Document
Exhibit 99.1
CONTACT:
Investor Relations
Axon Enterprise, Inc.
IR@axon.com
Axon 2024 revenue grows 33% to $2.1 billion; third consecutive year of 30%+ annual growth
•Axon Cloud & Services revenue grows 44% to $806 million
•Annual recurring revenue grows 37% to $1.0 billion
•Annual net income of $377 million supports non-GAAP net income of $466 million
•Company establishes fiscal year 2025 revenue guidance of $2.55 billion to $2.65 billion, representing approximately 25% annual growth at the midpoint
Fellow shareholders,
Axon is proud to report the closing of an evolutionary year defined by innovative product leadership, deep customer collaboration and unwavering commitment to our mission of protecting life. Our third consecutive year of 30%+ annual revenue growth demonstrates Axon’s strong product-market fit and customer expansion. Along with our growth, we achieved a full-year net income margin of 18.1% and an Adjusted EBITDA margin of 25.0%.
Key operational milestones of 2024 are as follows:
•Surpassed $2 billion in annual revenue and $1 billion in annual recurring revenue
•Annual bookings over $5 billion drove total future contracted bookings to $10.1 billion
•Awarded largest deal in company history, coming from an enterprise customer
•Full-year net income margin of 18.1% drove 25.0% Adjusted EBITDA margin with 60%+ free cash flow conversion
•Surpassed 1 million total software users
•Shipped more than 200,000 TASER devices, 300,000 body cameras and over 9 million cartridges
We closed 2024 with record quarterly revenue of $575 million in Q4, up 34% year over year, for our 12th consecutive quarter of 25%+ growth. TASER revenue of $221 million grew 37% year over year, fueled by the continued scaling of TASER 10 and growing adoption of our VR training solutions. Sensors & Other revenue of $124 million grew 18% year over year, supported by continued strong demand for Axon Body 4 and Axon Fleet 3. Axon Cloud & Services accounted for 40% of our total revenue, growing 41% year over year to $230 million as adoption of our premium subscription offerings continued to build.
Our momentum is strong heading into a new year. Looking ahead, we expect to deliver 2025 annual revenue in a range of $2.55 billion to $2.65 billion and Adjusted EBITDA of $640 million to $670 million. This reflects approximately 25% annual growth and approximately 25% Adjusted EBITDA margin at the midpoint of our guidance ranges. We recap our leaps in innovation in 2024, analyze our updated total market opportunity and dive into our financial results in more detail below.
5 Big Innovative Leaps in 2024
1) Artificial Intelligence in Policing — We introduced a suite of AI-powered solutions that are transforming public safety by enhancing efficiency, accelerating decision-making, and streamlining workflows. Our AI Era Plan integrates cutting-edge technologies like Draft One—our fastest-growing software solution—contributing to over 100,000 incident reports and saving officers 2.2 million minutes of valuable time through AI-driven incident reporting. Axon is at the forefront of AI-driven public safety, with more major advancements expected in 2025 and beyond.
2) Interoperable Real-Time Crime Center Technology — We strengthened our Real-Time Operations (RTO) platform with the acquisition of Fusus, a global leader in real-time crime center technology. Axon Fusus supports millions of livestreams a year across over 2,000 agencies as it integrates data from diverse sources—CCTV, body cameras, ALPR, drones and sensors—into a unified, cloud-based platform, enabling decentralized, real-time access.
3) Unmatched Drone as First Responder — Axon Air has evolved into a comprehensive public safety drone platform through our acquisition of Dedrone and our expanded strategic partnership with Skydio. These advancements led to the Axon Drone as First Responder (DFR) solution, which integrates secure, autonomous aircraft with mission-critical software and airspace security capabilities. With the ability to arrive on scene in just 1-2 minutes, drones enable rapid assessment and intervention when every second counts. The full potential of our DFR solution is unlocked through its native integration with Axon Fusus. Together, these technologies provide unparalleled situational awareness, improving response times and maximizing operational efficiency in this rapidly expanding space.
4) Enterprise Collaboration — Axon doubled-down on enterprise with the introduction of tailor-made solutions that build on our durable, battle-tested technology for law enforcement. We introduced Axon Body Workforce, a lightweight body-worn camera designed for frontline workers, enabling incident documentation without disrupting workflow. Axon Fusus further enhances our enterprise security offerings by integrating existing security technologies into a cloud-based Security Operations Center (SOC), allowing businesses to share real-time data with public safety agencies for faster response. Our strategic move into workplace safety drives deeper integration between enterprise security and public safety systems to enhance incident prevention and operational efficiency.
5) Mobile-First Policing — Axon’s reimagined mobile app enhances operational efficiency by providing officers with a secure, mobile-first solution for evidence and records management. For a growing set of key tasks, this eliminates the need to spend precious time returning to the station just to get this work done. Now available on iOS and Android with FedRAMP authorization, the app streamlines workflows by enabling real-time evidence capture, report generation and task tracking from the field.
“We see ourselves as a technology company committed to making the world a safer, less dangerous place. We’re focused on providing tools that help prevent violence, hold people accountable and address the complex challenges of modern society.“ — Rick Smith, CEO and Founder of Axon
“When I look at Axon, I look at the future of law enforcement technology. I want a partner who I can trust who’s at the forefront of building new products that are ultimately going to keep our officers safer and our community safer. That’s why I choose Axon. ” — Chief Gary Berg, Campbell (CA) Police Department
Total Addressable Market Update
Axon is executing on a vast and under-penetrated total addressable market (TAM), which continues to expand as we introduce new product solutions and gain traction in new customer verticals. In our biennial TAM analysis, we evaluate new product innovations and investment opportunities alongside various product and customer areas where we participate. Our investments are strategically aligned with rapidly emerging product areas, which we believe will drive long-term growth. As a result of continued investment in our business, we now estimate our expanded TAM to be $129 billion.
We assess our TAM through two key vectors—end customers and product categories—to clearly analyze the opportunity set we see ahead to drive our long-term growth. Our analysis includes only in-scope opportunities based on our current product offerings and sales progress, intentionally excluding those outside our near-to-medium-term roadmap or potential sales channels. The increase in our TAM from prior iterations is driven by our commitment to scaling and innovating in ways that advance our mission to protect life and create safer communities. Major contributors are:
•+$32 billion in international governments: We reevaluated our opportunity with international governments, which now extends beyond our initial areas of success within commonwealth nations to a set of more than 100 countries across the globe.
•+$23 billion in enterprise: Our expanded product offerings and improved enterprise product-market fit are evidence of a rapidly emerging opportunity to connect public and enterprise safety.
•+$17 billion from AI solutions: The introduction of our AI Era Plan enables us to evaluate the total potential for our growing set of AI solutions to help our existing customer base, including with local and international governments.
In aggregate, Axon’s $2 billion in annual revenue in 2024 represents less than 2% TAM penetration. Our revenue concentration and TAM penetration is highest within law enforcement functions for U.S. state & local governments. Within this area, we estimate U.S. state & local law enforcement TAM penetration below 15%, reinforcing our continued robust growth opportunity with our existing customers driven by innovation and strong product-market fit.
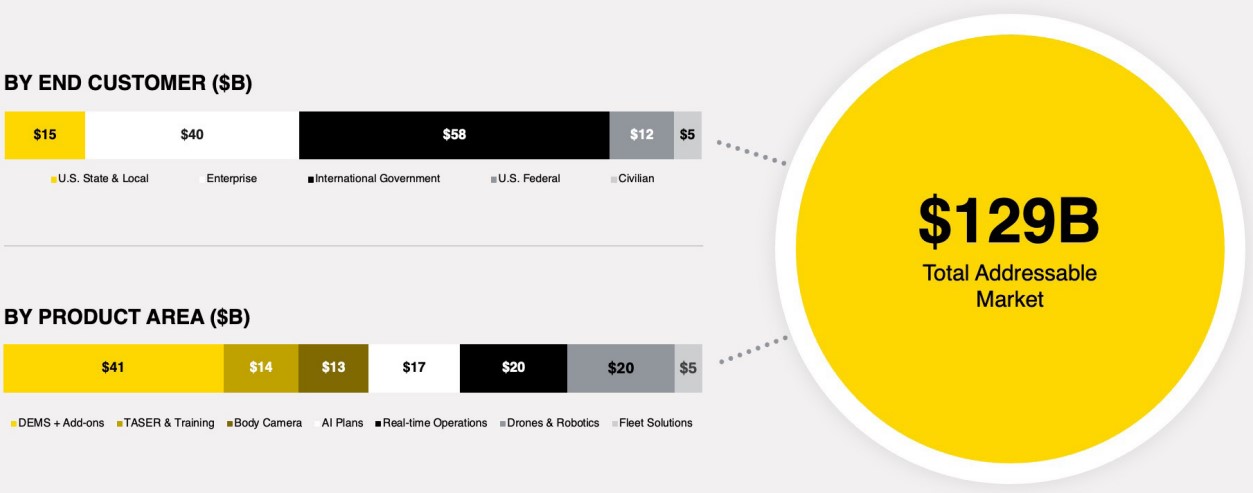
End Customers: Our customers can be summarized into five categories: U.S. state & local governments, the U.S. federal government, international governments, enterprises and civilians. Customers across these areas are focused on public and enterprise safety, and the relative size of our opportunity is proportionate to the potential total users of our products and the applicable products they may use. Each vertical includes various operational functions, including law enforcement, fire protection, emergency medical services, corrections, justice and defense within government funding use cases. The largest components of our TAM by customer vertical are international governments, given the significant number of public safety workers globally, and enterprises, where frontline workers outnumber public safety workers by over 20:1.
Product categories: Our products are primarily sold in subscription plans that solve a specific end user or platform use case. At the individual user solutions level, our subscription plans encompass an expansive set of individual software licenses across digital evidence management (DEMS) and associated add-ons, TASER, training solutions and body cameras—this includes different tiers of our officer safety plan (OSP) and similar dedicated solutions for enterprise and other public safety users. Along with our user solutions, the enabling technology in our AI Era Plan provides an embedded, further enhanced experience with our products for our customers. In addition to these solutions, we sell Axon Fleet solutions, drones and robotic security systems, and an expanding real-time operations platform that connect fixed and mobile sensors and devices into a single operating system.
Our TAM estimates are based on publicly available data on user counts, our assessment of in-scope users of our products based on current applications and sales channels, using the latest data published by national governments, surveys, studies and proprietary information. Note that under ASC 606, product revenue is recognized upon shipment to the customer and service revenue is recognized over time as a time-based obligation to the customer. The TAM reflects potential annual subscription spending — revenue recognized over the life of a multi-year contract — even though spending and revenue may not align in the same year due to
timing differences. Due to rounding, the sum of the individual vectors may not equal our total TAM estimate of $129 billion.
Q4 2024 Summary Results
Quarterly revenue of $575 million grew 34% year over year, exceeding our expectations, driven by double-digit growth in each of our product segments.
Total company gross margin of 60.1% declined 120 basis points year over year, driven by increased stock-based compensation expense and amortization of acquired intangibles in our cost of goods sold (COGS). Excluding the impacts of stock-based compensation and intangibles amortization, non-GAAP company adjusted gross margin of 63.2% increased 120 basis points year over year primarily due to an increased mix of high-margin Axon Cloud & Services revenue and investments in TASER automation and cost-reduction initiatives.
Operating loss of $16 million was primarily due to increased stock-based compensation expense of $131 million which included $74 million of expenses related to broad-based equity incentive programs due to expected achievement of operational and time-based service components.
•COGS of $229 million, 39.9% of revenue, included $12 million in stock-based compensation expense.
•SG&A expense of $227 million, 39.5% of revenue, included $74 million in stock-based compensation expense.
•R&D expense of $135 million, 23.4% of revenue, included $46 million in stock-based compensation expense.
Net income of $135 million (23.5% net income margin), or $1.67 per diluted share, supported non-GAAP net income of $169 million (29.3% non-GAAP net income margin), or $2.08 per diluted share.
Adjusted EBITDA of $142 million (24.6% Adjusted EBITDA margin) increased 56% year over year driven by higher revenue, improved adjusted gross margin and operating leverage.
Operating cash flow of $250 million increased 79% year over year, supporting free cash flow of $225 million and adjusted free cash flow of $227 million.
As of December 31, 2024, Axon had $800 million in cash, cash equivalents and investments, and outstanding convertible notes in principal amount of $690 million, for a net cash position of $110 million, down $209 million sequentially primarily due to the closing of our acquisition of Dedrone.
Detailed definitions of our non-GAAP financial measures and caution on the use of non-GAAP measures are included later in this letter.
Financial commentary by segment
Following the year ended December 31, 2024, we approved a plan to realign our reported business segments to better reflect our continued growth and the expansion of our product, software, and service offerings. Effective in the first quarter of fiscal year 2025, we will transition from our previously reported segments, TASER and Software & Sensors, to two new segments, Connected Devices and Software & Services. We are currently evaluating the impact of this change on our financial reporting and related disclosures, which we will update with our Q1 2025 financial report
Software & Sensors
|
|
|
|
|
|
|
|
|
|
|
|
|
|
|
|
|
|
|
|
|
|
|
|
|
|
|
|
|
|
|
THREE MONTHS ENDED |
|
CHANGE |
|
31 DEC 2024 |
|
30 SEP 2024 |
|
31 DEC 2023 |
|
QoQ |
|
YoY |
|
(in thousands) |
|
|
|
|
Axon Cloud & Services revenue(1) |
$ |
230,325 |
|
$ |
202,514 |
|
$ |
163,832 |
|
13.7 |
% |
|
40.6 |
% |
| Axon Cloud & Services gross margin |
73.7 |
% |
|
72.3 |
% |
|
74.7 |
% |
|
140 bp |
|
(100) bp |
| Axon Cloud & Services adjusted gross margin |
77.2 |
% |
|
75.2 |
% |
|
75.7 |
% |
|
200 bp |
|
150 bp |
|
|
|
|
|
|
|
|
|
|
| Sensors & Other revenue |
$ |
123,588 |
|
$ |
120,026 |
|
$ |
105,201 |
|
3.0 |
% |
|
17.5 |
% |
| Sensors & Other gross margin |
32.8 |
% |
|
41.4 |
% |
|
46.9 |
% |
|
(860) bp |
|
(1,410) |
bp |
| Sensors & Other adjusted gross margin |
36.2 |
% |
|
43.3 |
% |
|
47.5 |
% |
|
(710) bp |
|
(1,130) |
bp |
____________________________________________________________________
(1)The TASER segment includes Cloud and Services revenue, which is not included here.
•Axon Cloud & Services revenue growth of 41% year over year was primarily driven by new customer adoption of Axon Evidence and expansion with existing customers adopting premium software offerings.
•Axon Cloud & Services gross margin of 73.7% decreased from 74.7% year over year. Excluding the impacts of stock-based compensation expense and intangibles amortization, Axon Cloud & Services adjusted gross margin of 77.2% increased from 75.7% year over year primarily due to a higher software mix revenue relative to professional services. Software-only gross margin continued to exceed our target of 80%.
•Sensors & Other revenue growth of 18% year over year was primarily driven by strong demand for Axon Body 4 and Fleet.
•Sensors & Other gross margin of 32.8% decreased from 46.9% year over year. Excluding the impact of stock-based compensation and intangibles amortization, Sensors & Other adjusted gross margin of 36.2% decreased from 47.5% year over year due to product mix and inventory reserve charges associated with legacy products.
TASER
|
|
|
|
|
|
|
|
|
|
|
|
|
|
|
|
|
|
|
|
|
|
|
|
|
|
|
|
|
|
|
THREE MONTHS ENDED |
|
CHANGE |
|
31 DEC 2024 |
|
30 SEP 2024 |
|
31 DEC 2023 |
|
QoQ |
|
YoY |
|
(in thousands) |
|
|
|
|
| Revenue |
$ |
221,232 |
|
$ |
221,734 |
|
$ |
161,343 |
|
(0.2) |
% |
|
37.1 |
% |
| Gross margin |
61.3 |
% |
|
60.8 |
% |
|
57.1 |
% |
|
50 |
bp |
|
420 |
bp |
| Adjusted gross margin |
63.7 |
% |
|
63.0 |
% |
|
57.6 |
% |
|
70 |
bp |
|
610 |
bp |
•TASER segment revenue growth of 37% year over year was primarily driven by strong demand for TASER 10 devices and associated cartridges and services, including VR training.
•TASER segment gross margin of 61.3% increased from 57.1% year over year. Excluding the impact of stock-based compensation expense, TASER segment adjusted gross margin of 63.7% increased from 57.6% year over year driven by investments in automation, cost reduction initiatives and the absence of warranty reserve charges recognized in the prior year quarter.
Forward Looking Operating Metrics
|
|
|
|
|
|
|
|
|
|
|
|
|
|
|
|
|
|
|
|
|
|
|
|
|
|
|
|
|
|
|
31 DEC 2024 |
|
30 SEP 2024 |
|
30 JUN 2024 |
|
31 MAR 2024 |
|
31 DEC 2023 |
|
|
Annual recurring revenue ($ millions) (1) |
$ |
1,001 |
|
|
$ |
885 |
|
|
$ |
850 |
|
|
$ |
825 |
|
|
$ |
732 |
|
Net revenue retention (1) |
123 |
% |
|
123 |
% |
|
122 |
% |
|
122 |
% |
|
122 |
% |
Future contracted bookings ($ billions) (1) |
$ |
10.1 |
|
|
$ |
8.2 |
|
|
$ |
7.5 |
|
|
$ |
7.0 |
|
|
$ |
7.1 |
|
____________________________________________________________________
(1)Refer to “Statistical Definitions” below.
•Annual recurring revenue grew 37% year over year to $1.0 billion. Growth in annual recurring revenue is primarily driven by new users adopting our cloud products and upgrades to premium offerings.
•Net revenue retention was 123% in the quarter, reflecting our ability to deliver additional value to our customers over time and de minimis attrition. We drive adoption of our cloud software solutions through integrated subscription plans, which include a variety of premium software options. This Software-as-a-Service (SaaS) metric excludes the hardware portion of customer subscriptions and is normalized to account for phased customer deployments throughout the year.
•Future contracted bookings increased to $10.1 billion, up 42% year over year driven by strong new contracted bookings in the second half of 2024. This new operational metric tracks our total unrecognized contracted bookings, including remaining performance obligations, in addition to contracts with certain termination or other clauses as a result of which they are not otherwise included in remaining performance obligations. We expect to recognize between 20% to 25% of this balance over the next 12 months and generally expect the remainder to be recognized over the following ten years.
2025 Outlook
The following forward-looking statements reflect Axon’s expectations as of February 25, 2025 and are subject to risks and uncertainties. Please refer to “Forward-looking Statements” below for more information.
Full Year
•Axon expects full year 2025 revenue of $2.55 billion to $2.65 billion, representing approximately 25% annual growth at the midpoint.
•Axon expects full year 2025 Adjusted EBITDA dollars of $640 million to $670 million, representing Adjusted EBITDA margin of approximately 25%.
◦We provide Adjusted EBITDA guidance, rather than net income guidance, due to the inherent difficulty of forecasting certain types of expenses and gains such as stock-based compensation, income tax expenses and gains or losses on marketable securities and strategic investments, which affect net income but not Adjusted EBITDA. We are unable to reasonably estimate the impact of such expenses, which could be material, on net income. Accordingly, we do not provide a reconciliation of projected net income to projected Adjusted EBITDA
•We expect stock-based compensation expenses to be approximately $580 million to $630 million.
•Full year stock-based compensation expense includes approximately $325 million, related to the broad-based 2024 eXponential Stock Plan and the 2024 CEO Performance Award, primarily in SG&A and R&D. These performance-based incentive programs are achieved through stock price, operational and time-based requirements and are divided into seven substantially equal tranches.
•We expect 2025 CapEx to be in the range of $140 million to $180 million. Our 2025 CapEx plans include long-term R&D investment projects, continued capacity expansion, global facility build-outs and new product development costs. Expected capital expenditures do not include costs related to investments in a new headquarters as we await local zoning and planning decisions that could impact our development plans.
Quarterly conference call and webcast
We will host our Q4 2024 earnings conference call webinar on Tuesday, February 25th, at 2 p.m. PT / 5 p.m. ET The webcast will be available via a link on Axon's investor relations website at https://investor.axon.com or can be accessed directly via https://axon.zoom.us/j/92260379097.
Statistical Definitions
Annual recurring revenue: Annual recurring revenue is a performance indicator that management believes provides more visibility into the growth of our revenue generated by our highest margin, recurring services. Annual recurring revenue should be viewed independently of revenue and deferred revenue because it is an operating measure and is not intended to be combined with or to replace GAAP revenue or deferred revenue, as they can be impacted by contract start and end dates and renewal rates. Annual recurring revenue is not intended to be a replacement or forecast of revenue or deferred revenue. We calculate annual recurring revenue as monthly recurring license, integration, warranty and storage revenue, annualized.
Net revenue retention: Dollar-based net revenue retention is an important metric to measure our ability to retain and expand our relationships with existing customers. We calculate it as the software, camera and TASER warranty subscription and support revenue from a base set of agency customers from which we generated Axon Cloud subscription and warranty revenue in the last month of a quarter divided by the software and camera warranty subscription and support revenue from the year-ago month of that same customer base. This calculation includes high-margin warranty revenue but purposely excludes the lower-margin hardware subscription component of the customer contracts, as it is meant to be a SaaS metric that we use to monitor the health of the recurring revenue business we are building. This calculation also excludes the implied monthly revenue contribution of customers that were added since the year-ago quarter, and therefore excludes the benefit of new customer acquisition. The metric includes customers, if any, that terminated during the annual period, and therefore, this metric is inclusive of customer churn. This metric is downwardly adjusted to account for the effect of phased deployments — meaning that, for the year-ago period, we consider the total contractually obligated implied monthly revenue amount, rather than monthly revenue amounts that might have been in actuality smaller on a GAAP basis due to the customer not having yet fully deployed their Axon solution. For more information relative to our revenue recognition policies, please reference our filings with the Securities and Exchange Commission (SEC).
Future contracted bookings: This new operational metric tracks our total unrecognized contracted bookings, including remaining performance obligations, in addition to contracts with certain termination or other clauses as a result of which they are not otherwise included in remaining performance obligations. Total future contracted bookings for products and services represent total orders that the company has received and not yet performed. We define future contracted bookings as cumulative bookings, net of cancellations, less product and service revenue recognized to date. This operational metric is subject to change based on future events, including terminations for convenience, the execution of optional periods or other contract cancellations. To the extent future contract bookings become recognized as revenue, it is recognized over a period of multiple years. Further, this operational metric may be unique to the Company, as it may be different from similarly titled operational metrics used by other companies. As such, the presentation of this operational metric may not enhance the comparability of the Company’s results to the results of other companies.
Additional note
Remaining performance obligations, previously discussed within our past total future contracted revenue disclosures, include both recognized contract liabilities as well as amounts that are expected to be invoiced and recognized in future periods. The remaining performance obligations are limited only to arrangements that meet the definition of a contract under Accounting Standards Codification Topic 606 as of December 31, 2024. Remaining performance obligations as of December 31, 2024 were $7.9 billion. Similar to future contracted bookings, we currently expect to recognize between 20% to 25% of this balance over the next 12 months, and generally expect the remainder to be recognized over the following ten years, subject to risks related to delayed deployments, budget appropriation or other contract cancellation clauses.
Supplementary Non-GAAP Measures
To supplement the Company's financial results presented in accordance with GAAP, we present the non-GAAP financial measures of EBITDA, Adjusted EBITDA, Adjusted EBITDA Margin, Adjusted Gross Margin, Non-GAAP Net Income, Non-GAAP Diluted Earnings Per Share, Free Cash Flow and Adjusted Free Cash Flow. The Company's management uses these non-GAAP financial measures in evaluating the Company's performance in comparison to prior periods.
We believe that both management and investors benefit from referring to these non-GAAP financial measures in assessing its performance, and when planning and forecasting our future periods. A reconciliation of GAAP to the non-GAAP financial measures is presented below.
•EBITDA (most comparable GAAP measure: net income) – Earnings before interest expense, investment interest income, income taxes, depreciation and amortization.
•Adjusted EBITDA (most comparable GAAP measure: Net income) – Earnings before interest expense; investment interest income; income taxes; depreciation; amortization; noncash stock-based compensation expense; fair value adjustments related to strategic investments and marketable securities; transaction and integration costs related to strategic investments and acquisitions including adjustments related to the foreign currency impact of acquired intercompany balances that were unsettled as of the reporting date and plan to be settled in the near term; inventory step-up amortization related to acquisitions; certain litigation costs and recoveries related to (1) antitrust cases we consider to be non-recurring and outside of our core operating results and (2) certain litigation matters for acquired companies that were unresolved at the date of the acquisition and that we consider to be non-recurring and outside of our core operating results; and other unusual, non-recurring pre-tax items that are not considered representative of our underlying operating performance.
•Adjusted EBITDA margin (most comparable GAAP measure: net income margin) – Adjusted EBITDA as a percentage of net sales.
•Adjusted gross margin (most comparable GAAP measure: gross margin) – Gross margin before noncash stock-based compensation expense, amortization of acquired intangible assets and inventory step-up amortization related to acquisitions.
•Non-GAAP net income (most comparable GAAP measure: net income) – Net income excluding the costs of noncash stock-based compensation expense; fair value adjustments related to strategic investments and marketable securities; transaction and integration costs related to strategic investments and acquisitions including adjustments related to the foreign currency impact of acquired intercompany balances that were unsettled as of the reporting date and plan to be settled in the near term; inventory step-up amortization related to acquisitions; certain litigation costs and recoveries related to (1) antitrust cases we consider to be non-recurring and outside of our core operating results and (2) certain litigation matters for acquired companies that were unresolved at the date of the acquisition and that we consider to be non-recurring and outside of our core operating results; and other unusual, non-recurring pre-tax items that are not considered representative of our underlying operating performance. The Company tax-effects non-GAAP adjustments using the blended statutory federal and state tax rates for each period presented.
•Non-GAAP diluted earnings per share (most comparable GAAP measure: earnings per share) – Measure of Company's non-GAAP net income divided by the weighted average number of diluted common shares outstanding during the period presented.
•Free cash flow (most comparable GAAP measure: cash flow from operating activities) – Cash flows provided by operating activities minus purchases of property and equipment and intangible assets.
•Adjusted free cash flow (most comparable GAAP measure: cash flow from operating activities) – Cash flows provided by operating activities minus purchases of property and equipment and intangible assets, excluding the net impact of investments in our new Scottsdale, Arizona campus and bond premium amortization.
◦We believe that free cash flow and adjusted free cash flow excluding the impact of bond premium amortization and net campus investment are non-GAAP measures that are useful to investors and management to evaluate the Company’s ability to generate cash. These non-GAAP measures can also be used to evaluate the Company’s ability to generate cash flow from operations and the impact that this cash flow has on the Company’s liquidity.
Caution on Use of Non-GAAP Measures
Although these non-GAAP financial measures are not consistent with GAAP, management believes investors will benefit by referring to these non-GAAP financial measures when assessing the Company's operating results, as well as when forecasting and analyzing future periods. However, management recognizes that:
•these non-GAAP financial measures are limited in their usefulness and should be considered only as a supplement to the Company's GAAP financial measures;
•these non-GAAP financial measures should not be considered in isolation from, or as a substitute for, the Company's GAAP financial measures;
•these non-GAAP financial measures should not be considered to be superior to the Company's GAAP financial measures; and
•these non-GAAP financial measures were not prepared in accordance with GAAP or under a comprehensive set of rules or principles proposed by a third party.
Further, these non-GAAP financial measures may be unique to the Company, as they may be different from similarly titled non-GAAP financial measures used by other companies. As such, this presentation of non-GAAP financial measures may not enhance the comparability of the Company's results to the results of other companies.
About Axon
Axon is a technology leader in global public safety. Our moonshot goal is to cut gun-related deaths between police and the public by 50% before 2033. Axon is building the public safety operating system of the future by integrating a suite of hardware devices and cloud software solutions that lead modern policing. Axon’s suite includes TASER energy devices, body cameras, in-car cameras, robotic security and training, cloud-hosted digital evidence management solutions, productivity software and real-time operations capabilities. Axon’s growing global customer base includes first responders across international, federal, state and local law enforcement, fire, corrections and emergency medical services, as well as the justice sector, enterprises and consumers.
Non-Axon trademarks are property of their respective owners.
Axon, Axon Air, Axon Body, Axon Body Workforce, Axon Evidence, Axon Fleet, Axon Fusus, Dedrone, Draft One, TASER, TASER 10, the Filled Bolt within Circle Logo and the Delta Logo are trademarks of Axon Enterprise, Inc., some of which are registered in the United States and other countries. For more information, visit www.axon.com/legal. All rights reserved.
Forward-looking Statements
Forward-looking statements in this letter include, without limitation, statements regarding: proposed products and services and related development efforts and activities; expectations about the market for our current and future products and services, including statements related to our user base and customer profiles; the impact of pending litigation; strategies and trends relating to subscription plan programs and revenues; statements related to recently completed acquisitions; our anticipation that contracts with governmental customers will be fulfilled; our expectations about the future implementation of new strategies related to artificial intelligence; the timing and realization of future contracted revenue; the fulfillment of bookings; strategies and trends, including the amounts and benefits of R&D investments; the sufficiency of our liquidity and financial resources; expectations about customer behavior; statements concerning projections, predictions, expectations, estimates or forecasts as to our business, financial and operational results and future economic performance, including our outlook for 2025 full year revenue, stock-based compensation expense, Adjusted EBITDA, Adjusted EBITDA margin, and capital expenditures; statements of management’s strategies, goals and objectives and other similar expressions; as well as the ultimate resolution of financial statement items requiring critical accounting estimates, including those set forth in our Annual Report on Form 10‑K for the year ended December 31, 2023, and the soon-to-be-filed Annual Report on Form 10-K for the year ended December 31, 2024 (collectively, our “Annual Reports”). Such statements give our current expectations or forecasts of future events; they do not relate strictly to historical or current facts. Words such as “may,” “will,” “should,” “could,” “would,” “predict,” “potential,” “continue,” “expect,” “anticipate,” “future,” “intend,” “plan,” “believe,” “estimate,” and similar expressions, as well as statements in future tense, identify forward-looking statements.
However, not all forward-looking statements contain these identifying words.
We cannot guarantee that any forward-looking statement will be realized, although we believe we have been prudent in our plans and assumptions. Achievement of future results is subject to risks, uncertainties and potentially inaccurate assumptions. The following important factors could cause actual results to differ materially from those in the forward-looking statements: our exposure to cancellations of government contracts due to non-appropriation clauses, exercise of a cancellation clause or non-exercise of contractually optional periods; the ability of law enforcement agencies to obtain funding, including based on tax revenues; our ability to design, introduce and sell new products, services or features; our ability to defend against litigation and protect our intellectual property, and the resulting costs of this activity; our ability to win bids through the open bidding process for governmental agencies; our ability to manage our supply chain and avoid production delays, shortages and impacts to expected gross margins; the impacts of inflation, macroeconomic conditions and global events; the impact of catastrophic events or public health emergencies; the impact of stock-based compensation expense, impairment expense and income tax expense on our financial results; customer purchase behavior, including adoption of our software as a service delivery model; negative media publicity or sentiment regarding our products; the impact of various factors on projected gross margins; defects in, or misuse of, our products; changes in the costs of product components and labor; loss of customer data, a breach of security or an extended outage, including by our third-party cloud-based storage providers; exposure to international operational risks; delayed cash collections and possible credit losses due to our subscription model; changes in government regulations in the United States and in foreign markets, especially related to the classification of our products by the United States Bureau of Alcohol, Tobacco, Firearms and Explosives; our ability to integrate acquired businesses; the impact of declines in the fair values or impairment of our investments, including our strategic investments; our ability to attract and retain key personnel; litigation or inquiries and related time and costs; our ability to remediate the material weakness in our internal controls; and counter-party risks relating to cash balances held in excess of federally insured limits. Many events beyond our control may determine whether results we anticipate will be achieved. Should known or unknown risks or uncertainties materialize, or should underlying assumptions prove inaccurate, actual results could differ materially from past results and those anticipated, estimated or projected. You should bear this in mind as you consider forward-looking statements. Significant factors that may cause actual results to differ from those Axon expects include, among others, those discussed under “Risk Factors” in Axon’s Quarterly Report on Form 10-Q for the period ended September 30, 2024 filed with the Securities and Exchange Commission ("SEC") on November 8, 2024 and other reports or documents that Axon files with, or furnishes to, the SEC from time to time. These factors are intended as cautionary statements for investors within the meaning of Section 21E of the Securities Exchange Act of 1934, as amended, and Section 27A of the Securities Act of 1933, as amended. Readers can find them under the heading “Risk Factors” in our Annual Reports, and investors should refer to them. You should understand that it is not possible to predict or identify all such factors. You should understand that it is not possible to predict or identify all such factors. Consequently, you should not consider any such list to be a complete set of all potential risks or uncertainties.
Except as required by law, we undertake no obligation to publicly update forward-looking statements, whether as a result of new information, future events or otherwise. You are advised, however, to consult any further disclosures we make on related subjects in our Form 8-K, 10‑Q and 10‑K reports to the SEC. Our filings with the SEC may be accessed at the SEC’s website at www.sec.gov.
Q4 2024 Out-of-Period Adjustment
During the three months ended December 31, 2024, we identified immaterial errors in our previously issued financial statements related to our accounting for certain contract terms and conditions under ASC 606. We assessed the materiality of the errors on prior period consolidated financial statements and concluded that the errors correction are not material, individually and in the aggregate, to any previously issued financial statements and that the correction of this error was also not material to current period financial results or the current fiscal year on either a quantitative or qualitative basis. We corrected these errors as an out of period adjustment in the three months ended December 31, 2024 with a decrease to revenue of $3.3 million and a decrease to net income of $2.3 million. These errors originated in prior years and were immaterial to each respective prior period. More information regarding the out of period adjustment will be contained within the Company’s Annual Report on Form 10-K to be filed for the year ended December 31, 2024.
Internal Controls
As a result of management’s assessment of the Company’s annual internal control over financial reporting, management concluded that the Company’s disclosure controls and procedures were not effective as of December 31, 2024, due to one or more material weaknesses in our internal control over financial reporting generally related to a failure to design and maintain an effective control environment related to revenue recognition for its customer contracts. In relation to the material weakness in our control environment, the Company’s management is in the process of developing and implementing a remediation plan in response to the identified material weakness described above. This material weakness resulted in immaterial errors related to revenue, related contract assets and liabilities, and the remaining performance obligations disclosure as of and for each of the interim and annual periods during 2022, 2023 and 2024. More information regarding the material weakness will be contained within the Company’s Annual Report on Form 10-K to be filed for the year ended December 31, 2024.
AXON ENTERPRISE, INC.
CONSOLIDATED STATEMENTS OF OPERATIONS
(in thousands, except per share data)
|
|
|
|
|
|
|
|
|
|
|
|
|
|
|
|
|
|
|
|
|
|
|
|
|
|
|
|
|
|
|
THREE MONTHS ENDED |
|
TWELVE MONTHS ENDED |
|
31 DEC 2024 |
|
30 SEP 2024 |
|
31 DEC 2023 |
|
31 DEC 2024 |
|
31 DEC 2023 |
| Net sales from products |
$ |
330,205 |
|
|
$ |
327,900 |
|
|
$ |
256,439 |
|
|
$ |
1,221,292 |
|
|
$ |
964,002 |
|
| Net sales from services |
244,940 |
|
|
216,374 |
|
|
173,937 |
|
|
861,234 |
|
|
596,697 |
|
| Net sales |
575,145 |
|
|
544,274 |
|
|
430,376 |
|
|
2,082,526 |
|
|
1,560,699 |
|
| Cost of product sales |
167,182 |
|
|
156,167 |
|
|
123,900 |
|
|
618,136 |
|
|
447,708 |
|
| Cost of service sales |
62,114 |
|
|
57,360 |
|
|
42,484 |
|
|
223,010 |
|
|
157,538 |
|
| Cost of sales |
229,296 |
|
|
213,527 |
|
|
166,384 |
|
|
841,146 |
|
|
605,246 |
|
| Gross margin |
345,849 |
|
|
330,747 |
|
|
263,992 |
|
|
1,241,380 |
|
|
955,453 |
|
| Operating expenses: |
|
|
|
|
|
|
|
|
|
| Sales, general and administrative |
227,019 |
|
|
192,189 |
|
|
137,273 |
|
|
741,247 |
|
|
494,884 |
|
| Research and development |
134,585 |
|
|
114,477 |
|
|
83,972 |
|
|
441,593 |
|
|
303,719 |
|
| Total operating expenses |
361,604 |
|
|
306,666 |
|
|
221,245 |
|
|
1,182,840 |
|
|
798,603 |
|
| Income (loss) from operations |
(15,755) |
|
|
24,081 |
|
|
42,747 |
|
|
58,540 |
|
|
156,850 |
|
| Interest income, net |
5,461 |
|
|
10,978 |
|
|
12,325 |
|
|
36,595 |
|
|
42,112 |
|
| Other income (loss), net |
94,859 |
|
|
44,510 |
|
|
1 |
|
|
286,369 |
|
|
(41,901) |
|
| Income before provision for income taxes |
84,565 |
|
|
79,569 |
|
|
55,740 |
|
|
381,504 |
|
|
157,061 |
|
| Provision for (benefit from) income taxes |
(50,619) |
|
|
12,544 |
|
|
(1,321) |
|
|
4,470 |
|
|
(18,722) |
|
| Net income |
$ |
135,184 |
|
|
$ |
67,025 |
|
|
$ |
57,061 |
|
|
$ |
377,034 |
|
|
$ |
175,783 |
|
| Net income per common and common equivalent shares: |
|
|
|
|
|
|
|
|
|
| Basic |
$ |
1.77 |
|
$ |
0.89 |
|
$ |
0.76 |
|
$ |
4.98 |
|
$ |
2.37 |
| Diluted |
$ |
1.67 |
|
$ |
0.86 |
|
$ |
0.75 |
|
$ |
4.80 |
|
$ |
2.33 |
| Weighted average number of common and common equivalent shares outstanding: |
|
|
|
|
|
|
|
|
|
| Basic |
76,360 |
|
75,697 |
|
75,060 |
|
75,748 |
|
74,195 |
| Diluted |
81,091 |
|
78,080 |
|
76,178 |
|
78,558 |
|
75,456 |
AXON ENTERPRISE, INC.
SEGMENT REPORTING
(in thousands)
|
|
|
|
|
|
|
|
|
|
|
|
|
|
|
|
|
|
|
|
|
|
|
|
|
|
|
|
|
|
|
|
|
|
|
|
|
|
|
|
|
|
|
|
|
|
|
|
|
|
|
|
|
|
|
THREE MONTHS ENDED |
|
THREE MONTHS ENDED |
|
THREE MONTHS ENDED |
|
31 DEC 2024 |
|
30 SEP 2024 |
|
31 DEC 2023 |
|
Software
and
Sensors |
|
TASER |
|
Total |
|
Software
and
Sensors |
|
TASER |
|
Total |
|
Software
and
Sensors |
|
TASER |
|
Total |
Net sales from products (1) |
$ |
123,588 |
|
|
$ |
206,617 |
|
|
$ |
330,205 |
|
|
$ |
120,026 |
|
|
$ |
207,874 |
|
|
$ |
327,900 |
|
|
$ |
105,201 |
|
|
$ |
151,238 |
|
|
$ |
256,439 |
|
Net sales from services (2) |
230,325 |
|
14,615 |
|
|
244,940 |
|
|
202,514 |
|
|
13,860 |
|
|
216,374 |
|
|
163,832 |
|
|
10,105 |
|
|
173,937 |
|
| Net sales |
353,913 |
|
|
221,232 |
|
|
575,145 |
|
|
322,540 |
|
|
221,734 |
|
|
544,274 |
|
|
269,033 |
|
|
161,343 |
|
|
430,376 |
|
| Cost of product sales |
83,084 |
|
|
84,098 |
|
|
167,182 |
|
|
70,382 |
|
|
85,785 |
|
|
156,167 |
|
|
55,833 |
|
|
68,067 |
|
|
123,900 |
|
| Cost of service sales |
60,531 |
|
|
1,583 |
|
|
62,114 |
|
|
56,191 |
|
|
1,169 |
|
|
57,360 |
|
|
41,387 |
|
|
1,097 |
|
|
42,484 |
|
| Cost of sales |
143,615 |
|
|
85,681 |
|
|
229,296 |
|
|
126,573 |
|
|
86,954 |
|
|
213,527 |
|
|
97,220 |
|
|
69,164 |
|
|
166,384 |
|
| Gross margin |
$ |
210,298 |
|
|
$ |
135,551 |
|
|
$ |
345,849 |
|
|
$ |
195,967 |
|
|
$ |
134,780 |
|
|
$ |
330,747 |
|
|
$ |
171,813 |
|
|
$ |
92,179 |
|
|
$ |
263,992 |
|
| Gross margin % |
59.4 |
% |
|
61.3 |
% |
|
60.1 |
% |
|
60.8 |
% |
|
60.8 |
% |
|
60.8 |
% |
|
63.9 |
% |
|
57.1 |
% |
|
61.3 |
% |
| Adjusted gross margin |
62.9 |
% |
|
63.7 |
% |
|
63.2 |
% |
|
63.3 |
% |
|
63.0 |
% |
|
63.2 |
% |
|
64.7 |
% |
|
57.6 |
% |
|
62.0 |
% |
____________________________________________________________________________________
(1)Software and Sensors “products” revenue consists of sensors, including body worn cameras, Axon Fleet cameras, other hardware sensors, warranties on sensors, and other products, and is sometimes referred to as Sensors and Other revenue.
(2)Software and Sensors “services” revenue comprises sales related to the Axon Cloud and Services, which includes Axon Evidence, cloud-based evidence management software revenue, other recurring cloud-hosted software revenue and related professional services, and is sometimes referred to as Axon Cloud and Services revenue.
|
|
|
|
|
|
|
|
|
|
|
|
|
|
|
|
|
|
|
|
|
|
|
|
|
|
|
|
|
|
|
|
|
|
|
|
|
TWELVE MONTHS ENDED |
|
TWELVE MONTHS ENDED |
|
31 DEC 2024 |
|
31 DEC 2023 |
|
Software
and
Sensors |
|
TASER |
|
Total |
|
Software
and
Sensors |
|
TASER |
|
Total |
Net sales from products (1) |
$ |
457,531 |
|
$ |
763,761 |
|
$ |
1,221,292 |
|
$ |
386,392 |
|
$ |
577,610 |
|
$ |
964,002 |
Net sales from services (2) |
806,322 |
|
54,912 |
|
861,234 |
|
560,797 |
|
35,900 |
|
596,697 |
| Net sales |
1,263,853 |
|
818,673 |
|
2,082,526 |
|
947,189 |
|
613,510 |
|
1,560,699 |
| Cost of product sales |
284,817 |
|
333,319 |
|
618,136 |
|
209,344 |
|
238,364 |
|
447,708 |
| Cost of service sales |
217,687 |
|
5,323 |
|
223,010 |
|
153,925 |
|
3,613 |
|
157,538 |
| Cost of sales |
502,504 |
|
338,642 |
|
841,146 |
|
363,269 |
|
241,977 |
|
605,246 |
| Gross margin |
$ |
761,349 |
|
$ |
480,031 |
|
$ |
1,241,380 |
|
$ |
583,920 |
|
$ |
371,533 |
|
$ |
955,453 |
| Gross margin % |
60.2 |
% |
|
58.6 |
% |
|
59.6 |
% |
|
61.6 |
% |
|
60.6 |
% |
|
61.2 |
% |
| Adjusted gross margin |
63.3 |
% |
|
62.9 |
% |
|
63.2 |
% |
|
62.4 |
% |
|
60.9 |
% |
|
61.8 |
% |
____________________________________________________________________________________
(1)Software and Sensors “products” revenue consists of sensors, including body worn cameras, Axon Fleet cameras, other hardware sensors, warranties on sensors, and other products, and is sometimes referred to as Sensors and Other revenue.
(2)Software and Sensors “services” revenue comprises sales related to the Axon Cloud and Services, which includes Axon Evidence, cloud-based evidence management software revenue, other recurring cloud-hosted software revenue and related professional services, and is sometimes referred to as Axon Cloud and Services revenue.
AXON ENTERPRISE, INC.
SALES BY PRODUCT AND SERVICE
(in thousands)
|
|
|
|
|
|
|
|
|
|
|
|
|
|
|
|
|
|
|
|
|
|
|
|
|
|
|
|
|
|
|
|
|
|
|
|
|
THREE MONTHS ENDED |
|
31 DEC 2024 |
|
30 SEP 2024 |
|
31 DEC 2023 |
| Software and Sensors segment: |
|
|
|
|
|
|
|
|
|
|
|
| Axon Evidence and Cloud Services |
$ |
238,034 |
|
41.4 |
% |
|
$ |
203,481 |
|
37.4 |
% |
|
$ |
164,722 |
|
38.3 |
% |
| Axon Body Cameras and Accessories |
66,263 |
|
11.5 |
|
|
70,363 |
|
12.9 |
|
|
58,957 |
|
13.7 |
|
| Axon Fleet Systems |
25,270 |
|
4.4 |
|
|
23,239 |
|
4.3 |
|
|
22,827 |
|
5.3 |
|
| Extended Warranties |
17,490 |
|
3.0 |
|
|
17,306 |
|
3.2 |
|
|
14,959 |
|
3.5 |
|
Other (1) |
6,856 |
|
1.2 |
|
|
8,151 |
|
1.4 |
|
|
7,568 |
|
1.8 |
|
| Total Software and Sensors segment |
353,913 |
|
61.5 |
|
|
322,540 |
|
59.2 |
|
|
269,033 |
|
62.5 |
|
| TASER segment: |
|
|
|
|
|
|
|
|
|
|
|
| TASER Devices (Professional) |
119,240 |
|
20.7 |
|
|
130,515 |
|
24.0 |
|
|
94,758 |
|
22.0 |
|
| Cartridges |
64,974 |
|
11.3 |
|
|
60,179 |
|
11.1 |
|
|
43,781 |
|
10.2 |
|
| Axon Evidence and Cloud Services |
14,616 |
|
2.5 |
|
|
13,861 |
|
2.5 |
|
|
10,105 |
|
2.3 |
|
| Extended Warranties |
10,351 |
|
1.8 |
|
|
9,729 |
|
1.8 |
|
|
8,226 |
|
1.9 |
|
Other (2) |
12,051 |
|
2.1 |
|
|
7,450 |
|
1.4 |
|
|
4,473 |
|
1.0 |
|
| Total TASER segment |
221,232 |
|
38.5 |
|
|
221,734 |
|
40.8 |
|
|
161,343 |
|
37.5 |
|
| Total net sales |
$ |
575,145 |
|
100.0 |
% |
|
$ |
544,274 |
|
100.0 |
% |
|
$ |
430,376 |
|
100.0 |
% |
____________________________________________________________________________________
(1)Software and Sensors segment “Other” includes revenue from items including Signal Sidearm, Interview Room, Axon Air, partners' contra-revenue and other sensors and equipment.
(2)TASER segment “Other” includes smaller categories, such as VR hardware, weapons training revenue such as revenue associated with our Master Instructor School, and TASER consumer device sales.
|
|
|
|
|
|
|
|
|
|
|
|
|
|
|
|
|
|
|
|
|
|
|
|
|
TWELVE MONTHS ENDED |
|
31 DEC 2024 |
|
31 DEC 2023 |
| Software and Sensors segment: |
|
|
|
|
|
|
|
| Axon Evidence and Cloud Services |
$ |
808,256 |
|
38.8 |
% |
|
$ |
566,003 |
|
36.3 |
% |
| Axon Body Cameras and Accessories |
246,855 |
|
11.9 |
|
|
183,023 |
|
11.7 |
|
| Axon Fleet Systems |
104,890 |
|
5.0 |
|
|
121,842 |
|
7.8 |
|
| Extended Warranties |
66,141 |
|
3.2 |
|
|
55,154 |
|
3.5 |
|
Other (1) |
37,711 |
|
1.8 |
|
|
21,167 |
|
1.4 |
|
| Total Software and Sensors segment |
1,263,853 |
|
60.7 |
|
|
947,189 |
|
60.7 |
|
| TASER segment: |
|
|
|
|
|
|
|
| TASER Devices (Professional) |
$ |
453,055 |
|
21.8 |
|
|
$ |
333,923 |
|
21.4 |
|
| Cartridges |
246,766 |
|
11.8 |
|
|
193,285 |
|
12.4 |
|
| Axon Evidence and Cloud Services |
54,913 |
|
2.6 |
|
|
35,680 |
|
2.3 |
|
| Extended Warranties |
37,515 |
|
1.8 |
|
|
31,689 |
|
2.0 |
|
Other (2) |
26,424 |
|
1.3 |
|
|
18,933 |
|
1.2 |
|
| Total TASER segment |
818,673 |
|
39.3 |
|
|
613,510 |
|
39.3 |
|
| Total net sales |
$ |
2,082,526 |
|
100.0 |
% |
|
$ |
1,560,699 |
|
100.0 |
% |
____________________________________________________________________________________
(1)Software and Sensors segment “Other” includes revenue from items including Signal Sidearm, Interview Room, Axon Air, partners' contra-revenue and other sensors and equipment.
(2)TASER segment “Other” includes smaller categories, such as VR hardware, weapons training revenue such as revenue associated with our Master Instructor School, and TASER consumer device sales.
AXON ENTERPRISE, INC.
RECONCILIATION OF GAAP TO NON-GAAP FINANCIAL MEASURES
(in thousands)
|
|
|
|
|
|
|
|
|
|
|
|
|
|
|
|
|
|
|
|
|
|
|
|
|
|
|
|
|
|
|
THREE MONTHS ENDED |
|
TWELVE MONTHS ENDED |
|
31 DEC 2024 |
|
30 SEP 2024 |
|
31 DEC 2023 |
|
31 DEC 2024 |
|
31 DEC 2023 |
| EBITDA and Adjusted EBITDA: |
|
|
|
|
|
|
|
|
|
| Net income |
$ |
135,184 |
|
$ |
67,025 |
|
$ |
57,061 |
|
$ |
377,034 |
|
$ |
175,783 |
| Depreciation and amortization |
17,489 |
|
14,762 |
|
10,051 |
|
56,815 |
|
32,638 |
| Interest expense |
1,825 |
|
1,646 |
|
1,772 |
|
7,098 |
|
6,995 |
| Investment interest income |
(7,286) |
|
(12,624) |
|
(14,097) |
|
(43,693) |
|
(49,107) |
| Provision for (benefit from) income taxes |
(50,619) |
|
12,544 |
|
(1,321) |
|
4,470 |
|
(18,722) |
| EBITDA |
$ |
96,593 |
|
$ |
83,353 |
|
$ |
53,466 |
|
$ |
401,724 |
|
$ |
147,587 |
|
|
|
|
|
|
|
|
|
|
| Adjustments: |
|
|
|
|
|
|
|
|
|
| Stock-based compensation expense |
$ |
130,888 |
|
$ |
101,780 |
|
$ |
35,130 |
|
$ |
382,604 |
|
$ |
131,358 |
| Unrealized (gain) loss on strategic investments and marketable securities, net |
(42,222) |
|
(44,459) |
|
(521) |
|
(192,067) |
|
41,785 |
| Realized gains on previously held minority interests, net |
(48,837) |
|
— |
|
— |
|
(91,150) |
|
— |
| Transaction costs related to strategic investments and acquisitions |
2,104 |
|
2,652 |
|
2,708 |
|
15,249 |
|
4,501 |
| Loss on disposal, abandonment, and impairment of property, equipment and intangible assets, net |
— |
|
— |
|
— |
|
— |
|
317 |
| Loss recoveries |
— |
|
— |
|
— |
|
— |
|
(3,404) |
| Inventory step-up amortization |
609 |
|
— |
|
— |
|
609 |
|
— |
| Litigation costs and related recoveries |
1,537 |
|
— |
|
169 |
|
1,761 |
|
241 |
| Payroll taxes related to XSPP vesting and CEO Award option exercises |
918 |
|
1,727 |
|
50 |
|
2,645 |
|
9,011 |
| Adjusted EBITDA |
$ |
141,590 |
|
$ |
145,053 |
|
$ |
91,002 |
|
$ |
521,375 |
|
$ |
331,396 |
| Net income as a percentage of net sales |
23.5 |
% |
|
12.3 |
% |
|
13.3 |
% |
|
18.1 |
% |
|
11.3 |
% |
| Adjusted EBITDA as a percentage of net sales |
24.6 |
% |
|
26.7 |
% |
|
21.1 |
% |
|
25.0 |
% |
|
21.2 |
% |
|
|
|
|
|
|
|
|
|
|
| Stock-based compensation expense: |
|
|
|
|
|
|
|
|
|
| Cost of product and service sales |
$ |
11,854 |
|
$ |
10,123 |
|
$ |
1,910 |
|
$ |
60,089 |
|
$ |
6,595 |
| Sales, general and administrative |
73,525 |
|
55,248 |
|
15,301 |
|
190,561 |
|
58,533 |
| Research and development |
45,509 |
|
36,409 |
|
17,919 |
|
131,954 |
|
66,230 |
| Total |
$ |
130,888 |
|
$ |
101,780 |
|
$ |
35,130 |
|
$ |
382,604 |
|
$ |
131,358 |
AXON ENTERPRISE, INC.
RECONCILIATION OF GAAP TO NON-GAAP FINANCIAL MEASURES - continued
(in thousands, except per share amounts)
|
|
|
|
|
|
|
|
|
|
|
|
|
|
|
|
|
|
|
|
|
|
|
|
|
|
|
|
|
|
|
THREE MONTHS ENDED |
|
TWELVE MONTHS ENDED |
|
31 DEC 2024 |
|
30 SEP 2024 |
|
31 DEC 2023 |
|
31 DEC 2024 |
|
31 DEC 2023 |
| Non-GAAP net income: |
|
|
|
|
|
|
|
|
|
| GAAP net income |
$ |
135,184 |
|
$ |
67,025 |
|
$ |
57,061 |
|
$ |
377,034 |
|
$ |
175,783 |
| Non-GAAP adjustments: |
|
|
|
|
|
|
|
|
|
| Stock-based compensation expense |
130,888 |
|
101,780 |
|
35,130 |
|
382,604 |
|
131,358 |
| Unrealized (gain) loss on strategic investments and marketable securities, net |
(42,222) |
|
|
(44,459) |
|
|
(521) |
|
|
(192,067) |
|
|
41,785 |
|
| Realized gains on previously held minority interests, net |
(48,837) |
|
|
— |
|
|
— |
|
|
(91,150) |
|
|
— |
|
| Transaction costs related to strategic investments and acquisitions |
2,104 |
|
2,652 |
|
2,708 |
|
15,249 |
|
4,501 |
| Loss on disposal, abandonment, and impairment of property, equipment and intangible assets, net |
— |
|
— |
|
— |
|
— |
|
317 |
| Loss recoveries |
— |
|
— |
|
— |
|
— |
|
(3,404) |
| Inventory step-up amortization |
609 |
|
— |
|
— |
|
609 |
|
— |
| Litigation costs and related recoveries |
1,537 |
|
— |
|
169 |
|
1,761 |
|
241 |
| Payroll taxes related to XSPP vesting and CEO Award option exercises |
918 |
|
1,727 |
|
50 |
|
2,645 |
|
9,011 |
| Income tax effects |
(11,897) |
|
|
(15,273) |
|
|
(8,733) |
|
|
(30,410) |
|
|
(45,952) |
|
| Non-GAAP net income |
$ |
168,284 |
|
$ |
113,452 |
|
$ |
85,864 |
|
$ |
466,275 |
|
$ |
313,640 |
|
|
|
|
|
|
|
|
|
|
| Diluted income per common share |
|
|
|
|
|
|
|
|
|
| GAAP |
$ |
1.67 |
|
$ |
0.86 |
|
$ |
0.75 |
|
$ |
4.80 |
|
$ |
2.33 |
| Non-GAAP |
$ |
2.08 |
|
$ |
1.45 |
|
$ |
1.13 |
|
$ |
5.94 |
|
$ |
4.16 |
|
|
|
|
|
|
|
|
|
|
| Weighted average number of diluted common and common equivalent shares outstanding |
81,091 |
|
78,080 |
|
76,178 |
|
78,558 |
|
75,456 |
AXON ENTERPRISE, INC.
RECONCILIATION OF GAAP TO NON-GAAP FINANCIAL MEASURES - continued
(in thousands)
|
|
|
|
|
|
|
|
|
|
|
|
|
|
|
|
|
|
|
|
|
|
|
|
|
|
|
|
|
|
|
THREE MONTHS ENDED |
|
TWELVE MONTHS ENDED |
|
31 DEC 2024 |
|
30 SEP 2024 |
|
31 DEC 2023 |
|
31 DEC 2024 |
|
31 DEC 2023 |
| Net sales |
$ |
575,145 |
|
$ |
544,274 |
|
$ |
430,376 |
|
$ |
2,082,526 |
|
$ |
1,560,699 |
| Cost of sales |
229,296 |
|
213,527 |
|
166,384 |
|
841,146 |
|
605,246 |
| Gross margin |
345,849 |
|
330,747 |
|
263,992 |
|
1,241,380 |
|
955,453 |
| Stock-based compensation expense |
11,854 |
|
10,123 |
|
1,910 |
|
60,089 |
|
6,595 |
| Amortization of acquired intangible assets |
5,071 |
|
3,020 |
|
955 |
|
13,369 |
|
3,144 |
| Inventory step-up amortization |
609 |
|
— |
|
— |
|
609 |
|
— |
| Adjusted gross margin |
$ |
363,383 |
|
$ |
343,890 |
|
$ |
266,857 |
|
$ |
1,315,447 |
|
$ |
965,192 |
| Gross margin |
60.1 |
% |
|
60.8 |
% |
|
61.3 |
% |
|
59.6 |
% |
|
61.2 |
% |
| Adjusted gross margin |
63.2 |
% |
|
63.2 |
% |
|
62.0 |
% |
|
63.2 |
% |
|
61.8 |
% |
Software and Sensors
|
|
|
|
|
|
|
|
|
|
|
|
|
|
|
|
|
|
|
|
|
|
|
|
|
|
|
|
|
|
|
|
|
|
|
|
|
|
|
|
|
|
|
|
|
|
|
|
|
|
|
|
|
|
|
THREE MONTHS ENDED |
|
31 DEC 2024 |
|
30 SEP 2024 |
|
31 DEC 2023 |
|
Axon Cloud
& Services |
|
Sensors
& Other |
|
Total |
|
Axon Cloud
& Services |
|
Sensors
& Other |
|
Total |
|
Axon Cloud
& Services |
|
Sensors
& Other |
|
Total |
| Net sales |
$ |
230,325 |
|
$ |
123,588 |
|
$ |
353,913 |
|
$ |
202,514 |
|
$ |
120,026 |
|
$ |
322,540 |
|
$ |
163,832 |
|
$ |
105,201 |
|
$ |
269,033 |
| Cost of sales |
60,531 |
|
83,084 |
|
143,615 |
|
56,191 |
|
70,382 |
|
126,573 |
|
41,387 |
|
55,833 |
|
97,220 |
| Gross margin |
169,794 |
|
40,504 |
|
210,298 |
|
146,323 |
|
49,644 |
|
195,967 |
|
122,445 |
|
49,368 |
|
171,813 |
| Stock-based compensation expense |
4,170 |
|
2,342 |
|
6,512 |
|
3,270 |
|
2,045 |
|
5,315 |
|
977 |
|
220 |
|
1,197 |
| Amortization of acquired intangible assets |
3,811 |
|
1,259 |
|
5,070 |
|
2,638 |
|
338 |
|
2,976 |
|
617 |
|
338 |
|
955 |
| Inventory step-up amortization |
— |
|
609 |
|
609 |
|
— |
|
— |
|
— |
|
— |
|
— |
|
— |
| Adjusted gross margin |
$ |
177,775 |
|
$ |
44,714 |
|
$ |
222,489 |
|
$ |
152,231 |
|
$ |
52,027 |
|
$ |
204,258 |
|
$ |
124,039 |
|
$ |
49,926 |
|
$ |
173,965 |
| Gross margin |
73.7 |
% |
|
32.8 |
% |
|
59.4 |
% |
|
72.3 |
% |
|
41.4 |
% |
|
60.8 |
% |
|
74.7 |
% |
|
46.9 |
% |
|
63.9 |
% |
| Adjusted gross margin |
77.2 |
% |
|
36.2 |
% |
|
62.9 |
% |
|
75.2 |
% |
|
43.3 |
% |
|
63.3 |
% |
|
75.7 |
% |
|
47.5 |
% |
|
64.7 |
% |
|
|
|
|
|
|
|
|
|
|
|
|
|
|
|
|
|
|
|
|
|
|
|
|
|
|
|
|
|
|
|
|
|
|
|
|
|
TWELVE MONTHS ENDED |
|
31 DEC 2024 |
|
31 DEC 2023 |
|
Axon Cloud
& Services |
|
Sensors
& Other |
|
Total |
|
Axon Cloud
& Services |
|
Sensors
& Other |
|
Total |
| Net sales |
$ |
806,322 |
|
$ |
457,531 |
|
$ |
1,263,853 |
|
|
$ |
560,797 |
|
$ |
386,392 |
|
$ |
947,189 |
| Cost of sales |
217,687 |
|
284,817 |
|
502,504 |
|
153,925 |
|
209,344 |
|
363,269 |
| Gross margin |
588,635 |
|
172,714 |
|
761,349 |
|
406,872 |
|
177,048 |
|
583,920 |
| Stock-based compensation expense |
11,428 |
|
13,755 |
|
25,183 |
|
3,671 |
|
690 |
|
4,361 |
| Amortization of acquired intangible assets |
11,051 |
|
2,287 |
|
13,338 |
|
2,467 |
|
676 |
|
3,143 |
| Inventory step-up amortization |
— |
|
609 |
|
609 |
|
— |
|
— |
|
— |
| Adjusted gross margin |
$ |
611,114 |
|
$ |
189,365 |
|
$ |
800,479 |
|
$ |
413,010 |
|
$ |
178,414 |
|
$ |
591,424 |
| Gross margin |
73.0 |
% |
|
37.7 |
% |
|
60.2 |
% |
|
72.6 |
% |
|
45.8 |
% |
|
61.6 |
% |
| Adjusted gross margin |
75.8 |
% |
|
41.4 |
% |
|
63.3 |
% |
|
73.6 |
% |
|
46.2 |
% |
|
62.4 |
% |
TASER
|
|
|
|
|
|
|
|
|
|
|
|
|
|
|
|
|
|
|
|
|
|
|
|
|
|
|
|
|
|
|
THREE MONTHS ENDED |
|
TWELVE MONTHS ENDED |
|
31 DEC 2024 |
|
30 SEP 2024 |
|
31 DEC 2023 |
|
31 DEC 2024 |
|
31 DEC 2023 |
| Net sales |
$ |
221,232 |
|
|
$ |
221,734 |
|
|
$ |
161,343 |
|
|
$ |
818,673 |
|
|
$ |
613,510 |
|
| Cost of sales |
85,681 |
|
|
86,954 |
|
|
69,164 |
|
|
338,642 |
|
|
241,977 |
|
| Gross margin |
135,551 |
|
|
134,780 |
|
|
92,179 |
|
|
480,031 |
|
|
371,533 |
|
| Stock-based compensation expense |
5,342 |
|
|
4,808 |
|
|
713 |
|
|
34,906 |
|
|
2,234 |
|
| Amortization of acquired intangible assets |
1 |
|
|
44 |
|
|
— |
|
|
31 |
|
|
1 |
|
| Inventory step-up amortization |
— |
|
|
— |
|
|
— |
|
|
— |
|
|
— |
|
| Adjusted gross margin |
$ |
140,894 |
|
|
$ |
139,632 |
|
|
$ |
92,892 |
|
|
$ |
514,968 |
|
|
$ |
373,768 |
|
| Gross margin |
61.3 |
% |
|
60.8 |
% |
|
57.1 |
% |
|
58.6 |
% |
|
60.6 |
% |
| Adjusted gross margin |
63.7 |
% |
|
63.0 |
% |
|
57.6 |
% |
|
62.9 |
% |
|
60.9 |
% |
AXON ENTERPRISE, INC.
CONSOLIDATED BALANCE SHEETS
(in thousands)
|
|
|
|
|
|
|
|
|
|
|
|
|
31 DEC 2024 |
|
31 DEC 2023 |
|
|
|
|
| ASSETS |
|
|
|
| Current Assets: |
|
|
|
| Cash and cash equivalents |
$ |
454,844 |
|
|
$ |
598,545 |
|
| Marketable securities |
198,270 |
|
|
77,940 |
|
| Short-term investments |
333,235 |
|
|
644,054 |
|
| Accounts and notes receivable, net |
547,572 |
|
|
412,961 |
|
| Contract assets, net |
367,929 |
|
|
287,232 |
|
| Inventory |
265,316 |
|
|
269,855 |
|
| Prepaid expenses and other current assets |
130,315 |
|
|
103,055 |
|
| Total current assets |
2,297,481 |
|
|
2,393,642 |
|
|
|
|
|
| Property and equipment, net |
247,324 |
|
|
200,533 |
|
| Deferred tax assets, net |
304,282 |
|
|
227,784 |
|
| Intangible assets, net |
175,157 |
|
|
19,539 |
|
| Goodwill |
756,838 |
|
|
57,945 |
|
| Long-term notes receivable, net |
3,460 |
|
|
2,588 |
|
| Long-term contract assets, net |
119,876 |
|
|
84,382 |
|
| Strategic investments |
332,550 |
|
|
231,730 |
|
| Other long-term assets |
237,620 |
|
|
191,031 |
|
| Total assets |
$ |
4,474,588 |
|
|
$ |
3,409,174 |
|
|
|
|
|
| LIABILITIES AND STOCKHOLDERS’ EQUITY |
|
|
|
| Current Liabilities: |
|
|
|
| Accounts payable |
71,955 |
|
|
65,852 |
|
| Accrued liabilities |
279,193 |
|
|
193,550 |
|
| Current portion of deferred revenue |
612,955 |
|
|
470,415 |
|
| Customer deposits |
20,626 |
|
|
21,935 |
|
| Other current liabilities |
12,857 |
|
|
9,787 |
|
| Total current liabilities |
997,586 |
|
|
761,539 |
|
|
|
|
|
| Deferred revenue, net of current portion |
360,685 |
|
|
270,901 |
|
| Liability for unrecognized tax benefits |
25,007 |
|
|
18,049 |
|
| Long-term deferred compensation |
15,877 |
|
|
11,342 |
|
| Long-term lease liabilities |
41,383 |
|
|
33,550 |
|
| Convertible notes, net |
680,289 |
|
|
677,113 |
|
| Other long-term liabilities |
26,096 |
|
|
20,915 |
|
| Total liabilities |
2,146,923 |
|
|
1,793,409 |
|
|
|
|
|
| Stockholders’ Equity: |
|
|
|
| Preferred stock |
— |
|
— |
| Common stock |
1 |
|
|
1 |
|
| Additional paid-in capital |
1,689,781 |
|
|
1,347,410 |
|
| Treasury stock |
(155,947) |
|
|
(155,947) |
|
| Retained earnings |
812,014 |
|
|
434,980 |
|
| Accumulated other comprehensive loss |
(18,184) |
|
|
(10,679) |
|
| Total stockholders’ equity |
2,327,665 |
|
|
1,615,765 |
|
| Total liabilities and stockholders’ equity |
$ |
4,474,588 |
|
|
$ |
3,409,174 |
|
AXON ENTERPRISE, INC.
CONDENSED CONSOLIDATED STATEMENTS OF CASH FLOWS
(in thousands)
|
|
|
|
|
|
|
|
|
|
|
|
|
|
|
|
|
|
|
|
|
|
|
|
|
|
|
|
|
|
|
THREE MONTHS ENDED |
|
TWELVE MONTHS ENDED |
|
31 DEC 2024 |
|
30 SEP 2024 |
|
31 DEC 2023 |
|
31 DEC 2024 |
|
31 DEC 2023 |
| Cash flows from operating activities: |
|
|
|
|
|
|
|
|
|
| Net income |
$ |
135,184 |
|
|
$ |
67,025 |
|
|
$ |
57,061 |
|
|
$ |
377,034 |
|
|
$ |
175,783 |
|
| Adjustments to reconcile net income to net cash provided by (used in) operating activities: |
|
|
|
|
|
|
|
|
|
| Stock-based compensation |
130,888 |
|
|
101,780 |
|
|
35,130 |
|
|
382,604 |
|
|
131,358 |
|
| (Gain) loss on strategic investments and marketable securities, net |
(91,059) |
|
|
(44,459) |
|
|
(521) |
|
|
(283,217) |
|
|
41,785 |
|
| Depreciation and amortization |
17,680 |
|
|
13,003 |
|
|
6,471 |
|
|
48,425 |
|
|
19,315 |
|
| Provision for bad debts and inventory |
6,249 |
|
|
2,740 |
|
|
401 |
|
|
20,073 |
|
|
5,484 |
|
| Deferred income taxes |
(58,035) |
|
|
(19,306) |
|
|
(19,542) |
|
|
(85,096) |
|
|
(72,497) |
|
| Other noncash items |
7,994 |
|
|
6,819 |
|
|
4,615 |
|
|
21,177 |
|
|
12,853 |
|
| Change in assets and liabilities: |
|
|
|
|
|
|
|
|
|
| Receivables and contract assets |
(19,083) |
|
|
(149,667) |
|
|
7,625 |
|
|
(245,842) |
|
|
(178,989) |
|
| Inventory |
12,236 |
|
|
5,330 |
|
|
(12,530) |
|
|
607 |
|
|
(77,626) |
|
| Deferred revenue |
98,921 |
|
|
65,219 |
|
|
43,433 |
|
|
155,641 |
|
|
146,819 |
|
| Accounts payable, accrued and other liabilities |
44,276 |
|
|
53,775 |
|
|
51,962 |
|
|
54,519 |
|
|
65,329 |
|
| Prepaid expenses and other assets |
(35,085) |
|
|
(10,938) |
|
|
(34,067) |
|
|
(37,613) |
|
|
(80,351) |
|
| Net cash provided by operating activities |
250,166 |
|
|
91,321 |
|
|
140,038 |
|
|
408,312 |
|
|
189,263 |
|
| Cash flows from investing activities: |
|
|
|
|
|
|
|
|
|
| Purchases of investments |
(178,005) |
|
|
(124,425) |
|
|
(118,995) |
|
|
(793,419) |
|
|
(563,680) |
|
| Business combinations, net of cash acquired |
(384,021) |
|
|
— |
|
|
— |
|
|
(621,817) |
|
|
(21,090) |
|
| Proceeds from call, maturity, and sale of investments |
145,068 |
|
|
193,968 |
|
|
196,204 |
|
|
1,003,394 |
|
|
657,418 |
|
| Purchases of property and equipment |
(24,801) |
|
|
(26,472) |
|
|
(24,011) |
|
|
(78,785) |
|
|
(59,635) |
|
| Other, net |
20 |
|
|
— |
|
|
(25) |
|
|
54 |
|
|
(537) |
|
| Net cash (used in) provided by investing activities |
(441,739) |
|
|
43,071 |
|
|
53,173 |
|
|
(490,573) |
|
|
12,476 |
|
| Cash flows from financing activities: |
|
|
|
|
|
|
|
|
|
| Net proceeds from equity offering |
— |
|
|
— |
|
|
— |
|
|
— |
|
|
94,705 |
|
| Proceeds from options exercised |
4,859 |
|
|
9,717 |
|
|
— |
|
|
14,576 |
|
|
54,503 |
|
| Income and payroll tax payments for net-settled stock awards |
(35,853) |
|
|
(17,430) |
|
|
(3,818) |
|
|
(58,178) |
|
|
(107,894) |
|
| Other, net |
(1,835) |
|
|
— |
|
|
— |
|
|
(1,835) |
|
|
— |
|
| Net cash (used in) provided by financing activities |
(32,829) |
|
|
(7,713) |
|
|
(3,818) |
|
|
(45,437) |
|
|
41,314 |
|
| Effect of exchange rate changes on cash and cash equivalents |
(6,284) |
|
|
2,161 |
|
|
3,266 |
|
|
(6,209) |
|
|
2,065 |
|
| Net increase (decrease) in cash and cash equivalents |
(230,686) |
|
|
128,840 |
|
|
192,659 |
|
|
(133,907) |
|
|
245,118 |
|
| Cash and cash equivalents and restricted cash, beginning of period |
697,449 |
|
|
568,609 |
|
|
408,011 |
|
|
600,670 |
|
|
355,552 |
|
| Cash and cash equivalents and restricted cash, end of period |
$ |
466,763 |
|
|
$ |
697,449 |
|
|
$ |
600,670 |
|
|
$ |
466,763 |
|
|
$ |
600,670 |
|
AXON ENTERPRISE, INC.
SELECTED CASH FLOW INFORMATION
(in thousands)
|
|
|
|
|
|
|
|
|
|
|
|
|
|
|
|
|
|
|
|
|
|
|
|
|
|
|
|
|
|
|
THREE MONTHS ENDED |
|
TWELVE MONTHS ENDED |
|
31 DEC 2024 |
|
30 SEP 2024 |
|
31 DEC 2023 |
|
31 DEC 2024 |
|
31 DEC 2023 |
| Net cash provided by operating activities |
$ |
250,166 |
|
|
$ |
91,321 |
|
|
$ |
140,038 |
|
|
$ |
408,312 |
|
|
$ |
189,263 |
|
| Purchases of property and equipment |
(24,801) |
|
|
(26,472) |
|
|
(24,011) |
|
|
(78,785) |
|
|
(59,635) |
|
| Purchases of intangible assets |
— |
|
— |
|
(56) |
|
|
— |
|
(635) |
|
| Free cash flow, a non-GAAP measure |
$ |
225,365 |
|
$ |
64,849 |
|
$ |
115,971 |
|
$ |
329,527 |
|
$ |
128,993 |
| Bond premium amortization |
1,233 |
|
2,566 |
|
4,378 |
|
12,186 |
|
16,449 |
| Net campus investment |
218 |
|
882 |
|
606 |
|
2,591 |
|
2,669 |
| Adjusted free cash flow, a non-GAAP measure |
$ |
226,816 |
|
$ |
68,297 |
|
$ |
120,955 |
|
$ |
344,304 |
|
$ |
148,111 |
AXON ENTERPRISE, INC.
SUPPLEMENTAL TABLES
(in thousands)
|
|
|
|
|
|
|
|
|
|
|
|
|
31 DEC 2024 |
|
31 DEC 2023 |
|
|
|
|
| Cash and cash equivalents |
$ |
454,844 |
|
$ |
598,545 |
| Current restricted cash |
11,919 |
|
2,125 |
| Short-term investments |
333,235 |
|
644,054 |
| Cash, cash equivalents, restricted cash and investments, net |
799,998 |
|
1,244,724 |
| Convertible notes, principal amount |
(690,000) |
|
|
(690,000) |
|
| Total cash, cash equivalents, restricted cash and investments, net of convertible notes |
$ |
109,998 |
|
$ |
554,724 |