| Maryland | 001-13561 | 43-1790877 | ||||||||||||
| (State or other jurisdiction of incorporation) |
(Commission File Number) |
(I.R.S. Employer Identification No.) |
||||||||||||
| 909 Walnut Street, | Suite 200 | |||||||||||||
| Kansas City, | Missouri | 64106 | ||||||||||||
| (Address of principal executive offices) (Zip Code) | ||||||||||||||
| (816) | 472-1700 | ||||
| ☐ | Written communications pursuant to Rule 425 under the Securities Act (17 CFR 230.425) | ||||
| ☐ | Soliciting material pursuant to Rule 14a-12 under the Exchange Act (17 CFR 240.14a-12) | ||||
| ☐ | Pre-commencement communications pursuant to Rule 14d-2(b) under the Exchange Act (17 CFR 240.14d-2(b)) | ||||
| ☐ | Pre-commencement communications pursuant to Rule 13e-4(c) under the Exchange Act (17 CFR 240.13e-4(c)) | ||||
| Title of each class | Trading symbol(s) | Name of each exchange on which registered | ||||||||||||
| Common shares, par value $0.01 per share | EPR | New York Stock Exchange | ||||||||||||
| 5.75% Series C cumulative convertible preferred shares, par value $0.01 per share | EPR PrC | New York Stock Exchange | ||||||||||||
| 9.00% Series E cumulative convertible preferred shares, par value $0.01 per share | EPR PrE | New York Stock Exchange | ||||||||||||
| 5.75% Series G cumulative redeemable preferred shares, par value $0.01 per share | EPR PrG | New York Stock Exchange | ||||||||||||
| Exhibit No. |
Description | |||||||
Press Release dated February 25, 2026 issued by EPR Properties announcing its results of operations and financial condition for the fourth quarter and year ended December 31, 2025. |
||||||||
Investor slide presentation for the fourth quarter and year ended December 31, 2025, made available by EPR Properties on February 25, 2026. |
||||||||
Supplemental Operating and Financial Data for the fourth quarter and year ended December 31, 2025, made available by EPR Properties on February 25, 2026. |
||||||||
| 104 | Cover Page Interactive Data File (embedded within the Inline XBRL document) | |||||||
| EPR PROPERTIES | |||||||||||
| By: | /s/ Mark A. Peterson | ||||||||||
| Mark A. Peterson | |||||||||||
| Executive Vice President, Treasurer and Chief Financial Officer |
|||||||||||

| Three Months Ended December 31, | Year Ended December 31, | ||||||||||||||||||||||||||||
| 2025 | 2024 | % Change | 2025 | 2024 | % Change | ||||||||||||||||||||||||
| Total revenue | $ | 182,950 | $ | 177,234 | 3.2 | % | $ | 718,357 | $ | 698,068 | 2.9 | % | |||||||||||||||||
| Net income (loss) available to common shareholders | 60,864 | (14,435) | 521.6 | % | 250,792 | 121,922 | 105.7 | % | |||||||||||||||||||||
| Net income (loss) available to common shareholders per diluted common share | 0.79 | (0.19) | 515.8 | % | 3.28 | 1.60 | 105.0 | % | |||||||||||||||||||||
| Funds From Operations as adjusted (FFOAA)(1) | 101,201 | 94,309 | 7.3 | % | 396,639 | 373,929 | 6.1 | % | |||||||||||||||||||||
| FFOAA per diluted common share (1) | 1.30 | 1.23 | 5.7 | % | 5.12 | 4.87 | 5.1 | % | |||||||||||||||||||||
| Adjusted Funds From Operations (AFFO)(1) | 101,373 | 94,139 | 7.7 | % | 398,223 | 371,409 | 7.2 | % | |||||||||||||||||||||
| AFFO per diluted common share (1) | 1.30 | 1.22 | 6.6 | % | 5.14 | 4.84 | 6.2 | % | |||||||||||||||||||||
| (1) A non-GAAP financial measure | |||||||||||||||||||||||||||||
| Net income available to common shareholders per diluted common share | $ | 2.89 | to | $ | 3.09 | |||||||||
| FFOAA per diluted common share | $ | 5.28 | to | $ | 5.48 | |||||||||
| Investment spending | $ | 400.0 | to | $ | 500.0 | |||||||||
| Disposition proceeds | $ | 25.0 | to | $ | 75.0 | |||||||||
| Three Months Ended December 31, | Year Ended December 31, | ||||||||||||||||||||||
| 2025 | 2024 | 2025 | 2024 | ||||||||||||||||||||
| Rental revenue | $ | 157,057 | $ | 149,116 | $ | 608,605 | $ | 585,167 | |||||||||||||||
| Other income | 9,603 | 13,197 | 45,592 | 57,071 | |||||||||||||||||||
| Mortgage and other financing income | 16,290 | 14,921 | 64,160 | 55,830 | |||||||||||||||||||
| Total revenue | 182,950 | 177,234 | 718,357 | 698,068 | |||||||||||||||||||
| Property operating expense | 14,862 | 15,188 | 59,172 | 59,146 | |||||||||||||||||||
| Other expense | 10,013 | 13,437 | 45,756 | 56,877 | |||||||||||||||||||
| General and administrative expense | 14,575 | 12,233 | 55,830 | 50,096 | |||||||||||||||||||
| Retirement and severance expense | 1,901 | — | 2,995 | 1,836 | |||||||||||||||||||
| Transaction costs | 471 | 423 | 2,199 | 798 | |||||||||||||||||||
| Provision (benefit) for credit losses, net | (985) | 9,876 | 8,477 | 12,247 | |||||||||||||||||||
| Impairment charges | — | 39,952 | — | 51,764 | |||||||||||||||||||
| Depreciation and amortization | 43,582 | 40,995 | 169,160 | 165,733 | |||||||||||||||||||
| Total operating expenses | 84,419 | 132,104 | 343,589 | 398,497 | |||||||||||||||||||
| Gain on sale of real estate and early ground lease termination | 5,297 | 112 | 39,533 | 16,101 | |||||||||||||||||||
| Income from operations | 103,828 | 45,242 | 414,301 | 315,672 | |||||||||||||||||||
| Costs associated with loan refinancing or payoff | — | — | — | 337 | |||||||||||||||||||
| Interest expense, net | 33,574 | 33,472 | 133,079 | 130,810 | |||||||||||||||||||
| Equity in loss from joint ventures | 2,396 | 3,425 | 3,790 | 8,809 | |||||||||||||||||||
| Impairment charges on joint ventures | — | 16,087 | — | 28,217 | |||||||||||||||||||
| Income (loss) before income taxes | 67,858 | (7,742) | 277,432 | 147,499 | |||||||||||||||||||
| Income tax expense | 954 | 653 | 2,496 | 1,433 | |||||||||||||||||||
| Net income (loss) | $ | 66,904 | $ | (8,395) | $ | 274,936 | $ | 146,066 | |||||||||||||||
| Preferred dividend requirements | 6,040 | 6,040 | 24,144 | 24,144 | |||||||||||||||||||
| Net income (loss) available to common shareholders of EPR Properties | $ | 60,864 | $ | (14,435) | $ | 250,792 | $ | 121,922 | |||||||||||||||
| Net income (loss) available to common shareholders of EPR Properties per share: | |||||||||||||||||||||||
| Basic | $ | 0.80 | $ | (0.19) | $ | 3.30 | $ | 1.61 | |||||||||||||||
| Diluted | $ | 0.79 | $ | (0.19) | $ | 3.28 | $ | 1.60 | |||||||||||||||
| Shares used for computation (in thousands): | |||||||||||||||||||||||
| Basic | 76,141 | 75,733 | 76,040 | 75,636 | |||||||||||||||||||
| Diluted | 76,654 | 76,156 | 76,495 | 75,999 | |||||||||||||||||||
| December 31, 2025 | December 31, 2024 | ||||||||||
| Assets | |||||||||||
Real estate investments, net of accumulated depreciation of $1,714,886 and $1,562,645 at December 31, 2025 and December 31, 2024, respectively |
$ | 4,494,259 | $ | 4,435,358 | |||||||
| Land held for development | 20,168 | 20,168 | |||||||||
| Property under development | 54,905 | 112,263 | |||||||||
| Operating lease right-of-use assets | 170,755 | 173,364 | |||||||||
Mortgage notes and related accrued interest receivable, net of allowance for credit losses of $15,929 and $17,111 at December 31, 2025 and December 31, 2024, respectively |
679,254 | 665,796 | |||||||||
| Investment in joint ventures | 12,316 | 14,019 | |||||||||
| Cash and cash equivalents | 90,577 | 22,062 | |||||||||
| Restricted cash | 8,071 | 13,637 | |||||||||
| Accounts receivable | 97,855 | 84,589 | |||||||||
| Other assets | 71,602 | 75,251 | |||||||||
| Total assets | $ | 5,699,762 | $ | 5,616,507 | |||||||
| Liabilities and Equity | |||||||||||
| Accounts payable and accrued liabilities | $ | 99,392 | $ | 107,976 | |||||||
| Operating lease liabilities | 204,747 | 212,400 | |||||||||
| Dividends payable | 28,495 | 31,863 | |||||||||
| Unearned rents and interest | 108,546 | 80,565 | |||||||||
| Debt | 2,929,411 | 2,860,458 | |||||||||
| Total liabilities | 3,370,591 | 3,293,262 | |||||||||
| Total equity | $ | 2,329,171 | $ | 2,323,245 | |||||||
| Total liabilities and equity | $ | 5,699,762 | $ | 5,616,507 | |||||||
| Three Months Ended December 31, | Year Ended December 31, | |||||||||||||||||||||||||
| 2025 | 2024 | 2025 | 2024 | |||||||||||||||||||||||
| FFO: | ||||||||||||||||||||||||||
| Net income (loss) available to common shareholders of EPR Properties | $ | 60,864 | $ | (14,435) | $ | 250,792 | $ | 121,922 | ||||||||||||||||||
| Gain on sale of real estate and early ground lease termination | (5,297) | (112) | (39,533) | (16,101) | ||||||||||||||||||||||
| Impairment of real estate investments | — | 39,952 | — | 51,764 | ||||||||||||||||||||||
| Real estate depreciation and amortization | 43,417 | 40,838 | 168,545 | 165,029 | ||||||||||||||||||||||
| Allocated share of joint venture depreciation | 1,000 | 1,965 | 4,010 | 9,419 | ||||||||||||||||||||||
| Impairment charges on joint ventures | — | 16,087 | — | 28,217 | ||||||||||||||||||||||
| FFO available to common shareholders of EPR Properties | $ | 99,984 | $ | 84,295 | $ | 383,814 | $ | 360,250 | ||||||||||||||||||
| FFO available to common shareholders of EPR Properties | $ | 99,984 | $ | 84,295 | $ | 383,814 | $ | 360,250 | ||||||||||||||||||
| Add: Preferred dividends for Series C preferred shares | 1,938 | 1,938 | 7,752 | 7,752 | ||||||||||||||||||||||
| Add: Preferred dividends for Series E preferred shares | 1,938 | 1,938 | 7,752 | 7,752 | ||||||||||||||||||||||
| Diluted FFO available to common shareholders of EPR Properties | $ | 103,860 | $ | 88,171 | $ | 399,318 | $ | 375,754 | ||||||||||||||||||
| FFOAA: | ||||||||||||||||||||||||||
| FFO available to common shareholders of EPR Properties | $ | 99,984 | $ | 84,295 | $ | 383,814 | $ | 360,250 | ||||||||||||||||||
| Retirement and severance expense | 1,901 | — | 2,995 | 1,836 | ||||||||||||||||||||||
| Transaction costs | 471 | 423 | 2,199 | 798 | ||||||||||||||||||||||
| Provision (benefit) for credit losses, net | (985) | 9,876 | 8,477 | 12,247 | ||||||||||||||||||||||
| Costs associated with loan refinancing or payoff | — | — | — | 337 | ||||||||||||||||||||||
| Deferred income tax benefit | (170) | (285) | (846) | (1,539) | ||||||||||||||||||||||
| FFOAA available to common shareholders of EPR Properties | $ | 101,201 | $ | 94,309 | $ | 396,639 | $ | 373,929 | ||||||||||||||||||
| FFOAA available to common shareholders of EPR Properties | $ | 101,201 | $ | 94,309 | $ | 396,639 | $ | 373,929 | ||||||||||||||||||
| Add: Preferred dividends for Series C preferred shares | 1,938 | 1,938 | 7,752 | 7,752 | ||||||||||||||||||||||
| Add: Preferred dividends for Series E preferred shares | 1,938 | 1,938 | 7,752 | 7,752 | ||||||||||||||||||||||
| Diluted FFOAA available to common shareholders of EPR Properties | $ | 105,077 | $ | 98,185 | $ | 412,143 | $ | 389,433 | ||||||||||||||||||
| Three Months Ended December 31, | Year Ended December 31, | |||||||||||||||||||||||||
| 2025 | 2024 | 2025 | 2024 | |||||||||||||||||||||||
| AFFO: | ||||||||||||||||||||||||||
| FFOAA available to common shareholders of EPR Properties | $ | 101,201 | $ | 94,309 | $ | 396,639 | $ | 373,929 | ||||||||||||||||||
| Non-real estate depreciation and amortization | 165 | 157 | 615 | 704 | ||||||||||||||||||||||
| Deferred financing fees amortization | 2,380 | 2,187 | 8,808 | 8,844 | ||||||||||||||||||||||
| Share-based compensation expense to management and trustees | 3,643 | 3,572 | 15,329 | 14,066 | ||||||||||||||||||||||
| Amortization of above and below market leases, net and tenant allowances | (81) | (81) | (324) | (333) | ||||||||||||||||||||||
| Maintenance capital expenditures (1) | (1,532) | (1,862) | (5,205) | (7,299) | ||||||||||||||||||||||
| Straight-lined rental revenue | (4,025) | (3,992) | (16,100) | (17,327) | ||||||||||||||||||||||
| Straight-lined ground sublease expense | (35) | 20 | (37) | 97 | ||||||||||||||||||||||
| Non-cash portion of mortgage and other financing income | (343) | (171) | (1,502) | (1,984) | ||||||||||||||||||||||
| Allocated share of joint venture non-cash items | — | — | — | 712 | ||||||||||||||||||||||
| AFFO available to common shareholders of EPR Properties | $ | 101,373 | $ | 94,139 | $ | 398,223 | $ | 371,409 | ||||||||||||||||||
| AFFO available to common shareholders of EPR Properties | $ | 101,373 | $ | 94,139 | $ | 398,223 | $ | 371,409 | ||||||||||||||||||
| Add: Preferred dividends for Series C preferred shares | 1,938 | 1,938 | 7,752 | 7,752 | ||||||||||||||||||||||
| Add: Preferred dividends for Series E preferred shares | 1,938 | 1,938 | 7,752 | 7,752 | ||||||||||||||||||||||
| Diluted AFFO available to common shareholders of EPR Properties | $ | 105,249 | $ | 98,015 | $ | 413,727 | $ | 386,913 | ||||||||||||||||||
| FFO per common share: | ||||||||||||||||||||||||||
| Basic | $ | 1.31 | $ | 1.11 | $ | 5.05 | $ | 4.76 | ||||||||||||||||||
| Diluted | 1.29 | 1.10 | 4.96 | 4.70 | ||||||||||||||||||||||
| FFOAA per common share: | ||||||||||||||||||||||||||
| Basic | $ | 1.33 | $ | 1.25 | $ | 5.22 | $ | 4.94 | ||||||||||||||||||
| Diluted | 1.30 | 1.23 | 5.12 | 4.87 | ||||||||||||||||||||||
| AFFO per common share: | ||||||||||||||||||||||||||
| Basic | $ | 1.33 | $ | 1.24 | $ | 5.24 | $ | 4.91 | ||||||||||||||||||
| Diluted | 1.30 | 1.22 | 5.14 | 4.84 | ||||||||||||||||||||||
| Shares used for computation (in thousands): | ||||||||||||||||||||||||||
| Basic | 76,141 | 75,733 | 76,040 | 75,636 | ||||||||||||||||||||||
| Diluted | 76,654 | 76,156 | 76,495 | 75,999 | ||||||||||||||||||||||
| Weighted average shares outstanding-diluted EPS | 76,654 | 76,156 | 76,495 | 75,999 | ||||||||||||||||||||||
| Effect of dilutive Series C preferred shares | 2,361 | 2,327 | 2,348 | 2,314 | ||||||||||||||||||||||
| Effect of dilutive Series E preferred shares | 1,670 | 1,665 | 1,668 | 1,664 | ||||||||||||||||||||||
| Adjusted weighted average shares outstanding-diluted Series C and Series E | 80,685 | 80,148 | 80,511 | 79,977 | ||||||||||||||||||||||
| Other financial information: | ||||||||||||||||||||||||||
| Dividends per common share | $ | 0.885 | $ | 0.855 | $ | 3.520 | $ | 3.400 | ||||||||||||||||||
| December 31, | |||||||||||
| 2025 | 2024 | ||||||||||
| Net Debt: | |||||||||||
| Debt | $ | 2,929,411 | $ | 2,860,458 | |||||||
| Deferred financing costs, net | 25,181 | 19,134 | |||||||||
| Cash and cash equivalents | (90,577) | (22,062) | |||||||||
| Net Debt | $ | 2,864,015 | $ | 2,857,530 | |||||||
| Gross Assets: | |||||||||||
| Total Assets | $ | 5,699,762 | $ | 5,616,507 | |||||||
| Accumulated depreciation | 1,714,886 | 1,562,645 | |||||||||
| Cash and cash equivalents | (90,577) | (22,062) | |||||||||
| Gross Assets | $ | 7,324,071 | $ | 7,157,090 | |||||||
| Debt to Total Assets Ratio | 51 | % | 51 | % | |||||||
| Net Debt to Gross Assets Ratio | 39 | % | 40 | % | |||||||
| Three Months Ended December 31, | |||||||||||
| 2025 | 2024 | ||||||||||
| EBITDAre and Adjusted EBITDAre: | |||||||||||
| Net income (loss) | $ | 66,904 | $ | (8,395) | |||||||
| Interest expense, net | 33,574 | 33,472 | |||||||||
| Income tax expense | 954 | 653 | |||||||||
| Depreciation and amortization | 43,582 | 40,995 | |||||||||
| Gain on sale of real estate and early ground lease termination | (5,297) | (112) | |||||||||
| Impairment of real estate investments | — | 39,952 | |||||||||
| Allocated share of joint venture depreciation | 1,000 | 1,965 | |||||||||
| Allocated share of joint venture interest expense | 516 | 589 | |||||||||
| Impairment charges on joint ventures | — | 16,087 | |||||||||
| EBITDAre | $ | 141,233 | $ | 125,206 | |||||||
| Retirement and severance expense | 1,901 | — | |||||||||
| Transaction costs | 471 | 423 | |||||||||
| Provision (benefit) for credit losses, net | (985) | 9,876 | |||||||||
| Adjusted EBITDAre (for the quarter) | $ | 142,620 | $ | 135,505 | |||||||
| Adjusted EBITDAre (annualized) (1) | $ | 570,480 | $ | 542,020 | |||||||
| Net Debt/Adjusted EBITDAre Ratio | 5.0 | 5.3 | |||||||||
(1) Adjusted EBITDA for the quarter is multiplied by four to calculate an annualized amount but does not include the annualization of investments put in service, acquired or disposed of during the quarter, as well as the potential earnings on property under development, the annualization of percentage rent and participating interest and adjustments for other items. See detailed calculation and reconciliation of Annualized Adjusted EBITDAre and Net Debt/Annualized EBITDAre ratio that includes these adjustments in the Company's Supplemental Operating and Financial Data for the quarter and year ended December 31, 2025. | |||||||||||
| December 31, 2025 | December 31, 2024 | ||||||||||
| Total assets | $ | 5,699,762 | $ | 5,616,507 | |||||||
| Operating lease right-of-use assets | (170,755) | (173,364) | |||||||||
| Cash and cash equivalents | (90,577) | (22,062) | |||||||||
| Restricted cash | (8,071) | (13,637) | |||||||||
| Accounts receivable | (97,855) | (84,589) | |||||||||
| Add: accumulated depreciation on real estate investments | 1,714,886 | 1,562,645 | |||||||||
| Add: accumulated amortization on intangible assets (1) | 31,584 | 31,876 | |||||||||
| Prepaid expenses and other current assets (1) | (37,237) | (39,464) | |||||||||
| Total investments | $ | 7,041,737 | $ | 6,877,912 | |||||||
| Total Investments: | |||||||||||
| Real estate investments, net of accumulated depreciation | $ | 4,494,259 | $ | 4,435,358 | |||||||
| Add back accumulated depreciation on real estate investments | 1,714,886 | 1,562,645 | |||||||||
| Land held for development | 20,168 | 20,168 | |||||||||
| Property under development | 54,905 | 112,263 | |||||||||
| Mortgage notes and related accrued interest receivable, net | 679,254 | 665,796 | |||||||||
| Investment in joint ventures | 12,316 | 14,019 | |||||||||
| Intangible assets, gross (1) | 63,239 | 64,317 | |||||||||
| Notes receivable and related accrued interest receivable, net (1) | 2,710 | 3,346 | |||||||||
| Total investments | $ | 7,041,737 | $ | 6,877,912 | |||||||
| (1) Included in other assets in the accompanying consolidated balance sheet. Other assets include the following: | |||||||||||
| December 31, 2025 | December 31, 2024 | ||||||||||
| Intangible assets, gross | $ | 63,239 | $ | 64,317 | |||||||
| Less: accumulated amortization on intangible assets | (31,584) | (31,876) | |||||||||
| Notes receivable and related accrued interest receivable, net | 2,710 | 3,346 | |||||||||
| Prepaid expenses and other current assets | 37,237 | 39,464 | |||||||||
| Total other assets | $ | 71,602 | $ | 75,251 | |||||||


| TABLE OF CONTENTS | ||||||||||||||||||||||||||
| SECTION | PAGE | |||||||||||||||||||||||||
| Company Profile | ||||||||||||||||||||||||||
| Investor Information | ||||||||||||||||||||||||||
| Selected Financial Information | ||||||||||||||||||||||||||
| Selected Balance Sheet Information | ||||||||||||||||||||||||||
| Selected Operating Data | ||||||||||||||||||||||||||
| Funds From Operations and Funds From Operations as Adjusted | ||||||||||||||||||||||||||
| Adjusted Funds From Operations | ||||||||||||||||||||||||||
| Capital Structure | ||||||||||||||||||||||||||
| Summary of Ratios | ||||||||||||||||||||||||||
| Summary of Mortgage Notes Receivable | ||||||||||||||||||||||||||
| Investment Spending and Disposition Summaries | ||||||||||||||||||||||||||
| Property Under Development - Investment Spending Estimates | ||||||||||||||||||||||||||
| Portfolio Detail | ||||||||||||||||||||||||||
| Lease Expirations | ||||||||||||||||||||||||||
| Top Ten Customers by Total Revenue | ||||||||||||||||||||||||||
| Guidance | ||||||||||||||||||||||||||
| Definitions-Non-GAAP Financial Measures | ||||||||||||||||||||||||||
| Appendix-Reconciliation of Certain Non-GAAP Financial Measures | ||||||||||||||||||||||||||
 |
||||||||
| Q4 2025 Supplemental | Page 2 |
|||||||
| CAUTIONARY STATEMENT CONCERNING FORWARD-LOOKING STATEMENTS | ||||||||||||||
|
||||||||
| Q4 2025 Supplemental | Page 3 |
|||||||
| COMPANY PROFILE | ||||||||||||||
| THE COMPANY | COMPANY STRATEGY | |||||||
| EPR Properties ("we," "us," "our," "EPR" or the "Company") is a self-administered and self-managed real estate investment trust. EPR was formed in August 1997 as a Maryland real estate investment trust ("REIT"), and an initial public offering was completed on November 18, 1997. | Our primary business objective is to enhance shareholder value by achieving predictable growth in Funds from Operations As Adjusted ("FFOAA") and dividends per share. | |||||||
| Our strategic growth is focused on acquiring or developing a diversified portfolio of experiential real estate venues which create value by facilitating out-of-home congregate entertainment, recreation and leisure experiences where consumers choose to spend their discretionary time and money. This strategy is driven by the long-term trends of the growing experience economy. | ||||||||
| Since that time, the Company has been a leading Experiential net lease REIT, specializing in select enduring experiential properties. We are focused on growing our Experiential portfolio with properties that offer a variety of enduring, congregate entertainment, recreation and leisure activities. Separately, our Education portfolio is a legacy investment that provides additional geographic and operator diversity. | ||||||||
| This focus is consistent with our depth of knowledge across each of our property types, creating a competitive advantage that allows us to more quickly identify key market trends. We deliberately apply information and our ingenuity to target properties that represent logical extensions within each of our existing property types or potential future investments. | ||||||||
 |
||||||||
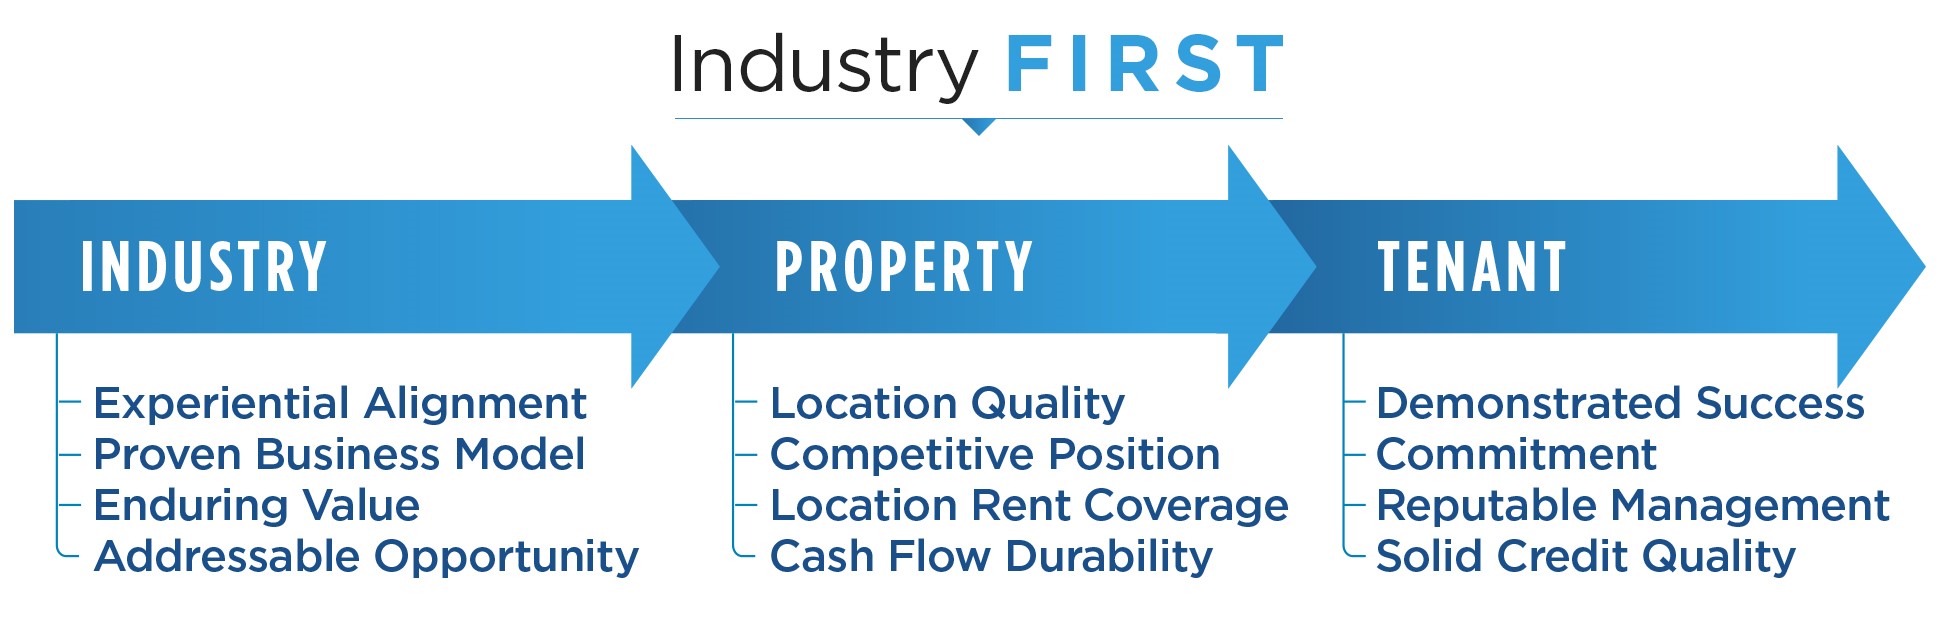
| As part of our strategic planning and portfolio management process we assess new opportunities against the following underwriting principles: | ||||||||
 |
||||||||
| BUILDING THE PREMIER EXPERIENTIAL REAL ESTATE PORTFOLIO | ||||||||||||||||||||
 |
 |
 |
 |
|||||||||||||||||
|
||||||||
| Q4 2025 Supplemental | Page 4 |
|||||||
| INVESTOR INFORMATION | ||||||||
| SENIOR MANAGEMENT | ||||||||
| Greg Silvers | Mark Peterson | |||||||
| Chairman and Chief Executive Officer | Executive Vice President and Chief Financial Officer | |||||||
| Tonya Mater | Greg Zimmerman | |||||||
| Senior Vice President and Chief Accounting Officer | Executive Vice President and Chief Investment Officer | |||||||
| Paul Turvey | Elizabeth Grace | |||||||
| Senior Vice President, General Counsel and Secretary | Senior Vice President - Human Resources and Administration | |||||||
| Ben Fox | Gwen Johnson | |||||||
| Executive Vice President | Senior Vice President - Asset Management | |||||||
| Brian Moriarty | ||||||||
| Senior Vice President - Corporate Communications | ||||||||
| COMPANY INFORMATION | ||||||||
| CORPORATE HEADQUARTERS | TRADING SYMBOLS | |||||||
| 909 Walnut Street, Suite 200 | Common Stock: | |||||||
| Kansas City, MO 64106 | EPR | |||||||
| 816-472-1700 | Preferred Stock: | |||||||
| www.eprkc.com | EPR-PrC | |||||||
| STOCK EXCHANGE LISTING | EPR-PrE | |||||||
| New York Stock Exchange | EPR-PrG | |||||||
| EQUITY RESEARCH COVERAGE | ||||||||
| Bank of America Merrill Lynch | Jana Galan | 646-855-5042 | ||||||
| Citi Global Markets | Nick Joseph/Smedes Rose | 212-816-6243 | ||||||
| Citizens Capital Markets & Advisory | Mitch Germain | 212-906-3537 | ||||||
| J.P. Morgan | Anthony Paolone | 212-622-6682 | ||||||
| Kansas City Capital Associates | Jonathan Braatz | 816-932-8019 | ||||||
| KeyBanc Capital Markets | Todd Thomas | 917-368-2286 | ||||||
| Raymond James & Associates | RJ Milligan | 727-567-2585 | ||||||
| RBC Capital Markets | Michael Carroll | 440-715-2649 | ||||||
| Stifel | Simon Yarmak | 443-224-1345 | ||||||
| Truist | Michael Lewis | 212-319-5659 | ||||||
| UBS | Michael Goldsmith | 212-713-2951 | ||||||
| Wells Fargo | James Feldman/John Kilichowski | 212-214-5311 | ||||||
|
||||||||
| Q4 2025 Supplemental | Page 5 |
|||||||
| SELECTED FINANCIAL INFORMATION | |||||||||||||||||||||||
| (UNAUDITED, DOLLARS AND SHARES IN THOUSANDS) | |||||||||||||||||||||||
| THREE MONTHS ENDED DECEMBER 31, | YEAR ENDED DECEMBER 31, | ||||||||||||||||||||||
| OPERATING INFORMATION: | 2025 | 2024 | 2025 | 2024 | |||||||||||||||||||
| Revenue | $ | 182,950 | $ | 177,234 | $ | 718,357 | $ | 698,068 | |||||||||||||||
| Net income (loss) available to common shareholders of EPR Properties | 60,864 | (14,435) | 250,792 | 121,922 | |||||||||||||||||||
| EBITDAre (1) | 141,233 | 125,206 | 545,966 | 525,295 | |||||||||||||||||||
| Adjusted EBITDAre (1) | 142,620 | 135,505 | 559,637 | 540,176 | |||||||||||||||||||
| Interest expense, net | 33,574 | 33,472 | 133,079 | 130,810 | |||||||||||||||||||
| Capitalized interest | 710 | 1,161 | 3,864 | 3,468 | |||||||||||||||||||
| Straight-lined rental revenue | 4,025 | 3,992 | 16,100 | 17,327 | |||||||||||||||||||
| Percentage rent and participating interest | 7,829 | 4,723 | 24,550 | 14,540 | |||||||||||||||||||
| Dividends declared on preferred shares | 6,040 | 6,040 | 24,144 | 24,144 | |||||||||||||||||||
| Dividends declared on common shares | 67,386 | 64,752 | 267,850 | 256,981 | |||||||||||||||||||
| General and administrative expense | 14,575 | 12,233 | 55,830 | 50,096 | |||||||||||||||||||
| DECEMBER 31, | |||||||||||||||||||||||
| BALANCE SHEET INFORMATION: | 2025 | 2024 | |||||||||||||||||||||
| Total assets | $ | 5,699,762 | $ | 5,616,507 | |||||||||||||||||||
| Accumulated depreciation | 1,714,886 | 1,562,645 | |||||||||||||||||||||
| Cash and cash equivalents | 90,577 | 22,062 | |||||||||||||||||||||
| Total assets before accumulated depreciation less cash and cash equivalents (gross assets) | 7,324,071 | 7,157,090 | |||||||||||||||||||||
| Debt | 2,929,411 | 2,860,458 | |||||||||||||||||||||
| Deferred financing costs, net | 25,181 | 19,134 | |||||||||||||||||||||
| Net debt (1) | 2,864,015 | 2,857,530 | |||||||||||||||||||||
| Equity | 2,329,171 | 2,323,245 | |||||||||||||||||||||
| Common shares outstanding | 76,145 | 75,736 | |||||||||||||||||||||
| Total market capitalization (using EOP closing price and liquidation values)(2) | 7,034,597 | 6,582,095 | |||||||||||||||||||||
| Net debt/total market capitalization ratio (1) | 41 | % | 43 | % | |||||||||||||||||||
| Debt to total assets ratio | 51 | % | 51 | % | |||||||||||||||||||
| Net debt/gross assets ratio (1) | 39 | % | 40 | % | |||||||||||||||||||
| Net debt/Adjusted EBITDAre ratio (1) (3) | 5.0 | 5.3 | |||||||||||||||||||||
| Net debt/Annualized adjusted EBITDAre ratio (1) (4) | 4.9 | 5.1 | |||||||||||||||||||||
(1) See pages 24 through 26 for definitions. See calculation on page 30, as applicable. | |||||||||||||||||||||||
| (2) See calculation on page 15. | |||||||||||||||||||||||
(3) Adjusted EBITDAre in this calculation is for the three-month period multiplied times four. See pages 24 through 26 for definitions. See calculation on page 30. | |||||||||||||||||||||||
(4) Annualized adjusted EBITDAre is adjusted EBITDAre for the quarter further adjusted for in-service and disposed projects, percentage rent and participating interest and other items which is then multiplied times four. These calculations can be found on page 30 under the reconciliation of Adjusted EBITDAre and Annualized Adjusted EBITDAre. See pages 24 through 26 for definitions. | |||||||||||||||||||||||
|
||||||||
| Q4 2025 Supplemental | Page 6 |
|||||||
| SELECTED BALANCE SHEET INFORMATION | ||||||||||||||||||||||||||||||||||||||
| (UNAUDITED, DOLLARS IN THOUSANDS) | ||||||||||||||||||||||||||||||||||||||
| ASSETS | 4TH QUARTER 2025 | 3RD QUARTER 2025 | 2ND QUARTER 2025 | 1ST QUARTER 2025 | 4TH QUARTER 2024 | 3RD QUARTER 2024 | ||||||||||||||||||||||||||||||||
| Real estate investments | $ | 6,209,145 | $ | 6,051,937 | $ | 6,044,295 | $ | 5,949,713 | $ | 5,998,003 | $ | 6,080,959 | ||||||||||||||||||||||||||
| Less: accumulated depreciation | (1,714,886) | (1,671,309) | (1,641,916) | (1,595,820) | (1,562,645) | (1,546,509) | ||||||||||||||||||||||||||||||||
| Land held for development | 20,168 | 20,168 | 20,168 | 20,168 | 20,168 | 20,168 | ||||||||||||||||||||||||||||||||
| Property under development | 54,905 | 67,381 | 84,195 | 118,264 | 112,263 | 76,913 | ||||||||||||||||||||||||||||||||
| Operating lease right-of-use assets | 170,755 | 168,730 | 177,919 | 180,557 | 173,364 | 175,451 | ||||||||||||||||||||||||||||||||
| Mortgage notes and related accrued interest receivable, net | 679,254 | 696,438 | 666,154 | 659,004 | 665,796 | 657,636 | ||||||||||||||||||||||||||||||||
| Investment in joint ventures | 12,316 | 14,046 | 9,680 | 11,361 | 14,019 | 32,426 | ||||||||||||||||||||||||||||||||
| Cash and cash equivalents | 90,577 | 13,710 | 12,955 | 20,572 | 22,062 | 35,328 | ||||||||||||||||||||||||||||||||
| Restricted cash | 8,071 | 15,982 | 15,765 | 6,354 | 13,637 | 2,992 | ||||||||||||||||||||||||||||||||
| Accounts receivable | 97,855 | 92,291 | 94,514 | 85,811 | 84,589 | 79,726 | ||||||||||||||||||||||||||||||||
| Other assets | 71,602 | 74,523 | 77,151 | 76,565 | 75,251 | 74,072 | ||||||||||||||||||||||||||||||||
| Total assets | $ | 5,699,762 | $ | 5,543,897 | $ | 5,560,880 | $ | 5,532,549 | $ | 5,616,507 | $ | 5,689,162 | ||||||||||||||||||||||||||
| LIABILITIES AND EQUITY | ||||||||||||||||||||||||||||||||||||||
| Liabilities: | ||||||||||||||||||||||||||||||||||||||
| Accounts payable and accrued liabilities | $ | 99,392 | $ | 113,475 | $ | 101,543 | $ | 93,248 | $ | 107,976 | $ | 99,334 | ||||||||||||||||||||||||||
| Operating lease liabilities | 204,747 | 203,269 | 216,411 | 219,305 | 212,400 | 214,809 | ||||||||||||||||||||||||||||||||
| Common dividends payable | 22,463 | 22,461 | 22,454 | 22,440 | 25,831 | 23,811 | ||||||||||||||||||||||||||||||||
| Preferred dividends payable | 6,032 | 6,032 | 6,032 | 6,032 | 6,032 | 6,032 | ||||||||||||||||||||||||||||||||
| Unearned rents and interest | 108,546 | 101,491 | 90,379 | 78,550 | 80,565 | 88,503 | ||||||||||||||||||||||||||||||||
| Line of credit | — | 379,000 | 405,000 | 105,000 | 175,000 | 169,000 | ||||||||||||||||||||||||||||||||
| Deferred financing costs, net | (25,181) | (15,205) | (16,622) | (17,630) | (19,134) | (20,622) | ||||||||||||||||||||||||||||||||
| Other debt | 2,954,592 | 2,404,592 | 2,404,592 | 2,704,592 | 2,704,592 | 2,704,592 | ||||||||||||||||||||||||||||||||
| Total liabilities | 3,370,591 | 3,215,115 | 3,229,789 | 3,211,537 | 3,293,262 | 3,285,459 | ||||||||||||||||||||||||||||||||
| Equity: | ||||||||||||||||||||||||||||||||||||||
| Common stock and additional paid-in-capital | 3,978,935 | 3,973,626 | 3,968,520 | 3,964,272 | 3,951,364 | 3,947,470 | ||||||||||||||||||||||||||||||||
| Preferred stock at par value | 148 | 148 | 148 | 148 | 148 | 148 | ||||||||||||||||||||||||||||||||
| Treasury stock | (295,290) | (295,268) | (295,258) | (295,258) | (285,413) | (285,413) | ||||||||||||||||||||||||||||||||
| Accumulated other comprehensive loss | 1,037 | (587) | (4) | (3,567) | (3,756) | (609) | ||||||||||||||||||||||||||||||||
| Distributions in excess of net income | (1,355,659) | (1,349,137) | (1,342,315) | (1,344,583) | (1,339,098) | (1,257,893) | ||||||||||||||||||||||||||||||||
| Total equity | 2,329,171 | 2,328,782 | 2,331,091 | 2,321,012 | 2,323,245 | 2,403,703 | ||||||||||||||||||||||||||||||||
| Total liabilities and equity | $ | 5,699,762 | $ | 5,543,897 | $ | 5,560,880 | $ | 5,532,549 | $ | 5,616,507 | $ | 5,689,162 | ||||||||||||||||||||||||||
|
||||||||
| Q4 2025 Supplemental | Page 7 |
|||||||
| SELECTED OPERATING DATA | |||||||||||||||||||||||||||||||||||
| (UNAUDITED, DOLLARS IN THOUSANDS) | |||||||||||||||||||||||||||||||||||
| 4TH QUARTER 2025 | 3RD QUARTER 2025 | 2ND QUARTER 2025 | 1ST QUARTER 2025 | 4TH QUARTER 2024 | 3RD QUARTER 2024 | ||||||||||||||||||||||||||||||
| Rental revenue | $ | 157,057 | $ | 154,838 | $ | 150,351 | $ | 146,359 | $ | 149,116 | $ | 148,677 | |||||||||||||||||||||||
| Other income (1) | 9,603 | 12,135 | 12,218 | 11,636 | 13,197 | 17,419 | |||||||||||||||||||||||||||||
| Mortgage and other financing income | 16,290 | 15,333 | 15,499 | 17,038 | 14,921 | 14,411 | |||||||||||||||||||||||||||||
| Total revenue | 182,950 | 182,306 | 178,068 | 175,033 | 177,234 | 180,507 | |||||||||||||||||||||||||||||
| Property operating expense | 14,862 | 14,478 | 14,661 | 15,171 | 15,188 | 14,611 | |||||||||||||||||||||||||||||
| Other expense (1) | 10,013 | 11,173 | 11,959 | 12,611 | 13,437 | 15,631 | |||||||||||||||||||||||||||||
| General and administrative expense | 14,575 | 14,001 | 13,230 | 14,024 | 12,233 | 11,935 | |||||||||||||||||||||||||||||
| Retirement and severance expense | 1,901 | 1,094 | — | — | — | — | |||||||||||||||||||||||||||||
| Transaction costs | 471 | 492 | 669 | 567 | 423 | 175 | |||||||||||||||||||||||||||||
| Provision (benefit) for credit losses, net | (985) | 9,117 | 997 | (652) | 9,876 | (770) | |||||||||||||||||||||||||||||
| Impairment charges | — | — | — | — | 39,952 | — | |||||||||||||||||||||||||||||
| Depreciation and amortization | 43,582 | 42,409 | 42,080 | 41,089 | 40,995 | 42,795 | |||||||||||||||||||||||||||||
| Total operating expenses | 84,419 | 92,764 | 83,596 | 82,810 | 132,104 | 84,377 | |||||||||||||||||||||||||||||
| Gain (loss) on sale of real estate and early ground lease termination | 5,297 | 8,073 | 16,779 | 9,384 | 112 | (3,419) | |||||||||||||||||||||||||||||
| Income from operations | 103,828 | 97,615 | 111,251 | 101,607 | 45,242 | 92,711 | |||||||||||||||||||||||||||||
| Costs associated with loan refinancing or payoff | — | — | — | — | — | 337 | |||||||||||||||||||||||||||||
| Interest expense, net | 33,574 | 33,238 | 33,246 | 33,021 | 33,472 | 32,867 | |||||||||||||||||||||||||||||
| Equity in loss (income) from joint ventures | 2,396 | (2,934) | 1,681 | 2,647 | 3,425 | 851 | |||||||||||||||||||||||||||||
| Impairment charges on joint ventures | — | — | — | — | 16,087 | 12,130 | |||||||||||||||||||||||||||||
| Income (loss) before income taxes | 67,858 | 67,311 | 76,324 | 65,939 | (7,742) | 46,526 | |||||||||||||||||||||||||||||
| Income tax expense (benefit) | 954 | 725 | 681 | 136 | 653 | (124) | |||||||||||||||||||||||||||||
| Net income (loss) | 66,904 | 66,586 | 75,643 | 65,803 | (8,395) | 46,650 | |||||||||||||||||||||||||||||
| Preferred dividend requirements | 6,040 | 6,032 | 6,040 | 6,032 | 6,040 | 6,032 | |||||||||||||||||||||||||||||
| Net income (loss) available to common shareholders of EPR Properties | $ | 60,864 | $ | 60,554 | $ | 69,603 | $ | 59,771 | $ | (14,435) | $ | 40,618 | |||||||||||||||||||||||
| (1) Other income and other expense consist primarily of results from the Company's properties operated through third-party managers. | |||||||||||||||||||||||||||||||||||
|
||||||||
| Q4 2025 Supplemental | Page 8 |
|||||||
| FUNDS FROM OPERATIONS AND FUNDS FROM OPERATIONS AS ADJUSTED | |||||||||||||||||||||||||||||||||||
| (UNAUDITED, DOLLARS IN THOUSANDS EXCEPT PER SHARE INFORMATION) | |||||||||||||||||||||||||||||||||||
| FUNDS FROM OPERATIONS ("FFO") (1): | 4TH QUARTER 2025 | 3RD QUARTER 2025 | 2ND QUARTER 2025 | 1ST QUARTER 2025 | 4TH QUARTER 2024 | 3RD QUARTER 2024 | |||||||||||||||||||||||||||||
| Net income (loss) available to common shareholders of EPR Properties | $ | 60,864 | $ | 60,554 | $ | 69,603 | $ | 59,771 | $ | (14,435) | $ | 40,618 | |||||||||||||||||||||||
| (Gain) loss on sale of real estate and early ground lease termination | (5,297) | (8,073) | (16,779) | (9,384) | (112) | 3,419 | |||||||||||||||||||||||||||||
| Impairment of real estate investments | — | — | — | — | 39,952 | — | |||||||||||||||||||||||||||||
| Real estate depreciation and amortization | 43,417 | 42,257 | 41,939 | 40,932 | 40,838 | 42,620 | |||||||||||||||||||||||||||||
| Allocated share of joint venture depreciation | 1,000 | 989 | 985 | 1,036 | 1,965 | 2,581 | |||||||||||||||||||||||||||||
| Impairment charges on joint ventures | — | — | — | — | 16,087 | 12,130 | |||||||||||||||||||||||||||||
| FFO available to common shareholders of EPR Properties | $ | 99,984 | $ | 95,727 | $ | 95,748 | $ | 92,355 | $ | 84,295 | $ | 101,368 | |||||||||||||||||||||||
| FFO available to common shareholders of EPR Properties | $ | 99,984 | $ | 95,727 | $ | 95,748 | $ | 92,355 | $ | 84,295 | $ | 101,368 | |||||||||||||||||||||||
| Add: Preferred dividends for Series C preferred shares | 1,938 | 1,938 | 1,938 | 1,938 | 1,938 | 1,938 | |||||||||||||||||||||||||||||
| Add: Preferred dividends for Series E preferred shares | 1,938 | 1,938 | 1,938 | 1,938 | 1,938 | 1,938 | |||||||||||||||||||||||||||||
| Diluted FFO available to common shareholders of EPR Properties | $ | 103,860 | $ | 99,603 | $ | 99,624 | $ | 96,231 | $ | 88,171 | $ | 105,244 | |||||||||||||||||||||||
| FUNDS FROM OPERATIONS AS ADJUSTED ("FFOAA") (1): | |||||||||||||||||||||||||||||||||||
| FFO available to common shareholders of EPR Properties | $ | 99,984 | $ | 95,727 | $ | 95,748 | $ | 92,355 | $ | 84,295 | $ | 101,368 | |||||||||||||||||||||||
| Retirement and severance expense | 1,901 | 1,094 | — | — | — | — | |||||||||||||||||||||||||||||
| Transaction costs | 471 | 492 | 669 | 567 | 423 | 175 | |||||||||||||||||||||||||||||
| Provision (benefit) for credit losses, net | (985) | 9,117 | 997 | (652) | 9,876 | (770) | |||||||||||||||||||||||||||||
| Costs associated with loan refinancing or payoff | — | — | — | — | — | 337 | |||||||||||||||||||||||||||||
| Deferred income tax benefit | (170) | (53) | (93) | (530) | (285) | (728) | |||||||||||||||||||||||||||||
| FFO as adjusted available to common shareholders of EPR Properties | $ | 101,201 | $ | 106,377 | $ | 97,321 | $ | 91,740 | $ | 94,309 | $ | 100,382 | |||||||||||||||||||||||
| FFO as adjusted available to common shareholders of EPR Properties | $ | 101,201 | $ | 106,377 | $ | 97,321 | $ | 91,740 | $ | 94,309 | $ | 100,382 | |||||||||||||||||||||||
| Add: Preferred dividends for Series C preferred shares | 1,938 | 1,938 | 1,938 | 1,938 | 1,938 | 1,938 | |||||||||||||||||||||||||||||
| Add: Preferred dividends for Series E preferred shares | 1,938 | 1,938 | 1,938 | 1,938 | 1,938 | 1,938 | |||||||||||||||||||||||||||||
| Diluted FFO as adjusted available to common shareholders of EPR Properties | $ | 105,077 | $ | 110,253 | $ | 101,197 | $ | 95,616 | $ | 98,185 | $ | 104,258 | |||||||||||||||||||||||
| FFO per common share: | |||||||||||||||||||||||||||||||||||
| Basic | $ | 1.31 | $ | 1.26 | $ | 1.26 | $ | 1.22 | $ | 1.11 | $ | 1.34 | |||||||||||||||||||||||
| Diluted | 1.29 | 1.23 | 1.24 | 1.20 | 1.10 | 1.31 | |||||||||||||||||||||||||||||
| FFO as adjusted per common share: | |||||||||||||||||||||||||||||||||||
| Basic | $ | 1.33 | $ | 1.40 | $ | 1.28 | $ | 1.21 | $ | 1.25 | $ | 1.33 | |||||||||||||||||||||||
| Diluted | 1.30 | 1.37 | 1.26 | 1.19 | 1.23 | 1.30 | |||||||||||||||||||||||||||||
| Shares used for computation (in thousands): | |||||||||||||||||||||||||||||||||||
| Basic | 76,141 | 76,127 | 76,083 | 75,804 | 75,733 | 75,723 | |||||||||||||||||||||||||||||
| Diluted | 76,654 | 76,668 | 76,571 | 76,215 | 76,156 | 76,108 | |||||||||||||||||||||||||||||
| Effect of dilutive Series C preferred shares | 2,361 | 2,352 | 2,344 | 2,336 | 2,327 | 2,319 | |||||||||||||||||||||||||||||
| Effect of dilutive Series E preferred shares | 1,670 | 1,668 | 1,667 | 1,665 | 1,665 | 1,664 | |||||||||||||||||||||||||||||
| Adjusted weighted-average shares outstanding-diluted Series C and Series E | 80,685 | 80,688 | 80,582 | 80,216 | 80,148 | 80,091 | |||||||||||||||||||||||||||||
(1) See pages 24 through 26 for definitions. |
|||||||||||||||||||||||||||||||||||
|
||||||||
| Q4 2025 Supplemental | Page 9 |
|||||||
| ADJUSTED FUNDS FROM OPERATIONS | ||||||||||||||||||||||||||||||||||||||
| (UNAUDITED, DOLLARS IN THOUSANDS EXCEPT PER SHARE INFORMATION) | ||||||||||||||||||||||||||||||||||||||
| ADJUSTED FUNDS FROM OPERATIONS ("AFFO") (1): | 4TH QUARTER 2025 | 3RD QUARTER 2025 | 2ND QUARTER 2025 | 1ST QUARTER 2025 | 4TH QUARTER 2024 | 3RD QUARTER 2024 | ||||||||||||||||||||||||||||||||
FFO available to common shareholders of EPR Properties |
$ | 99,984 | $ | 95,727 | $ | 95,748 | $ | 92,355 | $ | 84,295 | $ | 101,368 | ||||||||||||||||||||||||||
| Adjustments: | ||||||||||||||||||||||||||||||||||||||
| Retirement and severance expense | 1,901 | 1,094 | — | — | — | — | ||||||||||||||||||||||||||||||||
| Transaction costs | 471 | 492 | 669 | 567 | 423 | 175 | ||||||||||||||||||||||||||||||||
| Provision (benefit) for credit losses, net | (985) | 9,117 | 997 | (652) | 9,876 | (770) | ||||||||||||||||||||||||||||||||
Costs associated with loan refinancing or payoff |
— | — | — | — | — | 337 | ||||||||||||||||||||||||||||||||
| Deferred income tax benefit | (170) | (53) | (93) | (530) | (285) | (728) | ||||||||||||||||||||||||||||||||
| Non-real estate depreciation and amortization | 165 | 152 | 141 | 157 | 157 | 175 | ||||||||||||||||||||||||||||||||
| Deferred financing fees amortization | 2,380 | 2,120 | 2,102 | 2,206 | 2,187 | 2,211 | ||||||||||||||||||||||||||||||||
Share-based compensation expense to management and trustees |
3,643 | 3,907 | 3,912 | 3,867 | 3,572 | 3,264 | ||||||||||||||||||||||||||||||||
| Amortization of above/below market leases, net and tenant allowances | (81) | (81) | (81) | (81) | (81) | (84) | ||||||||||||||||||||||||||||||||
| Maintenance capital expenditures (2) | (1,532) | (564) | (1,858) | (1,251) | (1,862) | (2,561) | ||||||||||||||||||||||||||||||||
| Straight-lined rental revenue | (4,025) | (3,541) | (5,137) | (3,397) | (3,992) | (4,414) | ||||||||||||||||||||||||||||||||
| Straight-lined ground sublease expense | (35) | (4) | — | 2 | 20 | 20 | ||||||||||||||||||||||||||||||||
Non-cash portion of mortgage and other financing income |
(343) | (296) | (566) | (297) | (171) | (396) | ||||||||||||||||||||||||||||||||
| Allocated share of joint venture non-cash items | — | — | — | — | — | 712 | ||||||||||||||||||||||||||||||||
| AFFO available to common shareholders of EPR Properties | $ | 101,373 | $ | 108,070 | $ | 95,834 | $ | 92,946 | $ | 94,139 | $ | 99,309 | ||||||||||||||||||||||||||
| AFFO available to common shareholders of EPR Properties | $ | 101,373 | $ | 108,070 | $ | 95,834 | $ | 92,946 | $ | 94,139 | $ | 99,309 | ||||||||||||||||||||||||||
| Add: Preferred dividends for Series C preferred shares | 1,938 | 1,938 | 1,938 | 1,938 | 1,938 | 1,938 | ||||||||||||||||||||||||||||||||
| Add: Preferred dividends for Series E preferred shares | 1,938 | 1,938 | 1,938 | 1,938 | 1,938 | 1,938 | ||||||||||||||||||||||||||||||||
| Diluted AFFO available to common shareholders of EPR Properties | $ | 105,249 | $ | 111,946 | $ | 99,710 | $ | 96,822 | $ | 98,015 | $ | 103,185 | ||||||||||||||||||||||||||
Weighted average diluted shares outstanding (in thousands) |
76,654 | 76,668 | 76,571 | 76,215 | 76,156 | 76,108 | ||||||||||||||||||||||||||||||||
| Effect of dilutive Series C preferred shares | 2,361 | 2,352 | 2,344 | 2,336 | 2,327 | 2,319 | ||||||||||||||||||||||||||||||||
| Effect of dilutive Series E preferred shares | 1,670 | 1,668 | 1,667 | 1,665 | 1,665 | 1,664 | ||||||||||||||||||||||||||||||||
| Adjusted weighted-average shares outstanding-diluted | 80,685 | 80,688 | 80,582 | 80,216 | 80,148 | 80,091 | ||||||||||||||||||||||||||||||||
| AFFO per diluted common share | $ | 1.30 | $ | 1.39 | $ | 1.24 | $ | 1.21 | $ | 1.22 | $ | 1.29 | ||||||||||||||||||||||||||
| Dividends declared per common share | $ | 0.885 | $ | 0.885 | $ | 0.885 | $ | 0.865 | $ | 0.855 | $ | 0.855 | ||||||||||||||||||||||||||
| AFFO payout ratio (3) | 68 | % | 64 | % | 71 | % | 71 | % | 70 | % | 66 | % | ||||||||||||||||||||||||||
(1) See pages 24 through 26 for definitions. | ||||||||||||||||||||||||||||||||||||||
| (2) Includes maintenance capital expenditures and certain second-generation tenant improvements and leasing commissions. | ||||||||||||||||||||||||||||||||||||||
| (3) AFFO payout ratio is calculated by dividing dividends declared per common share by AFFO per diluted common share. | ||||||||||||||||||||||||||||||||||||||
|
||||||||
| Q4 2025 Supplemental | Page 10 |
|||||||
CAPITAL STRUCTURE AS OF DECEMBER 31, 2025 | |||||||||||||||||||||||||||||||||||
| (UNAUDITED, DOLLARS IN THOUSANDS) | |||||||||||||||||||||||||||||||||||
| CONSOLIDATED DEBT | |||||||||||||||||||||||||||||||||||
| PRINCIPAL PAYMENTS DUE ON DEBT: | |||||||||||||||||||||||||||||||||||
| BONDS/TERM LOAN/OTHER (1) | UNSECURED CREDIT FACILITY (2) | UNSECURED SENIOR NOTES | TOTAL | WEIGHTED AVG INTEREST RATE | |||||||||||||||||||||||||||||||
| YEAR | |||||||||||||||||||||||||||||||||||
| 2026 | $ | — | $ | — | $ | 629,597 | $ | 629,597 | 4.70% | ||||||||||||||||||||||||||
| 2027 | — | — | 450,000 | 450,000 | 4.50% | ||||||||||||||||||||||||||||||
| 2028 | — | — | 400,000 | 400,000 | 4.95% | ||||||||||||||||||||||||||||||
| 2029 | — | — | 500,000 | 500,000 | 3.75% | ||||||||||||||||||||||||||||||
| 2030 | — | — | 550,000 | 550,000 | 4.75% | ||||||||||||||||||||||||||||||
| 2031 | — | — | 400,000 | 400,000 | 3.60% | ||||||||||||||||||||||||||||||
| 2032 | — | — | — | — | —% | ||||||||||||||||||||||||||||||
| 2033 | — | — | — | — | —% | ||||||||||||||||||||||||||||||
| 2034 | — | — | — | — | —% | ||||||||||||||||||||||||||||||
| 2035 | — | — | — | — | —% | ||||||||||||||||||||||||||||||
| 2036 | — | — | — | — | —% | ||||||||||||||||||||||||||||||
| Thereafter | 24,995 | — | — | 24,995 | 2.53% | ||||||||||||||||||||||||||||||
| Less: deferred financing costs, net | — | — | — | (25,181) | —% | ||||||||||||||||||||||||||||||
| $ | 24,995 | $ | — | $ | 2,929,597 | $ | 2,929,411 | 4.38% | |||||||||||||||||||||||||||
| BALANCE | WEIGHTED AVG INTEREST RATE | WEIGHTED AVG MATURITY | |||||||||||||||||||||||||||||||||
| Fixed rate unsecured debt | $ | 2,929,597 | 4.40 | % | 3.02 | ||||||||||||||||||||||||||||||
| Fixed rate secured debt (1) | 24,995 | 2.53 | % | 21.59 | |||||||||||||||||||||||||||||||
| Variable rate unsecured debt | — | — | % | — | |||||||||||||||||||||||||||||||
| Less: deferred financing costs, net | (25,181) | — | % | — | |||||||||||||||||||||||||||||||
| Total | $ | 2,929,411 | 4.38 | % | 3.20 | ||||||||||||||||||||||||||||||
| (1) Includes $25.0 million of secured bonds that have been fixed through interest rate swaps through September 20, 2026. | |||||||||||||||||||||||||||||||||||
| (2) Unsecured Revolving Credit Facility Summary: | |||||||||||||||||||||||||||||||||||
| BALANCE | RATE | ||||||||||||||||||||||||||||||||||
| COMMITMENT | AT 12/31/2025 |
MATURITY | AT 12/31/2025 |
||||||||||||||||||||||||||||||||
| $1,000,000 | $— | October 2, 2028 | 4.71% | ||||||||||||||||||||||||||||||||
Note: This facility will mature on October 2, 2028 and has two six-month extensions available at the Company's option, and includes an accordion feature pursuant to which the maximum borrowing amount can be increased from $1.0 billion to $2.0 billion, in each case, subject to certain terms and conditions. |
|||||||||||||||||||||||||||||||||||
|
||||||||
| Q4 2025 Supplemental | Page 11 |
|||||||
CAPITAL STRUCTURE AS OF DECEMBER 31, 2025 AND DECEMBER 31, 2024 | ||||||||||||||
| (UNAUDITED, DOLLARS IN THOUSANDS) | ||||||||||||||
| CONSOLIDATED DEBT (continued) | ||||||||||||||
| SUMMARY OF DEBT: | December 31, 2025 |
December 31, 2024 |
||||||||||||
| Senior unsecured notes payable, 4.50%, paid in full on April 1, 2025 | $ | — | $ | 300,000 | ||||||||||
| Senior unsecured notes payable, 4.56%, due August 22, 2026 | 179,597 | 179,597 | ||||||||||||
| Senior unsecured notes payable, 4.75%, due December 15, 2026 | 450,000 | 450,000 | ||||||||||||
| Senior unsecured notes payable, 4.50%, due June 1, 2027 | 450,000 | 450,000 | ||||||||||||
| Senior unsecured notes payable, 4.95%, due April 15, 2028 | 400,000 | 400,000 | ||||||||||||
| Unsecured revolving variable rate credit facility, SOFR + 1.05%, due October 2, 2028 | — | 175,000 | ||||||||||||
| Senior unsecured notes payable, 3.75%, due August 15, 2029 | 500,000 | 500,000 | ||||||||||||
| Senior unsecured notes payable, 4.75%, due November 15, 2030 | 550,000 | — | ||||||||||||
| Senior unsecured notes payable, 3.60%, due November 15, 2031 | 400,000 | 400,000 | ||||||||||||
| Bonds payable, variable rate, fixed at 2.53% through September 30, 2026, due August 1, 2047 | 24,995 | 24,995 | ||||||||||||
| Less: deferred financing costs, net | (25,181) | (19,134) | ||||||||||||
| Total debt | $ | 2,929,411 | $ | 2,860,458 | ||||||||||
|
||||||||
| Q4 2025 Supplemental | Page 12 |
|||||||
| CAPITAL STRUCTURE | |||||||||||||||||||||||
| SENIOR NOTES | |||||||||||||||||||||||
SENIOR DEBT RATINGS AS OF DECEMBER 31, 2025 | |||||||||||||||||||||||
| Moody's | Baa3 (stable) | ||||||||||||||||||||||
| Fitch | BBB- (stable) | ||||||||||||||||||||||
| Standard and Poor's | BBB- (stable) | ||||||||||||||||||||||
| SUMMARY OF COVENANTS | |||||||||||||||||||||||
The Company had outstanding public senior unsecured notes with fixed interest rates of 3.60%, 3.75%, 4.50%, 4.75% and 4.95% at December 31, 2025. Interest on these notes is paid semiannually. These public senior unsecured notes contain various covenants, including: (i) a limitation on incurrence of any debt that would cause the Company's debt to adjusted total assets ratio to exceed 60%; (ii) a limitation on incurrence of any secured debt which would cause the Company’s secured debt to adjusted total assets ratio to exceed 40%; (iii) a limitation on incurrence of any debt which would cause the Company’s debt service coverage ratio to be less than 1.5 times; and (iv) the maintenance at all times of total unencumbered assets not less than 150% of the Company’s outstanding unsecured debt. |
|||||||||||||||||||||||
The following is a summary of the key financial covenants for the Company's 3.60%, 3.75%, 4.50%, 4.75% and 4.95% public senior unsecured notes, as defined and calculated per the Company's interpretation of the terms of the notes. These calculations, which are not based on U.S. generally accepted accounting principles ("GAAP") measurements, are presented to investors to show the Company's ability to incur additional debt under the terms of the senior unsecured notes only and are not measures of the Company's liquidity or performance. The actual amounts as of December 31, 2025 and September 30, 2025 are: |
|||||||||||||||||||||||
| Actual | Actual | ||||||||||||||||||||||
| NOTE COVENANTS | Required | 4th Quarter 2025 (1) | 3rd Quarter 2025 (1) | ||||||||||||||||||||
| Limitation on incurrence of total debt (Total Debt/Total Assets) | ≤ 60% | 40% | 39% | ||||||||||||||||||||
| Limitation on incurrence of secured debt (Secured Debt/Total Assets) | ≤ 40% | —% | —% | ||||||||||||||||||||
| Limitation on incurrence of debt: Debt service coverage (Consolidated Income Available for Debt Service/Annual Debt Service) - trailing twelve months | ≥ 1.5 x | 4.2x | 4.1x | ||||||||||||||||||||
| Maintenance of total unencumbered assets (Unencumbered Assets/Unsecured Debt) | ≥ 150% of unsecured debt | 246% | 254% | ||||||||||||||||||||
| (1) See page 14 for details of calculations. | |||||||||||||||||||||||
|
||||||||
| Q4 2025 Supplemental | Page 13 |
|||||||
| CAPITAL STRUCTURE | |||||||||||||||||||||||||||||
| SENIOR NOTES | |||||||||||||||||||||||||||||
| (UNAUDITED, DOLLARS IN THOUSANDS) | |||||||||||||||||||||||||||||
| COVENANT CALCULATIONS | |||||||||||||||||||||||||||||
| TOTAL ASSETS: | December 31, 2025 | TOTAL DEBT: | December 31, 2025 | ||||||||||||||||||||||||||
| Total Assets per balance sheet | $ | 5,699,762 | Secured debt obligations | $ | 24,995 | ||||||||||||||||||||||||
| Add: accumulated depreciation | 1,714,886 | Unsecured debt obligations: | |||||||||||||||||||||||||||
| Less: intangible assets, net | (31,655) | Unsecured debt | 2,929,597 | ||||||||||||||||||||||||||
| Total Assets | $ | 7,382,993 | Outstanding letters of credit | — | |||||||||||||||||||||||||
| Guarantees | 10,000 | ||||||||||||||||||||||||||||
| TOTAL UNENCUMBERED ASSETS: | December 31, 2025 | Derivatives at fair market value, net, if liability | 6,634 | ||||||||||||||||||||||||||
| Total Assets, per above | $ | 7,382,993 | Total unsecured debt obligations: | $ | 2,946,231 | ||||||||||||||||||||||||
| Less: investment in joint ventures | (12,316) | Total Debt | $ | 2,971,226 | |||||||||||||||||||||||||
| Less: accounts receivable | (97,855) | ||||||||||||||||||||||||||||
| Less: encumbered assets | (25,665) | ||||||||||||||||||||||||||||
| Total Unencumbered Assets | $ | 7,247,157 | |||||||||||||||||||||||||||
| CONSOLIDATED INCOME AVAILABLE FOR DEBT SERVICE: | 4TH QUARTER 2025 | 3RD QUARTER 2025 | 2ND QUARTER 2025 | 1ST QUARTER 2025 | TRAILING TWELVE MONTHS | ||||||||||||||||||||||||
| Adjusted EBITDAre | $ | 142,620 | $ | 147,074 | $ | 137,952 | $ | 131,991 | $ | 559,637 | |||||||||||||||||||
| Less: straight-line revenue, net, included in adjusted EBITDAre | (4,025) | (3,541) | (5,137) | (3,397) | (16,100) | ||||||||||||||||||||||||
| Less: joint venture EBITDA | 880 | (4,420) | 266 | 1,236 | (2,038) | ||||||||||||||||||||||||
| CONSOLIDATED INCOME AVAILABLE FOR DEBT SERVICE | $ | 139,475 | $ | 139,113 | $ | 133,081 | $ | 129,830 | $ | 541,499 | |||||||||||||||||||
| ANNUAL DEBT SERVICE: | |||||||||||||||||||||||||||||
| Interest expense, gross | $ | 34,768 | $ | 34,239 | $ | 34,510 | $ | 34,784 | $ | 138,301 | |||||||||||||||||||
| Less: deferred financing fees amortization | (2,380) | (2,120) | (2,102) | (2,206) | (8,808) | ||||||||||||||||||||||||
| ANNUAL DEBT SERVICE | $ | 32,388 | $ | 32,119 | $ | 32,408 | $ | 32,578 | $ | 129,493 | |||||||||||||||||||
| DEBT SERVICE COVERAGE | 4.3 | 4.3 | 4.1 | 4.0 | 4.2 | ||||||||||||||||||||||||
|
||||||||
| Q4 2025 Supplemental | Page 14 |
|||||||
CAPITAL STRUCTURE AS OF DECEMBER 31, 2025 | ||||||||||||||||||||||||||||||||||||||||||||
| (UNAUDITED, DOLLARS IN THOUSANDS EXCEPT SHARE INFORMATION) | ||||||||||||||||||||||||||||||||||||||||||||
| EQUITY | ||||||||||||||||||||||||||||||||||||||||||||
| SECURITY | SHARES OUTSTANDING | PRICE PER SHARE AT DECEMBER 31, 2025 |
LIQUIDATION PREFERENCE | DIVIDEND RATE | CONVERTIBLE | CONVERSION RATIO AT DECEMBER 31, 2025 |
CONVERSION PRICE AT DECEMBER 31, 2025 |
|||||||||||||||||||||||||||||||||||||
| Common shares | 76,144,638 | $49.90 | N/A | (1) | N/A | N/A | N/A | |||||||||||||||||||||||||||||||||||||
| Series C | 5,392,616 | $22.18 | $134,815 | 5.750% | Y | 0.4378 | $57.10 | |||||||||||||||||||||||||||||||||||||
| Series E | 3,445,980 | $29.92 | $86,150 | 9.000% | Y | 0.4845 | $51.60 | |||||||||||||||||||||||||||||||||||||
| Series G | 6,000,000 | $19.64 | $150,000 | 5.750% | N | N/A | N/A | |||||||||||||||||||||||||||||||||||||
| CALCULATION OF TOTAL MARKET CAPITALIZATION: | ||||||||||||||||||||||||||||||||||||||||||||
Common shares outstanding at December 31, 2025 multiplied by closing price at December 31, 2025 |
$ | 3,799,617 | ||||||||||||||||||||||||||||||||||||||||||
| Aggregate liquidation value of Series C preferred shares (2) | 134,815 | |||||||||||||||||||||||||||||||||||||||||||
| Aggregate liquidation value of Series E preferred shares (2) | 86,150 | |||||||||||||||||||||||||||||||||||||||||||
| Aggregate liquidation value of Series G preferred shares (2) | 150,000 | |||||||||||||||||||||||||||||||||||||||||||
Net debt at December 31, 2025 (3) |
2,864,015 | |||||||||||||||||||||||||||||||||||||||||||
| Total consolidated market capitalization | $ | 7,034,597 | ||||||||||||||||||||||||||||||||||||||||||
(1) Total monthly dividends declared in the fourth quarter of 2025 were $0.885 per share. | ||||||||||||||||||||||||||||||||||||||||||||
(2) Excludes accrued unpaid dividends at December 31, 2025. |
||||||||||||||||||||||||||||||||||||||||||||
(3) See pages 24 through 26 for definitions. |
||||||||||||||||||||||||||||||||||||||||||||
|
||||||||
| Q4 2025 Supplemental | Page 15 |
|||||||
| SUMMARY OF RATIOS | |||||||||||||||||||||||||||||||||||
| (UNAUDITED) | |||||||||||||||||||||||||||||||||||
| 4TH QUARTER 2025 | 3RD QUARTER 2025 | 2ND QUARTER 2025 | 1ST QUARTER 2025 | 4TH QUARTER 2024 | 3RD QUARTER 2024 | ||||||||||||||||||||||||||||||
| Debt to total assets ratio | 51% | 50% | 50% | 50% | 51% | 50% | |||||||||||||||||||||||||||||
| Net debt to total market capitalization ratio (1) | 41% | 37% | 37% | 39% | 43% | 41% | |||||||||||||||||||||||||||||
| Net debt to gross assets ratio (1) | 39% | 38% | 39% | 39% | 40% | 39% | |||||||||||||||||||||||||||||
| Net debt/Adjusted EBITDAre ratio (1)(2) | 5.0 | 4.7 | 5.1 | 5.3 | 5.3 | 5.0 | |||||||||||||||||||||||||||||
| Net debt/Annualized adjusted EBITDAre ratio (1)(3) | 4.9 | 4.9 | 5.0 | 5.1 | 5.1 | 5.2 | |||||||||||||||||||||||||||||
| Interest coverage ratio (4) | 4.0 | 4.2 | 3.9 | 3.8 | 3.8 | 4.0 | |||||||||||||||||||||||||||||
| Fixed charge coverage ratio (4) | 3.4 | 3.6 | 3.3 | 3.2 | 3.2 | 3.4 | |||||||||||||||||||||||||||||
| Debt service coverage ratio (4) | 4.0 | 4.2 | 3.9 | 3.8 | 3.8 | 4.0 | |||||||||||||||||||||||||||||
| FFO payout ratio (5) | 69% | 72% | 71% | 72% | 78% | 65% | |||||||||||||||||||||||||||||
| FFO as adjusted payout ratio (6) | 68% | 65% | 70% | 73% | 70% | 66% | |||||||||||||||||||||||||||||
| AFFO payout ratio (7) | 68% | 64% | 71% | 71% | 70% | 66% | |||||||||||||||||||||||||||||
(1) See pages 24 through 26 for definitions. See prior period supplementals for detailed calculations, as applicable. | |||||||||||||||||||||||||||||||||||
(2) Adjusted EBITDAre is for the quarter multiplied times four. See calculation on page 30. | |||||||||||||||||||||||||||||||||||
(3) Annualized adjusted EBITDAre is adjusted EBITDAre for the quarter further adjusted for in-service and disposed projects, percentage rent and participating interest and other items which is then multiplied times four. These calculations can be found on page 30 under the reconciliation of Adjusted EBITDAre and Annualized Adjusted EBITDAre. See pages 24 through 26 for definitions. | |||||||||||||||||||||||||||||||||||
(4) See page 28 for detailed calculation. | |||||||||||||||||||||||||||||||||||
| (5) FFO payout ratio is calculated by dividing dividends declared per common share by FFO per diluted common share. | |||||||||||||||||||||||||||||||||||
| (6) FFO as adjusted payout ratio is calculated by dividing dividends declared per common share by FFO as adjusted per diluted common share. | |||||||||||||||||||||||||||||||||||
| (7) AFFO payout ratio is calculated by dividing dividends declared per common share by AFFO per diluted common share. | |||||||||||||||||||||||||||||||||||
|
||||||||
| Q4 2025 Supplemental | Page 16 |
|||||||
| SUMMARY OF MORTGAGE NOTES RECEIVABLE | |||||||||||||||||||||||
| (UNAUDITED, DOLLARS IN THOUSANDS) | |||||||||||||||||||||||
| CARRYING AMOUNT AS OF (1) | |||||||||||||||||||||||
| DESCRIPTION | INTEREST RATE | PAYOFF DATE/MATURITY DATE | OUTSTANDING PRINCIPAL AMOUNT OF MORTGAGE | DECEMBER 31, 2025 | DECEMBER 31, 2024 | ||||||||||||||||||
| Attraction property Powells Point, North Carolina | 7.48 | % | 6/30/2026 | $ | 29,378 | $ | 28,992 | $ | 29,173 | ||||||||||||||
| Eat & play property Eugene, Oregon | 10.50 | % | 12/31/2028 | 10,750 | 10,417 | 10,417 | |||||||||||||||||
| Fitness & wellness property Merriam, Kansas | 8.15 | % | 7/31/2029 | 9,090 | 9,201 | 9,238 | |||||||||||||||||
| Fitness & wellness property Omaha, Nebraska | 9.50 | % | 6/30/2030 | 10,905 | 10,957 | 10,996 | |||||||||||||||||
| Fitness & wellness property Omaha, Nebraska | 9.50 | % | 6/30/2030 | 10,539 | 10,676 | 10,659 | |||||||||||||||||
| Experiential lodging property Nashville, Tennessee | 7.69 | % | 9/30/2031 | 70,000 | 70,293 | 71,041 | |||||||||||||||||
| Ski property Girdwood, Alaska | 8.80 | % | 7/31/2032 | 82,000 | 80,398 | 79,742 | |||||||||||||||||
| Fitness & wellness properties Colorado and California | 7.15 | % | 1/10/2033 | 46,120 | 46,046 | 64,275 | |||||||||||||||||
| Eat & play property Austin, Texas | 11.31 | % | 6/1/2033 | 8,330 | 8,330 | 9,083 | |||||||||||||||||
| Eat & play property Dallas, Texas | 10.25 | % | 11/26/2033 | 6,449 | — | 6,163 | |||||||||||||||||
| Experiential lodging property Breaux Bridge, Louisiana | 7.25 | % | 3/8/2034 | — | — | 1,000 | |||||||||||||||||
| Fitness & wellness property Glenwood Springs, Colorado | 8.38 | % | 8/16/2034 | 73,670 | 72,683 | 51,892 | |||||||||||||||||
| Ski property West Dover and Wilmington, Vermont | 12.69 | % | 12/1/2034 | 51,050 | 51,708 | 51,049 | |||||||||||||||||
| Four ski properties Ohio and Pennsylvania | 11.75 | % | 12/1/2034 | 37,562 | 37,439 | 37,430 | |||||||||||||||||
| Ski property Chesterland, Ohio | 12.26 | % | 12/1/2034 | 4,550 | 4,410 | 4,394 | |||||||||||||||||
| Fitness & wellness property Acworth, Georgia | 8.65 | % | 6/1/2035 | 5,923 | 5,963 | — | |||||||||||||||||
| Ski property Hunter, New York | 9.35 | % | 1/5/2036 | 21,000 | 21,000 | 21,000 | |||||||||||||||||
| Eat & play property Midvale, Utah | 10.25 | % | 5/31/2036 | 17,505 | 17,505 | 17,505 | |||||||||||||||||
| Eat & play property West Chester, Ohio | 9.75 | % | 8/1/2036 | 18,068 | 18,067 | 18,068 | |||||||||||||||||
| Fitness & wellness property Fort Collins, Colorado | 8.00 | % | 1/31/2038 | 10,292 | 9,891 | 9,896 | |||||||||||||||||
| Early childhood education center Lake Mary, Florida | 8.35 | % | 5/9/2039 | — | — | 4,412 | |||||||||||||||||
| Early childhood education center Lithia, Florida | 9.11 | % | 10/31/2039 | — | — | 4,103 | |||||||||||||||||
| Attraction property Frankenmuth, Michigan | 8.25 | % | 10/14/2042 | 69,139 | 68,485 | 67,966 | |||||||||||||||||
| Fitness & wellness properties Massachusetts and New York | 8.45 | % | 1/10/2044 | 77,000 | 76,589 | 76,294 | |||||||||||||||||
| Fitness & wellness property Manitoba, Canada | 7.75 | % | 9/25/2055 | 20,356 | 20,204 | — | |||||||||||||||||
| Total | $ | 689,676 | $ | 679,254 | $ | 665,796 | |||||||||||||||||
|
||||||||
| Q4 2025 Supplemental | Page 17 |
|||||||
| INVESTMENT SPENDING AND DISPOSITION SUMMARIES | |||||||||||||||||||||||
| (UNAUDITED, DOLLARS IN THOUSANDS) | |||||||||||||||||||||||
INVESTMENT SPENDING THREE MONTHS ENDED DECEMBER 31, 2025 | |||||||||||||||||||||||
| INVESTMENT TYPE | TOTAL INVESTMENT SPENDING | NEW DEVELOPMENT | RE-DEVELOPMENT | ASSET ACQUISITION | MORTGAGE NOTES OR NOTES RECEIVABLE | INVESTMENT IN JOINT VENTURES | |||||||||||||||||
| Theatres | $ | 8,167 | $ | — | $ | 8,167 | $ | — | $ | — | $ | — | |||||||||||
| Eat & Play | 17,888 | 15,594 | 2,294 | — | — | — | |||||||||||||||||
| Attractions | 23,171 | — | — | 23,171 | — | — | |||||||||||||||||
| Experiential Lodging | 683 | — | 18 | — | — | 665 | |||||||||||||||||
| Fitness & Wellness | 97,835 | — | 5,351 | 90,742 | 1,742 | — | |||||||||||||||||
| Total Experiential | 147,744 | 15,594 | 15,830 | 113,913 | 1,742 | 665 | |||||||||||||||||
| Total Investment Spending | $ | 147,744 | $ | 15,594 | $ | 15,830 | $ | 113,913 | $ | 1,742 | $ | 665 | |||||||||||
INVESTMENT SPENDING YEAR ENDED DECEMBER 31, 2025 | |||||||||||||||||||||||
| INVESTMENT TYPE | TOTAL INVESTMENT SPENDING | NEW DEVELOPMENT | RE-DEVELOPMENT | ASSET ACQUISITION | MORTGAGE NOTES OR NOTES RECEIVABLE | INVESTMENT IN JOINT VENTURES | |||||||||||||||||
| Theatres | $ | 8,167 | $ | — | $ | 8,167 | $ | — | $ | — | $ | — | |||||||||||
| Eat & Play | 77,763 | 72,724 | 4,765 | — | 274 | — | |||||||||||||||||
| Attractions | 37,452 | — | — | 37,452 | — | — | |||||||||||||||||
| Ski | 1,880 | — | — | — | 1,880 | — | |||||||||||||||||
| Experiential Lodging | 4,038 | — | 32 | — | — | 4,006 | |||||||||||||||||
| Fitness & Wellness | 159,235 | — | 19,316 | 91,984 | 47,935 | — | |||||||||||||||||
| Total Experiential | 288,535 | 72,724 | 32,280 | 129,436 | 50,089 | 4,006 | |||||||||||||||||
| Total Investment Spending | $ | 288,535 | $ | 72,724 | $ | 32,280 | $ | 129,436 | $ | 50,089 | $ | 4,006 | |||||||||||
2025 DISPOSITIONS | |||||||||||||||||||||||
THREE MONTHS ENDED DECEMBER 31, 2025 |
YEAR ENDED DECEMBER 31, 2025 |
||||||||||||||||||||||
| INVESTMENT TYPE | TOTAL DISPOSITIONS | NET PROCEEDS FROM SALE OF REAL ESTATE | NET PROCEEDS FROM PAYDOWN OF MORTGAGE NOTES | TOTAL DISPOSITIONS | NET PROCEEDS FROM SALE OF REAL ESTATE | NET PROCEEDS FROM PAYDOWN OF MORTGAGE NOTES | |||||||||||||||||
| Theatres | $ | 14,341 | $ | 14,341 | $ | — | $ | 98,416 | $ | 98,416 | $ | — | |||||||||||
| Eat & Play | 532 | 532 | — | 532 | 532 | — | |||||||||||||||||
| Attractions | 1,235 | 1,235 | — | 3,970 | 3,970 | — | |||||||||||||||||
| Fitness & Wellness | 18,430 | — | 18,430 | 18,430 | — | 18,430 | |||||||||||||||||
| Total Experiential | 34,538 | 16,108 | 18,430 | 121,348 | 102,918 | 18,430 | |||||||||||||||||
| Education | — | — | — | 47,009 | 38,887 | 8,122 | |||||||||||||||||
| Total Education | — | — | — | 47,009 | 38,887 | 8,122 | |||||||||||||||||
| Total Dispositions | $ | 34,538 | $ | 16,108 | $ | 18,430 | $ | 168,357 | $ | 141,805 | $ | 26,552 | |||||||||||
|
||||||||
| Q4 2025 Supplemental | Page 18 |
|||||||
PROPERTY UNDER DEVELOPMENT - INVESTMENT SPENDING ESTIMATES AT DECEMBER 31, 2025 (1) | |||||||||||||||||||||||||||||||||||||||||||||||
| (UNAUDITED, DOLLARS IN THOUSANDS) | |||||||||||||||||||||||||||||||||||||||||||||||
| DECEMBER 31, 2025 | OWNED BUILD-TO-SUIT SPENDING ESTIMATES | ||||||||||||||||||||||||||||||||||||||||||||||
| PROPERTY UNDER DEVELOPMENT | # OF PROJECTS | 1ST QUARTER 2026 | 2ND QUARTER 2026 | 3RD QUARTER 2026 | 4TH QUARTER 2026 | THEREAFTER | TOTAL EXPECTED COSTS (2) | % LEASED | |||||||||||||||||||||||||||||||||||||||
| Total Build-to-Suit | $ | 45,741 | 3 | $ | 6,110 | $ | 6,285 | $ | 2,234 | $ | — | $ | — | $ | 60,370 | 100 | % | ||||||||||||||||||||||||||||||
| Non Build-to-Suit Development | 9,164 | ||||||||||||||||||||||||||||||||||||||||||||||
| Total Property Under Development | $ | 54,905 | |||||||||||||||||||||||||||||||||||||||||||||
| DECEMBER 31, 2025 | OWNED BUILD-TO-SUIT IN-SERVICE ESTIMATES | ||||||||||||||||||||||||||||||||||||||||||||||
| # OF PROJECTS | 1ST QUARTER 2026 | 2ND QUARTER 2026 | 3RD QUARTER 2026 | 4TH QUARTER 2026 | THEREAFTER | TOTAL IN-SERVICE (2) | ACTUAL IN-SERVICE 4TH QUARTER 2025 | ||||||||||||||||||||||||||||||||||||||||
| Total Build-to-Suit | 3 | $ | 2,204 | $ | 38,947 | $ | 19,219 | $ | — | $ | — | $ | 60,370 | $ | 52,691 | ||||||||||||||||||||||||||||||||
| DECEMBER 31, 2025 | MORTGAGE BUILD-TO-SUIT SPENDING ESTIMATES | ||||||||||||||||||||||||||||||||||||||||||||||
| MORTGAGE NOTES RECEIVABLE | # OF PROJECTS | 1ST QUARTER 2026 | 2ND QUARTER 2026 | 3RD QUARTER 2026 | 4TH QUARTER 2026 | THEREAFTER | TOTAL EXPECTED COSTS (2) | ||||||||||||||||||||||||||||||||||||||||
| Total Build-to-Suit Mortgage Notes | $ | 149,271 | 2 | $ | 1,600 | $ | 750 | $ | 45,750 | $ | — | $ | — | $ | 197,371 | ||||||||||||||||||||||||||||||||
| Non Build-to-Suit Mortgage Notes | 529,983 | ||||||||||||||||||||||||||||||||||||||||||||||
| Total Mortgage Notes Receivable | $ | 679,254 | |||||||||||||||||||||||||||||||||||||||||||||
(1) This schedule includes only those properties for which the Company has commenced construction as of December 31, 2025. | |||||||||||||||||||||||||||||||||||||||||||||||
| (2) "Total Expected Costs" and "Total In-Service" each reflect the total capital costs expected to be funded by the Company through completion (including capitalized interest or accrued interest, as applicable). | |||||||||||||||||||||||||||||||||||||||||||||||
Note: This schedule includes future estimates for which the Company can give no assurance as to timing or amounts. Development projects have risks. See Item 1A - "Risk Factors" in the Company's most recent Annual Report on Form 10-K and, to the extent applicable, the Company's Quarterly Reports on Form 10-Q. | |||||||||||||||||||||||||||||||||||||||||||||||
|
||||||||
| Q4 2025 Supplemental | Page 19 |
|||||||
PORTFOLIO DETAIL AS OF DECEMBER 31, 2025 | ||||||||||||||||||||||||||
| (UNAUDITED) | ||||||||||||||||||||||||||
| PROPERTY TYPE | PROPERTIES | OPERATORS | ANNUALIZED ADJUSTED EBITDAre (1) | STRATEGIC FOCUS | ||||||||||||||||||||||
| Theatres (2) (4) | 148 | 17 | 36 | % | Reduce | |||||||||||||||||||||
| Eat & Play | 60 | 9 | (3) | 25 | % | Grow | ||||||||||||||||||||
| Attractions | 26 | 8 | 12 | % | Grow | |||||||||||||||||||||
| Ski | 11 | 3 | 7 | % | Grow | |||||||||||||||||||||
| Experiential Lodging (5) | 4 | 3 | 1 | % | Grow | |||||||||||||||||||||
| Fitness & Wellness | 27 | 12 | 10 | % | Grow | |||||||||||||||||||||
| Gaming | 1 | 1 | 2 | % | Grow | |||||||||||||||||||||
| Cultural | 1 | 1 | 1 | % | Grow | |||||||||||||||||||||
| EXPERIENTIAL PORTFOLIO | 278 | 54 | 94 | % | ||||||||||||||||||||||
| Early Childhood Education | 46 | 4 | 4 | % | Reduce | |||||||||||||||||||||
| Private schools | 9 | 1 | 2 | % | Reduce | |||||||||||||||||||||
| EDUCATION PORTFOLIO | 55 | 5 | 6 | % | ||||||||||||||||||||||
| TOTAL PORTFOLIO | 333 | 59 | 100 | % | ||||||||||||||||||||||
(1) See pages 24 through 26 for definitions. | ||||||||||||||||||||||||||
| (2) Excludes seven theatres located in Entertainment Districts (included in Eat & Play). | ||||||||||||||||||||||||||
| (3) Excludes non-theatre operators at Entertainment districts. | ||||||||||||||||||||||||||
| (4) Includes one vacant theatre property that the Company intends to sell. | ||||||||||||||||||||||||||
| (5) Excludes two experiential lodging properties held in unconsolidated joint ventures that the Company is working in good faith with the Company's joint venture partners, the non-recourse debt provider and insurance companies to identify a path forward that the Company expects will result in the eventual removal of both experiential properties from the Company's portfolio. | ||||||||||||||||||||||||||
|
||||||||
| Q4 2025 Supplemental | Page 20 |
|||||||
| LEASE EXPIRATIONS | |||||||||||||||||||||||
AS OF DECEMBER 31, 2025 | |||||||||||||||||||||||
| (UNAUDITED, DOLLARS IN THOUSANDS) | |||||||||||||||||||||||
| YEAR | TOTAL NUMBER OF PROPERTIES | RENTAL REVENUE FOR THE YEAR ENDED DECEMBER 31, 2025 (1) |
% OF TOTAL REVENUE | ||||||||||||||||||||
| 2026 | 1 | $ | 1,141 | — | % | ||||||||||||||||||
| 2027 | 4 | 20,675 | 3 | % | |||||||||||||||||||
| 2028 | 9 | 15,107 | 2 | % | |||||||||||||||||||
| 2029 | 14 | 21,726 | 3 | % | |||||||||||||||||||
| 2030 | 20 | 34,158 | 5 | % | |||||||||||||||||||
| 2031 | 3 | 5,126 | 1 | % | |||||||||||||||||||
| 2032 | 8 | 12,237 | 2 | % | |||||||||||||||||||
| 2033 | 7 | 10,210 | 1 | % | |||||||||||||||||||
| 2034 | 34 | 68,599 | 9 | % | |||||||||||||||||||
| 2035 | 29 | 72,313 | 10 | % | |||||||||||||||||||
| 2036 | 40 | 76,396 | 11 | % | |||||||||||||||||||
| 2037 | 27 | 61,758 | 9 | % | |||||||||||||||||||
| 2038 | 40 | 65,029 | 9 | % | |||||||||||||||||||
| 2039 | 2 | 4,987 | 1 | % | |||||||||||||||||||
| 2040 | 3 | 9,799 | 1 | % | |||||||||||||||||||
| 2041 | 30 | 18,608 | 2 | % | |||||||||||||||||||
| 2042 | 4 | 18,640 | 3 | % | |||||||||||||||||||
| 2043 | 7 | 20,266 | 3 | % | |||||||||||||||||||
| 2044 | 1 | 3,071 | — | % | |||||||||||||||||||
| 2045 | 6 | 21,570 | 3 | % | |||||||||||||||||||
| Thereafter | 7 | 7,003 | 1 | % | |||||||||||||||||||
| 296 | $ | 568,419 | 79 | % | |||||||||||||||||||
Note: This schedule excludes non-theatre tenant leases within the Company's entertainment districts, properties under development, land held for development, properties operated by the Company and investments in mortgage notes receivable. | |||||||||||||||||||||||
(1) Rental revenue for the year ended December 31, 2025 includes lease revenue related to the Company's existing operating ground leases (leases in which the Company is a sub-lessor) as well as the gross-up of tenant reimbursed expenses recognized during the year ended December 31, 2025 in accordance with Accounting Standards Update (ASU) No. 2016-02 Leases (Topic 842). | |||||||||||||||||||||||
|
||||||||
| Q4 2025 Supplemental | Page 21 |
|||||||
| TOP TEN CUSTOMERS BY PERCENTAGE OF TOTAL REVENUE | |||||||||||||||||
| (UNAUDITED) | |||||||||||||||||
| PERCENTAGE OF TOTAL REVENUE | PERCENTAGE OF TOTAL REVENUE | ||||||||||||||||
| FOR THE THREE MONTHS ENDED | FOR THE YEAR ENDED | ||||||||||||||||
| CUSTOMERS | DECEMBER 31, 2025 | DECEMBER 31, 2025 | |||||||||||||||
| 1. | Topgolf | 14.6% | 14.2% | ||||||||||||||
| 2. | AMC Entertainment Holdings, Inc. | 13.7% | 13.6% | ||||||||||||||
| 3. | Regal Entertainment Group | 10.2% | 11.5% | ||||||||||||||
| 4. | Premier Parks | 6.2% | 4.8% | ||||||||||||||
| 5. | Cinemark | 5.9% | 6.0% | ||||||||||||||
| 6. | Vail Resorts | 4.3% | 4.5% | ||||||||||||||
| 7. | Camelback Resort | 3.1% | 3.2% | ||||||||||||||
| 8. | Santikos Theaters, LLC | 2.5% | 2.5% | ||||||||||||||
| 9. | Six Flags Entertainment Corporation | 2.4% | 2.4% | ||||||||||||||
| 10. | Endeavor Schools | 2.0% | 2.0% | ||||||||||||||
| Total | 64.9% | 64.7% | |||||||||||||||
|
||||||||
| Q4 2025 Supplemental | Page 22 |
|||||||
| GUIDANCE | ||||||||||||||
| (UNAUDITED, DOLLARS IN MILLIONS, EXCEPT PER SHARE DATA) | ||||||||||||||
| MEASURE | 2026 GUIDANCE | |||||||||||||
| CURRENT | ||||||||||||||
| Investment spending | $400.0 | to | $500.0 | |||||||||||
| Disposition proceeds and mortgage note payoff | $25.0 | to | $75.0 | |||||||||||
| Percentage rent and participating interest | $18.5 | to | $22.5 | |||||||||||
| General and administrative expense | $56.0 | to | $59.0 | |||||||||||
| Other income (1) | $41.0 | to | $51.0 | |||||||||||
| Other expense (1) | $41.0 | to | $51.0 | |||||||||||
| FFO per diluted share | $5.26 | to | $5.46 | |||||||||||
| FFOAA per diluted share | $5.28 | to | $5.48 | |||||||||||
| RECONCILIATION FROM NET INCOME AVAILABLE TO COMMON SHAREHOLDERS OF EPR PROPERTIES (PER DILUTED SHARE): | 2026 GUIDANCE | |||||||||||||
| Net income available to common shareholders of EPR Properties | $2.89 | to | $3.09 | |||||||||||
| Gain on sale of real estate and early ground lease termination | (0.08) | |||||||||||||
| Real estate depreciation and amortization | 2.48 | |||||||||||||
| Allocated share of joint venture depreciation | 0.05 | |||||||||||||
| Impact of Series C and Series E Dilution, if applicable | (0.08) | |||||||||||||
| FFO available to common shareholders of EPR Properties | $5.26 | to | $5.46 | |||||||||||
| Retirement and severance expense | 0.02 | |||||||||||||
| Transaction costs | 0.03 | |||||||||||||
| Provision (benefit) for credit losses, net | (0.01) | |||||||||||||
| Deferred income tax benefit | (0.02) | |||||||||||||
| FFO as adjusted (FFOAA) available to common shareholders of EPR Properties | $5.28 | to | $5.48 | |||||||||||
| (1) Other income and other expense consist primarily of results from the Company's properties operated through third-party managers. | ||||||||||||||
|
||||||||
| Q4 2025 Supplemental | Page 23 |
|||||||
| DEFINITIONS - NON-GAAP FINANCIAL MEASURES | ||||||||||||||
|
||||||||
| Q4 2025 Supplemental | Page 24 |
|||||||
|
||||||||
| Q4 2025 Supplemental | Page 25 |
|||||||
|
||||||||
| Q4 2025 Supplemental | Page 26 |
|||||||

| Appendix to Supplemental Operating and Financial Data | ||||||||||||||||||||||||||
| Reconciliation of Certain Non-GAAP Financial Measures | ||||||||||||||||||||||||||
Fourth Quarter and Year Ended December 31, 2025 | ||||||||||||||||||||||||||
|
||||||||
| Q4 2025 Supplemental | Page 27 |
|||||||
| CALCULATION OF INTEREST, FIXED CHARGE AND DEBT SERVICE COVERAGE RATIOS | |||||||||||||||||||||||||||||||||||
| (UNAUDITED, DOLLARS IN THOUSANDS) | |||||||||||||||||||||||||||||||||||
| INTEREST COVERAGE RATIO (1): | 4TH QUARTER 2025 | 3RD QUARTER 2025 | 2ND QUARTER 2025 | 1ST QUARTER 2025 | 4TH QUARTER 2024 | 3RD QUARTER 2024 | |||||||||||||||||||||||||||||
| Net income (loss) | $ | 66,904 | $ | 66,586 | $ | 75,643 | $ | 65,803 | $ | (8,395) | $ | 46,650 | |||||||||||||||||||||||
| Impairment charges | — | — | — | — | 39,952 | — | |||||||||||||||||||||||||||||
| Impairment charges on joint ventures | — | — | — | — | 16,087 | 12,130 | |||||||||||||||||||||||||||||
| Retirement and severance expense | 1,901 | 1,094 | — | — | — | — | |||||||||||||||||||||||||||||
| Transaction costs | 471 | 492 | 669 | 567 | 423 | 175 | |||||||||||||||||||||||||||||
| Provision (benefit) for credit losses, net | (985) | 9,117 | 997 | (652) | 9,876 | (770) | |||||||||||||||||||||||||||||
| Interest expense, gross | 34,768 | 34,239 | 34,510 | 34,784 | 34,991 | 34,402 | |||||||||||||||||||||||||||||
| Depreciation and amortization | 43,582 | 42,409 | 42,080 | 41,089 | 40,995 | 42,795 | |||||||||||||||||||||||||||||
| Share-based compensation expense | |||||||||||||||||||||||||||||||||||
| to management and trustees | 3,643 | 3,907 | 3,912 | 3,867 | 3,572 | 3,264 | |||||||||||||||||||||||||||||
| Costs associated with loan refinancing or payoff | — | — | — | — | — | 337 | |||||||||||||||||||||||||||||
| Interest cost capitalized | (710) | (758) | (961) | (1,435) | (1,161) | (878) | |||||||||||||||||||||||||||||
| Straight-line rental revenue | (4,025) | (3,541) | (5,137) | (3,397) | (3,992) | (4,414) | |||||||||||||||||||||||||||||
| (Gain) loss on sale of real estate and early ground lease termination | (5,297) | (8,073) | (16,779) | (9,384) | (112) | 3,419 | |||||||||||||||||||||||||||||
| Deferred income tax benefit | (170) | (53) | (93) | (530) | (285) | (728) | |||||||||||||||||||||||||||||
| Interest coverage amount | $ | 140,082 | $ | 145,419 | $ | 134,841 | $ | 130,712 | $ | 131,951 | $ | 136,382 | |||||||||||||||||||||||
| Interest expense, net | $ | 33,574 | $ | 33,238 | $ | 33,246 | $ | 33,021 | $ | 33,472 | $ | 32,867 | |||||||||||||||||||||||
| Interest income | 484 | 243 | 303 | 328 | 358 | 657 | |||||||||||||||||||||||||||||
| Interest cost capitalized | 710 | 758 | 961 | 1,435 | 1,161 | 878 | |||||||||||||||||||||||||||||
| Interest expense, gross | $ | 34,768 | $ | 34,239 | $ | 34,510 | $ | 34,784 | $ | 34,991 | $ | 34,402 | |||||||||||||||||||||||
| Interest coverage ratio | 4.0 | 4.2 | 3.9 | 3.8 | 3.8 | 4.0 | |||||||||||||||||||||||||||||
| FIXED CHARGE COVERAGE RATIO (1): | |||||||||||||||||||||||||||||||||||
| Interest coverage amount | $ | 140,082 | $ | 145,419 | $ | 134,841 | $ | 130,712 | $ | 131,951 | $ | 136,382 | |||||||||||||||||||||||
| Interest expense, gross | $ | 34,768 | $ | 34,239 | $ | 34,510 | $ | 34,784 | $ | 34,991 | $ | 34,402 | |||||||||||||||||||||||
| Preferred share dividends | 6,040 | 6,032 | 6,040 | 6,032 | 6,040 | 6,032 | |||||||||||||||||||||||||||||
| Fixed charges | $ | 40,808 | $ | 40,271 | $ | 40,550 | $ | 40,816 | $ | 41,031 | $ | 40,434 | |||||||||||||||||||||||
| Fixed charge coverage ratio | 3.4 | 3.6 | 3.3 | 3.2 | 3.2 | 3.4 | |||||||||||||||||||||||||||||
| DEBT SERVICE COVERAGE RATIO (1): | |||||||||||||||||||||||||||||||||||
| Interest coverage amount | $ | 140,082 | $ | 145,419 | $ | 134,841 | $ | 130,712 | $ | 131,951 | $ | 136,382 | |||||||||||||||||||||||
| Interest expense, gross | $ | 34,768 | $ | 34,239 | $ | 34,510 | $ | 34,784 | $ | 34,991 | $ | 34,402 | |||||||||||||||||||||||
| Recurring principal payments | — | — | — | — | — | — | |||||||||||||||||||||||||||||
| Debt service | $ | 34,768 | $ | 34,239 | $ | 34,510 | $ | 34,784 | $ | 34,991 | $ | 34,402 | |||||||||||||||||||||||
| Debt service coverage ratio | 4.0 | 4.2 | 3.9 | 3.8 | 3.8 | 4.0 | |||||||||||||||||||||||||||||
(1) See pages 24 through 26 for definitions. |
|||||||||||||||||||||||||||||||||||
|
||||||||
| Q4 2025 Supplemental | Page 28 |
|||||||
| RECONCILIATION OF INTEREST COVERAGE AMOUNT TO NET CASH PROVIDED BY OPERATING ACTIVITIES | ||||||||||||||||||||||||||||||||||||||
| (UNAUDITED, DOLLARS IN THOUSANDS) | ||||||||||||||||||||||||||||||||||||||
The interest coverage amount per the table on page 28 is a non-GAAP financial measure and should not be considered an alternative to any GAAP liquidity measures. It is most directly comparable to the GAAP liquidity measure, “Net cash provided by operating activities,” and is not directly comparable to the GAAP liquidity measures, “Net cash used by investing activities” and “Net cash provided by financing activities.” The interest coverage amount can be reconciled to “Net cash provided by operating activities” per the consolidated statements of cash flows as follows: | ||||||||||||||||||||||||||||||||||||||
| 4TH QUARTER 2025 | 3RD QUARTER 2025 | 2ND QUARTER 2025 | 1ST QUARTER 2025 | 4TH QUARTER 2024 | 3RD QUARTER 2024 | |||||||||||||||||||||||||||||||||
| Net cash provided by operating activities | $ | 97,780 | $ | 136,483 | $ | 87,321 | $ | 99,369 | $ | 92,938 | $ | 122,001 | ||||||||||||||||||||||||||
| Equity in (loss) gain from joint ventures | (2,396) | 2,934 | (1,681) | (2,647) | (3,425) | (851) | ||||||||||||||||||||||||||||||||
| Distributions from joint ventures | — | — | — | (11) | — | — | ||||||||||||||||||||||||||||||||
| Amortization of deferred financing costs | (2,380) | (2,120) | (2,102) | (2,206) | (2,187) | (2,211) | ||||||||||||||||||||||||||||||||
| Amortization of above and below market leases and tenant allowances, net | 81 | 81 | 81 | 81 | 81 | 84 | ||||||||||||||||||||||||||||||||
| Changes in assets and liabilities: | ||||||||||||||||||||||||||||||||||||||
| Operating lease assets and liabilities | 532 | 496 | 259 | 293 | 324 | 373 | ||||||||||||||||||||||||||||||||
| Mortgage notes accrued interest receivable | (1,449) | 1,824 | (1,266) | 1,687 | (549) | 485 | ||||||||||||||||||||||||||||||||
| Accounts receivable | 4,307 | (2,209) | 8,619 | 3,862 | 5,902 | 4,209 | ||||||||||||||||||||||||||||||||
| Other assets | (1,238) | (1,318) | 3,370 | 1,507 | 759 | 677 | ||||||||||||||||||||||||||||||||
| Accounts payable and accrued liabilities | 15,141 | (15,929) | 10,160 | (3,759) | 81 | (18,882) | ||||||||||||||||||||||||||||||||
| Unearned rents and interest | (1,373) | (5,502) | 999 | 2,017 | 7,766 | 1,212 | ||||||||||||||||||||||||||||||||
| Straight-line rental revenue | (4,025) | (3,541) | (5,137) | (3,397) | (3,992) | (4,414) | ||||||||||||||||||||||||||||||||
| Interest expense, gross | 34,768 | 34,239 | 34,510 | 34,784 | 34,991 | 34,402 | ||||||||||||||||||||||||||||||||
| Interest cost capitalized | (710) | (758) | (961) | (1,435) | (1,161) | (878) | ||||||||||||||||||||||||||||||||
| Transaction costs | 471 | 492 | 669 | 567 | 423 | 175 | ||||||||||||||||||||||||||||||||
| Retirement and severance expense (cash portion) | 573 | 247 | — | — | — | — | ||||||||||||||||||||||||||||||||
| Interest coverage amount (1) | $ | 140,082 | $ | 145,419 | $ | 134,841 | $ | 130,712 | $ | 131,951 | $ | 136,382 | ||||||||||||||||||||||||||
| Net cash (used) provided by investing activities | $ | (115,175) | $ | (36,329) | $ | (12,574) | $ | 42,397 | $ | (30,710) | $ | (73,160) | ||||||||||||||||||||||||||
| Net cash provided (used) by financing activities | $ | 86,238 | $ | (99,058) | $ | (73,416) | $ | (150,490) | $ | (64,468) | $ | (47,295) | ||||||||||||||||||||||||||
(1) See pages 24 through 26 for definitions. | ||||||||||||||||||||||||||||||||||||||
|
||||||||
| Q4 2025 Supplemental | Page 29 |
|||||||
| RECONCILIATION OF EBITDAre, ADJUSTED EBITDAre AND ANNUALIZED ADJUSTED EBITDAre | ||||||||||||||||||||||||||||||||||||||
| (UNAUDITED, DOLLARS IN THOUSANDS) | ||||||||||||||||||||||||||||||||||||||
| ADJUSTED EBITDAre (1): | 4TH QUARTER 2025 | 3RD QUARTER 2025 | 2ND QUARTER 2025 | 1ST QUARTER 2025 | 4TH QUARTER 2024 | 3RD QUARTER 2024 | ||||||||||||||||||||||||||||||||
| Net income (loss) | $ | 66,904 | $ | 66,586 | $ | 75,643 | $ | 65,803 | $ | (8,395) | $ | 46,650 | ||||||||||||||||||||||||||
| Interest expense, net | 33,574 | 33,238 | 33,246 | 33,021 | 33,472 | 32,867 | ||||||||||||||||||||||||||||||||
| Income tax expense | 954 | 725 | 681 | 136 | 653 | (124) | ||||||||||||||||||||||||||||||||
| Depreciation and amortization | 43,582 | 42,409 | 42,080 | 41,089 | 40,995 | 42,795 | ||||||||||||||||||||||||||||||||
| (Gain) loss on sale of real estate and early ground lease termination | (5,297) | (8,073) | (16,779) | (9,384) | (112) | 3,419 | ||||||||||||||||||||||||||||||||
| Impairment of real estate investments | — | — | — | — | 39,952 | — | ||||||||||||||||||||||||||||||||
| Costs associated with loan refinancing or payoff | — | — | — | — | — | 337 | ||||||||||||||||||||||||||||||||
| Allocated share of joint venture depreciation | 1,000 | 989 | 985 | 1,036 | 1,965 | 2,581 | ||||||||||||||||||||||||||||||||
| Allocated share of joint venture interest expense | 516 | 497 | 430 | 375 | 589 | 2,587 | ||||||||||||||||||||||||||||||||
| Impairment charges on joint ventures | — | — | — | — | 16,087 | 12,130 | ||||||||||||||||||||||||||||||||
| EBITDAre | $ | 141,233 | $ | 136,371 | $ | 136,286 | $ | 132,076 | $ | 125,206 | $ | 143,242 | ||||||||||||||||||||||||||
| Retirement and severance expense | 1,901 | 1,094 | — | — | — | — | ||||||||||||||||||||||||||||||||
| Transaction costs | 471 | 492 | 669 | 567 | 423 | 175 | ||||||||||||||||||||||||||||||||
| Provision (benefit) for credit losses, net | (985) | 9,117 | 997 | (652) | 9,876 | (770) | ||||||||||||||||||||||||||||||||
| Adjusted EBITDAre (for the quarter) | $ | 142,620 | $ | 147,074 | $ | 137,952 | $ | 131,991 | $ | 135,505 | $ | 142,647 | ||||||||||||||||||||||||||
| Adjusted EBITDAre (2) | $ | 570,480 | $ | 588,296 | $ | 551,808 | $ | 527,964 | $ | 542,020 | $ | 570,588 | ||||||||||||||||||||||||||
| ANNUALIZED ADJUSTED EBITDAre (1): | ||||||||||||||||||||||||||||||||||||||
| Adjusted EBITDAre (for the quarter) | $ | 142,620 | $ | 147,074 | $ | 137,952 | $ | 131,991 | $ | 135,505 | $ | 142,647 | ||||||||||||||||||||||||||
| In-service and disposition adjustments (3) | 2,145 | 834 | 200 | (500) | 448 | 708 | ||||||||||||||||||||||||||||||||
| Managed and JV property adjustments (4) | 1,914 | (4,804) | 285 | 2,420 | 1,711 | (5,392) | ||||||||||||||||||||||||||||||||
| Property under development adjustments (5) | 934 | 1,303 | 1,715 | 2,336 | 2,258 | 1,472 | ||||||||||||||||||||||||||||||||
| Percentage rent/participation adjustments (6) | (2,829) | (1,906) | 496 | 40 | 70 | (2,193) | ||||||||||||||||||||||||||||||||
| Non-recurring adjustments (7) | 260 | 231 | (606) | 1,313 | (643) | (187) | ||||||||||||||||||||||||||||||||
| Annualized Adjusted EBITDAre (for the quarter) | $ | 145,044 | $ | 142,732 | $ | 140,042 | $ | 137,600 | $ | 139,349 | $ | 137,055 | ||||||||||||||||||||||||||
| Annualized Adjusted EBITDAre (8) | $ | 580,176 | $ | 570,928 | $ | 560,168 | $ | 550,400 | $ | 557,396 | $ | 548,220 | ||||||||||||||||||||||||||
| See footnotes on the following page. | ||||||||||||||||||||||||||||||||||||||
|
||||||||
| Q4 2025 Supplemental | Page 30 |
|||||||
(1) See pages 24 through 26 for definitions. | ||||||||||||||||||||||||||||||||||||||
| (2) Adjusted EBITDAre for the quarter is multiplied by four to calculate an annualized amount but does not include the annualization of investments put in service, acquired or disposed of during the quarter, as well as the potential earnings on property under development, the annualization of percentage rent and participating interest and adjustments for other items. These adjustments are considered in the calculation of Annualized Adjusted EBITDAre. | ||||||||||||||||||||||||||||||||||||||
| (3) Adjustments for rental properties commencing or terminating GAAP net operating income during the quarter and adjustments to revenue from mortgage notes receivable to be consistent with end of quarter balance. | ||||||||||||||||||||||||||||||||||||||
| (4) To annualize amounts from the actual latest quarterly amount to the trailing 12-month amount divided by four. Annualized Adjusted EBITDAre related to the Company's investments in two joint venture properties in St. Pete Beach, Florida has been reduced to zero. | ||||||||||||||||||||||||||||||||||||||
| (5) To add in income for property under development that is build-to-suit at the initial cash yields of the projects upon completion. | ||||||||||||||||||||||||||||||||||||||
| (6) To adjust percentage rents and participating interest income from the actual quarterly amount to the mid-point of the guidance amount shown on page 23, less non-recurring adjustments, divided by four. | ||||||||||||||||||||||||||||||||||||||
| (7) Adjustments for various non-recurring items during the quarter. | ||||||||||||||||||||||||||||||||||||||
| (8) Annualized Adjusted EBITDAre for the quarter is multiplied by four to calculate an annualized amount. | ||||||||||||||||||||||||||||||||||||||
|
||||||||
| Q4 2025 Supplemental | Page 31 |
|||||||