
| Maryland | 001-13145 | 36-4150422 | ||||||||||||
| (State or other jurisdiction | (Commission File Number) | (I.R.S. Employer | ||||||||||||
| of incorporation or organization) | Identification No.) | |||||||||||||
| 200 East Randolph Drive, | Chicago, | IL | 60601 | |||||||||||||||||||||||
| (Address of principal executive offices) | (Zip Code) | |||||||||||||||||||||||||
| Registrant's telephone number, including area code: | (312) | 782-5800 | ||||||||||||||||||||||||
Former name or former address, if changed since last report: Not Applicable |
||||||||||||||||||||||||||
| ☐ | Written communications pursuant to Rule 425 under Securities Act (17 CFR 230.425) | ||||
| ☐ | Soliciting material pursuant to Rule 14a-12 under the Exchange Act (17 CFR 240.14a-12) | ||||
| ☐ | Pre-commencement communications pursuant to Rule 14d-2(b) under the Exchange Act (17 CFR 240.14d-2(b)) | ||||
| ☐ | Pre-commencement communications pursuant to Rule 13e-4(c) under the Exchange Act (17 CFR 240.13e-4(c)) | ||||
| Title of each class | Trading Symbol | Name of each exchange on which registered | ||||||||||||
| Common Stock, par value $0.01 | JLL | The New York Stock Exchange | ||||||||||||
| News release issued by Jones Lang LaSalle Incorporated on May 7, 2025 announcing its | |||||
| financial results for the first quarter ended March 31, 2025. | |||||
| 104 | Cover Page Interactive Data File (embedded within the Inline XBRL document) | ||||
| Dated: May 7, 2025 | |||||||||||
| Jones Lang LaSalle Incorporated | |||||||||||
| By: /s/ Karen Brennan | |||||||||||
| Name: Karen Brennan | |||||||||||
| Title: Chief Financial Officer | |||||||||||
| News Release |  |
|||||||||||||
|
Summary Financial Results
($ in millions, except per share data, "LC" = local currency)
|
Three Months Ended March 31, | ||||||||||||||||
| 2025 | 2024 | % Change in USD | % Change in LC | ||||||||||||||
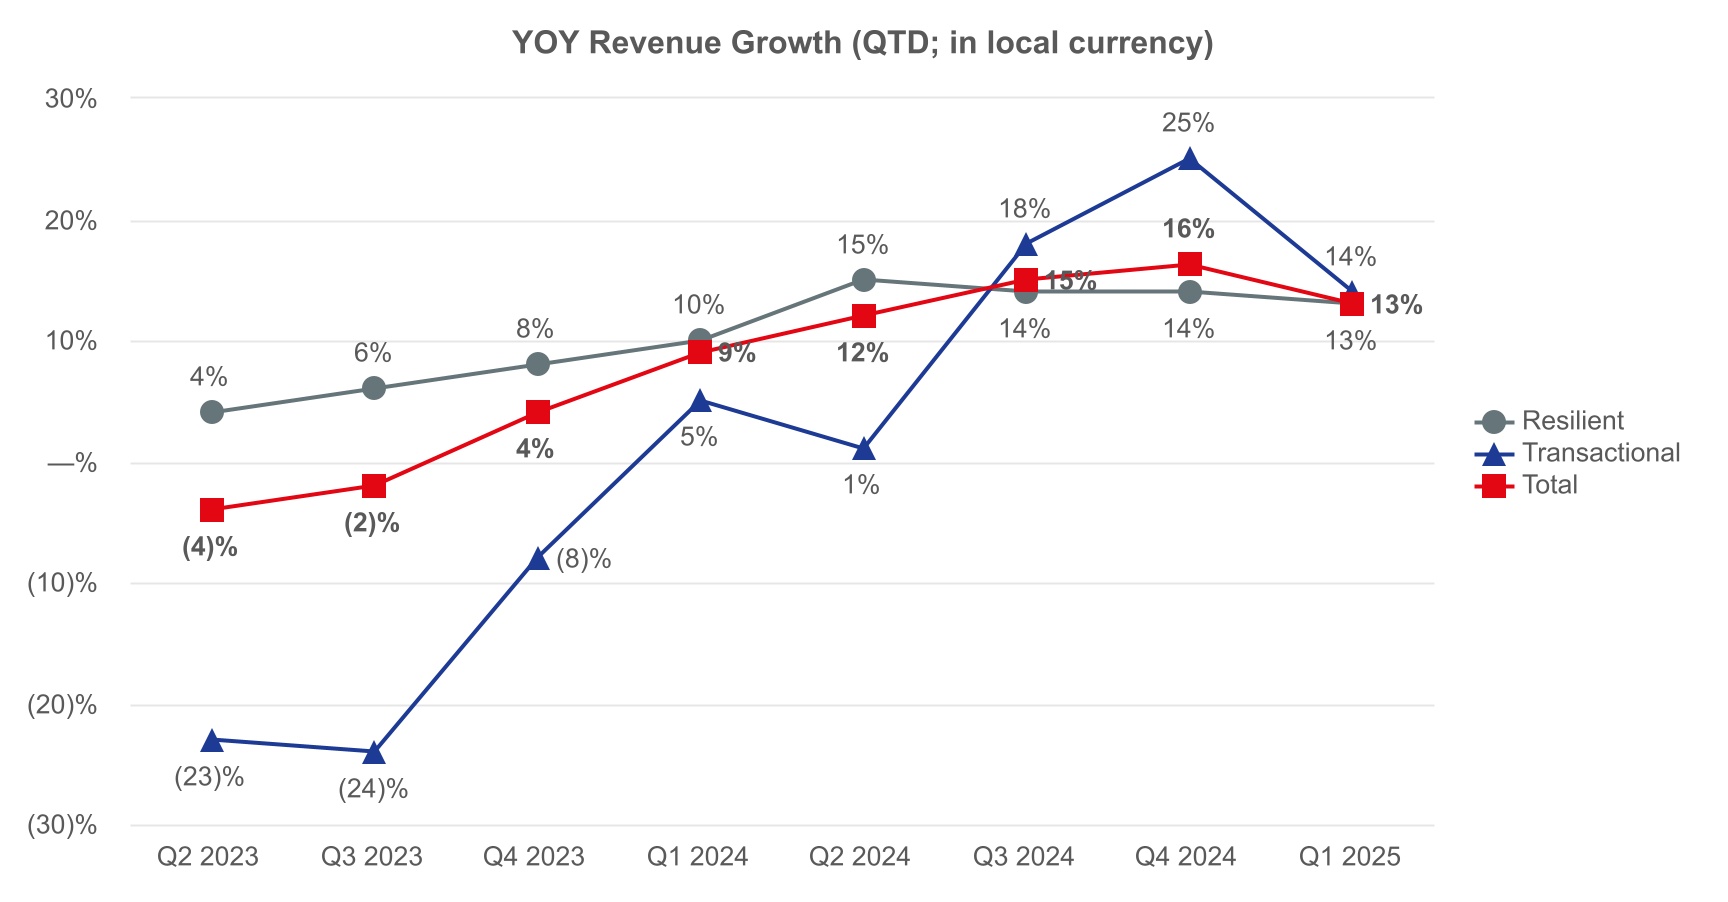
| Revenue | $ | 5,746.4 | $ | 5,124.5 | 12 | % | 13 | % | |||||||||
| Net income attributable to common shareholders | $ | 55.3 | $ | 66.1 | (16) | % | (19) | % | |||||||||
Adjusted net income attributable to common shareholders1 |
111.6 | 86.0 | 30 | 28 | |||||||||||||
| Diluted earnings per share | $ | 1.14 | $ | 1.37 | (17) | % | (19) | % | |||||||||
Adjusted diluted earnings per share1 |
2.31 | 1.78 | 30 | 28 | |||||||||||||
Adjusted EBITDA1 |
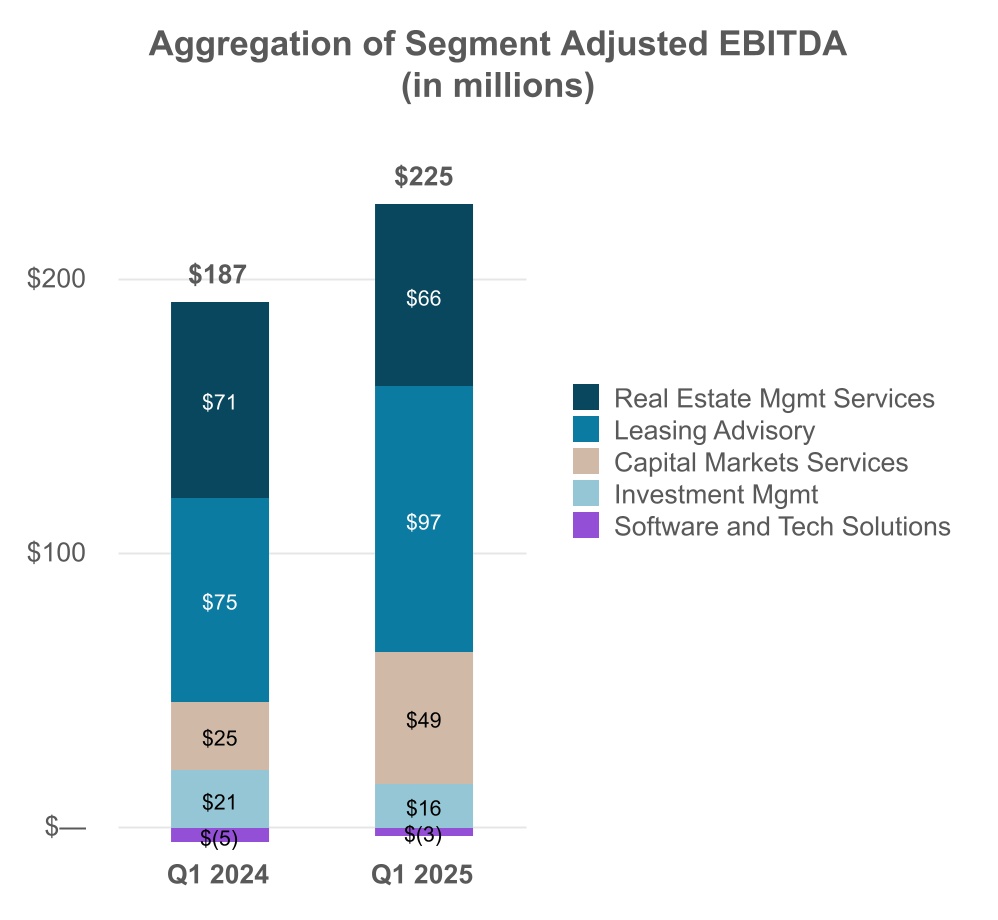
$ | 224.8 | $ | 187.1 | 20 | % | 20 | % | |||||||||
| Cash flows from operating activities | $ | (767.6) | $ | (677.5) | (13) | % | n/a | ||||||||||
Free Cash Flow6 |
(812.1) | (720.7) | (13) | % | n/a | ||||||||||||
|
Consolidated
($ in millions, "LC" = local currency) |
Three Months Ended March 31, | % Change in USD | % Change in LC | ||||||||||||||||||||
| 2025 | 2024 | ||||||||||||||||||||||
| Real Estate Management Services | $ | 4,569.4 | $ | 4,069.2 | 12 | % | 14 | % | |||||||||||||||
| Leasing Advisory | 586.1 | 520.4 | 13 | 13 | |||||||||||||||||||
| Capital Markets Services | 435.3 | 377.6 | 15 | 16 | |||||||||||||||||||
| Investment Management | 98.5 | 103.4 | (5) | (4) | |||||||||||||||||||
| Software and Technology Solutions | 57.1 | 53.9 | 6 | 6 | |||||||||||||||||||
| Total revenue | $ | 5,746.4 | $ | 5,124.5 | 12 | % | 13 | % | |||||||||||||||
Gross contract costs6 |
$ | 3,942.3 | $ | 3,498.7 | 13 | % | 14 | % | |||||||||||||||
| Platform operating expenses | 1,664.4 | 1,509.9 | 10 | 11 | |||||||||||||||||||
Restructuring and acquisition charges5 |
19.7 | 1.7 | n.m. | n.m. | |||||||||||||||||||
| Total operating expenses | $ | 5,626.4 | $ | 5,010.3 | 12 | % | 14 | % | |||||||||||||||
Net non-cash MSR and mortgage banking derivative activity1 |
$ | (12.9) | $ | (9.0) | (43) | % | (43) | % | |||||||||||||||
Note: For discussion and reconciliation of non-GAAP financial measures, see the Notes following the Financial Statements in this news release. Percentage variances in the Performance Highlights below are calculated and presented on a local currency basis, unless otherwise noted. | |||||||||||||||||||||||
|
($ in millions, except per share data, "LC" = local currency)
|
Three Months Ended March 31, | ||||||||||||||||
| 2025 | 2024 | % Change in USD | % Change in LC | ||||||||||||||
| Net income attributable to common shareholders | $ | 55.3 | $ | 66.1 | (16) | % | (19) | % | |||||||||
Adjusted net income attributable to common shareholders1 |
111.6 | 86.0 | 30 | 28 | |||||||||||||
| Diluted earnings per share | $ | 1.14 | $ | 1.37 | (17) | % | (19) | % | |||||||||
Adjusted diluted earnings per share1 |
2.31 | 1.78 | 30 | 28 | |||||||||||||
Adjusted EBITDA1 |
$ | 224.8 | $ | 187.1 | 20 | % | 20 | % | |||||||||
| Effective tax rate ("ETR") | 19.5 | % | 19.5 | % | 0 bps | n/a | |||||||||||
|
($ in millions)
|
Three Months Ended March 31, | |||||||||||||
| 2025 | 2024 | Change in USD | ||||||||||||
| Cash flows from operating activities | $ | (767.6) | $ | (677.5) | (13) | % | ||||||||
Free Cash Flow6 |
(812.1) | (720.7) | (13) | % | ||||||||||
| Three Months Ended March 31, | ||||||||
| 2025 | 2024 | |||||||
| Total number of shares repurchased (in thousands) | 75.3 | 110.7 | ||||||
| Total paid for shares repurchased (in millions) | $ | 19.8 | $ | 20.1 | ||||
| March 31, 2025 | December 31, 2024 | March 31, 2024 | |||||||||||||||
| Total Net Debt (in millions) | $ | 1,754.0 | $ | 800.6 | $ | 1,900.8 | |||||||||||
| Net Leverage Ratio | 1.4x | 0.7x | 1.9x | ||||||||||||||
| Corporate Liquidity (in millions) | $ | 3,312.4 | $ | 3,616.3 | $ | 2,301.7 | |||||||||||
|
Real Estate Management Services
($ in millions, "LC" = local currency) |
Three Months Ended March 31, | % Change in USD | % Change in LC | ||||||||||||||||||||
| 2025 | 2024 | ||||||||||||||||||||||
| Revenue | $ | 4,569.4 | $ | 4,069.2 | 12 | % | 14 | % | |||||||||||||||
| Workplace Management | 3,263.6 | 2,871.7 | 14 | 15 | |||||||||||||||||||
| Project Management | 747.5 | 656.4 | 14 | 16 | |||||||||||||||||||
| Property Management | 445.6 | 429.7 | 4 | 5 | |||||||||||||||||||
| Portfolio Services and Other | 112.7 | 111.4 | 1 | 2 | |||||||||||||||||||
| Segment operating expenses | $ | 4,532.6 | $ | 4,027.2 | 13 | % | 14 | % | |||||||||||||||
| Segment platform operating expenses | 602.3 | 558.1 | 8 | 10 | |||||||||||||||||||
Gross contract costs6 |
3,930.3 | 3,469.1 | 13 | 15 | |||||||||||||||||||
Adjusted EBITDA1 |
$ | 66.3 | $ | 71.4 | (7) | % | (9) | % | |||||||||||||||
| Note: For discussion and reconciliation of non-GAAP financial measures, see the Notes following the Financial Statements in this news release. Percentage variances in the Performance Highlights below are calculated and presented on a local currency basis, unless otherwise noted. | |||||||||||||||||||||||
|
Leasing Advisory
($ in millions, "LC" = local currency) |
Three Months Ended March 31, | % Change in USD | % Change in LC | ||||||||||||||||||||
| 2025 | 2024 | ||||||||||||||||||||||
| Revenue | $ | 586.1 | $ | 520.4 | 13 | % | 13 | % | |||||||||||||||
| Leasing | 566.1 | 497.3 | 14 | 15 | |||||||||||||||||||
| Advisory, Consulting and Other | 20.0 | 23.1 | (13) | (12) | |||||||||||||||||||
| Segment operating expenses | $ | 501.2 | $ | 454.9 | 10 | % | 11 | % | |||||||||||||||
| Segment platform operating expenses | 499.2 | 448.5 | 11 | 12 | |||||||||||||||||||
Gross contract costs6 |
2.0 | 6.4 | (69) | (68) | |||||||||||||||||||
Adjusted EBITDA1 |
$ | 97.0 | $ | 74.8 | 30 | % | 29 | % | |||||||||||||||
| Note: For discussion and reconciliation of non-GAAP financial measures, see the Notes following the Financial Statements in this news release. Percentage variances in the Performance Highlights below are calculated and presented on a local currency basis, unless otherwise noted. | |||||||||||||||||||||||
|
Capital Markets Services
($ in millions, "LC" = local currency) |
Three Months Ended March 31, | % Change in USD | % Change in LC | ||||||||||||||||||||
| 2025 | 2024 | ||||||||||||||||||||||
| Revenue | $ | 435.3 | $ | 377.6 | 15 | % | 16 | % | |||||||||||||||
Investment Sales, Debt/Equity Advisory and Other, excluding Net non-cash MSR(a) |
325.5 | 267.7 | 22 | 22 | |||||||||||||||||||
Net non-cash MSR and mortgage banking derivative activity (a) |
(12.9) | (9.0) | (43) | (43) | |||||||||||||||||||
| Value and Risk Advisory | 81.6 | 80.2 | 2 | 4 | |||||||||||||||||||
| Loan Servicing | 41.1 | 38.7 | 6 | 6 | |||||||||||||||||||
| Segment operating expenses | $ | 420.2 | $ | 378.4 | 11 | % | 12 | % | |||||||||||||||
| Segment platform operating expenses | 419.1 | 364.8 | 15 | 16 | |||||||||||||||||||
Gross contract costs6 |
1.1 | 13.6 | (92) | (92) | |||||||||||||||||||
| Equity earnings | $ | 1.6 | $ | 0.1 | n.m. | n.m. | |||||||||||||||||
Adjusted EBITDA1 |
$ | 48.6 | $ | 25.0 | 94 | % | 90 | % | |||||||||||||||
| Note: For discussion and reconciliation of non-GAAP financial measures, see the Notes following the Financial Statements in this news release. Percentage variances in the Performance Highlights below are calculated and presented on a local currency basis, unless otherwise noted. | |||||||||||||||||||||||
| (a) Historically, net non-cash MSR and mortgage banking derivative activity was included in the Investment Sales, Debt/Equity Advisory and Other caption. Effective beginning Q2 2024, the net non-cash MSR and mortgage banking derivative activity revenue is separately presented in the above table and prior period financial information was recast to conform with this presentation. | |||||||||||||||||||||||
|
Investment Management
($ in millions, "LC" = local currency) |
Three Months Ended March 31, | % Change in USD | % Change in LC | ||||||||||||||||||||
| 2025 | 2024 | ||||||||||||||||||||||
| Revenue | $ | 98.5 | $ | 103.4 | (5) | % | (4) | % | |||||||||||||||
| Advisory fees | 89.3 | 92.3 | (3) | (2) | |||||||||||||||||||
| Transaction fees and other | 8.5 | 8.9 | (4) | (4) | |||||||||||||||||||
| Incentive fees | 0.7 | 2.2 | (68) | (67) | |||||||||||||||||||
| Segment operating expenses | $ | 85.7 | $ | 84.6 | 1 | % | 2 | % | |||||||||||||||
| Segment platform operating expenses | 77.5 | 76.2 | 2 | 3 | |||||||||||||||||||
Gross contract costs6 |
8.2 | 8.4 | (2) | (3) | |||||||||||||||||||
Adjusted EBITDA1 |
$ | 15.8 | $ | 21.0 | (25) | % | (22) | % | |||||||||||||||
| Note: For discussion and reconciliation of non-GAAP financial measures, see the Notes following the Financial Statements in this news release. Percentage variances in the Performance Highlights below are calculated and presented on a local currency basis, unless otherwise noted. | |||||||||||||||||||||||
| Quarter-to-date | |||||
| Beginning balance (December 31, 2024) | $ | 88.8 | |||
| Asset acquisitions/takeovers | 2.2 | ||||
| Asset dispositions/withdrawals | (3.7) | ||||
| Valuation changes | 0.2 | ||||
| Foreign currency translation | (2.8) | ||||
| Change in uncalled committed capital and cash held | (2.4) | ||||
| Ending balance (March 31, 2025) | $ | 82.3 | |||
| Trailing Twelve Months | |||||
| Beginning balance (March 31, 2024) | $ | 89.7 | |||
| Asset acquisitions/takeovers | 5.3 | ||||
| Asset dispositions/withdrawals | (7.0) | ||||
| Valuation changes | (0.1) | ||||
| Foreign currency translation | (2.2) | ||||
| Change in uncalled committed capital and cash held | (3.4) | ||||
| Ending balance (March 31, 2025) | $ | 82.3 | |||
|
Software and Technology Solutions
($ in millions, "LC" = local currency) |
Three Months Ended March 31, | % Change in USD | % Change in LC | ||||||||||||||||||||
| 2025 | 2024 | ||||||||||||||||||||||
| Revenue | $ | 57.1 | $ | 53.9 | 6 | % | 6 | % | |||||||||||||||
| Segment operating expenses | $ | 67.0 | $ | 63.5 | 6 | % | 6 | % | |||||||||||||||
| Segment platform operating expenses, excluding Carried interest | 68.7 | 62.4 | 10 | 10 | |||||||||||||||||||
Carried interest benefit(a) |
(2.4) | (0.1) | n.m. | n.m. | |||||||||||||||||||
Gross contract costs6 |
0.7 | 1.2 | (42) | (35) | |||||||||||||||||||
Adjusted EBITDA1 |
$ | (2.9) | $ | (5.1) | 43 | % | 37 | % | |||||||||||||||
| Note: For discussion and reconciliation of non-GAAP financial measures, see the Notes following the Financial Statements in this news release. Percentage variances in the Performance Highlights below are calculated and presented on a local currency basis, unless otherwise noted. | |||||||||||||||||||||||
| (a) Carried interest expense/benefit is associated with equity earnings/losses on Spark Venture Funds investments. | |||||||||||||||||||||||
| Connect with us |  |
||||
| Live Webcast | Conference Call | ||||||||||
|
Management will offer a live webcast for shareholders, analysts and investment professionals on Wednesday, May 7, 2025, at 9:00 a.m. Eastern. Following the live broadcast, an audio replay will be available.
The link to the live webcast and audio replay can be accessed at the Investor Relations website: ir.jll.com.
|
The conference call can be accessed live over the phone by dialing (888) 660-6392; the conference ID number is 5398158. Listeners are asked to please dial in 10 minutes prior to the call start time and provide the conference ID number to be connected. |
||||||||||
| Supplemental Information | Contact | ||||||||||
Supplemental information regarding the first quarter 2025 earnings call has been posted to the Investor Relations section of JLL's website: ir.jll.com. |
If you have any questions, please contact Sean Coghlan, Head of Investor Relations. |
||||||||||
Phone: |
+1 312 252 8943 | ||||||||||
Email: |
JLLInvestorRelations@jll.com
|
||||||||||
| JONES LANG LASALLE INCORPORATED | |||||||||||
| Consolidated Statements of Operations (Unaudited) | |||||||||||
| Three Months Ended March 31, | |||||||||||
| (in millions, except share and per share data) | 2025 | 2024 | |||||||||
| Revenue | $ | 5,746.4 | $ | 5,124.5 | |||||||
| Operating expenses: | |||||||||||
| Compensation and benefits | $ | 2,674.6 | $ | 2,415.6 | |||||||
| Operating, administrative and other | 2,860.5 | 2,532.0 | |||||||||
| Depreciation and amortization | 71.6 | 61.0 | |||||||||
Restructuring and acquisition charges5 |
19.7 | 1.7 | |||||||||
| Total operating expenses | $ | 5,626.4 | $ | 5,010.3 | |||||||
| Operating income | $ | 120.0 | $ | 114.2 | |||||||
| Interest expense, net of interest income | 24.6 | 30.5 | |||||||||
| Equity losses | (25.6) | (3.7) | |||||||||
| Other income | 1.7 | 1.5 | |||||||||
| Income before income taxes and noncontrolling interest | 71.5 | 81.5 | |||||||||
| Income tax provision | 14.0 | 15.9 | |||||||||
| Net income | 57.5 | 65.6 | |||||||||
Net income (loss) attributable to noncontrolling interest |
2.2 | (0.5) | |||||||||
| Net income attributable to common shareholders | $ | 55.3 | $ | 66.1 | |||||||
| Basic earnings per common share | $ | 1.17 | $ | 1.39 | |||||||
| Basic weighted average shares outstanding (in 000's) | 47,466 | 47,485 | |||||||||
| Diluted earnings per common share | $ | 1.14 | $ | 1.37 | |||||||
| Diluted weighted average shares outstanding (in 000's) | 48,376 | 48,280 | |||||||||
| Please reference accompanying financial statement notes. | |||||||||||
| JONES LANG LASALLE INCORPORATED | |||||||||||
| Selected Segment Financial Data (Unaudited) | |||||||||||
| Three Months Ended March 31, | |||||||||||
| (in millions) | 2025 | 2024 | |||||||||
| Real Estate Management Services | |||||||||||
| Revenue | $ | 4,569.4 | $ | 4,069.2 | |||||||
| Platform compensation and benefits | $ | 431.6 | $ | 400.5 | |||||||
| Platform operating, administrative and other | 139.2 | 128.6 | |||||||||
| Depreciation and amortization | 31.5 | 29.0 | |||||||||
| Segment platform operating expenses | 602.3 | 558.1 | |||||||||
Gross contract costs6 |
3,930.3 | 3,469.1 | |||||||||
| Segment operating expenses | $ | 4,532.6 | $ | 4,027.2 | |||||||
| Segment operating income | $ | 36.8 | $ | 42.0 | |||||||
| Add: | |||||||||||
| Equity earnings | 0.4 | 1.1 | |||||||||
Depreciation and amortization(a) |
30.6 | 28.0 | |||||||||
| Net (income) loss attributable to noncontrolling interest | (1.5) | 0.3 | |||||||||
Adjusted EBITDA1 |
$ | 66.3 | $ | 71.4 | |||||||
| (a) This adjustment excludes the noncontrolling interest portion of amortization of acquisition-related intangibles which is not attributable to common shareholders. | |||||||||||
| JONES LANG LASALLE INCORPORATED | |||||||||||
| Selected Segment Financial Data (Unaudited) Continued | |||||||||||
| Three Months Ended March 31, | |||||||||||
| (in millions) | 2025 | 2024 | |||||||||
| Leasing Advisory | |||||||||||
| Revenue | $ | 586.1 | $ | 520.4 | |||||||
| Platform compensation and benefits | $ | 426.8 | $ | 381.8 | |||||||
| Platform operating, administrative and other | 60.4 | 57.6 | |||||||||
| Depreciation and amortization | 12.0 | 9.1 | |||||||||
| Segment platform operating expenses | 499.2 | 448.5 | |||||||||
Gross contract costs6 |
2.0 | 6.4 | |||||||||
| Segment operating expenses | $ | 501.2 | $ | 454.9 | |||||||
| Segment operating income | $ | 84.9 | $ | 65.5 | |||||||
| Add: | |||||||||||
| Depreciation and amortization | 12.0 | 9.1 | |||||||||
| Other income | 1.0 | 0.9 | |||||||||
| Adjustments: | |||||||||||
| Interest on employee loans, net of forgiveness | (0.9) | (0.7) | |||||||||
Adjusted EBITDA1 |
$ | 97.0 | $ | 74.8 | |||||||
| JONES LANG LASALLE INCORPORATED | |||||||||||
| Selected Segment Financial Data (Unaudited) Continued | |||||||||||
| Three Months Ended March 31, | |||||||||||
| (in millions) | 2025 | 2024 | |||||||||
| Capital Markets Services | |||||||||||
| Revenue | $ | 435.3 | $ | 377.6 | |||||||
| Platform compensation and benefits | $ | 329.5 | $ | 287.6 | |||||||
| Platform operating, administrative and other | 70.7 | 60.8 | |||||||||
| Depreciation and amortization | 18.9 | 16.4 | |||||||||
| Segment platform operating expenses | 419.1 | 364.8 | |||||||||
Gross contract costs6 |
1.1 | 13.6 | |||||||||
| Segment operating expenses | $ | 420.2 | $ | 378.4 | |||||||
| Segment operating income (loss) | $ | 15.1 | $ | (0.8) | |||||||
| Add: | |||||||||||
| Equity earnings | 1.6 | 0.1 | |||||||||
| Depreciation and amortization | 18.9 | 16.4 | |||||||||
| Other income | 0.8 | 0.6 | |||||||||
| Adjustments: | |||||||||||
| Net non-cash MSR and mortgage banking derivative activity | 12.9 | 9.0 | |||||||||
| Interest on employee loans, net of forgiveness | (0.7) | (0.3) | |||||||||
Adjusted EBITDA1 |
$ | 48.6 | $ | 25.0 | |||||||
| JONES LANG LASALLE INCORPORATED | |||||||||||
| Selected Segment Financial Data (Unaudited) Continued | |||||||||||
| Three Months Ended March 31, | |||||||||||
| (in millions) | 2025 | 2024 | |||||||||
| Investment Management | |||||||||||
| Revenue | $ | 98.5 | $ | 103.4 | |||||||
| Platform compensation and benefits | $ | 58.3 | $ | 61.3 | |||||||
| Platform operating, administrative and other | 16.3 | 12.9 | |||||||||
| Depreciation and amortization | 2.9 | 2.0 | |||||||||
| Segment platform operating expenses | 77.5 | 76.2 | |||||||||
Gross contract costs6 |
8.2 | 8.4 | |||||||||
| Segment operating expenses | $ | 85.7 | $ | 84.6 | |||||||
| Segment operating income | $ | 12.8 | $ | 18.8 | |||||||
| Add: | |||||||||||
| Depreciation and amortization | 2.9 | 2.0 | |||||||||
| Other income | 0.1 | — | |||||||||
Net loss attributable to noncontrolling interest(a) |
— | 0.2 | |||||||||
Adjusted EBITDA1 |
$ | 15.8 | $ | 21.0 | |||||||
| Equity losses | $ | (6.1) | $ | (3.9) | |||||||
| (a) This adjustment excludes the noncontrolling interest portion of Equity earnings which is not attributable to common shareholders. | |||||||||||
| JONES LANG LASALLE INCORPORATED | |||||||||||
| Selected Segment Financial Data (Unaudited) Continued | |||||||||||
| Three Months Ended March 31, | |||||||||||
| (in millions) | 2025 | 2024 | |||||||||
| Software and Technology Solutions | |||||||||||
| Revenue | $ | 57.1 | $ | 53.9 | |||||||
Platform compensation and benefits(a) |
$ | 45.5 | $ | 47.3 | |||||||
| Platform operating, administrative and other | 14.5 | 10.5 | |||||||||
| Depreciation and amortization | 6.3 | 4.5 | |||||||||
| Segment platform operating expenses | 66.3 | 62.3 | |||||||||
Gross contract costs6 |
0.7 | 1.2 | |||||||||
| Segment operating expenses | $ | 67.0 | $ | 63.5 | |||||||
| Segment operating loss | $ | (9.9) | $ | (9.6) | |||||||
| Add: | |||||||||||
| Depreciation and amortization | 6.3 | 4.5 | |||||||||
| Other income | (0.2) | — | |||||||||
| Net income attributable to noncontrolling interest | 0.4 | — | |||||||||
| Adjustments: | |||||||||||
| Credit losses on convertible note investments | 0.5 | — | |||||||||
Adjusted EBITDA1 |
$ | (2.9) | $ | (5.1) | |||||||
| Equity losses | $ | (21.5) | $ | (1.0) | |||||||
(a) Included in Segment platform operating expenses is a carried interest benefit of $2.4 million and $0.1 million for the three months ended March 31, 2025 and 2024, respectively. Carried interest expense (benefit) is associated with equity earnings/losses on Spark Venture Funds investments. | |||||||||||
| JONES LANG LASALLE INCORPORATED | ||||||||||||||||||||||||||
| Consolidated Statement of Cash Flows (Unaudited) | ||||||||||||||||||||||||||
| Three Months Ended March 31, | Three Months Ended March 31, | |||||||||||||||||||||||||
| (in millions) | 2025 | 2024 | 2025 | 2024 | ||||||||||||||||||||||
| Cash flows from operating activities: | Cash flows from investing activities: | |||||||||||||||||||||||||
| Net income | $ | 57.5 | $ | 65.6 | Net capital additions – property and equipment | $ | (44.5) | $ | (43.2) | |||||||||||||||||
| Reconciliation of net income to net cash used in operating activities: | Capital contributions to investments | (112.9) | (17.4) | |||||||||||||||||||||||
| Depreciation and amortization | 71.6 | 61.0 | Distributions of capital from investments | 4.9 | 5.7 | |||||||||||||||||||||
| Equity losses | 25.6 | 3.7 | Other, net | (0.3) | 0.6 | |||||||||||||||||||||
| Distributions of earnings from investments | 1.6 | 3.2 | Net cash used in investing activities | (152.8) | (54.3) | |||||||||||||||||||||
| Provision for loss on receivables and other assets | 9.4 | 9.9 | Cash flows from financing activities: | |||||||||||||||||||||||
| Amortization of stock-based compensation | 22.0 | 11.2 | Proceeds from borrowings under credit facility | 2,232.0 | 2,760.0 | |||||||||||||||||||||
| Net non-cash mortgage servicing rights and mortgage banking derivative activity | 12.9 | 9.0 | Repayments of borrowings under credit facility | (1,912.0) | (1,990.0) | |||||||||||||||||||||
| Accretion of interest and amortization of debt issuance costs | 1.7 | 1.4 | Proceeds from issuance of commercial paper | 1,000.0 | — | |||||||||||||||||||||
| Other, net | 6.9 | (8.6) | Repayments of commercial paper | (300.0) | — | |||||||||||||||||||||
| Change in: | Net repayments of short-term borrowings | (67.2) | (18.7) | |||||||||||||||||||||||
| Receivables | 163.5 | 156.2 | Payments of deferred business acquisition obligations and earn-outs | (0.6) | (3.1) | |||||||||||||||||||||
| Reimbursable receivables and reimbursable payables | (271.8) | (193.4) | Repurchase of common stock | (19.7) | (20.0) | |||||||||||||||||||||
| Prepaid expenses and other assets | (24.0) | (18.7) | Noncontrolling interest distributions, net | (2.9) | (1.5) | |||||||||||||||||||||
| Income taxes receivable, payable and deferred | (22.7) | (24.4) | Other, net | (28.9) | (23.3) | |||||||||||||||||||||
| Accounts payable, accrued liabilities and other liabilities | (171.3) | (154.5) | Net cash provided by financing activities | 900.7 | 703.4 | |||||||||||||||||||||
| Accrued compensation (including net deferred compensation) | (650.5) | (599.1) | Effect of currency exchange rate changes on cash, cash equivalents and restricted cash | 11.7 | (9.7) | |||||||||||||||||||||
| Net cash used in operating activities | $ | (767.6) | $ | (677.5) | Net change in cash, cash equivalents and restricted cash | $ | (8.0) | $ | (38.1) | |||||||||||||||||
| Cash, cash equivalents and restricted cash, beginning of the period | 652.7 | 663.4 | ||||||||||||||||||||||||
| Cash, cash equivalents and restricted cash, end of the period | $ | 644.7 | $ | 625.3 | ||||||||||||||||||||||
| . | ||||||||||||||||||||||||||
| Please reference accompanying financial statement notes. | ||||||||||||||||||||||||||
| JONES LANG LASALLE INCORPORATED | ||||||||||||||||||||||||||||||||||||||
| Consolidated Balance Sheets | ||||||||||||||||||||||||||||||||||||||
| March 31, | December 31, | March 31, | December 31, | |||||||||||||||||||||||||||||||||||
| (in millions, except share and per share data) | 2025 | 2024 | 2025 | 2024 | ||||||||||||||||||||||||||||||||||
| ASSETS | (Unaudited) | LIABILITIES AND EQUITY | (Unaudited) | |||||||||||||||||||||||||||||||||||
| Current assets: | Current liabilities: | |||||||||||||||||||||||||||||||||||||
| Cash and cash equivalents | $ | 432.4 | $ | 416.3 | Accounts payable and accrued liabilities | $ | 1,201.4 | $ | 1,322.7 | |||||||||||||||||||||||||||||
| Trade receivables, net of allowance | 2,013.3 | 2,153.5 | Reimbursable payables | 2,038.0 | 2,176.3 | |||||||||||||||||||||||||||||||||
| Notes and other receivables | 457.4 | 456.9 | Accrued compensation and benefits | 1,162.8 | 1,768.5 | |||||||||||||||||||||||||||||||||
| Reimbursable receivables | 2,833.9 | 2,695.0 | Short-term borrowings | 88.3 | 153.8 | |||||||||||||||||||||||||||||||||
| Warehouse receivables | 601.6 | 770.7 | Commercial paper, net of debt issuance costs | 898.3 | 199.3 | |||||||||||||||||||||||||||||||||
| Short-term contract assets, net of allowance | 314.8 | 334.8 | Short-term contract liability and deferred income | 187.7 | 203.8 | |||||||||||||||||||||||||||||||||
| Restricted cash, prepaid and other | 580.3 | 651.3 | Warehouse facilities | 600.7 | 841.0 | |||||||||||||||||||||||||||||||||
| Total current assets | 7,233.7 | 7,478.5 | Short-term operating lease liability | 155.5 | 157.2 | |||||||||||||||||||||||||||||||||
| Property and equipment, net of accumulated depreciation | 585.9 | 598.1 | Other | 294.0 | 321.9 | |||||||||||||||||||||||||||||||||
| Operating lease right-of-use asset | 737.6 | 743.1 | Total current liabilities | 6,626.7 | 7,144.5 | |||||||||||||||||||||||||||||||||
| Goodwill | 4,642.5 | 4,611.3 | Noncurrent liabilities: | |||||||||||||||||||||||||||||||||||
| Identified intangibles, net of accumulated amortization | 701.8 | 724.1 | Credit facility, net of debt issuance costs | 409.3 | 88.6 | |||||||||||||||||||||||||||||||||
| Investments | 902.4 | 812.7 | Long-term debt, net of debt issuance costs | 772.1 | 756.7 | |||||||||||||||||||||||||||||||||
| Long-term receivables | 387.6 | 394.7 | Long-term deferred tax liabilities, net | 45.5 | 45.6 | |||||||||||||||||||||||||||||||||
| Deferred tax assets, net | 539.5 | 518.2 | Deferred compensation | 649.1 | 665.4 | |||||||||||||||||||||||||||||||||
| Deferred compensation plans | 673.4 | 664.0 | Long-term operating lease liability | 754.2 | 748.8 | |||||||||||||||||||||||||||||||||
| Other | 226.7 | 219.1 | Other | 412.1 | 419.1 | |||||||||||||||||||||||||||||||||
| Total assets | $ | 16,631.1 | $ | 16,763.8 | Total liabilities | $ | 9,669.0 | $ | 9,868.7 | |||||||||||||||||||||||||||||
| Company shareholders' equity | ||||||||||||||||||||||||||||||||||||||
| Common stock | 0.5 | 0.5 | ||||||||||||||||||||||||||||||||||||
| Additional paid-in capital | 2,001.9 | 2,032.7 | ||||||||||||||||||||||||||||||||||||
| Retained earnings | 6,383.0 | 6,334.9 | ||||||||||||||||||||||||||||||||||||
| Treasury stock | (923.5) | (937.9) | ||||||||||||||||||||||||||||||||||||
| Shares held in trust | (12.1) | (11.8) | ||||||||||||||||||||||||||||||||||||
| Accumulated other comprehensive loss | (610.6) | (646.9) | ||||||||||||||||||||||||||||||||||||
| Total company shareholders' equity | 6,839.2 | 6,771.5 | ||||||||||||||||||||||||||||||||||||
| Noncontrolling interest | 122.9 | 123.6 | ||||||||||||||||||||||||||||||||||||
| Total equity | 6,962.1 | 6,895.1 | ||||||||||||||||||||||||||||||||||||
| Total liabilities and equity | $ | 16,631.1 | $ | 16,763.8 | ||||||||||||||||||||||||||||||||||
| Please reference accompanying financial statement notes. | ||||||||||||||||||||||||||||||||||||||
| Three Months Ended March 31, | |||||||||||
| (in millions) | 2025 | 2024 | |||||||||
| Net income attributable to common shareholders | $ | 55.3 | $ | 66.1 | |||||||
| Add: | |||||||||||
| Interest expense, net of interest income | 24.6 | 30.5 | |||||||||
| Income tax provision | 14.0 | 15.9 | |||||||||
Depreciation and amortization(a) |
70.7 | 60.0 | |||||||||
| Adjustments: | |||||||||||
Restructuring and acquisition charges5 |
19.7 | 1.7 | |||||||||
| Net non-cash MSR and mortgage banking derivative activity | 12.9 | 9.0 | |||||||||
| Interest on employee loans, net of forgiveness | (1.6) | (1.0) | |||||||||
Equity losses - Investment Management and Software and Technology Solutions(a) |
28.7 | 4.9 | |||||||||
Credit losses on convertible note investments |
0.5 | — | |||||||||
| Adjusted EBITDA | $ | 224.8 | $ | 187.1 | |||||||
| Three Months Ended March 31, | |||||||||||
| (In millions, except share and per share data) | 2025 | 2024 | |||||||||
| Net income attributable to common shareholders | $ | 55.3 | $ | 66.1 | |||||||
| Diluted shares (in thousands) | 48,376 | 48,280 | |||||||||
| Diluted earnings per share | $ | 1.14 | $ | 1.37 | |||||||
| Net income attributable to common shareholders | $ | 55.3 | $ | 66.1 | |||||||
| Adjustments: | |||||||||||
Restructuring and acquisition charges5 |
19.7 | 1.7 | |||||||||
| Net non-cash MSR and mortgage banking derivative activity | 12.9 | 9.0 | |||||||||
Amortization of acquisition-related intangibles(a) |
16.1 | 15.2 | |||||||||
| Interest on employee loans, net of forgiveness | (1.6) | (1.0) | |||||||||
Equity losses - Investment Management and Software and Technology Solutions(a) |
28.7 | 4.9 | |||||||||
Credit losses on convertible note investments |
0.5 | — | |||||||||
Tax impact of adjusted items(b) |
(20.0) | (9.9) | |||||||||
| Adjusted net income attributable to common shareholders | $ | 111.6 | $ | 86.0 | |||||||
| Diluted shares (in thousands) | 48,376 | 48,280 | |||||||||
| Adjusted diluted earnings per share | $ | 2.31 | $ | 1.78 | |||||||
| Three Months Ended March 31, | |||||||||||
| ($ in millions) | 2025 | % Change | |||||||||
| Revenue: | |||||||||||
| At current period exchange rates | $ | 5,746.4 | 12 | % | |||||||
| Impact of change in exchange rates | 60.4 | n/a | |||||||||
| At comparative period exchange rates | $ | 5,806.8 | 13 | % | |||||||
| Operating income: | |||||||||||
| At current period exchange rates | $ | 120.0 | 5 | % | |||||||
| Impact of change in exchange rates | (1.3) | n/a | |||||||||
| At comparative period exchange rates | $ | 118.7 | 4 | % | |||||||
| Adjusted EBITDA: | |||||||||||
| At current period exchange rates | $ | 224.8 | 20 | % | |||||||
| Impact of change in exchange rates | (0.5) | n/a | |||||||||
| At comparative period exchange rates | $ | 224.3 | 20 | % | |||||||
| Three Months Ended March 31, | |||||||||||
| (in millions) | 2025 | 2024 | |||||||||
| Severance and other employment-related charges | $ | 7.4 | $ | 4.5 | |||||||
| Restructuring, pre-acquisition and post-acquisition charges | 8.4 | 7.7 | |||||||||
| Fair value adjustments that resulted in a net (decrease) increase to earn-out liabilities from prior-period acquisition activity | 3.9 | (10.5) | |||||||||
| Total Restructuring and acquisition charges | $ | 19.7 | $ | 1.7 | |||||||
| ($ in millions) | March 31, 2025 | December 31, 2024 | March 31, 2024 | ||||||||||||||
| Total debt | $ | 2,186.4 | $ | 1,216.9 | $ | 2,297.5 | |||||||||||
| Less: Cash and cash equivalents | 432.4 | 416.3 | 396.7 | ||||||||||||||
| Net Debt | $ | 1,754.0 | $ | 800.6 | $ | 1,900.8 | |||||||||||
| Divided by: Trailing twelve-month Adjusted EBITDA | $ | 1,224.0 | $ | 1,186.3 | $ | 1,012.6 | |||||||||||
| Net Leverage Ratio | 1.4x | 0.7x | 1.9x | ||||||||||||||
| Three Months Ended March 31, | |||||||||||
| (in millions) | 2025 | 2024 | |||||||||
| Net cash used in operating activities | $ | (767.6) | $ | (677.5) | |||||||
| Net capital additions - property and equipment | (44.5) | (43.2) | |||||||||
| Free Cash Flow | $ | (812.1) | $ | (720.7) | |||||||
| Three Months Ended March 31, 2025 | |||||||||||||||||||||||||||||||||||||||||||||||||||||||||||||||||||||||
| (in millions) | Real Estate Management Services | Leasing Advisory | Capital Markets Services | ||||||||||||||||||||||||||||||||||||||||||||||||||||||||||||||||||||
| Workplace Mgmt | Project Mgmt | Property Mgmt | Portfolio Services and Other | Total Real Estate Mgmt Services | Leasing | Advisory, Consulting and Other | Total Leasing Advisory | Invt Sales, Debt/Equity Advisory and Other | Value and Risk Advisory | Loan Servicing | Total Capital Markets Services | Investment Mgmt | Software and Tech Solutions | Total | |||||||||||||||||||||||||||||||||||||||||||||||||||||||||
Revenue(a) |
$ | 3,263.6 | 747.5 | 445.6 | 112.7 | $ | 4,569.4 | $ | 566.1 | 20.0 | $ | 586.1 | $ | 312.6 | 81.6 | 41.1 | $ | 435.3 | $ | 98.5 | $ | 57.1 | $ | 5,746.4 | |||||||||||||||||||||||||||||||||||||||||||||||
Gross contract costs6 |
$ | 3,040.6 | 520.0 | 312.4 | 57.3 | $ | 3,930.3 | $ | 1.2 | 0.8 | $ | 2.0 | $ | 0.5 | 0.6 | — | $ | 1.1 | $ | 8.2 | $ | 0.7 | $ | 3,942.3 | |||||||||||||||||||||||||||||||||||||||||||||||
| Platform operating expenses | $ | 602.3 | $ | 499.2 | $ | 419.1 | $ | 77.5 | $ | 66.3 | $ | 1,664.4 | |||||||||||||||||||||||||||||||||||||||||||||||||||||||||||
Adjusted EBITDA1 |
$ | 66.3 | $ | 97.0 | $ | 48.6 | $ | 15.8 | $ | (2.9) | $ | 224.8 | |||||||||||||||||||||||||||||||||||||||||||||||||||||||||||
| Three Months Ended March 31, 2024 | |||||||||||||||||||||||||||||||||||||||||||||||||||||||||||||||||||||||
| (in millions) | Real Estate Management Services | Leasing Advisory | Capital Markets Services | ||||||||||||||||||||||||||||||||||||||||||||||||||||||||||||||||||||
| Workplace Mgmt | Project Mgmt | Property Mgmt | Portfolio Services and Other | Total Real Estate Mgmt Services | Leasing | Advisory, Consulting and Other | Total Leasing Advisory | Invt Sales, Debt/Equity Advisory and Other | Value and Risk Advisory | Loan Servicing | Total Capital Markets Services | Investment Mgmt | Software and Tech Solutions | Total | |||||||||||||||||||||||||||||||||||||||||||||||||||||||||
Revenue(a) |
$ | 2,871.7 | 656.4 | 429.7 | 111.4 | $ | 4,069.2 | $ | 497.3 | 23.1 | $ | 520.4 | $ | 258.7 | 80.2 | 38.7 | $ | 377.6 | $ | 103.4 | $ | 53.9 | $ | 5,124.5 | |||||||||||||||||||||||||||||||||||||||||||||||
Gross contract costs6 |
$ | 2,663.1 | 445.9 | 298.5 | 61.6 | $ | 3,469.1 | $ | 4.2 | 2.2 | $ | 6.4 | $ | 11.1 | 2.5 | — | $ | 13.6 | $ | 8.4 | $ | 1.2 | $ | 3,498.7 | |||||||||||||||||||||||||||||||||||||||||||||||
| Platform operating expenses | $ | 558.1 | $ | 448.5 | $ | 364.8 | $ | 76.2 | $ | 62.3 | $ | 1,509.9 | |||||||||||||||||||||||||||||||||||||||||||||||||||||||||||
Adjusted EBITDA1 |
$ | 71.4 | $ | 74.8 | $ | 25.0 | $ | 21.0 | $ | (5.1) | $ | 187.1 | |||||||||||||||||||||||||||||||||||||||||||||||||||||||||||