
| Maryland | 001-13145 | 36-4150422 | ||||||||||||
| (State or other jurisdiction | (Commission File Number) | (I.R.S. Employer | ||||||||||||
| of incorporation or organization) | Identification No.) | |||||||||||||
| 200 East Randolph Drive, | Chicago, | IL | 60601 | |||||||||||||||||||||||
| (Address of principal executive offices) | (Zip Code) | |||||||||||||||||||||||||
| Registrant's telephone number, including area code: | (312) | 782-5800 | ||||||||||||||||||||||||
Former name or former address, if changed since last report: Not Applicable |
||||||||||||||||||||||||||
| ☐ | Written communications pursuant to Rule 425 under Securities Act (17 CFR 230.425) | ||||
| ☐ | Soliciting material pursuant to Rule 14a-12 under the Exchange Act (17 CFR 240.14a-12) | ||||
| ☐ | Pre-commencement communications pursuant to Rule 14d-2(b) under the Exchange Act (17 CFR 240.14d-2(b)) | ||||
| ☐ | Pre-commencement communications pursuant to Rule 13e-4(c) under the Exchange Act (17 CFR 240.13e-4(c)) | ||||
| Title of each class | Trading Symbol | Name of each exchange on which registered | ||||||||||||
| Common Stock, par value $0.01 | JLL | The New York Stock Exchange | ||||||||||||
| News release issued by Jones Lang LaSalle Incorporated on August 6, 2024 announcing its | |||||
| financial results for the second quarter ended June 30, 2024. | |||||
| 104 | Cover Page Interactive Data File (embedded within the Inline XBRL document) | ||||
| Dated: August 6, 2024 | |||||||||||
| Jones Lang LaSalle Incorporated | |||||||||||
| By: /s/ Karen Brennan | |||||||||||
| Name: Karen Brennan | |||||||||||
| Title: Chief Financial Officer | |||||||||||
| News Release |  |
|||||||||||||
|
Summary Financial Results
($ in millions, except per share data, “LC” = local currency)
|
Three Months Ended June 30, | Six Months Ended June 30, | |||||||||||||||||||||||||||||||||
| 2024 | 2023 | % Change in USD | % Change in LC | 2024 | 2023 | % Change in USD | % Change in LC | ||||||||||||||||||||||||||||
| Revenue | $ | 5,628.7 | $ | 5,052.5 | 11 | % | 12 | % | $ | 10,753.2 | $ | 9,768.0 | 10 | % | 10 | % | |||||||||||||||||||
| Net income (loss) attributable to common shareholders | $ | 84.4 | $ | 2.5 | n.m. | n.m. | $ | 150.5 | $ | (6.7) | n.m. | n.m. | |||||||||||||||||||||||
Adjusted net income attributable to common shareholders1 |
123.2 | 102.2 | 21 | % | 23 | % | 209.2 | 136.4 | 53 | % | 59 | % | |||||||||||||||||||||||
| Diluted earnings (loss) per share | $ | 1.75 | $ | 0.05 | n.m. | n.m. | $ | 3.12 | $ | (0.14) | n.m. | n.m. | |||||||||||||||||||||||
Adjusted diluted earnings per share1 |
2.55 | 2.12 | 20 | % | 23 | % | 4.33 | 2.82 | 54 | % | 59 | % | |||||||||||||||||||||||
Adjusted EBITDA1 |
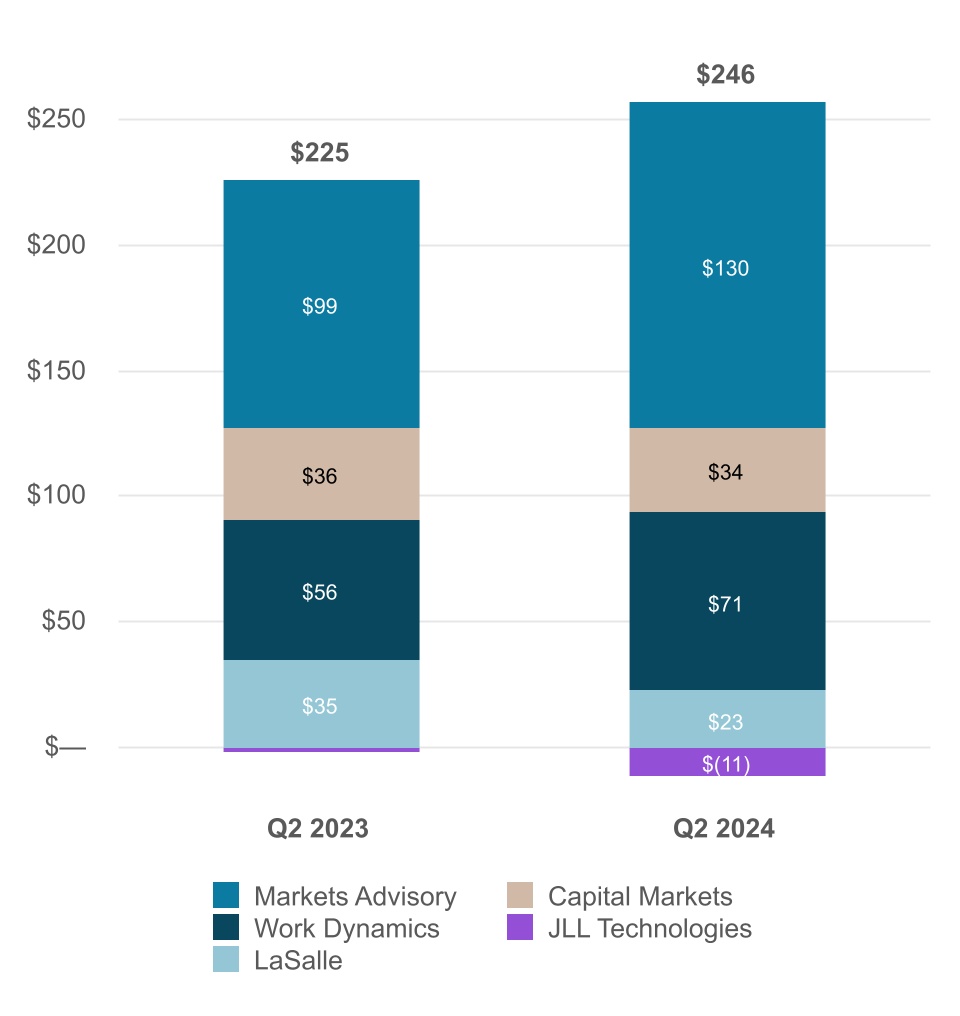
$ | 246.3 | $ | 225.1 | 9 | % | 11 | % | $ | 433.4 | $ | 338.0 | 28 | % | 31 | % | |||||||||||||||||||
| Cash flows from operating activities | $ | 273.9 | $ | 237.0 | 16 | % | n/a | $ | (403.6) | $ | (479.3) | 16 | % | n/a | |||||||||||||||||||||
Free Cash Flow5 |
235.7 | 198.1 | 19 | % | n/a | (485.0) | (567.5) | 15 | % | n/a | |||||||||||||||||||||||||
|
Consolidated
($ in millions, “LC” = local currency) |
Three Months Ended June 30, | % Change in USD | % Change in LC | Six Months Ended June 30, | % Change in USD | % Change in LC | |||||||||||||||||||||||||||||||||||||||||
| 2024 | 2023 | 2024 | 2023 | ||||||||||||||||||||||||||||||||||||||||||||
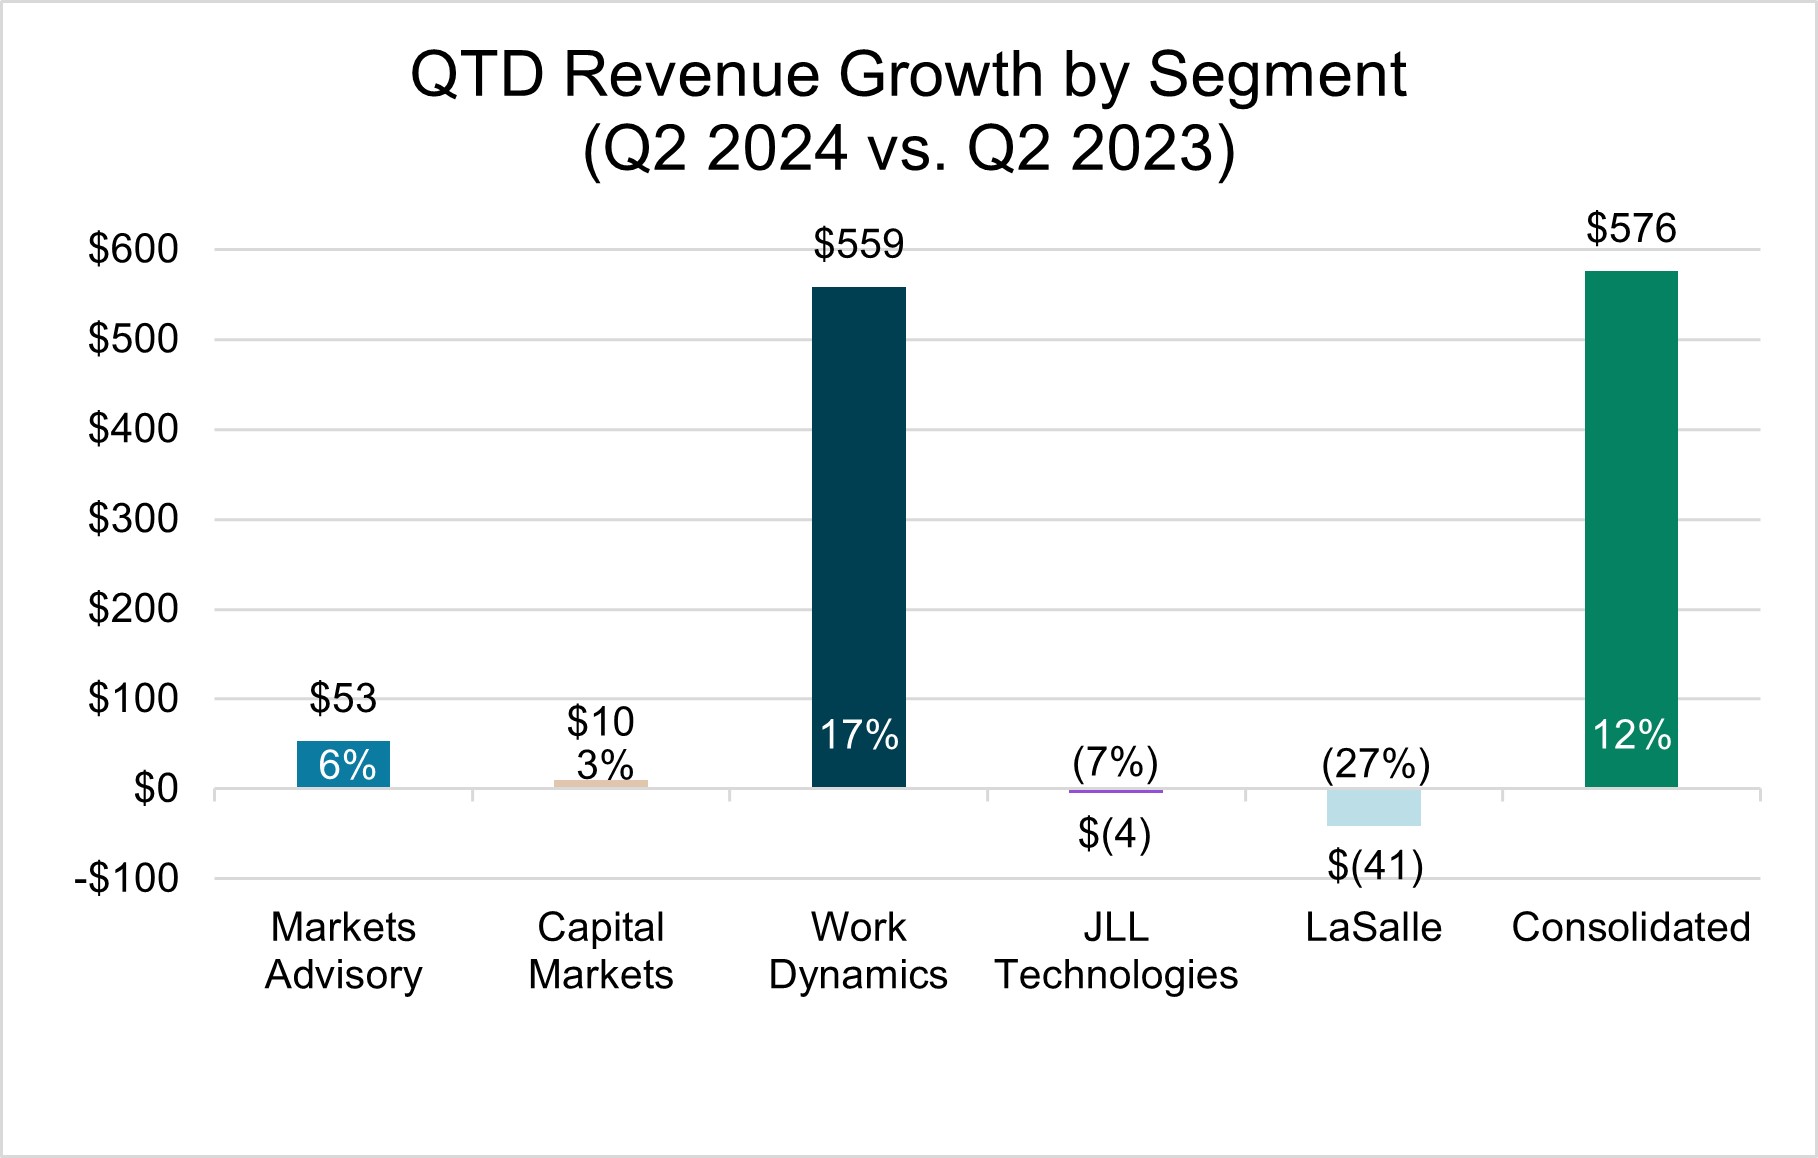
| Markets Advisory | $ | 1,078.8 | $ | 1,025.4 | 5 | % | 6 | % | $ | 2,028.9 | $ | 1,931.8 | 5 | % | 5 | % | |||||||||||||||||||||||||||||||
| Capital Markets | 457.6 | 448.0 | 2 | 3 | 835.2 | 805.1 | 4 | 4 | |||||||||||||||||||||||||||||||||||||||
| Work Dynamics | 3,933.3 | 3,374.6 | 17 | 17 | 7,572.8 | 6,650.8 | 14 | 14 | |||||||||||||||||||||||||||||||||||||||
| JLL Technologies | 56.4 | 60.6 | (7) | (7) | 110.3 | 122.0 | (10) | (10) | |||||||||||||||||||||||||||||||||||||||
| LaSalle | 102.6 | 143.9 | (29) | (27) | 206.0 | 258.3 | (20) | (19) | |||||||||||||||||||||||||||||||||||||||
| Total revenue | $ | 5,628.7 | $ | 5,052.5 | 11 | % | 12 | % | $ | 10,753.2 | $ | 9,768.0 | 10 | % | 10 | % | |||||||||||||||||||||||||||||||
Gross contract costs5 |
$ | 3,747.4 | $ | 3,205.8 | 17 | % | 18 | % | $ | 7,246.1 | $ | 6,339.1 | 14 | % | 15 | % | |||||||||||||||||||||||||||||||
| Platform operating expenses | 1,717.4 | 1,685.7 | 2 | 2 | 3,227.3 | 3,214.4 | — | 1 | |||||||||||||||||||||||||||||||||||||||
Restructuring and acquisition charges4 |
11.5 | 11.8 | (3) | (2) | 13.2 | 47.5 | (72) | (72) | |||||||||||||||||||||||||||||||||||||||
| Total operating expenses | $ | 5,476.3 | $ | 4,903.3 | 12 | % | 12 | % | $ | 10,486.6 | $ | 9,601.0 | 9 | % | 10 | % | |||||||||||||||||||||||||||||||
Net non-cash MSR and mortgage banking derivative activity1 |
$ | (11.8) | $ | (0.6) | n.m. | n.m. | $ | (20.8) | $ | (2.4) | (767) | % | (753) | % | |||||||||||||||||||||||||||||||||
Adjusted EBITDA1 |
$ | 246.3 | $ | 225.1 | 9 | % | 11 | % | $ | 433.4 | $ | 338.0 | 28 | % | 31 | % | |||||||||||||||||||||||||||||||
Note: For discussion and reconciliation of non-GAAP financial measures, see the Notes following the Financial Statements in this news release. Percentage variances in the Performance Highlights below are calculated and presented on a local currency basis, unless otherwise noted. | |||||||||||||||||||||||||||||||||||||||||||||||
| June 30, 2024 | March 31, 2024 | June 30, 2023 | |||||||||||||||
| Total Net Debt (in millions) | $ | 1,752.0 | 1,900.8 | 1,941.5 | |||||||||||||
| Net Leverage Ratio | 1.7x | 1.9x | 2.0x | ||||||||||||||
| Corporate Liquidity (in millions) | $ | 2,449.4 | 2,301.7 | 1,902.5 | |||||||||||||
|
Markets Advisory
($ in millions, “LC” = local currency) |
Three Months Ended June 30, | % Change in USD | % Change in LC | Six Months Ended June 30, | % Change in USD | % Change in LC | |||||||||||||||||||||||||||||||||||||||||
| 2024 | 2023 | 2024 | 2023 | ||||||||||||||||||||||||||||||||||||||||||||
| Revenue | $ | 1,078.8 | $ | 1,025.4 | 5 | % | 6 | % | $ | 2,028.9 | $ | 1,931.8 | 5 | % | 5 | % | |||||||||||||||||||||||||||||||
| Leasing | 619.1 | 591.4 | 5 | 5 | 1,116.4 | 1,078.4 | 4 | 4 | |||||||||||||||||||||||||||||||||||||||
| Property Management | 436.6 | 409.9 | 7 | 8 | 866.3 | 810.1 | 7 | 8 | |||||||||||||||||||||||||||||||||||||||
| Advisory, Consulting and Other | 23.1 | 24.1 | (4) | (3) | 46.2 | 43.3 | 7 | 7 | |||||||||||||||||||||||||||||||||||||||
| Segment operating expenses | $ | 965.6 | $ | 941.4 | 3 | % | 3 | % | $ | 1,837.3 | $ | 1,792.2 | 3 | % | 3 | % | |||||||||||||||||||||||||||||||
| Segment platform operating expenses | 652.9 | 657.1 | (1) | — | 1,219.7 | 1,228.8 | (1) | — | |||||||||||||||||||||||||||||||||||||||
Gross contract costs5 |
312.7 | 284.3 | 10 | 11 | 617.6 | 563.4 | 10 | 11 | |||||||||||||||||||||||||||||||||||||||
Adjusted EBITDA1 |
$ | 129.6 | $ | 99.4 | 30 | % | 30 | % | $ | 224.9 | $ | 171.0 | 32 | % | 31 | % | |||||||||||||||||||||||||||||||
| Note: For discussion and reconciliation of non-GAAP financial measures, see the Notes following the Financial Statements in this news release. Percentage variances in the Performance Highlights below are calculated and presented on a local currency basis, unless otherwise noted. | |||||||||||||||||||||||||||||||||||||||||||||||
|
Capital Markets
($ in millions, “LC” = local currency) |
Three Months Ended June 30, | % Change in USD | % Change in LC | Six Months Ended June 30, | % Change in USD | % Change in LC | |||||||||||||||||||||||||||||||||||||||||
| 2024 | 2023 | 2024 | 2023 | ||||||||||||||||||||||||||||||||||||||||||||
| Revenue | $ | 457.6 | $ | 448.0 | 2 | % | 3 | % | $ | 835.2 | $ | 805.1 | 4 | % | 4 | % | |||||||||||||||||||||||||||||||
Investment Sales, Debt/Equity Advisory and Other, excluding Net non-cash MSR (a) |
332.1 | 320.1 | 4 | 4 | 599.8 | 562.5 | 7 | 7 | |||||||||||||||||||||||||||||||||||||||
Net non-cash MSR and mortgage banking derivative activity (a) |
(11.8) | (0.6) | n.m. | n.m. | (20.8) | (2.4) | (767) | (753) | |||||||||||||||||||||||||||||||||||||||
| Value and Risk Advisory | 95.8 | 89.5 | 7 | 8 | 176.0 | 168.6 | 4 | 5 | |||||||||||||||||||||||||||||||||||||||
| Loan Servicing | 41.5 | 39.0 | 6 | 6 | 80.2 | 76.4 | 5 | 5 | |||||||||||||||||||||||||||||||||||||||
| Segment operating expenses | $ | 453.5 | $ | 433.9 | 5 | % | 5 | % | $ | 831.9 | $ | 799.1 | 4 | % | 5 | % | |||||||||||||||||||||||||||||||
| Segment platform operating expenses | 441.7 | 420.8 | 5 | 6 | 806.5 | 776.7 | 4 | 4 | |||||||||||||||||||||||||||||||||||||||
Gross contract costs5 |
11.8 | 13.1 | (10) | (9) | 25.4 | 22.4 | 13 | 15 | |||||||||||||||||||||||||||||||||||||||
| Equity earnings | $ | 0.5 | $ | 4.8 | (90) | % | (90) | % | $ | 0.6 | $ | 5.4 | (89) | % | (89) | % | |||||||||||||||||||||||||||||||
Adjusted EBITDA1 |
$ | 33.8 | $ | 36.0 | (6) | % | (8) | % | $ | 58.8 | $ | 46.7 | 26 | % | 27 | % | |||||||||||||||||||||||||||||||
| Note: For discussion and reconciliation of non-GAAP financial measures, see the Notes following the Financial Statements in this news release. Percentage variances in the Performance Highlights below are calculated and presented on a local currency basis, unless otherwise noted. | |||||||||||||||||||||||||||||||||||||||||||||||
| (a) Historically, net non-cash MSR and mortgage banking derivative activity was included in the Investment Sales, Debt/Equity Advisory and Other caption. Effective for Q2 2024, the net non-cash MSR and mortgage banking derivative activity revenue is separately presented in the above table and prior period financial information recast to conform with this presentation. | |||||||||||||||||||||||||||||||||||||||||||||||
|
Work Dynamics
($ in millions, “LC” = local currency) |
Three Months Ended June 30, | % Change in USD | % Change in LC | Six Months Ended June 30, | % Change in USD | % Change in LC | |||||||||||||||||||||||||||||||||||||||||
| 2024 | 2023 | 2024 | 2023 | ||||||||||||||||||||||||||||||||||||||||||||
| Revenue | $ | 3,933.3 | $ | 3,374.6 | 17 | % | 17 | % | $ | 7,572.8 | $ | 6,650.8 | 14 | % | 14 | % | |||||||||||||||||||||||||||||||
| Workplace Management | 3,021.1 | 2,553.4 | 18 | 19 | 5,892.8 | 5,050.6 | 17 | 17 | |||||||||||||||||||||||||||||||||||||||
| Project Management | 788.1 | 703.2 | 12 | 13 | 1,444.5 | 1,379.5 | 5 | 5 | |||||||||||||||||||||||||||||||||||||||
| Portfolio Services and Other | 124.1 | 118.0 | 5 | 5 | 235.5 | 220.7 | 7 | 6 | |||||||||||||||||||||||||||||||||||||||
| Segment operating expenses | $ | 3,883.3 | $ | 3,338.9 | 16 | % | 17 | % | $ | 7,493.7 | $ | 6,608.9 | 13 | % | 14 | % | |||||||||||||||||||||||||||||||
| Segment platform operating expenses | 470.6 | 442.1 | 6 | 7 | 910.4 | 877.9 | 4 | 4 | |||||||||||||||||||||||||||||||||||||||
Gross contract costs5 |
3,412.7 | 2,896.8 | 18 | 18 | 6,583.3 | 5,731.0 | 15 | 15 | |||||||||||||||||||||||||||||||||||||||
Adjusted EBITDA1 |
$ | 71.1 | $ | 56.2 | 27 | % | 26 | % | $ | 122.0 | $ | 81.9 | 49 | % | 50 | % | |||||||||||||||||||||||||||||||
| Note: For discussion and reconciliation of non-GAAP financial measures, see the Notes following the Financial Statements in this news release. Percentage variances in the Performance Highlights below are calculated and presented on a local currency basis, unless otherwise noted. | |||||||||||||||||||||||||||||||||||||||||||||||
|
JLL Technologies
($ in millions, “LC” = local currency) |
Three Months Ended June 30, | % Change in USD | % Change in LC | Six Months Ended June 30, | % Change in USD | % Change in LC | |||||||||||||||||||||||||||||||||||||||||
| 2024 | 2023 | 2024 | 2023 | ||||||||||||||||||||||||||||||||||||||||||||
| Revenue | $ | 56.4 | $ | 60.6 | (7) | % | (7) | % | $ | 110.3 | $ | 122.0 | (10) | % | (10) | % | |||||||||||||||||||||||||||||||
| Segment operating expenses | $ | 72.1 | $ | 66.0 | 9 | % | 9 | % | $ | 135.6 | $ | 149.5 | (9) | % | (9) | % | |||||||||||||||||||||||||||||||
Segment platform operating expenses(a) |
70.7 | 61.9 | 14 | 14 | 133.0 | 141.8 | (6) | (6) | |||||||||||||||||||||||||||||||||||||||
Gross contract costs5 |
1.4 | 4.1 | (66) | (65) | 2.6 | 7.7 | (66) | (66) | |||||||||||||||||||||||||||||||||||||||
Adjusted EBITDA1 |
$ | (10.9) | $ | (1.3) | (738) | % | (704) | % | $ | (16.0) | $ | (19.5) | 18 | % | 19 | % | |||||||||||||||||||||||||||||||
| Note: For discussion and reconciliation of non-GAAP financial measures, see the Notes following the Financial Statements in this news release. Percentage variances in the Performance Highlights below are calculated and presented on a local currency basis, unless otherwise noted. | |||||||||||||||||||||||||||||||||||||||||||||||
(a) Included in Segment platform operating expenses is carried interest expense of $2.2 million and $2.1 million for the three and six months ended June 30, 2024, and a reduction in carried interest expense of $10.0 million and $9.3 million for the three and six months ended June 30, 2023, related to Equity (losses) earnings of the segment. | |||||||||||||||||||||||||||||||||||||||||||||||
|
LaSalle
($ in millions, “LC” = local currency) |
Three Months Ended June 30, | % Change in USD | % Change in LC | Six Months Ended June 30, | % Change in USD | % Change in LC | |||||||||||||||||||||||||||||||||||||||||
| 2024 | 2023 | 2024 | 2023 | ||||||||||||||||||||||||||||||||||||||||||||
| Revenue | $ | 102.6 | $ | 143.9 | (29) | % | (27) | % | $ | 206.0 | $ | 258.3 | (20) | % | (19) | % | |||||||||||||||||||||||||||||||
| Advisory fees | 93.1 | 103.1 | (10) | (8) | 185.4 | 203.6 | (9) | (8) | |||||||||||||||||||||||||||||||||||||||
| Transaction fees and other | 6.9 | 5.0 | 38 | 39 | 15.8 | 15.4 | 3 | 7 | |||||||||||||||||||||||||||||||||||||||
| Incentive fees | 2.6 | 35.8 | (93) | (92) | 4.8 | 39.3 | (88) | (87) | |||||||||||||||||||||||||||||||||||||||
| Segment operating expenses | $ | 90.3 | $ | 111.3 | (19) | % | (18) | % | $ | 174.9 | $ | 203.8 | (14) | % | (14) | % | |||||||||||||||||||||||||||||||
| Segment platform operating expenses | 81.5 | 103.8 | (21) | (20) | 157.7 | 189.2 | (17) | (16) | |||||||||||||||||||||||||||||||||||||||
Gross contract costs5 |
8.8 | 7.5 | 17 | 16 | 17.2 | 14.6 | 18 | 18 | |||||||||||||||||||||||||||||||||||||||
Adjusted EBITDA1 |
$ | 22.7 | $ | 34.8 | (35) | % | (31) | % | $ | 43.7 | $ | 57.9 | (25) | % | (20) | % | |||||||||||||||||||||||||||||||
| Note: For discussion and reconciliation of non-GAAP financial measures, see the Notes following the Financial Statements in this news release. Percentage variances in the Performance Highlights below are calculated and presented on a local currency basis, unless otherwise noted. | |||||||||||||||||||||||||||||||||||||||||||||||
| Connect with us |   
|
||||
| Live Webcast | Conference Call | ||||||||||
|
Management will offer a live webcast for shareholders, analysts and investment professionals on Tuesday, August 6, 2024, at 9:00 a.m. Eastern. Following the live broadcast, an audio replay will be available.
The link to the live webcast and audio replay can be accessed at the Investor Relations website: ir.jll.com.
|
The conference call can be accessed live over the phone by dialing (800) 715-9871; the conference ID number is 5398158. Listeners are asked to please dial in 10 minutes prior to the call start time and provide the conference ID number to be connected. |
||||||||||
| Supplemental Information | Contact | ||||||||||
Supplemental information regarding the second quarter 2024 earnings call has been posted to the Investor Relations section of JLL's website: ir.jll.com. |
If you have any questions, please contact Scott Einberger, Investor Relations Officer. |
||||||||||
Phone: |
+1 312 252 8943 | ||||||||||
Email: |
JLLInvestorRelations@jll.com
|
||||||||||
| JONES LANG LASALLE INCORPORATED | |||||||||||||||||||||||
| Consolidated Statements of Operations (Unaudited) | |||||||||||||||||||||||
| Three Months Ended June 30, | Six Months Ended June 30, | ||||||||||||||||||||||
| (in millions, except share and per share data) | 2024 | 2023 | 2024 | 2023 | |||||||||||||||||||
| Revenue | $ | 5,628.7 | $ | 5,052.5 | $ | 10,753.2 | $ | 9,768.0 | |||||||||||||||
| Operating expenses: | |||||||||||||||||||||||
| Compensation and benefits | $ | 2,599.2 | $ | 2,417.0 | $ | 5,014.8 | $ | 4,670.0 | |||||||||||||||
| Operating, administrative and other | 2,803.3 | 2,414.6 | 5,335.3 | 4,766.1 | |||||||||||||||||||
| Depreciation and amortization | 62.3 | 59.9 | 123.3 | 117.4 | |||||||||||||||||||
Restructuring and acquisition charges4 |
11.5 | 11.8 | 13.2 | 47.5 | |||||||||||||||||||
| Total operating expenses | $ | 5,476.3 | $ | 4,903.3 | $ | 10,486.6 | $ | 9,601.0 | |||||||||||||||
| Operating income | $ | 152.4 | $ | 149.2 | $ | 266.6 | $ | 167.0 | |||||||||||||||
| Interest expense, net of interest income | 41.7 | 40.5 | 72.2 | 66.8 | |||||||||||||||||||
| Equity losses | (15.4) | (103.5) | (19.1) | (106.1) | |||||||||||||||||||
| Other income (expense) | 9.7 | (1.2) | 11.2 | (1.1) | |||||||||||||||||||
| Income (loss) before income taxes and noncontrolling interest | 105.0 | 4.0 | 186.5 | (7.0) | |||||||||||||||||||
| Income tax provision (benefit) | 20.5 | 0.8 | 36.4 | (1.5) | |||||||||||||||||||
| Net income (loss) | 84.5 | 3.2 | 150.1 | (5.5) | |||||||||||||||||||
Net income (loss) attributable to noncontrolling interest |
0.1 | 0.7 | (0.4) | 1.2 | |||||||||||||||||||
| Net income (loss) attributable to common shareholders | $ | 84.4 | $ | 2.5 | $ | 150.5 | $ | (6.7) | |||||||||||||||
| Basic earnings (loss) per common share | $ | 1.77 | $ | 0.05 | $ | 3.17 | $ | (0.14) | |||||||||||||||
| Basic weighted average shares outstanding (in 000's) | 47,539 | 47,748 | 47,512 | 47,652 | |||||||||||||||||||
| Diluted earnings (loss) per common share | $ | 1.75 | $ | 0.05 | $ | 3.12 | $ | (0.14) | |||||||||||||||
| Diluted weighted average shares outstanding (in 000's) | 48,317 | 48,334 | 48,302 | 47,652 | |||||||||||||||||||
| Please reference accompanying financial statement notes. | |||||||||||||||||||||||
| JONES LANG LASALLE INCORPORATED | |||||||||||||||||||||||
| Selected Segment Financial Data (Unaudited) | |||||||||||||||||||||||
| Three Months Ended June 30, | Six Months Ended June 30, | ||||||||||||||||||||||
| (in millions) | 2024 | 2023 | 2024 | 2023 | |||||||||||||||||||
| MARKETS ADVISORY | |||||||||||||||||||||||
| Revenue | $ | 1,078.8 | $ | 1,025.4 | $ | 2,028.9 | $ | 1,931.8 | |||||||||||||||
| Platform compensation and benefits | $ | 543.4 | $ | 546.4 | $ | 1,005.9 | $ | 1,007.4 | |||||||||||||||
| Platform operating, administrative and other | 92.1 | 93.3 | 179.0 | 186.9 | |||||||||||||||||||
| Depreciation and amortization | 17.4 | 17.4 | 34.8 | 34.5 | |||||||||||||||||||
| Segment platform operating expenses | 652.9 | 657.1 | 1,219.7 | 1,228.8 | |||||||||||||||||||
Gross contract costs5 |
312.7 | 284.3 | 617.6 | 563.4 | |||||||||||||||||||
| Segment operating expenses | $ | 965.6 | $ | 941.4 | $ | 1,837.3 | $ | 1,792.2 | |||||||||||||||
| Segment operating income | $ | 113.2 | $ | 84.0 | $ | 191.6 | $ | 139.6 | |||||||||||||||
| Add: | |||||||||||||||||||||||
| Equity (losses) earnings | — | (0.1) | 0.4 | 0.2 | |||||||||||||||||||
Depreciation and amortization(a) |
16.5 | 16.5 | 32.9 | 32.6 | |||||||||||||||||||
| Other income (expense) | 0.7 | (1.6) | 1.6 | (1.3) | |||||||||||||||||||
| Net income attributable to noncontrolling interest | (0.2) | (0.4) | (0.3) | (0.6) | |||||||||||||||||||
| Adjustments: | |||||||||||||||||||||||
| Net loss on disposition | — | 1.8 | — | 1.8 | |||||||||||||||||||
| Interest on employee loans, net of forgiveness | (0.6) | (0.8) | (1.3) | (1.3) | |||||||||||||||||||
Adjusted EBITDA1 |
$ | 129.6 | $ | 99.4 | $ | 224.9 | $ | 171.0 | |||||||||||||||
| (a) This adjustment excludes the noncontrolling interest portion of amortization of acquisition-related intangibles which is not attributable to common shareholders. | |||||||||||||||||||||||
| JONES LANG LASALLE INCORPORATED | |||||||||||||||||||||||
| Selected Segment Financial Data (Unaudited) Continued | |||||||||||||||||||||||
| Three Months Ended June 30, | Six Months Ended June 30, | ||||||||||||||||||||||
| (in millions) | 2024 | 2023 | 2024 | 2023 | |||||||||||||||||||
| CAPITAL MARKETS | |||||||||||||||||||||||
| Revenue | $ | 457.6 | $ | 448.0 | $ | 835.2 | $ | 805.1 | |||||||||||||||
| Platform compensation and benefits | $ | 341.1 | $ | 335.4 | $ | 628.7 | $ | 619.3 | |||||||||||||||
| Platform operating, administrative and other | 83.3 | 69.2 | 144.1 | 125.3 | |||||||||||||||||||
| Depreciation and amortization | 17.3 | 16.2 | 33.7 | 32.1 | |||||||||||||||||||
| Segment platform operating expenses | 441.7 | 420.8 | 806.5 | 776.7 | |||||||||||||||||||
Gross contract costs5 |
11.8 | 13.1 | 25.4 | 22.4 | |||||||||||||||||||
| Segment operating expenses | $ | 453.5 | $ | 433.9 | $ | 831.9 | $ | 799.1 | |||||||||||||||
| Segment operating income | $ | 4.1 | $ | 14.1 | $ | 3.3 | $ | 6.0 | |||||||||||||||
| Add: | |||||||||||||||||||||||
| Equity earnings | 0.5 | 4.8 | 0.6 | 5.4 | |||||||||||||||||||
| Depreciation and amortization | 17.3 | 16.2 | 33.7 | 32.1 | |||||||||||||||||||
| Other income | 0.8 | 0.4 | 1.4 | 0.2 | |||||||||||||||||||
| Adjustments: | |||||||||||||||||||||||
| Net non-cash MSR and mortgage banking derivative activity | 11.8 | 0.6 | 20.8 | 2.4 | |||||||||||||||||||
| Interest on employee loans, net of forgiveness | (0.7) | (0.1) | (1.0) | 0.6 | |||||||||||||||||||
Adjusted EBITDA1 |
$ | 33.8 | $ | 36.0 | $ | 58.8 | $ | 46.7 | |||||||||||||||
| JONES LANG LASALLE INCORPORATED | |||||||||||||||||||||||
| Selected Segment Financial Data (Unaudited) Continued | |||||||||||||||||||||||
| Three Months Ended June 30, | Six Months Ended June 30, | ||||||||||||||||||||||
| (in millions) | 2024 | 2023 | 2024 | 2023 | |||||||||||||||||||
| WORK DYNAMICS | |||||||||||||||||||||||
| Revenue | $ | 3,933.3 | $ | 3,374.6 | $ | 7,572.8 | $ | 6,650.8 | |||||||||||||||
| Platform compensation and benefits | $ | 333.8 | $ | 321.0 | $ | 653.6 | $ | 626.0 | |||||||||||||||
| Platform operating, administrative and other | 116.0 | 101.2 | 215.3 | 212.7 | |||||||||||||||||||
| Depreciation and amortization | 20.8 | 19.9 | 41.5 | 39.2 | |||||||||||||||||||
| Segment platform operating expenses | 470.6 | 442.1 | 910.4 | 877.9 | |||||||||||||||||||
Gross contract costs5 |
3,412.7 | 2,896.8 | 6,583.3 | 5,731.0 | |||||||||||||||||||
| Segment operating expenses | $ | 3,883.3 | $ | 3,338.9 | $ | 7,493.7 | $ | 6,608.9 | |||||||||||||||
| Segment operating income | $ | 50.0 | $ | 35.7 | $ | 79.1 | $ | 41.9 | |||||||||||||||
| Add: | |||||||||||||||||||||||
| Equity earnings | 0.4 | 0.8 | 1.1 | 1.2 | |||||||||||||||||||
| Depreciation and amortization | 20.8 | 19.9 | 41.5 | 39.2 | |||||||||||||||||||
| Net (income) loss attributable to noncontrolling interest | (0.1) | (0.2) | 0.3 | (0.4) | |||||||||||||||||||
Adjusted EBITDA1 |
$ | 71.1 | $ | 56.2 | $ | 122.0 | $ | 81.9 | |||||||||||||||
| JONES LANG LASALLE INCORPORATED | |||||||||||||||||||||||
| Selected Segment Financial Data (Unaudited) Continued | |||||||||||||||||||||||
| Three Months Ended June 30, | Six Months Ended June 30, | ||||||||||||||||||||||
| (in millions) | 2024 | 2023 | 2024 | 2023 | |||||||||||||||||||
| JLL TECHNOLOGIES | |||||||||||||||||||||||
| Revenue | $ | 56.4 | $ | 60.6 | $ | 110.3 | $ | 122.0 | |||||||||||||||
Platform compensation and benefits(a) |
$ | 53.5 | $ | 45.3 | $ | 100.8 | $ | 106.6 | |||||||||||||||
| Platform operating, administrative and other | 12.4 | 12.5 | 22.9 | 27.2 | |||||||||||||||||||
| Depreciation and amortization | 4.8 | 4.1 | 9.3 | 8.0 | |||||||||||||||||||
| Segment platform operating expenses | 70.7 | 61.9 | 133.0 | 141.8 | |||||||||||||||||||
Gross contract costs5 |
1.4 | 4.1 | 2.6 | 7.7 | |||||||||||||||||||
| Segment operating expenses | $ | 72.1 | $ | 66.0 | $ | 135.6 | $ | 149.5 | |||||||||||||||
| Segment operating loss | $ | (15.7) | $ | (5.4) | $ | (25.3) | $ | (27.5) | |||||||||||||||
| Add: | |||||||||||||||||||||||
| Depreciation and amortization | 4.8 | 4.1 | 9.3 | 8.0 | |||||||||||||||||||
Adjusted EBITDA1 |
$ | (10.9) | $ | (1.3) | $ | (16.0) | $ | (19.5) | |||||||||||||||
| Equity losses | $ | (9.0) | (103.9) | $ | (10.0) | $ | (99.0) | ||||||||||||||||
(a) Included in Platform compensation and benefits is carried interest expense of $2.2 million and $2.1 million for the three and six months ended June 30, 2024, and a reduction in carried interest expense of $10.0 million and $9.3 million for the three and six months ended June 30, 2023, related to Equity (losses) earnings of the segment. | |||||||||||||||||||||||
| Three Months Ended June 30, | Six Months Ended June 30, | ||||||||||||||||||||||
| (in millions) | 2024 | 2023 | 2024 | 2023 | |||||||||||||||||||
| LASALLE | |||||||||||||||||||||||
| Revenue | $ | 102.6 | $ | 143.9 | $ | 206.0 | $ | 258.3 | |||||||||||||||
| Platform compensation and benefits | $ | 59.0 | $ | 84.4 | $ | 120.3 | $ | 153.3 | |||||||||||||||
| Platform operating, administrative and other | 20.5 | 17.1 | 33.4 | 32.3 | |||||||||||||||||||
| Depreciation and amortization | 2.0 | 2.3 | 4.0 | 3.6 | |||||||||||||||||||
| Segment platform operating expenses | 81.5 | 103.8 | 157.7 | 189.2 | |||||||||||||||||||
Gross contract costs5 |
8.8 | 7.5 | 17.2 | 14.6 | |||||||||||||||||||
| Segment operating expenses | $ | 90.3 | $ | 111.3 | $ | 174.9 | $ | 203.8 | |||||||||||||||
| Segment operating income | $ | 12.3 | $ | 32.6 | $ | 31.1 | $ | 54.5 | |||||||||||||||
| Add: | |||||||||||||||||||||||
| Depreciation and amortization | 2.0 | 2.3 | 4.0 | 3.6 | |||||||||||||||||||
| Other income | 8.2 | — | 8.2 | — | |||||||||||||||||||
| Net loss (income) attributable to noncontrolling interest | 0.2 | (0.1) | 0.4 | (0.2) | |||||||||||||||||||
Adjusted EBITDA1 |
$ | 22.7 | $ | 34.8 | $ | 43.7 | $ | 57.9 | |||||||||||||||
| Equity losses | $ | (7.3) | (5.1) | $ | (11.2) | $ | (13.9) | ||||||||||||||||
| JONES LANG LASALLE INCORPORATED | ||||||||||||||||||||||||||
| Consolidated Statement of Cash Flows (Unaudited) | ||||||||||||||||||||||||||
| Six Months Ended June 30, | Six Months Ended June 30, | |||||||||||||||||||||||||
| (in millions) | 2024 | 2023 | 2024 | 2023 | ||||||||||||||||||||||
Cash flows from operating activities7: |
Cash flows from investing activities: | |||||||||||||||||||||||||
| Net income (loss) | $ | 150.1 | $ | (5.5) | Net capital additions – property and equipment | $ | (81.4) | $ | (88.2) | |||||||||||||||||
| Reconciliation of net income to net cash used in operating activities: | Business acquisitions, net of cash acquired | (39.3) | (13.6) | |||||||||||||||||||||||
| Depreciation and amortization | 123.3 | 117.4 | Capital contributions to investments | (41.0) | (66.2) | |||||||||||||||||||||
| Equity losses | 19.1 | 106.1 | Distributions of capital from investments | 9.6 | 12.7 | |||||||||||||||||||||
| Net loss on dispositions | — | 1.8 | Other, net | (2.0) | (5.4) | |||||||||||||||||||||
| Distributions of earnings from investments | 7.2 | 6.0 | Net cash used in investing activities | (154.1) | (160.7) | |||||||||||||||||||||
| Provision for loss on receivables and other assets | 31.7 | 19.0 | Cash flows from financing activities: | |||||||||||||||||||||||
| Amortization of stock-based compensation | 56.8 | 53.0 | Proceeds from borrowings under credit facility | 4,713.0 | 4,478.0 | |||||||||||||||||||||
| Net non-cash mortgage servicing rights and mortgage banking derivative activity | 20.8 | 2.4 | Repayments of borrowings under credit facility | (4,063.0) | (3,853.0) | |||||||||||||||||||||
| Accretion of interest and amortization of debt issuance costs | 2.6 | 2.1 | Net repayments of short-term borrowings | (15.4) | (55.3) | |||||||||||||||||||||
| Other, net | (0.7) | 3.6 | Payments of deferred business acquisition obligations and earn-outs | (4.9) | (21.8) | |||||||||||||||||||||
| Change in: | Repurchase of common stock | (40.4) | (19.5) | |||||||||||||||||||||||
| Receivables | 114.9 | 139.8 | Noncontrolling interest contributions, net | 3.3 | — | |||||||||||||||||||||
| Reimbursable receivables and reimbursable payables | (79.3) | (51.0) | Other, net | (26.0) | (24.5) | |||||||||||||||||||||
| Prepaid expenses and other assets | 16.2 | (4.9) | Net cash provided by financing activities | 566.6 | 503.9 | |||||||||||||||||||||
| Income taxes receivable, payable and deferred | (150.3) | (116.1) | Effect of currency exchange rate changes on cash, cash equivalents and restricted cash | (14.7) | 3.8 | |||||||||||||||||||||
| Accounts payable, accrued liabilities and other liabilities | (139.4) | (119.8) | Net change in cash, cash equivalents and restricted cash | $ | (5.8) | $ | (132.3) | |||||||||||||||||||
| Accrued compensation (including net deferred compensation) | (576.6) | (633.2) | Cash, cash equivalents and restricted cash, beginning of the period | 663.4 | 746.0 | |||||||||||||||||||||
| Net cash used in operating activities | $ | (403.6) | $ | (479.3) | Cash, cash equivalents and restricted cash, end of the period | $ | 657.6 | $ | 613.7 | |||||||||||||||||
| Please reference accompanying financial statement notes. | ||||||||||||||||||||||||||
| JONES LANG LASALLE INCORPORATED | ||||||||||||||||||||||||||||||||||||||
| Consolidated Balance Sheets | ||||||||||||||||||||||||||||||||||||||
| June 30, | December 31, | June 30, | December 31, | |||||||||||||||||||||||||||||||||||
| (in millions, except share and per share data) | 2024 | 2023 | 2024 | 2023 | ||||||||||||||||||||||||||||||||||
| ASSETS | (Unaudited) | LIABILITIES AND EQUITY | (Unaudited) | |||||||||||||||||||||||||||||||||||
| Current assets: | Current liabilities: | |||||||||||||||||||||||||||||||||||||
| Cash and cash equivalents | $ | 424.4 | $ | 410.0 | Accounts payable and accrued liabilities | $ | 1,154.0 | $ | 1,406.7 | |||||||||||||||||||||||||||||
| Trade receivables, net of allowance | 1,911.5 | 2,095.8 | Reimbursable payables | 1,746.0 | 1,796.9 | |||||||||||||||||||||||||||||||||
| Notes and other receivables | 417.9 | 446.4 | Accrued compensation and benefits | 1,098.0 | 1,698.3 | |||||||||||||||||||||||||||||||||
| Reimbursable receivables | 2,345.2 | 2,321.7 | Short-term borrowings | 126.2 | 147.9 | |||||||||||||||||||||||||||||||||
| Warehouse receivables | 642.4 | 677.4 | Short-term contract liability and deferred income | 217.9 | 226.4 | |||||||||||||||||||||||||||||||||
| Short-term contract assets, net of allowance | 310.3 | 338.3 | Warehouse facilities | 655.5 | 662.7 | |||||||||||||||||||||||||||||||||
| Prepaid and other | 582.3 | 567.4 | Short-term operating lease liability | 155.6 | 161.9 | |||||||||||||||||||||||||||||||||
| Total current assets | 6,634.0 | 6,857.0 | Other | 360.8 | 345.3 | |||||||||||||||||||||||||||||||||
| Property and equipment, net of accumulated depreciation | 596.9 | 613.9 | Total current liabilities | 5,514.0 | 6,446.1 | |||||||||||||||||||||||||||||||||
| Operating lease right-of-use asset | 759.4 | 730.9 | Noncurrent liabilities: | |||||||||||||||||||||||||||||||||||
| Goodwill | 4,609.2 | 4,587.4 | Credit facility, net of debt issuance costs | 1,262.1 | 610.6 | |||||||||||||||||||||||||||||||||
| Identified intangibles, net of accumulated amortization | 743.9 | 785.0 | Long-term debt, net of debt issuance costs | 767.9 | 779.3 | |||||||||||||||||||||||||||||||||
| Investments | 819.7 | 816.6 | Long-term deferred tax liabilities, net | 42.5 | 44.8 | |||||||||||||||||||||||||||||||||
| Long-term receivables | 394.1 | 363.8 | Deferred compensation | 620.0 | 580.0 | |||||||||||||||||||||||||||||||||
| Deferred tax assets, net | 507.8 | 497.4 | Long-term operating lease liability | 779.8 | 754.5 | |||||||||||||||||||||||||||||||||
| Deferred compensation plans | 639.8 | 604.3 | Other | 424.4 | 439.6 | |||||||||||||||||||||||||||||||||
| Other | 204.2 | 208.5 | Total liabilities | $ | 9,410.7 | $ | 9,654.9 | |||||||||||||||||||||||||||||||
| Total assets | $ | 15,909.0 | $ | 16,064.8 | ||||||||||||||||||||||||||||||||||
| Company shareholders' equity | ||||||||||||||||||||||||||||||||||||||
| Common stock | 0.5 | 0.5 | ||||||||||||||||||||||||||||||||||||
| Additional paid-in capital | 2,013.3 | 2,019.7 | ||||||||||||||||||||||||||||||||||||
| Retained earnings | 5,941.9 | 5,795.6 | ||||||||||||||||||||||||||||||||||||
| Treasury stock | (913.6) | (920.1) | ||||||||||||||||||||||||||||||||||||
| Shares held in trust | (11.9) | (10.4) | ||||||||||||||||||||||||||||||||||||
| Accumulated other comprehensive loss | (651.0) | (591.5) | ||||||||||||||||||||||||||||||||||||
| Total company shareholders' equity | 6,379.2 | 6,293.8 | ||||||||||||||||||||||||||||||||||||
| Noncontrolling interest | 119.1 | 116.1 | ||||||||||||||||||||||||||||||||||||
| Total equity | 6,498.3 | 6,409.9 | ||||||||||||||||||||||||||||||||||||
| Total liabilities and equity | $ | 15,909.0 | $ | 16,064.8 | ||||||||||||||||||||||||||||||||||
| Please reference accompanying financial statement notes. | ||||||||||||||||||||||||||||||||||||||
| Three Months Ended June 30, | Six Months Ended June 30, | ||||||||||||||||||||||
| (in millions) | 2024 | 2023 | 2024 | 2023 | |||||||||||||||||||
| Net income (loss) attributable to common shareholders | $ | 84.4 | $ | 2.5 | $ | 150.5 | $ | (6.7) | |||||||||||||||
| Add: | |||||||||||||||||||||||
| Interest expense, net of interest income | 41.7 | 40.5 | 72.2 | 66.8 | |||||||||||||||||||
| Income tax provision (benefit) | 20.5 | 0.8 | 36.4 | (1.5) | |||||||||||||||||||
Depreciation and amortization(a) |
61.4 | 59.0 | 121.4 | 115.5 | |||||||||||||||||||
| Adjustments: | |||||||||||||||||||||||
Restructuring and acquisition charges4 |
11.5 | 11.8 | 13.2 | 47.5 | |||||||||||||||||||
| Net loss on disposition | — | 1.8 | — | 1.8 | |||||||||||||||||||
| Net non-cash MSR and mortgage banking derivative activity | 11.8 | 0.6 | 20.8 | 2.4 | |||||||||||||||||||
| Interest on employee loans, net of forgiveness | (1.3) | (0.9) | (2.3) | (0.7) | |||||||||||||||||||
| Equity losses - JLL Technologies and LaSalle | 16.3 | 109.0 | 21.2 | 112.9 | |||||||||||||||||||
| Adjusted EBITDA | $ | 246.3 | $ | 225.1 | $ | 433.4 | $ | 338.0 | |||||||||||||||
| Three Months Ended June 30, | Six Months Ended June 30, | ||||||||||||||||||||||
| (In millions, except share and per share data) | 2024 | 2023 | 2024 | 2023 | |||||||||||||||||||
| Net income (loss) attributable to common shareholders | $ | 84.4 | $ | 2.5 | $ | 150.5 | $ | (6.7) | |||||||||||||||
Diluted shares (in thousands)(b) |
48,317 | 48,334 | 48,302 | 47,652 | |||||||||||||||||||
| Diluted earnings (loss) per share | $ | 1.75 | $ | 0.05 | $ | 3.12 | $ | (0.14) | |||||||||||||||
| Net income (loss) attributable to common shareholders | $ | 84.4 | $ | 2.5 | $ | 150.5 | $ | (6.7) | |||||||||||||||
| Adjustments: | |||||||||||||||||||||||
Restructuring and acquisition charges4 |
11.5 | 11.8 | 13.2 | 47.5 | |||||||||||||||||||
| Net non-cash MSR and mortgage banking derivative activity | 11.8 | 0.6 | 20.8 | 2.4 | |||||||||||||||||||
Amortization of acquisition-related intangibles(a) |
15.8 | 17.2 | 31.0 | 33.7 | |||||||||||||||||||
| Net loss on disposition | — | 1.8 | — | 1.8 | |||||||||||||||||||
| Interest on employee loans, net of forgiveness | (1.3) | (0.9) | (2.3) | (0.7) | |||||||||||||||||||
| Equity losses - JLL Technologies and LaSalle | 16.3 | 109.0 | 21.2 | 112.9 | |||||||||||||||||||
Tax impact of adjusted items(c) |
(15.3) | (39.8) | (25.2) | (54.5) | |||||||||||||||||||
| Adjusted net income attributable to common shareholders | $ | 123.2 | $ | 102.2 | $ | 209.2 | $ | 136.4 | |||||||||||||||
| Diluted shares (in thousands) | 48,317 | 48,334 | 48,302 | 48,357 | |||||||||||||||||||
| Adjusted diluted earnings per share | $ | 2.55 | $ | 2.12 | $ | 4.33 | $ | 2.82 | |||||||||||||||
| Three Months Ended June 30, | Six Months Ended June 30, | ||||||||||||||||||||||
| ($ in millions) | 2024 | % Change | 2024 | % Change | |||||||||||||||||||
| Revenue: | |||||||||||||||||||||||
| At current period exchange rates | $ | 5,628.7 | 11 | % | $ | 10,753.2 | 10 | % | |||||||||||||||
| Impact of change in exchange rates | 32.5 | n/a | 38.1 | n/a | |||||||||||||||||||
| At comparative period exchange rates | $ | 5,661.2 | 12 | % | $ | 10,791.3 | 10 | % | |||||||||||||||
| Operating income: | |||||||||||||||||||||||
| At current period exchange rates | $ | 152.4 | 2 | % | $ | 266.6 | 60 | % | |||||||||||||||
| Impact of change in exchange rates | 2.7 | n/a | 8.1 | n/a | |||||||||||||||||||
| At comparative period exchange rates | $ | 155.1 | 4 | % | $ | 274.7 | 65 | % | |||||||||||||||
| Adjusted EBITDA: | |||||||||||||||||||||||
| At current period exchange rates | $ | 246.3 | 9 | % | $ | 433.4 | 28 | % | |||||||||||||||
| Impact of change in exchange rates | 2.7 | n/a | 8.0 | n/a | |||||||||||||||||||
| At comparative period exchange rates | $ | 249.0 | 11 | % | $ | 441.4 | 31 | % | |||||||||||||||
| Three Months Ended June 30, | Six Months Ended June 30, | ||||||||||||||||||||||
| (in millions) | 2024 | 2023 | 2024 | 2023 | |||||||||||||||||||
| Severance and other employment-related charges | $ | 7.2 | $ | 5.8 | $ | 11.7 | $ | 31.5 | |||||||||||||||
| Restructuring, pre-acquisition and post-acquisition charges | 6.4 | 6.6 | 14.1 | 16.6 | |||||||||||||||||||
| Fair value adjustments that resulted in a net decrease to earn-out liabilities from prior-period acquisition activity | (2.1) | (0.6) | (12.6) | (0.6) | |||||||||||||||||||
| Total Restructuring and acquisition charges | $ | 11.5 | $ | 11.8 | $ | 13.2 | $ | 47.5 | |||||||||||||||
| ($ in millions) | June 30, 2024 | March 31, 2024 | June 30, 2023 | ||||||||||||||
| Total debt | $ | 2,176.4 | $ | 2,297.5 | $ | 2,344.0 | |||||||||||
| Less: Cash and cash equivalents | 424.4 | 396.7 | 402.5 | ||||||||||||||
| Net Debt | $ | 1,752.0 | $ | 1,900.8 | $ | 1,941.5 | |||||||||||
| Divided by: Trailing twelve-month Adjusted EBITDA | $ | 1,033.8 | $ | 1,012.6 | $ | 974.3 | |||||||||||
| Net Leverage Ratio | 1.7x | 1.9x | 2.0x | ||||||||||||||
| Six Months Ended June 30, | |||||||||||
| (in millions) | 2024 | 2023 | |||||||||
| Net cash used in operating activities | $ | (403.6) | $ | (479.3) | |||||||
| Net capital additions - property and equipment | (81.4) | (88.2) | |||||||||
Free Cash Flow5 |
$ | (485.0) | $ | (567.5) | |||||||
| Three Months Ended June 30, 2024 | |||||||||||||||||||||||||||||||||||||||||||||||||||||||||||||||||||||||
| (in millions) | Markets Advisory | Capital Markets | Work Dynamics | ||||||||||||||||||||||||||||||||||||||||||||||||||||||||||||||||||||
| Leasing | Property Mgmt | Advisory, Consulting and Other | Total Markets Advisory | Invt Sales, Debt/Equity Advisory and Other | Value and Risk Advisory | Loan Servicing | Total Capital Markets | Workplace Mgmt | Project Mgmt | Portfolio Services and Other | Total Work Dynamics | JLLT | LaSalle | Total | |||||||||||||||||||||||||||||||||||||||||||||||||||||||||
Revenue(a) |
$ | 619.1 | 436.6 | 23.1 | $ | 1,078.8 | $ | 320.3 | 95.8 | 41.5 | $ | 457.6 | $ | 3,021.1 | 788.1 | 124.1 | $ | 3,933.3 | $ | 56.4 | $ | 102.6 | $ | 5,628.7 | |||||||||||||||||||||||||||||||||||||||||||||||
Gross contract costs5 |
$ | 5.9 | 304.4 | 2.4 | $ | 312.7 | $ | 8.6 | 3.2 | — | $ | 11.8 | $ | 2,793.4 | 555.2 | 64.1 | $ | 3,412.7 | $ | 1.4 | $ | 8.8 | $ | 3,747.4 | |||||||||||||||||||||||||||||||||||||||||||||||
| Platform operating expenses | $ | 652.9 | $ | 441.7 | $ | 470.6 | $ | 70.7 | $ | 81.5 | $ | 1,717.4 | |||||||||||||||||||||||||||||||||||||||||||||||||||||||||||
Adjusted EBITDA1 |
$ | 129.6 | $ | 33.8 | $ | 71.1 | $ | (10.9) | $ | 22.7 | $ | 246.3 | |||||||||||||||||||||||||||||||||||||||||||||||||||||||||||
| Three Months Ended June 30, 2023 | |||||||||||||||||||||||||||||||||||||||||||||||||||||||||||||||||||||||
| (in millions) | Markets Advisory | Capital Markets | Work Dynamics | ||||||||||||||||||||||||||||||||||||||||||||||||||||||||||||||||||||
| Leasing | Property Mgmt | Advisory, Consulting and Other | Total Markets Advisory | Invt Sales, Debt/Equity Advisory and Other | Value and Risk Advisory | Loan Servicing | Total Capital Markets | Workplace Mgmt | Project Mgmt | Portfolio Services and Other | Total Work Dynamics | JLLT | LaSalle | Total | |||||||||||||||||||||||||||||||||||||||||||||||||||||||||
| Revenue | $ | 591.4 | 409.9 | 24.1 | $ | 1,025.4 | $ | 319.5 | 89.5 | 39.0 | $ | 448.0 | $ | 2,553.4 | 703.2 | 118.0 | $ | 3,374.6 | $ | 60.6 | $ | 143.9 | $ | 5,052.5 | |||||||||||||||||||||||||||||||||||||||||||||||
Gross contract costs5 |
$ | 3.4 | 278.9 | 2.0 | $ | 284.3 | $ | 10.2 | 2.9 | — | $ | 13.1 | $ | 2,365.2 | 473.5 | 58.1 | $ | 2,896.8 | $ | 4.1 | $ | 7.5 | $ | 3,205.8 | |||||||||||||||||||||||||||||||||||||||||||||||
| Platform operating expenses | $ | 657.1 | $ | 420.8 | $ | 442.1 | $ | 61.9 | $ | 103.8 | $ | 1,685.7 | |||||||||||||||||||||||||||||||||||||||||||||||||||||||||||
Adjusted EBITDA1 |
$ | 99.4 | $ | 36.0 | $ | 56.2 | $ | (1.3) | $ | 34.8 | $ | 225.1 | |||||||||||||||||||||||||||||||||||||||||||||||||||||||||||
| Six Months Ended June 30, 2024 | |||||||||||||||||||||||||||||||||||||||||||||||||||||||||||||||||||||||
| (in millions) | Markets Advisory | Capital Markets | Work Dynamics | ||||||||||||||||||||||||||||||||||||||||||||||||||||||||||||||||||||
| Leasing | Property Mgmt | Advisory, Consulting and Other | Total Markets Advisory | Invt Sales, Debt/Equity Advisory and Other | Value and Risk Advisory | Loan Servicing | Total Capital Markets | Workplace Mgmt | Project Mgmt | Portfolio Services and Other | Total Work Dynamics | JLLT | LaSalle | Total | |||||||||||||||||||||||||||||||||||||||||||||||||||||||||
Revenue(a) |
$ | 1,116.4 | 866.3 | 46.2 | $ | 2,028.9 | $ | 579.0 | 176.0 | 80.2 | $ | 835.2 | $ | 5,892.8 | 1,444.5 | 235.5 | $ | 7,572.8 | $ | 110.3 | $ | 206.0 | $ | 10,753.2 | |||||||||||||||||||||||||||||||||||||||||||||||
Gross contract costs5 |
$ | 10.1 | 602.9 | 4.6 | $ | 617.6 | $ | 19.7 | 5.7 | — | $ | 25.4 | $ | 5,456.5 | 1,001.1 | 125.7 | $ | 6,583.3 | $ | 2.6 | $ | 17.2 | $ | 7,246.1 | |||||||||||||||||||||||||||||||||||||||||||||||
| Platform operating expenses | $ | 1,219.7 | $ | 806.5 | $ | 910.4 | $ | 133.0 | $ | 157.7 | $ | 3,227.3 | |||||||||||||||||||||||||||||||||||||||||||||||||||||||||||
Adjusted EBITDA1 |
$ | 224.9 | $ | 58.8 | $ | 122.0 | $ | (16.0) | $ | 43.7 | $ | 433.4 | |||||||||||||||||||||||||||||||||||||||||||||||||||||||||||
| Six Months Ended June 30, 2023 | |||||||||||||||||||||||||||||||||||||||||||||||||||||||||||||||||||||||
| (in millions) | Markets Advisory | Capital Markets | Work Dynamics | ||||||||||||||||||||||||||||||||||||||||||||||||||||||||||||||||||||
| Leasing | Property Mgmt | Advisory, Consulting and Other | Total Markets Advisory | Invt Sales, Debt/Equity Advisory and Other | Value and Risk Advisory | Loan Servicing | Total Capital Markets | Workplace Mgmt | Project Mgmt | Portfolio Services and Other | Total Work Dynamics | JLLT | LaSalle | Total | |||||||||||||||||||||||||||||||||||||||||||||||||||||||||
Revenue(a) |
$ | 1,078.4 | 810.1 | 43.3 | $ | 1,931.8 | $ | 560.1 | 168.6 | 76.4 | $ | 805.1 | $ | 5,050.6 | 1,379.5 | 220.7 | $ | 6,650.8 | $ | 122.0 | $ | 258.3 | $ | 9,768.0 | |||||||||||||||||||||||||||||||||||||||||||||||
Gross contract costs5 |
$ | 7.9 | 552.0 | 3.5 | $ | 563.4 | $ | 17.4 | 5.0 | — | $ | 22.4 | $ | 4,679.2 | 938.9 | 112.9 | $ | 5,731.0 | $ | 7.7 | $ | 14.6 | $ | 6,339.1 | |||||||||||||||||||||||||||||||||||||||||||||||
| Platform operating expenses | $ | 1,228.8 | $ | 776.7 | $ | 877.9 | $ | 141.8 | $ | 189.2 | $ | 3,214.4 | |||||||||||||||||||||||||||||||||||||||||||||||||||||||||||
Adjusted EBITDA1 |
$ | 171.0 | $ | 46.7 | $ | 81.9 | $ | (19.5) | $ | 57.9 | $ | 338.0 | |||||||||||||||||||||||||||||||||||||||||||||||||||||||||||