UNITED STATES
SECURITIES AND EXCHANGE COMMISSION
WASHINGTON, D.C. 20549
FORM 8-K
CURRENT REPORT
Pursuant to Section 13 or 15(d) of the Securities Exchange Act of 1934
Date of Report (Date of earliest event reported): October 28, 2024 |
LINKBANCORP, Inc.
(Exact name of Registrant as Specified in Its Charter)
Pennsylvania |
001-41505 |
82-5130531 |
||
(State or Other Jurisdiction |
(Commission File Number) |
(IRS Employer |
||
|
|
|
|
|
1250 Camp Hill Bypass, Suite 202 |
|
|||
Camp Hill, Pennsylvania |
|
17011 |
||
(Address of Principal Executive Offices) |
|
(Zip Code) |
||
Registrant’s Telephone Number, Including Area Code: 855 569-2265 |
Not Applicable |
(Former Name or Former Address, if Changed Since Last Report)
Check the appropriate box below if the Form 8-K filing is intended to simultaneously satisfy the filing obligation of the registrant under any of the following provisions:
Securities registered pursuant to Section 12(b) of the Act:
|
|
Trading |
|
|
Common Stock, par value $0.01 |
|
LNKB |
|
The Nasdaq Stock Market LLC |
Indicate by check mark whether the registrant is an emerging growth company as defined in Rule 405 of the Securities Act of 1933 (§ 230.405 of this chapter) or Rule 12b-2 of the Securities Exchange Act of 1934 (§ 240.12b-2 of this chapter).
Emerging growth company ☒
If an emerging growth company, indicate by check mark if the registrant has elected not to use the extended transition period for complying with any new or revised financial accounting standards provided pursuant to Section 13(a) of the Exchange Act. ☐
Item 2.02 Results of Operations and Financial Condition.
On October 28, 2024, LINKBANCORP, Inc. (the “Company”) issued a press release reporting its financial results as of and for the three and nine months ended September 30, 2024.
A copy of the press release is attached as Exhibit 99.1 to this report and is being furnished to the Securities and Exchange Commission and shall not be deemed filed for any purpose.
Item 5.02 Departure of Directors or Certain Officers; Election of Directors; Appointment of Certain Officers; Compensatory Arrangements of Certain Officers.
On October 24, 2024, LINKBANK, the wholly owned subsidiary of the LINKBANCORP, Inc., entered into amendments to the Deferred Compensation Agreements, originally effective as of November 1, 2021, with each of Carl Lundblad, President of LINKBANCORP, Inc., and Brent Smith, Executive Vice President and President of LINKBANK. The amendments provide that in the event of a change in control (as defined in the agreements), followed within 24 months by a separation from service prior to the executive’s normal retirement age (as set forth in the agreements), the executive will receive a benefit equal to the executive’s deferral account balance plus an additional amount equal to the executive’s annual base salary as of the date of the change in control. The benefit will be paid in 180 substantially equal installments, commencing on the later of (i) the month following the date the executive attains normal retirement age or (ii) the sixty-first month following the executive’s separation from service. The amendments will become effective on November 1, 2025, in accordance with the requirements of Section 409A of the Internal Revenue Code of 1986, as amended.
The foregoing description of the amendments is qualified in its entirety by reference to the amendments, copies of which are attached hereto as Exhibits 10.1 and 10.2, respectively.
Item 7.01 Regulation FD
A copy of LINKBANCORP, Inc.’s investor presentation based on September 30, 2024 financial information is furnished as Exhibit 99.2 hereto.
The information in Exhibit 99.2 to this Current Report on Form 8-K shall not be deemed to be “filed” for purposes of Section 18 of the Securities and Exchange Act of 1934, or otherwise subject to the liabilities thereof, nor shall it be deemed to be incorporated by reference in any filing under the Securities and Exchange Act of 1934 or under the Securities Act of 1933, except to the extent specifically provided in any such filing.
Item 9.01 Financial Statements and Exhibits.
(a) |
Financial statements of businesses acquired. None. |
(b) |
Pro forma financial information. None. |
(c) |
Shell company transactions. None. |
(d) |
Exhibits. |
|
10.1 First Amendment to Deferred Compensation Agreement between LINKBANK and Carl Lundblad, dated October 24, 2024 |
|
10.2 First Amendment to Deferred Compensation Agreement between LINKBANK and Brent Smith, dated October 24, 2024 |
|
99.1 Press release dated October 28, 2024 |
|
99.2 Investor Presentation |
|
104 Cover Page Interactive Data File (embedded in the cover page formatted in Inline XBRL) |
SIGNATURES
Pursuant to the requirements of the Securities Exchange Act of 1934, the registrant has duly caused this report to be signed on its behalf by the undersigned thereunto duly authorized.
|
|
|
LINKBANCORP, INC. |
|
|
|
|
Date: |
October 28, 2024 |
By: |
/s/ Carl D. Lundblad |
|
|
|
Carl D. Lundblad |
FIRST AMENDMENT TO THE
DEFERRED COMPENSATION AGREEMENT
FORCARL LUNDBLAD
THIS AMENDMENT (the “Amendment”) is adopted October 24, 2024, to be effective November 1, 2025 by and between LINKBANK, f/k/a The Gratz Bank (the “Employer”) and Carl Lundblad (the “Executive”).
The Executive and Employer executed a Deferred Compensation Agreement effective November 1, 2021 (the “Agreement”) which provides retirement benefits to the Executive under certain circumstances. The Employer and the Executive now wish to change the Change in Control Benefits (described in Section 4.4 of the Agreement) under the Agreement. To ensure compliance with Section 409A of the internal Revenue Code of 1986, as amended (the “Code”), this Amendment shall not be effective until at least one year has passed from the date of its execution and the Change in Control Benefit payment shall be delayed at least five years.
NOW, THEREFORE, the Employer and the Executive adopt the following amendments to the Agreement:
Section 4.4 of the Agreement shall be deleted and replaced by the following:
4.4 Change in Control Benefit. If a Change in Control occurs, followed within twenty-four (24) months by a Separation from Service occurring prior to Normal Retirement Age, the Employer shall pay the Executive the sum of (i) the Deferral Account balance calculated at Separation from Service and (ii) an additional amount equal to Base Salary determined as of the date of the Change in Control. This benefit shall be paid in one hundred eighty (180) consecutive substantially equal monthly installments and shall commence the later of (i) the month following Normal Retirement Age or (ii) the sixty-first month following Separation from Service, with interest credited on the unpaid balance at the Crediting Rate as described in Section 3.1(b).
The Employer and the Executive intend that this Amendment and the Agreement comply with the provisions of Code Section 409A to prevent the inclusion in gross income of any amounts deferred hereunder in a taxable year prior to the year in which amounts are actually paid to the Executive or the Executive’s beneficiary. This Amendment and the Agreement shall be construed, administered and governed in a manner that affects such intent, and neither the Executive nor the Employer shall not take any action that would be inconsistent therewith.
IN WITNESS WHEREOF, the Executive and a duly authorized representative of the Employer have executed this Amendment as indicated below:
Executive Employer:
/s/Carl D. Lundblad By: /s/Andrew Samuel THIS AMENDMENT (the “Amendment”) is adopted October 24, 2024, to be effective November 1, 2025 by and between LINKBANK, f/k/a The Gratz Bank (the “Employer”) and Brent Smith (the “Executive”).
Its: Chief Executive Officer
FIRST AMENDMENT TO THE
DEFERRED COMPENSATION AGREEMENT
FORBRENT SMITH
The Executive and Employer executed a Deferred Compensation Agreement effective November 1, 2021 (the “Agreement”) which provides retirement benefits to the Executive under certain circumstances. The Employer and the Executive now wish to change the Change in Control Benefits (described in Section 4.4 of the Agreement) under the Agreement. To ensure compliance with Section 409A of the Internal Revenue Code of 1986, as amended (the “Code”), this Amendment shall not be effective until at least one year has passed from the date of its execution and the Change in Control Benefit payment shall be delayed at least five years.
NOW, THEREFORE, the Employer and the Executive adopt the following amendments to the Agreement:
Section 4.4 of the Agreement shall be deleted and replaced by the following:
4.4 Change in Control Benefit. If a Change in Control occurs, followed within twenty-four (24) months by a Separation from Service occurring prior to Normal Retirement Age, the Employer shall pay the Executive the sum of (i) the Deferral Account balance calculated at Separation from Service and (ii) an additional amount equal to Base Salary determined as of the date of the Change in Control. This benefit shall be paid in one hundred eighty (180) consecutive substantially equal monthly installments and shall commence the later of (i) the month following Normal Retirement Age or (ii) the sixty-first month following Separation from Service, with interest credited on the unpaid balance at the Crediting Rate as described in Section 3.1(b).
The Employer and the Executive intend that this Amendment and the Agreement comply with the provisions of Code Section 409A to prevent the inclusion in gross income of any amounts deferred hereunder in a taxable year prior to the year in which amounts are actually paid to the Executive or the Executive’s beneficiary. This Amendment and the Agreement shall be construed, administered and governed in a manner that affects such intent, and neither the Executive nor the Employer shall not take any action that would be inconsistent therewith.
IN WITNESS WHEREOF, the Executive and a duly authorized representative of the Employer have executed this Amendment as indicated below:
Executive Employer:
/s/ Brent Smith By: /s/Andrew Samuel Corporate and Investor Relations Officer
Its: Chief Executive Officer
Exhibit 99.1
FOR IMMEDIATE RELEASE
Contact:
Nicole Davis
717.803.8895
IR@LINKBANCORP.COM
LINKBANCORP, Inc. Announces Record Third Quarter Net Income of $7.1 Million
October 28, 2024 – HARRISBURG, PA – LINKBANCORP, Inc. (NASDAQ: LNKB) (the “Company”), the parent company of LINKBANK (the “Bank”) reported record net income of $7.1 million, or $0.19 per diluted share, for the quarter ended September 30, 2024, demonstrating continued growth compared to net income of $5.8 million, or $0.16 per diluted share, for the linked quarter ended June 30, 2024. Excluding expenses associated with the sale of its New Jersey branches and branch consolidations, adjusted earnings were $7.2 million1, or $0.191 per diluted share for the third quarter of 2024, compared with $6.3 million1, or $0.171 per diluted share for the second quarter of 2024.
Third Quarter 2024 Highlights
1 See Appendix A — Reconciliation to Non-GAAP Financial Measures for the computation of this non-GAAP measure.
2Total loans and total deposits include balances held for sale in the Branch Sale of $102.3 million and $94.0 million, respectively, at September 30, 2024. These balances were $116.2 million and $96.8 million, respectively, at June 30, 2024.
Page 2 of 18
June 30, 2024. Total loans2 increased $8.8 million from $2.31 billion at June 30, 2024 to $2.32 billion at September 30, 2024.
1 See Appendix A — Reconciliation to Non-GAAP Financial Measures for the computation of this non-GAAP measure.
Page 3 of 18
As a result of the Branch Sale announcement, associated loans and deposits were reclassified as held for sale, impacting the Company’s allowance for credit losses and purchase accounting amortization related to the loans held for sale.
“We are pleased to announce another quarter of record earnings for the third quarter of 2024, representing an annualized 1.00% return on average assets for the quarter and demonstrating solid progress toward achieving our target profitability metrics. This is a result of prioritizing high quality loan and strong core deposit growth, with an emphasis on achieving cost efficiencies from the merger and branch consolidations, while also executing on non-interest income initiatives,” said Andrew Samuel, Chief Executive Officer of LINKBANCORP. “As we look to close 2024 with a strong fourth quarter, our teams continue to implement strategies to reduce funding costs and operational expenses and generate additional revenue to support further earnings growth.”
Income Statement
Net interest income before the provision for credit losses for the third quarter of 2024 was $25.0 million compared to $24.5 million in the second quarter of 2024. Net interest margin was 3.82% for the third quarter of 2024 compared to 3.83% for the second quarter of 2024. Cost of funds decreased to 2.42% for the third quarter of 2024 compared to 2.43% for the second quarter of 2024, while the average yield on interest earning assets decreased from 6.19% for the second quarter of 2024 to 6.16% for the third quarter of 2024 due to the cut in the target federal funds rate.
Noninterest income increased $822 thousand quarter-over-quarter to $2.7 million for the third quarter of 2024 compared to $1.9 million for the second quarter of 2024, and included strong growth in service charges on deposit accounts and gain on sale of loans, as well as increases in merchant fees and swap fee income.
Noninterest expense for the third quarter of 2024 was $18.5 million compared to $18.9 million for the second quarter of 2024. Excluding one-time costs associated with the Branch Sale and branch consolidations of $171 thousand in the third quarter of 2024 and $631 thousand in the second quarter of 2024, adjusted noninterest expense was generally flat at $18.3 million for the second and third quarter of 20241 , as decreases in personnel and occupancy costs were offset by increases in FDIC deposit insurance and fraud-related operating losses.
1 See Appendix A — Reconciliation to Non-GAAP Financial Measures for the computation of this non-GAAP measure.
Page 4 of 18
Income tax expense was $2.0 million for the third quarter of 2024, reflecting an effective tax rate of 22.2%.
Balance Sheet
Total assets were $2.88 billion at September 30, 2024 compared to $2.86 billion at June 30, 2024 and $1.26 billion at September 30, 2023. Deposits and net loans as of September 30, 2024 totaled $2.37 billion and $2.19 billion, respectively, compared to deposits and net loans of $2.36 billion and $2.17 billion, respectively, at June 30, 2024 and $1.04 billion and $969.0 million, respectively, at September 30, 2023. Deposits and net loans exclude balances held for sale in the Branch Sale of $94.0 million and $102.3 million, respectively, at September 30, 2024, which are reflected in liabilities held for sale and assets held for sale. These balances were $96.8 million and $116.2 million respectively, at June 30, 2024.
Including loans held for sale, total loans increased $8.8 million, from $2.31 billion at June 30, 2024 to $2.32 billion at September 30, 2024. Total commercial loan commitments for the third quarter of 2024 were $111.0 million with funded balances of $74.8 million. The average commercial loan commitment originated during the third quarter of 2024 totaled approximately $810 thousand with an average outstanding funded balance of $546 thousand.
Including deposits held for sale, total deposits at September 30, 2024 totaled $2.47 billion, an increase of $9.3 million from $2.46 billion at June 30, 2024. This increase included growth of $54.5 million in demand deposit accounts and $21.4 million in retail time deposits, offset by a decrease in brokered deposits of $69.4 million quarter over quarter.
The Company maintains strong on-balance sheet liquidity, as cash and cash equivalents increased to $191.2 million at September 30, 2024 compared to $181.7 million at June 30, 2024.
Shareholders’ equity increased from $271.4 million at June 30, 2024 to $277.4 million at September 30, 2024 primarily as a result of a $4.3 million increase in retained earnings. Book value per share increased to $7.42 at September 30, 2024 compared to $7.27 at June 30, 2024. Tangible book value per share increased to $5.26 at September 30, 2024 compared to $5.07 at June 30, 20241.
1 See Appendix A — Reconciliation to Non-GAAP Financial Measures for the computation of this non-GAAP measure.
Page 5 of 18
Asset Quality
The Company recorded a $84 thousand provision for credit losses during the third quarter of 2024, after recording no provision for credit losses in the second quarter of 2024.
As of September 30, 2024, the Company’s non-performing assets were $17.4 million, representing 0.60% of total assets, compared to $10.6 million, representing 0.37% of total assets at June 30, 2024. The increase related primarily to a single real estate secured loan acquired in the merger with Partners Bancorp (the “Partners Merger”) with an outstanding principal balance of approximately $5.5 million at September 30, 2024. Based on a recent appraisal and application of the Company’s reserve methodology, a specific reserve was not needed for this loan as of September 30, 2024.
Loans 30-89 days past due at September 30, 2024 were $2.7 million, representing 0.12% of total loans, an improvement compared to $5.2 million or 0.24% of total loans at June 30, 2024.
The allowance for credit losses-loans was $26.5 million, or 1.20% of total loans held for investment at September 30, 2024, compared to $26.3 million, or 1.20% of total loans held for investment at June 30, 2024. In addition to the recorded provision, the increased allowance resulted from a reallocation of a portion of the allowance for credit losses-unfunded commitments to the allowance for credit losses-loans. The allowance for credit losses-loans to nonperforming assets was 152.73% at September 30, 2024, compared to 248.26% at June 30, 2024.
Capital
The Bank’s regulatory capital ratios were well in excess of regulatory minimums to be considered “well capitalized” as of September 30, 2024. The Bank’s Total Capital Ratio and Tier 1 Capital Ratio were 11.44% and 10.62% respectively, at September 30, 2024, compared to 11.09% and 10.30%, respectively, at June 30, 2024 and 12.92% and 12.37%, respectively, at September 30, 2023. The Company’s ratio of Tangible Common Equity to Tangible Assets was 7.02%1 at September 30, 2024.
1 See Appendix A — Reconciliation to Non-GAAP Financial Measures for the computation of this non-GAAP measure.
Page 6 of 18
ABOUT LINKBANCORP, Inc.
LINKBANCORP, Inc. was formed in 2018 with a mission to positively impact lives through community banking. Its subsidiary bank, LINKBANK, is a Pennsylvania state-chartered bank serving individuals, families, nonprofits and business clients throughout Pennsylvania, Maryland, Delaware, Virginia, and New Jersey through 26 client solutions centers and www.linkbank.com. LINKBANCORP, Inc. common stock is traded on the Nasdaq Capital Market under the symbol "LNKB". For further company information, visit ir.linkbancorp.com.
1 See Appendix A — Reconciliation to Non-GAAP Financial Measures for the computation of this non-GAAP measure.
Page 7 of 18
Forward Looking Statements
This press release contains forward-looking statements as defined in the Private Securities Litigation Reform Act of 1995. Forward-looking statements are not statements of current or historical fact and involve substantial risks and uncertainties. Words such as "anticipates," "believes," "estimates," "expects," "forecasts," "intends," "plans," "projects," "may," "will," "should," and other similar expressions can be used to identify forward-looking statements. Such statements are subject to factors that could cause actual results to differ materially from anticipated results. Among the risks and uncertainties that could cause actual results to differ from those described in the forward-looking statements include, but are not limited to the following: costs or difficulties associated with newly developed or acquired operations; risks related to the integration of the Partners Merger; the timing and receipt of regulatory approvals to complete the Branch Sale; changes in general economic trends, including inflation and changes in interest rates; increased competition; changes in consumer demand for financial services; our ability to control costs and expenses; adverse developments in borrower industries and, in particular, declines in real estate values; changes in and compliance with federal and state laws that regulate our business and capital levels; our ability to raise capital as needed; and the effects of any cybersecurity breaches. The Company does not undertake, and specifically disclaims, any obligation to publicly revise any forward-looking statements to reflect the occurrence of anticipated or unanticipated events or circumstances after the date of such statements, except as required by law. Accordingly, you should not place undue reliance on forward-looking statements.
Given that the Company’s merger with Partners Bancorp was completed on November 30, 2023, reported results prior to the fourth quarter of 2023 included in the following tables reflect legacy LINKBANCORP results only.
1 See Appendix A — Reconciliation to Non-GAAP Financial Measures for the computation of this non-GAAP measure.
Page 8 of 18
LINKBANCORP, Inc. and Subsidiaries |
|
|||||||||||||||||||
Consolidated Balance Sheet (Unaudited) |
|
|||||||||||||||||||
|
|
|
|
|
|
|
|
|
|
|
|
|
|
|
|
|||||
|
|
|
|
|
|
|
|
|
|
|
|
|
|
|
|
|||||
|
|
September 30, 2024 |
|
|
June 30, 2024 |
|
|
March 31, 2024 |
|
|
December 31, 2023 |
|
|
September 30, 2023 |
|
|||||
(In Thousands, except share and per share data) |
|
|
|
|
|
|
|
|
|
|
|
|
|
|
|
|||||
ASSETS |
|
|
|
|
|
|
|
|
|
|
|
|
|
|
|
|||||
Noninterest-bearing cash equivalents |
|
$ |
15,295 |
|
|
$ |
14,516 |
|
|
$ |
13,552 |
|
|
$ |
13,089 |
|
|
$ |
5,447 |
|
Interest-bearing deposits with other institutions |
|
|
175,937 |
|
|
|
167,141 |
|
|
|
158,731 |
|
|
|
67,101 |
|
|
|
62,532 |
|
Cash and cash equivalents |
|
|
191,232 |
|
|
|
181,657 |
|
|
|
172,283 |
|
|
|
80,190 |
|
|
|
67,979 |
|
Certificates of deposit with other banks |
|
|
— |
|
|
|
— |
|
|
|
— |
|
|
|
— |
|
|
|
249 |
|
Securities available for sale, at fair value |
|
|
149,315 |
|
|
|
140,121 |
|
|
|
133,949 |
|
|
|
115,490 |
|
|
|
78,779 |
|
Securities held to maturity, net of allowance for credit losses |
|
|
34,155 |
|
|
|
35,343 |
|
|
|
36,109 |
|
|
|
36,223 |
|
|
|
37,266 |
|
Loans receivable, gross |
|
|
2,215,868 |
|
|
|
2,193,197 |
|
|
|
2,129,919 |
|
|
|
2,128,284 |
|
|
|
978,912 |
|
Allowance for credit losses - loans |
|
|
(26,542 |
) |
|
|
(26,288 |
) |
|
|
(23,842 |
) |
|
|
(23,767 |
) |
|
|
(9,964 |
) |
Loans receivable, net |
|
|
2,189,326 |
|
|
|
2,166,909 |
|
|
|
2,106,077 |
|
|
|
2,104,517 |
|
|
|
968,948 |
|
Investments in restricted bank stock |
|
|
4,904 |
|
|
|
4,928 |
|
|
|
4,286 |
|
|
|
3,965 |
|
|
|
3,107 |
|
Premises and equipment, net |
|
|
17,623 |
|
|
|
18,364 |
|
|
|
20,102 |
|
|
|
20,130 |
|
|
|
6,414 |
|
Right-of-Use Asset – premises |
|
|
14,150 |
|
|
|
13,970 |
|
|
|
14,577 |
|
|
|
15,497 |
|
|
|
9,727 |
|
Bank-owned life insurance |
|
|
51,646 |
|
|
|
49,616 |
|
|
|
49,230 |
|
|
|
48,847 |
|
|
|
24,732 |
|
Goodwill and other intangible assets |
|
|
80,924 |
|
|
|
82,129 |
|
|
|
81,494 |
|
|
|
82,701 |
|
|
|
36,715 |
|
Deferred tax asset |
|
|
21,662 |
|
|
|
22,024 |
|
|
|
22,717 |
|
|
|
24,153 |
|
|
|
6,880 |
|
Assets held for sale |
|
|
104,660 |
|
|
|
118,362 |
|
|
|
118,115 |
|
|
|
115,499 |
|
|
|
— |
|
Accrued interest receivable and other assets |
|
|
20,344 |
|
|
|
25,170 |
|
|
|
26,730 |
|
|
|
22,113 |
|
|
|
14,899 |
|
TOTAL ASSETS |
|
$ |
2,879,941 |
|
|
$ |
2,858,593 |
|
|
$ |
2,785,669 |
|
|
$ |
2,669,325 |
|
|
$ |
1,255,695 |
|
LIABILITIES |
|
|
|
|
|
|
|
|
|
|
|
|
|
|
|
|||||
Deposits: |
|
|
|
|
|
|
|
|
|
|
|
|
|
|
|
|||||
Demand, noninterest bearing |
|
$ |
658,473 |
|
|
$ |
661,292 |
|
|
$ |
618,277 |
|
|
$ |
624,780 |
|
|
$ |
210,404 |
|
Interest bearing |
|
|
1,714,179 |
|
|
|
1,699,220 |
|
|
|
1,662,124 |
|
|
|
1,574,019 |
|
|
|
831,368 |
|
Total deposits |
|
|
2,372,652 |
|
|
|
2,360,512 |
|
|
|
2,280,401 |
|
|
|
2,198,799 |
|
|
|
1,041,772 |
|
Long-term borrowings |
|
|
40,000 |
|
|
|
40,000 |
|
|
|
40,000 |
|
|
|
— |
|
|
|
— |
|
Short-term borrowings |
|
|
— |
|
|
|
— |
|
|
|
— |
|
|
|
10,000 |
|
|
|
15,000 |
|
Note payable |
|
|
572 |
|
|
|
578 |
|
|
|
584 |
|
|
|
590 |
|
|
|
— |
|
Subordinated debt |
|
|
61,843 |
|
|
|
61,706 |
|
|
|
61,573 |
|
|
|
61,444 |
|
|
|
40,354 |
|
Lease liabilities |
|
|
14,911 |
|
|
|
14,746 |
|
|
|
15,357 |
|
|
|
16,361 |
|
|
|
9,728 |
|
Liabilities held for sale |
|
|
94,228 |
|
|
|
96,916 |
|
|
|
105,716 |
|
|
|
99,777 |
|
|
|
— |
|
Accrued interest payable and other liabilities |
|
|
18,382 |
|
|
|
12,726 |
|
|
|
13,795 |
|
|
|
16,558 |
|
|
|
7,490 |
|
TOTAL LIABILITIES |
|
|
2,602,588 |
|
|
|
2,587,184 |
|
|
|
2,517,426 |
|
|
|
2,403,529 |
|
|
|
1,114,344 |
|
SHAREHOLDERS’ EQUITY |
|
|
|
|
|
|
|
|
|
|
|
|
|
|
|
|||||
Preferred stock |
|
|
— |
|
|
|
— |
|
|
|
— |
|
|
|
— |
|
|
|
— |
|
Common stock |
|
|
370 |
|
|
|
370 |
|
|
|
369 |
|
|
|
369 |
|
|
|
162 |
|
Surplus |
|
|
264,059 |
|
|
|
263,795 |
|
|
|
263,577 |
|
|
|
263,310 |
|
|
|
127,856 |
|
Retained earnings |
|
|
15,147 |
|
|
|
10,826 |
|
|
|
7,724 |
|
|
|
4,843 |
|
|
|
19,062 |
|
Accumulated other comprehensive loss |
|
|
(2,223 |
) |
|
|
(3,582 |
) |
|
|
(3,427 |
) |
|
|
(3,209 |
) |
|
|
(5,729 |
) |
Total equity attributable to parent |
|
|
277,353 |
|
|
|
271,409 |
|
|
|
268,243 |
|
|
|
265,313 |
|
|
|
141,351 |
|
Noncontrolling interest in consolidated subsidiary |
|
|
— |
|
|
|
— |
|
|
|
— |
|
|
|
483 |
|
|
|
— |
|
TOTAL SHAREHOLDERS' EQUITY |
|
|
277,353 |
|
|
|
271,409 |
|
|
|
268,243 |
|
|
|
265,796 |
|
|
|
141,351 |
|
TOTAL LIABILITIES AND SHAREHOLDERS’ EQUITY |
|
$ |
2,879,941 |
|
|
$ |
2,858,593 |
|
|
$ |
2,785,669 |
|
|
$ |
2,669,325 |
|
|
$ |
1,255,695 |
|
Common shares outstanding |
|
|
37,361,560 |
|
|
|
37,356,278 |
|
|
|
37,348,151 |
|
|
|
37,340,700 |
|
|
|
16,235,871 |
|
Page 9 of 18
LINKBANCORP, Inc. and Subsidiaries |
|
|||||||||||||||||||||
Consolidated Statements of Operations (Unaudited) |
|
|||||||||||||||||||||
|
|
|
|
|
|
|
|
|
|
|
|
|
|
|
|
|
|
|||||
|
|
|
|
|
|
|
|
|
|
|
|
|
|
|
|
|
|
|||||
|
|
Three Months Ended |
|
Nine Months Ended |
|
|||||||||||||||||
|
|
9/30/2024 |
|
|
6/30/2024 |
|
|
9/30/2023 |
|
|
|
|
9/30/2024 |
|
|
9/30/2023 |
|
|||||
(In Thousands, except share and per share data) |
|
|
|
|
|
|
|
|
|
|
|
|
|
|
|
|
|
|||||
INTEREST AND DIVIDEND INCOME |
|
|
|
|
|
|
|
|
|
|
|
|
|
|
|
|
|
|||||
Loans receivable, including fees |
|
$ |
36,856 |
|
|
$ |
36,112 |
|
|
$ |
13,068 |
|
|
|
|
$ |
109,093 |
|
|
$ |
37,330 |
|
Other |
|
|
3,338 |
|
|
|
3,337 |
|
|
|
1,710 |
|
|
|
|
|
9,325 |
|
|
|
4,765 |
|
Total interest and dividend income |
|
|
40,194 |
|
|
|
39,449 |
|
|
|
14,778 |
|
|
|
|
|
118,418 |
|
|
|
42,095 |
|
INTEREST EXPENSE |
|
|
|
|
|
|
|
|
|
|
|
|
|
|
|
|
|
|||||
Deposits |
|
|
13,292 |
|
|
|
13,071 |
|
|
|
5,434 |
|
|
|
|
|
38,210 |
|
|
|
15,193 |
|
Other Borrowings |
|
|
949 |
|
|
|
932 |
|
|
|
550 |
|
|
|
|
|
2,967 |
|
|
|
1,196 |
|
Subordinated Debt |
|
|
972 |
|
|
|
962 |
|
|
|
442 |
|
|
|
|
|
2,892 |
|
|
|
1,311 |
|
Total interest expense |
|
|
15,213 |
|
|
|
14,965 |
|
|
|
6,426 |
|
|
|
|
|
44,069 |
|
|
|
17,700 |
|
NET INTEREST INCOME BEFORE |
|
|
24,981 |
|
|
|
24,484 |
|
|
|
8,352 |
|
|
|
|
|
74,349 |
|
|
|
24,395 |
|
Provision for (credit to) credit losses |
|
|
84 |
|
|
|
— |
|
|
|
(349 |
) |
|
|
|
|
125 |
|
|
|
(549 |
) |
NET INTEREST INCOME AFTER |
|
|
24,897 |
|
|
|
24,484 |
|
|
|
8,701 |
|
|
|
|
|
74,224 |
|
|
|
24,944 |
|
NONINTEREST INCOME |
|
|
|
|
|
|
|
|
|
|
|
|
|
|
|
|
|
|||||
Service charges on deposit accounts |
|
|
1,052 |
|
|
|
865 |
|
|
|
198 |
|
|
|
|
|
2,697 |
|
|
|
593 |
|
Bank-owned life insurance |
|
|
430 |
|
|
|
386 |
|
|
|
177 |
|
|
|
|
|
1,199 |
|
|
|
488 |
|
Net realized gains (losses) on the sale of debt securities |
|
|
— |
|
|
|
4 |
|
|
|
— |
|
|
|
|
|
4 |
|
|
|
(2,370 |
) |
Gain on sale of loans |
|
|
138 |
|
|
|
12 |
|
|
|
— |
|
|
|
|
|
200 |
|
|
|
296 |
|
Other |
|
|
1,060 |
|
|
|
591 |
|
|
|
505 |
|
|
|
|
|
2,167 |
|
|
|
905 |
|
Total noninterest income |
|
|
2,680 |
|
|
|
1,858 |
|
|
|
880 |
|
|
|
|
|
6,267 |
|
|
|
(88 |
) |
NONINTEREST EXPENSE |
|
|
|
|
|
|
|
|
|
|
|
|
|
|
|
|
|
|||||
Salaries and employee benefits |
|
|
9,855 |
|
|
|
9,941 |
|
|
|
4,193 |
|
|
|
|
|
30,914 |
|
|
|
12,350 |
|
Occupancy |
|
|
1,440 |
|
|
|
1,559 |
|
|
|
701 |
|
|
|
|
|
4,577 |
|
|
|
2,104 |
|
Equipment and data processing |
|
|
1,640 |
|
|
|
1,824 |
|
|
|
934 |
|
|
|
|
|
5,290 |
|
|
|
2,519 |
|
Professional fees |
|
|
763 |
|
|
|
788 |
|
|
|
363 |
|
|
|
|
|
2,299 |
|
|
|
1,162 |
|
FDIC insurance and supervisory fees |
|
|
812 |
|
|
|
545 |
|
|
|
276 |
|
|
|
|
|
1,709 |
|
|
|
619 |
|
Bank Shares Tax |
|
|
752 |
|
|
|
760 |
|
|
|
278 |
|
|
|
|
|
2,103 |
|
|
|
834 |
|
Intangible amortization |
|
|
1,205 |
|
|
|
1,204 |
|
|
|
59 |
|
|
|
|
|
3,616 |
|
|
|
179 |
|
Merger & restructuring expenses |
|
|
171 |
|
|
|
631 |
|
|
|
777 |
|
|
|
|
|
858 |
|
|
|
1,679 |
|
Advertising |
|
|
163 |
|
|
|
241 |
|
|
|
77 |
|
|
|
|
|
505 |
|
|
|
268 |
|
Other |
|
|
1,651 |
|
|
|
1,407 |
|
|
|
336 |
|
|
|
|
|
4,730 |
|
|
|
1,833 |
|
Total noninterest expense |
|
|
18,452 |
|
|
|
18,900 |
|
|
|
7,994 |
|
|
|
|
|
56,601 |
|
|
|
23,547 |
|
Income before income tax expense |
|
|
9,125 |
|
|
|
7,442 |
|
|
|
1,587 |
|
|
|
|
|
23,890 |
|
|
|
1,309 |
|
Income tax expense |
|
|
2,030 |
|
|
|
1,638 |
|
|
|
347 |
|
|
|
|
|
5,265 |
|
|
|
276 |
|
NET INCOME |
|
$ |
7,095 |
|
|
$ |
5,804 |
|
|
$ |
1,240 |
|
|
|
|
$ |
18,625 |
|
|
$ |
1,033 |
|
|
|
|
|
|
|
|
|
|
|
|
|
|
|
|
|
|
|
|||||
EARNINGS PER SHARE, BASIC |
|
$ |
0.19 |
|
|
$ |
0.16 |
|
|
$ |
0.08 |
|
|
|
|
$ |
0.50 |
|
|
$ |
0.06 |
|
EARNINGS PER SHARE, DILUTED |
|
$ |
0.19 |
|
|
$ |
0.16 |
|
|
$ |
0.08 |
|
|
|
|
$ |
0.50 |
|
|
$ |
0.06 |
|
WEIGHTED-AVERAGE COMMON SHARES |
|
|
|
|
|
|
|
|
|
|
|
|
|
|
|
|
|
|||||
BASIC |
|
|
36,983,637 |
|
|
|
36,970,768 |
|
|
|
16,235,144 |
|
|
|
|
|
36,972,127 |
|
|
|
15,984,151 |
|
DILUTED |
|
|
37,090,111 |
|
|
|
37,040,748 |
|
|
|
16,235,144 |
|
|
|
|
|
37,061,512 |
|
|
|
15,984,151 |
|
Page 10 of 18
LINKBANCORP, Inc. and Subsidiaries |
|
||||||||||||||||||
Financial Highlights (Unaudited) |
|
||||||||||||||||||
|
|
|
|
|
|
|
|
|
|
|
|
|
|
|
|||||
|
For the Three Months Ended |
|
|
For the Nine Months Ended |
|
||||||||||||||
(Dollars In Thousands, except per share data) |
9/30/2024 |
|
|
6/30/2024 |
|
|
9/30/2023 |
|
|
9/30/2024 |
|
|
9/30/2023 |
|
|||||
Operating Highlights |
|
|
|
|
|
|
|
|
|
|
|
|
|
|
|||||
Net Income |
$ |
7,095 |
|
|
$ |
5,804 |
|
|
$ |
1,240 |
|
|
$ |
18,625 |
|
|
$ |
1,033 |
|
Net Interest Income |
|
24,981 |
|
|
|
24,484 |
|
|
|
8,352 |
|
|
|
74,349 |
|
|
|
24,395 |
|
Provision for (credit to) Credit Losses |
|
84 |
|
|
|
- |
|
|
|
(349 |
) |
|
|
125 |
|
|
|
(549 |
) |
Non-Interest Income |
|
2,680 |
|
|
|
1,858 |
|
|
|
880 |
|
|
|
6,267 |
|
|
|
(88 |
) |
Non-Interest Expense |
|
18,452 |
|
|
|
18,900 |
|
|
|
7,994 |
|
|
|
56,601 |
|
|
|
23,547 |
|
Earnings per Share, Basic |
|
0.19 |
|
|
|
0.16 |
|
|
|
0.08 |
|
|
|
0.50 |
|
|
|
0.06 |
|
Adjusted Earnings per Share, Basic (2) |
|
0.20 |
|
|
|
0.17 |
|
|
|
0.11 |
|
|
|
0.52 |
|
|
|
0.26 |
|
Earnings per Share, Diluted |
|
0.19 |
|
|
|
0.16 |
|
|
|
0.08 |
|
|
|
0.50 |
|
|
|
0.06 |
|
Adjusted Earnings per Share, Diluted (2) |
|
0.19 |
|
|
|
0.17 |
|
|
|
0.11 |
|
|
|
0.52 |
|
|
|
0.26 |
|
|
|
|
|
|
|
|
|
|
|
|
|
|
|
|
|||||
Selected Operating Ratios |
|
|
|
|
|
|
|
|
|
|
|
|
|
|
|||||
Net Interest Margin |
|
3.82 |
% |
|
|
3.83 |
% |
|
|
2.89 |
% |
|
|
3.89 |
% |
|
|
2.88 |
% |
Annualized Return on Assets ("ROA") |
|
1.00 |
% |
|
|
0.84 |
% |
|
|
0.39 |
% |
|
|
0.90 |
% |
|
|
0.11 |
% |
Adjusted ROA2 |
|
1.02 |
% |
|
|
0.91 |
% |
|
|
0.59 |
% |
|
|
0.93 |
% |
|
|
0.46 |
% |
Annualized Return on Equity ("ROE") |
|
10.30 |
% |
|
|
8.65 |
% |
|
|
3.46 |
% |
|
|
9.20 |
% |
|
|
0.99 |
% |
Adjusted ROE2 |
|
10.50 |
% |
|
|
9.39 |
% |
|
|
5.17 |
% |
|
|
9.53 |
% |
|
|
4.04 |
% |
Efficiency Ratio |
|
66.71 |
% |
|
|
71.75 |
% |
|
|
86.59 |
% |
|
|
70.21 |
% |
|
|
96.87 |
% |
Adjusted Efficiency Ratio3 |
|
66.09 |
% |
|
|
69.36 |
% |
|
|
78.17 |
% |
|
|
69.15 |
% |
|
|
81.97 |
% |
Noninterest Income to Avg. Assets |
|
0.38 |
% |
|
|
0.27 |
% |
|
|
0.28 |
% |
|
|
0.30 |
% |
|
|
-0.01 |
% |
Noninterest Expense to Avg. Assets |
|
2.61 |
% |
|
|
2.73 |
% |
|
|
2.54 |
% |
|
|
2.73 |
% |
|
|
2.56 |
% |
|
|
|
|
|
|
|
|
|
|
|
|
|
|
|
|||||
|
|
|
|
|
|
|
|
|
|
|
|
|
|
|
|||||
|
9/30/2024 |
|
|
6/30/2024 |
|
|
3/31/2024 |
|
|
12/31/2023 |
|
|
9/30/2023 |
|
|||||
Financial Condition Data |
|
|
|
|
|
|
|
|
|
|
|
|
|
|
|||||
Total Assets |
$ |
2,879,941 |
|
|
$ |
2,858,593 |
|
|
$ |
2,785,669 |
|
|
$ |
2,669,325 |
|
|
$ |
1,255,695 |
|
Loans Receivable, Net |
|
2,189,326 |
|
|
|
2,166,909 |
|
|
|
2,106,077 |
|
|
|
2,104,517 |
|
|
|
968,948 |
|
|
|
|
|
|
|
|
|
|
|
|
|
|
|
|
|||||
Noninterest-bearing Deposits |
|
658,473 |
|
|
|
661,292 |
|
|
|
618,277 |
|
|
|
624,780 |
|
|
|
210,404 |
|
Interest-bearing Deposits |
|
1,714,179 |
|
|
|
1,699,220 |
|
|
|
1,662,124 |
|
|
|
1,574,019 |
|
|
|
831,368 |
|
Total Deposits |
|
2,372,652 |
|
|
|
2,360,512 |
|
|
|
2,280,401 |
|
|
|
2,198,799 |
|
|
|
1,041,772 |
|
|
|
|
|
|
|
|
|
|
|
|
|
|
|
|
|||||
Selected Balance Sheet Ratios |
|
|
|
|
|
|
|
|
|
|
|
|
|
|
|||||
Total Capital Ratio1 |
|
11.44 |
% |
|
|
11.09 |
% |
|
|
11.04 |
% |
|
|
10.62 |
% |
|
|
12.92 |
% |
Tier 1 Capital Ratio1 |
|
10.62 |
% |
|
|
10.30 |
% |
|
|
10.24 |
% |
|
|
9.92 |
% |
|
|
12.37 |
% |
Common Equity Tier 1 Capital Ratio1 |
|
10.62 |
% |
|
|
10.30 |
% |
|
|
10.24 |
% |
|
|
9.92 |
% |
|
|
12.37 |
% |
Leverage Ratio1 |
|
9.41 |
% |
|
|
9.17 |
% |
|
|
9.23 |
% |
|
|
14.13 |
% |
|
|
10.71 |
% |
Tangible Common Equity to Tangible Assets4 |
|
7.02 |
% |
|
|
6.82 |
% |
|
|
6.91 |
% |
|
|
7.08 |
% |
|
|
8.58 |
% |
Tangible Book Value per Share5 |
$ |
5.26 |
|
|
$ |
5.07 |
|
|
$ |
5.00 |
|
|
$ |
4.90 |
|
|
$ |
6.44 |
|
|
|
|
|
|
|
|
|
|
|
|
|
|
|
|
|||||
Asset Quality Data |
|
|
|
|
|
|
|
|
|
|
|
|
|
|
|||||
Non-performing Assets |
$ |
17,378 |
|
|
$ |
10,589 |
|
|
$ |
6,675 |
|
|
$ |
7,250 |
|
|
$ |
2,958 |
|
Non-performing Assets to Total Assets |
|
0.60 |
% |
|
|
0.37 |
% |
|
|
0.24 |
% |
|
|
0.27 |
% |
|
|
0.24 |
% |
Non-performing Loans to Total Loans |
|
0.78 |
% |
|
|
0.48 |
% |
|
|
0.31 |
% |
|
|
0.34 |
% |
|
|
0.30 |
% |
Allowance for Credit Losses - Loans ("ACLL") |
$ |
26,542 |
|
|
$ |
26,288 |
|
|
$ |
23,842 |
|
|
$ |
23,767 |
|
|
$ |
9,964 |
|
ACLL to Total Loans6 |
|
1.20 |
% |
|
|
1.20 |
% |
|
|
1.06 |
% |
|
|
1.06 |
% |
|
|
1.02 |
% |
ACLL to Nonperforming Assets |
|
152.73 |
% |
|
|
248.26 |
% |
|
|
357.18 |
% |
|
|
327.82 |
% |
|
|
336.85 |
% |
Net (recoveries) chargeoffs |
$ |
(28 |
) |
|
$ |
(20 |
) |
|
$ |
70 |
|
|
$ |
195 |
|
|
$ |
(12 |
) |
|
|
|
|
|
|
|
|
|
|
|
|
|
|
|
|||||
(1) - These capital ratios have been calculated using bank-level capital |
|
||||||||||||||||||
(2) - This is a non-GAAP financial measure. See our reconciliation of non-GAAP financial measures to their most directly comparable GAAP financial measures at the end of this release. |
|
||||||||||||||||||
(3) - The efficiency ratio, as adjusted represents noninterest expense divided by the sum of net interest income and noninterest income, excluding gains or losses from securities sales and merger related expenses. This is a non-GAAP financial measure. See our reconciliation of non-GAAP financial measures to their most directly comparable GAAP financial measures at the end of this release. |
|
||||||||||||||||||
Page 11 of 18
(4) - We calculate tangible common equity as total shareholders' equity less goodwill and other intangibles, and we calculate tangible assets as total assets less goodwill and other intangibles. This is a non-GAAP financial measure. See our reconciliation of non-GAAP financial measures to their most directly comparable GAAP financial measures at the end of this release. |
|
(5) - We calculate tangible book value per common share as total shareholders' equity less goodwill and other intangibles, divided by the outstanding number of shares of our common stock at the end of the relevant period. Tangible book value per common share is a non-GAAP financial measure, and, as we calculate tangible book value per common share, the most directly comparable GAAP financial measure is book value per common share. See our reconciliation of non-GAAP financial measures to their most directly comparable GAAP financial measures at the end of this release. |
|
(6) - The historical ratios have not been recast for the reclassification of loans held for sale. |
|
LINKBANCORP, Inc. and Subsidiaries |
|
|||||||||||||||||||||||
Net Interest Margin - Quarter-To-Date (Unaudited) |
|
|||||||||||||||||||||||
|
|
|
|
|
|
|
|
|
|
|
|
|
|
|
|
|
|
|
||||||
|
|
For the Three Months Ended September 30, |
|
|||||||||||||||||||||
|
|
2024 |
|
|
2023 |
|
||||||||||||||||||
(Dollars in thousands) |
|
Avg Bal |
|
|
Interest (2) |
|
|
Yield/Rate |
|
|
Avg Bal |
|
|
Interest (2) |
|
|
Yield/Rate |
|
||||||
Int. Earn. Cash |
|
$ |
114,383 |
|
|
$ |
1,296 |
|
|
|
4.51 |
% |
|
$ |
55,514 |
|
|
$ |
577 |
|
|
|
4.12 |
% |
Securities |
|
|
|
|
|
|
|
|
|
|
|
|
|
|
|
|
|
|
||||||
Taxable (1) |
|
|
133,443 |
|
|
|
1,683 |
|
|
|
5.02 |
% |
|
|
82,499 |
|
|
|
833 |
|
|
|
4.01 |
% |
Tax-Exempt |
|
|
42,800 |
|
|
|
453 |
|
|
|
4.21 |
% |
|
|
38,589 |
|
|
|
378 |
|
|
|
3.89 |
% |
Total Securities |
|
|
176,243 |
|
|
|
2,136 |
|
|
|
4.82 |
% |
|
|
121,088 |
|
|
|
1,211 |
|
|
|
3.97 |
% |
Total Cash Equiv. and Investments |
|
|
290,626 |
|
|
|
3,432 |
|
|
|
4.70 |
% |
|
|
176,602 |
|
|
|
1,788 |
|
|
|
4.02 |
% |
Total Loans (3)(4) |
|
|
2,313,228 |
|
|
|
36,856 |
|
|
|
6.34 |
% |
|
|
971,877 |
|
|
|
13,068 |
|
|
|
5.33 |
% |
Total Earning Assets |
|
|
2,603,854 |
|
|
|
40,288 |
|
|
|
6.16 |
% |
|
|
1,148,479 |
|
|
|
14,856 |
|
|
|
5.13 |
% |
Other Assets |
|
|
208,407 |
|
|
|
|
|
|
|
|
|
97,995 |
|
|
|
|
|
|
|
||||
Total Assets |
|
$ |
2,812,261 |
|
|
|
|
|
|
|
|
$ |
1,246,474 |
|
|
|
|
|
|
|
||||
Interest bearing demand(5) |
|
$ |
497,100 |
|
|
$ |
2,902 |
|
|
|
2.32 |
% |
|
$ |
254,725 |
|
|
$ |
1,490 |
|
|
|
2.32 |
% |
Money market demand(5) |
|
|
580,766 |
|
|
|
3,396 |
|
|
|
2.33 |
% |
|
|
254,849 |
|
|
|
1,827 |
|
|
|
2.84 |
% |
Time deposits(5) |
|
|
613,402 |
|
|
|
6,993 |
|
|
|
4.54 |
% |
|
|
265,573 |
|
|
|
2,117 |
|
|
|
3.16 |
% |
Total Borrowings |
|
|
153,699 |
|
|
|
1,922 |
|
|
|
0.00 |
% |
|
|
102,669 |
|
|
|
992 |
|
|
|
3.83 |
% |
Total Interest-Bearing Liabilities |
|
|
1,844,967 |
|
|
|
15,213 |
|
|
|
3.28 |
% |
|
|
877,816 |
|
|
|
6,426 |
|
|
|
2.90 |
% |
Non Interest-Bearing Deposits(5) |
|
|
659,825 |
|
|
|
|
|
|
|
|
|
209,054 |
|
|
|
|
|
|
|
||||
Total Cost of Funds |
|
$ |
2,504,792 |
|
|
$ |
15,213 |
|
|
|
2.42 |
% |
|
$ |
1,086,870 |
|
|
$ |
6,426 |
|
|
|
2.35 |
% |
Other Liabilities |
|
|
33,534 |
|
|
|
|
|
|
|
|
|
17,230 |
|
|
|
|
|
|
|
||||
Total Liabilities |
|
$ |
2,538,326 |
|
|
|
|
|
|
|
|
$ |
1,104,100 |
|
|
|
|
|
|
|
||||
Shareholders' Equity |
|
$ |
273,935 |
|
|
|
|
|
|
|
|
$ |
142,374 |
|
|
|
|
|
|
|
||||
Total Liabilities & Shareholders' Equity |
|
$ |
2,812,261 |
|
|
|
|
|
|
|
|
$ |
1,246,474 |
|
|
|
|
|
|
|
||||
Net Interest Income/Spread (FTE) |
|
|
|
|
|
25,075 |
|
|
|
2.88 |
% |
|
|
|
|
|
8,430 |
|
|
|
2.23 |
% |
||
Tax-Equivalent Basis Adjustment |
|
|
|
|
|
(94 |
) |
|
|
|
|
|
|
|
|
(78 |
) |
|
|
|
||||
Net Interest Income |
|
|
|
|
$ |
24,981 |
|
|
|
|
|
|
|
|
$ |
8,352 |
|
|
|
|
||||
Net Interest Margin |
|
|
|
|
|
|
|
|
3.82 |
% |
|
|
|
|
|
|
|
|
2.89 |
% |
||||
(1) Taxable income on securities includes income from available for sale securities and income from certificates of deposits with other banks. |
|
|||||||||||||||||||||||
(2) Income stated on a tax equivalent basis which is a non-GAAP measure and reconciled to GAAP at the bottom of the table |
|
|||||||||||||||||||||||
(3) Includes the balances of nonaccrual loans |
|
|||||||||||||||||||||||
(4) Includes the balances of loans held for sale |
|
|||||||||||||||||||||||
(5) Includes the balances of deposits held for sale |
|
|||||||||||||||||||||||
Page 12 of 18
LINKBANCORP, Inc. and Subsidiaries |
|
|||||||||||||||||||||||
Net Interest Margin - Linked Quarter-To-Date (Unaudited) |
|
|||||||||||||||||||||||
|
|
|
|
|
|
|
|
|
|
|
|
|
|
|
|
|
|
|
||||||
|
|
For the Three Months Ended |
|
|||||||||||||||||||||
|
|
September 30, 2024 |
|
|
June 30, 2024 |
|
||||||||||||||||||
(Dollars in thousands) |
|
Avg Bal |
|
|
Interest (2) |
|
|
Yield/Rate |
|
|
Avg Bal |
|
|
Interest (2) |
|
|
Yield/Rate |
|
||||||
Int. Earn. Cash |
|
$ |
114,383 |
|
|
$ |
1,296 |
|
|
|
4.51 |
% |
|
$ |
121,340 |
|
|
$ |
1,395 |
|
|
|
4.62 |
% |
Securities |
|
|
|
|
|
|
|
|
|
|
|
|
|
|
|
|
|
|
||||||
Taxable (1) |
|
|
133,443 |
|
|
|
1,683 |
|
|
|
5.02 |
% |
|
|
125,885 |
|
|
|
1,592 |
|
|
|
5.09 |
% |
Tax-Exempt |
|
|
42,800 |
|
|
|
453 |
|
|
|
4.21 |
% |
|
|
41,776 |
|
|
|
443 |
|
|
|
4.26 |
% |
Total Securities |
|
|
176,243 |
|
|
|
2,136 |
|
|
|
4.82 |
% |
|
|
167,661 |
|
|
|
2,035 |
|
|
|
4.88 |
% |
Total Cash Equiv. and Investments |
|
|
290,626 |
|
|
|
3,432 |
|
|
|
4.70 |
% |
|
|
289,001 |
|
|
|
3,430 |
|
|
|
4.77 |
% |
Total Loans (3)(4) |
|
|
2,313,228 |
|
|
|
36,856 |
|
|
|
6.34 |
% |
|
|
2,280,041 |
|
|
|
36,112 |
|
|
|
6.37 |
% |
Total Earning Assets |
|
|
2,603,854 |
|
|
|
40,288 |
|
|
|
6.16 |
% |
|
|
2,569,042 |
|
|
|
39,542 |
|
|
|
6.19 |
% |
Other Assets |
|
|
208,407 |
|
|
|
|
|
|
|
|
|
212,097 |
|
|
|
|
|
|
|
||||
Total Assets |
|
$ |
2,812,261 |
|
|
|
|
|
|
|
|
$ |
2,781,139 |
|
|
|
|
|
|
|
||||
Interest bearing demand(5) |
|
$ |
497,100 |
|
|
|
2,902 |
|
|
|
2.32 |
% |
|
$ |
446,109 |
|
|
$ |
2,457 |
|
|
|
2.22 |
% |
Money market demand(5) |
|
|
580,766 |
|
|
|
3,396 |
|
|
|
2.33 |
% |
|
|
581,223 |
|
|
|
3,271 |
|
|
|
2.26 |
% |
Time deposits(5) |
|
|
613,402 |
|
|
|
6,993 |
|
|
|
4.54 |
% |
|
|
642,919 |
|
|
|
7,343 |
|
|
|
4.59 |
% |
Total Borrowings |
|
|
153,699 |
|
|
|
1,922 |
|
|
|
4.97 |
% |
|
|
151,596 |
|
|
|
1,894 |
|
|
|
5.02 |
% |
Total Interest-Bearing Liabilities |
|
|
1,844,967 |
|
|
|
15,213 |
|
|
|
3.28 |
% |
|
|
1,821,847 |
|
|
|
14,965 |
|
|
|
3.30 |
% |
Non Interest-Bearing Deposits(5) |
|
|
659,825 |
|
|
|
|
|
|
|
|
|
657,939 |
|
|
|
|
|
|
|
||||
Total Cost of Funds |
|
$ |
2,504,792 |
|
|
$ |
15,213 |
|
|
|
2.42 |
% |
|
$ |
2,479,786 |
|
|
$ |
14,965 |
|
|
|
2.43 |
% |
Other Liabilities |
|
|
33,534 |
|
|
|
|
|
|
|
|
|
31,519 |
|
|
|
|
|
|
|
||||
Total Liabilities |
|
$ |
2,538,326 |
|
|
|
|
|
|
|
|
$ |
2,511,305 |
|
|
|
|
|
|
|
||||
Shareholders' Equity |
|
$ |
273,935 |
|
|
|
|
|
|
|
|
$ |
269,834 |
|
|
|
|
|
|
|
||||
Total Liabilities & Shareholders' Equity |
|
$ |
2,812,261 |
|
|
|
|
|
|
|
|
$ |
2,781,139 |
|
|
|
|
|
|
|
||||
Net Interest Income/Spread (FTE) |
|
|
|
|
|
25,075 |
|
|
|
2.88 |
% |
|
|
|
|
|
24,577 |
|
|
|
2.89 |
% |
||
Tax-Equivalent Basis Adjustment |
|
|
|
|
|
(94 |
) |
|
|
|
|
|
|
|
|
(93 |
) |
|
|
|
||||
Net Interest Income |
|
|
|
|
$ |
24,981 |
|
|
|
|
|
|
|
|
$ |
24,484 |
|
|
|
|
||||
Net Interest Margin |
|
|
|
|
|
|
|
|
3.82 |
% |
|
|
|
|
|
|
|
|
3.83 |
% |
||||
(1) Taxable income on securities includes income from available for sale securities and income from certificates of deposits with other banks. |
|
|||||||||||||||||||||||
(2) Income stated on a tax equivalent basis which is a non-GAAP measure and reconciled to GAAP at the bottom of the table |
|
|||||||||||||||||||||||
(3) Includes the balances of nonaccrual loans |
|
|||||||||||||||||||||||
(4) Includes the balances of loans held for sale |
|
|||||||||||||||||||||||
(5) Includes the balances of deposits held for sale |
|
|||||||||||||||||||||||
Page 13 of 18
LINKBANCORP, Inc. and Subsidiaries |
|
|||||||||||||||||||||||
Net Interest Margin - Year-To-Date (Unaudited) |
|
|||||||||||||||||||||||
|
|
|
|
|
|
|
|
|
|
|
|
|
|
|
|
|
|
|
||||||
|
|
For the Nine Months Ended September 30, |
|
|||||||||||||||||||||
|
|
2024 |
|
|
2023 |
|
||||||||||||||||||
(Dollars in thousands) |
|
Avg Bal |
|
|
Interest (2) |
|
|
Yield/Rate |
|
|
Avg Bal |
|
|
Interest (2) |
|
|
Yield/Rate |
|
||||||
Int. Earn. Cash |
|
$ |
106,334 |
|
|
$ |
3,590 |
|
|
|
4.51 |
% |
|
$ |
51,547 |
|
|
$ |
1,561 |
|
|
|
4.05 |
% |
Securities |
|
|
|
|
|
|
|
|
|
|
|
|
|
|
|
|
|
|
||||||
Taxable (1) |
|
|
125,264 |
|
|
|
4,666 |
|
|
|
4.98 |
% |
|
|
83,449 |
|
|
|
2,309 |
|
|
|
3.70 |
% |
Tax-Exempt |
|
|
42,606 |
|
|
|
1,353 |
|
|
|
4.24 |
% |
|
|
38,617 |
|
|
|
1,133 |
|
|
|
3.92 |
% |
Total Securities |
|
|
167,870 |
|
|
|
6,019 |
|
|
|
4.79 |
% |
|
|
122,066 |
|
|
|
3,442 |
|
|
|
3.77 |
% |
Total Cash Equiv. and Investments |
|
|
274,204 |
|
|
|
9,609 |
|
|
|
4.68 |
% |
|
|
173,613 |
|
|
|
5,003 |
|
|
|
3.85 |
% |
Total Loans (3)(4) |
|
|
2,279,378 |
|
|
|
109,093 |
|
|
|
6.39 |
% |
|
|
958,382 |
|
|
|
37,330 |
|
|
|
5.21 |
% |
Total Earning Assets |
|
|
2,553,582 |
|
|
|
118,702 |
|
|
|
6.21 |
% |
|
|
1,131,995 |
|
|
|
42,333 |
|
|
|
5.00 |
% |
Other Assets |
|
|
210,962 |
|
|
|
|
|
|
|
|
|
95,400 |
|
|
|
|
|
|
|
||||
Total Assets |
|
$ |
2,764,544 |
|
|
|
|
|
|
|
|
$ |
1,227,395 |
|
|
|
|
|
|
|
||||
Interest bearing demand(5) |
|
$ |
458,184 |
|
|
$ |
7,301 |
|
|
|
2.13 |
% |
|
$ |
250,830 |
|
|
$ |
3,938 |
|
|
|
2.10 |
% |
Money market demand(5) |
|
|
582,998 |
|
|
|
9,841 |
|
|
|
2.25 |
% |
|
|
248,731 |
|
|
|
4,766 |
|
|
|
2.56 |
% |
Time deposits(5) |
|
|
621,881 |
|
|
|
21,068 |
|
|
|
4.53 |
% |
|
|
285,666 |
|
|
|
6,489 |
|
|
|
3.04 |
% |
Total Borrowings |
|
|
147,557 |
|
|
|
5,859 |
|
|
|
5.30 |
% |
|
|
81,749 |
|
|
|
2,507 |
|
|
|
4.10 |
% |
Total Interest-Bearing Liabilities |
|
|
1,810,620 |
|
|
|
44,069 |
|
|
|
3.25 |
% |
|
|
866,976 |
|
|
|
17,700 |
|
|
|
2.73 |
% |
Non Interest-Bearing Deposits(5) |
|
|
650,384 |
|
|
|
|
|
|
|
|
|
203,284 |
|
|
|
|
|
|
|
||||
Total Cost of Funds |
|
$ |
2,461,004 |
|
|
$ |
44,069 |
|
|
|
2.39 |
% |
|
$ |
1,070,260 |
|
|
$ |
17,700 |
|
|
|
2.21 |
% |
Other Liabilities |
|
|
33,086 |
|
|
|
|
|
|
|
|
|
17,024 |
|
|
|
|
|
|
|
||||
Total Liabilities |
|
$ |
2,494,090 |
|
|
|
|
|
|
|
|
$ |
1,087,284 |
|
|
|
|
|
|
|
||||
Shareholders' Equity |
|
$ |
270,454 |
|
|
|
|
|
|
|
|
$ |
140,005 |
|
|
|
|
|
|
|
||||
Total Liabilities & Shareholders' Equity |
|
$ |
2,764,544 |
|
|
|
|
|
|
|
|
$ |
1,227,289 |
|
|
|
|
|
|
|
||||
Net Interest Income/Spread (FTE) |
|
|
|
|
|
74,633 |
|
|
|
2.96 |
% |
|
|
|
|
|
24,633 |
|
|
|
2.27 |
% |
||
Tax-Equivalent Basis Adjustment |
|
|
|
|
|
(284 |
) |
|
|
|
|
|
|
|
|
(238 |
) |
|
|
|
||||
Net Interest Income |
|
|
|
|
$ |
74,349 |
|
|
|
|
|
|
|
|
$ |
24,395 |
|
|
|
|
||||
Net Interest Margin |
|
|
|
|
|
|
|
|
3.89 |
% |
|
|
|
|
|
|
|
|
2.88 |
% |
||||
(1) Taxable income on securities includes income from available for sale securities and income from certificates of deposits with other banks. |
|
|||||||||||||||||||||||
(2) Income stated on a tax equivalent basis which is a non-GAAP measure and reconciled to GAAP at the bottom of the table |
|
|||||||||||||||||||||||
(3) Includes the balances of nonaccrual loans |
|
|||||||||||||||||||||||
(4) Includes the balances of loans held for sale |
|
|||||||||||||||||||||||
(5) Includes the balances of deposits held for sale |
|
|||||||||||||||||||||||
Page 14 of 18
LINKBANCORP, Inc. and Subsidiaries |
|
|||||||||||||||||||
Loans Receivable Detail (Unaudited) |
|
|||||||||||||||||||
|
|
|
|
|
|
|
|
|
|
|
|
|
|
|
|
|||||
(In Thousands) |
|
September 30, 2024 |
|
|
June 30, 2024 |
|
|
March 31, 2024 |
|
|
December 31, 2023 |
|
|
September 30, 2023 |
|
|||||
Agriculture and farmland loans |
|
$ |
65,166 |
|
|
$ |
66,937 |
|
|
$ |
67,359 |
|
|
$ |
65,861 |
|
|
$ |
50,584 |
|
Construction loans |
|
|
175,373 |
|
|
|
201,174 |
|
|
|
194,391 |
|
|
|
178,483 |
|
|
|
65,836 |
|
Commercial & industrial loans |
|
|
241,597 |
|
|
|
247,190 |
|
|
|
218,724 |
|
|
|
238,343 |
|
|
|
115,572 |
|
Commercial real estate loans |
|
|
|
|
|
|
|
|
|
|
|
|
|
|
|
|||||
Multifamily |
|
|
212,444 |
|
|
|
199,740 |
|
|
|
190,146 |
|
|
|
180,788 |
|
|
|
111,853 |
|
Owner occupied |
|
|
500,643 |
|
|
|
492,065 |
|
|
|
489,467 |
|
|
|
501,732 |
|
|
|
160,929 |
|
Non-owner occupied |
|
|
626,030 |
|
|
|
610,649 |
|
|
|
589,731 |
|
|
|
580,972 |
|
|
|
257,344 |
|
Residential real estate loans |
|
|
|
|
|
|
|
|
|
|
|
|
|
|
|
|||||
First liens |
|
|
400,869 |
|
|
|
400,098 |
|
|
|
403,300 |
|
|
|
402,433 |
|
|
|
172,481 |
|
Second liens and lines of credit |
|
|
73,591 |
|
|
|
71,168 |
|
|
|
71,060 |
|
|
|
70,747 |
|
|
|
27,870 |
|
Consumer and other loans |
|
|
17,498 |
|
|
|
15,514 |
|
|
|
16,810 |
|
|
|
16,756 |
|
|
|
11,869 |
|
Municipal loans |
|
|
4,296 |
|
|
|
4,362 |
|
|
|
4,473 |
|
|
|
5,244 |
|
|
|
4,137 |
|
|
|
|
2,317,507 |
|
|
|
2,308,897 |
|
|
|
2,245,461 |
|
|
|
2,241,359 |
|
|
|
978,475 |
|
Deferred costs |
|
|
634 |
|
|
|
478 |
|
|
|
356 |
|
|
|
174 |
|
|
|
437 |
|
Total loans receivable |
|
|
2,318,141 |
|
|
|
2,309,375 |
|
|
|
2,245,817 |
|
|
|
2,241,533 |
|
|
|
978,912 |
|
Less: Loans held for sale |
|
|
102,273 |
|
|
|
116,178 |
|
|
|
115,898 |
|
|
|
113,249 |
|
|
|
- |
|
Loans Held for Investment |
|
$ |
2,215,868 |
|
|
$ |
2,193,197 |
|
|
$ |
2,129,919 |
|
|
$ |
2,128,284 |
|
|
$ |
978,912 |
|
Page 15 of 18
LINKBANCORP, Inc. and Subsidiaries |
|
|
|
|
||||||||||||
Investments in Securities Detail (Unaudited) |
|
|
|
|
||||||||||||
|
|
|
|
|
|
|
|
|
|
|
|
|
||||
|
|
September 30, 2024 |
|
|
|
|
||||||||||
(In Thousands) |
|
Amortized |
|
|
Net |
|
|
Fair |
|
|
|
|
||||
Available for Sale: |
|
|
|
|
|
|
|
|
|
|
|
|
||||
US Government Agency securities |
|
$ |
11,935 |
|
|
$ |
442 |
|
|
$ |
12,377 |
|
|
|
|
|
Obligations of state and political subdivisions |
|
|
51,124 |
|
|
|
(2,529 |
) |
|
|
48,595 |
|
|
|
|
|
Mortgage-backed securities in government-sponsored entities |
|
|
88,528 |
|
|
|
(700 |
) |
|
|
87,828 |
|
|
|
|
|
Other securities |
|
|
524 |
|
|
|
(9 |
) |
|
|
515 |
|
|
|
|
|
|
|
$ |
152,111 |
|
|
$ |
(2,796 |
) |
|
$ |
149,315 |
|
|
|
|
|
|
|
|
|
|
|
|
|
|
|
|
|
|
||||
|
|
Amortized |
|
|
Net Unrealized Gains (Losses) |
|
|
Fair Value |
|
|
Allowance for Credit Losses |
|
||||
Held to Maturity: |
|
|
|
|
|
|
|
|
|
|
|
|
||||
Corporate debentures |
|
$ |
15,000 |
|
|
$ |
(1,198 |
) |
|
$ |
13,802 |
|
|
$ |
(471 |
) |
Structured mortgage-backed securities |
|
|
19,626 |
|
|
|
(605 |
) |
|
|
19,021 |
|
|
|
- |
|
|
|
$ |
34,626 |
|
|
$ |
(1,803 |
) |
|
$ |
32,823 |
|
|
$ |
(471 |
) |
|
|
|
|
|
|
|
|
|
|
|
|
|
||||
|
|
December 31, 2023 |
|
|
|
|
||||||||||
(In Thousands) |
|
Amortized |
|
|
Net |
|
|
Fair |
|
|
|
|
||||
Available for Sale: |
|
|
|
|
|
|
|
|
|
|
|
|
||||
US Government Agency securities |
|
$ |
12,711 |
|
|
$ |
274 |
|
|
$ |
12,985 |
|
|
|
|
|
US Government Treasury securities |
|
|
4,925 |
|
|
|
17 |
|
|
|
4,942 |
|
|
|
|
|
Obligations of state and political subdivisions |
|
|
49,640 |
|
|
|
(2,595 |
) |
|
|
47,045 |
|
|
|
|
|
Mortgage-backed securities in government-sponsored entities |
|
|
50,795 |
|
|
|
(2,614 |
) |
|
|
48,181 |
|
|
|
|
|
Other securities |
|
|
2,301 |
|
|
|
36 |
|
|
|
2,337 |
|
|
|
|
|
|
|
$ |
120,372 |
|
|
$ |
(4,882 |
) |
|
$ |
115,490 |
|
|
|
|
|
|
|
|
|
|
|
|
|
|
|
|
|
|
||||
|
|
Amortized |
|
|
Net Unrealized Gains (Losses) |
|
|
Fair Value |
|
|
Allowance for Credit Losses |
|
||||
Held to Maturity: |
|
|
|
|
|
|
|
|
|
|
|
|
||||
Corporate debentures |
|
$ |
15,000 |
|
|
$ |
(1,592 |
) |
|
$ |
13,408 |
|
|
$ |
(512 |
) |
Structured mortgage-backed securities |
|
|
21,735 |
|
|
|
(907 |
) |
|
|
20,828 |
|
|
|
- |
|
|
|
$ |
36,735 |
|
|
$ |
(2,499 |
) |
|
$ |
34,236 |
|
|
$ |
(512 |
) |
Page 16 of 18
LINKBANCORP, Inc. and Subsidiaries |
|
|||||||||||||||||||
Deposits Detail (Unaudited) |
|
|||||||||||||||||||
|
|
|
|
|
|
|
|
|
|
|
|
|
|
|
|
|||||
(In Thousands) |
|
September 30, 2024 |
|
|
June 30, 2024 |
|
|
March 31, 2024 |
|
|
December 31, 2023 |
|
|
September 30, 2023 |
|
|||||
Demand, noninterest-bearing |
|
$ |
687,536 |
|
|
$ |
692,095 |
|
|
$ |
653,719 |
|
|
$ |
655,953 |
|
|
$ |
210,404 |
|
Demand, interest-bearing |
|
|
547,099 |
|
|
|
488,043 |
|
|
|
447,412 |
|
|
|
438,765 |
|
|
|
273,673 |
|
Money market and savings |
|
|
585,395 |
|
|
|
582,561 |
|
|
|
591,982 |
|
|
|
577,448 |
|
|
|
258,334 |
|
Time deposits, $250 and over |
|
|
169,616 |
|
|
|
156,621 |
|
|
|
147,898 |
|
|
|
134,324 |
|
|
|
51,563 |
|
Time deposits, other |
|
|
401,976 |
|
|
|
393,603 |
|
|
|
398,365 |
|
|
|
372,572 |
|
|
|
172,798 |
|
Brokered deposits |
|
|
75,000 |
|
|
|
144,429 |
|
|
|
146,653 |
|
|
|
119,411 |
|
|
|
75,000 |
|
|
|
|
2,466,622 |
|
|
|
2,457,352 |
|
|
|
2,386,029 |
|
|
|
2,298,473 |
|
|
|
1,041,772 |
|
Less: Deposits held for sale |
|
|
93,970 |
|
|
|
96,840 |
|
|
|
105,628 |
|
|
|
99,674 |
|
|
|
— |
|
Total deposits |
|
$ |
2,372,652 |
|
|
$ |
2,360,512 |
|
|
$ |
2,280,401 |
|
|
$ |
2,198,799 |
|
|
$ |
1,041,772 |
|
|
|
|
|
|
|
|
|
|
|
|
|
|
|
|
|
|||||
|
|
|
|
|
|
|
|
|
|
|
|
|
|
|
|
|||||
Average Deposits Detail, for the Three Months Ended (Unaudited) |
|
|||||||||||||||||||
|
|
|
|
|
|
|
|
|
|
|
|
|
|
|
|
|||||
(In Thousands) |
|
September 30, 2024 |
|
|
June 30, 2024 |
|
|
March 31, 2024 |
|
|
December 31, 2023 |
|
|
September 30, 2023 |
|
|||||
Demand, noninterest-bearing |
|
$ |
659,825 |
|
|
$ |
657,939 |
|
|
$ |
632,637 |
|
|
$ |
371,051 |
|
|
$ |
209,054 |
|
Demand, interest-bearing |
|
|
497,100 |
|
|
|
446,109 |
|
|
|
424,781 |
|
|
|
328,342 |
|
|
|
254,725 |
|
Money market and savings |
|
|
580,766 |
|
|
|
581,223 |
|
|
|
587,455 |
|
|
|
367,821 |
|
|
|
254,849 |
|
Time deposits |
|
|
560,815 |
|
|
|
547,582 |
|
|
|
518,929 |
|
|
|
317,747 |
|
|
|
236,869 |
|
Brokered deposits |
|
|
52,587 |
|
|
|
95,337 |
|
|
|
89,263 |
|
|
|
30,832 |
|
|
|
28,705 |
|
Total deposits |
|
$ |
2,351,093 |
|
|
$ |
2,328,190 |
|
|
$ |
2,253,065 |
|
|
$ |
1,415,793 |
|
|
$ |
984,202 |
|
Balances in table above include deposits held for sale |
|
|||||||||||||||||||
Page 17 of 18
Appendix A – Reconciliation to Non-GAAP Financial Measures
This document contains supplemental financial information determined by methods other than in accordance with accounting principles generally accepted in the United States of America (“GAAP”). Management uses these non-GAAP measures in its analysis of the Company’s performance. These measures should not be considered a substitute for GAAP basis measures nor should they be viewed as a substitute for operating results determined in accordance with GAAP. Management believes the presentation of non-GAAP financial measures that exclude the impact of specified items provide useful supplemental information that is essential to a proper understanding of the Company’s financial condition and results. Non-GAAP measures are not formally defined under GAAP, and other entities may use calculation methods that differ from those used by us. As a complement to GAAP financial measures, our management believes these non-GAAP financial measures assist investors in comparing the financial condition and results of operations of financial institutions due to the industry prevalence of such non-GAAP measures. See the tables below for a reconciliation of these non-GAAP measures to the most directly comparable GAAP financial measures.
Adjusted Return on Average Assets |
|
||||||||||||||||||
|
For the Three Months Ended |
|
|
For the Nine Months Ended |
|
||||||||||||||
(Dollars in thousands) |
9/30/2024 |
|
|
6/30/2024 |
|
|
9/30/2023 |
|
|
9/30/2024 |
|
|
9/30/2023 |
|
|||||
Net income |
$ |
7,095 |
|
|
$ |
5,804 |
|
|
$ |
1,240 |
|
|
$ |
18,625 |
|
|
$ |
1,033 |
|
Average assets |
|
2,812,261 |
|
|
|
2,781,139 |
|
|
|
1,246,474 |
|
|
|
2,764,544 |
|
|
|
1,227,395 |
|
Return on average assets (annualized) |
|
1.00 |
% |
|
|
0.84 |
% |
|
|
0.39 |
% |
|
|
0.90 |
% |
|
|
0.11 |
% |
Net income |
|
7,095 |
|
|
|
5,804 |
|
|
|
1,240 |
|
|
|
18,625 |
|
|
|
1,033 |
|
Net (gains) losses on sale of securities |
|
- |
|
|
|
(4 |
) |
|
|
- |
|
|
|
(4 |
) |
|
|
2,370 |
|
Tax effect at 21% |
|
- |
|
|
|
1 |
|
|
|
- |
|
|
|
1 |
|
|
|
(498 |
) |
Merger & restructuring expenses |
|
171 |
|
|
|
631 |
|
|
|
777 |
|
|
|
858 |
|
|
|
1,679 |
|
Tax effect at 21% |
|
(36 |
) |
|
|
(133 |
) |
|
|
(163 |
) |
|
|
(180 |
) |
|
|
(353 |
) |
Adjusted Net Income (Non-GAAP) |
|
7,230 |
|
|
|
6,299 |
|
|
|
1,854 |
|
|
|
19,300 |
|
|
|
4,231 |
|
Average assets |
|
2,812,261 |
|
|
|
2,781,139 |
|
|
|
1,246,474 |
|
|
|
2,764,544 |
|
|
|
1,227,395 |
|
Adjusted return on average assets (annualized) |
|
1.02 |
% |
|
|
0.91 |
% |
|
|
0.59 |
% |
|
|
0.93 |
% |
|
|
0.46 |
% |
Page 18 of 18
Adjusted Return on Average Shareholders' Equity |
|
||||||||||||||||||
|
For the Three Months Ended |
|
|
For the Nine Months Ended |
|
||||||||||||||
(Dollars in thousands) |
9/30/2024 |
|
|
6/30/2024 |
|
|
9/30/2023 |
|
|
9/30/2024 |
|
|
9/30/2023 |
|
|||||
Net income |
$ |
7,095 |
|
|
$ |
5,804 |
|
|
$ |
1,240 |
|
|
$ |
18,625 |
|
|
$ |
1,033 |
|
Average shareholders' equity |
|
273,935 |
|
|
|
269,834 |
|
|
|
142,374 |
|
|
|
270,454 |
|
|
|
140,005 |
|
Return on average shareholders' equity (annualized) |
|
10.30 |
% |
|
|
8.65 |
% |
|
|
3.46 |
% |
|
|
9.20 |
% |
|
|
0.99 |
% |
Net income |
|
7,095 |
|
|
|
5,804 |
|
|
|
1,240 |
|
|
|
18,625 |
|
|
|
1,033 |
|
Net (gains) losses on sale of securities |
|
- |
|
|
|
(4 |
) |
|
|
- |
|
|
|
(4 |
) |
|
|
2,370 |
|
Tax effect at 21% |
|
- |
|
|
|
1 |
|
|
|
- |
|
|
|
1 |
|
|
|
(498 |
) |
Merger & restructuring expenses |
|
171 |
|
|
|
631 |
|
|
|
777 |
|
|
|
858 |
|
|
|
1,679 |
|
Tax effect at 21% |
|
(36 |
) |
|
|
(133 |
) |
|
|
(163 |
) |
|
|
(180 |
) |
|
|
(353 |
) |
Adjusted Net Income (Non-GAAP) |
|
7,230 |
|
|
|
6,299 |
|
|
|
1,854 |
|
|
|
19,300 |
|
|
|
4,231 |
|
Average shareholders' equity |
|
273,935 |
|
|
|
269,834 |
|
|
|
142,374 |
|
|
|
270,454 |
|
|
|
140,005 |
|
Adjusted return on average shareholders' equity (annualized) |
|
10.50 |
% |
|
|
9.39 |
% |
|
|
5.17 |
% |
|
|
9.53 |
% |
|
|
4.04 |
% |
Adjusted Efficiency Ratio |
|
||||||||||||||||||
|
For the Three Months Ended |
|
|
For the Nine Months Ended |
|
||||||||||||||
(Dollars in thousands) |
9/30/2024 |
|
|
6/30/2024 |
|
|
9/30/2023 |
|
|
9/30/2024 |
|
|
9/30/2023 |
|
|||||
GAAP-based efficiency ratio |
|
66.71 |
% |
|
|
71.75 |
% |
|
|
86.59 |
% |
|
|
70.21 |
% |
|
|
96.87 |
% |
Net interest income |
$ |
24,981 |
|
|
$ |
24,484 |
|
|
$ |
8,352 |
|
|
$ |
74,349 |
|
|
$ |
24,395 |
|
Noninterest income |
|
2,680 |
|
|
|
1,858 |
|
|
|
880 |
|
|
|
6,267 |
|
|
|
(88 |
) |
Less: net gains (losses) on sales of securities |
|
- |
|
|
|
4 |
|
|
|
- |
|
|
|
4 |
|
|
|
(2,370 |
) |
Adjusted revenue (Non-GAAP) |
|
27,661 |
|
|
|
26,338 |
|
|
|
9,232 |
|
|
|
80,612 |
|
|
|
26,677 |
|
Total noninterest expense |
|
18,452 |
|
|
|
18,900 |
|
|
|
7,994 |
|
|
|
56,601 |
|
|
|
23,547 |
|
Less: Merger & restructuring expenses |
|
171 |
|
|
|
631 |
|
|
|
777 |
|
|
|
858 |
|
|
|
1,679 |
|
Adjusted non-interest expense |
|
18,281 |
|
|
|
18,269 |
|
|
|
7,217 |
|
|
|
55,743 |
|
|
|
21,868 |
|
Efficiency ratio, as adjusted (Non-GAAP) |
|
66.09 |
% |
|
|
69.36 |
% |
|
|
78.17 |
% |
|
|
69.15 |
% |
|
|
81.97 |
% |
Adjusted Earnings Per Share |
|
||||||||||||||||||
|
For the Three Months Ended |
|
|
For the Nine Months Ended |
|
||||||||||||||
(Dollars in thousands, except per share data) |
9/30/2024 |
|
|
6/30/2024 |
|
|
9/30/2023 |
|
|
9/30/2024 |
|
|
9/30/2023 |
|
|||||
GAAP-Based Earnings Per Share, Basic |
$ |
0.19 |
|
|
$ |
0.16 |
|
|
$ |
0.08 |
|
|
$ |
0.50 |
|
|
$ |
0.06 |
|
GAAP-Based Earnings Per Share, Diluted |
$ |
0.19 |
|
|
$ |
0.16 |
|
|
$ |
0.08 |
|
|
$ |
0.50 |
|
|
$ |
0.06 |
|
Net Income |
$ |
7,095 |
|
|
$ |
5,804 |
|
|
$ |
1,240 |
|
|
$ |
18,625 |
|
|
$ |
1,033 |
|
Net (gains) losses on sale of securities |
|
- |
|
|
|
(4 |
) |
|
|
- |
|
|
|
(4 |
) |
|
|
2,370 |
|
Tax effect at 21% |
|
- |
|
|
|
1 |
|
|
|
- |
|
|
|
1 |
|
|
|
(498 |
) |
Merger & restructuring expenses |
|
171 |
|
|
|
631 |
|
|
|
777 |
|
|
|
858 |
|
|
|
1,679 |
|
Tax effect at 21% |
|
(36 |
) |
|
|
(133 |
) |
|
|
(163 |
) |
|
|
(180 |
) |
|
|
(353 |
) |
Adjusted Net Income (Non-GAAP) |
|
7,230 |
|
|
|
6,299 |
|
|
|
1,854 |
|
|
|
19,300 |
|
|
|
4,231 |
|
Adjusted Earnings per Share, Basic (Non-GAAP) |
$ |
0.20 |
|
|
$ |
0.17 |
|
|
$ |
0.11 |
|
|
$ |
0.52 |
|
|
$ |
0.26 |
|
Adjusted Earnings per Share, Diluted (Non-GAAP) |
$ |
0.19 |
|
|
$ |
0.17 |
|
|
$ |
0.11 |
|
|
$ |
0.52 |
|
|
$ |
0.26 |
|
Page 19 of 18
Tangible Common Equity and Tangible Book Value |
|
|||||||||||||||||||
(Dollars in thousands, except per share data) |
|
9/30/2024 |
|
|
6/30/2024 |
|
|
3/31/2024 |
|
|
12/31/2023 |
|
|
9/30/2023 |
|
|||||
Tangible Common Equity |
|
|
|
|
(Dollars in thousands, except for share data) |
|
||||||||||||||
Total shareholders’ equity |
|
$ |
277,353 |
|
|
$ |
271,409 |
|
|
$ |
268,243 |
|
|
$ |
265,796 |
|
|
$ |
141,351 |
|
Adjustments: |
|
|
|
|
|
|
|
|
|
|
|
|
|
|
|
|||||
Goodwill |
|
|
(58,806 |
) |
|
|
(58,806 |
) |
|
|
(56,968 |
) |
|
|
(56,968 |
) |
|
|
(35,842 |
) |
Other intangible assets |
|
|
(22,118 |
) |
|
|
(23,323 |
) |
|
|
(24,526 |
) |
|
|
(25,733 |
) |
|
|
(873 |
) |
Tangible common equity (Non-GAAP) |
|
$ |
196,429 |
|
|
$ |
189,280 |
|
|
$ |
186,749 |
|
|
$ |
183,095 |
|
|
$ |
104,636 |
|
Common shares outstanding |
|
|
37,361,560 |
|
|
|
37,356,278 |
|
|
|
37,348,151 |
|
|
|
37,340,700 |
|
|
|
16,235,871 |
|
Book value per common share |
|
$ |
7.42 |
|
|
$ |
7.27 |
|
|
$ |
7.18 |
|
|
$ |
7.12 |
|
|
$ |
8.71 |
|
Tangible book value per common share |
|
$ |
5.26 |
|
|
$ |
5.07 |
|
|
$ |
5.00 |
|
|
$ |
4.90 |
|
|
$ |
6.44 |
|
Tangible Assets |
|
|
|
|
|
|
|
|
|
|
|
|
|
|
|
|||||
Total assets |
|
$ |
2,879,941 |
|
|
$ |
2,858,593 |
|
|
$ |
2,785,669 |
|
|
$ |
2,669,325 |
|
|
$ |
1,255,695 |
|
Adjustments: |
|
|
|
|
|
|
|
|
|
|
|
|
|
|
|
|||||
Goodwill |
|
|
(58,806 |
) |
|
|
(58,806 |
) |
|
|
(56,968 |
) |
|
|
(56,968 |
) |
|
|
(35,842 |
) |
Other intangible assets |
|
|
(22,118 |
) |
|
|
(23,323 |
) |
|
|
(24,526 |
) |
|
|
(25,733 |
) |
|
|
(873 |
) |
Tangible assets (Non-GAAP) |
|
$ |
2,799,017 |
|
|
$ |
2,776,464 |
|
|
$ |
2,704,175 |
|
|
$ |
2,586,624 |
|
|
$ |
1,218,980 |
|
Tangible common equity to tangible assets (Non-GAAP) |
|
|
7.02 |
% |
|
|
6.82 |
% |
|
|
6.91 |
% |
|
|
7.08 |
% |
|
|
8.58 |
% |
Adjusted Pre-tax, Pre-provision Net Income (Non-GAAP) |
|
||||||||||||||||||
|
For the Three Months Ended |
|
|
For the Nine Months Ended |
|
||||||||||||||
(Dollars in thousands, except per share data) |
9/30/2024 |
|
|
6/30/2024 |
|
|
9/30/2023 |
|
|
9/30/2024 |
|
|
9/30/2023 |
|
|||||
Net Income - GAAP |
$ |
7,095 |
|
|
$ |
5,804 |
|
|
$ |
1,240 |
|
|
$ |
18,625 |
|
|
$ |
1,033 |
|
Net (gains) losses on sale of securities |
|
- |
|
|
|
(4 |
) |
|
|
- |
|
|
|
(4 |
) |
|
|
2,370 |
|
Tax effect at 21% |
|
- |
|
|
|
1 |
|
|
|
- |
|
|
|
1 |
|
|
|
(498 |
) |
Merger & restructuring expenses |
|
171 |
|
|
|
631 |
|
|
|
777 |
|
|
|
858 |
|
|
|
1,679 |
|
Tax effect at 21% |
|
(36 |
) |
|
|
(133 |
) |
|
|
(163 |
) |
|
|
(180 |
) |
|
|
(353 |
) |
Adjusted Net Income (Non-GAAP) |
|
7,230 |
|
|
|
6,299 |
|
|
|
1,854 |
|
|
|
19,300 |
|
|
|
4,231 |
|
Income tax expense |
|
2,030 |
|
|
|
1,638 |
|
|
|
347 |
|
|
|
5,265 |
|
|
|
276 |
|
Provision for (credit to) credit losses |
|
84 |
|
|
|
- |
|
|
|
(349 |
) |
|
|
125 |
|
|
|
(549 |
) |
Tax effect included in Adjusted Net Income |
|
36 |
|
|
|
132 |
|
|
|
163 |
|
|
|
179 |
|
|
|
851 |
|
Adjusted Pre-tax, Pre-provision Net Income (Non-GAAP) |
$ |
9,380 |
|
|
$ |
8,069 |
|
|
$ |
2,015 |
|
|
$ |
24,869 |
|
|
$ |
4,809 |
|
October 2024 THIRD QUARTER 2024 Nasdaq: LNKB ir.linkbancorp.com
IMPORTANT INFORMATION / DISCLAIMERS LINKBANCORP, Inc. (Nasdaq: LNKB) (“LINKBANCORP” or the “Company”) is the parent company of LINKBANK (the “Bank”). Company and Bank data reflect the November 30, 2023 effective date of Partners Bancorp, Inc. (“Partners”) merger with and into the Company and the merger of Partners Bancorp’s the Bank of Delmarva & Virginia Partners Bank subsidiaries with and into LINKBANK (the “Merger”). Given that the Merger with Partners was completed on November 30, 2023, fourth quarter 2023 results do not represent a full quarter of comparable combined earnings. Reported results prior to the fourth quarter of 2023 reflect legacy LINKBANCORP results only. Financial data for the most recent quarter (“MRQ”) and last twelve months (“LTM”) is for periods ended September 30, 2024. Market-pricing data is as of October 25, 2024 (Source: S&P Capital IQ Pro). Forward looking statements: This presentation may contain forward-looking statements as defined in the Private Securities Litigation Reform Act of 1995. Forward-looking statements are not statements of current or historical fact and involve substantial risks and uncertainties. Words such as “anticipates,” “believes,” “estimates,” “expects,” “forecasts,” “intends,” “plans,” “projects,” “may,” “will,” “should,” and other similar expressions can be used to identify forward-looking statements. Such statements are subject to factors that could cause actual results to differ materially from anticipated results. Among the risks and uncertainties that could cause actual results to differ from those described in the forward-looking statements include, but are not limited to the following: costs or difficulties associated with newly developed or acquired operations; risks related to the integration of the Merger with Partners; the timing and receipt of regulatory approvals to complete the pending sale of three New Jersey branches and associated loans and deposits; changes in general economic trends, including inflation and changes in interest rates; increased competition; changes in consumer demand for financial services; our ability to control costs and expenses; adverse developments in borrower industries and, in particular, declines in real estate values; changes in and compliance with federal and state laws that regulate our business and capital levels; our ability to raise capital as needed; and the effects of any cybersecurity breaches. The Company does not undertake, and specifically disclaims, any obligation to publicly revise any forward-looking statements to reflect the occurrence of anticipated or unanticipated events or circumstances after the date of such statements, except as required by law. Accordingly, you should not place undue reliance on forward-looking statements. Disclosures regarding non-GAAP financial information: To the extent that supplemental Company or Bank financial metrics presented herein are not financial measures under generally accepted accounting principles (“GAAP”), these non-GAAP metrics will be reconciled with comparable GAAP measures in the appendix to this presentation. Management may use non-GAAP measures in the analysis of the performance of the Company or the Bank, and they should not be considered a substitute for GAAP basis measures nor should they be viewed as a substitute for operating results determined in accordance with GAAP.
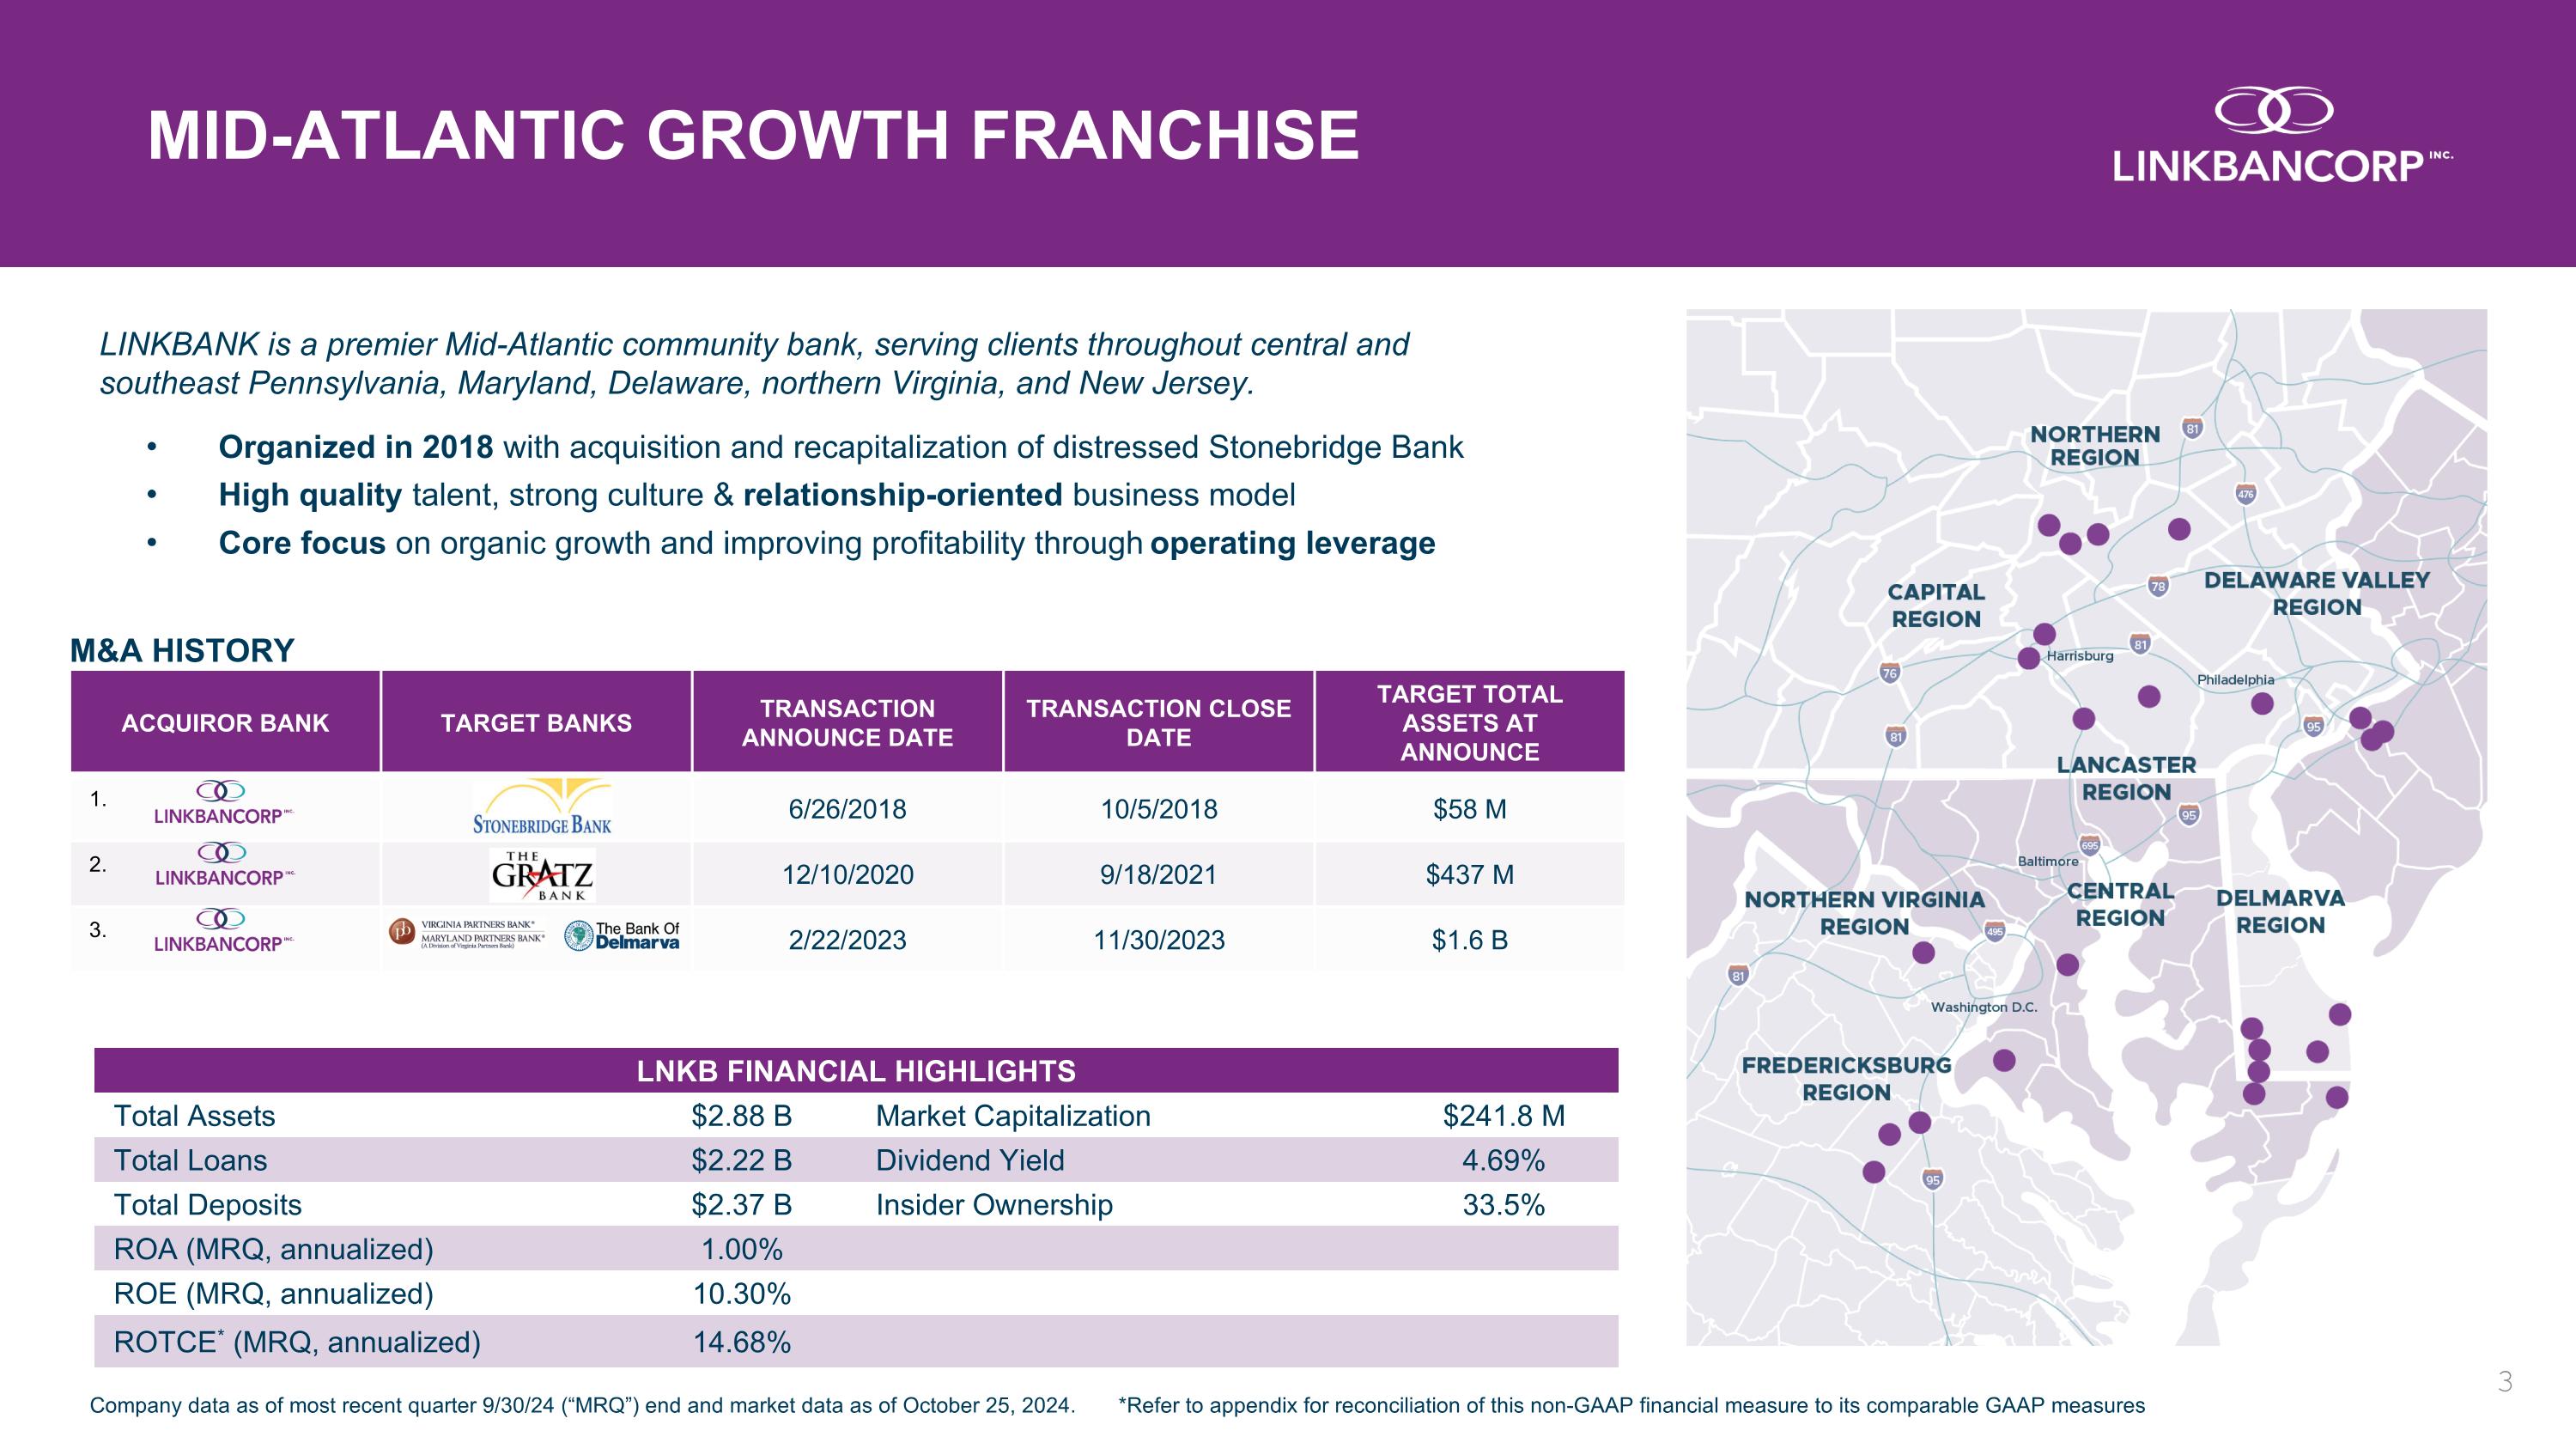
Organized in 2018 with acquisition and recapitalization of distressed Stonebridge Bank High quality talent, strong culture & relationship-oriented business model Core focus on organic growth and improving profitability through operating leverage LNKB FINANCIAL HIGHLIGHTS Total Assets $2.88 B Market Capitalization $241.8 M Total Loans $2.22 B Dividend Yield 4.69% Total Deposits $2.37 B Insider Ownership 33.5% ROA (MRQ, annualized) 1.00% ROE (MRQ, annualized) 10.30% ROTCE* (MRQ, annualized) 14.68% Company data as of most recent quarter 9/30/24 (“MRQ”) end and market data as of October 25, 2024. *Refer to appendix for reconciliation of this non-GAAP financial measure to its comparable GAAP measures M&A HISTORY MID-ATLANTIC GROWTH FRANCHISE ACQUIROR BANK TARGET BANKS TRANSACTION ANNOUNCE DATE TRANSACTION CLOSE DATE TARGET TOTAL ASSETS AT ANNOUNCE 1. 6/26/2018 10/5/2018 $58 M 2. 12/10/2020 9/18/2021 $437 M 3. 2/22/2023 11/30/2023 $1.6 B LINKBANK is a premier Mid-Atlantic community bank, serving clients throughout central and southeast Pennsylvania, Maryland, Delaware, northern Virginia, and New Jersey.

KRISTOFER PAUL - CFO | LINKBANCORP 20 years of bank credit administration and portfolio management experience also includes Susquehanna Bank, Sovereign Bank, and Waypoint Financial Experience in development and maintenance of commercial loan portfolios for more than 6 M&A transactions Named to Next 2021: Most Powerful Women in Banking by American Banker magazine TIFFANIE HORTON - Chief Credit Officer | LINKBANCORP Long track record of industry success Been involved in M&A of more than 10 companies with aggregate deal value surpassing $1.5 billion Successfully transitioned private community banks to public companies on NASDAQ Demonstrated track record of value creation: Waypoint Financial (PA), Tower Bancorp (PA), Sunshine Bancorp (FL) CARL LUNDBLAD - President | LINKBANCORP 27 years of banking, legal and other executive experience Extensive bank executive experience overseeing M&A, strategy development, regulatory and governance matters Strong transaction and value creation history, overseeing sales of Tower Bancorp and Susquehanna Bancshares BRENT SMITH - President | LINKBANK Consistent leader in growth initiatives with 19 years of banking experience Been involved in M&A of more than 5 companies with aggregate deal value surpassing $700 million Led on transformational acquisitions, private placements, debt issuances and branch acquisitions DEE BONORA - Chief Operations and Technology Officer | LINKBANCORP 20+ YEAR HISTORY OF WORKING TOGETHER IN THE MID ATLANTIC REGION 21 years of banking and financial services industry experience Oversaw financial reporting and accounting of various public companies, including Hersha Hospitality Trust and Tower Bancorp Involved in transactions totaling over $700M SEASONED EXECUTIVE TEAM Strong background in bank operations, data management and systems architecture Record of value creation through efficiencies, bringing a wealth of technology and software engineering experience 29 years of technology experience in highly regulated industries also includes Orrstown Bank and Rite Aid Corp ANDREW SAMUEL - CEO | LINKBANCORP & LINKBANK CATE EISEL - Chief Risk Officer | LINKBANK Over 10 years of risk management experience Served in a variety of roles with the FDIC including financial institution examiner, senior bank examination training specialist and supervisory training administrator
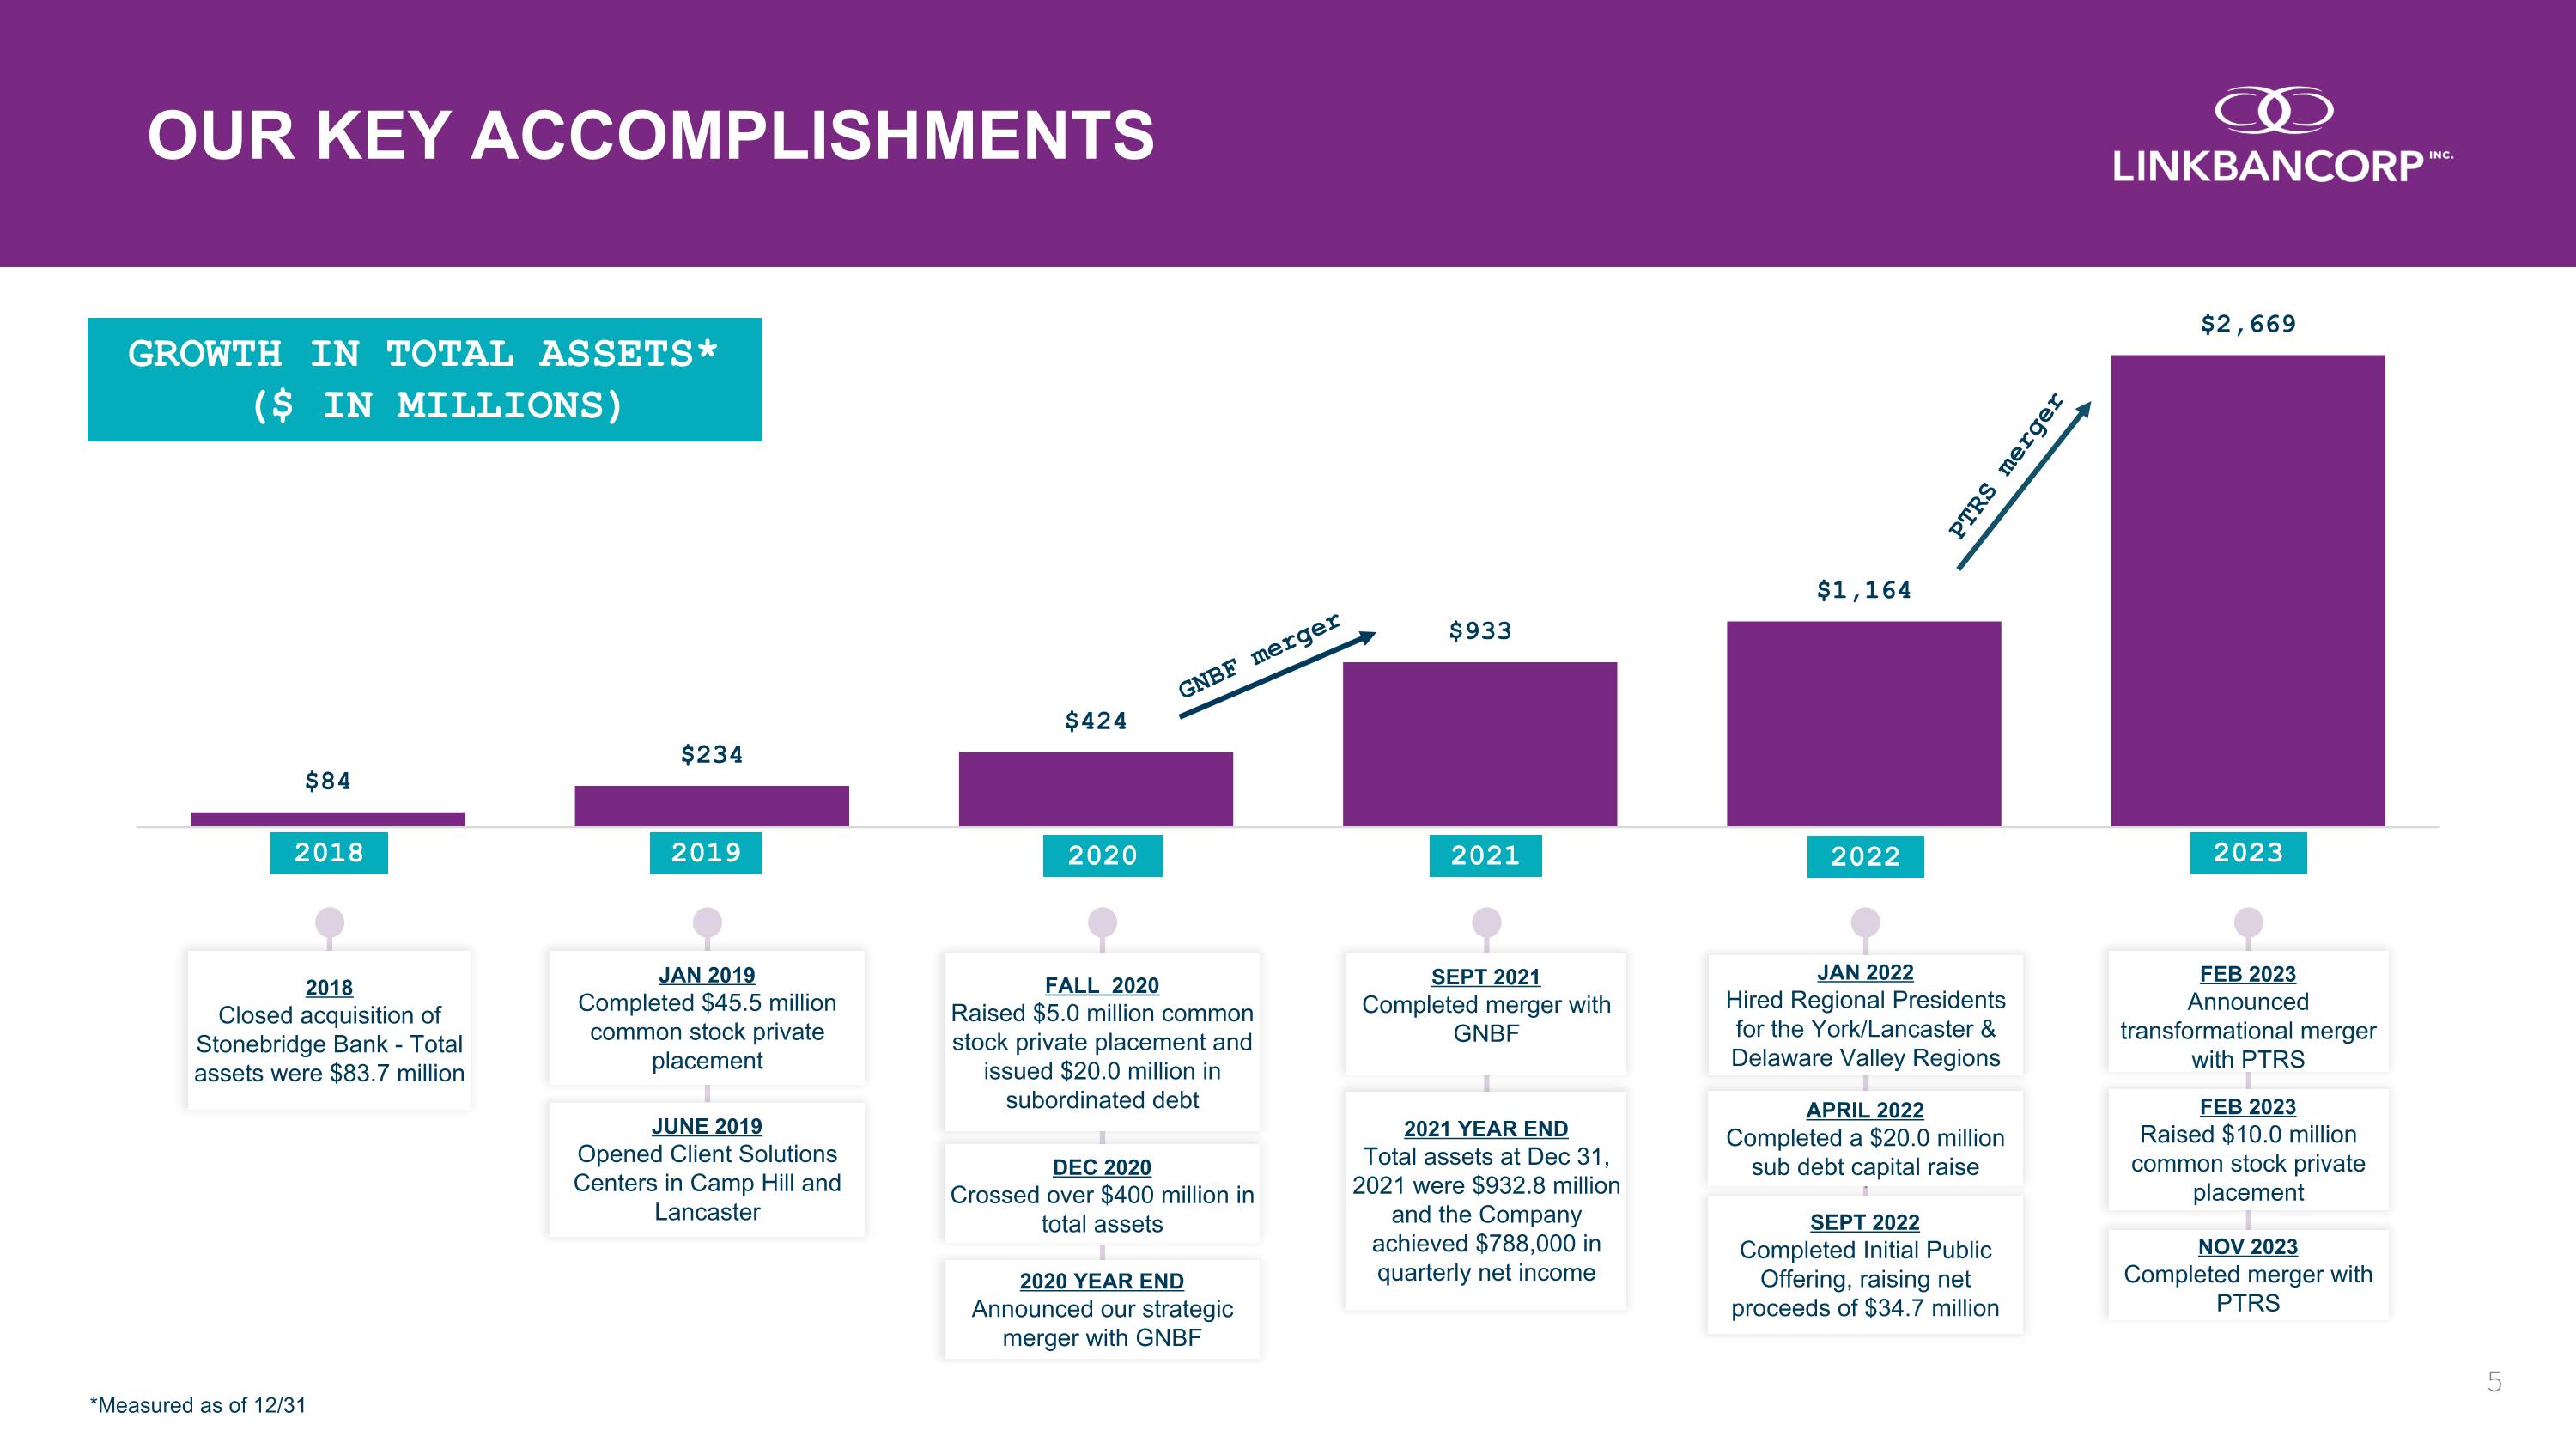
OUR KEY ACCOMPLISHMENTS GROWTH IN TOTAL ASSETS* ($ IN MILLIONS) 2018 2019 2021 2020 2022 GNBF merger 2018 Closed acquisition of Stonebridge Bank - Total assets were $83.7 million JAN 2019 Completed $45.5 million common stock private placement JUNE 2019 Opened Client Solutions Centers in Camp Hill and Lancaster FALL 2020 Raised $5.0 million common stock private placement and issued $20.0 million in subordinated debt SEPT 2021 Completed merger with GNBF 2021 YEAR END Total assets at Dec 31, 2021 were $932.8 million and the Company achieved $788,000 in quarterly net income SEPT 2022 Completed Initial Public Offering, raising net proceeds of $34.7 million APRIL 2022 Completed a $20.0 million sub debt capital raise JAN 2022 Hired Regional Presidents for the York/Lancaster & Delaware Valley Regions DEC 2020 Crossed over $400 million in total assets 2020 YEAR END Announced our strategic merger with GNBF 2023 FEB 2023 Announced transformational merger with PTRS FEB 2023 Raised $10.0 million common stock private placement PTRS merger NOV 2023 Completed merger with PTRS *Measured as of 12/31
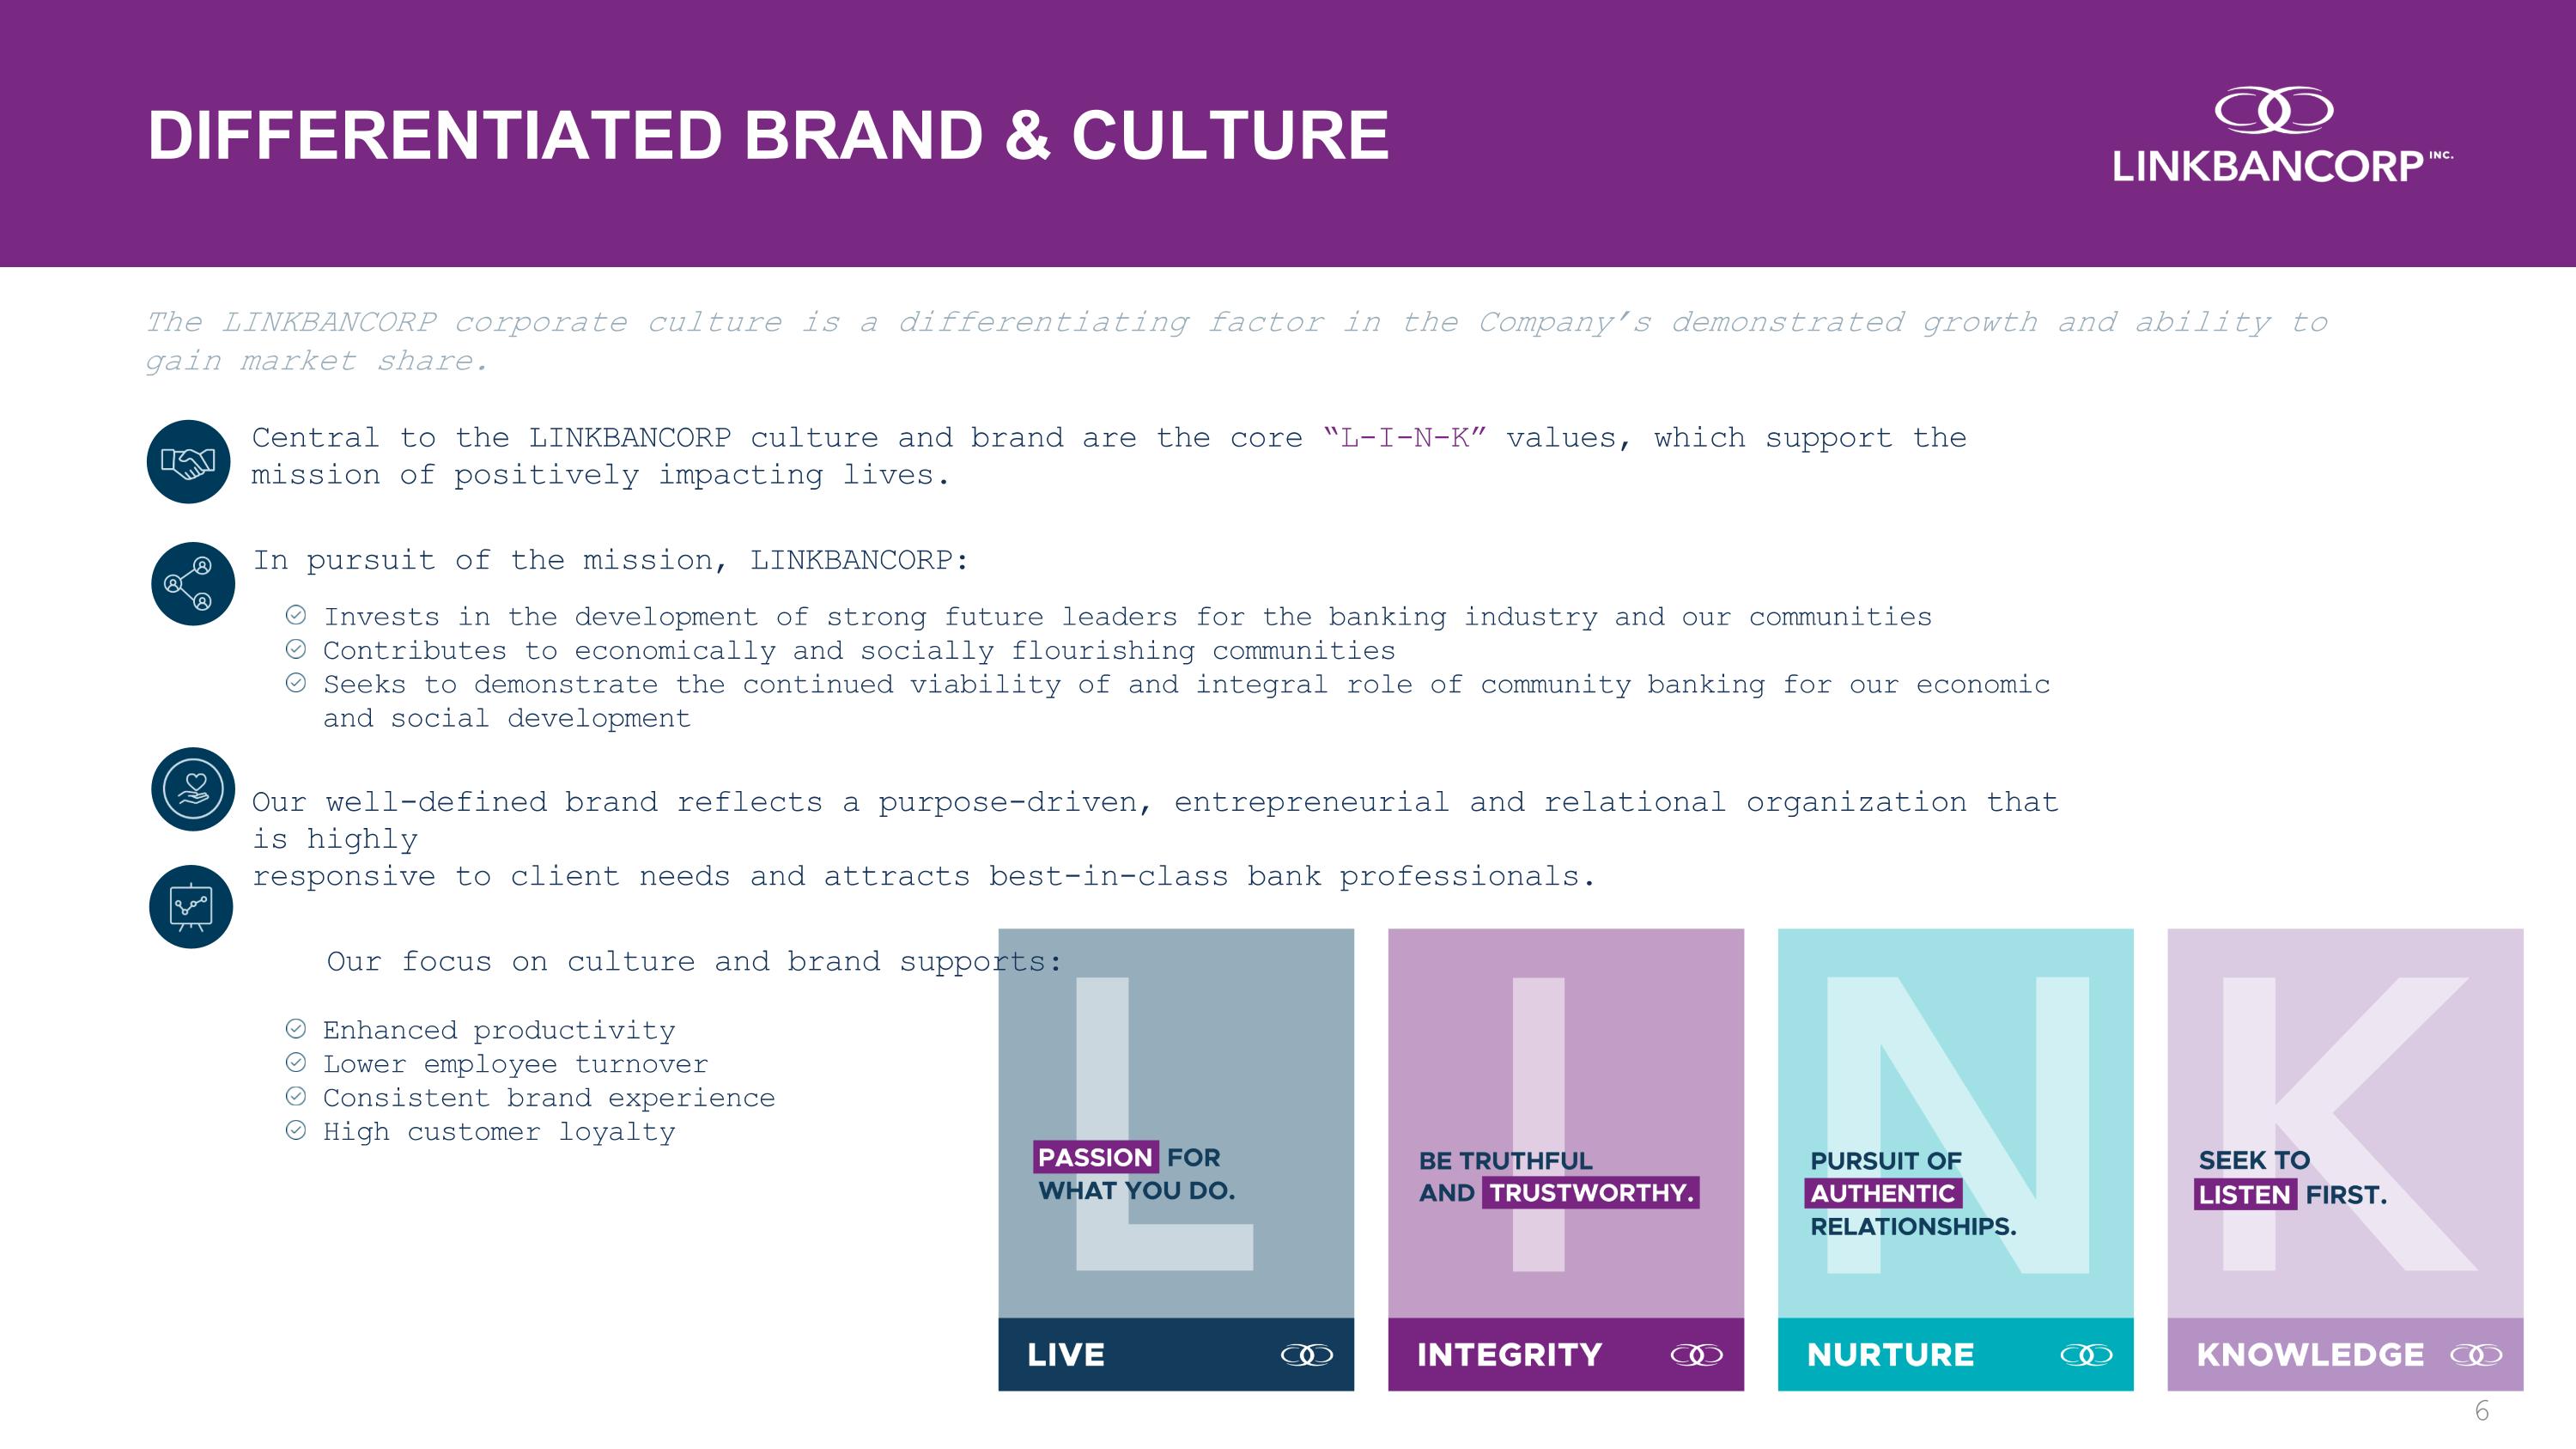
Central to the LINKBANCORP culture and brand are the core “L-I-N-K” values, which support the mission of positively impacting lives. In pursuit of the mission, LINKBANCORP: Invests in the development of strong future leaders for the banking industry and our communities Contributes to economically and socially flourishing communities Seeks to demonstrate the continued viability of and integral role of community banking for our economic and social development Our well-defined brand reflects a purpose-driven, entrepreneurial and relational organization that is highly responsive to client needs and attracts best-in-class bank professionals. Our focus on culture and brand supports: Enhanced productivity Lower employee turnover Consistent brand experience High customer loyalty DIFFERENTIATED BRAND & CULTURE The LINKBANCORP corporate culture is a differentiating factor in the Company’s demonstrated growth and ability to gain market share.
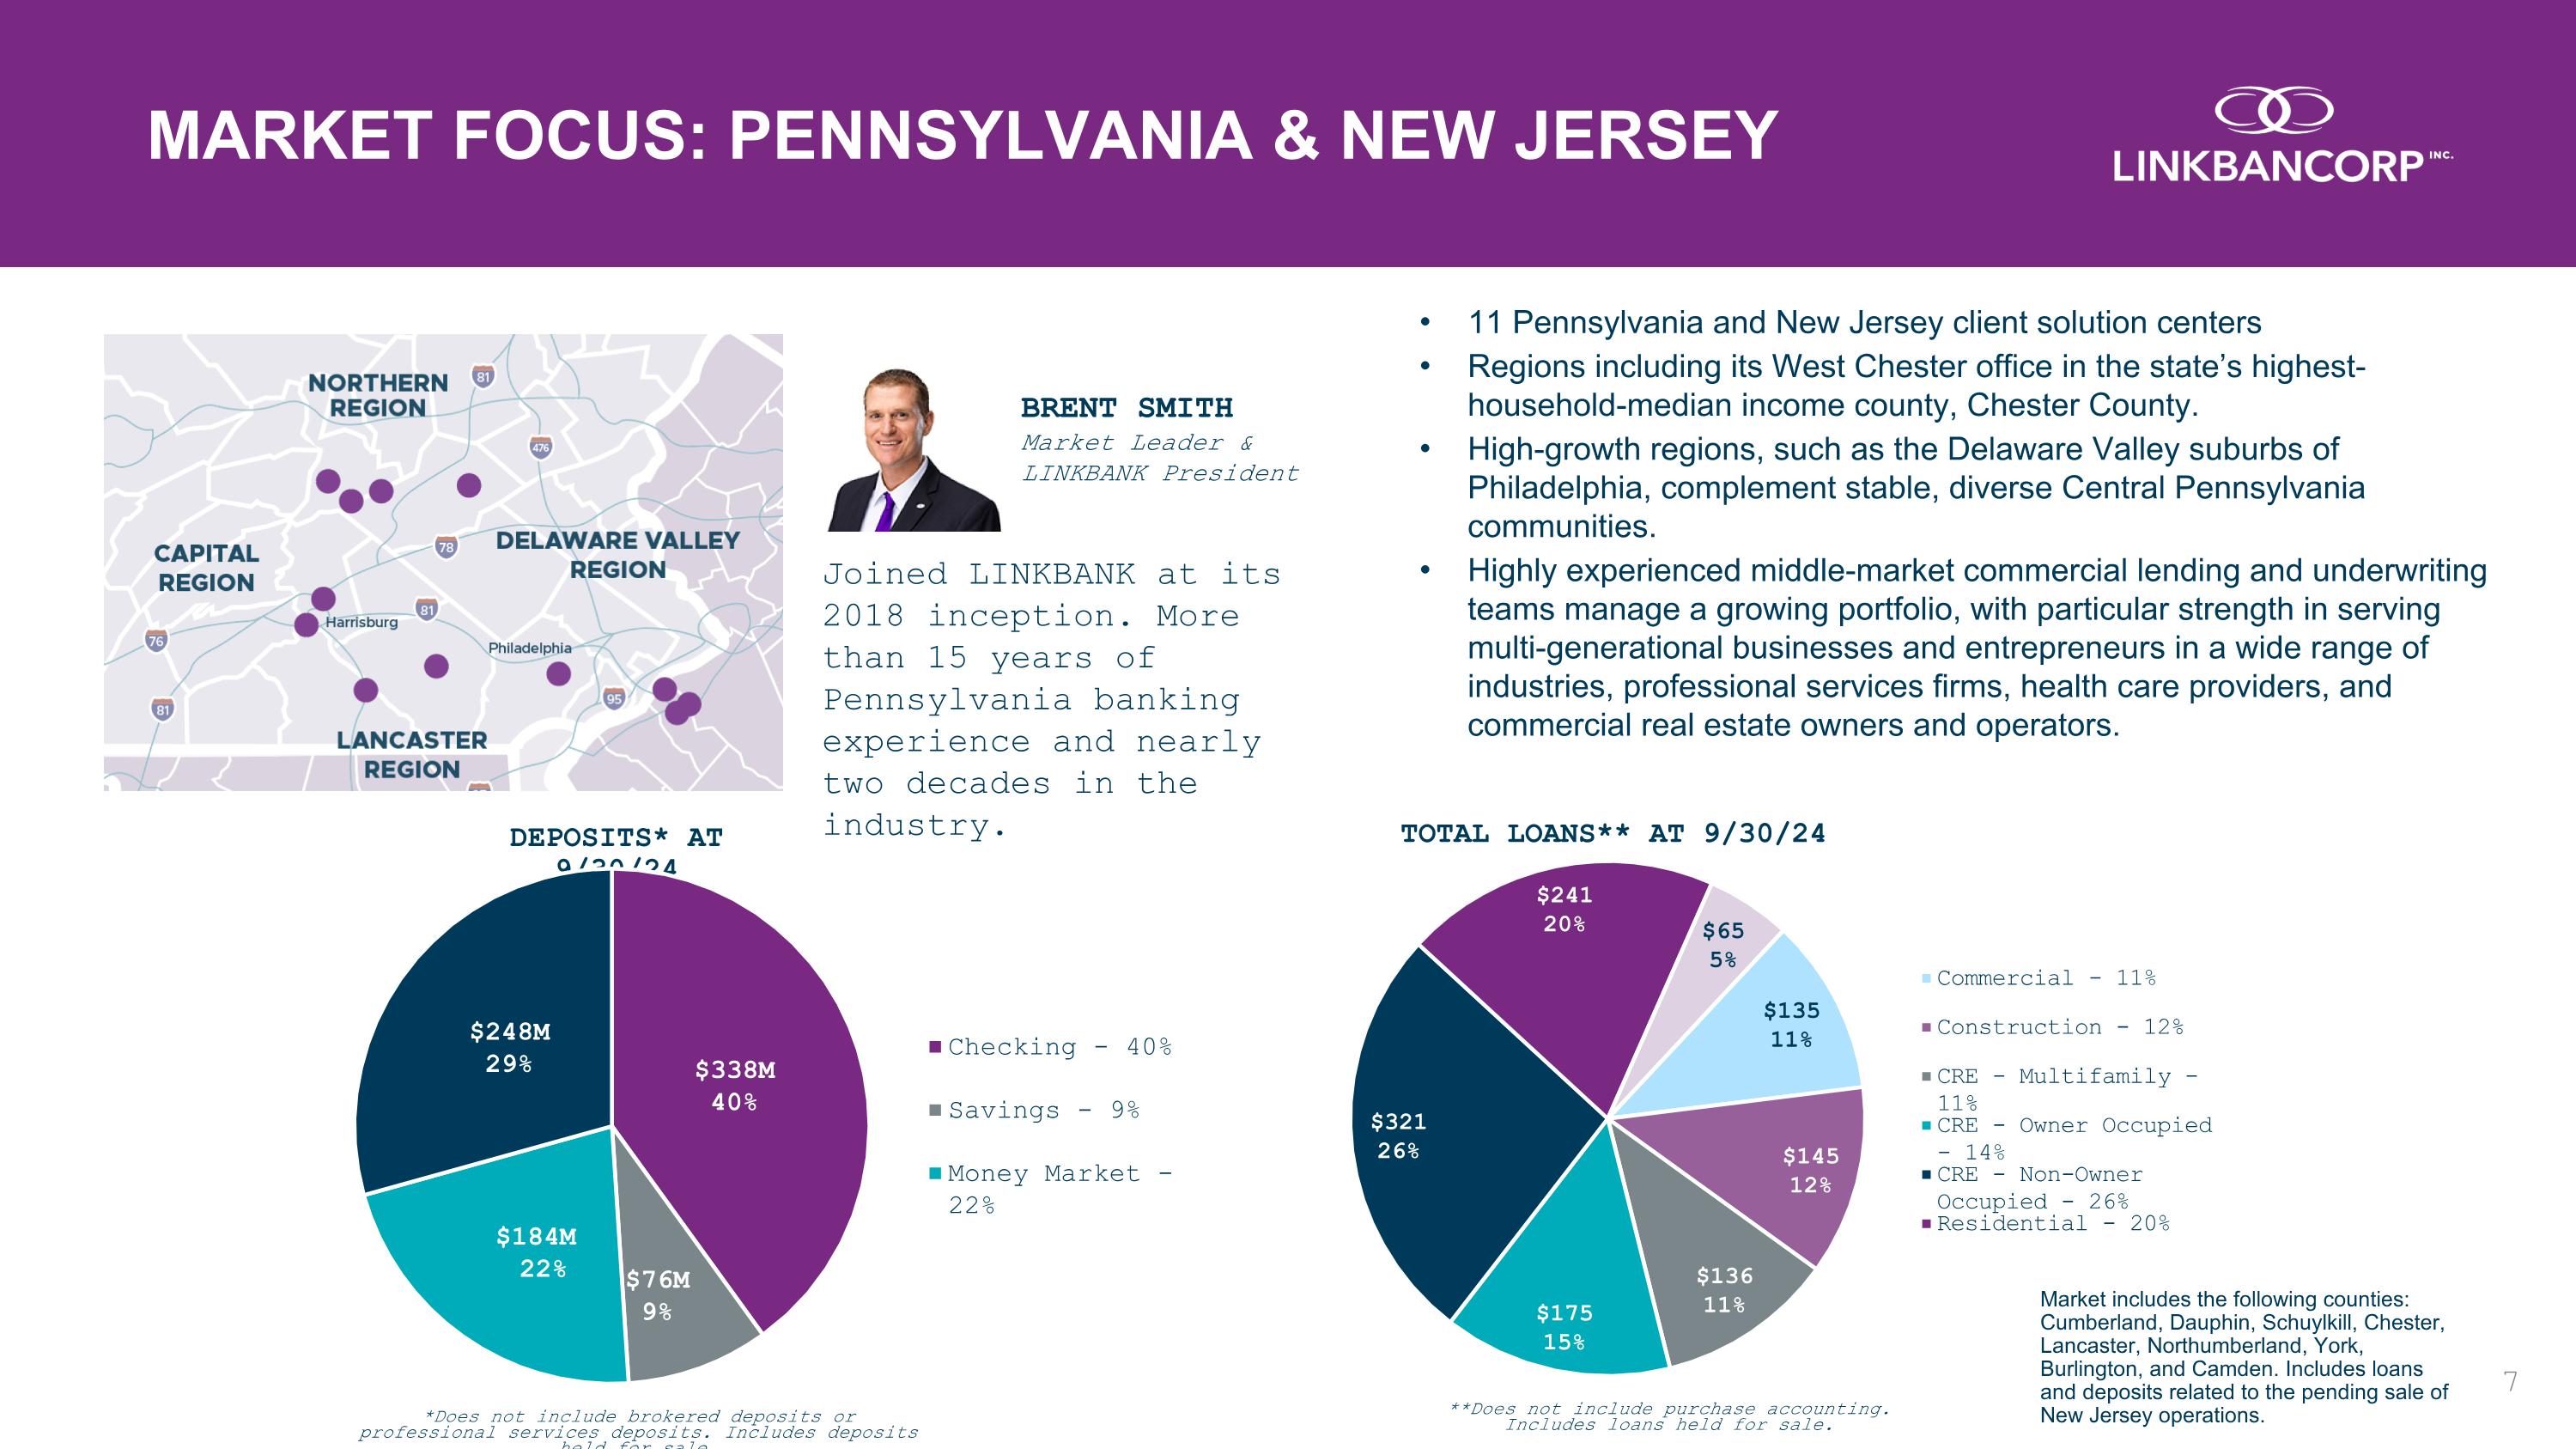
MARKET FOCUS: PENNSYLVANIA & NEW JERSEY BRENT SMITH Market Leader &LINKBANK President Joined LINKBANK at its 2018 inception. More than 15 years of Pennsylvania banking experience and nearly two decades in the industry. 11 Pennsylvania and New Jersey client solution centers Regions including its West Chester office in the state’s highest-household-median income county, Chester County. High-growth regions, such as the Delaware Valley suburbs of Philadelphia, complement stable, diverse Central Pennsylvania communities. Highly experienced middle-market commercial lending and underwriting teams manage a growing portfolio, with particular strength in serving multi-generational businesses and entrepreneurs in a wide range of industries, professional services firms, health care providers, and commercial real estate owners and operators. **Does not include purchase accounting. Includes loans held for sale. TOTAL LOANS** AT 9/30/24 DEPOSITS* AT 9/30/24 *Does not include brokered deposits or professional services deposits. Includes deposits held for sale. Market includes the following counties: Cumberland, Dauphin, Schuylkill, Chester, Lancaster, Northumberland, York, Burlington, and Camden. Includes loans and deposits related to the pending sale of New Jersey operations.
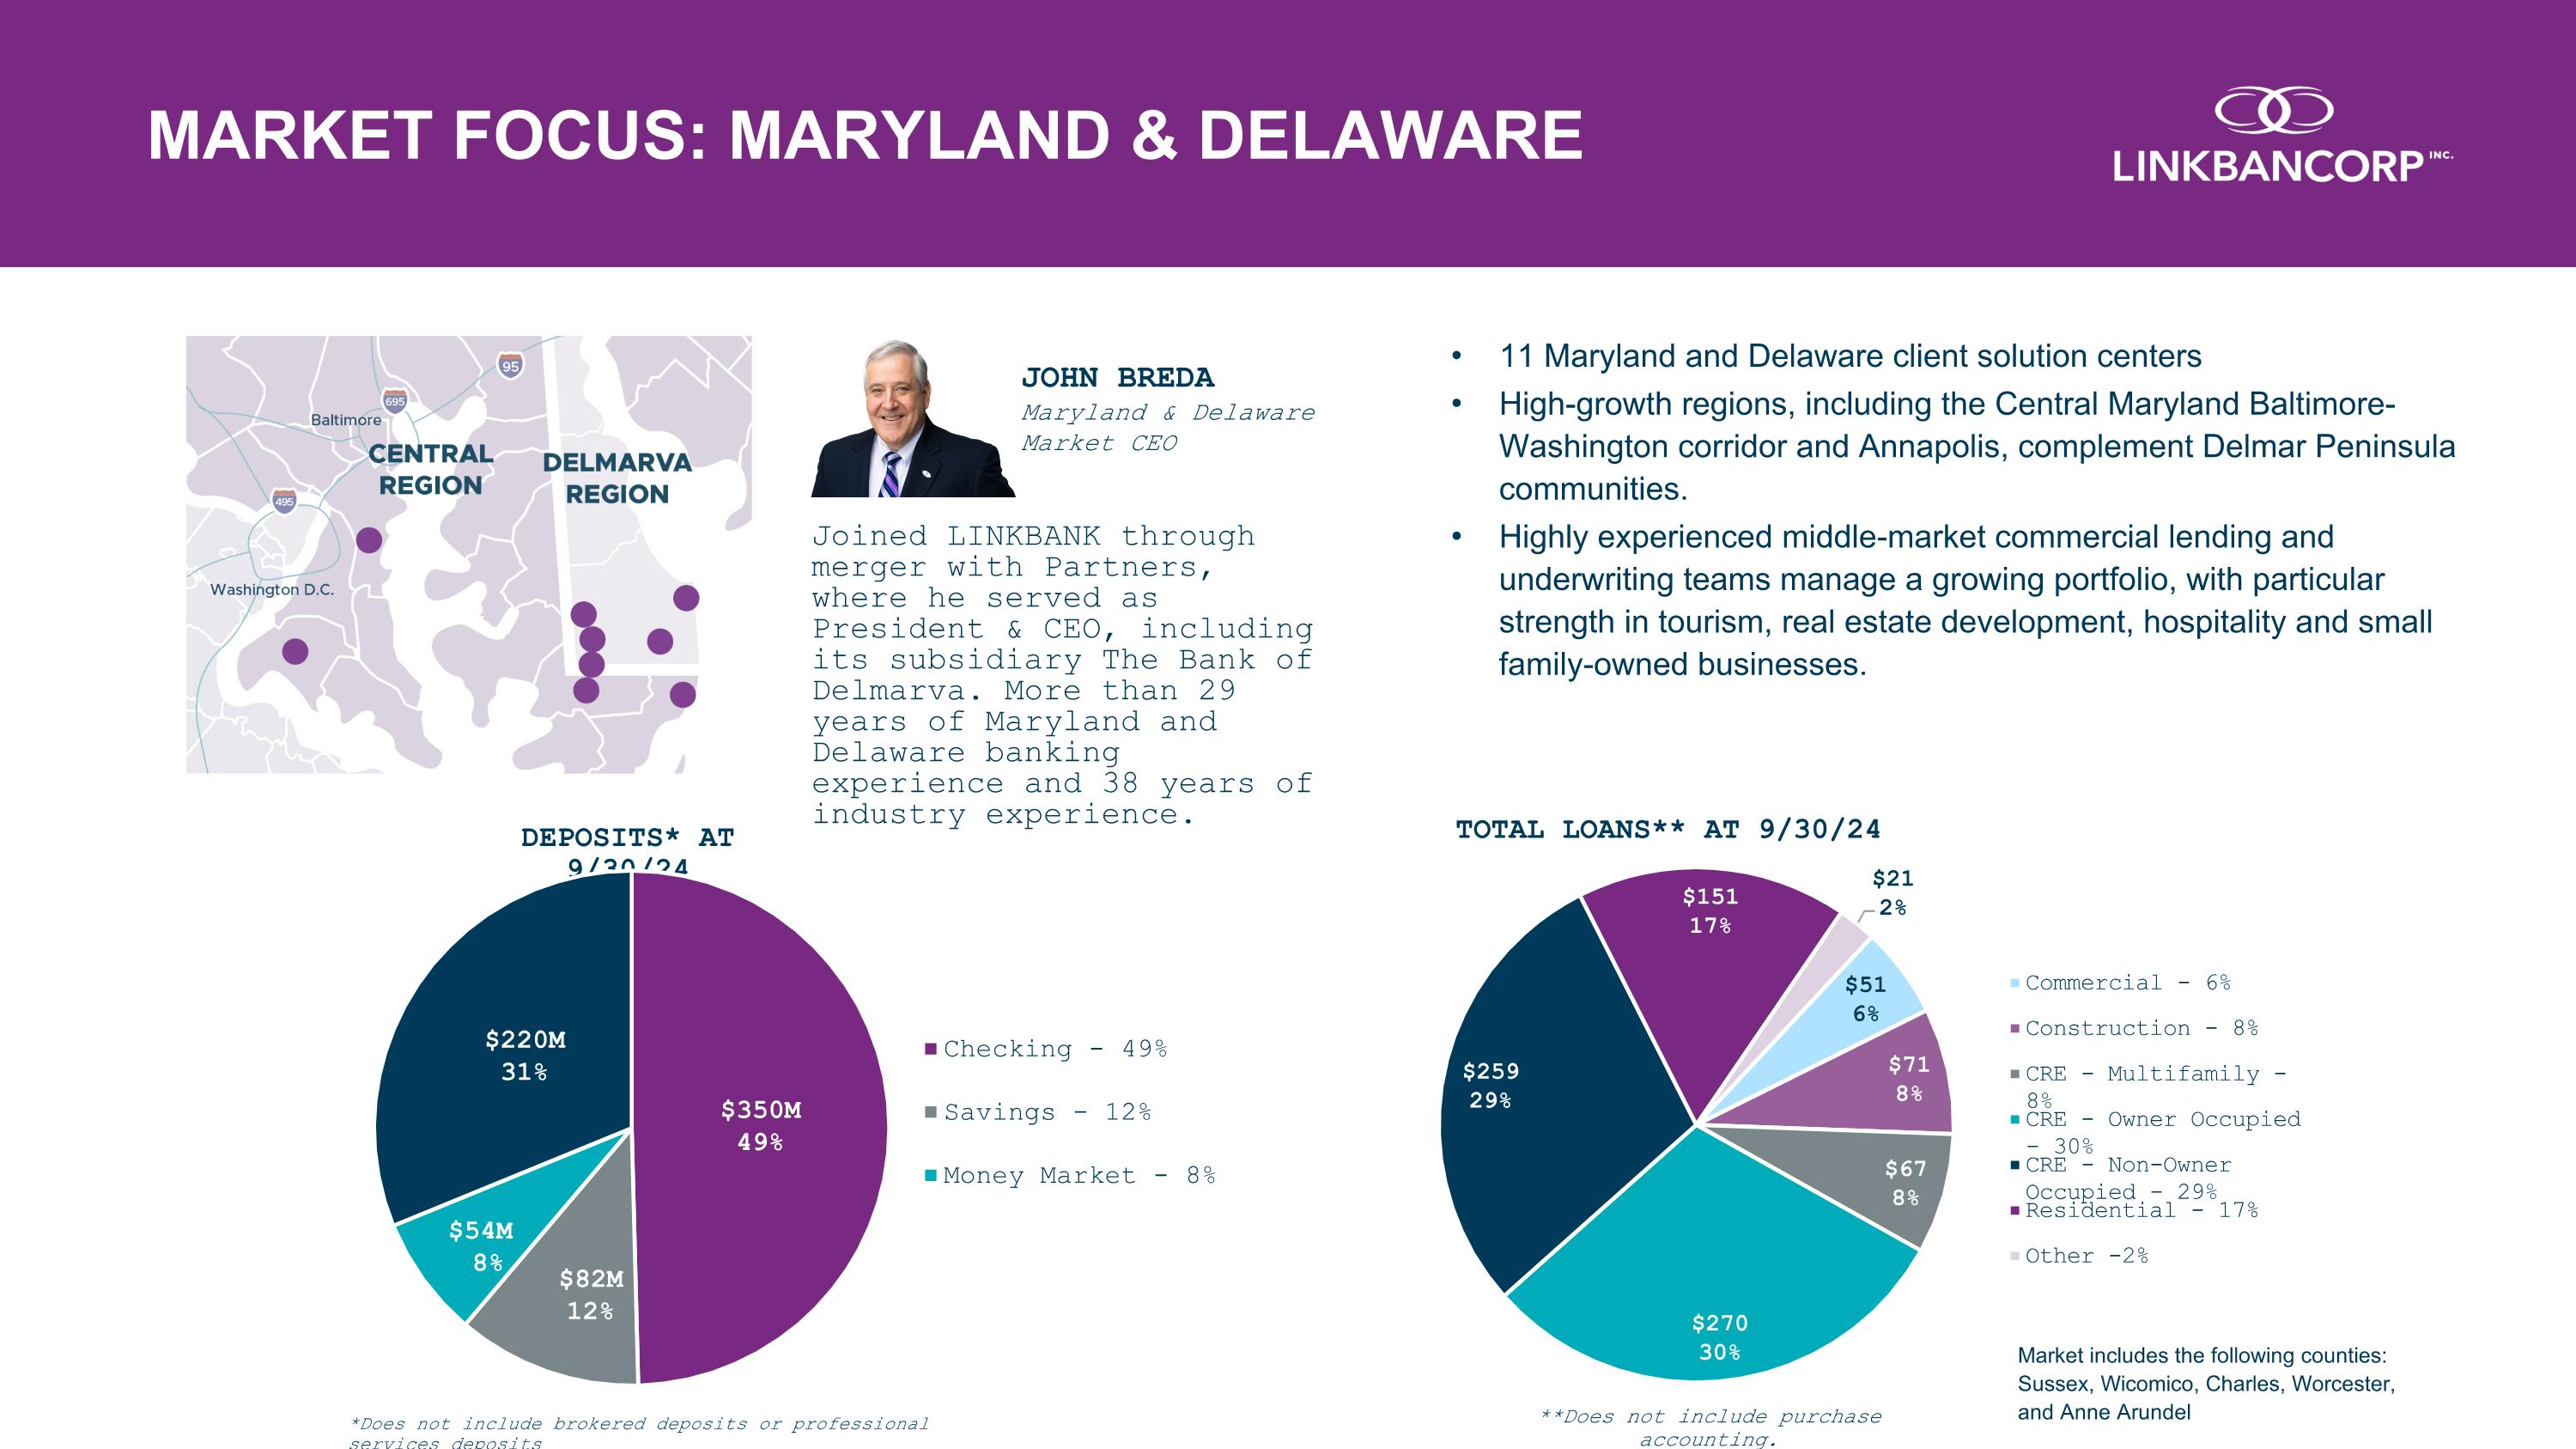
MARKET FOCUS: MARYLAND & DELAWARE JOHN BREDA Maryland & Delaware Market CEO Joined LINKBANK through merger with Partners, where he served as President & CEO, including its subsidiary The Bank of Delmarva. More than 29 years of Maryland and Delaware banking experience and 38 years of industry experience. 11 Maryland and Delaware client solution centers High-growth regions, including the Central Maryland Baltimore-Washington corridor and Annapolis, complement Delmar Peninsula communities. Highly experienced middle-market commercial lending and underwriting teams manage a growing portfolio, with particular strength in tourism, real estate development, hospitality and small family-owned businesses. TOTAL LOANS** AT 9/30/24 DEPOSITS* AT 9/30/24 *Does not include brokered deposits or professional services deposits Market includes the following counties: Sussex, Wicomico, Charles, Worcester, and Anne Arundel **Does not include purchase accounting.
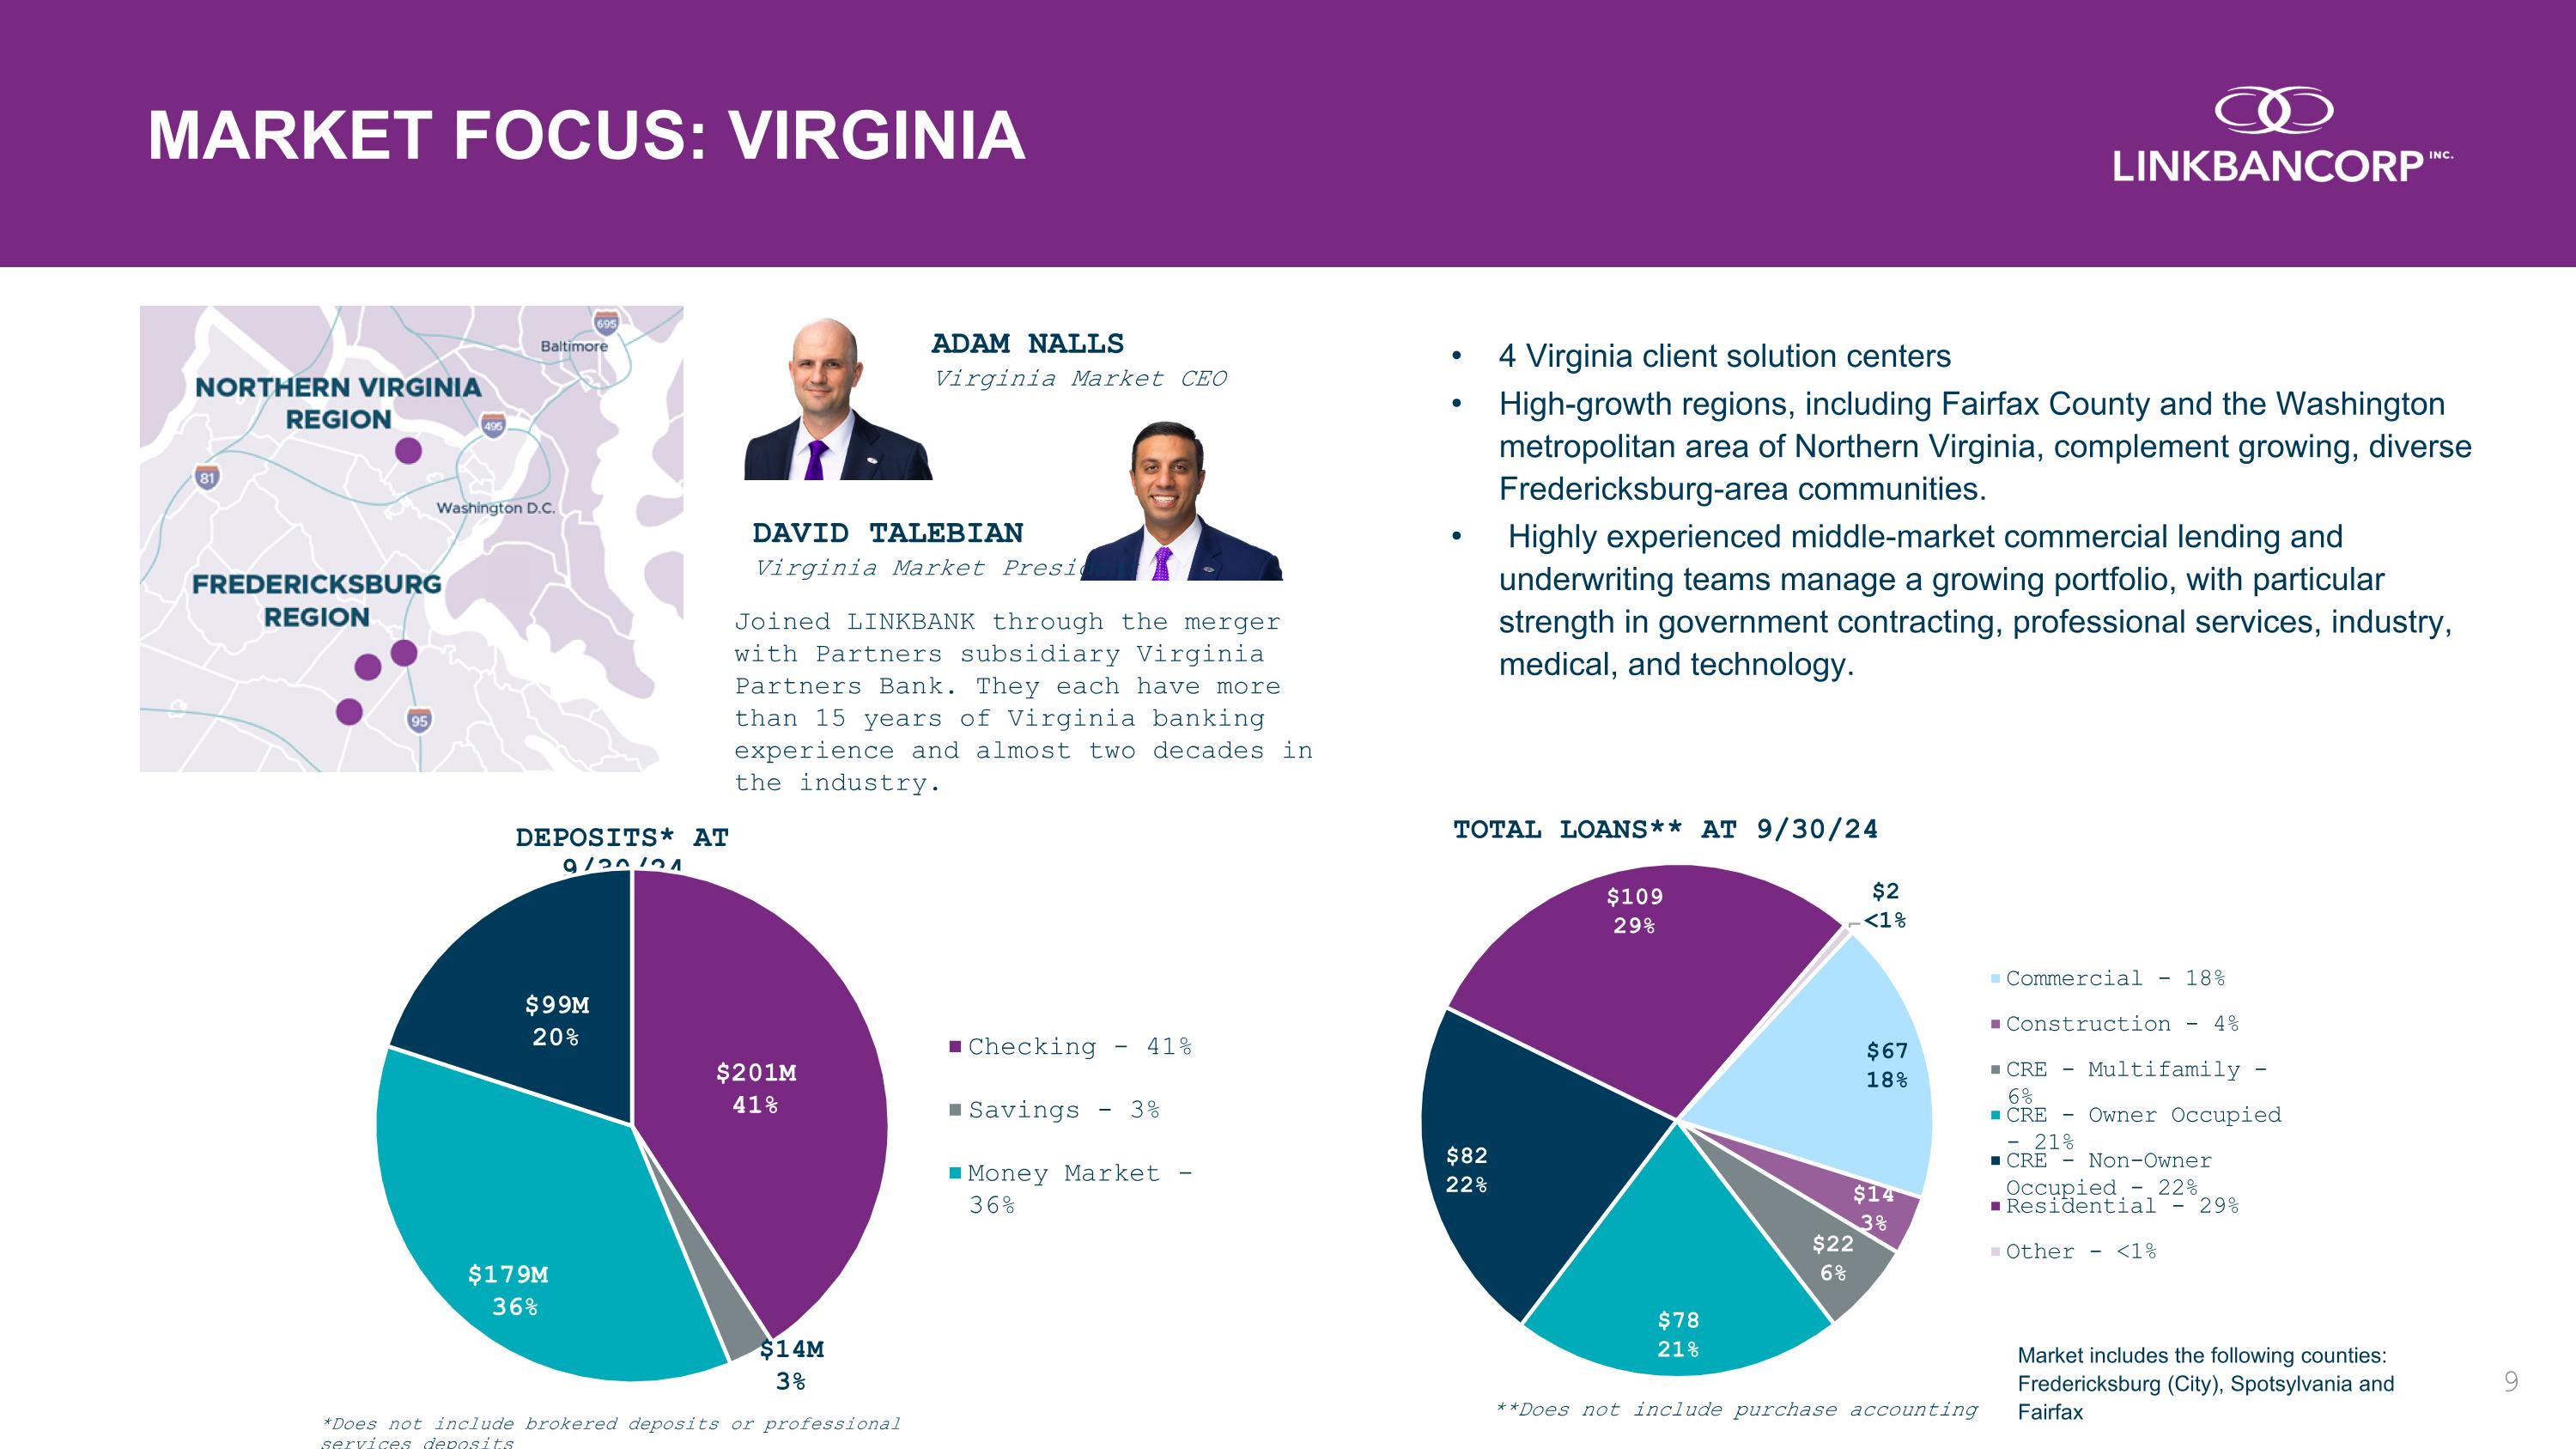
MARKET FOCUS: VIRGINIA ADAM NALLS Virginia Market CEO DAVID TALEBIAN Virginia Market President LOANS* 4 Virginia client solution centers High-growth regions, including Fairfax County and the Washington metropolitan area of Northern Virginia, complement growing, diverse Fredericksburg-area communities. Highly experienced middle-market commercial lending and underwriting teams manage a growing portfolio, with particular strength in government contracting, professional services, industry, medical, and technology. DEPOSITS Joined LINKBANK through the merger with Partners subsidiary Virginia Partners Bank. They each have more than 15 years of Virginia banking experience and almost two decades in the industry. **Does not include purchase accounting TOTAL LOANS** AT 9/30/24 DEPOSITS* AT 9/30/24 *Does not include brokered deposits or professional services deposits Market includes the following counties: Fredericksburg (City), Spotsylvania and Fairfax
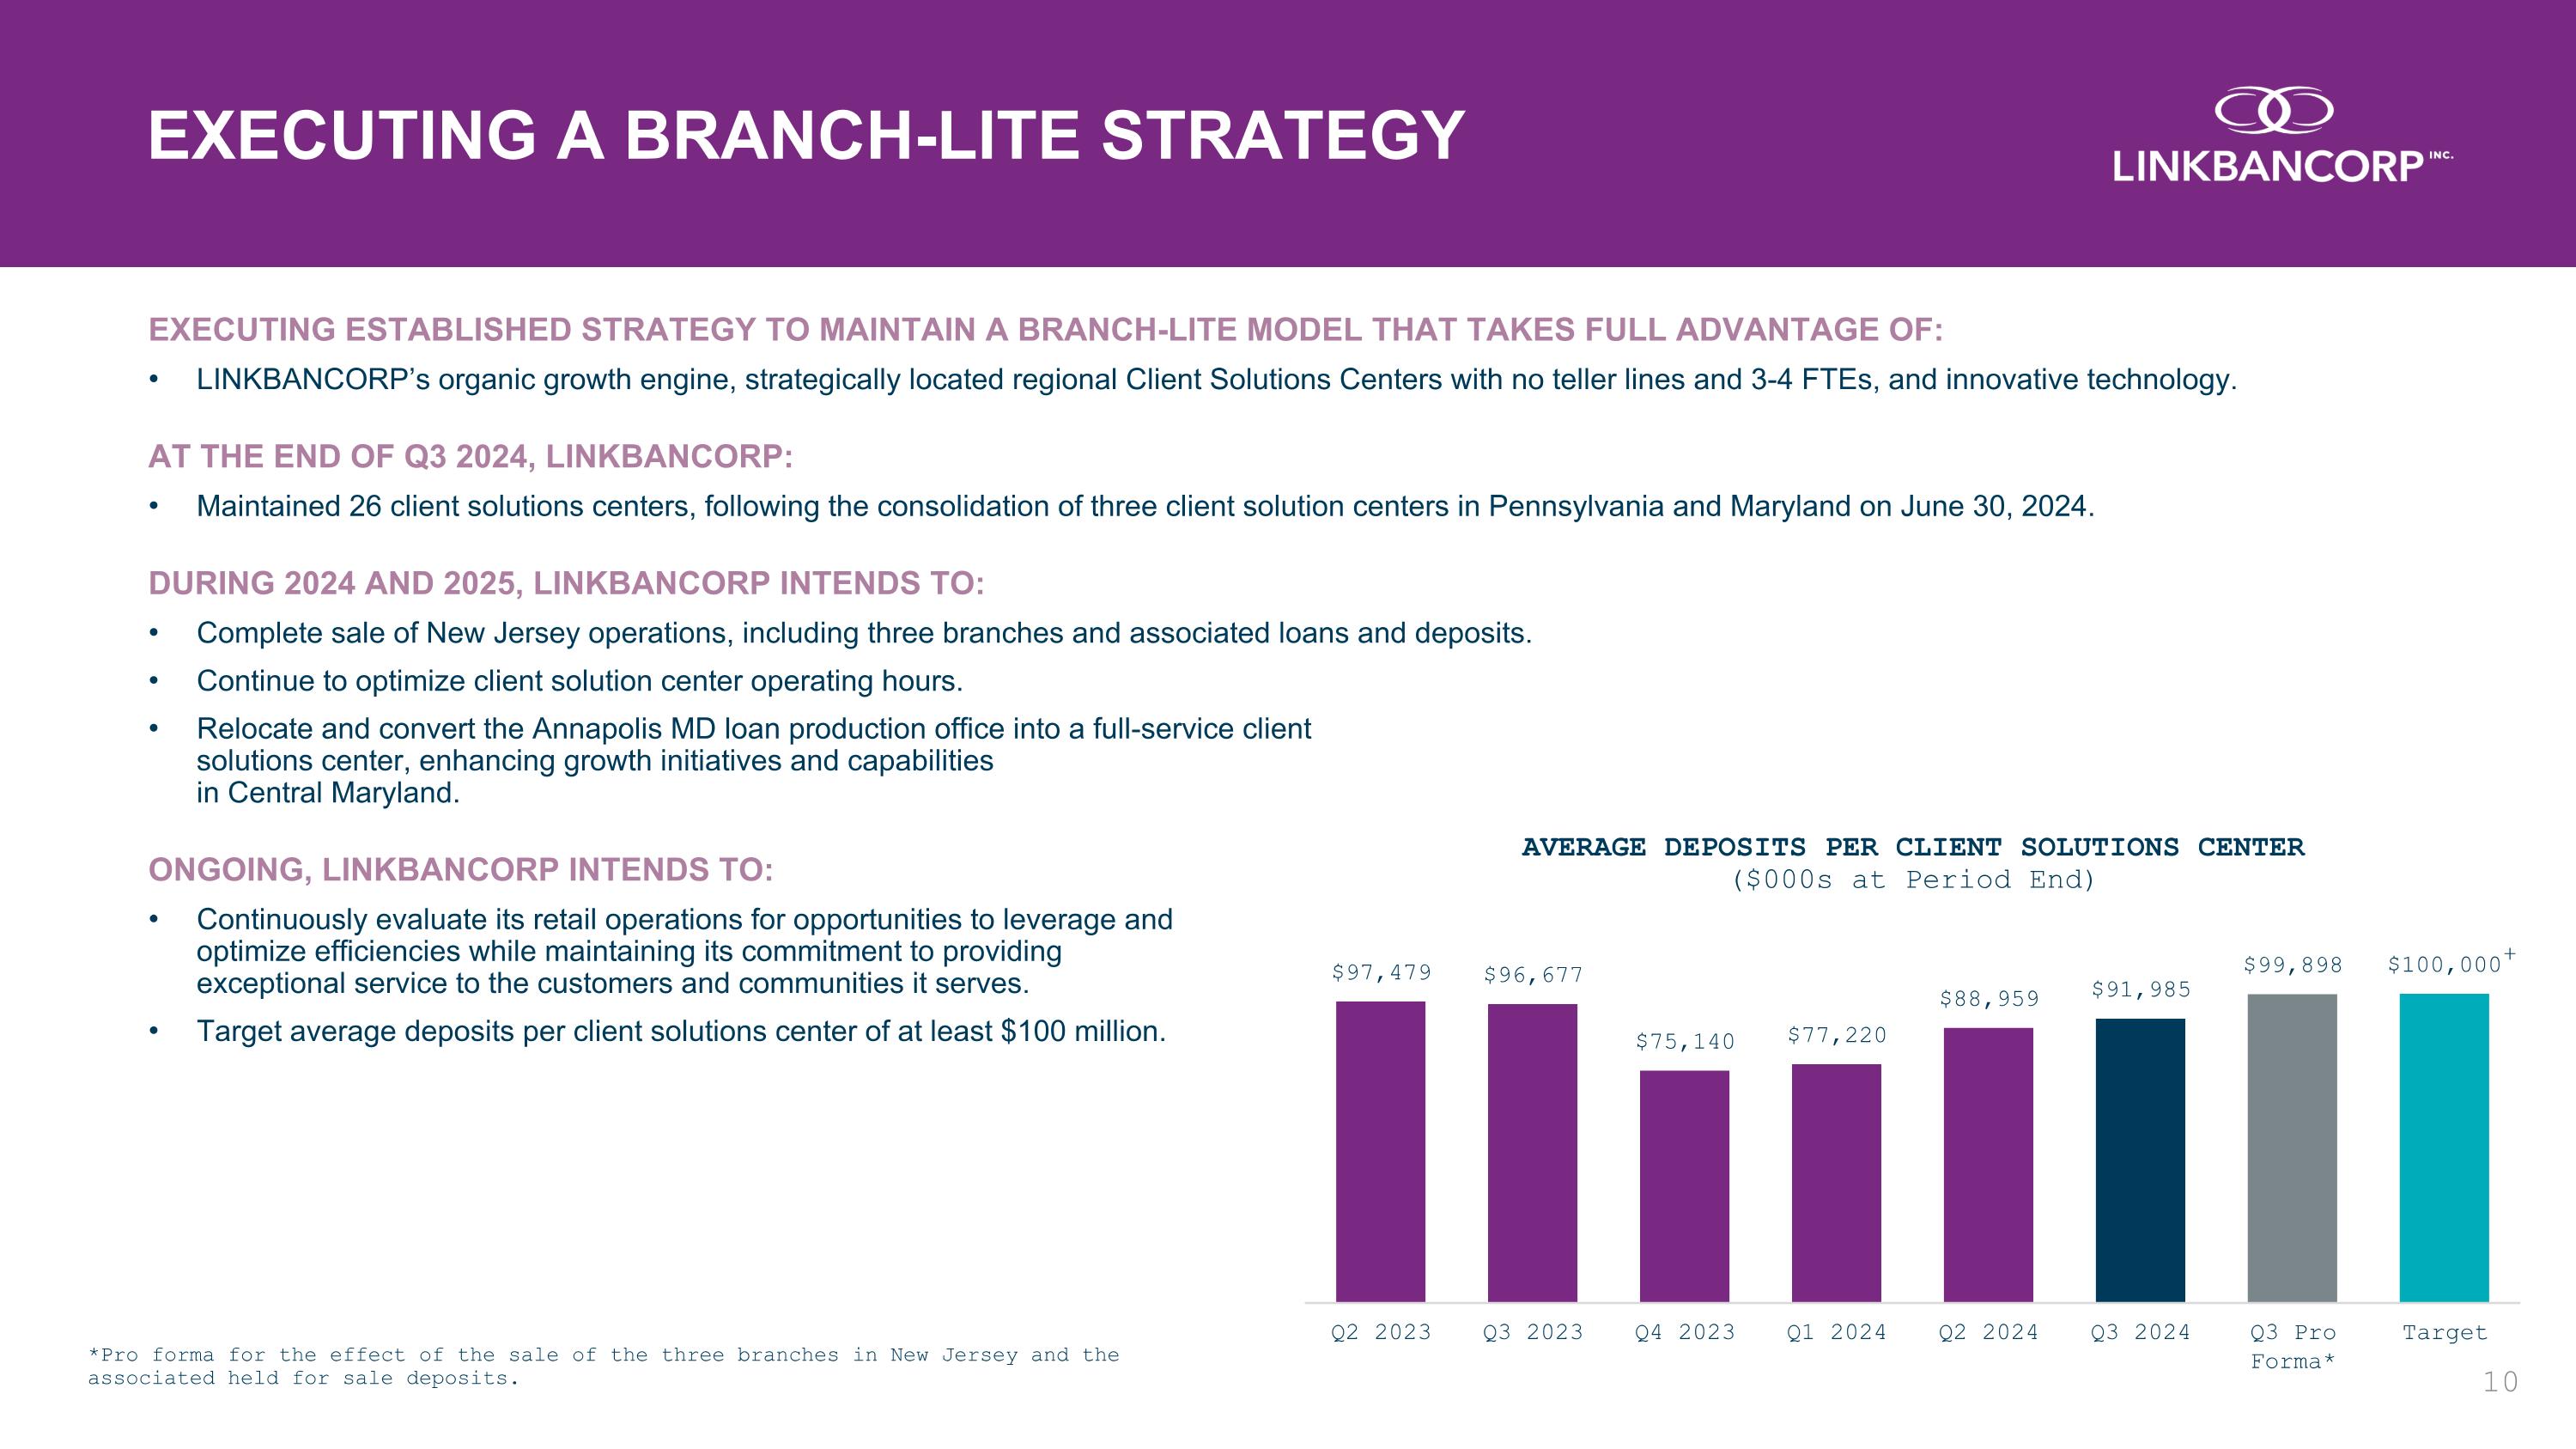
*Pro forma for the effect of the sale of the three branches in New Jersey and the associated held for sale deposits. EXECUTING ESTABLISHED STRATEGY TO MAINTAIN A BRANCH-LITE MODEL THAT TAKES FULL ADVANTAGE OF: LINKBANCORP’s organic growth engine, strategically located regional Client Solutions Centers with no teller lines and 3-4 FTEs, and innovative technology. AT THE END OF Q3 2024, LINKBANCORP: Maintained 26 client solutions centers, following the consolidation of three client solution centers in Pennsylvania and Maryland on June 30, 2024. DURING 2024 AND 2025, LINKBANCORP INTENDS TO: Complete sale of New Jersey operations, including three branches and associated loans and deposits. Continue to optimize client solution center operating hours. Relocate and convert the Annapolis MD loan production office into a full-service client solutions center, enhancing growth initiatives and capabilities in Central Maryland. ONGOING, LINKBANCORP INTENDS TO: Continuously evaluate its retail operations for opportunities to leverage andoptimize efficiencies while maintaining its commitment to providing exceptional service to the customers and communities it serves. Target average deposits per client solutions center of at least $100 million. EXECUTING A BRANCH-LITE STRATEGY +
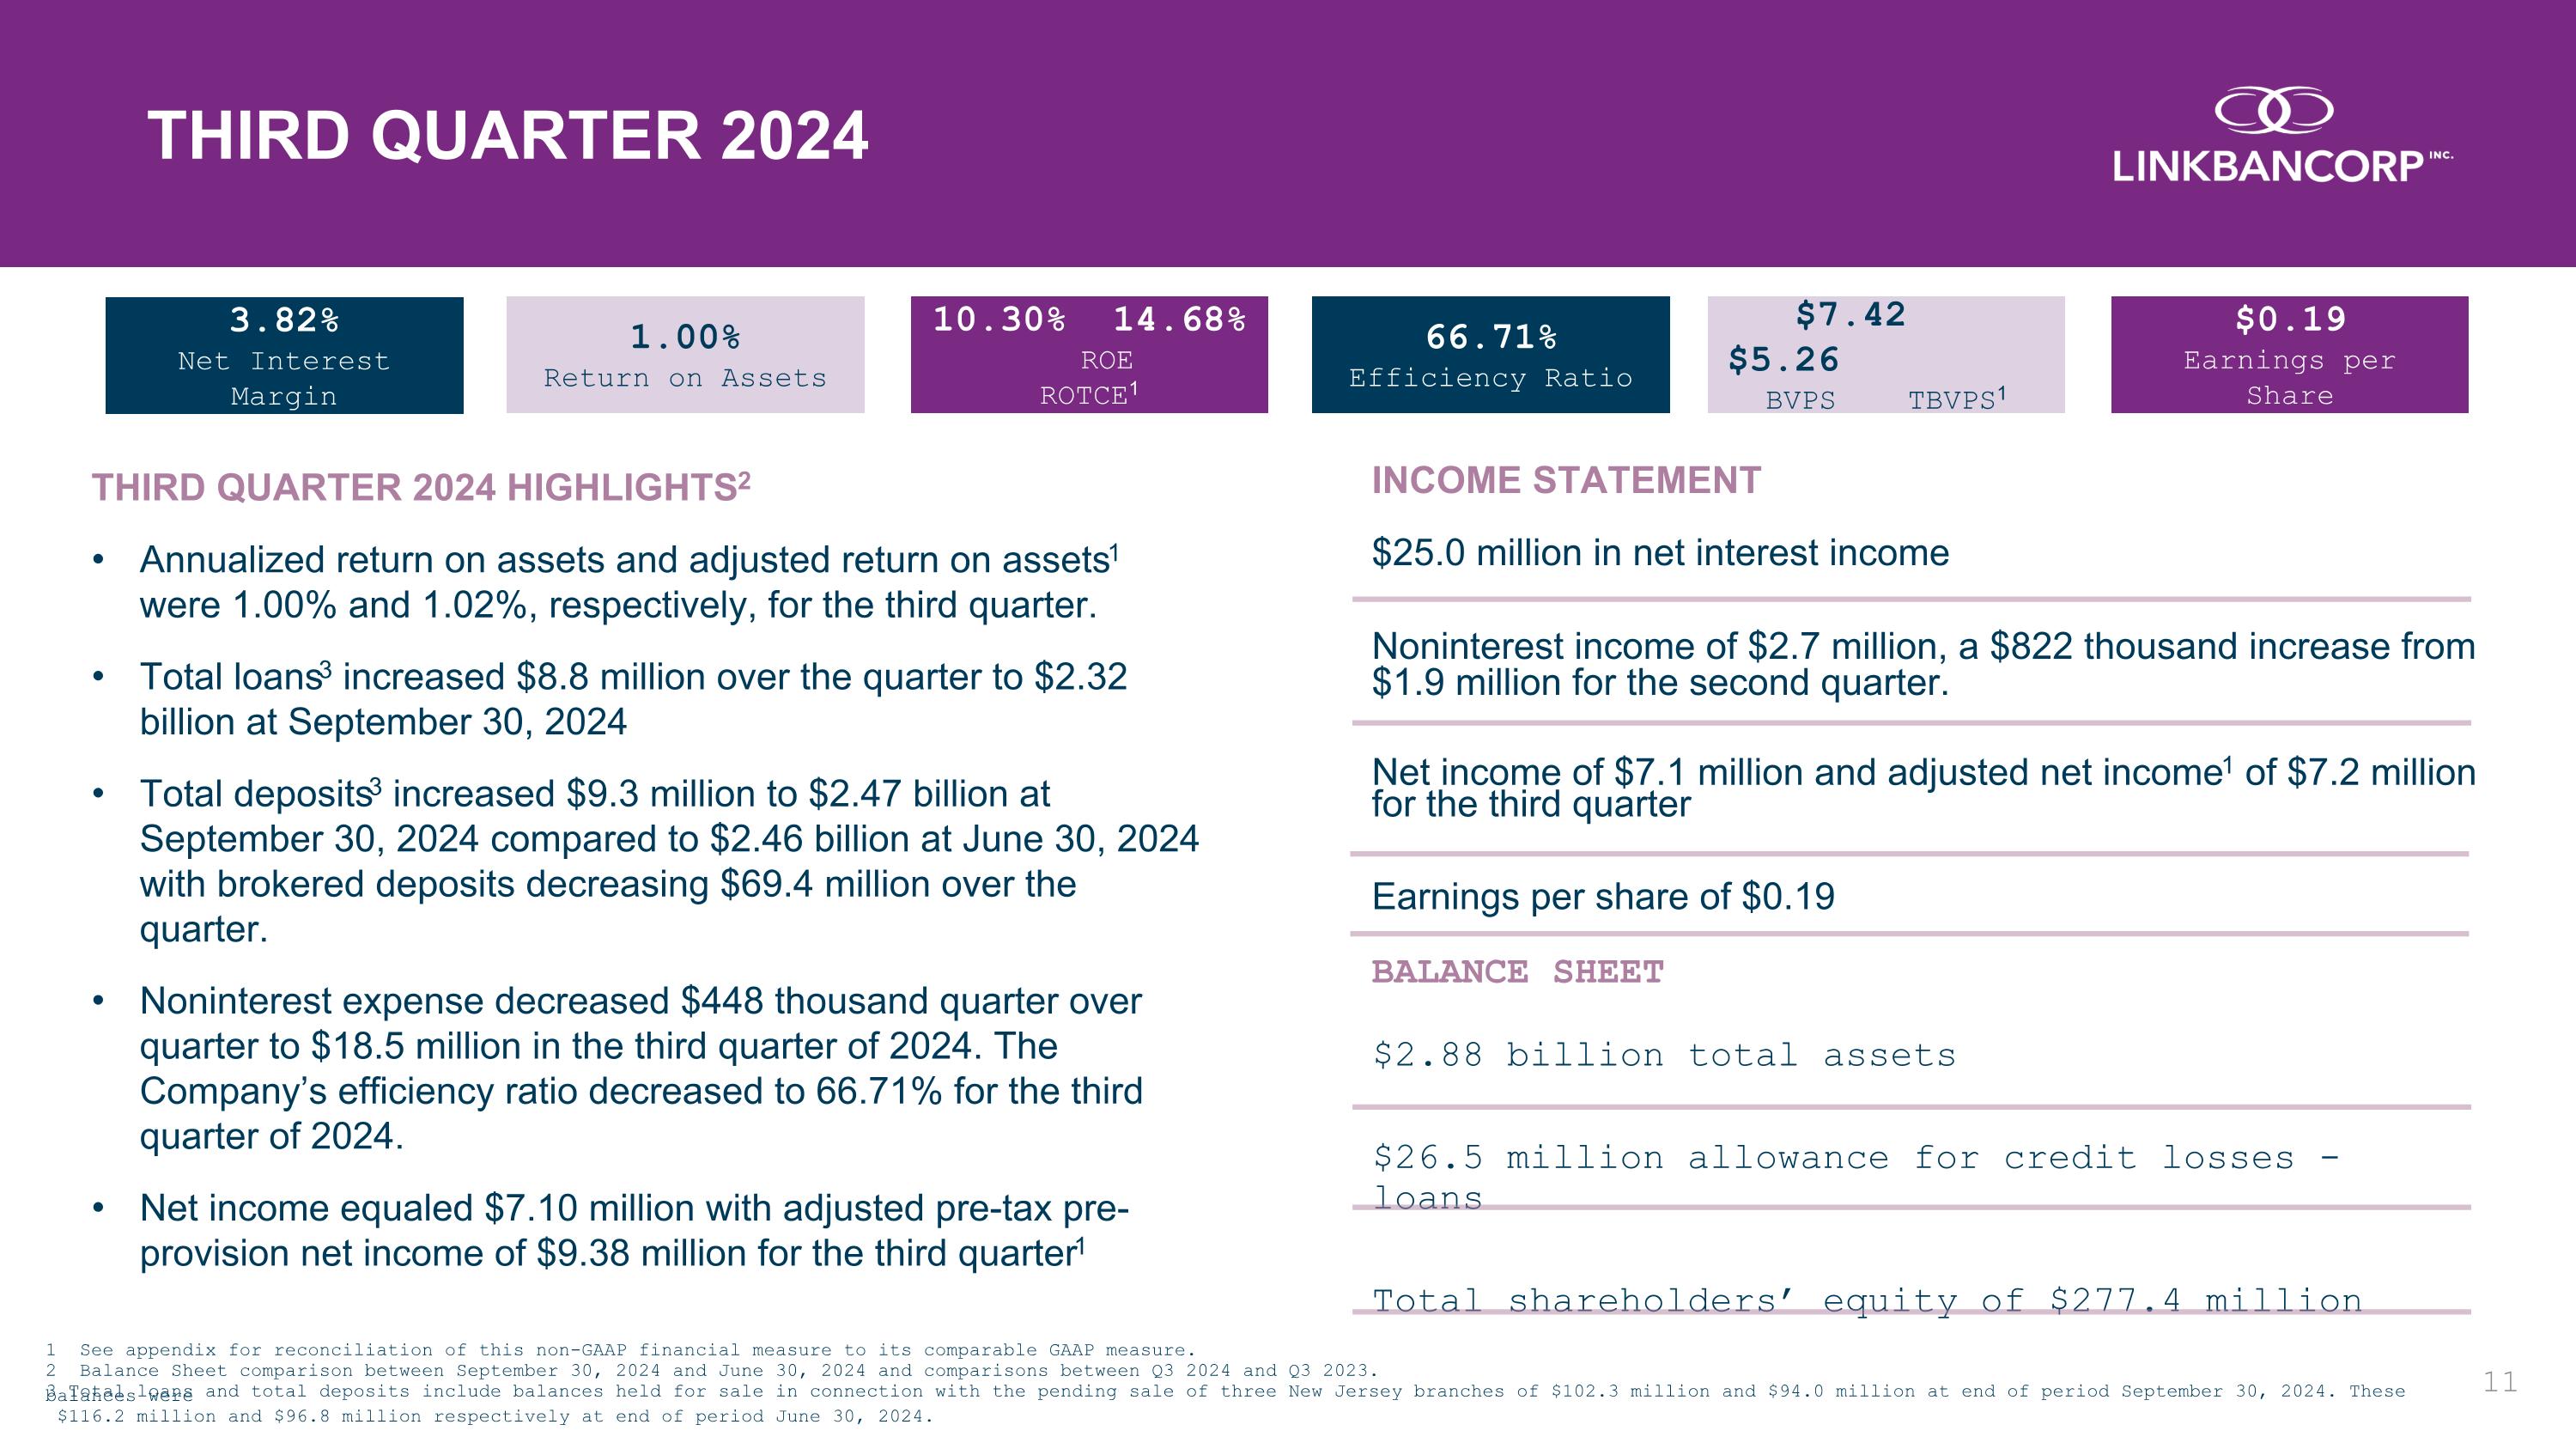
THIRD QUARTER 2024 HIGHLIGHTS2 Annualized return on assets and adjusted return on assets1 were 1.00% and 1.02%, respectively, for the third quarter. Total loans3 increased $8.8 million over the quarter to $2.32 billion at September 30, 2024 Total deposits3 increased $9.3 million to $2.47 billion at September 30, 2024 compared to $2.46 billion at June 30, 2024 with brokered deposits decreasing $69.4 million over the quarter. Noninterest expense decreased $448 thousand quarter over quarter to $18.5 million in the third quarter of 2024. The Company’s efficiency ratio decreased to 66.71% for the third quarter of 2024. Net income equaled $7.10 million with adjusted pre-tax pre-provision net income of $9.38 million for the third quarter1 BALANCE SHEET INCOME STATEMENT $25.0 million in net interest income Noninterest income of $2.7 million, a $822 thousand increase from $1.9 million for the second quarter. Net income of $7.1 million and adjusted net income1 of $7.2 million for the third quarter Earnings per share of $0.19 THIRD QUARTER 2024 $2.88 billion total assets $26.5 million allowance for credit losses - loans Total shareholders’ equity of $277.4 million 3.82% Net Interest Margin 1.00% Return on Assets 10.30% 14.68% ROE ROTCE1 66.71% Efficiency Ratio $7.42 $5.26 BVPS TBVPS1 $0.19 Earnings per Share 1 See appendix for reconciliation of this non-GAAP financial measure to its comparable GAAP measure. 2 Balance Sheet comparison between September 30, 2024 and June 30, 2024 and comparisons between Q3 2024 and Q3 2023. 3 Total loans and total deposits include balances held for sale in connection with the pending sale of three New Jersey branches of $102.3 million and $94.0 million at end of period September 30, 2024. These balances were $116.2 million and $96.8 million respectively at end of period June 30, 2024.
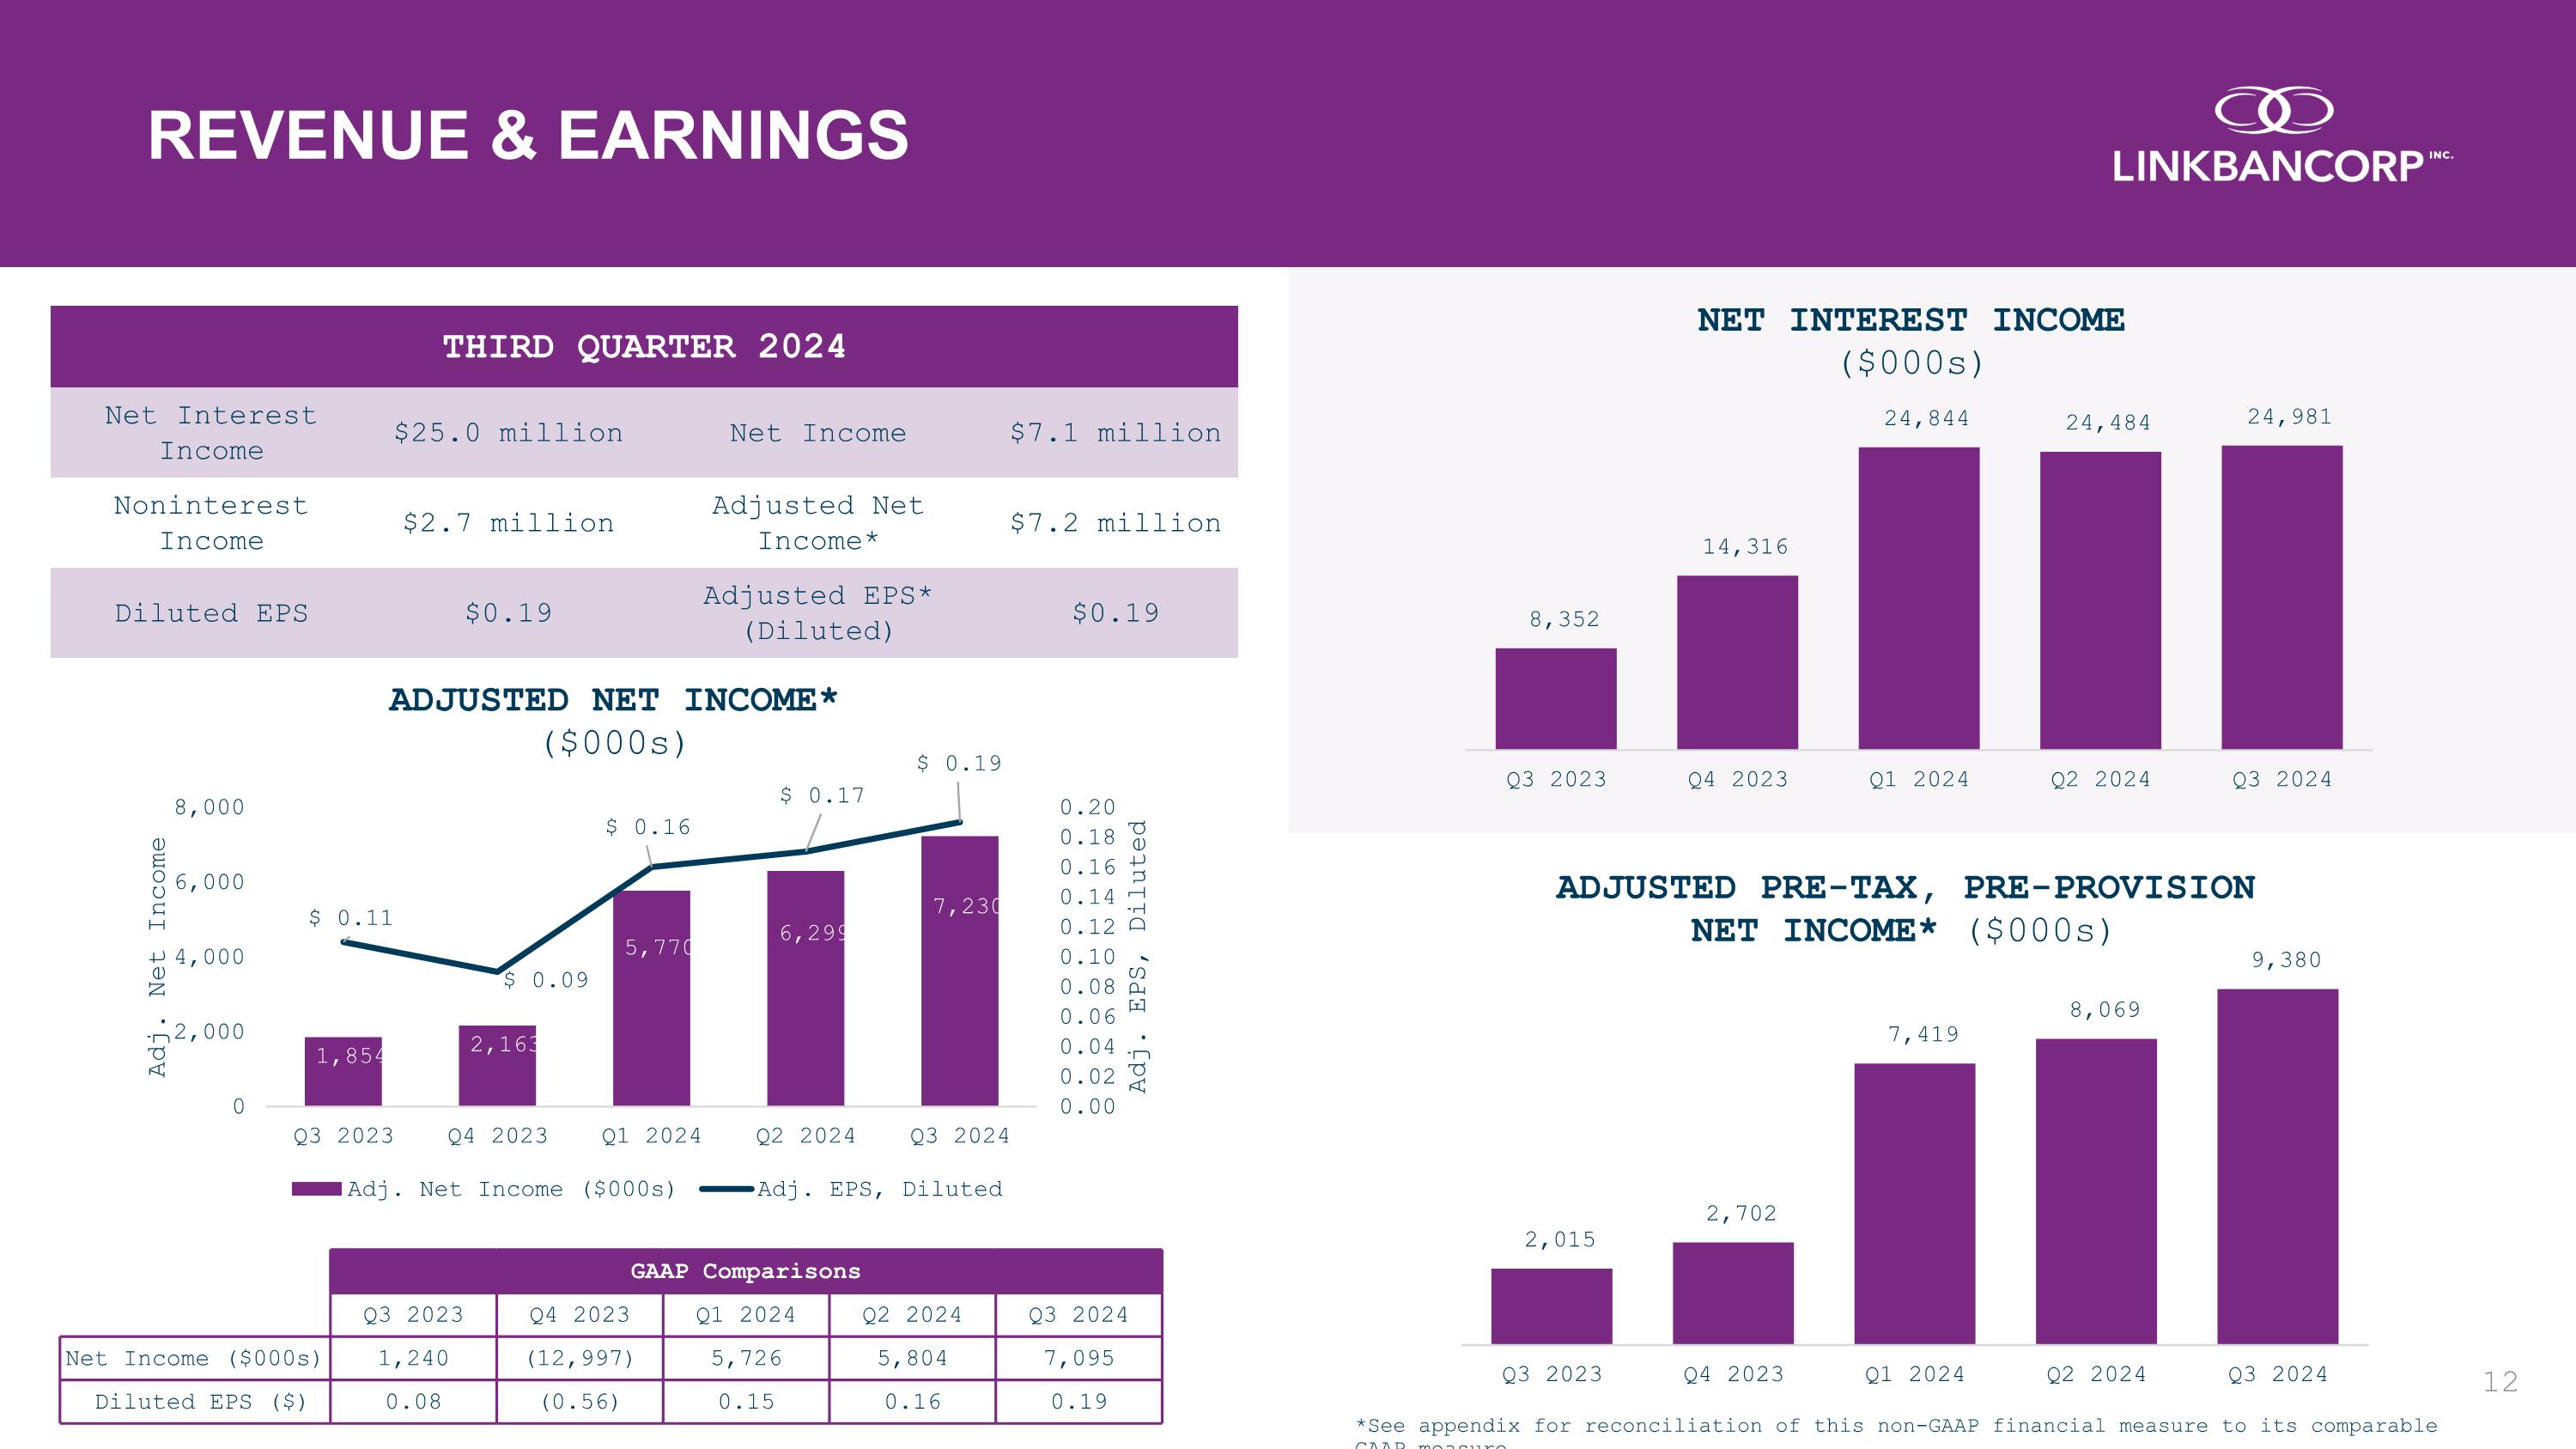
*See appendix for reconciliation of this non-GAAP financial measure to its comparable GAAP measure. REVENUE & EARNINGS THIRD QUARTER 2024 Net Interest Income $25.0 million Net Income $7.1 million Noninterest Income $2.7 million Adjusted Net Income* $7.2 million Diluted EPS $0.19 Adjusted EPS* (Diluted) $0.19 GAAP Comparisons Q3 2023 Q4 2023 Q1 2024 Q2 2024 Q3 2024 Net Income ($000s) 1,240 (12,997) 5,726 5,804 7,095 Diluted EPS ($) 0.08 (0.56) 0.15 0.16 0.19
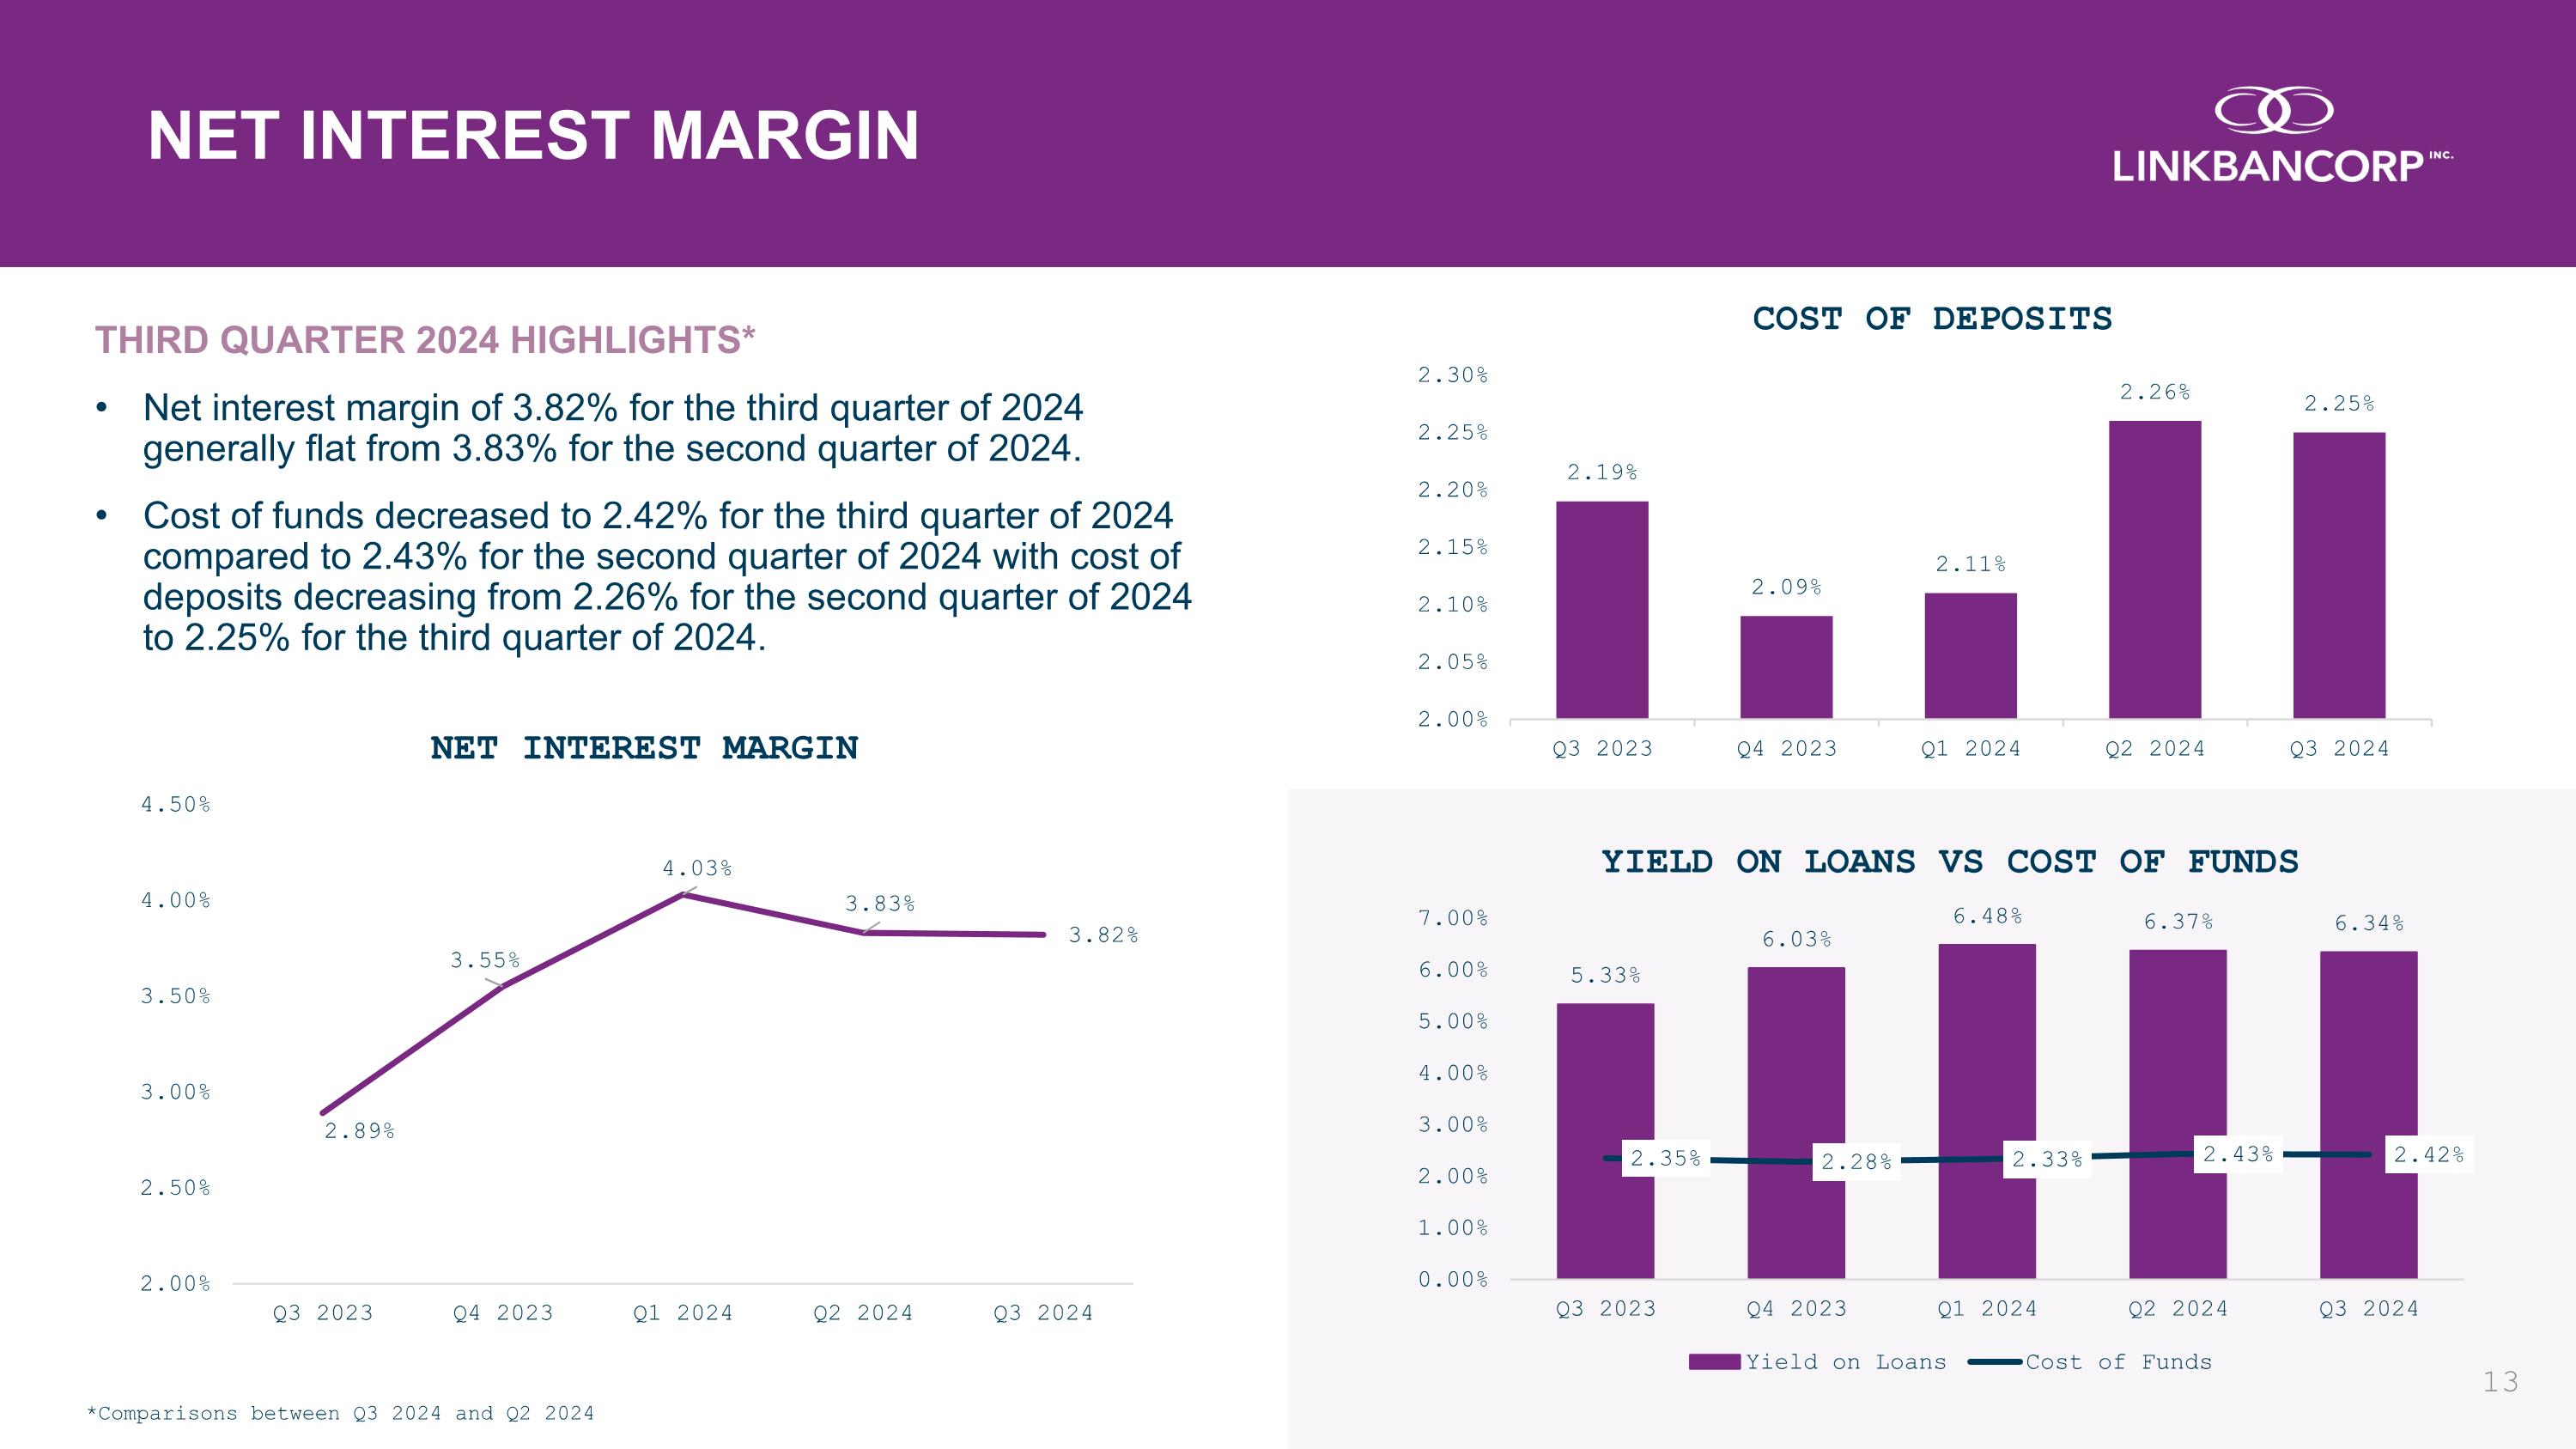
THIRD QUARTER 2024 HIGHLIGHTS* Net interest margin of 3.82% for the third quarter of 2024 generally flat from 3.83% for the second quarter of 2024. Cost of funds decreased to 2.42% for the third quarter of 2024 compared to 2.43% for the second quarter of 2024 with cost of deposits decreasing from 2.26% for the second quarter of 2024 to 2.25% for the third quarter of 2024. NET INTEREST MARGIN *Comparisons between Q3 2024 and Q2 2024
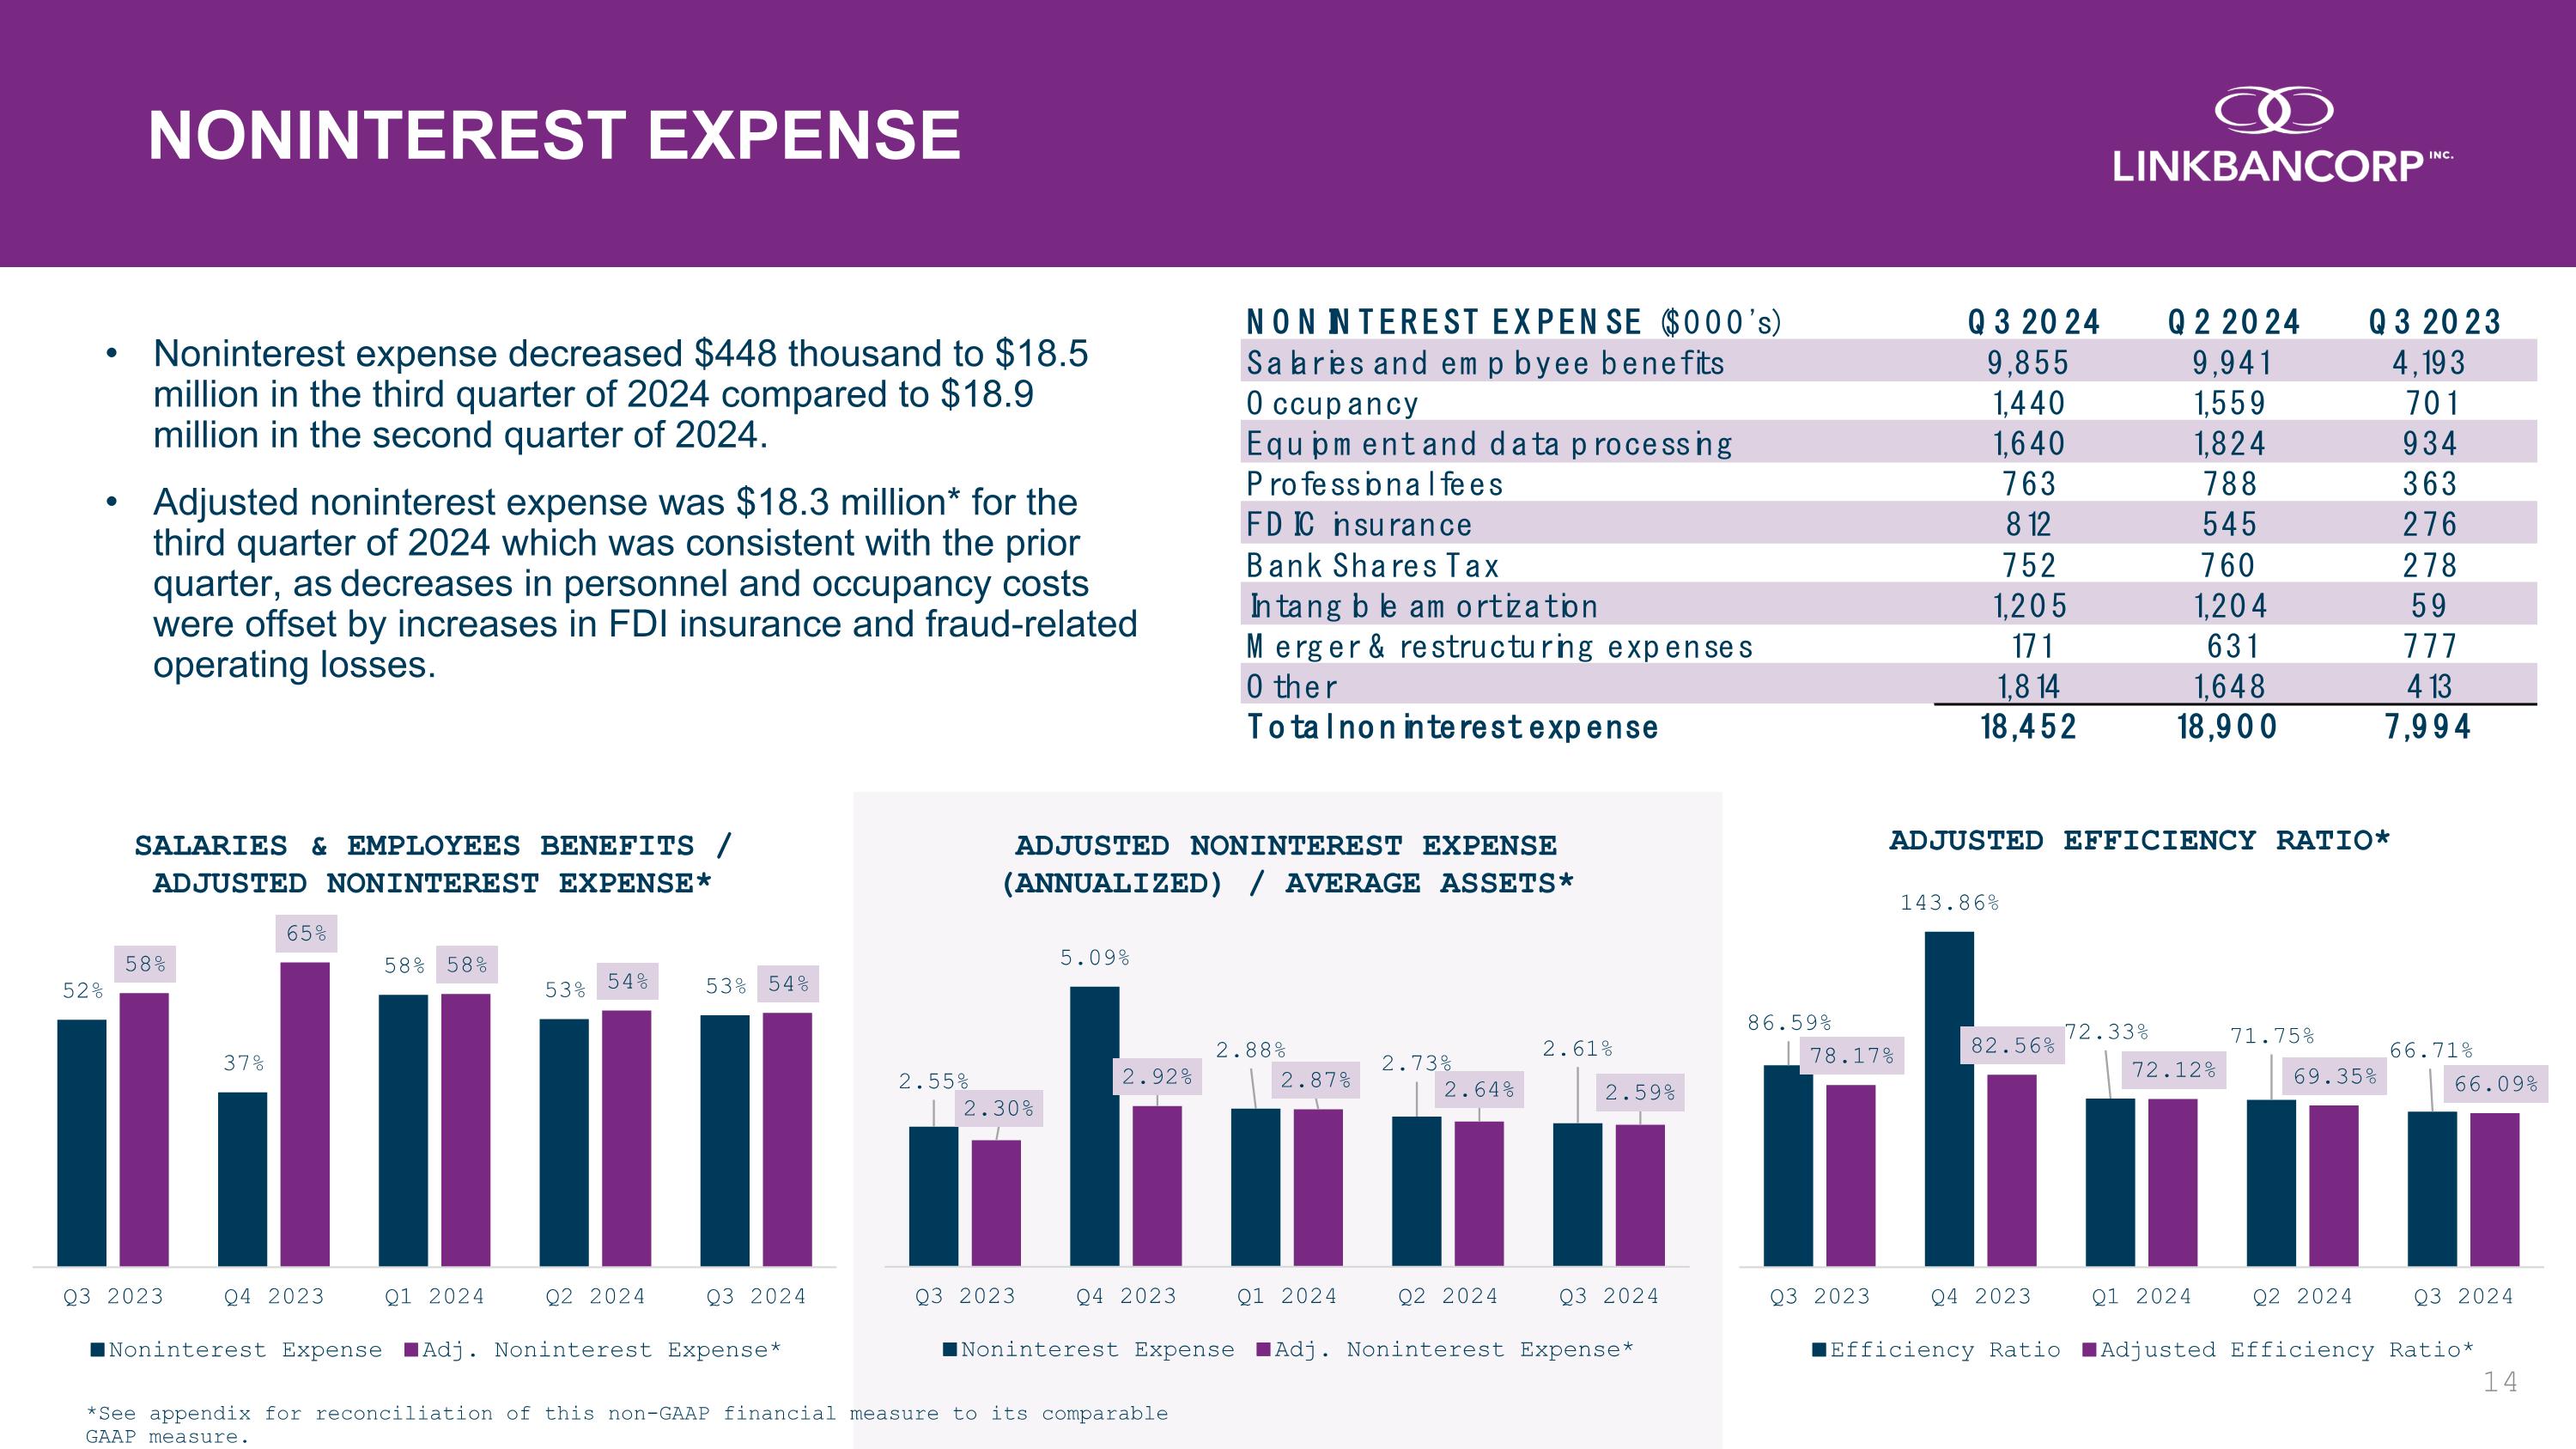
Noninterest expense decreased $448 thousand to $18.5 million in the third quarter of 2024 compared to $18.9 million in the second quarter of 2024. Adjusted noninterest expense was $18.3 million* for the third quarter of 2024 which was consistent with the prior quarter, as decreases in personnel and occupancy costs were offset by increases in FDI insurance and fraud-related operating losses. NONINTEREST EXPENSE *See appendix for reconciliation of this non-GAAP financial measure to its comparable GAAP measure.
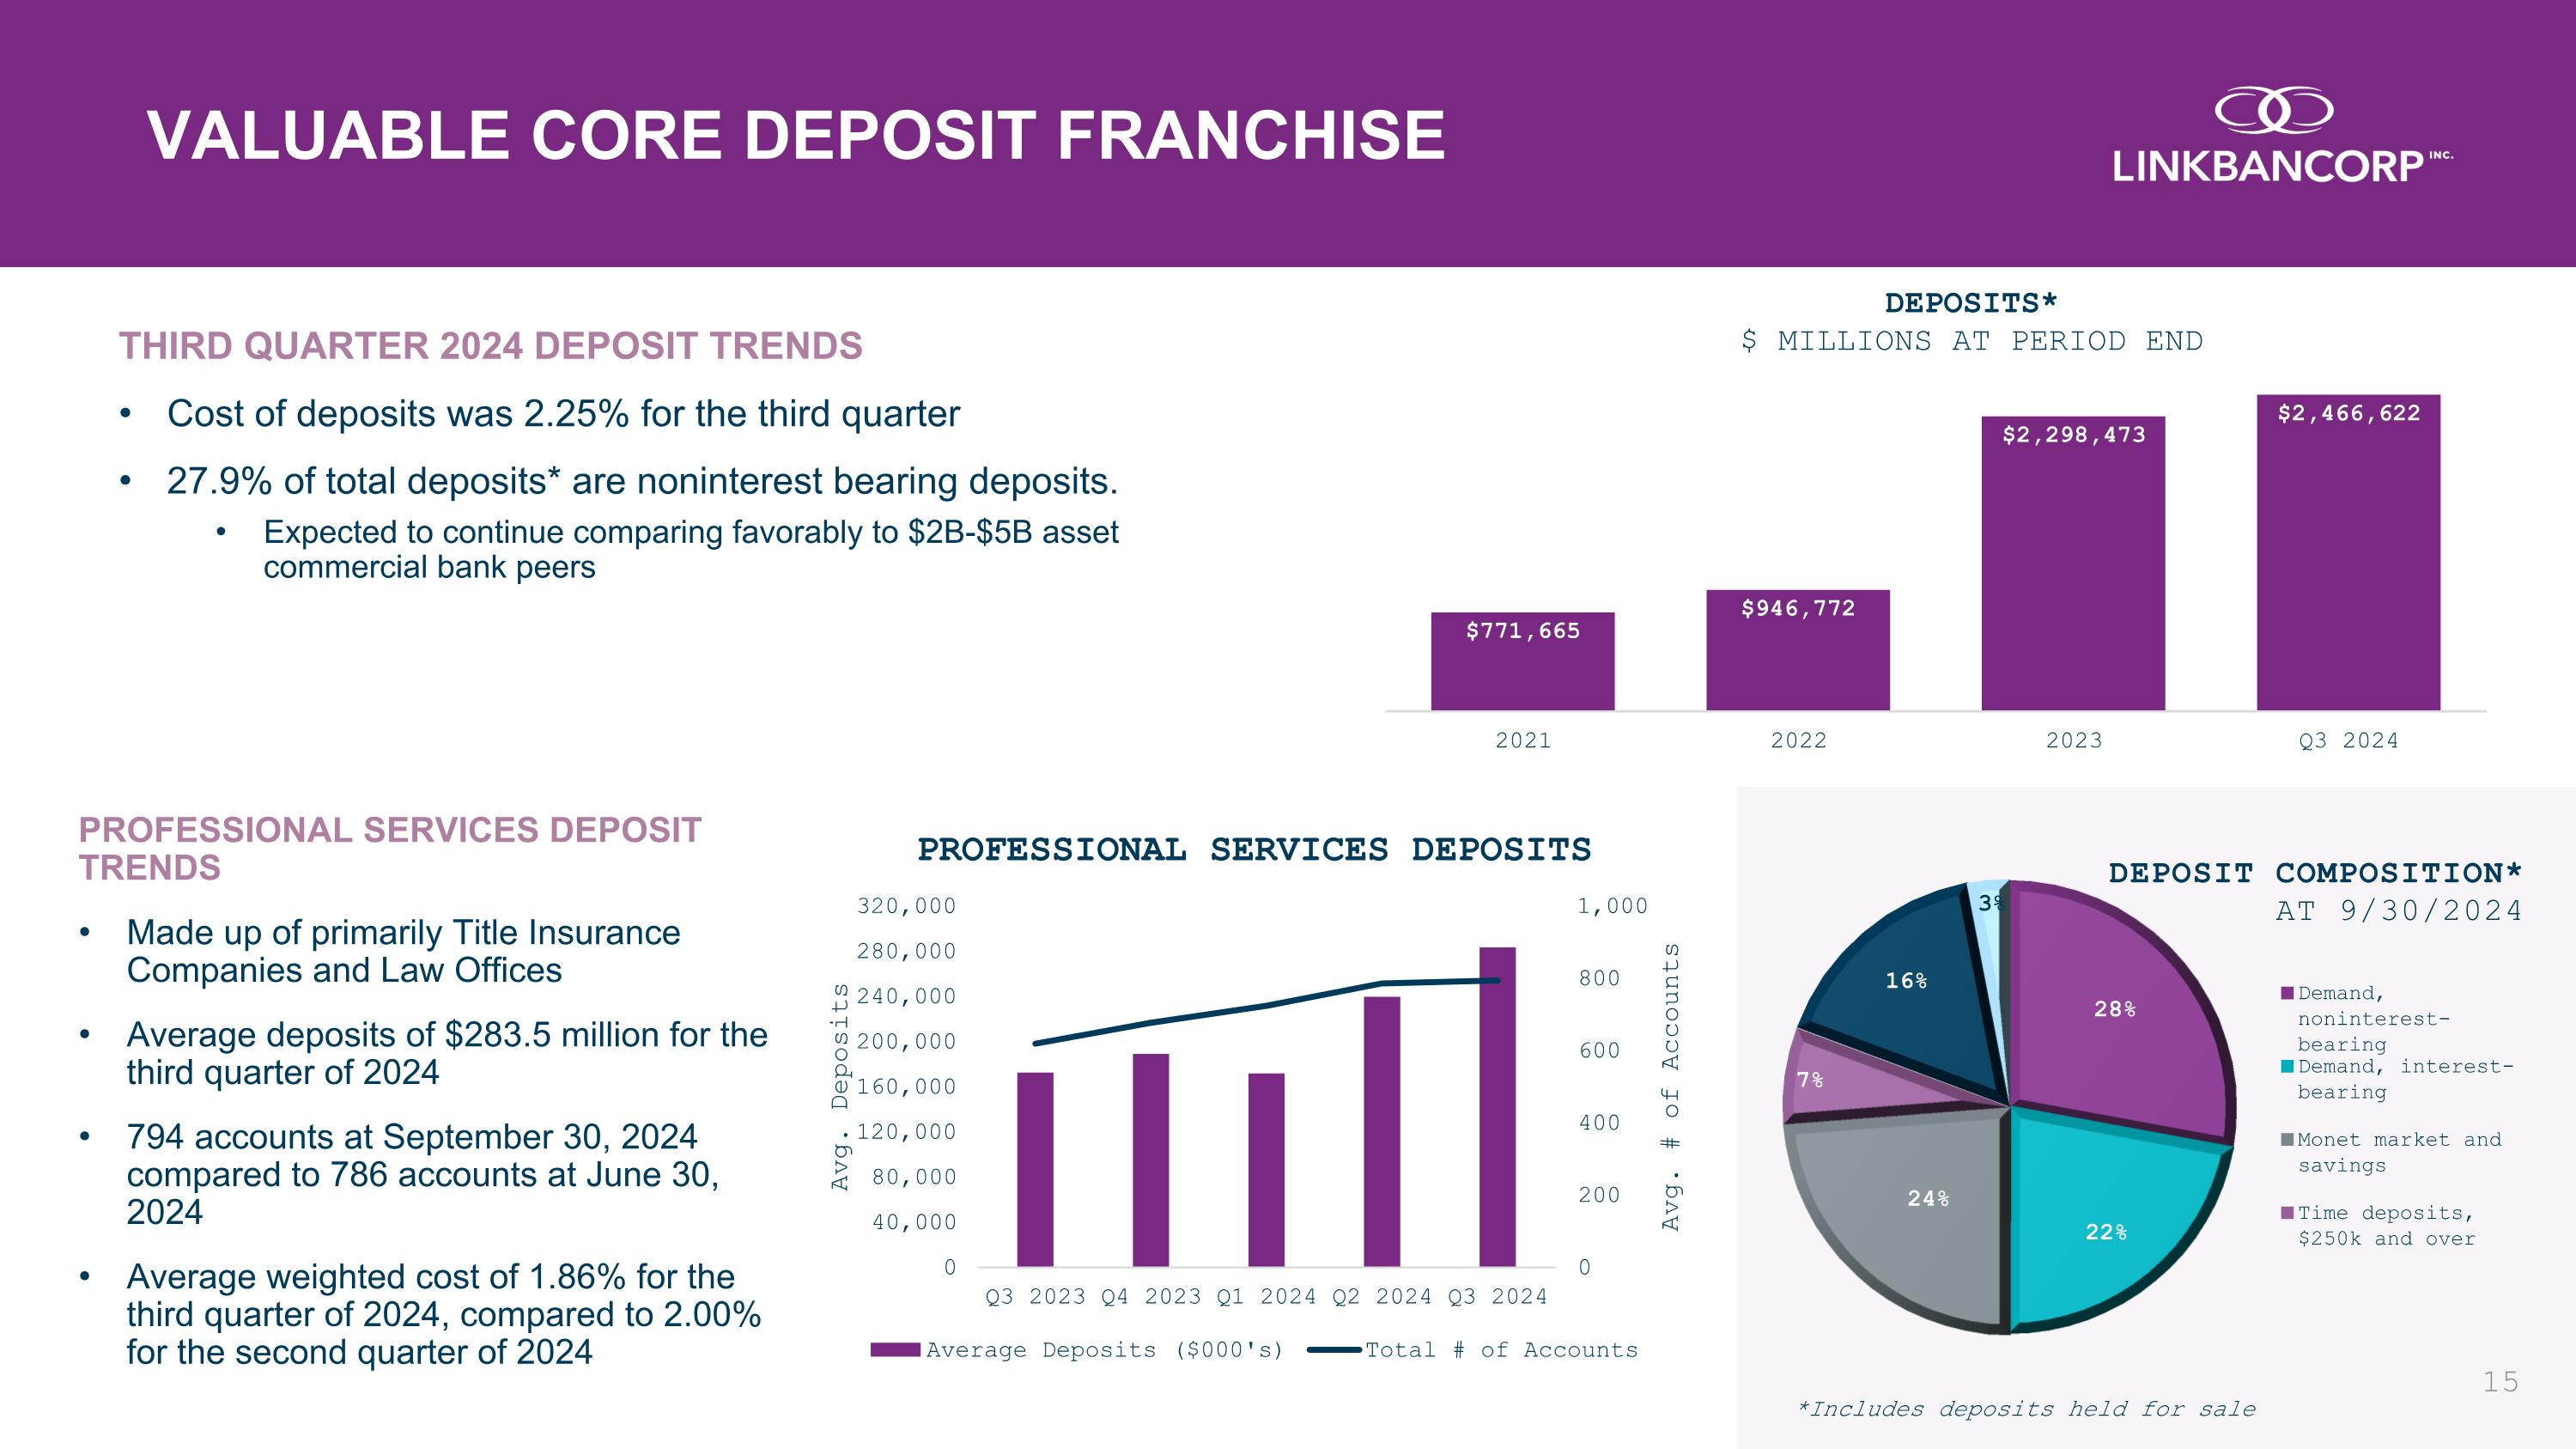
THIRD QUARTER 2024 DEPOSIT TRENDS Cost of deposits was 2.25% for the third quarter 27.9% of total deposits* are noninterest bearing deposits. Expected to continue comparing favorably to $2B-$5B asset commercial bank peers PROFESSIONAL SERVICES DEPOSIT TRENDS Made up of primarily Title Insurance Companies and Law Offices Average deposits of $283.5 million for the third quarter of 2024 794 accounts at September 30, 2024 compared to 786 accounts at June 30, 2024 Average weighted cost of 1.86% for the third quarter of 2024, compared to 2.00% for the second quarter of 2024 VALUABLE CORE DEPOSIT FRANCHISE *Includes deposits held for sale
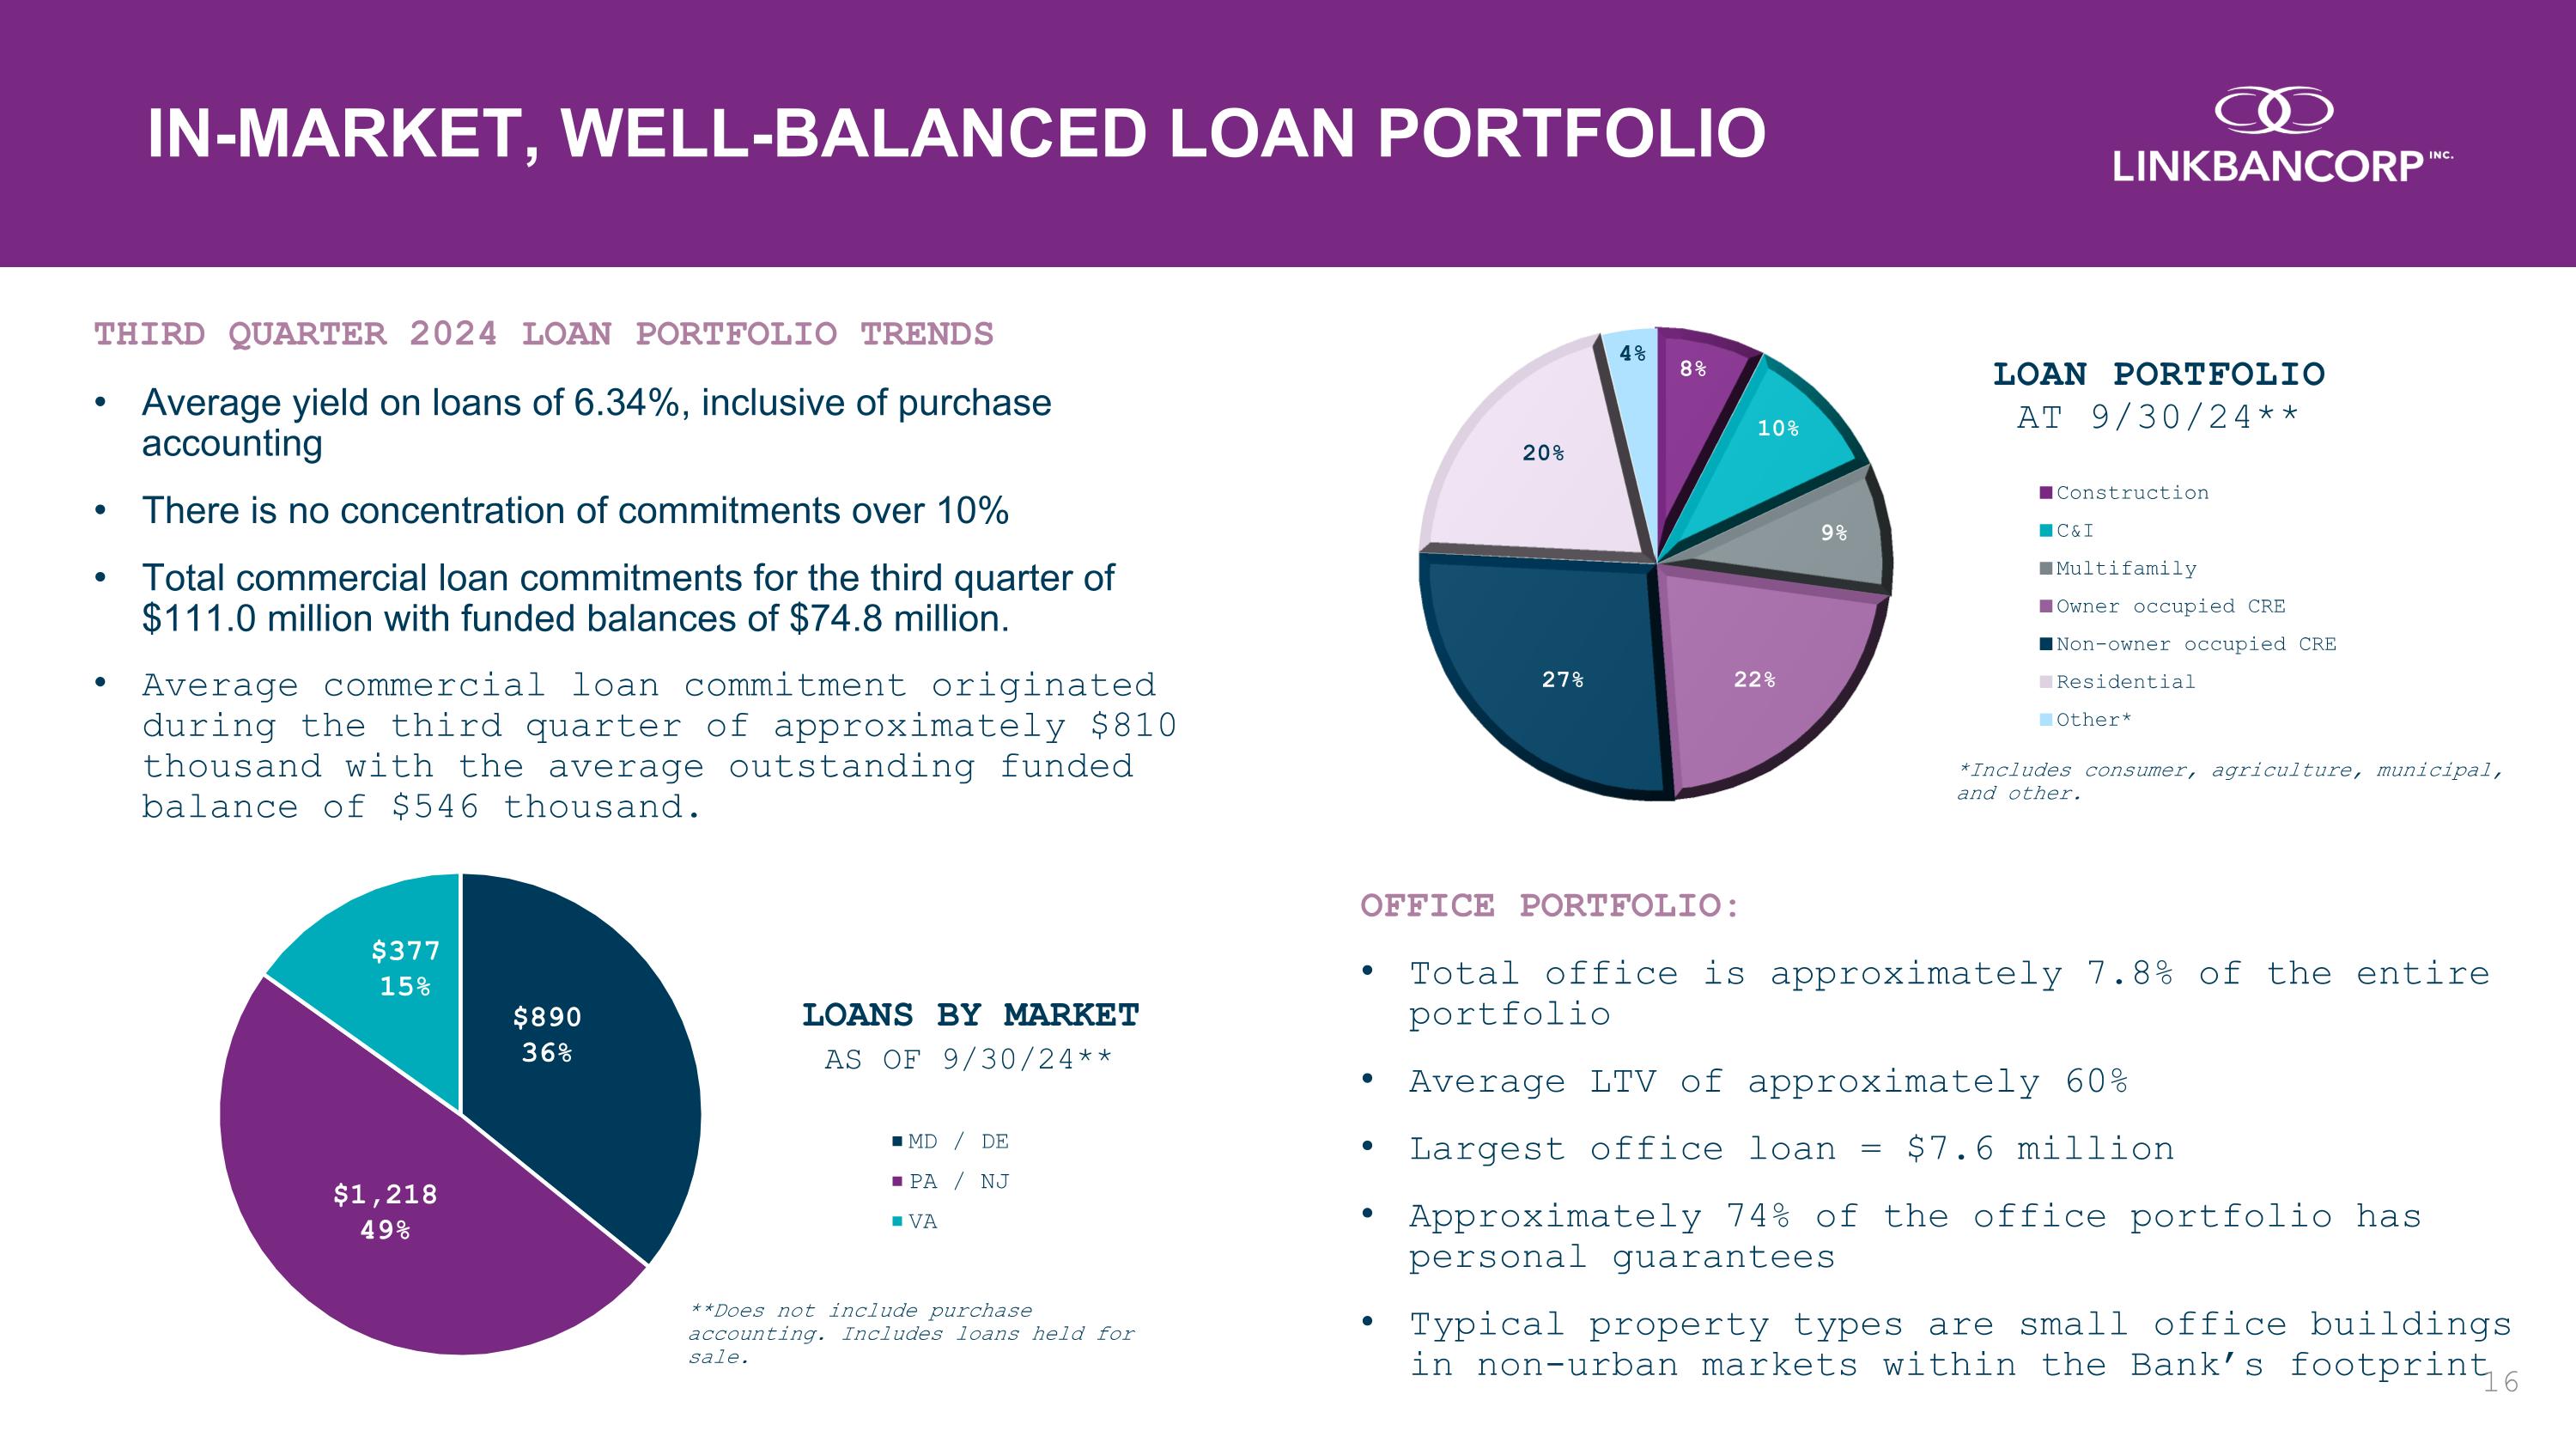
THIRD QUARTER 2024 LOAN PORTFOLIO TRENDS Average yield on loans of 6.34%, inclusive of purchase accounting There is no concentration of commitments over 10% Total commercial loan commitments for the third quarter of $111.0 million with funded balances of $74.8 million. Average commercial loan commitment originated during the third quarter of approximately $810 thousand with the average outstanding funded balance of $546 thousand. IN-MARKET, WELL-BALANCED LOAN PORTFOLIO **Does not include purchase accounting. Includes loans held for sale. OFFICE PORTFOLIO: Total office is approximately 7.8% of the entire portfolio Average LTV of approximately 60% Largest office loan = $7.6 million Approximately 74% of the office portfolio has personal guarantees Typical property types are small office buildings in non-urban markets within the Bank’s footprint *Includes consumer, agriculture, municipal, and other.
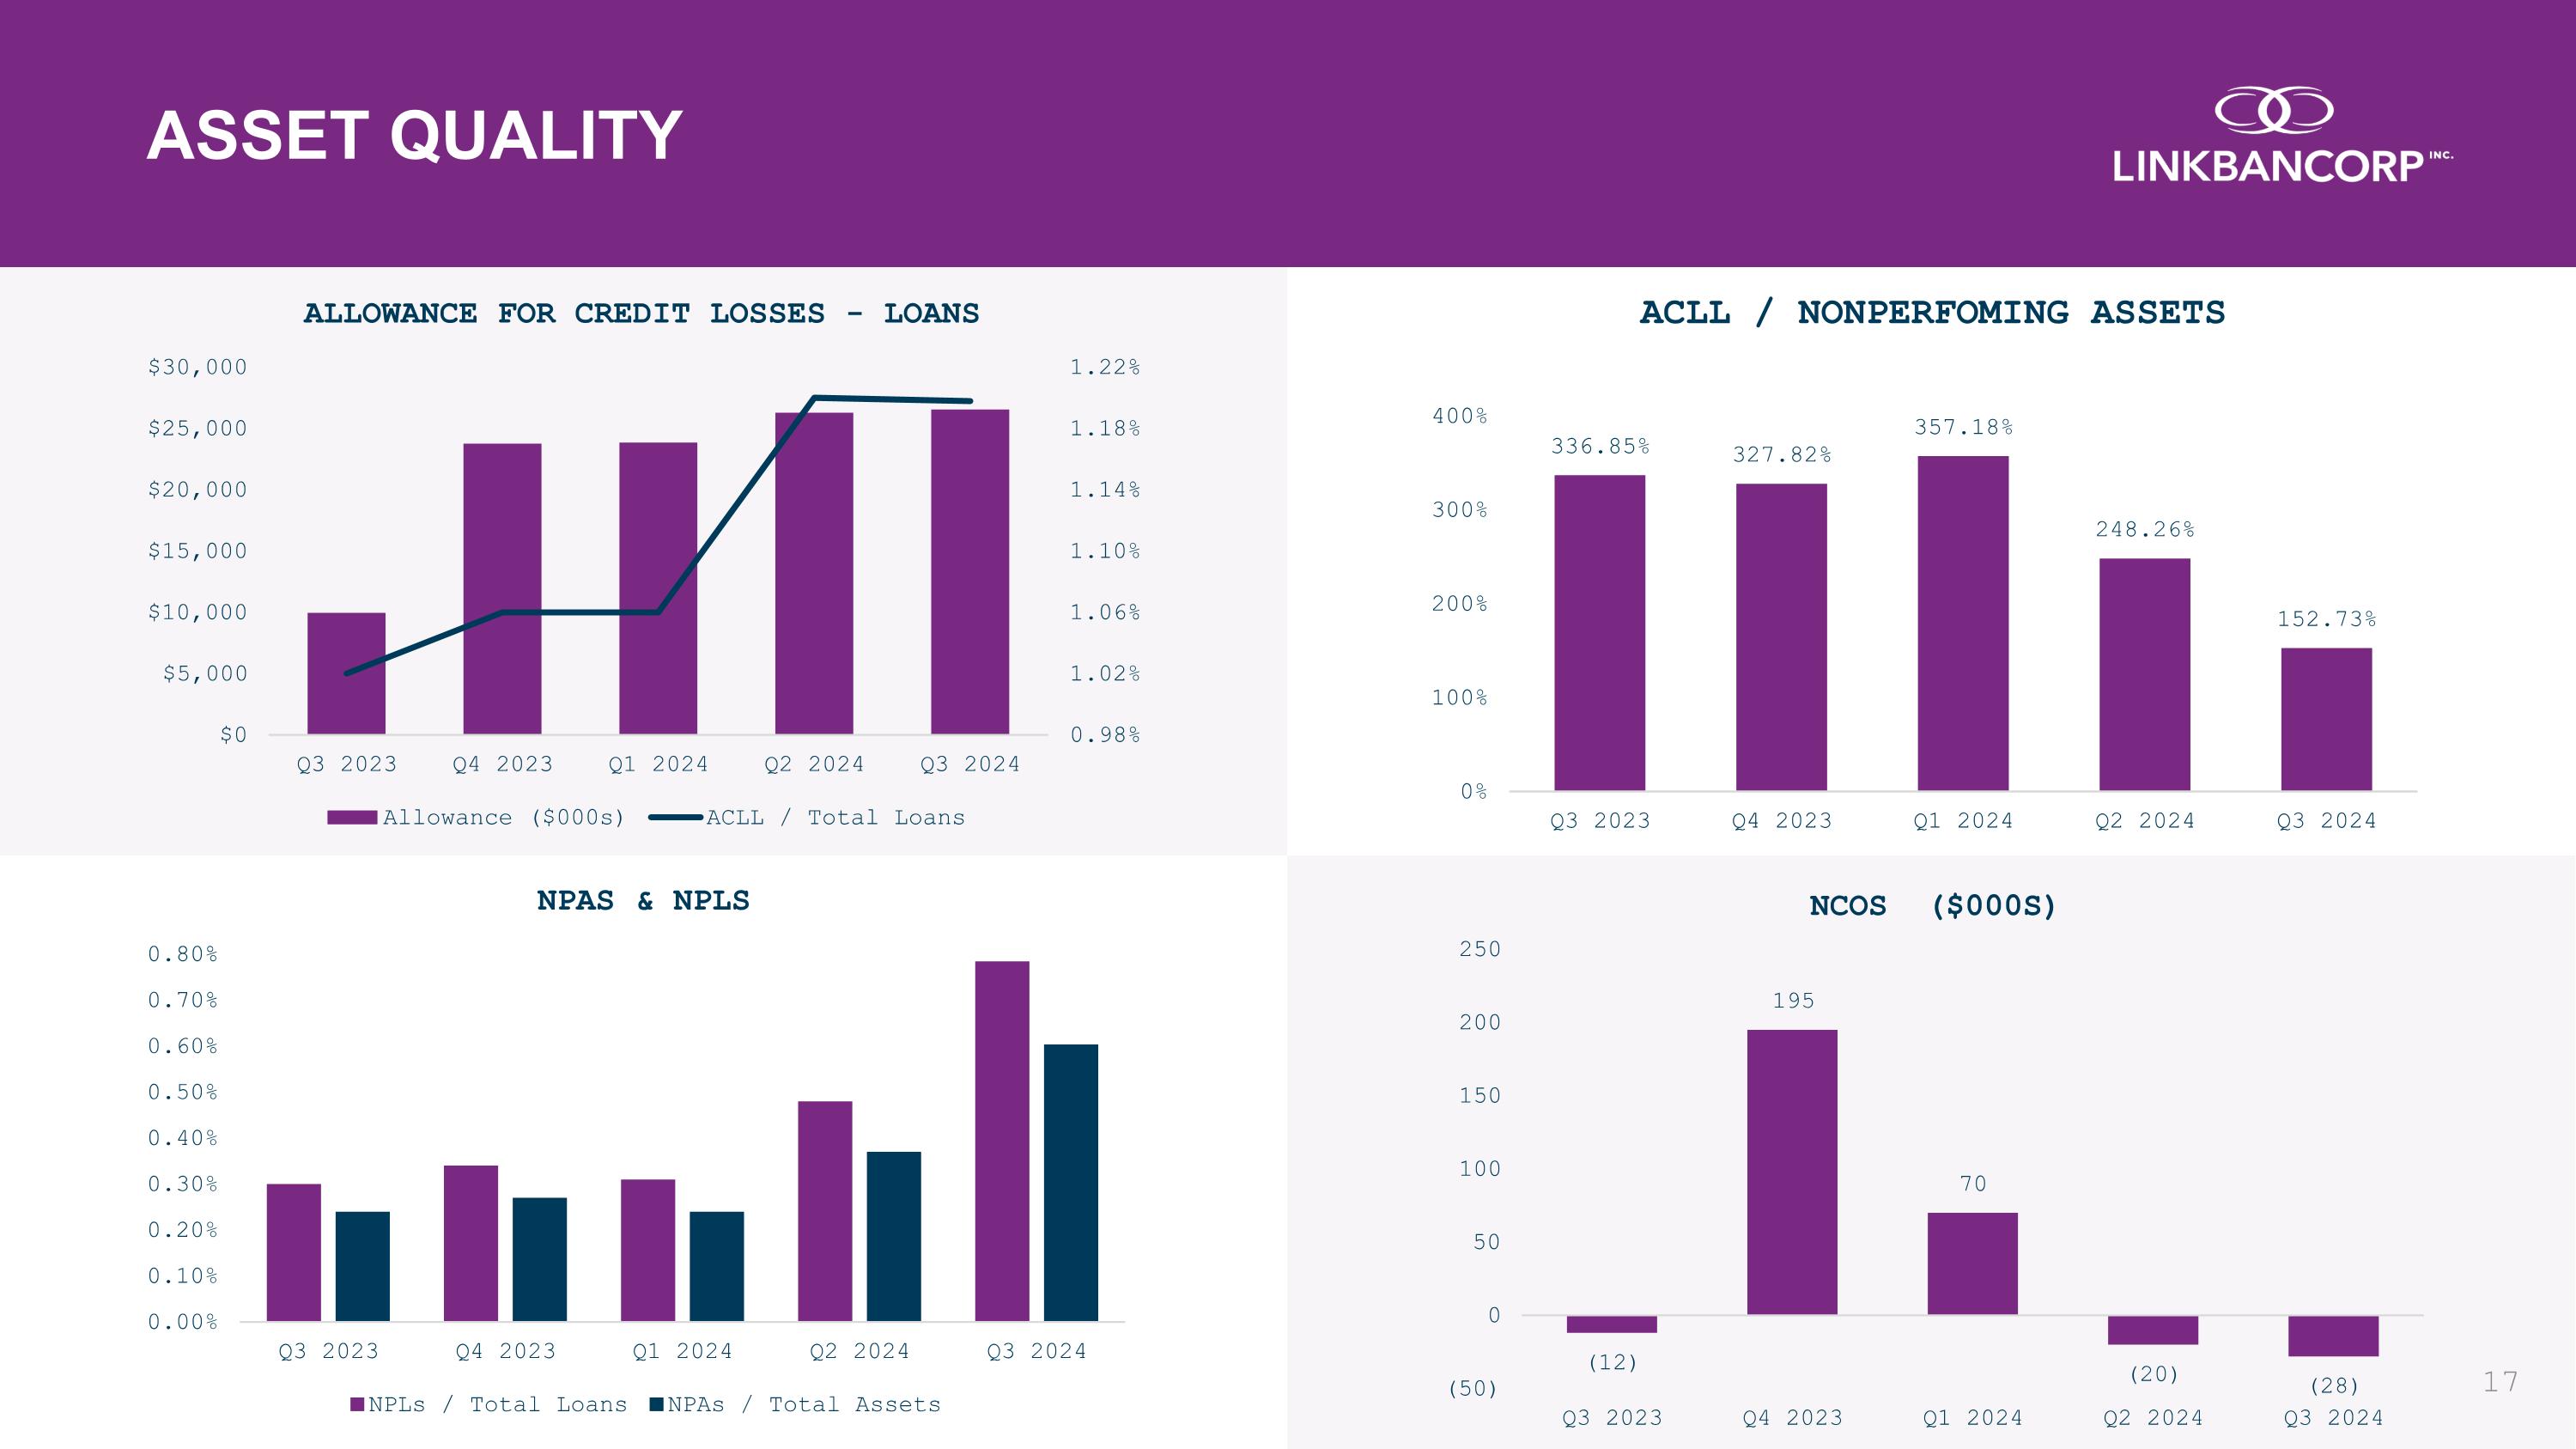
ASSET QUALITY
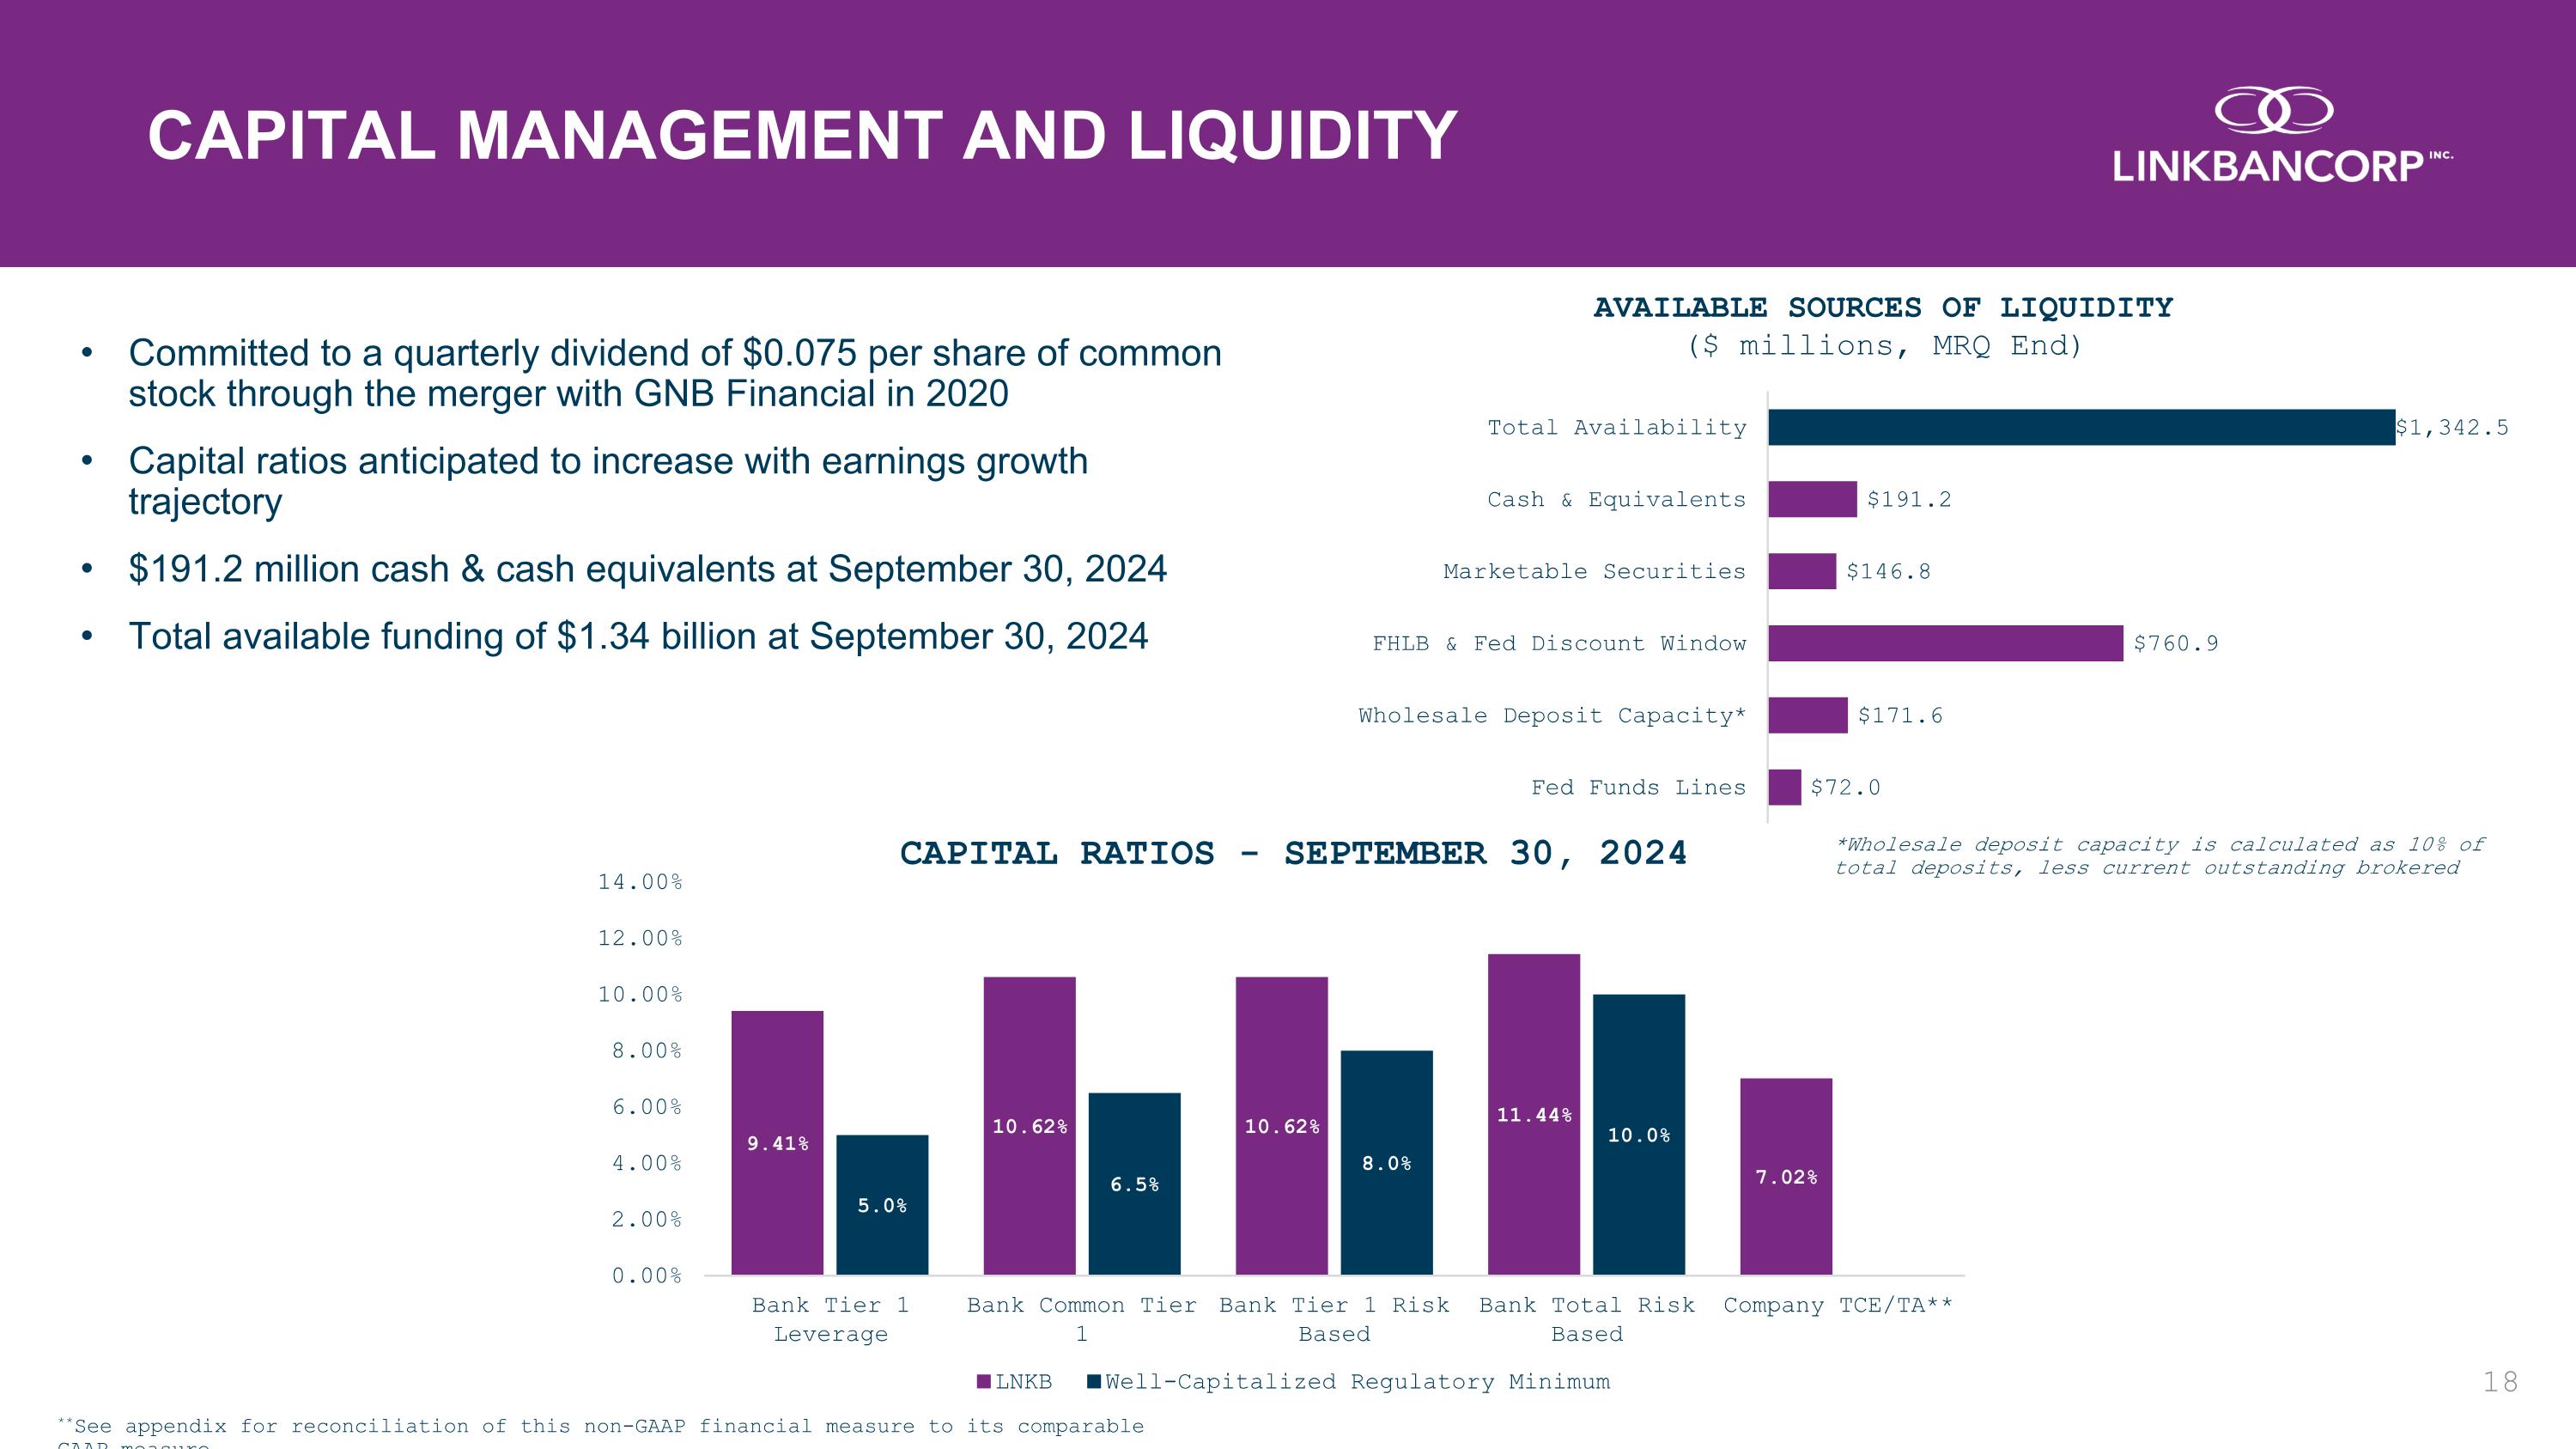
Committed to a quarterly dividend of $0.075 per share of common stock through the merger with GNB Financial in 2020 Capital ratios anticipated to increase with earnings growth trajectory $191.2 million cash & cash equivalents at September 30, 2024 Total available funding of $1.34 billion at September 30, 2024 CAPITAL MANAGEMENT AND LIQUIDITY *Wholesale deposit capacity is calculated as 10% of total deposits, less current outstanding brokered **See appendix for reconciliation of this non-GAAP financial measure to its comparable GAAP measure.
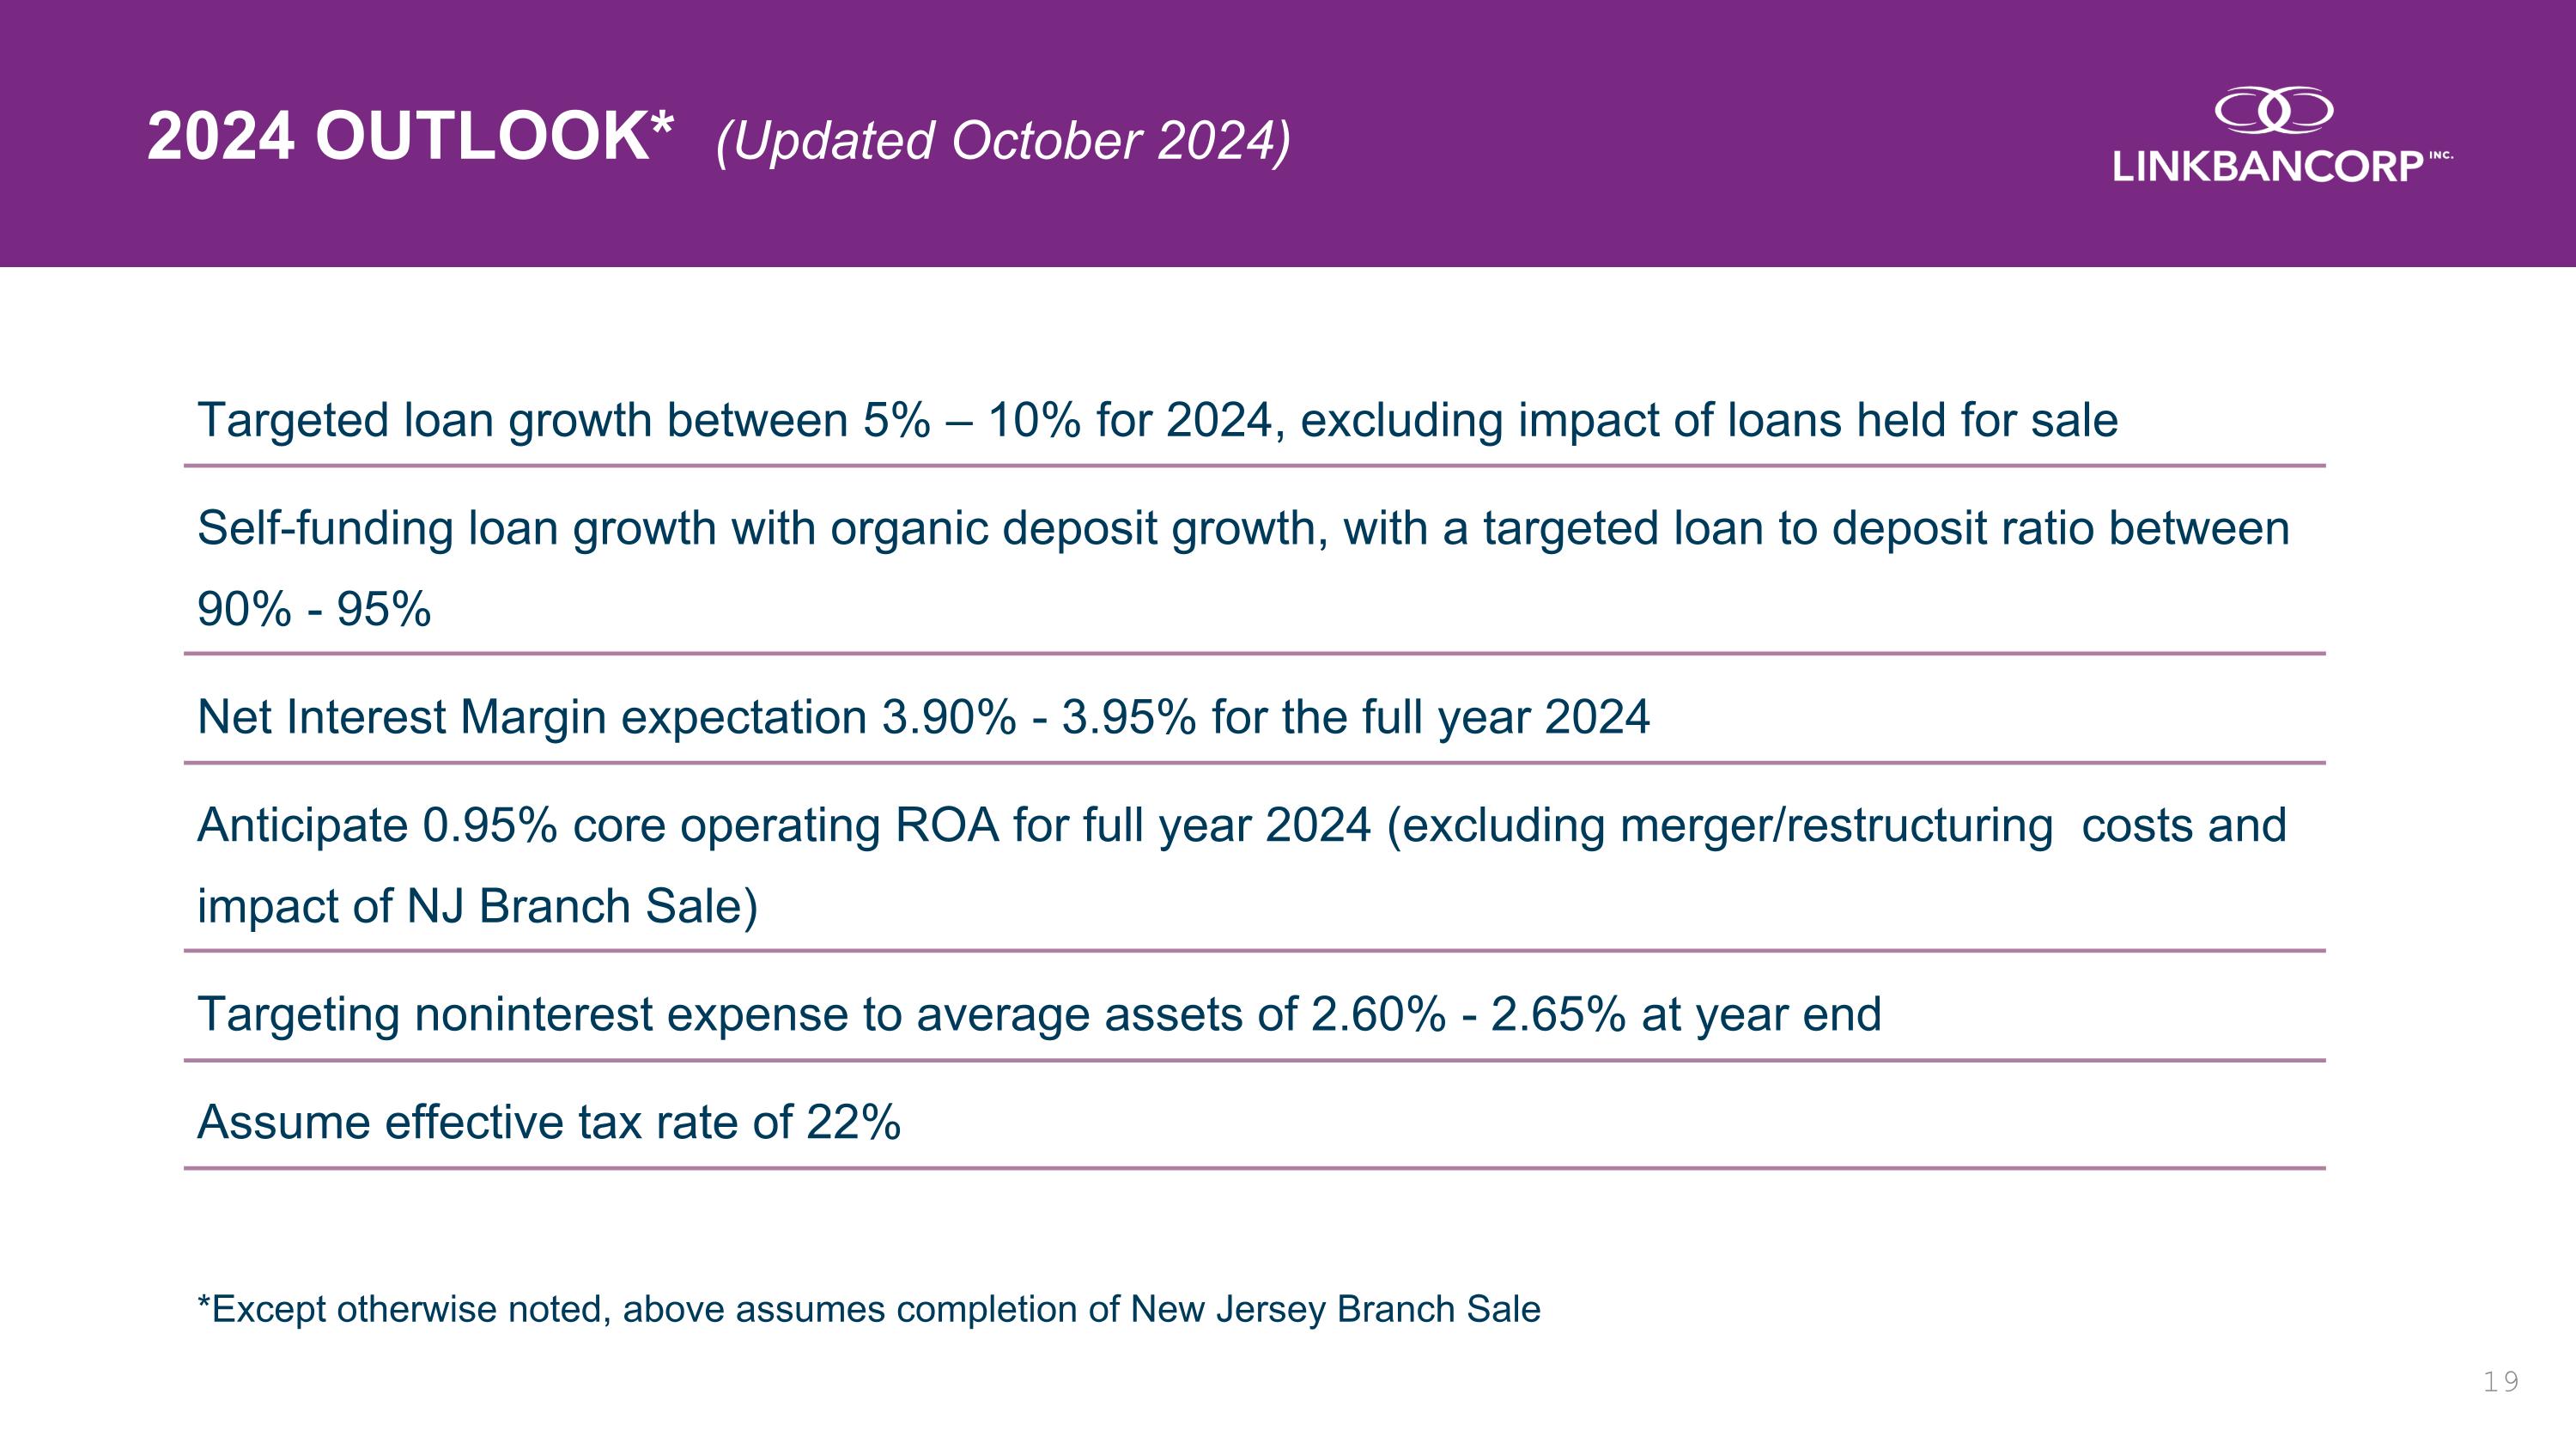
Targeted loan growth between 5% – 10% for 2024, excluding impact of loans held for sale Self-funding loan growth with organic deposit growth, with a targeted loan to deposit ratio between 90% - 95% Net Interest Margin expectation 3.90% - 3.95% for the full year 2024 Anticipate 0.95% core operating ROA for full year 2024 (excluding merger/restructuring costs and impact of NJ Branch Sale) Targeting noninterest expense to average assets of 2.60% - 2.65% at year end Assume effective tax rate of 22% *Except otherwise noted, above assumes completion of New Jersey Branch Sale 2024 OUTLOOK* (Updated October 2024)
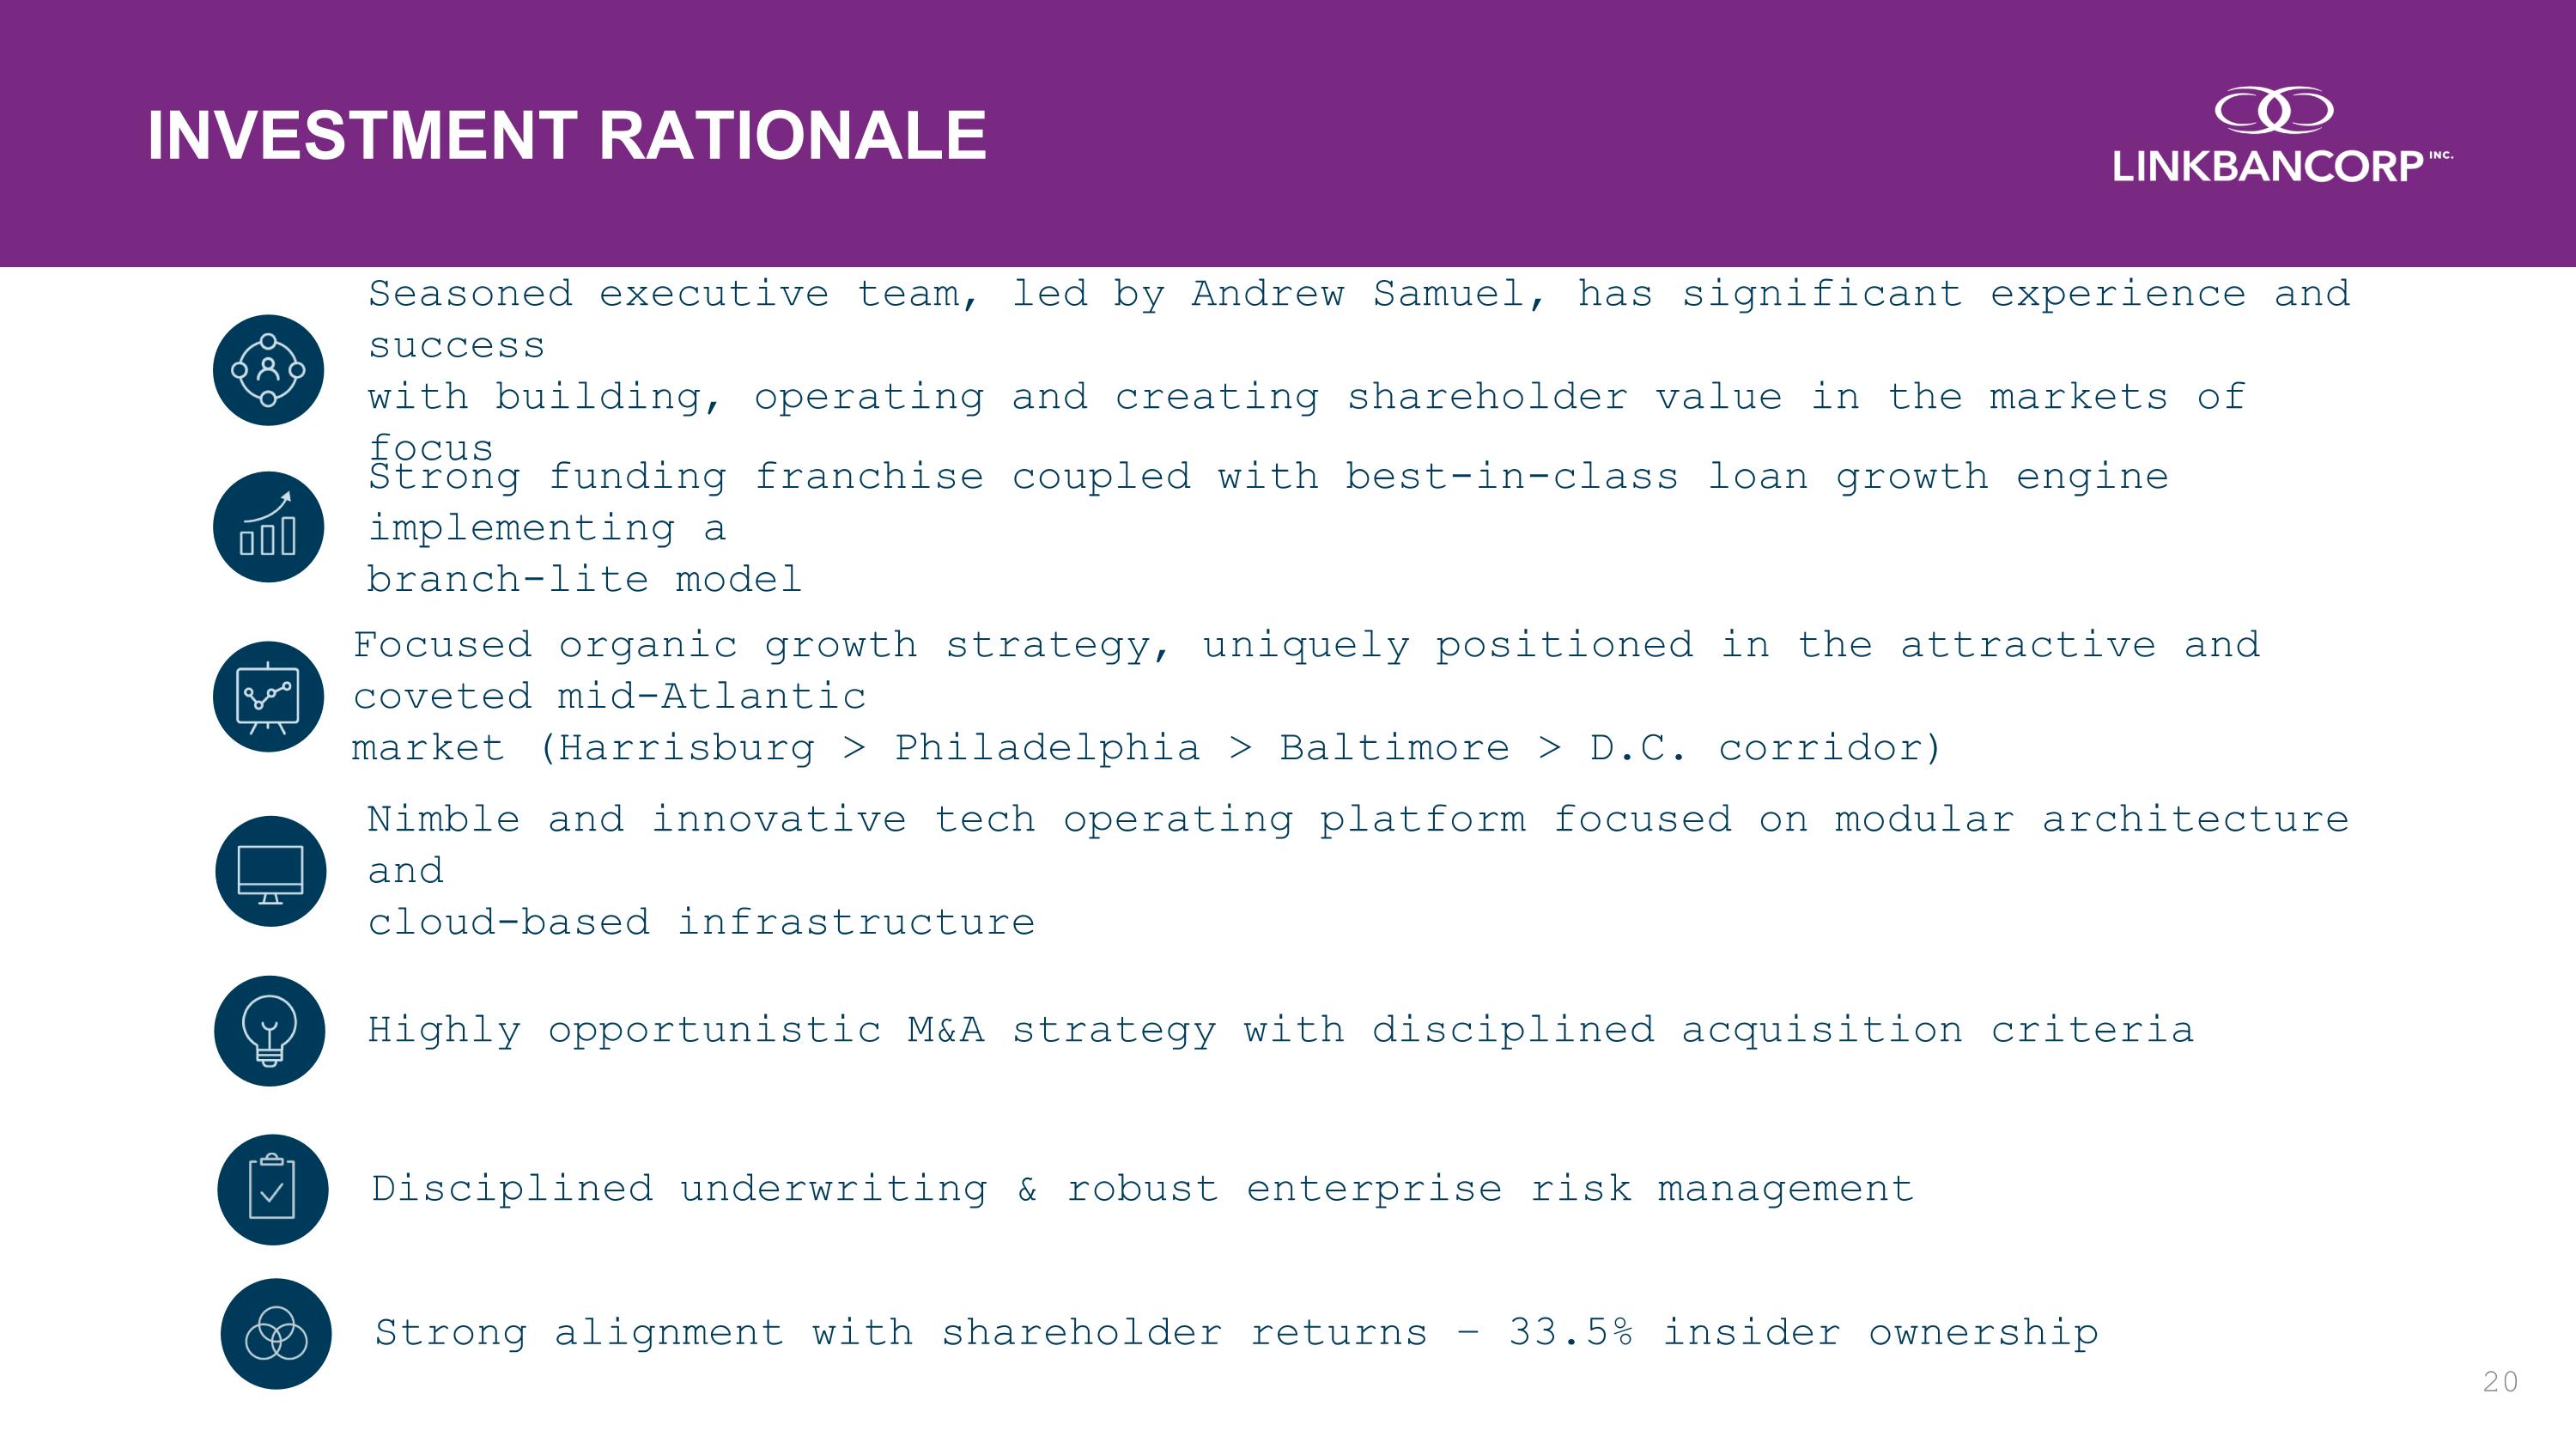
Strong alignment with shareholder returns – 33.5% insider ownership Disciplined underwriting & robust enterprise risk management Highly opportunistic M&A strategy with disciplined acquisition criteria Nimble and innovative tech operating platform focused on modular architecture and cloud-based infrastructure Focused organic growth strategy, uniquely positioned in the attractive and coveted mid-Atlantic market (Harrisburg > Philadelphia > Baltimore > D.C. corridor) Seasoned executive team, led by Andrew Samuel, has significant experience and success with building, operating and creating shareholder value in the markets of focus Strong funding franchise coupled with best-in-class loan growth engine implementing a branch-lite model INVESTMENT RATIONALE

THANK YOU!

CONTACT US: NICOLE DAVIS Corporate & Investor Relations Officer IR@linkbancorp.com | (717) 803-8895

APPENDIX
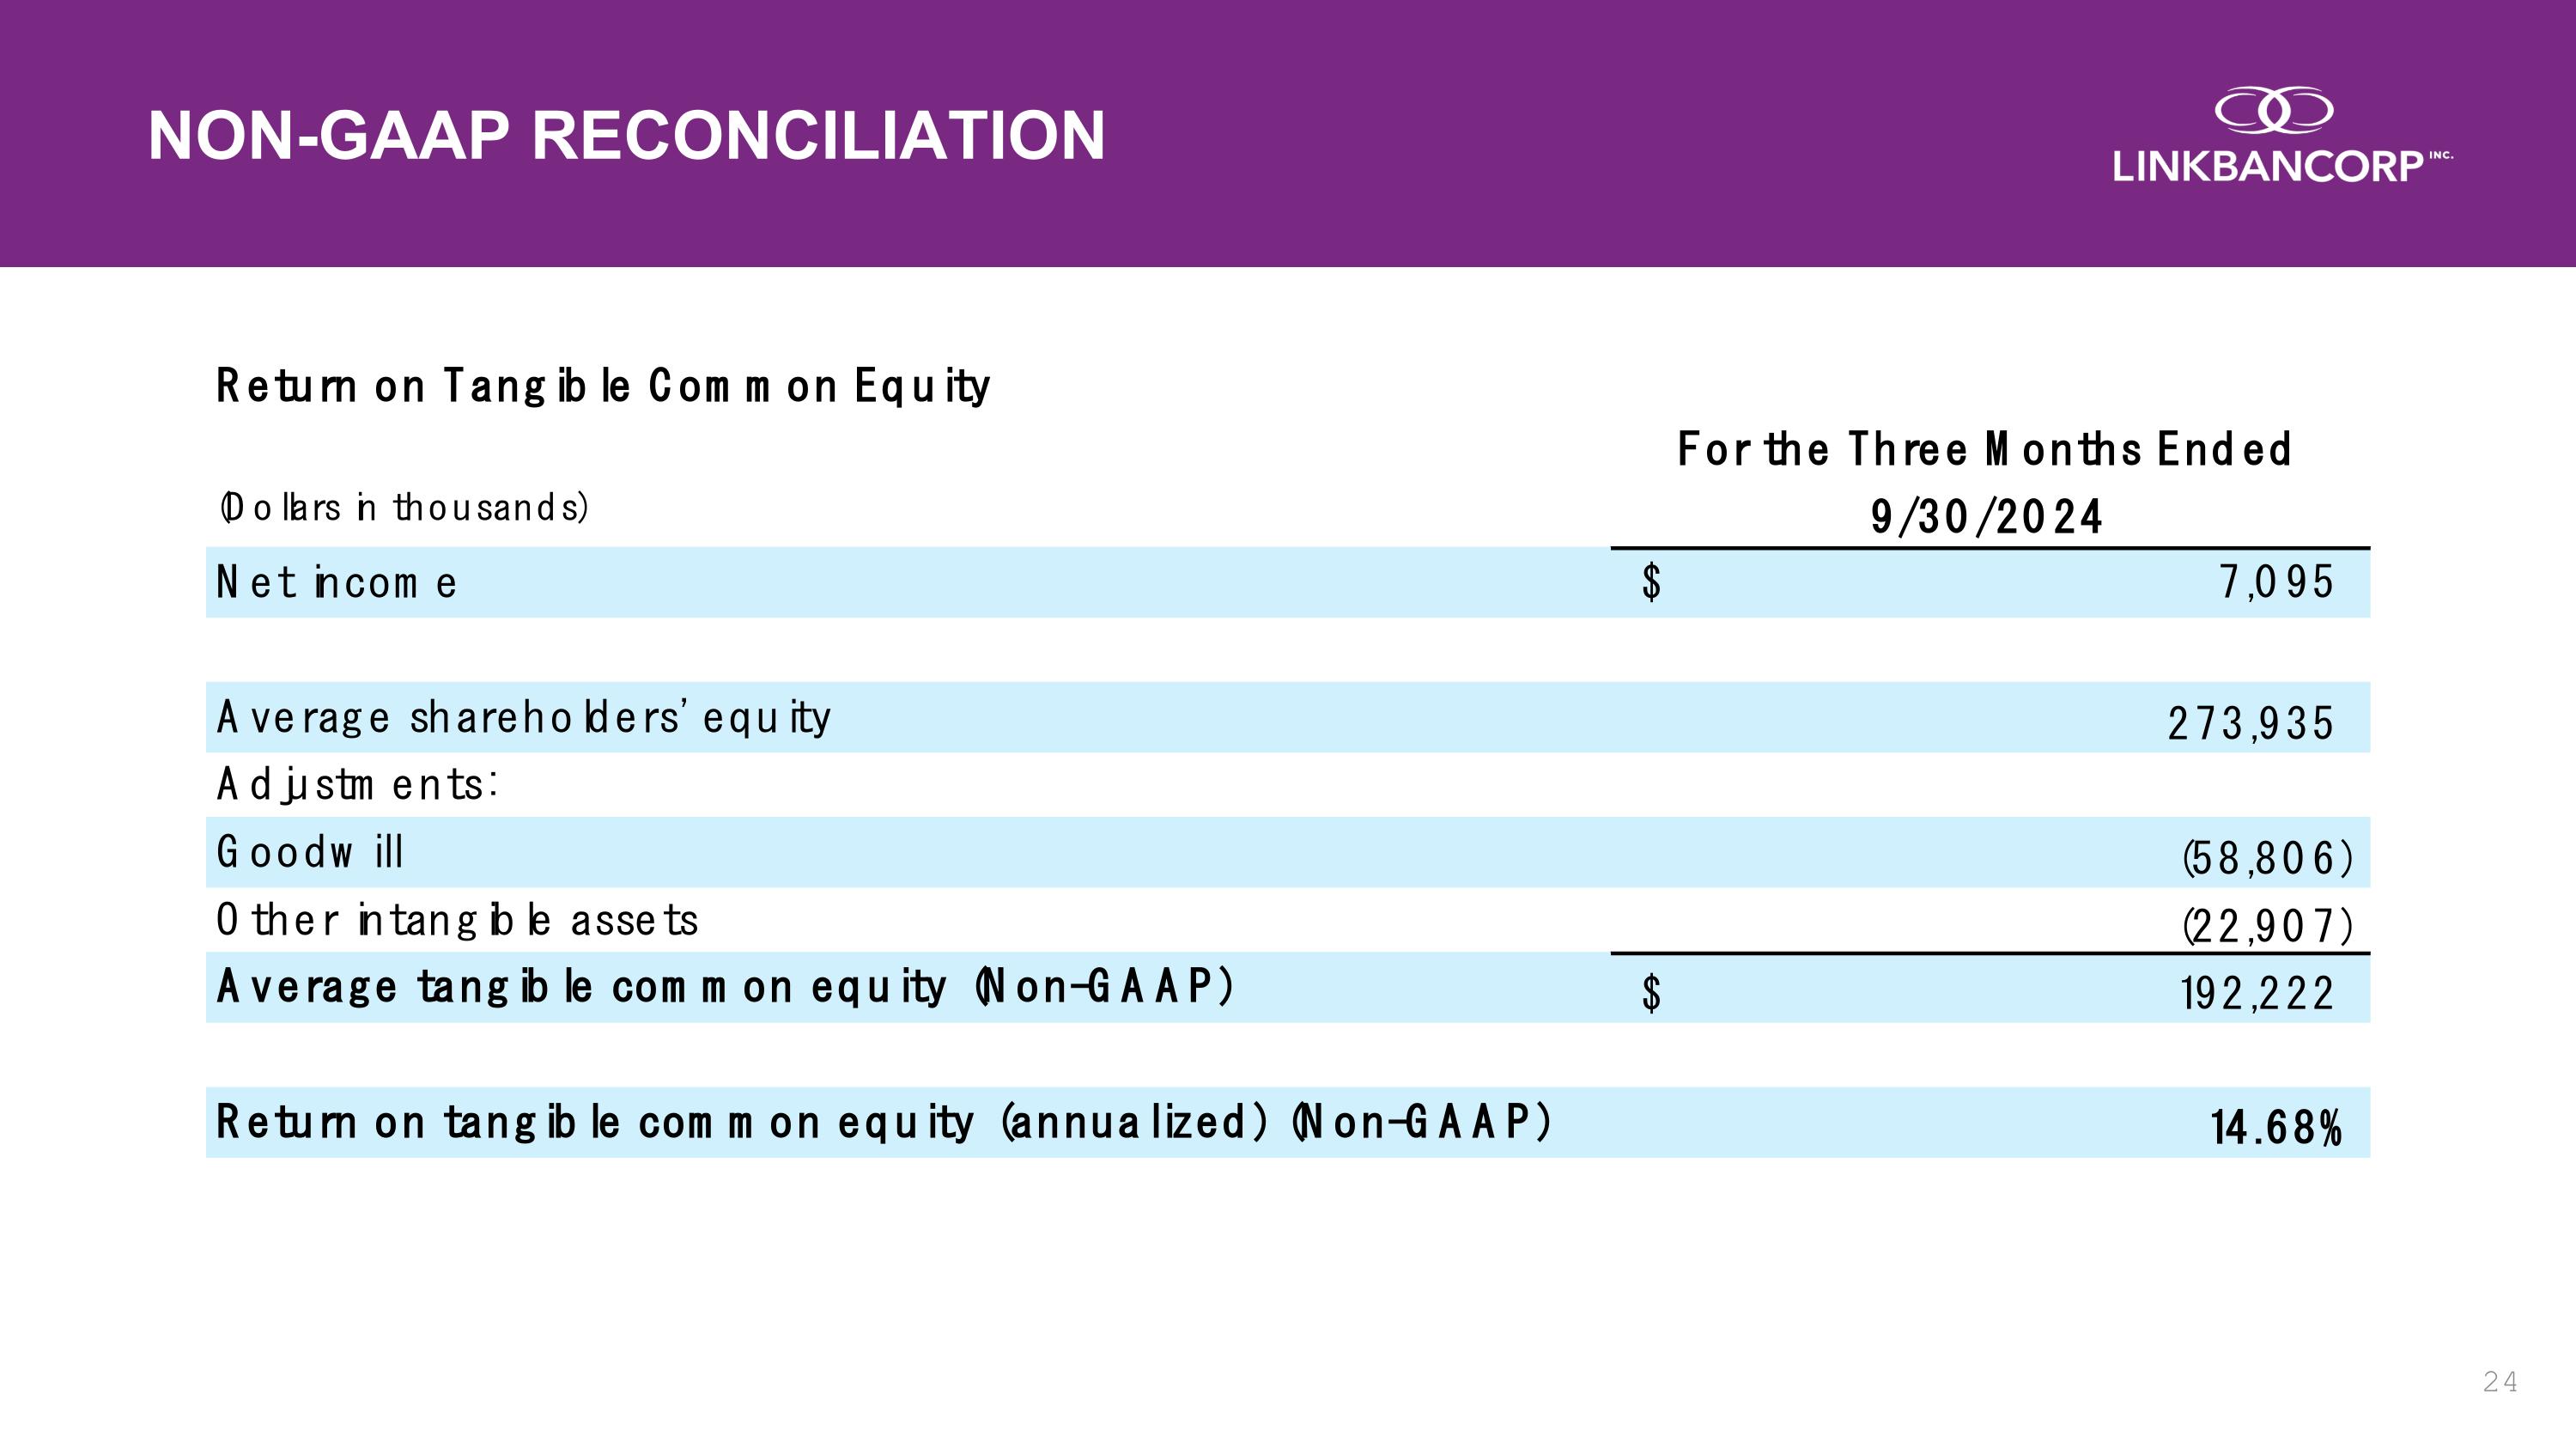
NON-GAAP RECONCILIATION
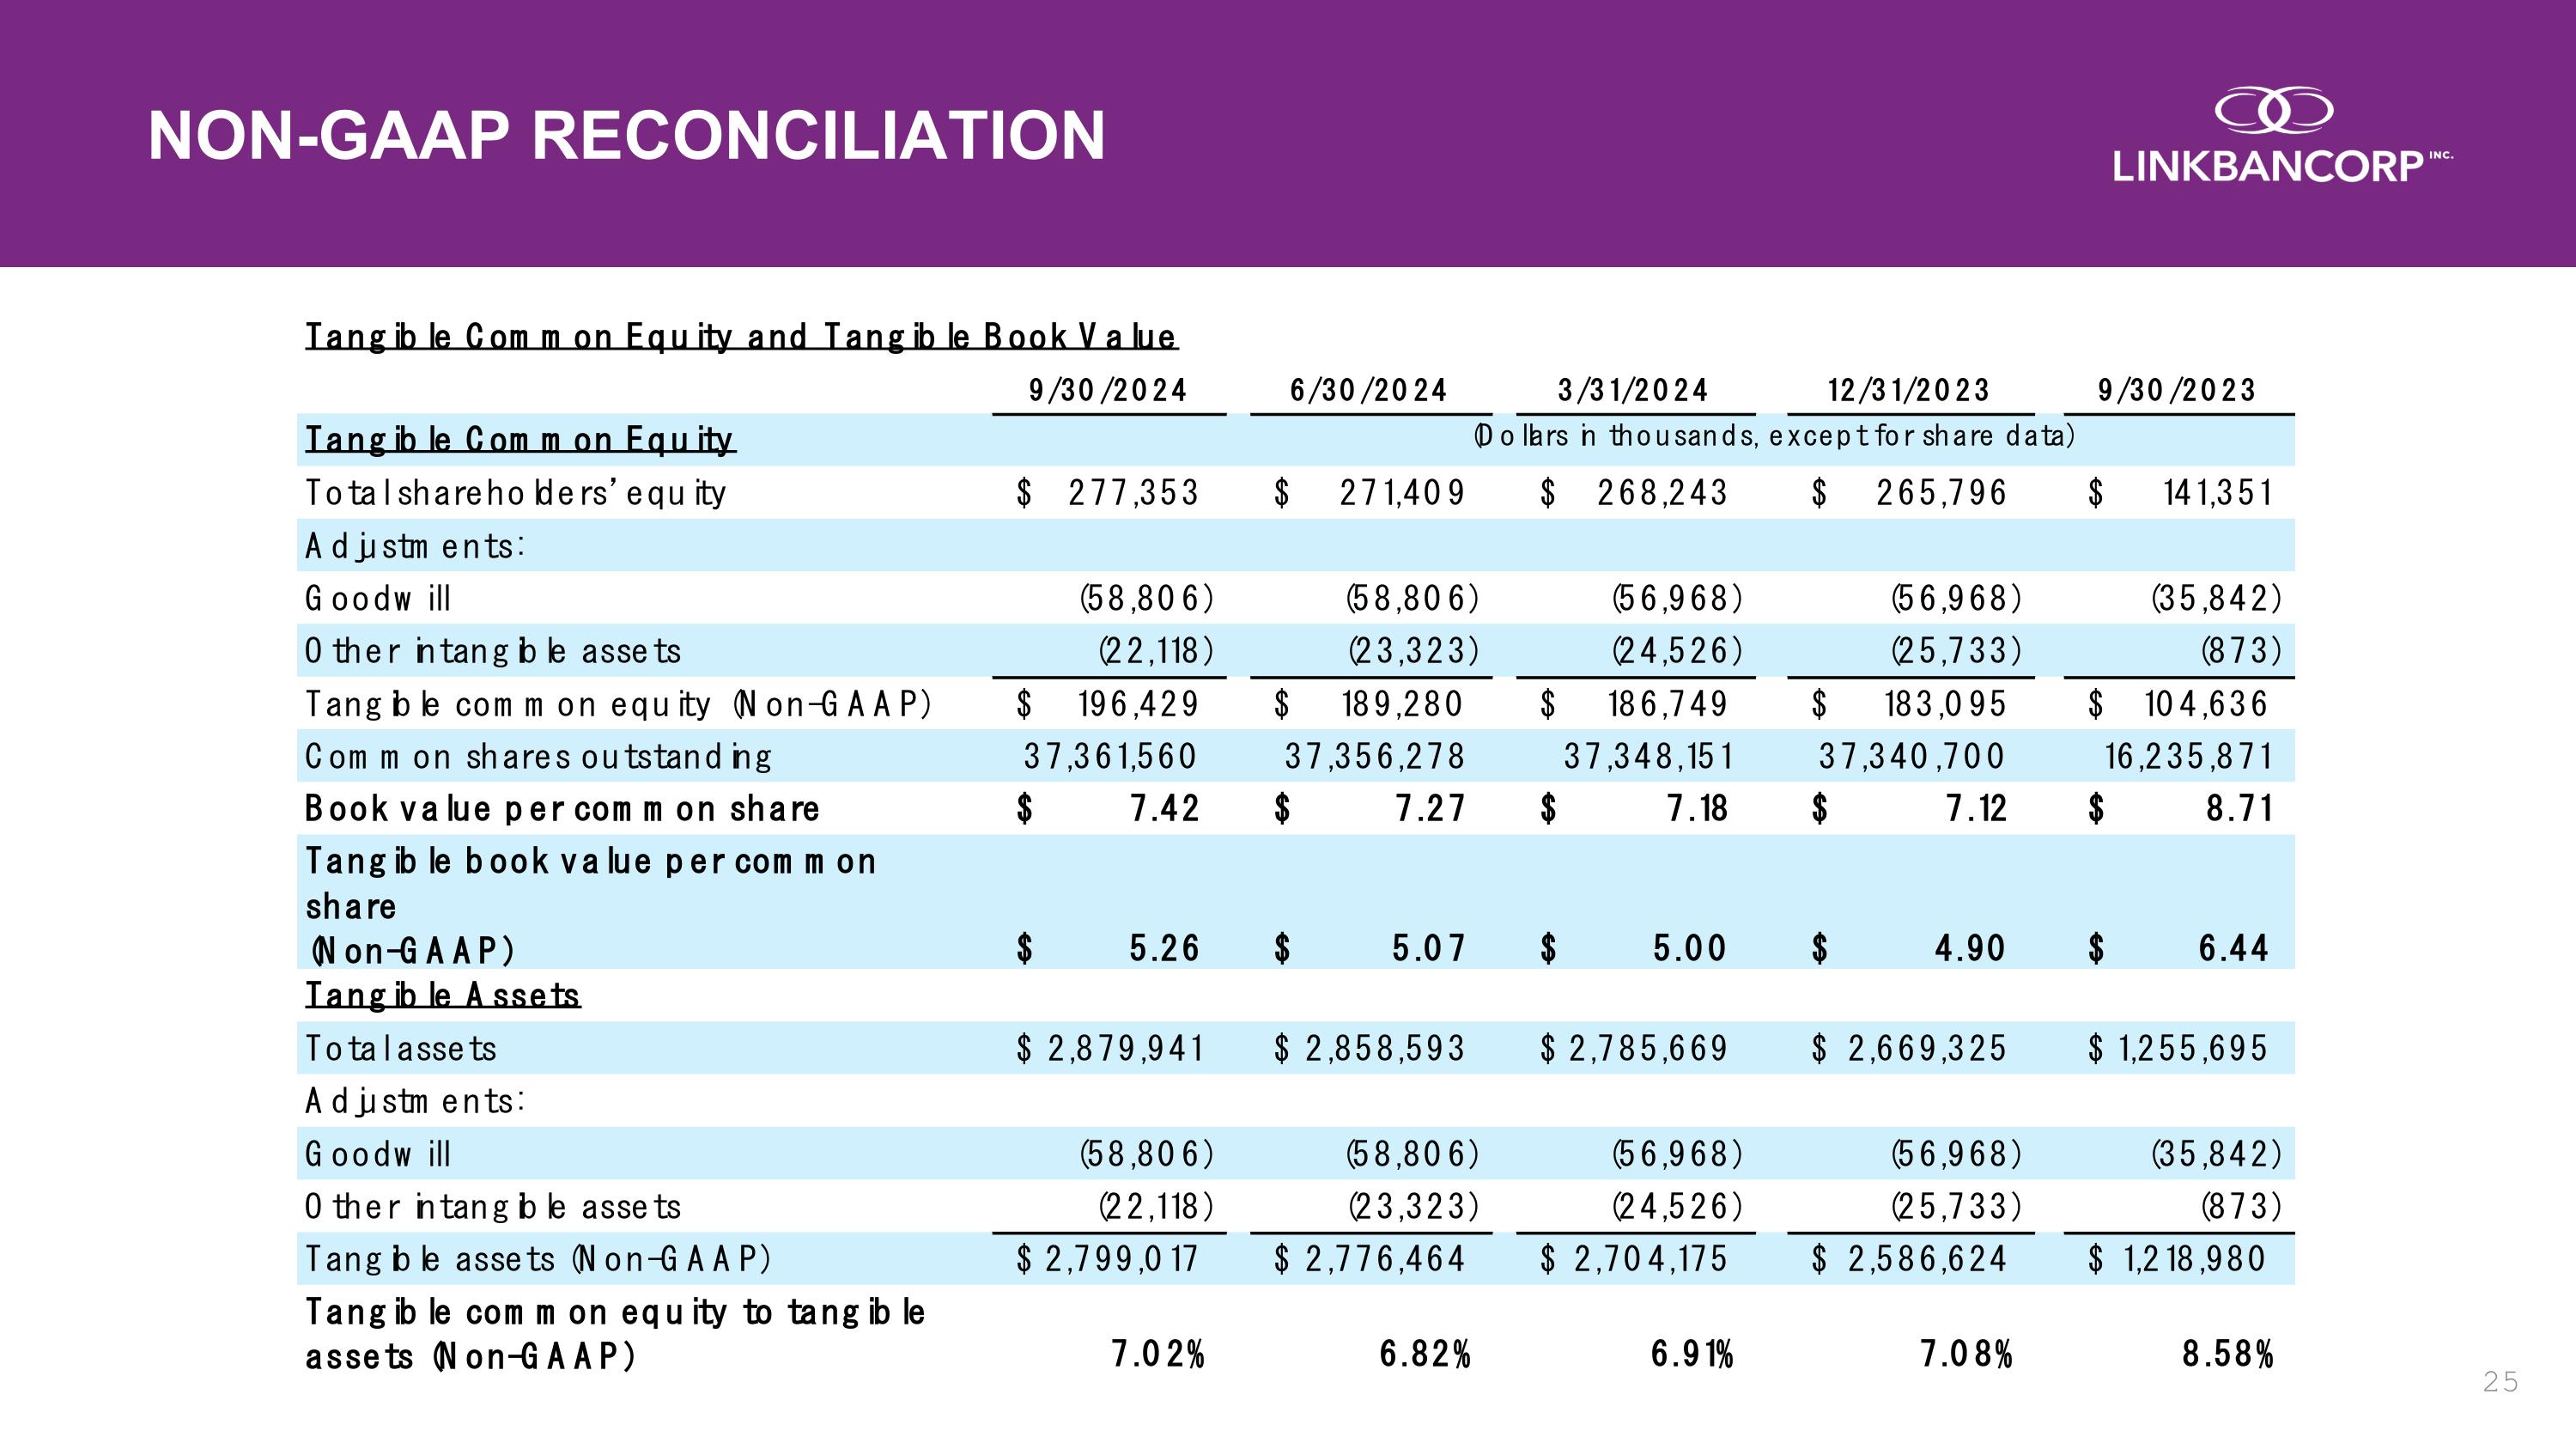
NON-GAAP RECONCILIATION
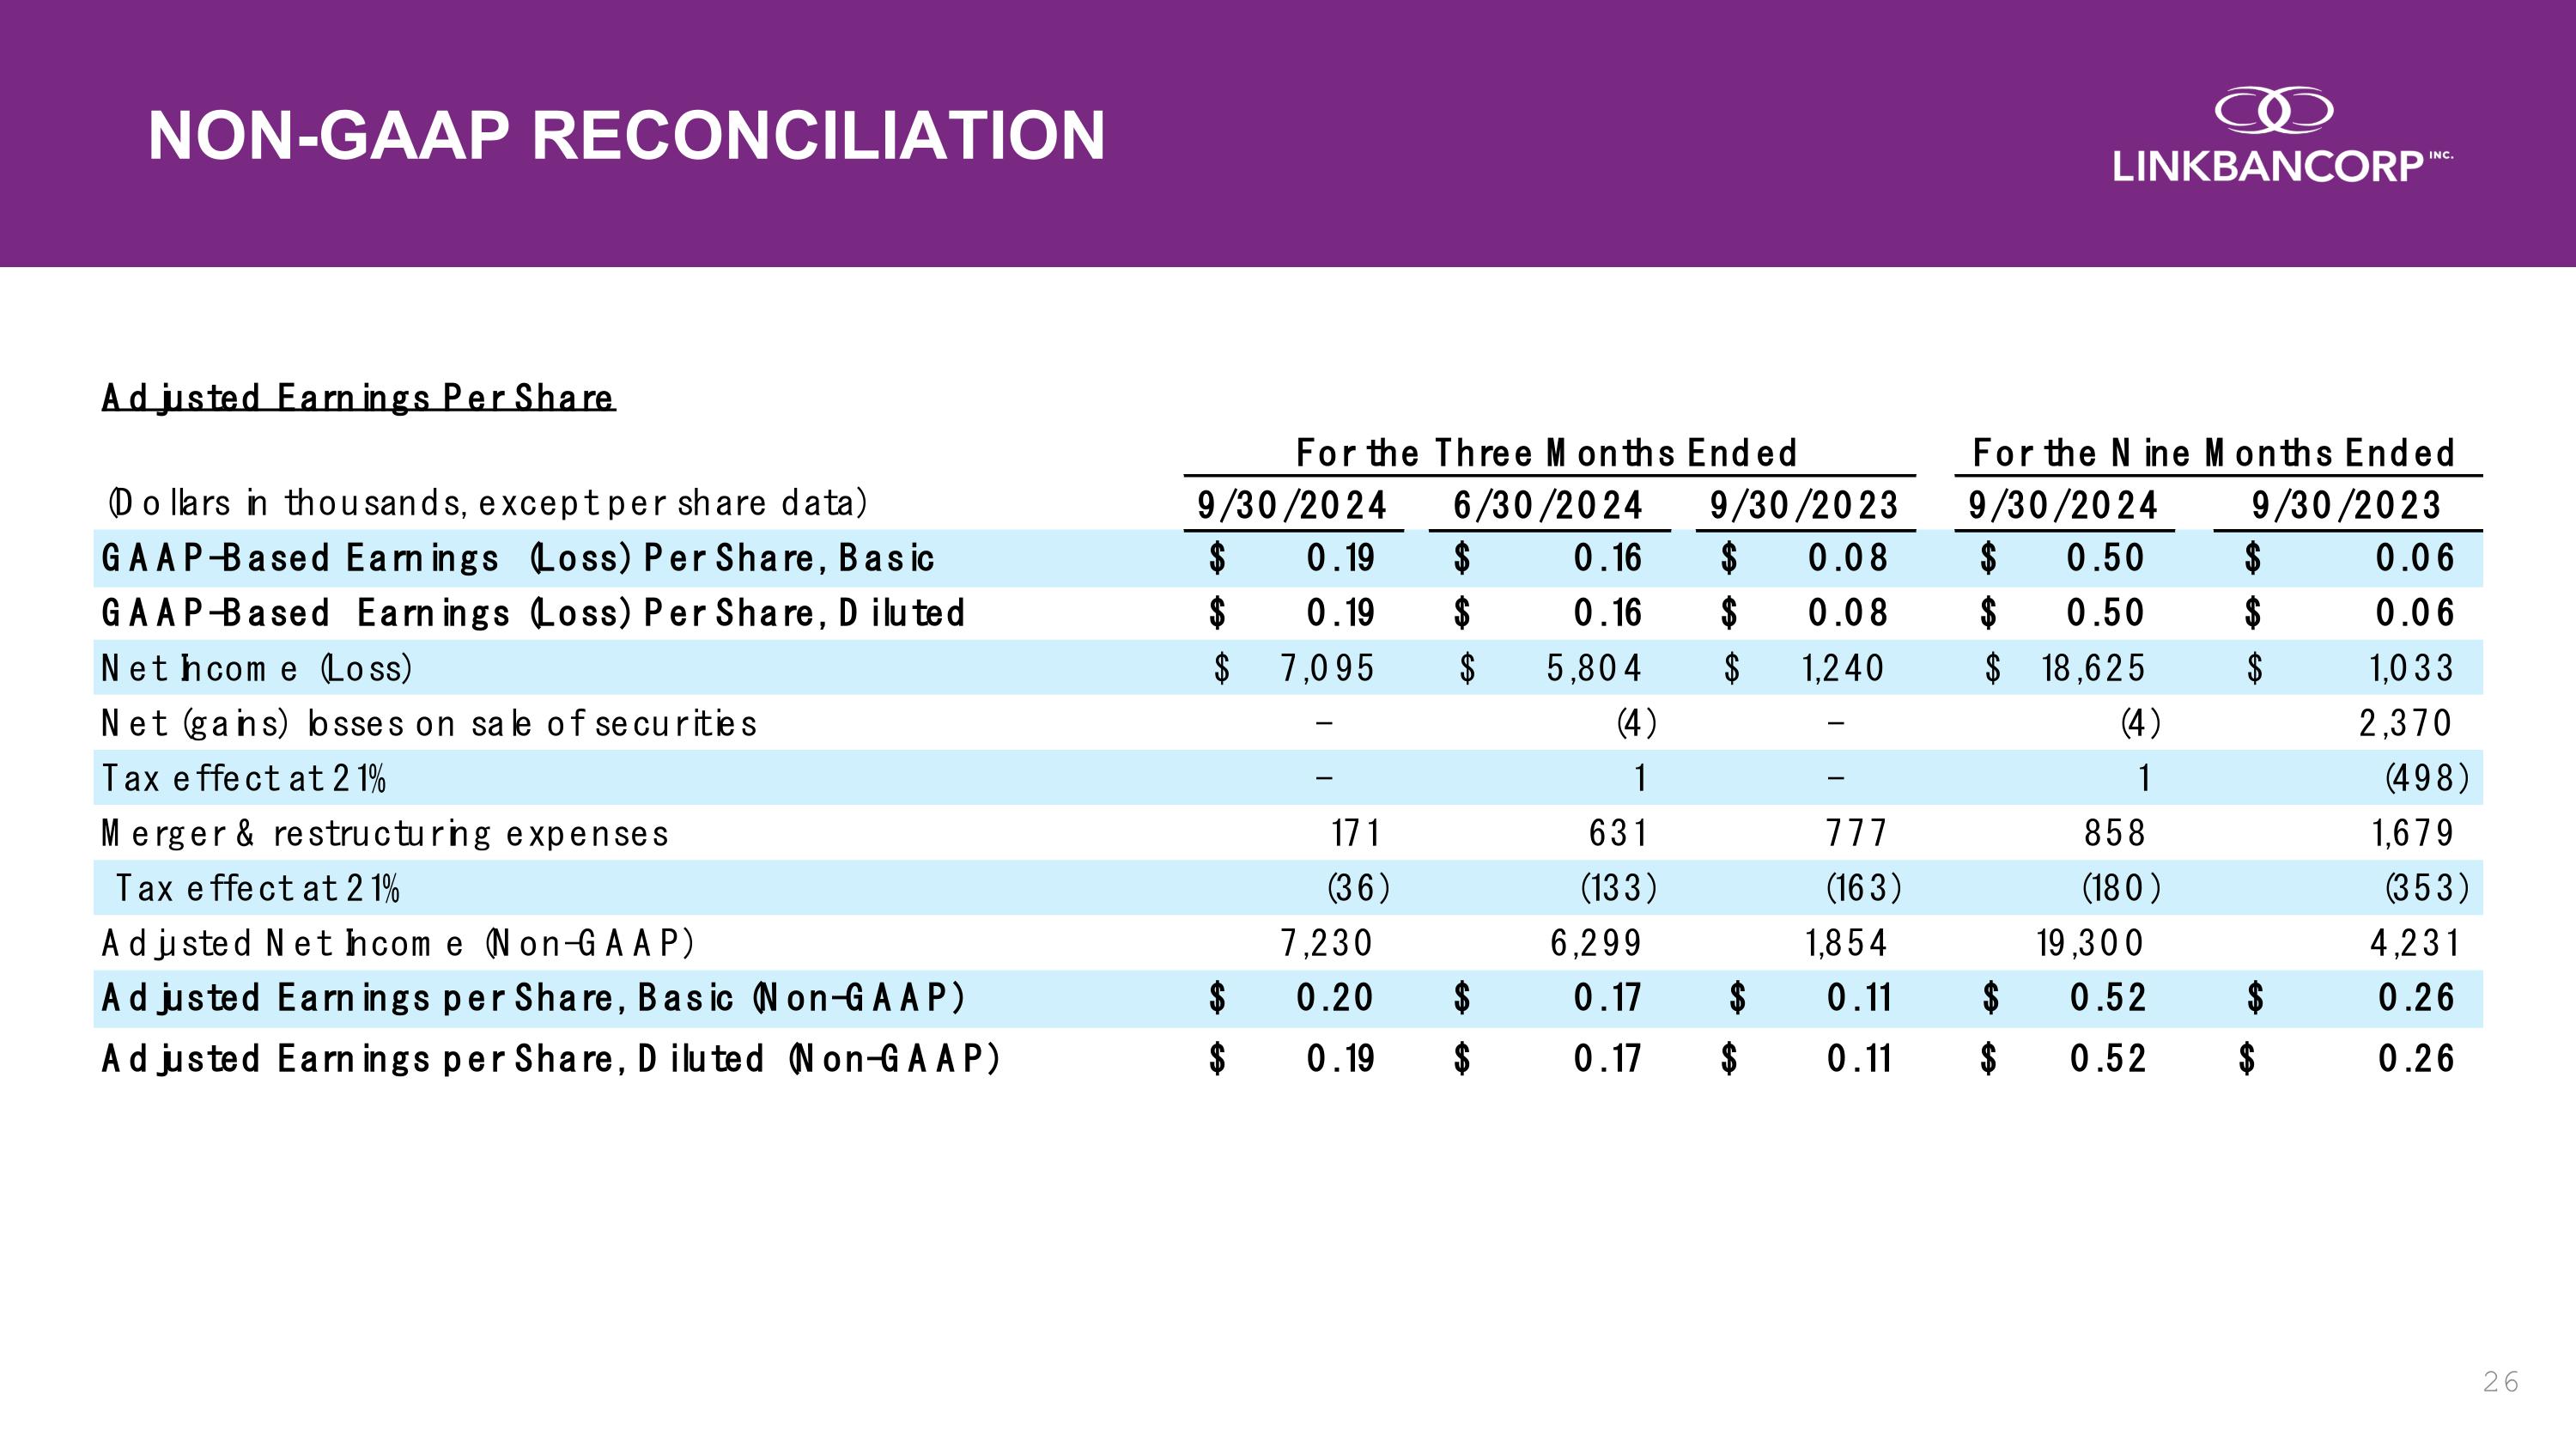
NON-GAAP RECONCILIATION
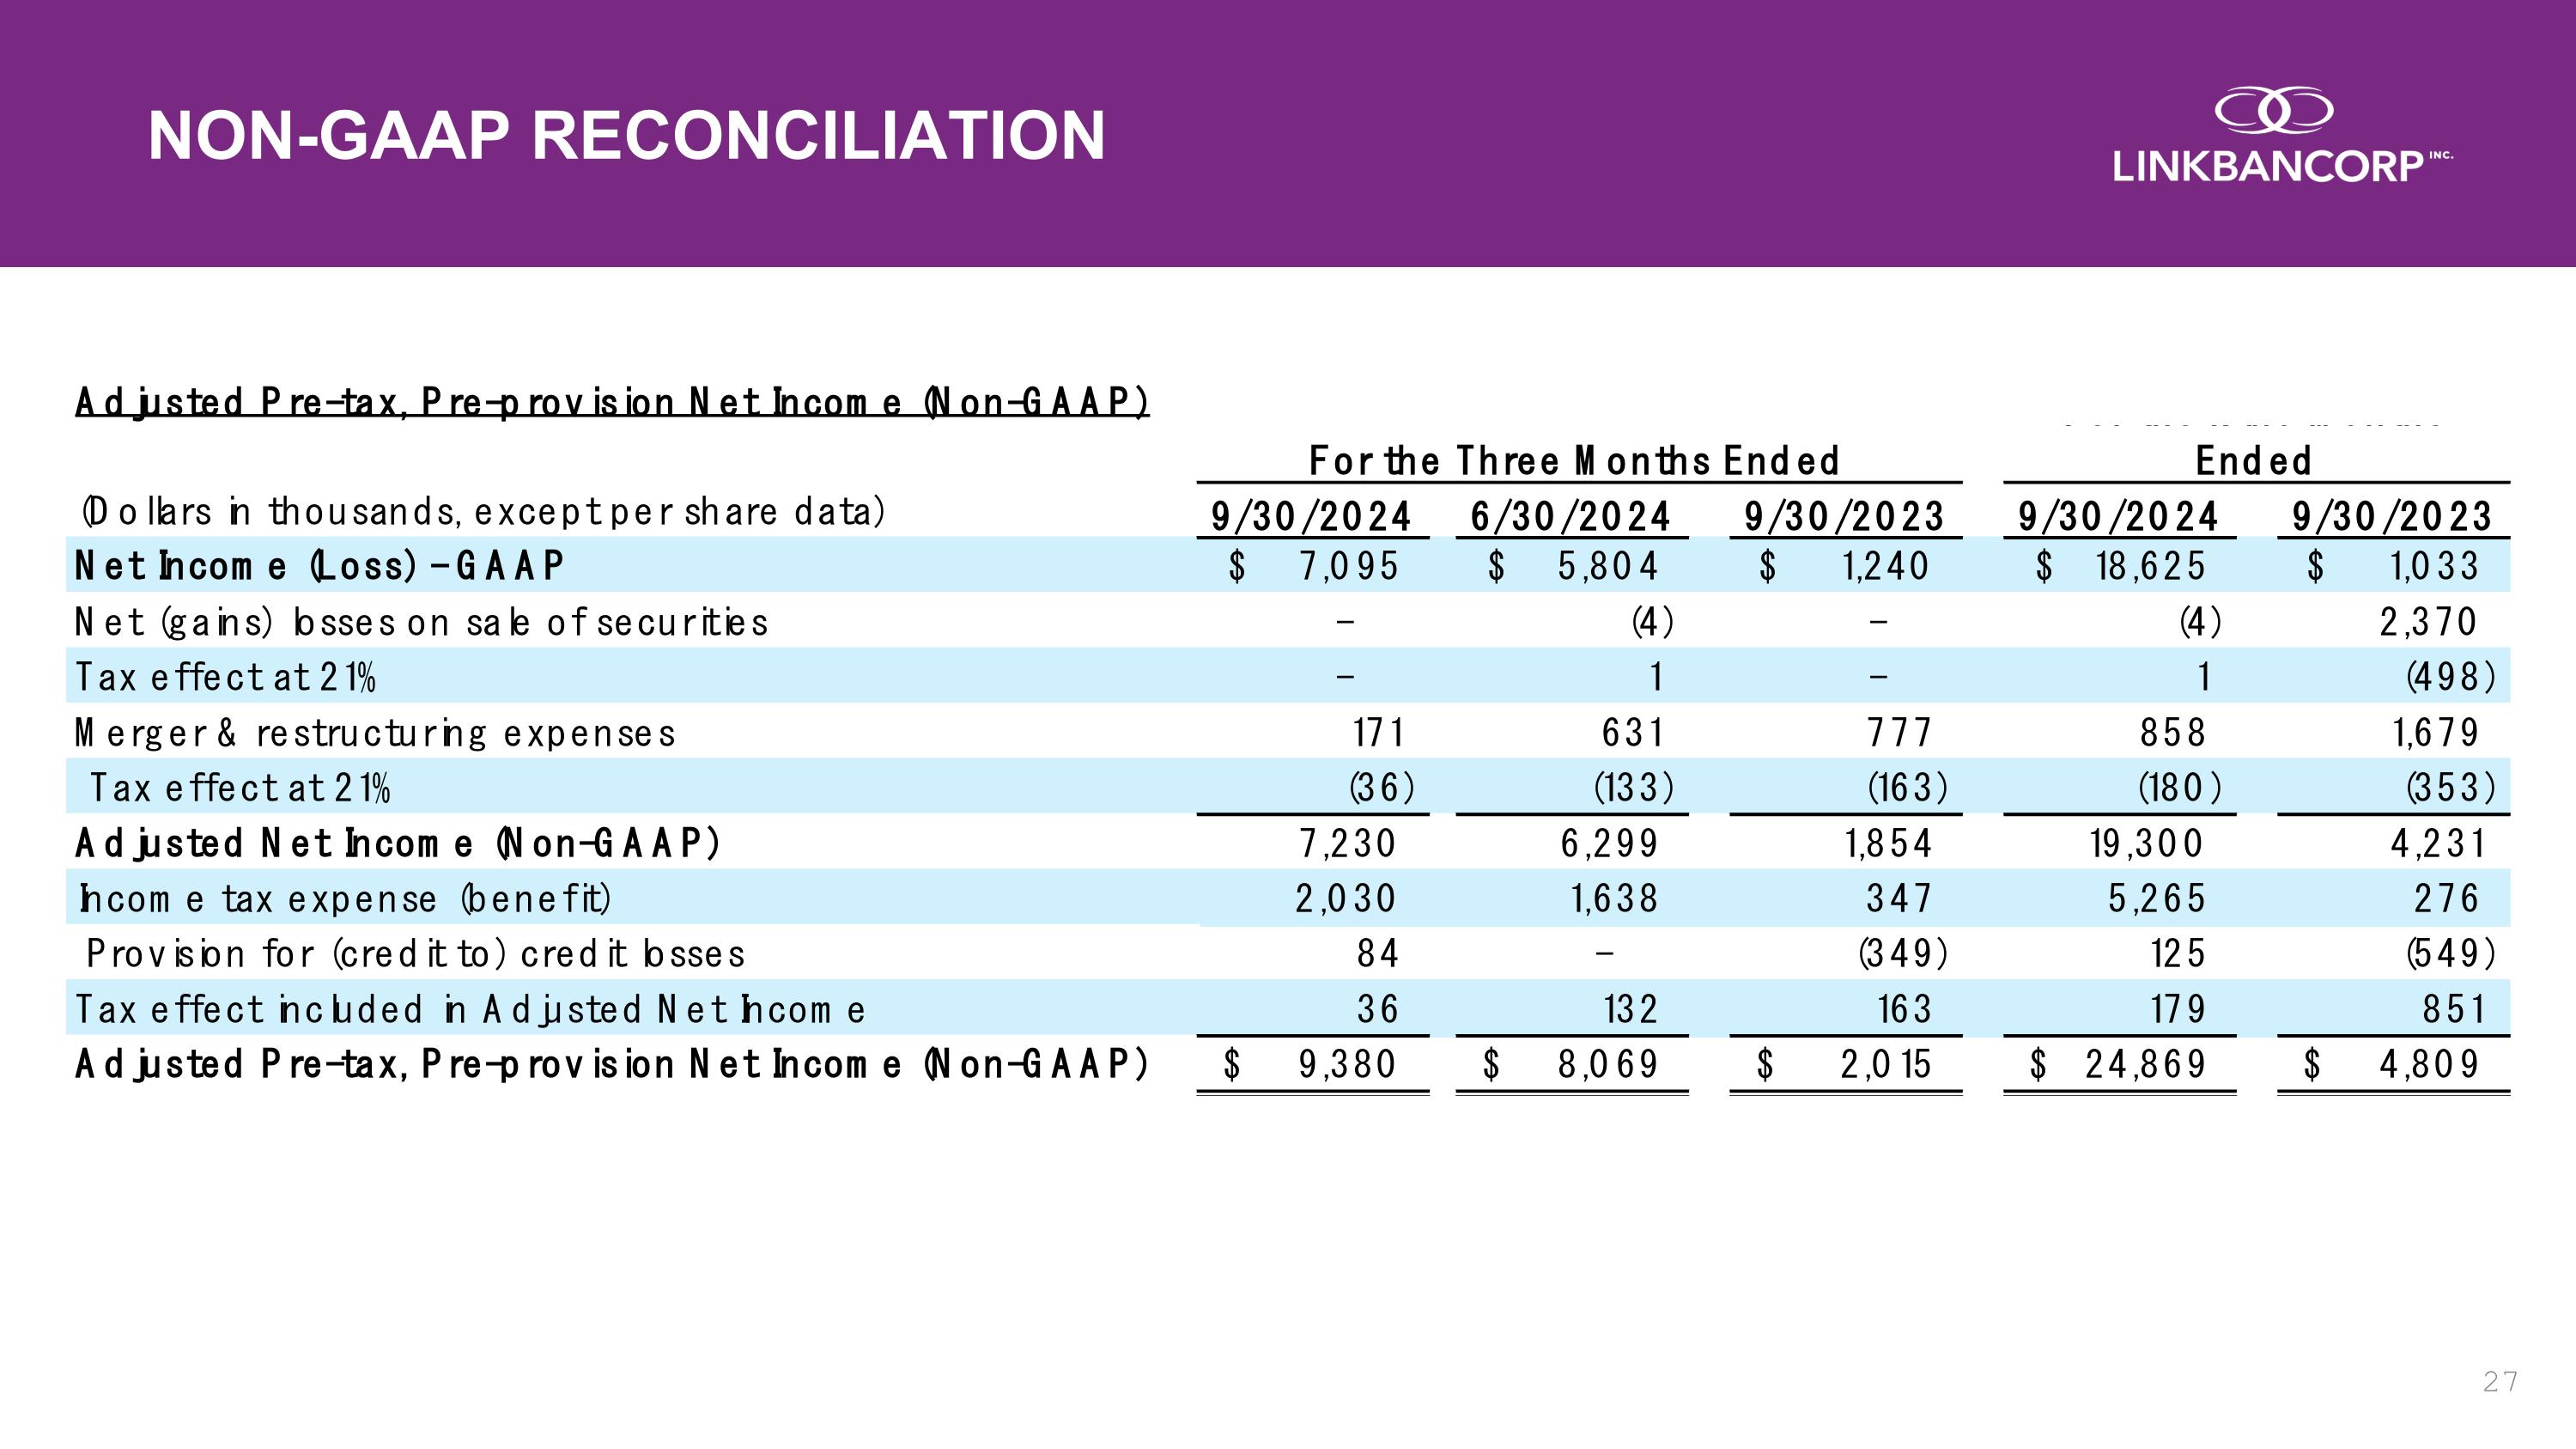
NON-GAAP RECONCILIATION
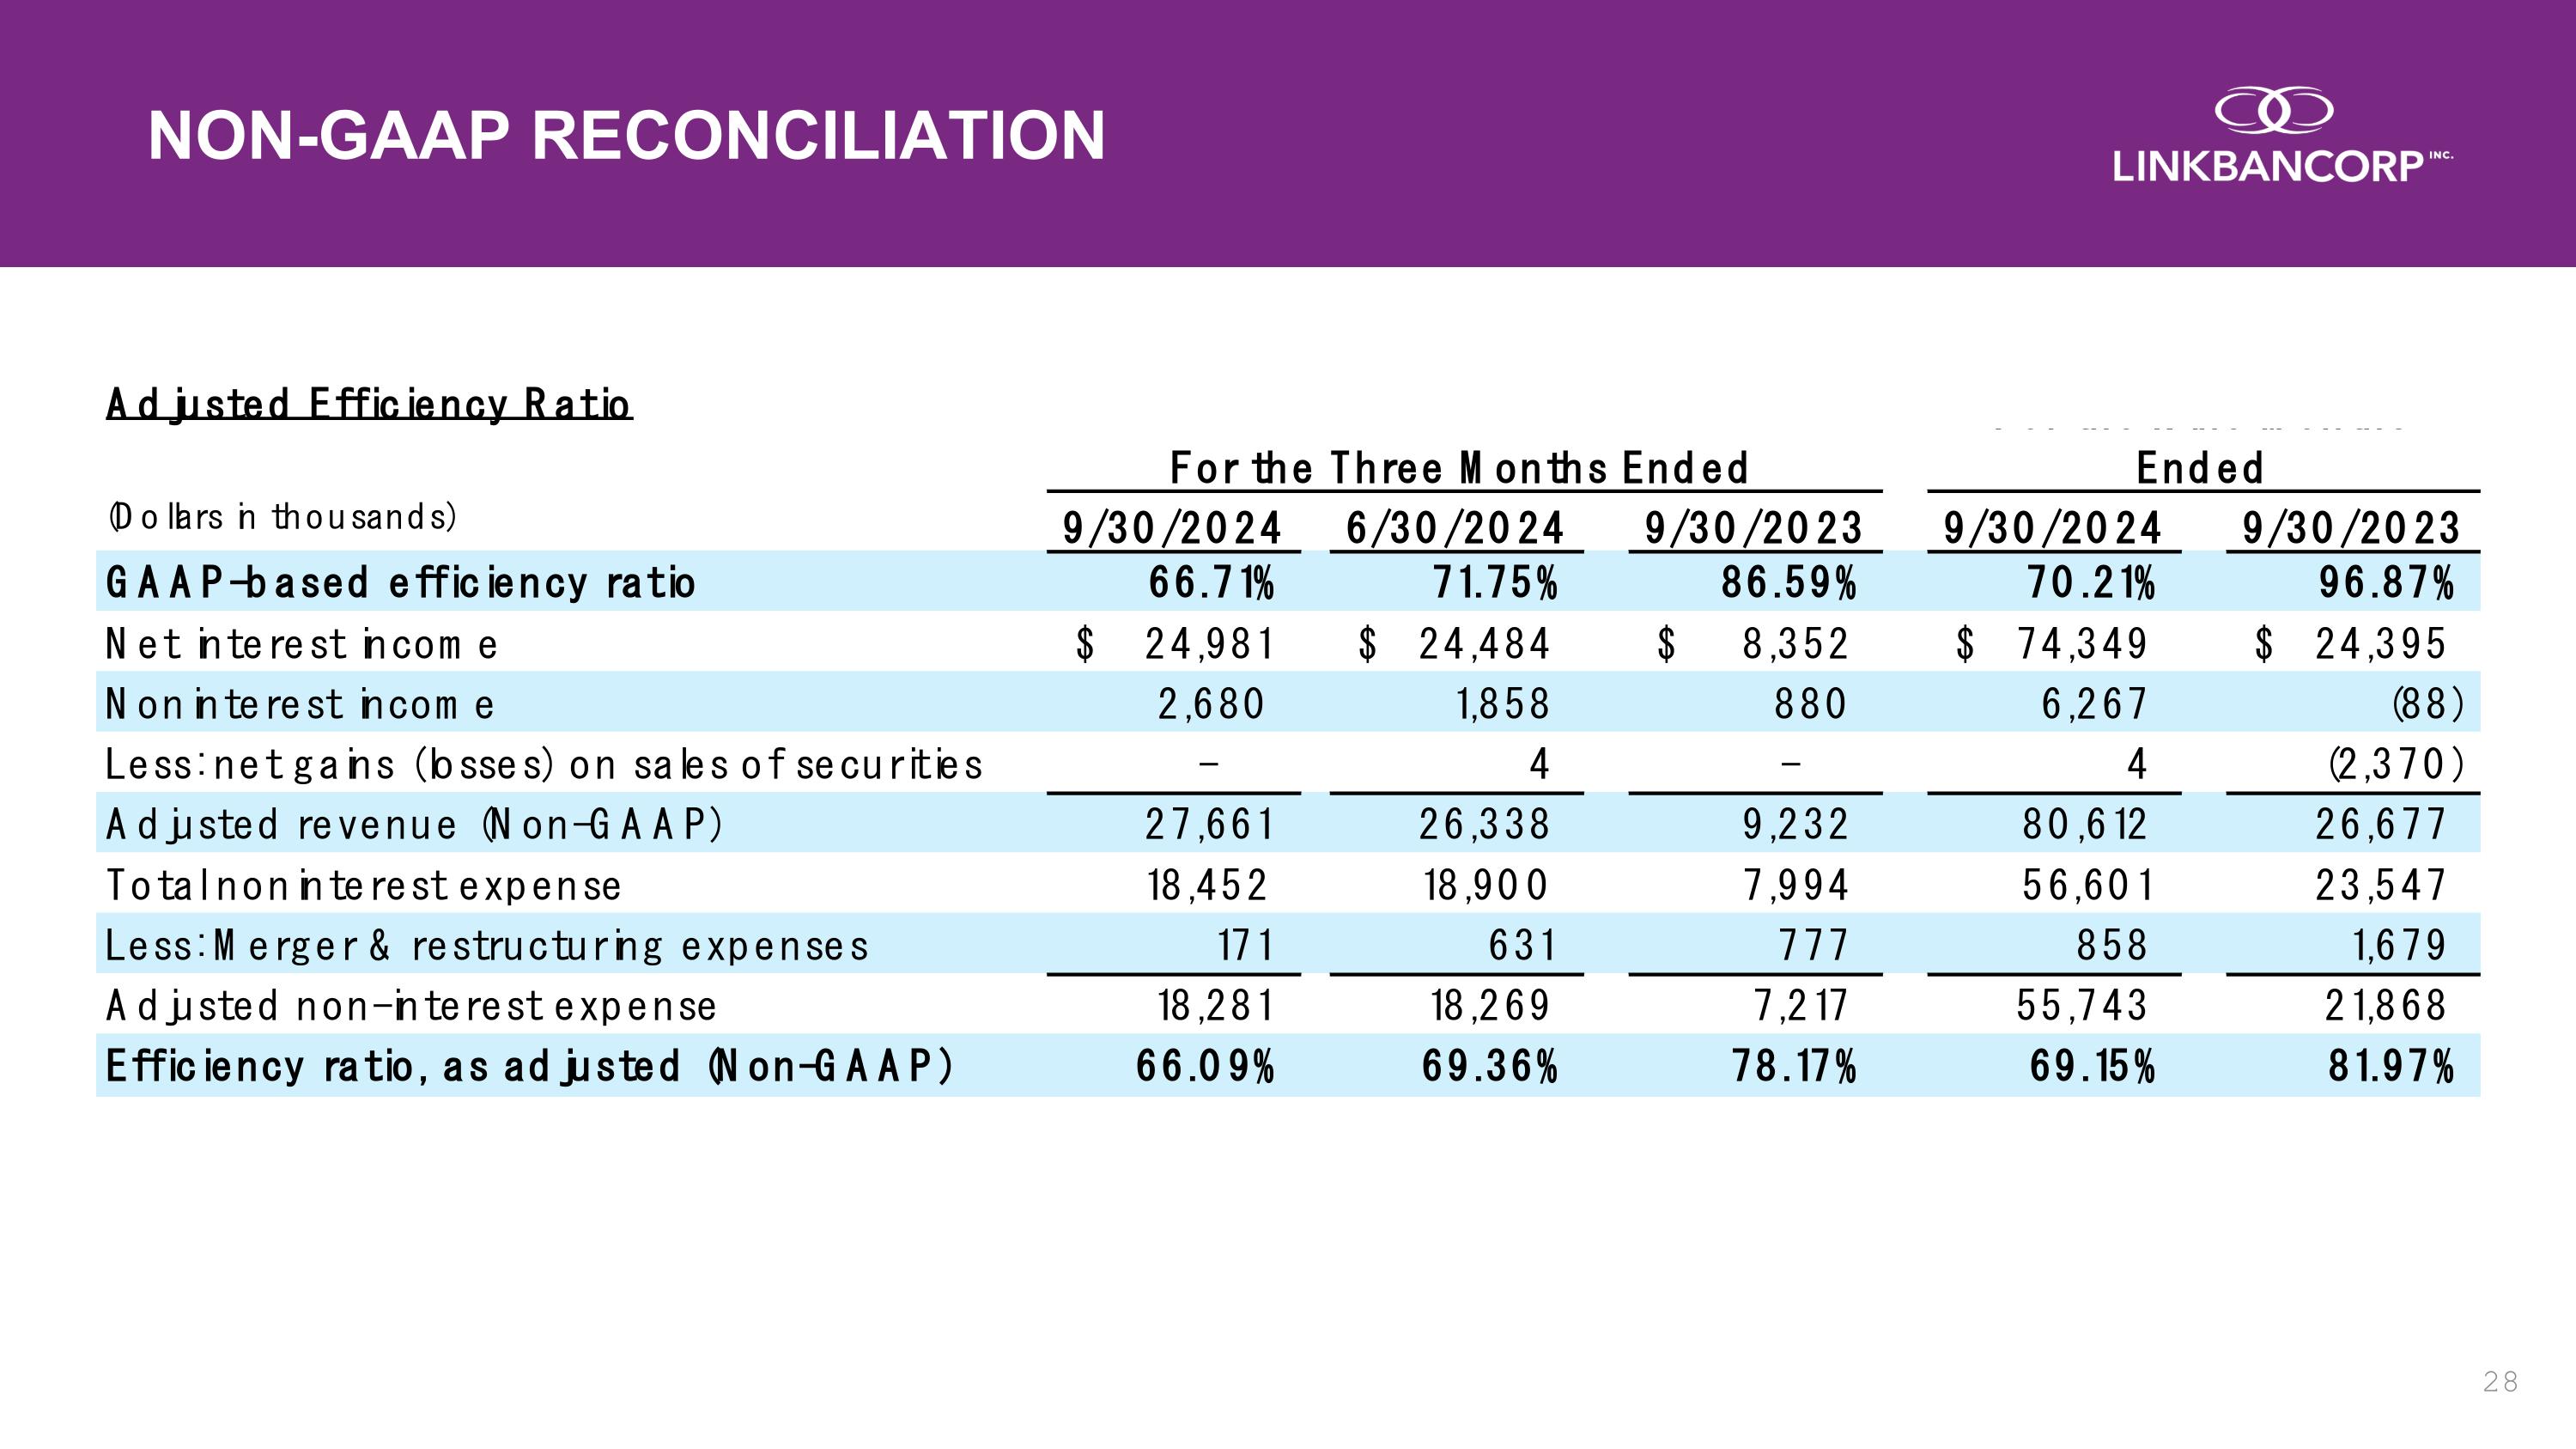
NON-GAAP RECONCILIATION
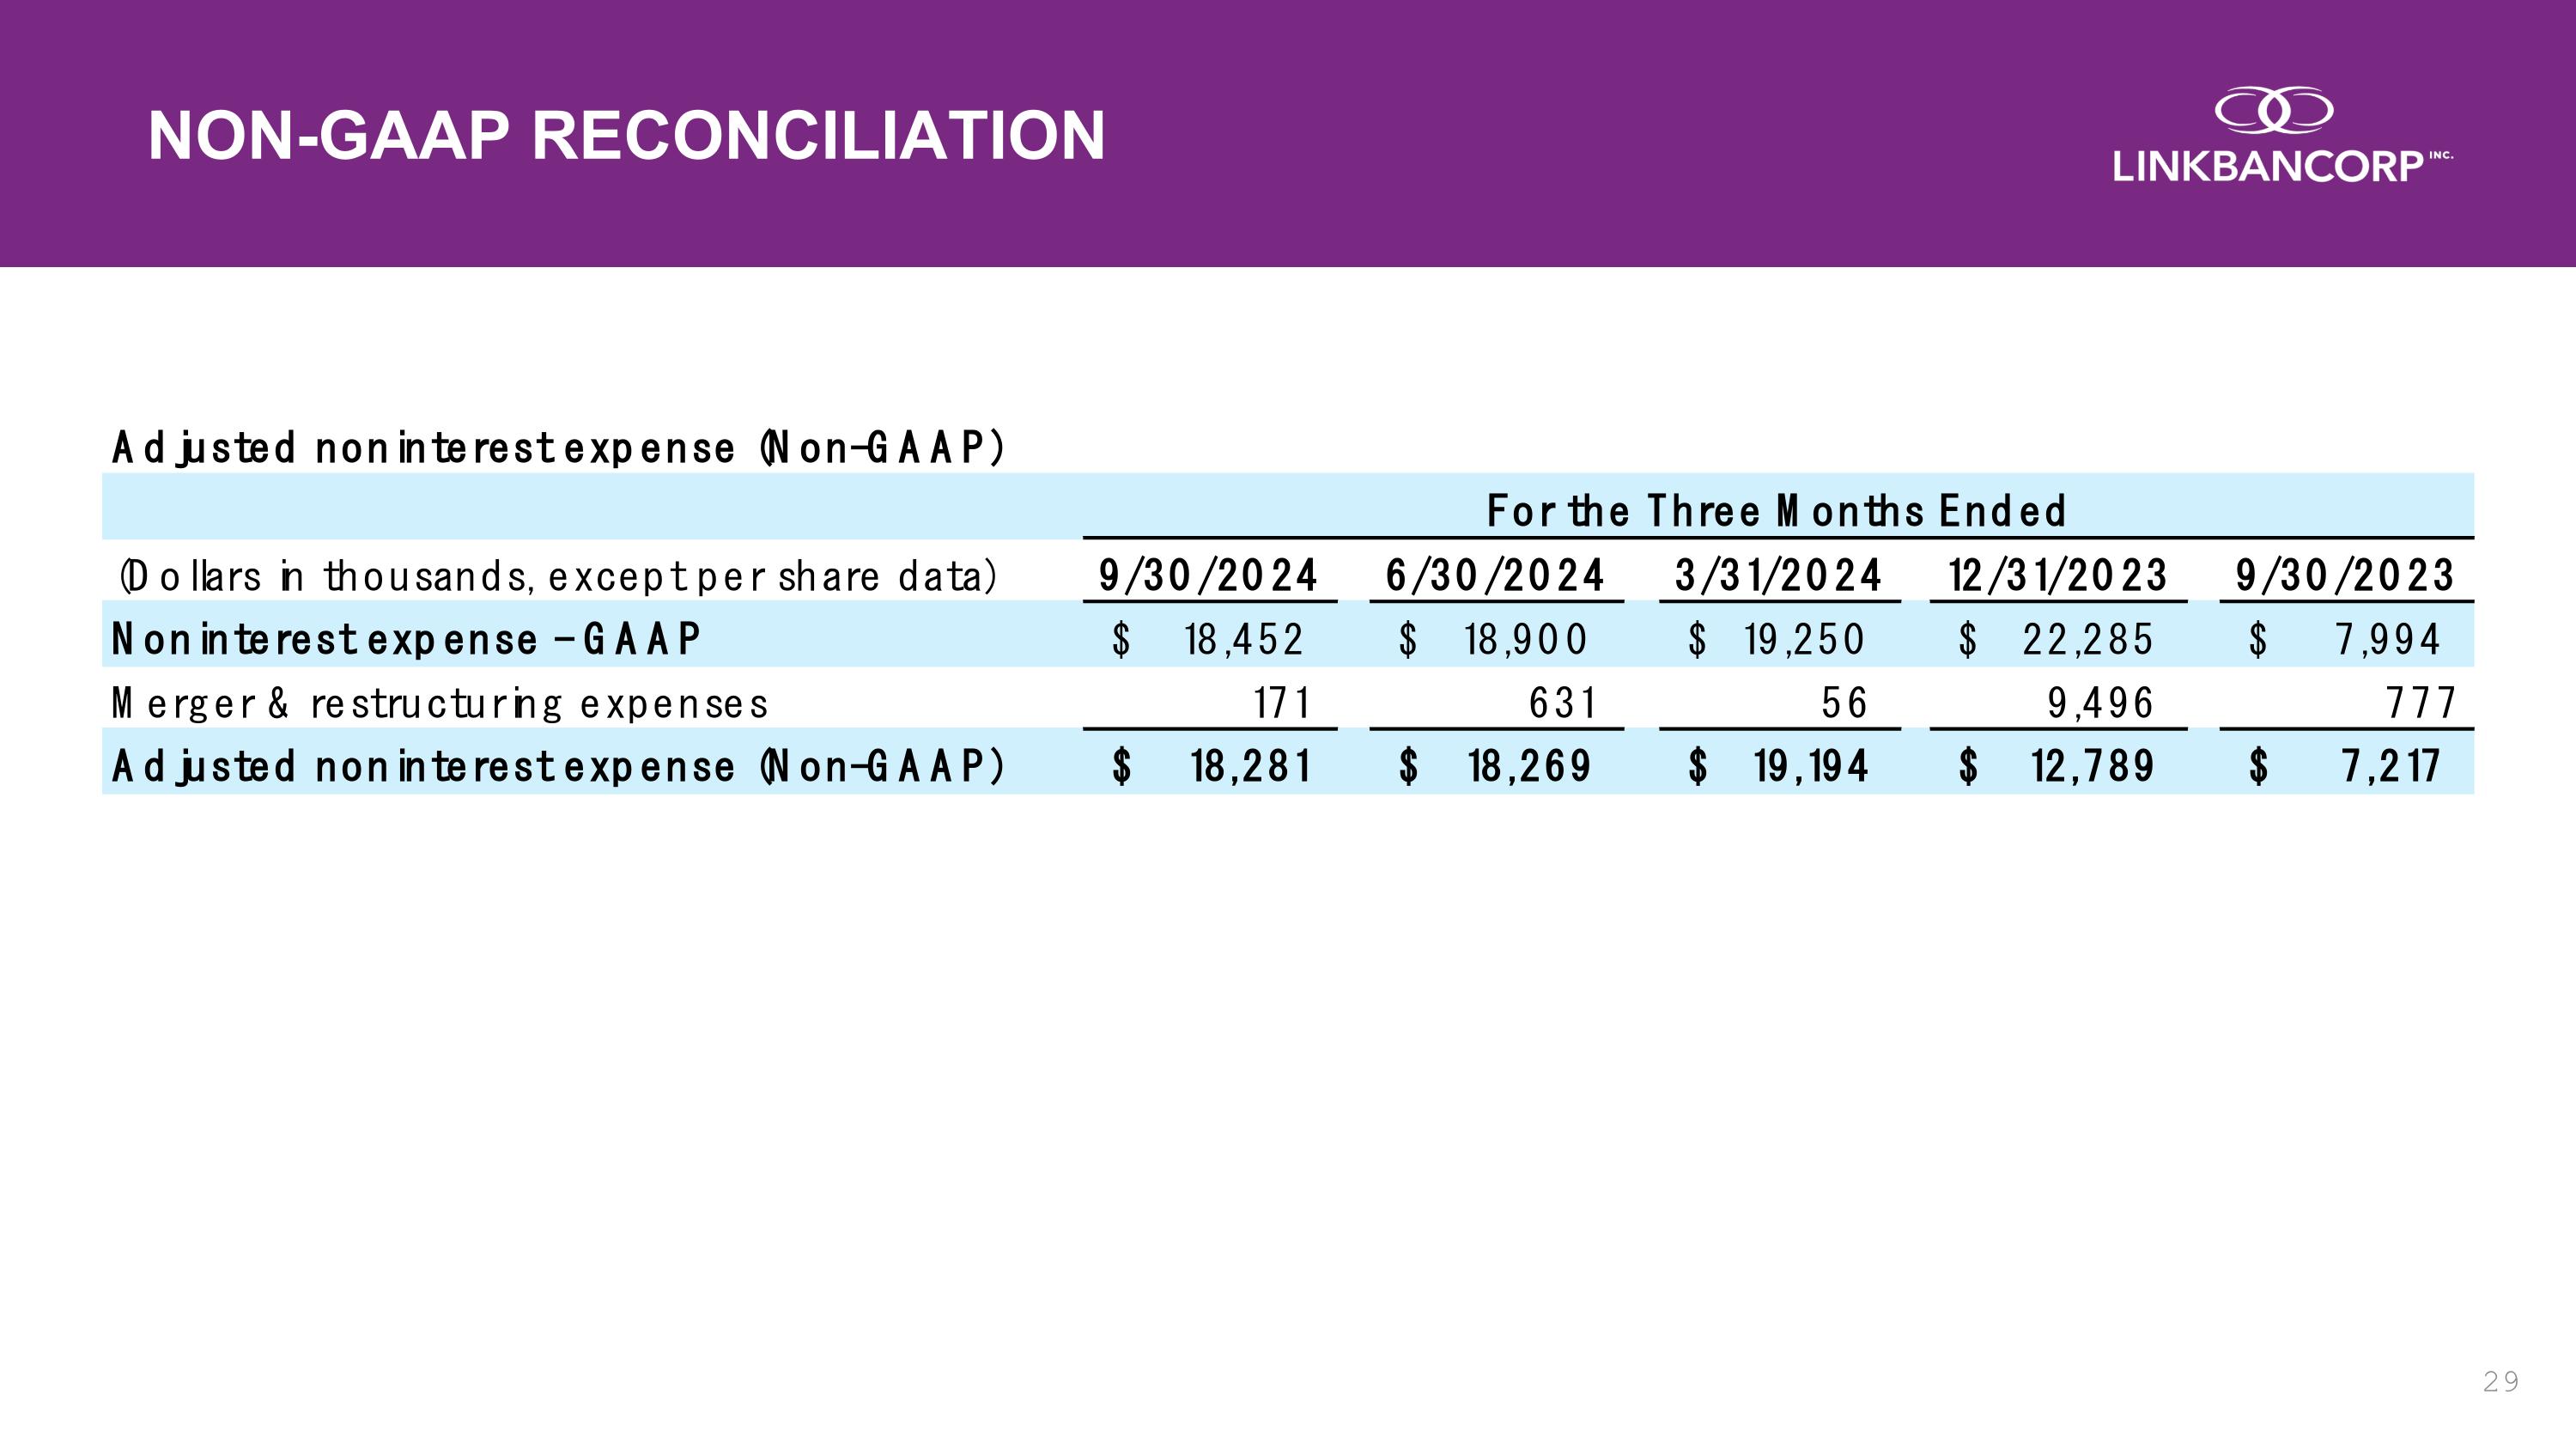
NON-GAAP RECONCILIATION