UNITED STATES
SECURITIES AND EXCHANGE COMMISSION
Washington, D.C. 20549
FORM 8-K
CURRENT REPORT
Pursuant to Section 13 or 15(d) of the Securities Exchange Act of 1934
Date of Report (Date of earliest event reported): April 24, 2024
QuantumScape Corporation
(Exact name of registrant as specified in its charter)
Delaware |
001-39345 |
85-0796578 |
|
(State or other jurisdiction of incorporation) |
(Commission File Number) |
(IRS Employer Identification No.) |
|
|
|
|
1730 Technology Drive, San Jose, California |
|
95110 |
(Address of principal executive offices) |
|
(Zip Code) |
Registrant’s telephone number, including area code: (408) 452-2000
Not Applicable
(Former name or former address, if changed since last report)
Check the appropriate box below if the Form 8-K filing is intended to simultaneously satisfy the filing obligation of the registrant under any of the following provisions:
☐ |
Written communications pursuant to Rule 425 under the Securities Act (17 CFR 230.425) |
☐ |
Soliciting material pursuant to Rule 14a-12 under the Exchange Act (17 CFR 240.14a-12) |
☐ |
Pre-commencement communications pursuant to Rule 14d-2(b) under the Exchange Act (17 CFR 240.14d-2(b)) |
☐ |
Pre-commencement communications pursuant to Rule 13e-4(c) under the Exchange Act (17 CFR 240.13e-4(c)) |
Securities registered pursuant to Section 12(b) of the Act:
Title of each class |
|
Trading Symbol(s) |
|
Name of each exchange on which registered |
Class A common stock, par value $0.0001 per share |
|
QS |
|
The New York Stock Exchange |
Indicate by check mark whether the registrant is an emerging growth company as defined in Rule 405 of the Securities Act of 1933 (§ 230.405 of this chapter) or Rule 12b-2 of the Securities Exchange Act of 1934 (§ 240.12b-2 of this chapter).
Emerging growth company ☐
If an emerging growth company, indicate by check mark if the registrant has elected not to use the extended transition period for complying with any new or revised financial accounting standards provided pursuant to Section 13(a) of the Exchange Act. ☐
Item 2.02 Results of Operations and Financial Condition.
On April 24, 2024, QuantumScape Corporation (the “Company”) announced its business and financial results for its first quarter of 2024, which ended March 31. A copy of the Company’s Shareholder Letter is furnished as Exhibit 99.1 to this Current Report on Form 8-K.
On April 24, 2024, the Company issued a press release announcing the release of its business and financial results. A copy of the press release is attached as Exhibit 99.2 to this Current Report on Form 8-K.
The information contained in this Item 2.02 and in the accompanying Exhibits 99.1 and 99.2 shall not be deemed “filed” for purposes of Section 18 of the Securities Exchange Act of 1934, as amended (the “Exchange Act”), or otherwise subject to the liabilities of that section, nor shall it be deemed incorporated by reference in any filing under the Securities Act of 1933, as amended, or the Exchange Act, regardless of any general incorporation language in such filing, unless expressly incorporated by specific reference in such filing.
Item 9.01 Financial Statements and Exhibits.
(d) Exhibits.
|
Exhibit Number |
|
Description |
99.1* |
|
Letter to Shareholders – Q1 Fiscal 2024 dated April 24, 2024 |
99.2* |
|
|
104 |
|
Cover Page Interactive Data File (embedded within the Inline XBRL document) |
* Filed herewith.
SIGNATURES
Pursuant to the requirements of the Securities Exchange Act of 1934, the registrant has duly caused this report to be signed on its behalf by the undersigned thereunto duly authorized.
|
|
QUANTUMSCAPE CORPORATION |
|
|
|
|
|
Date: April 24, 2024 |
|
By: |
/s/ Kevin Hettrich |
|
|
|
Kevin Hettrich |
|
|
|
Chief Financial Officer (Principal Financial and Accounting Officer) |
|
|
|
Exhibit 99.1
Q1 Fiscal 2024 Letter To Shareholders April 24, 2024
|
|
|
|
|
|
Dear shareholders,
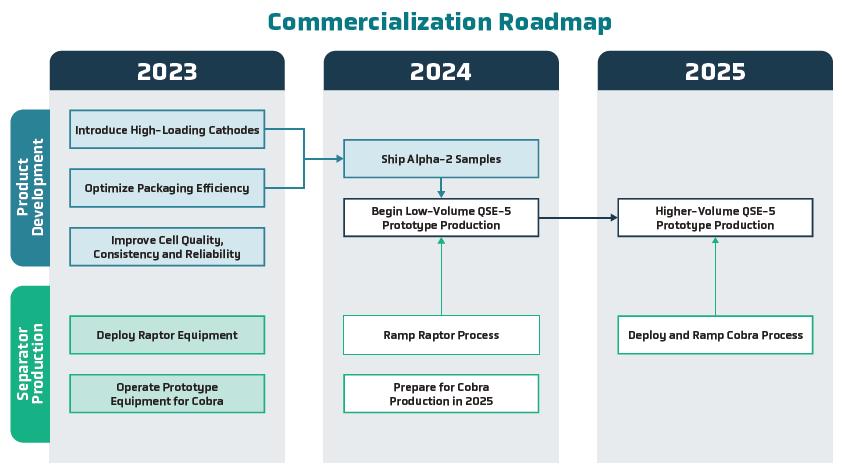
At the beginning of this year, we laid out four key goals for 2024 to help shareholders follow our progress as we move from prototype to product: begin shipment of Alpha-2 prototype battery cells, ramp our Raptor fast separator production process, begin low-volume B0 prototype production of our first commercial product, QSE-5, and prepare our Cobra process to support higher volumes of QSE-5 in 2025.
We announced on March 27 that we started shipments of six-layer Alpha-2 prototype battery cells to automotive customers, which is the first of our four key goals for 2024. This is a key deliverable in our engagement with our prospective launch customer. The Alpha-2 prototype is more energy-dense than our earlier 24-layer A0 prototype, as it combines higher-loading cathodes with our FlexFrame cell format and improvements to packaging efficiency: tighter internal margins, thinner current collectors and a slimmer design. Alpha-2 is important because, when combined with Raptor films and other refinements and incorporated into a ~5Ah design, it represents the core of QSE-5.
As noted in our Q1 2023 Shareholder Letter, after shipping our initial A0 prototype cells to automotive customers at the end of 2022, we planned a sequence of customer samples intended to serve as stepping stones between A0 and our first commercial design, QSE-5. We already shipped the first of these samples, two-layer unit-cell prototypes known as Alpha-1, to multiple automotive customers last year.
The Alpha-2 design is intended to serve as an effective demonstration platform for customers to preview important electrical performance capabilities of the planned QSE-5. Customer feedback is the most critical input in the product development cycle, as it provides insight into areas that need improvement and strengthens collaboration.
Alpha-2 Performance Focus
The following data is from Alpha-2 sister cells1 tested in our labs, as the test protocols in customer labs are proprietary and confidential. As a reminder, Alpha-2 cells are prototypes and will not have the reliability performance expected of a commercial product.
___________________Discharge energy retention vs cycle count for single-layer pouch cells with zero externally applied pressure
1 As part of any prospective customer shipment, we build additional cells with the same design, which we refer to as sister cells, and test them in our own labs.
|
|
|
|
|
|
Discharge Power
In addition to improved energy density, a key performance feature of our planned QSE-5 cell is high discharge-power capability, which relates directly to vehicle acceleration in high-performance applications. Relative to cells optimized only for energy density, we believe this is an important differentiator in the EV battery market.
For context, conventional lithium-ion cells can be optimized for either high power or high energy, but not both at the same time. As the following chart shows, Alpha-2 prototypes are capable of up to 10C discharge rates, which in a 100 kWh pack would be nominally equivalent to over 1,000 horsepower.2 When comparing equivalent electrode areas, Alpha-2 demonstrates higher capacity than a lithium-ion energy cell, while also delivering more capacity at high power than a lithium-ion power cell.3 We believe this translates to a compelling combination of energy and power compared to lithium-ion cell designs.
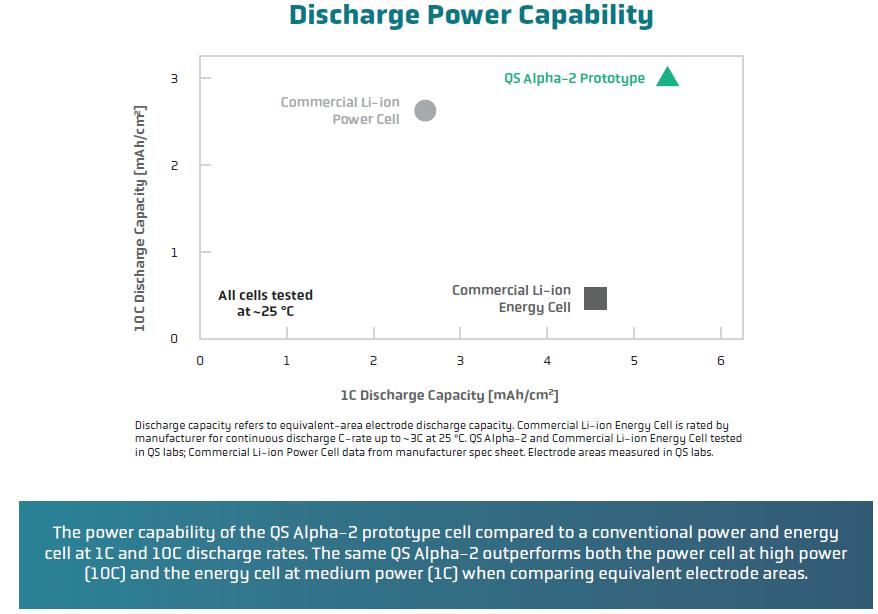
Discharge capacity refers to equivalent-area electrode discharge capacity.Commercial Li-ion energy cell is rated by manufacturer for continuous discharge C -rate up to -3C at 25 °C. AS Alpha-2 and commercial Li-ion energy cell tested in QS labs; commercial Li-ion power cell data from manufacturer spec sheet. Electrode areas measured in QS labs. The power capability of the QS Alpha-2 prototype cell compared to a conventional power and energy cell at 1C and 10C discharge rates. The same QS Alpha-2 outperforms both the power cell at high power (10C) and the energy cell at medium power (1C) when comparing equivalent electrode areas..
___________________Discharge energy retention vs cycle count for single-layer pouch cells with zero externally applied pressure
2 The formula used to estimate power in this case is ( 3.17V/ 3.81V ) × 100 kWh × ( 10/ hour ) = 832 kW, which is nominally equivalent to 1115 horsepower.
3 For more info, see our blog on electrode loading: https://www.quantumscape.com/resources/blog/energy-density-active-materials-electrode-loading/
|
|
|
|
|
|
Fast Charging
In addition to discharge power, fast charging is an important feature for EV applications. Improving on the results from Alpha-1 unit cells we reported in our Q2 2023 Shareholder Letter, Alpha-2 prototypes have demonstrated the capability to fast charge from 10% to 80% state of charge in less than 15 minutes, in line with our target for QSE-5 of 15 minutes.
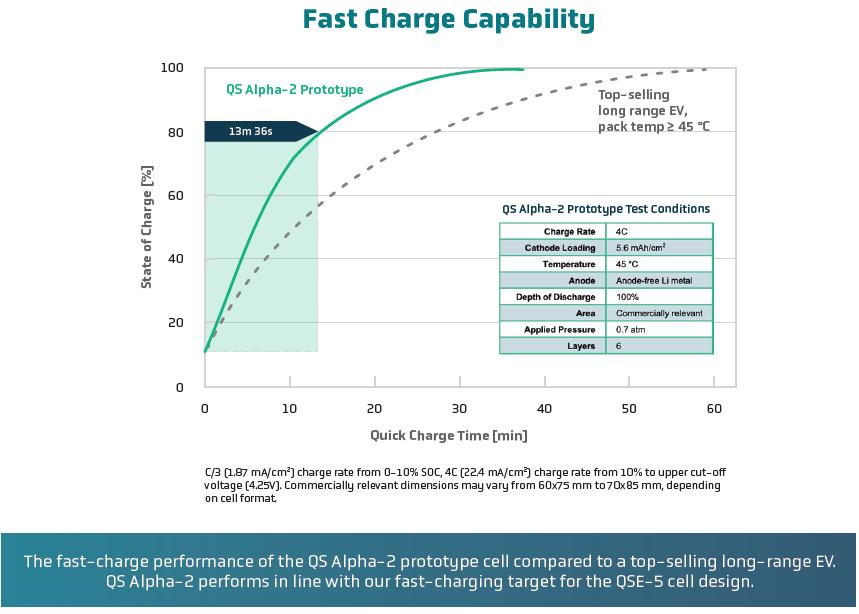
C/3 [1.87 mA/cm2] charge rate from 0-10% SOC, 4C [22.4mA/cm2] charge rate from 10% to upper cut-off voltage [4.25V]. Commercially relevant dimensions may vary from 60x75 mm to 70x85 mm, depending on cell format. The fast-charge performance of the QS Alpha-2 prototype cell compared to a top-selling long-range EV. QS Alpha-2 performs in line with our fast-charging target for the QSE-5 cell design.
Low-Temperature Performance
Conventional EV battery performance can be significantly impaired when ambient temperature drops below freezing. In this context, our technology has a unique advantage: we replace a conventional graphite anode with an anode-free architecture, which shortens the distance lithium has to travel during discharge, thereby increasing performance at low temperatures. As the following chart shows, our cells have the potential to offer good energy density, and hence range, across a spectrum of operating temperatures.
|
|
|
|
|
|
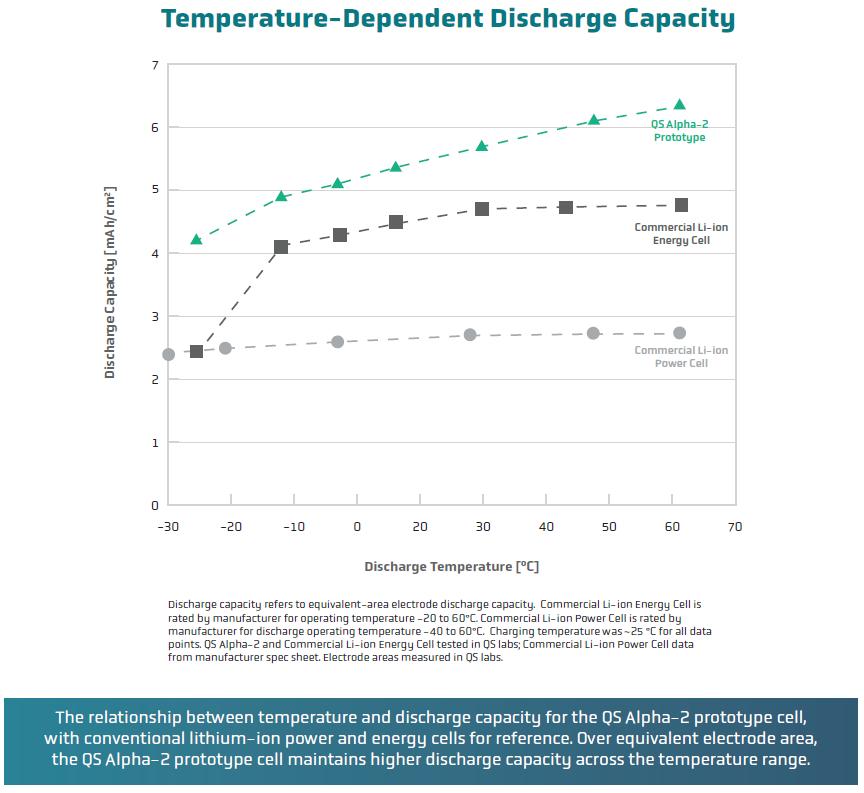
Discharge capacity refers to equivalent-area electrode discharge capacity. Commercial Li-ion Energy Cell is rated by manufacturer for operating temperature -20 to 60°C. Commercial Li-ion Power is rated by manufacturer for discharge operating temperature -40 to 60°C. Charging temperature was -25°C for all data points. QS alpha-2 and Commercial Li-ion Energy Cell tested in QS labs; Commercial Li-ion Power Cell data from manufacturer spec sheet. Electrode areas measured in QS labs. The relationship between temperature and discharge capacity for the QS Alpha-2 prototype cell, with conventional lithium ion power and energy cells for reference. Over equivalent electrode area, the QS Alpha-2 prototype cell maintains higher discharge capacity across the temperature range..
Applied Pressure
Some solid-state battery technologies can appear to deliver acceptable performance when put under high externally applied pressure: we are aware of various solid-state battery groups reporting cycling results using test pressures from 20 atm to as high as 750 atm. Such high pressures are impractical for EV applications.
In the Alpha-2 prototype, we have now reduced externally applied pressure to 0.7 atm (in addition to normal ambient atmospheric pressure), within the range currently present in conventional EV battery pack designs, and we believe this allows us to integrate our cells into existing pack concepts. As we demonstrated in Q3 2023, our system is capable of long cycle life with zero externally applied pressure, and we continue to target zero-pressure designs for consumer-electronics applications.
|
|
|
|
|
|
The Alpha-2 prototype is a key milestone on our path to our first commercial product, QSE-5, which has the potential to offer high energy density (above 800 Wh/L), high discharge power, and fast charging in a cell design that can perform in a vehicle pack environment without compromised requirements, such as high pressure or elevated temperature. It’s important to emphasize that all of these planned performance characteristics are enabled by a single product design, rather than individually optimized designs, as is typical of conventional lithium-ion batteries.
We believe the planned combination of capabilities offered by QSE-5 represents an unmatched value proposition, and Alpha-2 represents an important step forward as we work toward ramping up our manufacturing capabilities and improving the reliability performance of our cells.
Production Outlook: Alpha-2 and Raptor Fast Separator Production
Our current-generation separator production process will continue to serve ongoing Alpha-2 sample production for customer shipment and internal testing in Q2. In parallel, increased production from the Raptor process will allow us to accelerate process development of downstream cell assembly steps, gather larger volumes of cell testing data to validate safety and reliability improvements, and begin production of QSE-5 B0 samples.
Most of the upstream and downstream automation equipment that serves the Raptor heat-treatment equipment has completed or is undergoing site acceptance testing. The Raptor process has shown encouraging improvements to separator performance with respect to certain critical-to-quality metrics. In addition to the planned Raptor ramp, we are also streamlining downstream cell assembly processes by simplifying the bill of materials, consolidating process steps and increasing automation to enable a smooth ramp of cell production.
While supporting initial production of QSE-5 prototype cells, Raptor also serves as a learning platform for our next generation of separator production, the Cobra process. Cobra is intended to combine the fundamental process innovations pioneered by Raptor with specialized equipment capable of realizing the full potential of fast separator production. The Cobra process is necessary to enable higher volumes of QSE-5 prototype production in 2025, and we continue to work toward preparing our Cobra process as another of our four key annual goals.
|
|
|
|
|
|
Financial Outlook
Capital expenditures in the first quarter were $14.1M. Q1 capex primarily supported: low volume QSE-5 prototype production, as well as the Cobra process and other equipment as we prepare for higher volume QSE-5 prototype production in 2025. GAAP operating expenses and GAAP net loss were $131.9M and $120.6M respectively; Adjusted EBITDA loss was $76.2M in Q1. A table reconciling GAAP net loss and Adjusted EBITDA loss can be found in the financial statements at the end of this shareholder letter. We maintain our full-year 2024 guidance for capital expenditures to be between $70M and $120M and for Adjusted EBITDA loss to be between $250M and $300M.
We ended Q1 with $1.01B in liquidity and continue to expect our cash runway to extend into the second half of 2026. Any additional funds raised from capital markets activity, including under our ATM prospectus supplement, would further extend this cash runway. Longer term, our capital requirements will be a function of our industrialization business model, which we believe could reflect a mix of wholly owned production, joint venture and licensing relationships. As always, we encourage investors to read more on our financial information, business outlook and risk factors in our quarterly and annual SEC filings on our investor relations website.
Strategic Outlook
We remain tightly focused on a singular goal: bringing our first commercial solid-state lithium-metal battery cell to market for electric vehicle applications. Achieving this ambitious goal requires three major elements: differentiated technology, close customer engagement and methodical execution of our milestones.
On the first point, we believe the performance differentiation of our solid-state lithium-metal technology continues to be clear, as successive iterations of samples have demonstrated. On the customer front, we are increasing our focus on intensive collaboration with our automotive partners, including our prospective launch customer. And finally, we continue to pursue a disciplined approach to product development and process deployment.
While there is still significant work ahead of us, we are as enthusiastic as ever about our technology and its potential impact, and we look forward to sharing more details over the months to come. Thank you for your ongoing support of our mission to revolutionize energy storage.
|
|
|
Dr. Siva Sivaram President, CEO and Director |
Kevin Hettrich CFO |
|
|
|
|
|
|
QuantumScape Corporation
Condensed Consolidated Balance Sheets (Unaudited)
(In Thousands)
|
|
March 31, |
|
|
December 31, |
|
||
|
|
2024 |
|
|
2023 |
|
||
Assets |
|
|
|
|
|
|
||
Current assets |
|
|
|
|
|
|
||
Cash and cash equivalents ($3,564 and $3,522 as of March 31, 2024 and December 31, 2023, respectively, for joint venture) |
|
$ |
192,321 |
|
|
$ |
142,524 |
|
Marketable securities |
|
|
817,314 |
|
|
|
928,284 |
|
Prepaid expenses and other current assets |
|
|
35,400 |
|
|
|
12,709 |
|
Total current assets |
|
|
1,045,035 |
|
|
|
1,083,517 |
|
Property and equipment, net |
|
|
315,644 |
|
|
|
313,164 |
|
Right-of-use assets - finance lease |
|
|
24,422 |
|
|
|
25,140 |
|
Right-of-use assets - operating lease |
|
|
54,596 |
|
|
|
55,863 |
|
Other assets |
|
|
24,281 |
|
|
|
24,294 |
|
Total assets |
|
$ |
1,463,978 |
|
|
$ |
1,501,978 |
|
Liabilities, redeemable non-controlling interest and stockholders’ equity |
|
|
|
|
|
|
||
Current liabilities |
|
|
|
|
|
|
||
Accounts payable |
|
$ |
11,508 |
|
|
$ |
12,959 |
|
Accrued liabilities |
|
|
72,331 |
|
|
|
10,180 |
|
Accrued compensation and benefits |
|
|
8,738 |
|
|
|
26,043 |
|
Operating lease liability, short-term |
|
|
5,110 |
|
|
|
5,006 |
|
Finance lease liability, short-term |
|
|
2,986 |
|
|
|
2,907 |
|
Total current liabilities |
|
|
100,673 |
|
|
|
57,095 |
|
Operating lease liability, long-term |
|
|
56,256 |
|
|
|
57,622 |
|
Finance lease liability, long-term |
|
|
34,314 |
|
|
|
35,098 |
|
Other liabilities |
|
|
13,073 |
|
|
|
11,986 |
|
Total liabilities |
|
|
204,316 |
|
|
|
161,801 |
|
Redeemable non-controlling interest |
|
|
1,790 |
|
|
|
1,770 |
|
Stockholders’ equity |
|
|
|
|
|
|
||
Preferred stock |
|
|
— |
|
|
|
— |
|
Common stock |
|
|
50 |
|
|
|
49 |
|
Additional paid-in-capital |
|
|
4,260,514 |
|
|
|
4,221,892 |
|
Accumulated other comprehensive loss |
|
|
(1,387 |
) |
|
|
(2,877 |
) |
Accumulated deficit |
|
|
(3,001,305 |
) |
|
|
(2,880,657 |
) |
Total stockholders’ equity |
|
|
1,257,872 |
|
|
|
1,338,407 |
|
Total liabilities, redeemable non-controlling interest and stockholders’ equity |
|
$ |
1,463,978 |
|
|
$ |
1,501,978 |
|
|
|
|
|
|
|
QuantumScape Corporation
Condensed Consolidated Statements of Operations and Comprehensive Loss (Unaudited)
(In Thousands, Except per Share Amounts)
|
|
Three Months Ended March 31, |
|
|||||
|
|
2024 |
|
|
2023 |
|
||
Operating expenses: |
|
|
|
|
|
|
||
Research and development |
|
$ |
83,847 |
|
|
$ |
76,941 |
|
General and administrative |
|
|
48,054 |
|
|
|
33,037 |
|
Total operating expenses |
|
|
131,901 |
|
|
|
109,978 |
|
Loss from operations |
|
|
(131,901 |
) |
|
|
(109,978 |
) |
Other income (loss): |
|
|
|
|
|
|
||
Interest expense |
|
|
(572 |
) |
|
|
(600 |
) |
Interest income |
|
|
12,065 |
|
|
|
6,277 |
|
Other expense |
|
|
(220 |
) |
|
|
(330 |
) |
Total other income |
|
|
11,273 |
|
|
|
5,347 |
|
Net loss |
|
|
(120,628 |
) |
|
|
(104,631 |
) |
Less: Net income attributable to non-controlling interest, net of tax of $0 |
|
|
20 |
|
|
|
16 |
|
Net loss attributable to common stockholders |
|
$ |
(120,648 |
) |
|
$ |
(104,647 |
) |
Net loss |
|
$ |
(120,628 |
) |
|
$ |
(104,631 |
) |
Other comprehensive income (loss): |
|
|
|
|
|
|
||
Unrealized gain on marketable securities |
|
|
1,490 |
|
|
|
5,518 |
|
Total comprehensive loss |
|
|
(119,138 |
) |
|
|
(99,113 |
) |
Less: Comprehensive income attributable to non-controlling interest |
|
|
20 |
|
|
|
16 |
|
Comprehensive loss attributable to common stockholders |
|
$ |
(119,158 |
) |
|
$ |
(99,129 |
) |
|
|
|
|
|
|
|
||
Basic and Diluted net loss per share |
|
$ |
(0.24 |
) |
|
$ |
(0.24 |
) |
Basic and Diluted weighted-average common shares outstanding |
|
|
496,145 |
|
|
|
440,085 |
|
|
|
|
|
|
|
QuantumScape Corporation
Condensed Consolidated Statements of Cash Flows (Unaudited)
(In Thousands)
|
|
Three Months Ended March 31, |
|
|||||
|
|
2024 |
|
|
2023 |
|
||
Operating activities |
|
|
|
|
|
|
||
Net loss |
|
$ |
(120,628 |
) |
|
$ |
(104,631 |
) |
Adjustments to reconcile net loss to net cash used in operating activities: |
|
|
|
|
|
|
||
Depreciation and amortization |
|
|
11,983 |
|
|
|
9,505 |
|
Amortization of right-of-use assets and non-cash lease expense |
|
|
1,985 |
|
|
|
1,933 |
|
Amortization of premiums and accretion of discounts on marketable securities |
|
|
(8,159 |
) |
|
|
(2,176 |
) |
Stock-based compensation expense |
|
|
19,287 |
|
|
|
37,990 |
|
Other |
|
|
107 |
|
|
|
599 |
|
Changes in operating assets and liabilities: |
|
|
|
|
|
|
||
Prepaid expenses and other current assets and other assets |
|
|
(22,679 |
) |
|
|
(862 |
) |
Accounts payable, accrued liabilities and accrued compensation and benefits |
|
|
61,564 |
|
|
|
(4,108 |
) |
Operating lease liability |
|
|
(1,261 |
) |
|
|
(569 |
) |
Other liabilities |
|
|
(144 |
) |
|
|
— |
|
Net cash used in operating activities |
|
|
(57,945 |
) |
|
|
(62,319 |
) |
Investing activities |
|
|
|
|
|
|
||
Purchases of property and equipment |
|
|
(14,120 |
) |
|
|
(28,012 |
) |
Proceeds from maturities of marketable securities |
|
|
384,639 |
|
|
|
191,043 |
|
Proceeds from sales of marketable securities |
|
|
1,245 |
|
|
|
1,477 |
|
Purchases of marketable securities |
|
|
(265,265 |
) |
|
|
(100,422 |
) |
Net cash provided by investing activities |
|
|
106,499 |
|
|
|
64,086 |
|
Financing activities |
|
|
|
|
|
|
||
Proceeds from exercise of stock options |
|
|
1,948 |
|
|
|
4,050 |
|
Principal payment for finance lease |
|
|
(705 |
) |
|
|
— |
|
Net cash provided by financing activities |
|
|
1,243 |
|
|
|
4,050 |
|
Net increase in cash, cash equivalents and restricted cash |
|
|
49,797 |
|
|
|
5,817 |
|
Cash, cash equivalents and restricted cash at beginning of period |
|
|
160,572 |
|
|
|
252,916 |
|
Cash, cash equivalents and restricted cash at end of period |
|
$ |
210,369 |
|
|
$ |
258,733 |
|
Supplemental disclosure: |
|
|
|
|
|
|
||
Cash paid for interest |
|
$ |
572 |
|
|
$ |
— |
|
Purchases of property and equipment, not yet paid |
|
$ |
9,772 |
|
|
$ |
13,437 |
|
Net Loss to Adjusted EBITDA
Adjusted EBITDA is a non-GAAP supplemental measure of operating performance that does not represent and should not be considered an alternative to operating loss or cash flow from operations, as determined by GAAP. Adjusted EBITDA is defined as net income (loss) before interest expense, non-controlling interest, revaluations, stock-based compensation, depreciation and amortization expense and other non-recurring charges. We use Adjusted EBITDA to measure the operating performance of our business, excluding specifically identified items that we do not believe directly reflect our core operations and may not be indicative of our recurring operations. Adjusted EBITDA may not be comparable to similarly titled measures provided by other companies due to potential differences in methods of calculations. A reconciliation of Adjusted EBITDA to net loss is as follows:
|
|
|
|
|
|
($ in Thousands) |
|
Three Months Ended |
|
|||||
|
|
2024 |
|
|
2023 |
|
||
GAAP net loss attributable to Common Stockholders |
|
$ |
(120,648 |
) |
|
$ |
(104,647 |
) |
Interest expense (income), net |
|
|
(11,493 |
) |
|
|
(5,677 |
) |
Other expense (income), net |
|
|
220 |
|
|
|
330 |
|
Net gain (loss) attributable to non-controlling interests |
|
|
20 |
|
|
|
16 |
|
Stock-based compensation |
|
|
19,287 |
|
|
|
37,990 |
|
Litigation settlement accrual and legal fees, net (1) |
|
|
24,455 |
|
|
|
— |
|
Non-GAAP operating loss |
|
$ |
(88,159 |
) |
|
$ |
(71,988 |
) |
Depreciation and amortization expense |
|
|
11,983 |
|
|
|
9,505 |
|
Adjusted EBITDA |
|
$ |
(76,176 |
) |
|
$ |
(62,483 |
) |
(1) This amount is with respect to the pending settlement of the securities class action litigation, which litigation was previously disclosed in our annual report filed on February 27, 2024.
Management’s Use of Non-GAAP Financial Measures
This letter includes certain non-GAAP financial measures as defined by SEC rules. These non-GAAP financial measures are in addition to, and not a substitute for or superior to, measures of financial performance prepared in accordance with U.S. GAAP. There are a number of limitations related to the use of these non-GAAP financial measures versus their nearest GAAP equivalents. For example, other companies may calculate non-GAAP financial measures differently or may use other measures to evaluate their performance, all of which could reduce the usefulness of our non-GAAP financial measures as tools for comparison. We urge you to review the reconciliations of our non-GAAP financial measures to the most directly comparable U.S. GAAP financial measures set forth in this letter, and not to rely on any single financial measure to evaluate our business.
Forward-Looking Statements
This letter contains forward-looking statements within the meaning of the federal securities laws and information based on management’s current expectations as of the date of this letter. All statements other than statements of historical fact contained in this letter, including statements regarding the future development of the Company’s battery technology, the anticipated benefits of the Company’s technologies and the performance of its batteries, plans and objectives for future operations, forecasted cash usage, including spending and investment, are forward-looking statements. When used in this letter, the words “may,” “will,” “can,” “estimate,” “aim,” “pro forma,” “expect,” “plan,” “believe,” “focus,” “potential,” “predict,” “target,” “should,” “would,” “could,” “continue,” “project,” “intend,” “anticipates,” “reiterate,” “seek,” “working toward,” “progress toward,” “prospective” the negative of such terms and other similar expressions are intended to identify forward-looking statements, although not all forward-looking statements contain such identifying words. These forward-looking statements are based on management’s current expectations, assumptions, hopes, beliefs, intentions, and strategies regarding future events and are based on currently available information as to the outcome and timing of future events.
|
|
|
|
|
|
These forward-looking statements involve significant risks and uncertainties that could cause the actual results to differ materially from the expected results. Many of these factors are outside the Company’s control and are difficult to predict. Factors that may cause such differences include but are not limited to ones listed here. The Company faces significant challenges in its attempts to scale up a solid-state battery cell and produce it at high volumes and may not be able to successfully develop its solid-state battery cell or build high volumes of multilayer cells for commercialization. The Company could encounter significant delays and/or technical challenges in replicating and scaling up the performance seen in its single-layer and early multilayer cells, in achieving the high quality, consistency, reliability, safety, cost, and throughput required for commercial production and sale (e.g., unanticipated contamination issues), and in developing a cell architecture that meets all the technical requirements. The Company has encountered and may encounter delays and other obstacles in acquiring, installing and operating new manufacturing equipment for automated and/or continuous-flow processes such as Raptor and Cobra, including vendor delays and other supply chain disruptions and challenges in optimizing its complex manufacturing processes. The Company may encounter delays and cost overruns in hiring and retaining the engineers it needs to expand its development and production efforts, including as a result of management changes, delays in building out or scaling up QS-0, and delays in establishing supply relationships for necessary materials, components or equipment. Delays in increasing production of engineering samples have slowed the Company’s development efforts in the past. These or other sources of delay could impact our delivery of additional Alpha-2 samples and B-samples and delay or prevent successful commercialization of our products. Delays or difficulties in meeting technical milestones or scaling up QS-0 could cause prospective customers and joint venture partners not to purchase cells from our pre-production line or not to proceed with a manufacturing joint venture. The Company may be unable to adequately control the costs associated with its operations and the components necessary to build its solid-state battery cells at competitive prices. The Company’s spending may be higher than currently anticipated and the Company may need to raise additional funds, including in the public markets, and this may cause dilution in the stock ownership of our investors. The Company may encounter difficulties, including due to challenges related to the management transition, the building out of high-volume processes, the achievement of the quality, consistency, reliability, safety, cost and throughput required for commercial production and sale, changes in economic and financial conditions, and not be successful in competing in the battery market industry or establishing and maintaining confidence in its long-term business prospects among current and future partners and customers. The Company is at an early stage of testing its battery technology for use in consumer electronics applications, and we may discover technical or other hurdles that impede our ability to serve that market. If the Company is unable to protect or assert its intellectual property, its business and competitive position would be harmed. The Company cautions that the foregoing list of factors is not exclusive. The Company cautions readers not to place undue reliance upon any forward-looking statements, which speak only as of the date made.
Except as otherwise required by applicable law, the Company disclaims any duty to update any forward-looking statements. Should underlying assumptions prove incorrect, actual results and projections could differ materially from those expressed in any forward-looking statements. Additional information concerning these and other factors that could materially affect the Company’s actual results can be found in the Company’s periodic filings with the SEC. The Company’s SEC filings are available publicly on the SEC’s website at www.sec.gov.
|
|
|
Exhibit 99.2

QuantumScape Reports First Quarter 2024 Business and Financial Results
SAN JOSE, Calif. – April 24, 2024 – QuantumScape Corporation (NYSE: QS), a leader in developing next-generation solid-state lithium-metal batteries, today announced its business and financial results for the first quarter of 2024, which ended March 31.
The company posted a letter to shareholders on its Investor Relations website, ir.quantumscape.com, that details first-quarter financial results and provides a business update.
QuantumScape will host a live webcast today at 2 p.m. Pacific Time (5 p.m. Eastern Time), accessible via its IR Events page. Siva Sivaram, chief executive officer, and Kevin Hettrich, chief financial officer, will participate on the call.
An archive of the webcast will be available shortly after the call for 12 months.
About QuantumScape Corporation
QuantumScape is on a mission to revolutionize energy storage to enable a sustainable future. The company’s next-generation batteries are designed to enable greater energy density, faster charging and enhanced safety to support the transition away from legacy energy sources toward a lower carbon future. For more information, visit www.quantumscape.com.
For Investors
ir@quantumscape.com
For Media
media@quantumscape.com