UNITED STATES
SECURITIES AND EXCHANGE COMMISSION
Washington, D.C. 20549
FORM 8-K
CURRENT REPORT
Pursuant to Section 13 or 15(d) of the Securities Exchange Act of 1934
Date of Report (Date of earliest event reported): July 26, 2023
QuantumScape Corporation
(Exact name of registrant as specified in its charter)
Delaware |
001-39345 |
85-0796578 |
|
(State or other jurisdiction of incorporation) |
(Commission File Number) |
(IRS Employer Identification No.) |
|
|
|
|
1730 Technology Drive, San Jose, California |
|
95110 |
(Address of principal executive offices) |
|
(Zip Code) |
Registrant’s telephone number, including area code: (408) 452-2000
Not Applicable
(Former name or former address, if changed since last report)
Check the appropriate box below if the Form 8-K filing is intended to simultaneously satisfy the filing obligation of the registrant under any of the following provisions:
☐ |
Written communications pursuant to Rule 425 under the Securities Act (17 CFR 230.425) |
☐ |
Soliciting material pursuant to Rule 14a-12 under the Exchange Act (17 CFR 240.14a-12) |
☐ |
Pre-commencement communications pursuant to Rule 14d-2(b) under the Exchange Act (17 CFR 240.14d-2(b)) |
☐ |
Pre-commencement communications pursuant to Rule 13e-4(c) under the Exchange Act (17 CFR 240.13e-4(c)) |
Securities registered pursuant to Section 12(b) of the Act:
Title of each class |
|
Trading Symbol(s) |
|
Name of each exchange on which registered |
Class A common stock, par value $0.0001 per share |
|
QS |
|
The New York Stock Exchange |
Indicate by check mark whether the registrant is an emerging growth company as defined in Rule 405 of the Securities Act of 1933 (§ 230.405 of this chapter) or Rule 12b-2 of the Securities Exchange Act of 1934 (§ 240.12b-2 of this chapter).
Emerging growth company ☐
If an emerging growth company, indicate by check mark if the registrant has elected not to use the extended transition period for complying with any new or revised financial accounting standards provided pursuant to Section 13(a) of the Exchange Act. ☐
Item 2.02 Results of Operations and Financial Condition.
On July 26, 2023, QuantumScape Corporation (the “Company”) announced its business and financial results for its second quarter of 2023, which ended June 30. A copy of the Company’s Shareholder Letter is furnished as Exhibit 99.1 to this Current Report on Form 8-K.
On July 26, 2023, the Company issued a press release announcing the release of its business and financial results. A copy of the press release is attached as Exhibit 99.2 to this Current Report on Form 8-K.
The information contained in this Item 2.02 and in the accompanying Exhibits 99.1 and 99.2 shall not be deemed “filed” for purposes of Section 18 of the Securities Exchange Act of 1934, as amended (the “Exchange Act”), or otherwise subject to the liabilities of that section, nor shall it be deemed incorporated by reference in any filing under the Securities Act of 1933, as amended, or the Exchange Act, regardless of any general incorporation language in such filing, unless expressly incorporated by specific reference in such filing.
Item 9.01 Financial Statements and Exhibits.
(d) Exhibits.
|
Exhibit Number |
|
Description |
99.1* |
|
|
99.2* |
|
|
104 |
|
Cover Page Interactive Data File (embedded within the Inline XBRL document) |
* Filed herewith.
SIGNATURES
Pursuant to the requirements of the Securities Exchange Act of 1934, the registrant has duly caused this report to be signed on its behalf by the undersigned thereunto duly authorized.
|
|
QUANTUMSCAPE CORPORATION |
|
|
|
|
|
Date: July 26, 2023 |
|
By: |
/s/ Kevin Hettrich |
|
|
|
Kevin Hettrich |
|
|
|
Chief Financial Officer (Principal Financial and Accounting Officer) |
|
|
|
Exhibit 99.1
Q2 FISCAL 2023 LETTER TO SHAREHODLERS At the beginning of 2023, we set out a few core goals to enable our transition from prototype to product.
JULY 26, 2023
|
|
|
|
|
|
Dear shareholders,
With the first half of the year behind us, we’re pleased to share an update on our progress.
Customer Shipments
The first of our 2023 goals was to increase the cathode loading of our cells, which increases cell energy by packing more cathode active material into the same area. Last quarter we shared testing results of two-layer unit cells using higher-loading cathodes. Our system enables higher-loading cathodes thanks to our anode-free lithium-metal technology, which eliminates the graphite host material used in conventional battery anodes and so reduces the transport distance lithium ions have to traverse as the battery cycles.
These new cathodes, with a loading of greater than 5 mAh/cm2, are capable of storing more energy, not only compared with the cathodes in cells we previously shipped to customers (~3.1 mAh/cm2), but also relative to the cathodes used in commercial cells such as the 2170 battery cell (~4.3 mAh/cm2) that power some of today’s best-selling EVs.1 Higher cathode loading is a critical element to improve energy density beyond what is available in the leading EV battery cells today.
We are happy to report that we have shipped high cathode-loading unit cells to multiple automotive partners, in line with our development roadmap. This is an important milestone because this level of cathode loading is close to our commercial-intent cathode design for energy-dense cells and represents a significant step toward delivering a commercial product. In our view, when combined with the 24-layer capability we have already shown in our A0 prototype cells and other planned improvements, these shipments represent a validation of our ability to achieve industry-leading energy and power performance for our first commercial product.
Product Roadmap
As announced last quarter, our first commercial product is planned to be a ~5 Ah cell, which we believe will offer a combination of energy density and power unmatched by the leading EV batteries available today. We are designating this first product QSE-5.2 We are already working closely with a prospective launch customer in the automotive sector for this cell, with the goal of bringing our next-generation technology to the electric vehicle market as rapidly as possible.
____________________
1 Cathode loading of 2170 cells is taken from data provided by Batemo GmbH.
2 QSE-5 stands for QuantumScape Energy Cell, 5 Ah.
|
|
|
|
|
|
In our recent webinar on energy density, we showed our latest product performance roadmap:
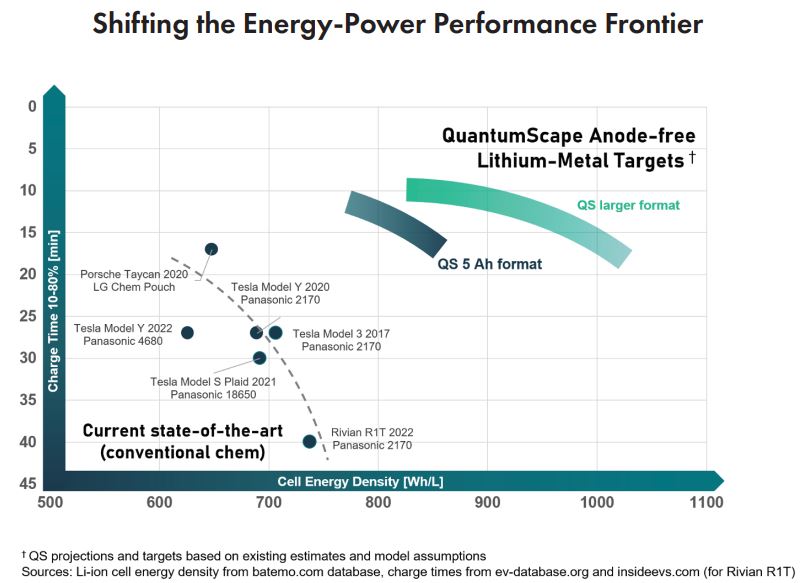
†QS projections and targets based on existing estimates and model assumptions Sources: Li-ion cell energy density from batemo.com database, charge times from ev-database.org and insideevs.com (for Rivian R1T)
As the chart shows, our technology enables a shift of the entire energy-power performance frontier. We expect QSE-5 to push this frontier well beyond the capabilities of today’s best-performing EV cells, better than 800 Wh/L with the ability to charge from 10% to 80% in approximately 15 minutes. We believe this is a unique selling point: with our technology enabling longer range, higher power and faster charging, automotive OEMs gain the ability to better differentiate their EV offerings.
Delivering on our product roadmap will undoubtedly require us to successfully address many technical and manufacturing challenges, including our key goals for 2023. However, we believe
QSE-5 raises the bar for EV performance and puts battery development on a fundamentally new trajectory. To help investors and the general public understand the complexities of designing more energy-dense batteries, we have developed a series of educational blogs. We encourage interested shareholders to visit our website for more details.
Technical Development
Last quarter, we shared data from high-power discharge of unit cells with high-loading cathodes. This showed that in our system, cathodes optimized for high energy density can also meet the demands of high-performance vehicle applications, including those that require sustained discharge rates of 6C-8C.3
____________________
3 Read our blog for more information on C-rates.
|
|
|
|
|
|
In addition to high-rate discharge, improving the EV driving experience requires high-power fast charging. We have targeted 15-minute fast charging from 10% to 80% for our first commercial product, faster than conventional energy-dense cells used in today’s best-selling EVs. Fast charge rates present a challenge for conventional cell architectures, which have to transport lithium ions from one side of the battery to the other and then drive them into the graphite or silicon host material, which imposes a kinetic penalty that limits power. Our system unlocks higher performance by plating lithium directly on the anode layer, without the need for a host material. The lithium ions in our system have a shorter distance to traverse and don’t incur the diffusion penalty of intercalating into a graphite host material, as is the case in a conventional cell.
As a result, our system can plate lithium as fast as the cathode can deliver it. Thanks to this fundamental advantage, we’ve now demonstrated unit cells capable of meeting our 15-minute fast-charge target, even with a high-loading cathode.

†C/3 (1.76 mA/cm2) used from 0-10% SOC, 4C (21.1 mA/cm2) used from 10% to upper cut-off voltage (4.25V)
‡Commercially relevant dimensions may vary from 60x75 mm to 70x85 mm, depending on cell format The fast-charge performance of QuantumScape unit cells with energy-dense cathodes compared to atop-selling long-range EV
As this data shows, our anode-free design enables not only higher energy density, via higher cathode loading and a thinner anode, but also higher power density as a result of shortened ion-transport paths. This fundamental advantage is why we believe our technology is capable of an unmatched combination of energy and power. When referenced against a top-selling EV, the speed advantage is clear: our system can deliver a ~15-minute charge from 10% to 80% state of charge, almost twice as fast as the reference car’s 27 minutes.
|
|
|
|
|
|
Since most batteries can deliver higher power at higher temperatures, several EV manufacturers give drivers the option to pre-heat (or pre-condition) their battery pack before fast charging. For example, the top-selling EV model referenced in the previous chart achieves its fast-charge performance with pack temperatures at or above 45 °C. Lithium-ion batteries also generally self-heat rapidly under fast-charge conditions to temperatures of 45 °C or higher, due to their inherent internal resistance. For these reasons, we believe 45 °C is the most relevant condition for understanding fast-charging performance.
Another key technical development milestone is safety testing. In Q2, we ran a suite of safety tests on our A0 prototype cells, including nail penetration, overcharge, external short circuit, and thermal stability testing up to 300 °C, and we’re pleased to report that the A0 prototype cells successfully passed these safety tests according to the specification set by a leading automotive customer, with hazard levels of 3 or lower as defined by EUCAR and SAE J2464 standards.
We attribute these encouraging results to our solid-state architecture, which replaces the combustible polymer separator in conventional lithium-ion cells with a noncombustible solid-state ceramic separator and eliminates the graphite fuel from the anode; however, it’s important to note that safety is a function of cell materials and design, and as we improve packaging efficiency and energy density for QSE-5, the cell itself will have different physical characteristics and potentially a different safety profile. Any new cell design must be re-tested to establish its behavior under abuse conditions.
Manufacturing Scale Up
We also made significant progress last quarter on our manufacturing scale-up process. We reported previously on an innovative fast separator heat-treatment process that offers the potential for dramatically better throughput. Initial deployment of this fast process is another key goal for 2023, and we plan to roll it out in two stages, which we have dubbed Raptor and Cobra. The underlying work on these processes has been ongoing for several years, and as the data has come in, it’s clear that fast separator processes are the endgame for our separator production.
Raptor introduces a step-change process innovation which allows continuous-flow heat treatment equipment to process separator films much more rapidly while applying much less total heat energy per film, increasing the throughput of the equipment and bringing down the energy cost of producing an individual separator.4 Raptor is intended to support production of initial B0 samples from QS-0 in 2024, and so our goal is to qualify Raptor for production by the end of 2023. We’re pleased to report that installation of Raptor equipment is complete, and we continue to expect initial production to begin before the end of the year.
Cobra is a further evolution of the fast separator process, which builds on the innovations of Raptor and adds even faster processing, higher energy efficiency and better unit economics. We see Cobra as a groundbreaking innovation in ceramics processing and we believe it represents the best pathway to gigafactory-scale manufacturing. We are currently operating prototypes of Cobra and intend to roll out our first production Cobra system to support higher-volume B-sample production from QS-0.
As an integral part of our scale up and transition from R&D to production, we continue to strengthen our leadership team with deep expertise from high-volume, high-tech manufacturing industries, such as semiconductors, batteries, automotive and magnetic storage.
____________________
4 Cover photo shows Raptor automation and conveyor equipment.
|
|
|
|
|
|
Financial Outlook
For the second quarter 2023, capital expenditures were $25M. GAAP operating expenses were $124M. Cash operating expenses, defined as operating expenses less stock-based compensation and depreciation, were $64M. For the full-year 2023, we keep our guidance on capital expenditures of $100M to $150M and cash operating expenses of $225M to $275M.
During Q2, our capex primarily went toward facility spend for our consolidated QS-0 pre-production line. Other notable capex spend was driven by progress payments made toward various equipment projects, including the Raptor equipment. For the remainder of the year, our capex will continue to be allocated toward facility work and equipment for our consolidated QS-0 pre-production line.
We ended Q2 with over $900M in liquidity and continue to look for opportunities to optimize our spending and be prudent with our strong balance sheet. We maintain our guidance that our cash runway is forecast to extend into the second half of 2025. Any funds raised from capital markets activity, including under our ATM prospectus supplement, would further extend this cash runway.
Longer term, our capital requirements will be a function of our industrialization business model, which we believe could reflect a mix of wholly-owned production, joint venture, and licensing relationships.
Strategic Outlook
At the start of the year, we set our focus on moving from our first 24-layer A0 prototypes, which shipped at the end of 2022, to a first commercial product design, with initial lower-volume B0-sample production currently slated for next year. To achieve this transition from prototype to product, we set four key goals: introduce high-loading cathodes, bring up our fast separator production process, optimize packaging efficiency, and improve cell quality, consistency and reliability.
Midway through 2023, we’re excited and encouraged by our progress against these goals:
Hopefully it’s clear from these results that our team of more than 800 engineers, technicians and business personnel has been laser-focused on doing what it takes to bring our first commercial product to market.
|
|
|
|
|
|
As we continually emphasize, there is much work still to be done on our path from prototype to product, and unforeseen challenges will almost certainly arise. However, at the close of Q2, we are excited by the momentum we’ve built and energized to tackle the remaining challenges on the path to commercialization. We look forward to sharing more as we continue ahead.
|
|
Jagdeep Singh |
Kevin Hettrich |
Founder, CEO & Chairman |
CFO |
|
|
|
|
|
|
QuantumScape Corporation
Condensed Consolidated Balance Sheets (Unaudited)
(In Thousands, Except per Share Amounts)
|
|
June 30, |
|
|
December 31, |
|
||
|
|
2023 |
|
|
2022 |
|
||
Assets |
|
|
|
|
|
|
||
Current assets |
|
|
|
|
|
|
||
Cash and cash equivalents ($3,465 and $3,395 as of June 30, 2023 and December 31, 2022, respectively, for joint venture) |
|
$ |
232,840 |
|
|
$ |
235,393 |
|
Marketable securities |
|
|
676,834 |
|
|
|
826,340 |
|
Prepaid expenses and other current assets |
|
|
8,951 |
|
|
|
10,591 |
|
Total current assets |
|
|
918,625 |
|
|
|
1,072,324 |
|
Property and equipment, net |
|
|
323,872 |
|
|
|
295,934 |
|
Right-of-use assets - finance lease |
|
|
26,577 |
|
|
|
28,013 |
|
Right-of-use assets - operating lease |
|
|
58,343 |
|
|
|
60,782 |
|
Other assets |
|
|
19,861 |
|
|
|
18,353 |
|
Total assets |
|
$ |
1,347,278 |
|
|
$ |
1,475,406 |
|
Liabilities, redeemable non-controlling interest and stockholders’ equity |
|
|
|
|
|
|
||
Current liabilities |
|
|
|
|
|
|
||
Accounts payable |
|
$ |
12,470 |
|
|
$ |
21,420 |
|
Accrued liabilities |
|
|
8,206 |
|
|
|
7,477 |
|
Accrued compensation and benefits |
|
|
19,684 |
|
|
|
13,061 |
|
Operating lease liability, short-term |
|
|
4,618 |
|
|
|
3,478 |
|
Finance lease liability, short-term |
|
|
2,753 |
|
|
|
1,373 |
|
Total current liabilities |
|
|
47,731 |
|
|
|
46,809 |
|
Operating lease liability, long-term |
|
|
60,168 |
|
|
|
62,560 |
|
Finance lease liability, long-term |
|
|
36,585 |
|
|
|
38,005 |
|
Other liabilities |
|
|
11,808 |
|
|
|
8,488 |
|
Total liabilities |
|
|
156,292 |
|
|
|
155,862 |
|
Redeemable non-controlling interest |
|
|
1,734 |
|
|
|
1,704 |
|
Stockholders’ equity |
|
|
|
|
|
|
||
Preferred stock |
|
|
— |
|
|
|
— |
|
Common stock |
|
|
45 |
|
|
|
44 |
|
Additional paid-in-capital |
|
|
3,855,602 |
|
|
|
3,771,181 |
|
Accumulated other comprehensive loss |
|
|
(9,715 |
) |
|
|
(17,873 |
) |
Accumulated deficit |
|
|
(2,656,680 |
) |
|
|
(2,435,512 |
) |
Total stockholders’ equity |
|
|
1,189,252 |
|
|
|
1,317,840 |
|
Total liabilities, redeemable non-controlling interest and stockholders’ equity |
|
$ |
1,347,278 |
|
|
$ |
1,475,406 |
|
|
|
|
|
|
|
QuantumScape Corporation
Condensed Consolidated Statements of Operations and Comprehensive Loss (Unaudited)
(In Thousands, Except per Share Amounts)
|
|
Three Months Ended June 30, |
|
|
Six Months Ended June 30, |
|
||||||||||
|
|
2023 |
|
|
2022 |
|
|
2023 |
|
|
2022 |
|
||||
Operating expenses: |
|
|
|
|
|
|
|
|
|
|
|
|
||||
Research and development |
|
$ |
86,453 |
|
|
$ |
65,133 |
|
|
$ |
163,394 |
|
|
$ |
126,478 |
|
General and administrative |
|
|
37,089 |
|
|
|
30,740 |
|
|
|
70,126 |
|
|
|
60,052 |
|
Total operating expenses |
|
|
123,542 |
|
|
|
95,873 |
|
|
|
233,520 |
|
|
|
186,530 |
|
Loss from operations |
|
|
(123,542 |
) |
|
|
(95,873 |
) |
|
|
(233,520 |
) |
|
|
(186,530 |
) |
Other income (loss): |
|
|
|
|
|
|
|
|
|
|
|
|
||||
Interest expense |
|
|
(602 |
) |
|
|
(607 |
) |
|
|
(1,202 |
) |
|
|
(1,207 |
) |
Interest income |
|
|
7,319 |
|
|
|
1,510 |
|
|
|
13,596 |
|
|
|
2,326 |
|
Other income (expense) |
|
|
318 |
|
|
|
133 |
|
|
|
(12 |
) |
|
|
221 |
|
Total other income |
|
|
7,035 |
|
|
|
1,036 |
|
|
|
12,382 |
|
|
|
1,340 |
|
Net loss |
|
|
(116,507 |
) |
|
|
(94,837 |
) |
|
|
(221,138 |
) |
|
|
(185,190 |
) |
Less: Net income (loss) attributable to non-controlling interest, net of tax of $0 |
|
|
14 |
|
|
|
(8 |
) |
|
|
30 |
|
|
|
(9 |
) |
Net loss attributable to common stockholders |
|
$ |
(116,521 |
) |
|
$ |
(94,829 |
) |
|
$ |
(221,168 |
) |
|
$ |
(185,181 |
) |
Net loss |
|
$ |
(116,507 |
) |
|
$ |
(94,837 |
) |
|
$ |
(221,138 |
) |
|
$ |
(185,190 |
) |
Other comprehensive income (loss): |
|
|
|
|
|
|
|
|
|
|
|
|
||||
Unrealized gain (loss) on marketable securities |
|
|
2,640 |
|
|
|
(3,321 |
) |
|
|
8,158 |
|
|
|
(14,937 |
) |
Total comprehensive loss |
|
|
(113,867 |
) |
|
|
(98,158 |
) |
|
|
(212,980 |
) |
|
|
(200,127 |
) |
Less: Comprehensive income (loss) attributable to non-controlling interest |
|
|
14 |
|
|
|
(8 |
) |
|
|
30 |
|
|
|
(9 |
) |
Comprehensive loss attributable to common stockholders |
|
$ |
(113,881 |
) |
|
$ |
(98,150 |
) |
|
$ |
(213,010 |
) |
|
$ |
(200,118 |
) |
|
|
|
|
|
|
|
|
|
|
|
|
|
||||
Basic and Diluted net loss per share |
|
$ |
(0.26 |
) |
|
$ |
(0.22 |
) |
|
$ |
(0.50 |
) |
|
$ |
(0.43 |
) |
Basic and Diluted weighted-average common shares outstanding |
|
|
445,324 |
|
|
|
431,523 |
|
|
|
442,724 |
|
|
|
430,435 |
|
|
|
|
|
|
|
QuantumScape Corporation
Condensed Consolidated Statements of Cash Flows (Unaudited)
(In Thousands)
|
|
Three Months Ended June 30, |
|
|
Six Months Ended June 30, |
|
||||||||||
|
|
2023 |
|
|
2022 |
|
|
2023 |
|
|
2022 |
|
||||
Operating activities |
|
|
|
|
|
|
|
|
|
|
|
|
||||
Net loss |
|
$ |
(116,507 |
) |
|
$ |
(94,837 |
) |
|
$ |
(221,138 |
) |
|
$ |
(185,190 |
) |
Adjustments to reconcile net loss to net cash used in operating activities: |
|
|
|
|
|
|
|
|
|
|
|
|
||||
Depreciation and amortization |
|
|
10,028 |
|
|
|
5,782 |
|
|
|
19,533 |
|
|
|
10,506 |
|
Amortization of right-of-use assets and non-cash lease expense |
|
|
1,942 |
|
|
|
1,906 |
|
|
|
3,875 |
|
|
|
3,698 |
|
Amortization of premiums and accretion of discounts on marketable securities |
|
|
(3,336 |
) |
|
|
1,528 |
|
|
|
(5,512 |
) |
|
|
3,713 |
|
Stock-based compensation expense |
|
|
49,992 |
|
|
|
30,926 |
|
|
|
87,982 |
|
|
|
59,407 |
|
Other |
|
|
(98 |
) |
|
|
48 |
|
|
|
501 |
|
|
|
608 |
|
Changes in operating assets and liabilities: |
|
|
|
|
|
|
|
|
|
|
|
|
||||
Prepaid expenses and other assets |
|
|
995 |
|
|
|
3,156 |
|
|
|
133 |
|
|
|
5,238 |
|
Accounts payable, accrued liabilities and accrued compensation |
|
|
91 |
|
|
|
(1,967 |
) |
|
|
(4,017 |
) |
|
|
701 |
|
Other long-term liabilities |
|
|
(100 |
) |
|
|
2,100 |
|
|
|
(100 |
) |
|
|
2,100 |
|
Operating lease liabilities |
|
|
(682 |
) |
|
|
26 |
|
|
|
(1,251 |
) |
|
|
486 |
|
Net cash used in operating activities |
|
|
(57,675 |
) |
|
|
(51,332 |
) |
|
|
(119,994 |
) |
|
|
(98,733 |
) |
Investing activities |
|
|
|
|
|
|
|
|
|
|
|
|
||||
Purchases of property and equipment |
|
|
(24,720 |
) |
|
|
(27,631 |
) |
|
|
(52,732 |
) |
|
|
(66,925 |
) |
Proceeds from maturities of marketable securities |
|
|
261,440 |
|
|
|
200,740 |
|
|
|
452,483 |
|
|
|
419,240 |
|
Proceeds from sales of marketable securities |
|
|
— |
|
|
|
1,992 |
|
|
|
1,477 |
|
|
|
15,105 |
|
Purchases of marketable securities |
|
|
(190,358 |
) |
|
|
(66,895 |
) |
|
|
(290,780 |
) |
|
|
(250,787 |
) |
Net cash provided by investing activities |
|
|
46,362 |
|
|
|
108,206 |
|
|
|
110,448 |
|
|
|
116,633 |
|
Financing activities |
|
|
|
|
|
|
|
|
|
|
|
|
||||
Proceeds from exercise of stock options and employee stock purchase plan |
|
|
3,583 |
|
|
|
3,680 |
|
|
|
7,633 |
|
|
|
4,967 |
|
Principal payment for finance lease, net of credit |
|
|
(640 |
) |
|
|
(199 |
) |
|
|
(640 |
) |
|
|
(199 |
) |
Net cash provided by financing activities |
|
|
2,943 |
|
|
|
3,481 |
|
|
|
6,993 |
|
|
|
4,768 |
|
Net increase (decrease) in cash, cash equivalents and restricted cash |
|
|
(8,370 |
) |
|
|
60,355 |
|
|
|
(2,553 |
) |
|
|
22,668 |
|
Cash, cash equivalents and restricted cash at beginning of period |
|
|
258,733 |
|
|
|
300,536 |
|
|
|
252,916 |
|
|
|
338,223 |
|
Cash, cash equivalents and restricted cash at end of period |
|
$ |
250,363 |
|
|
$ |
360,891 |
|
|
$ |
250,363 |
|
|
$ |
360,891 |
|
Supplemental disclosure of cash flow information |
|
|
|
|
|
|
|
|
|
|
|
|
||||
Cash paid for interest |
|
$ |
602 |
|
|
$ |
607 |
|
|
$ |
602 |
|
|
$ |
607 |
|
Purchases of property and equipment, not yet paid |
|
$ |
9,416 |
|
|
$ |
17,871 |
|
|
$ |
9,416 |
|
|
$ |
17,871 |
|
|
|
|
|
|
|
Net Loss to Adjusted EBITDA
Adjusted EBITDA is a non-GAAP supplemental measure of operating performance that does not represent and should not be considered an alternative to operating loss or cash flow from operations, as determined by GAAP. Adjusted EBITDA is defined as net income (loss) before interest expense, non-controlling interest, revaluations, stock-based compensation and depreciation and amortization expense. We use Adjusted EBITDA to measure the operating performance of our business, excluding specifically identified items that we do not believe directly reflect our core operations and may not be indicative of our recurring operations. Adjusted EBITDA may not be comparable to similarly titled measures provided by other companies due to potential differences in methods of calculations. A reconciliation of Adjusted EBITDA to net loss is as follows:
($ in Thousands) |
|
Three Months Ended |
|
|
Six Months Ended |
|
||||||||||
|
|
2023 |
|
|
2022 |
|
|
2023 |
|
|
2022 |
|
||||
GAAP net loss attributable to Common Stockholders |
|
$ |
(116,521 |
) |
|
$ |
(94,829 |
) |
|
$ |
(221,168 |
) |
|
$ |
(185,181 |
) |
Interest expense (income), net |
|
|
(6,717 |
) |
|
|
(903 |
) |
|
|
(12,394 |
) |
|
|
(1,119 |
) |
Other expense (income), net |
|
|
(318 |
) |
|
|
(133 |
) |
|
|
12 |
|
|
|
(221 |
) |
Net gain (loss) attributable to non-controlling interests |
|
|
14 |
|
|
|
(8 |
) |
|
|
30 |
|
|
|
(9 |
) |
Stock-based compensation |
|
|
49,992 |
|
|
|
30,926 |
|
|
|
87,982 |
|
|
|
59,407 |
|
Non-GAAP operating loss |
|
$ |
(73,550 |
) |
|
$ |
(64,947 |
) |
|
$ |
(145,538 |
) |
|
$ |
(127,123 |
) |
Depreciation and amortization expense |
|
|
10,028 |
|
|
|
5,782 |
|
|
|
19,533 |
|
|
|
10,506 |
|
Adjusted EBITDA |
|
$ |
(63,522 |
) |
|
$ |
(59,165 |
) |
|
$ |
(126,005 |
) |
|
$ |
(116,617 |
) |
Management’s Use of Non-GAAP Financial Measures
This letter includes certain non-GAAP financial measures as defined by SEC rules. These non-GAAP financial measures are in addition to, and not a substitute for or superior to, measures of financial performance prepared in accordance with U.S. GAAP. There are a number of limitations related to the use of these non-GAAP financial measures versus their nearest GAAP equivalents. For example, other companies may calculate non-GAAP financial measures differently or may use other measures to evaluate their performance, all of which could reduce the usefulness of our non-GAAP financial measures as tools for comparison. We urge you to review the reconciliations of our non-GAAP financial measures to the most directly comparable U.S. GAAP financial measures set forth in this letter, and not to rely on any single financial measure to evaluate our business.
|
|
|
|
|
|
Forward-Looking Statements
This letter contains forward-looking statements within the meaning of the federal securities laws and information based on management’s current expectations as of the date of this letter. All statements other than statements of historical fact contained in this letter, including statements regarding the future development of the Company’s battery technology, the anticipated benefits of the Company’s technologies and the performance of its batteries, plans and objectives for future operations, forecasted cash usage, including spending and investment, are forward-looking statements. When used in this letter, the words “may,” “will,” “estimate,” “aim,” “pro forma,” “expect,” “plan,” “believe,” “focus,” “potential,” “predict,” “target,” “should,” “would,” “could,” “continue,” “project,” “intend,” “anticipates,” “reiterate,” “seek,” “working toward,” “progress toward,” “prospective” the negative of such terms and other similar expressions are intended to identify forward-looking statements, although not all forward-looking statements contain such identifying words. These forward-looking statements are based on management’s current expectations, assumptions, hopes, beliefs, intentions, and strategies regarding future events and are based on currently available information as to the outcome and timing of future events.
These forward-looking statements involve significant risks and uncertainties that could cause the actual results to differ materially from the expected results. Many of these factors are outside the Company’s control and are difficult to predict. Factors that may cause such differences include but are not limited to ones listed here. The Company faces significant challenges in its attempts to develop a solid-state battery cell and produce it at high volumes and may not be able to successfully develop its solid-state battery cell or build high volumes of multilayer cells in commercially relevant area and with higher layer count. The Company could encounter significant delays and/or technical challenges in replicating the performance seen in its single-layer and early multilayer cells, in achieving the high quality, consistency, reliability, safety, cost, and throughput required for commercial production and sale (e.g., unanticipated contamination issues), and in developing a cell architecture that meets all the technical requirements. The Company has encountered delays and other obstacles in acquiring, installing and operating new manufacturing equipment for automated and/or continuous-flow processes, including vendor delays and other supply chain disruptions and challenges in optimizing its complex manufacturing processes. The Company may encounter delays and cost overruns in hiring the engineers it needs to expand its development and production efforts, delays in building out or scaling up QS-0, and delays in establishing supply relationships for necessary materials, components or equipment. Delays in increasing production of engineering samples have slowed the Company’s development efforts in the past. These or other sources of delay could impact our delivery of A-samples and B-samples and delay or prevent successful commercialization of our products. Delays or difficulties in meeting technical milestones or scaling up QS-0 could cause prospective customers and joint venture partners not to purchase cells from our pre-production line or not to proceed with a manufacturing joint venture. The Company may be unable to adequately control the costs associated with its operations and the components necessary to build its solid-state battery cells at competitive prices. The Company’s spending may be higher than currently anticipated. The Company may not be successful in competing in the battery market industry or establishing and maintaining confidence in its long-term business prospects among current and future partners and customers. The Company is at an early stage of testing its battery technology for use in consumer electronics applications, and we may discover technical or other hurdles that impede our ability to serve that market. The Company cautions that the foregoing list of factors is not exclusive. The Company cautions readers not to place undue reliance upon any forward-looking statements, which speak only as of the date made.
|
|
|
|
|
|
Except as otherwise required by applicable law, the Company disclaims any duty to update any forward-looking statements. Should underlying assumptions prove incorrect, actual results and projections could differ materially from those expressed in any forward-looking statements. Additional information concerning these and other factors that could materially affect the Company’s actual results can be found in the Company’s periodic filings with the SEC. The Company’s SEC filings are available publicly on the SEC’s website at www.sec.gov.
|
|
|
Exhibit 99.2

QuantumScape Reports Second Quarter 2023 Business and Financial Results
SAN JOSE, Calif. – July 26, 2023 – QuantumScape Corporation (NYSE: QS), a leader in developing next-generation solid-state lithium-metal batteries, today announced its business and financial results for the second quarter of 2023, which ended June 30.
The company posted a letter to shareholders on its Investor Relations website, ir.quantumscape.com, that details second-quarter financial results and provides a business update.
QuantumScape will host a live webcast today at 2 p.m. Pacific Time (5 p.m. Eastern Time), accessible via its IR Events page. Jagdeep Singh, co-founder and chief executive officer, and Kevin Hettrich, chief financial officer, will participate on the call.
An archive of the webcast will be available shortly after the call for 12 months.
About QuantumScape Corporation
QuantumScape is on a mission to transform energy storage with solid-state lithium-metal battery technology. The company’s next-generation batteries are designed to enable greater energy density, faster charging and enhanced safety to support the transition away from legacy energy sources toward a lower carbon future. For more information, visit www.quantumscape.com.
For Investors
ir@quantumscape.com
For Media
media@quantumscape.com

