Document
COPT Defense Properties
Supplemental Information + Earnings Release - Unaudited
For the Period Ended 3/31/24
|
|
|
|
|
|
|
|
|
|
|
|
|
|
|
|
|
|
|
|
|
|
|
|
|
|
|
|
|
|
|
|
|
|
|
|
|
|
|
|
|
|
|
|
|
|
|
|
|
|
|
|
|
|
|
|
|
|
|
|
|
|
|
|
|
|
|
|
|
|
|
|
|
|
|
|
|
|
|
|
|
|
|
|
|
|
|
|
|
|
|
|
|
|
|
|
|
|
|
|
|
|
|
|
|
|
|
|
|
|
|
|
|
|
|
|
|
|
|
|
|
|
|
|
|
|
|
|
|
|
|
|
|
|
|
|
|
|
|
|
|
|
|
|
|
|
|
|
|
|
|
|
|
|
|
|
|
|
|
|
|
|
|
|
|
|
|
|
|
|
|
|
|
|
|
|
|
|
|
|
|
|
|
|
|
|
|
|
|
|
|
|
|
|
|
|
Please refer to the section entitled “Definitions” for definitions of non-GAAP measures
and other terms we use herein that may not be customary or commonly known.
|
|
|
|
|
|
|
|
|
|
|
|
|
|
|
|
|
|
|
|
|
|
|
|
|
|
|
|
|
|
|
COPT Defense Properties
Summary Description
THE COMPANY
COPT Defense Properties (the “Company” or “COPT Defense”), an S&P MidCap 400 Company, is a self-managed real estate investment trust (“REIT”) focused on owning, operating and developing properties in locations proximate to, or sometimes containing, key U.S. Government (“USG”) defense installations and missions (which we refer to herein as our Defense/IT Portfolio). Our tenants include the USG and their defense contractors, who are primarily engaged in priority national security activities, and who generally require mission-critical and high security property enhancements. The ticker symbol under which our common shares are publicly traded on the New York Stock Exchange is “CDP”. As of March 31, 2024, our Defense/IT Portfolio of 193 properties, including 24 owned through unconsolidated joint ventures, encompassed 22.0 million square feet and was 96.8% leased.
|
|
|
|
|
|
|
|
|
|
|
|
|
|
|
|
|
|
|
|
| MANAGEMENT |
Stephen E. Budorick, President + CEO |
|
INVESTOR RELATIONS |
Venkat Kommineni, VP |
| Britt A. Snider, EVP + COO |
|
443.285.5587 | venkat.kommineni@copt.com |
|
Anthony Mifsud, EVP + CFO |
|
|
|
|
|
Michelle Layne, Manager |
|
|
|
443.285.5452 | michelle.layne@copt.com |
CORPORATE CREDIT RATING
Fitch: BBB- Stable | Moody’s: Baa3 Stable | S&P: BBB- Stable
DISCLOSURE STATEMENT
This supplemental package contains forward-looking statements within the meaning of the Federal securities laws. Forward-looking statements can be identified by the use of words such as “may,” “will,” “should,” “could,” “believe,” “anticipate,” “expect,” “estimate,” “plan” or other comparable terminology. Forward-looking statements are inherently subject to risks and uncertainties, many of which we cannot predict with accuracy and some of which we might not even anticipate. Although we believe that the expectations, estimates and projections reflected in such forward-looking statements are based on reasonable assumptions at the time made, we can give no assurance that these expectations, estimates and projections will be achieved. Future events and actual results may differ materially from those discussed in the forward-looking statements and we undertake no obligation to update or supplement any forward-looking statements. The areas of risk that may affect these expectations, estimates and projections include, but are not limited to, those risks described in Item 1A of our Annual Report on Form 10-K for the year ended December 31, 2023.
COPT Defense Properties
Equity Research Coverage
|
|
|
|
|
|
|
|
|
|
|
|
|
|
|
|
|
|
|
|
|
|
| Firm |
|
Senior Analyst |
|
Phone |
|
Email |
| Bank of America Securities |
|
Camille Bonnel |
|
416.369.2140 |
|
camille.bonnel@bofa.com |
| BTIG |
|
Tom Catherwood |
|
212.738.6410 |
|
tcatherwood@btig.com |
| Citigroup Global Markets |
|
Michael Griffin |
|
212.816.5871 |
|
michael.a.griffin@citi.com |
| Evercore ISI |
|
Steve Sakwa |
|
212.446.9462 |
|
steve.sakwa@evercoreisi.com |
| Green Street |
|
Dylan Burzinski |
|
949.640.8780 |
|
dburzinski@greenstreet.com |
| Jefferies & Co. |
|
Peter Abramowitz |
|
212.336.7241 |
|
pabramowitz@jefferies.com |
| JP Morgan |
|
Tony Paolone |
|
212.622.6682 |
|
anthony.paolone@jpmorgan.com |
| Raymond James |
|
Bill Crow |
|
727.567.2594 |
|
bill.crow@raymondjames.com |
| Truist Securities |
|
Michael Lewis |
|
212.319.5659 |
|
michael.r.lewis@truist.com |
| Wedbush Securities |
|
Richard Anderson |
|
212.938.9949 |
|
richard.anderson@wedbush.com |
| Wells Fargo Securities |
|
Blaine Heck |
|
410.662.2556 |
|
blaine.heck@wellsfargo.com |
With the exception of Green Street, the above-listed firms are those whose analysts publish research material on the Company and whose estimates of our FFO per share can be tracked through FactSet. Any opinions, estimates or forecasts the above analysts make regarding COPT Defense’s future performance are their own and do not represent the views, estimates or forecasts of COPT Defense’s management.
COPT Defense Properties
Selected Financial Summary Data
(in thousands, except per share data)
|
|
|
|
|
|
|
|
|
|
|
|
|
|
|
|
|
|
|
|
|
|
|
|
|
|
|
|
|
|
|
|
|
|
|
|
|
|
|
|
|
|
|
|
|
|
|
|
|
|
|
|
|
|
|
|
|
|
|
|
| |
|
Page |
|
Three Months Ended |
|
|
| SUMMARY OF RESULTS |
|
Refer. |
|
3/31/24 |
|
12/31/23 |
|
9/30/23 |
|
6/30/23 |
|
3/31/23 |
|
|
|
|
| Net income (loss) |
|
7 |
|
$ |
33,671 |
|
|
$ |
34,820 |
|
|
$ |
(221,207) |
|
|
$ |
31,642 |
|
|
$ |
80,398 |
|
|
|
|
|
| NOI from real estate operations |
|
13 |
|
$ |
101,657 |
|
|
$ |
98,656 |
|
|
$ |
96,494 |
|
|
$ |
95,024 |
|
|
$ |
93,903 |
|
|
|
|
|
| Same Property NOI |
|
17 |
|
$ |
95,403 |
|
|
$ |
94,854 |
|
|
$ |
95,039 |
|
|
$ |
94,223 |
|
|
$ |
92,723 |
|
|
|
|
|
| Same Property cash NOI |
|
18 |
|
$ |
91,619 |
|
|
$ |
89,493 |
|
|
$ |
88,793 |
|
|
$ |
87,989 |
|
|
$ |
86,391 |
|
|
|
|
|
| Adjusted EBITDA |
|
11 |
|
$ |
95,841 |
|
|
$ |
93,934 |
|
|
$ |
90,260 |
|
|
$ |
89,044 |
|
|
$ |
87,443 |
|
|
|
|
|
|
|
|
|
|
|
|
|
|
|
|
|
|
|
|
|
|
| FFO per NAREIT |
|
8 |
|
$ |
72,799 |
|
|
$ |
72,360 |
|
|
$ |
70,016 |
|
|
$ |
70,033 |
|
|
$ |
68,816 |
|
|
|
|
|
| Diluted AFFO avail. to common share and unit holders |
|
10 |
|
$ |
59,269 |
|
|
$ |
54,280 |
|
|
$ |
64,122 |
|
|
$ |
46,003 |
|
|
$ |
38,616 |
|
|
|
|
|
| Dividend per common share |
|
N/A |
|
$ |
0.295 |
|
|
$ |
0.285 |
|
|
$ |
0.285 |
|
|
$ |
0.285 |
|
|
$ |
0.285 |
|
|
|
|
|
|
|
|
|
|
|
|
|
|
|
|
|
|
|
|
|
|
| Per share - diluted: |
|
|
|
|
|
|
|
|
|
|
|
|
|
|
|
|
| EPS |
|
9 |
|
$ |
0.29 |
|
|
$ |
0.30 |
|
|
$ |
(1.94) |
|
|
$ |
0.27 |
|
|
$ |
0.70 |
|
|
|
|
|
| FFO - Nareit |
|
9 |
|
$ |
0.62 |
|
|
$ |
0.62 |
|
|
$ |
0.60 |
|
|
$ |
0.60 |
|
|
$ |
0.59 |
|
|
|
|
|
| FFO - as adjusted for comparability |
|
9 |
|
$ |
0.62 |
|
|
$ |
0.62 |
|
|
$ |
0.60 |
|
|
$ |
0.60 |
|
|
$ |
0.59 |
|
|
|
|
|
|
|
|
|
|
|
|
|
|
|
|
|
|
|
|
|
|
| Numerators for diluted per share amounts: |
|
|
|
|
|
|
|
|
|
|
|
|
|
|
|
|
| Diluted EPS |
|
7 |
|
$ |
32,480 |
|
|
$ |
33,552 |
|
|
$ |
(217,179) |
|
|
$ |
30,138 |
|
|
$ |
78,467 |
|
|
|
|
|
| Diluted FFO available to common share and unit holders |
|
8 |
|
$ |
71,892 |
|
|
$ |
70,913 |
|
|
$ |
68,512 |
|
|
$ |
68,323 |
|
|
$ |
67,651 |
|
|
|
|
|
| Diluted FFO available to common share and unit holders, as adjusted for comparability |
|
8 |
|
$ |
71,969 |
|
|
$ |
71,100 |
|
|
$ |
68,593 |
|
|
$ |
68,569 |
|
|
$ |
67,651 |
|
|
|
|
|
|
|
|
|
|
|
|
|
|
|
|
|
|
|
|
|
|
|
|
|
|
|
|
|
|
|
|
|
|
|
|
|
|
|
COPT Defense Properties
Selected Financial Summary Data (continued)
(in thousands, except ratios)
|
|
|
|
|
|
|
|
|
|
|
|
|
|
|
|
|
|
|
|
|
|
|
|
|
|
|
|
|
|
|
|
|
|
|
|
|
|
|
|
|
|
|
| |
|
Page |
|
As of or for Three Months Ended |
|
|
| PAYOUT RATIOS AND CAPITALIZATION |
|
Refer. |
|
3/31/24 |
|
12/31/23 |
|
9/30/23 |
|
6/30/23 |
|
3/31/23 |
|
|
|
|
| GAAP |
|
|
|
|
|
|
|
|
|
|
|
|
|
|
|
|
| Payout ratio: |
|
|
|
|
|
|
|
|
|
|
|
|
|
|
|
|
| Net income |
|
N/A |
|
100.7% |
|
93.7% |
|
N/A |
|
103.1% |
|
40.6% |
|
|
|
|
|
|
|
|
|
|
|
|
|
|
|
|
|
|
|
|
|
| Capitalization and debt ratios: |
|
|
|
|
|
|
|
|
|
|
|
|
|
|
|
|
| Total assets |
|
6 |
|
$ |
4,232,895 |
|
|
$ |
4,246,966 |
|
|
$ |
4,239,257 |
|
|
$ |
4,246,346 |
|
|
$ |
4,177,992 |
|
|
|
|
|
|
|
|
|
|
|
|
|
|
|
|
|
|
|
|
|
|
| Total equity |
|
6 |
|
$ |
1,526,046 |
|
|
$ |
1,523,755 |
|
|
$ |
1,525,873 |
|
|
$ |
1,776,695 |
|
|
$ |
1,768,814 |
|
|
|
|
|
| Debt per balance sheet |
|
6 |
|
$ |
2,416,873 |
|
|
$ |
2,416,287 |
|
|
$ |
2,415,783 |
|
|
$ |
2,176,174 |
|
|
$ |
2,123,012 |
|
|
|
|
|
| Debt to assets |
|
31 |
|
57.1% |
|
56.9% |
|
57.0% |
|
51.2% |
|
50.8% |
|
|
|
|
| Net income to interest expense ratio |
|
31 |
|
1.6x |
|
1.7x |
|
N/A |
|
1.9x |
|
4.9x |
|
|
|
|
| Debt to net income ratio |
|
31 |
|
17.9x |
|
17.3x |
|
N/A |
|
17.2x |
|
6.6x |
|
|
|
|
|
|
|
|
|
|
|
|
|
|
|
|
|
|
|
|
|
| Non-GAAP |
|
|
|
|
|
|
|
|
|
|
|
|
|
|
|
|
| Payout ratios: |
|
|
|
|
|
|
|
|
|
|
|
|
|
|
|
|
| Diluted FFO |
|
N/A |
|
46.8% |
|
45.7% |
|
47.3% |
|
47.5% |
|
47.9% |
|
|
|
|
| Diluted FFO - as adjusted for comparability |
|
N/A |
|
46.7% |
|
45.6% |
|
47.3% |
|
47.3% |
|
47.9% |
|
|
|
|
| Diluted AFFO |
|
N/A |
|
56.8% |
|
59.7% |
|
50.6% |
|
70.5% |
|
83.9% |
|
|
|
|
|
|
|
|
|
|
|
|
|
|
|
|
|
|
|
|
|
|
|
|
|
|
|
|
|
|
|
|
|
|
|
|
|
|
| Capitalization and debt ratios: |
|
|
|
|
|
|
|
|
|
|
|
|
|
|
|
|
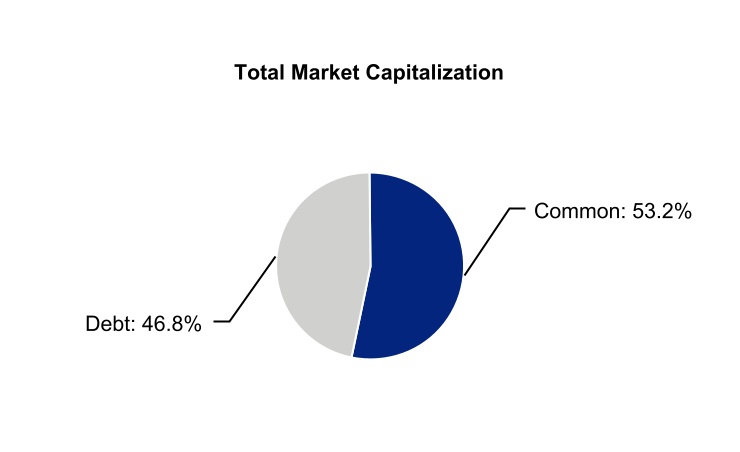
| Total Market Capitalization |
|
28 |
|
$ |
5,218,681 |
|
|
$ |
5,377,815 |
|
|
$ |
5,172,058 |
|
|
$ |
4,914,516 |
|
|
$ |
4,856,761 |
|
|
|
|
|
| Total Equity Market Capitalization |
|
28 |
|
$ |
2,774,450 |
|
|
$ |
2,932,815 |
|
|
$ |
2,726,295 |
|
|
$ |
2,717,000 |
|
|
$ |
2,711,499 |
|
|
|
|
|
| Net debt |
|
36 |
|
$ |
2,372,747 |
|
|
$ |
2,328,941 |
|
|
$ |
2,293,005 |
|
|
$ |
2,234,633 |
|
|
$ |
2,181,408 |
|
|
|
|
|
| Net debt to adjusted book |
|
31 |
|
40.9% |
|
40.6% |
|
40.5% |
|
38.4% |
|
38.1% |
|
|
|
|
|
|
|
|
|
|
|
|
|
|
|
|
|
|
|
|
|
|
|
|
|
|
|
|
|
|
|
|
|
|
|
|
|
|
|
|
|
|
|
|
|
|
|
|
|
|
|
|
|
|
|
| Adjusted EBITDA fixed charge coverage ratio |
|
31 |
|
4.5x |
|
4.4x |
|
4.6x |
|
4.9x |
|
5.0x |
|
|
|
|
|
|
|
|
|
|
|
|
|
|
|
|
|
|
|
|
|
| Net debt to in-place adj. EBITDA ratio |
|
31 |
|
6.1x |
|
6.1x |
|
6.2x |
|
6.3x |
|
6.2x |
|
|
|
|
|
|
|
|
|
|
|
|
|
|
|
|
|
|
|
|
|
| Net debt adjusted for fully-leased development to in-place adj. EBITDA ratio |
|
31 |
|
6.0x |
|
6.0x |
|
5.9x |
|
5.7x |
|
5.8x |
|
|
|
|
|
|
|
|
|
|
|
|
|
|
|
|
|
|
|
|
|
COPT Defense Properties
Selected Portfolio Data (1)
|
|
|
|
|
|
|
|
|
|
|
|
|
|
|
|
|
|
|
|
|
|
|
|
|
|
|
|
|
|
|
| |
3/31/24 |
|
12/31/23 |
|
9/30/23 |
|
6/30/23 |
|
3/31/23 |
|
| # of Properties |
|
|
|
|
|
|
|
|
|
|
| Total Portfolio |
201 |
|
198 |
|
196 |
|
194 |
|
194 |
|
| Consolidated Portfolio |
177 |
|
174 |
|
172 |
|
170 |
|
170 |
|
| Defense/IT Portfolio |
193 |
|
190 |
|
188 |
|
186 |
|
186 |
|
| Same Property |
189 |
|
189 |
|
189 |
|
189 |
|
189 |
|
|
|
|
|
|
|
|
|
|
|
|
| % Occupied |
|
|
|
|
|
|
|
|
|
|
| Total Portfolio |
93.6 |
% |
|
94.2 |
% |
|
94.1 |
% |
|
93.4 |
% |
|
92.8 |
% |
|
| Consolidated Portfolio |
92.2 |
% |
|
92.9 |
% |
|
92.7 |
% |
|
91.9 |
% |
|
91.2 |
% |
|
| Defense/IT Portfolio |
95.6 |
% |
|
96.2 |
% |
|
95.9 |
% |
|
95.3 |
% |
|
94.4 |
% |
|
| Same Property |
93.5 |
% |
|
93.8 |
% |
|
93.8 |
% |
|
93.3 |
% |
|
92.6 |
% |
|
|
|
|
|
|
|
|
|
|
|
|
| % Leased |
|
|
|
|
|
|
|
|
|
|
| Total Portfolio |
94.9 |
% |
|
95.3 |
% |
|
95.1 |
% |
|
94.9 |
% |
|
95.0 |
% |
|
| Consolidated Portfolio |
93.8 |
% |
|
94.3 |
% |
|
94.0 |
% |
|
93.7 |
% |
|
93.9 |
% |
|
| Defense/IT Portfolio |
96.8 |
% |
|
97.2 |
% |
|
97.0 |
% |
|
96.8 |
% |
|
96.7 |
% |
|
| Same Property |
95.0 |
% |
|
95.1 |
% |
|
94.9 |
% |
|
94.7 |
% |
|
94.9 |
% |
|
|
|
|
|
|
|
|
|
|
|
|
| Square Feet (in thousands) |
|
|
|
|
|
|
|
|
|
|
| Total Portfolio |
24,137 |
|
23,859 |
|
23,479 |
|
23,035 |
|
23,020 |
|
| Consolidated Portfolio |
19,841 |
|
19,563 |
|
19,184 |
|
18,740 |
|
18,725 |
|
| Defense/IT Portfolio |
21,993 |
|
21,719 |
|
21,339 |
|
20,895 |
|
20,878 |
|
| Same Property |
22,227 |
|
22,227 |
|
22,227 |
|
22,227 |
|
22,227 |
|
|
|
|
|
|
|
|
|
|
|
|
(1)Except for the Consolidated Portfolio, includes properties owned through unconsolidated real estate joint ventures (see page 33).
COPT Defense Properties
Consolidated Balance Sheets
(in thousands)
|
|
|
|
|
|
|
|
|
|
|
|
|
|
|
|
|
|
|
|
|
|
|
|
|
|
|
|
|
|
| |
3/31/24 |
|
12/31/23 |
|
9/30/23 |
|
6/30/23 |
|
3/31/23 |
| Assets |
|
|
|
|
|
|
|
|
|
| Properties, net: |
|
|
|
|
|
|
|
|
|
| Operating properties, net |
$ |
3,272,452 |
|
|
$ |
3,246,806 |
|
|
$ |
3,148,434 |
|
|
$ |
3,272,670 |
|
|
$ |
3,272,873 |
|
| Development and redevelopment in progress, including land (1) |
76,931 |
|
|
82,972 |
|
|
141,854 |
|
|
206,130 |
|
|
151,910 |
|
| Land held (1) |
168,495 |
|
|
173,900 |
|
|
177,909 |
|
|
193,435 |
|
|
189,292 |
|
| Total properties, net |
3,517,878 |
|
|
3,503,678 |
|
|
3,468,197 |
|
|
3,672,235 |
|
|
3,614,075 |
|
| Property - operating right-of-use assets |
40,368 |
|
|
41,296 |
|
|
40,487 |
|
|
41,652 |
|
|
42,808 |
|
|
|
|
|
|
|
|
|
|
|
|
|
|
|
|
|
|
|
|
|
| Cash and cash equivalents |
123,144 |
|
|
167,820 |
|
|
204,238 |
|
|
14,273 |
|
|
15,199 |
|
| Investment in unconsolidated real estate joint ventures |
40,597 |
|
|
41,052 |
|
|
41,495 |
|
|
41,928 |
|
|
42,279 |
|
| Accounts receivable, net |
50,088 |
|
|
48,946 |
|
|
40,211 |
|
|
47,363 |
|
|
46,149 |
|
| Deferred rent receivable |
153,788 |
|
|
149,237 |
|
|
142,041 |
|
|
136,382 |
|
|
130,153 |
|
| Lease incentives, net |
61,150 |
|
|
61,331 |
|
|
60,506 |
|
|
59,541 |
|
|
49,679 |
|
| Deferred leasing costs, net |
70,902 |
|
|
70,057 |
|
|
68,033 |
|
|
69,218 |
|
|
68,930 |
|
| Investing receivables, net |
82,523 |
|
|
81,512 |
|
|
87,535 |
|
|
86,708 |
|
|
85,499 |
|
|
|
|
|
|
|
|
|
|
|
|
|
|
|
|
|
|
|
|
|
| Prepaid expenses and other assets, net |
92,457 |
|
|
82,037 |
|
|
86,514 |
|
|
77,046 |
|
|
83,221 |
|
| Total assets |
$ |
4,232,895 |
|
|
$ |
4,246,966 |
|
|
$ |
4,239,257 |
|
|
$ |
4,246,346 |
|
|
$ |
4,177,992 |
|
| Liabilities and equity |
|
|
|
|
|
|
|
|
|
| Liabilities: |
|
|
|
|
|
|
|
|
|
| Debt |
$ |
2,416,873 |
|
|
$ |
2,416,287 |
|
|
$ |
2,415,783 |
|
|
$ |
2,176,174 |
|
|
$ |
2,123,012 |
|
| Accounts payable and accrued expenses |
111,981 |
|
|
133,315 |
|
|
135,605 |
|
|
135,784 |
|
|
128,509 |
|
| Rents received in advance and security deposits |
37,557 |
|
|
35,409 |
|
|
32,063 |
|
|
32,021 |
|
|
34,653 |
|
| Dividends and distributions payable |
33,906 |
|
|
32,644 |
|
|
32,645 |
|
|
32,636 |
|
|
32,630 |
|
| Deferred revenue associated with operating leases |
34,019 |
|
|
29,049 |
|
|
24,590 |
|
|
9,199 |
|
|
9,022 |
|
|
|
|
|
|
|
|
|
|
|
| Property - operating lease liabilities |
33,141 |
|
|
33,931 |
|
|
32,940 |
|
|
33,923 |
|
|
34,896 |
|
|
|
|
|
|
|
|
|
|
|
|
|
|
|
|
|
|
|
|
|
| Other liabilities |
16,406 |
|
|
18,996 |
|
|
17,936 |
|
|
27,699 |
|
|
21,008 |
|
| Total liabilities |
2,683,883 |
|
|
2,699,631 |
|
|
2,691,562 |
|
|
2,447,436 |
|
|
2,383,730 |
|
| Redeemable noncontrolling interests |
22,966 |
|
|
23,580 |
|
|
21,822 |
|
|
22,215 |
|
|
25,448 |
|
| Equity: |
|
|
|
|
|
|
|
|
|
| COPT Defense’s shareholders’ equity: |
|
|
|
|
|
|
|
|
|
|
|
|
|
|
|
|
|
|
|
| Common shares |
1,126 |
|
|
1,126 |
|
|
1,125 |
|
|
1,125 |
|
|
1,125 |
|
| Additional paid-in capital |
2,487,468 |
|
|
2,489,989 |
|
|
2,489,717 |
|
|
2,486,996 |
|
|
2,484,501 |
|
| Cumulative distributions in excess of net income |
(1,009,964) |
|
|
(1,009,318) |
|
|
(1,010,885) |
|
|
(762,617) |
|
|
(760,820) |
|
| Accumulated other comprehensive income |
3,849 |
|
|
2,115 |
|
|
6,094 |
|
|
5,224 |
|
|
1,353 |
|
| Total COPT Defense’s shareholders’ equity |
1,482,479 |
|
|
1,483,912 |
|
|
1,486,051 |
|
|
1,730,728 |
|
|
1,726,159 |
|
| Noncontrolling interests in subsidiaries: |
|
|
|
|
|
|
|
|
|
| Common units in the Operating Partnership |
29,214 |
|
|
25,502 |
|
|
25,337 |
|
|
29,563 |
|
|
29,268 |
|
|
|
|
|
|
|
|
|
|
|
| Other consolidated entities |
14,353 |
|
|
14,341 |
|
|
14,485 |
|
|
16,404 |
|
|
13,387 |
|
| Total noncontrolling interests in subsidiaries |
43,567 |
|
|
39,843 |
|
|
39,822 |
|
|
45,967 |
|
|
42,655 |
|
| Total equity |
1,526,046 |
|
|
1,523,755 |
|
|
1,525,873 |
|
|
1,776,695 |
|
|
1,768,814 |
|
| Total liabilities, redeemable noncontrolling interests and equity |
$ |
4,232,895 |
|
|
$ |
4,246,966 |
|
|
$ |
4,239,257 |
|
|
$ |
4,246,346 |
|
|
$ |
4,177,992 |
|
(1)Refer to pages 25 and 27 for detail.
COPT Defense Properties
Consolidated Statements of Operations
(in thousands)
|
|
|
|
|
|
|
|
|
|
|
|
|
|
|
|
|
|
|
|
|
|
|
|
|
|
|
|
|
|
|
|
|
|
| |
Three Months Ended |
|
|
| |
3/31/24 |
|
12/31/23 |
|
9/30/23 |
|
6/30/23 |
|
3/31/23 |
|
|
|
|
| Revenues |
|
|
|
|
|
|
|
|
|
|
|
|
|
| Lease revenue |
$ |
165,433 |
|
|
$ |
160,337 |
|
|
$ |
155,268 |
|
|
$ |
153,682 |
|
|
$ |
150,560 |
|
|
|
|
|
| Other property revenue |
1,230 |
|
|
1,225 |
|
|
1,339 |
|
|
1,271 |
|
|
1,121 |
|
|
|
|
|
| Construction contract and other service revenues |
26,603 |
|
|
18,167 |
|
|
11,949 |
|
|
14,243 |
|
|
15,820 |
|
|
|
|
|
| Total revenues |
193,266 |
|
|
179,729 |
|
|
168,556 |
|
|
169,196 |
|
|
167,501 |
|
|
|
|
|
| Operating expenses |
|
|
|
|
|
|
|
|
|
|
|
|
|
| Property operating expenses |
66,746 |
|
|
64,577 |
|
|
61,788 |
|
|
61,600 |
|
|
59,420 |
|
|
|
|
|
| Depreciation and amortization associated with real estate operations |
38,351 |
|
|
36,735 |
|
|
37,620 |
|
|
37,600 |
|
|
36,995 |
|
|
|
|
|
| Construction contract and other service expenses |
26,007 |
|
|
17,167 |
|
|
11,493 |
|
|
13,555 |
|
|
15,201 |
|
|
|
|
|
| Impairment losses |
— |
|
|
— |
|
|
252,797 |
|
|
— |
|
|
— |
|
|
|
|
|
| General and administrative expenses |
8,378 |
|
|
8,240 |
|
|
7,582 |
|
|
7,287 |
|
|
7,996 |
|
|
|
|
|
| Leasing expenses |
2,187 |
|
|
2,308 |
|
|
2,280 |
|
|
2,345 |
|
|
1,999 |
|
|
|
|
|
| Business development expenses and land carry costs |
1,182 |
|
|
797 |
|
|
714 |
|
|
726 |
|
|
495 |
|
|
|
|
|
| Total operating expenses |
142,851 |
|
|
129,824 |
|
|
374,274 |
|
|
123,113 |
|
|
122,106 |
|
|
|
|
|
| Interest expense |
(20,767) |
|
|
(20,383) |
|
|
(17,798) |
|
|
(16,519) |
|
|
(16,442) |
|
|
|
|
|
| Interest and other income, net |
4,122 |
|
|
5,659 |
|
|
2,529 |
|
|
2,143 |
|
|
2,256 |
|
|
|
|
|
| Gain on sales of real estate |
— |
|
|
— |
|
|
— |
|
|
14 |
|
|
49,378 |
|
|
|
|
|
|
|
|
|
|
|
|
|
|
|
|
|
|
|
|
|
|
|
|
|
|
|
|
|
|
|
|
|
|
|
|
|
|
|
|
|
|
|
|
|
|
|
| Income (loss) before equity in income (loss) of unconsolidated entities and income taxes |
33,770 |
|
|
35,181 |
|
|
(220,987) |
|
|
31,721 |
|
|
80,587 |
|
|
|
|
|
| Equity in income (loss) of unconsolidated entities |
69 |
|
|
(240) |
|
|
(68) |
|
|
111 |
|
|
(64) |
|
|
|
|
|
| Income tax expense |
(168) |
|
|
(121) |
|
|
(152) |
|
|
(190) |
|
|
(125) |
|
|
|
|
|
|
|
|
|
|
|
|
|
|
|
|
|
|
|
|
|
|
|
|
|
|
|
|
|
|
|
|
|
| Net income (loss) |
33,671 |
|
|
34,820 |
|
|
(221,207) |
|
|
31,642 |
|
|
80,398 |
|
|
|
|
|
| Net (income) loss attributable to noncontrolling interests: |
|
|
|
|
|
|
|
|
|
|
|
|
|
| Common units in the Operating Partnership |
(608) |
|
|
(576) |
|
|
3,691 |
|
|
(516) |
|
|
(1,293) |
|
|
|
|
|
|
|
|
|
|
|
|
|
|
|
|
|
|
|
| Other consolidated entities |
(454) |
|
|
(592) |
|
|
1,329 |
|
|
(839) |
|
|
(326) |
|
|
|
|
|
|
|
|
|
|
|
|
|
|
|
|
|
|
|
|
|
|
|
|
|
|
|
|
|
|
|
|
|
|
|
|
|
|
|
|
|
|
|
|
|
|
|
| Net income (loss) attributable to common shareholders |
$ |
32,609 |
|
|
$ |
33,652 |
|
|
$ |
(216,187) |
|
|
$ |
30,287 |
|
|
$ |
78,779 |
|
|
|
|
|
| Amount allocable to share-based compensation awards |
(129) |
|
|
(100) |
|
|
(992) |
|
|
(98) |
|
|
(248) |
|
|
|
|
|
| Redeemable noncontrolling interests |
— |
|
|
— |
|
|
— |
|
|
(51) |
|
|
(64) |
|
|
|
|
|
|
|
|
|
|
|
|
|
|
|
|
|
|
|
|
|
|
|
|
|
|
|
|
|
|
|
|
|
| Numerator for diluted EPS |
$ |
32,480 |
|
|
$ |
33,552 |
|
|
$ |
(217,179) |
|
|
$ |
30,138 |
|
|
$ |
78,467 |
|
|
|
|
|
COPT Defense Properties
Funds from Operations
(in thousands)
|
|
|
|
|
|
|
|
|
|
|
|
|
|
|
|
|
|
|
|
|
|
|
|
|
|
|
|
|
|
|
|
|
|
| |
Three Months Ended |
|
|
| |
3/31/24 |
|
12/31/23 |
|
9/30/23 |
|
6/30/23 |
|
3/31/23 |
|
|
|
|
| Net income (loss) |
$ |
33,671 |
|
|
$ |
34,820 |
|
|
$ |
(221,207) |
|
|
$ |
31,642 |
|
|
$ |
80,398 |
|
|
|
|
|
| Real estate-related depreciation and amortization |
38,351 |
|
|
36,735 |
|
|
37,620 |
|
|
37,600 |
|
|
36,995 |
|
|
|
|
|
| Impairment losses on real estate |
— |
|
|
— |
|
|
252,797 |
|
|
— |
|
|
— |
|
|
|
|
|
| Gain on sales of real estate |
— |
|
|
— |
|
|
— |
|
|
(14) |
|
|
(49,378) |
|
|
|
|
|
| Depreciation and amortization on unconsolidated real estate JVs (1) |
777 |
|
|
805 |
|
|
806 |
|
|
805 |
|
|
801 |
|
|
|
|
|
|
|
|
|
|
|
|
|
|
|
|
|
|
|
|
|
|
|
|
|
|
|
|
|
|
|
|
|
| FFO - per Nareit (2) |
72,799 |
|
|
72,360 |
|
|
70,016 |
|
|
70,033 |
|
|
68,816 |
|
|
|
|
|
|
|
|
|
|
|
|
|
|
|
|
|
|
|
|
|
|
|
|
|
|
|
|
|
|
|
|
|
|
|
|
|
|
|
|
|
|
|
|
|
|
|
| FFO allocable to other noncontrolling interests (3) |
(836) |
|
|
(972) |
|
|
(1,059) |
|
|
(1,239) |
|
|
(708) |
|
|
|
|
|
| Basic FFO allocable to share-based compensation awards |
(587) |
|
|
(513) |
|
|
(481) |
|
|
(480) |
|
|
(466) |
|
|
|
|
|
| Basic FFO available to common share and common unit holders (2) |
71,376 |
|
|
70,875 |
|
|
68,476 |
|
|
68,314 |
|
|
67,642 |
|
|
|
|
|
|
|
|
|
|
|
|
|
|
|
|
|
|
|
| Redeemable noncontrolling interests |
469 |
|
|
— |
|
|
— |
|
|
(28) |
|
|
(30) |
|
|
|
|
|
| Diluted FFO adjustments allocable to share-based compensation awards |
47 |
|
|
38 |
|
|
36 |
|
|
37 |
|
|
39 |
|
|
|
|
|
| Diluted FFO available to common share and common unit holders - per Nareit (2) |
71,892 |
|
|
70,913 |
|
|
68,512 |
|
|
68,323 |
|
|
67,651 |
|
|
|
|
|
|
|
|
|
|
|
|
|
|
|
|
|
|
|
|
|
|
|
|
|
|
|
|
|
|
|
|
|
|
|
|
|
|
|
|
|
|
|
|
|
|
|
|
|
|
|
|
|
|
|
|
|
|
|
|
|
|
|
|
|
|
|
|
|
|
|
|
|
|
|
|
|
|
|
|
|
|
|
|
|
|
|
|
|
| Executive transition costs |
77 |
|
|
188 |
|
|
82 |
|
|
248 |
|
|
— |
|
|
|
|
|
|
|
|
|
|
|
|
|
|
|
|
|
|
|
|
|
|
|
|
|
|
|
|
|
|
|
|
|
|
|
|
|
|
|
|
|
|
|
|
|
|
|
|
|
|
|
|
|
|
|
|
|
|
|
|
|
| Diluted FFO comparability adjustments allocable to share-based compensation awards |
— |
|
|
(1) |
|
|
(1) |
|
|
(2) |
|
|
— |
|
|
|
|
|
| Diluted FFO available to common share and common unit holders, as adjusted for comparability (2) |
$ |
71,969 |
|
|
$ |
71,100 |
|
|
$ |
68,593 |
|
|
$ |
68,569 |
|
|
$ |
67,651 |
|
|
|
|
|
(1)See page 33 for additional disclosure regarding our unconsolidated real estate JVs.
(2)Refer to the section entitled “Definitions” for a definition of this measure.
(3)Pertains to noncontrolling interests in consolidated real estate JVs reported on page 32.
COPT Defense Properties
Diluted Share + Unit Computations
(in thousands, except per share data)
|
|
|
|
|
|
|
|
|
|
|
|
|
|
|
|
|
|
|
|
|
|
|
|
|
|
|
|
|
|
|
|
|
|
| |
Three Months Ended |
|
|
| |
3/31/24 |
|
12/31/23 |
|
9/30/23 |
|
6/30/23 |
|
3/31/23 |
|
|
|
|
| EPS Denominator: |
|
|
|
|
|
|
|
|
|
|
|
|
|
| Weighted average common shares - basic |
112,231 |
|
|
112,199 |
|
|
112,196 |
|
|
112,188 |
|
|
112,127 |
|
|
|
|
|
| Dilutive effect of share-based compensation awards |
509 |
|
|
432 |
|
|
— |
|
|
426 |
|
|
410 |
|
|
|
|
|
|
|
|
|
|
|
|
|
|
|
|
|
|
|
| Dilutive effect of redeemable noncontrolling interests |
— |
|
|
— |
|
|
— |
|
|
62 |
|
|
91 |
|
|
|
|
|
|
|
|
|
|
|
|
|
|
|
|
|
|
|
|
|
|
|
|
|
|
|
|
|
|
|
|
|
| Weighted average common shares - diluted |
112,740 |
|
|
112,631 |
|
|
112,196 |
|
|
112,676 |
|
|
112,628 |
|
|
|
|
|
| Diluted EPS |
$ |
0.29 |
|
|
$ |
0.30 |
|
|
$ |
(1.94) |
|
|
$ |
0.27 |
|
|
$ |
0.70 |
|
|
|
|
|
|
|
|
|
|
|
|
|
|
|
|
|
|
|
| Weighted Average Shares for period ended: |
|
|
|
|
|
|
|
|
|
|
|
|
|
| Common shares |
112,231 |
|
|
112,199 |
|
|
112,196 |
|
|
112,188 |
|
|
112,127 |
|
|
|
|
|
| Dilutive effect of share-based compensation awards |
509 |
|
|
432 |
|
|
429 |
|
|
426 |
|
|
410 |
|
|
|
|
|
| Common units |
1,625 |
|
|
1,514 |
|
|
1,520 |
|
|
1,514 |
|
|
1,489 |
|
|
|
|
|
|
|
|
|
|
|
|
|
|
|
|
|
|
|
|
|
|
|
|
|
|
|
|
|
|
|
|
|
| Redeemable noncontrolling interests |
947 |
|
|
— |
|
|
— |
|
|
62 |
|
|
91 |
|
|
|
|
|
|
|
|
|
|
|
|
|
|
|
|
|
|
|
|
|
|
|
|
|
|
|
|
|
|
|
|
|
|
|
|
|
|
|
|
|
|
|
|
|
|
|
|
|
|
|
|
|
|
|
|
|
|
|
|
|
| Denominator for diluted FFO per share and as adjusted for comparability |
115,312 |
|
|
114,145 |
|
|
114,145 |
|
|
114,190 |
|
|
114,117 |
|
|
|
|
|
| Weighted average common units |
(1,625) |
|
|
(1,514) |
|
|
(1,520) |
|
|
(1,514) |
|
|
(1,489) |
|
|
|
|
|
| Redeemable noncontrolling interests |
(947) |
|
|
— |
|
|
— |
|
|
— |
|
|
— |
|
|
|
|
|
| Dilutive effect of additional share-based compensation awards |
— |
|
|
— |
|
|
(429) |
|
|
— |
|
|
— |
|
|
|
|
|
|
|
|
|
|
|
|
|
|
|
|
|
|
|
| Denominator for diluted EPS |
112,740 |
|
|
112,631 |
|
|
112,196 |
|
|
112,676 |
|
|
112,628 |
|
|
|
|
|
| Diluted FFO per share - Nareit (1) |
$ |
0.62 |
|
|
$ |
0.62 |
|
|
$ |
0.60 |
|
|
$ |
0.60 |
|
|
$ |
0.59 |
|
|
|
|
|
| Diluted FFO per share - as adjusted for comparability (1) |
$ |
0.62 |
|
|
$ |
0.62 |
|
|
$ |
0.60 |
|
|
$ |
0.60 |
|
|
$ |
0.59 |
|
|
|
|
|
(1)Refer to the section entitled “Definitions” for a definition of this measure.
COPT Defense Properties
Adjusted Funds from Operations
(in thousands)
|
|
|
|
|
|
|
|
|
|
|
|
|
|
|
|
|
|
|
|
|
|
|
|
|
|
|
|
|
|
|
|
|
|
| |
Three Months Ended |
|
|
| |
3/31/24 |
|
12/31/23 |
|
9/30/23 |
|
6/30/23 |
|
3/31/23 |
|
|
|
|
| Diluted FFO available to common share and common unit holders, as adjusted for comparability (1) |
$ |
71,969 |
|
|
$ |
71,100 |
|
|
$ |
68,593 |
|
|
$ |
68,569 |
|
|
$ |
67,651 |
|
|
|
|
|
| Straight line rent adjustments and lease incentive amortization |
3,473 |
|
|
313 |
|
|
12,882 |
|
|
(3,161) |
|
|
(3,516) |
|
|
|
|
|
| Amortization of intangibles and other assets included in NOI |
122 |
|
|
26 |
|
|
26 |
|
|
17 |
|
|
(19) |
|
|
|
|
|
| Share-based compensation, net of amounts capitalized |
2,645 |
|
|
2,318 |
|
|
2,280 |
|
|
2,213 |
|
|
1,733 |
|
|
|
|
|
| Amortization of deferred financing costs |
685 |
|
|
681 |
|
|
639 |
|
|
628 |
|
|
632 |
|
|
|
|
|
| Amortization of net debt discounts, net of amounts capitalized |
1,014 |
|
|
1,004 |
|
|
750 |
|
|
622 |
|
|
618 |
|
|
|
|
|
|
|
|
|
|
|
|
|
|
|
|
|
|
|
| Replacement capital expenditures (1) |
(20,776) |
|
|
(21,498) |
|
|
(21,122) |
|
|
(22,664) |
|
|
(28,210) |
|
|
|
|
|
| Other |
137 |
|
|
336 |
|
|
74 |
|
|
(221) |
|
|
(273) |
|
|
|
|
|
| Diluted AFFO available to common share and common unit holders (“diluted AFFO”) (1) |
$ |
59,269 |
|
|
$ |
54,280 |
|
|
$ |
64,122 |
|
|
$ |
46,003 |
|
|
$ |
38,616 |
|
|
|
|
|
|
|
|
|
|
|
|
|
|
|
|
|
|
|
| Replacement capital expenditures (1) |
|
|
|
|
|
|
|
|
|
|
|
|
|
| Tenant improvements and incentives |
$ |
12,776 |
|
|
$ |
7,850 |
|
|
$ |
14,457 |
|
|
$ |
32,619 |
|
|
$ |
19,986 |
|
|
|
|
|
| Building improvements |
4,953 |
|
|
14,762 |
|
|
6,307 |
|
|
2,766 |
|
|
2,141 |
|
|
|
|
|
| Leasing costs |
3,590 |
|
|
2,440 |
|
|
1,902 |
|
|
3,542 |
|
|
1,750 |
|
|
|
|
|
| Net additions to (exclusions from) tenant improvements and incentives |
316 |
|
|
(189) |
|
|
(813) |
|
|
(16,007) |
|
|
4,839 |
|
|
|
|
|
| Excluded building improvements and leasing costs |
(859) |
|
|
(3,365) |
|
|
(731) |
|
|
(256) |
|
|
(506) |
|
|
|
|
|
|
|
|
|
|
|
|
|
|
|
|
|
|
|
|
|
|
|
|
|
|
|
|
|
|
|
|
|
| Replacement capital expenditures |
$ |
20,776 |
|
|
$ |
21,498 |
|
|
$ |
21,122 |
|
|
$ |
22,664 |
|
|
$ |
28,210 |
|
|
|
|
|
(1)Refer to the section entitled “Definitions” for a definition of this measure.
COPT Defense Properties
EBITDAre + Adjusted EBITDA
(in thousands)
|
|
|
|
|
|
|
|
|
|
|
|
|
|
|
|
|
|
|
|
|
|
|
|
|
|
|
|
|
|
|
|
|
|
| |
Three Months Ended |
|
|
| |
3/31/24 |
|
12/31/23 |
|
9/30/23 |
|
6/30/23 |
|
3/31/23 |
|
|
|
|
| Net income (loss) |
$ |
33,671 |
|
|
$ |
34,820 |
|
|
$ |
(221,207) |
|
|
$ |
31,642 |
|
|
$ |
80,398 |
|
|
|
|
|
| Interest expense |
20,767 |
|
|
20,383 |
|
|
17,798 |
|
|
16,519 |
|
|
16,442 |
|
|
|
|
|
| Income tax expense |
168 |
|
|
121 |
|
|
152 |
|
|
190 |
|
|
125 |
|
|
|
|
|
| Real estate-related depreciation and amortization |
38,351 |
|
|
36,735 |
|
|
37,620 |
|
|
37,600 |
|
|
36,995 |
|
|
|
|
|
| Other depreciation and amortization |
608 |
|
|
619 |
|
|
615 |
|
|
609 |
|
|
602 |
|
|
|
|
|
| Impairment losses on real estate |
— |
|
|
— |
|
|
252,797 |
|
|
— |
|
|
— |
|
|
|
|
|
| Gain on sales of real estate |
— |
|
|
— |
|
|
— |
|
|
(14) |
|
|
(49,378) |
|
|
|
|
|
|
|
|
|
|
|
|
|
|
|
|
|
|
|
| Adjustments from unconsolidated real estate JVs |
1,671 |
|
|
1,911 |
|
|
1,743 |
|
|
1,559 |
|
|
1,704 |
|
|
|
|
|
| EBITDAre (1) |
95,236 |
|
|
94,589 |
|
|
89,518 |
|
|
88,105 |
|
|
86,888 |
|
|
|
|
|
| Credit loss expense (recoveries) |
22 |
|
|
(1,288) |
|
|
372 |
|
|
238 |
|
|
67 |
|
|
|
|
|
| Business development expenses |
630 |
|
|
445 |
|
|
313 |
|
|
394 |
|
|
241 |
|
|
|
|
|
|
|
|
|
|
|
|
|
|
|
|
|
|
|
|
|
|
|
|
|
|
|
|
|
|
|
|
|
| Executive transition costs |
430 |
|
|
188 |
|
|
82 |
|
|
307 |
|
|
247 |
|
|
|
|
|
|
|
|
|
|
|
|
|
|
|
|
|
|
|
|
|
|
|
|
|
|
|
|
|
|
|
|
|
|
|
|
|
|
|
|
|
|
|
|
|
|
|
| Net gain on other investments |
(477) |
|
|
— |
|
|
(25) |
|
|
— |
|
|
— |
|
|
|
|
|
| Adjusted EBITDA (1) |
95,841 |
|
|
93,934 |
|
|
90,260 |
|
|
89,044 |
|
|
87,443 |
|
|
|
|
|
| Pro forma NOI adjustment for property changes within period |
813 |
|
|
1,341 |
|
|
1,647 |
|
|
56 |
|
|
(318) |
|
|
|
|
|
| Change in collectability of deferred rental revenue |
— |
|
|
(198) |
|
|
— |
|
|
28 |
|
|
899 |
|
|
|
|
|
|
|
|
|
|
|
|
|
|
|
|
|
|
|
| In-place adjusted EBITDA (1) |
$ |
96,654 |
|
|
$ |
95,077 |
|
|
$ |
91,907 |
|
|
$ |
89,128 |
|
|
$ |
88,024 |
|
|
|
|
|
|
|
|
|
|
|
|
|
|
|
|
|
|
|
|
|
|
|
|
|
|
|
|
|
|
|
|
|
(1)Refer to the section entitled “Definitions” for a definition of this measure.
COPT Defense Properties
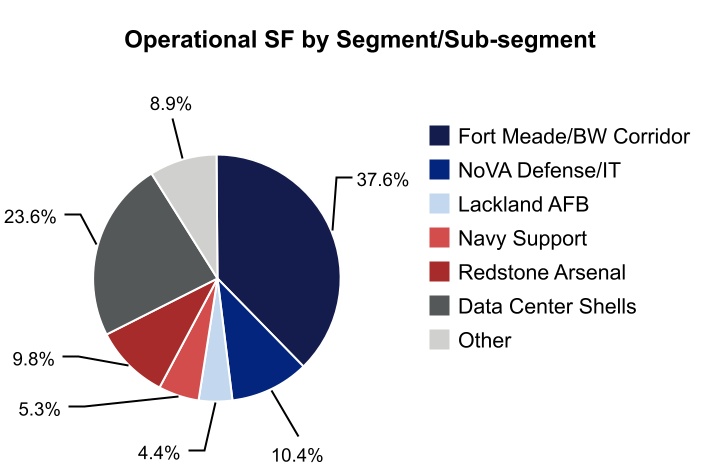
Properties by Segment - 3/31/24
(square feet in thousands)
|
|
|
|
|
|
|
|
|
|
|
|
|
|
|
|
|
|
|
|
|
|
|
|
|
|
|
|
|
# of
Properties |
|
Operational
Square Feet |
|
% Occupied |
|
% Leased |
|
|
|
|
|
|
|
|
|
| Defense/IT Portfolio: |
|
|
|
|
|
|
|
|
| Fort Meade/Baltimore Washington (“BW”) Corridor: |
|
|
|
|
|
|
|
|
| National Business Park |
|
34 |
|
|
4,292 |
|
|
99.1% |
|
99.1% |
| Howard County |
|
36 |
|
|
3,064 |
|
|
91.4% |
|
92.8% |
| Other |
|
23 |
|
|
1,725 |
|
|
92.9% |
|
96.5% |
| Total Fort Meade/BW Corridor |
|
93 |
|
|
9,081 |
|
|
95.3% |
|
96.5% |
| Northern Virginia (“NoVA”) Defense/IT |
|
16 |
|
|
2,500 |
|
|
88.2% |
|
92.6% |
| Lackland AFB (San Antonio, Texas) |
|
8 |
|
|
1,062 |
|
|
100.0% |
|
100.0% |
| Navy Support |
|
22 |
|
|
1,273 |
|
|
85.9% |
|
86.2% |
| Redstone Arsenal (Huntsville, Alabama) |
|
24 |
|
|
2,374 |
|
|
97.4% |
|
98.6% |
| Data Center Shells: |
|
|
|
|
|
|
|
|
| Consolidated Properties |
|
6 |
|
|
1,408 |
|
|
100.0% |
|
100.0% |
| Unconsolidated JV Properties (1) |
|
24 |
|
|
4,295 |
|
|
100.0% |
|
100.0% |
| Total Defense/IT Portfolio |
|
193 |
|
|
21,993 |
|
|
95.6% |
|
96.8% |
|
|
|
|
|
|
|
|
|
| Other |
|
8 |
|
|
2,144 |
|
|
72.5% |
|
76.1% |
| Total Portfolio |
|
201 |
|
|
24,137 |
|
|
93.6% |
|
94.9% |
| Consolidated Portfolio |
|
177 |
|
|
19,841 |
|
|
92.2% |
|
93.8% |
(1)See page 33 for additional disclosure regarding our unconsolidated real estate JVs.
(2)Refer to the section entitled “Definitions” for a definition of this measure.
COPT Defense Properties
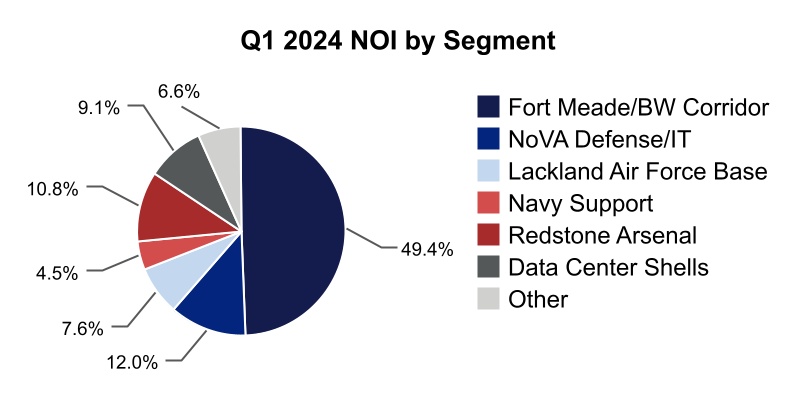
Consolidated Real Estate Revenues + NOI by Segment
(in thousands)
|
|
|
|
|
|
|
|
|
|
|
|
|
|
|
|
|
|
|
|
|
|
|
|
|
|
|
|
|
|
|
|
|
|
| |
Three Months Ended |
|
|
| |
3/31/24 |
|
12/31/23 |
|
9/30/23 |
|
6/30/23 |
|
3/31/23 |
|
|
|
|
| Consolidated real estate revenues |
|
|
|
|
|
|
|
|
|
|
|
|
|
| Defense/IT Portfolio: |
|
|
|
|
|
|
|
|
|
|
|
|
|
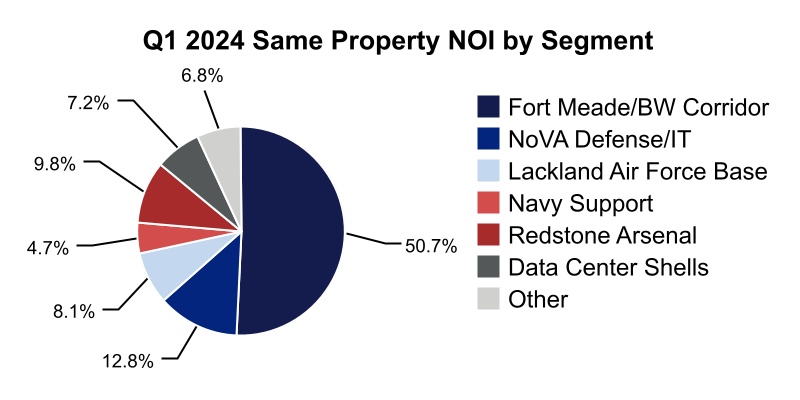
| Fort Meade/BW Corridor |
$ |
78,068 |
|
|
$ |
74,758 |
|
|
$ |
73,350 |
|
|
$ |
72,176 |
|
|
$ |
69,777 |
|
|
|
|
|
| NoVA Defense/IT |
21,426 |
|
|
20,410 |
|
|
20,333 |
|
|
19,841 |
|
|
19,829 |
|
|
|
|
|
| Lackland Air Force Base |
16,411 |
|
|
17,861 |
|
|
16,193 |
|
|
17,595 |
|
|
15,605 |
|
|
|
|
|
| Navy Support |
8,226 |
|
|
8,405 |
|
|
8,190 |
|
|
8,118 |
|
|
7,925 |
|
|
|
|
|
| Redstone Arsenal |
16,808 |
|
|
14,971 |
|
|
13,768 |
|
|
12,978 |
|
|
13,414 |
|
|
|
|
|
| Data Center Shells-Consolidated |
8,457 |
|
|
7,654 |
|
|
6,811 |
|
|
6,287 |
|
|
6,692 |
|
|
|
|
|
| Total Defense/IT Portfolio |
149,396 |
|
|
144,059 |
|
|
138,645 |
|
|
136,995 |
|
|
133,242 |
|
|
|
|
|
| Other |
17,267 |
|
|
17,503 |
|
|
17,962 |
|
|
17,958 |
|
|
18,439 |
|
|
|
|
|
| Consolidated real estate revenues (1) |
$ |
166,663 |
|
|
$ |
161,562 |
|
|
$ |
156,607 |
|
|
$ |
154,953 |
|
|
$ |
151,681 |
|
|
|
|
|
|
|
|
|
| NOI from real estate operations (2) |
|
|
|
|
|
|
|
|
|
|
|
|
|
| Defense/IT Portfolio: |
|
|
|
|
|
|
|
|
|
|
|
|
|
| Fort Meade/BW Corridor |
$ |
50,178 |
|
|
$ |
48,894 |
|
|
$ |
48,134 |
|
|
$ |
47,988 |
|
|
$ |
45,257 |
|
|
|
|
|
| NoVA Defense/IT |
12,164 |
|
|
11,972 |
|
|
12,433 |
|
|
12,158 |
|
|
12,257 |
|
|
|
|
|
| Lackland Air Force Base |
7,723 |
|
|
7,708 |
|
|
7,626 |
|
|
7,644 |
|
|
7,660 |
|
|
|
|
|
| Navy Support |
4,600 |
|
|
4,783 |
|
|
4,257 |
|
|
4,602 |
|
|
4,382 |
|
|
|
|
|
| Redstone Arsenal |
11,016 |
|
|
10,157 |
|
|
8,820 |
|
|
8,228 |
|
|
8,778 |
|
|
|
|
|
| Data Center Shells: |
|
|
|
|
|
|
|
|
|
|
|
|
|
| Consolidated properties |
7,514 |
|
|
6,966 |
|
|
6,133 |
|
|
5,544 |
|
|
6,098 |
|
|
|
|
|
| COPT Defense’s share of unconsolidated real estate JVs |
1,740 |
|
|
1,671 |
|
|
1,675 |
|
|
1,671 |
|
|
1,642 |
|
|
|
|
|
| Total Defense/IT Portfolio |
94,935 |
|
|
92,151 |
|
|
89,078 |
|
|
87,835 |
|
|
86,074 |
|
|
|
|
|
| Other |
6,722 |
|
|
6,505 |
|
|
7,416 |
|
|
7,189 |
|
|
7,829 |
|
|
|
|
|
| NOI from real estate operations (1) |
$ |
101,657 |
|
|
$ |
98,656 |
|
|
$ |
96,494 |
|
|
$ |
95,024 |
|
|
$ |
93,903 |
|
|
|
|
|
(1)Refer to the section entitled “Supplementary Reconciliations of Non-GAAP Measures” for reconciliation.
(2)Refer to the section entitled “Definitions” for a definition of this measure.
COPT Defense Properties
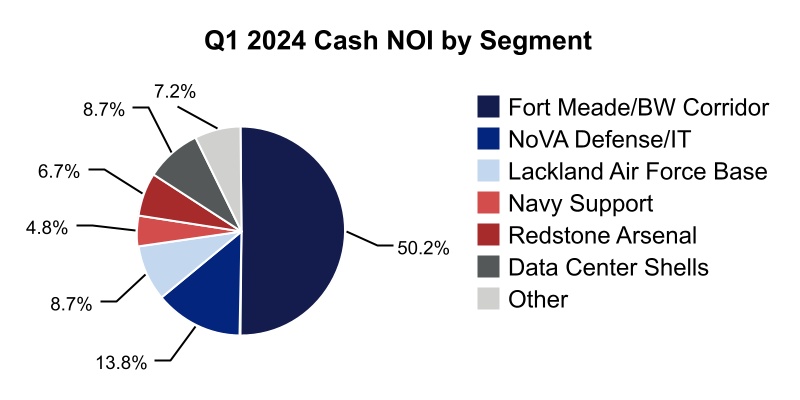
Cash NOI by Segment
(in thousands)
|
|
|
|
|
|
|
|
|
|
|
|
|
|
|
|
|
|
|
|
|
|
|
|
|
|
|
|
|
|
|
|
|
|
| |
Three Months Ended |
|
|
| |
3/31/24 |
|
12/31/23 |
|
9/30/23 |
|
6/30/23 |
|
3/31/23 |
|
|
|
|
| Cash NOI from real estate operations (1) |
|
|
|
|
|
|
|
|
|
|
|
|
|
| Defense/IT Portfolio: |
|
|
|
|
|
|
|
|
|
|
|
|
|
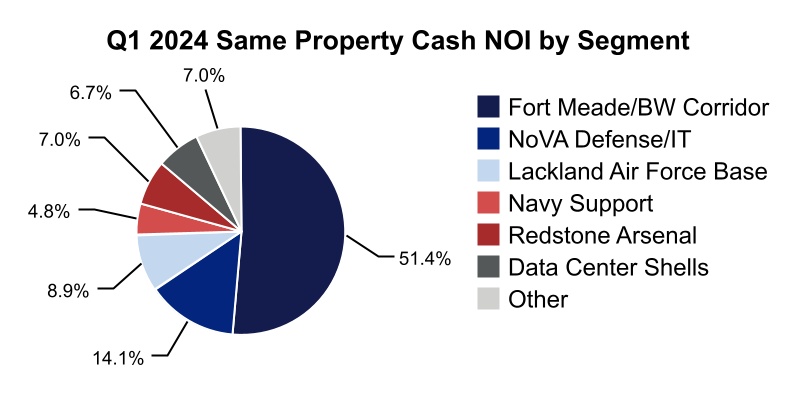
| Fort Meade/BW Corridor |
$ |
47,117 |
|
|
$ |
46,173 |
|
|
$ |
45,513 |
|
|
$ |
45,727 |
|
|
$ |
43,662 |
|
|
|
|
|
| NoVA Defense/IT |
12,933 |
|
|
12,881 |
|
|
12,765 |
|
|
12,642 |
|
|
11,423 |
|
|
|
|
|
| Lackland Air Force Base |
8,186 |
|
|
8,114 |
|
|
7,913 |
|
|
7,919 |
|
|
7,915 |
|
|
|
|
|
| Navy Support |
4,503 |
|
|
5,008 |
|
|
4,621 |
|
|
4,911 |
|
|
5,023 |
|
|
|
|
|
| Redstone Arsenal |
6,308 |
|
|
4,869 |
|
|
4,861 |
|
|
3,707 |
|
|
4,988 |
|
|
|
|
|
| Data Center Shells: |
|
|
|
|
|
|
|
|
|
|
|
|
|
| Consolidated properties |
6,688 |
|
|
5,868 |
|
|
4,904 |
|
|
4,918 |
|
|
5,379 |
|
|
|
|
|
| COPT Defense’s share of unconsolidated real estate JVs |
1,477 |
|
|
1,400 |
|
|
1,396 |
|
|
1,385 |
|
|
1,351 |
|
|
|
|
|
| Total Defense/IT Portfolio |
87,212 |
|
|
84,313 |
|
|
81,973 |
|
|
81,209 |
|
|
79,741 |
|
|
|
|
|
| Other |
6,723 |
|
|
6,536 |
|
|
7,400 |
|
|
7,350 |
|
|
7,583 |
|
|
|
|
|
| Cash NOI from real estate operations (2) |
$ |
93,935 |
|
|
$ |
90,849 |
|
|
$ |
89,373 |
|
|
$ |
88,559 |
|
|
$ |
87,324 |
|
|
|
|
|
|
|
|
|
|
|
|
|
|
|
|
|
|
|
|
|
|
|
|
|
|
|
|
|
|
|
|
|
|
|
|
|
|
|
|
|
|
|
|
|
|
|
|
|
|
|
|
|
|
|
|
|
|
|
|
|
|
|
|
|
|
|
|
|
|
|
|
|
|
|
|
|
|
|
|
|
|
|
|
|
|
|
|
|
|
|
|
|
|
|
|
|
|
|
|
|
|
|
|
|
|
|
|
|
|
|
|
|
|
|
|
|
(1)Refer to the section entitled “Definitions” for a definition of this measure.
(2)Refer to the section entitled “Supplementary Reconciliations of Non-GAAP Measures” for reconciliation.
COPT Defense Properties
NOI from Real Estate Operations + Occupancy by Property Grouping - 3/31/24
(dollars and square feet in thousands)
|
|
|
|
|
|
|
|
|
|
|
|
|
|
|
|
|
|
|
|
|
|
|
|
|
|
|
|
|
|
|
|
|
|
|
|
|
|
|
|
|
|
|
|
|
|
|
| |
|
As of Period End |
|
NOI from Real Estate Operations (3) |
|
|
# of
Properties |
|
Operational Square Feet |
|
% Occupied (1) |
|
% Leased (1) |
|
Annualized
Rental Revenue (2) |
|
% of Total
Annualized
Rental Revenue (2) |
|
| Property Grouping |
|
|
|
|
|
|
|
Three Months Ended |
|
|
| Defense/IT Portfolio: |
|
|
|
|
|
|
|
|
|
|
|
|
|
|
|
|
| Same Property: (2) |
|
|
|
|
|
|
|
|
|
|
|
|
|
|
|
|
| Consolidated properties |
|
160 |
|
|
16,536 |
|
|
94.8% |
|
96.4% |
|
$ |
553,073 |
|
|
84.4 |
% |
|
$ |
87,587 |
|
|
|
| Unconsolidated real estate JV |
|
21 |
|
|
3,547 |
|
|
100.0% |
|
100.0% |
|
5,821 |
|
|
0.9 |
% |
|
1,301 |
|
|
|
| Total Same Property in Defense/IT Portfolio |
|
181 |
|
|
20,083 |
|
|
95.8% |
|
97.0% |
|
558,894 |
|
|
85.3 |
% |
|
88,888 |
|
|
|
| Properties Placed in Service (4) |
|
8 |
|
|
960 |
|
|
97.8% |
|
97.8% |
|
24,976 |
|
|
3.8 |
% |
|
5,532 |
|
|
|
| Other unconsolidated JV properties (5) |
|
3 |
|
|
748 |
|
|
100.0% |
|
100.0% |
|
1,360 |
|
|
0.2 |
% |
|
444 |
|
|
|
| Acquired property (6) |
|
1 |
|
|
202 |
|
|
55.6% |
|
55.6% |
|
4,070 |
|
|
0.6 |
% |
|
71 |
|
|
|
| Total Defense/IT Portfolio |
|
193 |
|
|
21,993 |
|
|
95.6% |
|
96.8% |
|
589,300 |
|
|
90.0 |
% |
|
94,935 |
|
|
|
|
|
|
|
|
|
|
|
|
|
|
|
|
|
|
|
|
|
|
|
|
|
|
|
|
|
|
|
|
|
|
|
|
|
|
|
|
|
|
|
|
|
|
|
|
|
|
|
|
|
|
| Other |
|
8 |
|
|
2,144 |
|
|
72.5% |
|
76.1% |
|
65,622 |
|
|
10.0 |
% |
|
6,722 |
|
|
|
| Total Portfolio |
|
201 |
|
|
24,137 |
|
|
93.6% |
|
94.9% |
|
$ |
654,922 |
|
|
100.0 |
% |
|
$ |
101,657 |
|
|
|
| Consolidated Portfolio |
|
177 |
|
|
19,841 |
|
|
92.2% |
|
93.8% |
|
$ |
647,741 |
|
|
98.9 |
% |
|
$ |
99,917 |
|
|
|
|
|
|
|
|
|
|
|
|
|
|
|
|
|
|
|
|
|
|
|
|
|
|
|
|
|
|
|
|
|
|
|
|
|
|
|
|
|
|
|
|
|
|
|
|
|
|
|
|
|
|
|
|
|
|
|
|
|
|
|
|
|
|
|
|
|
|
|
|
|
|
|
|
|
|
|
|
|
|
|
|
|
|
|
|
|
|
|
|
|
|
|
|
|
|
|
|
|
|
|
|
|
|
|
|
|
|
|
|
|
|
|
|
|
|
|
|
|
|
|
|
|
|
|
|
|
|
|
|
|
|
|
|
|
|
|
|
|
|
|
|
|
|
|
|
|
|
|
|
|
|
|
|
|
|
|
|
|
|
|
|
|
|
|
|
|
|
|
|
|
|
|
|
|
|
|
|
|
|
|
|
|
|
(1)Percentages calculated based on operational square feet.
(2)Refer to the section entitled “Definitions” for a definition of this measure.
(3)Refer to the section entitled “Supplementary Reconciliations of Non-GAAP Measures” for reconciliation.
(4)Newly developed or redeveloped properties placed in service that were not fully operational by 1/1/23.
(5)Includes three data center shell properties in which we sold ownership interests and retained 10% interests through unconsolidated real estate JVs in 2023.
(6)Includes an office property acquired on 3/15/24.
COPT Defense Properties
Same Property (1) Average Occupancy Rates by Segment
(square feet in thousands)
|
|
|
|
|
|
|
|
|
|
|
|
|
|
|
|
|
|
|
|
|
|
|
|
|
|
|
|
|
|
|
|
|
|
|
|
|
|
|
|
|
|
|
|
|
|
| |
# of Properties |
|
Operational Square Feet |
|
Three Months Ended |
|
|
| |
|
|
3/31/24 |
|
12/31/23 |
|
9/30/23 |
|
6/30/23 |
|
3/31/23 |
|
|
|
|
|
|
|
|
|
|
|
|
|
|
|
|
|
|
|
|
|
|
| Defense/IT Portfolio: |
|
|
|
|
|
|
|
|
|
|
|
|
|
|
|
|
|
| Fort Meade/BW Corridor |
91 |
|
|
8,693 |
|
|
96.2 |
% |
|
96.2 |
% |
|
95.8 |
% |
|
94.8 |
% |
|
93.0 |
% |
|
|
|
|
| NoVA Defense/IT |
16 |
|
|
2,500 |
|
|
87.9 |
% |
|
88.5 |
% |
|
89.8 |
% |
|
89.9 |
% |
|
90.6 |
% |
|
|
|
|
| Lackland Air Force Base |
8 |
|
|
1,062 |
|
|
100.0 |
% |
|
100.0 |
% |
|
100.0 |
% |
|
100.0 |
% |
|
100.0 |
% |
|
|
|
|
| Navy Support |
21 |
|
|
1,244 |
|
|
85.6 |
% |
|
87.8 |
% |
|
87.2 |
% |
|
87.6 |
% |
|
88.9 |
% |
|
|
|
|
| Redstone Arsenal |
20 |
|
|
2,049 |
|
|
97.7 |
% |
|
97.4 |
% |
|
93.5 |
% |
|
90.6 |
% |
|
89.7 |
% |
|
|
|
|
| Data Center Shells: |
|
|
|
|
|
|
|
|
|
|
|
|
|
|
|
|
|
| Consolidated properties |
4 |
|
|
988 |
|
|
100.0 |
% |
|
100.0 |
% |
|
100.0 |
% |
|
100.0 |
% |
|
100.0 |
% |
|
|
|
|
| Unconsolidated JV properties |
21 |
|
|
3,547 |
|
|
100.0 |
% |
|
100.0 |
% |
|
100.0 |
% |
|
100.0 |
% |
|
100.0 |
% |
|
|
|
|
| Total Defense/IT Portfolio |
181 |
|
|
20,083 |
|
|
95.7 |
% |
|
95.9 |
% |
|
95.5 |
% |
|
94.8 |
% |
|
94.1 |
% |
|
|
|
|
|
|
|
|
|
|
|
|
|
|
|
|
|
|
|
|
|
|
|
|
|
|
|
|
|
|
|
|
|
|
|
|
|
|
|
|
| Other |
8 |
|
|
2,144 |
|
|
72.0 |
% |
|
73.9 |
% |
|
75.2 |
% |
|
75.0 |
% |
|
78.6 |
% |
|
|
|
|
| Total Same Property |
189 |
|
|
22,227 |
|
|
93.4 |
% |
|
93.8 |
% |
|
93.5 |
% |
|
92.9 |
% |
|
92.6 |
% |
|
|
|
|
|
|
|
|
|
|
|
|
|
|
|
|
|
|
|
|
|
|
|
Same Property (1) Period End Occupancy Rates by Segment
(square feet in thousands)
|
|
# of Properties |
|
Operational Square Feet |
|
|
|
|
| |
|
|
3/31/24 |
|
12/31/23 |
|
9/30/23 |
|
6/30/23 |
|
3/31/23 |
|
|
|
|
|
|
|
|
|
|
|
|
|
|
|
|
|
|
|
|
|
|
| Defense/IT Portfolio: |
|
|
|
|
|
|
|
|
|
|
|
|
|
|
|
|
|
| Fort Meade/BW Corridor |
91 |
|
|
8,693 |
|
|
96.1 |
% |
|
96.3 |
% |
|
96.1 |
% |
|
95.4 |
% |
|
93.4 |
% |
|
|
|
|
| NoVA Defense/IT |
16 |
|
|
2,500 |
|
|
88.2 |
% |
|
88.9 |
% |
|
89.5 |
% |
|
89.9 |
% |
|
90.7 |
% |
|
|
|
|
| Lackland Air Force Base |
8 |
|
|
1,062 |
|
|
100.0 |
% |
|
100.0 |
% |
|
100.0 |
% |
|
100.0 |
% |
|
100.0 |
% |
|
|
|
|
| Navy Support |
21 |
|
|
1,244 |
|
|
86.4 |
% |
|
88.0 |
% |
|
87.4 |
% |
|
87.4 |
% |
|
88.4 |
% |
|
|
|
|
| Redstone Arsenal |
20 |
|
|
2,049 |
|
|
97.5 |
% |
|
97.7 |
% |
|
95.7 |
% |
|
92.3 |
% |
|
89.7 |
% |
|
|
|
|
| Data Center Shells: |
|
|
|
|
|
|
|
|
|
|
|
|
|
|
|
|
|
| Consolidated properties |
4 |
|
|
988 |
|
|
100.0 |
% |
|
100.0 |
% |
|
100.0 |
% |
|
100.0 |
% |
|
100.0 |
% |
|
|
|
|
| Unconsolidated JV properties |
21 |
|
|
3,547 |
|
|
100.0 |
% |
|
100.0 |
% |
|
100.0 |
% |
|
100.0 |
% |
|
100.0 |
% |
|
|
|
|
| Total Defense/IT Portfolio |
181 |
|
|
20,083 |
|
|
95.8 |
% |
|
96.0 |
% |
|
95.8 |
% |
|
95.2 |
% |
|
94.2 |
% |
|
|
|
|
|
|
|
|
|
|
|
|
|
|
|
|
|
|
|
|
|
|
|
|
|
|
|
|
|
|
|
|
|
|
|
|
|
|
|
|
| Other |
8 |
|
|
2,144 |
|
|
72.5 |
% |
|
73.2 |
% |
|
75.4 |
% |
|
74.9 |
% |
|
77.6 |
% |
|
|
|
|
| Total Same Property |
189 |
|
|
22,227 |
|
|
93.5 |
% |
|
93.8 |
% |
|
93.8 |
% |
|
93.3 |
% |
|
92.6 |
% |
|
|
|
|
(1)Includes properties stably owned and 100% operational since at least 1/1/23.
COPT Defense Properties
Same Property Real Estate Revenues + NOI by Segment
(in thousands)
|
|
|
|
|
|
|
|
|
|
|
|
|
|
|
|
|
|
|
|
|
|
|
|
|
|
|
|
|
|
|
|
|
|
| |
Three Months Ended |
|
|
| |
3/31/24 |
|
12/31/23 |
|
9/30/23 |
|
6/30/23 |
|
3/31/23 |
|
|
|
|
| Same Property real estate revenues |
|
|
|
|
|
|
|
|
|
|
|
|
|
| Defense/IT Portfolio: |
|
|
|
|
|
|
|
|
|
|
|
|
|
| Fort Meade/BW Corridor |
$ |
76,082 |
|
|
$ |
74,008 |
|
|
$ |
73,350 |
|
|
$ |
72,177 |
|
|
$ |
69,769 |
|
|
|
|
|
| NoVA Defense/IT |
21,426 |
|
|
20,411 |
|
|
20,333 |
|
|
19,840 |
|
|
19,829 |
|
|
|
|
|
| Lackland Air Force Base |
16,411 |
|
|
17,860 |
|
|
16,193 |
|
|
17,596 |
|
|
15,605 |
|
|
|
|
|
| Navy Support |
8,073 |
|
|
8,251 |
|
|
8,035 |
|
|
7,964 |
|
|
7,771 |
|
|
|
|
|
| Redstone Arsenal |
14,311 |
|
|
13,861 |
|
|
13,520 |
|
|
12,820 |
|
|
13,292 |
|
|
|
|
|
| Data Center Shells-Consolidated |
6,427 |
|
|
6,186 |
|
|
6,205 |
|
|
6,285 |
|
|
6,293 |
|
|
|
|
|
| Total Defense/IT Portfolio |
142,730 |
|
|
140,577 |
|
|
137,636 |
|
|
136,682 |
|
|
132,559 |
|
|
|
|
|
| Other |
15,262 |
|
|
15,500 |
|
|
15,953 |
|
|
15,964 |
|
|
16,790 |
|
|
|
|
|
| Same Property real estate revenues |
$ |
157,992 |
|
|
$ |
156,077 |
|
|
$ |
153,589 |
|
|
$ |
152,646 |
|
|
$ |
149,349 |
|
|
|
|
|
|
|
|
|
|
|
|
|
|
|
|
|
|
|
| Same Property NOI from real estate operations (“NOI”) |
|
|
|
|
|
|
|
|
|
|
|
|
|
| Defense/IT Portfolio: |
|
|
|
|
|
|
|
|
|
|
|
|
|
| Fort Meade/BW Corridor |
$ |
48,330 |
|
|
$ |
48,239 |
|
|
$ |
48,134 |
|
|
$ |
47,988 |
|
|
$ |
45,257 |
|
|
|
|
|
| NoVA Defense/IT |
12,164 |
|
|
11,972 |
|
|
12,433 |
|
|
12,158 |
|
|
12,257 |
|
|
|
|
|
| Lackland Air Force Base |
7,723 |
|
|
7,708 |
|
|
7,625 |
|
|
7,645 |
|
|
7,660 |
|
|
|
|
|
| Navy Support |
4,522 |
|
|
4,702 |
|
|
4,177 |
|
|
4,510 |
|
|
4,293 |
|
|
|
|
|
| Redstone Arsenal |
9,321 |
|
|
9,148 |
|
|
8,665 |
|
|
8,134 |
|
|
8,682 |
|
|
|
|
|
| Data Center Shells: |
|
|
|
|
|
|
|
|
|
|
|
|
|
| Consolidated properties |
5,527 |
|
|
5,538 |
|
|
5,539 |
|
|
5,544 |
|
|
5,753 |
|
|
|
|
|
| COPT Defense’s share of unconsolidated real estate JVs |
1,301 |
|
|
1,233 |
|
|
1,236 |
|
|
1,232 |
|
|
1,245 |
|
|
|
|
|
| Total Defense/IT Portfolio |
88,888 |
|
|
88,540 |
|
|
87,809 |
|
|
87,211 |
|
|
85,147 |
|
|
|
|
|
| Other |
6,515 |
|
|
6,314 |
|
|
7,230 |
|
|
7,012 |
|
|
7,576 |
|
|
|
|
|
| Same Property NOI (1) |
$ |
95,403 |
|
|
$ |
94,854 |
|
|
$ |
95,039 |
|
|
$ |
94,223 |
|
|
$ |
92,723 |
|
|
|
|
|
|
|
|
|
|
|
|
|
|
|
|
|
|
|
|
|
|
|
|
|
|
|
|
|
|
|
|
|
(1)Refer to the section entitled “Supplementary Reconciliations of Non-GAAP Measures” for reconciliation.
COPT Defense Properties
Same Property Cash NOI by Segment
(dollars in thousands)
|
|
|
|
|
|
|
|
|
|
|
|
|
|
|
|
|
|
|
|
|
|
|
|
|
|
|
|
|
|
|
|
|
|
| |
Three Months Ended |
|
|
| |
3/31/24 |
|
12/31/23 |
|
9/30/23 |
|
6/30/23 |
|
3/31/23 |
|
|
|
|
| Same Property cash NOI from real estate operations (“cash NOI”) |
|
|
|
|
|
|
|
|
|
|
|
|
|
| Defense/IT Portfolio: |
|
|
|
|
|
|
|
|
|
|
|
|
|
| Fort Meade/BW Corridor |
$ |
47,052 |
|
|
$ |
46,267 |
|
|
$ |
45,513 |
|
|
$ |
45,727 |
|
|
$ |
43,662 |
|
|
|
|
|
| NoVA Defense/IT |
12,933 |
|
|
12,882 |
|
|
12,764 |
|
|
12,642 |
|
|
11,423 |
|
|
|
|
|
| Lackland Air Force Base |
8,186 |
|
|
8,114 |
|
|
7,913 |
|
|
7,919 |
|
|
7,915 |
|
|
|
|
|
| Navy Support |
4,429 |
|
|
4,932 |
|
|
4,545 |
|
|
4,825 |
|
|
4,940 |
|
|
|
|
|
| Redstone Arsenal |
6,412 |
|
|
4,966 |
|
|
4,953 |
|
|
3,771 |
|
|
5,015 |
|
|
|
|
|
| Data Center Shells: |
|
|
|
|
|
|
|
|
|
|
|
|
|
| Consolidated properties |
4,984 |
|
|
4,960 |
|
|
4,865 |
|
|
4,918 |
|
|
5,101 |
|
|
|
|
|
| COPT Defense’s share of unconsolidated real estate JVs |
1,183 |
|
|
1,108 |
|
|
1,106 |
|
|
1,095 |
|
|
1,092 |
|
|
|
|
|
| Total Defense/IT Portfolio |
85,179 |
|
|
83,229 |
|
|
81,659 |
|
|
80,897 |
|
|
79,148 |
|
|
|
|
|
| Other |
6,440 |
|
|
6,264 |
|
|
7,134 |
|
|
7,092 |
|
|
7,243 |
|
|
|
|
|
| Same Property cash NOI (1) |
$ |
91,619 |
|
|
$ |
89,493 |
|
|
$ |
88,793 |
|
|
$ |
87,989 |
|
|
$ |
86,391 |
|
|
|
|
|
| Percentage change in total Same Property cash NOI (1)(2) |
6.1% |
|
|
|
|
|
|
|
|
|
|
|
|
| Percentage change in Defense/IT Portfolio Same Property cash NOI (2) |
7.6% |
|
|
|
|
|
|
|
|
|
|
|
|
(1)Refer to the section entitled “Supplementary Reconciliations of Non-GAAP Measures” for reconciliation.
(2)Represents the change between the current period and the same period in the prior year.
COPT Defense Properties
Leasing (1)(2)
Three Months Ended 3/31/24
(square feet in thousands)
|
|
|
|
|
|
|
|
|
|
|
|
|
|
|
|
|
|
|
|
|
|
|
|
|
|
|
|
|
|
|
|
|
|
|
|
|
|
|
|
|
|
|
|
|
|
|
|
|
|
|
|
|
Defense/IT Portfolio |
|
|
|
|
|
|
|
|
| |
Ft Meade/BW Corridor |
|
NoVA Defense/IT |
|
|
|
Navy Support |
|
Redstone Arsenal |
|
|
|
Total Defense/IT Portfolio |
|
|
|
Other |
|
Total |
|
|
|
|
| Renewed Space |
|
|
|
|
|
|
|
|
|
|
|
|
|
|
|
|
|
|
|
|
|
|
|
| Leased Square Feet |
227 |
|
|
116 |
|
|
|
|
80 |
|
|
85 |
|
|
|
|
509 |
|
|
|
|
42 |
|
|
551 |
|
|
|
|
|
| Expiring Square Feet |
272 |
|
|
127 |
|
|
|
|
125 |
|
|
89 |
|
|
|
|
613 |
|
|
|
|
93 |
|
|
706 |
|
|
|
|
|
| Vacating Square Feet |
45 |
|
|
11 |
|
|
|
|
45 |
|
|
4 |
|
|
|
|
105 |
|
|
|
|
51 |
|
|
155 |
|
|
|
|
|
| Retention Rate (% based upon square feet) |
83.5 |
% |
|
91.5 |
% |
|
|
|
64.1 |
% |
|
95.3 |
% |
|
|
|
82.9 |
% |
|
|
|
45.6 |
% |
|
78.0 |
% |
|
|
|
|
| Statistics for Completed Leasing: |
|
|
|
|
|
|
|
|
|
|
|
|
|
|
|
|
|
|
|
|
|
|
|
| Per Annum Average Committed Cost per Square Foot |
$ |
2.89 |
|
|
$ |
5.77 |
|
|
|
|
$ |
0.63 |
|
|
$ |
0.19 |
|
|
|
|
$ |
2.75 |
|
|
|
|
$ |
3.10 |
|
|
$ |
2.77 |
|
|
|
|
|
| Weighted Average Lease Term in Years |
4.2 |
|
|
4.8 |
|
|
|
|
3.1 |
|
|
2.0 |
|
|
|
|
3.8 |
|
|
|
|
7.9 |
|
|
4.1 |
|
|
|
|
|
| Straight-line Rent Per Square Foot |
|
|
|
|
|
|
|
|
|
|
|
|
|
|
|
|
|
|
|
|
|
|
|
| Renewal Straight-line Rent |
$ |
32.58 |
|
|
$ |
34.91 |
|
|
|
|
$ |
28.89 |
|
|
$ |
26.03 |
|
|
|
|
$ |
31.44 |
|
|
|
|
$ |
32.07 |
|
|
$ |
31.49 |
|
|
|
|
|
| Expiring Straight-line Rent |
$ |
30.44 |
|
|
$ |
37.87 |
|
|
|
|
$ |
24.78 |
|
|
$ |
25.11 |
|
|
|
|
$ |
30.36 |
|
|
|
|
$ |
30.35 |
|
|
$ |
30.36 |
|
|
|
|
|
| Change in Straight-line Rent |
7.0 |
% |
|
(7.8 |
%) |
|
|
|
16.6 |
% |
|
3.6 |
% |
|
|
|
3.6 |
% |
|
|
|
5.7 |
% |
|
3.7 |
% |
|
|
|
|
| Cash Rent Per Square Foot |
|
|
|
|
|
|
|
|
|
|
|
|
|
|
|
|
|
|
|
|
|
|
|
| Renewal Cash Rent |
$ |
32.20 |
|
|
$ |
37.16 |
|
|
|
|
$ |
28.71 |
|
|
$ |
25.82 |
|
|
|
|
$ |
31.72 |
|
|
|
|
$ |
30.83 |
|
|
$ |
31.65 |
|
|
|
|
|
| Expiring Cash Rent |
$ |
32.62 |
|
|
$ |
39.79 |
|
|
|
|
$ |
27.97 |
|
|
$ |
25.45 |
|
|
|
|
$ |
32.34 |
|
|
|
|
$ |
33.93 |
|
|
$ |
32.46 |
|
|
|
|
|
| Change in Cash Rent |
(1.3 |
%) |
|
(6.6 |
%) |
|
|
|
2.6 |
% |
|
1.4 |
% |
|
|
|
(1.9 |
%) |
|
|
|
(9.2 |
%) |
|
(2.5 |
%) |
|
|
|
|
| Compound Annual Growth Rate |
2.4 |
% |
|
1.4 |
% |
|
|
|
2.5 |
% |
|
1.7 |
% |
|
|
|
2.1 |
% |
|
|
|
2.2 |
% |
|
2.1 |
% |
|
|
|
|
| Average Escalations Per Year |
2.7 |
% |
|
2.5 |
% |
|
|
|
2.6 |
% |
|
2.5 |
% |
|
|
|
2.6 |
% |
|
|
|
1.1 |
% |
|
2.4 |
% |
|
|
|
|
| New Leases |
|
|
|
|
|
|
|
|
|
|
|
|
|
|
|
|
|
|
|
|
|
|
|
| Development and Redevelopment Space |
|
|
|
|
|
|
|
|
|
|
|
|
|
|
|
|
|
|
|
|
|
|
|
| Leased Square Feet |
— |
|
|
— |
|
|
|
|
— |
|
|
10 |
|
|
|
|
10 |
|
|
|
|
— |
|
|
10 |
|
|
|
|
|
| Statistics for Completed Leasing: |
|
|
|
|
|
|
|
|
|
|
|
|
|
|
|
|
|
|
|
|
|
|
|
| Per Annum Average Committed Cost per Square Foot |
$ |
— |
|
|
$ |
— |
|
|
|
|
$ |
— |
|
|
$ |
3.14 |
|
|
|
|
$ |
3.14 |
|
|
|
|
$ |
— |
|
|
$ |
3.14 |
|
|
|
|
|
| Weighted Average Lease Term in Years |
— |
|
|
— |
|
|
|
|
— |
|
|
5.3 |
|
|
|
|
5.3 |
|
|
|
|
— |
|
|
5.3 |
|
|
|
|
|
| Straight-line Rent Per Square Foot |
$ |
— |
|
|
$ |
— |
|
|
|
|
$ |
— |
|
|
$ |
23.81 |
|
|
|
|
$ |
23.81 |
|
|
|
|
$ |
— |
|
|
$ |
23.81 |
|
|
|
|
|
| Cash Rent Per Square Foot |
$ |
— |
|
|
$ |
— |
|
|
|
|
$ |
— |
|
|
$ |
23.50 |
|
|
|
|
$ |
23.50 |
|
|
|
|
$ |
— |
|
|
$ |
23.50 |
|
|
|
|
|
| Vacant Space |
|
|
|
|
|
|
|
|
|
|
|
|
|
|
|
|
|
|
|
|
|
|
|
| Leased Square Feet |
80 |
|
|
20 |
|
|
|
|
13 |
|
|
— |
|
|
|
|
113 |
|
|
|
|
47 |
|
|
160 |
|
|
|
|
|
| Statistics for Completed Leasing: |
|
|
|
|
|
|
|
|
|
|
|
|
|
|
|
|
|
|
|
|
|
|
|
| Per Annum Average Committed Cost per Square Foot |
$ |
9.23 |
|
|
$ |
9.12 |
|
|
|
|
$ |
4.64 |
|
|
$ |
— |
|
|
|
|
$ |
8.68 |
|
|
|
|
$ |
6.14 |
|
|
$ |
7.93 |
|
|
|
|
|
| Weighted Average Lease Term in Years |
8.8 |
|
|
9.5 |
|
|
|
|
5.1 |
|
|
— |
|
|
|
|
8.5 |
|
|
|
|
7.4 |
|
|
8.2 |
|
|
|
|
|
| Straight-line Rent Per Square Foot |
$ |
32.09 |
|
|
$ |
33.17 |
|
|
|
|
$ |
25.29 |
|
|
$ |
— |
|
|
|
|
$ |
31.50 |
|
|
|
|
$ |
28.03 |
|
|
$ |
30.48 |
|
|
|
|
|
| Cash Rent Per Square Foot |
$ |
30.77 |
|
|
$ |
34.40 |
|
|
|
|
$ |
25.96 |
|
|
$ |
— |
|
|
|
|
$ |
30.85 |
|
|
|
|
$ |
28.15 |
|
|
$ |
30.05 |
|
|
|
|
|
| Total Square Feet Leased |
307 |
|
|
136 |
|
|
|
|
93 |
|
|
95 |
|
|
|
|
632 |
|
|
|
|
89 |
|
|
721 |
|
|
|
|
|
| Average Escalations Per Year |
2.6 |
% |
|
2.6 |
% |
|
|
|
2.6 |
% |
|
2.6 |
% |
|
|
|
2.6 |
% |
|
|
|
1.9 |
% |
|
2.5 |
% |
|
|
|
|
| Average Escalations Excl. Data Center Shells |
|
|
|
|
|
|
|
|
|
|
|
|
|
|
|
|
|
|
2.5 |
% |
|
|
|
|
(1)Activity excludes owner occupied space, leases with less than a one-year term and expirations associated with space removed from service. Weighted average lease term is based on the term defined in the lease assuming no exercise of early termination rights. Committed costs for leasing are reported above in the period of lease execution. Actual capital expenditures for leasing are reported on page 10 in the period such costs are incurred.
(2)Refer to the section entitled “Definitions” for definitions of certain terms on this schedule.
COPT Defense Properties
Lease Expiration Analysis as of 3/31/24 (1)
(dollars and square feet in thousands, except per square foot amounts)
|
|
|
|
|
|
|
|
|
|
|
|
|
|
|
|
|
|
|
|
|
|
|
|
|
|
|
|
|
|
|
|
|
|
|
|
|
|
| Segment of Lease and Year of Expiration (2) |
|
Square Footage of Leases Expiring |
|
Annualized Rental
Revenue of Expiring Leases (3) |
|
% of Defense/IT
Annualized
Rental
Revenue
Expiring (3) |
|
Annualized Rental
Revenue of
Expiring Leases per Occupied Sq. Foot (3) |
|
|
|
|
|
|
|
|
|
|
|
| Defense/IT Portfolio |
|
|
|
|
|
|
|
|
|
|
|
|
|
|
|
|
|
|
|
| Ft Meade/BW Corridor |
|
1,145 |
|
|
$ |
47,852 |
|
|
8.1 |
% |
|
$ |
41.75 |
|
|
|
|
|
|
|
|
|
|
|
|
| NoVA Defense/IT |
|
130 |
|
|
3,987 |
|
|
0.7 |
% |
|
30.71 |
|
|
|
|
|
|
|
|
|
|
|
|
|
|
|
|
|
|
|
|
|
|
|
|
|
|
|
|
|
|
|
|
| Navy Support |
|
234 |
|
|
6,275 |
|
|
1.1 |
% |
|
26.79 |
|
|
|
|
|
|
|
|
|
|
|
|
| Redstone Arsenal |
|
49 |
|
|
1,019 |
|
|
0.2 |
% |
|
20.81 |
|
|
|
|
|
|
|
|
|
|
|
|
|
|
|
|
|
|
|
|
|
|
|
|
|
|
|
|
|
|
|
|
| Data Center Shells-Unconsolidated JV Properties |
|
310 |
|
|
444 |
|
|
0.1 |
% |
|
14.31 |
|
|
|
|
|
|
|
|
|
|
|
|
|
|
|
|
|
|
|
|
|
|
|
|
|
|
|
|
|
|
|
|
| 2024 |
|
1,868 |
|
|
59,577 |
|
|
10.1 |
% |
|
37.47 |
|
|
|
|
|
|
|
|
|
|
|
|
| Ft Meade/BW Corridor |
|
1,870 |
|
|
71,284 |
|
|
12.1 |
% |
|
38.06 |
|
|
|
|
|
|
|
|
|
|
|
|
| NoVA Defense/IT |
|
281 |
|
|
11,849 |
|
|
2.0 |
% |
|
42.21 |
|
|
|
|
|
|
|
|
|
|
|
|
| Lackland Air Force Base |
|
703 |
|
|
39,803 |
|
|
6.8 |
% |
|
56.64 |
|
|
|
|
|
|
|
|
|
|
|
|
| Navy Support |
|
212 |
|
|
4,968 |
|
|
0.8 |
% |
|
23.41 |
|
|
|
|
|
|
|
|
|
|
|
|
| Redstone Arsenal |
|
288 |
|
|
6,860 |
|
|
1.2 |
% |
|
23.82 |
|
|
|
|
|
|
|
|
|
|
|
|
|
|
|
|
|
|
|
|
|
|
|
|
|
|
|
|
|
|
|
|
| Data Center Shells-Unconsolidated JV Properties |
|
121 |
|
|
175 |
|
|
— |
% |
|
14.48 |
|
|
|
|
|
|
|
|
|
|
|
|
|
|
|
|
|
|
|
|
|
|
|
|
|
|
|
|
|
|
|
|
| 2025 |
|
3,475 |
|
|
134,939 |
|
|
22.9 |
% |
|
40.06 |
|
|
|
|
|
|
|
|
|
|
|
|
| Ft Meade/BW Corridor |
|
938 |
|
|
37,545 |
|
|
6.4 |
% |
|
40.02 |
|
|
|
|
|
|
|
|
|
|
|
|
| NoVA Defense/IT |
|
66 |
|
|
2,250 |
|
|
0.4 |
% |
|
33.84 |
|
|
|
|
|
|
|
|
|
|
|
|
| Lackland Air Force Base |
|
250 |
|
|
12,793 |
|
|
2.2 |
% |
|
51.17 |
|
|
|
|
|
|
|
|
|
|
|
|
| Navy Support |
|
193 |
|
|
6,722 |
|
|
1.1 |
% |
|
34.77 |
|
|
|
|
|
|
|
|
|
|
|
|
| Redstone Arsenal |
|
105 |
|
|
3,021 |
|
|
0.5 |
% |
|
28.71 |
|
|
|
|
|
|
|
|
|
|
|
|
|
|
|
|
|
|
|
|
|
|
|
|
|
|
|
|
|
|
|
|
| Data Center Shells-Unconsolidated JV Properties |
|
446 |
|
|
814 |
|
|
0.1 |
% |
|
18.26 |
|
|
|
|
|
|
|
|
|
|
|
|
|
|
|
|
|
|
|
|
|
|
|
|
|
|
|
|
|
|
|
|
| 2026 |
|
1,998 |
|
|
63,146 |
|
|
10.7 |
% |
|
39.52 |
|
|
|
|
|
|
|
|
|
|
|
|
| Ft Meade/BW Corridor |
|
793 |
|
|
29,477 |
|
|
5.0 |
% |
|
37.18 |
|
|
|
|
|
|
|
|
|
|
|
|
| NoVA Defense/IT |
|
190 |
|
|
6,443 |
|
|
1.1 |
% |
|
33.86 |
|
|
|
|
|
|
|
|
|
|
|
|
|
|
|
|
|
|
|
|
|
|
|
|
|
|
|
|
|
|
|
|
| Navy Support |
|
212 |
|
|
8,231 |
|
|
1.4 |
% |
|
38.80 |
|
|
|
|
|
|
|
|
|
|
|
|
| Redstone Arsenal |
|
163 |
|
|
4,394 |
|
|
0.7 |
% |
|
26.94 |
|
|
|
|
|
|
|
|
|
|
|
|
|
|
|
|
|
|
|
|
|
|
|
|
|
|
|
|
|
|
|
|
| Data Center Shells-Unconsolidated JV Properties |
|
364 |
|
|
518 |
|
|
0.1 |
% |
|
14.23 |
|
|
|
|
|
|
|
|
|
|
|
|
|
|
|
|
|
|
|
|
|
|
|
|
|
|
|
|
|
|
|
|
| 2027 |
|
1,722 |
|
|
49,063 |
|
|
8.3 |
% |
|
35.18 |
|
|
|
|
|
|
|
|
|
|
|
|
| Ft Meade/BW Corridor |
|
1,421 |
|
|
48,015 |
|
|
8.1 |
% |
|
33.76 |
|
|
|
|
|
|
|
|
|
|
|
|
| NoVA Defense/IT |
|
211 |
|
|
7,170 |
|
|
1.2 |
% |
|
33.93 |
|
|
|
|
|
|
|
|
|
|
|
|
|
|
|
|
|
|
|
|
|
|
|
|
|
|
|
|
|
|
|
|
| Navy Support |
|
54 |
|
|
1,462 |
|
|
0.2 |
% |
|
27.31 |
|
|
|
|
|
|
|
|
|
|
|
|
|
|
|
|
|
|
|
|
|
|
|
|
|
|
|
|
|
|
|
|
|
|
|
|
|
|
|
|
|
|
|
|
|
|
|
|
|
|
|
|
| Data Center Shells-Unconsolidated JV Properties |
|
515 |
|
|
867 |
|
|
0.1 |
% |
|
16.82 |
|
|
|
|
|
|
|
|
|
|
|
|
|
|
|
|
|
|
|
|
|
|
|
|
|
|
|
|
|
|
|
|
| 2028 |
|
2,201 |
|
|
57,515 |
|
|
9.8 |
% |
|
33.08 |
|
|
|
|
|
|
|
|
|
|
|
|
| Thereafter |
|
|
|
|
|
|
|
|
|
|
|
|
|
|
|
|
|
|
|
| Consolidated Properties |
|
7,227 |
|
|
220,697 |
|
|
37.5 |
% |
|
29.81 |
|
|
|
|
|
|
|
|
|
|
|
|
| Unconsolidated JV Properties |
|
2,539 |
|
|
4,363 |
|
|
0.7 |
% |
|
17.18 |
|
|
|
|
|
|
|
|
|
|
|
|
| Total Defense/IT Portfolio |
|
21,030 |
|
|
$ |
589,300 |
|
|
100.0 |
% |
|
$ |
34.01 |
|
|
|
|
|
|
|
|
|
|
|
|
COPT Defense Properties
Lease Expiration Analysis as of 3/31/24 (1) (continued)
(dollars and square feet in thousands, except per square foot amounts)
|
|
|
|
|
|
|
|
|
|
|
|
|
|
|
|
|
|
|
|
|
|
|
|
|
|
|
| Segment of Lease and Year of Expiration (2) |
|
Square Footage of Leases Expiring |
|
Annualized Rental
Revenue of Expiring Leases (3) |
|
% of Total
Annualized
Rental
Revenue
Expiring (3) |
|
Annualized Rental
Revenue of
Expiring Leases per Occupied Sq. Foot (3) |
| Total Defense/IT Portfolio |
|
21,030 |
|
|
$ |
589,300 |
|
|
90.0 |
% |
|
$ |
34.01 |
|
| Other |
|
|
|
|
|
|
|
|
| 2024 |
|
44 |
|
|
1,547 |
|
|
0.2 |
% |
|
34.05 |
|
| 2025 |
|
173 |
|
|
11,027 |
|
|
1.7 |
% |
|
29.40 |
|
| 2026 |
|
164 |
|
|
5,995 |
|
|
0.9 |
% |
|
36.47 |
|
| 2027 |
|
124 |
|
|
4,622 |
|
|
0.7 |
% |
|
36.93 |
|
| 2028 |
|
243 |
|
|
8,951 |
|
|
1.4 |
% |
|
36.73 |
|
| Thereafter |
|
806 |
|
|
33,480 |
|
|
5.1 |
% |
|
41.33 |
|
| Total Other |
|
1,554 |
|
|
65,622 |
|
|
10.0 |
% |
|
38.21 |
|
| Total Portfolio |
|
22,584 |
|
|
$ |
654,922 |
|
|
100.0 |
% |
|
$ |
34.36 |
|
| Consolidated Portfolio |
|
18,289 |
|
|
$ |
647,741 |
|
|
|
|
|
| Unconsolidated JV Properties |
|
4,295 |
|
|
$ |
7,181 |
|
|
|
|
|
Note: As of 3/31/24, the weighted average lease term was 5.2 years for both the Defense/IT and total portfolio and 5.1 years for the consolidated portfolio.
(1)This expiration analysis reflects consolidated and unconsolidated properties and includes the effect of early renewals completed on existing leases but excludes the effect of new tenant leases on square feet yet to commence as of 3/31/24. With regard to properties owned through unconsolidated real estate joint ventures, the amounts reported above reflect 100% of the properties’ square footage but only reflect the portion of Annualized Rental Revenue that was allocable to COPT Defense’s ownership interest.
(2)The year of lease expiration is based on the lease term determined in accordance with GAAP.
(3)Refer to the section entitled “Definitions” for a definition of annualized rental revenue.
COPT Defense Properties
2024 Defense/IT Portfolio Quarterly Lease Expiration Analysis as of 3/31/24 (1)
(dollars and square feet in thousands, except per square foot amounts)
|
|
|
|
|
|
|
|
|
|
|
|
|
|
|
|
|
|
|
|
|
|
|
|
|
|
|
|
|
|
|
|
|
|
|
|
|
|
|
|
| Segment of Lease and Quarter of Expiration (2) |
|
Square Footage of Leases Expiring |
|
Annualized Rental
Revenue of Expiring Leases (3) |
|
% of Defense/IT
Annualized
Rental
Revenue Expiring (3) |
|
Annualized Rental Revenue of Expiring Leases per Occupied Sq. Foot (3) |
|
|
|
|
|
|
|
|
|
|
|
|
|
| Defense IT Portfolio |
|
|
|
|
|
|
|
|
|
|
|
|
|
|
|
|
|
|
|
|
|
|
|
|
|
|
|
|
|
|
|
|
|
|
|
|
|
|
|
|
|
|
|
|
|
|
|
|
|
|
|
|
|
|
|
|
|
|
|
|
|
|
|
|
|
|
|
|
|
|
|
|
|
|
|
|
|
|
|
|
|
|
|
|
|
|
|
|
|
|
|
|
|
|
|
|
|
|
|
|
|
|
|
|
|
|
|
|
|
|
|
|
|
|
|
|
|
|
|
|
|
|
|
|
|
|
|
|
|
|
|
|
|
|
|
|
|
|
|
|
|
|
|
|
|
|
|
|
|
|
|
|
|
|
|
|
|
|
|
|
|
|
|
|
|
|
|
|
|
|
|
|
|
|
|
|
|
|
|
|
|
|
|
|
|
|
|
|
|
|
|
|
|
|
|
|
|
|
|
|
|
|
|
|
|
|
|
|
|
|
|
|
|
|
|
|
|
|
|
| Ft Meade/BW Corridor |
|
663 |
|
|
$ |
27,421 |
|
|
4.7 |
% |
|
$ |
41.38 |
|
|
|
|
|
|
|
|
|
|
|
|
|
|
| NoVA Defense/IT |
|
89 |
|
|
3,006 |
|
|
0.5 |
% |
|
33.77 |
|
|
|
|
|
|
|
|
|
|
|
|
|
|
|
|
|
|
|
|
|
|
|
|
|
|
|
|
|
|
|
|
|
|
|
|
| Navy Support |
|
21 |
|
|
630 |
|
|
0.1 |
% |
|
29.64 |
|
|
|
|
|
|
|
|
|
|
|
|
|
|
| Redstone Arsenal |
|
31 |
|
|
550 |
|
|
0.1 |
% |
|
17.72 |
|
|
|
|
|
|
|
|
|
|
|
|
|
|
|
|
|
|
|
|
|
|
|
|
|
|
|
|
|
|
|
|
|
|
|
|
|
|
|
|
|
|
|
|
|
|
|
|
|
|
|
|
|
|
|
|
|
|
|
|
|
|
|
|
|
|
|
|
|
|
|
|
|
|
|
|
|
|
|
|
| Q2 2024 |
|
804 |
|
|
31,607 |
|
|
5.4 |
% |
|
39.32 |
|
|
|
|
|
|
|
|
|
|
|
|
|
|
| Ft Meade/BW Corridor |
|
240 |
|
|
8,605 |
|
|
1.5 |
% |
|
35.73 |
|
|
|
|
|
|
|
|
|
|
|
|
|
|
| NoVA Defense/IT |
|
30 |
|
|
630 |
|
|
0.1 |
% |
|
20.72 |
|
|
|
|
|
|
|
|
|
|
|
|
|
|
|
|
|
|
|
|
|
|
|
|
|
|
|
|
|
|
|
|
|
|
|
|
| Navy Support |
|
97 |
|
|
2,233 |
|
|
0.4 |
% |
|
23.07 |
|
|
|
|
|
|
|
|
|
|
|
|
|
|
|
|
|
|
|
|
|
|
|
|
|
|
|
|
|
|
|
|
|
|
|
|
|
|
|
|
|
|
|
|
|
|
|
|
|
|
|
|
|
|
|
|
|
|
| Data Center Shells-Unconsolidated JV Properties |
|
310 |
|
|
444 |
|
|
0.1 |
% |
|
14.31 |
|
|
|
|
|
|
|
|
|
|
|
|
|
|
|
|
|
|
|
|
|
|
|
|
|
|
|
|
|
|
|
|
|
|
|
|
| Q3 2024 |
|
677 |
|
|
11,912 |
|
|
2.1 |
% |
|
29.84 |
|
|
|
|
|
|
|
|
|
|
|
|
|
|
| Ft Meade/BW Corridor |
|
243 |
|
|
11,826 |
|
|
2.0 |
% |
|
48.73 |
|
|
|
|
|
|
|
|
|
|
|
|
|
|
| NoVA Defense/IT |
|
10 |
|
|
351 |
|
|
0.1 |
% |
|
33.78 |
|
|
|
|
|
|
|
|
|
|
|
|
|
|
|
|
|
|
|
|
|
|
|
|
|
|
|
|
|
|
|
|
|
|
|
|
| Navy Support |
|
116 |
|
|
3,412 |
|
|
0.6 |
% |
|
29.37 |
|
|
|
|
|
|
|
|
|
|
|
|
|
|
| Redstone Arsenal |
|
18 |
|
|
469 |
|
|
0.1 |
% |
|
26.15 |
|
|
|
|
|
|
|
|
|
|
|
|
|
|
|
|
|
|
|
|
|
|
|
|
|
|
|
|
|
|
|
|
|
|
|
|
|
|
|
|
|
|
|
|
|
|
|
|
|
|
|
|
|
|
|
|
|
|
|
|
|
|
|
|
|
|
|
|
|
|
|
|
|
|
|
|
|
|
|
|
| Q4 2024 |
|
387 |
|
|
16,058 |
|
|
2.8 |
% |
|
41.47 |
|
|
|
|
|
|
|
|
|
|
|
|
|
|
|
|
|
|
|
|
|
|
|
|
|
|
|
|
|
|
|
|
|
|
|
|
|
|
1,868 |
|
|
$ |
59,577 |
|
|
10.1 |
% |
|
$ |
37.47 |
|
|
|
|
|
|
|
|
|
|
|
|
|
|
|
|
|
|
|
|
|
|
|
|
|
|
|
|
|
|
|
|
|
|
|
|
|
|
|
|
|
|
|
|
|
|
|
|
|
|
|
|
|
|
|
|
|
|
|
|
|
|
|
|
|
|
|
|
|
|
|
|
|
|
|
|
|
|
|
|
|
|
|
|
|
|
|
|
|
|
|
|
|
|
|
|
|
|
|
|
|
|
|
|
|
|
|
|
|
|
|
|
|
|
|
|
|
|
|
|
|
|
|
|
|
|
|
|
|
|
|
|
|
|
|
|
|
|
|
|
|
|
|
|
|
|
|
|
|
|
|
|
|
|
|
|
|
|
|
|
|
|
|
|
|
|
|
|
|
|
|
|
|
|
|
|
|
|
|
|
|
|
|
|
|
|
|
|
|
|
|
|
|
|
|
|
|
|
|
|
|
|
|
|
|
|
|
|
|
|
|
|
|
|
|
|
|
|
|
|
|
|
|
|
|
|
|
|
|
|
|
|
|
|
|
|
|
|
|
|
|
|
|
|
|
|
|
|
|
|
|
|
|
|
|
|
|
|
|
|
|
|
|
|
|
|
|
|
|
|
|
|
|
|
|
|
|
|
|
|
|
|
|
|
|
|
|
|
|
|
|
|
|
|
|
|
|
|
|
|
|
|
|
|
|
|
|
|
|
|
|
|
|
|
|
|
|
|
|
|
|
|
|
|
|
|
|
|
|
|
|
|
|
|
|
|
|
|
|
|
|
|
|
|
|
|
|
|
|
|
|
|
|
|
|
|
|
|
|
|
|
|
|
|
|
|
|
|
|
|
|
|
|
|
|
|
|
|
|
|
|
|
|
|
|
|
|
|
|
|
|
|
|
|
|
|
|
|
|
|
|
|
|
|
|
|
|
|
|
|
|
|
|
|
|
|
|
|
|
|
|
|
|
|
|
|
|
|
|
|
|
|
|
|
|
|
|
|
|
|
|
|
|
|
|
|
|
|
|
|
|
|
|
|
|
|
|
|
|
|
|
|
|
|
|
|
|
|
|
|
|
|
|
|
|
|
|
|
|
|
|
|
|
|
|
|
|
|
|
|
|
|
|
|
|
|
|
|
|
|
|
|
|
|
|
|
|
|
|
|
|
|
|
|
|
|
|
|
|
|
|
|
|
|
|
|
|
|
|
|
|
|
|
|
|
|
|
|
|
|
|
|
|
|
|
|
|
|
|
|
|
|
|
|
|
|
|
|
|
|
|
|
|
|
|
|
|
|
|
|
|
|
|
|
|
|
|
|
|
|
|
|
|
|
|
|
|
|
|
|
|
|
|
|
|
|
|
|
|
|
|
|
|
|
|
|
|
|
|
|
|
|
|
|
|
|
|
|
|
|
|
|
|
|
|
|
|
|
|
|
|
|
|
|
|
|
|
|
|
|
|
|
|
|
|
|
|
|
|
|
|
|
|
|
|
|
|
|
|
|
|
|
|
|
|
|
|
|
|
|
|
|
|
|
|
|
|
|
|
|
|
|
|
|
|
|
|
|
|
|
|
|
|
|
|
|
|
|
|
|
|
|
|
|
|
|
|
|
|
|
|
|
|
|
|
|
|
|
|
|
|
|
|
|
|
|
|
|
|
|
|
|
|
|
|
|
|
|
|
|
|
|
|
|
|
|
|
|
|
|
|
|
|
|
|
|
|
|
|
|
|
|
|
|
|
|
|
|
|
|
|
|
|
|
|
|
|
|
|
|
|
|
|
|
|
|
|
|
|
|
|
|
|
|
|
|
|
|
|
|
|
|
|
|
|
|
|
|
|
|
|
|
|
|
|
|
|
|
|
|
|
|
|
|
|
|
|
|
|
|
|
|
|
|
|
|
|
|
|
|
|
|
|
|
|
|
|
|
|
|
|
|
|
|
|
|
|
|
|
|
|
|
|
|
|
|
|
|
|
|
|
|
|
|
|
|
|
|
|
|
|
|
|
|
|
|
|
|
|
|
|
|
|
|
(1)This expiration analysis reflects consolidated and unconsolidated properties and includes the effect of early renewals completed on existing leases but excludes the effect of new tenant leases on square feet yet to commence as of 3/31/24.
(2)The period of lease expiration is based on the lease term determined in accordance with GAAP.
(3)Refer to the section entitled “Definitions” for a definition of annualized rental revenue.
COPT Defense Properties
Top 20 Tenants as of 3/31/24 (1)
(dollars and square feet in thousands)
|
|
|
|
|
|
|
|
|
|
|
|
|
|
|
|
|
|
|
|
|
|
|
|
|
|
|
|
|
|
|
| Tenant |
|
|
|
Total
Annualized
Rental Revenue (2) |
|
%
of Total
Annualized
Rental Revenue (2) |
|
Occupied Square Feet |
|
Weighted Average Remaining Lease Term (3) |
| United States Government |
(4) |
|
|
$ |
232,891 |
|
|
35.6 |
% |
|
5,529 |
|
|
3.5 |
|
| Fortune 100 Company |
|
|
|
57,542 |
|
|
8.8 |
% |
|
6,182 |
|
|
7.9 |
|
| General Dynamics Corporation |
|
|
|
32,844 |
|
|
5.0 |
% |
|
703 |
|
|
3.6 |
|
| Northrop Grumman Corporation |
|
|
|
15,048 |
|
|
2.3 |
% |
|
519 |
|
|
5.5 |
|
| The Boeing Company |
|
|
|
14,701 |
|
|
2.2 |
% |
|
443 |
|
|
2.7 |
|
| CACI International Inc |
|
|
|
13,166 |
|
|
2.0 |
% |
|
327 |
|
|
4.2 |
|
| Peraton Corp. |
|
|
|
12,858 |
|
|
2.0 |
% |
|
330 |
|
|
4.5 |
|
| Booz Allen Hamilton, Inc. |
|
|
|
12,103 |
|
|
1.8 |
% |
|
297 |
|
|
1.9 |
|
| Fortune 100 Company |
|
|
|
11,752 |
|
|
1.8 |
% |
|
183 |
|
|
10.5 |
|
| Morrison & Foerster, LLP |
|
|
|
9,631 |
|
|
1.5 |
% |
|
102 |
|
|
13.0 |
|
| CareFirst, Inc. |
|
|
|
9,067 |
|
|
1.4 |
% |
|
264 |
|
|
10.4 |
|
| KBR, Inc. |
|
|
|
7,843 |
|
|
1.2 |
% |
|
309 |
|
|
9.1 |
|
| Yulista Holding, LLC |
|
|
|
7,088 |
|
|
1.1 |
% |
|
368 |
|
|
5.7 |
|
| AT&T Corporation |
|
|
|
6,774 |
|
|
1.0 |
% |
|
321 |
|
|
5.5 |
|
| Mantech International Corp. |
|
|
|
6,584 |
|
|
1.0 |
% |
|
200 |
|
|
1.5 |
|
| Jacobs Solutions Inc. |
|
|
|
6,474 |
|
|
1.0 |
% |
|
185 |
|
|
5.2 |
|
| Wells Fargo & Company |
|
|
|
6,270 |
|
|
1.0 |
% |
|
145 |
|
|
4.4 |
|
| The University System of Maryland |
|
|
|
6,054 |
|
|
0.9 |
% |
|
172 |
|
|
5.8 |
|
| Lockheed Martin Corporation |
|
|
|
5,712 |
|
|
0.9 |
% |
|
194 |
|
|
6.0 |
|
| The Mitre Corporation |
|
|
|
5,406 |
|
|
0.8 |
% |
|
152 |
|
|
2.2 |
|
| Subtotal Top 20 Tenants |
|
|
|
479,808 |
|
|
73.3 |
% |
|
16,925 |
|
|
5.6 |
|
| All remaining tenants |
|
|
|
175,114 |
|
|
26.7 |
% |
|
5,659 |
|
|
4.1 |
|
| Total / Weighted Average |
|
|
|
$ |
654,922 |
|
|
100.0 |
% |
|
22,584 |
|
|
5.2 |
|
(1)For properties owned through unconsolidated real estate JVs, includes COPT Defense’s share of those properties’ ARR of $7.2 million (see page 33 for additional information).
(2)Refer to the section entitled “Definitions” for a definition of annualized rental revenue.
(3)Weighted average remaining lease term is based on the lease term determined in accordance with GAAP. The weighting of the lease term was computed based on occupied square feet (excluding leases not associated with square feet, such as ground leases).
(4)Substantially all of our government leases are subject to early termination provisions which are customary in government leases. As of 3/31/24, $5.8 million of our ARR was through the General Services Administration (GSA), representing 2.5% of our ARR from the United States Government and 0.9% of our total ARR.
COPT Defense Properties
Operating Property Acquisition
(square feet in thousands)
|
|
|
|
|
|
|
|
|
|
|
|
|
|
|
|
|
|
|
|
|
|
|
|
|
|
|
|
|
|
|
|
|
|
|
|
|
|
|
|
|
|
|
|
|
|
|
| Property |
|
Property Segment/Sub-Segment |
|
Location |
|
# of Properties |
|
|
|
Operational Square Feet |
|
Transaction
Date |
|
% Occupied on Transaction Date |
|
Transaction
Value
(in millions) |
| 6841 Benjamin Franklin Drive |
|
Fort Meade/BW Corridor |
|
Columbia, Maryland |
|
1 |
|
|
|
202 |
|
3/15/24 |
|
55.6% |
|
$ |
15 |
|
|
|
|
|
|
|
|
|
|
|
|
|
|
|
|
|
|
|
|
|
|
|
|
|
|
|
|
|
|
|
|
|
|
|
|
|
|
|
|
|
|
|
|
|
|
|
|
|
|
|
|
|
|
|
|
|
|
|
|
|
|
|
|
|
|
|
|
|
|
|
|
|
|
|
|
|
|
|
|
|
|
|
|
|
|
|
|
|
|
|
|
|
|
|
|
|
|
|
|
|
|
|
|
COPT Defense Properties
Summary of Development Projects as of 3/31/24 (1)
(dollars and square feet in thousands)
|
|
|
|
|
|
|
|
|
|
|
|
|
|
|
|
|
|
|
|
|
|
|
|
|
|
|
|
|
|
|
|
|
Total Rentable Square Feet |
% Leased as of 3/31/24 |
as of 3/31/24 (2) |
Actual or Anticipated Shell Completion Date |
Anticipated Operational Date (3) |
| Anticipated Total Cost |
Cost to Date |
Cost to Date Placed in Service |
|
| Property and Segment/Sub-Segment |
Location |
| Defense/IT Portfolio: |
|
|
|
|
|
|
|
|
|
| Fort Meade/BW Corridor: |
|
|
|
|
|
|
|
|
|
| 400 National Business Parkway |
Annapolis Junction, Maryland |
|
138 |
|
0% |
$ |
65,100 |
|
$ |
12,776 |
|
$ |
— |
|
1Q 25 |
1Q 26 |
|
|
|
|
|
|
|
|
|
|
|
|
|
|
|
|
|
|
|
|
|
|
|
|
|
|
|
|
|
|
|
|
|
|
|
|
|
|
|
|
|
|
|
|
|
|
|
|
|
|
| Redstone Arsenal: |
|
|
|
|
|
|
|
| 8100 Rideout Road (4) |
Huntsville, Alabama |
|
128 |
|
42% |
45,991 |
|
33,085 |
|
11,723 |
|
3Q 23 |
3Q 24 |
| 9700 Advanced Gateway |
Huntsville, Alabama |
|
50 |
|
20% |
11,000 |
|
161 |
|
— |
|
1Q 25 |
1Q 26 |
| Subtotal / Average |
|
|
178 |
|
35% |
56,991 |
|
33,246 |
|
11,723 |
|
|
|
|
|
|
|
|
|
|
|
|
|
| Data Center Shells: |
|
|
|
|
|
|
|
|
|
| Southpoint Phase 2 Bldg A |
Northern Virginia |
|
225 |
|
100% |
82,500 |
|
27,222 |
|
— |
|
3Q 24 |
3Q 24 |
| Southpoint Phase 2 Bldg B |
Northern Virginia |
|
193 |
|
100% |
65,000 |
|
5,410 |
|
— |
|
3Q 25 |
3Q 25 |
| MP 3 |
Northern Virginia |
|
225 |
|
100% |
111,800 |
|
10,402 |
|
— |
|
4Q 25 |
4Q 25 |
| Data Center Shells Subtotal / Average |
|
643 |
|
100% |
259,300 |
|
43,034 |
|
— |
|
|
|
|
|
|
|
|
|
|
|
|
|
| Total Defense/IT Portfolio Under Development |
|
959 |
|
74% |
$ |
381,391 |
|
$ |
89,056 |
|
$ |
11,723 |
|
|
|
(1)Includes properties under, or contractually committed for, development as of 3/31/24.
(2)Cost includes land, development, leasing costs and allocated portion of structured parking and other shared infrastructure, if applicable.
(3)Anticipated operational date is the earlier of the estimated date when leases have commenced on 100% of a property’s space or one year from the cessation of major construction activities.
(4)Although classified as under development, 27,000 square feet were operational as of 3/31/24.
COPT Defense Properties
Development Placed in Service as of 3/31/24
(square feet in thousands)
|
|
|
|
|
|
|
|
|
|
|
|
|
|
|
|
|
|
|
|
|
|
|
|
|
|
|
|
|
|
|
|
|
Square Feet Placed in Service |
Total Space Placed in Service % Leased as of 3/31/24 |
|
|
Total Property |
|
|
|
Property Segment/Sub-Segment |
% Leased as of 3/31/24 |
Rentable Square Feet |
|
|
2024 |
|
| Property and Location |
1st Quarter |
|
|
|
|
|
5300 Redstone Gateway
Huntsville, Alabama
|
Redstone Arsenal |
100% |
46 |
|
|
|
46 |
|
|
|
|
|
|
100% |
|
8100 Rideout Road
Huntsville, Alabama
|
Redstone Arsenal |
42% |
128 |
|
|
|
27 |
|
|
|
|
|
|
100% |
|
|
|
|
|
|
|
|
|
|
|
|
|
|
|
|
|
|
|
|
|
|
|
|
|
|
| Total Development Placed in Service |
57% |
174 |
|
|
|
73 |
|
|
|
|
|
|
100% |
% Leased as of 3/31/24 |
|
|
|
|
|
100% |
|
|
|
|
|
|
COPT Defense Properties
Summary of Land Owned/Controlled as of 3/31/24 (1)
(dollars and square feet in thousands)
|
|
|
|
|
|
|
|
|
|
|
|
|
|
|
|
|
|
| Location |
Acres |
|
Estimated Developable Square Feet |
|
Carrying Amount |
| Defense/IT Portfolio land owned/controlled for future development: |
|
|
|
|
|
| Fort Meade/BW Corridor: |
|
|
|
|
|
| National Business Park |
144 |
|
1,483 |
|
|
| Howard County |
19 |
|
290 |
|
|
| Other |
126 |
|
1,338 |
|
|
| Total Fort Meade/BW Corridor |
289 |
|
3,111 |
|
|
| NoVA Defense/IT |
29 |
|
1,171 |
|
|
|
|
|
|
|
|
| Navy Support |
38 |
|
64 |
|
|
| Redstone Arsenal (2) |
295 |
|
3,350 |
|
|
|
|
|
|
|
|
| Total Defense/IT Portfolio land owned/controlled for future development |
651 |
|
7,696 |
|
$ |
158,839 |
|
|
|
|
|
|
|
|
|
|
|
|
|
| Other land owned/controlled |
53 |
|
1,538 |
|
9,656 |
|
|
|
|
|
|
|
|
|
|
|
|
|
|
|
|
|
|
|
|
|
|
|
|
|
| Land held, net |
704 |
|
9,234 |
|
$ |
168,495 |
|
|
|
|
|
|
|
(1)This land inventory schedule includes properties under ground lease to us and excludes all properties listed as development as detailed on page 25. The costs associated with the land included on this summary are reported on our consolidated balance sheet in the line entitled “land held.”
(2)This land is controlled under a long-term master lease agreement to LW Redstone Company, LLC, a consolidated JV (see page 32). As this land is developed in the future, the JV will execute site-specific leases under the master lease agreement. Lease payments will commence under the site-specific leases as cash rents under tenant leases commence at the respective properties.
COPT Defense Properties
Capitalization Overview
(dollars, shares and units in thousands)
|
|
|
|
|
|
|
|
|
|
|
|
|
|
|
|
|
|
|
|
|
|
|
|
|
|
|
|
|
Wtd. Avg. Maturity (Years) (1) |
|
Stated Rate |
|
Effective Rate
(2)(3) |
|
Amount Outstanding at 3/31/24 |
|
|
|
|
|
| Debt |
|
|
|
|
|
|
| Secured debt |
|
1.4 |
|
5.04 |
% |
|
3.54 |
% |
|
$ |
98,820 |
|
| Unsecured debt |
|
5.6 |
|
3.26 |
% |
|
3.34 |
% |
|
2,345,411 |
|
| Total Consolidated Debt |
5.4 |
|
3.33 |
% |
|
3.34 |
% |
|
$ |
2,444,231 |
|
|
|
|
|
|
|
|
|
|
| Fixed-rate debt (3) |
|
5.6 |
|
2.98 |
% |
|
3.34 |
% |
|
$ |
2,444,231 |
|
| Variable-rate debt (3) |
|
3.4 |
|
6.67 |
% |
|
N/A |
|
— |
|
| Total Consolidated Debt |
|
|
|
|
|
|
|
$ |
2,444,231 |
|
|
|
|
|
|
|
|
|
|
|
|
|
|
|
|
|
|
|
| Common Equity |
|
|
|
|
|
|
|
|
| Common Shares |
|
|
|
|
|
|
|
112,641 |
|
| Common Units (4) |
|
|
|
|
|
|
|
2,148 |
|
| Total Common Shares and Units |
|
|
|
|
|
114,789 |
|
|
|
|
|
|
|
|
|
|
Closing Common Share Price on 3/28/24 |
|
|
|
$ |
24.17 |
|
| Equity Market Capitalization (5) |
|
|
|
$ |
2,774,450 |
|
|
|
|
|
|
| Total Market Capitalization (5) |
|
|
|
$ |
5,218,681 |
|
|
|
|
|
|
|
|
|
|
|
(1)Calculated assuming exercise of extension options on our Revolving Credit Facility and term loan.
(2)Excludes the effect of deferred financing cost amortization.
(3)Includes the effect of interest rate swaps with notional amounts totaling $233.0 million that hedge the risk of changes in interest rates on variable-rate debt. We had swaps in place for all of our variable-rate debt balances as of 3/31/24.
(4)Includes certain unvested share-based compensation awards in the form of profit interest units.
(5)Refer to the section entitled “Definitions” for a definition of this measure.
|
|
|
|
|
|
|
|
|
|
|
|
|
|
|
|
|
|
|
|
|
|
|
|
|
|
|
|
|
Investment Grade Ratings & Outlook |
|
Latest Report |
|
Fitch |
|
BBB- |
Stable |
|
11/22/23 |
|
Moody’s |
|
Baa3 |
Stable |
|
1/22/24 |
|
S&P |
BBB- |
Stable |
|
9/7/23 |
COPT Defense Properties
Summary of Outstanding Debt as of 3/31/24
(dollars in thousands)
|
|
|
|
|
|
|
|
|
|
|
|
|
|
|
|
|
|
|
|
|
|
|
|
|
|
|
|
|
|
|
|
|
|
|
|
|
|
|
|
|
|
| Unsecured Debt |
Stated Rate |
|
Amount Outstanding |
Maturity Date |
|
|
Secured Debt |
Stated Rate |
|
Amount Outstanding |
Balloon Payment Due Upon Maturity |
Maturity Date |
|
| Revolving Credit Facility |
SOFR+
0.10%+1.05% |
|
$ |
75,000 |
|
Oct-26 |
(1)(2) |
|
LW Redstone: |
|
|
|
|
|
|
|
1000, 1200 & 1100 Redstone Gateway (3) |
4.47% |
(4) |
$ |
27,865 |
|
$ |
27,649 |
|
Jun-24 |
|
| Senior Unsecured Notes |
|
|
|
|
|
|
| 2.25% due 2026 |
2.25% |
|
400,000 |
|
Mar-26 |
|
|
4000 & 4100 Market Street and 8800 Redstone Gateway (2)(3) |
SOFR
+0.10%+1.55% |
|
22,400 |
|
$ |
22,100 |
|
Mar-25 |
(6) |
| 5.25% due 2028 |
5.25% |
|
345,000 |
|
Sep-28 |
(5) |
|
| 2.00% due 2029 |
2.00% |
|
400,000 |
|
Jan-29 |
|
|
M Square: |
|
|
|
|
|
|
| 2.75% due 2031 |
2.75% |
|
600,000 |
|
Apr-31 |
|
|
5825 & 5850 University Research Court (3) |
3.82% |
|
37,975 |
|
$ |
35,603 |
|
Jun-26 |
|
| 2.90% due 2033 |
2.90% |
|
400,000 |
|
Dec-33 |
|
|
| Subtotal - Senior Unsecured Notes |
2.95% |
|
$ |
2,145,000 |
|
|
|
|
5801 University Research Court (2)(3) |
SOFR
+0.10%+1.45% |
|
10,580 |
|
$ |
10,020 |
|
Aug-26 |
|
|
|
|
|
|
|
|
| Unsecured Bank Term Loans |
|
|
|
|
|
|
Total Secured Debt |
5.04% |
|
$ |
98,820 |
|
|
|
|
| 2026 Maturity |
SOFR+
0.10%+1.30% |
|
$ |
125,000 |
|
Jan-26 |
(2)(7) |
|
|
|
|
|
|
|
|
| Other Unsecured Debt |
0.00% |
|
411 |
|
May-26 |
|
|
|
|
|
|
|
|
|
| Total Unsecured Debt |
3.26% |
|
$ |
2,345,411 |
|
|
|
|
|
|
|
|
|
|
|
|
|
|
|
|
|
|
|
|
|
|
|
|
|
| Debt Summary |
|
|
|
|
|
|
|
|
|
|
|
|
|
| Total Unsecured Debt |
3.26% |
|
$ |
2,345,411 |
|
|
|
|
|
|
|
|
|
|
|
| Total Secured Debt |
5.04% |
|
98,820 |
|
|
|
|
|
|
|
|
|
|
|
| Consolidated Debt |
3.33% |
|
$ |
2,444,231 |
|
|
|
|
|
|
|
|
|
|
|
|
|
|
|
|
|
|
|
|
|
|
|
|
|
| Debt per balance sheet |
|
|
$ |
2,416,873 |
|
|
|
|
|
|
|
|
|
|
|
| Net discounts and deferred financing costs |
|
27,358 |
|
|
|
|
|
|
|
|
|
|
|
| Consolidated Debt |
|
|
2,444,231 |
|
|
|
|
|
|
|
|
|
|
|
| COPT Defense’s share of unconsolidated JV gross debt (8) |
|
52,819 |
|
|
|
|
|
|
|
|
|
|
|
| Gross debt |
|
|
$ |
2,497,050 |
|
|
|
|
|
|
|
|
|
|
|
(1)The Company’s $600.0 million Revolving Credit Facility matures in October 2026 and may be extended by two six-month periods at our option.
(2)Pre-payable anytime without penalty.
(3)These properties are owned through consolidated joint ventures.
(4)Represents the weighted average rate of three loans on the properties.
(5)These notes are due in 2028 unless earlier exchanged, redeemed or repurchased only in the event of certain circumstances and during certain periods defined under the terms of the notes. Upon exchange of the notes, the principal amount of notes exchanged is payable in cash, with the remainder of the exchange obligation, if any, payable in cash, common shares or a combination thereof at our election.
(6)The loan maturity may be extended for two one-year periods, provided certain conditions are met.
(7)The Company’s term loan matures in January 2026 and may be extended by two 12-month periods at our option.
(8)See page 33 for additional disclosure regarding our unconsolidated real estate joint ventures.
COPT Defense Properties
Summary of Outstanding Debt as of 3/31/24 (continued)
(1)Revolving Credit Facility maturity of $75.0 million is included above in 2027 assuming our exercise of two six-month extension options.
(2)Term loan balance of $125.0 million is included in 2028 assuming our exercise of two 12-month extension options. Also includes $345.0 million principal amount of exchangeable senior notes due in 2028 unless earlier exchanged, redeemed or repurchased only in the event of certain circumstances and during certain periods defined under the terms of the notes.
(3)Includes the effect of interest rate swaps with notional amounts totaling $233.0 million that hedge the risk of changes in interest rates on variable-rate debt.
COPT Defense Properties
Debt Analysis
(dollars and square feet in thousands)
|
|
|
|
|
|
|
|
|
|
|
|
|
|
|
|
|
|
|
|
|
|
|
|
|
|
|
|
|
|
|
|
|
|
|
|
|
As of and for Three Months Ended
3/31/24 |
|
|
|
As of and for Three Months Ended
3/31/24
|
| Senior Note Covenants (1) |
|
Required |
|
|
Line of Credit & Term Loan Covenants (1)(2) |
Required |
|
| Total Debt / Total Assets |
|
< 60% |
|
42.5% |
|
Total Debt / Total Assets |
< 60% |
|
38.3% |
| Secured Debt / Total Assets |
|
< 40% |
|
1.7% |
|
Secured Debt / Total Assets |
< 40% |
|
2.0% |
| Debt Service Coverage |
|
> 1.5x |
|
4.3x |
|
Adjusted EBITDA / Fixed Charges |
> 1.5x |
|
4.6x |
| Unencumbered Assets / Unsecured Debt |
|
> 150% |
|
234.3% |
|
Unsecured Debt / Unencumbered Assets |
< 60% |
|
38.0% |
|
|
|
|
|
|
Unencumbered Adjusted NOI / Unsecured Interest Expense |
> 1.75x |
|
4.6x |
|
|
|
|
|
|
|
|
|
|
|
| Debt Ratios |
Page Refer. |
|
|
|
Unencumbered Portfolio Analysis |
|
|
|
| GAAP |
|
|
|
|
|
# of unencumbered properties |
173 |
|
| Debt per balance sheet |
6 |
|
$ |
2,416,873 |
|
|
% of total portfolio |
86 |
% |
| Total assets |
6 |
|
$ |
4,232,895 |
|
|
Unencumbered square feet in-service |
|
20,124 |
|
| Debt to assets |
|
|
57.1 |
% |
|
% of total portfolio |
|
83 |
% |
| Net income |
7 |
|
$ |
33,671 |
|
|
NOI from unencumbered real estate operations |
|
$ |
97,073 |
|
| Debt to net income ratio (2) |
17.9 |
x |
|
% of total NOI from real estate operations |
|
95 |
% |
| Interest expense |
7 |
|
$ |
20,767 |
|
|
Adjusted EBITDA from unencumbered real estate operations |
|
$ |
91,257 |
|
| Net income to interest expense ratio (2) |
|
|
1.6 |
x |
|
% of total adjusted EBITDA from real estate operations |
|
95 |
% |
|
|
|
|
|
|
Unencumbered adjusted book |
|
$ |
5,528,468 |
|
| Non-GAAP |
|
|
|
|
|
% of total adjusted book |
|
95 |
% |
| Net debt |
36 |
|
$ |
2,372,747 |
|
|
|
|
|
|
|
| Adjusted book |
36 |
|
$ |
5,806,374 |
|
|
|
|
|
|
|
| Net debt to adjusted book |
|
|
40.9 |
% |
|
|
|
|
|
|
|
|
|
|
|
|
|
|
|
|
|
| Net debt adj. for fully-leased development |
36 |
|
$ |
2,329,713 |
|
|
|
|
|
|
|
|
|
|
|
|
|
|
|
|
|
| In-place adjusted EBITDA |
11 |
|
$ |
96,654 |
|
|
|
|
|
|
|
|
|
|
|
|
|
|
|
|
|
|
| Net debt to in-place adjusted EBITDA ratio |
6.1 |
x |
|
|
|
|
|
|
|
|
|
|
|
|
|
|
| Net debt adj. for fully-leased devel. to in-place adj. EBITDA ratio |
6.0 |
x |
|
|
|
|
|
|
|
|
|
|
|
|
|
|
| Denominator for debt service coverage |
35 |
|
$ |
20,641 |
|
|
|
|
|
|
|
| Denominator for fixed charge coverage |
35 |
|
$ |
21,230 |
|
|
|
|
|
|
|
| Adjusted EBITDA |
11 |
|
$ |
95,841 |
|
|
|
|
|
|
|
| Adjusted EBITDA debt service coverage ratio |
|
|
4.6 |
x |
|
|
|
|
|
|
| Adjusted EBITDA fixed charge coverage ratio |
|
|
4.5 |
x |
|
|
|
|
|
|
(1)The covenants are calculated as defined in the applicable agreements, and the calculations differ between those agreements.
(2)Refer to the section entitled “Definitions” for a definition of this measure.
COPT Defense Properties
Consolidated Real Estate Joint Ventures as of 3/31/24
(dollars and square feet in thousands)
|
|
|
|
|
|
|
|
|
|
|
|
|
|
|
|
|
|
|
|
|
|
|
|
|
|
|
|
|
|
|
|
|
|
NOI from Real Estate Operations (1) |
|
Venture Level Debt Outstanding (3) |
COPT Defense Nominal
Ownership % |
|
|
|
| Operating Properties |
Operational
Square Feet |
% Occupied |
% Leased |
Three Months Ended |
|
Total Assets (2) |
|
|
|
| Suburban Maryland: |
|
|
|
|
|
|
|
|
|
|
|
M Square Associates, LLC (4 properties) |
414 |
|
88.8% |
95.5% |
$ |
1,565 |
|
|
$ |
92,514 |
|
$ |
48,555 |
|
50% |
|
|
|
| Huntsville, Alabama: |
|
|
|
|
|
|
|
|
|
|
|
LW Redstone Company, LLC (23 properties) |
2,237 |
|
98.0% |
99.2% |
10,660 |
|
|
593,434 |
|
50,265 |
|
85% |
(4) |
|
|
| Washington, D.C.: |
|
|
|
|
|
|
|
|
|
|
|
Stevens Place (1 property) |
188 |
|
60.6% |
83.5% |
1,255 |
|
|
130,123 |
|
— |
|
95% |
|
|
|
| Total / Average |
2,839 |
|
94.2% |
97.7% |
$ |
13,480 |
|
|
$ |
816,071 |
|
$ |
98,820 |
|
|
|
|
|
|
|
|
|
|
|
|
|
|
|
|
|
|
|
|
|
|
|
|
|
|
|
|
|
|
|
|
|
|
|
|
|
|
|
| Non-Operating Properties |
Estimated Developable Square Feet |
|
|
Total Assets (2) |
Venture Level Debt Outstanding |
COPT Defense Nominal Ownership % |
|
| Suburban Maryland: |
|
|
|
|
|
|
|
| M Square Research Park |
348 |
|
|
|
$ |
5,942 |
|
$ |
— |
|
50% |
|
| Huntsville, Alabama: |
|
|
|
|
|
|
|
| Redstone Gateway (5) |
3,501 |
|
|
|
130,075 |
|
— |
|
85% |
(3) |
| Total |
3,849 |
|
|
|
$ |
136,017 |
|
$ |
— |
|
|
|
(1)Represents NOI from real estate operations of the JV operating properties before allocation to JV partners.
(2)Total assets includes the assets of the consolidated JV plus any outside investment basis.
(3)Excludes debt from us to the JV, which is eliminated in the presentation of our consolidated financial statements.
(4)Our partner receives an annual priority return of 13.5% on its $9.0 million in contributed equity, plus certain fees for leasing and development, and we expect to receive all other distributions from the JV.
(5)Total assets include $78.0 million in notes receivable due from the City of Huntsville (including accrued interest and excluding allowance for credit losses) in connection with infrastructure costs funded by the JV.
COPT Defense Properties
Unconsolidated Real Estate Joint Ventures as of 3/31/24 (1)
(dollars and square feet in thousands)
|
|
|
|
|
|
|
|
|
|
|
|
|
|
|
|
|
|
|
| Joint venture information |
|
|
|
|
|
|
|
|
COPT Defense ownership % |
|
10 |
% |
|
|
|
|
|
|
COPT Defense’s investment |
|
$ |
37,615 |
|
(2) |
|
|
|
|
| # of Properties |
|
24 |
|
|
|
|
|
|
|
| Square Feet |
|
4,295 |
|
|
|
|
|
|
|
| % Occupied |
|
100 |
% |
|
|
|
|
|
|
| COPT Defense’s share of ARR |
|
$ |
7,181 |
|
|
|
|
|
|
|
|
|
|
|
|
|
|
|
|
|
|
|
|
|
|
|
| Balance sheet information |
|
Total |
|
COPT Defense’s Share (4) |
|
|
|
|
| Operating properties, net |
|
$ |
953,549 |
|
|
$ |
95,355 |
|
|
|
|
|
| Total assets |
|
$ |
1,052,588 |
|
|
$ |
105,259 |
|
|
|
|
|
| Debt (3) |
|
$ |
524,949 |
|
|
$ |
52,495 |
|
|
|
|
|
|
|
|
|
|
|
|
|
|
|
|
|
|
|
|
|
|
|
| Total liabilities |
|
$ |
609,039 |
|
|
$ |
60,904 |
|
|
|
|
|
|
|
|
|
|
|
|
|
|
|
|
Three Months Ended |
|
|
| Operating information |
|
Total |
|
COPT Defense’s Share (4) |
|
|
|
|
| Revenue |
|
$ |
20,891 |
|
|
$ |
2,089 |
|
|
|
|
|
| Operating expenses |
|
(3,492) |
|
|
(349) |
|
|
|
|
|
| NOI from real estate operations and EBITDAre (5) |
|
17,399 |
|
|
1,740 |
|
|
|
|
|
|
|
|
|
|
|
|
|
|
| Interest expense |
|
(8,933) |
|
|
(893) |
|
|
|
|
|
| Depreciation and amortization |
|
(8,238) |
|
|
(778) |
|
|
|
|
|
|
|
|
|
|
|
|
|
|
| Net income |
|
$ |
228 |
|
|
$ |
69 |
|
|
|
|
|
|
|
|
|
|
|
|
|
|
| NOI from real estate operations (per above) (5) |
|
$ |
17,399 |
|
|
$ |
1,740 |
|
|
|
|
|
|
|
|
|
|
|
|
|
|
| Straight line rent adjustments |
|
(637) |
|
|
(64) |
|
|
|
|
|
| Amortization of acquired above- and below-market rents |
|
(1,988) |
|
|
(199) |
|
|
|
|
|
| Cash NOI from real estate operations (5) |
|
$ |
14,774 |
|
|
$ |
1,477 |
|
|
|
|
|
|
|
|
|
|
|
|
|
|
(1)Includes equity method investments in five JVs that own and operate data center shell properties.
(2)Includes $40.6 million reported in “Investment in unconsolidated real estate joint ventures” and $3.0 million for investments with deficit balances reported in “other liabilities” on our consolidated balance sheet.
(3)Maturities on JV debt range from 2027 (assuming exercise of three one-year extension options) to 2030.
(4)Represents the portion allocable to our ownership interest.
(5)Refer to the section entitled “Definitions” for definitions of these measures.
COPT Defense Properties
Supplementary Reconciliations of Non-GAAP Measures
(in thousands)
|
|
|
|
|
|
|
|
|
|
|
|
|
|
|
|
|
|
|
|
|
|
|
|
|
|
|
|
|
|
|
|
|
|
| |
Three Months Ended |
|
|
| |
3/31/24 |
|
12/31/23 |
|
9/30/23 |
|
6/30/23 |
|
3/31/23 |
|
|
|
|
| Net income (loss) |
$ |
33,671 |
|
|
$ |
34,820 |
|
|
$ |
(221,207) |
|
|
$ |
31,642 |
|
|
$ |
80,398 |
|
|
|
|
|
| Construction contract and other service revenues |
(26,603) |
|
|
(18,167) |
|
|
(11,949) |
|
|
(14,243) |
|
|
(15,820) |
|
|
|
|
|
| Depreciation and other amortization associated with real estate operations |
38,351 |
|
|
36,735 |
|
|
37,620 |
|
|
37,600 |
|
|
36,995 |
|
|
|
|
|
| Construction contract and other service expenses |
26,007 |
|
|
17,167 |
|
|
11,493 |
|
|
13,555 |
|
|
15,201 |
|
|
|
|
|
| Impairment losses |
— |
|
|
— |
|
|
252,797 |
|
|
— |
|
|
— |
|
|
|
|
|
| General and administrative expenses |
8,378 |
|
|
8,240 |
|
|
7,582 |
|
|
7,287 |
|
|
7,996 |
|
|
|
|
|
| Leasing expenses |
2,187 |
|
|
2,308 |
|
|
2,280 |
|
|
2,345 |
|
|
1,999 |
|
|
|
|
|
| Business development expenses and land carry costs |
1,182 |
|
|
797 |
|
|
714 |
|
|
726 |
|
|
495 |
|
|
|
|
|
| Interest expense |
20,767 |
|
|
20,383 |
|
|
17,798 |
|
|
16,519 |
|
|
16,442 |
|
|
|
|
|
| Interest and other income, net |
(4,122) |
|
|
(5,659) |
|
|
(2,529) |
|
|
(2,143) |
|
|
(2,256) |
|
|
|
|
|
| Gain on sales of real estate |
— |
|
|
— |
|
|
— |
|
|
(14) |
|
|
(49,378) |
|
|
|
|
|
|
|
|
|
|
|
|
|
|
|
|
|
|
|
| Equity in (income) loss of unconsolidated entities |
(69) |
|
|
240 |
|
|
68 |
|
|
(111) |
|
|
64 |
|
|
|
|
|
| Unconsolidated real estate JVs NOI allocable to COPT Defense included in equity in income (loss) of unconsolidated entities (1) |
1,740 |
|
|
1,671 |
|
|
1,675 |
|
|
1,671 |
|
|
1,642 |
|
|
|
|
|
| Income tax expense |
168 |
|
|
121 |
|
|
152 |
|
|
190 |
|
|
125 |
|
|
|
|
|
|
|
|
|
|
|
|
|
|
|
|
|
|
|
|
|
|
|
|
|
|
|
|
|
|
|
|
|
|
|
|
|
|
|
|
|
|
|
|
|
|
|
| NOI from real estate operations |
101,657 |
|
|
98,656 |
|
|
96,494 |
|
|
95,024 |
|
|
93,903 |
|
|
|
|
|
| Straight line rent adjustments and lease incentive amortization |
3,632 |
|
|
703 |
|
|
13,262 |
|
|
(2,916) |
|
|
(3,818) |
|
|
|
|
|
| Amortization of acquired above- and below-market rents |
(24) |
|
|
(121) |
|
|
(120) |
|
|
(129) |
|
|
(166) |
|
|
|
|
|
| Amortization of intangibles and other assets to property operating expenses |
147 |
|
|
146 |
|
|
147 |
|
|
146 |
|
|
147 |
|
|
|
|
|
| Lease termination fees, net |
(775) |
|
|
(716) |
|
|
(748) |
|
|
(1,059) |
|
|
(1,221) |
|
|
|
|
|
| Tenant funded landlord assets and lease incentives |
(10,439) |
|
|
(7,548) |
|
|
(19,383) |
|
|
(2,221) |
|
|
(1,230) |
|
|
|
|
|
| Cash NOI adjustments in unconsolidated real estate JVs |
(263) |
|
|
(271) |
|
|
(279) |
|
|
(286) |
|
|
(291) |
|
|
|
|
|
| Cash NOI from real estate operations |
$ |
93,935 |
|
|
$ |
90,849 |
|
|
$ |
89,373 |
|
|
$ |
88,559 |
|
|
$ |
87,324 |
|
|
|
|
|
|
|
|
|
|
|
|
|
|
|
|
|
|
|
| NOI from real estate operations (from above) |
$ |
101,657 |
|
|
$ |
98,656 |
|
|
$ |
96,494 |
|
|
$ |
95,024 |
|
|
$ |
93,903 |
|
|
|
|
|
| Non-Same Property NOI from real estate operations |
(6,254) |
|
|
(3,802) |
|
|
(1,455) |
|
|
(801) |
|
|
(1,180) |
|
|
|
|
|
| Same Property NOI from real estate operations |
95,403 |
|
|
94,854 |
|
|
95,039 |
|
|
94,223 |
|
|
92,723 |
|
|
|
|
|
| Straight line rent adjustments and lease incentive amortization |
5,367 |
|
|
3,142 |
|
|
10,154 |
|
|
(2,696) |
|
|
(3,570) |
|
|
|
|
|
| Amortization of acquired above- and below-market rents |
(69) |
|
|
(121) |
|
|
(120) |
|
|
(129) |
|
|
(166) |
|
|
|
|
|
|
|
|
|
|
|
|
|
|
|
|
|
|
|
| Lease termination fees, net |
(775) |
|
|
(717) |
|
|
(748) |
|
|
(1,059) |
|
|
(1,221) |
|
|
|
|
|
| Tenant funded landlord assets and lease incentives |
(8,190) |
|
|
(7,541) |
|
|
(15,402) |
|
|
(2,213) |
|
|
(1,222) |
|
|
|
|
|
| Cash NOI adjustments in unconsolidated real estate JVs |
(117) |
|
|
(124) |
|
|
(130) |
|
|
(137) |
|
|
(153) |
|
|
|
|
|
| Same Property Cash NOI from real estate operations |
$ |
91,619 |
|
|
$ |
89,493 |
|
|
$ |
88,793 |
|
|
$ |
87,989 |
|
|
$ |
86,391 |
|
|
|
|
|
|
|
|
|
|
|
|
|
|
|
|
|
|
|
(1)See page 33 for additional disclosure regarding our unconsolidated real estate JVs.
COPT Defense Properties
Supplementary Reconciliations of Non-GAAP Measures (continued)
(in thousands)
|
|
|
|
|
|
|
|
|
|
|
|
|
|
|
|
|
|
|
|
|
|
|
|
|
|
|
|
|
|
|
|
|
|
| |
Three Months Ended |
|
|
| |
3/31/24 |
|
12/31/23 |
|
9/30/23 |
|
6/30/23 |
|
3/31/23 |
|
|
|
|
| Real estate revenues |
|
|
|
|
|
|
|
|
|
|
|
|
|
| Lease revenue |
|
|
|
|
|
|
|
|
|
|
|
|
|
| Fixed contractual payments |
$ |
126,198 |
|
|
$ |
123,677 |
|
|
$ |
120,408 |
|
|
$ |
118,461 |
|
|
$ |
116,039 |
|
|
|
|
|
| Variable lease payments (1) |
39,235 |
|
|
36,660 |
|
|
34,860 |
|
|
35,221 |
|
|
34,521 |
|
|
|
|
|
| Lease revenue |
165,433 |
|
|
160,337 |
|
|
155,268 |
|
|
153,682 |
|
|
150,560 |
|
|
|
|
|
| Other property revenue |
1,230 |
|
|
1,225 |
|
|
1,339 |
|
|
1,271 |
|
|
1,121 |
|
|
|
|
|
| Real estate revenues |
$ |
166,663 |
|
|
$ |
161,562 |
|
|
$ |
156,607 |
|
|
$ |
154,953 |
|
|
$ |
151,681 |
|
|
|
|
|
|
|
|
|
|
|
|
|
|
|
|
|
|
|
| Provision for credit (recoveries) losses on billed lease revenue |
$ |
(109) |
|
|
$ |
498 |
|
|
$ |
13 |
|
|
$ |
(196) |
|
|
$ |
269 |
|
|
|
|
|
|
|
|
|
|
|
|
|
|
|
|
|
|
|
|
|
|
|
|
|
|
|
|
|
|
|
|
|
|
|
|
|
|
|
|
|
|
|
|
|
|
|
|
|
|
|
|
|
|
|
|
|
|
|
|
|
|
|
|
|
|
|
|
|
|
|
|
|
|
|
|
|
|
|
|
|
|
|
|
|
|
|
|
|
|
|
|
|
|
|
|
|
|
|
|
|
|
|
|
|
|
|
|
|
|
|
|
|
|
|
|
|
|
|
|
|
|
|
|
|
|
|
|
|
|
|
| Total revenues |
$ |
193,266 |
|
|
$ |
179,729 |
|
|
$ |
168,556 |
|
|
$ |
169,196 |
|
|
$ |
167,501 |
|
|
|
|
|
| Construction contract and other service revenues |
(26,603) |
|
|
(18,167) |
|
|
(11,949) |
|
|
(14,243) |
|
|
(15,820) |
|
|
|
|
|
|
|
|
|
|
|
|
|
|
|
|
|
|
|
| Real estate revenues |
$ |
166,663 |
|
|
$ |
161,562 |
|
|
$ |
156,607 |
|
|
$ |
154,953 |
|
|
$ |
151,681 |
|
|
|
|
|
|
|
|
|
|
|
|
|
|
|
|
|
|
|
|
|
|
|
|
|
|
|
|
|
|
|
|
|
|
|
|
|
|
|
|
|
|
|
|
|
|
|
|
|
|
|
|
|
|
|
|
|
|
|
|
|
|
|
|
|
|
|
|
|
|
|
|
|
|
|
|
|
|
|
|
|
|
|
|
|
|
|
|
|
|
|
|
|
|
|
|
|
|
|
|
|
|
|
|
|
|
|
|
|
|
|
|
|
|
|
|
|
|
|
|
|
|
|
|
|
|
|
|
|
|
|
|
|
|
|
|
|
|
|
|
|
|
|
|
|
|
|
|
|
|
|
|
|
|
|
|
|
|
|
| Total interest expense |
$ |
20,767 |
|
|
$ |
20,383 |
|
|
$ |
17,798 |
|
|
$ |
16,519 |
|
|
$ |
16,442 |
|
|
|
|
|
| Less: Amortization of deferred financing costs |
(685) |
|
|
(681) |
|
|
(639) |
|
|
(628) |
|
|
(632) |
|
|
|
|
|
| Less: Amortization of net debt discounts, net of amounts capitalized |
(1,014) |
|
|
(1,004) |
|
|
(750) |
|
|
(622) |
|
|
(618) |
|
|
|
|
|
|
|
|
|
|
|
|
|
|
|
|
|
|
|
|
|
|
|
|
|
|
|
|
|
|
|
|
|
| COPT Defense’s share of interest expense of unconsolidated real estate JVs, excluding amortization of deferred financing costs and net debt premium and gain or loss on interest rate derivatives |
804 |
|
|
819 |
|
|
805 |
|
|
791 |
|
|
773 |
|
|
|
|
|
| Denominator for interest coverage |
19,872 |
|
|
19,517 |
|
|
17,214 |
|
|
16,060 |
|
|
15,965 |
|
|
|
|
|
| Scheduled principal amortization |
769 |
|
|
763 |
|
|
753 |
|
|
746 |
|
|
790 |
|
|
|
|
|
| Denominator for debt service coverage |
20,641 |
|
|
20,280 |
|
|
17,967 |
|
|
16,806 |
|
|
16,755 |
|
|
|
|
|
| Capitalized interest |
589 |
|
|
1,028 |
|
|
1,487 |
|
|
1,194 |
|
|
770 |
|
|
|
|
|
|
|
|
|
|
|
|
|
|
|
|
|
|
|
|
|
|
|
|
|
|
|
|
|
|
|
|
|
| Denominator for fixed charge coverage |
$ |
21,230 |
|
|
$ |
21,308 |
|
|
$ |
19,454 |
|
|
$ |
18,000 |
|
|
$ |
17,525 |
|
|
|
|
|
|
|
|
|
|
|
|
|
|
|
|
|
|
|
|
|
|
|
|
|
|
|
|
|
|
|
|
|
| Dividends on unrestricted common and deferred shares |
$ |
33,143 |
|
|
$ |
31,998 |
|
|
$ |
31,996 |
|
|
$ |
31,995 |
|
|
$ |
31,989 |
|
|
|
|
|
| Distributions on unrestricted common units |
500 |
|
|
430 |
|
|
432 |
|
|
433 |
|
|
430 |
|
|
|
|
|
| Dividends and distributions on restricted shares and units |
267 |
|
|
209 |
|
|
200 |
|
|
204 |
|
|
215 |
|
|
|
|
|
|
|
|
|
|
|
|
|
|
|
|
|
|
|
| Total dividends and distributions for GAAP payout ratio |
33,910 |
|
|
32,637 |
|
|
32,628 |
|
|
32,632 |
|
|
32,634 |
|
|
|
|
|
| Dividends and distributions on antidilutive shares and units |
(266) |
|
|
(212) |
|
|
(202) |
|
|
(205) |
|
|
(216) |
|
|
|
|
|
|
|
|
|
|
|
|
|
|
|
|
|
|
|
|
|
|
|
|
|
|
|
|
|
|
|
|
|
|
|
|
|
|
|
|
|
|
|
|
|
|
|
| Dividends and distributions for non-GAAP payout ratios |
$ |
33,644 |
|
|
$ |
32,425 |
|
|
$ |
32,426 |
|
|
$ |
32,427 |
|
|
$ |
32,418 |
|
|
|
|
|
(1)Represents primarily lease revenue associated with property operating expense reimbursements from tenants.
COPT Defense Properties
Supplementary Reconciliations of Non-GAAP Measures (continued)
(in thousands)
|
|
|
|
|
|
|
|
|
|
|
|
|
|
|
|
|
|
|
|
|
|
|
|
|
|
|
|
|
|
|
|
|
|
|
|
|
|
|
|
|
3/31/24 |
|
12/31/23 |
|
9/30/23 |
|
6/30/23 |
|
3/31/23 |
|
|
|
|
| Total assets |
$ |
4,232,895 |
|
|
$ |
4,246,966 |
|
|
$ |
4,239,257 |
|
|
$ |
4,246,346 |
|
|
$ |
4,177,992 |
|
|
|
|
|
| Accumulated depreciation |
1,434,621 |
|
|
1,400,162 |
|
|
1,367,473 |
|
|
1,334,066 |
|
|
1,300,430 |
|
|
|
|
|
|
|
|
|
|
|
|
|
|
|
|
|
|
|
| Accumulated amortization of intangibles on property acquisitions and deferred leasing costs |
225,443 |
|
|
228,484 |
|
|
228,334 |
|
|
226,555 |
|
|
224,791 |
|
|
|
|
|
|
|
|
|
|
|
|
|
|
|
|
|
|
|
| COPT Defense’s share of liabilities of unconsolidated real estate JVs |
60,904 |
|
|
60,583 |
|
|
60,762 |
|
|
60,724 |
|
|
60,734 |
|
|
|
|
|
| COPT Defense’s share of accumulated depreciation and amortization of unconsolidated real estate JVs |
10,364 |
|
|
9,528 |
|
|
8,664 |
|
|
7,800 |
|
|
6,936 |
|
|
|
|
|
| Less: Property - operating lease liabilities |
(33,141) |
|
|
(33,931) |
|
|
(32,940) |
|
|
(33,923) |
|
|
(34,896) |
|
|
|
|
|
| Less: Property - finance lease liabilities |
(409) |
|
|
(415) |
|
|
(420) |
|
|
(426) |
|
|
(431) |
|
|
|
|
|
| Less: Cash and cash equivalents |
(123,144) |
|
|
(167,820) |
|
|
(204,238) |
|
|
(14,273) |
|
|
(15,199) |
|
|
|
|
|
| Less: COPT Defense’s share of cash of unconsolidated real estate JVs |
(1,159) |
|
|
(852) |
|
|
(1,031) |
|
|
(974) |
|
|
(881) |
|
|
|
|
|
| Adjusted book |
$ |
5,806,374 |
|
|
$ |
5,742,705 |
|
|
$ |
5,665,861 |
|
|
$ |
5,825,895 |
|
|
$ |
5,719,476 |
|
|
|
|
|
|
|
|
|
|
|
|
|
|
|
|
|
|
|
Gross debt (page 29) |
$ |
2,497,050 |
|
|
$ |
2,497,613 |
|
|
$ |
2,498,274 |
|
|
$ |
2,249,880 |
|
|
$ |
2,197,488 |
|
|
|
|
|
| Less: Cash and cash equivalents |
(123,144) |
|
|
(167,820) |
|
|
(204,238) |
|
|
(14,273) |
|
|
(15,199) |
|
|
|
|
|
| Less: COPT Defense’s share of cash of unconsolidated real estate JVs |
(1,159) |
|
|
(852) |
|
|
(1,031) |
|
|
(974) |
|
|
(881) |
|
|
|
|
|
| Net debt |
2,372,747 |
|
|
2,328,941 |
|
|
2,293,005 |
|
|
2,234,633 |
|
|
2,181,408 |
|
|
|
|
|
|
|
|
|
|
|
|
|
|
|
|
|
|
|
|
|
|
|
|
|
|
|
|
|
|
|
|
|
| Costs incurred on fully-leased development properties |
(43,034) |
|
|
(53,914) |
|
|
(124,038) |
|
|
(189,407) |
|
|
(137,309) |
|
|
|
|
|
| Net debt adjusted for fully-leased development |
$ |
2,329,713 |
|
|
$ |
2,275,027 |
|
|
$ |
2,168,967 |
|
|
$ |
2,045,226 |
|
|
$ |
2,044,099 |
|
|
|
|
|
|
|
|
|
|
|
|
|
|
|
|
|
|
|
|
|
|
|
|
|
|
|
|
|
|
|
|
|
|
|
|
|
|
|
|
|
|
|
|
|
|
|
|
|
|
|
|
|
|
|
|
|
|
|
|
|
|
|
|
|
|
|
|
|
|
|
|
|
|
|
|
|
|
|
|
|
|
|
|
|
|
|
|
|
COPT Defense Properties
Definitions
Non-GAAP Measures
We believe that the measures defined below that are not determined in accordance with generally accepted accounting principles (“GAAP”) are helpful to investors in measuring our performance and comparing it to that of other real estate investment trusts (“REITs”). Since these measures exclude certain items includable in their respective most comparable GAAP measures, reliance on the measures has limitations; management compensates for these limitations by using the measures simply as supplemental measures that are weighed in balance with other GAAP and non-GAAP measures. These measures should not be used as an alternative to the respective most comparable GAAP measures when evaluating our financial performance or to cash flow from operating, investing and financing activities when evaluating our liquidity or ability to make cash distributions or pay debt service.
Adjusted book
Defined as total assets presented on our consolidated balance sheet, net of lease liabilities associated with property right-of-use assets, and excluding the effect of cash and cash equivalents, accumulated depreciation on real estate properties, accumulated amortization of intangible assets on real estate acquisitions, accumulated amortization of deferred leasing costs and unconsolidated real estate joint ventures (“JVs”) cash and cash equivalents, liabilities and accumulated depreciation and amortization (of intangibles on property acquisitions and deferred leasing costs) allocable to our ownership interest in the JVs. We use adjusted book for purposes of calculating our net debt to adjusted book, which we believe is a useful supplemental measure for investors to use in further understanding the relationship of our outstanding debt to our assets available to service such debt. We believe that total assets is the most directly comparable GAAP measure to this non-GAAP measure.
Adjusted earnings before interest, income taxes, depreciation and amortization (“Adjusted EBITDA”)
Adjusted EBITDA is net income or loss adjusted for the effects of interest expense, depreciation and amortization, gain on sales and impairment losses of real estate and investments in unconsolidated real estate JVs, gain or loss on early extinguishment of debt, loss on interest rate derivatives, net gain or loss on other investments, credit loss expense or recoveries, operating property acquisition costs, income taxes, business development expenses, demolition costs on redevelopment and nonrecurring improvements, executive transition costs and certain other expenses that we believe are not relevant to an investor’s evaluation of our ability to repay debt. Adjusted EBITDA also includes adjustments to net income or loss for the effects of the items noted above pertaining to unconsolidated real estate JVs that were allocable to our ownership interest in the JVs. While EBITDA (earnings before interest, taxes, depreciation and amortization) is a universally-defined supplemental measure, Adjusted EBITDA incorporates additional adjustments for gains and losses from investing and financing activities and certain other items that we believe represent costs that are not closely correlated to (or associated with) our operating performance and are not relevant to an investor’s evaluation of our ability to repay debt. We believe that adjusted EBITDA is a
useful supplemental measure for assessing our un-levered performance and ability to repay outstanding debt from operations. We believe that net income or loss is the most directly comparable GAAP measure to this non-GAAP measure.
Adjusted EBITDA debt service coverage ratio
This measure divides Adjusted EBITDA by the sum of interest expense (excluding amortization of deferred financing costs and amortization of debt discounts and premiums, net of amounts capitalized, and gains or losses on interest rate derivatives) and scheduled principal amortization on mortgage loans.
Amortization of acquisition intangibles included in NOI
Represents the amortization of intangible asset and liability categories that is included in net operating income, including amortization of above- or below-market leases and above- or below-market cost arrangements.
Basic FFO available to common share and common unit holders (“Basic FFO”)
This measure is FFO adjusted to subtract (1) preferred share dividends, (2) income or loss attributable to noncontrolling interests through ownership of preferred units in COPT Defense Properties, L.P. (the “Operating Partnership”) or interests in other consolidated entities not owned by us, (3) depreciation and amortization allocable to noncontrolling interests in other consolidated entities, (4) Basic FFO allocable to share-based compensation awards and (5) issuance costs associated with redeemed preferred shares. With these adjustments, Basic FFO represents FFO available to common shareholders and holders of common units in the Operating Partnership (“common units”). Common units are substantially similar to our common shares of beneficial interest (“common shares”) and are exchangeable into common shares, subject to certain conditions. We believe that Basic FFO is useful to investors due to the close correlation of common units to common shares. We believe that net income or loss is the most directly comparable GAAP measure to this non-GAAP measure.
Cash net operating income (“Cash NOI”)
Defined as NOI from real estate operations adjusted to eliminate the effects of: straight-line rental adjustments, amortization of tenant incentives, amortization of intangibles and other assets included in FFO and NOI, lease termination fees from tenants to terminate their lease obligations prior to the end of the agreed upon lease terms and rental revenue recognized under GAAP resulting from landlord assets and lease incentives funded by tenants. Cash NOI also includes adjustments to NOI from real estate operations for the effects of the items noted above pertaining to unconsolidated real estate JVs that were allocable to our ownership interest in the JVs. Under GAAP, rental revenue is recognized evenly over the term of tenant leases (through straight-line rental adjustments and amortization of tenant incentives), which, given the long term nature of our leases, does not align with the economics of when tenant payments are due to us under the arrangements. Also under GAAP, when a property is acquired, we allocate the acquisition to certain intangible components, which are then amortized into NOI over their estimated lives, even though the resulting revenue adjustments are not reflective of our lease economics. In addition, revenue from lease termination fees and tenant-funded landlord improvements, absent an adjustment from us, would result in large one-time lump sum amounts in Cash NOI that we do not believe are reflective of a property’s long-term value.
COPT Defense Properties
Definitions
We believe that Cash NOI is a useful supplemental measure of operating performance for a REIT’s operating real estate because it makes adjustments to NOI for the above stated items to be more reflective of the economics of when tenant payments are due to us under our leases and the value of our properties. As is the case with NOI, the measure is useful in our opinion in evaluating and comparing the performance of reportable segments, Same Property groupings and individual properties. We believe that net income or loss is the most directly comparable GAAP measure to this non-GAAP measure.
COPT Defense’s share of NOI from unconsolidated real estate JVs
Represents the net of revenues and property operating expenses of real estate operations owned through unconsolidated JVs that are allocable to COPT Defense’s ownership interest. This measure is included in the computation of NOI, our segment performance measure, as discussed below.
Diluted adjusted funds from operations available to common share and common unit holders (“Diluted AFFO”)
Defined as Diluted FFO, as adjusted for comparability, adjusted for the following: (1) the elimination of the effect of (a) noncash rental revenues and property operating expenses (comprised of straight-line rental adjustments, which includes the amortization of recurring tenant incentives, and amortization of acquisition intangibles included in FFO and NOI, both of which are described under “Cash NOI” above), (b) share-based compensation, net of amounts capitalized, (c) amortization of deferred financing costs, (d) amortization of debt discounts and premiums and (e) amortization of settlements of debt hedges; and (2) replacement capital expenditures (defined below). Diluted AFFO also includes adjustments to Diluted FFO, as adjusted for comparability for the effects of the items noted above pertaining to unconsolidated real estate JVs that were allocable to our ownership interest in the JVs. We believe that Diluted AFFO is a useful supplemental measure of operating performance for a REIT because it incorporates adjustments for: certain revenue and expenses that are not associated with cash to or from us during the period; and certain capital expenditures for operating properties incurred during the period that do require cash outlays. We believe that net income or loss is the most directly comparable GAAP measure to this non-GAAP measure.
Diluted FFO available to common share and common unit holders (“Diluted FFO”)
Diluted FFO is Basic FFO adjusted to add back any changes in Basic FFO that would result from the assumed conversion of securities that are convertible or exchangeable into common shares. The computation of Diluted FFO assumes the conversion of common units but does not assume the conversion of other securities that are convertible into common shares if the conversion of those securities would increase Diluted FFO per share in a given period. We believe that Diluted FFO (which includes discontinued operations, if any) is useful to investors because it is the numerator used to compute Diluted FFO per share, discussed below. We believe that net income or loss is the most directly comparable GAAP measure to this non-GAAP measure.
Diluted FFO available to common share and common unit holders, as adjusted for comparability (“Diluted FFO, as adjusted for comparability”)
Defined as Diluted FFO or FFO adjusted to exclude: operating property acquisition costs; gain or loss on early extinguishment of debt; FFO associated with properties that secured non-recourse debt on which we defaulted and, subsequently, extinguished via conveyance of such properties (including property NOI, interest expense and gains on debt extinguishment); loss on interest rate derivatives; executive transition costs associated with named executive officers; and, for periods prior to 10/1/22, demolition costs on redevelopment and nonrecurring improvements and executive transition costs associated with other senior management team members. Diluted FFO, as adjusted for comparability also includes adjustments to Diluted FFO for the effects of the items noted above pertaining to unconsolidated real estate JVs that were allocable to our ownership interest in the JVs. We believe this to be a useful supplemental measure alongside Diluted FFO as it excludes gains and losses from certain investing and financing activities and certain other items that we believe are not closely correlated to (or associated with) our operating performance. We believe that net income or loss is the most directly comparable GAAP measure to this non-GAAP measure.
Diluted FFO per share
Diluted FFO per share is (1) Diluted FFO divided by (2) the sum of the (a) weighted average common shares outstanding during a period, (b) weighted average common units outstanding during a period and (c) weighted average number of potential additional common shares that would have been outstanding during a period if other securities that are convertible or exchangeable into common shares were converted or exchanged. The computation of Diluted FFO per share assumes the conversion of common units but does not assume the conversion of other securities that are convertible into common shares if the conversion of those securities would increase Diluted FFO per share in a given period. We believe that Diluted FFO per share is useful to investors because it provides investors with a further context for evaluating our FFO results in the same manner that investors use earnings per share (“EPS”) in evaluating net income or loss available to common shareholders. We believe that diluted EPS is the most directly comparable GAAP measure to this non-GAAP measure.
Diluted FFO per share, as adjusted for comparability
Defined as (1) Diluted FFO available to common share and common unit holders, as adjusted for comparability divided by (2) the sum of the (a) weighted average common shares outstanding during a period, (b) weighted average common units outstanding during a period and (c) weighted average number of potential additional common shares that would have been outstanding during a period if other securities that are convertible or exchangeable into common shares were converted or exchanged. The computation of this measure assumes the conversion of common units but does not assume the conversion of other securities that are convertible into common shares if the conversion of those securities would increase the per share measure in a given period. We believe this to be a useful supplemental measure alongside Diluted FFO per share as it excludes gains and losses from investing and financing activities and certain other items that we believe are not closely correlated to (or associated with) our operating performance.
COPT Defense Properties
Definitions
We believe that diluted EPS is the most directly comparable GAAP measure to this non-GAAP measure.
Earnings before interest, income taxes, depreciation and amortization for real estate (“EBITDAre”)
Defined as net income or loss adjusted for the effects of interest expense, depreciation and amortization, gains on sales and impairment losses of real estate and investments in unconsolidated real estate JVs, and income taxes. EBITDAre also includes adjustments to net income or loss for the effects of the items noted above pertaining to unconsolidated real estate JVs that were allocable to our ownership interest in the JVs. While EBITDA (earnings before interest, taxes, depreciation and amortization) is a universally-defined supplemental measure, EBITDAre incorporates additional adjustments for gains and losses from investing activities related to our investments in operating properties. We believe that EBITDAre is a useful supplemental measure for assessing our un-levered performance. We believe that net income or loss is the most directly comparable GAAP measure to this non-GAAP measure.
Funds from operations (“FFO” or “FFO per Nareit”)
Defined as net income or loss computed using GAAP, excluding gains on sales and impairment losses of real estate and investments in unconsolidated real estate JVs (net of associated income tax) and real estate-related depreciation and amortization. FFO also includes adjustments to net income or loss for the effects of the items noted above pertaining to unconsolidated real estate JVs that were allocable to our ownership interest in the JVs. We believe that we use the National Association of Real Estate Investment Trust’s (“Nareit”) definition of FFO, although others may interpret the definition differently and, accordingly, our presentation of FFO may differ from those of other REITs. We believe that FFO is useful to management and investors as a supplemental measure of operating performance because, by excluding gains on sales and impairment losses of real estate (net of associated income tax) and real estate-related depreciation and amortization, FFO can help one compare our operating performance between periods. We believe that net income or loss is the most directly comparable GAAP measure to this non-GAAP measure.
Gross debt
Defined as debt reported on our consolidated balance sheet adjusted to exclude net discounts and premiums and deferred financing costs, as further adjusted to include outstanding debt of unconsolidated real estate JVs that were allocable to our ownership interest in the JVs. We believe that this measure is useful to investors as it represents our total outstanding debt, including our share of unconsolidated joint venture debt. We believe that debt reported on our consolidated balance sheet is the most directly comparable GAAP measure to this non-GAAP measure.
In-place adjusted EBITDA
Defined as Adjusted EBITDA, as further adjusted for: (1) certain events occurring in a three month period to reflect Adjusted EBITDA as if the events occurred at the beginning of such period, including: (a) properties acquired, placed in service or expanded upon subsequent to the commencement of a period made in order to reflect a full period of ownership/operations; (b) properties removed from service or in which we disposed of interests; (c) significant mid-period occupancy changes associated with properties recently placed in service as if such occupancy changes occurred at the beginning of such period; and (2) adjustments to deferred rental revenue associated with changes in our assessment of collectability. The measure also includes adjustments for the effects of the items noted above pertaining to unconsolidated real estate JVs that were allocable to our ownership interest in the JVs. We believe that the pro forma adjustments described above are consistent with the requirements for preparation of amounts presented on a pro forma basis in accordance with Article 11 of Regulation S-X. We believe that in-place adjusted EBITDA is a useful supplemental measure of performance for assessing our un-levered performance and ability to repay outstanding debt from operations, as further adjusted for changes in operating properties subsequent to the commencement of a quarter and for the other items noted above that we believe are not closely correlated with our operating performance and are not relevant to an investor’s evaluation of our ability to repay debt. We believe that net income or loss is the most directly comparable GAAP measure to this non-GAAP measure.
Net debt
Defined as Gross debt (total outstanding debt reported per our balance sheet as adjusted to exclude net discounts and premiums and deferred financing costs), as adjusted to subtract cash and cash equivalents as of the end of the period. The measure also includes adjustments to Gross debt for the effects of the items noted above pertaining to unconsolidated real estate JVs that were allocable to our ownership interest in the JVs. We use net debt for purposes of calculating our net debt to adjusted book, which we believe is a useful supplemental measure for investors to use in further understanding the relationship of our outstanding debt to our assets available to service such debt. We believe that debt reported on our consolidated balance sheet is the most directly comparable GAAP measure to this non-GAAP measure.
Net debt adjusted for fully-leased development
Defined as Net debt less costs incurred on properties under development that were 100% leased. We believe that this supplemental measure is useful in providing investors the impact to our debt of fully leased properties under development that are not yet contributing to our adjusted EBITDA. We believe that debt reported on our consolidated balance sheet is the most directly comparable GAAP measure to this non-GAAP measure.
Net debt to Adjusted book
Defined as Net debt divided by Adjusted book (defined above).
COPT Defense Properties
Definitions
Net debt to in-place adjusted EBITDA ratio and Net debt adjusted for fully-leased development to in-place adjusted EBITDA ratio
Defined as Net debt or Net debt adjusted for fully-leased development divided by in-place adjusted EBITDA (defined above) for the three month period that is annualized by multiplying by four.
Net operating income from real estate operations (“NOI”)
NOI, which is our segment performance measure, includes: consolidated real estate revenues; consolidated property operating expenses; and the net of revenues and property operating expenses of real estate operations owned through unconsolidated real estate JVs that are allocable to COPT Defense’s ownership interest in the JVs. We believe that NOI is an important supplemental measure of operating performance for a REIT’s operating real estate because it provides a measure of the core real estate operations that is unaffected by depreciation, amortization, financing and general, administrative and leasing expenses; we believe this measure is particularly useful in evaluating the performance of reportable segments, Same Property groupings and individual properties. We believe that net income or loss is the most directly comparable GAAP measure to this non-GAAP measure.
NOI fixed charge coverage ratio and Adjusted EBITDA fixed charge coverage ratio
These measures divide either NOI from real estate operations or Adjusted EBITDA by the sum of (1) interest expense (excluding amortization of deferred financing costs and amortization of debt discounts and premiums, net of amounts capitalized, and gains or losses on interest rate derivatives), (2) scheduled principal amortization on mortgage loans, (3) capitalized interest, (4) dividends on preferred shares and (5) distributions on preferred units in the Operating Partnership not owned by us.
NOI interest coverage ratio and Adjusted EBITDA interest coverage ratio
These measures divide either NOI from real estate operations or Adjusted EBITDA by interest expense (excluding amortization of deferred financing costs and amortization of debt discounts and premiums, net of amounts capitalized, gains on losses on interest rate derivatives and interest expense on debt in default to be extinguished via conveyance of properties).
Payout ratios based on: Diluted FFO; Diluted FFO, as adjusted for comparability; and Diluted AFFO
These payout ratios are defined as (1) the sum of dividends on common and deferred shares and distributions to holders of interests in the Operating Partnership to the extent they are dilutive in the respective FFO per share numerators divided by (2) the respective non-GAAP measures.
Replacement capital expenditures
Replacement capital expenditures are defined as tenant improvements and incentives, building improvements and leasing costs incurred during the period for operating properties that are not (1) items contemplated prior to the acquisition of a property, (2) improvements associated with the expansion of a building or its improvements, (3) renovations to a building which change the underlying classification of the building (for example, from industrial to office or Class C office to Class B office), (4) capital improvements that represent the addition of something new to the property rather than the replacement of something (for example, the addition of a new heating and air conditioning unit that is not replacing one that was previously there) or (5) replacements of significant components of a building after the building has reached the end of its original useful life. Replacement capital expenditures excludes expenditures of operating properties included in disposition plans during the period that were already sold or are held for future disposition. For cash tenant incentives not due to the tenant for a period exceeding three months past the date on which such incentives were incurred, we recognize such incentives as replacement capital expenditures in the periods such incentives are due to the tenant. Replacement capital expenditures, which is included in the computation of Diluted AFFO, is intended to represent non-transformative capital expenditures of existing properties held for long-term investment. We believe that the excluded expenditures are more closely associated with our investing activities than the performance of our operating portfolio.
Same Property NOI from real estate operations and Same Property cash NOI
from real estate operations Defined as NOI, or Cash NOI, from real estate operations of Same Property groupings. We believe that these are important supplemental measures of Same Property operating performance for the same reasons discussed above for NOI from real estate operations and Cash NOI from real estate operations.
COPT Defense Properties
Definitions
Other Definitions
Acquisition Costs — Transaction costs expensed in connection with executed or anticipated acquisitions of operating properties.
Annualized Rental Revenue (“ARR”) — The monthly contractual base rent as of the reporting date (ignoring free rent then in effect and rent associated with tenant funded landlord assets) multiplied by 12, plus the estimated annualized expense reimbursements under existing leases for occupied space. With regard to properties owned through unconsolidated real estate JVs, we include the portion of ARR allocable to COPT Defense’s ownership interest. We consider ARR to be a useful measure for analyzing revenue sources because, since it is point-in-time based, it does not contain increases and decreases in revenue associated with periods in which lease terms were not in effect; historical revenue under GAAP does contain such fluctuations. We find the measure particularly useful for leasing, tenant, segment and industry analysis.
Average Escalations — Leasing statistic used to report average increase in rental rates over lease terms for leases with a term of greater than one-year.
Cash Rent — Includes monthly contractual base rent (ignoring rent abatements and rent associated with tenant funded landlord assets) multiplied by 12, plus estimated annualized expense reimbursements (average for first 12 months of term for new or renewed leases or as of lease expiration for expiring leases). We believe that cash rent is a useful measure for evaluating the rental rates at the time rent payments commence for our leasing activity, including changes in such rates relative to rates that may have been previously in place.
Committed Cost per Square Foot — Includes tenant improvement allowance (excluding tenant funded landlord assets), leasing commissions and estimated turn key costs and excludes lease incentives. We believe this is a useful measure for evaluating our costs associated with obtaining new leases.
Compound Annual Growth Rate — For renewed space, represents the compound annual growth rate between the first year cash rent of the expired lease and the first year cash rent of the renewal lease.
Debt to Net Income Ratio — Represents debt reported on our consolidated balance sheet divided by net income for the three month period that is annualized by multiplying by four. We do not present this ratio for periods with a net loss.
Defense/IT Portfolio — Represents properties in locations proximate to, or sometimes containing, key U.S. Government (“USG”) defense installations and missions.
Development Properties — Properties under, or contractually committed for, development.
Equity Market Capitalization — Defined as the sum of: (1) the product of the closing price of our common shares on the NYSE and the sum of (a) common shares outstanding and (b) common units outstanding; and (2) the liquidation value of preferred shares and preferred units in our operating partnership.
First Generation Space — Newly-developed or redeveloped space that has never been occupied.
Net Income to Interest Expense Ratio — Represents net income reported on our consolidated statements of operations divided by interest expense. We do not present this ratio for periods with a net loss.
Net Income Payout Ratio — Defined as (1) the sum of dividends on common and deferred shares and distributions to holders of interests in the Operating Partnership divided by (2) net income. We do not present this ratio for periods with a net loss.
Operational Space — The portion of a property in operations (excludes portion under development or redevelopment).
Redevelopment Properties — Properties previously in operations on which activities to substantially renovate such properties were underway or approved.
Same Property — Operating properties stably owned and 100% operational since at least 1/1/23.
Second Generation Space — Space leased that has been previously occupied.
Straight-line Rent — Includes annual minimum base rents, net of abatements and lease incentives and excluding rent associated with tenant funded landlord assets, on a straight-line basis over the term of the lease, and estimated annual expense reimbursements (as of lease commencement for new or renewed leases or as of lease expiration for expiring leases). We believe that straight-line rent is a useful measures for evaluating the rental rates over the related lease terms for our leasing activity, including changes in such rates relative to rates that may have been previously in place.
Total Market Capitalization — Defined as the sum of: (1) consolidated outstanding debt, excluding discounts, premiums and deferred financing costs; (2) the product of the closing price of our common shares on the NYSE and the sum of (a) common shares outstanding and (b) common units outstanding; and (3) the liquidation value of preferred shares and preferred units in our operating partnership.
Total Portfolio — Operating properties, including ones owned through unconsolidated real estate JVs.
Vacancy Leasing Activity Ratio — Square footage associated with prospective tenants for vacant square feet in service divided by total vacant square feet in service.
Vacant Space Leased — Includes acquired first generation space, vacated second generation space and leases executed on developed and redeveloped space previously placed in service.
|
|
|
|
|
|
|
|
|
|
|
|
|
NEWS RELEASE |
|
|
|
|
|
IR Contacts: |
|
|
|
Venkat Kommineni, CFA |
|
Michelle Layne |
|
443.285.5587 |
|
443.285.5452 |
|
venkat.kommineni@copt.com |
|
michelle.layne@copt.com |
COPT Defense Reports First Quarter 2024 Results
_______________________________________________________________
EPS of $0.29
FFO per Share, as Adjusted for Comparability, of $0.62
Exceeded High-End of Guidance
Increased Midpoint of 2024 FFO per Share Guidance by 3-cents to $2.54
Implies 5% FFO per Share Growth at the Midpoint for the Year
Defense/IT Portfolio 95.6% Occupied and 96.8% Leased
Same Property Cash NOI Increased 6.1%
Raised Same Property Cash NOI Guidance for the Year by 50 Basis Points, to 6.0%-7.0%
Committed $91 Million of Capital to New Investments
Placed 73,000 SF of Developments into Service that are 100% Leased
$381 Million of Active Developments (959,000 SF) are 74% Leased
_______________________________________________________________
Excellent Leasing to Start the Year
Total Leasing of 721,000 SF
160,000 SF of Vacancy Leasing
On Track to Achieve Annual Target of 400,000 SF
Tenant Retention of 78%
On Track to Achieve Annual Goal of 75%-85%
_______________________________________________________________
COLUMBIA, MD (BUSINESS WIRE) April 25, 2024 - COPT Defense Properties (“COPT Defense” or the “Company”) (NYSE: CDP) announced results for the first quarter ended March 31, 2024.
Management Comments
Stephen E. Budorick, COPT Defense’s President & Chief Executive Officer, commented, “Our Defense/IT investment strategy, which concentrates our portfolio near priority U.S. defense installations, generated strong results in the first quarter with FFO per share exceeding the midpoint of our guidance range by $0.02. Based on this outperformance and our forecast over the remainder of the year, we increased the midpoint of 2024 FFO per share guidance by $0.03 to $2.54, which implies 5% year-over-year growth.
In terms of internal growth, the strength of demand for our portfolio is evidenced by our same property cash NOI growth of 6.1% for our Total Portfolio and 7.6% for our Defense/IT Portfolio on a year-over-year basis, which led us to increase our 2024 guidance by 50 basis points at the midpoint. Our Defense/IT Portfolio was 95.6% occupied and 96.8% leased at quarter-end, while our tenant retention rate was 78%, all of which we believe compare favorably to other leading REIT sectors.
In terms of external growth, we committed $91 million of capital to new investments which includes two development projects totaling $76 million at The National Business Park and Redstone Gateway, two of our highest occupancy markets. We also acquired Franklin Center in Columbia Gateway for $15 million, which marks our first acquisition since 2015. This transaction is an excellent opportunity to acquire high quality inventory at a deeply discounted basis, and leverage our Defense/IT franchise and strong demand from defense contractors, to create significant shareholder value.
Our actual and expected performance led our Board of Trustees to approve a 3.5% increase in our quarterly dividend in February, which marks our second consecutive annual increase, following the 3.6% raise in 2023. Looking forward, we continue to anticipate compound annual FFO per share growth of roughly 4% between 2023 to 2026.”
Financial Highlights
1st Quarter Financial Results:
•Diluted earnings per share (“EPS”) was $0.29 for the quarter ended March 31, 2024 as compared to $0.70 for the quarter ended March 31, 2023.
•Diluted funds from operations per share (“FFOPS”), as calculated in accordance with Nareit’s definition and as adjusted for comparability, was $0.62 for the quarter ended March 31, 2024 compared to $0.59 for the quarter ended March 31, 2023.
Operating Performance Highlights
Operating Portfolio Summary:
•At March 31, 2024, the Company’s 24.1 million square foot Total Portfolio was 93.6% occupied and 94.9% leased, which includes the 22.0 million square foot Defense/IT Portfolio that was 95.6% occupied and 96.8% leased.
•During the quarter ended March 31, 2024, the Company placed into service $32.3 million of developments totaling 73,000 square feet that were 100% leased.
Same Property Performance:
•At March 31, 2024, the Company’s 22.2 million square foot same property portfolio was 93.5% occupied and 95.0% leased.
•The Company’s same property cash NOI increased 6.1% for the three months ended March 31, 2024 compared to the same period in 2023.
Leasing:
•Total Square Feet Leased: For the quarter ended March 31, 2024, the Company leased 721,000 square feet, including 551,000 square feet of renewals, 160,000 square feet of vacancy leasing, and 10,000 square feet in development projects.
•Tenant Retention Rates: During the quarter ended March 31, 2024, the Company renewed 78% of expiring square feet in its Total Portfolio and 82.9% in its Defense/IT Portfolio.
•Rent Spreads & Average Escalations on Renewing Leases: For the quarter ended March 31, 2024, straight-line rents on renewals increased 3.7% and cash rents on renewed space decreased 2.5%. For the same time period, annual escalations on renewing leases averaged 2.4%.
•Lease Terms: In the quarter ended March 31, 2024, lease terms averaged 4.1 years on renewing leases, 8.2 years on vacancy leasing, and 5.3 years on development projects.
Investment Activity Highlights
•Development Pipeline: The Company’s development pipeline consists of six properties totaling 959,000 square feet that were 74% leased as of March 31, 2024. These projects represent a total estimated investment of $381.4 million, of which $89.1 million has been spent.
•Acquisition: During the quarter, the Company acquired 6841 Benjamin Franklin Center Drive, a 7-story LEED-Gold office building containing 202,000 square feet in Columbia, Maryland for $15 million.
◦Please see the Company’s Franklin Center acquisition press release dated April 25, 2024 for further details and pages 8-14 of the Company’s 1Q24 Results Presentation (refer to the ‘Associated Supplemental Presentation’ section below).
Balance Sheet and Capital Transaction Highlights
•For the quarter ended March 31, 2024, the Company’s adjusted EBITDA fixed charge coverage ratio was 4.5x.
•At March 31, 2024, the Company’s net debt to in-place adjusted EBITDA ratio was 6.1x and its net debt adjusted for fully-leased development to in-place adjusted EBITDA ratio was 6.0x.
•At March 31, 2024, and including the effect of interest rate swaps, the Company’s weighted average effective interest rate on its consolidated debt portfolio was 3.3% with a weighted average maturity of 5.4 years, and 100% of the Company’s debt was subject to fixed interest rates.
Associated Supplemental Presentation
Prior to the call, the Company will post a slide presentation to accompany management’s prepared remarks for its first quarter 2024 conference call; the presentation can be viewed and downloaded from the ‘Financial Info – Financial Results’ section of COPT Defense’s Investors website: https://investors.copt.com/financial-information/financial-results
2024 Guidance
Management is revising its full-year guidance for diluted EPS and diluted FFOPS, per Nareit and as adjusted for comparability, from the prior range of $1.15-$1.23, and $2.47-$2.55, respectively, to new ranges of $1.19-$1.25, and $2.51-$2.57, respectively. Management is establishing second quarter guidance for diluted EPS and diluted FFOPS per Nareit and as adjusted for comparability at $0.29-$0.31 and $0.62-$0.64, respectively. Reconciliations of projected diluted EPS to projected diluted FFOPS, in accordance with Nareit and as adjusted for comparability are as follows:
|
|
|
|
|
|
|
|
|
|
|
|
|
|
|
|
|
|
|
|
|
|
|
|
|
|
|
|
Reconciliation of Diluted EPS to FFOPS, per Nareit,
and As Adjusted for Comparability
|
|
Quarter Ending June 30, 2024 |
|
Year Ending December 31, 2024 |
|
|
Low |
|
High |
|
Low |
|
High |
| Diluted EPS |
|
$ |
0.29 |
|
|
$ |
0.31 |
|
|
$ |
1.19 |
|
|
$ |
1.25 |
|
| Real estate-related depreciation and amortization |
|
0.33 |
|
|
0.33 |
|
|
1.32 |
|
|
1.32 |
|
|
|
|
|
|
|
|
|
|
|
|
|
|
|
|
|
|
|
| Diluted FFOPS, Nareit definition and as adjusted for comparability |
|
$ |
0.62 |
|
|
$ |
0.64 |
|
|
$ |
2.51 |
|
|
$ |
2.57 |
|
Conference Call Information
Management will discuss first quarter 2024 results on its conference call tomorrow at 12:00 p.m. Eastern Time, details of which are listed below:
Conference Call Date: Friday, April 26, 2024
Time: 12:00 p.m. Eastern Time
Participants must register for the conference call at the link below to receive the dial-in number and personal pin. Registering only takes a few moments and provides direct access to the conference call without waiting for an operator. You may register at any time, including up to and after the call start time:
https://register.vevent.com/register/BI45e0b73633dc499fa57ffc62af57efd2
The conference call will also be available via live webcast in the ‘News & Events – IR Calendar’ section of COPT Defense’s Investors website: https://investors.copt.com/news-events/ir-calendar
Replay Information
A replay of the conference call will be immediately available via webcast only on COPT Defense’s Investors website and will be maintained on the website for approximately 90 days after the conference call.
Definitions
For definitions of certain terms used in this press release, please refer to the information furnished in the Company’s Supplemental Information Package furnished on a Form 8-K which can be found on its website (www.copt.com). Reconciliations of non-GAAP measures to the most directly comparable GAAP measures are included in the attached tables.
About COPT Defense
COPT Defense, an S&P MidCap 400 Company, is a self-managed REIT focused on owning, operating and developing properties in locations proximate to, or sometimes containing, key U.S. Government (“USG”) defense installations and missions (referred to as its Defense/IT Portfolio). The Company’s tenants include the USG and their defense contractors, who are primarily engaged in priority national security activities, and who generally require mission-critical and high security property enhancements. As of March 31, 2024, the Company’s Defense/IT Portfolio of 193 properties, including 24 owned through unconsolidated joint ventures, encompassed 22.0 million square feet and was 96.8% leased.
Forward-Looking Information
This press release may contain “forward-looking” statements, as defined in Section 27A of the Securities Act of 1933 and Section 21E of the Securities Exchange Act of 1934, that are based on the Company’s current expectations, estimates and projections about future events and financial trends affecting the Company. Forward-looking statements can be identified by the use of words such as “may,” “will,” “should,” “could,” “believe,” “anticipate,” “expect,” “estimate,” “plan” or other comparable terminology. Forward-looking statements are inherently subject to risks and uncertainties, many of which the Company cannot predict with accuracy and some of which the Company might not even anticipate. Although the Company believes that the expectations, estimates and projections reflected in such forward-looking statements are based on reasonable assumptions at the time made, the Company can give no assurance that these expectations, estimates and projections will be achieved. Future events and actual results may differ materially from those discussed in the forward-looking statements and the Company undertakes no obligation to update or supplement any forward-looking statements.
The areas of risk that may affect these expectations, estimates and projections include, but are not limited to, those risks described in Item 1A of the Company’s Annual Report on Form 10-K for the year ended December 31, 2023.
COPT Defense Properties
Summary Financial Data
(unaudited)
(dollars and shares in thousands, except per share data)
|
|
|
|
|
|
|
|
|
|
|
|
|
|
|
|
| |
For the Three Months Ended March 31, |
|
|
| |
2024 |
|
2023 |
|
|
|
|
| Revenues |
|
|
|
|
|
|
|
| Lease revenue |
$ |
165,433 |
|
|
$ |
150,560 |
|
|
|
|
|
| Other property revenue |
1,230 |
|
|
1,121 |
|
|
|
|
|
| Construction contract and other service revenues |
26,603 |
|
|
15,820 |
|
|
|
|
|
| Total revenues |
193,266 |
|
|
167,501 |
|
|
|
|
|
| Operating expenses |
|
|
|
|
|
|
|
| Property operating expenses |
66,746 |
|
|
59,420 |
|
|
|
|
|
| Depreciation and amortization associated with real estate operations |
38,351 |
|
|
36,995 |
|
|
|
|
|
| Construction contract and other service expenses |
26,007 |
|
|
15,201 |
|
|
|
|
|
|
|
|
|
|
|
|
|
| General and administrative expenses |
8,378 |
|
|
7,996 |
|
|
|
|
|
| Leasing expenses |
2,187 |
|
|
1,999 |
|
|
|
|
|
| Business development expenses and land carry costs |
1,182 |
|
|
495 |
|
|
|
|
|
| Total operating expenses |
142,851 |
|
|
122,106 |
|
|
|
|
|
| Interest expense |
(20,767) |
|
|
(16,442) |
|
|
|
|
|
| Interest and other income, net |
4,122 |
|
|
2,256 |
|
|
|
|
|
| Gain on sales of real estate |
— |
|
|
49,378 |
|
|
|
|
|
|
|
|
|
|
|
|
|
|
|
|
|
|
|
|
|
|
|
|
|
|
|
|
|
| Income before equity in income (loss) of unconsolidated entities and income taxes |
33,770 |
|
|
80,587 |
|
|
|
|
|
| Equity in income (loss) of unconsolidated entities |
69 |
|
|
(64) |
|
|
|
|
|
| Income tax expense |
(168) |
|
|
(125) |
|
|
|
|
|
|
|
|
|
|
|
|
|
|
|
|
|
|
|
|
|
| Net income |
33,671 |
|
|
80,398 |
|
|
|
|
|
| Net income attributable to noncontrolling interests: |
|
|
|
|
|
|
|
| Common units in the Operating Partnership (“OP”) |
(608) |
|
|
(1,293) |
|
|
|
|
|
|
|
|
|
|
|
|
|
| Other consolidated entities |
(454) |
|
|
(326) |
|
|
|
|
|
|
|
|
|
|
|
|
|
|
|
|
|
|
|
|
|
|
|
|
|
|
|
|
|
| Net income attributable to common shareholders |
$ |
32,609 |
|
|
$ |
78,779 |
|
|
|
|
|
|
|
|
|
|
|
|
|
| Earnings per share (“EPS”) computation: |
|
|
|
|
|
|
|
| Numerator for diluted EPS: |
|
|
|
|
|
|
|
| Net income attributable to common shareholders |
$ |
32,609 |
|
|
$ |
78,779 |
|
|
|
|
|
| Amount allocable to share-based compensation awards |
(129) |
|
|
(248) |
|
|
|
|
|
| Redeemable noncontrolling interests |
— |
|
|
(64) |
|
|
|
|
|
|
|
|
|
|
|
|
|
|
|
|
|
|
|
|
|
| Numerator for diluted EPS |
$ |
32,480 |
|
|
$ |
78,467 |
|
|
|
|
|
| Denominator: |
|
|
|
|
|
|
|
| Weighted average common shares - basic |
112,231 |
|
|
112,127 |
|
|
|
|
|
| Dilutive effect of share-based compensation awards |
509 |
|
|
410 |
|
|
|
|
|
| Dilutive effect of redeemable noncontrolling interests |
— |
|
|
91 |
|
|
|
|
|
|
|
|
|
|
|
|
|
|
|
|
|
|
|
|
|
|
|
|
|
|
|
|
|
| Weighted average common shares - diluted |
112,740 |
|
|
112,628 |
|
|
|
|
|
| Diluted EPS |
$ |
0.29 |
|
|
$ |
0.70 |
|
|
|
|
|
COPT Defense Properties
Summary Financial Data
(unaudited)
(in thousands, except per share data)
|
|
|
|
|
|
|
|
|
|
|
|
|
|
|
|
| |
For the Three Months Ended March 31, |
|
|
| |
2024 |
|
2023 |
|
|
|
|
| Net income |
$ |
33,671 |
|
|
$ |
80,398 |
|
|
|
|
|
| Real estate-related depreciation and amortization |
38,351 |
|
|
36,995 |
|
|
|
|
|
|
|
|
|
|
|
|
|
| Gain on sales of real estate |
— |
|
|
(49,378) |
|
|
|
|
|
|
|
|
|
|
|
|
|
| Depreciation and amortization on unconsolidated real estate JVs |
777 |
|
|
801 |
|
|
|
|
|
| Funds from operations (“FFO”) |
72,799 |
|
|
68,816 |
|
|
|
|
|
| FFO allocable to other noncontrolling interests |
(836) |
|
|
(708) |
|
|
|
|
|
| Basic FFO allocable to share-based compensation awards |
(587) |
|
|
(466) |
|
|
|
|
|
|
|
|
|
|
|
|
|
| Basic FFO available to common share and common unit holders (“Basic FFO”) |
71,376 |
|
|
67,642 |
|
|
|
|
|
|
|
|
|
|
|
|
|
| Redeemable noncontrolling interests |
469 |
|
|
(30) |
|
|
|
|
|
| Diluted FFO adjustments allocable to share-based compensation awards |
47 |
|
|
39 |
|
|
|
|
|
| Diluted FFO available to common share and common unit holders (“Diluted FFO”) |
71,892 |
|
|
67,651 |
|
|
|
|
|
|
|
|
|
|
|
|
|
|
|
|
|
|
|
|
|
|
|
|
|
|
|
|
|
|
|
|
|
|
|
|
|
|
|
|
|
|
|
|
|
|
|
|
|
|
|
|
|
|
|
|
|
|
|
|
|
|
|
|
|
|
|
|
|
|
|
|
|
|
|
|
|
| Executive transition costs |
77 |
|
|
— |
|
|
|
|
|
|
|
|
|
|
|
|
|
| Diluted FFO available to common share and common unit holders, as adjusted for comparability |
71,969 |
|
|
67,651 |
|
|
|
|
|
| Straight line rent adjustments and lease incentive amortization |
3,473 |
|
|
(3,516) |
|
|
|
|
|
| Amortization of intangibles and other assets included in net operating income (“NOI”) |
122 |
|
|
(19) |
|
|
|
|
|
| Share-based compensation, net of amounts capitalized |
2,645 |
|
|
1,733 |
|
|
|
|
|
| Amortization of deferred financing costs |
685 |
|
|
632 |
|
|
|
|
|
| Amortization of net debt discounts, net of amounts capitalized |
1,014 |
|
|
618 |
|
|
|
|
|
|
|
|
|
|
|
|
|
| Replacement capital expenditures |
(20,776) |
|
|
(28,210) |
|
|
|
|
|
| Other |
137 |
|
|
(273) |
|
|
|
|
|
| Diluted adjusted funds from operations available to common share and common unit holders (“Diluted AFFO”) |
$ |
59,269 |
|
|
$ |
38,616 |
|
|
|
|
|
| Diluted FFO per share |
$ |
0.62 |
|
|
$ |
0.59 |
|
|
|
|
|
| Diluted FFO per share, as adjusted for comparability |
$ |
0.62 |
|
|
$ |
0.59 |
|
|
|
|
|
| Dividends/distributions per common share/unit |
$ |
0.295 |
|
|
$ |
0.285 |
|
|
|
|
|
COPT Defense Properties
Summary Financial Data
(unaudited)
(Dollars and shares in thousands, except per share data)
|
|
|
|
|
|
|
|
|
|
|
|
|
March 31,
2024 |
|
December 31,
2023 |
| Balance Sheet Data |
|
|
|
| Properties, net of accumulated depreciation |
$ |
3,517,878 |
|
|
$ |
3,503,678 |
|
| Total assets |
$ |
4,232,895 |
|
|
$ |
4,246,966 |
|
| Debt per balance sheet |
$ |
2,416,873 |
|
|
$ |
2,416,287 |
|
| Total liabilities |
$ |
2,683,883 |
|
|
$ |
2,699,631 |
|
| Redeemable noncontrolling interests |
$ |
22,966 |
|
|
$ |
23,580 |
|
| Total equity |
$ |
1,526,046 |
|
|
$ |
1,523,755 |
|
| Debt to assets |
57.1 |
% |
|
56.9 |
% |
| Net debt to adjusted book |
40.9 |
% |
|
40.6 |
% |
|
|
|
|
| Defense/IT Portfolio Data (as of period end) |
|
|
|
| Number of operating properties |
193 |
|
|
190 |
|
| Total operational square feet (in thousands) |
21,993 |
|
|
21,719 |
|
| % Occupied |
95.6 |
% |
|
96.2 |
% |
| % Leased |
96.8 |
% |
|
97.2 |
% |
|
|
|
|
|
|
|
|
|
|
|
|
|
|
|
|
|
|
|
|
|
For the Three Months Ended March 31, |
|
|
| 2024 |
|
2023 |
|
|
|
|
| GAAP |
|
|
|
|
|
|
|
| Payout ratio: |
|
|
|
|
|
|
|
| Net income |
100.7 |
% |
|
40.6 |
% |
|
|
|
|
| Debt ratios: |
|
|
|
|
|
|
|
| Net income to interest expense ratio |
1.6 |
x |
|
4.9 |
x |
|
|
|
|
| Debt to net income ratio |
17.9 |
x |
|
6.6 |
x |
|
|
|
|
| Non-GAAP |
|
|
|
|
|
|
|
| Payout ratios: |
|
|
|
|
|
|
|
| Diluted FFO |
46.8 |
% |
|
47.9 |
% |
|
|
|
|
| Diluted FFO, as adjusted for comparability |
46.7 |
% |
|
47.9 |
% |
|
|
|
|
| Diluted AFFO |
56.8 |
% |
|
83.9 |
% |
|
|
|
|
| Debt ratios: |
|
|
|
|
|
|
|
| Adjusted EBITDA fixed charge coverage ratio |
4.5 |
x |
|
5.0 |
x |
|
|
|
|
| Net debt to in-place adjusted EBITDA ratio |
6.1 |
x |
|
6.2 |
x |
|
|
|
|
|
|
|
|
|
|
|
|
| Net debt adj. for fully-leased development to in-place adj. EBITDA ratio |
6.0 |
x |
|
5.8 |
x |
|
|
|
|
|
|
|
|
|
|
|
|
|
|
|
|
|
|
|
|
| Reconciliation of denominators for per share measures |
|
|
|
|
|
|
| Denominator for diluted EPS |
112,740 |
|
|
112,628 |
|
|
|
|
|
| Weighted average common units |
1,625 |
|
|
1,489 |
|
|
|
|
|
|
|
|
|
|
|
|
|
| Redeemable noncontrolling interests |
947 |
|
|
— |
|
|
|
|
|
|
|
|
|
|
|
|
|
|
|
|
|
|
|
|
|
|
|
|
|
|
|
|
|
|
|
|
|
|
|
|
|
| Denominator for diluted FFO per share and as adjusted for comparability |
115,312 |
|
|
114,117 |
|
|
|
|
|
|
|
|
|
|
|
|
|
COPT Defense Properties
Summary Financial Data
(unaudited)
(in thousands)
|
|
|
|
|
|
|
|
|
|
|
|
|
|
|
|
|
For the Three Months Ended March 31, |
|
|
| |
2024 |
|
2023 |
|
|
|
|
| Numerators for Payout Ratios |
|
|
|
|
|
|
|
| Dividends on unrestricted common and deferred shares |
$ |
33,143 |
|
|
$ |
31,989 |
|
|
|
|
|
| Distributions on unrestricted common units |
500 |
|
|
430 |
|
|
|
|
|
| Dividends and distributions on restricted shares and units |
267 |
|
|
215 |
|
|
|
|
|
| Total dividends and distributions for GAAP payout ratio |
33,910 |
|
|
32,634 |
|
|
|
|
|
| Dividends and distributions on antidilutive shares and units |
(266) |
|
|
(216) |
|
|
|
|
|
| Dividends and distributions for non-GAAP payout ratios |
$ |
33,644 |
|
|
$ |
32,418 |
|
|
|
|
|
|
|
|
|
|
|
|
|
| Reconciliation of net income to earnings before interest, income taxes, depreciation and amortization for real estate (“EBITDAre”), adjusted EBITDA and in-place adjusted EBITDA |
|
|
|
|
|
|
|
| Net income |
$ |
33,671 |
|
|
$ |
80,398 |
|
|
|
|
|
| Interest expense |
20,767 |
|
|
16,442 |
|
|
|
|
|
| Income tax expense |
168 |
|
|
125 |
|
|
|
|
|
| Real estate-related depreciation and amortization |
38,351 |
|
|
36,995 |
|
|
|
|
|
| Other depreciation and amortization |
608 |
|
|
602 |
|
|
|
|
|
|
|
|
|
|
|
|
|
| Gain on sales of real estate |
— |
|
|
(49,378) |
|
|
|
|
|
|
|
|
|
|
|
|
|
| Adjustments from unconsolidated real estate JVs |
1,671 |
|
|
1,704 |
|
|
|
|
|
| EBITDAre |
95,236 |
|
|
86,888 |
|
|
|
|
|
| Credit loss expense |
22 |
|
|
67 |
|
|
|
|
|
| Business development expenses |
630 |
|
|
241 |
|
|
|
|
|
|
|
|
|
|
|
|
|
|
|
|
|
|
|
|
|
| Executive transition costs |
430 |
|
|
247 |
|
|
|
|
|
|
|
|
|
|
|
|
|
|
|
|
|
|
|
|
|
|
|
|
|
|
|
|
|
| Net gain on other investments |
(477) |
|
|
— |
|
|
|
|
|
| Adjusted EBITDA |
95,841 |
|
|
87,443 |
|
|
|
|
|
| Pro forma NOI adjustment for property changes within period |
813 |
|
|
(318) |
|
|
|
|
|
| Change in collectability of deferred rental revenue |
— |
|
|
899 |
|
|
|
|
|
|
|
|
|
|
|
|
|
| In-place adjusted EBITDA |
$ |
96,654 |
|
|
$ |
88,024 |
|
|
|
|
|
|
|
|
|
|
|
|
|
|
|
|
|
|
|
|
|
|
|
|
|
|
|
|
|
| Reconciliations of tenant improvements and incentives, building improvements and leasing costs for operating properties to replacement capital expenditures |
|
|
|
|
|
|
|
| Tenant improvements and incentives |
$ |
12,776 |
|
|
$ |
19,986 |
|
|
|
|
|
| Building improvements |
4,953 |
|
|
2,141 |
|
|
|
|
|
| Leasing costs |
3,590 |
|
|
1,750 |
|
|
|
|
|
| Net additions to tenant improvements and incentives |
316 |
|
|
4,839 |
|
|
|
|
|
| Excluded building improvements and leasing costs |
(859) |
|
|
(506) |
|
|
|
|
|
|
|
|
|
|
|
|
|
|
|
|
|
|
|
|
|
| Replacement capital expenditures |
$ |
20,776 |
|
|
$ |
28,210 |
|
|
|
|
|
COPT Defense Properties
Summary Financial Data
(unaudited)
(in thousands)
|
|
|
|
|
|
|
|
|
|
|
|
|
|
|
|
|
For the Three Months Ended March 31, |
|
|
| |
2024 |
|
2023 |
|
|
|
|
| Reconciliation of interest expense to the denominator for fixed charge coverage-Adjusted EBITDA |
|
|
|
|
|
|
|
| Interest expense |
$ |
20,767 |
|
|
$ |
16,442 |
|
|
|
|
|
| Less: Amortization of deferred financing costs |
(685) |
|
|
(632) |
|
|
|
|
|
| Less: Amortization of net debt discounts, net of amounts capitalized |
(1,014) |
|
|
(618) |
|
|
|
|
|
|
|
|
|
|
|
|
|
|
|
|
|
|
|
|
|
| COPT Defense’s share of interest expense of unconsolidated real estate JVs, excluding amortization of deferred financing costs and net debt premium and gain or loss on interest rate derivatives |
804 |
|
|
773 |
|
|
|
|
|
| Scheduled principal amortization |
769 |
|
|
790 |
|
|
|
|
|
| Capitalized interest |
589 |
|
|
770 |
|
|
|
|
|
|
|
|
|
|
|
|
|
|
|
|
|
|
|
|
|
| Denominator for fixed charge coverage-Adjusted EBITDA |
$ |
21,230 |
|
|
$ |
17,525 |
|
|
|
|
|
|
|
|
|
|
|
|
|
| Reconciliation of net income to NOI from real estate operations, same property NOI from real estate operations and same property cash NOI from real estate operations |
|
|
|
|
|
|
|
| Net income |
$ |
33,671 |
|
|
$ |
80,398 |
|
|
|
|
|
| Construction contract and other service revenues |
(26,603) |
|
|
(15,820) |
|
|
|
|
|
| Depreciation and other amortization associated with real estate operations |
38,351 |
|
|
36,995 |
|
|
|
|
|
| Construction contract and other service expenses |
26,007 |
|
|
15,201 |
|
|
|
|
|
|
|
|
|
|
|
|
|
| General and administrative expenses |
8,378 |
|
|
7,996 |
|
|
|
|
|
| Leasing expenses |
2,187 |
|
|
1,999 |
|
|
|
|
|
| Business development expenses and land carry costs |
1,182 |
|
|
495 |
|
|
|
|
|
| Interest expense |
20,767 |
|
|
16,442 |
|
|
|
|
|
| Interest and other income, net |
(4,122) |
|
|
(2,256) |
|
|
|
|
|
| Gain on sales of real estate |
— |
|
|
(49,378) |
|
|
|
|
|
|
|
|
|
|
|
|
|
| Equity in (income) loss of unconsolidated entities |
(69) |
|
|
64 |
|
|
|
|
|
| Unconsolidated real estate JVs NOI allocable to COPT Defense included in equity in income (loss) of unconsolidated entities |
1,740 |
|
|
1,642 |
|
|
|
|
|
| Income tax expense |
168 |
|
|
125 |
|
|
|
|
|
|
|
|
|
|
|
|
|
|
|
|
|
|
|
|
|
|
|
|
|
|
|
|
|
| NOI from real estate operations |
101,657 |
|
|
93,903 |
|
|
|
|
|
| Non-Same Property NOI from real estate operations |
(6,254) |
|
|
(1,180) |
|
|
|
|
|
| Same Property NOI from real estate operations |
95,403 |
|
|
92,723 |
|
|
|
|
|
| Straight line rent adjustments and lease incentive amortization |
5,367 |
|
|
(3,570) |
|
|
|
|
|
| Amortization of acquired above- and below-market rents |
(69) |
|
|
(166) |
|
|
|
|
|
|
|
|
|
|
|
|
|
| Lease termination fees, net |
(775) |
|
|
(1,221) |
|
|
|
|
|
| Tenant funded landlord assets and lease incentives |
(8,190) |
|
|
(1,222) |
|
|
|
|
|
| Cash NOI adjustments in unconsolidated real estate JVs |
(117) |
|
|
(153) |
|
|
|
|
|
| Same Property Cash NOI from real estate operations |
$ |
91,619 |
|
|
$ |
86,391 |
|
|
|
|
|
COPT Defense Properties
Summary Financial Data
(unaudited)
(in thousands)
|
|
|
|
|
|
|
|
|
|
|
|
|
|
|
|
|
March 31,
2024 |
|
December 31,
2023 |
| Reconciliation of total assets to adjusted book |
|
|
|
|
| Total assets |
|
$ |
4,232,895 |
|
|
$ |
4,246,966 |
|
| Accumulated depreciation |
|
1,434,621 |
|
|
1,400,162 |
|
|
|
|
|
|
| Accumulated amortization of intangibles on property acquisitions and deferred leasing costs |
|
225,443 |
|
|
228,484 |
|
|
|
|
|
|
| COPT Defense’s share of liabilities of unconsolidated real estate JVs |
|
60,904 |
|
|
60,583 |
|
| COPT Defense’s share of accumulated depreciation and amortization of unconsolidated real estate JVs |
|
10,364 |
|
|
9,528 |
|
| Less: Property - operating lease liabilities |
|
(33,141) |
|
|
(33,931) |
|
| Less: Property - finance lease liabilities |
|
(409) |
|
|
(415) |
|
| Less: Cash and cash equivalents |
|
(123,144) |
|
|
(167,820) |
|
| Less: COPT Defense’s share of cash of unconsolidated real estate JVs |
|
(1,159) |
|
|
(852) |
|
| Adjusted book |
|
$ |
5,806,374 |
|
|
$ |
5,742,705 |
|
|
|
|
|
|
|
|
|
|
|
|
|
|
|
|
|
|
|
|
|
|
|
|
|
|
|
|
|
|
|
|
|
|
|
|
|
|
|
|
|
|
|
|
|
|
|
|
|
|
|
|
|
|
|
|
|
|
|
|
|
|
|
|
|
|
|
|
|
|
|
|
|
|
|
|
|
|
|
March 31,
2024 |
|
December 31,
2023 |
|
March 31,
2023 |
| Reconciliation of debt to net debt and net debt adjusted for fully-leased development |
|
|
|
|
|
|
| Debt per balance sheet |
|
$ |
2,416,873 |
|
|
$ |
2,416,287 |
|
|
$ |
2,123,012 |
|
| Net discounts and deferred financing costs |
|
27,358 |
|
|
28,713 |
|
|
22,250 |
|
| COPT Defense’s share of unconsolidated JV gross debt |
|
52,819 |
|
|
52,613 |
|
|
52,226 |
|
| Gross debt |
|
2,497,050 |
|
|
2,497,613 |
|
|
2,197,488 |
|
| Less: Cash and cash equivalents |
|
(123,144) |
|
|
(167,820) |
|
|
(15,199) |
|
| Less: COPT Defense’s share of cash of unconsolidated real estate JVs |
|
(1,159) |
|
|
(852) |
|
|
(881) |
|
| Net debt |
|
2,372,747 |
|
|
2,328,941 |
|
|
2,181,408 |
|
|
|
|
|
|
|
|
|
|
|
|
|
|
|
| Costs incurred on fully-leased development properties |
|
(43,034) |
|
|
(53,914) |
|
|
(137,309) |
|
| Net debt adjusted for fully-leased development |
|
$ |
2,329,713 |
|
|
$ |
2,275,027 |
|
|
$ |
2,044,099 |
|
|
|
|
|
|
|
|
|
|
|
|
|
|
|
|
|
|
|
|
|
|
|
|
|
|
|
|
|
|
|
|
|
|
|
|
|
|
|
|
|
|
|