| 1-9317 | 04-6558834 | |||||||
| (Commission File Number) | (IRS Employer Identification No.) | |||||||
Two North Riverside Plaza, Suite 2000, Chicago, IL |
60606
|
|||||||
| (Address of principal executive offices) | (Zip Code) | |||||||
| ☐ | Written communications pursuant to Rule 425 under the Securities Act (17 CFR 230.425) | ||||
| ☐ | Soliciting material pursuant to Rule 14a-12 under the Exchange Act (17 CFR 240.14a-12) | ||||
| ☐ | Pre-commencement communications pursuant to Rule 14d-2(b) under the Exchange Act (17 CFR 240.14d-2(b)) | ||||
| ☐ | Pre-commencement communications pursuant to Rule 13e-4(c) under the Exchange Act (17 CFR 240.13e-4(c)) | ||||
| Securities registered pursuant to Section 12(b) of the Exchange Act: | ||||||||||||||
| Title Of Each Class | Trading Symbol | Name of Each Exchange On Which Registered | ||||||||||||
| Common Shares of Beneficial Interest | EQC | New York Stock Exchange | ||||||||||||
| 6.50% Series D Cumulative Convertible Preferred Shares of Beneficial Interest | EQCpD | New York Stock Exchange | ||||||||||||
| 99.1 | ||||||||
| 99.2 | ||||||||
| 104 | The cover page from this Current Report on form 8-K, formatted in Inline XBRL. | |||||||
| EQUITY COMMONWEALTH | ||||||||
| By: | /s/ William H. Griffiths | |||||||
| Name: | William H. Griffiths | |||||||
| Title: | Executive Vice President, Chief | |||||||
| Financial Officer and Treasurer | ||||||||

| March 31, 2024 | December 31, 2023 | ||||||||||
| ASSETS | |||||||||||
| Real estate properties: | |||||||||||
| Land | $ | 44,060 | $ | 44,060 | |||||||
| Buildings and improvements | 371,550 | 367,827 | |||||||||
| 415,610 | 411,887 | ||||||||||
| Accumulated depreciation | (180,266) | (180,535) | |||||||||
| 235,344 | 231,352 | ||||||||||
| Cash and cash equivalents | 2,170,834 | 2,160,535 | |||||||||
| Rents receivable | 16,593 | 15,737 | |||||||||
| Other assets, net | 16,915 | 17,417 | |||||||||
| Total assets | $ | 2,439,686 | $ | 2,425,041 | |||||||
| LIABILITIES AND EQUITY | |||||||||||
| Accounts payable, accrued expenses and other | $ | 20,833 | $ | 27,298 | |||||||
| Rent collected in advance | 2,166 | 1,990 | |||||||||
| Distributions payable | 3,359 | 5,640 | |||||||||
| Total liabilities | $ | 26,358 | $ | 34,928 | |||||||
| Shareholders’ equity: | |||||||||||
| Preferred shares of beneficial interest, $0.01 par value: 50,000,000 shares authorized; | |||||||||||
| Series D preferred shares; 6.50% cumulative convertible; 4,915,196 shares issued and outstanding, aggregate liquidation preference of $122,880 | $ | 119,263 | $ | 119,263 | |||||||
Common shares of beneficial interest, $0.01 par value: 350,000,000 shares authorized; 107,223,284 and 106,847,438 shares issued and outstanding, respectively |
1,072 | 1,068 | |||||||||
| Additional paid in capital | 3,935,501 | 3,935,873 | |||||||||
| Cumulative net income | 3,952,384 | 3,926,979 | |||||||||
| Cumulative common distributions | (4,864,195) | (4,864,440) | |||||||||
| Cumulative preferred distributions | (735,673) | (733,676) | |||||||||
| Total shareholders’ equity | 2,408,352 | 2,385,067 | |||||||||
| Noncontrolling interest | 4,976 | 5,046 | |||||||||
| Total equity | $ | 2,413,328 | $ | 2,390,113 | |||||||
| Total liabilities and equity | $ | 2,439,686 | $ | 2,425,041 | |||||||
| Three Months Ended | |||||||||||
| March 31, | |||||||||||
| 2024 | 2023 | ||||||||||
| Revenues: | |||||||||||
| Rental revenue | $ | 13,893 | $ | 14,226 | |||||||
Other revenue (1) |
1,297 | 1,350 | |||||||||
| Total revenues | $ | 15,190 | $ | 15,576 | |||||||
| Expenses: | |||||||||||
| Operating expenses | $ | 6,534 | $ | 7,256 | |||||||
| Depreciation and amortization | 4,357 | 4,310 | |||||||||
| General and administrative | 8,323 | 8,555 | |||||||||
| Total expenses | $ | 19,214 | $ | 20,121 | |||||||
| Interest and other income, net | 29,512 | 28,376 | |||||||||
| Income before income taxes | 25,488 | 23,831 | |||||||||
| Income tax expense | (30) | (1,080) | |||||||||
| Net income | $ | 25,458 | $ | 22,751 | |||||||
| Net income attributable to noncontrolling interest | (53) | (66) | |||||||||
| Net income attributable to Equity Commonwealth | $ | 25,405 | $ | 22,685 | |||||||
| Preferred distributions | (1,997) | (1,997) | |||||||||
| Net income attributable to Equity Commonwealth common shareholders | $ | 23,408 | $ | 20,688 | |||||||
Weighted average common shares outstanding — basic (2) |
107,216 | 109,720 | |||||||||
Weighted average common shares outstanding — diluted (2)(3) |
108,224 | 111,300 | |||||||||
| Earnings per common share attributable to Equity Commonwealth common shareholders: | |||||||||||
| Basic | $ | 0.22 | $ | 0.19 | |||||||
| Diluted | $ | 0.22 | $ | 0.19 | |||||||
| (1) | Other revenue is primarily comprised of parking revenue that does not represent a component of a lease. | ||||
| (2) | Weighted average common shares outstanding for the three months ended March 31, 2024 and 2023 includes 129 and 113 unvested, earned RSUs, respectively. | ||||
| (3) | As of March 31, 2024, we had 4,915 series D preferred shares outstanding. The series D preferred shares were convertible into 4,032 common shares as of March 31, 2024 and 2023. The series D preferred shares are anti-dilutive for GAAP EPS for all periods presented. |
||||
| Three Months Ended | |||||||||||
| March 31, | |||||||||||
| 2024 | 2023 | ||||||||||
| Calculation of FFO | |||||||||||
| Net income | $ | 25,458 | $ | 22,751 | |||||||
| Real estate depreciation and amortization | 4,346 | 4,299 | |||||||||
| FFO attributable to Equity Commonwealth | 29,804 | 27,050 | |||||||||
| Preferred distributions | (1,997) | (1,997) | |||||||||
| FFO attributable to EQC common shareholders and unitholders | $ | 27,807 | $ | 25,053 | |||||||
| Calculation of Normalized FFO | |||||||||||
| FFO attributable to EQC common shareholders and unitholders | $ | 27,807 | $ | 25,053 | |||||||
| Straight-line rent adjustments | (223) | 279 | |||||||||
Normalized FFO attributable to EQC common shareholders and unitholders |
$ | 27,584 | $ | 25,332 | |||||||
Weighted average common shares and units outstanding — basic (1) |
107,439 | 110,044 | |||||||||
Weighted average common shares and units outstanding — diluted (1) |
108,447 | 111,624 | |||||||||
FFO attributable to EQC common shareholders and unitholders per share and unit — basic |
$ | 0.26 | $ | 0.23 | |||||||
FFO attributable to EQC common shareholders and unitholders per share and unit — diluted |
$ | 0.26 | $ | 0.22 | |||||||
Normalized FFO attributable to EQC common shareholders and unitholders per share and unit — basic |
$ | 0.26 | $ | 0.23 | |||||||
Normalized FFO attributable to EQC common shareholders and unitholders per share and unit — diluted |
$ | 0.25 | $ | 0.23 | |||||||
| (1) | Our calculations of FFO and Normalized FFO attributable to EQC common shareholders and unitholders per share and unit - basic for the three months ended March 31, 2024 and 2023 include 223 and 324 LTIP/Operating Partnership Units, respectively, that are excluded from the calculation of basic earnings per common share attributable to EQC common shareholders (only). |
||||
We compute FFO in accordance with standards established by Nareit. Nareit defines FFO as net income (loss), calculated in accordance with GAAP, excluding real estate depreciation and amortization, gains (or losses) from sales of depreciable property, impairment of depreciable real estate and our portion of these items related to equity investees and noncontrolling interests. Our calculation of Normalized FFO differs from Nareit’s definition of FFO because we exclude certain items that we view as nonrecurring or impacting comparability from period to period. FFO and Normalized FFO are supplemental non-GAAP financial measures. We consider FFO and Normalized FFO to be appropriate measures of operating performance for a REIT, along with net income (loss), net income (loss) attributable to EQC common shareholders and cash flow from operating activities. | ||
We believe that FFO and Normalized FFO provide useful information to investors because by excluding the effects of certain historical amounts, such as depreciation expense, FFO and Normalized FFO may facilitate a comparison of our operating performance between periods and with other REITs. FFO and Normalized FFO do not represent cash generated by operating activities in accordance with GAAP and should not be considered as alternatives to net income (loss), net income (loss) attributable to EQC common shareholders or cash flow from operating activities, determined in accordance with GAAP, or as indicators of our financial performance or liquidity, nor are these measures necessarily indicative of sufficient cash flow to fund all of our needs. These measures should be considered in conjunction with net income (loss), net income (loss) attributable to EQC common shareholders and cash flow from operating activities as presented in our condensed consolidated statements of operations and condensed consolidated statements of cash flows. Other REITs and real estate companies may calculate FFO and Normalized FFO differently than we do. | ||
| For the Three Months Ended | |||||||||||||||||||||||||||||
| 3/31/2024 | 12/31/2023 | 9/30/2023 | 6/30/2023 | 3/31/2023 | |||||||||||||||||||||||||
| Calculation of Same Property NOI and Same Property Cash Basis NOI: | |||||||||||||||||||||||||||||
| Rental revenue | $ | 13,893 | $ | 13,824 | $ | 13,928 | $ | 13,358 | $ | 14,226 | |||||||||||||||||||
Other revenue (1) |
1,297 | 1,322 | 1,284 | 1,232 | 1,350 | ||||||||||||||||||||||||
| Operating expenses | (6,534) | (6,542) | (6,722) | (6,942) | (7,256) | ||||||||||||||||||||||||
| NOI | $ | 8,656 | $ | 8,604 | $ | 8,490 | $ | 7,648 | $ | 8,320 | |||||||||||||||||||
| Straight-line rent adjustments | (223) | (538) | (107) | 273 | 279 | ||||||||||||||||||||||||
| Lease termination fees | (616) | (630) | (173) | (33) | (177) | ||||||||||||||||||||||||
| Cash Basis NOI | $ | 7,817 | $ | 7,436 | $ | 8,210 | $ | 7,888 | $ | 8,422 | |||||||||||||||||||
Cash Basis NOI from non-same properties (2) |
16 | 7 | (5) | (4) | (4) | ||||||||||||||||||||||||
| Same Property Cash Basis NOI | $ | 7,833 | $ | 7,443 | $ | 8,205 | $ | 7,884 | $ | 8,418 | |||||||||||||||||||
| Non-cash rental income and lease termination fees from same properties | 839 | 1,168 | 280 | (240) | (102) | ||||||||||||||||||||||||
| Same Property NOI | $ | 8,672 | $ | 8,611 | $ | 8,485 | $ | 7,644 | $ | 8,316 | |||||||||||||||||||
| Reconciliation of Same Property NOI to GAAP Net Income: | |||||||||||||||||||||||||||||
| Same Property NOI | $ | 8,672 | $ | 8,611 | $ | 8,485 | $ | 7,644 | $ | 8,316 | |||||||||||||||||||
| Non-cash rental income and lease termination fees from same properties | (839) | (1,168) | (280) | 240 | 102 | ||||||||||||||||||||||||
| Same Property Cash Basis NOI | $ | 7,833 | $ | 7,443 | $ | 8,205 | $ | 7,884 | $ | 8,418 | |||||||||||||||||||
Cash Basis NOI from non-same properties (2) |
(16) | (7) | 5 | 4 | 4 | ||||||||||||||||||||||||
| Cash Basis NOI | $ | 7,817 | $ | 7,436 | $ | 8,210 | $ | 7,888 | $ | 8,422 | |||||||||||||||||||
| Straight-line rent adjustments | 223 | 538 | 107 | (273) | (279) | ||||||||||||||||||||||||
| Lease termination fees | 616 | 630 | 173 | 33 | 177 | ||||||||||||||||||||||||
| NOI | $ | 8,656 | $ | 8,604 | $ | 8,490 | $ | 7,648 | $ | 8,320 | |||||||||||||||||||
| Depreciation and amortization | (4,357) | (4,184) | (4,436) | (4,514) | (4,310) | ||||||||||||||||||||||||
| General and administrative | (8,323) | (7,504) | (7,061) | (13,854) | (8,555) | ||||||||||||||||||||||||
| Interest and other income, net | 29,512 | 29,670 | 29,269 | 27,352 | 28,376 | ||||||||||||||||||||||||
| Income before income taxes | $ | 25,488 | $ | 26,586 | $ | 26,262 | $ | 16,632 | $ | 23,831 | |||||||||||||||||||
| Income tax (expense) benefit | (30) | 40 | (30) | (796) | (1,080) | ||||||||||||||||||||||||
| Net income | $ | 25,458 | $ | 26,626 | $ | 26,232 | $ | 15,836 | $ | 22,751 | |||||||||||||||||||
| (1) | Other revenue is primarily comprised of parking revenue that does not represent a component of a lease. | ||||
| (2) | Cash Basis NOI from non-same properties for all periods presented includes the operations of disposed properties. | ||||
NOI is income from our real estate including lease termination fees received from tenants less our property operating expenses. NOI excludes amortization of capitalized tenant improvement costs and leasing commissions and corporate level expenses. Cash Basis NOI is NOI excluding the effects of straight-line rent adjustments, lease value amortization and lease termination fees. The year-to-date same property versions of these measures include the results of properties continuously owned from January 1, 2023 through March 31, 2024.Properties classified as held for sale within our condensed consolidated balance sheets are excluded from the same property versions of these measures. | ||
We consider these supplemental non-GAAP financial measures to be appropriate supplemental measures to net income (loss) because they may help to understand the operations of our properties. We use these measures internally to evaluate property level performance, and we believe that they provide useful information to investors regarding our results of operations because they reflect only those income and expense items that are incurred at the property level and may facilitate comparisons of our operating performance between periods and with other REITs. Cash Basis NOI is among the factors considered with respect to acquisition, disposition and financing decisions. These measures do not represent cash generated by operating activities in accordance with GAAP and should not be considered as an alternative to net income (loss), net income (loss) attributable to Equity Commonwealth common shareholders or cash flow from operating activities, determined in accordance with GAAP, or as indicators of our financial performance or liquidity, nor are these measures necessarily indicative of sufficient cash flow to fund all of our needs. These measures should be considered in conjunction with net income (loss), net income (loss) attributable to EQC common shareholders and cash flow from operating activities as presented in our condensed consolidated statements of operations and condensed consolidated statements of cash flows. Other REITs and real estate companies may calculate these measures differently than we do. | ||

| Corporate Headquarters | Investor Relations | |||||||
| Two North Riverside Plaza | (312) 646-2801 | |||||||
| Suite 2000 | ir@eqcre.com | |||||||
| Chicago, IL 60606 | www.eqcre.com | |||||||
| (312) 646-2800 | ||||||||
| Corporate Information | ||||||||
| Company Profile and Investor Information | ||||||||
| Financial Information | ||||||||
| Key Financial Data | ||||||||
| Condensed Consolidated Balance Sheets | ||||||||
| Additional Balance Sheet Information | ||||||||
| Condensed Consolidated Statements of Operations | ||||||||
Calculation of Same Property Net Operating Income (NOI) and Same Property Cash Basis NOI |
||||||||
| Same Property Results of Operations | ||||||||
| Calculation of EBITDA, EBITDAre, and Adjusted EBITDAre | ||||||||
| Calculation of Funds from Operations (FFO) and Normalized FFO | ||||||||
| Portfolio Information | ||||||||
| Property Detail | ||||||||
| Leasing Summary | ||||||||
| Capital Summary - Expenditures & Same Property Leasing Commitments | ||||||||
| Tenants Representing 2.5% or More of Annualized Rental Revenue | ||||||||
| Same Property Lease Expiration Schedule | ||||||||
| Additional Support | ||||||||
| Common & Potential Common Shares | ||||||||
| Definitions | ||||||||
| Forward-Looking Statements | ||||||||
| Some of the statements contained in this presentation constitute forward-looking statements within the meaning of the federal securities laws including, but not limited to, statements pertaining to our capital resources, portfolio performance, lease expirations schedules, results of operations or anticipated market conditions, including statements regarding the overall impact of COVID-19 and other external factors on the foregoing. Any forward-looking statements contained in this presentation are intended to be made pursuant to the safe harbor provisions of Section 27A of the Securities Act of 1933, as amended, and Section 21E of the Securities Exchange Act of 1934, as amended. Forward-looking statements relate to expectations, beliefs, projections, future plans and strategies, anticipated events or trends and similar expressions concerning matters that are not historical facts. You can identify forward-looking statements by the use of forward-looking terminology, including but not limited to, “may,” “will,” “should,” “could,” “would,” “expects,” “intends,” “plans,” “anticipates,” “believes,” “estimates,” “predicts,” or “potential” or the negative of these words and phrases or similar words or phrases which are predictions of or indicate future events or trends and which do not relate solely to historical matters. You can also identify forward-looking statements by discussions of strategy, plans or intentions. | ||||||||
| Any forward-looking statements contained in this presentation reflect our current views about future events and are subject to numerous known and unknown risks, uncertainties, assumptions and changes in circumstances that may cause our actual results to differ significantly from those expressed in any forward-looking statement. We do not guarantee that the transactions and events described will happen as described (or that they will happen at all). We disclaim any obligation to publicly update or revise any forward-looking statement to reflect changes in underlying assumptions or factors, of new information, data or methods, future events or other changes. For a further discussion of these and other factors that could cause our future results to differ materially from any forward-looking statements, see the section entitled “Risk Factors” in our most recent Annual Report on Form 10-K and subsequent quarterly reports on Form 10-Q. | ||||||||
| Regulation FD Disclosures | ||||||||
We use any of the following to comply with our disclosure obligations under Regulation FD: press releases, SEC filings, public conference calls, or our website. We routinely post important information on our website at www.eqcre.com, including information that may be deemed to be material. We encourage investors and others interested in the company to monitor these distribution channels for material disclosures. | ||||||||
| Same Property Statistics | |||||||||||
| No. of | |||||||||||
| Properties | Sq. Feet | % Leased | % Commenced | ||||||||
| 4 | 1,520,944 | 75.4% | 74.6% | ||||||||
| NYSE Trading Symbols | ||
| Common Stock: EQC | ||
| Preferred Stock Series D: EQCpD | ||
| Board of Trustees | ||||||||||||||
| David Helfand (Chair) | Peter Linneman (Lead Independent Trustee) | James A. Star | ||||||||||||
| Ellen-Blair Chube | Mary Jane Robertson | |||||||||||||
| Martin L. Edelman | Gerald A. Spector | |||||||||||||
| Senior Management | ||||||||||||||
| David A. Helfand | David S. Weinberg | |||||||||||||
| President and Chief Executive Officer | Executive Vice President and | |||||||||||||
| Chief Operating Officer | ||||||||||||||
| William H. Griffiths | Orrin S. Shifrin | |||||||||||||
| Executive Vice President, | Executive Vice President, | |||||||||||||
| Chief Financial Officer and Treasurer | General Counsel and Secretary | |||||||||||||
Equity Research Coverage (1) | |||||||||||
| Citigroup | Nicholas Joseph | (212) 816-1909 | nicholas.joseph@citi.com | ||||||||
| Green Street Advisors | Daniel Ismail | (949) 640-8780 | dismail@greenstreetadvisors.com | ||||||||
| Certain terms are defined in the definitions section of this document. All financial data included herein is unaudited. | |||||
| (1) | Any opinions, estimates or forecasts regarding EQC's performance made by these analysts do not represent opinions, forecasts or predictions of EQC or its management. EQC does not by its reference to the analysts above imply its endorsement of or concurrence with any information, conclusions or recommendations provided by any of these analysts. | ||||
| As of and for the Three Months Ended | ||||||||||||||||||||||||||||||||
| 3/31/2024 | 12/31/2023 | 9/30/2023 | 6/30/2023 | 3/31/2023 | ||||||||||||||||||||||||||||
| OPERATING INFORMATION | ||||||||||||||||||||||||||||||||
Ending property count |
4 | 4 | 4 | 4 | 4 | |||||||||||||||||||||||||||
Ending square footage (1) |
1,521 | 1,521 | 1,521 | 1,521 | 1,507 | |||||||||||||||||||||||||||
Percent leased |
75.4 | % | 81.2 | % | 80.8 | % | 82.0 | % | 81.6 | % | ||||||||||||||||||||||
Percent commenced |
74.6 | % | 80.0 | % | 79.9 | % | 78.2 | % | 77.0 | % | ||||||||||||||||||||||
Net income attributable to EQC common shareholders |
$ | 23,408 | $ | 24,552 | $ | 24,149 | $ | 13,787 | $ | 20,688 | ||||||||||||||||||||||
Adjusted EBITDAre (2) |
29,845 | 30,770 | 30,698 | 27,103 | 28,141 | |||||||||||||||||||||||||||
| SAME PROPERTY OPERATING INFORMATION | ||||||||||||||||||||||||||||||||
Ending square footage (1) |
1,521 | 1,521 | 1,521 | 1,521 | 1,507 | |||||||||||||||||||||||||||
| Percent leased | 75.4 | % | 81.2 | % | 80.8 | % | 82.0 | % | 81.6 | % | ||||||||||||||||||||||
| Percent commenced | 74.6 | % | 80.0 | % | 79.9 | % | 78.2 | % | 77.0 | % | ||||||||||||||||||||||
Same Property NOI (2) |
$ | 8,672 | $ | 8,611 | $ | 8,485 | $ | 7,644 | $ | 8,316 | ||||||||||||||||||||||
Same Property Cash Basis NOI (2) |
7,833 | 7,443 | 8,205 | 7,884 | 8,418 | |||||||||||||||||||||||||||
| Same Property NOI margin | 57.1 | % | 56.9 | % | 55.8 | % | 52.4 | % | 53.4 | % | ||||||||||||||||||||||
| Same Property Cash Basis NOI margin | 54.6 | % | 53.3 | % | 55.0 | % | 53.2 | % | 53.7 | % | ||||||||||||||||||||||
| SHARES OUTSTANDING AND PER SHARE DATA | ||||||||||||||||||||||||||||||||
| Shares Outstanding at End of Period | ||||||||||||||||||||||||||||||||
Common shares outstanding |
107,223 | 106,847 | 106,712 | 109,730 | 109,702 | |||||||||||||||||||||||||||
Dilutive restricted share units (RSUs), Operating Partnership Units, and LTIP Units (3) |
1,358 | 1,467 | 1,779 | 1,891 | 2,068 | |||||||||||||||||||||||||||
Preferred shares outstanding (4) |
4,915 | 4,915 | 4,915 | 4,915 | 4,915 | |||||||||||||||||||||||||||
| Weighted Average Shares Outstanding - GAAP | ||||||||||||||||||||||||||||||||
Basic (5) |
107,216 | 106,905 | 108,931 | 109,839 | 109,720 | |||||||||||||||||||||||||||
Diluted (5) |
108,224 | 108,015 | 110,217 | 111,237 | 111,300 | |||||||||||||||||||||||||||
| Distributions Declared Per Common Share | $ | — | $ | — | $ | — | $ | — | $ | 4.25 | ||||||||||||||||||||||
| BALANCE SHEET | ||||||||||||||||||||||||||||||||
| Total assets | $ | 2,439,686 | $ | 2,425,041 | $ | 2,393,786 | $ | 2,421,843 | $ | 2,399,324 | ||||||||||||||||||||||
| Total liabilities | 26,358 | 34,928 | 31,550 | 30,016 | 30,252 | |||||||||||||||||||||||||||
| MARKET CAPITALIZATION | ||||||||||||||||||||||||||||||||
Market value of preferred shares |
$ | 122,880 | $ | 123,519 | $ | 122,929 | $ | 124,846 | $ | 122,831 | ||||||||||||||||||||||
Market value of diluted common shares |
2,050,009 | 2,079,629 | 1,992,980 | 2,261,441 | 2,314,757 | |||||||||||||||||||||||||||
| Total market capitalization | $ | 2,172,889 | $ | 2,203,148 | $ | 2,115,909 | $ | 2,386,287 | $ | 2,437,588 | ||||||||||||||||||||||
| (1) | Changes in total square footage result from remeasurement. | ||||
| (2) | Non-GAAP financial measures are defined and reconciled to the most directly comparable GAAP measure herein. | ||||
| (3) | Restricted share units (RSUs) and LTIP Units are equity awards that contain both service and market-based vesting components. Refer to the schedule of Common & Potential Common Shares for information regarding RSUs and LTIP Units and their impact on weighted average shares outstanding. | ||||
| (4) | As of March 31, 2024, we had 4,915 series D preferred shares outstanding that were convertible into 4,032 common shares. The series D preferred shares are anti-dilutive for GAAP EPS for all periods presented. Refer to the schedule of Common & Potential Common Shares for information regarding the series D preferred shares and their impact on diluted weighted average shares outstanding for EPS, FFO per share and Normalized FFO per share. |
||||
| (5) | Refer to the schedule of Common & Potential Common Shares for information regarding the components of our weighted average common shares outstanding. | ||||
| March 31, 2024 | December 31, 2023 | ||||||||||
| ASSETS | |||||||||||
| Real estate properties: | |||||||||||
| Land | $ | 44,060 | $ | 44,060 | |||||||
| Buildings and improvements | 371,550 | 367,827 | |||||||||
| 415,610 | 411,887 | ||||||||||
| Accumulated depreciation | (180,266) | (180,535) | |||||||||
| 235,344 | 231,352 | ||||||||||
| Cash and cash equivalents | 2,170,834 | 2,160,535 | |||||||||
| Rents receivable | 16,593 | 15,737 | |||||||||
| Other assets, net | 16,915 | 17,417 | |||||||||
| Total assets | $ | 2,439,686 | $ | 2,425,041 | |||||||
| LIABILITIES AND EQUITY | |||||||||||
| Accounts payable, accrued expenses and other | $ | 20,833 | $ | 27,298 | |||||||
| Rent collected in advance | 2,166 | 1,990 | |||||||||
| Distributions payable | 3,359 | 5,640 | |||||||||
| Total liabilities | $ | 26,358 | $ | 34,928 | |||||||
| Shareholders’ equity: | |||||||||||
| Preferred shares of beneficial interest, $0.01 par value: 50,000,000 shares authorized; | |||||||||||
| Series D preferred shares; 6.50% cumulative convertible; 4,915,196 shares issued and outstanding, aggregate liquidation preference of $122,880 | $ | 119,263 | $ | 119,263 | |||||||
Common shares of beneficial interest, $0.01 par value: 350,000,000 shares authorized; 107,223,284 and 106,847,438 shares issued and outstanding, respectively |
1,072 | 1,068 | |||||||||
| Additional paid in capital | 3,935,501 | 3,935,873 | |||||||||
| Cumulative net income | 3,952,384 | 3,926,979 | |||||||||
| Cumulative common distributions | (4,864,195) | (4,864,440) | |||||||||
| Cumulative preferred distributions | (735,673) | (733,676) | |||||||||
| Total shareholders’ equity | 2,408,352 | 2,385,067 | |||||||||
| Noncontrolling interest | 4,976 | 5,046 | |||||||||
| Total equity | $ | 2,413,328 | $ | 2,390,113 | |||||||
| Total liabilities and equity | $ | 2,439,686 | $ | 2,425,041 | |||||||
| March 31, 2024 | December 31, 2023 | |||||||||||||
| Additional Balance Sheet Information | ||||||||||||||
| Straight-line rents receivable | $ | 15,218 | $ | 14,995 | ||||||||||
| Accounts receivable | 1,375 | 742 | ||||||||||||
| Rents receivable | $ | 16,593 | $ | 15,737 | ||||||||||
| Capitalized lease incentives, net | $ | 1,340 | $ | 1,193 | ||||||||||
| Deferred leasing costs, net | 10,258 | 10,816 | ||||||||||||
| Other | 5,317 | 5,408 | ||||||||||||
| Other assets, net | $ | 16,915 | $ | 17,417 | ||||||||||
| Accounts payable | $ | 2,690 | $ | 2,824 | ||||||||||
| Accrued taxes | 5,560 | 9,527 | ||||||||||||
| Accrued capital expenditures | 5,433 | 2,881 | ||||||||||||
| Accrued leasing costs | 286 | 206 | ||||||||||||
| Security deposits | 2,341 | 2,356 | ||||||||||||
| Other accrued liabilities | 4,523 | 9,504 | ||||||||||||
| Accounts payable, accrued expenses and other | $ | 20,833 | $ | 27,298 | ||||||||||
| Three Months Ended | |||||||||||
| March 31, | |||||||||||
| 2024 | 2023 | ||||||||||
| Revenues: | |||||||||||
| Rental revenue | $ | 13,893 | $ | 14,226 | |||||||
Other revenue (1) |
1,297 | 1,350 | |||||||||
| Total revenues | $ | 15,190 | $ | 15,576 | |||||||
| Expenses: | |||||||||||
| Operating expenses | $ | 6,534 | $ | 7,256 | |||||||
| Depreciation and amortization | 4,357 | 4,310 | |||||||||
| General and administrative | 8,323 | 8,555 | |||||||||
| Total expenses | $ | 19,214 | $ | 20,121 | |||||||
| Interest and other income, net | 29,512 | 28,376 | |||||||||
| Income before income taxes | 25,488 | 23,831 | |||||||||
| Income tax expense | (30) | (1,080) | |||||||||
| Net income | $ | 25,458 | $ | 22,751 | |||||||
| Net income attributable to noncontrolling interest | (53) | (66) | |||||||||
| Net income attributable to Equity Commonwealth | $ | 25,405 | $ | 22,685 | |||||||
Preferred distributions |
(1,997) | (1,997) | |||||||||
| Net income attributable to Equity Commonwealth common shareholders | $ | 23,408 | $ | 20,688 | |||||||
Weighted average common shares outstanding — basic (2) |
107,216 | 109,720 | |||||||||
Weighted average common shares outstanding — diluted (2) |
108,224 | 111,300 | |||||||||
| Earnings per common share attributable to Equity Commonwealth common shareholders: | |||||||||||
| Basic | $ | 0.22 | $ | 0.19 | |||||||
| Diluted | $ | 0.22 | $ | 0.19 | |||||||
| (1) | Other revenue is primarily comprised of parking revenue that does not represent a component of a lease. | ||||
| (2) | Refer to the schedule of Common & Potential Common Shares for information regarding the components of our weighted average common shares outstanding. | ||||
| For the Three Months Ended | |||||||||||||||||||||||||||||
| 3/31/2024 | 12/31/2023 | 9/30/2023 | 6/30/2023 | 3/31/2023 | |||||||||||||||||||||||||
Calculation of Same Property NOI and Same Property Cash Basis NOI: |
|||||||||||||||||||||||||||||
| Rental revenue | $ | 13,893 | $ | 13,824 | $ | 13,928 | $ | 13,358 | $ | 14,226 | |||||||||||||||||||
Other revenue (1) |
1,297 | 1,322 | 1,284 | 1,232 | 1,350 | ||||||||||||||||||||||||
| Operating expenses | (6,534) | (6,542) | (6,722) | (6,942) | (7,256) | ||||||||||||||||||||||||
| NOI | $ | 8,656 | $ | 8,604 | $ | 8,490 | $ | 7,648 | $ | 8,320 | |||||||||||||||||||
| Straight-line rent adjustments | (223) | (538) | (107) | 273 | 279 | ||||||||||||||||||||||||
| Lease termination fees | (616) | (630) | (173) | (33) | (177) | ||||||||||||||||||||||||
| Cash Basis NOI | $ | 7,817 | $ | 7,436 | $ | 8,210 | $ | 7,888 | $ | 8,422 | |||||||||||||||||||
Cash Basis NOI from non-same properties (2) |
16 | 7 | (5) | (4) | (4) | ||||||||||||||||||||||||
| Same Property Cash Basis NOI | $ | 7,833 | $ | 7,443 | $ | 8,205 | $ | 7,884 | $ | 8,418 | |||||||||||||||||||
Non-cash rental income and lease termination fees from same properties |
839 | 1,168 | 280 | (240) | (102) | ||||||||||||||||||||||||
| Same Property NOI | $ | 8,672 | $ | 8,611 | $ | 8,485 | $ | 7,644 | $ | 8,316 | |||||||||||||||||||
Reconciliation of Same Property NOI to GAAP Net Income: |
|||||||||||||||||||||||||||||
| Same Property NOI | $ | 8,672 | $ | 8,611 | $ | 8,485 | $ | 7,644 | $ | 8,316 | |||||||||||||||||||
Non-cash rental income and lease termination fees from same properties |
(839) | (1,168) | (280) | 240 | 102 | ||||||||||||||||||||||||
| Same Property Cash Basis NOI | $ | 7,833 | $ | 7,443 | $ | 8,205 | $ | 7,884 | $ | 8,418 | |||||||||||||||||||
Cash Basis NOI from non-same properties (2) |
(16) | (7) | 5 | 4 | 4 | ||||||||||||||||||||||||
| Cash Basis NOI | $ | 7,817 | $ | 7,436 | $ | 8,210 | $ | 7,888 | $ | 8,422 | |||||||||||||||||||
| Straight-line rent adjustments | 223 | 538 | 107 | (273) | (279) | ||||||||||||||||||||||||
| Lease termination fees | 616 | 630 | 173 | 33 | 177 | ||||||||||||||||||||||||
| NOI | $ | 8,656 | $ | 8,604 | $ | 8,490 | $ | 7,648 | $ | 8,320 | |||||||||||||||||||
| Depreciation and amortization | (4,357) | (4,184) | (4,436) | (4,514) | (4,310) | ||||||||||||||||||||||||
| General and administrative | (8,323) | (7,504) | (7,061) | (13,854) | (8,555) | ||||||||||||||||||||||||
| Interest and other income, net | 29,512 | 29,670 | 29,269 | 27,352 | 28,376 | ||||||||||||||||||||||||
| Income before income taxes | $ | 25,488 | $ | 26,586 | $ | 26,262 | $ | 16,632 | $ | 23,831 | |||||||||||||||||||
| Income tax (expense) benefit | (30) | 40 | (30) | (796) | (1,080) | ||||||||||||||||||||||||
| Net income | $ | 25,458 | $ | 26,626 | $ | 26,232 | $ | 15,836 | $ | 22,751 | |||||||||||||||||||
| (1) | Other revenue is primarily comprised of parking revenue that does not represent a component of a lease. | ||||
| (2) | Cash Basis NOI from non-same properties for all periods presented includes the operations of disposed properties. | ||||
As of and for the Three Months Ended March 31, |
|||||||||||||||||
| 2024 | 2023 | % Change | |||||||||||||||
| Properties | 4 | 4 | |||||||||||||||
Square Feet |
1,521 | 1,507 | |||||||||||||||
| % Leased | 75.4 | % | 81.6 | % | (6.2) | % | |||||||||||
| % Commenced | 74.6 | % | 77.0 | % | (2.4) | % | |||||||||||
Rental revenue |
$ | 13,054 | $ | 14,328 | (8.9) | % | |||||||||||
Other revenue (1) |
1,297 | 1,343 | (3.4) | % | |||||||||||||
Straight-line rent adjustment |
223 | (279) | |||||||||||||||
Lease termination fees |
616 | 177 | |||||||||||||||
Total revenue |
15,190 | 15,569 | (2.4) | % | |||||||||||||
Operating expenses |
(6,518) | (7,253) | (10.1) | % | |||||||||||||
NOI |
$ | 8,672 | $ | 8,316 | 4.3 | % | |||||||||||
NOI Margin |
57.1 | % | 53.4 | % | |||||||||||||
Straight-line rent adjustment |
$ | (223) | $ | 279 | |||||||||||||
Lease termination fees |
(616) | (177) | |||||||||||||||
| Cash Basis NOI | $ | 7,833 | $ | 8,418 | (6.9) | % | |||||||||||
Cash Basis NOI Margin |
54.6 | % | 53.7 | % | |||||||||||||
| (1) | Other revenue is primarily comprised of parking revenue that does not represent a component of a lease. | ||||
| Three Months Ended | |||||||||||
| March 31, | |||||||||||
| 2024 | 2023 | ||||||||||
| Net income | $ | 25,458 | $ | 22,751 | |||||||
Income tax expense |
30 | 1,080 | |||||||||
Depreciation and amortization |
4,357 | 4,310 | |||||||||
EBITDA, EBITDAre and Adjusted EBITDAre |
$ | 29,845 | $ | 28,141 | |||||||
| Three Months Ended | |||||||||||
| March 31, | |||||||||||
| 2024 | 2023 | ||||||||||
| Calculation of FFO | |||||||||||
| Net income | $ | 25,458 | $ | 22,751 | |||||||
| Real estate depreciation and amortization | 4,346 | 4,299 | |||||||||
| FFO attributable to Equity Commonwealth | 29,804 | 27,050 | |||||||||
| Preferred distributions | (1,997) | (1,997) | |||||||||
FFO attributable to EQC common shareholders and unitholders |
$ | 27,807 | $ | 25,053 | |||||||
| Calculation of Normalized FFO | |||||||||||
| FFO attributable to EQC common shareholders and unitholders | $ | 27,807 | $ | 25,053 | |||||||
| Straight-line rent adjustments | (223) | 279 | |||||||||
Normalized FFO attributable to EQC common shareholders and unitholders |
$ | 27,584 | $ | 25,332 | |||||||
Weighted average common shares and units outstanding -- basic (1) |
107,439 | 110,044 | |||||||||
Weighted average common shares and units outstanding -- diluted (1) |
108,447 | 111,624 | |||||||||
FFO attributable to EQC common shareholders and unitholders per share and unit -- basic |
$ | 0.26 | $ | 0.23 | |||||||
FFO attributable to EQC common shareholders and unitholders per share and unit -- diluted |
$ | 0.26 | $ | 0.22 | |||||||
Normalized FFO attributable to EQC common shareholders and unitholders per share and unit -- basic |
$ | 0.26 | $ | 0.23 | |||||||
Normalized FFO attributable to EQC common shareholders and unitholders per share and unit -- diluted |
$ | 0.25 | $ | 0.23 | |||||||
| (1) | Our calculations of FFO and Normalized FFO attributable to EQC common shareholders and unitholders per share and unit - basic for the three months ended March 31, 2024 and 2023 include 223 and 324 LTIP/Operating Partnership Units, respectively, that are excluded from the calculation of basic earnings per common share attributable to EQC common shareholders (only). Refer to the schedule of Common & Potential Common Shares for information regarding the components of our weighted average common shares and units outstanding. |
||||
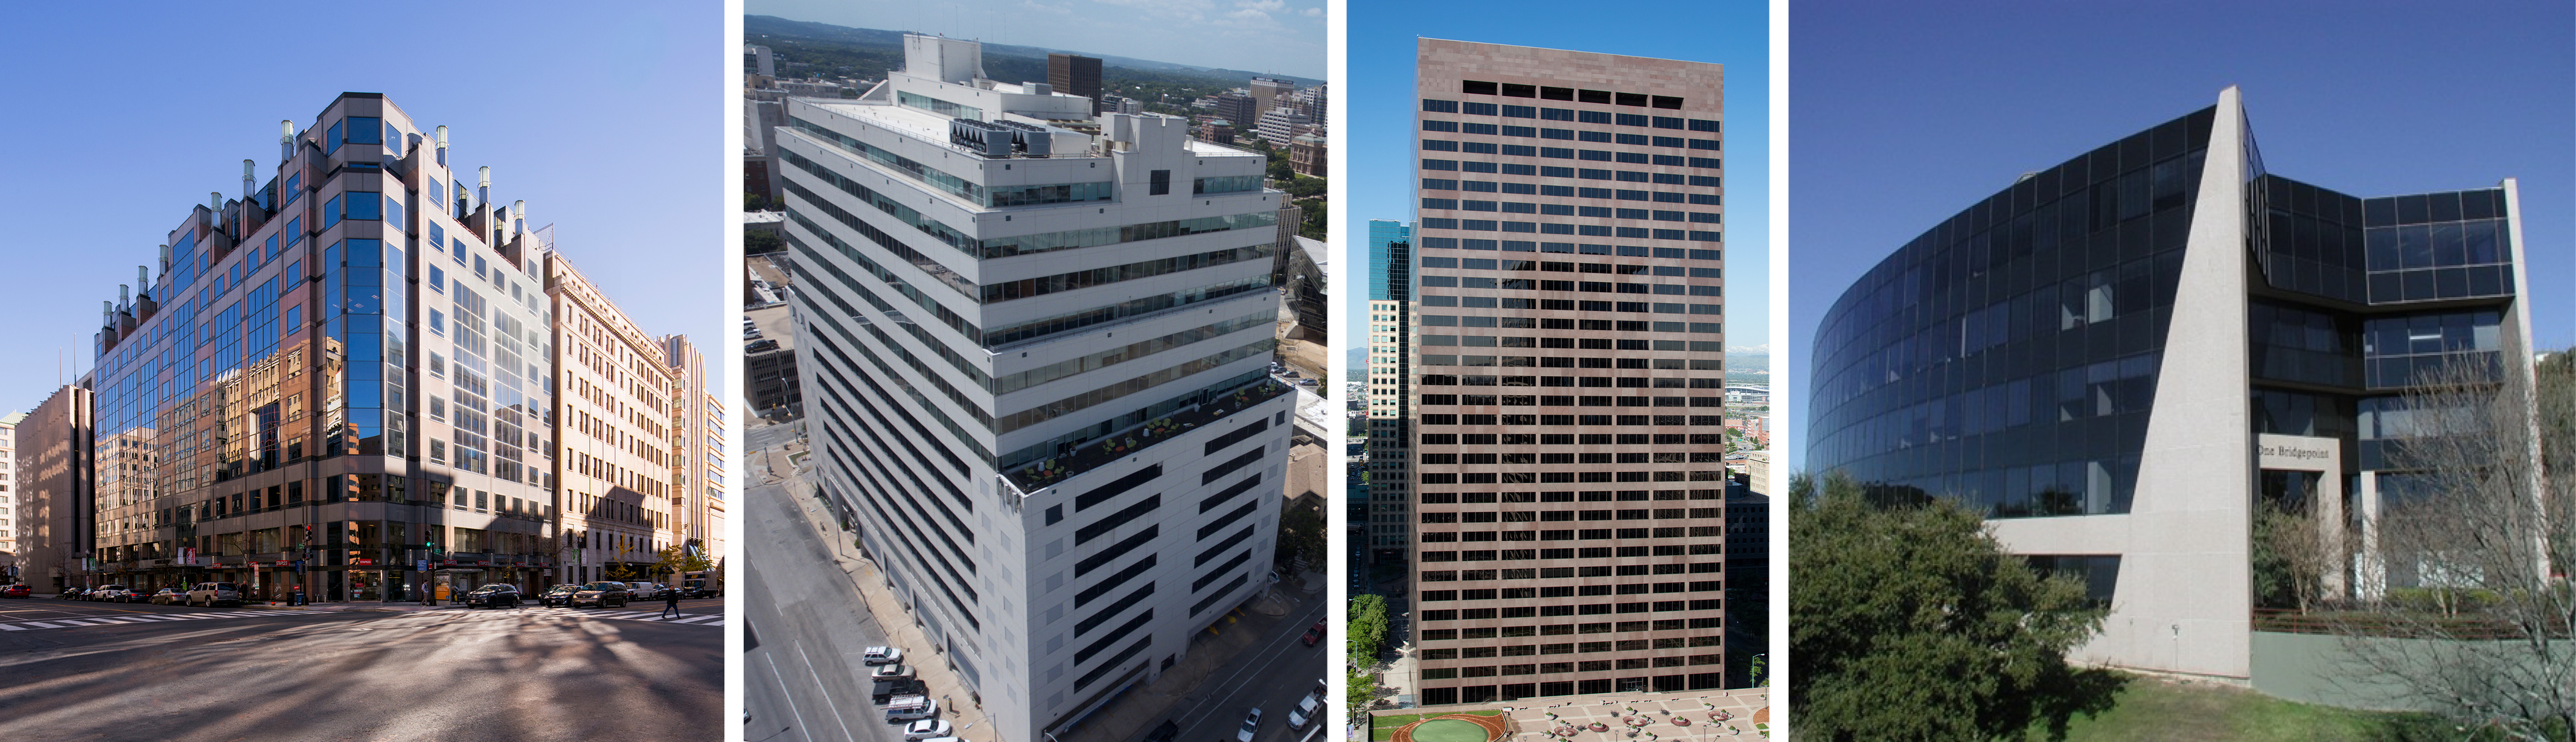
Same Property Portfolio(1) | |||||||||||||||||||||||||||||||||||
| Property | City, State | Type | No. of Buildings | Square Feet | % Leased | % Commenced | Annualized Rental Revenue | Undepreciated Book Value | Net Book Value | Year Acquired | |||||||||||||||||||||||||
| 1 | 1225 Seventeenth Street | Denver, CO | Office | 1 | 708,937 | 91.6 | % | 90.8 | % | $ | 29,594 | $ | 177,668 | $ | 111,586 | 2009 | |||||||||||||||||||
(17th Street Plaza) |
|||||||||||||||||||||||||||||||||||
| 2 | Bridgepoint Square | Austin, TX | Office | 5 | 440,007 | 57.0 | % | 55.9 | % | 9,862 | 104,785 | 47,430 | 1997 | ||||||||||||||||||||||
| 3 | 206 East 9th Street | Austin, TX | Office | 1 | 175,510 | 69.4 | % | 69.4 | % | 8,201 | 56,578 | 42,163 | 2012 | ||||||||||||||||||||||
(Capitol Tower) |
|||||||||||||||||||||||||||||||||||
| 4 | 1250 H Street, NW | Washington, D.C. | Office | 1 | 196,490 | 63.4 | % | 62.5 | % | 7,141 | 76,579 | 34,165 | 1998 | ||||||||||||||||||||||
| Total Same Properties | 8 | 1,520,944 | 75.4 | % | 74.6 | % | $ | 54,798 | $ | 415,610 | $ | 235,344 | |||||||||||||||||||||||
| (1) | Refer to the definitions section of this document for a description of our same property portfolio. | ||||
| As of and for the Three Months Ended | ||||||||||||||||||||||||||||||||
| 3/31/2024 | 12/31/2023 | 9/30/2023 | 6/30/2023 | 3/31/2023 | ||||||||||||||||||||||||||||
Properties |
4 | 4 | 4 | 4 | 4 | |||||||||||||||||||||||||||
Total square feet (1) |
1,521 | 1,521 | 1,521 | 1,521 | 1,507 | |||||||||||||||||||||||||||
| Percentage leased | 75.4 | % | 81.2 | % | 80.8 | % | 82.0 | % | 81.6 | % | ||||||||||||||||||||||
| Percentage commenced | 74.6 | % | 80.0 | % | 79.9 | % | 78.2 | % | 77.0 | % | ||||||||||||||||||||||
| Total Leases | ||||||||||||||||||||||||||||||||
| Square feet | 18 | 32 | 54 | 68 | 60 | |||||||||||||||||||||||||||
| Lease term (years) | 4.1 | 3.0 | 6.4 | 4.9 | 5.8 | |||||||||||||||||||||||||||
| Starting cash rent | $ | 49.71 | $ | 50.88 | $ | 48.17 | $ | 48.34 | $ | 61.15 | ||||||||||||||||||||||
Percent change in cash rent (2) |
(2.8) | % | 7.9 | % | (1.8) | % | (0.7) | % | 3.6 | % | ||||||||||||||||||||||
Percent change in GAAP rent (2) |
(0.5) | % | 26.4 | % | 6.0 | % | 15.3 | % | 13.8 | % | ||||||||||||||||||||||
Total TI & LC per square foot (3) |
$ | 58.93 | $ | 16.97 | $ | 40.57 | $ | 43.44 | $ | 64.87 | ||||||||||||||||||||||
Total TI & LC per sq. ft. per year of lease term (3) |
$ | 14.39 | $ | 5.75 | $ | 6.38 | $ | 8.92 | $ | 11.22 | ||||||||||||||||||||||
| Renewal Leases | ||||||||||||||||||||||||||||||||
| Square feet | 15 | 27 | 39 | 54 | 37 | |||||||||||||||||||||||||||
| Lease term (years) | 4.0 | 2.6 | 7.0 | 4.7 | 5.3 | |||||||||||||||||||||||||||
| Starting cash rent | $ | 49.54 | $ | 52.04 | $ | 49.47 | $ | 49.63 | $ | 63.26 | ||||||||||||||||||||||
Percent change in cash rent (2) |
0.6 | % | 7.9 | % | (1.7) | % | (0.7) | % | 4.8 | % | ||||||||||||||||||||||
Percent change in GAAP rent (2) |
3.2 | % | 26.4 | % | 8.8 | % | 15.3 | % | 16.8 | % | ||||||||||||||||||||||
Total TI & LC per square foot (3) |
$ | 64.35 | $ | 9.46 | $ | 41.02 | $ | 25.17 | $ | 58.65 | ||||||||||||||||||||||
Total TI & LC per sq. ft. per year of lease term (3) |
$ | 15.95 | $ | 3.70 | $ | 5.84 | $ | 5.40 | $ | 11.00 | ||||||||||||||||||||||
| New Leases | ||||||||||||||||||||||||||||||||
| Square feet | 3 | 5 | 15 | 14 | 23 | |||||||||||||||||||||||||||
| Lease term (years) | 4.4 | 5.2 | 4.6 | 5.7 | 6.5 | |||||||||||||||||||||||||||
| Starting cash rent | $ | 50.50 | $ | 44.44 | $ | 44.73 | $ | 43.34 | $ | 57.87 | ||||||||||||||||||||||
Percent change in cash rent (2) |
(17.6) | % | — | (2.2) | % | — | 1.5 | % | ||||||||||||||||||||||||
Percent change in GAAP rent (2) |
(17.0) | % | — | (1.3) | % | — | 8.9 | % | ||||||||||||||||||||||||
Total TI & LC per square foot (3) |
$ | 34.43 | $ | 58.68 | $ | 39.38 | $ | 114.17 | $ | 74.56 | ||||||||||||||||||||||
Total TI & LC per sq. ft. per year of lease term (3) |
$ | 7.88 | $ | 11.36 | $ | 8.50 | $ | 20.15 | $ | 11.50 | ||||||||||||||||||||||
| The above leasing summary is based on leases executed during the periods indicated and excludes leasing activity for assets during the quarter in which the asset was sold or classified as held for sale. Our same property leasing activity is identical to the information above for all periods presented. Refer to the definitions section of this document for a description of our same property portfolio. | |||||
| (1) | Changes in total square footage result from remeasurement. | ||||
| (2) | Percent change in GAAP and cash rents is a comparison of current rent, including estimated tenant expense reimbursements, if any, to the rent, including actual/projected tenant expense reimbursements, if any, last received for the same space on a GAAP and cash basis, respectively. Cash rent during the reporting period is calculated before deducting any initial period free rent. Leasing in suites vacant longer than two years was excluded from the calculation. |
||||
| (3) | Includes tenant improvements (TI) and leasing commissions (LC). | ||||
| CAPITAL SUMMARY | Three Months Ended | ||||||||||||||||||||||||||||
| EXPENDITURES | 3/31/2024 | 12/31/2023 | 9/30/2023 | 6/30/2023 | 3/31/2023 | ||||||||||||||||||||||||
| Tenant improvements | $ | 5,752 | $ | 645 | $ | 224 | $ | 1,351 | $ | 1,757 | |||||||||||||||||||
Leasing costs |
174 | 150 | 646 | 673 | 1,162 | ||||||||||||||||||||||||
Building improvements (1) |
1,855 | 1,495 | 1,438 | 533 | 195 | ||||||||||||||||||||||||
| Total capital expenditures | $ | 7,781 | $ | 2,290 | $ | 2,308 | $ | 2,557 | $ | 3,114 | |||||||||||||||||||
Average square feet during period |
1,521 | 1,521 | 1,521 | 1,514 | 1,507 | ||||||||||||||||||||||||
Building improvements per average total sq. ft. during period |
$ | 1.22 | $ | 0.98 | $ | 0.95 | $ | 0.35 | $ | 0.13 | |||||||||||||||||||
| CAPITAL SUMMARY | Three Months Ended | |||||||||||||||||||
| SAME PROPERTY LEASING COMMITMENTS | March 31, 2024 | |||||||||||||||||||
| New Leases | Renewal Leases | Total | ||||||||||||||||||
| Square feet leased during the period | 3 | 15 | 18 | |||||||||||||||||
Total TI & LC (2) |
$ | 103 | $ | 965 | $ | 1,068 | ||||||||||||||
Total TI & LC per square foot (2) |
$ | 34.43 | $ | 64.35 | $ | 58.93 | ||||||||||||||
| Weighted average lease term by square foot (years) | 4.4 | 4.0 | 4.1 | |||||||||||||||||
Total TI & LC per square foot per year of lease term (2) |
$ | 7.88 | $ | 15.95 | $ | 14.39 | ||||||||||||||
| (1) | Tenant-funded capital expenditures are excluded. | ||||
| (2) | Includes tenant improvements (TI) and leasing commissions (LC). | ||||
| Tenant | Square Feet (1) |
% of Total Sq. Ft. (1) |
% of Annualized Rental Revenue | Weighted Average Remaining Lease Term | |||||||||||||||||||||||||||||||
| 1 | Salesforce.com, Inc. | 66 | 5.8 | % | 5.7 | % | 1.7 | ||||||||||||||||||||||||||||
| 2 | KPMG, LLP | 66 | 5.8 | % | 5.2 | % | 5.2 | ||||||||||||||||||||||||||||
| 3 | Crowdstrike, Inc. | 48 | 4.2 | % | 5.2 | % | 5.9 | ||||||||||||||||||||||||||||
| 4 | CBRE, Inc. | 41 | 3.6 | % | 3.9 | % | 4.0 | ||||||||||||||||||||||||||||
| 5 | Jones Lang LaSalle Americas, Inc. | 42 | 3.7 | % | 3.6 | % | 6.3 | ||||||||||||||||||||||||||||
| 6 | RSM US LLP | 32 | 2.8 | % | 3.5 | % | 8.2 | ||||||||||||||||||||||||||||
| 7 | SonarSource US, Inc. | 28 | 2.4 | % | 3.0 | % | 3.4 | ||||||||||||||||||||||||||||
| 8 | Alden Torch Financial, LLC | 35 | 3.1 | % | 2.9 | % | 2.9 | ||||||||||||||||||||||||||||
| 9 | Ballard Spahr LLP | 30 | 2.6 | % | 2.6 | % | 1.4 | ||||||||||||||||||||||||||||
| 10 | Simply Good Foods USA, Inc | 29 | 2.5 | % | 2.6 | % | 3.7 | ||||||||||||||||||||||||||||
| 11 | Wunderman Thompson, LLC | 24 | 2.1 | % | 2.5 | % | 3.3 | ||||||||||||||||||||||||||||
| 12 | Shiseido Americas Corporation | 21 | 1.8 | % | 2.5 | % | 5.6 | ||||||||||||||||||||||||||||
| Total | 462 | 40.4 | % | 43.2 | % | 4.3 | |||||||||||||||||||||||||||||
| (1) | Square footage as of March 31, 2024 includes space subject to leases that have commenced for revenue recognition purposes in accordance with GAAP, space being fitted out for occupancy pursuant to existing leases, and space which is leased but is not occupied or is being offered for sublease by tenants. |
||||
| Year | Number of Tenants Expiring | Leased Sq. Ft. Expiring (1) |
% of Leased Sq. Ft. Expiring | Cumulative % of Leased Sq. Ft. Expiring | Annualized Rental Revenue Expiring (2) |
% of Annualized Rental Revenue Expiring | Cumulative % of Annualized Rental Revenue Expiring | |||||||||||||||||||||||||||||||||||||
| 2024 | 17 | 119 | 10.4 | % | 10.4 | % | $ | 5,849 | 10.7 | % | 10.7 | % | ||||||||||||||||||||||||||||||||
| 2025 | 7 | 130 | 11.3 | % | 21.7 | % | 6,018 | 11.0 | % | 21.7 | % | |||||||||||||||||||||||||||||||||
| 2026 | 11 | 69 | 6.0 | % | 27.7 | % | 3,241 | 5.9 | % | 27.6 | % | |||||||||||||||||||||||||||||||||
| 2027 | 18 | 231 | 20.1 | % | 47.8 | % | 11,027 | 20.1 | % | 47.7 | % | |||||||||||||||||||||||||||||||||
| 2028 | 11 | 123 | 10.7 | % | 58.5 | % | 5,400 | 9.9 | % | 57.6 | % | |||||||||||||||||||||||||||||||||
| 2029 | 10 | 149 | 13.0 | % | 71.5 | % | 6,729 | 12.3 | % | 69.9 | % | |||||||||||||||||||||||||||||||||
| 2030 | 10 | 159 | 13.9 | % | 85.4 | % | 7,664 | 14.0 | % | 83.9 | % | |||||||||||||||||||||||||||||||||
| 2031 | 4 | 58 | 5.1 | % | 90.5 | % | 2,661 | 4.9 | % | 88.8 | % | |||||||||||||||||||||||||||||||||
| 2032 | 1 | 32 | 2.8 | % | 93.3 | % | 1,942 | 3.5 | % | 92.3 | % | |||||||||||||||||||||||||||||||||
| 2033 | 3 | 23 | 2.0 | % | 95.3 | % | 1,392 | 2.5 | % | 94.8 | % | |||||||||||||||||||||||||||||||||
| Thereafter | 4 | 54 | 4.7 | % | 100.0 | % | 2,875 | 5.2 | % | 100.0 | % | |||||||||||||||||||||||||||||||||
| Total | 96 | 1,147 | 100.0 | % | $ | 54,798 | 100.0 | % | ||||||||||||||||||||||||||||||||||||
| Weighted average remaining | ||||||||||||||||||||||||||||||||||||||||||||
| lease term (in years) | 4.2 | 4.3 | ||||||||||||||||||||||||||||||||||||||||||
| (1) | Leased square footage as of March 31, 2024 includes space subject to leases that have commenced for revenue recognition purposes in accordance with GAAP, space being fitted out for occupancy pursuant to existing leases, and space which is leased but is not occupied or is being offered for sublease by tenants. The year expiring corresponds to the latest-expiring signed lease for a given suite. Thus, backfilled suites expire in the year stipulated by the new lease. |
||||
| (2) | Excludes the Annualized Rental Revenue of space that is leased but not commenced. | ||||
| Three Months Ended | |||||||||||
| March 31, | |||||||||||
| Weighted Average Share Calculation - GAAP EPS | 2024 | 2023 | |||||||||
Weighted average common shares outstanding - basic (1) |
107,216 | 109,720 | |||||||||
Weighted average dilutive RSUs and maket-based LTIP Units (2) |
1,008 | 1,580 | |||||||||
Weighted average common shares outstanding - diluted (1) |
108,224 | 111,300 | |||||||||
| Three Months Ended | |||||||||||
| March 31, | |||||||||||
| Weighted Average Share and Unit Calculation - FFO and Normalized FFO per share and unit | 2024 | 2023 | |||||||||
Weighted average EQC common shares outstanding (1) |
107,216 | 109,720 | |||||||||
Weighted average Operating Partnership Units outstanding (3) |
119 | 227 | |||||||||
Weighted average time-based LTIP Units (2)(3) |
104 | 97 | |||||||||
Weighted average common shares and units outstanding - basic (1) |
107,439 | 110,044 | |||||||||
Weighted average dilutive RSUs and market-based LTIP Units (2) |
1,008 | 1,580 | |||||||||
Weighted average common shares and units outstanding - diluted (1) |
108,447 | 111,624 | |||||||||
Rollforward of Share Count to March 31, 2024 |
Series D Preferred Shares (4) |
EQC Common Shares (5) |
|||||||||||||||
| Outstanding on December 31, 2023 | 4,915 | 106,847 | |||||||||||||||
| Operating Partnership Unit redemption | — | 4 | |||||||||||||||
Share-based compensation grants and vesting, net (6) |
— | 372 | |||||||||||||||
Outstanding on March 31, 2024 |
4,915 | 107,223 | |||||||||||||||
Common shares issuable from RSUs, Operating Partnership Units, and LTIP Units as measured on March 31, 2024 (2) |
1,358 | ||||||||||||||||
Potential common shares as measured on March 31, 2024 (7) |
108,581 | ||||||||||||||||
| (1) | Weighted average common shares outstanding for the three months ended March 31, 2024 and 2023 includes 129 and 113 unvested, earned RSUs, respectively. |
||||
| (2) | We have granted RSUs and LTIP Units to certain trustees, employees and eligible consultants. RSUs and market-based LTIP Units contain service and market-based vesting components. Time-based LTIP Units contain service-based vesting components. Each LTIP Unit will convert automatically into an OP Unit on a one-for-one basis when the LTIP Unit becomes vested and its capital account is equalized with the per-unit capital account of the OP Units. |
||||
| (3) | Our calculations of FFO and Normalized FFO attributable to EQC common shareholders and unitholders per share and unit - basic include time-based LTIP Units and OP Units that are excluded from the calculation of basic earnings per common share attributable to EQC common shareholders (only). |
||||
| (4) | As of March 31, 2024, we had 4,915 series D preferred shares that were convertible into 4,032 common shares. The series D preferred shares are anti-dilutive for GAAP EPS for all periods presented. The series D preferred shares are anti-dilutive for all periods presented with respect to FFO and Normalized FFO per common share and unit. |
||||
| (5) | EQC common shares include unvested restricted shares. | ||||
| (6) | This amount is net of forfeitures and shares surrendered to satisfy statutory tax withholding obligations. | ||||
| (7) | Potential common shares as measured on March 31, 2024 include unvested earned RSUs. The 4,915 series D preferred shares outstanding that were convertible into 4,032 common shares as of March 31, 2024 are excluded. |
||||