| Delaware | 1-8923 | 34-1096634 | ||||||||||||||||||
| (State or other jurisdiction of Incorporation) |
(Commission File Number) |
(IRS Employer Identification No.) |
||||||||||||||||||
| 4500 Dorr Street, | Toledo, | Ohio | 43615 | |||||||||||||||||
| (Address of principal executive offices) | (Zip Code) | |||||||||||||||||||
| Title of each class | Trading Symbol(s) | Name of each exchange on which registered | ||||||||||||
| Common stock, $1.00 par value per share | WELL | New York Stock Exchange | ||||||||||||
| Guarantee of 4.800% Notes due 2028 issued by Welltower OP LLC | WELL/28 | New York Stock Exchange | ||||||||||||
| Guarantee of 4.500% Notes due 2034 issued by Welltower OP LLC | WELL/34 | New York Stock Exchange | ||||||||||||
| WELLTOWER INC. | |||||
| By: | /s/ Matthew McQueen | ||||
| Name: | Matthew McQueen | ||||
| Title: | Executive Vice President – General Counsel & Corporate Secretary | ||||

Page 1 of 12 |
||||||||
| 2Q23 | Earnings Release | July 31, 2023 | |||||||||
Page 2 of 12 |
||||||||
| 2Q23 | Earnings Release | July 31, 2023 | |||||||||
Page 3 of 12 |
||||||||
| 2Q23 | Earnings Release | July 31, 2023 | |||||||||
Page 4 of 12 |
||||||||
| 2Q23 | Earnings Release | July 31, 2023 | |||||||||
Page 5 of 12 |
||||||||
| 2Q23 | Earnings Release | July 31, 2023 | |||||||||
| Consolidated Balance Sheets (unaudited) | ||||||||||||||
| (in thousands) | ||||||||||||||
| June 30, | ||||||||||||||
| 2023 | 2022 | |||||||||||||
| Assets | ||||||||||||||
| Real estate investments: | ||||||||||||||
| Land and land improvements | $ | 4,262,745 | $ | 4,109,851 | ||||||||||
| Buildings and improvements | 34,127,012 | 32,480,543 | ||||||||||||
| Acquired lease intangibles | 1,950,349 | 1,902,141 | ||||||||||||
| Real property held for sale, net of accumulated depreciation | 404,071 | 177,719 | ||||||||||||
| Construction in progress | 1,108,773 | 900,633 | ||||||||||||
| Less accumulated depreciation and intangible amortization | (8,599,622) | (7,437,779) | ||||||||||||
| Net real property owned | 33,253,328 | 32,133,108 | ||||||||||||
| Right of use assets, net | 322,316 | 324,720 | ||||||||||||
| Real estate loans receivable, net of credit allowance | 965,509 | 956,285 | ||||||||||||
| Net real estate investments | 34,541,153 | 33,414,113 | ||||||||||||
| Other assets: | ||||||||||||||
| Investments in unconsolidated entities | 1,650,133 | 1,300,975 | ||||||||||||
| Goodwill | 68,321 | 68,321 | ||||||||||||
| Cash and cash equivalents | 2,203,788 | 363,339 | ||||||||||||
| Restricted cash | 95,281 | 78,912 | ||||||||||||
| Straight-line rent receivable | 389,381 | 408,575 | ||||||||||||
| Receivables and other assets | 1,116,078 | 939,436 | ||||||||||||
| Total other assets | 5,522,982 | 3,159,558 | ||||||||||||
| Total assets | $ | 40,064,135 | $ | 36,573,671 | ||||||||||
| Liabilities and equity | ||||||||||||||
| Liabilities: | ||||||||||||||
| Unsecured credit facility and commercial paper | $ | — | $ | 354,000 | ||||||||||
| Senior unsecured notes | 13,530,788 | 12,488,718 | ||||||||||||
| Secured debt | 2,460,349 | 2,191,826 | ||||||||||||
| Lease liabilities | 348,770 | 410,717 | ||||||||||||
| Accrued expenses and other liabilities | 1,531,114 | 1,254,497 | ||||||||||||
| Total liabilities | 17,871,021 | 16,699,758 | ||||||||||||
| Redeemable noncontrolling interests | 369,191 | 420,018 | ||||||||||||
| Equity: | ||||||||||||||
| Common stock | 509,805 | 464,778 | ||||||||||||
| Capital in excess of par value | 28,085,297 | 24,465,041 | ||||||||||||
| Treasury stock | (112,032) | (111,691) | ||||||||||||
| Cumulative net income | 8,933,663 | 8,815,446 | ||||||||||||
| Cumulative dividends | (16,116,698) | (14,932,198) | ||||||||||||
| Accumulated other comprehensive income | (95,594) | (145,196) | ||||||||||||
| Total Welltower Inc. stockholders’ equity | 21,204,441 | 18,556,180 | ||||||||||||
| Noncontrolling interests | 619,482 | 897,715 | ||||||||||||
| Total equity | 21,823,923 | 19,453,895 | ||||||||||||
| Total liabilities and equity | $ | 40,064,135 | $ | 36,573,671 | ||||||||||
Page 6 of 12 |
||||||||
| 2Q23 | Earnings Release | July 31, 2023 | |||||||||
| Consolidated Statements of Income (unaudited) | ||||||||||||||||||||||||||||||||
| (in thousands, except per share data) | ||||||||||||||||||||||||||||||||
| Three Months Ended | Six Months Ended | |||||||||||||||||||||||||||||||
| June 30, | June 30, | |||||||||||||||||||||||||||||||
| 2023 | 2022 | 2023 | 2022 | |||||||||||||||||||||||||||||
| Revenues: | ||||||||||||||||||||||||||||||||
| Resident fees and services | $ | 1,159,449 | $ | 1,009,999 | $ | 2,291,134 | $ | 2,004,334 | ||||||||||||||||||||||||
| Rental income | 383,439 | 361,411 | 767,498 | 717,801 | ||||||||||||||||||||||||||||
| Interest income | 38,710 | 37,140 | 75,115 | 76,134 | ||||||||||||||||||||||||||||
| Other income | 83,880 | 63,986 | 92,460 | 69,971 | ||||||||||||||||||||||||||||
| Total revenues | 1,665,478 | 1,472,536 | 3,226,207 | 2,868,240 | ||||||||||||||||||||||||||||
| Expenses: | ||||||||||||||||||||||||||||||||
| Property operating expenses | 958,672 | 854,083 | 1,916,425 | 1,707,752 | ||||||||||||||||||||||||||||
| Depreciation and amortization | 341,945 | 310,295 | 681,057 | 614,383 | ||||||||||||||||||||||||||||
| Interest expense | 152,337 | 127,750 | 296,740 | 249,446 | ||||||||||||||||||||||||||||
| General and administrative expenses | 44,287 | 36,554 | 88,658 | 74,260 | ||||||||||||||||||||||||||||
| Loss (gain) on derivatives and financial instruments, net | 1,280 | (1,407) | 2,210 | 1,171 | ||||||||||||||||||||||||||||
| Loss (gain) on extinguishment of debt, net | 1 | 603 | 6 | 591 | ||||||||||||||||||||||||||||
| Provision for loan losses, net | 2,456 | 165 | 3,233 | (639) | ||||||||||||||||||||||||||||
| Impairment of assets | 1,086 | — | 13,715 | — | ||||||||||||||||||||||||||||
| Other expenses | 11,069 | 35,166 | 33,814 | 61,235 | ||||||||||||||||||||||||||||
| Total expenses | 1,513,133 | 1,363,209 | 3,035,858 | 2,708,199 | ||||||||||||||||||||||||||||
| Income (loss) from continuing operations before income taxes | ||||||||||||||||||||||||||||||||
| and other items | 152,345 | 109,327 | 190,349 | 160,041 | ||||||||||||||||||||||||||||
| Income tax (expense) benefit | (3,503) | (3,065) | (6,548) | (8,078) | ||||||||||||||||||||||||||||
| Income (loss) from unconsolidated entities | (40,332) | (7,058) | (47,403) | (9,942) | ||||||||||||||||||||||||||||
| Gain (loss) on real estate dispositions, net | (2,168) | (3,532) | (1,421) | 19,402 | ||||||||||||||||||||||||||||
| Income (loss) from continuing operations | 106,342 | 95,672 | 134,977 | 161,423 | ||||||||||||||||||||||||||||
| Net income (loss) | 106,342 | 95,672 | 134,977 | 161,423 | ||||||||||||||||||||||||||||
| Less: | Net income (loss) attributable to noncontrolling interests (1) |
3,302 | 5,888 | 6,264 | 9,714 | |||||||||||||||||||||||||||
| Net income (loss) attributable to common stockholders | $ | 103,040 | $ | 89,784 | $ | 128,713 | $ | 151,709 | ||||||||||||||||||||||||
| Average number of common shares outstanding: | ||||||||||||||||||||||||||||||||
| Basic | 499,023 | 454,327 | 495,561 | 450,865 | ||||||||||||||||||||||||||||
| Diluted | 501,970 | 457,082 | 498,305 | 453,455 | ||||||||||||||||||||||||||||
| Net income (loss) attributable to common stockholders per share: | ||||||||||||||||||||||||||||||||
| Basic | $ | 0.21 | $ | 0.20 | $ | 0.26 | $ | 0.34 | ||||||||||||||||||||||||
Diluted(2) |
$ | 0.20 | $ | 0.20 | $ | 0.26 | $ | 0.33 | ||||||||||||||||||||||||
| Common dividends per share | $ | 0.61 | $ | 0.61 | $ | 1.22 | $ | 1.22 | ||||||||||||||||||||||||
(1) Includes amounts attributable to redeemable noncontrolling interests. | ||||||||||||||||||||||||||||||||
(2) Includes adjustment to the numerator for income (loss) attributable to OP Units and DownREIT Units. | ||||||||||||||||||||||||||||||||
Page 7 of 12 |
||||||||
| 2Q23 | Earnings Release | July 31, 2023 | |||||||||
| FFO Reconciliations | Exhibit 1 | |||||||||||||||||||||||||||||||||||||
| (in thousands, except per share data) | Three Months Ended | Six Months Ended | ||||||||||||||||||||||||||||||||||||
| June 30, | June 30, | |||||||||||||||||||||||||||||||||||||
| 2023 | 2022 | 2023 | 2022 | |||||||||||||||||||||||||||||||||||
| Net income (loss) attributable to common stockholders | $ | 103,040 | $ | 89,784 | $ | 128,713 | $ | 151,709 | ||||||||||||||||||||||||||||||
| Depreciation and amortization | 341,945 | 310,295 | 681,057 | 614,383 | ||||||||||||||||||||||||||||||||||
| Impairments and losses (gains) on real estate dispositions, net | 3,254 | 3,532 | 15,136 | (19,402) | ||||||||||||||||||||||||||||||||||
Noncontrolling interests(1) |
(12,841) | (13,173) | (26,168) | (27,926) | ||||||||||||||||||||||||||||||||||
Unconsolidated entities(2) |
30,784 | 19,150 | 53,506 | 38,459 | ||||||||||||||||||||||||||||||||||
| NAREIT FFO attributable to common stockholders | 466,182 | 409,588 | 852,244 | 757,223 | ||||||||||||||||||||||||||||||||||
Normalizing items, net(3) |
(15,318) | (14,975) | 18,153 | 5,672 | ||||||||||||||||||||||||||||||||||
| Normalized FFO attributable to common stockholders | $ | 450,864 | $ | 394,613 | $ | 870,397 | $ | 762,895 | ||||||||||||||||||||||||||||||
| Average diluted common shares outstanding | 501,970 | 457,082 | 498,305 | 453,455 | ||||||||||||||||||||||||||||||||||
| Per diluted share data attributable to common stockholders: | ||||||||||||||||||||||||||||||||||||||
Net income (loss)(4) |
$ | 0.20 | $ | 0.20 | $ | 0.26 | $ | 0.33 | ||||||||||||||||||||||||||||||
| NAREIT FFO | $ | 0.93 | $ | 0.90 | $ | 1.71 | $ | 1.67 | ||||||||||||||||||||||||||||||
| Normalized FFO | $ | 0.90 | $ | 0.86 | $ | 1.75 | $ | 1.68 | ||||||||||||||||||||||||||||||
| Normalized FFO Payout Ratio: | ||||||||||||||||||||||||||||||||||||||
| Dividends per common share | $ | 0.61 | $ | 0.61 | $ | 1.22 | $ | 1.22 | ||||||||||||||||||||||||||||||
| Normalized FFO attributable to common stockholders per share | $ | 0.90 | $ | 0.86 | $ | 1.75 | $ | 1.68 | ||||||||||||||||||||||||||||||
| Normalized FFO payout ratio | 68% | 71 | % | 70% | 73 | % | ||||||||||||||||||||||||||||||||
Other items:(5) |
||||||||||||||||||||||||||||||||||||||
| Net straight-line rent and above/below market rent amortization | $ | (30,336) | $ | (25,507) | $ | (63,720) | $ | (45,521) | ||||||||||||||||||||||||||||||
Non-cash interest expenses(6) |
6,574 | 5,552 | 12,452 | 10,273 | ||||||||||||||||||||||||||||||||||
| Recurring cap-ex, tenant improvements, and lease commissions | (40,694) | (39,558) | (77,607) | (72,024) | ||||||||||||||||||||||||||||||||||
| Stock-based compensation | 10,491 | 5,901 | 19,615 | 13,343 | ||||||||||||||||||||||||||||||||||
| (1) Represents noncontrolling interests' share of net FFO adjustments. | ||||||||||||||||||||||||||||||||||||||
| (2) Represents Welltower's share of net FFO adjustments from unconsolidated entities. | ||||||||||||||||||||||||||||||||||||||
| (3) See Exhibit 2. | ||||||||||||||||||||||||||||||||||||||
| (4) Includes adjustment to the numerator for income (loss) attributable to OP unitholders. | ||||||||||||||||||||||||||||||||||||||
| (5) Amounts presented net of noncontrolling interests' share and including Welltower's share of unconsolidated entities. | ||||||||||||||||||||||||||||||||||||||
| (6) Excludes normalized foreign currency loss (gain) (see Exhibit 2). | ||||||||||||||||||||||||||||||||||||||
Page 8 of 12 |
||||||||
| 2Q23 | Earnings Release | July 31, 2023 | |||||||||
| Normalizing Items | Exhibit 2 | ||||||||||||||||||||||||||||
| (in thousands, except per share data) | Three Months Ended | Six Months Ended | |||||||||||||||||||||||||||
| June 30, | June 30, | ||||||||||||||||||||||||||||
| 2023 | 2022 | 2023 | 2022 | ||||||||||||||||||||||||||
| Loss (gain) on derivatives and financial instruments, net | $ | 1,280 | (1) | $ | (1,407) | $ | 2,210 | $ | 1,171 | ||||||||||||||||||||
| Loss (gain) on extinguishment of debt, net | 1 | (2) | 603 | 6 | 591 | ||||||||||||||||||||||||
| Provision for loan losses, net | 2,456 | (3) | 165 | 3,233 | (639) | ||||||||||||||||||||||||
| Income tax benefits | — | — | (246) | — | |||||||||||||||||||||||||
| Other impairment | — | (620) | — | (620) | |||||||||||||||||||||||||
| Other expenses | 11,069 | (4) | 35,166 | 33,814 | 61,235 | ||||||||||||||||||||||||
| Leasehold interest termination | (65,485) | (5) | (56,397) | (65,485) | (64,854) | ||||||||||||||||||||||||
| Casualty losses, net of recoveries | 3,568 | (6) | 2,673 | 8,055 | 2,686 | ||||||||||||||||||||||||
| Foreign currency loss (gain) | (345) | (7) | 1,840 | (572) | 1,840 | ||||||||||||||||||||||||
| Normalizing items attributable to noncontrolling interests and unconsolidated entities, net | 32,138 | (8) | 3,002 | 37,138 | 4,262 | ||||||||||||||||||||||||
| Net normalizing items | $ | (15,318) | $ | (14,975) | $ | 18,153 | $ | 5,672 | |||||||||||||||||||||
| Average diluted common shares outstanding | 501,970 | 457,082 | 498,305 | 453,455 | |||||||||||||||||||||||||
| Net normalizing items per diluted share | $ | (0.03) | $ | (0.03) | $ | 0.04 | $ | 0.01 | |||||||||||||||||||||
| (1) Primarily related to mark-to-market of the equity warrants received as part of the Safanad/HC-One transaction that closed in 2021. | |||||||||||||||||||||||||||||
| (2) Primarily related to the extinguishment of secured debt. | |||||||||||||||||||||||||||||
| (3) Primarily related to reserves for loan losses under the current expected credit losses accounting standard. | |||||||||||||||||||||||||||||
| (4) Primarily related to non-capitalizable transaction costs and an accrual for non-capitalizable promotes. | |||||||||||||||||||||||||||||
| (5) Primarily related to a gain from the loss of control and derecognition of the leasehold interest related to seven properties. | |||||||||||||||||||||||||||||
| (6) Primarily relates to casualty losses net of any insurance recoveries. | |||||||||||||||||||||||||||||
| (7) Primarily relates to foreign currency gains and losses related to accrued interest on intercompany loans and third party debt denominated in a foreign currency. | |||||||||||||||||||||||||||||
| (8) Primarily related to an impairment recognized on the Sunrise Senior Living unconsolidated management company investment. | |||||||||||||||||||||||||||||
| Outlook Reconciliation: Year Ending December 31, 2023 | Exhibit 3 | |||||||||||||||||||||||||||||||
| (in millions, except per share data) | Prior Outlook | Current Outlook | ||||||||||||||||||||||||||||||
| Low | High | Low | High | |||||||||||||||||||||||||||||
| FFO Reconciliation: | ||||||||||||||||||||||||||||||||
| Net income attributable to common stockholders | $ | 303 | $ | 368 | $ | 374 | $ | 430 | ||||||||||||||||||||||||
Impairments and losses (gains) on real estate dispositions, net(1,2) |
(19) | (19) | (20) | (20) | ||||||||||||||||||||||||||||
Depreciation and amortization(1) |
1,391 | 1,391 | 1,402 | 1,402 | ||||||||||||||||||||||||||||
| NAREIT FFO attributable to common stockholders | 1,675 | 1,740 | 1,756 | 1,812 | ||||||||||||||||||||||||||||
Normalizing items, net(1,3) |
33 | 33 | 18 | 18 | ||||||||||||||||||||||||||||
| Normalized FFO attributable to common stockholders | $ | 1,708 | $ | 1,773 | $ | 1,774 | $ | 1,830 | ||||||||||||||||||||||||
| Diluted per share data attributable to common stockholders: | ||||||||||||||||||||||||||||||||
| Net income | $ | 0.61 | $ | 0.74 | $ | 0.73 | $ | 0.84 | ||||||||||||||||||||||||
| NAREIT FFO | $ | 3.36 | $ | 3.49 | $ | 3.44 | $ | 3.55 | ||||||||||||||||||||||||
| Normalized FFO | $ | 3.43 | $ | 3.56 | $ | 3.48 | $ | 3.59 | ||||||||||||||||||||||||
Other items:(1) |
||||||||||||||||||||||||||||||||
| Net straight-line rent and above/below market rent amortization | $ | (126) | $ | (126) | $ | (126) | $ | (126) | ||||||||||||||||||||||||
| Non-cash interest expenses | 24 | 24 | 27 | 27 | ||||||||||||||||||||||||||||
| Recurring cap-ex, tenant improvements, and lease commissions | (174) | (174) | (177) | (177) | ||||||||||||||||||||||||||||
| Stock-based compensation | 33 | 33 | 37 | 37 | ||||||||||||||||||||||||||||
| (1) Amounts presented net of noncontrolling interests' share and Welltower's share of unconsolidated entities. | ||||||||||||||||||||||||||||||||
| (2) Includes estimated gains on projected dispositions. | ||||||||||||||||||||||||||||||||
| (3) See Exhibit 2. | ||||||||||||||||||||||||||||||||
Page 9 of 12 |
||||||||
| 2Q23 | Earnings Release | July 31, 2023 | |||||||||
| SSNOI Reconciliation | Exhibit 4 | |||||||||||||||||||||||||
| (in thousands) | Three Months Ended | |||||||||||||||||||||||||
| June 30, | ||||||||||||||||||||||||||
| 2023 | 2022 | % growth | ||||||||||||||||||||||||
| Net income (loss) | $ | 106,342 | $ | 95,672 | ||||||||||||||||||||||
| Loss (gain) on real estate dispositions, net | 2,168 | 3,532 | ||||||||||||||||||||||||
| Loss (income) from unconsolidated entities | 40,332 | 7,058 | ||||||||||||||||||||||||
| Income tax expense (benefit) | 3,503 | 3,065 | ||||||||||||||||||||||||
| Other expenses | 11,069 | 35,166 | ||||||||||||||||||||||||
| Impairment of assets | 1,086 | — | ||||||||||||||||||||||||
| Provision for loan losses, net | 2,456 | 165 | ||||||||||||||||||||||||
| Loss (gain) on extinguishment of debt, net | 1 | 603 | ||||||||||||||||||||||||
| Loss (gain) on derivatives and financial instruments, net | 1,280 | (1,407) | ||||||||||||||||||||||||
| General and administrative expenses | 44,287 | 36,554 | ||||||||||||||||||||||||
| Depreciation and amortization | 341,945 | 310,295 | ||||||||||||||||||||||||
| Interest expense | 152,337 | 127,750 | ||||||||||||||||||||||||
| Consolidated NOI | 706,806 | 618,453 | ||||||||||||||||||||||||
NOI attributable to unconsolidated investments(1) |
25,150 | 23,648 | ||||||||||||||||||||||||
NOI attributable to noncontrolling interests(2) |
(24,262) | (82,804) | ||||||||||||||||||||||||
| Pro rata NOI | 707,694 | 559,297 | ||||||||||||||||||||||||
Non-cash NOI attributable to same store properties |
(15,671) | (18,162) | ||||||||||||||||||||||||
NOI attributable to non-same store properties |
(242,710) | (133,593) | ||||||||||||||||||||||||
Currency and ownership adjustments(3) |
(1,738) | (1,713) | ||||||||||||||||||||||||
Normalizing adjustments, net(4) |
(3,378) | (11,603) | ||||||||||||||||||||||||
| Same Store NOI (SSNOI) | $ | 444,197 | $ | 394,226 | 12.7% | |||||||||||||||||||||
| Seniors Housing Operating | 217,863 | 175,416 | 24.2% | |||||||||||||||||||||||
| Seniors Housing Triple-net | 93,575 | 90,740 | 3.1% | |||||||||||||||||||||||
| Outpatient Medical | 113,097 | 109,547 | 3.2% | |||||||||||||||||||||||
| Long-Term/Post-Acute Care | 19,662 | 18,523 | 6.1% | |||||||||||||||||||||||
Total SSNOI |
$ | 444,197 | $ | 394,226 | 12.7% | |||||||||||||||||||||
| (1) Represents Welltower's interests in joint ventures where Welltower is the minority partner. | ||||||||||||||||||||||||||
| (2) Represents minority partners' interests in joint ventures where Welltower is the majority partner. | ||||||||||||||||||||||||||
| (3) Includes adjustments to reflect consistent property ownership percentages and foreign currency exchange rates for properties in the U.K. and Canada. | ||||||||||||||||||||||||||
| (4) Includes other adjustments described in the accompanying Supplement. | ||||||||||||||||||||||||||
Page 10 of 12 |
||||||||
| 2Q23 | Earnings Release | July 31, 2023 | |||||||||
| Reconciliation of SHO SS RevPOR Growth | Exhibit 5 | ||||||||||||||||
| (in thousands except SS RevPOR) | |||||||||||||||||
| June 30, | |||||||||||||||||
| 2023 | 2022 | ||||||||||||||||
| Consolidated SHO revenues | $ | 1,164,439 | $ | 1,071,210 | |||||||||||||
Unconsolidated SHO revenues attributable to WELL(1) |
63,041 | 51,456 | |||||||||||||||
SHO revenues attributable to noncontrolling interests(2) |
(48,505) | (121,704) | |||||||||||||||
SHO pro rata revenues(3) |
1,178,975 | 1,000,962 | |||||||||||||||
| Non-cash and non-RevPOR revenues on same store properties | (2,006) | (907) | |||||||||||||||
| Revenues attributable to non-same store properties | (298,776) | (211,353) | |||||||||||||||
Currency and ownership adjustments(4) |
(3,922) | 8,111 | |||||||||||||||
SHO SS RevPOR revenues(5) |
$ | 874,271 | $ | 796,813 | |||||||||||||
Average occupied units/month(6) |
55,788 | 54,537 | |||||||||||||||
SHO SS RevPOR(7) |
$ | 5,238 | $ | 4,884 | |||||||||||||
| SS RevPOR YOY growth | 7.3 | % | |||||||||||||||
(1) Represents Welltower's interests in joint ventures where Welltower is the minority partner. |
|||||||||||||||||
| (2) Represents minority partners' interests in joint ventures where Welltower is the majority partner. | |||||||||||||||||
| (3) Represents SHO revenues at Welltower pro rata ownership. | |||||||||||||||||
(4) Includes where appropriate adjustments to reflect consistent property ownership percentages, to translate Canadian properties at a USD/CAD rate of 1.37 and to translate UK properties at a GBP/USD rate of 1.20. |
|||||||||||||||||
| (5) Represents SS SHO RevPOR revenues at Welltower pro rata ownership. | |||||||||||||||||
| (6) Represents average occupied units for SS properties on a pro rata basis. | |||||||||||||||||
| (7) Represents pro rata SS average revenues generated per occupied room per month. | |||||||||||||||||
Page 11 of 12 |
||||||||
| 2Q23 | Earnings Release | July 31, 2023 | |||||||||
| Net Debt to Adjusted EBITDA Reconciliation | Exhibit 6 | |||||||||||||||||||||||||
| (in thousands) | Three Months Ended | |||||||||||||||||||||||||
| June 30, 2023 | June 30, 2022 | |||||||||||||||||||||||||
| Net income (loss) | $ | 106,342 | $ | 95,672 | ||||||||||||||||||||||
| Interest expense | 152,337 | 127,750 | ||||||||||||||||||||||||
| Income tax expense (benefit) | 3,503 | 3,065 | ||||||||||||||||||||||||
| Depreciation and amortization | 341,945 | 310,295 | ||||||||||||||||||||||||
| EBITDA | 604,127 | 536,782 | ||||||||||||||||||||||||
| Loss (income) from unconsolidated entities | 40,332 | 7,058 | ||||||||||||||||||||||||
| Stock-based compensation | 10,491 | 5,901 | ||||||||||||||||||||||||
| Loss (gain) on extinguishment of debt, net | 1 | 603 | ||||||||||||||||||||||||
| Loss (gain) on real estate dispositions, net | 2,168 | 3,532 | ||||||||||||||||||||||||
| Impairment of assets | 1,086 | — | ||||||||||||||||||||||||
| Provision for loan losses, net | 2,456 | 165 | ||||||||||||||||||||||||
| Loss (gain) on derivatives and financial instruments, net | 1,280 | (1,407) | ||||||||||||||||||||||||
| Other expenses | 11,069 | 35,166 | ||||||||||||||||||||||||
Leasehold interest termination(1) |
(65,485) | (56,397) | ||||||||||||||||||||||||
| Casualty losses, net of recoveries | 3,568 | 2,673 | ||||||||||||||||||||||||
Other impairment(2) |
— | (620) | ||||||||||||||||||||||||
| Adjusted EBITDA | $ | 611,093 | $ | 533,456 | ||||||||||||||||||||||
Total debt(3) |
$ | 16,040,530 | $ | 15,144,432 | ||||||||||||||||||||||
| Cash and cash equivalents and restricted cash | (2,299,069) | (442,251) | ||||||||||||||||||||||||
| Net debt | $ | 13,741,461 | $ | 14,702,181 | ||||||||||||||||||||||
| Adjusted EBITDA annualized | $ | 2,444,372 | $ | 2,133,824 | ||||||||||||||||||||||
| Net debt to Adjusted EBITDA ratio | 5.62 | x | 6.89 | x | ||||||||||||||||||||||
| (1) For the three months ended June 30, 2023, relates to the derecognition of leasehold interest related to seven properties. For the three months ended June 30, 2022, relates to the termination of our leasehold interest relating to the master lease with National Health Investors ("NHI") for 17 properties assumed in conjunction with the Holiday Retirement acquisition. | ||||||||||||||||||||||||||
| (2) Primarily relates to the release of previously reserved straight-line receivables. | ||||||||||||||||||||||||||
(3) Amounts include unamortized premiums/discounts, other fair value adjustments and financing lease liabilities. Excludes operating lease liabilities related to ASC 842 adoption. |
||||||||||||||||||||||||||
| Net Debt to Consolidated Enterprise Value | Exhibit 7 | |||||||||||||||||||
| (in thousands, except share price) | ||||||||||||||||||||
| June 30, 2023 | December 31, 2022 | |||||||||||||||||||
| Common shares outstanding | 508,159 | 490,509 | ||||||||||||||||||
| Period end share price | $ | 80.89 | $ | 65.55 | ||||||||||||||||
| Common equity market capitalization | $ | 41,104,982 | $ | 32,152,865 | ||||||||||||||||
Total debt(1) |
$ | 16,040,530 | $ | 14,661,552 | ||||||||||||||||
| Cash and cash equivalents and restricted cash | (2,299,069) | (722,292) | ||||||||||||||||||
| Net debt | $ | 13,741,461 | $ | 13,939,260 | ||||||||||||||||
Noncontrolling interests(2) |
988,673 | 1,099,182 | ||||||||||||||||||
| Consolidated enterprise value | $ | 55,835,116 | $ | 47,191,307 | ||||||||||||||||
| Net debt to consolidated enterprise value | 24.6 | % | 29.5 | % | ||||||||||||||||
(1) Amounts include senior unsecured notes, secured debt and lease liabilities related to finance leases, as reflected on our consolidated balance sheets. Operating lease liabilities related to the ASC 842 adoption are excluded. |
||||||||||||||||||||
| (2) Includes amounts attributable to both redeemable noncontrolling interests and noncontrolling interests as reflected on our consolidated balance sheets. | ||||||||||||||||||||
Page 12 of 12 |
||||||||
| Table of Contents | |||||
Overview |
|||||
Portfolio |
|||||
Investment |
|||||
Financial |
|||||
Glossary |
|||||
Supplemental Reporting Measures |
|||||
Forward Looking Statements and Risk Factors |
|||||
Overview |
|||||
| (dollars and occupancy at Welltower pro rata ownership; dollars in thousands) | |||||||||||||||||||||||||||||||||||||||||||||||
Portfolio Composition(1) |
Beds/Unit Mix | ||||||||||||||||||||||||||||||||||||||||||||||
| Average Age | Properties | Total | Wellness Housing | Independent Living | Assisted Living | Memory Care | Long-Term/ Post-Acute Care | ||||||||||||||||||||||||||||||||||||||||
| Seniors Housing Operating | 19 | 957 | 113,007 | 16,897 | 44,444 | 36,003 | 14,871 | 792 | |||||||||||||||||||||||||||||||||||||||
| Seniors Housing Triple-net | 19 | 373 | 31,044 | — | 5,442 | 14,711 | 9,140 | 1,751 | |||||||||||||||||||||||||||||||||||||||
| Outpatient Medical | 17 | 437 | 25,987,778 | (2) | n/a | n/a | n/a | n/a | n/a | ||||||||||||||||||||||||||||||||||||||
| Long-Term/Post-Acute Care | 28 | 234 | 29,682 | — | — | 824 | 10 | 28,848 | |||||||||||||||||||||||||||||||||||||||
| Total | 19 | 2,001 | |||||||||||||||||||||||||||||||||||||||||||||
| NOI Performance | Same Store(3) |
In-Place Portfolio(4) |
||||||||||||||||||||||||||||||||||||||||||
| Properties | 2Q22 NOI | 2Q23 NOI | % Change | Properties | Annualized In-Place NOI |
% of Total | ||||||||||||||||||||||||||||||||||||||
| Seniors Housing Operating | 674 | $ | 175,416 | $ | 217,863 | 24.2 | % | 859 | $ | 1,072,692 | 49.0 | % | ||||||||||||||||||||||||||||||||
| Seniors Housing Triple-net | 327 | 90,740 | 93,575 | 3.1 | % | 354 | 396,116 | 18.1 | % | |||||||||||||||||||||||||||||||||||
| Outpatient Medical | 374 | 109,547 | 113,097 | 3.2 | % | 419 | 489,144 | 22.3 | % | |||||||||||||||||||||||||||||||||||
| Long-Term/Post-Acute Care | 48 | 18,523 | 19,662 | 6.1 | % | 204 | 233,084 | 10.6 | % | |||||||||||||||||||||||||||||||||||
| Total | 1,423 | $ | 394,226 | $ | 444,197 | 12.7 | % | 1,836 | $ | 2,191,036 | 100.0 | % | ||||||||||||||||||||||||||||||||
| Portfolio Performance | Facility Revenue Mix | ||||||||||||||||||||||||||||||||||||||||
Stable Portfolio(5) |
Occupancy | EBITDAR Coverage(6) |
EBITDARM Coverage(6) |
Private Pay | Medicaid | Medicare | Other Government(7) |
||||||||||||||||||||||||||||||||||
| Seniors Housing Operating | 80.7 | % | n/a | n/a | 97.3 | % | 1.2 | % | 0.6 | % | 0.9 | % | |||||||||||||||||||||||||||||
| Seniors Housing Triple-net | 80.4 | % | 0.88 | 1.17 | 94.0 | % | 2.3 | % | 0.5 | % | 3.2 | % | |||||||||||||||||||||||||||||
| Outpatient Medical | 94.4 | % | n/a | n/a | 100.0 | % | — | — | — | ||||||||||||||||||||||||||||||||
| Long-Term/Post-Acute Care | 79.4 | % | 1.48 | 1.78 | 27.3 | % | 35.0 | % | 37.7 | % | — | % | |||||||||||||||||||||||||||||
| Total | 0.98 | 1.27 | 94.2 | % | 2.8 | % | 1.8 | % | 1.2 | % | |||||||||||||||||||||||||||||||
| Portfolio | |||||
| (dollars in thousands at Welltower pro rata ownership) | |||||||||||||||||||||||||||||||||||||||||
In-Place NOI Diversification(1) | |||||||||||||||||||||||||||||||||||||||||
| By Partner: | Total Properties | Seniors Housing Operating | Seniors Housing Triple-net |
Outpatient Medical |
Long-Term/ Post-Acute Care | Total | % of Total | ||||||||||||||||||||||||||||||||||
| Sunrise Senior Living | 120 | $ | 192,868 | $ | — | $ | — | $ | — | $ | 192,868 | 8.8 | % | ||||||||||||||||||||||||||||
| Integra Healthcare Properties | 147 | — | — | — | 152,088 | 152,088 | 6.9 | % | |||||||||||||||||||||||||||||||||
| Avery Healthcare | 91 | 38,080 | 67,424 | — | — | 105,504 | 4.8 | % | |||||||||||||||||||||||||||||||||
| StoryPoint Senior Living | 75 | 41,764 | 44,476 | — | — | 86,240 | 3.9 | % | |||||||||||||||||||||||||||||||||
| Cogir Management Corporation | 49 | 85,584 | — | — | — | 85,584 | 3.9 | % | |||||||||||||||||||||||||||||||||
| Atria Senior Living | 92 | 78,736 | — | — | — | 78,736 | 3.6 | % | |||||||||||||||||||||||||||||||||
| Oakmont Management Group | 35 | 76,344 | — | — | — | 76,344 | 3.5 | % | |||||||||||||||||||||||||||||||||
| Belmont Village | 21 | 76,172 | — | — | — | 76,172 | 3.5 | % | |||||||||||||||||||||||||||||||||
| Sagora Senior Living | 40 | 42,944 | 23,708 | — | — | 66,652 | 3.0 | % | |||||||||||||||||||||||||||||||||
| Brookdale Senior Living | 73 | — | 60,940 | — | — | 60,940 | 2.8 | % | |||||||||||||||||||||||||||||||||
| Remaining | 1,093 | 440,200 | 199,568 | 489,144 | 80,996 | 1,209,908 | 55.3 | % | |||||||||||||||||||||||||||||||||
| Total | 1,836 | $ | 1,072,692 | $ | 396,116 | $ | 489,144 | $ | 233,084 | $ | 2,191,036 | 100.0 | % | ||||||||||||||||||||||||||||
| By Country: | |||||||||||||||||||||||||||||||||||||||||
| United States | 1,567 | $ | 889,728 | $ | 314,576 | $ | 489,144 | $ | 226,236 | $ | 1,919,684 | 87.6 | % | ||||||||||||||||||||||||||||
| United Kingdom | 129 | 63,928 | 78,048 | — | — | 141,976 | 6.5 | % | |||||||||||||||||||||||||||||||||
| Canada | 140 | 119,036 | 3,492 | — | 6,848 | 129,376 | 5.9 | % | |||||||||||||||||||||||||||||||||
| Total | 1,836 | $ | 1,072,692 | $ | 396,116 | $ | 489,144 | $ | 233,084 | $ | 2,191,036 | 100.0 | % | ||||||||||||||||||||||||||||
| By MSA: | |||||||||||||||||||||||||||||||||||||||||
| Los Angeles | 73 | $ | 86,084 | $ | 19,496 | $ | 33,376 | $ | — | $ | 138,956 | 6.3 | % | ||||||||||||||||||||||||||||
| New York / New Jersey | 76 | 66,244 | 11,316 | 37,328 | 3,512 | 118,400 | 5.4 | % | |||||||||||||||||||||||||||||||||
| Washington D.C. | 56 | 49,832 | 8,040 | 24,388 | 30,240 | 112,500 | 5.1 | % | |||||||||||||||||||||||||||||||||
| Dallas | 64 | 49,220 | 6,168 | 30,224 | 4,384 | 89,996 | 4.1 | % | |||||||||||||||||||||||||||||||||
| Philadelphia | 45 | 14,104 | 5,216 | 18,628 | 25,520 | 63,468 | 2.9 | % | |||||||||||||||||||||||||||||||||
| Greater London | 49 | 42,404 | 16,704 | — | — | 59,108 | 2.7 | % | |||||||||||||||||||||||||||||||||
| San Francisco | 22 | 34,700 | 10,336 | 2,084 | — | 47,120 | 2.2 | % | |||||||||||||||||||||||||||||||||
| Chicago | 45 | 22,016 | 11,492 | 7,512 | 5,784 | 46,804 | 2.1 | % | |||||||||||||||||||||||||||||||||
| Houston | 35 | 8,288 | 3,308 | 32,304 | — | 43,900 | 2.0 | % | |||||||||||||||||||||||||||||||||
| San Diego | 19 | 20,748 | 6,868 | 8,744 | 2,912 | 39,272 | 1.8 | % | |||||||||||||||||||||||||||||||||
| Charlotte | 26 | 1,368 | 10,592 | 24,096 | — | 36,056 | 1.6 | % | |||||||||||||||||||||||||||||||||
| Seattle | 26 | 15,132 | 1,084 | 15,192 | 4,176 | 35,584 | 1.6 | % | |||||||||||||||||||||||||||||||||
| Montréal | 24 | 34,188 | — | — | — | 34,188 | 1.6 | % | |||||||||||||||||||||||||||||||||
| Raleigh | 13 | 7,340 | 22,312 | 3,156 | — | 32,808 | 1.5 | % | |||||||||||||||||||||||||||||||||
| Boston | 24 | 23,420 | 5,280 | 2,584 | — | 31,284 | 1.4 | % | |||||||||||||||||||||||||||||||||
| Minneapolis | 20 | (608) | 16,992 | 13,548 | — | 29,932 | 1.4 | % | |||||||||||||||||||||||||||||||||
| Indianapolis | 17 | 5,140 | 13,892 | 552 | 9,000 | 28,584 | 1.3 | % | |||||||||||||||||||||||||||||||||
| Atlanta | 31 | 3,824 | — | 19,192 | 1,632 | 24,648 | 1.1 | % | |||||||||||||||||||||||||||||||||
| Kansas City | 24 | 8,036 | 9,812 | 652 | 6,100 | 24,600 | 1.1 | % | |||||||||||||||||||||||||||||||||
| Miami | 36 | (216) | 1,364 | 16,312 | 6,684 | 24,144 | 1.1 | % | |||||||||||||||||||||||||||||||||
| Remaining | 1,111 | 581,428 | 215,844 | 199,272 | 133,140 | 1,129,684 | 51.7 | % | |||||||||||||||||||||||||||||||||
| Total | 1,836 | $ | 1,072,692 | $ | 396,116 | $ | 489,144 | $ | 233,084 | $ | 2,191,036 | 100.0 | % | ||||||||||||||||||||||||||||
| Portfolio | |||||
| (dollars, units and occupancy at Welltower pro rata ownership; dollars in thousands) | |||||||||||||||||||||||||||||||||||
| Seniors Housing Operating | |||||||||||||||||||||||||||||||||||
Total Portfolio Performance(1) |
2Q22 | 3Q22 | 4Q22 | 1Q23 | 2Q23 | ||||||||||||||||||||||||||||||
| Properties | 836 | 870 | 882 | 885 | 886 | ||||||||||||||||||||||||||||||
| Units | 84,782 | 87,375 | 88,783 | 89,240 | 89,932 | ||||||||||||||||||||||||||||||
| Total occupancy | 77.1 | % | 78.0 | % | 78.3 | % | 79.0 | % | 79.6 | % | |||||||||||||||||||||||||
| Total revenues | $ | 1,000,962 | $ | 1,061,753 | $ | 1,095,146 | $ | 1,143,744 | $ | 1,178,975 | |||||||||||||||||||||||||
| Operating expenses | 777,178 | 831,556 | 866,482 | 894,981 | 902,068 | ||||||||||||||||||||||||||||||
| NOI | $ | 223,784 | $ | 230,197 | $ | 228,664 | $ | 248,763 | $ | 276,907 | |||||||||||||||||||||||||
| NOI margin | 22.4 | % | 21.7 | % | 20.9 | % | 21.7 | % | 23.5 | % | |||||||||||||||||||||||||
| Recurring cap-ex | $ | 26,806 | $ | 31,513 | $ | 36,923 | $ | 26,848 | $ | 32,791 | |||||||||||||||||||||||||
| Other cap-ex | $ | 57,225 | $ | 56,878 | $ | 75,545 | $ | 45,557 | $ | 66,002 | |||||||||||||||||||||||||
Same Store Performance(2) |
2Q22 | 3Q22 | 4Q22 | 1Q23 | 2Q23 | ||||||||||||||||||||||||||||||
| Properties | 674 | 674 | 674 | 674 | 674 | ||||||||||||||||||||||||||||||
| Occupancy | 78.3 | % | 79.2 | % | 79.6 | % | 79.8 | % | 80.2 | % | |||||||||||||||||||||||||
| Same store revenues | $ | 797,156 | $ | 819,487 | $ | 838,616 | $ | 854,088 | $ | 875,900 | |||||||||||||||||||||||||
| Compensation | 365,500 | 373,765 | 379,361 | 381,631 | 387,005 | ||||||||||||||||||||||||||||||
| Utilities | 37,009 | 43,710 | 43,259 | 46,681 | 39,066 | ||||||||||||||||||||||||||||||
| Food | 34,060 | 34,839 | 36,571 | 34,704 | 36,259 | ||||||||||||||||||||||||||||||
| Repairs and maintenance | 24,883 | 24,989 | 24,856 | 24,934 | 26,631 | ||||||||||||||||||||||||||||||
| Property taxes | 32,991 | 32,883 | 28,983 | 32,979 | 32,290 | ||||||||||||||||||||||||||||||
| All other | 127,297 | 130,096 | 136,103 | 130,909 | 136,786 | ||||||||||||||||||||||||||||||
| Same store operating expenses | 621,740 | 640,282 | 649,133 | 651,838 | 658,037 | ||||||||||||||||||||||||||||||
| Same store NOI | $ | 175,416 | $ | 179,205 | $ | 189,483 | $ | 202,250 | $ | 217,863 | |||||||||||||||||||||||||
| Same store NOI margin % | 22.0 | % | 21.9 | % | 22.6 | % | 23.7 | % | 24.9 | % | |||||||||||||||||||||||||
| Year over year NOI growth rate | 24.2 | % | |||||||||||||||||||||||||||||||||
| Year over year revenue growth rate | 9.9 | % | |||||||||||||||||||||||||||||||||
Partners(3) |
Properties | Pro Rata Units | Welltower Ownership %(4) |
Top Markets | 2Q23 NOI | % of Total | ||||||||||||||||||||||||||||||||
| Sunrise Senior Living | 120 | 9,895 | 100.0 | % | Southern California | $ | 32,815 | 11.9 | % | |||||||||||||||||||||||||||||
| Cogir Management Corporation | 49 | 7,168 | 88.4 | % | Northern California | 21,383 | 7.7 | % | ||||||||||||||||||||||||||||||
| Atria Senior Living | 92 | 10,924 | 100.0 | % | New York / New Jersey | 16,364 | 5.9 | % | ||||||||||||||||||||||||||||||
| Oakmont Management Group | 35 | 4,428 | 100.0 | % | Greater London, UK | 11,387 | 4.1 | % | ||||||||||||||||||||||||||||||
| Belmont Village | 21 | 2,804 | 95.0 | % | Washington D.C. | 12,138 | 4.4 | % | ||||||||||||||||||||||||||||||
| Legend Senior Living | 37 | 2,809 | 93.3 | % | Montréal, QC | 8,660 | 3.1 | % | ||||||||||||||||||||||||||||||
| Brandywine Living | 29 | 2,704 | 99.4 | % | Toronto, ON | 7,173 | 2.6 | % | ||||||||||||||||||||||||||||||
| Sagora Senior Living | 18 | 2,884 | 99.5 | % | Boston, MA | 5,505 | 2.0 | % | ||||||||||||||||||||||||||||||
| StoryPoint Senior Living | 43 | 4,523 | 100.0 | % | Seattle, WA | 3,153 | 1.1 | % | ||||||||||||||||||||||||||||||
| Revera | 64 | 5,870 | 75.0 | % | Vancouver, BC | 2,404 | 0.9 | % | ||||||||||||||||||||||||||||||
| Avery Healthcare | 41 | 3,239 | 100.0 | % | Birmingham, UK | 2,164 | 0.8 | % | ||||||||||||||||||||||||||||||
| Clover | 36 | 3,950 | 90.4 | % | Manchester, UK | 1,625 | 0.6 | % | ||||||||||||||||||||||||||||||
| Pegasus | 35 | 3,791 | 99.0 | % | Ottawa, ON | 1,189 | 0.4 | % | ||||||||||||||||||||||||||||||
| Chartwell | 42 | 4,479 | 49.6 | % | Top Markets | 125,960 | 45.5 | % | ||||||||||||||||||||||||||||||
| Remaining | 197 | 18,675 | All Other | 150,947 | 54.5 | % | ||||||||||||||||||||||||||||||||
| Total | 859 | 88,143 | Total | $ | 276,907 | 100.0 | % | |||||||||||||||||||||||||||||||
| Portfolio | |||||
| (dollars in thousands at Welltower pro rata ownership) | |||||||||||||||||||||||||||||||||||||||||||||||
| Payment Coverage Stratification | |||||||||||||||||||||||||||||||||||||||||||||||
EBITDARM Coverage(1) |
EBITDAR Coverage(1) |
||||||||||||||||||||||||||||||||||||||||||||||
| % of In-Place NOI | Seniors Housing Triple-net | Long-Term/ Post- Acute Care | Total | Weighted Average Maturity | Number of Leases | Seniors Housing Triple-net | Long-Term/ Post- Acute Care | Total | Weighted Average Maturity | Number of Leases | |||||||||||||||||||||||||||||||||||||
| <.85x | 2.6 | % | 0.1 | % | 2.7 | % | 12 | 4 | 4.6 | % | 0.1 | % | 4.7 | % | 11 | 6 | |||||||||||||||||||||||||||||||
| .85x-.95x | 0.6 | % | — | % | 0.6 | % | 14 | 1 | 5.4 | % | 0.5 | % | 5.9 | % | 10 | 8 | |||||||||||||||||||||||||||||||
| .95x-1.05x | 1.9 | % | — | % | 1.9 | % | 7 | 2 | 0.3 | % | — | % | 0.3 | % | 23 | 2 | |||||||||||||||||||||||||||||||
| 1.05x-1.15x | 1.7 | % | 0.5 | % | 2.2 | % | 6 | 3 | 6.1 | % | — | % | 6.1 | % | 9 | 3 | |||||||||||||||||||||||||||||||
| 1.15x-1.25x | 1.2 | % | — | % | 1.2 | % | 14 | 2 | 1.2 | % | 1.0 | % | 2.2 | % | 11 | 3 | |||||||||||||||||||||||||||||||
| 1.25x-1.35x | 7.2 | % | 0.1 | % | 7.3 | % | 10 | 7 | — | % | — | % | — | % | — | — | |||||||||||||||||||||||||||||||
| >1.35 | 2.3 | % | 2.4 | % | 4.7 | % | 10 | 8 | — | % | 1.4 | % | 1.4 | % | 12 | 5 | |||||||||||||||||||||||||||||||
| Total | 17.6 | % | 3.0 | % | 20.6 | % | 10 | 27 | 17.6 | % | 3.0 | % | 20.6 | % | 10 | 27 | |||||||||||||||||||||||||||||||
Revenue and Lease Maturity(2) |
||||||||||||||||||||||||||||||||||||||
| Rental Income | ||||||||||||||||||||||||||||||||||||||
| Year | Seniors Housing Triple-net |
Outpatient Medical | Long-Term / Post-Acute Care | Interest Income |
Total Revenues |
% of Total | ||||||||||||||||||||||||||||||||
| 2023 | $ | — | $ | 41,796 | $ | 2,159 | $ | 8,073 | $ | 52,028 | 4.0 | % | ||||||||||||||||||||||||||
| 2024 | 13,088 | 58,182 | — | 24,546 | 95,816 | 7.4 | % | |||||||||||||||||||||||||||||||
| 2025 | 5,667 | 42,430 | — | 10,591 | 58,688 | 4.5 | % | |||||||||||||||||||||||||||||||
| 2026 | 3,529 | 45,527 | 9,355 | 103,528 | 161,939 | 12.4 | % | |||||||||||||||||||||||||||||||
| 2027 | — | 40,949 | 1,211 | 3,173 | 45,333 | 3.5 | % | |||||||||||||||||||||||||||||||
| 2028 | — | 34,331 | 5,246 | 360 | 39,937 | 3.1 | % | |||||||||||||||||||||||||||||||
| 2029 | 1,004 | 33,416 | — | 416 | 34,836 | 2.7 | % | |||||||||||||||||||||||||||||||
| 2030 | 40,895 | 34,480 | 28,411 | 140 | 103,926 | 8.0 | % | |||||||||||||||||||||||||||||||
| 2031 | 6,390 | 45,841 | 4,310 | 226 | 56,767 | 4.4 | % | |||||||||||||||||||||||||||||||
| 2032 | 90,850 | 37,025 | — | — | 127,875 | 9.8 | % | |||||||||||||||||||||||||||||||
| Thereafter | 226,963 | 117,076 | 179,976 | 1,535 | 525,550 | 40.2 | % | |||||||||||||||||||||||||||||||
| $ | 388,386 | $ | 531,053 | $ | 230,668 | $ | 152,588 | $ | 1,302,695 | 100.0 | % | |||||||||||||||||||||||||||
| Weighted Avg Maturity Years | 11 | 6 | 15 | 3 | 9 | |||||||||||||||||||||||||||||||||
| Portfolio | |||||
| (dollars, square feet and occupancy at Welltower pro rata ownership; dollars in thousands except per square feet) | ||||||||||||||||||||||||||||||||
| Outpatient Medical | ||||||||||||||||||||||||||||||||
Total Portfolio Performance(1) |
2Q22 | 3Q22 | 4Q22 | 1Q23 | 2Q23 | |||||||||||||||||||||||||||
| Properties | 384 | 386 | 389 | 419 | 420 | |||||||||||||||||||||||||||
| Square feet | 18,452,459 | 18,665,903 | 18,844,516 | 20,188,159 | 20,236,315 | |||||||||||||||||||||||||||
| Occupancy | 94.5 | % | 94.5 | % | 94.2 | % | 94.0 | % | 94.4 | % | ||||||||||||||||||||||
| Total revenues | $ | 166,220 | $ | 171,990 | $ | 176,816 | $ | 185,190 | $ | 186,802 | ||||||||||||||||||||||
| Operating expenses | 51,177 | 53,684 | 53,259 | 58,977 | 59,358 | |||||||||||||||||||||||||||
| NOI | $ | 115,043 | $ | 118,306 | $ | 123,557 | $ | 126,213 | $ | 127,444 | ||||||||||||||||||||||
| NOI margin | 69.2 | % | 68.8 | % | 69.9 | % | 68.2 | % | 68.2 | % | ||||||||||||||||||||||
| Revenues per square foot | $ | 36.03 | $ | 37.15 | $ | 37.53 | $ | 36.69 | $ | 36.92 | ||||||||||||||||||||||
| NOI per square foot | $ | 24.94 | $ | 25.55 | $ | 26.23 | $ | 25.01 | $ | 25.19 | ||||||||||||||||||||||
| Recurring cap-ex | $ | 12,752 | $ | 13,470 | $ | 25,200 | $ | 10,666 | $ | 7,400 | ||||||||||||||||||||||
| Other cap-ex | $ | 2,303 | $ | 2,472 | $ | 5,633 | $ | 5,118 | $ | 4,397 | ||||||||||||||||||||||
Same Store Performance(2) |
2Q22 | 3Q22 | 4Q22 | 1Q23 | 2Q23 | |||||||||||||||||||||||||||
| Properties | 374 | 374 | 374 | 374 | 374 | |||||||||||||||||||||||||||
| Occupancy | 95.1 | % | 95.0 | % | 95.1 | % | 95.0 | % | 95.1 | % | ||||||||||||||||||||||
| Same store revenues | $ | 158,414 | $ | 159,654 | $ | 160,439 | $ | 164,810 | $ | 163,301 | ||||||||||||||||||||||
| Same store operating expenses | 48,867 | 49,766 | 48,755 | 52,638 | 50,204 | |||||||||||||||||||||||||||
| Same store NOI | $ | 109,547 | $ | 109,888 | $ | 111,684 | $ | 112,172 | $ | 113,097 | ||||||||||||||||||||||
| NOI margin | 69.2 | % | 68.8 | % | 69.6 | % | 68.1 | % | 69.3 | % | ||||||||||||||||||||||
| Year over year NOI growth rate | 3.2 | % | ||||||||||||||||||||||||||||||
|
Portfolio Diversification
by Tenant(3)
|
Rental Income | % of Total | Quality Indicators | ||||||||||||||||||||
| Kelsey-Seybold | $ | 29,851 | 5.6 | % | Health system affiliated properties as % of NOI(3) |
88.8 | % | ||||||||||||||||
| Common Spirit Health | 19,729 | 3.7 | % | Health system affiliated tenants as % of rental income(3) |
59.7 | % | |||||||||||||||||
| Novant Health | 15,763 | 3.0 | % | Retention (trailing twelve months)(3) |
92.5 | % | |||||||||||||||||
| Summit Health | 14,888 | 2.8 | % | In-house managed properties as % of square feet(3,4) |
86.4 | % | |||||||||||||||||
| Providence Health & Services | 14,238 | 2.7 | % | Average remaining lease term (years)(3) |
6.3 | ||||||||||||||||||
| Remaining portfolio | 436,584 | 82.2 | % | Average building size (square feet)(3) |
59,928 | ||||||||||||||||||
| Total | $ | 531,053 | 100.0 | % | Average age (years) | 17 | |||||||||||||||||
Expirations(3) |
2023 | 2024 | 2025 | 2026 | 2027 | Thereafter | ||||||||||||||||||||||||||||||||
| Occupied square feet | 1,525,700 | 1,976,071 | 1,459,723 | 1,702,638 | 1,472,142 | 10,933,742 | ||||||||||||||||||||||||||||||||
| % of occupied square feet | 8.0 | % | 10.4 | % | 7.7 | % | 8.9 | % | 7.7 | % | 57.3 | % | ||||||||||||||||||||||||||
| Investment | |||||
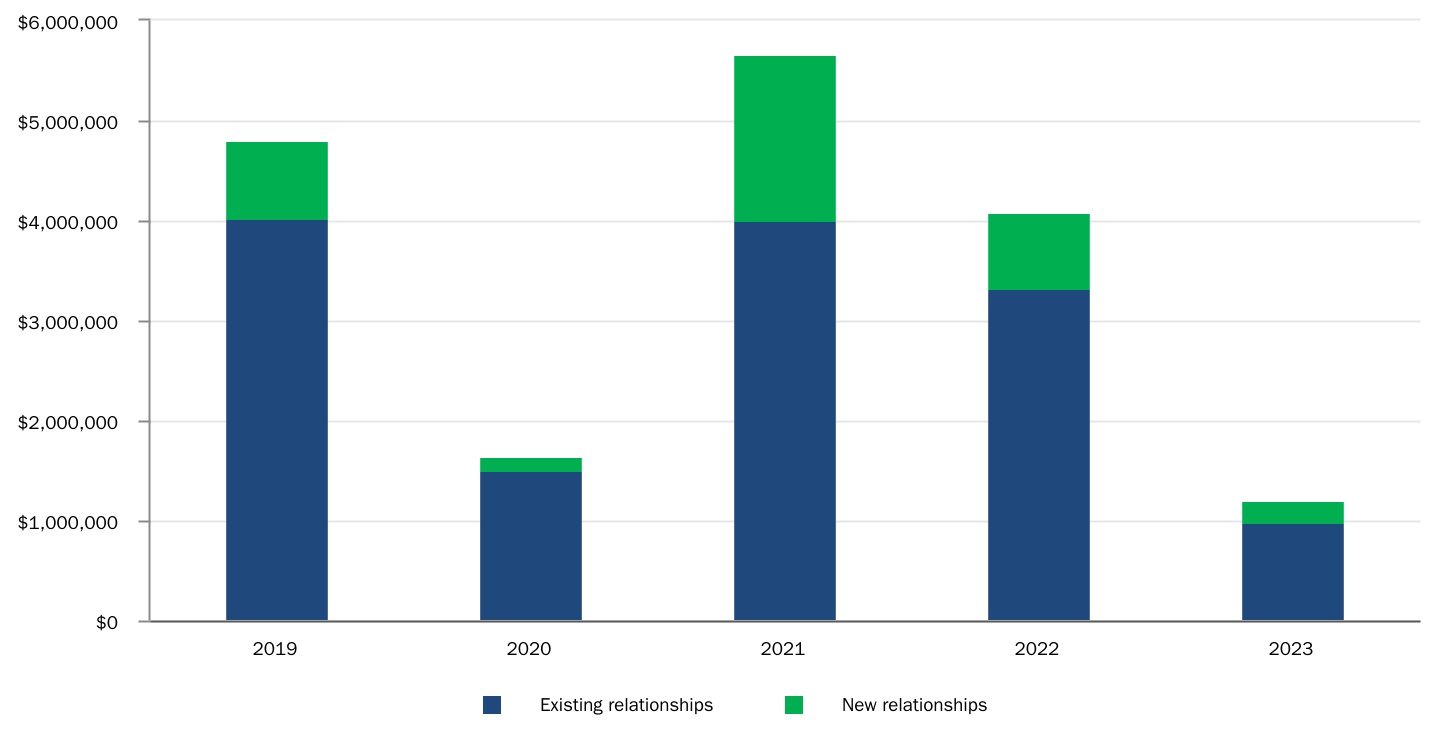
Detail of Acquisitions/JVs(1) |
||||||||||||||||||||||||||||||||||||||||||||
| 2019 | 2020 | 2021 | 2022 | 1Q23 | 2Q23 | 19-23 Total | ||||||||||||||||||||||||||||||||||||||
| Count | 27 | 12 | 35 | 27 | 11 | 2 | 114 | |||||||||||||||||||||||||||||||||||||
| Total | $ | 4,073,554 | $ | 910,217 | $ | 4,101,534 | $ | 2,785,739 | $ | 443,240 | $ | 145,094 | $ | 12,459,378 | ||||||||||||||||||||||||||||||
| Low | 7,550 | 6,201 | 5,000 | 6,485 | 19,967 | 34,532 | 5,000 | |||||||||||||||||||||||||||||||||||||
| Median | 38,800 | 48,490 | 45,157 | 66,074 | 78,250 | 72,547 | 48,793 | |||||||||||||||||||||||||||||||||||||
| High | 1,250,000 | 235,387 | 1,576,642 | 389,149 | 140,172 | 110,562 | 1,576,642 | |||||||||||||||||||||||||||||||||||||
| Investment Timing | |||||||||||||||||||||||||||||
Acquisitions and Loan Funding(2) |
Yield | Construction Conversions(3) |
Year 1 Yield | Dispositions and Loan Payoffs | Yield | ||||||||||||||||||||||||
| April | $ | 41,636 | 4.1 | % | $ | 55,319 | 1.0 | % | $ | 24,385 | 9.6 | % | |||||||||||||||||
| May | 2,887 | 6.1 | % | 23,604 | 2.4 | % | 182,090 | 4.1 | % | ||||||||||||||||||||
| June | 119,513 | 4.0 | % | 245,220 | 4.3 | % | 226,745 | 3.9 | % | ||||||||||||||||||||
| Total | $ | 164,036 | 4.1 | % | $ | 324,143 | 3.6 | % | $ | 433,220 | 4.3 | % | |||||||||||||||||
| Investment | |||||
| (dollars in thousands at Welltower pro rata ownership, except per bed / unit / square foot) | ||||||||||||||||||||||||||||||||
| Gross Investment Activity | ||||||||||||||||||||||||||||||||
| Second Quarter 2023 | ||||||||||||||||||||||||||||||||
| Properties | Beds / Units / Square Feet | Investment Per Bed / Unit / SqFt |
Pro Rata Amount |
Yield | ||||||||||||||||||||||||||||
Acquisitions and Loan Funding(1) |
||||||||||||||||||||||||||||||||
| Seniors Housing Operating | 1 | 204 | units | $ | 169,275 | $ | 145,094 | |||||||||||||||||||||||||
| Loan funding | 18,942 | |||||||||||||||||||||||||||||||
Total acquisitions and loan funding(2) |
1 | 164,036 | 4.1 | % | ||||||||||||||||||||||||||||
Development Funding(3) |
||||||||||||||||||||||||||||||||
| Development projects: | ||||||||||||||||||||||||||||||||
| Seniors Housing Operating | 37 | 6,221 | units | 140,744 | ||||||||||||||||||||||||||||
| Seniors Housing Triple-net | 1 | 191 | units | 7,311 | ||||||||||||||||||||||||||||
| Outpatient Medical | 8 | 675,386 | sf | 59,891 | ||||||||||||||||||||||||||||
| Total development projects | 46 | 207,946 | ||||||||||||||||||||||||||||||
| Expansion projects: | ||||||||||||||||||||||||||||||||
| Seniors Housing Operating | 2 | 160 | units | 6,212 | ||||||||||||||||||||||||||||
| Outpatient Medical | 7 | 323,449 | sf | 35,700 | ||||||||||||||||||||||||||||
| Total expansion projects | 9 | 41,912 | ||||||||||||||||||||||||||||||
| Total development funding | 55 | 249,858 | 7.0 | % | ||||||||||||||||||||||||||||
| Total gross investments | 413,894 | 5.8 | % | |||||||||||||||||||||||||||||
Dispositions and Loan Payoffs(4) |
||||||||||||||||||||||||||||||||
| Seniors Housing Operating | 4 | 371 | units | 559,960 | 207,745 | |||||||||||||||||||||||||||
| Loan payoffs | 43,385 | |||||||||||||||||||||||||||||||
| Leasehold termination | 7 | 1,112 | beds | 163,750 | 182,090 | |||||||||||||||||||||||||||
Total dispositions and loan payoffs(5) |
11 | 433,220 | 4.3 | % | ||||||||||||||||||||||||||||
| Net investments (dispositions) | $ | (19,326) | ||||||||||||||||||||||||||||||
| Investment | |||||
| (dollars in thousands, except per bed / unit / square foot, at Welltower pro rata ownership) | ||||||||||||||||||||||||||||||||
| Gross Investment Activity | ||||||||||||||||||||||||||||||||
| Year-To-Date 2023 | ||||||||||||||||||||||||||||||||
| Properties | Beds / Units / Square Feet | Investment Per Bed / Unit / SqFt |
Pro Rata Amount |
Yield | ||||||||||||||||||||||||||||
Acquisitions and Loan Funding(1) |
||||||||||||||||||||||||||||||||
| Seniors Housing Operating | 3 | 395 | units | $ | 137,972 | $ | 165,061 | |||||||||||||||||||||||||
| Seniors Housing Triple-net | 8 | 612 | units | 122,217 | 74,797 | |||||||||||||||||||||||||||
| Outpatient Medical | 29 | 1,297,917 | sf | 268 | 348,476 | |||||||||||||||||||||||||||
| Loan funding | 104,234 | |||||||||||||||||||||||||||||||
Total acquisitions and loan funding(2) |
40 | 692,568 | 6.8 | % | ||||||||||||||||||||||||||||
Development Funding(3) |
||||||||||||||||||||||||||||||||
| Development projects: | ||||||||||||||||||||||||||||||||
| Seniors Housing Operating | 40 | 6,638 | units | 290,043 | ||||||||||||||||||||||||||||
| Seniors Housing Triple-net | 1 | 191 | units | 13,264 | ||||||||||||||||||||||||||||
| Outpatient Medical | 9 | 692,221 | sf | 125,292 | ||||||||||||||||||||||||||||
| Total development projects | 50 | 428,599 | ||||||||||||||||||||||||||||||
| Expansion projects: | ||||||||||||||||||||||||||||||||
| Seniors Housing Operating | 2 | 160 | units | 9,554 | ||||||||||||||||||||||||||||
| Outpatient Medical | 8 | 355,294 | sf | 68,650 | ||||||||||||||||||||||||||||
| Total expansion projects | 10 | 78,204 | ||||||||||||||||||||||||||||||
| Total development funding | 60 | 506,803 | 6.9 | % | ||||||||||||||||||||||||||||
| Total gross investments | 1,199,371 | 6.9 | % | |||||||||||||||||||||||||||||
Dispositions and Loan Payoffs(4) |
||||||||||||||||||||||||||||||||
| Seniors Housing Operating | 5 | 389 | units | 534,923 | 208,068 | |||||||||||||||||||||||||||
| Seniors Housing Triple-net | 1 | 57 | units | 35,088 | 2,000 | |||||||||||||||||||||||||||
| Long-Term/Post-Acute Care | — | — | beds | — | 74,279 | |||||||||||||||||||||||||||
| Loan payoffs | 58,855 | |||||||||||||||||||||||||||||||
| Leasehold termination | 7 | 1,112 | beds | 163,750 | 182,090 | |||||||||||||||||||||||||||
Total dispositions and loan payoffs(5) |
13 | 525,292 | 5.2 | % | ||||||||||||||||||||||||||||
| Net investments (dispositions) | $ | 674,079 | ||||||||||||||||||||||||||||||
| Investment | |||||
| (dollars in thousands at Welltower pro rata ownership) | |||||||||||||||||||||||||||||||||||||||||
Development Summary(1) |
|||||||||||||||||||||||||||||||||||||||||
| Unit Mix | |||||||||||||||||||||||||||||||||||||||||
| Facility MSA | Total | Wellness Housing | Independent Living | Assisted Living | Memory Care | Commitment Amount | Balance at 06/30/23 | Estimated Conversion(3) |
|||||||||||||||||||||||||||||||||
| Seniors Housing Operating | |||||||||||||||||||||||||||||||||||||||||
| Austin, TX | 108 | 108 | — | — | — | $ | 21,293 | $ | 16,051 | 3Q23 | |||||||||||||||||||||||||||||||
| Boston, MA | 167 | — | 91 | 48 | 28 | 72,790 | 54,026 | 4Q23 | |||||||||||||||||||||||||||||||||
| Charlotte, NC | 328 | 328 | — | — | — | 59,233 | 53,072 | 3Q23 - 4Q23 | |||||||||||||||||||||||||||||||||
| Hartford, CT | 128 | 128 | — | — | — | 21,934 | 21,934 | 4Q23 | |||||||||||||||||||||||||||||||||
| Hartford, CT | 122 | 122 | — | — | — | 20,578 | 20,578 | 4Q23 | |||||||||||||||||||||||||||||||||
| Tampa, FL | 206 | 206 | — | — | — | 49,685 | 17,477 | 4Q23 - 1Q24 | |||||||||||||||||||||||||||||||||
| Austin, TX | 188 | 188 | — | — | — | 39,627 | 30,024 | 3Q23 - 1Q24 | |||||||||||||||||||||||||||||||||
| Cincinnati, OH | 122 | 122 | — | — | — | 16,385 | 10,293 | 1Q24 | |||||||||||||||||||||||||||||||||
| Washington DC | 302 | — | 190 | 89 | 23 | 156,276 | 107,099 | 2Q24 | |||||||||||||||||||||||||||||||||
| Phoenix, AZ | 199 | 199 | — | — | — | 51,794 | 32,825 | 4Q23 - 2Q24 | |||||||||||||||||||||||||||||||||
| Phoenix, AZ | 204 | 204 | — | — | — | 50,496 | 32,646 | 4Q23 - 2Q24 | |||||||||||||||||||||||||||||||||
| Kansas City, MO | 134 | 134 | — | — | — | 20,887 | 20,887 | 2Q24 | |||||||||||||||||||||||||||||||||
| Dallas, TX | 60 | 60 | — | — | — | 17,298 | 4,035 | 3Q23 - 2Q24 | |||||||||||||||||||||||||||||||||
| Washington DC | 137 | — | 10 | 90 | 37 | 115,127 | 50,576 | 3Q24 | |||||||||||||||||||||||||||||||||
| Naples, FL | 188 | 188 | — | — | — | 54,370 | 18,154 | 2Q24 - 3Q24 | |||||||||||||||||||||||||||||||||
| Sacramento, CA | 100 | — | — | 70 | 30 | 48,486 | 10,784 | 3Q24 | |||||||||||||||||||||||||||||||||
| Dallas, TX | 55 | 55 | — | — | — | 16,035 | 8,248 | 1Q24 - 3Q24 | |||||||||||||||||||||||||||||||||
| Burley, UK | 70 | — | — | 45 | 25 | 10,284 | 2,467 | 3Q24 | |||||||||||||||||||||||||||||||||
| Peterborough, UK | 80 | — | — | 52 | 28 | 9,669 | 2,568 | 3Q24 | |||||||||||||||||||||||||||||||||
| Boston, MA | 160 | — | 82 | 37 | 41 | 148,590 | 89,968 | 4Q24 | |||||||||||||||||||||||||||||||||
| Sherman, TX | 237 | 237 | — | — | — | 75,626 | 8,311 | 2Q24 - 4Q24 | |||||||||||||||||||||||||||||||||
| Phoenix, AZ | 110 | 110 | — | — | — | 40,195 | 9,220 | 2Q24 - 4Q24 | |||||||||||||||||||||||||||||||||
| Houston, TX | 130 | 130 | — | — | — | 31,100 | 23,329 | 3Q23 - 4Q24 | |||||||||||||||||||||||||||||||||
| San Jose, CA | 685 | 509 | — | 143 | 33 | 175,381 | 171,139 | 1Q25 | |||||||||||||||||||||||||||||||||
| San Jose, CA | 158 | — | — | 158 | — | 61,929 | 33,444 | 1Q25 | |||||||||||||||||||||||||||||||||
| Columbus, OH | 409 | 409 | — | — | — | 82,069 | 20,855 | 2Q25 | |||||||||||||||||||||||||||||||||
| Killeen, TX | 256 | 256 | — | — | — | 64,133 | 10,717 | 4Q23 - 2Q25 | |||||||||||||||||||||||||||||||||
| Little Rock, AR | 283 | 283 | — | — | — | 13,893 | 5,920 | 3Q25 | |||||||||||||||||||||||||||||||||
Sunrise Developments(2) |
362 | — | — | 208 | 154 | 86,281 | 57,137 | 3Q23 - 4Q24 | |||||||||||||||||||||||||||||||||
| Subtotal | 5,688 | 3,976 | 373 | 940 | 399 | 1,631,444 | 943,784 | ||||||||||||||||||||||||||||||||||
| Outpatient Medical | Rentable Square Ft | Preleased % | Health System Affiliation | Commitment Amount | Balance at 06/30/23 | Estimated Conversion | |||||||||||||||||||||||||||||||||||
| Houston, TX | 16,830 | 100 | % | Yes | 8,847 | 7,806 | 3Q23 | ||||||||||||||||||||||||||||||||||
| Houston, TX | 178,446 | 100 | % | Yes | 108,068 | 50,749 | 4Q23 | ||||||||||||||||||||||||||||||||||
| Houston, TX | 121,368 | 100 | % | Yes | 84,384 | 30,930 | 4Q23 | ||||||||||||||||||||||||||||||||||
| Oklahoma City, OK | 134,285 | 100 | % | Yes | 89,928 | 79,363 | 2Q24 | ||||||||||||||||||||||||||||||||||
| Santa Fe, NM | 90,000 | 100 | % | Yes | 45,977 | 10,171 | 3Q24 | ||||||||||||||||||||||||||||||||||
| Houston, TX | 50,323 | 100 | % | Yes | 30,156 | 3,485 | 3Q24 | ||||||||||||||||||||||||||||||||||
| Houston, TX | 51,134 | 100 | % | Yes | 28,723 | 416 | 3Q24 | ||||||||||||||||||||||||||||||||||
| Subtotal | 642,386 | 396,083 | 182,920 | ||||||||||||||||||||||||||||||||||||||
| Total Development Projects | $ | 2,027,527 | $ | 1,126,704 | |||||||||||||||||||||||||||||||||||||
| Investment | |||||
| (dollars in thousands at Welltower pro rata ownership) | |||||||||||||||||||||||||||||||||||||||||
Development Funding Projections(1) |
|||||||||||||||||||||||||||||||||||||||||
| Projected Future Funding | |||||||||||||||||||||||||||||||||||||||||
| Projects | Beds / Units / Square Feet | Stable Yields(2) |
2023 Funding | Funding Thereafter | Total Unfunded Commitments | Committed Balances | |||||||||||||||||||||||||||||||||||
| Seniors Housing Operating | 32 | 5,688 | 7.3 | % | $ | 299,773 | $ | 387,887 | $ | 687,660 | $ | 1,631,444 | |||||||||||||||||||||||||||||
| Outpatient Medical | 7 | 642,386 | 6.1 | % | 141,045 | 72,118 | 213,163 | 396,083 | |||||||||||||||||||||||||||||||||
| Total | 39 | 7.1 | % | $ | 440,818 | $ | 460,005 | $ | 900,823 | $ | 2,027,527 | ||||||||||||||||||||||||||||||
Development Project Conversion Estimates(1) |
||||||||||||||||||||||||||||||||||||||||||||
| Quarterly Conversions | Annual Conversions | |||||||||||||||||||||||||||||||||||||||||||
| Amount | Year 1 Yields(2) |
Stable Yields(2) |
Amount | Year 1 Yields(2) |
Stable Yields(2) |
|||||||||||||||||||||||||||||||||||||||
| 1Q23 actual | $ | 57,473 | 0.4 | % | 6.7 | % | 2023 actual | $ | 372,735 | 2.6 | % | 8.0 | % | |||||||||||||||||||||||||||||||
| 2Q23 actual | 315,262 | 3.0 | % | 8.2 | % | 2023 estimate | 436,701 | 2.9 | % | 6.6 | % | |||||||||||||||||||||||||||||||||
| 3Q23 estimate | 69,714 | 0.2 | % | 7.4 | % | 2024 estimate | 1,193,421 | 0.9 | % | 7.3 | % | |||||||||||||||||||||||||||||||||
| 4Q23 estimate | 366,987 | 3.4 | % | 6.4 | % | 2025 estimate | 397,405 | 4.5 | % | 7.2 | % | |||||||||||||||||||||||||||||||||
| 1Q24 estimate | 105,697 | — | % | 6.4 | % | Total | $ | 2,400,262 | 2.1 | % | 7.2 | % | ||||||||||||||||||||||||||||||||
| 2Q24 estimate | 432,656 | 1.0 | % | 7.1 | % | |||||||||||||||||||||||||||||||||||||||
| 3Q24 estimate | 336,700 | 1.2 | % | 7.4 | % | |||||||||||||||||||||||||||||||||||||||
| 4Q24 estimate | 318,368 | 0.6 | % | 7.6 | % | |||||||||||||||||||||||||||||||||||||||
| 1Q25 estimate | 237,310 | 6.8 | % | 6.8 | % | |||||||||||||||||||||||||||||||||||||||
| 2Q25 estimate | 146,202 | 0.8 | % | 7.8 | % | |||||||||||||||||||||||||||||||||||||||
| 3Q25 estimate | 13,893 | 4.1 | % | 6.9 | % | |||||||||||||||||||||||||||||||||||||||
| Total | $ | 2,400,262 | 2.1 | % | 7.2 | % | ||||||||||||||||||||||||||||||||||||||
| Unstabilized Properties | ||||||||||||||||||||||||||||||||||||||
| 3/31/2023 Properties | Stabilizations | Construction Conversions(3) |
Acquisitions/ Dispositions | 6/30/2023 Properties | Beds / Units | |||||||||||||||||||||||||||||||||
| Seniors Housing Operating | 50 | (3) | 5 | (9) | 43 | 6,111 | ||||||||||||||||||||||||||||||||
| Seniors Housing Triple-net | 15 | (1) | — | — | 14 | 1,556 | ||||||||||||||||||||||||||||||||
| Total | 65 | (4) | 5 | (9) | 57 | 7,667 | ||||||||||||||||||||||||||||||||
| Occupancy | 3/31/2023 Properties | Stabilizations | Construction Conversions(3) |
Acquisitions/ Dispositions | Progressions | 6/30/2023 Properties | ||||||||||||||||||||||||||||||||
| 0% - 50% | 30 | — | 5 | (6) | (3) | 26 | ||||||||||||||||||||||||||||||||
| 50% - 70% | 24 | — | — | (3) | (3) | 18 | ||||||||||||||||||||||||||||||||
| 70% + | 11 | (4) | — | — | 6 | 13 | ||||||||||||||||||||||||||||||||
| Total | 65 | (4) | 5 | (9) | — | 57 | ||||||||||||||||||||||||||||||||
| Occupancy | 6/30/2023 Properties | Months In Operation | Revenues | % of Total Revenues(4) |
Gross Investment Balance | % of Total Gross Investment | ||||||||||||||||||||||||||||||||
| 0% - 50% | 26 | 13 | $ | 57,430 | 0.9 | % | $ | 888,438 | 2.1 | % | ||||||||||||||||||||||||||||
| 50% - 70% | 18 | 27 | 77,868 | 1.2 | % | 569,222 | 1.3 | % | ||||||||||||||||||||||||||||||
| 70% + | 13 | 31 | 93,897 | 1.4 | % | 518,127 | 1.2 | % | ||||||||||||||||||||||||||||||
| Total | 57 | 22 | $ | 229,195 | 3.5 | % | $ | 1,975,787 | 4.6 | % | ||||||||||||||||||||||||||||
| Financial | |||||
| (dollars in thousands at Welltower pro rata ownership) | ||||||||||||||||||||
| Components of NAV | ||||||||||||||||||||
| Stabilized NOI | Pro rata beds/units/square feet | |||||||||||||||||||
Seniors Housing Operating(1) |
$ | 1,072,692 | 88,143 | units | ||||||||||||||||
| Seniors Housing Triple-net | 396,116 | 27,097 | units | |||||||||||||||||
| Outpatient Medical | 489,144 | 20,236,315 | square feet | |||||||||||||||||
| Long-Term/Post-Acute Care | 233,084 | 24,553 | beds | |||||||||||||||||
Total In-Place NOI(2) |
2,191,036 | |||||||||||||||||||
Incremental stabilized NOI(3) |
96,338 | |||||||||||||||||||
| Total stabilized NOI | $ | 2,287,374 | ||||||||||||||||||
| Obligations | ||||||||||||||||||||
Lines of credit and commercial paper(4) |
$ | — | ||||||||||||||||||
Senior unsecured notes(4) |
13,695,104 | |||||||||||||||||||
Secured debt(4) |
3,468,103 | |||||||||||||||||||
| Financing lease liabilities | 49,393 | |||||||||||||||||||
| Total debt | $ | 17,212,600 | ||||||||||||||||||
| Add (Subtract): | ||||||||||||||||||||
Other liabilities (assets), net(5) |
$ | 451,087 | ||||||||||||||||||
| Cash and cash equivalents and restricted cash | (2,299,069) | |||||||||||||||||||
| Net obligations | $ | 15,364,618 | ||||||||||||||||||
| Other Assets | ||||||||||||||||||||
| Land parcels | $ | 261,039 | Effective Interest Rate(8) |
|||||||||||||||||
Real estate loans receivable(6) |
1,586,864 | 11.0% | ||||||||||||||||||
Non-real estate loans receivable(7) |
257,218 | 11.4% | ||||||||||||||||||
Joint venture real estate loans receivables(9) |
254,961 | 5.7% | ||||||||||||||||||
Other investments(10) |
15,205 | |||||||||||||||||||
Property dispositions(11) |
960,846 | |||||||||||||||||||
Development properties:(12) |
||||||||||||||||||||
| Current balance | 1,208,758 | |||||||||||||||||||
| Unfunded commitments | 1,064,081 | |||||||||||||||||||
| Committed balances | $ | 2,272,839 | ||||||||||||||||||
| Projected yield | 7.1 | % | ||||||||||||||||||
| Projected NOI | $ | 161,372 | ||||||||||||||||||
Common Shares Outstanding(13) |
510,024 | |||||||||||||||||||
| Unearned revenues | $ | 414,089 | ||||||
| Below market tenant lease intangibles, net | 25,300 | |||||||
| Deferred taxes, net | (39,829) | |||||||
| Intangible assets, net | (156,749) | |||||||
| Other non-cash liabilities / (assets), net | 8,181 | |||||||
| Total non-cash liabilities/(assets), net | $ | 250,992 | ||||||
| Financial | |||||
| (dollars in thousands at Welltower pro rata ownership) | ||||||||||||||||||||||||||||||||
Net Operating Income(1,2) |
||||||||||||||||||||||||||||||||
| 2Q22 | 3Q22 | 4Q22 | 1Q23 | 2Q23 | ||||||||||||||||||||||||||||
| Revenues: | ||||||||||||||||||||||||||||||||
| Seniors Housing Operating | ||||||||||||||||||||||||||||||||
| Resident fees and services | $ | 1,000,571 | $ | 1,057,814 | $ | 1,091,043 | $ | 1,138,916 | $ | 1,173,630 | ||||||||||||||||||||||
| Interest income | 1,642 | 2,210 | 2,388 | 2,318 | 1,850 | |||||||||||||||||||||||||||
| Other income | (1,251) | 1,729 | 1,715 | 2,510 | 3,495 | |||||||||||||||||||||||||||
| Total revenues | 1,000,962 | 1,061,753 | 1,095,146 | 1,143,744 | 1,178,975 | |||||||||||||||||||||||||||
| Seniors Housing Triple-net | ||||||||||||||||||||||||||||||||
| Rental income | 123,557 | 116,233 | 122,267 | 119,786 | 118,115 | |||||||||||||||||||||||||||
| Interest income | 31,725 | 32,726 | 31,837 | 31,540 | 32,657 | |||||||||||||||||||||||||||
| Other income | 1,786 | 1,307 | 1,361 | 1,675 | 1,202 | |||||||||||||||||||||||||||
| Total revenues | 157,068 | 150,266 | 155,465 | 153,001 | 151,974 | |||||||||||||||||||||||||||
| Outpatient Medical | ||||||||||||||||||||||||||||||||
| Rental income | 163,808 | 170,051 | 174,182 | 182,044 | 185,133 | |||||||||||||||||||||||||||
| Interest income | 65 | 80 | 86 | 91 | 95 | |||||||||||||||||||||||||||
| Other income | 2,347 | 1,859 | 2,548 | 3,055 | 1,574 | |||||||||||||||||||||||||||
| Total revenues | 166,220 | 171,990 | 176,816 | 185,190 | 186,802 | |||||||||||||||||||||||||||
| Long-Term/Post-Acute Care | ||||||||||||||||||||||||||||||||
| Rental income | 68,598 | 70,356 | 71,021 | 80,423 | 75,766 | |||||||||||||||||||||||||||
| Interest income | 5,499 | 5,760 | 5,982 | 6,367 | 8,264 | |||||||||||||||||||||||||||
| Other income | — | 513 | 153 | 193 | 65,490 | |||||||||||||||||||||||||||
| Total revenues | 74,097 | 76,629 | 77,156 | 86,983 | 149,520 | |||||||||||||||||||||||||||
| Corporate | ||||||||||||||||||||||||||||||||
| Other income | 3,665 | 3,942 | 7,714 | 5,147 | 16,807 | |||||||||||||||||||||||||||
| Total revenues | 3,665 | 3,942 | 7,714 | 5,147 | 16,807 | |||||||||||||||||||||||||||
| Total | ||||||||||||||||||||||||||||||||
| Rental income | 355,963 | 356,640 | 367,470 | 382,253 | 379,014 | |||||||||||||||||||||||||||
| Resident fees and services | 1,000,571 | 1,057,814 | 1,091,043 | 1,138,916 | 1,173,630 | |||||||||||||||||||||||||||
| Interest Income | 38,931 | 40,776 | 40,293 | 40,316 | 42,866 | |||||||||||||||||||||||||||
| Other Income | 6,547 | 9,350 | 13,491 | 12,580 | 88,568 | |||||||||||||||||||||||||||
| Total revenues | 1,402,012 | 1,464,580 | 1,512,297 | 1,574,065 | 1,684,078 | |||||||||||||||||||||||||||
| Property operating expenses: | ||||||||||||||||||||||||||||||||
| Seniors Housing Operating | 777,178 | 831,556 | 866,482 | 894,981 | 902,068 | |||||||||||||||||||||||||||
| Seniors Housing Triple-net | 7,799 | 7,710 | 6,924 | 7,917 | 7,996 | |||||||||||||||||||||||||||
| Outpatient Medical | 51,177 | 53,684 | 53,259 | 58,977 | 59,358 | |||||||||||||||||||||||||||
| Long-Term/Post-Acute Care | 3,916 | 4,034 | 3,426 | 4,040 | 2,827 | |||||||||||||||||||||||||||
| Corporate | 2,645 | 5,794 | 5,086 | 3,877 | 4,135 | |||||||||||||||||||||||||||
| Total property operating expenses | 842,715 | 902,778 | 935,177 | 969,792 | 976,384 | |||||||||||||||||||||||||||
| Net operating income: | ||||||||||||||||||||||||||||||||
| Seniors Housing Operating | 223,784 | 230,197 | 228,664 | 248,763 | 276,907 | |||||||||||||||||||||||||||
| Seniors Housing Triple-net | 149,269 | 142,556 | 148,541 | 145,084 | 143,978 | |||||||||||||||||||||||||||
| Outpatient Medical | 115,043 | 118,306 | 123,557 | 126,213 | 127,444 | |||||||||||||||||||||||||||
| Long-Term/Post-Acute Care | 70,181 | 72,595 | 73,730 | 82,943 | 146,693 | |||||||||||||||||||||||||||
| Corporate | 1,020 | (1,852) | 2,628 | 1,270 | 12,672 | |||||||||||||||||||||||||||
| Net operating income | $ | 559,297 | $ | 561,802 | $ | 577,120 | $ | 604,273 | $ | 707,694 | ||||||||||||||||||||||
| Financial | |||||
| (dollars in thousands) | ||||||||||||||
Leverage and EBITDA Reconciliations(1) |
||||||||||||||
| Twelve Months Ended | Three Months Ended | |||||||||||||
| June 30, 2023 | June 30, 2023 | |||||||||||||
| Net income (loss) | $ | 134,122 | $ | 106,342 | ||||||||||
| Interest expense | 576,813 | 152,337 | ||||||||||||
| Income tax expense (benefit) | 5,717 | 3,503 | ||||||||||||
| Depreciation and amortization | 1,377,042 | 341,945 | ||||||||||||
| EBITDA | 2,093,694 | 604,127 | ||||||||||||
| Loss (income) from unconsolidated entities | 58,751 | 40,332 | ||||||||||||
| Stock-based compensation | 32,299 | 10,491 | ||||||||||||
| Loss (gain) on extinguishment of debt, net | 95 | 1 | ||||||||||||
| Loss (gain) on real estate dispositions, net | 4,780 | 2,168 | ||||||||||||
| Impairment of assets | 31,217 | 1,086 | ||||||||||||
| Provision for loan losses, net | 14,192 | 2,456 | ||||||||||||
| Loss (gain) on derivatives and financial instruments, net | 9,373 | 1,280 | ||||||||||||
| Other expenses | 74,249 | 11,069 | ||||||||||||
Leasehold interest termination(2) |
(65,485) | (65,485) | ||||||||||||
| Casualty losses, net of recoveries | 15,760 | 3,568 | ||||||||||||
| Total adjustments | 175,231 | 6,966 | ||||||||||||
| Adjusted EBITDA | $ | 2,268,925 | $ | 611,093 | ||||||||||
| Interest Coverage Ratios | ||||||||||||||
| Interest expense | $ | 576,813 | $ | 152,337 | ||||||||||
| Capitalized interest | 40,830 | 11,870 | ||||||||||||
| Non-cash interest expense | (21,946) | (5,824) | ||||||||||||
| Total interest | $ | 595,697 | $ | 158,383 | ||||||||||
| EBITDA | $ | 2,093,694 | $ | 604,127 | ||||||||||
| Interest coverage ratio | 3.51 | x | 3.81 | x | ||||||||||
| Adjusted EBITDA | $ | 2,268,925 | $ | 611,093 | ||||||||||
| Adjusted Interest coverage ratio | 3.81 | x | 3.86 | x | ||||||||||
| Fixed Charge Coverage Ratios | ||||||||||||||
| Total interest | $ | 595,697 | $ | 158,383 | ||||||||||
| Secured debt principal amortization | 56,545 | 13,839 | ||||||||||||
| Total fixed charges | $ | 652,242 | $ | 172,222 | ||||||||||
| EBITDA | $ | 2,093,694 | $ | 604,127 | ||||||||||
| Fixed charge coverage ratio | 3.21 | x | 3.51 | x | ||||||||||
| Adjusted EBITDA | $ | 2,268,925 | $ | 611,093 | ||||||||||
| Adjusted Fixed charge coverage ratio | 3.48 | x | 3.55 | x | ||||||||||
| Net Debt to EBITDA Ratios | ||||||||||||||
Total debt(3) |
$ | 16,040,530 | ||||||||||||
| Less: cash and cash equivalents and restricted cash | (2,299,069) | |||||||||||||
| Net debt | $ | 13,741,461 | ||||||||||||
| EBITDA Annualized | $ | 2,416,508 | ||||||||||||
| Net debt to EBITDA ratio | 5.69 | x | ||||||||||||
| Adjusted EBITDA Annualized | $ | 2,444,372 | ||||||||||||
| Net debt to Adjusted EBITDA ratio | 5.62 | x | ||||||||||||
| Financial | |||||
| (in thousands except share price) | |||||||||||||||||
Leverage and Current Capitalization(1) | |||||||||||||||||
| % of Total | |||||||||||||||||
| Book capitalization | |||||||||||||||||
Lines of credit and commercial paper(2) |
$ | — | 0.00 | % | |||||||||||||
Long-term debt obligations(2)(3) |
16,040,530 | 44.64 | % | ||||||||||||||
| Cash and cash equivalents and restricted cash | (2,299,069) | (6.40) | % | ||||||||||||||
| Net debt to consolidated book capitalization | $ | 13,741,461 | 38.24 | % | |||||||||||||
Total equity(4) |
22,193,114 | 61.76 | % | ||||||||||||||
| Consolidated book capitalization | $ | 35,934,575 | 100.00 | % | |||||||||||||
Joint venture debt, net(5) |
971,512 | ||||||||||||||||
| Total book capitalization | $ | 36,906,087 | |||||||||||||||
| Undepreciated book capitalization | |||||||||||||||||
Lines of credit and commercial paper(2) |
$ | — | 0.00 | % | |||||||||||||
Long-term debt obligations(2)(3) |
16,040,530 | 36.02 | % | ||||||||||||||
| Cash and cash equivalents and restricted cash | (2,299,069) | (5.16) | % | ||||||||||||||
| Net debt to consolidated undepreciated book capitalization | $ | 13,741,461 | 30.86 | % | |||||||||||||
| Accumulated depreciation and amortization | 8,599,622 | 19.31 | % | ||||||||||||||
Total equity(4) |
22,193,114 | 49.83 | % | ||||||||||||||
| Consolidated undepreciated book capitalization | $ | 44,534,197 | 100.00 | % | |||||||||||||
Joint venture debt, net(5) |
971,512 | ||||||||||||||||
| Total undepreciated book capitalization | $ | 45,505,709 | |||||||||||||||
| Enterprise value | |||||||||||||||||
Lines of credit and commercial paper(2) |
$ | — | 0.00 | % | |||||||||||||
Long-term debt obligations(2)(3) |
16,040,530 | 28.73 | % | ||||||||||||||
| Cash and cash equivalents and restricted cash | (2,299,069) | (4.12) | % | ||||||||||||||
| Net debt to consolidated enterprise value | $ | 13,741,461 | 24.61 | % | |||||||||||||
| Common shares outstanding | 508,159 | ||||||||||||||||
| Period end share price | 80.89 | ||||||||||||||||
| Common equity market capitalization | $ | 41,104,982 | 73.62 | % | |||||||||||||
Noncontrolling interests(4) |
988,673 | 1.77 | % | ||||||||||||||
| Consolidated enterprise value | $ | 55,835,116 | 100.00 | % | |||||||||||||
Joint venture debt, net(5) |
971,512 | ||||||||||||||||
| Total enterprise value | $ | 56,806,628 | |||||||||||||||
| Secured debt as % of total assets | |||||||||||||||||
Secured debt(2) |
$ | 2,460,349 | 5.06 | % | |||||||||||||
Gross asset value(6) |
$ | 48,663,757 | |||||||||||||||
| Total debt as % of gross asset value | |||||||||||||||||
Total debt(2)(3) |
$ | 16,040,530 | 32.96 | % | |||||||||||||
Gross asset value(6) |
$ | 48,663,757 | |||||||||||||||
| Unsecured debt as % of unencumbered assets | |||||||||||||||||
Unsecured debt(2) |
$ | 13,530,788 | 31.34 | % | |||||||||||||
Unencumbered gross assets(7) |
$ | 43,176,774 | |||||||||||||||
| Financial | |||||
| (dollars in thousands) | |||||||||||||||||||||||||||||||||||||||||||||||||||||
Debt Maturities and Scheduled Principal Amortization(1) | |||||||||||||||||||||||||||||||||||||||||||||||||||||
| Year | Lines of Credit and Commercial Paper(2) |
Senior Unsecured Notes(3,4,5,6,7) |
Consolidated Secured Debt | Share of Unconsolidated Secured Debt | Noncontrolling Interests' Share of Consolidated Secured Debt | Combined Debt(8) |
% of Total | Wtd. Avg. Interest Rate (9) |
|||||||||||||||||||||||||||||||||||||||||||||
| 2023 | $ | — | $ | — | $ | 398,560 | $ | 216,141 | $ | (107,924) | $ | 506,777 | 2.95 | % | 5.35 | % | |||||||||||||||||||||||||||||||||||||
| 2024 | — | 1,350,000 | 470,448 | 177,251 | (93,112) | 1,904,587 | 11.10 | % | 4.16 | % | |||||||||||||||||||||||||||||||||||||||||||
| 2025 | — | 1,260,000 | 298,553 | 536,588 | (45,844) | 2,049,297 | 11.94 | % | 3.99 | % | |||||||||||||||||||||||||||||||||||||||||||
| 2026 | — | 700,000 | 144,144 | 82,550 | (20,573) | 906,121 | 5.28 | % | 4.18 | % | |||||||||||||||||||||||||||||||||||||||||||
| 2027 | — | 1,915,659 | 190,356 | 120,330 | (39,121) | 2,187,224 | 12.74 | % | 4.62 | % | |||||||||||||||||||||||||||||||||||||||||||
| 2028 | — | 2,483,995 | 102,812 | 25,992 | (13,131) | 2,599,668 | 15.15 | % | 3.80 | % | |||||||||||||||||||||||||||||||||||||||||||
| 2029 | — | 1,050,000 | 289,827 | 35,972 | (936) | 1,374,863 | 8.01 | % | 3.75 | % | |||||||||||||||||||||||||||||||||||||||||||
| 2030 | — | 750,000 | 57,124 | 30,776 | (127) | 837,773 | 4.88 | % | 3.14 | % | |||||||||||||||||||||||||||||||||||||||||||
| 2031 | — | 1,350,000 | 7,038 | 33,303 | (133) | 1,390,208 | 8.10 | % | 2.77 | % | |||||||||||||||||||||||||||||||||||||||||||
| 2032 | — | 1,050,000 | 48,015 | 3,401 | (138) | 1,101,278 | 6.42 | % | 4.37 | % | |||||||||||||||||||||||||||||||||||||||||||
| Thereafter | — | 1,785,450 | 489,714 | 70,564 | (40,317) | 2,305,411 | 13.43 | % | 5.02 | % | |||||||||||||||||||||||||||||||||||||||||||
| Totals | $ | — | $ | 13,695,104 | $ | 2,496,591 | $ | 1,332,868 | $ | (361,356) | $ | 17,163,207 | 100.00 | % | |||||||||||||||||||||||||||||||||||||||
Weighted Avg. Interest Rate(9) |
— | 4.00 | % | 4.70 | % | 4.35 | % | 4.93 | % | 4.11 | % | ||||||||||||||||||||||||||||||||||||||||||
| Weighted Avg. Maturity Years | — | 6.3 | 4.7 | 4.1 | 3.0 | 6.0 | |||||||||||||||||||||||||||||||||||||||||||||||
% Floating Rate Debt(8) |
100.00 | % | 10.21 | % | 30.36 | % | 20.02 | % | 44.92 | % | 13.18 | % | |||||||||||||||||||||||||||||||||||||||||
Debt by Local Currency(1) | |||||||||||||||||||||||||||||||||||||||||||||||
Lines of Credit and Commercial Paper(2) |
Senior Unsecured Notes(3,4,5,6,7) |
Consolidated Secured Debt | Share of Unconsolidated Secured Debt | Noncontrolling Interests' Share of Consolidated Secured Debt | Combined Debt(8) |
Investment Hedges(10) |
|||||||||||||||||||||||||||||||||||||||||
| United States | $ | — | $ | 11,945,000 | $ | 1,542,508 | $ | 1,007,250 | $ | (141,283) | $ | 14,353,475 | $ | — | |||||||||||||||||||||||||||||||||
| United Kingdom | — | 1,334,445 | — | — | — | 1,334,445 | 2,402,901 | ||||||||||||||||||||||||||||||||||||||||
| Canada | — | 415,659 | 954,083 | 325,618 | (220,073) | 1,475,287 | 812,424 | ||||||||||||||||||||||||||||||||||||||||
| Totals | $ | — | $ | 13,695,104 | $ | 2,496,591 | $ | 1,332,868 | $ | (361,356) | $ | 17,163,207 | $ | 3,215,325 | |||||||||||||||||||||||||||||||||
| Glossary | |||||
| Supplemental Reporting Measures | |||||
| Supplemental Reporting Measures | |||||
| (dollars in thousands) | |||||||||||||||||||||||||||||||||||||||||
| Non-GAAP Reconciliations | |||||||||||||||||||||||||||||||||||||||||
| NOI Reconciliation | 2Q22 | 3Q22 | 4Q22 | 1Q23 | 2Q23 | ||||||||||||||||||||||||||||||||||||
| Net income (loss) | $ | 95,672 | $ | (2,653) | $ | 1,798 | $ | 28,635 | $ | 106,342 | |||||||||||||||||||||||||||||||
| Loss (gain) on real estate dispositions, net | 3,532 | (1,064) | 4,423 | (747) | 2,168 | ||||||||||||||||||||||||||||||||||||
| Loss (income) from unconsolidated entities | 7,058 | 6,698 | 4,650 | 7,071 | 40,332 | ||||||||||||||||||||||||||||||||||||
| Income tax expense (benefit) | 3,065 | 3,257 | (4,088) | 3,045 | 3,503 | ||||||||||||||||||||||||||||||||||||
| Other expenses | 35,166 | 15,481 | 24,954 | 22,745 | 11,069 | ||||||||||||||||||||||||||||||||||||
| Impairment of assets | — | 4,356 | 13,146 | 12,629 | 1,086 | ||||||||||||||||||||||||||||||||||||
| Provision for loan losses, net | 165 | 490 | 10,469 | 777 | 2,456 | ||||||||||||||||||||||||||||||||||||
| Loss (gain) on extinguishment of debt, net | 603 | 2 | 87 | 5 | 1 | ||||||||||||||||||||||||||||||||||||
| Loss (gain) on derivatives and financial instruments, net | (1,407) | 6,905 | 258 | 930 | 1,280 | ||||||||||||||||||||||||||||||||||||
| General and administrative expenses | 36,554 | 34,811 | 41,319 | 44,371 | 44,287 | ||||||||||||||||||||||||||||||||||||
| Depreciation and amortization | 310,295 | 353,699 | 342,286 | 339,112 | 341,945 | ||||||||||||||||||||||||||||||||||||
| Interest expense | 127,750 | 139,682 | 140,391 | 144,403 | 152,337 | ||||||||||||||||||||||||||||||||||||
| Consolidated net operating income | 618,453 | 561,664 | 579,693 | 602,976 | 706,806 | ||||||||||||||||||||||||||||||||||||
NOI attributable to unconsolidated investments(1) |
23,648 | 27,374 | 24,950 | 26,354 | 25,150 | ||||||||||||||||||||||||||||||||||||
NOI attributable to noncontrolling interests(2) |
(82,804) | (27,236) | (27,523) | (25,057) | (24,262) | ||||||||||||||||||||||||||||||||||||
Pro rata net operating income (NOI)(3) |
$ | 559,297 | $ | 561,802 | $ | 577,120 | $ | 604,273 | $ | 707,694 | |||||||||||||||||||||||||||||||
| In-Place NOI Reconciliation | ||||||||||||||||||||||||||||||||||||||
| At Welltower pro rata ownership | Seniors Housing Operating | Seniors Housing Triple-net | Outpatient Medical | Long-Term /Post-Acute Care |
Corporate | Total | ||||||||||||||||||||||||||||||||
| Revenues | $ | 1,178,975 | $ | 151,974 | $ | 186,802 | $ | 149,520 | $ | 16,807 | $ | 1,684,078 | ||||||||||||||||||||||||||
| Property operating expenses | (902,068) | (7,996) | (59,358) | (2,827) | (4,135) | (976,384) | ||||||||||||||||||||||||||||||||
NOI(3) |
276,907 | 143,978 | 127,444 | 146,693 | 12,672 | 707,694 | ||||||||||||||||||||||||||||||||
| Adjust: | ||||||||||||||||||||||||||||||||||||||
| Interest income | (1,850) | (32,657) | (95) | (8,264) | — | (42,866) | ||||||||||||||||||||||||||||||||
| Other income | (3,260) | (352) | (46) | (65,490) | (12,719) | (81,867) | ||||||||||||||||||||||||||||||||
| Sold / held for sale | (3,063) | (1,331) | 17 | (1,760) | — | (6,137) | ||||||||||||||||||||||||||||||||
Non operational(4) |
2,035 | — | (186) | (102) | — | 1,747 | ||||||||||||||||||||||||||||||||
Non In-Place NOI(5) |
(3,871) | (10,609) | (4,848) | (12,806) | 47 | (32,087) | ||||||||||||||||||||||||||||||||
Timing adjustments(6) |
1,275 | — | — | — | — | 1,275 | ||||||||||||||||||||||||||||||||
| Total adjustments | (8,734) | (44,949) | (5,158) | (88,422) | (12,672) | (159,935) | ||||||||||||||||||||||||||||||||
| In-Place NOI | 268,173 | 99,029 | 122,286 | 58,271 | — | 547,759 | ||||||||||||||||||||||||||||||||
| Annualized In-Place NOI | $ | 1,072,692 | $ | 396,116 | $ | 489,144 | $ | 233,084 | $ | — | $ | 2,191,036 | ||||||||||||||||||||||||||
| Same Store Property Reconciliation | ||||||||||||||||||||||||||||||||
| Seniors Housing Operating | Seniors Housing Triple-net |
Outpatient Medical | Long-Term /Post-Acute Care |
Total | ||||||||||||||||||||||||||||
| Total properties | 957 | 373 | 437 | 234 | 2,001 | |||||||||||||||||||||||||||
Recent acquisitions/ development conversions(7) |
(88) | (13) | (41) | — | (142) | |||||||||||||||||||||||||||
| Under development | (33) | — | (7) | — | (40) | |||||||||||||||||||||||||||
Under redevelopment(8) |
(8) | — | (4) | (6) | (18) | |||||||||||||||||||||||||||
| Current held for sale | (31) | (12) | (2) | (28) | (73) | |||||||||||||||||||||||||||
| Land parcels, loans and sub-leases | (21) | (8) | (9) | — | (38) | |||||||||||||||||||||||||||
Transitions(9) |
(89) | (13) | — | (150) | (252) | |||||||||||||||||||||||||||
Other(10) |
(13) | — | — | (2) | (15) | |||||||||||||||||||||||||||
| Same store properties | 674 | 327 | 374 | 48 | 1,423 | |||||||||||||||||||||||||||
| Supplemental Reporting Measures | |||||
| (dollars in thousands at Welltower pro rata ownership) | ||||||||||||||||||||||||||||||||||||||
| Same Store NOI Reconciliation | 2Q22 | 3Q22 | 4Q22 | 1Q23 | 2Q23 | Y/o/Y | ||||||||||||||||||||||||||||||||
| Seniors Housing Operating | ||||||||||||||||||||||||||||||||||||||
| NOI | $ | 223,784 | $ | 230,197 | $ | 228,664 | $ | 248,763 | $ | 276,907 | ||||||||||||||||||||||||||||
| Non-cash NOI on same store properties | (375) | (349) | (348) | (319) | (152) | |||||||||||||||||||||||||||||||||
| NOI attributable to non-same store properties | (35,269) | (49,185) | (41,922) | (50,514) | (54,225) | |||||||||||||||||||||||||||||||||
Currency and ownership adjustments(1) |
(1,209) | (430) | 800 | (111) | (925) | |||||||||||||||||||||||||||||||||
Normalizing adjustment for government grants(2) |
(13,061) | (2,188) | (2,360) | (18) | (5,352) | |||||||||||||||||||||||||||||||||
Other normalizing adjustments(3) |
1,546 | 1,160 | 4,649 | 4,449 | 1,610 | |||||||||||||||||||||||||||||||||
SSNOI(4) |
175,416 | 179,205 | 189,483 | 202,250 | 217,863 | 24.2 | % | |||||||||||||||||||||||||||||||
| Seniors Housing Triple-net | ||||||||||||||||||||||||||||||||||||||
| NOI | 149,269 | 142,556 | 148,541 | 145,084 | 143,978 | |||||||||||||||||||||||||||||||||
| Non-cash NOI on same store properties | (13,274) | (10,845) | (10,365) | (12,531) | (10,040) | |||||||||||||||||||||||||||||||||
| NOI attributable to non-same store properties | (44,437) | (41,042) | (45,319) | (39,248) | (39,595) | |||||||||||||||||||||||||||||||||
Currency and ownership adjustments(1) |
(818) | 295 | 371 | (212) | (768) | |||||||||||||||||||||||||||||||||
| SSNOI | 90,740 | 90,964 | 93,228 | 93,093 | 93,575 | 3.1 | % | |||||||||||||||||||||||||||||||
| Outpatient Medical | ||||||||||||||||||||||||||||||||||||||
| NOI | 115,043 | 118,306 | 123,557 | 126,213 | 127,444 | |||||||||||||||||||||||||||||||||
| Non-cash NOI on same store properties | (3,788) | (4,238) | (4,835) | (4,666) | (4,319) | |||||||||||||||||||||||||||||||||
| NOI attributable to non-same store properties | (2,057) | (3,316) | (6,885) | (9,115) | (10,380) | |||||||||||||||||||||||||||||||||
Currency and ownership adjustments(1) |
437 | 192 | (153) | 180 | (12) | |||||||||||||||||||||||||||||||||
Other normalizing adjustments(3) |
(88) | (1,056) | — | (440) | 364 | |||||||||||||||||||||||||||||||||
| SSNOI | 109,547 | 109,888 | 111,684 | 112,172 | 113,097 | 3.2 | % | |||||||||||||||||||||||||||||||
| Long-Term/Post-Acute Care | ||||||||||||||||||||||||||||||||||||||
| NOI | 70,181 | 72,595 | 73,730 | 82,943 | 146,693 | |||||||||||||||||||||||||||||||||
| Non-cash NOI on same store properties | (725) | (1,654) | (1,526) | (1,538) | (1,160) | |||||||||||||||||||||||||||||||||
| NOI attributable to non-same store properties | (50,810) | (51,674) | (53,239) | (61,910) | (125,838) | |||||||||||||||||||||||||||||||||
Currency and ownership adjustments(1) |
(123) | (84) | (16) | (22) | (33) | |||||||||||||||||||||||||||||||||
Other normalizing adjustments(3) |
— | (327) | — | — | — | |||||||||||||||||||||||||||||||||
| SSNOI | 18,523 | 18,856 | 18,949 | 19,473 | 19,662 | 6.1 | % | |||||||||||||||||||||||||||||||
| Corporate | ||||||||||||||||||||||||||||||||||||||
| NOI | 1,020 | (1,852) | 2,628 | 1,270 | 12,672 | |||||||||||||||||||||||||||||||||
| NOI attributable to non-same store properties | (1,020) | 1,852 | (2,628) | (1,270) | (12,672) | |||||||||||||||||||||||||||||||||
| SSNOI | — | — | — | — | — | |||||||||||||||||||||||||||||||||
| Total | ||||||||||||||||||||||||||||||||||||||
| NOI | 559,297 | 561,802 | 577,120 | 604,273 | 707,694 | |||||||||||||||||||||||||||||||||
| Non-cash NOI on same store properties | (18,162) | (17,086) | (17,074) | (19,054) | (15,671) | |||||||||||||||||||||||||||||||||
| NOI attributable to non-same store properties | (133,593) | (143,365) | (149,993) | (162,057) | (242,710) | |||||||||||||||||||||||||||||||||
Currency and ownership adjustments(1) |
(1,713) | (27) | 1,002 | (165) | (1,738) | |||||||||||||||||||||||||||||||||
| Normalizing adjustments, net | (11,603) | (2,411) | 2,289 | 3,991 | (3,378) | |||||||||||||||||||||||||||||||||
| SSNOI | $ | 394,226 | $ | 398,913 | $ | 413,344 | $ | 426,988 | $ | 444,197 | 12.7 | % | ||||||||||||||||||||||||||
| Supplemental Reporting Measures | |||||
| (dollars in thousands, except RevPOR, SS RevPOR and SSNOI/unit) | ||||||||||||||||||||||||||
| SHO RevPOR Reconciliation | United States | United Kingdom | Canada | Total | ||||||||||||||||||||||
| Consolidated SHO revenues | $ | 934,244 | $ | 113,875 | $ | 116,320 | $ | 1,164,439 | ||||||||||||||||||
Unconsolidated SHO revenues attributable to Welltower(1) |
36,857 | 1,657 | 24,527 | 63,041 | ||||||||||||||||||||||
SHO revenues attributable to noncontrolling interests(2) |
(17,100) | (8,148) | (23,257) | (48,505) | ||||||||||||||||||||||
Pro rata SHO revenues(3) |
954,001 | 107,384 | 117,590 | 1,178,975 | ||||||||||||||||||||||
| SHO interest and other income | (12,087) | (37) | (951) | (13,075) | ||||||||||||||||||||||
| SHO revenues attributable to sold and held for sale properties | (5,215) | (4,927) | (14,114) | (24,256) | ||||||||||||||||||||||
Currency and ownership adjustments(4) |
(1,954) | (4,278) | (2,154) | (8,386) | ||||||||||||||||||||||
| SHO local revenues | 934,745 | 98,142 | 100,371 | 1,133,258 | ||||||||||||||||||||||
| Average occupied units/month | 54,688 | 3,748 | 13,084 | 71,520 | ||||||||||||||||||||||
| RevPOR/month in USD | $ | 5,713 | $ | 8,752 | $ | 2,564 | $ | 5,296 | ||||||||||||||||||
RevPOR/month in local currency(4) |
£ | 7,293 | $ | 3,512 | ||||||||||||||||||||||
| Reconciliations of SHO SS RevPOR Growth, SSNOI Growth and SSNOI/Unit | |||||||||||||||||||||||||||||||||||||||||||||||
| United States | United Kingdom | Canada | Total | ||||||||||||||||||||||||||||||||||||||||||||
| 2Q22 | 2Q23 | 2Q22 | 2Q23 | 2Q22 | 2Q23 | 2Q22 | 2Q23 | ||||||||||||||||||||||||||||||||||||||||
| SHO SS RevPOR Growth | |||||||||||||||||||||||||||||||||||||||||||||||
| Consolidated SHO revenues | $ | 859,987 | $ | 934,244 | $ | 99,647 | $ | 113,875 | $ | 111,576 | $ | 116,320 | $ | 1,071,210 | $ | 1,164,439 | |||||||||||||||||||||||||||||||
Unconsolidated SHO revenues attributable to WELL(1) |
28,910 | 36,857 | — | 1,657 | 22,546 | 24,527 | 51,456 | 63,041 | |||||||||||||||||||||||||||||||||||||||
SHO revenues attributable to noncontrolling interests(2) |
(89,739) | (17,100) | (9,339) | (8,148) | (22,626) | (23,257) | (121,704) | (48,505) | |||||||||||||||||||||||||||||||||||||||
SHO pro rata revenues(3) |
799,158 | 954,001 | 90,308 | 107,384 | 111,496 | 117,590 | 1,000,962 | 1,178,975 | |||||||||||||||||||||||||||||||||||||||
| Non-cash and non-RevPOR revenues on same store properties | (835) | (1,656) | — | — | (72) | (350) | (907) | (2,006) | |||||||||||||||||||||||||||||||||||||||
| Revenues attributable to non-same store properties | (148,590) | (220,863) | (47,971) | (59,706) | (14,792) | (18,207) | (211,353) | (298,776) | |||||||||||||||||||||||||||||||||||||||
Currency and ownership adjustments(4) |
16,597 | — | (1,899) | (1,980) | (6,587) | (1,942) | 8,111 | (3,922) | |||||||||||||||||||||||||||||||||||||||
SHO SS RevPOR revenues(5) |
$ | 666,330 | $ | 731,482 | $ | 40,438 | $ | 45,698 | $ | 90,045 | $ | 97,091 | $ | 796,813 | $ | 874,271 | |||||||||||||||||||||||||||||||
Avg. occupied units/month(6) |
41,629 | 42,595 | 1,780 | 1,903 | 11,128 | 11,290 | 54,537 | 55,788 | |||||||||||||||||||||||||||||||||||||||
SHO SS RevPOR(7) |
$ | 5,350 | $ | 5,740 | $ | 7,593 | $ | 8,027 | $ | 2,705 | $ | 2,874 | $ | 4,884 | $ | 5,238 | |||||||||||||||||||||||||||||||
| SS RevPOR YOY growth | 7.3 | % | 5.7 | % | 6.3 | % | 7.3 | % | |||||||||||||||||||||||||||||||||||||||
| SHO SSNOI Growth | |||||||||||||||||||||||||||||||||||||||||||||||
| Consolidated SHO NOI | $ | 237,393 | $ | 229,006 | $ | 16,579 | $ | 17,497 | $ | 27,939 | $ | 32,749 | $ | 281,911 | $ | 279,252 | |||||||||||||||||||||||||||||||
Unconsolidated SHO NOI attributable to WELL(1) |
4,956 | 5,987 | — | (389) | 6,840 | 8,031 | 11,796 | 13,629 | |||||||||||||||||||||||||||||||||||||||
SHO NOI attributable to noncontrolling interests(2) |
(63,731) | (8,574) | (1,278) | (1,585) | (4,914) | (5,815) | (69,923) | (15,974) | |||||||||||||||||||||||||||||||||||||||
SHO pro rata NOI(3) |
178,618 | 226,419 | 15,301 | 15,523 | 29,865 | 34,965 | 223,784 | 276,907 | |||||||||||||||||||||||||||||||||||||||
| Non-cash NOI on same store properties | (375) | (152) | — | — | — | — | (375) | (152) | |||||||||||||||||||||||||||||||||||||||
| NOI attributable to non-same store properties | (23,483) | (41,470) | (7,816) | (6,672) | (3,970) | (6,083) | (35,269) | (54,225) | |||||||||||||||||||||||||||||||||||||||
Currency and ownership adjustments(4) |
872 | 24 | (322) | (374) | (1,759) | (575) | (1,209) | (925) | |||||||||||||||||||||||||||||||||||||||
Normalizing adjustment for government grants(8) |
(12,045) | (5,352) | (1,028) | — | 12 | — | (13,061) | (5,352) | |||||||||||||||||||||||||||||||||||||||
Other normalizing adjustments(9) |
1,546 | 1,610 | — | — | — | — | 1,546 | 1,610 | |||||||||||||||||||||||||||||||||||||||
SHO pro rata SSNOI(5) |
$ | 145,133 | $ | 181,079 | $ | 6,135 | $ | 8,477 | $ | 24,148 | $ | 28,307 | $ | 175,416 | $ | 217,863 | |||||||||||||||||||||||||||||||
| SHO SSNOI growth | 24.8 | % | 38.2 | % | 17.2 | % | 24.2 | % | |||||||||||||||||||||||||||||||||||||||
| SHO SSNOI/Unit | |||||||||||||||||||||||||||||||||||||||||||||||
Trailing four quarters' SSNOI(5) |
$ | 649,914 | $ | 32,024 | $ | 106,863 | $ | 788,801 | |||||||||||||||||||||||||||||||||||||||
Average units in service(10) |
53,269 | 2,251 | 14,055 | 69,575 | |||||||||||||||||||||||||||||||||||||||||||
| SSNOI/unit in USD | $ | 12,201 | $ | 14,227 | $ | 7,603 | $ | 11,337 | |||||||||||||||||||||||||||||||||||||||
SSNOI/unit in local currency(4) |
£ | 11,856 | $ | 10,415 | |||||||||||||||||||||||||||||||||||||||||||
| Forward-Looking Statement and Risk Factors | |||||