| 1-8957 | 91-1292054 | |||||||
| (Commission File Number) | (IRS Employer Identification No.) | |||||||
| 19300 International Boulevard | Seattle | Washington | 98188 | |||||||||||
| (Address of Principal Executive Offices) | (Zip Code) | |||||||||||||
| Title of each class | Ticker Symbol | Name of each exchange on which registered | ||||||
| Common stock, $0.01 par value | ALK | New York Stock Exchange | ||||||
| Third Quarter 2024 Earnings Press Release dated October 31, 2024 | ||||||||
| Supplemental Earnings Material | ||||||||
| Supplemental Earnings Question & Answer | ||||||||
| Unaudited pro forma condensed combined financial information of the Company for the year ended December 31, 2023, and for the quarters ended September 30, 2024, December 31, 2023, and September 30, 2023 | ||||||||
| 104 | Cover Page Interactive Data File - embedded within the Inline XBRL Document | |||||||

| Media contact: | Investor/analyst contact: | |||||||
| Media Relations | Ryan St. John | |||||||
| (206) 304-0008 | VP Finance, Planning and Investor Relations | |||||||
| ALKInvestorRelations@alaskaair.com | ||||||||
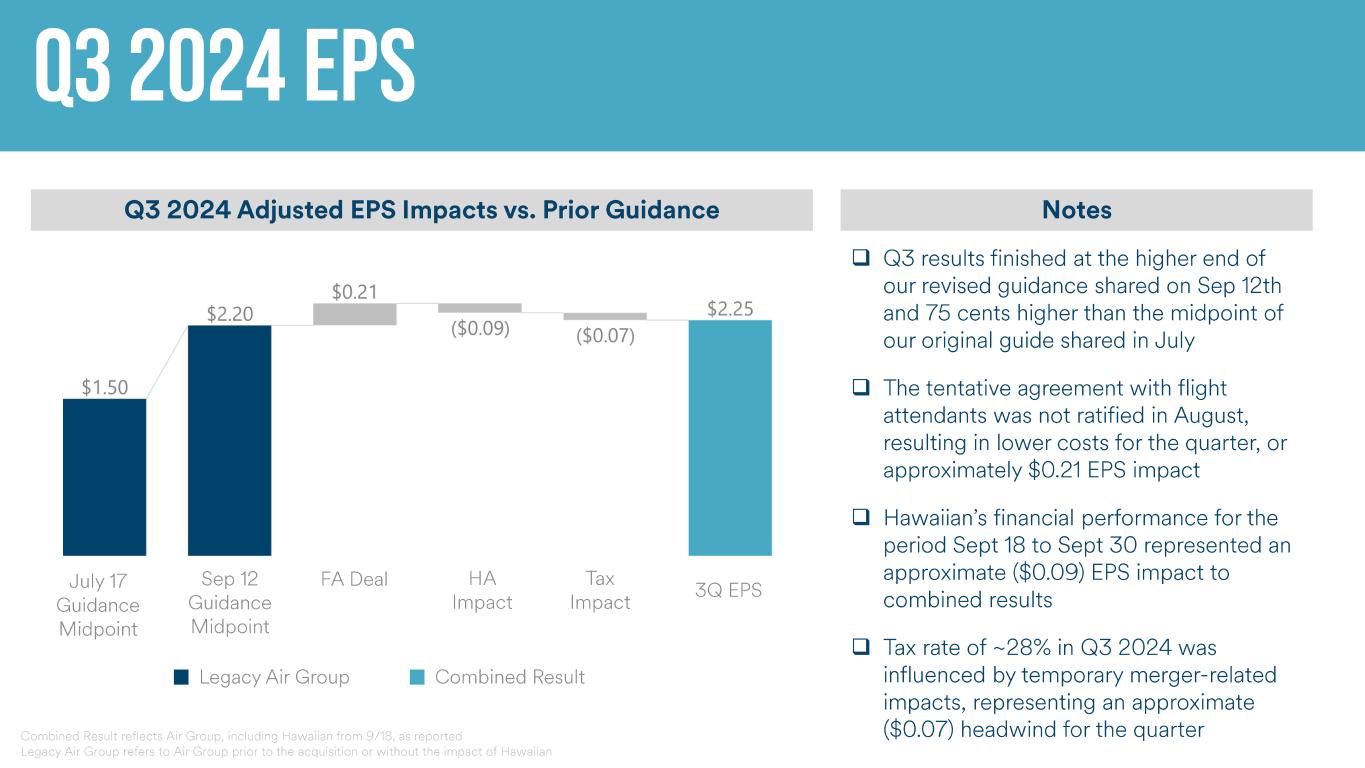
| Q3 Expectations July 17, 2024 |
Q3 Expectations September 12, 2024 |
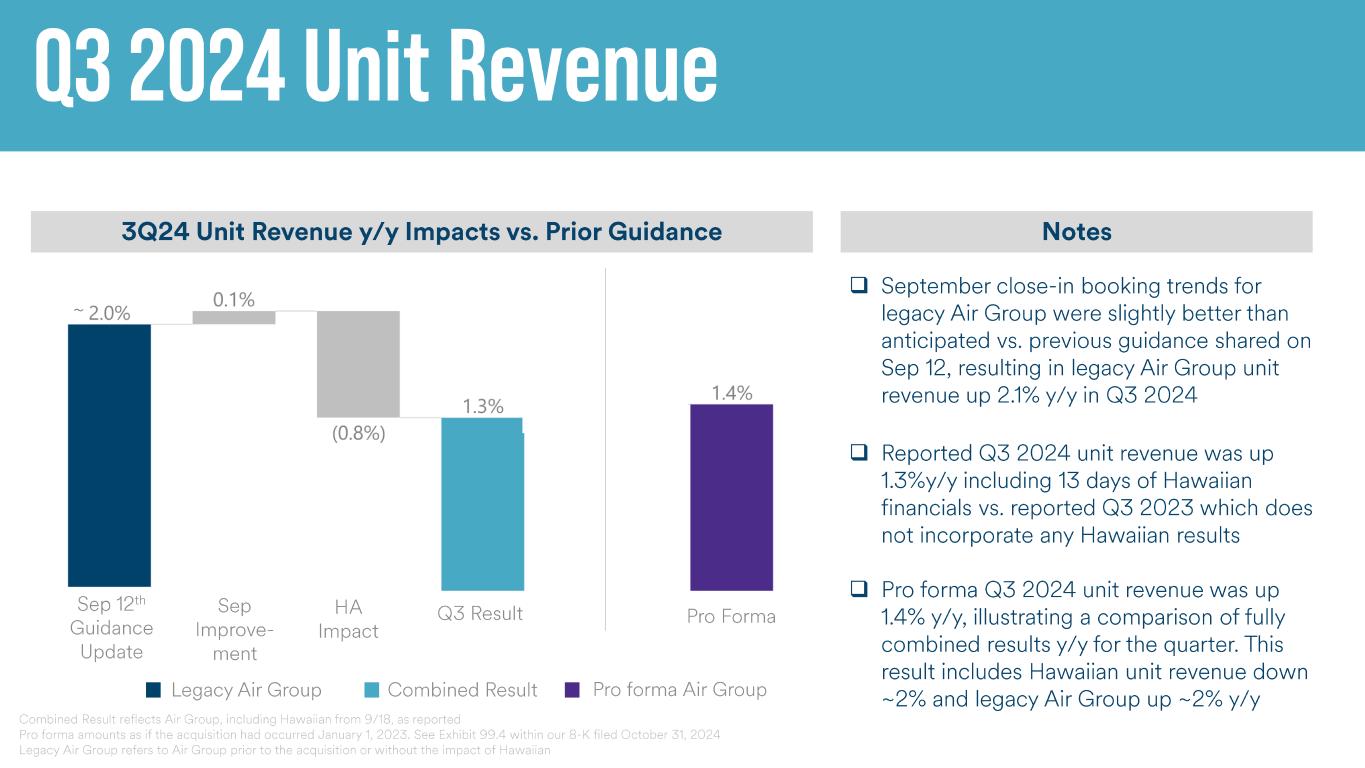
Q3 Consolidated Air Group Results | Q3 Hawaiian Airlines Contribution to Results | |||||||||||||||||||||||
| ASMs vs. 2023 | Up 2% to 3% | Up 2% to 3% | Up 6.8% | 4.1 pts | ||||||||||||||||||||||
| CASMex vs. 2023 | Up high single digits | Up high single digits | Up 6.9% | 0.2 pts | ||||||||||||||||||||||
| RASM vs. 2023 | Flat to positive | Up ~2% | Up 1.3% | (0.8) pts | ||||||||||||||||||||||
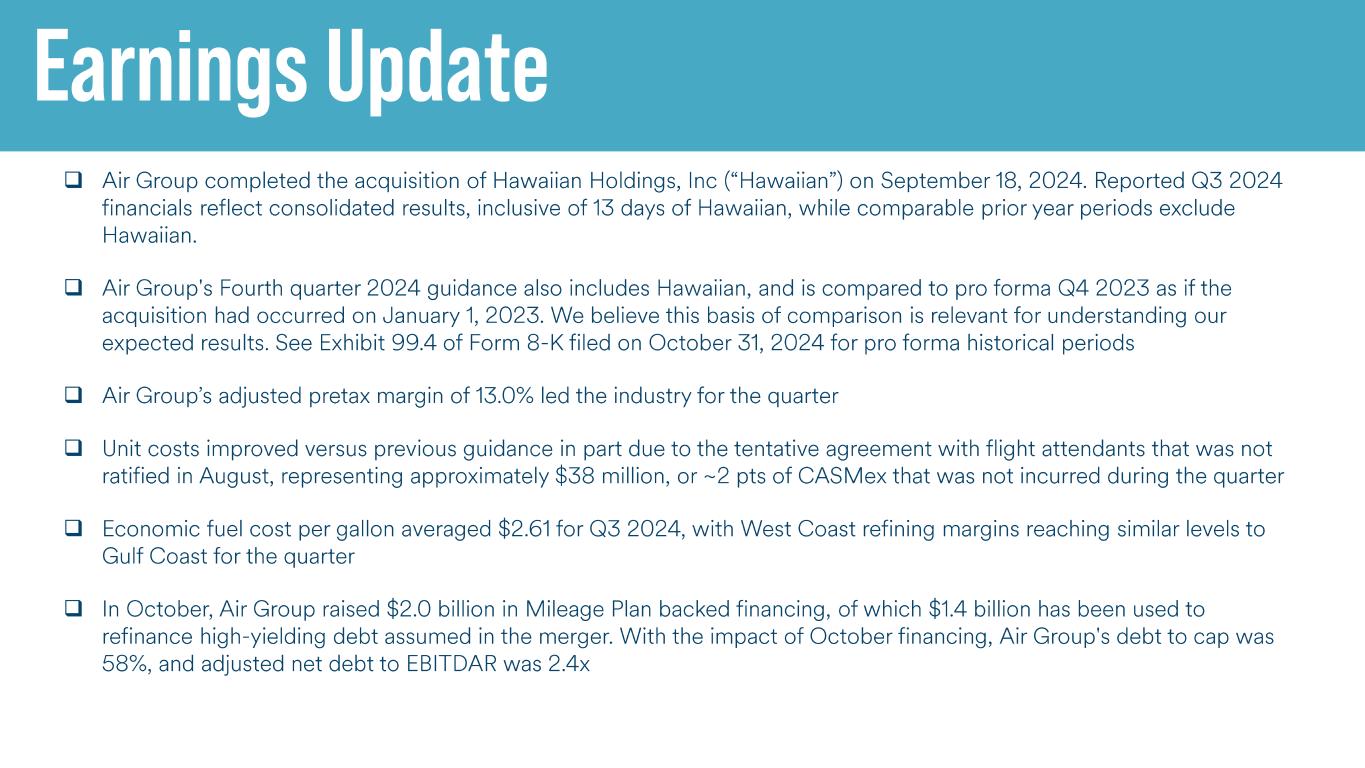
| Economic fuel cost per gallon | $2.85 to $2.95 | $2.60 to $2.70 | $2.61 | $2.35 | ||||||||||||||||||||||
| Adjusted pretax income (in millions) | — | — | $399 | $(14) | ||||||||||||||||||||||
| Adjusted earnings per share | $1.40 to $1.60 | $2.15 to $2.25 | $2.25 | $(0.09) | ||||||||||||||||||||||
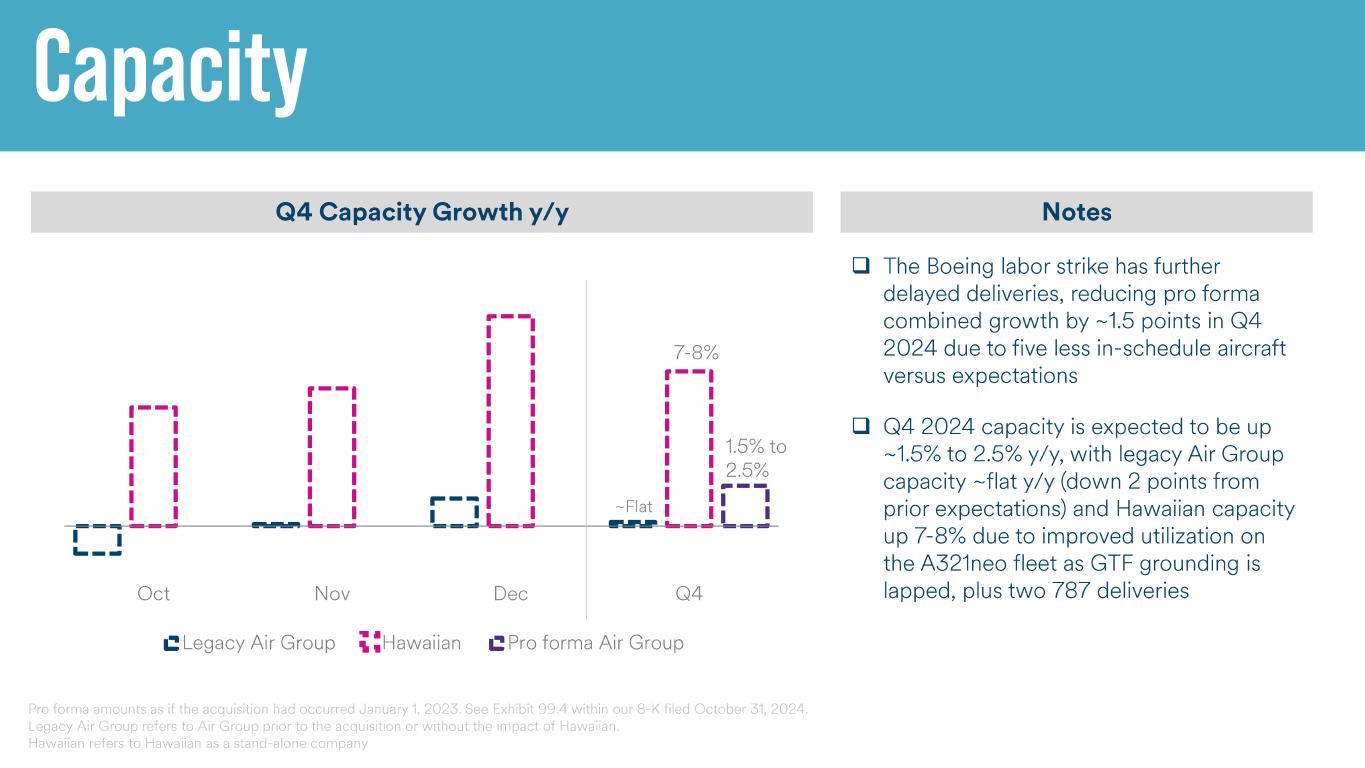
| Q4 Expectation | ||||||||
| Capacity (ASMs) % change versus 2023 | Up 1.5% to 2.5% | |||||||
| CASMex % change versus 2023 | Up high single digits | |||||||
| RASM % change versus 2023 | Up mid single digits | |||||||
| Economic fuel cost per gallon | $2.55 to $2.65 | |||||||
Adjusted earnings per share(a) |
$0.20 to $0.40 | |||||||
| Three Months Ended September 30, | |||||||||||||||||||||||
| 2024 | 2023 | ||||||||||||||||||||||
| (in millions, except per share amounts) | Dollars | Diluted EPS | Dollars | Diluted EPS | |||||||||||||||||||
| Net income per share | $ | 236 | $ | 1.84 | $ | 139 | $ | 1.08 | |||||||||||||||
| Mark-to-market fuel hedge adjustments | (4) | (0.03) | (35) | (0.27) | |||||||||||||||||||
| Special items - operating | 74 | 0.57 | 156 | 1.20 | |||||||||||||||||||
| Special items - net non-operating | 1 | 0.01 | 8 | 0.06 | |||||||||||||||||||
| Income tax effect of reconciling items above | (18) | (0.14) | (31) | (0.24) | |||||||||||||||||||
| Adjusted net income per share | $ | 289 | $ | 2.25 | $ | 237 | $ | 1.83 | |||||||||||||||
| Nine Months Ended September 30, | |||||||||||||||||||||||
| 2024 | 2023 | ||||||||||||||||||||||
| (in millions, except per-share amounts) | Dollars | Diluted EPS | Dollars | Diluted EPS | |||||||||||||||||||
| Net income per share | $ | 324 | $ | 2.52 | $ | 237 | $ | 1.84 | |||||||||||||||
| Mark-to-market fuel hedge adjustments | (22) | (0.17) | (14) | (0.11) | |||||||||||||||||||
| Special items - operating | 254 | 1.98 | 406 | 3.14 | |||||||||||||||||||
| Special items - net non-operating | 1 | 0.01 | 14 | 0.11 | |||||||||||||||||||
| Income tax effect of reconciling items above | (57) | (0.44) | (98) | (0.76) | |||||||||||||||||||
| Adjusted net income per share | $ | 500 | $ | 3.90 | $ | 545 | $ | 4.22 | |||||||||||||||
| Three Months Ended September 30, | Nine Months Ended September 30, | ||||||||||||||||||||||||||||||||||
| (in millions, except per share amounts) | 2024 | 2023 | Change | 2024 | 2023 | Change | |||||||||||||||||||||||||||||
| Operating Revenue | |||||||||||||||||||||||||||||||||||
| Passenger revenue | $ | 2,821 | $ | 2,618 | 8 | % | $ | 7,476 | $ | 7,200 | 4 | % | |||||||||||||||||||||||
| Mileage Plan other revenue | 171 | 159 | 8 | % | 509 | 483 | 5 | % | |||||||||||||||||||||||||||
| Cargo and other revenue | 80 | 62 | 29 | % | 216 | 190 | 14 | % | |||||||||||||||||||||||||||
| Total Operating Revenue | 3,072 | 2,839 | 8 | % | 8,201 | 7,873 | 4 | % | |||||||||||||||||||||||||||
| Operating Expenses | |||||||||||||||||||||||||||||||||||
| Wages and benefits | 883 | 782 | 13 | % | 2,469 | 2,259 | 9 | % | |||||||||||||||||||||||||||
| Variable incentive pay | 104 | 45 | 131 | % | 197 | 149 | 32 | % | |||||||||||||||||||||||||||
| Aircraft fuel, including hedging gains and losses | 624 | 694 | (10) | % | 1,804 | 1,932 | (7) | % | |||||||||||||||||||||||||||
| Aircraft maintenance | 140 | 118 | 19 | % | 391 | 367 | 7 | % | |||||||||||||||||||||||||||
| Aircraft rent | 49 | 48 | 2 | % | 142 | 161 | (12) | % | |||||||||||||||||||||||||||
| Landing fees and other rentals | 194 | 183 | 6 | % | 532 | 502 | 6 | % | |||||||||||||||||||||||||||
| Contracted services | 108 | 100 | 8 | % | 311 | 290 | 7 | % | |||||||||||||||||||||||||||
| Selling expenses | 82 | 84 | (2) | % | 243 | 231 | 5 | % | |||||||||||||||||||||||||||
| Depreciation and amortization | 139 | 113 | 23 | % | 393 | 330 | 19 | % | |||||||||||||||||||||||||||
| Food and beverage service | 69 | 62 | 11 | % | 194 | 176 | 10 | % | |||||||||||||||||||||||||||
| Third-party regional carrier expense | 63 | 58 | 9 | % | 181 | 164 | 10 | % | |||||||||||||||||||||||||||
| Other | 202 | 185 | 9 | % | 593 | 544 | 9 | % | |||||||||||||||||||||||||||
| Special items - operating | 74 | 156 | (53) | % | 254 | 406 | (37) | % | |||||||||||||||||||||||||||
| Total Operating Expenses | 2,731 | 2,628 | 4 | % | 7,704 | 7,511 | 3 | % | |||||||||||||||||||||||||||
| Operating Income | 341 | 211 | 62 | % | 497 | 362 | 37 | % | |||||||||||||||||||||||||||
| Non-operating Income (Expense) | |||||||||||||||||||||||||||||||||||
| Interest income | 28 | 23 | 22 | % | 69 | 62 | 11 | % | |||||||||||||||||||||||||||
| Interest expense | (44) | (34) | 29 | % | (115) | (90) | 28 | % | |||||||||||||||||||||||||||
| Interest capitalized | 7 | 7 | — | % | 19 | 21 | (10) | % | |||||||||||||||||||||||||||
| Special items - net non-operating | (1) | (8) | (88) | % | (1) | (14) | (93) | % | |||||||||||||||||||||||||||
| Other - net | (3) | (6) | (50) | % | (3) | (22) | (86) | % | |||||||||||||||||||||||||||
| Total Non-operating Expense | (13) | (18) | (28) | % | (31) | (43) | (28) | % | |||||||||||||||||||||||||||
| Income Before Income Tax | 328 | 193 | 466 | 319 | |||||||||||||||||||||||||||||||
| Income tax provision | (92) | (54) | (142) | (82) | |||||||||||||||||||||||||||||||
| Net Income | $ | 236 | $ | 139 | $ | 324 | $ | 237 | |||||||||||||||||||||||||||
| Basic Earnings Per Share | $ | 1.87 | $ | 1.09 | $ | 2.57 | $ | 1.86 | |||||||||||||||||||||||||||
| Diluted Earnings Per Share | $ | 1.84 | $ | 1.08 | $ | 2.52 | $ | 1.84 | |||||||||||||||||||||||||||
| Weighted Average Shares Outstanding used for computation: | |||||||||||||||||||||||||||||||||||
| Basic | 126.189 | 127.187 | 126.165 | 127.375 | |||||||||||||||||||||||||||||||
| Diluted | 128.590 | 129.188 | 128.347 | 129.085 | |||||||||||||||||||||||||||||||
| (in millions) | September 30, 2024 | December 31, 2023 | |||||||||
| ASSETS | |||||||||||
| Current Assets | |||||||||||
| Cash and cash equivalents | $ | 1,015 | $ | 281 | |||||||
| Restricted cash | 27 | — | |||||||||
| Marketable securities | 1,490 | 1,510 | |||||||||
| Total cash, restricted cash, and marketable securities | 2,532 | 1,791 | |||||||||
| Receivables - net | 510 | 383 | |||||||||
| Inventories and supplies - net | 202 | 116 | |||||||||
| Prepaid expenses | 270 | 176 | |||||||||
| Other current assets | 223 | 239 | |||||||||
| Total Current Assets | 3,737 | 2,705 | |||||||||
| Property and Equipment | |||||||||||
| Aircraft and other flight equipment | 12,349 | 10,425 | |||||||||
| Other property and equipment | 2,109 | 1,814 | |||||||||
| Deposits for future flight equipment | 612 | 491 | |||||||||
| 15,070 | 12,730 | ||||||||||
| Less accumulated depreciation and amortization | (4,548) | (4,342) | |||||||||
| Total Property and Equipment - net | 10,522 | 8,388 | |||||||||
| Other Assets | |||||||||||
| Operating lease assets | 1,346 | 1,195 | |||||||||
| Goodwill | 2,703 | 1,943 | |||||||||
| Intangible assets - net | 888 | 90 | |||||||||
| Other noncurrent assets | 363 | 292 | |||||||||
| Total Other Assets | 5,300 | 3,520 | |||||||||
| Total Assets | $ | 19,559 | $ | 14,613 | |||||||
| (in millions, except share amounts) | September 30, 2024 | December 31, 2023 | |||||||||
| LIABILITIES AND SHAREHOLDERS' EQUITY | |||||||||||
| Current Liabilities | |||||||||||
| Accounts payable | $ | 242 | $ | 207 | |||||||
| Accrued wages, vacation and payroll taxes | 822 | 584 | |||||||||
| Air traffic liability | 1,878 | 1,136 | |||||||||
| Other accrued liabilities | 958 | 800 | |||||||||
| Deferred revenue | 1,614 | 1,221 | |||||||||
| Current portion of operating lease liabilities | 211 | 158 | |||||||||
| Current portion of long-term debt and finance leases | 523 | 353 | |||||||||
| Total Current Liabilities | 6,248 | 4,459 | |||||||||
| Noncurrent Liabilities | |||||||||||
| Long-term debt and finance leases, net of current portion | 4,159 | 2,182 | |||||||||
| Long-term operating lease liabilities, net of current portion | 1,249 | 1,125 | |||||||||
| Deferred income taxes | 889 | 695 | |||||||||
| Deferred revenue | 1,578 | 1,382 | |||||||||
| Obligation for pension and post-retirement medical benefits | 505 | 362 | |||||||||
| Other liabilities | 452 | 295 | |||||||||
| Total Noncurrent Liabilities | 8,832 | 3,859 | |||||||||
| Shareholders' Equity | |||||||||||
Preferred stock, $0.01 par value, Authorized: 5,000,000 shares, none issued or outstanding |
— | — | |||||||||
Common stock, $0.01 par value, Authorized: 400,000,000 shares, Issued: 2024 - 140,588,216 shares; 2023 - 138,960,830 shares, Outstanding: 2024 - 126,125,771 shares; 2023 - 126,090,353 shares |
1 | 1 | |||||||||
| Capital in excess of par value | 769 | 695 | |||||||||
Treasury stock (common), at cost: 2024 - 14,462,445 shares; 2023 - 12,870,477 shares |
(882) | (819) | |||||||||
| Accumulated other comprehensive loss | (268) | (299) | |||||||||
| Retained earnings | 4,859 | 4,535 | |||||||||
| Total Shareholders' Equity | 4,479 | 4,113 | |||||||||
| Total Liabilities and Shareholders' Equity | $ | 19,559 | $ | 14,613 | |||||||
| SUMMARY CASH FLOW (unaudited) | |||||||||||||||||
| (in millions) | Nine Months Ended September 30, 2024 | Six Months Ended June 30, 2024(a) |
Three Months Ended September 30, 2024(b) |
||||||||||||||
| Cash Flows from Operating Activities: | |||||||||||||||||
| Net Income | $ | 324 | $ | 88 | $ | 236 | |||||||||||
| Adjustments to reconcile net income to net cash provided by operating activities | 451 | 291 | 160 | ||||||||||||||
| Changes in working capital | 415 | 493 | (78) | ||||||||||||||
| Net cash provided by operating activities | 1,190 | 872 | 318 | ||||||||||||||
| Cash Flows from Investing Activities: | |||||||||||||||||
| Property and equipment additions | (851) | (587) | (264) | ||||||||||||||
| Acquisition of Hawaiian Airlines, net of cash acquired | (659) | — | (659) | ||||||||||||||
| Supplier proceeds | 162 | 162 | — | ||||||||||||||
| Other investing activities | 912 | 290 | 622 | ||||||||||||||
| Net cash used in investing activities | (436) | (135) | (301) | ||||||||||||||
| Cash Flows from Financing Activities: | 7 | 87 | (80) | ||||||||||||||
| Net increase in cash and cash equivalents | 761 | 824 | (63) | ||||||||||||||
Cash, cash equivalents, and restricted cash at beginning of period(c) |
308 | 308 | 1,132 | ||||||||||||||
Cash, cash equivalents, and restricted cash at end of the period(c) |
$ | 1,069 | $ | 1,132 | $ | 1,069 | |||||||||||
| Three Months Ended September 30, | Nine Months Ended September 30, | ||||||||||||||||||||||
| (in millions) | 2024 | 2023 | 2024 | 2023 | |||||||||||||||||||
| Operating Expenses | |||||||||||||||||||||||
| Fleet transition | $ | (16) | $ | 156 | $ | 51 | $ | 355 | |||||||||||||||
| Labor agreements | — | — | 30 | 51 | |||||||||||||||||||
| Integration costs | 90 | — | 128 | — | |||||||||||||||||||
| Litigation | — | — | 45 | — | |||||||||||||||||||
| Special items - operating | $ | 74 | $ | 156 | $ | 254 | $ | 406 | |||||||||||||||
| Non-operating Income (Expense) | |||||||||||||||||||||||
| Special items - net non-operating | $ | (1) | $ | (8) | $ | (1) | $ | (14) | |||||||||||||||
| OPERATING STATISTICS (unaudited) | |||||||||||||||||||||||||||||||||||
Amounts below reflect the results of operations for Hawaiian Airlines for the period September 18, 2024 through September 30, 2024. | |||||||||||||||||||||||||||||||||||
| Three Months Ended September 30, | Nine Months Ended September 30, | ||||||||||||||||||||||||||||||||||
| 2024 | 2023 | Change | 2024 | 2023 | Change | ||||||||||||||||||||||||||||||
Consolidated Operating Statistics:(a) |
|||||||||||||||||||||||||||||||||||
| Revenue passengers (000) | 13,237 | 12,210 | 8.4% | 34,899 | 33,654 | 3.7% | |||||||||||||||||||||||||||||
| RPMs (000,000) "traffic" | 16,970 | 15,718 | 8.0% | 44,803 | 43,208 | 3.7% | |||||||||||||||||||||||||||||
| ASMs (000,000) "capacity" | 19,847 | 18,582 | 6.8% | 53,422 | 51,447 | 3.8% | |||||||||||||||||||||||||||||
| Load factor | 85.5% | 84.6% | 0.9 pts | 83.9% | 84.0% | (0.1) pts | |||||||||||||||||||||||||||||
| Yield | 16.62¢ | 16.66¢ | (0.2)% | 16.69¢ | 16.66¢ | 0.2% | |||||||||||||||||||||||||||||
| PRASM | 14.21¢ | 14.09¢ | 0.9% | 13.99¢ | 14.00¢ | (0.1)% | |||||||||||||||||||||||||||||
| RASM | 15.48¢ | 15.28¢ | 1.3% | 15.35¢ | 15.30¢ | 0.3% | |||||||||||||||||||||||||||||
CASMex(b) |
10.16¢ | 9.50¢ | 6.9% | 10.48¢ | 9.98¢ | 5.0% | |||||||||||||||||||||||||||||
Economic fuel cost per gallon(b) (c) |
$2.61 | $3.26 | (19.9)% | $2.82 | $3.14 | (10.2)% | |||||||||||||||||||||||||||||
Fuel gallons (000,000)(c) |
240 | 224 | 7.2% | 646 | 620 | 4.3% | |||||||||||||||||||||||||||||
| ASMs per gallon | 82.7 | 83.0 | (0.4)% | 82.6 | 83.0 | (0.5)% | |||||||||||||||||||||||||||||
| Departures (000) | 121.6 | 111.8 | 8.8% | 329.7 | 311.6 | 5.8% | |||||||||||||||||||||||||||||
| Average full-time equivalent employees (FTEs) | 24,963 | 23,879 | 4.5% | 23,784 | 23,386 | 1.7% | |||||||||||||||||||||||||||||
Operating fleet(d) |
394 | 303 | 91 a/c | 394 | 303 | 91 a/c | |||||||||||||||||||||||||||||
| Alaska Airlines Operating Statistics: | |||||||||||||||||||||||||||||||||||
| RPMs (000,000) "traffic" | 14,951 | 14,471 | 3.3% | 40,375 | 39,967 | 1.0% | |||||||||||||||||||||||||||||
| ASMs (000,000) "capacity" | 17,459 | 17,123 | 2.0% | 48,118 | 47,584 | 1.1% | |||||||||||||||||||||||||||||
| Economic fuel cost per gallon | $2.60 | $3.22 | (19)% | $2.80 | $3.11 | (10)% | |||||||||||||||||||||||||||||
| Hawaiian Airlines Operating Statistics: | |||||||||||||||||||||||||||||||||||
| RPMs (000,000) "traffic" | 634 | n/a | n/a | 634 | n/a | n/a | |||||||||||||||||||||||||||||
| ASMs (000,000) "capacity" | 763 | n/a | n/a | 763 | n/a | n/a | |||||||||||||||||||||||||||||
Economic fuel cost per gallon(c) |
$2.35 | n/a | n/a | $2.35 | n/a | n/a | |||||||||||||||||||||||||||||
Regional Operating Statistics:(e) |
|||||||||||||||||||||||||||||||||||
| RPMs (000,000) "traffic" | 1,385 | 1,247 | 11.1% | 3,795 | 3,241 | 17.1% | |||||||||||||||||||||||||||||
| ASMs (000,000) "capacity" | 1,625 | 1,459 | 11.4% | 4,540 | 3,862 | 17.6% | |||||||||||||||||||||||||||||
| Economic fuel cost per gallon | $2.74 | $3.49 | (21.5)% | $2.99 | $3.32 | (9.9)% | |||||||||||||||||||||||||||||
| OPERATING SEGMENTS (unaudited) | |||||||||||||||||||||||||||||||||||||||||
| Alaska Air Group, Inc. | |||||||||||||||||||||||||||||||||||||||||
| Three Months Ended September 30, 2024 | |||||||||||||||||||||||||||||||||||||||||
| (in millions) | Alaska Airlines | Hawaiian Airlines | Regional | Consolidating & Other(a) |
Air Group Adjusted(b) |
Special Items(c) |
Consolidated | ||||||||||||||||||||||||||||||||||
| Operating Revenue | |||||||||||||||||||||||||||||||||||||||||
| Passenger revenue | $ | 2,261 | $ | 84 | $ | 476 | $ | — | $ | 2,821 | $ | — | $ | 2,821 | |||||||||||||||||||||||||||
| Mileage Plan other revenue | 151 | 5 | 15 | — | 171 | — | 171 | ||||||||||||||||||||||||||||||||||
| Cargo and other revenue | 71 | 6 | — | 3 | 80 | — | 80 | ||||||||||||||||||||||||||||||||||
| Total Operating Revenue | 2,483 | 95 | 491 | 3 | 3,072 | — | 3,072 | ||||||||||||||||||||||||||||||||||
| Operating Expenses | |||||||||||||||||||||||||||||||||||||||||
| Operating expenses, excluding fuel | 1,640 | 82 | 325 | (14) | 2,033 | 74 | 2,107 | ||||||||||||||||||||||||||||||||||
| Fuel expense | 510 | 23 | 95 | — | 628 | (4) | 624 | ||||||||||||||||||||||||||||||||||
| Total Operating Expenses | 2,150 | 105 | 420 | (14) | 2,661 | 70 | 2,731 | ||||||||||||||||||||||||||||||||||
| Non-operating Income (Expense) | 3 | (4) | — | (11) | (12) | (1) | (13) | ||||||||||||||||||||||||||||||||||
| Income (Loss) Before Income Tax | $ | 336 | $ | (14) | $ | 71 | $ | 6 | $ | 399 | $ | (71) | $ | 328 | |||||||||||||||||||||||||||
| Pretax Margin | 13.0 | % | 10.7 | % | |||||||||||||||||||||||||||||||||||||
| Three Months Ended September 30, 2023 | |||||||||||||||||||||||||||||||||||||||||
| (in millions) | Alaska Airlines | Hawaiian Airlines | Regional | Consolidating & Other(a) |
Air Group Adjusted(b) |
Special Items(c) |
Consolidated | ||||||||||||||||||||||||||||||||||
| Operating Revenue | |||||||||||||||||||||||||||||||||||||||||
| Passenger revenue | $ | 2,201 | $ | — | $ | 417 | $ | — | $ | 2,618 | $ | — | $ | 2,618 | |||||||||||||||||||||||||||
| Mileage Plan other revenue | 146 | — | 13 | — | 159 | — | 159 | ||||||||||||||||||||||||||||||||||
| Cargo and other revenue | 60 | — | — | 2 | 62 | — | 62 | ||||||||||||||||||||||||||||||||||
| Total Operating Revenue | 2,407 | — | 430 | 2 | 2,839 | — | 2,839 | ||||||||||||||||||||||||||||||||||
| Operating Expenses | |||||||||||||||||||||||||||||||||||||||||
| Operating expenses, excluding fuel | 1,484 | — | 297 | (3) | 1,778 | 156 | 1,934 | ||||||||||||||||||||||||||||||||||
| Fuel expense | 621 | — | 108 | — | 729 | (35) | 694 | ||||||||||||||||||||||||||||||||||
| Total Operating Expenses | 2,105 | — | 405 | (3) | 2,507 | 121 | 2,628 | ||||||||||||||||||||||||||||||||||
| Non-operating Income (Expense) | — | — | — | (10) | (10) | (8) | (18) | ||||||||||||||||||||||||||||||||||
| Income (Loss) Before Income Tax | $ | 302 | $ | — | $ | 25 | $ | (5) | $ | 322 | $ | (129) | $ | 193 | |||||||||||||||||||||||||||
| Pretax Margin | 11.4 | % | 6.8 | % | |||||||||||||||||||||||||||||||||||||
| Nine Months Ended September 30, 2024 | |||||||||||||||||||||||||||||||||||||||||
| (in millions) | Alaska Airlines | Hawaiian Airlines | Regional | Consolidating & Other(a) |
Air Group Adjusted(b) |
Special Items(c) |
Consolidated | ||||||||||||||||||||||||||||||||||
| Operating Revenue | |||||||||||||||||||||||||||||||||||||||||
| Passenger revenue | $ | 6,078 | $ | 84 | $ | 1,314 | $ | — | $ | 7,476 | $ | — | $ | 7,476 | |||||||||||||||||||||||||||
| Mileage Plan other revenue | 460 | 5 | 44 | — | 509 | — | 509 | ||||||||||||||||||||||||||||||||||
| Cargo and other revenue | 202 | 6 | — | 8 | 216 | — | 216 | ||||||||||||||||||||||||||||||||||
| Total Operating Revenue | 6,740 | 95 | 1,358 | 8 | 8,201 | — | 8,201 | ||||||||||||||||||||||||||||||||||
| Operating Expenses | |||||||||||||||||||||||||||||||||||||||||
| Operating expenses, excluding fuel | 4,670 | 82 | 946 | (52) | 5,646 | 254 | 5,900 | ||||||||||||||||||||||||||||||||||
| Fuel expense | 1,515 | 23 | 288 | — | 1,826 | (22) | 1,804 | ||||||||||||||||||||||||||||||||||
| Total Operating Expenses | 6,185 | 105 | 1,234 | (52) | 7,472 | 232 | 7,704 | ||||||||||||||||||||||||||||||||||
| Non-operating Income (Expense) | 6 | (4) | — | (32) | (30) | (1) | (31) | ||||||||||||||||||||||||||||||||||
| Income (Loss) Before Income Tax | $ | 561 | $ | (14) | $ | 124 | $ | 28 | $ | 699 | $ | (233) | $ | 466 | |||||||||||||||||||||||||||
| Pretax Margin | 8.5 | % | 5.7 | % | |||||||||||||||||||||||||||||||||||||
| Nine Months Ended September 30, 2023 | |||||||||||||||||||||||||||||||||||||||||
| (in millions) | Alaska Airlines | Hawaiian Airlines | Regional | Consolidating & Other(a) |
Air Group Adjusted(b) |
Special Items(c) |
Consolidated | ||||||||||||||||||||||||||||||||||
| Operating Revenue | |||||||||||||||||||||||||||||||||||||||||
| Passenger revenue | $ | 6,082 | $ | — | $ | 1,118 | $ | — | $ | 7,200 | $ | — | $ | 7,200 | |||||||||||||||||||||||||||
| Mileage Plan other revenue | 447 | — | 36 | — | 483 | — | 483 | ||||||||||||||||||||||||||||||||||
| Cargo and other revenue | 184 | — | — | 6 | 190 | — | 190 | ||||||||||||||||||||||||||||||||||
| Total Operating Revenue | 6,713 | — | 1,154 | 6 | 7,873 | — | 7,873 | ||||||||||||||||||||||||||||||||||
| Operating Expenses | |||||||||||||||||||||||||||||||||||||||||
| Operating expenses, excluding fuel | 4,342 | — | 832 | (1) | 5,173 | 406 | 5,579 | ||||||||||||||||||||||||||||||||||
| Fuel expense | 1,672 | — | 274 | — | 1,946 | (14) | 1,932 | ||||||||||||||||||||||||||||||||||
| Total Operating Expenses | 6,014 | — | 1,106 | (1) | 7,119 | 392 | 7,511 | ||||||||||||||||||||||||||||||||||
| Non-operating Income (Expense) | (3) | — | — | (26) | (29) | (14) | (43) | ||||||||||||||||||||||||||||||||||
| Income (Loss) Before Income Tax | $ | 696 | $ | — | $ | 48 | $ | (19) | $ | 725 | $ | (406) | $ | 319 | |||||||||||||||||||||||||||
| Pretax Margin | 9.2 | % | 4.1 | % | |||||||||||||||||||||||||||||||||||||
| Adjusted Income Before Income Tax Reconciliation | |||||||||||||||||||||||
| Three Months Ended September 30, | Nine Months Ended September 30, | ||||||||||||||||||||||
| (in millions) | 2024 | 2023 | 2024 | 2023 | |||||||||||||||||||
| Income before income tax | $ | 328 | $ | 193 | $ | 466 | $ | 319 | |||||||||||||||
| Adjusted for: | |||||||||||||||||||||||
| Mark-to-market fuel hedge adjustment | (4) | (35) | (22) | (14) | |||||||||||||||||||
| Special items - operating | 74 | 156 | 254 | 406 | |||||||||||||||||||
| Special items - net non-operating | 1 | 8 | 1 | 14 | |||||||||||||||||||
| Adjusted income before income tax | $ | 399 | $ | 322 | $ | 699 | $ | 725 | |||||||||||||||
| Pretax margin | 10.7 | % | 6.8 | % | 5.7 | % | 4.1 | % | |||||||||||||||
| Adjusted pretax margin | 13.0 | % | 11.4 | % | 8.5 | % | 9.2 | % | |||||||||||||||
| CASMex Reconciliation | |||||||||||||||||||||||
| Three Months Ended September 30, | Nine Months Ended September 30, | ||||||||||||||||||||||
| (in millions) | 2024 | 2023 | 2024 | 2023 | |||||||||||||||||||
| Consolidated: | |||||||||||||||||||||||
| Total operating expenses | $ | 2,731 | $ | 2,628 | $ | 7,704 | $ | 7,511 | |||||||||||||||
| Less the following components: | |||||||||||||||||||||||
| Aircraft fuel, including hedging gains and losses | 624 | 694 | 1,804 | 1,932 | |||||||||||||||||||
| Freighter costs | 17 | 12 | 46 | 38 | |||||||||||||||||||
| Special items - operating | 74 | 156 | 254 | 406 | |||||||||||||||||||
| Total operating expenses, excluding fuel, freighter costs, and special items | $ | 2,016 | $ | 1,766 | $ | 5,600 | $ | 5,135 | |||||||||||||||
| ASMs | 19,847 | 18,582 | 53,422 | 51,447 | |||||||||||||||||||
| CASMex | 10.16 | ¢ | 9.50 | ¢ | 10.48 | ¢ | 9.98 | ¢ | |||||||||||||||
| Fuel Reconciliation | |||||||||||||||||||||||
| Three Months Ended September 30, | |||||||||||||||||||||||
| 2024 | 2023 | ||||||||||||||||||||||
| (in millions, except for per-gallon amounts) | Dollars | Cost/Gallon | Dollars | Cost/Gallon | |||||||||||||||||||
| Raw or "into-plane" fuel cost | $ | 619 | $ | 2.57 | $ | 711 | $ | 3.18 | |||||||||||||||
| Losses on settled hedges | 9 | 0.04 | 18 | 0.08 | |||||||||||||||||||
| Economic fuel expense | $ | 628 | $ | 2.61 | $ | 729 | $ | 3.26 | |||||||||||||||
| Mark-to-market fuel hedge adjustment | (4) | (0.01) | (35) | (0.16) | |||||||||||||||||||
| Aircraft fuel, including hedging gains and losses | $ | 624 | $ | 2.60 | $ | 694 | $ | 3.10 | |||||||||||||||
| Fuel gallons | 240 | 224 | |||||||||||||||||||||
| Nine Months Ended September 30, | |||||||||||||||||||||||
| 2024 | 2023 | ||||||||||||||||||||||
| (in millions, except for per gallon amounts) | Dollars | Cost/Gallon | Dollars | Cost/Gallon | |||||||||||||||||||
| Raw or "into-plane" fuel cost | $ | 1,795 | $ | 2.77 | $ | 1,899 | $ | 3.06 | |||||||||||||||
| Losses on settled hedges | 31 | 0.05 | 47 | 0.08 | |||||||||||||||||||
| Economic fuel expense | $ | 1,826 | $ | 2.82 | $ | 1,946 | $ | 3.14 | |||||||||||||||
| Mark-to-market fuel hedge adjustment | (22) | (0.03) | (14) | (0.02) | |||||||||||||||||||
| Aircraft fuel, including hedging gains and losses | $ | 1,804 | $ | 2.79 | $ | 1,932 | $ | 3.12 | |||||||||||||||
| Fuel gallons | 646 | 620 | |||||||||||||||||||||
| Debt-to-capitalization, including operating and finance leases | |||||||||||
| (in millions) | September 30, 2024 | December 31, 2023 | |||||||||
Long-term debt and finance leases, net of current portion(a) |
$ | 4,159 | $ | 2,182 | |||||||
| Capitalized operating leases | 1,460 | 1,283 | |||||||||
Capitalized finance leases, current portion |
8 | 64 | |||||||||
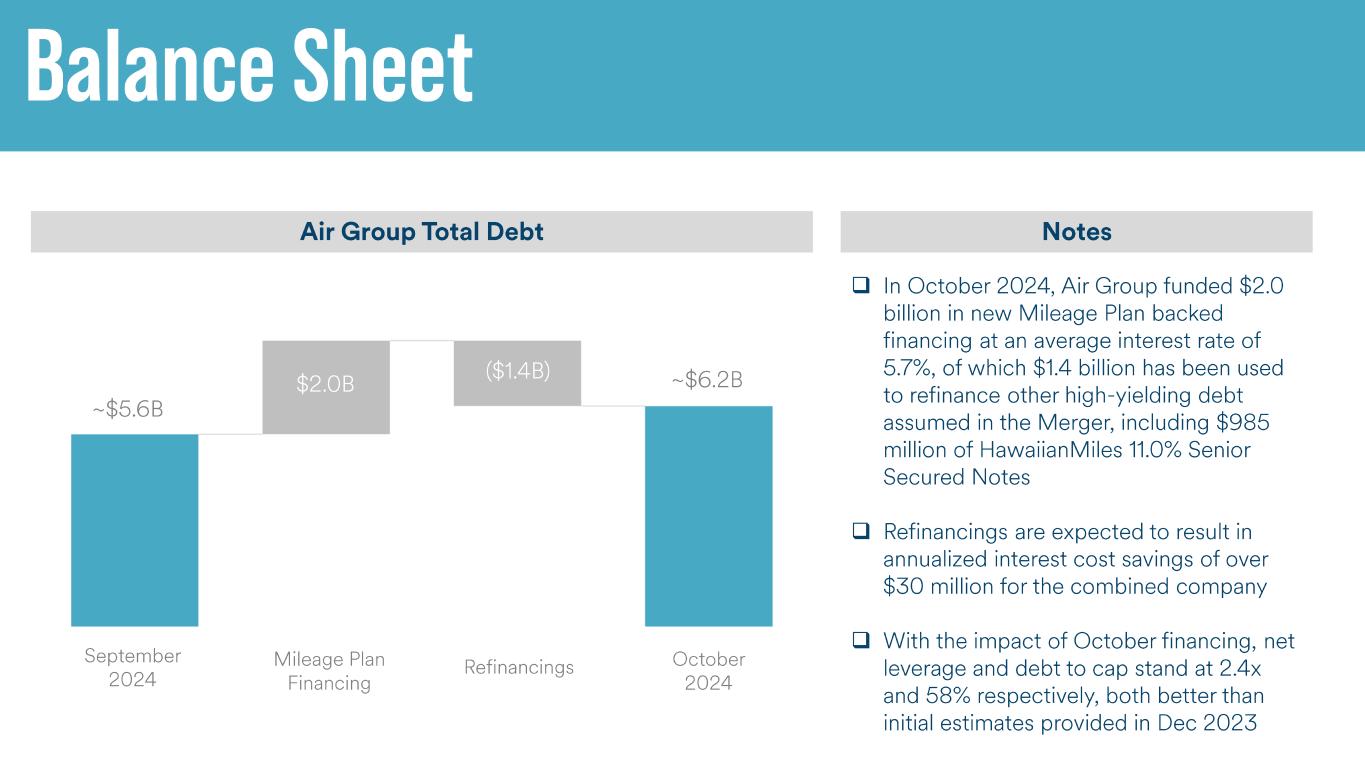
| Adjusted debt, net of current portion of long-term debt | 5,627 | 3,529 | |||||||||
| Shareholders' equity | 4,479 | 4,113 | |||||||||
| Total Invested Capital | $ | 10,106 | $ | 7,642 | |||||||
| Debt-to-capitalization ratio, including operating and finance leases | 56 | % | 46 | % | |||||||
| Adjusted net debt to earnings before interest, taxes, depreciation, amortization, rent, and special items | |||||||||||
| (in millions) | September 30, 2024 | December 31, 2023 | |||||||||
| Current portion of long-term debt and finance leases | $ | 523 | $ | 353 | |||||||
| Current portion of operating lease liabilities | 211 | 158 | |||||||||
| Long-term debt and finance leases, net of current portion | 4,159 | 2,182 | |||||||||
| Long-term operating lease liabilities, net of current portion | 1,249 | 1,125 | |||||||||
| Total adjusted debt | 6,142 | 3,818 | |||||||||
| Less: Total cash, restricted cash, and marketable securities | 2,532 | 1,791 | |||||||||
| Adjusted net debt | $ | 3,610 | $ | 2,027 | |||||||
| (in millions) | Twelve Months Ended September 30, 2024 | Twelve Months Ended December 31, 2023 | |||||||||
Operating Income(a) |
$ | 529 | $ | 394 | |||||||
| Adjusted for: | |||||||||||
| Special items - operating | 291 | 443 | |||||||||
| Mark-to-market fuel hedge adjustments | (10) | (2) | |||||||||
| Depreciation and amortization | 514 | 451 | |||||||||
| Aircraft rent | 189 | 208 | |||||||||
| EBITDAR | $ | 1,513 | $ | 1,494 | |||||||
| Adjusted net debt to EBITDAR | 2.4x | 1.4x | |||||||||
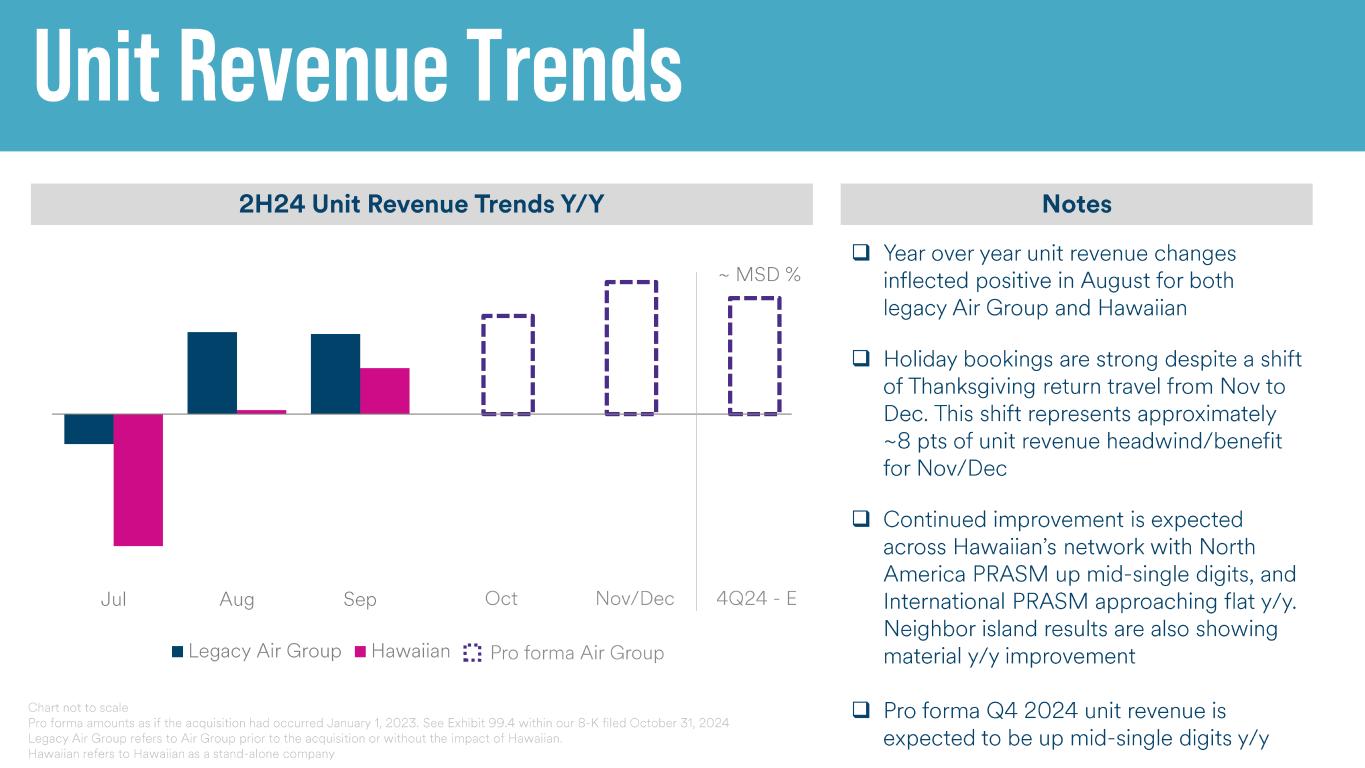
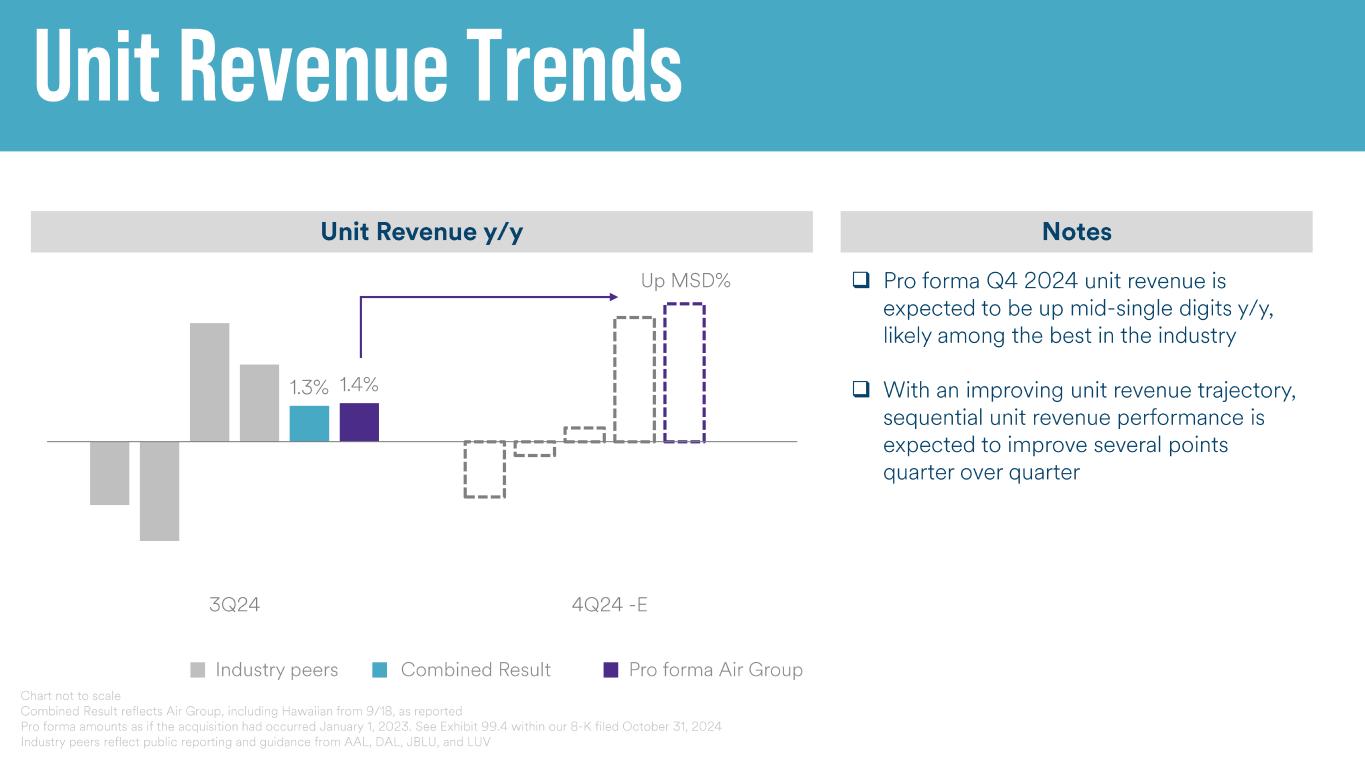
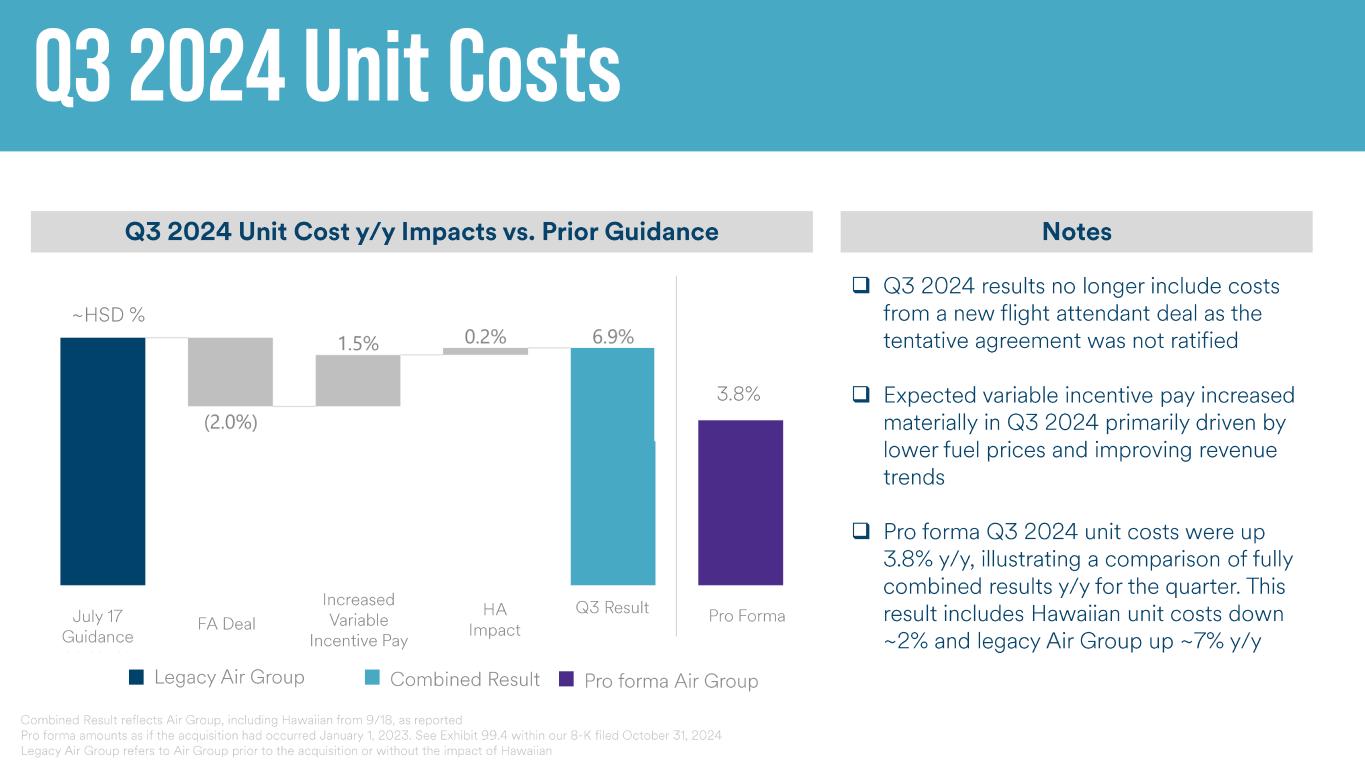
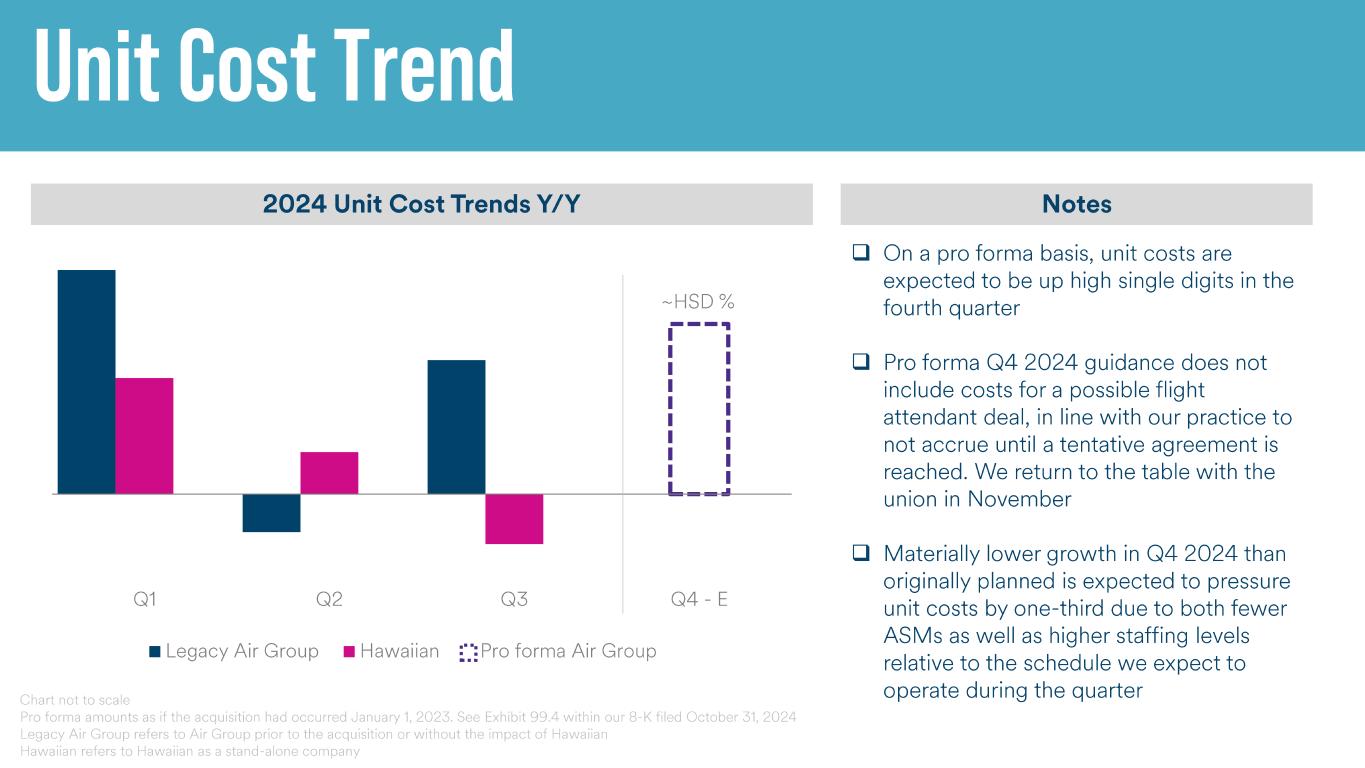

As Reported |
Pro Forma |
||||||||||||||||||||||||||||
| (in millions, except statistical data) | Alaska |
Hawaiian |
Reclassification and Policy Adjustments | Other | Condensed Combined Pro Forma |
||||||||||||||||||||||||
| Operating Revenue | |||||||||||||||||||||||||||||
| Passenger revenue | $ | 2,618 | $ | 665 | $ | — | $ | — | $ | 3,283 | |||||||||||||||||||
| Mileage Plan other revenue | 159 | — | 31 | — | 190 | ||||||||||||||||||||||||
| Cargo and other revenue | 62 | 63 | (32) | — | 93 | ||||||||||||||||||||||||
| Total Operating Revenue | 2,839 | 728 | (1) | — | 3,566 | ||||||||||||||||||||||||
| Non-fuel operating expense | 1,934 | 583 | (2) | 9 | (a) | 2,524 | |||||||||||||||||||||||
| Fuel Expense | 694 | 200 | 8 | — | 902 | ||||||||||||||||||||||||
| Total Operating Expenses | 2,628 | 783 | 6 | 9 | 3,426 | ||||||||||||||||||||||||
| Operating Income / (Loss) | 211 | (55) | (7) | (9) | 140 | ||||||||||||||||||||||||
| Non-operating Income (Expense) | (18) | (6) | 6 | 3 | (b) | (15) | |||||||||||||||||||||||
| Income (Loss) Before Income Tax | 193 | (61) | (1) | (6) | 125 | ||||||||||||||||||||||||
| Income tax expense / (benefit) | 54 | (12) | — | (2) | (c) | 40 | |||||||||||||||||||||||
| Net Income (Loss) | 139 | (49) | (1) | (4) | 85 | ||||||||||||||||||||||||
| RPMs (000,000) "traffic" | 15,718 | 4,451 | 20,169 | ||||||||||||||||||||||||||
| ASMs (000,000) "capacity" | 18,582 | 5,169 | 23,751 | ||||||||||||||||||||||||||
| Load Factor | 84.6 | % | 86.1 | % | 84.9 | % | |||||||||||||||||||||||
| RASM | 15.28 | ¢ | 14.08 | ¢ | 15.01 | ¢ | |||||||||||||||||||||||
| As Reported | Pro Forma | ||||||||||||||||||||||||||||
| (in millions, except statistical data) | Alaska |
Hawaiian |
Reclassification and Policy Adjustments | Other | Condensed Combined Pro Forma |
||||||||||||||||||||||||
| CASMex Reconciliation | |||||||||||||||||||||||||||||
| Non-fuel operating expense | $ | 1,934 | $ | 583 | $ | (2) | $ | 9 | $ | 2,524 | |||||||||||||||||||
| Less the following components: | |||||||||||||||||||||||||||||
| Freighter costs | 12 | — | — | — | 12 | ||||||||||||||||||||||||
| Special items - operating | 156 | — | — | — | 156 | ||||||||||||||||||||||||
| Total non-fuel operating expenses, excluding freighter costs and special items | $ | 1,766 | $ | 583 | $ | (2) | $ | 9 | $ | 2,356 | |||||||||||||||||||
| CASMex | 9.50 | ¢ | 11.27 | ¢ | 9.92 | ¢ | |||||||||||||||||||||||
Adjusted Pretax Income |
|||||||||||||||||||||||||||||
| Income before income tax | $ | 193 | $ | (61) | $ | (1) | $ | (6) | $ | 125 | |||||||||||||||||||
| Adjusted for: | |||||||||||||||||||||||||||||
| Mark-to-market fuel hedge adjustment | (35) | (7) | — | — | (42) | ||||||||||||||||||||||||
| Special items - operating | 156 | — | — | — | 156 | ||||||||||||||||||||||||
| Special items - net non-operating | 8 | (1) | — | — | 7 | ||||||||||||||||||||||||
| Adjusted income before income tax | $ | 322 | $ | (69) | $ | (1) | $ | (6) | $ | 246 | |||||||||||||||||||
| Pretax margin | 6.8 | % | (8.4) | % | 3.5 | % | |||||||||||||||||||||||
| Adjusted pretax margin | 11.4 | % | (9.5) | % | 7.0 | % | |||||||||||||||||||||||
Adjusted Net Income |
|||||||||||||||||||||||||||||
| Net Income (Loss) | $ | 139 | $ | (49) | $ | (1) | $ | (4) | $ | 85 | |||||||||||||||||||
| Adjusted for: | |||||||||||||||||||||||||||||
| Mark-to-market fuel hedge adjustments | (35) | (7) | — | — | (42) | ||||||||||||||||||||||||
| Special items - operating | 156 | — | — | — | 156 | ||||||||||||||||||||||||
| Special items - net non-operating | 8 | (1) | — | — | 7 | ||||||||||||||||||||||||
| Income tax effect of reconciling items above | (31) | 2 | — | — | (29) | ||||||||||||||||||||||||
| Adjusted Net Income (Loss) | $ | 237 | $ | (55) | $ | (1) | $ | (4) | $ | 177 | |||||||||||||||||||
As Reported |
Pro Forma |
||||||||||||||||||||||||||||
| (in millions, except statistical data) | Alaska |
Hawaiian |
Reclassification and Policy Adjustments | Other | Condensed Combined Pro Forma |
||||||||||||||||||||||||
| Operating Revenue | |||||||||||||||||||||||||||||
| Passenger revenue | $ | 2,326 | $ | 602 | $ | — | $ | — | $ | 2,928 | |||||||||||||||||||
| Mileage Plan other revenue | 165 | — | 31 | — | $ | 196 | |||||||||||||||||||||||
| Cargo and other revenue | 62 | 67 | (32) | — | $ | 97 | |||||||||||||||||||||||
| Total Operating Revenue | 2,553 | 669 | (1) | — | 3,221 | ||||||||||||||||||||||||
| Non-fuel operating expense | 1,812 | 579 | (13) | 9 | (a) | 2,387 | |||||||||||||||||||||||
| Fuel Expense | 709 | 202 | 8 | — | 919 | ||||||||||||||||||||||||
| Total Operating Expenses | 2,521 | 781 | (5) | 9 | 3,306 | ||||||||||||||||||||||||
Operating Income / (Loss) |
32 | (112) | 4 | (9) | (85) | ||||||||||||||||||||||||
Non-operating Income (Expense) |
(28) | (15) | 6 | 3 | (b) | (34) | |||||||||||||||||||||||
| Income (Loss) Before Income Tax | 4 | (127) | 10 | (6) | (119) | ||||||||||||||||||||||||
| Income tax expense / (benefit) | 6 | (26) | — | (2) | (c) | (22) | |||||||||||||||||||||||
| Net Income (Loss) | (2) | (101) | 10 | (4) | (97) | ||||||||||||||||||||||||
| RPMs (000,000) "traffic" | 14,153 | 4,221 | 18,374 | ||||||||||||||||||||||||||
| ASMs (000,000) "capacity" | 17,077 | 5,104 | 22,181 | ||||||||||||||||||||||||||
| Load Factor | 82.9 | % | 82.7 | % | 82.8 | % | |||||||||||||||||||||||
| RASM | 14.95 | ¢ | 13.11 | ¢ | 14.52 | ¢ | |||||||||||||||||||||||
As Reported |
Pro Forma |
||||||||||||||||||||||||||||
| (in millions, except statistical data) | Alaska |
Hawaiian |
Reclassification and Policy Adjustments | Other | Condensed Combined Pro Forma |
||||||||||||||||||||||||
| CASMex Reconciliation | |||||||||||||||||||||||||||||
| Non-fuel operating expense | $ | 1,812 | $ | 579 | $ | (13) | $ | 9 | $ | 2,387 | |||||||||||||||||||
| Less the following components: | |||||||||||||||||||||||||||||
| Freighter costs | 15 | — | — | — | 15 | ||||||||||||||||||||||||
| Special items - operating | 37 | (22) | — | — | 15 | ||||||||||||||||||||||||
Total non-fuel operating expenses, excluding freighter costs and special items |
$ | 1,760 | $ | 601 | $ | (13) | $ | 9 | $ | 2,357 | |||||||||||||||||||
| CASMex | 10.31 | ¢ | 11.77 | ¢ | 10.63 | ¢ | |||||||||||||||||||||||
Adjusted Pretax Income |
|||||||||||||||||||||||||||||
| Income before income tax | $ | 4 | $ | (127) | $ | 10 | $ | (6) | $ | (119) | |||||||||||||||||||
| Adjusted for: | |||||||||||||||||||||||||||||
| Mark-to-market fuel hedge adjustment | 12 | 4 | — | — | 16 | ||||||||||||||||||||||||
| Special items - operating | 37 | (22) | — | — | 15 | ||||||||||||||||||||||||
| Special items - net non-operating | 4 | (9) | — | — | (5) | ||||||||||||||||||||||||
| Adjusted income before income tax | $ | 57 | $ | (154) | $ | 10 | $ | (6) | $ | (93) | |||||||||||||||||||
| Pretax margin | 0.2 | % | (19.0) | % | (3.7) | % | |||||||||||||||||||||||
| Adjusted pretax margin | 2.2 | % | (22.9) | % | (2.8) | % | |||||||||||||||||||||||
Adjusted Net Income |
|||||||||||||||||||||||||||||
| Net Income (Loss) | $ | (2) | $ | (101) | $ | 10 | $ | (4) | $ | (97) | |||||||||||||||||||
| Adjusted for: | |||||||||||||||||||||||||||||
| Mark-to-market fuel hedge adjustments | 12 | 4 | — | — | 16 | ||||||||||||||||||||||||
| Special items - operating | 37 | (22) | — | — | 15 | ||||||||||||||||||||||||
| Special items - net non-operating | 4 | (9) | — | — | (5) | ||||||||||||||||||||||||
| Income tax effect of reconciling items above | (13) | 5 | — | — | (8) | ||||||||||||||||||||||||
| Adjusted Net Income (Loss) | $ | 38 | $ | (123) | $ | 10 | $ | (4) | $ | (79) | |||||||||||||||||||
As Reported |
Pro Forma |
||||||||||||||||||||||||||||
| (in millions, except statistical data) | Alaska |
Hawaiian |
Reclassification and Policy Adjustments | Other | Condensed Combined Pro Forma |
||||||||||||||||||||||||
| Operating Revenue | |||||||||||||||||||||||||||||
| Passenger revenue | $ | 9,526 | $ | 2,460 | $ | — | $ | — | $ | 11,986 | |||||||||||||||||||
| Mileage Plan other revenue | 648 | — | 124 | — | 772 | ||||||||||||||||||||||||
| Cargo and other revenue | 252 | 256 | (126) | — | 382 | ||||||||||||||||||||||||
| Total Operating Revenue | 10,426 | 2,716 | (2) | — | 13,140 | ||||||||||||||||||||||||
| Non-fuel operating expense | 7,391 | 2,244 | (20) | 33 | (a) | 9,648 | |||||||||||||||||||||||
| Fuel Expense | 2,641 | 766 | 32 | — | 3,439 | ||||||||||||||||||||||||
| Total Operating Expenses | 10,032 | 3,010 | 12 | 33 | 13,087 | ||||||||||||||||||||||||
Operating Income / (Loss) |
394 | (294) | (14) | (33) | 53 | ||||||||||||||||||||||||
| Non-operating Income (expense) | (71) | (34) | 12 | 4 | (b) | (89) | |||||||||||||||||||||||
| Income (Loss) Before Income Tax | 323 | (328) | (2) | (29) | (36) | ||||||||||||||||||||||||
Income tax expense / (benefit) |
88 | (67) | — | (7) | (c) | 14 | |||||||||||||||||||||||
| Net Income (Loss) | 235 | (261) | (2) | (22) | (50) | ||||||||||||||||||||||||
| RPMs (000,000) "traffic" | 57,362 | 16,865 | 74,227 | ||||||||||||||||||||||||||
| ASMs (000,000) "capacity" | 68,524 | 20,204 | 88,728 | ||||||||||||||||||||||||||
| Load Factor | 83.7 | % | 83.5 | % | 83.7 | % | |||||||||||||||||||||||
| RASM | 15.22 | ¢ | 13.44 | ¢ | 14.81 | ¢ | |||||||||||||||||||||||
As Reported |
Pro Forma |
||||||||||||||||||||||||||||
| (in millions, except statistical data) | Alaska |
Hawaiian |
Reclassification and Policy Adjustments | Other | Condensed Combined Pro Forma |
||||||||||||||||||||||||
| CASMex Reconciliation | |||||||||||||||||||||||||||||
| Non-fuel operating expense | $ | 7,391 | $ | 2,244 | $ | (20) | $ | 33 | $ | 9,648 | |||||||||||||||||||
| Less the following components: | |||||||||||||||||||||||||||||
| Freighter costs | 53 | — | — | — | 53 | ||||||||||||||||||||||||
| Special items - operating | 443 | (38) | — | — | 405 | ||||||||||||||||||||||||
Total non-fuel operating expenses, excluding freighter costs and special items |
$ | 6,895 | $ | 2,282 | $ | (20) | $ | 33 | $ | 9,190 | |||||||||||||||||||
| CASMex | 10.06 | ¢ | 11.29 | ¢ | 10.36 | ¢ | |||||||||||||||||||||||
Adjusted Pretax Income |
|||||||||||||||||||||||||||||
| Income before income tax | $ | 323 | $ | (328) | $ | (2) | $ | (29) | $ | (36) | |||||||||||||||||||
| Adjusted for: | |||||||||||||||||||||||||||||
| Mark-to-market fuel hedge adjustment | (2) | 2 | — | — | — | ||||||||||||||||||||||||
| Special items - operating | 443 | (38) | — | — | 405 | ||||||||||||||||||||||||
| Special items - net non-operating | 18 | (29) | — | — | (11) | ||||||||||||||||||||||||
| Adjusted income before income tax | $ | 782 | $ | (393) | $ | (2) | $ | (29) | $ | 358 | |||||||||||||||||||
| Pretax margin | 3.1 | % | (12.1) | % | (0.3) | % | |||||||||||||||||||||||
| Adjusted pretax margin | 7.5 | % | (14.5) | % | 2.7 | % | |||||||||||||||||||||||
Adjusted Net Income |
|||||||||||||||||||||||||||||
| Net Income (Loss) | $ | 235 | $ | (261) | $ | (2) | $ | (22) | $ | (50) | |||||||||||||||||||
| Adjusted for: | |||||||||||||||||||||||||||||
| Mark-to-market fuel hedge adjustments | (2) | 2 | — | — | — | ||||||||||||||||||||||||
| Special items - operating | 443 | (38) | — | — | 405 | ||||||||||||||||||||||||
| Special items - net non-operating | 18 | (29) | — | — | (11) | ||||||||||||||||||||||||
| Income tax effect of reconciling items above | (111) | 12 | — | — | (111) | ||||||||||||||||||||||||
| Adjusted Net Income (Loss) | $ | 583 | $ | (314) | $ | (2) | $ | (22) | $ | 233 | |||||||||||||||||||
As Reported |
Pro Forma |
||||||||||||||||||||||||||||
| (in millions, except statistical data) | Alaska |
Hawaiian |
Reclassification and Policy Adjustments | Other | Condensed Combined Pro Forma |
||||||||||||||||||||||||
| Operating Revenue | |||||||||||||||||||||||||||||
| Passenger revenue | $ | 2,821 | $ | 606 | $ | — | $ | — | $ | 3,427 | |||||||||||||||||||
| Mileage Plan other revenue | 171 | — | 4 | — | 175 | ||||||||||||||||||||||||
| Cargo and other revenue | 80 | 62 | (5) | — | 137 | ||||||||||||||||||||||||
| Total Operating Revenue | 3,072 | 668 | (1) | — | 3,739 | ||||||||||||||||||||||||
| Non-fuel operating expense | 2,107 | 539 | (8) | (9) | (a) | 2,629 | |||||||||||||||||||||||
| Fuel Expense | 624 | 153 | 6 | — | 783 | ||||||||||||||||||||||||
| Total Operating Expenses | 2,731 | 692 | (2) | (9) | 3,412 | ||||||||||||||||||||||||
Operating Income / (Loss) |
341 | (24) | 1 | 9 | 327 | ||||||||||||||||||||||||
Non-operating Income (Expense) |
(13) | (38) | 17 | 3 | (b) | (31) | |||||||||||||||||||||||
| Income (Loss) Before Income Tax | 328 | (62) | 18 | 12 | 296 | ||||||||||||||||||||||||
Income tax expense / (benefit) |
92 | (3) | — | 3 | (c) | 92 | |||||||||||||||||||||||
| Net Income (Loss) | 236 | (59) | 18 | 9 | 204 | ||||||||||||||||||||||||
| RPMs (000,000) "traffic" | 16,970 | 4,103 | 21,073 | ||||||||||||||||||||||||||
| ASMs (000,000) "capacity" | 19,847 | 4,760 | 24,607 | ||||||||||||||||||||||||||
| Load Factor | 85.5 | % | 86.2 | % | 85.6 | % | |||||||||||||||||||||||
| RASM | 15.48 | ¢ | 14.03 | ¢ | 15.19 | ¢ | |||||||||||||||||||||||
As Reported |
Pro Forma |
||||||||||||||||||||||||||||
| (in millions, except statistical data) | Alaska |
Hawaiian |
Reclassification and Policy Adjustments | Other | Condensed Combined Pro Forma |
||||||||||||||||||||||||
| CASMex Reconciliation | |||||||||||||||||||||||||||||
| Non-fuel operating expense | $ | 2,107 | $ | 539 | $ | (8) | $ | (9) | $ | 2,629 | |||||||||||||||||||
| Less the following components: | |||||||||||||||||||||||||||||
| Freighter costs | 17 | — | — | — | 17 | ||||||||||||||||||||||||
| Special items - operating | 74 | 3 | — | — | 77 | ||||||||||||||||||||||||
| Total non-fuel operating expenses, excluding freighter costs and special items | $ | 2,016 | $ | 536 | $ | (8) | $ | (9) | $ | 2,535 | |||||||||||||||||||
| CASMex | 10.16 | ¢ | 11.26 | ¢ | 10.30 | ¢ | |||||||||||||||||||||||
Adjusted Pretax Income |
|||||||||||||||||||||||||||||
| Income before income tax | $ | 328 | $ | (62) | $ | 18 | $ | 12 | $ | 296 | |||||||||||||||||||
| Adjusted for: | |||||||||||||||||||||||||||||
| Mark-to-market fuel hedge adjustment | (4) | — | — | — | (4) | ||||||||||||||||||||||||
| Special items - operating | 74 | 3 | — | — | 77 | ||||||||||||||||||||||||
| Special items - net non-operating | 1 | — | — | — | 1 | ||||||||||||||||||||||||
| Adjusted income before income tax | $ | 399 | $ | (59) | $ | 18 | $ | 12 | $ | 370 | |||||||||||||||||||
| Pretax margin | 10.7 | % | (9.3) | % | 7.9 | % | |||||||||||||||||||||||
| Adjusted pretax margin | 13.0 | % | (8.8) | % | 9.9 | % | |||||||||||||||||||||||
Adjusted Net Income |
|||||||||||||||||||||||||||||
| Net Income (Loss) | $ | 236 | $ | (59) | $ | 18 | $ | 9 | $ | 204 | |||||||||||||||||||
| Adjusted for: | |||||||||||||||||||||||||||||
| Mark-to-market fuel hedge adjustments | (4) | — | — | — | (4) | ||||||||||||||||||||||||
| Special items - operating | 74 | 3 | — | — | 77 | ||||||||||||||||||||||||
| Special items - net non-operating | 1 | — | — | — | 1 | ||||||||||||||||||||||||
| Income tax effect of reconciling items above | (18) | — | — | — | (18) | ||||||||||||||||||||||||
| Adjusted Net Income (Loss) | $ | 289 | $ | (56) | $ | 18 | $ | 9 | $ | 260 | |||||||||||||||||||