| New York | 0-12507 | 22-2448962 | ||||||
| (State or other jurisdiction of incorporation) | (Commission File Number) | (IRS Employer Identification No.) | ||||||
| 250 Glen Street | Glens Falls | New York | 12801 | |||||||||||
| (Address of principal executive offices) | (Zip Code) | |||||||||||||
| Registrant’s telephone number, including area code: | 518 | 745-1000 | ||||||||||||
| Check the appropriate box below if the Form 8-K filing is intended to simultaneously satisfy the filing obligation of the registrant under any of the following provisions: | |||||
| ☐ | Written communications pursuant to Rule 425 under the Securities Act (17 CFR 230.425) | ||||
| ☐ | Soliciting material pursuant to Rule 14a-12 under the Exchange Act (17 CFR 240.14a-12) | ||||
| ☐ | Pre-commencement communications pursuant to Rule 14d-2(b) under the Exchange Act (17 CFR 240.14d-2(b)) | ||||
| ☐ | Pre-commencement communications pursuant to Rule 13e-4(c) under the Exchange Act (17 CFR 240.13e-4(c)) | ||||
| Title of Each Class | Trading Symbol | Name of each exchange on which registered | ||||||
| Common Stock, Par Value $1.00 per share | AROW | NASDAQ Global Select Market | ||||||
| Indicate by check mark whether the registrant is an emerging growth company as defined in Rule 405 of the Securities Act of 1933 (§230.405 of this chapter) or Rule 12b-2 of the Securities Exchange Act of 1934 (§240.12b-2 of this chapter). | ||||||||
| Emerging growth company | ☐ | |||||||
| If an emerging growth company, indicate by check mark if the registrant has elected not to use the extended transition period for complying with any new or revised financial accounting standards provided pursuant to Section 13(a) of the Exchange Act | ☐ | |||||||
| ARROW FINANCIAL CORPORATION | ||||||||
| Registrant | ||||||||
| Date: | October 31, 2024 | /s/ Penko Ivanov | ||||||
| Penko Ivanov | ||||||||
| Chief Financial Officer | ||||||||
 |
250 Glen Street Glens Falls, NY 12801 |
||||
| NASDAQ® Symbol: "AROW" Website: arrowfinancial.com Media Contact: Rachael Murray Tel: (518) 742-6505 | |||||
| Three Months Ended | |||||||||||||||||
| (Dollars in Thousands) | |||||||||||||||||
| September 30, 2024 | June 30, 2024 | September 30, 2023 | |||||||||||||||
| Interest and Dividend Income | $ | 49,443 | $ | 47,972 | $ | 42,117 | |||||||||||
| Interest Expense | 21,005 | 20,820 | 16,764 | ||||||||||||||
| Net Interest Income | 28,438 | 27,152 | 25,353 | ||||||||||||||
Average Earning Assets(A) |
4,075,162 | 4,083,813 | 3,973,747 | ||||||||||||||
| Average Interest-Bearing Liabilities | 3,085,066 | 3,127,417 | 2,920,518 | ||||||||||||||
Yield on Earning Assets(A) |
4.83 | % | 4.72 | % | 4.20 | % | |||||||||||
| Cost of Interest-Bearing Liabilities | 2.71 | 2.68 | 2.28 | ||||||||||||||
| Net Interest Spread | 2.12 | 2.04 | 1.92 | ||||||||||||||
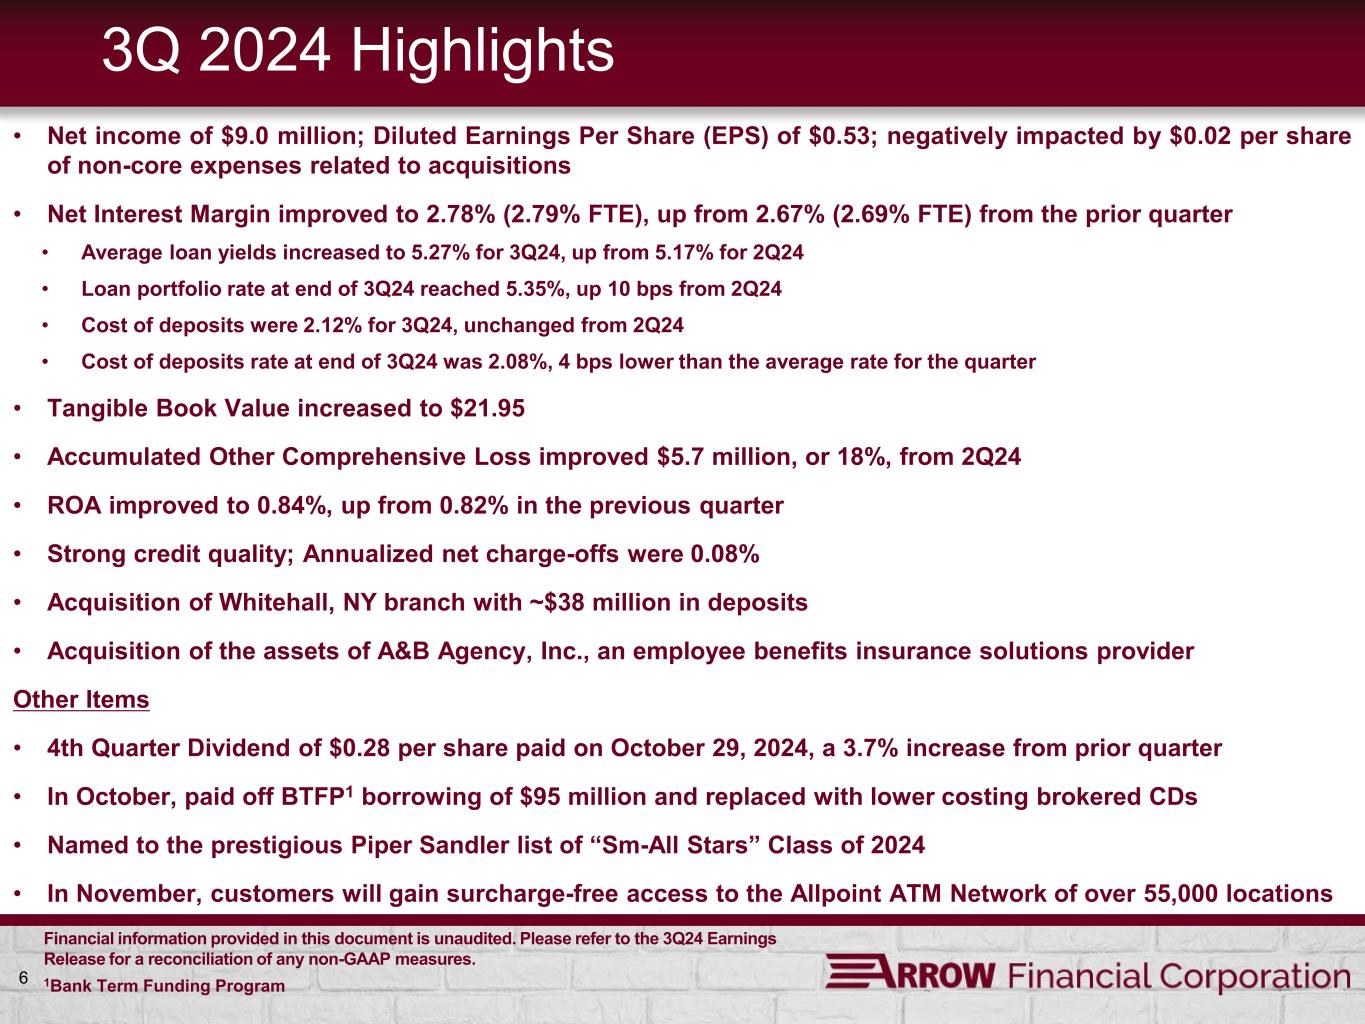
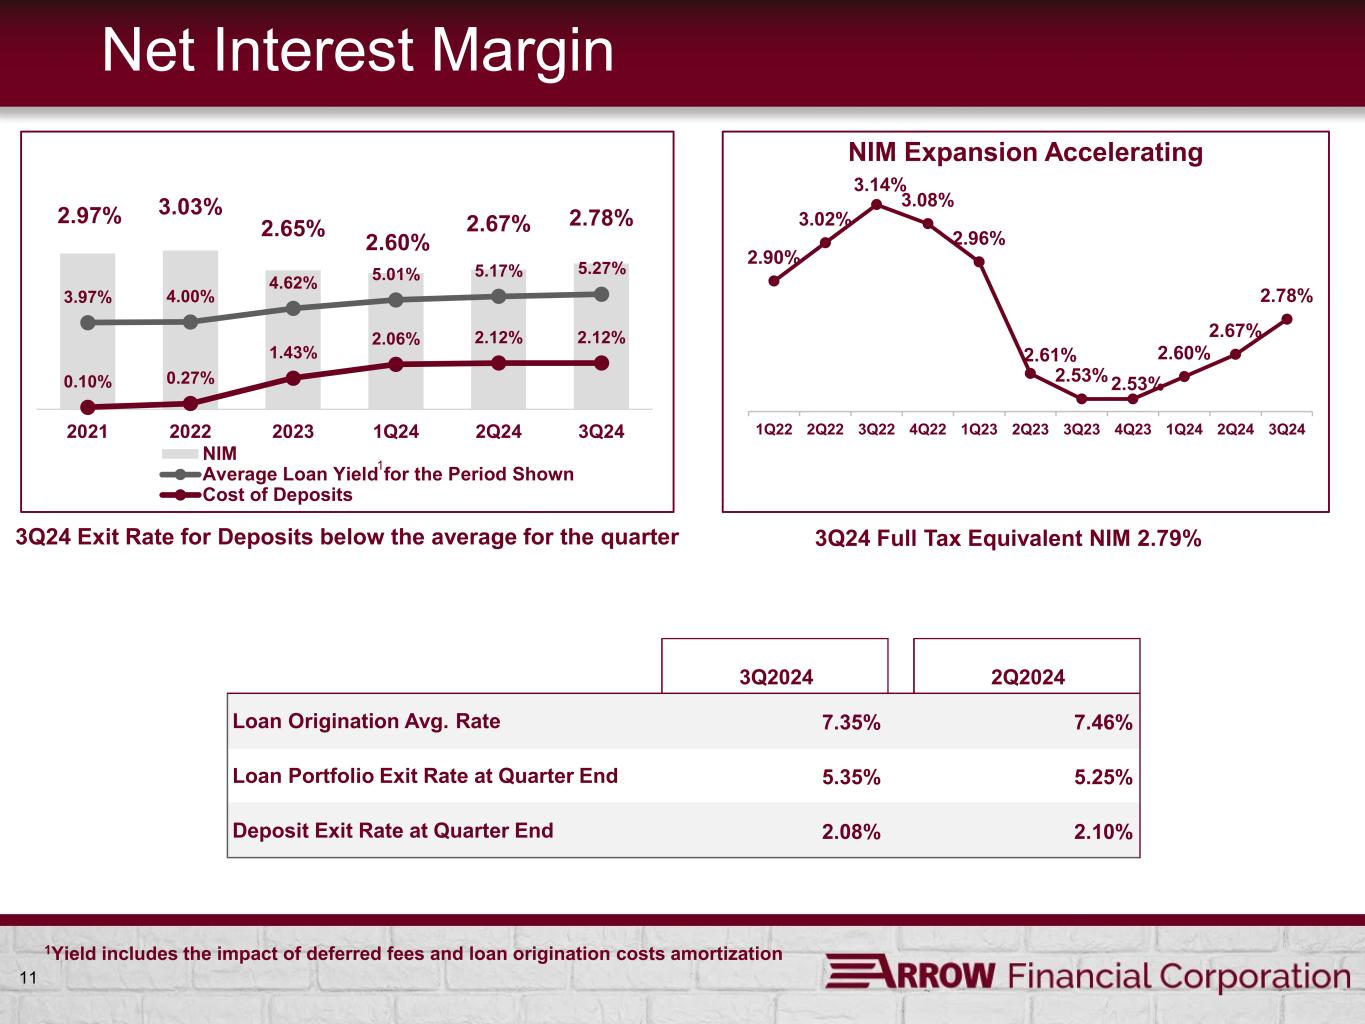
| Net Interest Margin | 2.78 | 2.67 | 2.53 | ||||||||||||||
| Net Interest Margin - FTE | 2.79 | 2.69 | 2.55 | ||||||||||||||
(A) Includes Nonaccrual Loans. |
|||||||||||||||||
Three Months Ended September 30 |
Nine Months Ended September 30 |
|||||||||||||||||||||||||
| 2024 | 2023 | 2024 | 2023 | |||||||||||||||||||||||
| INTEREST AND DIVIDEND INCOME | ||||||||||||||||||||||||||
| Interest and Fees on Loans | $ | 44,122 | $ | 36,699 | $ | 126,639 | $ | 103,203 | ||||||||||||||||||
| Interest on Deposits at Banks | 2,103 | 1,805 | 6,735 | 3,958 | ||||||||||||||||||||||
| Interest and Dividends on Investment Securities: | ||||||||||||||||||||||||||
| Fully Taxable | 2,656 | 2,924 | 8,851 | 8,823 | ||||||||||||||||||||||
| Exempt from Federal Taxes | 562 | 689 | 1,867 | 2,256 | ||||||||||||||||||||||
| Total Interest and Dividend Income | 49,443 | 42,117 | 144,092 | 118,240 | ||||||||||||||||||||||
| INTEREST EXPENSE | ||||||||||||||||||||||||||
| Interest-Bearing Checking Accounts | 1,966 | 1,156 | 5,510 | 2,346 | ||||||||||||||||||||||
| Savings Deposits | 10,905 | 9,729 | 31,706 | 23,830 | ||||||||||||||||||||||
| Time Deposits over $250,000 | 1,803 | 1,466 | 5,645 | 3,159 | ||||||||||||||||||||||
| Other Time Deposits | 4,934 | 2,051 | 15,091 | 3,721 | ||||||||||||||||||||||
| Borrowings | 1,177 | 2,143 | 3,439 | 5,309 | ||||||||||||||||||||||
| Junior Subordinated Obligations Issued to Unconsolidated Subsidiary Trusts |
173 | 173 | 514 | 513 | ||||||||||||||||||||||
| Interest on Financing Leases | 47 | 46 | 142 | 143 | ||||||||||||||||||||||
| Total Interest Expense | 21,005 | 16,764 | 62,047 | 39,021 | ||||||||||||||||||||||
| NET INTEREST INCOME | 28,438 | 25,353 | 82,045 | 79,219 | ||||||||||||||||||||||
| Provision for Credit Losses | 934 | 354 | 2,326 | 2,856 | ||||||||||||||||||||||
| NET INTEREST INCOME AFTER PROVISION FOR CREDIT LOSSES | 27,504 | 24,999 | 79,719 | 76,363 | ||||||||||||||||||||||
| NON-INTEREST INCOME | ||||||||||||||||||||||||||
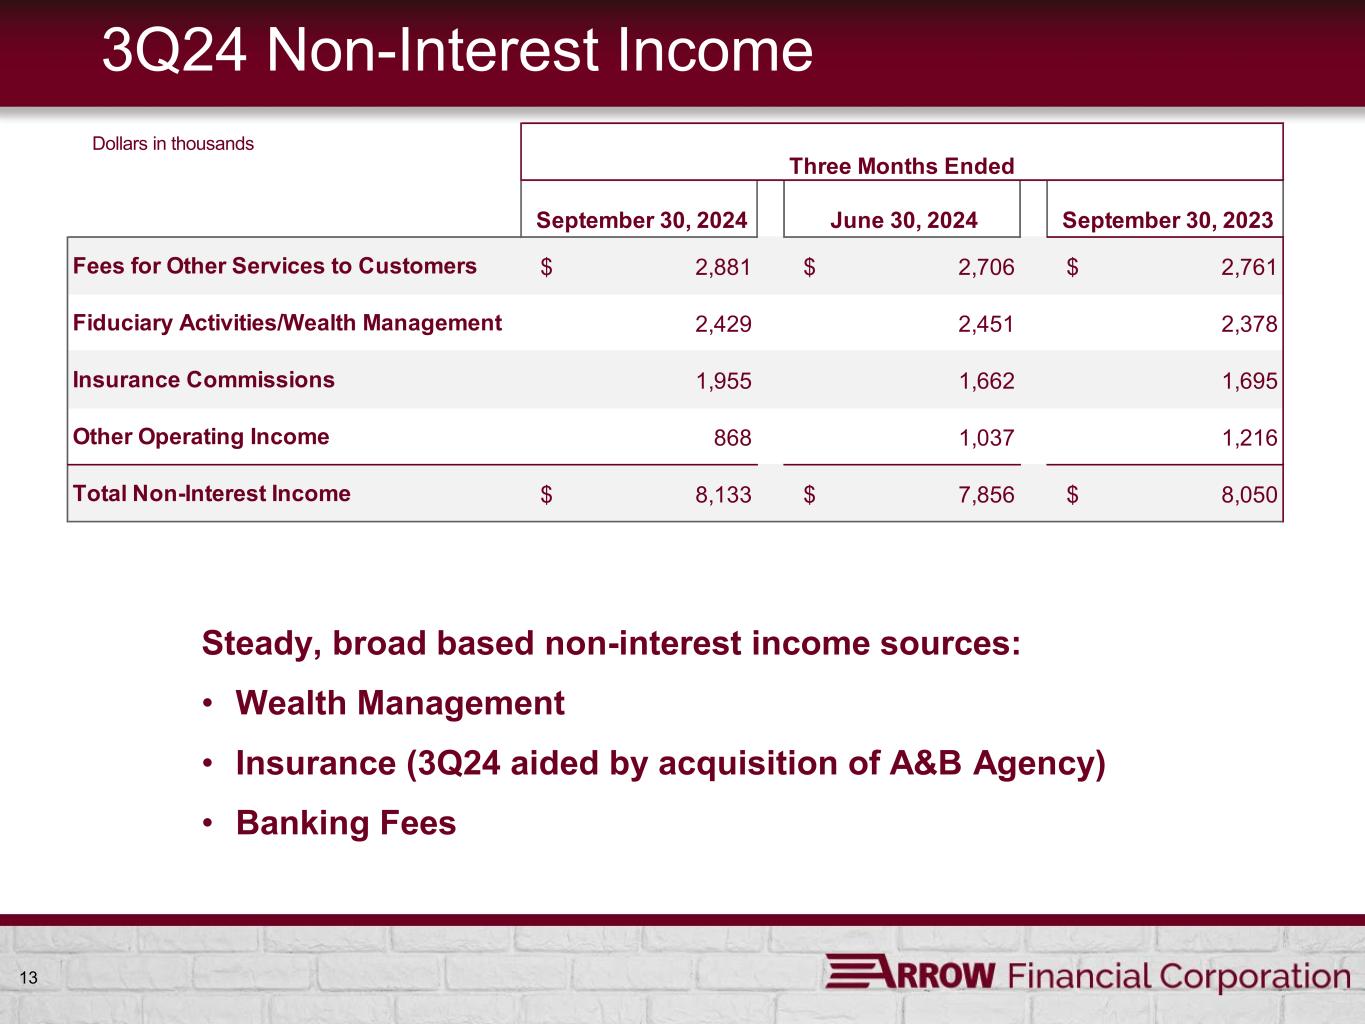
| Income From Fiduciary Activities | 2,429 | 2,378 | 7,337 | 7,081 | ||||||||||||||||||||||
| Fees for Other Services to Customers | 2,881 | 2,761 | 8,130 | 8,073 | ||||||||||||||||||||||
| Insurance Commissions | 1,955 | 1,695 | 5,299 | 4,775 | ||||||||||||||||||||||
| Net Gain (Loss) on Securities | 94 | 71 | 165 | (214) | ||||||||||||||||||||||
| Net Gain on Sales of Loans | 126 | 21 | 135 | 25 | ||||||||||||||||||||||
| Other Operating Income | 648 | 1,124 | 2,781 | 1,893 | ||||||||||||||||||||||
| Total Non-Interest Income | 8,133 | 8,050 | 23,847 | 21,633 | ||||||||||||||||||||||
| NON-INTEREST EXPENSE | ||||||||||||||||||||||||||
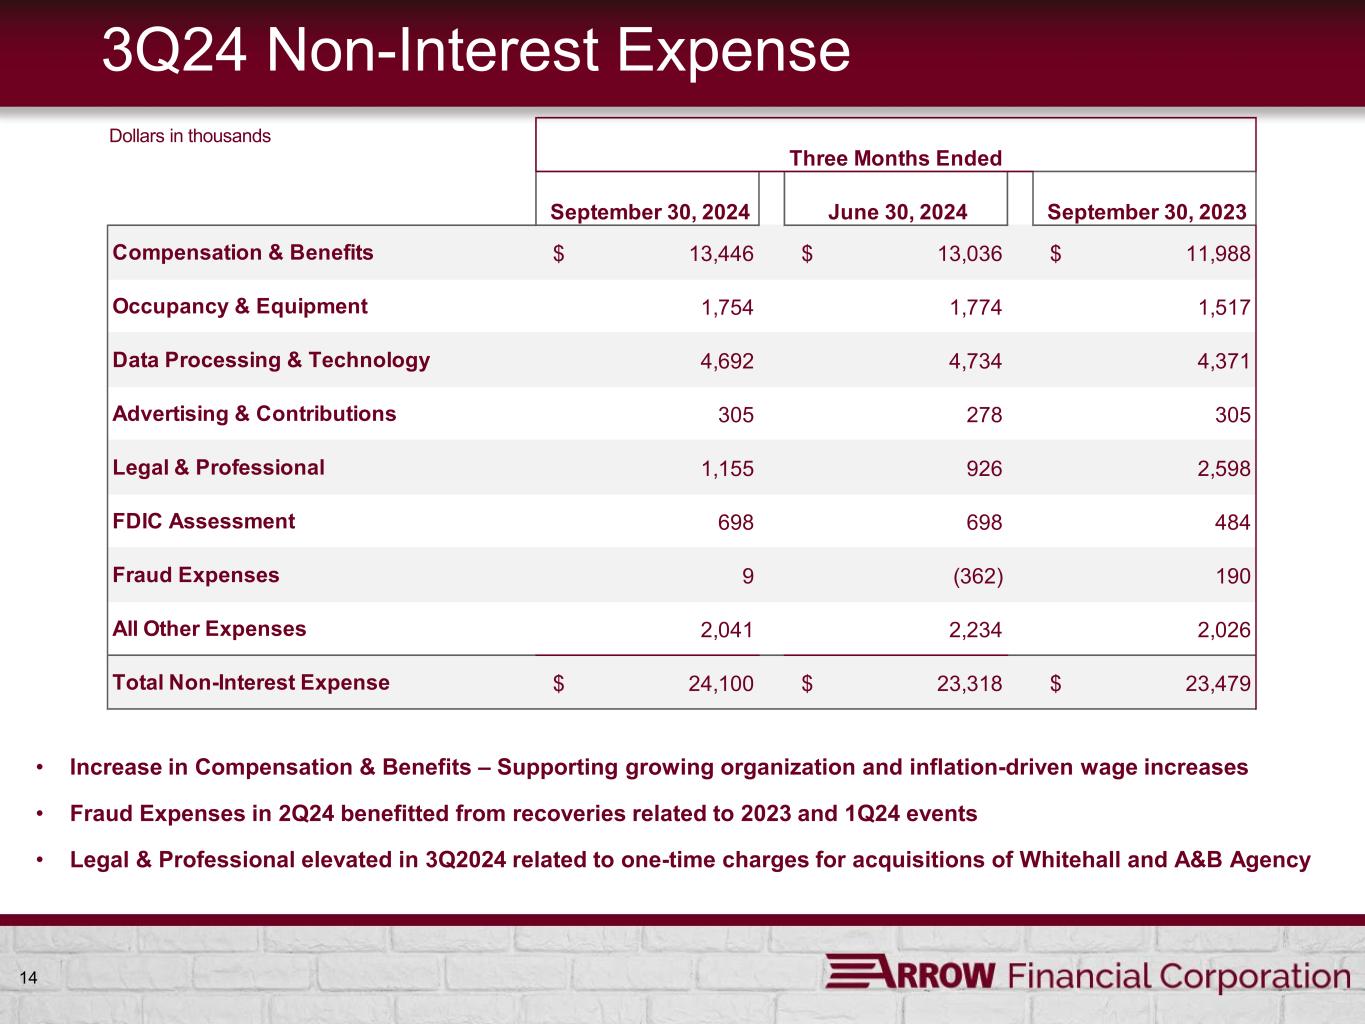
| Salaries and Employee Benefits | 13,446 | 11,988 | 39,375 | 35,974 | ||||||||||||||||||||||
| Occupancy Expenses, Net | 1,754 | 1,517 | 5,299 | 4,728 | ||||||||||||||||||||||
| Technology and Equipment Expense | 4,692 | 4,371 | 14,246 | 13,150 | ||||||||||||||||||||||
| FDIC Assessments | 698 | 515 | 2,111 | 1,478 | ||||||||||||||||||||||
| Other Operating Expense | 3,510 | 5,088 | 10,399 | 14,528 | ||||||||||||||||||||||
| Total Non-Interest Expense | 24,100 | 23,479 | 71,430 | 69,858 | ||||||||||||||||||||||
| INCOME BEFORE PROVISION FOR INCOME TAXES | 11,537 | 9,570 | 32,136 | 28,138 | ||||||||||||||||||||||
| Provision for Income Taxes | 2,562 | 1,827 | 6,897 | 5,786 | ||||||||||||||||||||||
| NET INCOME | $ | 8,975 | $ | 7,743 | $ | 25,239 | $ | 22,352 | ||||||||||||||||||
| Average Shares Outstanding: | ||||||||||||||||||||||||||
| Basic | 16,710 | 17,050 | 16,746 | 17,049 | ||||||||||||||||||||||
| Diluted | 16,742 | 17,050 | 16,772 | 17,049 | ||||||||||||||||||||||
| Per Common Share: | ||||||||||||||||||||||||||
| Basic Earnings | $ | 0.54 | $ | 0.46 | $ | 1.51 | $ | 1.31 | ||||||||||||||||||
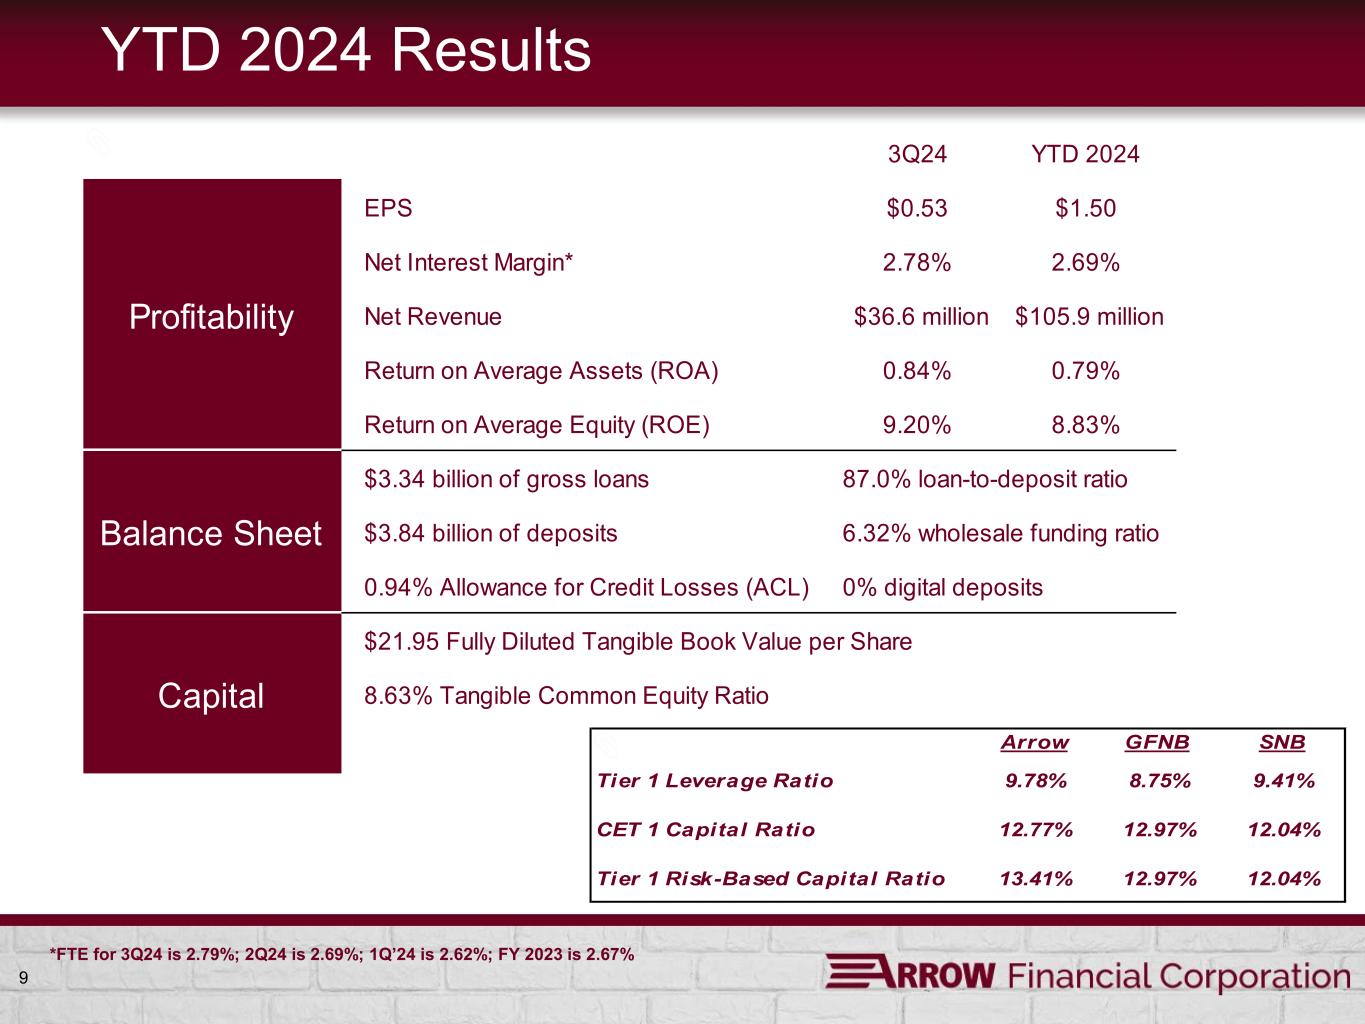
| Diluted Earnings | 0.53 | 0.46 | 1.50 | 1.31 | ||||||||||||||||||||||
| September 30, 2024 |
December 31, 2023 | September 30, 2023 |
|||||||||||||||
| ASSETS | |||||||||||||||||
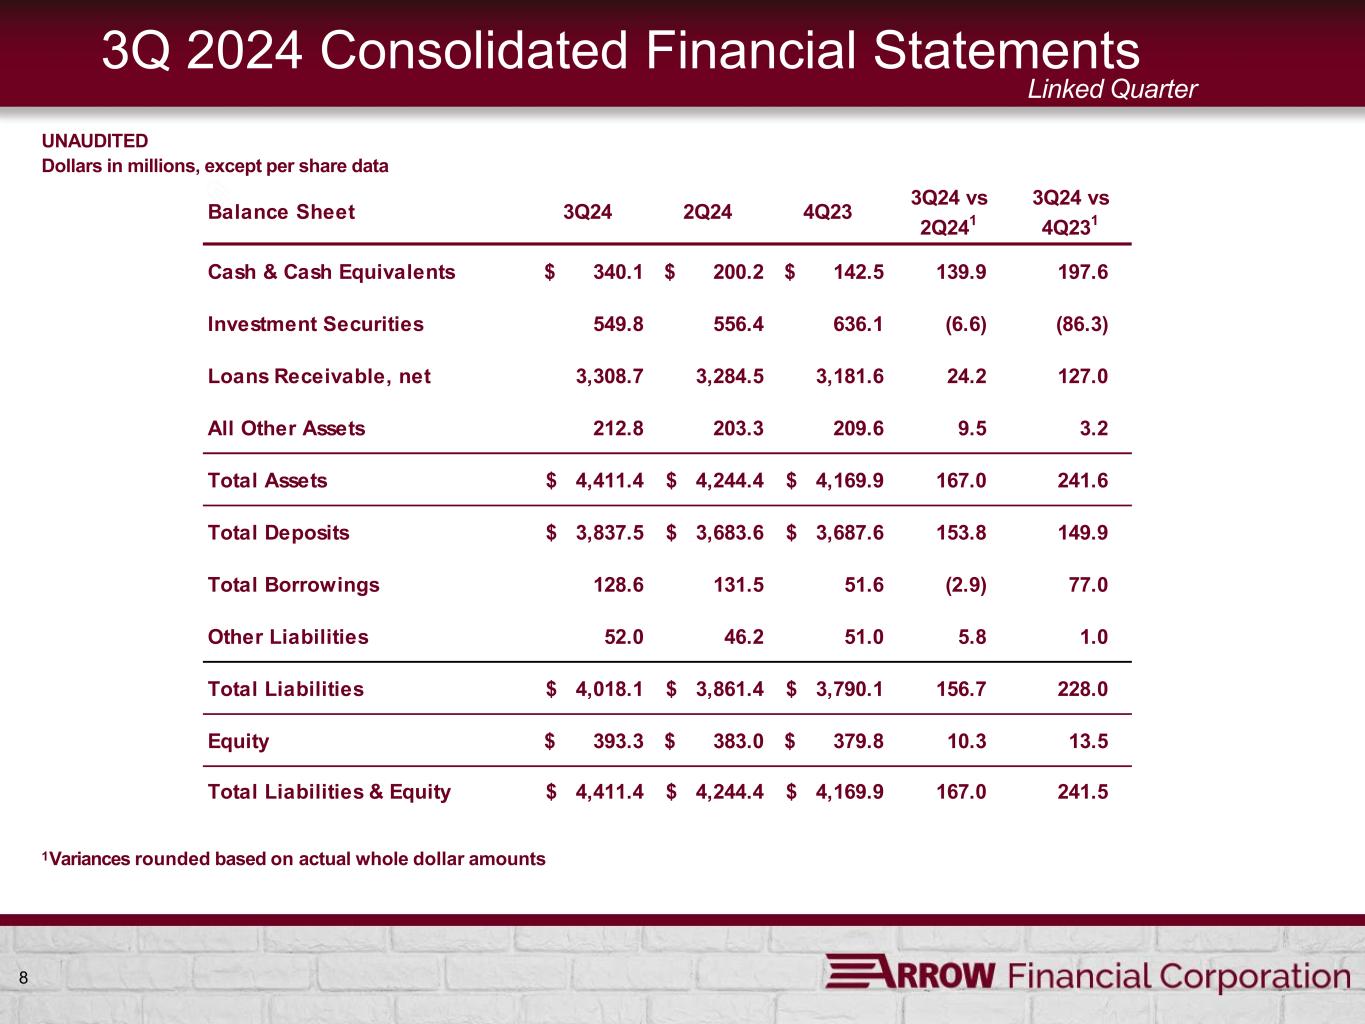
| Cash and Due From Banks | $ | 53,969 | $ | 36,755 | $ | 39,778 | |||||||||||
| Interest-Bearing Deposits at Banks | 286,119 | 105,781 | 254,961 | ||||||||||||||
| Investment Securities: | |||||||||||||||||
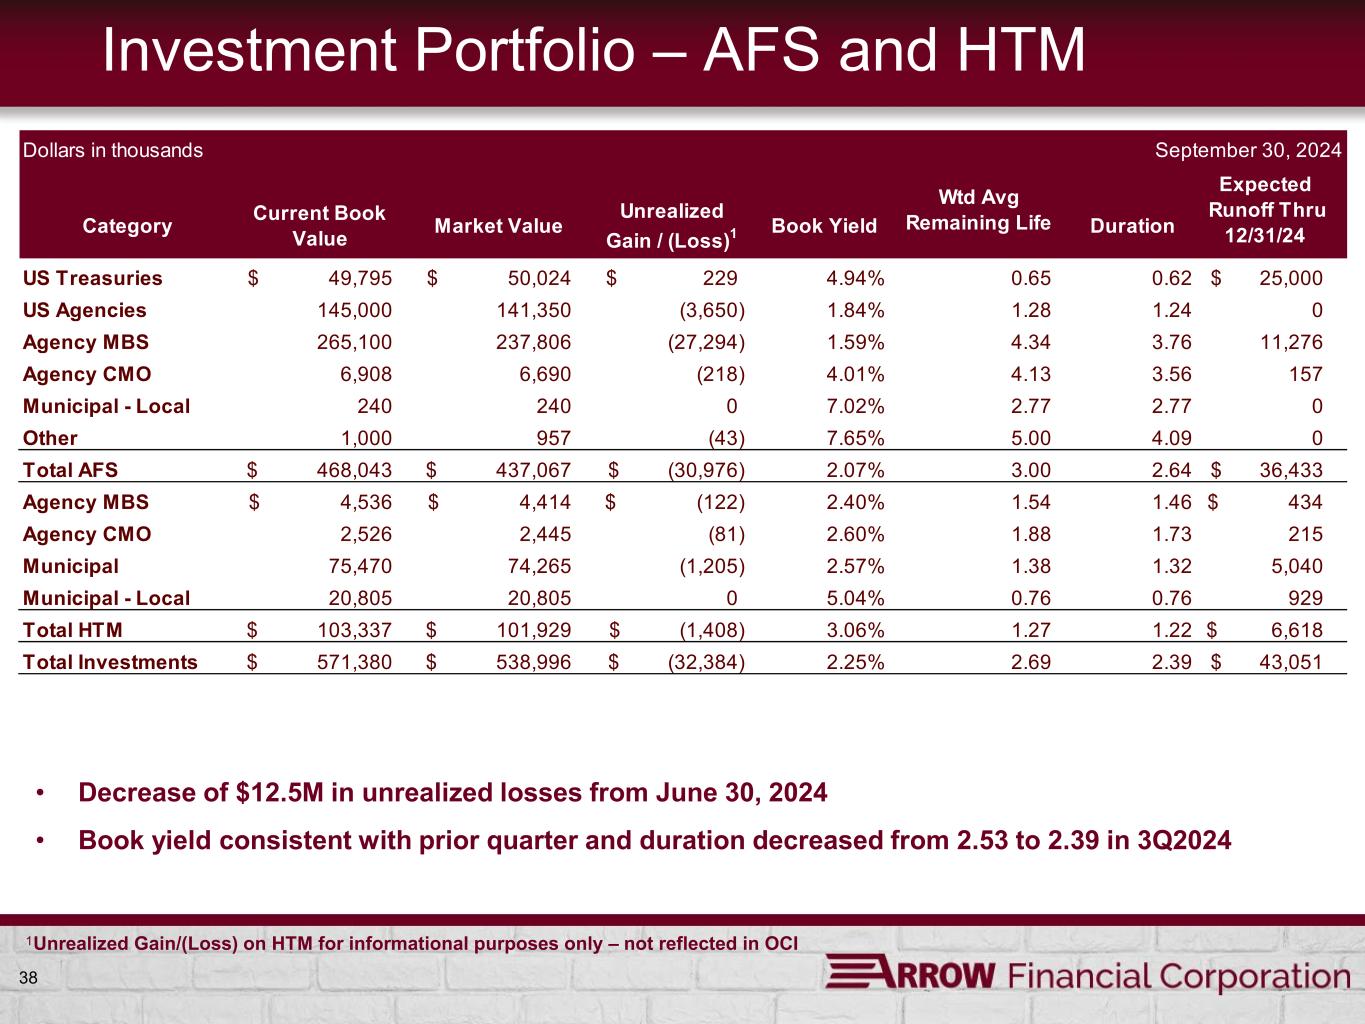
| Available-for-Sale at Fair Value | 437,067 | 497,769 | 519,240 | ||||||||||||||
Held-to-Maturity (Fair Value of $101,929 at September 30, 2024; $128,837 at December 31, 2023; and $134,811 at September 30, 2023) |
103,337 | 131,395 | 140,577 | ||||||||||||||
| Equity Securities | 5,089 | 1,925 | 1,960 | ||||||||||||||
| Other Investments | 4,352 | 5,049 | 5,110 | ||||||||||||||
| Loans | 3,339,937 | 3,212,908 | 3,138,617 | ||||||||||||||
| Allowance for Credit Losses | (31,262) | (31,265) | (31,112) | ||||||||||||||
| Net Loans | 3,308,675 | 3,181,643 | 3,107,505 | ||||||||||||||
| Premises and Equipment, Net | 59,932 | 59,642 | 60,311 | ||||||||||||||
| Goodwill | 23,789 | 21,873 | 21,873 | ||||||||||||||
| Other Intangible Assets, Net | 2,190 | 1,110 | 1,205 | ||||||||||||||
| Other Assets | 126,930 | 126,926 | 120,391 | ||||||||||||||
| Total Assets | $ | 4,411,449 | $ | 4,169,868 | $ | 4,272,911 | |||||||||||
| LIABILITIES | |||||||||||||||||
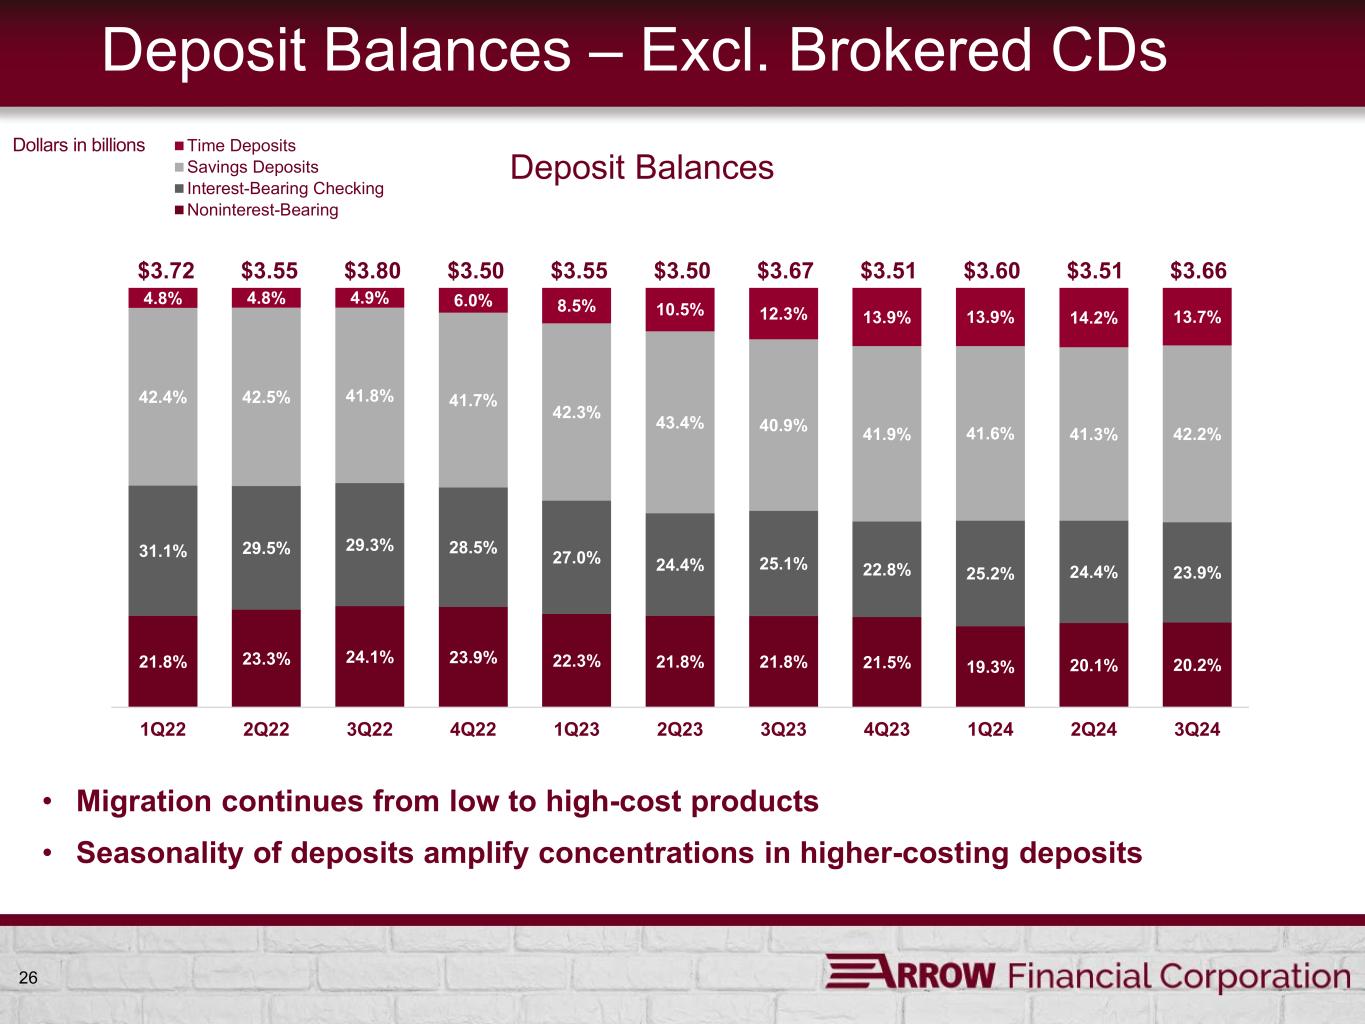
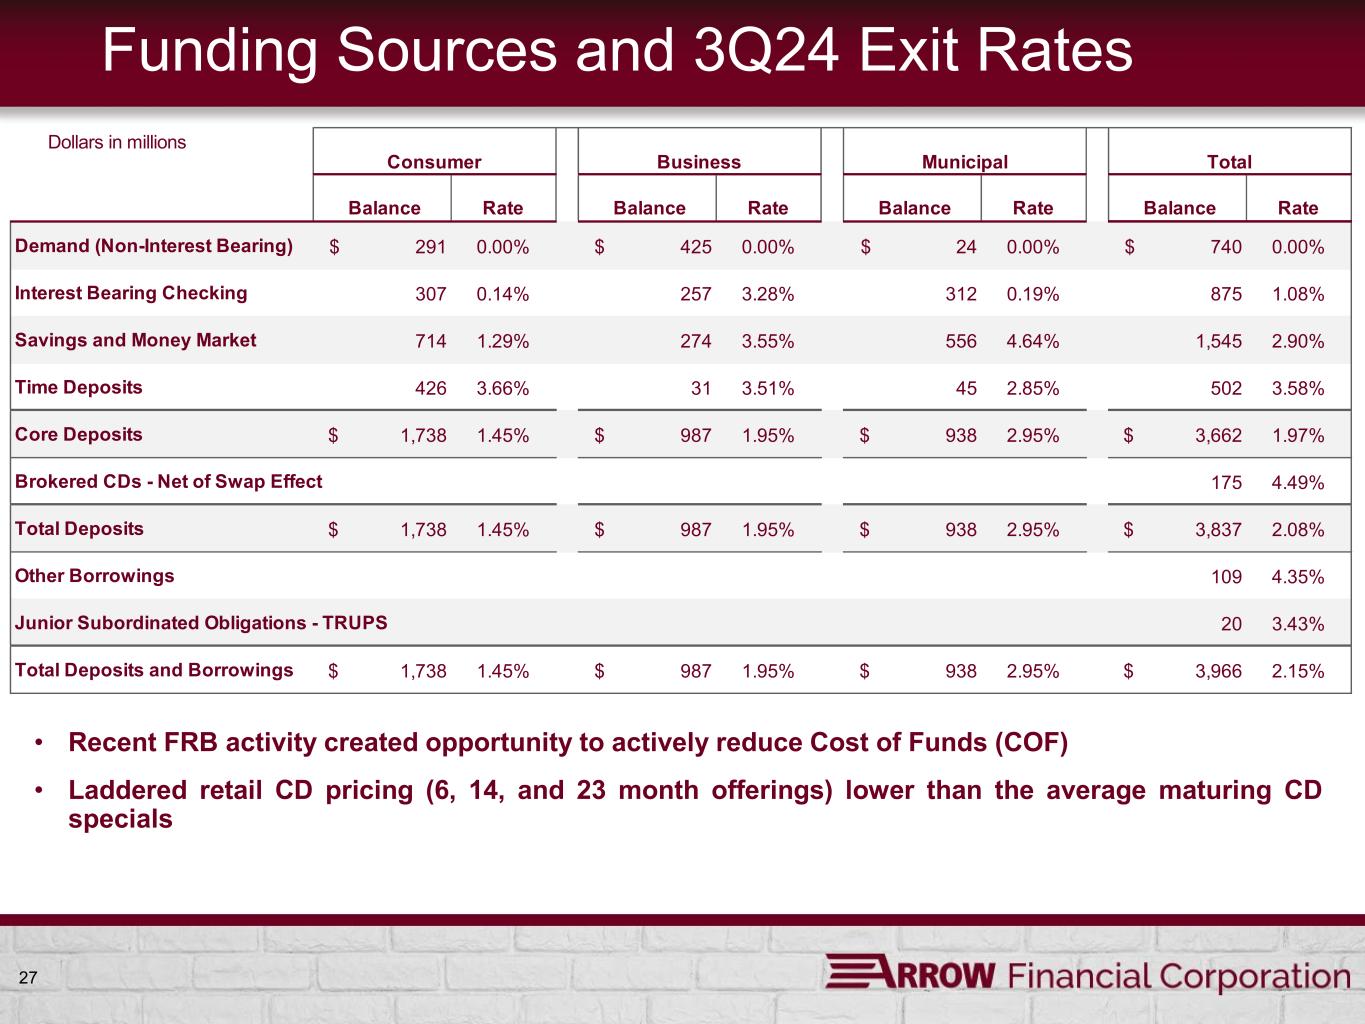
| Noninterest-Bearing Deposits | 740,170 | 758,425 | 798,392 | ||||||||||||||
| Interest-Bearing Checking Accounts | 875,365 | 799,785 | 920,250 | ||||||||||||||
| Savings Deposits | 1,544,868 | 1,466,280 | 1,496,193 | ||||||||||||||
| Time Deposits over $250,000 | 177,990 | 179,301 | 167,614 | ||||||||||||||
| Other Time Deposits | 499,064 | 483,775 | 284,036 | ||||||||||||||
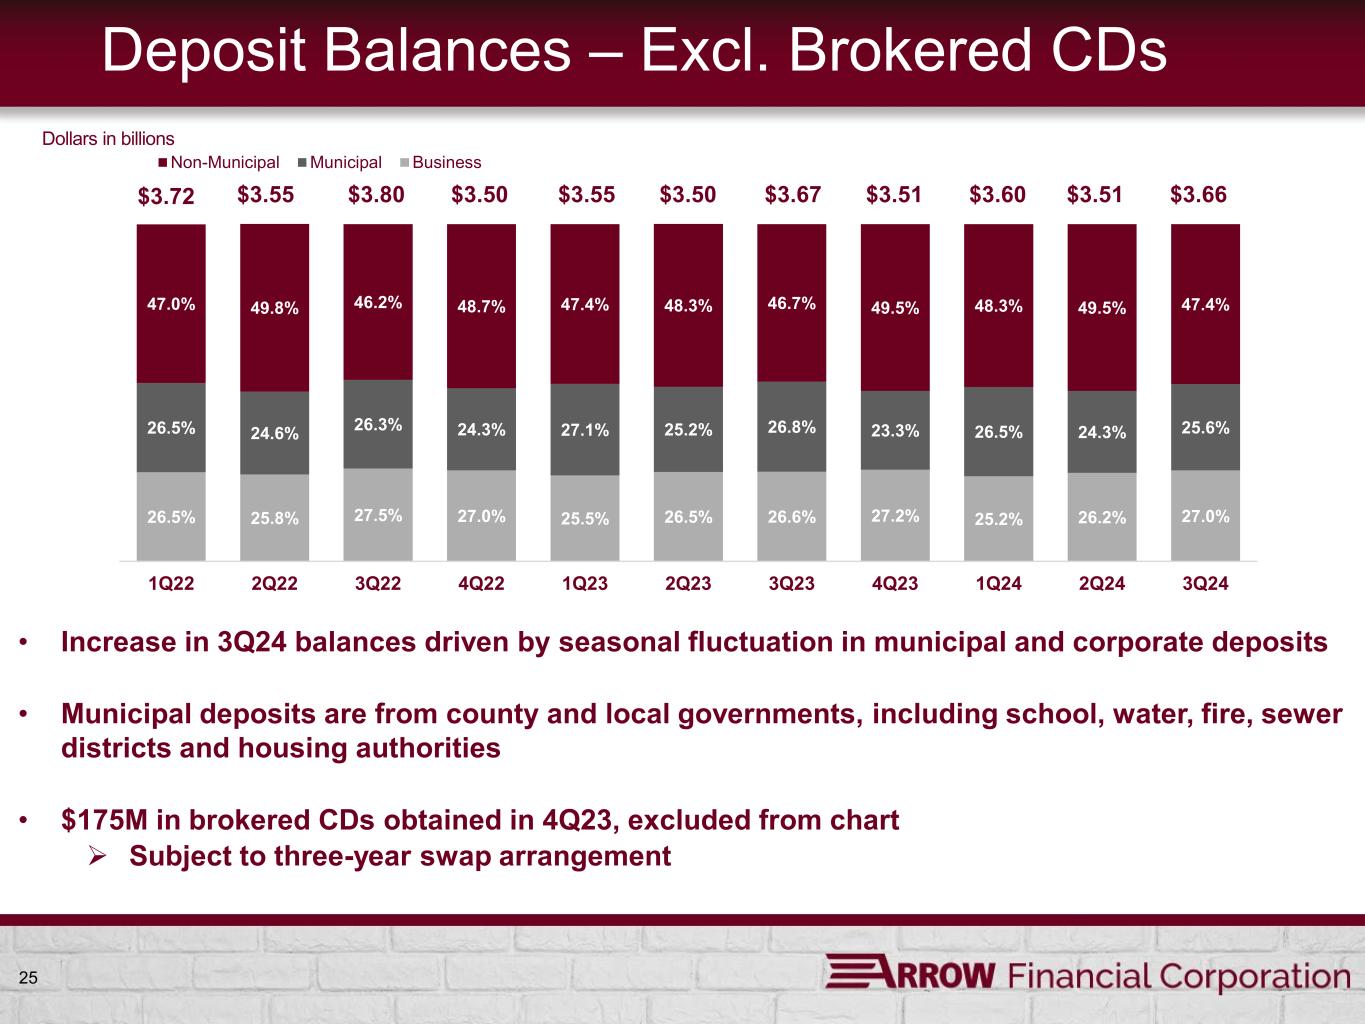
| Total Deposits | 3,837,457 | 3,687,566 | 3,666,485 | ||||||||||||||
| Borrowings | 103,600 | 26,500 | 174,300 | ||||||||||||||
| Junior Subordinated Obligations Issued to Unconsolidated Subsidiary Trusts |
20,000 | 20,000 | 20,000 | ||||||||||||||
| Finance Leases | 5,022 | 5,066 | 5,080 | ||||||||||||||
| Other Liabilities | 52,059 | 50,964 | 47,032 | ||||||||||||||
| Total Liabilities | 4,018,138 | 3,790,096 | 3,912,897 | ||||||||||||||
| STOCKHOLDERS’ EQUITY | |||||||||||||||||
Preferred Stock, $1 Par Value and 1,000,000 Shares Authorized at September 30, 2024, December 31, 2023 and September 30, 2023 |
— | — | — | ||||||||||||||
Common Stock, $1 Par Value; 30,000,000 Shares Authorized (22,066,559 Shares Issued at September 30, 2024, December 31, 2023 and September 30, 2023) |
22,067 | 22,067 | 22,067 | ||||||||||||||
| Additional Paid-in Capital | 413,065 | 412,551 | 412,397 | ||||||||||||||
| Retained Earnings | 77,429 | 65,792 | 62,647 | ||||||||||||||
| Accumulated Other Comprehensive Loss | (25,968) | (33,416) | (52,584) | ||||||||||||||
Treasury Stock, at Cost (5,332,907 Shares at September 30, 2024; 5,124,073 Shares at December 31, 2023 and 5,017,063 Shares at September 30, 2023) |
(93,282) | (87,222) | (84,513) | ||||||||||||||
| Total Stockholders’ Equity | 393,311 | 379,772 | 360,014 | ||||||||||||||
| Total Liabilities and Stockholders’ Equity | $ | 4,411,449 | $ | 4,169,868 | $ | 4,272,911 | |||||||||||
| Quarter Ended | 9/30/2024 | 6/30/2024 | 3/31/2024 | 12/31/2023 | 9/30/2023 | ||||||||||||||||||||||||
| Net Income | $ | 8,975 | $ | 8,604 | $ | 7,660 | $ | 7,723 | $ | 7,743 | |||||||||||||||||||
Net Changes in Fair Value of Equity Investments (Net of Tax) |
69 | 39 | 13 | 90 | 52 | ||||||||||||||||||||||||
| Share and Per Share Data: | |||||||||||||||||||||||||||||
| Period End Shares Outstanding | 16,734 | 16,723 | 16,710 | 16,942 | 17,049 | ||||||||||||||||||||||||
| Basic Average Shares Outstanding | 16,710 | 16,685 | 16,865 | 17,002 | 17,050 | ||||||||||||||||||||||||
| Diluted Average Shares Outstanding | 16,742 | 16,709 | 16,867 | 17,004 | 17,050 | ||||||||||||||||||||||||
| Basic Earnings Per Share | $ | 0.54 | $ | 0.52 | $ | 0.45 | $ | 0.46 | $ | 0.46 | |||||||||||||||||||
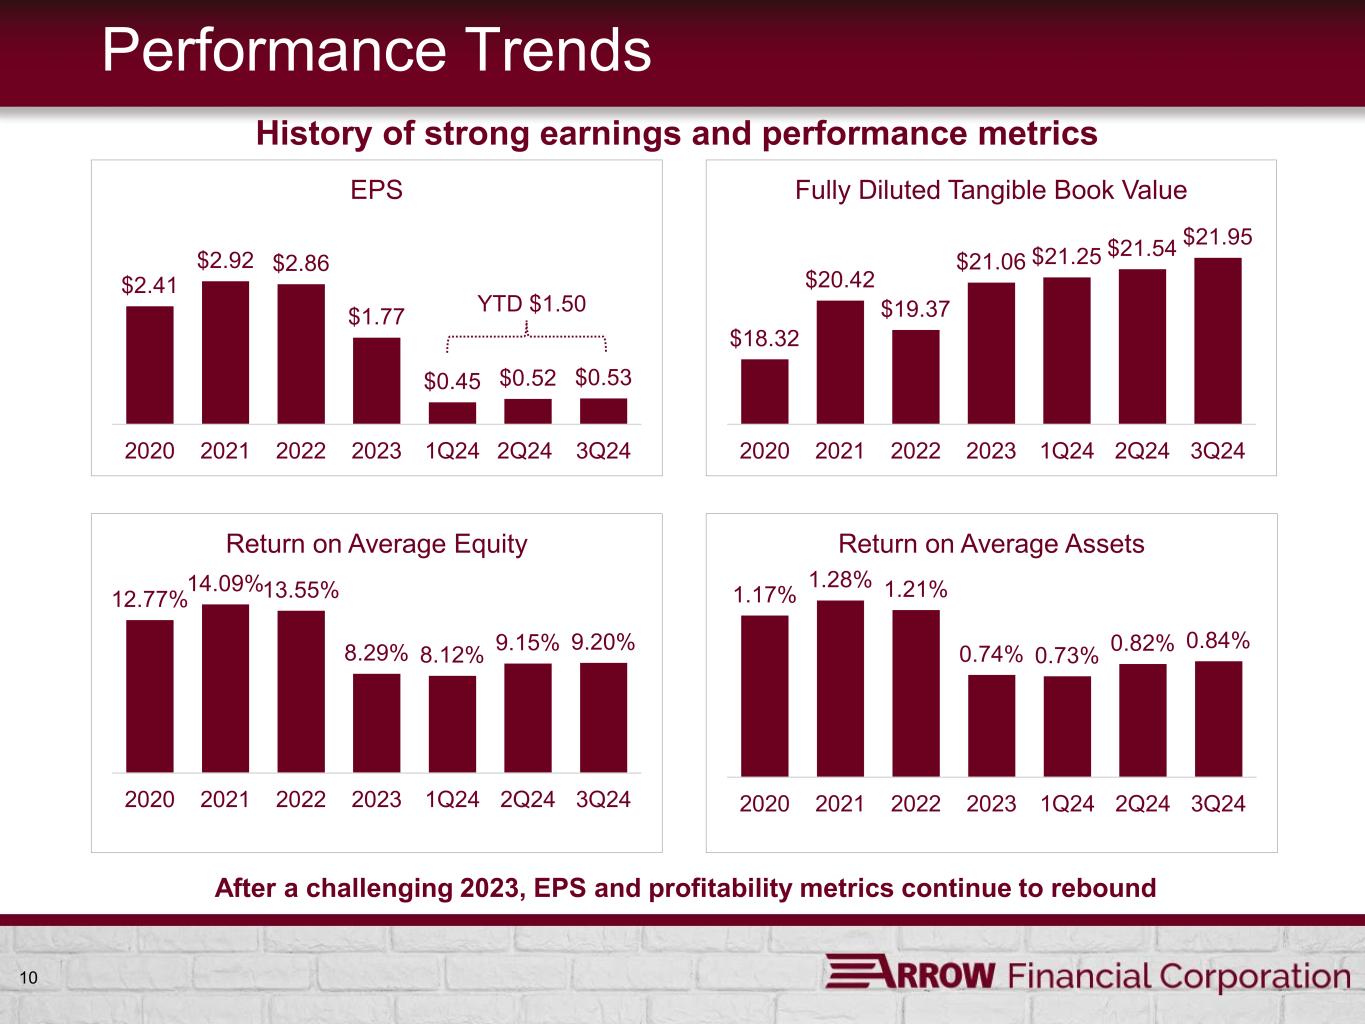
| Diluted Earnings Per Share | 0.53 | 0.52 | 0.45 | 0.46 | 0.46 | ||||||||||||||||||||||||
| Cash Dividend Per Share | 0.270 | 0.270 | 0.270 | 0.270 | 0.262 | ||||||||||||||||||||||||
| Selected Quarterly Average Balances: | |||||||||||||||||||||||||||||
| Interest-Bearing Deposits at Banks | $ | 154,937 | $ | 159,336 | $ | 178,452 | $ | 136,026 | $ | 131,814 | |||||||||||||||||||
| Investment Securities | 590,352 | 644,192 | 671,105 | 713,144 | 745,693 | ||||||||||||||||||||||||
| Loans | 3,329,873 | 3,280,285 | 3,235,841 | 3,170,262 | 3,096,240 | ||||||||||||||||||||||||
| Deposits | 3,672,128 | 3,678,957 | 3,693,325 | 3,593,949 | 3,491,028 | ||||||||||||||||||||||||
| Other Borrowed Funds | 134,249 | 131,537 | 122,033 | 149,507 | 208,527 | ||||||||||||||||||||||||
Stockholders' Equity |
387,904 | 378,256 | 379,446 | 363,753 | 362,701 | ||||||||||||||||||||||||
| Total Assets | 4,245,597 | 4,237,359 | 4,245,484 | 4,159,313 | 4,109,995 | ||||||||||||||||||||||||
| Return on Average Assets, annualized | 0.84 | % | 0.82 | % | 0.73 | % | 0.74 | % | 0.75 | % | |||||||||||||||||||
| Return on Average Equity, annualized | 9.20 | % | 9.15 | % | 8.12 | % | 8.42 | % | 8.47 | % | |||||||||||||||||||
Return on Average Tangible Equity, annualized 1 |
9.79 | % | 9.74 | % | 8.64 | % | 8.99 | % | 9.05 | % | |||||||||||||||||||
| Average Earning Assets | $ | 4,075,162 | $ | 4,083,813 | $ | 4,085,398 | $ | 4,019,432 | $ | 3,973,747 | |||||||||||||||||||
| Average Paying Liabilities | 3,085,066 | 3,127,417 | 3,108,093 | 2,985,717 | 2,920,518 | ||||||||||||||||||||||||
| Interest Income | 49,443 | 47,972 | 46,677 | 44,324 | 42,117 | ||||||||||||||||||||||||
Tax-Equivalent Adjustment 2 |
149 | 163 | 176 | 184 | 183 | ||||||||||||||||||||||||
Interest Income, Tax-Equivalent 2 |
49,592 | 48,135 | 46,853 | 44,508 | 42,117 | ||||||||||||||||||||||||
| Interest Expense | 21,005 | 20,820 | 20,222 | 18,711 | 16,764 | ||||||||||||||||||||||||
| Net Interest Income | 28,438 | 27,152 | 26,455 | 25,613 | 25,353 | ||||||||||||||||||||||||
Net Interest Income, Tax-Equivalent 2 |
28,587 | 27,315 | 26,631 | 25,797 | 25,536 | ||||||||||||||||||||||||
| Net Interest Margin, annualized | 2.78 | % | 2.67 | % | 2.60 | % | 2.53 | % | 2.53 | % | |||||||||||||||||||
Net Interest Margin, Tax-Equivalent, annualized 2 |
2.79 | % | 2.69 | % | 2.62 | % | 2.55 | % | 2.55 | % | |||||||||||||||||||
Efficiency Ratio Calculation: 3 |
|||||||||||||||||||||||||||||
| Non-Interest Expense | $ | 24,100 | $ | 23,318 | $ | 24,012 | $ | 23,190 | $ | 23,479 | |||||||||||||||||||
| Less: Intangible Asset Amortization | 78 | 40 | 41 | 43 | 43 | ||||||||||||||||||||||||
| Net Non-Interest Expense | $ | 24,022 | $ | 23,278 | $ | 23,971 | $ | 23,147 | $ | 23,436 | |||||||||||||||||||
| Net Interest Income, Tax-Equivalent | $ | 28,587 | $ | 27,315 | $ | 26,631 | $ | 25,797 | $ | 25,536 | |||||||||||||||||||
| Non-Interest Income | 8,133 | 7,856 | 7,858 | 7,484 | 8,050 | ||||||||||||||||||||||||
Less: Net Gain on Securities |
94 | 54 | 17 | 122 | 71 | ||||||||||||||||||||||||
| Net Gross Income | $ | 36,626 | $ | 35,117 | $ | 34,472 | $ | 33,159 | $ | 33,515 | |||||||||||||||||||
| Efficiency Ratio | 65.59 | % | 66.29 | % | 69.54 | % | 69.81 | % | 69.93 | % | |||||||||||||||||||
| Period-End Capital Information: | |||||||||||||||||||||||||||||
| Total Stockholders' Equity (i.e. Book Value) | $ | 393,311 | $ | 383,018 | $ | 377,986 | $ | 379,772 | $ | 360,014 | |||||||||||||||||||
Book Value per Share |
23.50 | 22.90 | 22.62 | 22.42 | 21.12 | ||||||||||||||||||||||||
| Goodwill and Other Intangible Assets, net | 25,979 | 22,800 | 22,891 | 22,983 | 23,078 | ||||||||||||||||||||||||
Tangible Book Value per Share 1 |
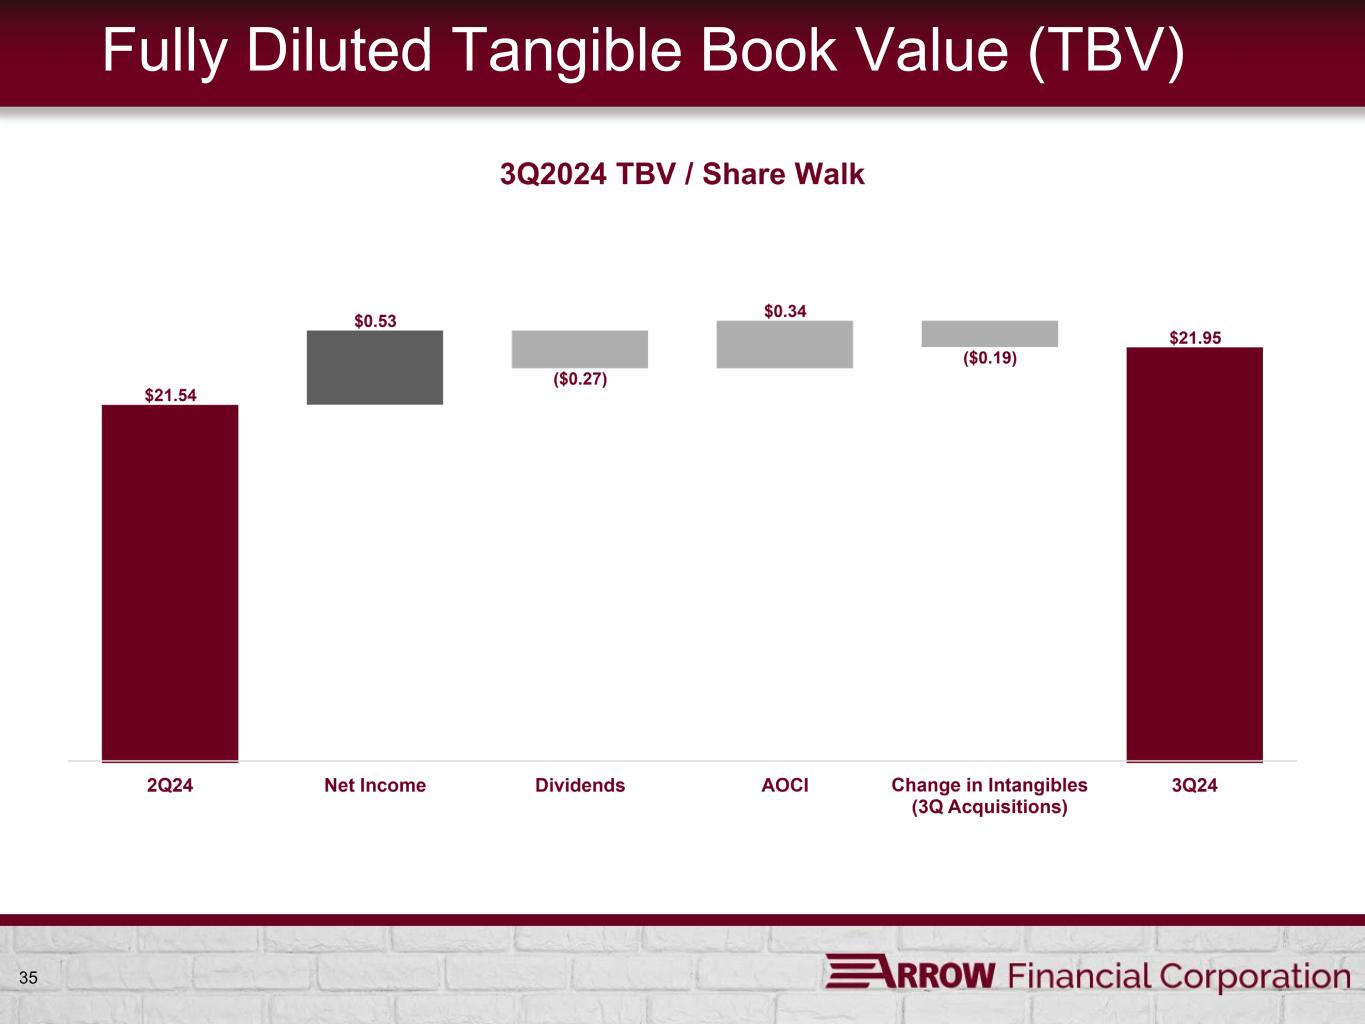
21.95 | 21.54 | 21.25 | 21.06 | 19.76 | ||||||||||||||||||||||||
Capital Ratios:4 |
|||||||||||||||||||||||||||||
| Tier 1 Leverage Ratio | 9.78 | % | 9.74 | % | 9.63 | % | 9.84 | % | 9.94 | % | |||||||||||||||||||
Common Equity Tier 1 Capital Ratio |
12.77 | % | 12.88 | % | 12.84 | % | 13.00 | % | 13.17 | % | |||||||||||||||||||
| Tier 1 Risk-Based Capital Ratio | 13.41 | % | 13.53 | % | 13.50 | % | 13.66 | % | 13.84 | % | |||||||||||||||||||
| Total Risk-Based Capital Ratio | 14.46 | % | 14.57 | % | 14.57 | % | 14.74 | % | 14.94 | % | |||||||||||||||||||
| Assets Under Trust Admin. & Investment Mgmt. | $ | 1,944,239 | $ | 1,848,349 | $ | 1,829,266 | $ | 1,763,194 | $ | 1,627,522 | |||||||||||||||||||
| Footnotes: | ||||||||||||||||||||||||||||||||
| 1. | Non-GAAP Financial Measure Reconciliation: Tangible Book Value, Tangible Equity, and Return on Tangible Equity exclude goodwill and other intangible assets, net from total equity. These are non-GAAP financial measures which Arrow believes provide investors with information that is useful in understanding its financial performance. |
|||||||||||||||||||||||||||||||
| 9/30/2024 | 6/30/2024 | 3/31/2024 | 12/31/2023 | 9/30/2023 | ||||||||||||||||||||||||||||
| Total Stockholders' Equity (GAAP) | $ | 393,311 | $ | 383,018 | $ | 377,986 | $ | 379,772 | $ | 360,014 | ||||||||||||||||||||||
| Less: Goodwill and Other Intangible assets, net | 25,979 | 22,800 | 22,891 | 22,983 | 23,078 | |||||||||||||||||||||||||||
| Tangible Equity (Non-GAAP) | $ | 367,332 | $ | 360,218 | $ | 355,095 | $ | 356,789 | $ | 336,936 | ||||||||||||||||||||||
| Period End Shares Outstanding | 16,734 | 16,723 | 16,710 | 16,942 | 17,049 | |||||||||||||||||||||||||||
| Tangible Book Value per Share (Non-GAAP) | $ | 21.95 | $ | 21.54 | $ | 21.25 | $ | 21.06 | $ | 19.76 | ||||||||||||||||||||||
| Net Income | 8,975 | 8,604 | 7,660 | 7,723 | 7,743 | |||||||||||||||||||||||||||
Return on Tangible Equity (Net Income/Tangible Equity - Annualized) |
9.79 | % | 9.74 | % | 8.64 | % | 8.99 | % | 9.05 | % | ||||||||||||||||||||||
| 2. | Non-GAAP Financial Measure Reconciliation: Net Interest Margin is the ratio of annualized tax-equivalent net interest income to average earning assets. This is also a non-GAAP financial measure which Arrow believes provides investors with information that is useful in understanding its financial performance. | |||||||||||||||||||||||||||||||
| 9/30/2024 | 6/30/2024 | 3/31/2024 | 12/31/2023 | 9/30/2023 | ||||||||||||||||||||||||||||
| Interest Income (GAAP) | $ | 49,443 | $ | 47,972 | $ | 46,677 | $ | 44,324 | $ | 42,117 | ||||||||||||||||||||||
| Add: Tax-Equivalent adjustment (Non-GAAP) |
149 | 163 | 176 | 184 | 183 | |||||||||||||||||||||||||||
| Interest Income - Tax Equivalent (Non-GAAP) |
$ | 49,592 | $ | 48,135 | $ | 46,853 | $ | 44,508 | $ | 42,300 | ||||||||||||||||||||||
| Net Interest Income (GAAP) | $ | 28,438 | $ | 27,152 | $ | 26,455 | $ | 25,613 | $ | 25,353 | ||||||||||||||||||||||
| Add: Tax-Equivalent adjustment (Non-GAAP) |
149 | 163 | 176 | 184 | 183 | |||||||||||||||||||||||||||
| Net Interest Income - Tax Equivalent (Non-GAAP) |
$ | 28,587 | $ | 27,315 | $ | 26,631 | $ | 25,797 | $ | 25,536 | ||||||||||||||||||||||
| Average Earning Assets | $ | 4,075,162 | $ | 4,083,813 | $ | 4,085,398 | $ | 4,019,432 | $ | 3,973,747 | ||||||||||||||||||||||
| Net Interest Margin (Non-GAAP)* | 2.79 | % | 2.69 | % | 2.62 | % | 2.55 | % | 2.55 | % | ||||||||||||||||||||||
| 3. | Non-GAAP Financial Measure Reconciliation: Financial Institutions often use the "efficiency ratio", a non-GAAP ratio, as a measure of expense control. Arrow believes the efficiency ratio provides investors with information that is useful in understanding its financial performance. Arrow defines efficiency ratio as the ratio of non-interest expense to net gross income (which equals tax-equivalent net interest income plus non-interest income, as adjusted). | |||||||||||||||||||||||||||||||
| 4. | For the current quarter, all of the regulatory capital ratios as well as the Total Risk-Weighted Assets are calculated in accordance with bank regulatory capital rules. The September 30, 2024 CET1 ratio listed in the tables (i.e., 12.77%) exceeds the sum of the required minimum CET1 ratio plus the fully phased-in Capital Conservation Buffer (i.e., 7.00%). |
|||||||||||||||||||||||||||||||
| 9/30/2024 | 6/30/2024 | 3/31/2024 | 12/31/2023 | 9/30/2023 | ||||||||||||||||||||||||||||
| Total Risk Weighted Assets | $ | 3,110,178 | $ | 3,072,922 | $ | 3,049,525 | $ | 3,032,188 | $ | 2,988,438 | ||||||||||||||||||||||
| Common Equity Tier 1 Capital | 397,122 | 395,691 | 391,706 | 394,166 | 393,541 | |||||||||||||||||||||||||||
| Common Equity Tier 1 Ratio | 12.77 | % | 12.88 | % | 12.84 | % | 13.00 | % | 13.17 | % | ||||||||||||||||||||||
| * Quarterly ratios have been annualized. | ||||||||||||||||||||||||||||||||
| Quarter Ended: | September 30, 2024 | September 30, 2023 | |||||||||||||||||||||||||||||||||
| Interest | Rate | Interest | Rate | ||||||||||||||||||||||||||||||||
| Average | Income/ | Earned/ | Average | Income/ | Earned/ | ||||||||||||||||||||||||||||||
| Balance | Expense | Paid | Balance | Expense | Paid | ||||||||||||||||||||||||||||||
| Interest-Bearing Deposits at Banks | $ | 154,937 | $ | 2,103 | 5.40 | % | $ | 131,814 | $ | 1,805 | 5.43 | % | |||||||||||||||||||||||
| Investment Securities: | |||||||||||||||||||||||||||||||||||
| Fully Taxable | 497,450 | 2,656 | 2.12 | 616,020 | 2,924 | 1.88 | |||||||||||||||||||||||||||||
| Exempt from Federal Taxes | 92,902 | 562 | 2.41 | 129,673 | 689 | 2.11 | |||||||||||||||||||||||||||||
Loans (1) |
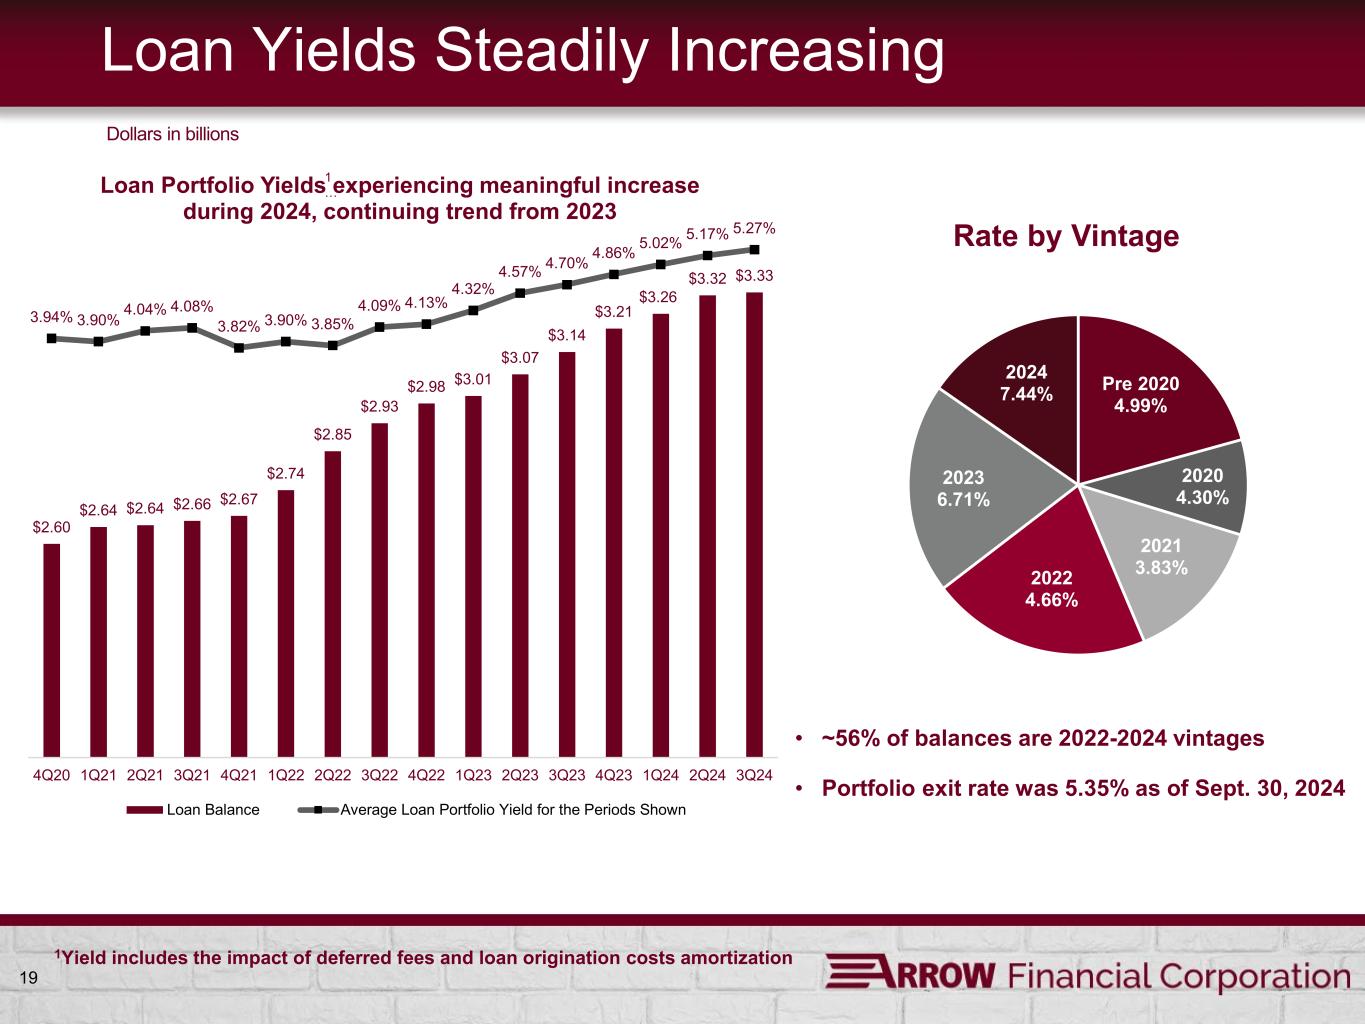
3,329,873 | 44,122 | 5.27 | 3,096,240 | 36,699 | 4.70 | |||||||||||||||||||||||||||||
Total Earning Assets (1) |
4,075,162 | 49,443 | 4.83 | 3,973,747 | 42,117 | 4.20 | |||||||||||||||||||||||||||||
| Allowance for Credit Losses | (31,147) | (31,386) | |||||||||||||||||||||||||||||||||
| Cash and Due From Banks | 33,159 | 32,874 | |||||||||||||||||||||||||||||||||
| Other Assets | 168,423 | 134,760 | |||||||||||||||||||||||||||||||||
| Total Assets | $ | 4,245,597 | $ | 4,109,995 | |||||||||||||||||||||||||||||||
| Deposits: | |||||||||||||||||||||||||||||||||||
| Interest-Bearing Checking Accounts | $ | 785,134 | 1,966 | 1.00 | $ | 795,627 | 1,156 | 0.58 | |||||||||||||||||||||||||||
| Savings Deposits | 1,492,888 | 10,905 | 2.91 | 1,505,916 | 9,729 | 2.56 | |||||||||||||||||||||||||||||
| Time Deposits of $250,000 or More | 174,028 | 1,803 | 4.12 | 152,738 | 1,466 | 3.81 | |||||||||||||||||||||||||||||
| Other Time Deposits | 498,767 | 4,934 | 3.94 | 257,710 | 2,051 | 3.16 | |||||||||||||||||||||||||||||
| Total Interest-Bearing Deposits | 2,950,817 | 19,608 | 2.64 | 2,711,991 | 14,402 | 2.11 | |||||||||||||||||||||||||||||
| Borrowings | 109,230 | 1,177 | 4.29 | 183,452 | 2,143 | 4.63 | |||||||||||||||||||||||||||||
| Junior Subordinated Obligations Issued to Unconsolidated Subsidiary Trusts | 20,000 | 173 | 3.44 | 20,000 | 173 | 3.43 | |||||||||||||||||||||||||||||
| Finance Leases | 5,019 | 47 | 3.73 | 5,075 | 46 | 3.60 | |||||||||||||||||||||||||||||
| Total Interest-Bearing Liabilities | 3,085,066 | 21,005 | 2.71 | 2,920,518 | 16,764 | 2.28 | |||||||||||||||||||||||||||||
| Noninterest-Bearing Deposits | 721,311 | 779,037 | |||||||||||||||||||||||||||||||||
| Other Liabilities | 51,316 | 47,739 | |||||||||||||||||||||||||||||||||
| Total Liabilities | 3,857,693 | 3,747,294 | |||||||||||||||||||||||||||||||||
| Stockholders’ Equity | 387,904 | 362,701 | |||||||||||||||||||||||||||||||||
| Total Liabilities and Stockholders’ Equity | $ | 4,245,597 | $ | 4,109,995 | |||||||||||||||||||||||||||||||
| Net Interest Income | $ | 28,438 | $ | 25,353 | |||||||||||||||||||||||||||||||
| Net Interest Spread | 2.12 | % | 1.92 | % | |||||||||||||||||||||||||||||||
| Net Interest Margin | 2.78 | % | 2.53 | % | |||||||||||||||||||||||||||||||
| Quarter Ended: | September 30, 2024 | June 30, 2024 | |||||||||||||||||||||||||||||||||
| Interest | Rate | Interest | Rate | ||||||||||||||||||||||||||||||||
| Average | Income/ | Earned/ | Average | Income/ | Earned/ | ||||||||||||||||||||||||||||||
| Balance | Expense | Paid | Balance | Expense | Paid | ||||||||||||||||||||||||||||||
| Interest-Bearing Deposits at Banks | $ | 154,937 | $ | 2,103 | 5.40 | % | $ | 159,336 | $ | 2,185 | 5.52 | % | |||||||||||||||||||||||
| Investment Securities: | |||||||||||||||||||||||||||||||||||
| Fully Taxable | 497,450 | 2,656 | 2.12 | 530,869 | 3,009 | 2.28 | |||||||||||||||||||||||||||||
| Exempt from Federal Taxes | 92,902 | 562 | 2.41 | 113,323 | 637 | 2.26 | |||||||||||||||||||||||||||||
Loans (1) |
3,329,873 | 44,122 | 5.27 | 3,280,285 | 42,141 | 5.17 | |||||||||||||||||||||||||||||
Total Earning Assets (1) |
4,075,162 | 49,443 | 4.83 | 4,083,813 | 47,972 | 4.72 | |||||||||||||||||||||||||||||
| Allowance for Credit Losses | (31,147) | (31,459) | |||||||||||||||||||||||||||||||||
| Cash and Due From Banks | 33,159 | 28,611 | |||||||||||||||||||||||||||||||||
| Other Assets | 168,423 | 156,394 | |||||||||||||||||||||||||||||||||
| Total Assets | $ | 4,245,597 | $ | 4,237,359 | |||||||||||||||||||||||||||||||
| Deposits: | |||||||||||||||||||||||||||||||||||
| Interest-Bearing Checking Accounts | $ | 785,134 | 1,966 | 1.00 | $ | 832,087 | 1,903 | 0.92 | |||||||||||||||||||||||||||
| Savings Deposits | 1,492,888 | 10,905 | 2.91 | 1,487,062 | 10,571 | 2.86 | |||||||||||||||||||||||||||||
| Time Deposits of $250,000 or More | 174,028 | 1,803 | 4.12 | 172,655 | 1,869 | 4.35 | |||||||||||||||||||||||||||||
| Other Time Deposits | 498,767 | 4,934 | 3.94 | 504,076 | 5,074 | 4.05 | |||||||||||||||||||||||||||||
| Total Interest-Bearing Deposits | 2,950,817 | 19,608 | 2.64 | 2,995,880 | 19,417 | 2.61 | |||||||||||||||||||||||||||||
| Borrowings | 109,230 | 1,177 | 4.29 | 106,502 | 1,186 | 4.48 | |||||||||||||||||||||||||||||
| Junior Subordinated Obligations Issued to Unconsolidated Subsidiary Trusts | 20,000 | 173 | 3.44 | 20,000 | 170 | 3.42 | |||||||||||||||||||||||||||||
| Finance Leases | 5,019 | 47 | 3.73 | 5,035 | 47 | 3.75 | |||||||||||||||||||||||||||||
| Total Interest-Bearing Liabilities | 3,085,066 | 21,005 | 2.71 | 3,127,417 | 20,820 | 2.68 | |||||||||||||||||||||||||||||
| Noninterest-Bearing Deposits | 721,311 | 683,077 | |||||||||||||||||||||||||||||||||
| Other Liabilities | 51,316 | 48,609 | |||||||||||||||||||||||||||||||||
| Total Liabilities | 3,857,693 | 3,859,103 | |||||||||||||||||||||||||||||||||
| Stockholders’ Equity | 387,904 | 378,256 | |||||||||||||||||||||||||||||||||
| Total Liabilities and Stockholders’ Equity | $ | 4,245,597 | $ | 4,237,359 | |||||||||||||||||||||||||||||||
| Net Interest Income | $ | 28,438 | $ | 27,152 | |||||||||||||||||||||||||||||||
| Net Interest Spread | 2.12 | % | 2.04 | % | |||||||||||||||||||||||||||||||
| Net Interest Margin | 2.78 | % | 2.67 | % | |||||||||||||||||||||||||||||||
| Average Consolidated Balance Sheets and Net Interest Income Analysis | |||||||||||||||||||||||||||||||||||
| (GAAP Basis) | |||||||||||||||||||||||||||||||||||
| (Dollars In Thousands) | |||||||||||||||||||||||||||||||||||
| Nine Months Ended September 30: | 2024 | 2023 | |||||||||||||||||||||||||||||||||
| Interest | Rate | Interest | Rate | ||||||||||||||||||||||||||||||||
| Average | Income/ | Earned/ | Average | Income/ | Earned/ | ||||||||||||||||||||||||||||||
| Balance | Expense | Paid | Balance | Expense | Paid | ||||||||||||||||||||||||||||||
| Interest-Bearing Deposits at Banks | $ | 164,208 | $ | 6,735 | 5.48 | % | $ | 101,104 | $ | 3,958 | 5.23 | % | |||||||||||||||||||||||
| Investment Securities: | |||||||||||||||||||||||||||||||||||
| Fully Taxable | 526,181 | 8,851 | 2.25 | 635,126 | 8,823 | 1.86 | |||||||||||||||||||||||||||||
| Exempt from Federal Taxes | 108,872 | 1,867 | 2.29 | 146,736 | 2,256 | 2.06 | |||||||||||||||||||||||||||||
Loans (1) |
3,282,175 | 126,639 | 5.15 | 3,041,909 | 103,203 | 4.54 | |||||||||||||||||||||||||||||
Total Earning Assets (1) |
4,081,436 | 144,092 | 4.72 | 3,924,875 | 118,240 | 4.03 | |||||||||||||||||||||||||||||
| Allowance for Credit Losses | (31,340) | (30,591) | |||||||||||||||||||||||||||||||||
| Cash and Due From Banks | 30,534 | 30,720 | |||||||||||||||||||||||||||||||||
| Other Assets | 162,194 | 134,310 | |||||||||||||||||||||||||||||||||
| Total Assets | $ | 4,242,824 | $ | 4,059,314 | |||||||||||||||||||||||||||||||
| Deposits: | |||||||||||||||||||||||||||||||||||
| Interest-Bearing Checking Accounts | $ | 815,933 | 5,510 | 0.90 | $ | 874,132 | 2,346 | 0.36 | |||||||||||||||||||||||||||
| Savings Deposits | 1,487,005 | 31,706 | 2.85 | 1,494,976 | 23,830 | 2.13 | |||||||||||||||||||||||||||||
| Time Deposits of $250,000 or More | 174,668 | 5,645 | 4.32 | 127,230 | 3,159 | 3.32 | |||||||||||||||||||||||||||||
| Other Time Deposits | 499,881 | 15,091 | 4.03 | 203,047 | 3,721 | 2.45 | |||||||||||||||||||||||||||||
| Total Interest-Bearing Deposits | 2,977,487 | 57,952 | 2.60 | 2,699,385 | 33,056 | 1.64 | |||||||||||||||||||||||||||||
| Borrowings | 104,257 | 3,439 | 4.41 | 151,887 | 5,309 | 4.67 | |||||||||||||||||||||||||||||
| Junior Subordinated Obligations Issued to Unconsolidated Subsidiary Trusts | 20,000 | 514 | 3.43 | 20,000 | 513 | 3.43 | |||||||||||||||||||||||||||||
| Finance Leases | 5,034 | 142 | 3.77 | 5,088 | 143 | 3.76 | |||||||||||||||||||||||||||||
| Total Interest-Bearing Liabilities | 3,106,778 | 62,047 | 2.67 | 2,876,360 | 39,021 | 1.81 | |||||||||||||||||||||||||||||
| Noninterest-Bearing Deposits | 703,948 | 777,994 | |||||||||||||||||||||||||||||||||
| Other Liabilities | 50,207 | 42,506 | |||||||||||||||||||||||||||||||||
| Total Liabilities | 3,860,933 | 3,696,860 | |||||||||||||||||||||||||||||||||
| Stockholders’ Equity | 381,891 | 362,454 | |||||||||||||||||||||||||||||||||
| Total Liabilities and Stockholders’ Equity | $ | 4,242,824 | $ | 4,059,314 | |||||||||||||||||||||||||||||||
| Net Interest Income | $ | 82,045 | $ | 79,219 | |||||||||||||||||||||||||||||||
| Net Interest Spread | 2.05 | % | 2.22 | % | |||||||||||||||||||||||||||||||
| Net Interest Margin | 2.69 | % | 2.70 | % | |||||||||||||||||||||||||||||||
| Quarter Ended: | 9/30/2024 | 12/31/2023 | 9/30/2023 | ||||||||||||||
| Loan Portfolio | |||||||||||||||||
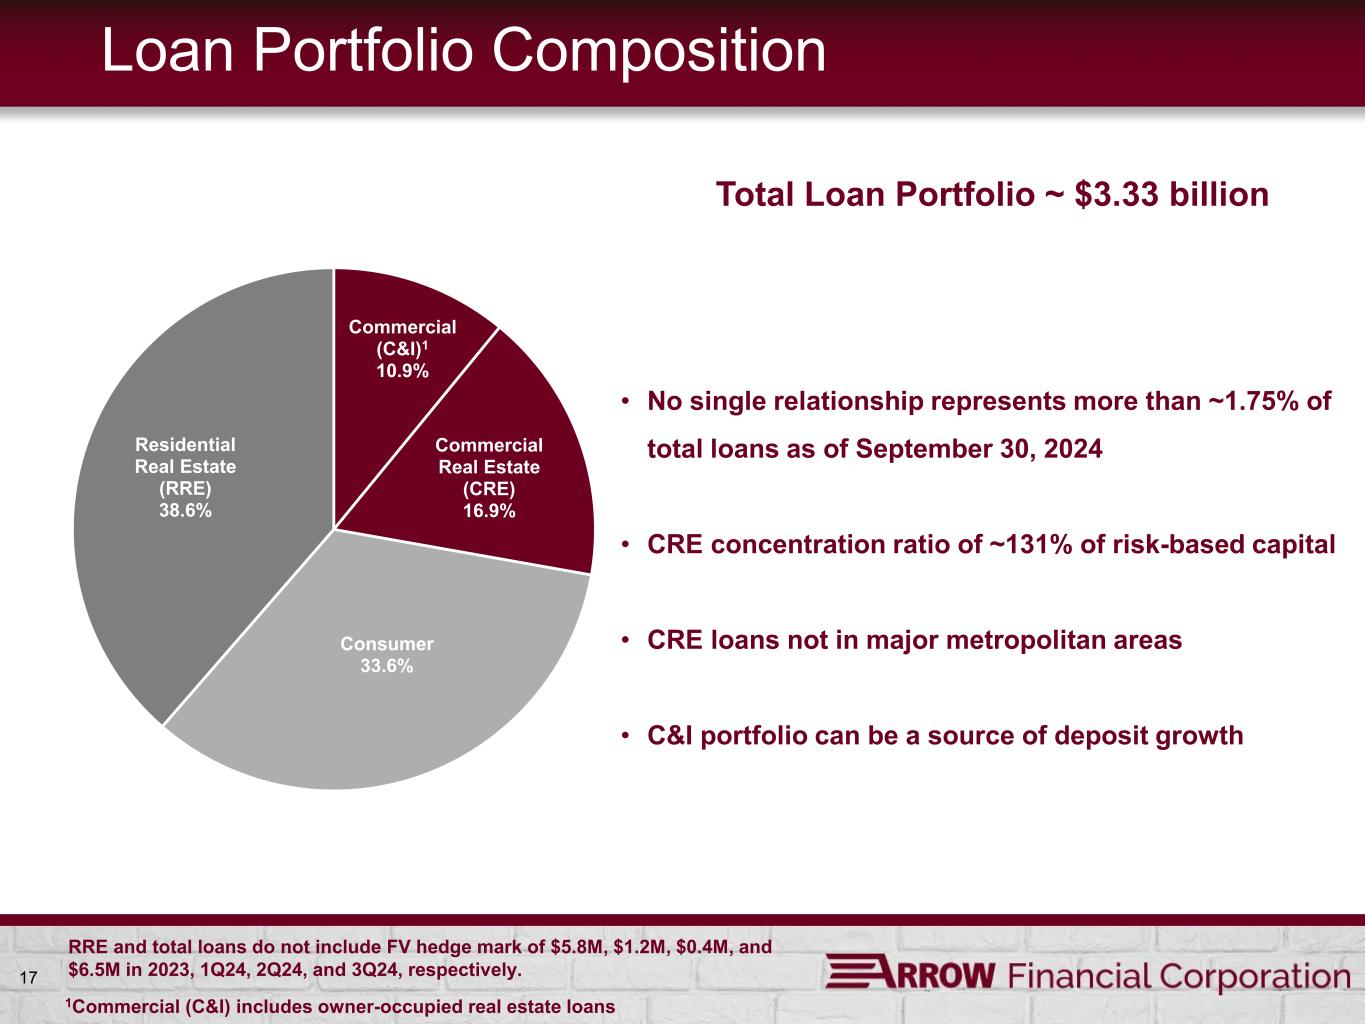
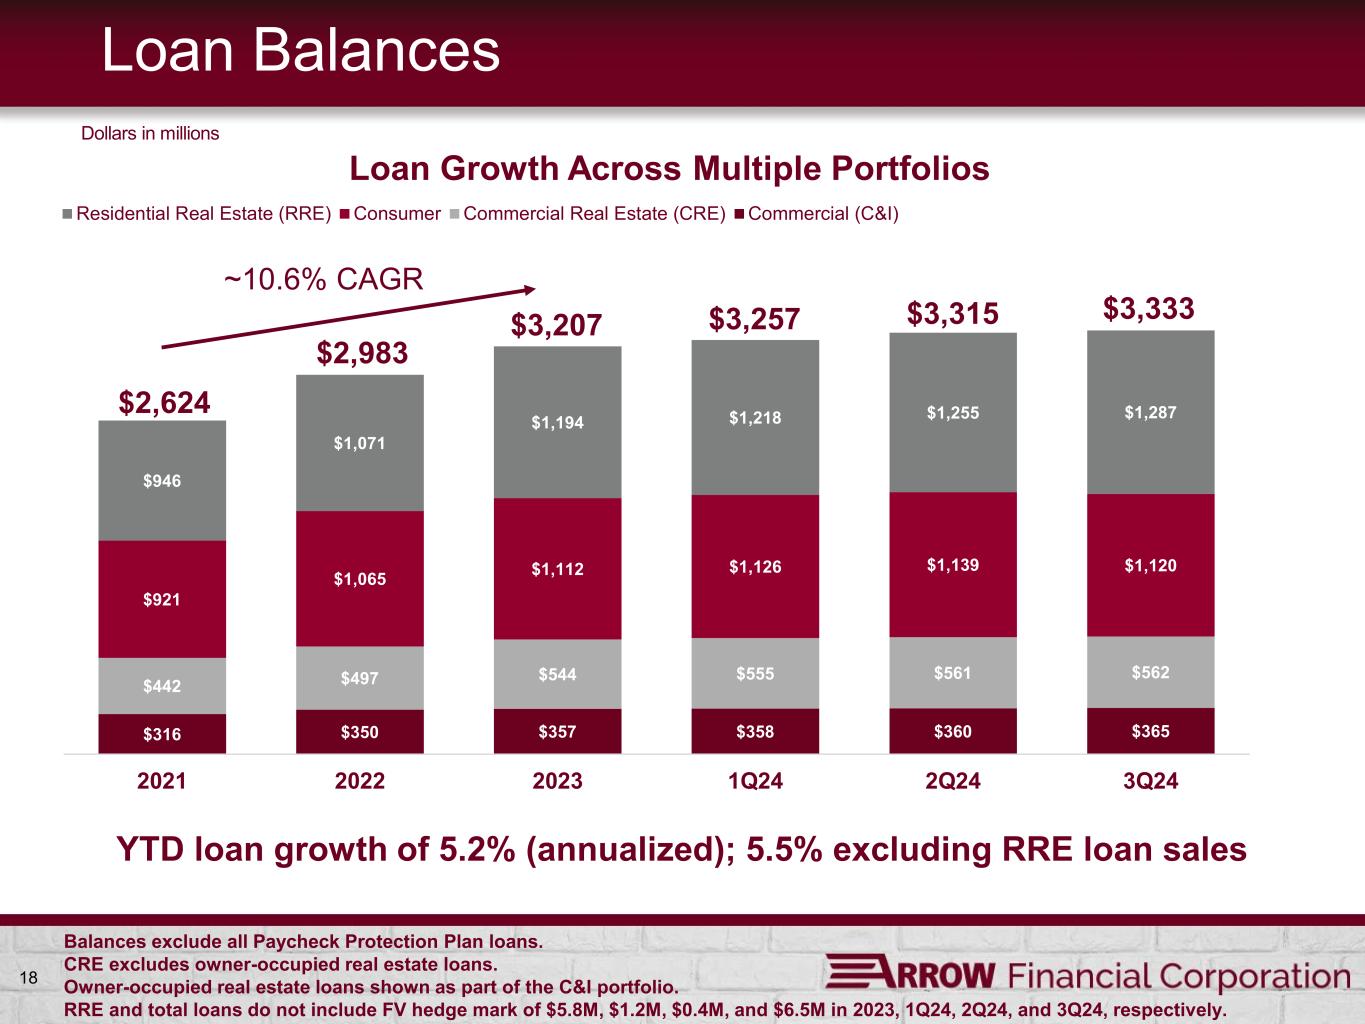
| Commercial Loans | $ | 169,884 | $ | 156,224 | $ | 148,066 | |||||||||||
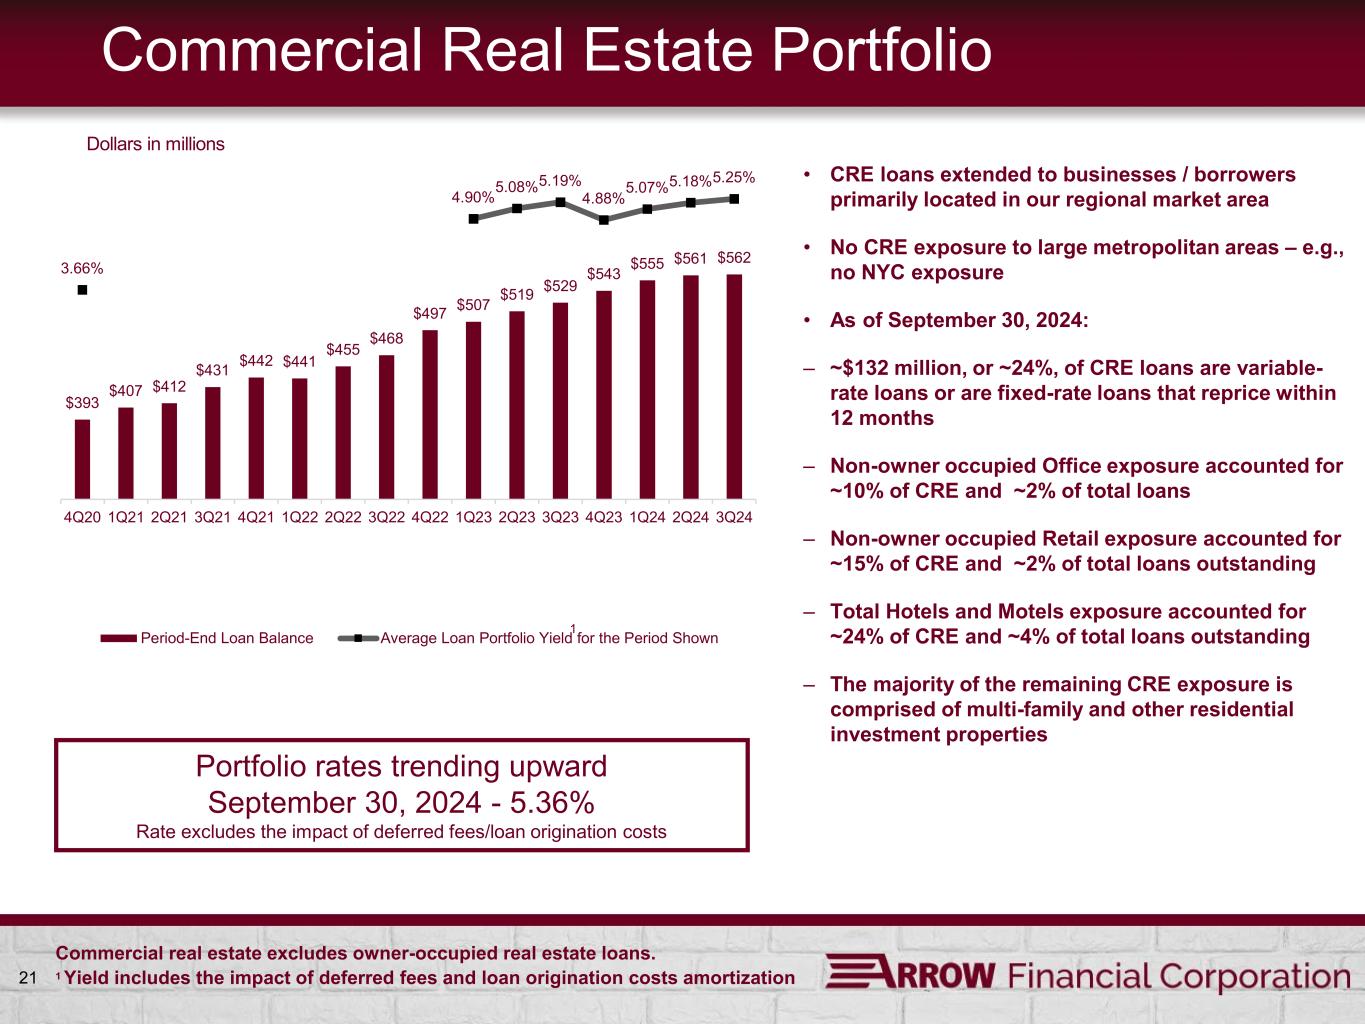
| Commercial Real Estate Loans | 756,420 | 745,487 | 734,604 | ||||||||||||||
| Subtotal Commercial Loan Portfolio | 926,304 | 901,711 | 882,670 | ||||||||||||||
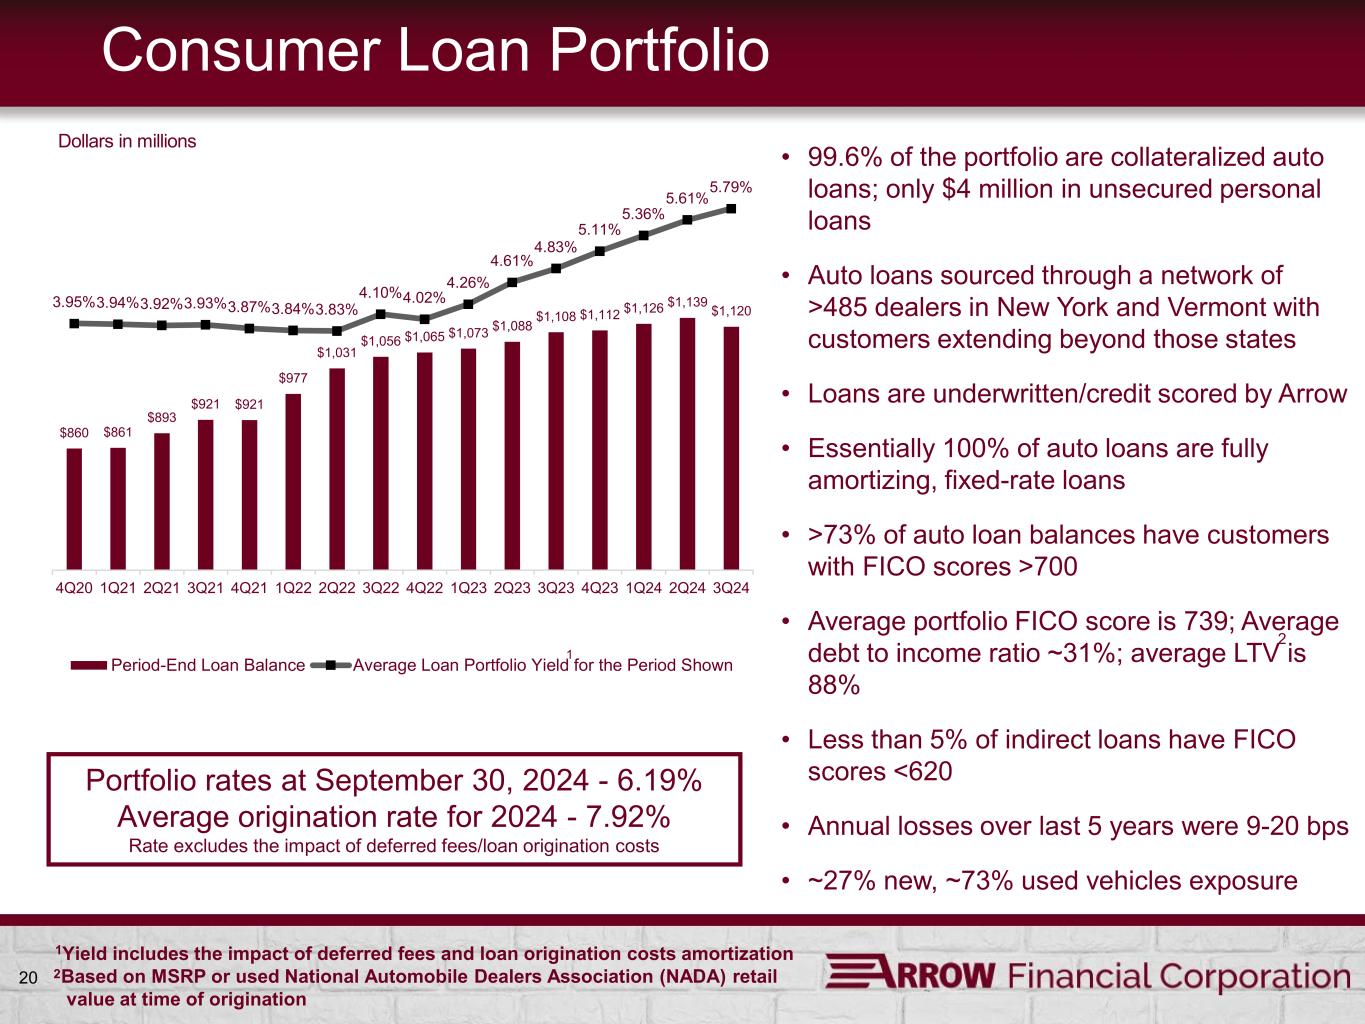
| Consumer Loans | 1,120,241 | 1,111,667 | 1,107,638 | ||||||||||||||
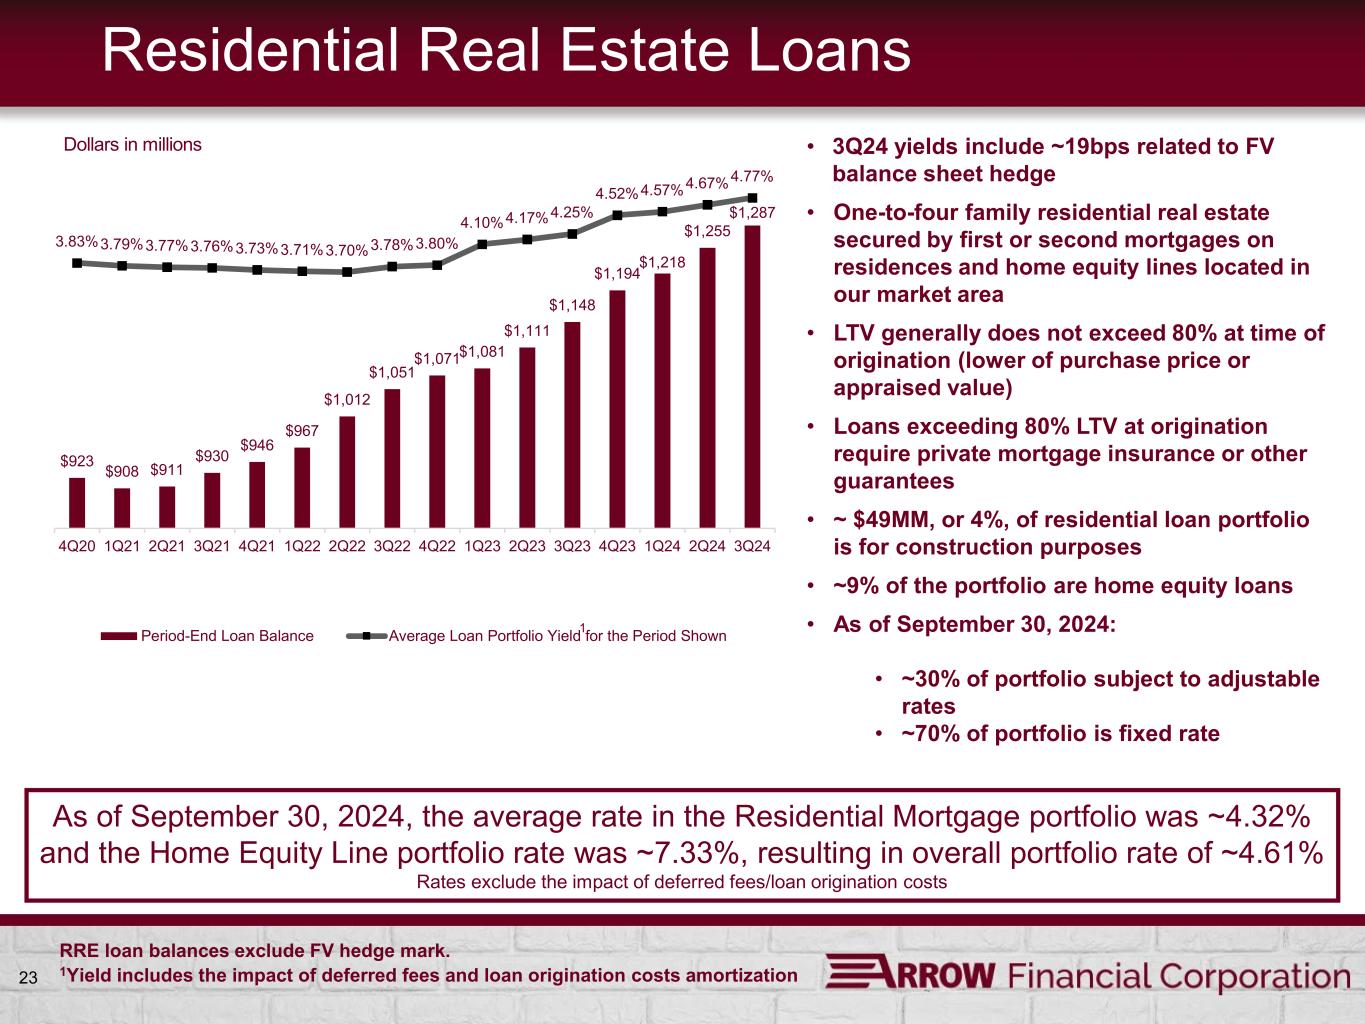
| Residential Real Estate Loans | 1,293,392 | 1,199,530 | 1,148,309 | ||||||||||||||
| Total Loans | $ | 3,339,937 | $ | 3,212,908 | $ | 3,138,617 | |||||||||||
| Allowance for Credit Losses | |||||||||||||||||
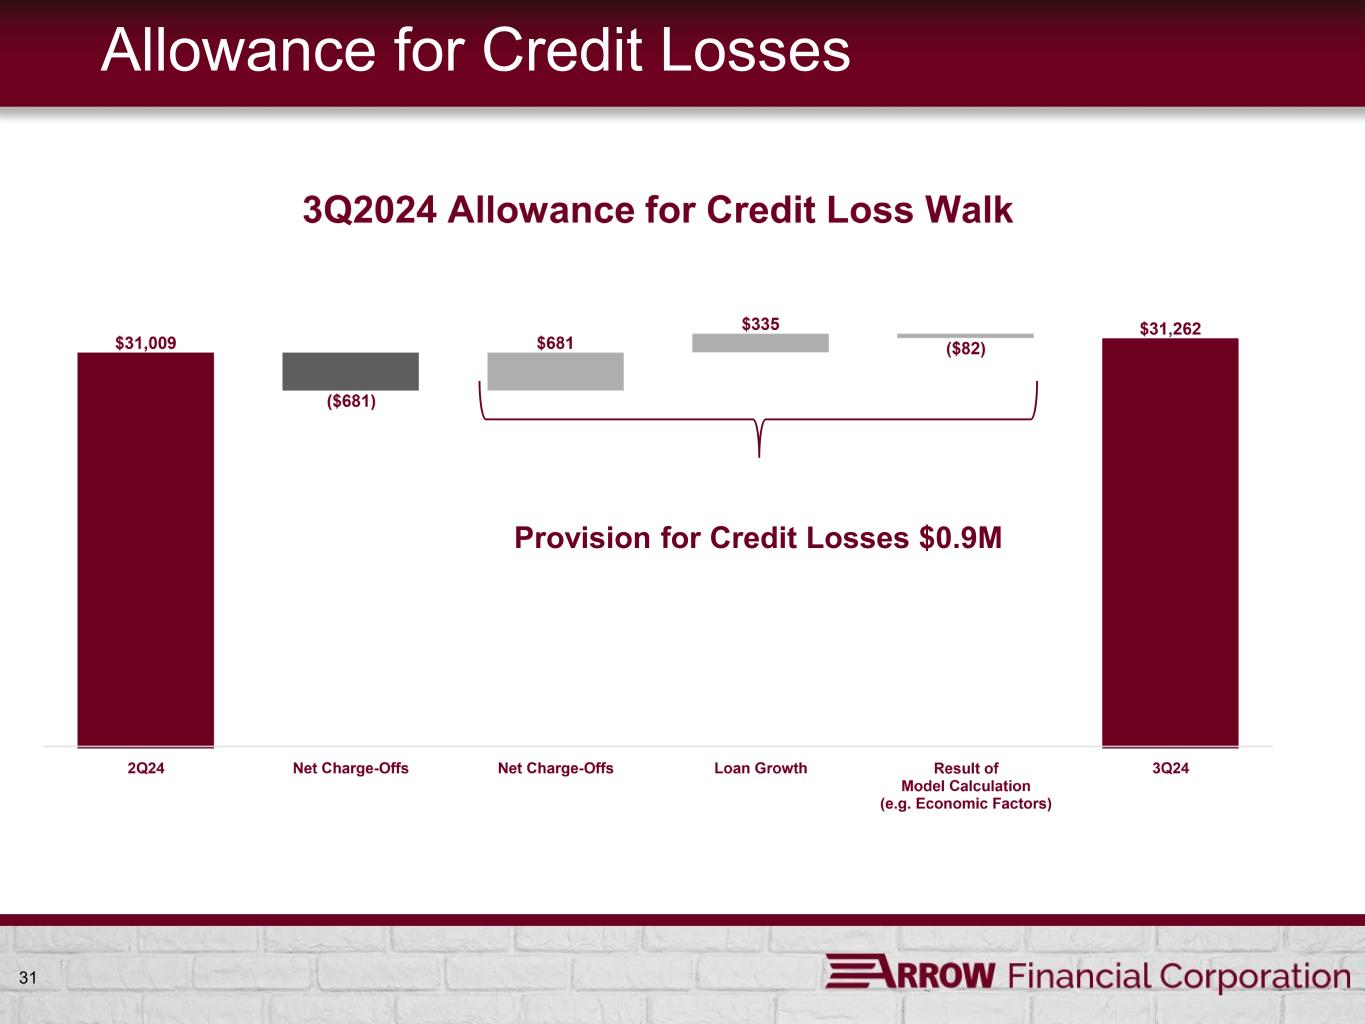
| Allowance for Credit Losses, Beginning of Quarter | $ | 31,009 | $ | 31,112 | $ | 31,170 | |||||||||||
| Loans Charged-off | (1,429) | (1,366) | (1,204) | ||||||||||||||
| Less Recoveries of Loans Previously Charged-off | 748 | 994 | 792 | ||||||||||||||
| Net Loans Charged-off | (681) | (372) | (412) | ||||||||||||||
| Provision for Credit Losses | 934 | 525 | 354 | ||||||||||||||
| Allowance for Credit Losses, End of Quarter | $ | 31,262 | $ | 31,265 | $ | 31,112 | |||||||||||
| Nonperforming Assets | |||||||||||||||||
| Nonaccrual Loans | $ | 21,047 | $ | 20,645 | $ | 6,023 | |||||||||||
| Loans Past Due 90 or More Days and Accruing | 816 | 452 | 251 | ||||||||||||||
| Loans Restructured and in Compliance with Modified Terms | 30 | 54 | 60 | ||||||||||||||
| Total Nonperforming Loans | 21,893 | 21,151 | 6,334 | ||||||||||||||
| Repossessed Assets | 322 | 312 | 344 | ||||||||||||||
| Other Real Estate Owned | 76 | — | 182 | ||||||||||||||
| Total Nonperforming Assets | $ | 22,291 | $ | 21,463 | $ | 6,860 | |||||||||||
| Key Asset Quality Ratios | |||||||||||||||||
| Net Loans Charged-off to Average Loans, Quarter-to-date Annualized |
0.08 | % | 0.05 | % | 0.05 | % | |||||||||||
| Provision for Credit Losses to Average Loans, Quarter-to-date Annualized |
0.11 | % | 0.07 | % | 0.05 | % | |||||||||||
| Allowance for Credit Losses to Period-End Loans | 0.94 | % | 0.97 | % | 0.99 | % | |||||||||||
| Allowance for Credit Losses to Period-End Nonperforming Loans | 142.79 | % | 147.82 | % | 491.19 | % | |||||||||||
| Nonperforming Loans to Period-End Loans | 0.66 | % | 0.66 | % | 0.20 | % | |||||||||||
| Nonperforming Assets to Period-End Assets | 0.51 | % | 0.51 | % | 0.16 | % | |||||||||||
| Year-to-Date Period Ended: | 9/30/2024 | 12/31/2023 | 9/30/2023 | ||||||||||||||
| Allowance for Credit Losses | |||||||||||||||||
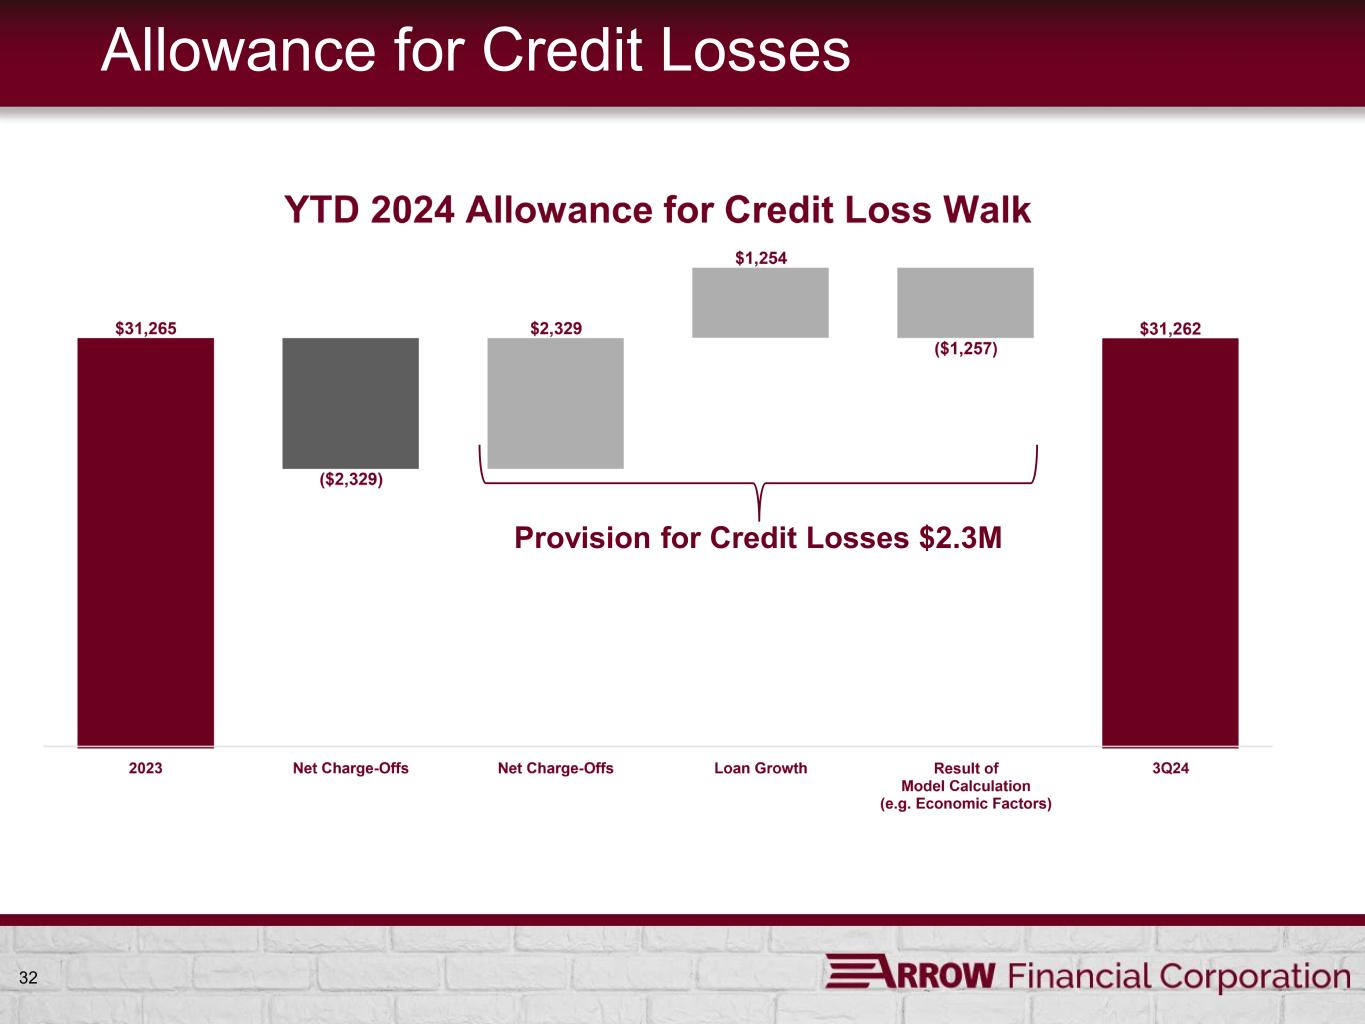
| Allowance for Credit Losses, Beginning of Year | $ | 31,265 | $ | 29,952 | $ | 29,952 | |||||||||||
| Loans Charged-off | (4,562) | (5,177) | (3,812) | ||||||||||||||
| Less Recoveries of Loans Previously Charged-off | 2,233 | 3,109 | 2,116 | ||||||||||||||
| Net Loans Charged-off | (2,329) | (2,068) | (1,696) | ||||||||||||||
| Provision for Credit Losses | 2,326 | 3,381 | 2,856 | ||||||||||||||
| Allowance for Credit Losses, End of Period | $ | 31,262 | $ | 31,265 | $ | 31,112 | |||||||||||
| Key Asset Quality Ratios | |||||||||||||||||
| Net Loans Charged-off to Average Loans, Annualized | 0.09 | % | 0.07 | % | 0.07 | % | |||||||||||
| Provision for Loan Losses to Average Loans, Annualized | 0.09 | % | 0.11 | % | 0.13 | % | |||||||||||

