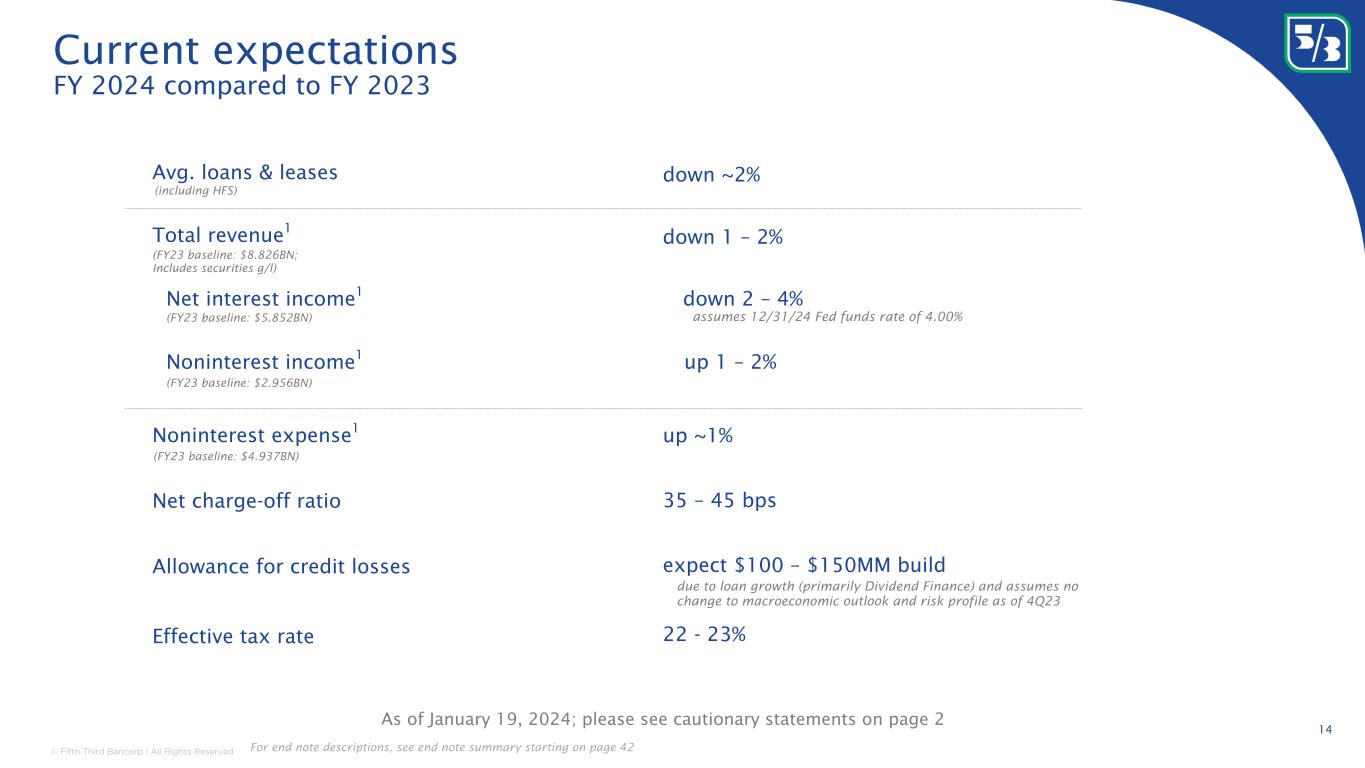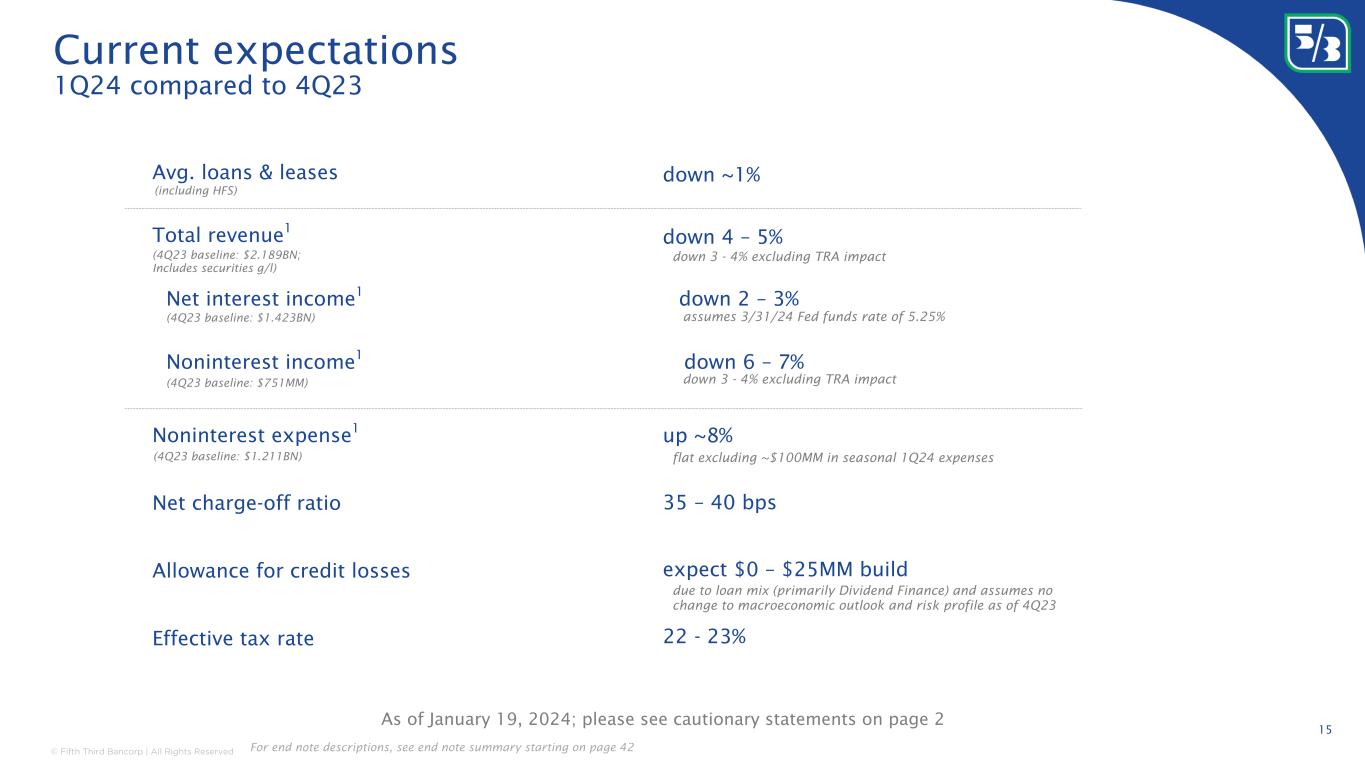
| Ohio | 001-33653 | 31-0854434 | ||||||||||||
| (State or other jurisdiction of incorporation) |
(Commission File Number) |
(IRS Employer Identification No.) |
||||||||||||
| Fifth Third Center | ||||||||||||||||||||
| 38 Fountain Square Plaza | , | Cincinnati | , | Ohio | 45263 | |||||||||||||||
| (Address of Principal Executive Offices) | (Zip Code) | |||||||||||||||||||
| Securities registered pursuant to Section 12(b) of the Act: | ||||||||||||||||||||
| Title of each class | Trading Symbol(s) |
Name of each exchange on which registered |
||||||||||||||||||
| Common Stock, Without Par Value | FITB | The | NASDAQ | Stock Market LLC | ||||||||||||||||
| Depositary Shares Representing a 1/1000th Ownership Interest in a Share of 6.625% Fixed-to-Floating Rate Non-Cumulative Perpetual Preferred Stock, Series I | FITBI | The | NASDAQ | Stock Market LLC | ||||||||||||||||
| Depositary Shares Representing a 1/40th Ownership Interest in a Share of 6.00% Non-Cumulative Perpetual Class B Preferred Stock, Series A | FITBP | The | NASDAQ | Stock Market LLC | ||||||||||||||||
| Depositary Shares Representing a 1/1000th Ownership Interest in a Share of 4.95% Non-Cumulative Perpetual Preferred Stock, Series K | FITBO | The | NASDAQ | Stock Market LLC | ||||||||||||||||
| FIFTH THIRD BANCORP | ||||||||
| (Registrant) | ||||||||
Date: January 19, 2024 |
/s/ Bryan D. Preston | |||||||
| Bryan D. Preston | ||||||||
| Executive Vice President and Chief Financial Officer |
||||||||

| Key Financial Data | Key Highlights | |||||||||||||||||||||||||||||||
| $ in millions for all balance sheet and income statement items | ||||||||||||||||||||||||||||||||
4Q23 |
3Q23 |
4Q22 |
Stability:
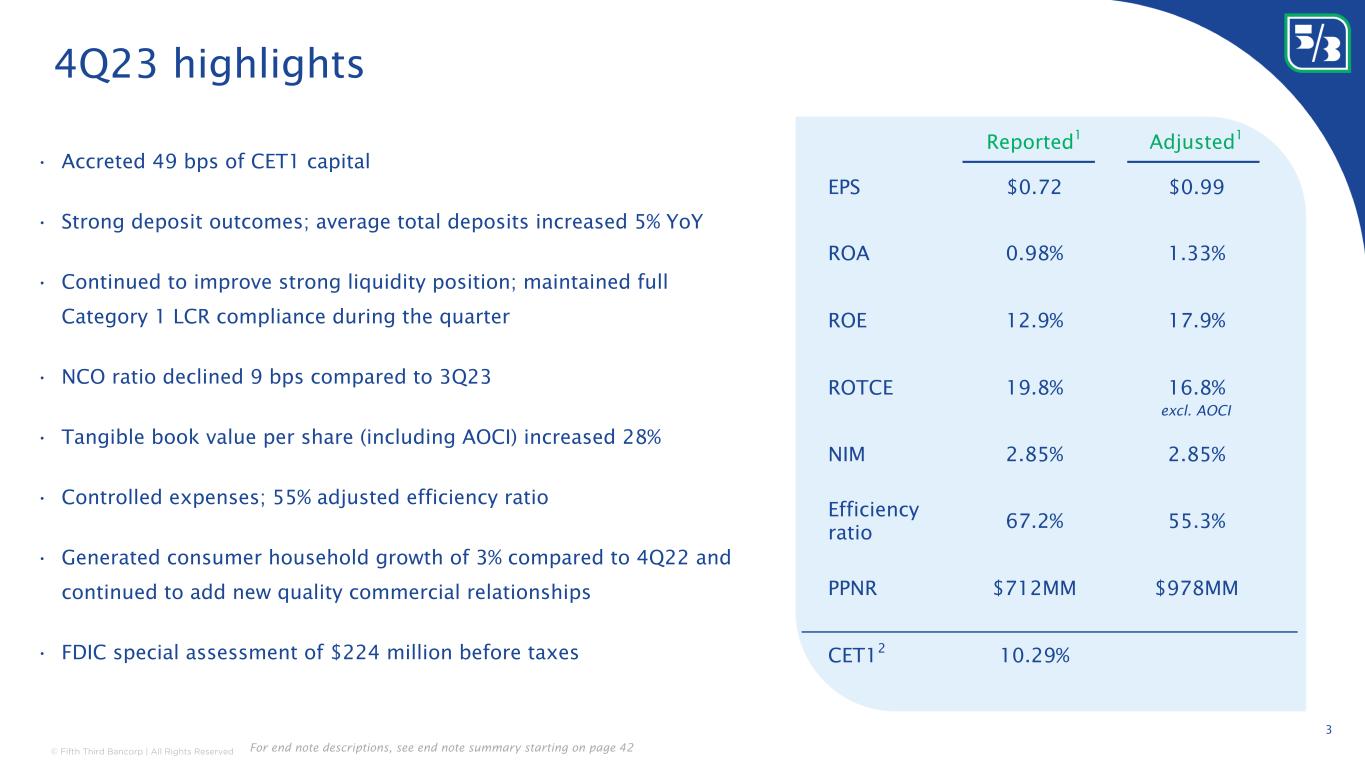
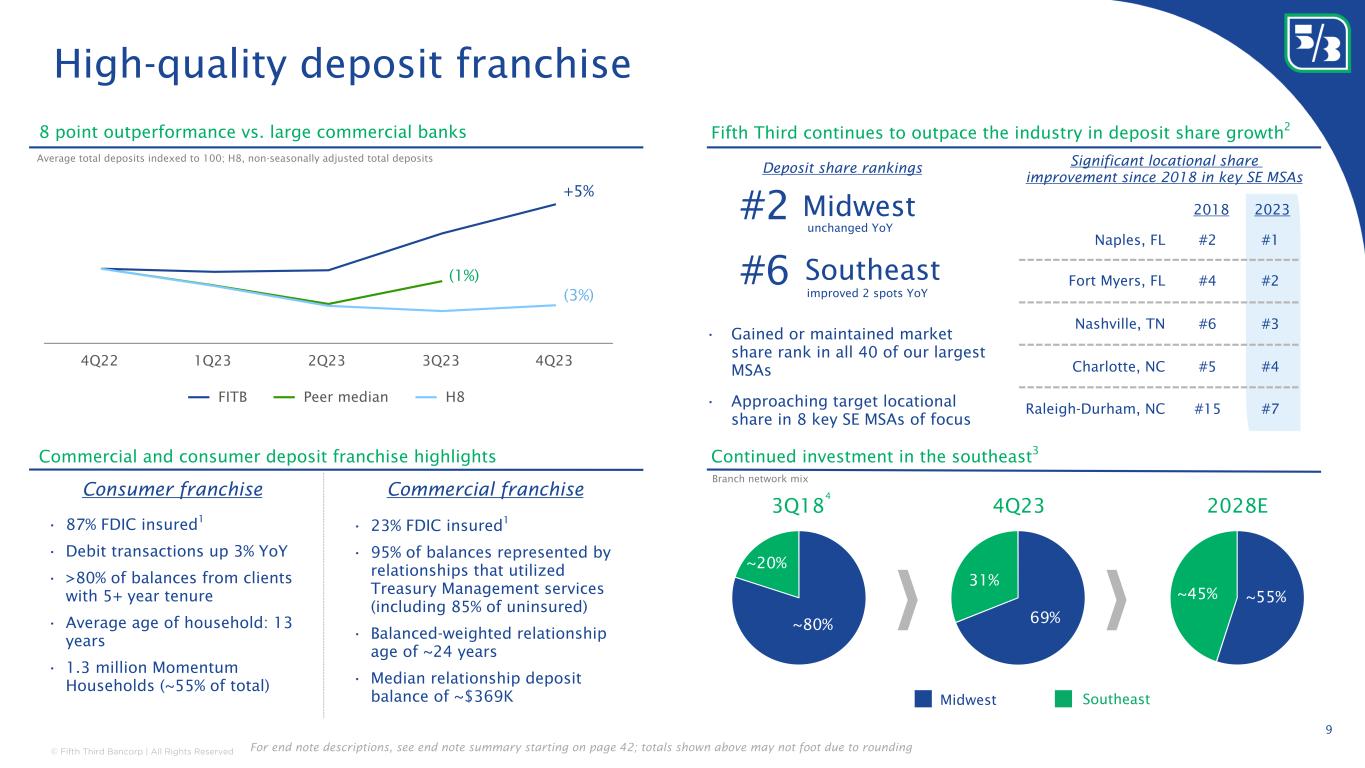
•Average deposits increased 2% compared to 3Q23; increased 5% compared to 4Q22
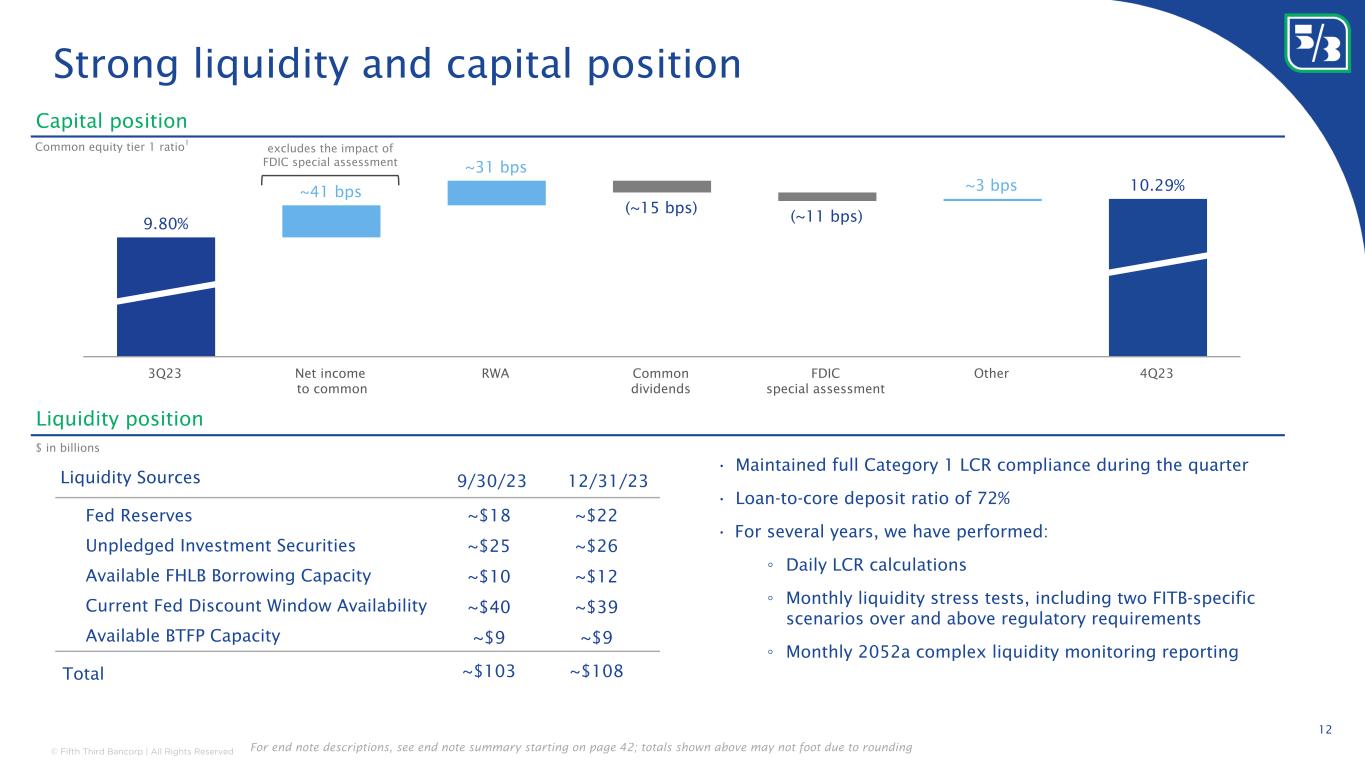
•Maintained full Category 1 LCR compliance during the quarter and achieved a loan-to-core deposit ratio of 72%
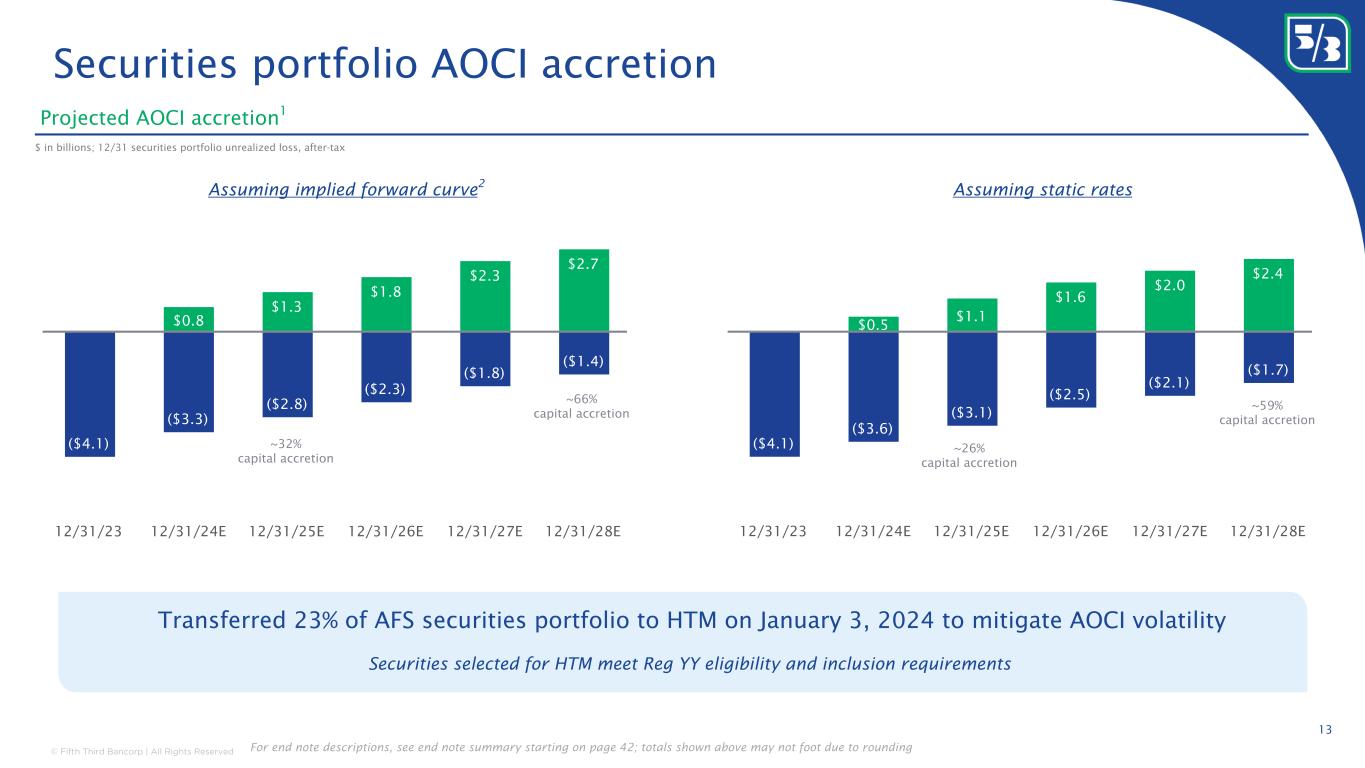
•Transferred 23% of AFS securities portfolio to HTM on January 3, 2024
•CET1 capital increased 49 bps sequentially to 10.29% reflecting strong earnings power and balance sheet optimization efforts
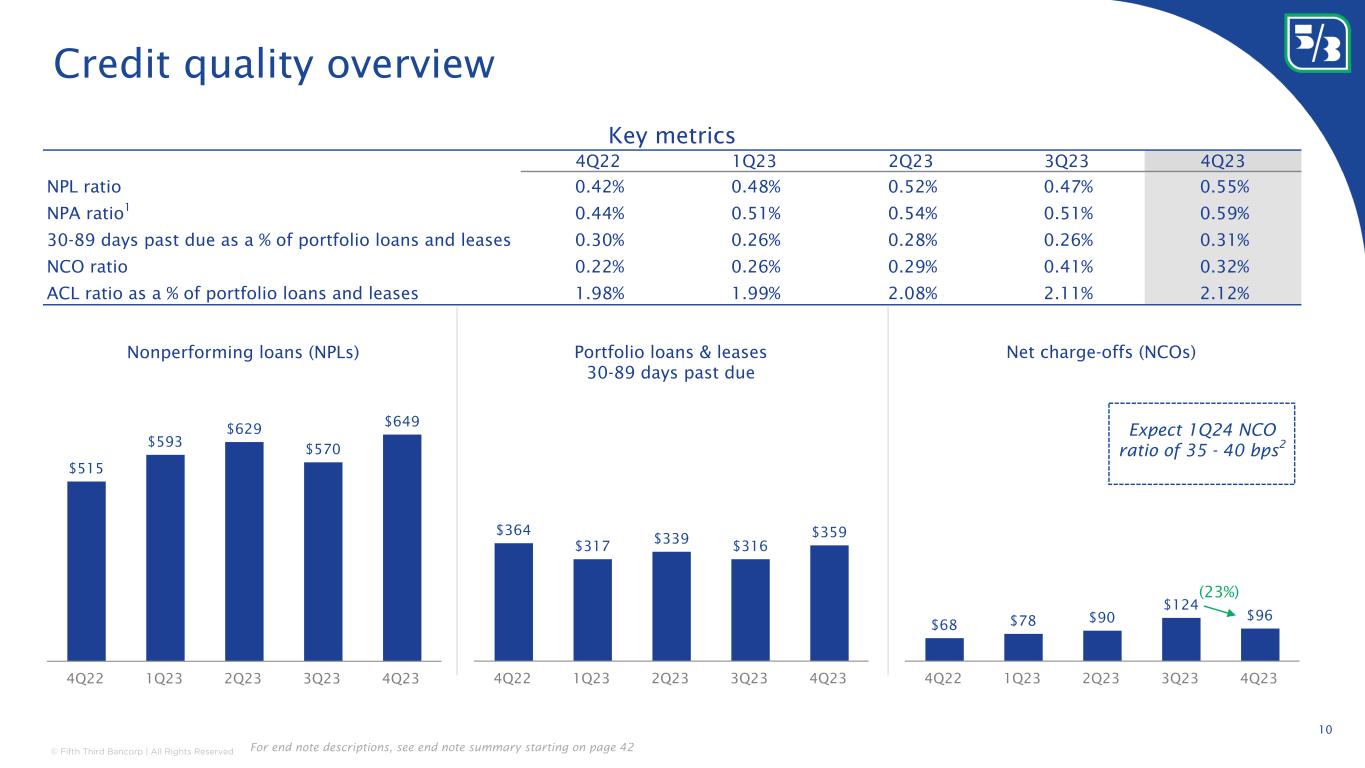
•NCO ratio declined 9 bps compared to 3Q23
Profitability:
Compared to 3Q23
•Adjusted ROTCE ex. AOCI(a) of 16.8% increased 90 basis points
•Adjusted efficiency ratio(a) of 55.3%
•Tangible book value per share (including AOCI) increased 28%
Growth:
•Generated consumer household growth of 3% compared to 4Q22
•Opened 19 branches during the quarter, 18 of which are in high-growth Southeast markets
|
|||||||||||||||||||||||||||||
| Income Statement Data | ||||||||||||||||||||||||||||||||
| Net income available to common shareholders | $492 | $623 | $699 | |||||||||||||||||||||||||||||
| Net interest income (U.S. GAAP) | 1,416 | 1,438 | 1,577 | |||||||||||||||||||||||||||||
Net interest income (FTE)(a) |
1,423 | 1,445 | 1,582 | |||||||||||||||||||||||||||||
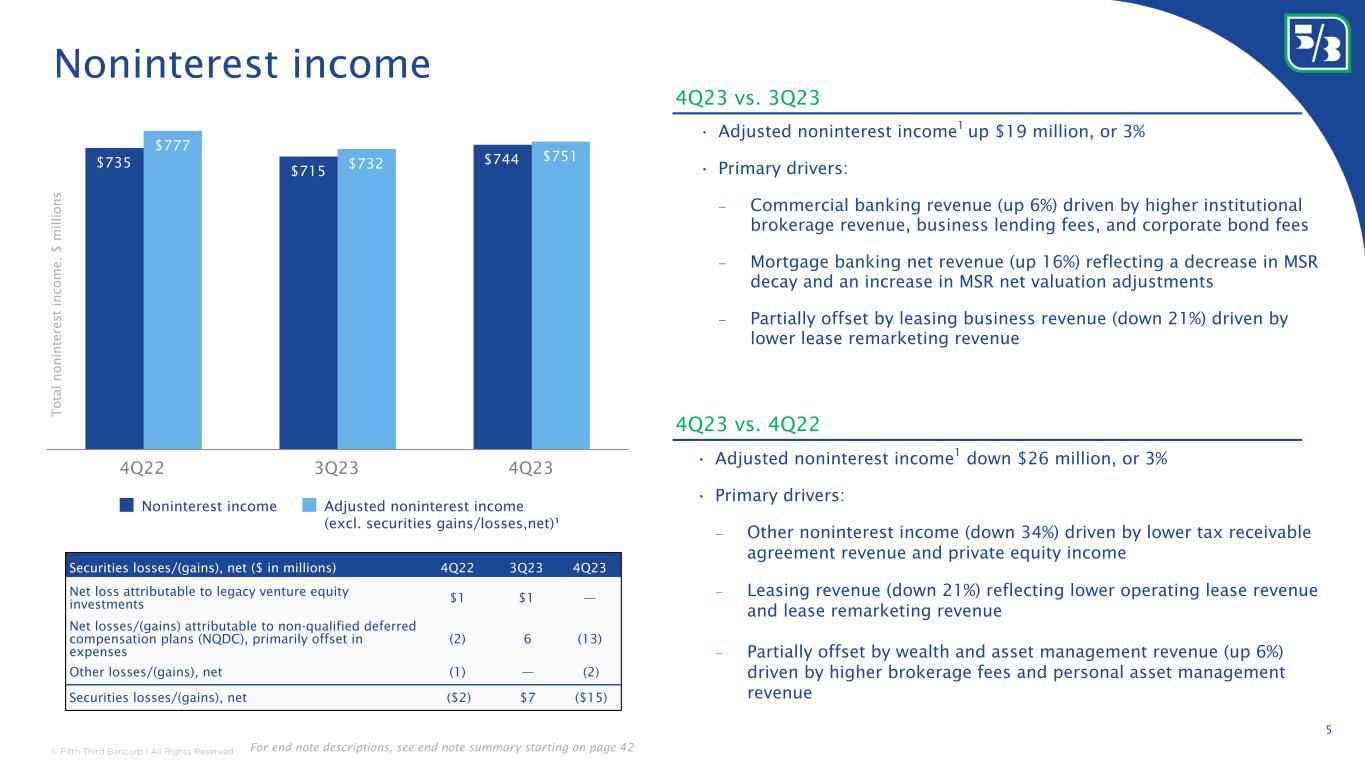
| Noninterest income | 744 | 715 | 735 | |||||||||||||||||||||||||||||
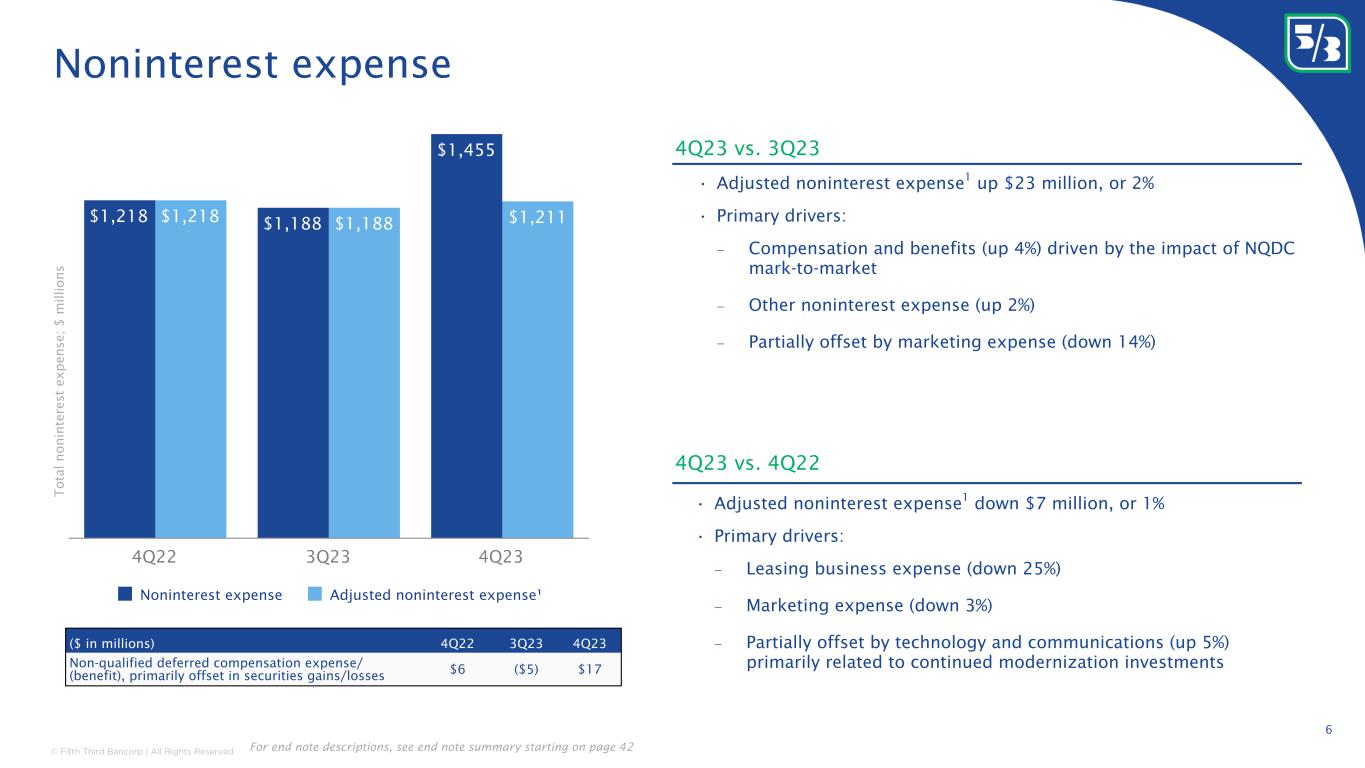
| Noninterest expense | 1,455 | 1,188 | 1,218 | |||||||||||||||||||||||||||||
| Per Share Data | ||||||||||||||||||||||||||||||||
| Earnings per share, basic | $0.72 | $0.91 | $1.01 | |||||||||||||||||||||||||||||
| Earnings per share, diluted | 0.72 | 0.91 | 1.01 | |||||||||||||||||||||||||||||
| Book value per share | 25.04 | 21.19 | 22.26 | |||||||||||||||||||||||||||||
Tangible book value per share(a) |
17.64 | 13.76 | 14.83 | |||||||||||||||||||||||||||||
| Balance Sheet & Credit Quality | ||||||||||||||||||||||||||||||||
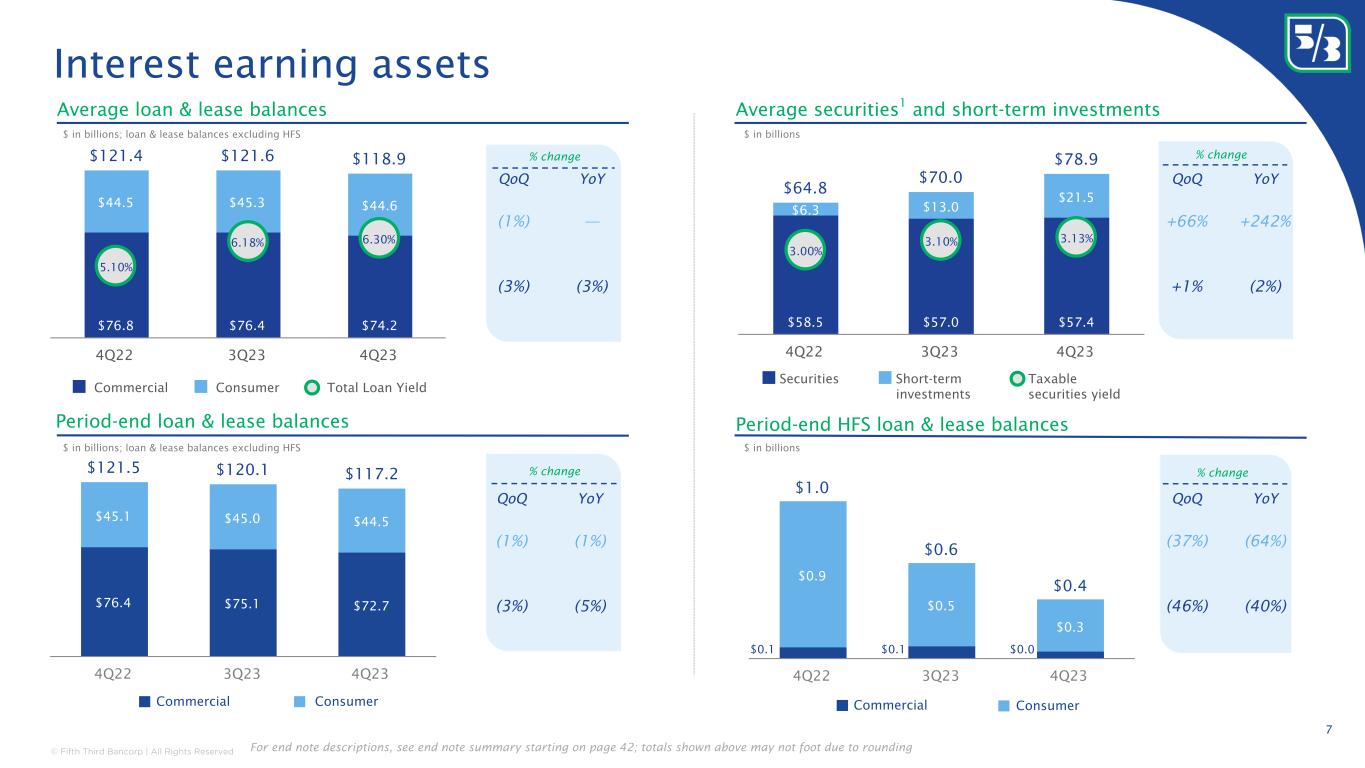
| Average portfolio loans and leases | $118,858 | $121,630 | $121,371 | |||||||||||||||||||||||||||||
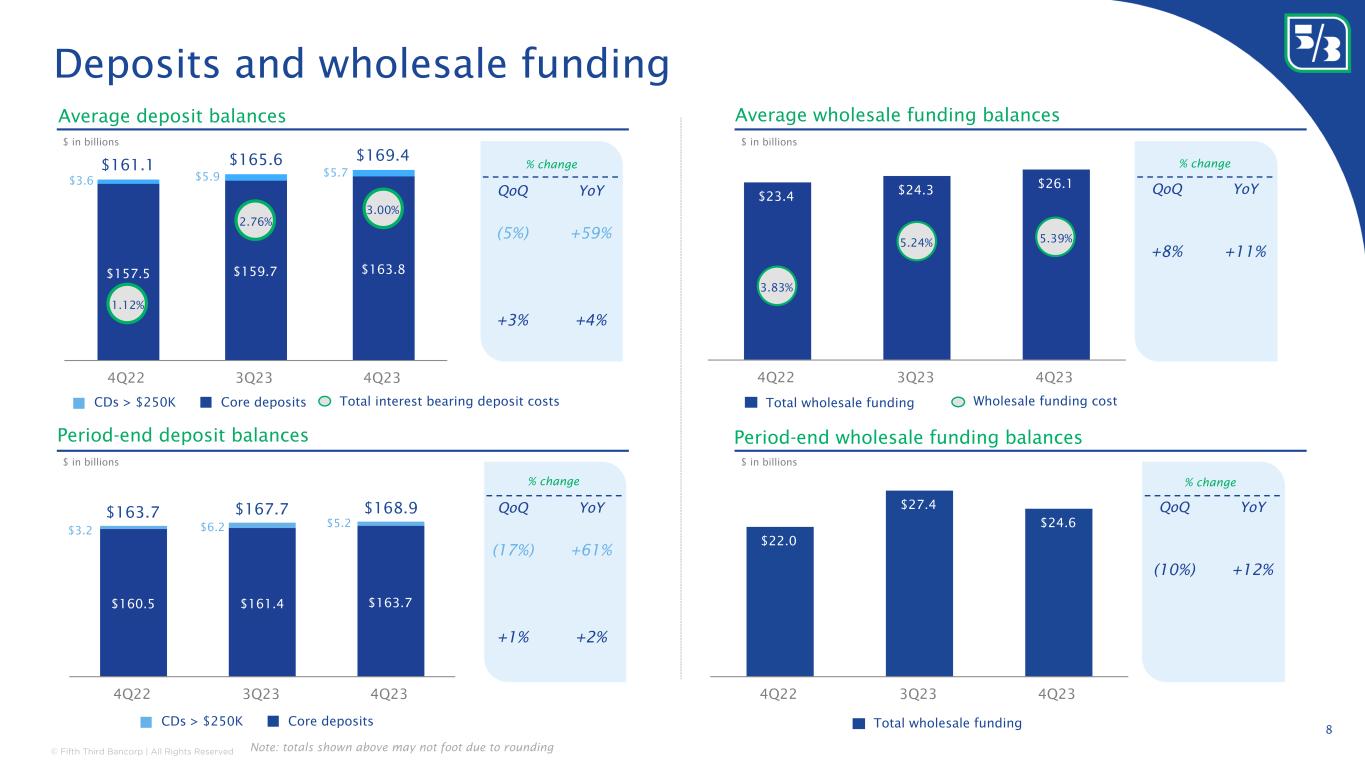
| Average deposits | 169,447 | 165,644 | 161,061 | |||||||||||||||||||||||||||||
| Accumulated other comprehensive loss | (4,487) | (6,839) | (5,110) | |||||||||||||||||||||||||||||
Net charge-off ratio(b) |
0.32 | % | 0.41 | % | 0.22 | % | ||||||||||||||||||||||||||
Nonperforming asset ratio(c) |
0.59 | 0.51 | 0.44 | |||||||||||||||||||||||||||||
| Financial Ratios | ||||||||||||||||||||||||||||||||
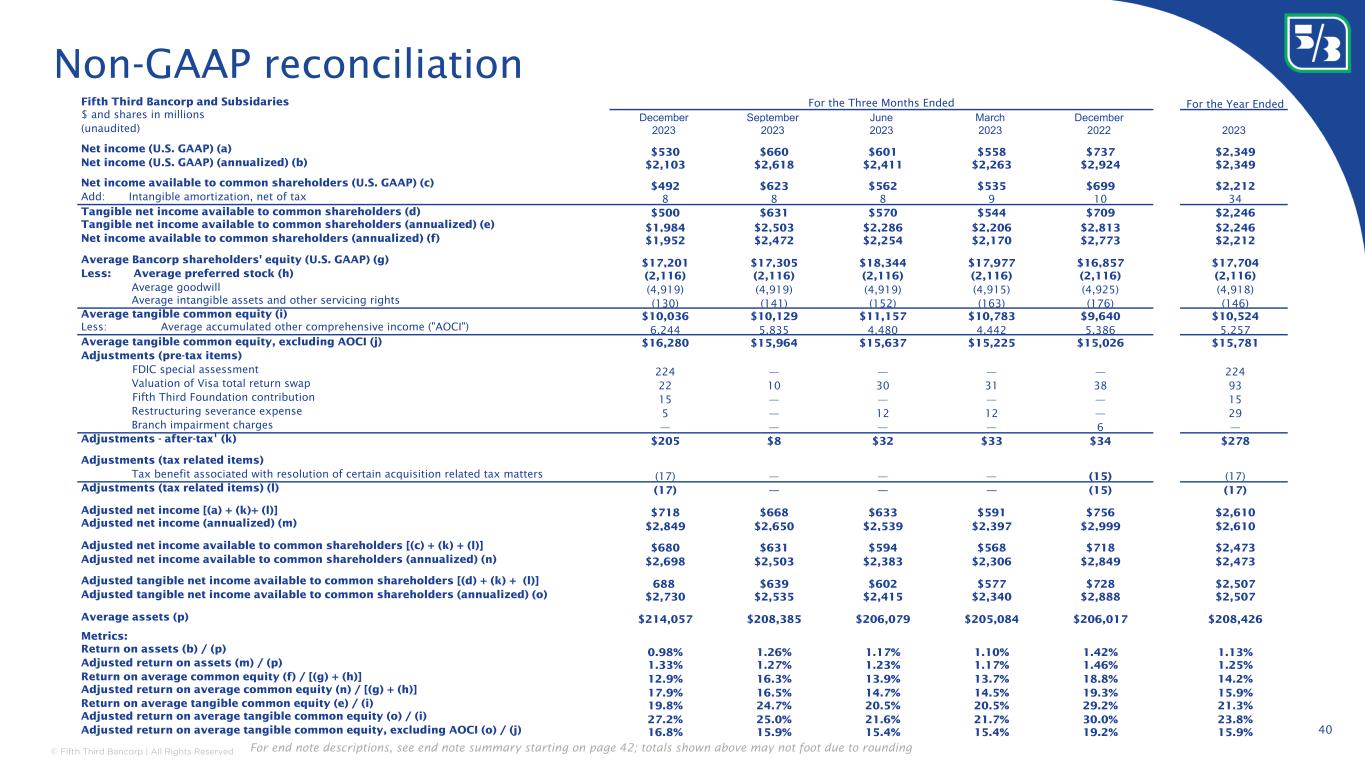
| Return on average assets | 0.98 | % | 1.26 | % | 1.42 | % | ||||||||||||||||||||||||||
| Return on average common equity | 12.9 | 16.3 | 18.8 | |||||||||||||||||||||||||||||
Return on average tangible common equity(a) |
19.8 | 24.7 | 29.2 | |||||||||||||||||||||||||||||
CET1 capital(d)(e) |
10.29 | 9.80 | 9.28 | |||||||||||||||||||||||||||||
Net interest margin(a) |
2.85 | 2.98 | 3.35 | |||||||||||||||||||||||||||||
Efficiency(a) |
67.2 | 55.0 | 52.6 | |||||||||||||||||||||||||||||
Other than the Quarterly Financial Review tables beginning on page 14, commentary is on a fully taxable-equivalent (FTE) basis unless otherwise noted. Consistent with SEC guidance in Regulation S-K that contemplates the calculation of tax-exempt income on a taxable-equivalent basis, net interest income, net interest margin, net interest rate spread, total revenue and the efficiency ratio are provided on an FTE basis. |
||||||||||||||||||||||||||||||||
| From Tim Spence, Fifth Third Chairman, President and CEO: | ||||||||||||||
| Income Statement Highlights | ||||||||||||||||||||||||||||||||||||||||||||
| ($ in millions, except per share data) | For the Three Months Ended | % Change | ||||||||||||||||||||||||||||||||||||||||||
| December | September | December | ||||||||||||||||||||||||||||||||||||||||||
| 2023 | 2023 | 2022 | Seq | Yr/Yr | ||||||||||||||||||||||||||||||||||||||||
| Condensed Statements of Income | ||||||||||||||||||||||||||||||||||||||||||||
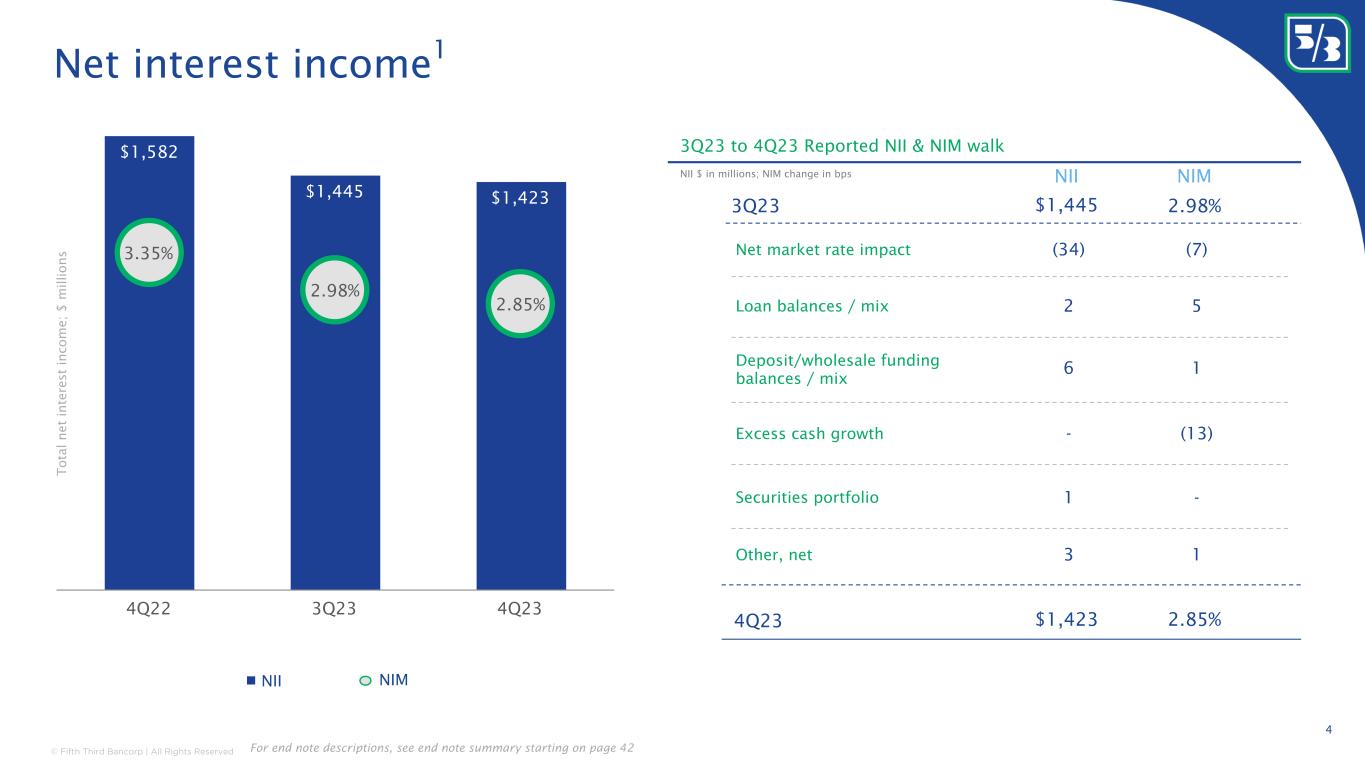
Net interest income (NII)(a) |
$1,423 | $1,445 | $1,582 | (2)% | (10)% | |||||||||||||||||||||||||||||||||||||||
| Provision for credit losses | 55 | 119 | 180 | (54)% | (69)% | |||||||||||||||||||||||||||||||||||||||
| Noninterest income | 744 | 715 | 735 | 4% | 1% | |||||||||||||||||||||||||||||||||||||||
| Noninterest expense | 1,455 | 1,188 | 1,218 | 22% | 19% | |||||||||||||||||||||||||||||||||||||||
Income before income taxes(a) |
$657 | $853 | $919 | (23)% | (29)% | |||||||||||||||||||||||||||||||||||||||
| Taxable equivalent adjustment | $7 | $7 | $5 | — | 40% | |||||||||||||||||||||||||||||||||||||||
| Applicable income tax expense | 120 | 186 | 177 | (35)% | (32)% | |||||||||||||||||||||||||||||||||||||||
| Net income | $530 | $660 | $737 | (20)% | (28)% | |||||||||||||||||||||||||||||||||||||||
| Dividends on preferred stock | 38 | 37 | 38 | 3% | — | |||||||||||||||||||||||||||||||||||||||
| Net income available to common shareholders | $492 | $623 | $699 | (21)% | (30)% | |||||||||||||||||||||||||||||||||||||||
| Earnings per share, diluted | $0.72 | $0.91 | $1.01 | (21)% | (29)% | |||||||||||||||||||||||||||||||||||||||
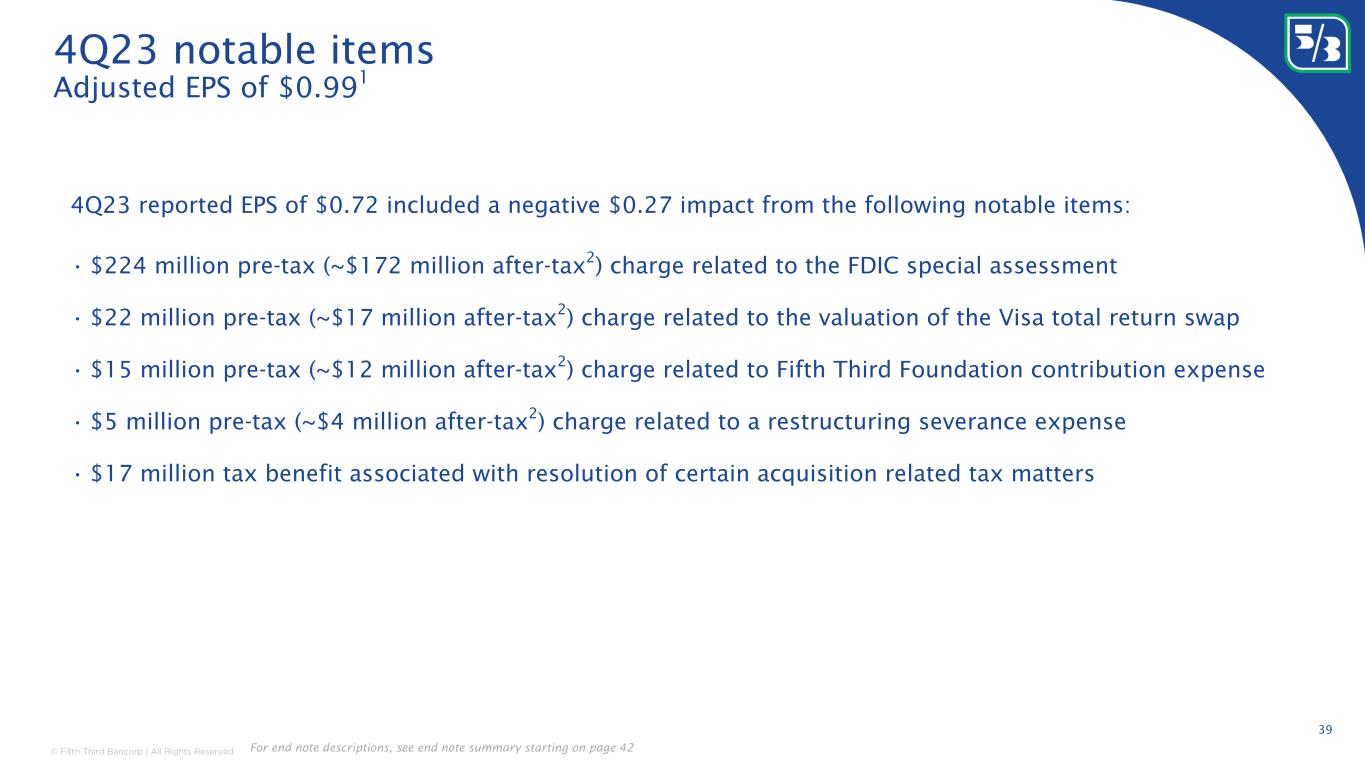
Diluted earnings per share impact of certain item(s) - 4Q23 |
|||||||||||||||||
(after-tax impact; $ in millions, except per share data) |
|||||||||||||||||
FDIC special assessment (noninterest expense)(f) |
$(172) | ||||||||||||||||
Valuation of Visa total return swap (noninterest income)(f) |
(17) | ||||||||||||||||
Fifth Third Foundation contribution (noninterest expense)(f) |
(12) | ||||||||||||||||
Restructuring severance expense (noninterest expense)(f) |
(4) | ||||||||||||||||
| Income tax benefit associated with resolution of certain acquisition related tax matters | 17 | ||||||||||||||||
After-tax impact of certain item(s) |
$(188) | ||||||||||||||||
Diluted earnings per share impact of certain item(s)1 |
$(0.27) | ||||||||||||||||
1Diluted earnings per share impact reflects 687.729 million average diluted shares outstanding |
|||||||||||||||||
| Net Interest Income | ||||||||||||||||||||||||||||||||||||||||||||
(FTE; $ in millions)(a) |
For the Three Months Ended | % Change | ||||||||||||||||||||||||||||||||||||||||||
| December | September | December | ||||||||||||||||||||||||||||||||||||||||||
| 2023 | 2023 | 2022 | Seq | Yr/Yr | ||||||||||||||||||||||||||||||||||||||||
| Interest Income | ||||||||||||||||||||||||||||||||||||||||||||
| Interest income | $2,655 | $2,536 | $2,080 | 5% | 28% | |||||||||||||||||||||||||||||||||||||||
| Interest expense | 1,232 | 1,091 | 498 | 13% | 147% | |||||||||||||||||||||||||||||||||||||||
| Net interest income (NII) | $1,423 | $1,445 | $1,582 | (2)% | (10)% | |||||||||||||||||||||||||||||||||||||||
| Average Yield/Rate Analysis | bps Change | |||||||||||||||||||||||||||||||||||||||||||
| Yield on interest-earning assets | 5.31 | % | 5.23 | % | 4.40 | % | 8 | 91 | ||||||||||||||||||||||||||||||||||||
| Rate paid on interest-bearing liabilities | 3.34 | % | 3.10 | % | 1.56 | % | 24 | 178 | ||||||||||||||||||||||||||||||||||||
| Ratios | ||||||||||||||||||||||||||||||||||||||||||||
| Net interest rate spread | 1.97 | % | 2.13 | % | 2.84 | % | (16) | (87) | ||||||||||||||||||||||||||||||||||||
| Net interest margin (NIM) | 2.85 | % | 2.98 | % | 3.35 | % | (13) | (50) | ||||||||||||||||||||||||||||||||||||
| Noninterest Income | |||||||||||||||||||||||||||||||||||
| ($ in millions) | For the Three Months Ended | % Change | |||||||||||||||||||||||||||||||||
| December | September | December | |||||||||||||||||||||||||||||||||
| 2023 | 2023 | 2022 | Seq | Yr/Yr | |||||||||||||||||||||||||||||||
| Noninterest Income | |||||||||||||||||||||||||||||||||||
| Service charges on deposits | $146 | $149 | $140 | (2)% | 4% | ||||||||||||||||||||||||||||||
| Commercial banking revenue | 163 | 154 | 158 | 6% | 3% | ||||||||||||||||||||||||||||||
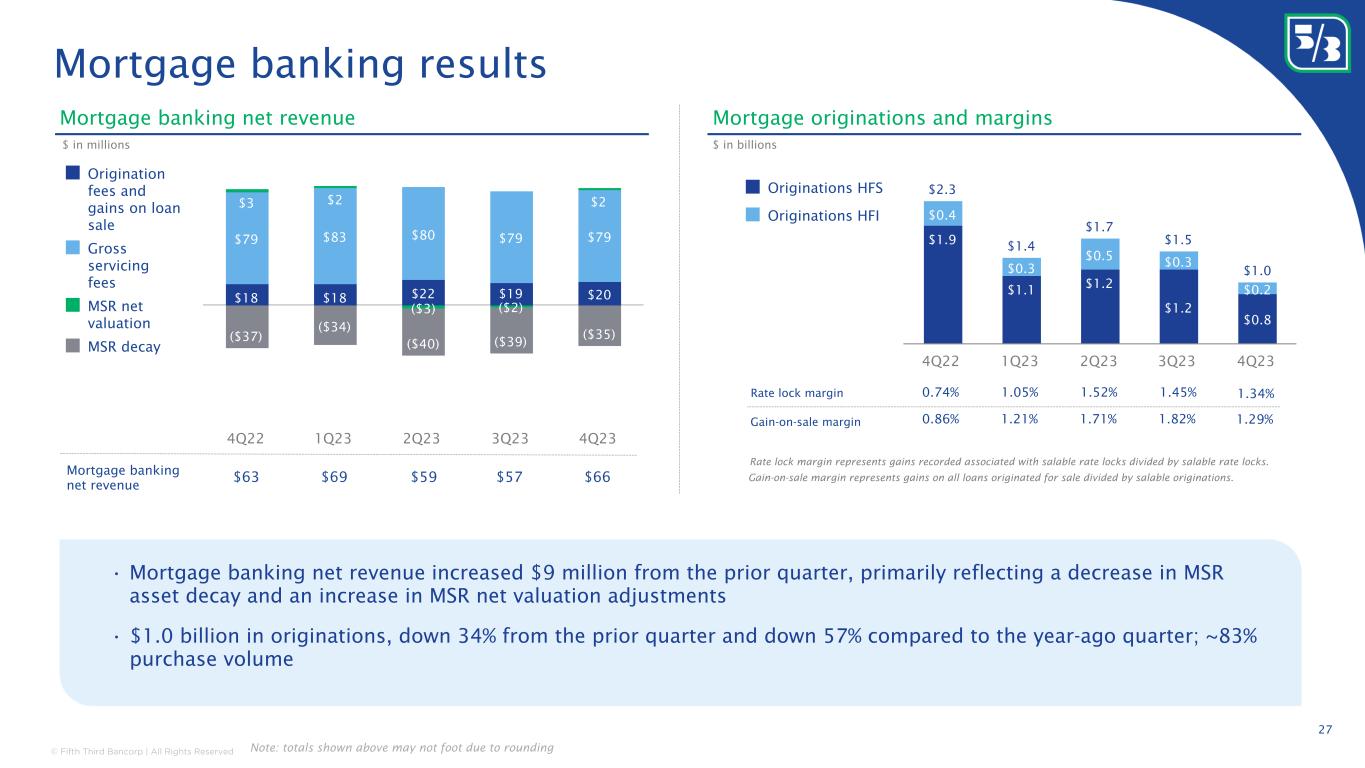
| Mortgage banking net revenue | 66 | 57 | 63 | 16% | 5% | ||||||||||||||||||||||||||||||
| Wealth and asset management revenue | 147 | 145 | 139 | 1% | 6% | ||||||||||||||||||||||||||||||
| Card and processing revenue | 106 | 104 | 103 | 2% | 3% | ||||||||||||||||||||||||||||||
| Leasing business revenue | 46 | 58 | 58 | (21)% | (21)% | ||||||||||||||||||||||||||||||
| Other noninterest income | 54 | 55 | 72 | (2)% | (25)% | ||||||||||||||||||||||||||||||
| Securities gains (losses), net | 15 | (7) | 2 | NM | 650% | ||||||||||||||||||||||||||||||
| Securities gains, net - non-qualifying hedges | |||||||||||||||||||||||||||||||||||
| on mortgage servicing rights | 1 | — | — | NM | NM | ||||||||||||||||||||||||||||||
| Total noninterest income | $744 | $715 | $735 | 4% | 1% | ||||||||||||||||||||||||||||||
| Noninterest Income excluding certain items | ||||||||||||||||||||||||||||||||||||||||||||
| ($ in millions) | For the Three Months Ended | |||||||||||||||||||||||||||||||||||||||||||
| December | September | December | % Change | |||||||||||||||||||||||||||||||||||||||||
| 2023 | 2023 | 2022 | Seq | Yr/Yr | ||||||||||||||||||||||||||||||||||||||||
| Noninterest Income excluding certain items | ||||||||||||||||||||||||||||||||||||||||||||
| Noninterest income (U.S. GAAP) | $744 | $715 | $735 | |||||||||||||||||||||||||||||||||||||||||
| Valuation of Visa total return swap | 22 | 10 | 38 | |||||||||||||||||||||||||||||||||||||||||
| Branch impairment charges | — | — | 6 | |||||||||||||||||||||||||||||||||||||||||
| Securities (gains) losses, net | (15) | 7 | (2) | |||||||||||||||||||||||||||||||||||||||||
Noninterest income excluding certain items(a) |
$751 | $732 | $777 | 3% | (3)% | |||||||||||||||||||||||||||||||||||||||
| Noninterest Expense | ||||||||||||||||||||||||||||||||||||||||||||
| ($ in millions) | For the Three Months Ended | % Change | ||||||||||||||||||||||||||||||||||||||||||
| December | September | December | ||||||||||||||||||||||||||||||||||||||||||
| 2023 | 2023 | 2022 | Seq | Yr/Yr | ||||||||||||||||||||||||||||||||||||||||
| Noninterest Expense | ||||||||||||||||||||||||||||||||||||||||||||
| Compensation and benefits | $659 | $629 | $655 | 5% | 1% | |||||||||||||||||||||||||||||||||||||||
| Net occupancy expense | 83 | 84 | 82 | (1)% | 1% | |||||||||||||||||||||||||||||||||||||||
| Technology and communications | 117 | 115 | 111 | 2% | 5% | |||||||||||||||||||||||||||||||||||||||
| Equipment expense | 37 | 37 | 37 | — | — | |||||||||||||||||||||||||||||||||||||||
| Card and processing expense | 21 | 21 | 21 | — | — | |||||||||||||||||||||||||||||||||||||||
| Leasing business expense | 27 | 29 | 36 | (7)% | (25)% | |||||||||||||||||||||||||||||||||||||||
| Marketing expense | 30 | 35 | 31 | (14)% | (3)% | |||||||||||||||||||||||||||||||||||||||
| Other noninterest expense | 481 | 238 | 245 | 102% | 96% | |||||||||||||||||||||||||||||||||||||||
| Total noninterest expense | $1,455 | $1,188 | $1,218 | 22% | 19% | |||||||||||||||||||||||||||||||||||||||
| Noninterest Expense excluding certain item(s) | ||||||||||||||||||||||||||||||||||||||||||||||||||
| ($ in millions) | For the Three Months Ended | % Change | ||||||||||||||||||||||||||||||||||||||||||||||||
| December | September | December | ||||||||||||||||||||||||||||||||||||||||||||||||
| 2023 | 2023 | 2022 | Seq | Yr/Yr | ||||||||||||||||||||||||||||||||||||||||||||||
| Noninterest Expense excluding certain item(s) | ||||||||||||||||||||||||||||||||||||||||||||||||||
| Noninterest expense (U.S. GAAP) | $1,455 | $1,188 | $1,218 | |||||||||||||||||||||||||||||||||||||||||||||||
| FDIC special assessment | (224) | — | — | |||||||||||||||||||||||||||||||||||||||||||||||
| Fifth Third Foundation contribution | (15) | — | — | |||||||||||||||||||||||||||||||||||||||||||||||
| Restructuring severance expense | (5) | — | — | |||||||||||||||||||||||||||||||||||||||||||||||
Noninterest expense excluding certain item(s)(a) |
$1,211 | $1,188 | $1,218 | 2% | (1)% | |||||||||||||||||||||||||||||||||||||||||||||
| Average Interest-Earning Assets | ||||||||||||||||||||||||||||||||||||||||||||
| ($ in millions) | For the Three Months Ended | % Change | ||||||||||||||||||||||||||||||||||||||||||
| December | September | December | ||||||||||||||||||||||||||||||||||||||||||
| 2023 | 2023 | 2022 | Seq | Yr/Yr | ||||||||||||||||||||||||||||||||||||||||
| Average Portfolio Loans and Leases | ||||||||||||||||||||||||||||||||||||||||||||
| Commercial loans and leases: | ||||||||||||||||||||||||||||||||||||||||||||
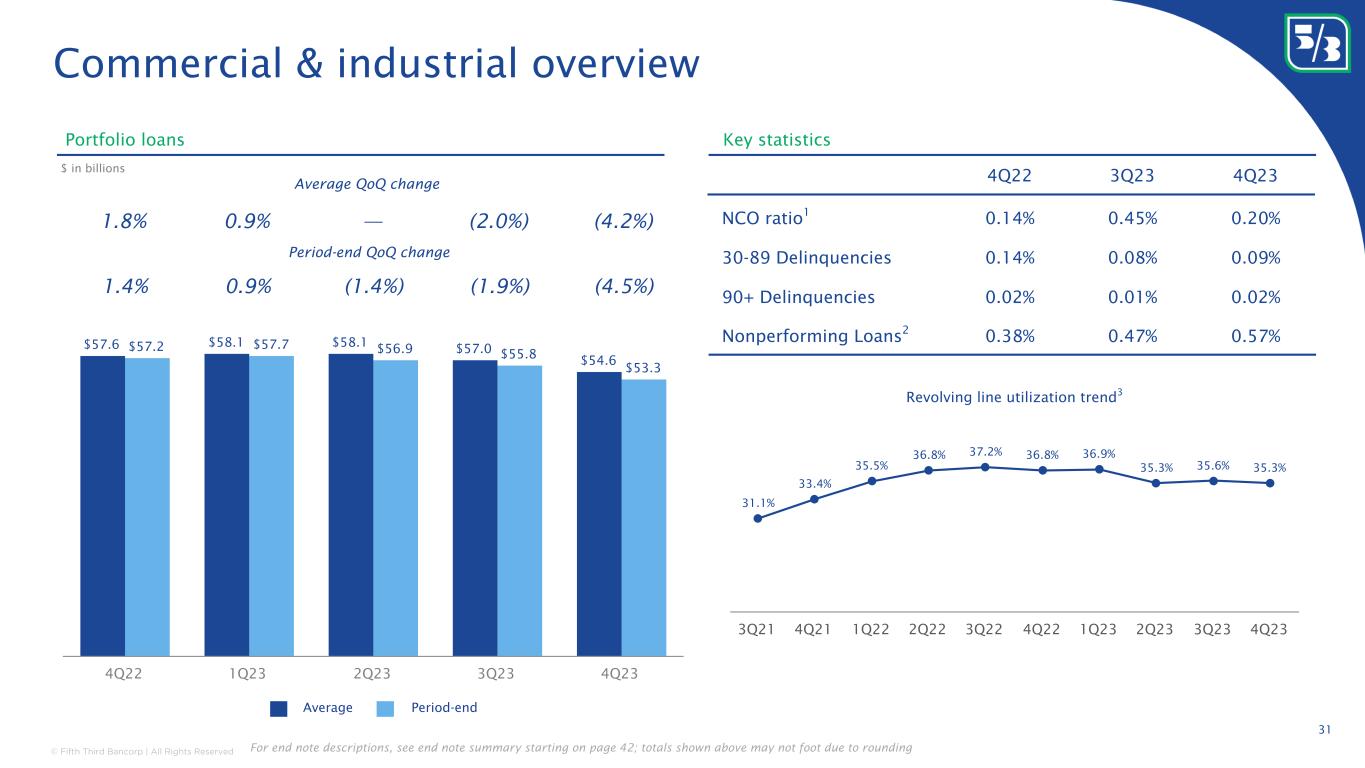
| Commercial and industrial loans | $54,633 | $57,001 | $57,646 | (4)% | (5)% | |||||||||||||||||||||||||||||||||||||||
| Commercial mortgage loans | 11,338 | 11,216 | 10,898 | 1% | 4% | |||||||||||||||||||||||||||||||||||||||
| Commercial construction loans | 5,727 | 5,539 | 5,544 | 3% | 3% | |||||||||||||||||||||||||||||||||||||||
| Commercial leases | 2,535 | 2,616 | 2,736 | (3)% | (7)% | |||||||||||||||||||||||||||||||||||||||
| Total commercial loans and leases | $74,233 | $76,372 | $76,824 | (3)% | (3)% | |||||||||||||||||||||||||||||||||||||||
| Consumer loans: | ||||||||||||||||||||||||||||||||||||||||||||
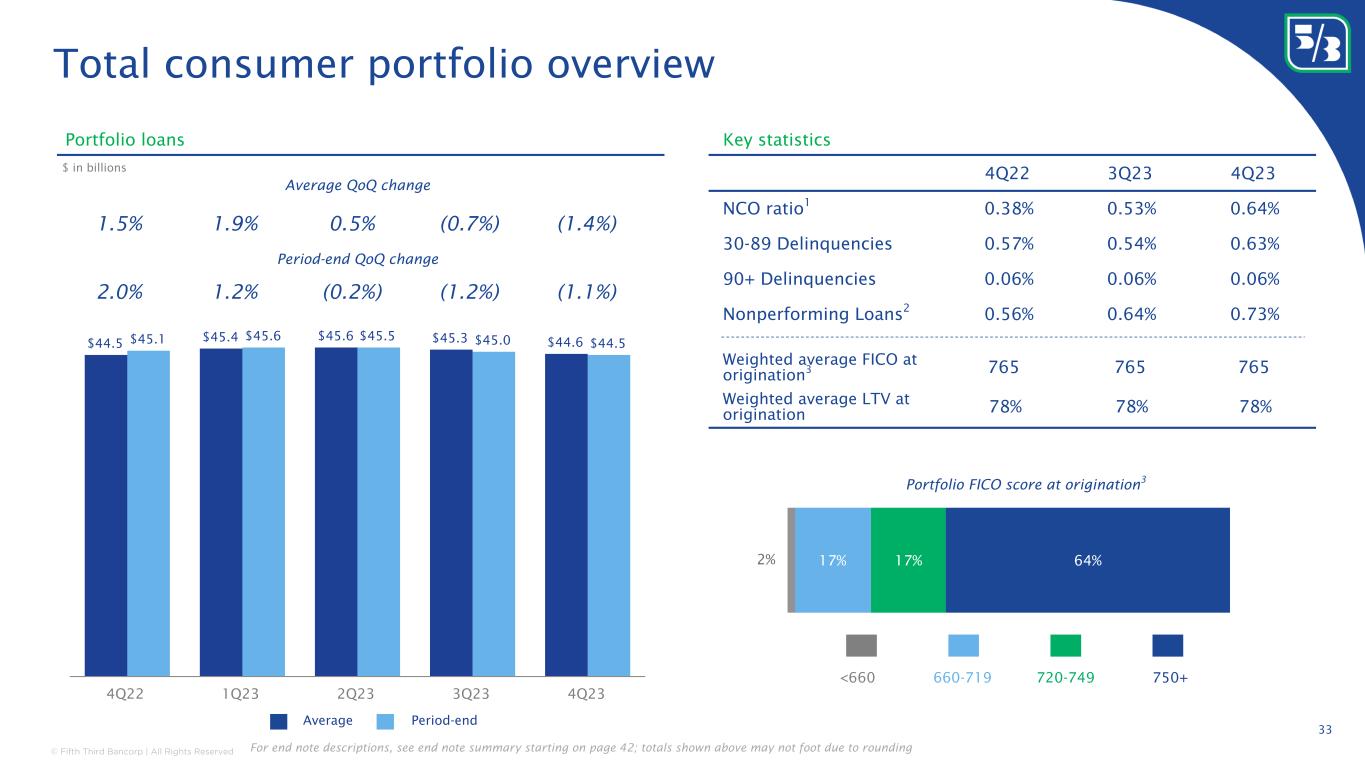
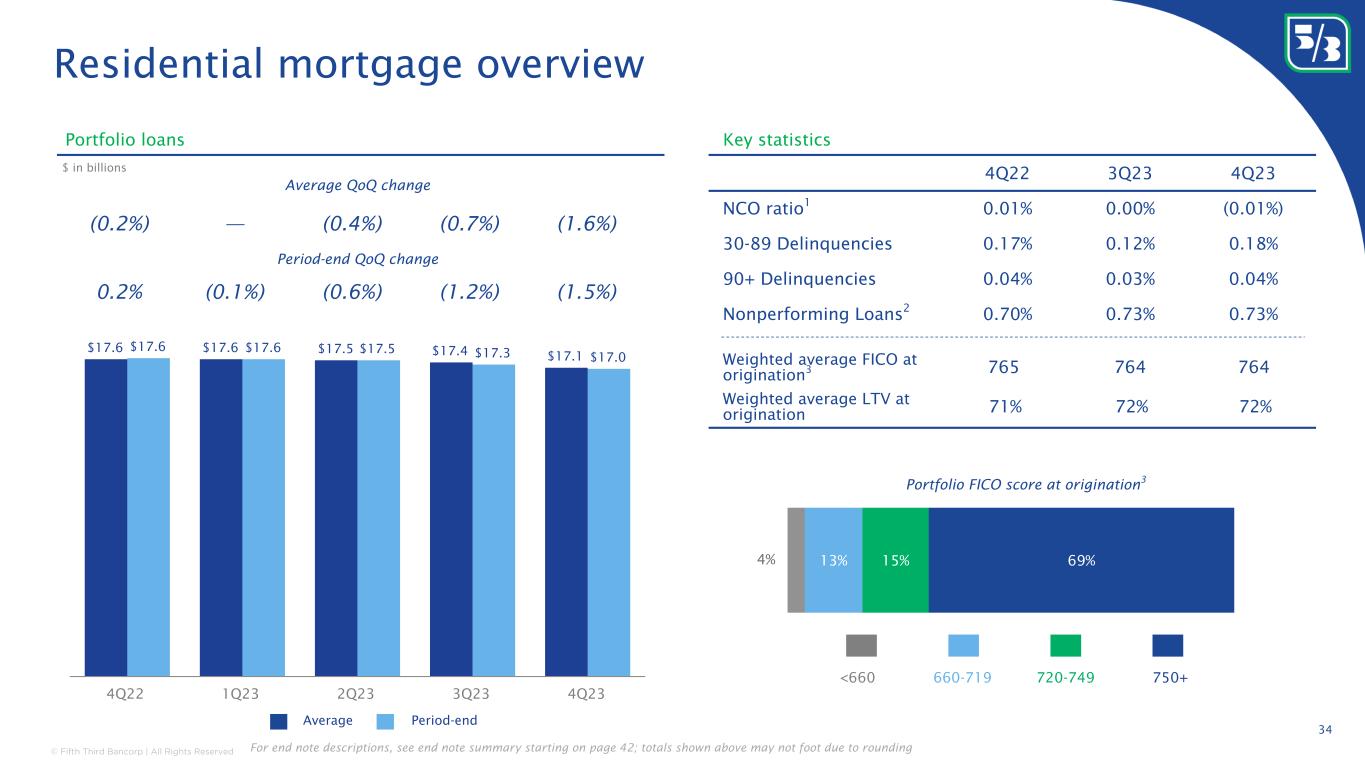
| Residential mortgage loans | $17,129 | $17,400 | $17,577 | (2)% | (3)% | |||||||||||||||||||||||||||||||||||||||
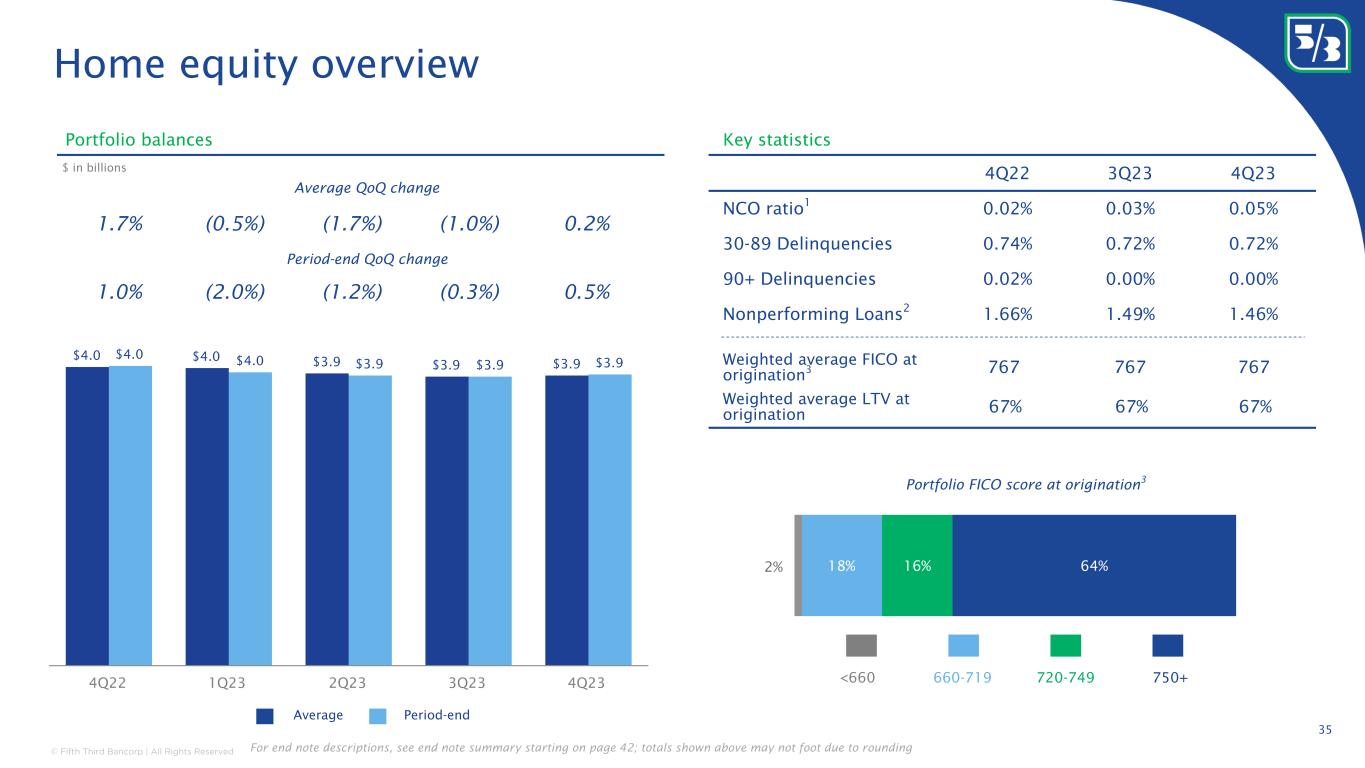
| Home equity | 3,905 | 3,897 | 4,024 | — | (3)% | |||||||||||||||||||||||||||||||||||||||
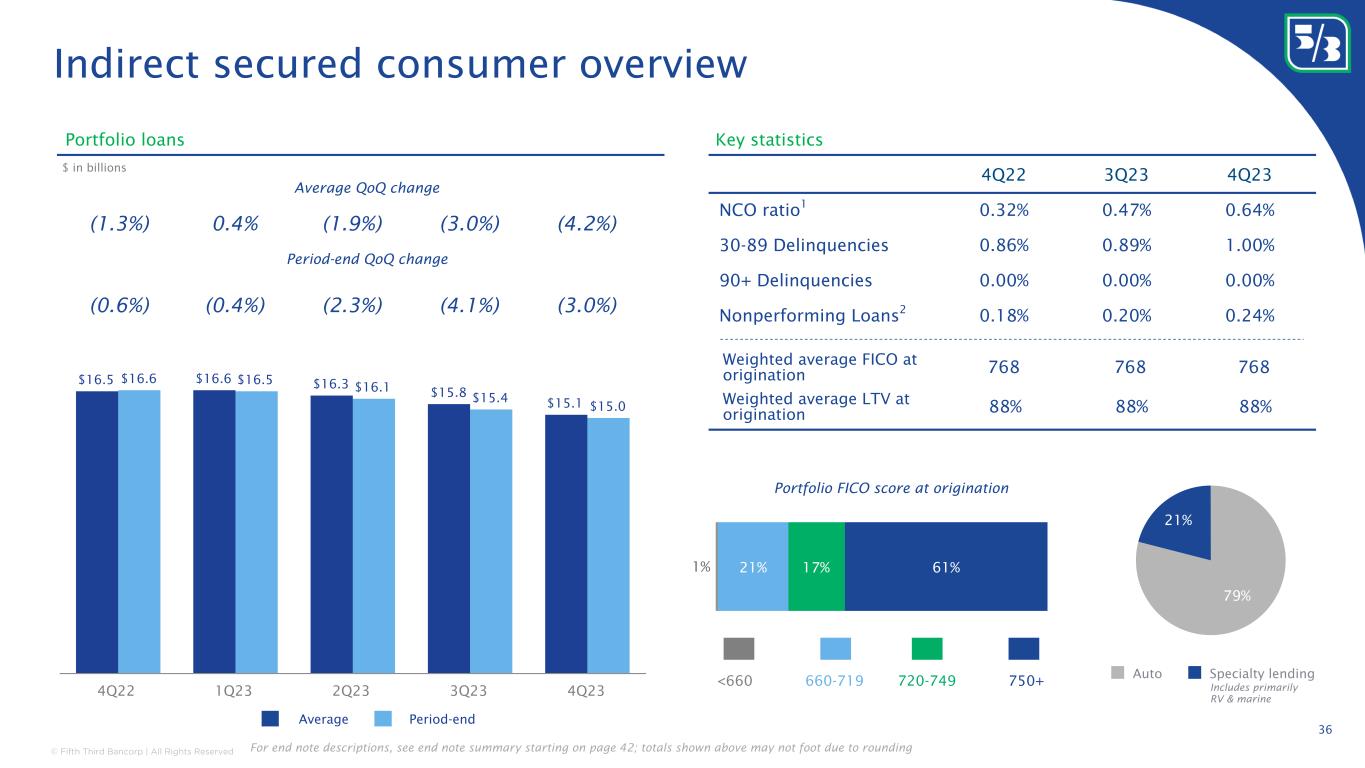
| Indirect secured consumer loans | 15,129 | 15,787 | 16,536 | (4)% | (9)% | |||||||||||||||||||||||||||||||||||||||
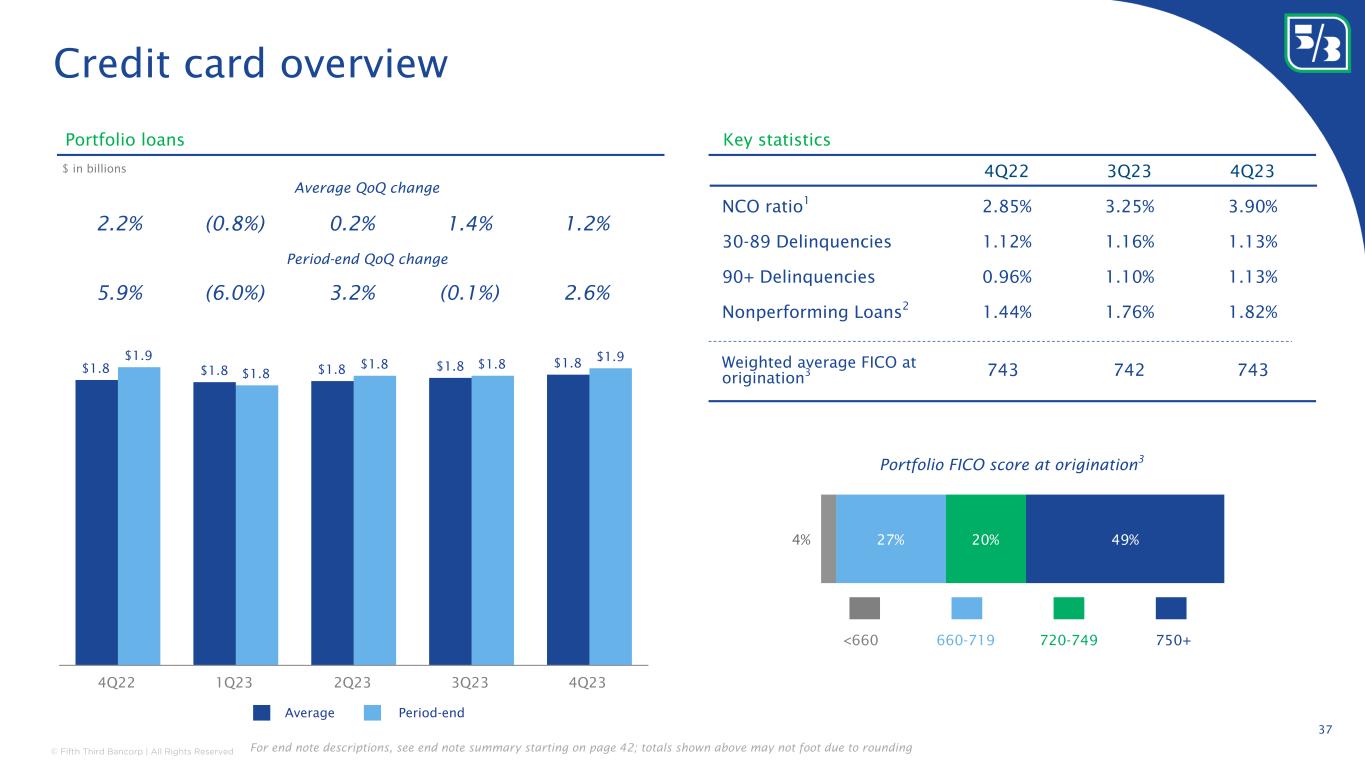
| Credit card | 1,829 | 1,808 | 1,795 | 1% | 2% | |||||||||||||||||||||||||||||||||||||||
| Other consumer loans | 6,633 | 6,366 | 4,615 | 4% | 44% | |||||||||||||||||||||||||||||||||||||||
| Total consumer loans | $44,625 | $45,258 | $44,547 | (1)% | — | |||||||||||||||||||||||||||||||||||||||
| Total average portfolio loans and leases | $118,858 | $121,630 | $121,371 | (2)% | (2)% | |||||||||||||||||||||||||||||||||||||||
| Average Loans and Leases Held for Sale | ||||||||||||||||||||||||||||||||||||||||||||
| Commercial loans and leases held for sale | $72 | $17 | $84 | 324% | (14)% | |||||||||||||||||||||||||||||||||||||||
| Consumer loans held for sale | 379 | 619 | 1,411 | (39)% | (73)% | |||||||||||||||||||||||||||||||||||||||
| Total average loans and leases held for sale | $451 | $636 | $1,495 | (29)% | (70)% | |||||||||||||||||||||||||||||||||||||||
| Total average loans and leases | $119,309 | $122,266 | $122,866 | (2)% | (3)% | |||||||||||||||||||||||||||||||||||||||
| Securities (taxable and tax-exempt) | $57,351 | $56,994 | $58,489 | 1% | (2)% | |||||||||||||||||||||||||||||||||||||||
| Other short-term investments | 21,506 | 12,956 | 6,285 | 66% | 242% | |||||||||||||||||||||||||||||||||||||||
| Total average interest-earning assets | $198,166 | $192,216 | $187,640 | 3% | 6% | |||||||||||||||||||||||||||||||||||||||
| Average Deposits | ||||||||||||||||||||||||||||||||||||||||||||
| ($ in millions) | For the Three Months Ended | % Change | ||||||||||||||||||||||||||||||||||||||||||
| December | September | December | ||||||||||||||||||||||||||||||||||||||||||
| 2023 | 2023 | 2022 | Seq | Yr/Yr | ||||||||||||||||||||||||||||||||||||||||
| Average Deposits | ||||||||||||||||||||||||||||||||||||||||||||
| Demand | $43,396 | $44,228 | $54,550 | (2)% | (20)% | |||||||||||||||||||||||||||||||||||||||
| Interest checking | 57,114 | 53,109 | 47,801 | 8% | 19% | |||||||||||||||||||||||||||||||||||||||
| Savings | 18,252 | 20,511 | 23,474 | (11)% | (22)% | |||||||||||||||||||||||||||||||||||||||
| Money market | 34,292 | 32,072 | 28,713 | 7% | 19% | |||||||||||||||||||||||||||||||||||||||
Foreign office(g) |
178 | 168 | 209 | 6% | (15)% | |||||||||||||||||||||||||||||||||||||||
| Total transaction deposits | $153,232 | $150,088 | $154,747 | 2% | (1)% | |||||||||||||||||||||||||||||||||||||||
| CDs $250,000 or less | 10,556 | 9,630 | 2,748 | 10% | 284% | |||||||||||||||||||||||||||||||||||||||
| Total core deposits | $163,788 | $159,718 | $157,495 | 3% | 4% | |||||||||||||||||||||||||||||||||||||||
| CDs over $250,000 | 5,659 | 5,926 | 3,566 | (5)% | 59% | |||||||||||||||||||||||||||||||||||||||
| Total average deposits | $169,447 | $165,644 | $161,061 | 2% | 5% | |||||||||||||||||||||||||||||||||||||||
CDs over $250,000 includes $4.8BN, $5.2BN, and $3.4BN of retail brokered certificates of deposit which are fully covered by FDIC insurance for the three months ended 12/31/23, 9/30/23, and 12/31/22, respectively. |
||||||||||||||||||||||||||||||||||||||||||||
| Average Wholesale Funding | ||||||||||||||||||||||||||||||||||||||||||||
| ($ in millions) | For the Three Months Ended | % Change | ||||||||||||||||||||||||||||||||||||||||||
| December | September | December | ||||||||||||||||||||||||||||||||||||||||||
| 2023 | 2023 | 2022 | Seq | Yr/Yr | ||||||||||||||||||||||||||||||||||||||||
| Average Wholesale Funding | ||||||||||||||||||||||||||||||||||||||||||||
| CDs over $250,000 | $5,659 | $5,926 | $3,566 | (5)% | 59% | |||||||||||||||||||||||||||||||||||||||
| Federal funds purchased | 191 | 181 | 264 | 6% | (28)% | |||||||||||||||||||||||||||||||||||||||
| Securities sold under repurchase agreements | 350 | 352 | 476 | (1)% | (26)% | |||||||||||||||||||||||||||||||||||||||
| FHLB advances | 3,293 | 3,726 | 5,489 | (12)% | (40)% | |||||||||||||||||||||||||||||||||||||||
| Derivative collateral and other secured borrowings | 34 | 48 | 225 | (29)% | (85)% | |||||||||||||||||||||||||||||||||||||||
| Long-term debt | 16,588 | 14,056 | 13,425 | 18% | 24% | |||||||||||||||||||||||||||||||||||||||
| Total average wholesale funding | $26,115 | $24,289 | $23,445 | 8% | 11% | |||||||||||||||||||||||||||||||||||||||
CDs over $250,000 includes $4.8BN, $5.2BN, and $3.4BN of retail brokered certificates of deposit which are fully covered by FDIC insurance for the three months ended 12/31/23, 9/30/23, and 12/31/22, respectively. |
||||||||||||||||||||||||||||||||||||||||||||
| Credit Quality Summary | ||||||||||||||||||||||||||||||||||||||||||||
| ($ in millions) | As of and For the Three Months Ended | |||||||||||||||||||||||||||||||||||||||||||
| December | September | June | March | December | ||||||||||||||||||||||||||||||||||||||||
| 2023 | 2023 | 2023 | 2023 | 2022 | ||||||||||||||||||||||||||||||||||||||||
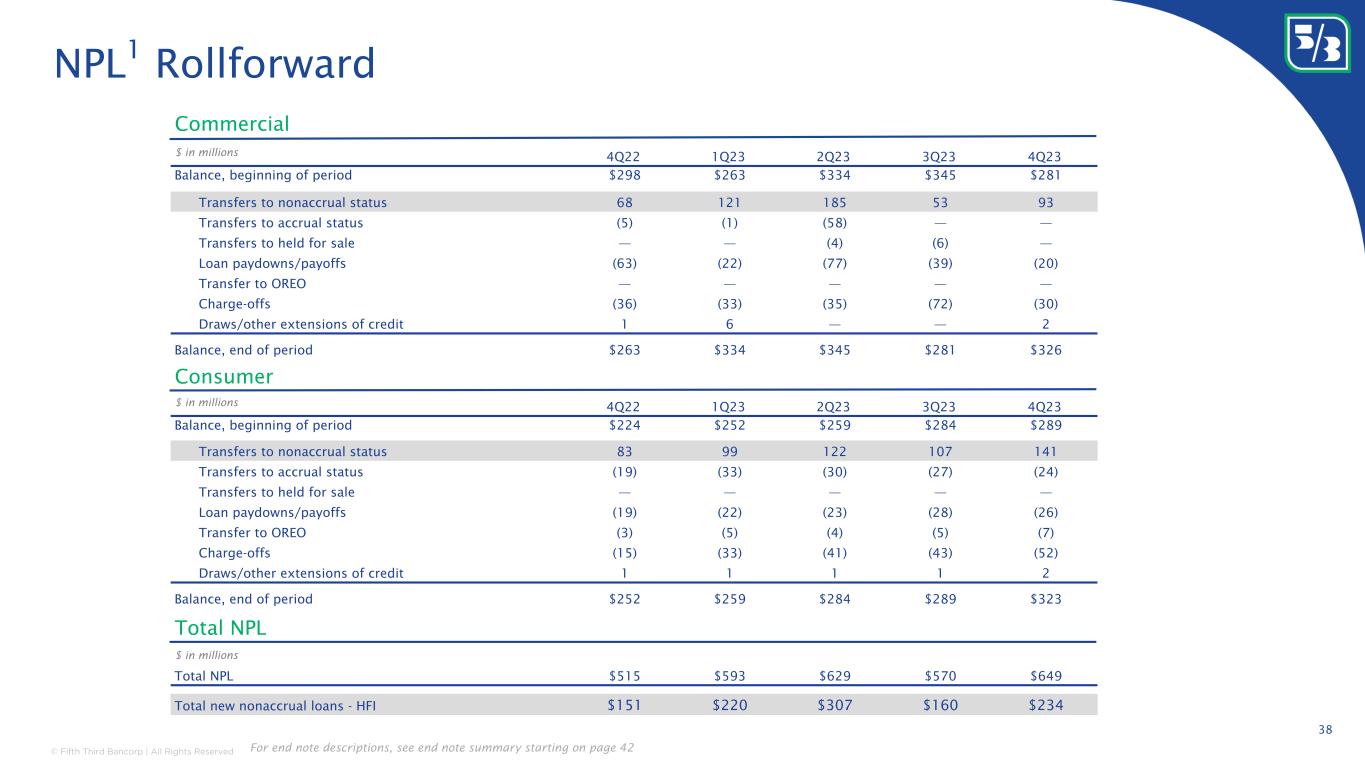
| Total nonaccrual portfolio loans and leases (NPLs) | $649 | $570 | $629 | $593 | $515 | |||||||||||||||||||||||||||||||||||||||
| Repossessed property | 10 | 11 | 8 | 8 | 6 | |||||||||||||||||||||||||||||||||||||||
| OREO | 29 | 31 | 24 | 22 | 18 | |||||||||||||||||||||||||||||||||||||||
| Total nonperforming portfolio loans and leases and OREO (NPAs) | $688 | $612 | $661 | $623 | $539 | |||||||||||||||||||||||||||||||||||||||
NPL ratio(h) |
0.55 | % | 0.47 | % | 0.52 | % | 0.48 | % | 0.42 | % | ||||||||||||||||||||||||||||||||||
NPA ratio(c) |
0.59 | % | 0.51 | % | 0.54 | % | 0.51 | % | 0.44 | % | ||||||||||||||||||||||||||||||||||
| Portfolio loans and leases 30-89 days past due (accrual) | $359 | $316 | $339 | $317 | $364 | |||||||||||||||||||||||||||||||||||||||
| Portfolio loans and leases 90 days past due (accrual) | 36 | 29 | 51 | 46 | 40 | |||||||||||||||||||||||||||||||||||||||
| 30-89 days past due as a % of portfolio loans and leases | 0.31 | % | 0.26 | % | 0.28 | % | 0.26 | % | 0.30 | % | ||||||||||||||||||||||||||||||||||
| 90 days past due as a % of portfolio loans and leases | 0.03 | % | 0.02 | % | 0.04 | % | 0.04 | % | 0.03 | % | ||||||||||||||||||||||||||||||||||
| Allowance for loan and lease losses (ALLL), beginning | $2,340 | $2,327 | $2,215 | $2,194 | $2,099 | |||||||||||||||||||||||||||||||||||||||
| Impact of adoption of ASU 2022-02 | — | — | — | (49) | — | |||||||||||||||||||||||||||||||||||||||
| Total net losses charged-off | (96) | (124) | (90) | (78) | (68) | |||||||||||||||||||||||||||||||||||||||
| Provision for loan and lease losses | 78 | 137 | 202 | 148 | 163 | |||||||||||||||||||||||||||||||||||||||
| ALLL, ending | $2,322 | $2,340 | $2,327 | $2,215 | $2,194 | |||||||||||||||||||||||||||||||||||||||
| Reserve for unfunded commitments, beginning | $189 | $207 | $232 | $216 | $199 | |||||||||||||||||||||||||||||||||||||||
| (Benefit from) provision for the reserve for unfunded commitments | (23) | (18) | (25) | 16 | 17 | |||||||||||||||||||||||||||||||||||||||
| Reserve for unfunded commitments, ending | $166 | $189 | $207 | $232 | $216 | |||||||||||||||||||||||||||||||||||||||
| Total allowance for credit losses (ACL) | $2,488 | $2,529 | $2,534 | $2,447 | $2,410 | |||||||||||||||||||||||||||||||||||||||
| ACL ratios: | ||||||||||||||||||||||||||||||||||||||||||||
| As a % of portfolio loans and leases | 2.12 | % | 2.11 | % | 2.08 | % | 1.99 | % | 1.98 | % | ||||||||||||||||||||||||||||||||||
| As a % of nonperforming portfolio loans and leases | 383 | % | 443 | % | 403 | % | 413 | % | 468 | % | ||||||||||||||||||||||||||||||||||
| As a % of nonperforming portfolio assets | 362 | % | 413 | % | 383 | % | 393 | % | 447 | % | ||||||||||||||||||||||||||||||||||
| ALLL as a % of portfolio loans and leases | 1.98 | % | 1.95 | % | 1.91 | % | 1.80 | % | 1.81 | % | ||||||||||||||||||||||||||||||||||
| Total losses charged-off | $(133) | $(158) | $(121) | $(110) | $(103) | |||||||||||||||||||||||||||||||||||||||
| Total recoveries of losses previously charged-off | 37 | 34 | 31 | 32 | 35 | |||||||||||||||||||||||||||||||||||||||
| Total net losses charged-off | $(96) | $(124) | $(90) | $(78) | $(68) | |||||||||||||||||||||||||||||||||||||||
Net charge-off ratio (NCO ratio)(b) |
0.32 | % | 0.41 | % | 0.29 | % | 0.26 | % | 0.22 | % | ||||||||||||||||||||||||||||||||||
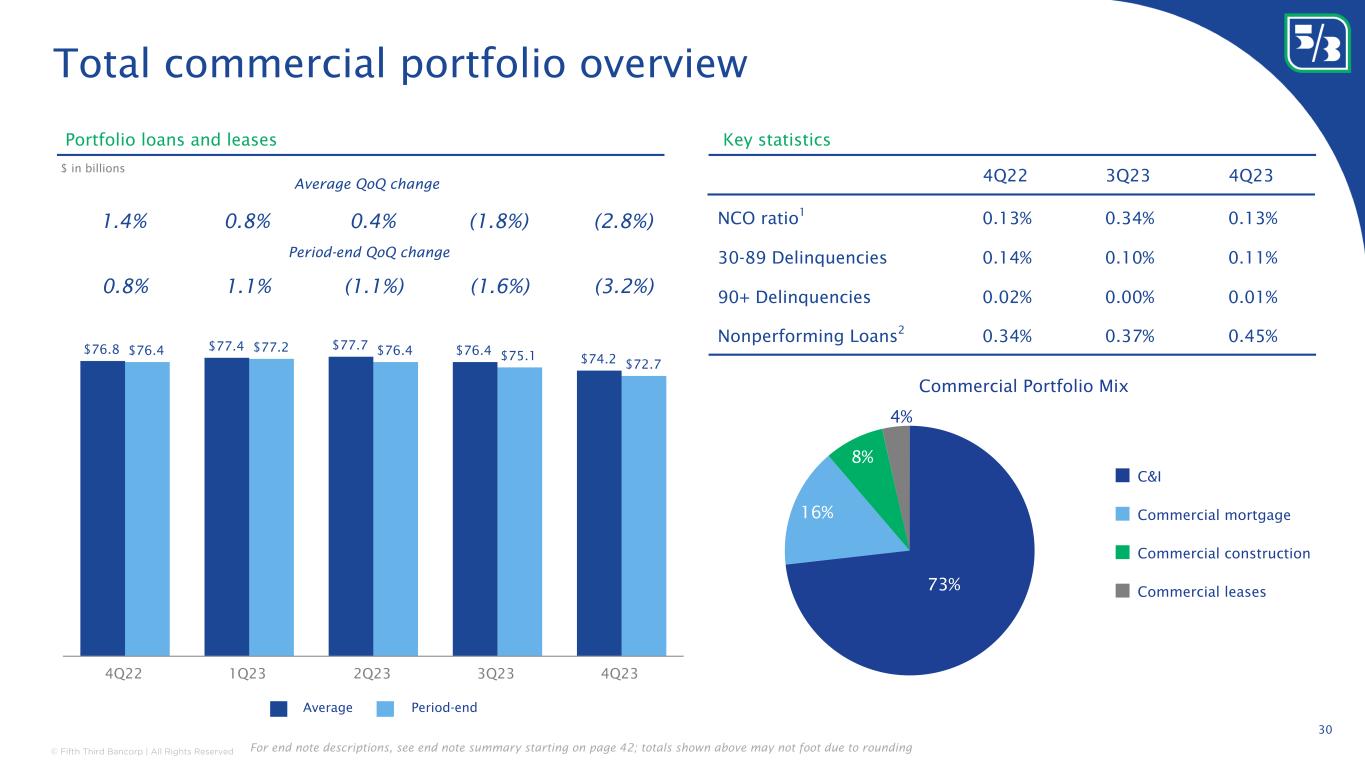
| Commercial NCO ratio | 0.13 | % | 0.34 | % | 0.16 | % | 0.17 | % | 0.13 | % | ||||||||||||||||||||||||||||||||||
| Consumer NCO ratio | 0.64 | % | 0.53 | % | 0.50 | % | 0.42 | % | 0.38 | % | ||||||||||||||||||||||||||||||||||
| Capital Position | ||||||||||||||||||||||||||||||||||||||||||||||||||
| As of and For the Three Months Ended | ||||||||||||||||||||||||||||||||||||||||||||||||||
| December | September | June | March | December | ||||||||||||||||||||||||||||||||||||||||||||||
| 2023 | 2023 | 2023 | 2023 | 2022 | ||||||||||||||||||||||||||||||||||||||||||||||
| Capital Position | ||||||||||||||||||||||||||||||||||||||||||||||||||
Average total Bancorp shareholders' equity as a % of average assets |
8.04 | % | 8.30% | 8.90% | 8.77% | 8.18 | % | |||||||||||||||||||||||||||||||||||||||||||
Tangible equity(a) |
8.65 | % | 8.46% | 8.58% | 8.39% | 8.31 | % | |||||||||||||||||||||||||||||||||||||||||||
Tangible common equity (excluding AOCI)(a) |
7.67 | % | 7.49% | 7.57% | 7.38% | 7.30 | % | |||||||||||||||||||||||||||||||||||||||||||
Tangible common equity (including AOCI)(a) |
5.73 | % | 4.51% | 5.26% | 5.49% | 5.00 | % | |||||||||||||||||||||||||||||||||||||||||||
Regulatory Capital Ratios(d)(e) |
||||||||||||||||||||||||||||||||||||||||||||||||||
CET1 capital |
10.29 | % | 9.80% | 9.49% | 9.28% | 9.28 | % | |||||||||||||||||||||||||||||||||||||||||||
Tier 1 risk-based capital |
11.59 | % | 11.06% | 10.73% | 10.53% | 10.53 | % | |||||||||||||||||||||||||||||||||||||||||||
Total risk-based capital |
13.72 | % | 13.13% | 12.83% | 12.64% | 12.79 | % | |||||||||||||||||||||||||||||||||||||||||||
| Leverage | 8.73 | % | 8.85% | 8.81% | 8.67% | 8.56 | % | |||||||||||||||||||||||||||||||||||||||||||

| Financial Highlights | 14-15 | ||||||||||
| Consolidated Statements of Income | 16-17 | ||||||||||
| Consolidated Balance Sheets | 18-19 | ||||||||||
| Consolidated Statements of Changes in Equity | 20 | ||||||||||
| Average Balance Sheets and Yield/Rate Analysis | 21-22 | ||||||||||
| Summary of Loans and Leases | 23 | ||||||||||
| Regulatory Capital | 24 | ||||||||||
| Summary of Credit Loss Experience | 25 | ||||||||||
| Asset Quality | 26 | ||||||||||
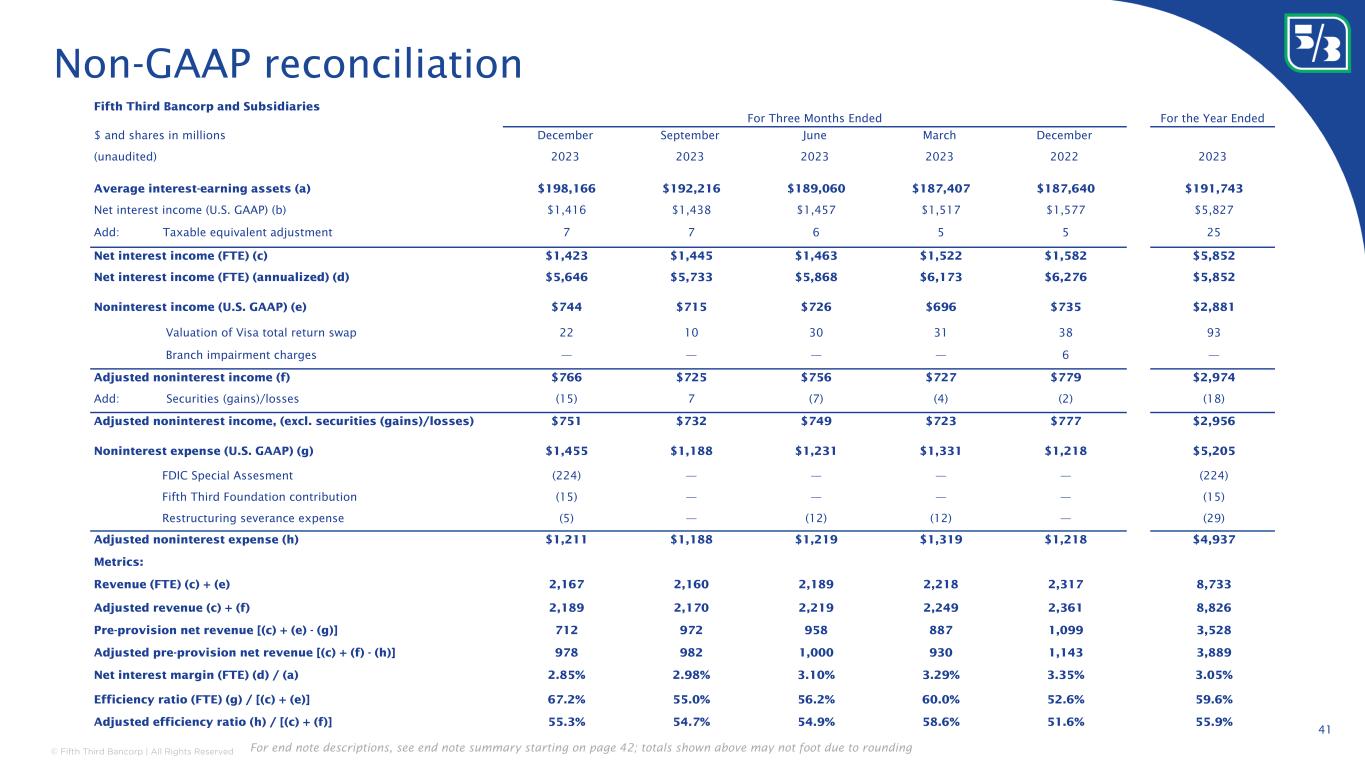
| Non-GAAP Reconciliation | 27-29 | ||||||||||
| Segment Presentation | 30 | ||||||||||
| Fifth Third Bancorp and Subsidiaries | |||||||||||||||||||||||||||||
| Financial Highlights | As of and For the Three Months Ended | % / bps | % / bps | ||||||||||||||||||||||||||
| $ in millions, except per share data | Change | Year to Date | Change | ||||||||||||||||||||||||||
| (unaudited) | December | September | December | December | December | ||||||||||||||||||||||||
| 2023 | 2023 | 2022 | Seq | Yr/Yr | 2023 | 2022 | Yr/Yr | ||||||||||||||||||||||
| Income Statement Data | |||||||||||||||||||||||||||||
| Net interest income | $1,416 | $1,438 | $1,577 | (2%) | (10%) | $5,827 | $5,609 | 4% | |||||||||||||||||||||
Net interest income (FTE)(a) |
1,423 | 1,445 | 1,582 | (2%) | (10%) | 5,852 | 5,625 | 4% | |||||||||||||||||||||
| Noninterest income | 744 | 715 | 735 | 4% | 1% | 2,881 | 2,766 | 4% | |||||||||||||||||||||
Total revenue (FTE)(a) |
2,167 | 2,160 | 2,317 | — | (6%) | 8,733 | 8,391 | 4% | |||||||||||||||||||||
| Provision for credit losses | 55 | 119 | 180 | (54%) | (69%) | 515 | 563 | (9%) | |||||||||||||||||||||
| Noninterest expense | 1,455 | 1,188 | 1,218 | 22% | 19% | 5,205 | 4,719 | 10% | |||||||||||||||||||||
| Net income | 530 | 660 | 737 | (20%) | (28%) | 2,349 | 2,446 | (4%) | |||||||||||||||||||||
| Net income available to common shareholders | 492 | 623 | 699 | (21%) | (30%) | 2,212 | 2,330 | (5%) | |||||||||||||||||||||
| Earnings Per Share Data | |||||||||||||||||||||||||||||
| Net income allocated to common shareholders | $492 | $623 | $698 | (21%) | (30%) | $2,212 | $2,328 | (5%) | |||||||||||||||||||||
| Average common shares outstanding (in thousands): | |||||||||||||||||||||||||||||
| Basic | 684,413 | 684,224 | 688,680 | — | (1%) | 684,172 | 688,634 | (1%) | |||||||||||||||||||||
| Diluted | 687,729 | 687,059 | 694,195 | — | (1%) | 687,678 | 694,952 | (1%) | |||||||||||||||||||||
| Earnings per share, basic | $0.72 | $0.91 | $1.01 | (21%) | (29%) | $3.23 | $3.38 | (4%) | |||||||||||||||||||||
| Earnings per share, diluted | 0.72 | 0.91 | 1.01 | (21%) | (29%) | 3.22 | 3.35 | (4%) | |||||||||||||||||||||
| Common Share Data | |||||||||||||||||||||||||||||
| Cash dividends per common share | $0.35 | $0.35 | $0.33 | — | 6% | $1.36 | $1.26 | 8% | |||||||||||||||||||||
| Book value per share | 25.04 | 21.19 | 22.26 | 18% | 12% | 25.04 | 22.26 | 12% | |||||||||||||||||||||
| Market value per share | 34.49 | 25.33 | 32.81 | 36% | 5% | 34.49 | 32.81 | 5% | |||||||||||||||||||||
| Common shares outstanding (in thousands) | 681,125 | 680,990 | 683,386 | — | — | 681,125 | 683,386 | — | |||||||||||||||||||||
| Market capitalization | $23,492 | $17,249 | $22,422 | 36% | 5% | $23,492 | $22,422 | 5% | |||||||||||||||||||||
| Financial Ratios | |||||||||||||||||||||||||||||
| Return on average assets | 0.98 | % | 1.26 | % | 1.42 | % | (28) | (44) | 1.13 | % | 1.18 | % | (5) | ||||||||||||||||
| Return on average common equity | 12.9 | % | 16.3 | % | 18.8 | % | (340) | (590) | 14.2 | % | 13.7 | % | 50 | ||||||||||||||||
Return on average tangible common equity(a) |
19.8 | % | 24.7 | % | 29.2 | % | (490) | (940) | 21.3 | % | 19.7 | % | 160 | ||||||||||||||||
Noninterest income as a percent of total revenue(a) |
34 | % | 33 | % | 32 | % | 100 | 200 | 33 | % | 33 | % | — | ||||||||||||||||
| Dividend payout | 48.6 | % | 38.5 | % | 32.7 | % | 1,010 | 1,590 | 42.1 | % | 37.3 | % | 480 | ||||||||||||||||
Average total Bancorp shareholders’ equity as a percent of average assets |
8.04 | % | 8.30 | % | 8.18 | % | (26) | (14) | 8.49 | % | 9.22 | % | (73) | ||||||||||||||||
Tangible common equity(a) |
7.67 | % | 7.49 | % | 7.30 | % | 18 | 37 | 7.67 | % | 7.30 | % | 37 | ||||||||||||||||
Net interest margin (FTE)(a) |
2.85 | % | 2.98 | % | 3.35 | % | (13) | (50) | 3.05 | % | 3.02 | % | 3 | ||||||||||||||||
Efficiency (FTE)(a) |
67.2 | % | 55.0 | % | 52.6 | % | NM | NM | 59.6 | % | 56.2 | % | 340 | ||||||||||||||||
| Effective tax rate | 18.4 | % | 22.0 | % | 19.4 | % | (360) | (100) | 21.4 | % | 21.0 | % | 40 | ||||||||||||||||
| Credit Quality | |||||||||||||||||||||||||||||
| Net losses charged-off | $96 | $124 | $68 | (23 | %) | 41 | % | $388 | $227 | 71 | % | ||||||||||||||||||
| Net losses charged-off as a percent of average portfolio loans and leases (annualized) | 0.32 | % | 0.41 | % | 0.22 | % | (9) | 10 | 0.32 | % | 0.19 | % | 13 | ||||||||||||||||
| ALLL as a percent of portfolio loans and leases | 1.98 | % | 1.95 | % | 1.81 | % | 3 | 17 | 1.98 | % | 1.81 | % | 17 | ||||||||||||||||
ACL as a percent of portfolio loans and leases(g) |
2.12 | % | 2.11 | % | 1.98 | % | 1 | 14 | 2.12 | % | 1.98 | % | 14 | ||||||||||||||||
| Nonperforming portfolio assets as a percent of portfolio loans and leases and OREO | 0.59 | % | 0.51 | % | 0.44 | % | 8 | 15 | 0.59 | % | 0.44 | % | 15 | ||||||||||||||||
| Average Balances | |||||||||||||||||||||||||||||
| Loans and leases, including held for sale | $119,309 | $122,266 | $122,866 | (2%) | (3%) | $122,282 | $120,561 | 1% | |||||||||||||||||||||
| Securities and other short-term investments | 78,857 | 69,950 | 64,774 | 13% | 22% | 69,461 | 65,765 | 6% | |||||||||||||||||||||
| Assets | 214,057 | 208,385 | 206,017 | 3% | 4% | 208,426 | 206,929 | 1% | |||||||||||||||||||||
Transaction deposits(b) |
153,232 | 150,088 | 154,747 | 2% | (1%) | 150,546 | 158,961 | (5%) | |||||||||||||||||||||
Core deposits(c) |
163,788 | 159,718 | 157,495 | 3% | 4% | 158,844 | 161,303 | (2%) | |||||||||||||||||||||
Wholesale funding(d) |
26,115 | 24,289 | 23,445 | 8% | 11% | 24,943 | 18,506 | 35% | |||||||||||||||||||||
Bancorp shareholders' equity |
17,201 | 17,305 | 16,857 | (1%) | 2% | 17,704 | 19,080 | (7%) | |||||||||||||||||||||
Regulatory Capital Ratios(e)(f) |
|||||||||||||||||||||||||||||
CET1 capital |
10.29 | % | 9.80 | % | 9.28 | % | 49 | 101 | 10.29 | % | 9.28 | % | 101 | ||||||||||||||||
Tier 1 risk-based capital |
11.59 | % | 11.06 | % | 10.53 | % | 53 | 106 | 11.59 | % | 10.53 | % | 106 | ||||||||||||||||
Total risk-based capital |
13.72 | % | 13.13 | % | 12.79 | % | 59 | 93 | 13.72 | % | 12.79 | % | 93 | ||||||||||||||||
| Leverage | 8.73 | % | 8.85 | % | 8.56 | % | (12) | 17 | 8.73 | % | 8.56 | % | 17 | ||||||||||||||||
| Additional Metrics | |||||||||||||||||||||||||||||
| Banking centers | 1,088 | 1,073 | 1,087 | 1% | — | 1,088 | 1,087 | — | |||||||||||||||||||||
| ATMs | 2,104 | 2,101 | 2,132 | — | (1%) | 2,104 | 2,132 | (1%) | |||||||||||||||||||||
| Full-time equivalent employees | 18,724 | 18,804 | 19,319 | — | (3%) | 18,724 | 19,319 | (3%) | |||||||||||||||||||||
Assets under care ($ in billions)(h) |
$574 | $547 | $510 | 5% | 13% | $574 | $510 | 13% | |||||||||||||||||||||
Assets under management ($ in billions)(h) |
59 | 57 | 55 | 4% | 7% | 59 | 55 | 7% | |||||||||||||||||||||
| Fifth Third Bancorp and Subsidiaries | ||||||||||||||||||||
| Financial Highlights | ||||||||||||||||||||
| $ in millions, except per share data | As of and For the Three Months Ended | |||||||||||||||||||
| (unaudited) | December | September | June | March | December | |||||||||||||||
| 2023 | 2023 | 2023 | 2023 | 2022 | ||||||||||||||||
| Income Statement Data | ||||||||||||||||||||
| Net interest income | $1,416 | $1,438 | $1,457 | $1,517 | $1,577 | |||||||||||||||
Net interest income (FTE)(a) |
1,423 | 1,445 | 1,463 | 1,522 | 1,582 | |||||||||||||||
| Noninterest income | 744 | 715 | 726 | 696 | 735 | |||||||||||||||
Total revenue (FTE)(a) |
2,167 | 2,160 | 2,189 | 2,218 | 2,317 | |||||||||||||||
| Provision for credit losses | 55 | 119 | 177 | 164 | 180 | |||||||||||||||
| Noninterest expense | 1,455 | 1,188 | 1,231 | 1,331 | 1,218 | |||||||||||||||
| Net income | 530 | 660 | 601 | 558 | 737 | |||||||||||||||
| Net income available to common shareholders | 492 | 623 | 562 | 535 | 699 | |||||||||||||||
| Earnings Per Share Data | ||||||||||||||||||||
| Net income allocated to common shareholders | $492 | $623 | $562 | $535 | $698 | |||||||||||||||
| Average common shares outstanding (in thousands): | ||||||||||||||||||||
| Basic | 684,413 | 684,224 | 684,029 | 684,017 | 688,680 | |||||||||||||||
| Diluted | 687,729 | 687,059 | 686,386 | 689,566 | 694,195 | |||||||||||||||
| Earnings per share, basic | $0.72 | $0.91 | $0.82 | $0.78 | $1.01 | |||||||||||||||
| Earnings per share, diluted | 0.72 | 0.91 | 0.82 | 0.78 | 1.01 | |||||||||||||||
| Common Share Data | ||||||||||||||||||||
| Cash dividends per common share | $0.35 | $0.35 | $0.33 | $0.33 | $0.33 | |||||||||||||||
| Book value per share | 25.04 | 21.19 | 23.05 | 23.87 | 22.26 | |||||||||||||||
| Market value per share | 34.49 | 25.33 | 26.21 | 26.64 | 32.81 | |||||||||||||||
| Common shares outstanding (in thousands) | 681,125 | 680,990 | 680,850 | 680,537 | 683,386 | |||||||||||||||
| Market capitalization | $23,492 | $17,249 | $17,845 | $18,129 | $22,422 | |||||||||||||||
| Financial Ratios | ||||||||||||||||||||
| Return on average assets | 0.98 | % | 1.26 | % | 1.17 | % | 1.10 | % | 1.42 | % | ||||||||||
| Return on average common equity | 12.9 | % | 16.3 | % | 13.9 | % | 13.7 | % | 18.8 | % | ||||||||||
Return on average tangible common equity(a) |
19.8 | % | 24.7 | % | 20.5 | % | 20.5 | % | 29.2 | % | ||||||||||
Noninterest income as a percent of total revenue(a) |
34 | % | 33 | % | 33 | % | 31 | % | 32 | % | ||||||||||
| Dividend payout | 48.6 | % | 38.5 | % | 40.2 | % | 42.3 | % | 32.7 | % | ||||||||||
Average total Bancorp shareholders’ equity as a percent of average assets |
8.04 | % | 8.30 | % | 8.90 | % | 8.77 | % | 8.18 | % | ||||||||||
Tangible common equity(a) |
7.67 | % | 7.49 | % | 7.57 | % | 7.38 | % | 7.30 | % | ||||||||||
Net interest margin (FTE)(a) |
2.85 | % | 2.98 | % | 3.10 | % | 3.29 | % | 3.35 | % | ||||||||||
Efficiency (FTE)(a) |
67.2 | % | 55.0 | % | 56.2 | % | 60.0 | % | 52.6 | % | ||||||||||
| Effective tax rate | 18.4 | % | 22.0 | % | 22.5 | % | 22.3 | % | 19.4 | % | ||||||||||
| Credit Quality | ||||||||||||||||||||
| Net losses charged-off | $96 | $124 | $90 | $78 | $68 | |||||||||||||||
| Net losses charged-off as a percent of average portfolio loans and leases (annualized) | 0.32 | % | 0.41 | % | 0.29 | % | 0.26 | % | 0.22 | % | ||||||||||
| ALLL as a percent of portfolio loans and leases | 1.98 | % | 1.95 | % | 1.91 | % | 1.80 | % | 1.81 | % | ||||||||||
ACL as a percent of portfolio loans and leases(g) |
2.12 | % | 2.11 | % | 2.08 | % | 1.99 | % | 1.98 | % | ||||||||||
| Nonperforming portfolio assets as a percent of portfolio loans and leases and OREO | 0.59 | % | 0.51 | % | 0.54 | % | 0.51 | % | 0.44 | % | ||||||||||
| Average Balances | ||||||||||||||||||||
| Loans and leases, including held for sale | $119,309 | $122,266 | $123,987 | $123,615 | $122,866 | |||||||||||||||
| Securities and other short-term investments | 78,857 | 69,950 | 65,073 | 63,792 | 64,774 | |||||||||||||||
| Assets | 214,057 | 208,385 | 206,079 | 205,084 | 206,017 | |||||||||||||||
Transaction deposits(b) |
153,232 | 150,088 | 147,723 | 151,124 | 154,747 | |||||||||||||||
Core deposits(c) |
163,788 | 159,718 | 155,482 | 156,297 | 157,495 | |||||||||||||||
Wholesale funding(d) |
26,115 | 24,289 | 25,628 | 23,720 | 23,445 | |||||||||||||||
Bancorp shareholders’ equity |
17,201 | 17,305 | 18,344 | 17,977 | 16,857 | |||||||||||||||
Regulatory Capital Ratios(e)(f) |
||||||||||||||||||||
CET1 capital |
10.29 | % | 9.80 | % | 9.49 | % | 9.28 | % | 9.28 | % | ||||||||||
| Tier 1 risk-based capital | 11.59 | % | 11.06 | % | 10.73 | % | 10.53 | % | 10.53 | % | ||||||||||
Total risk-based capital |
13.72 | % | 13.13 | % | 12.83 | % | 12.64 | % | 12.79 | % | ||||||||||
| Leverage | 8.73 | % | 8.85 | % | 8.81 | % | 8.67 | % | 8.56 | % | ||||||||||
| Additional Metrics | ||||||||||||||||||||
| Banking centers | 1,088 | 1,073 | 1,072 | 1,069 | 1,087 | |||||||||||||||
| ATMs | 2,104 | 2,101 | 2,114 | 2,118 | 2,132 | |||||||||||||||
| Full-time equivalent employees | 18,724 | 18,804 | 19,225 | 19,474 | 19,319 | |||||||||||||||
Assets under care ($ in billions)(h) |
$574 | $547 | $554 | $542 | $510 | |||||||||||||||
Assets under management ($ in billions)(h) |
59 | 57 | 59 | 57 | 55 | |||||||||||||||
| Fifth Third Bancorp and Subsidiaries | ||||||||||||||||||||||||||
| Consolidated Statements of Income | ||||||||||||||||||||||||||
| $ in millions | For the Three Months Ended | % Change | Year to Date | % Change | ||||||||||||||||||||||
| (unaudited) | December | September | December | December | December | |||||||||||||||||||||
| 2023 | 2023 | 2022 | Seq | Yr/Yr | 2023 | 2022 | Yr/Yr | |||||||||||||||||||
| Interest Income | ||||||||||||||||||||||||||
| Interest and fees on loans and leases | $1,889 | $1,899 | $1,577 | (1%) | 20% | $7,334 | $4,954 | 48% | ||||||||||||||||||
| Interest on securities | 451 | 444 | 440 | 2% | 3% | 1,770 | 1,517 | 17% | ||||||||||||||||||
| Interest on other short-term investments | 308 | 186 | 58 | 66% | 431% | 656 | 116 | 466% | ||||||||||||||||||
| Total interest income | 2,648 | 2,529 | 2,075 | 5% | 28% | 9,760 | 6,587 | 48% | ||||||||||||||||||
| Interest Expense | ||||||||||||||||||||||||||
| Interest on deposits | 952 | 844 | 300 | 13% | 217% | 2,929 | 447 | 555% | ||||||||||||||||||
| Interest on federal funds purchased | 3 | 2 | 2 | 50% | 50% | 15 | 6 | 150% | ||||||||||||||||||
| Interest on other short-term borrowings | 49 | 52 | 53 | (6%) | (8%) | 247 | 108 | 129% | ||||||||||||||||||
| Interest on long-term debt | 228 | 193 | 143 | 18% | 59% | 742 | 417 | 78% | ||||||||||||||||||
| Total interest expense | 1,232 | 1,091 | 498 | 13% | 147% | 3,933 | 978 | 302% | ||||||||||||||||||
| Net Interest Income | 1,416 | 1,438 | 1,577 | (2%) | (10%) | 5,827 | 5,609 | 4% | ||||||||||||||||||
| Provision for credit losses | 55 | 119 | 180 | (54%) | (69%) | 515 | 563 | (9%) | ||||||||||||||||||
| Net Interest Income After Provision for Credit Losses | 1,361 | 1,319 | 1,397 | 3% | (3%) | 5,312 | 5,046 | 5% | ||||||||||||||||||
| Noninterest Income | ||||||||||||||||||||||||||
| Service charges on deposits | 146 | 149 | 140 | (2%) | 4% | 577 | 589 | (2%) | ||||||||||||||||||
| Commercial banking revenue | 163 | 154 | 158 | 6% | 3% | 624 | 565 | 10% | ||||||||||||||||||
| Mortgage banking net revenue | 66 | 57 | 63 | 16% | 5% | 250 | 215 | 16% | ||||||||||||||||||
| Wealth and asset management revenue | 147 | 145 | 139 | 1% | 6% | 581 | 570 | 2% | ||||||||||||||||||
| Card and processing revenue | 106 | 104 | 103 | 2% | 3% | 416 | 409 | 2% | ||||||||||||||||||
| Leasing business revenue | 46 | 58 | 58 | (21%) | (21%) | 208 | 237 | (12%) | ||||||||||||||||||
| Other noninterest income | 54 | 55 | 72 | (2%) | (25%) | 207 | 265 | (22%) | ||||||||||||||||||
| Securities gains (losses), net | 15 | (7) | 2 | NM | 650% | 18 | (82) | NM | ||||||||||||||||||
| Securities gains (losses), net - non-qualifying hedges on mortgage servicing rights | 1 | — | — | NM | NM | — | (2) | (100%) | ||||||||||||||||||
| Total noninterest income | 744 | 715 | 735 | 4% | 1% | 2,881 | 2,766 | 4% | ||||||||||||||||||
| Noninterest Expense | ||||||||||||||||||||||||||
| Compensation and benefits | 659 | 629 | 655 | 5% | 1% | 2,694 | 2,554 | 5% | ||||||||||||||||||
| Net occupancy expense | 83 | 84 | 82 | (1%) | 1% | 331 | 307 | 8% | ||||||||||||||||||
| Technology and communications | 117 | 115 | 111 | 2% | 5% | 464 | 416 | 12% | ||||||||||||||||||
| Equipment expense | 37 | 37 | 37 | — | — | 148 | 145 | 2% | ||||||||||||||||||
| Card and processing expense | 21 | 21 | 21 | — | — | 84 | 80 | 5% | ||||||||||||||||||
| Leasing business expense | 27 | 29 | 36 | (7%) | (25%) | 121 | 131 | (8%) | ||||||||||||||||||
| Marketing expense | 30 | 35 | 31 | (14%) | (3%) | 126 | 118 | 7% | ||||||||||||||||||
| Other noninterest expense | 481 | 238 | 245 | 102% | 96% | 1,237 | 968 | 28% | ||||||||||||||||||
| Total noninterest expense | 1,455 | 1,188 | 1,218 | 22% | 19% | 5,205 | 4,719 | 10% | ||||||||||||||||||
| Income Before Income Taxes | 650 | 846 | 914 | (23%) | (29%) | 2,988 | 3,093 | (3%) | ||||||||||||||||||
| Applicable income tax expense | 120 | 186 | 177 | (35%) | (32%) | 639 | 647 | (1%) | ||||||||||||||||||
| Net Income | 530 | 660 | 737 | (20%) | (28%) | 2,349 | 2,446 | (4%) | ||||||||||||||||||
| Dividends on preferred stock | 38 | 37 | 38 | 3% | — | 137 | 116 | 18% | ||||||||||||||||||
| Net Income Available to Common Shareholders | $492 | $623 | $699 | (21%) | (30%) | $2,212 | $2,330 | (5%) | ||||||||||||||||||
| Fifth Third Bancorp and Subsidiaries | |||||||||||||||||
| Consolidated Statements of Income | |||||||||||||||||
| $ in millions | For the Three Months Ended | ||||||||||||||||
| (unaudited) | December | September | June | March | December | ||||||||||||
| 2023 | 2023 | 2023 | 2023 | 2022 | |||||||||||||
| Interest Income | |||||||||||||||||
| Interest and fees on loans and leases | $1,889 | $1,899 | $1,831 | $1,714 | $1,577 | ||||||||||||
| Interest on securities | 451 | 444 | 437 | 439 | 440 | ||||||||||||
| Interest on other short-term investments | 308 | 186 | 102 | 60 | 58 | ||||||||||||
| Total interest income | 2,648 | 2,529 | 2,370 | 2,213 | 2,075 | ||||||||||||
| Interest Expense | |||||||||||||||||
| Interest on deposits | 952 | 844 | 655 | 478 | 300 | ||||||||||||
| Interest on federal funds purchased | 3 | 2 | 5 | 5 | 2 | ||||||||||||
| Interest on other short-term borrowings | 49 | 52 | 90 | 57 | 53 | ||||||||||||
| Interest on long-term debt | 228 | 193 | 163 | 156 | 143 | ||||||||||||
| Total interest expense | 1,232 | 1,091 | 913 | 696 | 498 | ||||||||||||
| Net Interest Income | 1,416 | 1,438 | 1,457 | 1,517 | 1,577 | ||||||||||||
| Provision for credit losses | 55 | 119 | 177 | 164 | 180 | ||||||||||||
| Net Interest Income After Provision for Credit Losses | 1,361 | 1,319 | 1,280 | 1,353 | 1,397 | ||||||||||||
| Noninterest Income | |||||||||||||||||
| Service charges on deposits | 146 | 149 | 144 | 137 | 140 | ||||||||||||
| Commercial banking revenue | 163 | 154 | 146 | 161 | 158 | ||||||||||||
| Mortgage banking net revenue | 66 | 57 | 59 | 69 | 63 | ||||||||||||
| Wealth and asset management revenue | 147 | 145 | 143 | 146 | 139 | ||||||||||||
| Card and processing revenue | 106 | 104 | 106 | 100 | 103 | ||||||||||||
| Leasing business revenue | 46 | 58 | 47 | 57 | 58 | ||||||||||||
| Other noninterest income | 54 | 55 | 74 | 22 | 72 | ||||||||||||
| Securities gains (losses), net | 15 | (7) | 7 | 4 | 2 | ||||||||||||
| Securities gains, net - non-qualifying hedges on mortgage servicing rights | 1 | — | — | — | — | ||||||||||||
| Total noninterest income | 744 | 715 | 726 | 696 | 735 | ||||||||||||
| Noninterest Expense | |||||||||||||||||
| Compensation and benefits | 659 | 629 | 650 | 757 | 655 | ||||||||||||
| Net occupancy expense | 83 | 84 | 83 | 81 | 82 | ||||||||||||
| Technology and communications | 117 | 115 | 114 | 118 | 111 | ||||||||||||
| Equipment expense | 37 | 37 | 36 | 37 | 37 | ||||||||||||
| Card and processing expense | 21 | 21 | 20 | 22 | 21 | ||||||||||||
| Leasing business expense | 27 | 29 | 31 | 34 | 36 | ||||||||||||
| Marketing expense | 30 | 35 | 31 | 29 | 31 | ||||||||||||
| Other noninterest expense | 481 | 238 | 266 | 253 | 245 | ||||||||||||
| Total noninterest expense | 1,455 | 1,188 | 1,231 | 1,331 | 1,218 | ||||||||||||
| Income Before Income Taxes | 650 | 846 | 775 | 718 | 914 | ||||||||||||
| Applicable income tax expense | 120 | 186 | 174 | 160 | 177 | ||||||||||||
| Net Income | 530 | 660 | 601 | 558 | 737 | ||||||||||||
| Dividends on preferred stock | 38 | 37 | 39 | 23 | 38 | ||||||||||||
| Net Income Available to Common Shareholders | $492 | $623 | $562 | $535 | $699 | ||||||||||||
| Fifth Third Bancorp and Subsidiaries | |||||||||||||||||
| Consolidated Balance Sheets | |||||||||||||||||
| $ in millions, except per share data | As of | % Change | |||||||||||||||
| (unaudited) | December | September | December | ||||||||||||||
| 2023 | 2023 | 2022 | Seq | Yr/Yr | |||||||||||||
| Assets | |||||||||||||||||
| Cash and due from banks | $3,142 | $2,837 | $3,466 | 11% | (9%) | ||||||||||||
| Other short-term investments | 22,082 | 18,923 | 8,351 | 17% | 164% | ||||||||||||
Available-for-sale debt and other securities(a) |
50,419 | 47,893 | 51,503 | 5% | (2%) | ||||||||||||
Held-to-maturity securities(b) |
2 | 2 | 5 | — | (60%) | ||||||||||||
| Trading debt securities | 899 | 1,222 | 414 | (26%) | 117% | ||||||||||||
| Equity securities | 613 | 250 | 317 | 145% | 93% | ||||||||||||
| Loans and leases held for sale | 378 | 614 | 1,007 | (38%) | (62%) | ||||||||||||
| Portfolio loans and leases: | |||||||||||||||||
| Commercial and industrial loans | 53,270 | 55,790 | 57,232 | (5%) | (7%) | ||||||||||||
| Commercial mortgage loans | 11,276 | 11,122 | 11,020 | 1% | 2% | ||||||||||||
| Commercial construction loans | 5,621 | 5,582 | 5,433 | 1% | 3% | ||||||||||||
| Commercial leases | 2,579 | 2,624 | 2,704 | (2%) | (5%) | ||||||||||||
| Total commercial loans and leases | 72,746 | 75,118 | 76,389 | (3%) | (5%) | ||||||||||||
| Residential mortgage loans | 17,026 | 17,293 | 17,628 | (2%) | (3%) | ||||||||||||
| Home equity | 3,916 | 3,898 | 4,039 | — | (3%) | ||||||||||||
| Indirect secured consumer loans | 14,965 | 15,434 | 16,552 | (3%) | (10%) | ||||||||||||
| Credit card | 1,865 | 1,817 | 1,874 | 3% | — | ||||||||||||
| Other consumer loans | 6,716 | 6,528 | 4,998 | 3% | 34% | ||||||||||||
| Total consumer loans | 44,488 | 44,970 | 45,091 | (1%) | (1%) | ||||||||||||
| Portfolio loans and leases | 117,234 | 120,088 | 121,480 | (2%) | (3%) | ||||||||||||
| Allowance for loan and lease losses | (2,322) | (2,340) | (2,194) | (1%) | 6% | ||||||||||||
| Portfolio loans and leases, net | 114,912 | 117,748 | 119,286 | (2%) | (4%) | ||||||||||||
| Bank premises and equipment | 2,349 | 2,303 | 2,187 | 2% | 7% | ||||||||||||
| Operating lease equipment | 459 | 480 | 627 | (4%) | (27%) | ||||||||||||
| Goodwill | 4,919 | 4,919 | 4,915 | — | — | ||||||||||||
| Intangible assets | 125 | 136 | 169 | (8%) | (26%) | ||||||||||||
| Servicing rights | 1,737 | 1,822 | 1,746 | (5%) | (1%) | ||||||||||||
| Other assets | 12,538 | 13,818 | 13,459 | (9%) | (7%) | ||||||||||||
| Total Assets | $214,574 | $212,967 | $207,452 | 1% | 3% | ||||||||||||
| Liabilities | |||||||||||||||||
| Deposits: | |||||||||||||||||
| Demand | $43,146 | $43,844 | $53,125 | (2%) | (19%) | ||||||||||||
| Interest checking | 57,257 | 53,421 | 51,653 | 7% | 11% | ||||||||||||
| Savings | 18,215 | 20,195 | 23,469 | (10%) | (22%) | ||||||||||||
| Money market | 34,374 | 33,492 | 28,220 | 3% | 22% | ||||||||||||
| Foreign office | 162 | 168 | 182 | (4%) | (11%) | ||||||||||||
| CDs $250,000 or less | 10,552 | 10,306 | 3,809 | 2% | 177% | ||||||||||||
| CDs over $250,000 | 5,206 | 6,246 | 3,232 | (17%) | 61% | ||||||||||||
| Total deposits | 168,912 | 167,672 | 163,690 | 1% | 3% | ||||||||||||
| Federal funds purchased | 193 | 205 | 180 | (6%) | 7% | ||||||||||||
| Other short-term borrowings | 2,861 | 4,594 | 4,838 | (38%) | (41%) | ||||||||||||
| Accrued taxes, interest and expenses | 2,195 | 1,834 | 1,822 | 20% | 20% | ||||||||||||
| Other liabilities | 4,861 | 5,808 | 5,881 | (16%) | (17%) | ||||||||||||
| Long-term debt | 16,380 | 16,310 | 13,714 | — | 19% | ||||||||||||
| Total Liabilities | 195,402 | 196,423 | 190,125 | (1%) | 3% | ||||||||||||
| Equity | |||||||||||||||||
Common stock(c) |
2,051 | 2,051 | 2,051 | — | — | ||||||||||||
| Preferred stock | 2,116 | 2,116 | 2,116 | — | — | ||||||||||||
| Capital surplus | 3,757 | 3,733 | 3,684 | 1% | 2% | ||||||||||||
| Retained earnings | 22,997 | 22,747 | 21,689 | 1% | 6% | ||||||||||||
| Accumulated other comprehensive loss | (4,487) | (6,839) | (5,110) | (34%) | (12%) | ||||||||||||
| Treasury stock | (7,262) | (7,264) | (7,103) | — | 2% | ||||||||||||
| Total Equity | 19,172 | 16,544 | 17,327 | 16% | 11% | ||||||||||||
| Total Liabilities and Equity | $214,574 | $212,967 | $207,452 | 1% | 3% | ||||||||||||
| (a) Amortized cost | $55,789 | $55,557 | $57,530 | — | (3%) | ||||||||||||
| (b) Market values | 2 | 2 | 5 | — | (60%) | ||||||||||||
| (c) Common shares, stated value $2.22 per share (in thousands): | |||||||||||||||||
| Authorized | 2,000,000 | 2,000,000 | 2,000,000 | — | — | ||||||||||||
| Outstanding, excluding treasury | 681,125 | 680,990 | 683,386 | — | — | ||||||||||||
| Treasury | 242,768 | 242,903 | 240,507 | — | — | ||||||||||||
| Fifth Third Bancorp and Subsidiaries | |||||||||||||||||
| Consolidated Balance Sheets | |||||||||||||||||
| $ in millions, except per share data | As of | ||||||||||||||||
| (unaudited) | December | September | June | March | December | ||||||||||||
| 2023 | 2023 | 2023 | 2023 | 2022 | |||||||||||||
| Assets | |||||||||||||||||
| Cash and due from banks | $3,142 | $2,837 | $2,594 | $2,780 | $3,466 | ||||||||||||
| Other short-term investments | 22,082 | 18,923 | 10,943 | 9,794 | 8,351 | ||||||||||||
Available-for-sale debt and other securities(a) |
50,419 | 47,893 | 49,329 | 50,719 | 51,503 | ||||||||||||
Held-to-maturity securities(b) |
2 | 2 | 2 | 2 | 5 | ||||||||||||
| Trading debt securities | 899 | 1,222 | 1,139 | 1,174 | 414 | ||||||||||||
| Equity securities | 613 | 250 | 331 | 323 | 317 | ||||||||||||
| Loans and leases held for sale | 378 | 614 | 760 | 749 | 1,007 | ||||||||||||
| Portfolio loans and leases: | |||||||||||||||||
| Commercial and industrial loans | 53,270 | 55,790 | 56,897 | 57,720 | 57,232 | ||||||||||||
| Commercial mortgage loans | 11,276 | 11,122 | 11,310 | 11,228 | 11,020 | ||||||||||||
| Commercial construction loans | 5,621 | 5,582 | 5,475 | 5,548 | 5,433 | ||||||||||||
| Commercial leases | 2,579 | 2,624 | 2,670 | 2,743 | 2,704 | ||||||||||||
| Total commercial loans and leases | 72,746 | 75,118 | 76,352 | 77,239 | 76,389 | ||||||||||||
| Residential mortgage loans | 17,026 | 17,293 | 17,503 | 17,608 | 17,628 | ||||||||||||
| Home equity | 3,916 | 3,898 | 3,911 | 3,958 | 4,039 | ||||||||||||
| Indirect secured consumer loans | 14,965 | 15,434 | 16,097 | 16,484 | 16,552 | ||||||||||||
| Credit card | 1,865 | 1,817 | 1,818 | 1,761 | 1,874 | ||||||||||||
| Other consumer loans | 6,716 | 6,528 | 6,210 | 5,807 | 4,998 | ||||||||||||
| Total consumer loans | 44,488 | 44,970 | 45,539 | 45,618 | 45,091 | ||||||||||||
| Portfolio loans and leases | 117,234 | 120,088 | 121,891 | 122,857 | 121,480 | ||||||||||||
| Allowance for loan and lease losses | (2,322) | (2,340) | (2,327) | (2,215) | (2,194) | ||||||||||||
| Portfolio loans and leases, net | 114,912 | 117,748 | 119,564 | 120,642 | 119,286 | ||||||||||||
| Bank premises and equipment | 2,349 | 2,303 | 2,275 | 2,219 | 2,187 | ||||||||||||
| Operating lease equipment | 459 | 480 | 537 | 578 | 627 | ||||||||||||
| Goodwill | 4,919 | 4,919 | 4,919 | 4,915 | 4,915 | ||||||||||||
| Intangible assets | 125 | 136 | 146 | 157 | 169 | ||||||||||||
| Servicing rights | 1,737 | 1,822 | 1,764 | 1,725 | 1,746 | ||||||||||||
| Other assets | 12,538 | 13,818 | 12,973 | 12,880 | 13,459 | ||||||||||||
| Total Assets | $214,574 | $212,967 | $207,276 | $208,657 | $207,452 | ||||||||||||
| Liabilities | |||||||||||||||||
| Deposits: | |||||||||||||||||
| Demand | $43,146 | $43,844 | $45,264 | $49,649 | $53,125 | ||||||||||||
| Interest checking | 57,257 | 53,421 | 52,743 | 49,924 | 51,653 | ||||||||||||
| Savings | 18,215 | 20,195 | 21,342 | 22,563 | 23,469 | ||||||||||||
| Money market | 34,374 | 33,492 | 30,012 | 28,482 | 28,220 | ||||||||||||
| Foreign office | 162 | 168 | 182 | 134 | 182 | ||||||||||||
| CDs $250,000 or less | 10,552 | 10,306 | 8,833 | 6,624 | 3,809 | ||||||||||||
| CDs over $250,000 | 5,206 | 6,246 | 5,752 | 5,599 | 3,232 | ||||||||||||
| Total deposits | 168,912 | 167,672 | 164,128 | 162,975 | 163,690 | ||||||||||||
| Federal funds purchased | 193 | 205 | 163 | 177 | 180 | ||||||||||||
| Other short-term borrowings | 2,861 | 4,594 | 5,817 | 7,364 | 4,838 | ||||||||||||
| Accrued taxes, interest and expenses | 2,195 | 1,834 | 1,765 | 1,577 | 1,822 | ||||||||||||
| Other liabilities | 4,861 | 5,808 | 5,316 | 5,307 | 5,881 | ||||||||||||
| Long-term debt | 16,380 | 16,310 | 12,278 | 12,893 | 13,714 | ||||||||||||
| Total Liabilities | 195,402 | 196,423 | 189,467 | 190,293 | 190,125 | ||||||||||||
| Equity | |||||||||||||||||
Common stock(c) |
2,051 | 2,051 | 2,051 | 2,051 | 2,051 | ||||||||||||
| Preferred stock | 2,116 | 2,116 | 2,116 | 2,116 | 2,116 | ||||||||||||
| Capital surplus | 3,757 | 3,733 | 3,708 | 3,682 | 3,684 | ||||||||||||
| Retained earnings | 22,997 | 22,747 | 22,366 | 22,032 | 21,689 | ||||||||||||
| Accumulated other comprehensive loss | (4,487) | (6,839) | (5,166) | (4,245) | (5,110) | ||||||||||||
| Treasury stock | (7,262) | (7,264) | (7,266) | (7,272) | (7,103) | ||||||||||||
| Total Equity | 19,172 | 16,544 | 17,809 | 18,364 | 17,327 | ||||||||||||
| Total Liabilities and Equity | $214,574 | $212,967 | $207,276 | $208,657 | $207,452 | ||||||||||||
| (a) Amortized cost | $55,789 | $55,557 | $55,399 | $55,958 | $57,530 | ||||||||||||
| (b) Market values | 2 | 2 | 2 | 2 | 5 | ||||||||||||
| (c) Common shares, stated value $2.22 per share (in thousands): | |||||||||||||||||
| Authorized | 2,000,000 | 2,000,000 | 2,000,000 | 2,000,000 | 2,000,000 | ||||||||||||
| Outstanding, excluding treasury | 681,125 | 680,990 | 680,850 | 680,537 | 683,386 | ||||||||||||
| Treasury | 242,768 | 242,903 | 243,042 | 243,356 | 240,507 | ||||||||||||
| Fifth Third Bancorp and Subsidiaries | ||||||||||||||||||||
| Consolidated Statements of Changes in Equity | ||||||||||||||||||||
| $ in millions | ||||||||||||||||||||
| (unaudited) | ||||||||||||||||||||
| For the Three Months Ended | Year to Date | |||||||||||||||||||
| December | December | December | December | |||||||||||||||||
| 2023 | 2022 | 2023 | 2022 | |||||||||||||||||
| Total Equity, Beginning | $16,544 | $16,736 | $17,327 | $22,210 | ||||||||||||||||
| Impact of cumulative effect of change in accounting principle | — | — | 37 | — | ||||||||||||||||
| Net income | 530 | 737 | 2,349 | 2,446 | ||||||||||||||||
| Other comprehensive income (loss), net of tax: | ||||||||||||||||||||
| Change in unrealized gains (losses): | ||||||||||||||||||||
| Available-for-sale debt securities | 1,746 | 86 | 495 | (5,480) | ||||||||||||||||
| Qualifying cash flow hedges | 605 | 98 | 126 | (851) | ||||||||||||||||
| Change in accumulated other comprehensive income related to employee benefit plans | 1 | 12 | 2 | 14 | ||||||||||||||||
| Comprehensive income (loss) | 2,882 | 933 | 2,972 | (3,871) | ||||||||||||||||
| Cash dividends declared: | ||||||||||||||||||||
| Common stock | (242) | (229) | (941) | (877) | ||||||||||||||||
| Preferred stock | (38) | (38) | (137) | (116) | ||||||||||||||||
| Impact of stock transactions under stock compensation plans, net | 26 | 25 | 115 | 81 | ||||||||||||||||
| Shares acquired for treasury | — | (100) | (201) | (100) | ||||||||||||||||
| Total Equity, Ending | $19,172 | $17,327 | $19,172 | $17,327 | ||||||||||||||||
| Fifth Third Bancorp and Subsidiaries | ||||||||||||||||||||||||||
| Average Balance Sheet and Yield/Rate Analysis | For the Three Months Ended | |||||||||||||||||||||||||
| $ in millions | December | September | December | |||||||||||||||||||||||
| (unaudited) | 2023 | 2023 | 2022 | |||||||||||||||||||||||
| Average | Average | Average | Average | Average | Average | |||||||||||||||||||||
| Balance | Yield/Rate | Balance | Yield/Rate | Balance | Yield/Rate | |||||||||||||||||||||
| Assets | ||||||||||||||||||||||||||
| Interest-earning assets: | ||||||||||||||||||||||||||
| Loans and leases: | ||||||||||||||||||||||||||
Commercial and industrial loans(a) |
$54,688 | 7.10 | % | $57,015 | 7.00 | % | $57,729 | 5.71 | % | |||||||||||||||||
Commercial mortgage loans(a) |
11,338 | 6.26 | % | 11,216 | 6.12 | % | 10,898 | 4.98 | % | |||||||||||||||||
Commercial construction loans(a) |
5,744 | 6.96 | % | 5,540 | 6.93 | % | 5,544 | 5.73 | % | |||||||||||||||||
Commercial leases(a) |
2,535 | 3.76 | % | 2,618 | 3.75 | % | 2,737 | 3.23 | % | |||||||||||||||||
| Total commercial loans and leases | 74,305 | 6.85 | % | 76,389 | 6.75 | % | 76,908 | 5.52 | % | |||||||||||||||||
| Residential mortgage loans | 17,508 | 3.51 | % | 18,019 | 3.52 | % | 18,987 | 3.48 | % | |||||||||||||||||
| Home equity | 3,905 | 8.28 | % | 3,897 | 8.17 | % | 4,024 | 5.63 | % | |||||||||||||||||
| Indirect secured consumer loans | 15,129 | 4.69 | % | 15,787 | 4.43 | % | 16,536 | 3.67 | % | |||||||||||||||||
| Credit card | 1,829 | 13.81 | % | 1,808 | 14.09 | % | 1,795 | 13.39 | % | |||||||||||||||||
| Other consumer loans | 6,633 | 7.90 | % | 6,366 | 7.65 | % | 4,616 | 6.27 | % | |||||||||||||||||
| Total consumer loans | 45,004 | 5.38 | % | 45,877 | 5.22 | % | 45,958 | 4.40 | % | |||||||||||||||||
| Total loans and leases | 119,309 | 6.30 | % | 122,266 | 6.18 | % | 122,866 | 5.10 | % | |||||||||||||||||
| Securities: | ||||||||||||||||||||||||||
| Taxable securities | 55,884 | 3.13 | % | 55,519 | 3.10 | % | 57,230 | 3.00 | % | |||||||||||||||||
Tax exempt securities(a) |
1,467 | 3.29 | % | 1,475 | 3.21 | % | 1,259 | 3.02 | % | |||||||||||||||||
| Other short-term investments | 21,506 | 5.68 | % | 12,956 | 5.69 | % | 6,285 | 3.68 | % | |||||||||||||||||
| Total interest-earning assets | 198,166 | 5.31 | % | 192,216 | 5.23 | % | 187,640 | 4.40 | % | |||||||||||||||||
| Cash and due from banks | 2,759 | 2,576 | 3,127 | |||||||||||||||||||||||
| Other assets | 15,471 | 15,920 | 17,351 | |||||||||||||||||||||||
| Allowance for loan and lease losses | (2,339) | (2,327) | (2,101) | |||||||||||||||||||||||
| Total Assets | $214,057 | $208,385 | $206,017 | |||||||||||||||||||||||
| Liabilities | ||||||||||||||||||||||||||
| Interest-bearing liabilities: | ||||||||||||||||||||||||||
| Interest checking deposits | $57,114 | 3.41 | % | $53,109 | 3.18 | % | $47,801 | 1.63 | % | |||||||||||||||||
| Savings deposits | 18,252 | 0.63 | % | 20,511 | 0.89 | % | 23,474 | 0.37 | % | |||||||||||||||||
| Money market deposits | 34,292 | 2.85 | % | 32,072 | 2.50 | % | 28,713 | 0.61 | % | |||||||||||||||||
| Foreign office deposits | 178 | 2.32 | % | 168 | 1.72 | % | 209 | 1.51 | % | |||||||||||||||||
| CDs $250,000 or less | 10,556 | 4.14 | % | 9,630 | 3.97 | % | 2,748 | 1.12 | % | |||||||||||||||||
| Total interest-bearing core deposits | 120,392 | 2.89 | % | 115,490 | 2.65 | % | 102,945 | 1.05 | % | |||||||||||||||||
| CDs over $250,000 | 5,659 | 5.21 | % | 5,926 | 4.91 | % | 3,566 | 3.15 | % | |||||||||||||||||
| Total interest-bearing deposits | 126,051 | 3.00 | % | 121,416 | 2.76 | % | 106,511 | 1.12 | % | |||||||||||||||||
| Federal funds purchased | 191 | 5.38 | % | 181 | 5.31 | % | 264 | 3.52 | % | |||||||||||||||||
| Securities sold under repurchase agreements | 350 | 1.47 | % | 352 | 1.46 | % | 476 | 0.36 | % | |||||||||||||||||
| FHLB advances | 3,293 | 5.66 | % | 3,726 | 5.26 | % | 5,489 | 3.61 | % | |||||||||||||||||
| Derivative collateral and other secured borrowings | 34 | 9.77 | % | 48 | 7.82 | % | 225 | 4.10 | % | |||||||||||||||||
| Long-term debt | 16,588 | 5.47 | % | 14,056 | 5.46 | % | 13,425 | 4.23 | % | |||||||||||||||||
| Total interest-bearing liabilities | 146,507 | 3.34 | % | 139,779 | 3.10 | % | 126,390 | 1.56 | % | |||||||||||||||||
| Demand deposits | 43,396 | 44,228 | 54,550 | |||||||||||||||||||||||
| Other liabilities | 6,953 | 7,073 | 8,220 | |||||||||||||||||||||||
| Total Liabilities | 196,856 | 191,080 | 189,160 | |||||||||||||||||||||||
| Total Equity | 17,201 | 17,305 | 16,857 | |||||||||||||||||||||||
| Total Liabilities and Equity | $214,057 | $208,385 | $206,017 | |||||||||||||||||||||||
| Ratios: | ||||||||||||||||||||||||||
Net interest margin (FTE)(b) |
2.85 | % | 2.98 | % | 3.35 | % | ||||||||||||||||||||
Net interest rate spread (FTE)(b) |
1.97 | % | 2.13 | % | 2.84 | % | ||||||||||||||||||||
| Interest-bearing liabilities to interest-earning assets | 73.93 | % | 72.72 | % | 67.36 | % | ||||||||||||||||||||
| (a) Average Yield/Rate of these assets are presented on an FTE basis. | ||||||||||||||||||||||||||
| (b) Non-GAAP measure; see discussion and reconciliation of non-GAAP measures beginning on page 27. | ||||||||||||||||||||||||||
| Fifth Third Bancorp and Subsidiaries | |||||||||||||||||
| Average Balance Sheet and Yield/Rate Analysis | Year to Date | ||||||||||||||||
| $ in millions | December | December | |||||||||||||||
| (unaudited) | 2023 | 2022 | |||||||||||||||
| Average | Average | Average | Average | ||||||||||||||
| Balance | Yield/Rate | Balance | Yield/Rate | ||||||||||||||
| Assets | |||||||||||||||||
| Interest-earning assets: | |||||||||||||||||
| Loans and leases: | |||||||||||||||||
Commercial and industrial loans(a) |
$57,005 | 6.82 | % | $55,618 | 4.32 | % | |||||||||||
Commercial mortgage loans(a) |
11,262 | 5.97 | % | 10,723 | 3.87 | % | |||||||||||
Commercial construction loans(a) |
5,582 | 6.80 | % | 5,458 | 4.38 | % | |||||||||||
Commercial leases(a) |
2,629 | 3.63 | % | 2,828 | 3.02 | % | |||||||||||
| Total commercial loans and leases | 76,478 | 6.58 | % | 74,627 | 4.21 | % | |||||||||||
| Residential mortgage loans | 18,002 | 3.45 | % | 19,731 | 3.27 | % | |||||||||||
| Home equity | 3,936 | 7.58 | % | 3,971 | 4.46 | % | |||||||||||
| Indirect secured consumer loans | 15,944 | 4.31 | % | 16,914 | 3.31 | % | |||||||||||
| Credit card | 1,800 | 14.00 | % | 1,737 | 12.73 | % | |||||||||||
| Other consumer loans | 6,122 | 7.46 | % | 3,581 | 6.16 | % | |||||||||||
| Total consumer loans | 45,804 | 5.05 | % | 45,934 | 3.97 | % | |||||||||||
| Total loans and leases | 122,282 | 6.01 | % | 120,561 | 4.12 | % | |||||||||||
| Securities: | |||||||||||||||||
| Taxable securities | 56,066 | 3.09 | % | 52,218 | 2.86 | % | |||||||||||
Tax exempt securities(a) |
1,461 | 3.20 | % | 1,128 | 2.72 | % | |||||||||||
| Other short-term investments | 11,934 | 5.50 | % | 12,419 | 0.94 | % | |||||||||||
| Total interest-earning assets | 191,743 | 5.10 | % | 186,326 | 3.54 | % | |||||||||||
| Cash and due from banks | 2,772 | 3,093 | |||||||||||||||
| Other assets | 16,169 | 19,490 | |||||||||||||||
| Allowance for loan and lease losses | (2,258) | (1,980) | |||||||||||||||
| Total Assets | $208,426 | $206,929 | |||||||||||||||
| Liabilities | |||||||||||||||||
| Interest-bearing liabilities: | |||||||||||||||||
| Interest checking deposits | $52,378 | 2.96 | % | $45,835 | 0.65 | % | |||||||||||
| Savings deposits | 20,872 | 0.71 | % | 23,445 | 0.14 | % | |||||||||||
| Money market deposits | 30,943 | 2.15 | % | 29,326 | 0.23 | % | |||||||||||
| Foreign office deposits | 158 | 1.82 | % | 170 | 0.74 | % | |||||||||||
| CDs $250,000 or less | 8,298 | 3.71 | % | 2,342 | 0.40 | % | |||||||||||
| Total interest-bearing core deposits | 112,649 | 2.38 | % | 101,118 | 0.40 | % | |||||||||||
| CDs over $250,000 | 5,332 | 4.74 | % | 1,688 | 2.45 | % | |||||||||||
| Total interest-bearing deposits | 117,981 | 2.48 | % | 102,806 | 0.44 | % | |||||||||||
| Federal funds purchased | 307 | 4.96 | % | 381 | 1.69 | % | |||||||||||
| Securities sold under repurchase agreements | 348 | 1.22 | % | 482 | 0.17 | % | |||||||||||
| FHLB advances | 4,596 | 5.11 | % | 3,733 | 2.63 | % | |||||||||||
| Derivative collateral and other secured borrowings | 100 | 8.24 | % | 329 | 2.94 | % | |||||||||||
| Long-term debt | 14,260 | 5.20 | % | 11,893 | 3.50 | % | |||||||||||
| Total interest-bearing liabilities | 137,592 | 2.86 | % | 119,624 | 0.82 | % | |||||||||||
| Demand deposits | 46,195 | 60,185 | |||||||||||||||
| Other liabilities | 6,935 | 8,040 | |||||||||||||||
| Total Liabilities | 190,722 | 187,849 | |||||||||||||||
| Total Equity | 17,704 | 19,080 | |||||||||||||||
| Total Liabilities and Equity | $208,426 | $206,929 | |||||||||||||||
| Ratios: | |||||||||||||||||
Net interest margin (FTE)(b) |
3.05 | % | 3.02 | % | |||||||||||||
Net interest rate spread (FTE)(b) |
2.24 | % | 2.72 | % | |||||||||||||
| Interest-bearing liabilities to interest-earning assets | 71.76 | % | 64.20 | % | |||||||||||||
| (a) Average Yield/Rate of these assets are presented on an FTE basis. | |||||||||||||||||
| (b) Non-GAAP measure; see discussion and reconciliation of non-GAAP measures beginning on page 27. | |||||||||||||||||
| Fifth Third Bancorp and Subsidiaries | |||||||||||||||||
| Summary of Loans and Leases | |||||||||||||||||
| $ in millions | For the Three Months Ended | ||||||||||||||||
| (unaudited) | December | September | June | March | December | ||||||||||||
| 2023 | 2023 | 2023 | 2023 | 2022 | |||||||||||||
| Average Portfolio Loans and Leases | |||||||||||||||||
| Commercial loans and leases: | |||||||||||||||||
| Commercial and industrial loans | $54,633 | $57,001 | $58,137 | $58,149 | $57,646 | ||||||||||||
| Commercial mortgage loans | 11,338 | 11,216 | 11,373 | 11,121 | 10,898 | ||||||||||||
| Commercial construction loans | 5,727 | 5,539 | 5,535 | 5,507 | 5,544 | ||||||||||||
| Commercial leases | 2,535 | 2,616 | 2,700 | 2,662 | 2,736 | ||||||||||||
| Total commercial loans and leases | 74,233 | 76,372 | 77,745 | 77,439 | 76,824 | ||||||||||||
| Consumer loans: | |||||||||||||||||
| Residential mortgage loans | 17,129 | 17,400 | 17,517 | 17,581 | 17,577 | ||||||||||||
| Home equity | 3,905 | 3,897 | 3,937 | 4,005 | 4,024 | ||||||||||||
| Indirect secured consumer loans | 15,129 | 15,787 | 16,281 | 16,598 | 16,536 | ||||||||||||
| Credit card | 1,829 | 1,808 | 1,783 | 1,780 | 1,795 | ||||||||||||
| Other consumer loans | 6,633 | 6,366 | 6,064 | 5,409 | 4,615 | ||||||||||||
| Total consumer loans | 44,625 | 45,258 | 45,582 | 45,373 | 44,547 | ||||||||||||
| Total average portfolio loans and leases | $118,858 | $121,630 | $123,327 | $122,812 | $121,371 | ||||||||||||
| Average Loans and Leases Held for Sale | |||||||||||||||||
| Commercial loans and leases held for sale | $72 | $17 | $19 | $56 | $84 | ||||||||||||
| Consumer loans held for sale | 379 | 619 | 641 | 747 | 1,411 | ||||||||||||
| Average loans and leases held for sale | $451 | $636 | $660 | $803 | $1,495 | ||||||||||||
| End of Period Portfolio Loans and Leases | |||||||||||||||||
| Commercial loans and leases: | |||||||||||||||||
| Commercial and industrial loans | $53,270 | $55,790 | $56,897 | $57,720 | $57,232 | ||||||||||||
| Commercial mortgage loans | 11,276 | 11,122 | 11,310 | 11,228 | 11,020 | ||||||||||||
| Commercial construction loans | 5,621 | 5,582 | 5,475 | 5,548 | 5,433 | ||||||||||||
| Commercial leases | 2,579 | 2,624 | 2,670 | 2,743 | 2,704 | ||||||||||||
| Total commercial loans and leases | 72,746 | 75,118 | 76,352 | 77,239 | 76,389 | ||||||||||||
| Consumer loans: | |||||||||||||||||
| Residential mortgage loans | 17,026 | 17,293 | 17,503 | 17,608 | 17,628 | ||||||||||||
| Home equity | 3,916 | 3,898 | 3,911 | 3,958 | 4,039 | ||||||||||||
| Indirect secured consumer loans | 14,965 | 15,434 | 16,097 | 16,484 | 16,552 | ||||||||||||
| Credit card | 1,865 | 1,817 | 1,818 | 1,761 | 1,874 | ||||||||||||
| Other consumer loans | 6,716 | 6,528 | 6,210 | 5,807 | 4,998 | ||||||||||||
| Total consumer loans | 44,488 | 44,970 | 45,539 | 45,618 | 45,091 | ||||||||||||
| Total portfolio loans and leases | $117,234 | $120,088 | $121,891 | $122,857 | $121,480 | ||||||||||||
End of Period Loans and Leases Held for Sale |
|||||||||||||||||
| Commercial loans and leases held for sale | $44 | $81 | $32 | $24 | $73 | ||||||||||||
| Consumer loans held for sale | 334 | 533 | 728 | 725 | 934 | ||||||||||||
| Loans and leases held for sale | $378 | $614 | $760 | $749 | $1,007 | ||||||||||||
| Operating lease equipment | $459 | $480 | $537 | $578 | $627 | ||||||||||||
Loans and Leases Serviced for Others(a) |
|||||||||||||||||
| Commercial and industrial loans | $1,231 | $1,217 | $1,122 | $1,090 | $1,109 | ||||||||||||
| Commercial mortgage loans | 655 | 711 | 748 | 696 | 614 | ||||||||||||
| Commercial construction loans | 283 | 288 | 260 | 386 | 406 | ||||||||||||
| Commercial leases | 703 | 721 | 642 | 588 | 581 | ||||||||||||
| Residential mortgage loans | 100,842 | 101,889 | 102,817 | 103,399 | 103,154 | ||||||||||||
| Other consumer loans | 804 | 827 | 853 | 881 | 912 | ||||||||||||
| Total loans and leases serviced for others | 104,518 | 105,653 | 106,442 | 107,040 | 106,776 | ||||||||||||
| Total loans and leases owned or serviced | $222,589 | $226,835 | $229,630 | $231,224 | $229,890 | ||||||||||||
| Fifth Third Bancorp and Subsidiaries | |||||||||||||||||||||||
| Regulatory Capital | |||||||||||||||||||||||
| $ in millions | As of | ||||||||||||||||||||||
| (unaudited) | December | September | June | March | December | ||||||||||||||||||
2023(a) |
2023 | 2023 | 2023 | 2022 | |||||||||||||||||||
Regulatory Capital(b) |
|||||||||||||||||||||||
| CET1 capital | $16,800 | $16,510 | $16,100 | $15,727 | $15,670 | ||||||||||||||||||
| Additional tier 1 capital | 2,116 | 2,116 | 2,116 | 2,116 | 2,116 | ||||||||||||||||||
| Tier 1 capital | 18,916 | 18,626 | 18,216 | 17,843 | 17,786 | ||||||||||||||||||
| Tier 2 capital | 3,484 | 3,485 | 3,565 | 3,588 | 3,820 | ||||||||||||||||||
| Total regulatory capital | $22,400 | $22,111 | $21,781 | $21,431 | $21,606 | ||||||||||||||||||
Risk-weighted assets |
$163,278 | $168,433 | $169,720 | $169,510 | $168,909 | ||||||||||||||||||
| Ratios | |||||||||||||||||||||||
Average total Bancorp shareholders' equity as a percent of average assets |
8.04 | % | 8.30 | % | 8.90 | % | 8.77 | % | 8.18 | % | |||||||||||||
Regulatory Capital Ratios(b) |
|||||||||||||||||||||||
| Fifth Third Bancorp | |||||||||||||||||||||||
CET1 capital |
10.29 | % | 9.80 | % | 9.49 | % | 9.28 | % | 9.28 | % | |||||||||||||
Tier 1 risk-based capital |
11.59 | % | 11.06 | % | 10.73 | % | 10.53 | % | 10.53 | % | |||||||||||||
Total risk-based capital |
13.72 | % | 13.13 | % | 12.83 | % | 12.64 | % | 12.79 | % | |||||||||||||
| Leverage | 8.73 | % | 8.85 | % | 8.81 | % | 8.67 | % | 8.56 | % | |||||||||||||
| Fifth Third Bank, National Association | |||||||||||||||||||||||
Tier 1 risk-based capital |
12.42 | % | 11.96 | % | 11.25 | % | 11.63 | % | 11.31 | % | |||||||||||||
Total risk-based capital |
13.85 | % | 13.38 | % | 12.67 | % | 13.05 | % | 12.81 | % | |||||||||||||
| Leverage | 9.37 | % | 9.59 | % | 9.26 | % | 9.62 | % | 9.23 | % | |||||||||||||
| Fifth Third Bancorp and Subsidiaries | |||||||||||||||||
| Summary of Credit Loss Experience | |||||||||||||||||
| $ in millions | For the Three Months Ended | ||||||||||||||||
| (unaudited) | December | September | June | March | December | ||||||||||||
| 2023 | 2023 | 2023 | 2023 | 2022 | |||||||||||||
| Average portfolio loans and leases: | |||||||||||||||||
| Commercial and industrial loans | $54,633 | $57,001 | $58,137 | $58,149 | $57,646 | ||||||||||||
| Commercial mortgage loans | 11,338 | 11,216 | 11,373 | 11,121 | 10,898 | ||||||||||||
| Commercial construction loans | 5,727 | 5,539 | 5,535 | 5,507 | 5,544 | ||||||||||||
| Commercial leases | 2,535 | 2,616 | 2,700 | 2,662 | 2,736 | ||||||||||||
| Total commercial loans and leases | 74,233 | 76,372 | 77,745 | 77,439 | 76,824 | ||||||||||||
| Residential mortgage loans | 17,129 | 17,400 | 17,517 | 17,581 | 17,577 | ||||||||||||
| Home equity | 3,905 | 3,897 | 3,937 | 4,005 | 4,024 | ||||||||||||
| Indirect secured consumer loans | 15,129 | 15,787 | 16,281 | 16,598 | 16,536 | ||||||||||||
| Credit card | 1,829 | 1,808 | 1,783 | 1,780 | 1,795 | ||||||||||||
| Other consumer loans | 6,633 | 6,366 | 6,064 | 5,409 | 4,615 | ||||||||||||
| Total consumer loans | 44,625 | 45,258 | 45,582 | 45,373 | 44,547 | ||||||||||||
| Total average portfolio loans and leases | $118,858 | $121,630 | $123,327 | $122,812 | $121,371 | ||||||||||||
| Losses charged-off: | |||||||||||||||||
| Commercial and industrial loans | ($30) | ($70) | ($35) | ($32) | ($30) | ||||||||||||
| Commercial mortgage loans | — | — | — | — | — | ||||||||||||
| Commercial construction loans | — | — | — | (1) | — | ||||||||||||
| Commercial leases | — | — | — | — | (6) | ||||||||||||
| Total commercial loans and leases | (30) | (70) | (35) | (33) | (36) | ||||||||||||
| Residential mortgage loans | (1) | (1) | (1) | (1) | (1) | ||||||||||||
| Home equity | (2) | (2) | (2) | (1) | (2) | ||||||||||||
| Indirect secured consumer loans | (35) | (27) | (25) | (23) | (21) | ||||||||||||
| Credit card | (22) | (19) | (21) | (20) | (17) | ||||||||||||
| Other consumer loans | (43) | (39) | (37) | (32) | (26) | ||||||||||||
| Total consumer loans | (103) | (88) | (86) | (77) | (67) | ||||||||||||
| Total losses charged-off | ($133) | ($158) | ($121) | ($110) | ($103) | ||||||||||||
| Recoveries of losses previously charged-off: | |||||||||||||||||
| Commercial and industrial loans | $2 | $5 | $3 | $2 | $10 | ||||||||||||
| Commercial mortgage loans | 3 | — | — | — | — | ||||||||||||
| Commercial construction loans | — | — | — | — | — | ||||||||||||
| Commercial leases | — | 1 | — | — | 1 | ||||||||||||
| Total commercial loans and leases | 5 | 6 | 3 | 2 | 11 | ||||||||||||
| Residential mortgage loans | 1 | 1 | 1 | 1 | — | ||||||||||||
| Home equity | 2 | 2 | 1 | 1 | 2 | ||||||||||||
| Indirect secured consumer loans | 10 | 8 | 9 | 9 | 7 | ||||||||||||
| Credit card | 4 | 4 | 5 | 5 | 4 | ||||||||||||
| Other consumer loans | 15 | 13 | 12 | 14 | 11 | ||||||||||||
| Total consumer loans | 32 | 28 | 28 | 30 | 24 | ||||||||||||
| Total recoveries of losses previously charged-off | $37 | $34 | $31 | $32 | $35 | ||||||||||||
| Net losses charged-off: | |||||||||||||||||
| Commercial and industrial loans | ($28) | ($65) | ($32) | ($30) | ($20) | ||||||||||||
| Commercial mortgage loans | 3 | — | — | — | — | ||||||||||||
| Commercial construction loans | — | — | — | (1) | — | ||||||||||||
| Commercial leases | — | 1 | — | — | (5) | ||||||||||||
| Total commercial loans and leases | (25) | (64) | (32) | (31) | (25) | ||||||||||||
| Residential mortgage loans | — | — | — | — | (1) | ||||||||||||
| Home equity | — | — | (1) | — | — | ||||||||||||
| Indirect secured consumer loans | (25) | (19) | (16) | (14) | (14) | ||||||||||||
| Credit card | (18) | (15) | (16) | (15) | (13) | ||||||||||||
| Other consumer loans | (28) | (26) | (25) | (18) | (15) | ||||||||||||
| Total consumer loans | (71) | (60) | (58) | (47) | (43) | ||||||||||||
| Total net losses charged-off | ($96) | ($124) | ($90) | ($78) | ($68) | ||||||||||||
| Net losses charged-off as a percent of average portfolio loans and leases (annualized): | |||||||||||||||||
| Commercial and industrial loans | 0.20 | % | 0.45 | % | 0.22 | % | 0.21 | % | 0.14 | % | |||||||
| Commercial mortgage loans | (0.10 | %) | — | 0.01 | % | 0.01 | % | — | |||||||||
| Commercial construction loans | — | — | (0.01 | %) | 0.10 | % | — | ||||||||||
| Commercial leases | 0.01 | % | (0.08 | %) | (0.03 | %) | (0.04 | %) | 0.70 | % | |||||||
| Total commercial loans and leases | 0.13 | % | 0.34 | % | 0.16 | % | 0.17 | % | 0.13 | % | |||||||
| Residential mortgage loans | (0.01 | %) | — | — | — | 0.01 | % | ||||||||||
| Home equity | 0.05 | % | 0.03 | % | 0.06 | % | (0.04 | %) | 0.02 | % | |||||||
| Indirect secured consumer loans | 0.64 | % | 0.47 | % | 0.38 | % | 0.34 | % | 0.32 | % | |||||||
| Credit card | 3.90 | % | 3.25 | % | 3.61 | % | 3.43 | % | 2.85 | % | |||||||
| Other consumer loans | 1.77 | % | 1.67 | % | 1.63 | % | 1.41 | % | 1.33 | % | |||||||
| Total consumer loans | 0.64 | % | 0.53 | % | 0.50 | % | 0.42 | % | 0.38 | % | |||||||
| Total net losses charged-off as a percent of average portfolio loans and leases (annualized) | 0.32 | % | 0.41 | % | 0.29 | % | 0.26 | % | 0.22 | % | |||||||
| Fifth Third Bancorp and Subsidiaries | ||||||||||||||||||||
| Asset Quality | ||||||||||||||||||||
| $ in millions | For the Three Months Ended | |||||||||||||||||||
| (unaudited) | December | September | June | March | December | |||||||||||||||
| 2023 | 2023 | 2023 | 2023 | 2022 | ||||||||||||||||
| Allowance for Credit Losses | ||||||||||||||||||||
| Allowance for loan and lease losses, beginning | $2,340 | $2,327 | $2,215 | $2,194 | $2,099 | |||||||||||||||
| Impact of adoption of ASU 2022-02 | — | — | — | (49) | — | |||||||||||||||
| Total net losses charged-off | (96) | (124) | (90) | (78) | (68) | |||||||||||||||
| Provision for loan and lease losses | 78 | 137 | 202 | 148 | 163 | |||||||||||||||
| Allowance for loan and lease losses, ending | $2,322 | $2,340 | $2,327 | $2,215 | $2,194 | |||||||||||||||
| Reserve for unfunded commitments, beginning | $189 | $207 | $232 | $216 | $199 | |||||||||||||||
| (Benefit from) provision for the reserve for unfunded commitments | (23) | (18) | (25) | 16 | 17 | |||||||||||||||
| Reserve for unfunded commitments, ending | $166 | $189 | $207 | $232 | $216 | |||||||||||||||
| Components of allowance for credit losses: | ||||||||||||||||||||
| Allowance for loan and lease losses | $2,322 | $2,340 | $2,327 | $2,215 | $2,194 | |||||||||||||||
| Reserve for unfunded commitments | 166 | 189 | 207 | 232 | 216 | |||||||||||||||
| Total allowance for credit losses | $2,488 | $2,529 | $2,534 | $2,447 | $2,410 | |||||||||||||||
| As of | ||||||||||||||||||||
| December | September | June | March | December | ||||||||||||||||
| 2023 | 2023 | 2023 | 2023 | 2022 | ||||||||||||||||
| Nonperforming Assets and Delinquent Loans | ||||||||||||||||||||
| Nonaccrual portfolio loans and leases: | ||||||||||||||||||||
| Commercial and industrial loans | $304 | $262 | $322 | $280 | $215 | |||||||||||||||
| Commercial mortgage loans | 20 | 18 | 22 | 44 | 40 | |||||||||||||||
| Commercial construction loans | 1 | — | — | 5 | 8 | |||||||||||||||
| Commercial leases | 1 | 1 | 1 | 5 | — | |||||||||||||||
| Residential mortgage loans | 124 | 127 | 137 | 129 | 124 | |||||||||||||||
| Home equity | 57 | 58 | 61 | 68 | 67 | |||||||||||||||
| Indirect secured consumer loans | 36 | 31 | 23 | 27 | 29 | |||||||||||||||
| Credit card | 34 | 32 | 30 | 29 | 27 | |||||||||||||||
| Other consumer loans | 72 | 41 | 33 | 6 | 5 | |||||||||||||||
| Total nonaccrual portfolio loans and leases | 649 | 570 | 629 | 593 | 515 | |||||||||||||||
| Repossessed property | 10 | 11 | 8 | 8 | 6 | |||||||||||||||
| OREO | 29 | 31 | 24 | 22 | 18 | |||||||||||||||
| Total nonperforming portfolio loans and leases and OREO | 688 | 612 | 661 | 623 | 539 | |||||||||||||||
| Nonaccrual loans held for sale | 1 | 6 | 2 | — | — | |||||||||||||||
| Total nonperforming assets | $689 | $618 | $663 | $623 | $539 | |||||||||||||||
| Loans and leases 90 days past due (accrual): | ||||||||||||||||||||
| Commercial and industrial loans | $8 | $3 | $6 | $17 | $11 | |||||||||||||||
| Commercial mortgage loans | — | — | 20 | — | — | |||||||||||||||
| Commercial leases | — | — | — | — | 2 | |||||||||||||||
| Total commercial loans and leases | 8 | 3 | 26 | 17 | 13 | |||||||||||||||
Residential mortgage loans(c) |
7 | 6 | 7 | 9 | 7 | |||||||||||||||
| Home equity | — | — | 1 | 1 | 1 | |||||||||||||||
| Credit card | 21 | 20 | 17 | 18 | 18 | |||||||||||||||
| Other consumer loans | — | — | — | 1 | 1 | |||||||||||||||
| Total consumer loans | 28 | 26 | 25 | 29 | 27 | |||||||||||||||
Total loans and leases 90 days past due (accrual)(b) |
$36 | $29 | $51 | $46 | $40 | |||||||||||||||
| Ratios | ||||||||||||||||||||
| Net losses charged-off as a percent of average portfolio loans and leases (annualized) | 0.32 | % | 0.41 | % | 0.29 | % | 0.26 | % | 0.22 | % | ||||||||||
| Allowance for credit losses: | ||||||||||||||||||||
| As a percent of portfolio loans and leases | 2.12 | % | 2.11 | % | 2.08 | % | 1.99 | % | 1.98 | % | ||||||||||
As a percent of nonperforming portfolio loans and leases(a) |
383 | % | 443 | % | 403 | % | 413 | % | 468 | % | ||||||||||
As a percent of nonperforming portfolio assets(a) |
362 | % | 413 | % | 383 | % | 393 | % | 447 | % | ||||||||||
Nonperforming portfolio loans and leases as a percent of portfolio loans and leases(a) |
0.55 | % | 0.47 | % | 0.52 | % | 0.48 | % | 0.42 | % | ||||||||||
Nonperforming portfolio assets as a percent of portfolio loans and leases and OREO(a) |
0.59 | % | 0.51 | % | 0.54 | % | 0.51 | % | 0.44 | % | ||||||||||
| Nonperforming assets as a percent of total loans and leases, OREO, and repossessed property | 0.59 | % | 0.51 | % | 0.54 | % | 0.50 | % | 0.44 | % | ||||||||||
| (a) Excludes nonaccrual loans held for sale. | ||||||||||||||||||||
| (b) Excludes loans held for sale. | ||||||||||||||||||||
| (c) Excludes government guaranteed residential mortgage loans. | ||||||||||||||||||||
| Fifth Third Bancorp and Subsidiaries | |||||||||||||||||||||||
| Non-GAAP Reconciliation | |||||||||||||||||||||||
| $ and shares in millions | As of and For the Three Months Ended | ||||||||||||||||||||||
| (unaudited) | December | September | June | March | December | ||||||||||||||||||
| 2023 | 2023 | 2023 | 2023 | 2022 | |||||||||||||||||||
| Net interest income | $1,416 | $1,438 | $1,457 | $1,517 | $1,577 | ||||||||||||||||||
| Add: Taxable equivalent adjustment | 7 | 7 | 6 | 5 | 5 | ||||||||||||||||||
| Net interest income (FTE) (a) | 1,423 | 1,445 | 1,463 | 1,522 | 1,582 | ||||||||||||||||||
| Net interest income (annualized) (b) | 5,618 | 5,705 | 5,844 | 6,152 | 6,257 | ||||||||||||||||||
| Net interest income (FTE) (annualized) (c) | 5,646 | 5,733 | 5,868 | 6,173 | 6,276 | ||||||||||||||||||
| Interest income | 2,648 | 2,529 | 2,370 | 2,213 | 2,075 | ||||||||||||||||||
| Add: Taxable equivalent adjustment | 7 | 7 | 6 | 5 | 5 | ||||||||||||||||||
| Interest income (FTE) | 2,655 | 2,536 | 2,376 | 2,218 | 2,080 | ||||||||||||||||||
| Interest income (FTE) (annualized) (d) | 10,533 | 10,061 | 9,530 | 8,995 | 8,252 | ||||||||||||||||||
| Interest expense (annualized) (e) | 4,888 | 4,328 | 3,662 | 2,823 | 1,976 | ||||||||||||||||||
| Average interest-earning assets (f) | 198,166 | 192,216 | 189,060 | 187,407 | 187,640 | ||||||||||||||||||
| Average interest-bearing liabilities (g) | 146,507 | 139,779 | 134,590 | 129,280 | 126,390 | ||||||||||||||||||
| Net interest margin (b) / (f) | 2.83 | % | 2.97 | % | 3.09 | % | 3.28 | % | 3.33 | % | |||||||||||||
| Net interest margin (FTE) (c) / (f) | 2.85 | % | 2.98 | % | 3.10 | % | 3.29 | % | 3.35 | % | |||||||||||||
| Net interest rate spread (FTE) (d) / (f) - (e) / (g) | 1.97 | % | 2.13 | % | 2.32 | % | 2.62 | % | 2.84 | % | |||||||||||||
| Income before income taxes | $650 | $846 | $775 | $718 | $914 | ||||||||||||||||||
| Add: Taxable equivalent adjustment | 7 | 7 | 6 | 5 | 5 | ||||||||||||||||||
| Income before income taxes (FTE) | 657 | 853 | 781 | 723 | 919 | ||||||||||||||||||
| Net income available to common shareholders | 492 | 623 | 562 | 535 | 699 | ||||||||||||||||||
| Add: Intangible amortization, net of tax | 8 | 8 | 8 | 9 | 10 | ||||||||||||||||||
| Tangible net income available to common shareholders (h) | 500 | 631 | 570 | 544 | 709 | ||||||||||||||||||
| Tangible net income available to common shareholders (annualized) (i) | 1,984 | 2,503 | 2,286 | 2,206 | 2,813 | ||||||||||||||||||
Average Bancorp shareholders’ equity |
17,201 | 17,305 | 18,344 | 17,977 | 16,857 | ||||||||||||||||||
| Less: | Average preferred stock | (2,116) | (2,116) | (2,116) | (2,116) | (2,116) | |||||||||||||||||
| Average goodwill | (4,919) | (4,919) | (4,919) | (4,915) | (4,925) | ||||||||||||||||||
| Average intangible assets | (130) | (141) | (152) | (163) | (176) | ||||||||||||||||||
| Average tangible common equity, including AOCI (j) | 10,036 | 10,129 | 11,157 | 10,783 | 9,640 | ||||||||||||||||||
| Less: | Average AOCI | 6,244 | 5,835 | 4,480 | 4,442 | 5,386 | |||||||||||||||||
| Average tangible common equity, excluding AOCI (k) | 16,280 | 15,964 | 15,637 | 15,225 | 15,026 | ||||||||||||||||||
Total Bancorp shareholders’ equity |
19,172 | 16,544 | 17,809 | 18,364 | 17,327 | ||||||||||||||||||
| Less: | Preferred stock | (2,116) | (2,116) | (2,116) | (2,116) | (2,116) | |||||||||||||||||
| Goodwill | (4,919) | (4,919) | (4,919) | (4,915) | (4,915) | ||||||||||||||||||
| Intangible assets | (125) | (136) | (146) | (157) | (169) | ||||||||||||||||||
| Tangible common equity, including AOCI (l) | 12,012 | 9,373 | 10,628 | 11,176 | 10,127 | ||||||||||||||||||
| Less: | AOCI | 4,487 | 6,839 | 5,166 | 4,245 | 5,110 | |||||||||||||||||
| Tangible common equity, excluding AOCI (m) | 16,499 | 16,212 | 15,794 | 15,421 | 15,237 | ||||||||||||||||||
| Add: | Preferred stock | 2,116 | 2,116 | 2,116 | 2,116 | 2,116 | |||||||||||||||||
| Tangible equity (n) | 18,615 | 18,328 | 17,910 | 17,537 | 17,353 | ||||||||||||||||||
| Total assets | 214,574 | 212,967 | 207,276 | 208,657 | 207,452 | ||||||||||||||||||
| Less: | Goodwill | (4,919) | (4,919) | (4,919) | (4,915) | (4,915) | |||||||||||||||||
| Intangible assets | (125) | (136) | (146) | (157) | (169) | ||||||||||||||||||
| Tangible assets, including AOCI (o) | 209,530 | 207,912 | 202,211 | 203,585 | 202,368 | ||||||||||||||||||
| Less: | AOCI, before tax | 5,680 | 8,657 | 6,539 | 5,373 | 6,468 | |||||||||||||||||
| Tangible assets, excluding AOCI (p) | $215,210 | $216,569 | $208,750 | $208,958 | $208,836 | ||||||||||||||||||
| Common shares outstanding (q) | 681 | 681 | 681 | 681 | 683 | ||||||||||||||||||
| Tangible equity (n) / (p) | 8.65 | % | 8.46 | % | 8.58 | % | 8.39 | % | 8.31 | % | |||||||||||||
| Tangible common equity (excluding AOCI) (m) / (p) | 7.67 | % | 7.49 | % | 7.57 | % | 7.38 | % | 7.30 | % | |||||||||||||
| Tangible common equity (including AOCI) (l) / (o) | 5.73 | % | 4.51 | % | 5.26 | % | 5.49 | % | 5.00 | % | |||||||||||||
| Tangible book value per share (including AOCI) (l) / (q) | $17.64 | $13.76 | $15.61 | $16.41 | $14.83 | ||||||||||||||||||
| Tangible book value per share (excluding AOCI) (m) / (q) | $24.23 | $23.81 | $23.19 | $22.64 | $22.31 | ||||||||||||||||||
| Fifth Third Bancorp and Subsidiaries | |||||||||||||||||||||||
| Non-GAAP Reconciliation | |||||||||||||||||||||||
| $ in millions | For the Three Months Ended | ||||||||||||||||||||||
| (unaudited) | December | September | December | ||||||||||||||||||||
| 2023 | 2023 | 2022 | |||||||||||||||||||||
| Net income (r) | $530 | $660 | $737 | ||||||||||||||||||||
| Net income (annualized) (s) | 2,103 | 2,618 | 2,924 | ||||||||||||||||||||
| Adjustments (pre-tax items) | |||||||||||||||||||||||
| FDIC special assessment | 224 | — | — | ||||||||||||||||||||
| Valuation of Visa total return swap | 22 | 10 | 38 | ||||||||||||||||||||
| Fifth Third Foundation contribution | 15 | — | — | ||||||||||||||||||||
| Restructuring severance expense | 5 | — | — | ||||||||||||||||||||
| Branch impairment charges | — | — | 6 | ||||||||||||||||||||
Adjustments, after-tax (t)(a) |
205 | 8 | 34 | ||||||||||||||||||||
| Adjustments (tax related items) | |||||||||||||||||||||||
| Tax benefit associated with resolution of certain acquisition related tax matters | (17) | — | (15) | ||||||||||||||||||||
| Adjustments (tax related items) (u) | (17) | — | (15) | ||||||||||||||||||||
| Noninterest income (v) | 744 | 715 | 735 | ||||||||||||||||||||
| Valuation of Visa total return swap | 22 | 10 | 38 | ||||||||||||||||||||
| Branch impairment charges | — | — | 6 | ||||||||||||||||||||
| Adjusted noninterest income (w) | 766 | 725 | 779 | ||||||||||||||||||||
| Noninterest expense (x) | 1,455 | 1,188 | 1,218 | ||||||||||||||||||||
| FDIC special assessment | (224) | — | — | ||||||||||||||||||||
| Fifth Third Foundation contribution | (15) | — | — | ||||||||||||||||||||
| Restructuring severance expense | (5) | — | — | ||||||||||||||||||||
| Adjusted noninterest expense (y) | 1,211 | 1,188 | 1,218 | ||||||||||||||||||||
| Adjusted net income (r) + (t) + (u) | 718 | 668 | 756 | ||||||||||||||||||||
| Adjusted net income (annualized) (z) | 2,849 | 2,650 | 2,999 | ||||||||||||||||||||
| Adjusted tangible net income available to common shareholders (h) + (t) + (u) | 688 | 639 | 728 | ||||||||||||||||||||
| Adjusted tangible net income available to common shareholders (annualized) (aa) | 2,730 | 2,535 | 2,888 | ||||||||||||||||||||
| Average assets (ab) | $214,057 | $208,385 | $206,017 | ||||||||||||||||||||
| Return on average tangible common equity (i) / (j) | 19.8 | % | 24.7 | % | 29.2 | % | |||||||||||||||||
| Return on average tangible common equity excluding AOCI (i) / (k) | 12.2 | % | 15.7 | % | 18.7 | % | |||||||||||||||||
| Adjusted return on average tangible common equity, including AOCI (aa) / (j) | 27.2 | % | 25.0 | % | 30.0 | % | |||||||||||||||||
| Adjusted return on average tangible common equity, excluding AOCI (aa) / (k) | 16.8 | % | 15.9 | % | 19.2 | % | |||||||||||||||||
| Return on average assets (s) / (ab) | 0.98 | % | 1.26 | % | 1.42 | % | |||||||||||||||||
| Adjusted return on average assets (z) / (ab) | 1.33 | % | 1.27 | % | 1.46 | % | |||||||||||||||||
| Efficiency ratio (FTE) (x) / [(a) + (v)] | 67.2 | % | 55.0 | % | 52.6 | % | |||||||||||||||||
| Adjusted efficiency ratio (y) / [(a) + (w)] | 55.3 | % | 54.7 | % | 51.6 | % | |||||||||||||||||
| Total revenue (FTE) (a) + (v) | $2,167 | $2,160 | $2,317 | ||||||||||||||||||||
| Adjusted total revenue (FTE) (a) + (w) | $2,189 | $2,170 | $2,361 | ||||||||||||||||||||
| Pre-provision net revenue (PPNR) (a) + (v) - (x) | $712 | $972 | $1,099 | ||||||||||||||||||||
| Adjusted pre-provision net revenue (PPNR) (a) + (w) - (y) | $978 | $982 | $1,143 | ||||||||||||||||||||
| Totals may not foot due to rounding; (a) Assumes a 23% tax rate | |||||||||||||||||||||||
| Fifth Third Bancorp and Subsidiaries | ||||||||||||||||||||
| Segment Presentation | ||||||||||||||||||||
| $ in millions | ||||||||||||||||||||
| (unaudited) | ||||||||||||||||||||
For the three months ended December 31, 2023 |
Commercial Banking | Consumer and Small Business Banking |
Wealth
and Asset Management
|
Other/
Eliminations
|
Total | |||||||||||||||
Net interest income (FTE)(a) |
$812 | $1,190 | $66 | $(645) | $1,423 | |||||||||||||||
| (Provision for) benefit from credit losses | 25 | (81) | — | 1 | (55) | |||||||||||||||
| Net interest income after (provision for) benefit from credit losses | 837 | 1,109 | 66 | (644) | 1,368 | |||||||||||||||
| Noninterest income | 332 | 284 | 140 | (12) | 744 | |||||||||||||||
| Noninterest expense | (488) | (614) | (139) | (214) | (1,455) | |||||||||||||||
| Income (loss) before income taxes | 681 | 779 | 67 | (870) | 657 | |||||||||||||||
Applicable income tax (expense) benefit(a) |
(129) | (164) | (15) | 181 | (127) | |||||||||||||||
| Net income (loss) | $552 | $615 | $52 | $(689) | $530 | |||||||||||||||
For the three months ended September 30, 2023 |
Commercial Banking | Consumer and Small Business Banking |
Wealth
and Asset Management
|
Other/
Eliminations
|
Total | |||||||||||||||
Net interest income (FTE)(a) |
$1,012 | $1,390 | $98 | $(1,055) | $1,445 | |||||||||||||||
| Provision for credit losses | — | (105) | (1) | (13) | (119) | |||||||||||||||
| Net interest income after provision for credit losses | 1,012 | 1,285 | 97 | (1,068) | 1,326 | |||||||||||||||
| Noninterest income | 353 | 274 | 139 | (51) | 715 | |||||||||||||||
| Noninterest expense | (478) | (624) | (135) | 49 | (1,188) | |||||||||||||||
| Income (loss) before income taxes | 887 | 935 | 101 | (1,070) | 853 | |||||||||||||||
Applicable income tax (expense) benefit(a) |
(169) | (196) | (22) | 194 | (193) | |||||||||||||||
| Net income (loss) | $718 | $739 | $79 | $(876) | $660 | |||||||||||||||
For the three months ended June 30, 2023 |
Commercial Banking | Consumer and Small Business Banking |
Wealth
and Asset Management
|
Other/
Eliminations
|
Total | |||||||||||||||
Net interest income (FTE)(a) |
$1,025 | $1,370 | $95 | $(1,027) | $1,463 | |||||||||||||||
| (Provision for) benefit from credit losses | 9 | (65) | — | (121) | (177) | |||||||||||||||
| Net interest income after (provision for) benefit from credit losses | 1,034 | 1,305 | 95 | (1,148) | 1,286 | |||||||||||||||
| Noninterest income | 336 | 271 | 137 | (18) | 726 | |||||||||||||||
| Noninterest expense | (486) | (632) | (139) | 26 | (1,231) | |||||||||||||||
| Income (loss) before income taxes | 884 | 944 | 93 | (1,140) | 781 | |||||||||||||||
Applicable income tax (expense) benefit(a) |
(173) | (198) | (20) | 211 | (180) | |||||||||||||||
| Net income (loss) | $711 | $746 | $73 | $(929) | $601 | |||||||||||||||
For the three months ended March 31, 2023 |
Commercial Banking | Consumer and Small Business Banking |
Wealth
and Asset Management
|
Other/
Eliminations
|
Total | |||||||||||||||
Net interest income (FTE)(a) |
$980 | $1,257 | $101 | $(816) | $1,522 | |||||||||||||||
| Provision for credit losses | (46) | (51) | — | (67) | (164) | |||||||||||||||
| Net interest income after provision for credit losses | 934 | 1,206 | 101 | (883) | 1,358 | |||||||||||||||
| Noninterest income | 336 | 273 | 138 | (51) | 696 | |||||||||||||||
| Noninterest expense | (551) | (645) | (146) | 11 | (1,331) | |||||||||||||||
| Income (loss) before income taxes | 719 | 834 | 93 | (923) | 723 | |||||||||||||||
Applicable income tax (expense) benefit(a) |
(139) | (175) | (19) | 168 | (165) | |||||||||||||||
| Net income (loss) | $580 | $659 | $74 | $(755) | $558 | |||||||||||||||
For the three months ended December 31, 2022 |
Commercial Banking | Consumer and Small Business Banking |
Wealth
and Asset Management
|
Other/
Eliminations
|
Total | |||||||||||||||
Net interest income (FTE)(a) |
$876 | $1,151 | $94 | $(539) | $1,582 | |||||||||||||||
| (Provision for) benefit from credit losses | 11 | (46) | — | (145) | (180) | |||||||||||||||
| Net interest income after (provision for) benefit from credit losses | 887 | 1,105 | 94 | (684) | 1,402 | |||||||||||||||
| Noninterest income | 349 | 268 | 133 | (15) | 735 | |||||||||||||||
| Noninterest expense | (464) | (602) | (134) | (18) | (1,218) | |||||||||||||||
| Income (loss) before income taxes | 772 | 771 | 93 | (717) | 919 | |||||||||||||||
Applicable income tax (expense) benefit(a) |
(150) | (162) | (19) | 149 | (182) | |||||||||||||||
| Net income (loss) | $622 | $609 | $74 | $(568) | $737 | |||||||||||||||
(a) Includes taxable equivalent adjustments of $7 million for the three months ended December 31, 2023 and September 30, 2023, $6 million for the three months ended June 30, 2023 and $5 million for the three months ended March 31, 2023 and December 31, 2022. |
||||||||||||||||||||
