
COMMERCIAL METALS COMPANY Q3 FY 2023 Supplemental Slides

Forward-Looking Statements Q3 FY23 Supplemental Slides │ June 22, 2023 2 This presentation contains forward-looking statements within the meaning of the federal securities laws with respect to general economic conditions, key macro-economic drivers that impact our business, the effects of ongoing trade actions, the effects of continued pressure on the liquidity of our customers, potential synergies and organic growth provided by acquisitions and strategic investments, demand for our products, shipment volumes, metal margins, the ability to operate our steel mills at full capacity, future availability and cost of supplies of raw materials and energy for our operations, share repurchases, legal proceedings, construction activity, international trade, the impact of the Russian invasion of Ukraine, capital expenditures, tax credits, our liquidity and our ability to satisfy future liquidity requirements, estimated contractual obligations, the expected capabilities and benefits of new facilities, the timeline for execution of our growth plan, and our expectations or beliefs concerning future events. The statements in this presentation that are not historical statements, are forward-looking statements. These forward-looking statements can generally be identified by phrases such as we or our management "expects," "anticipates," "believes," "estimates," "future," "intends," "may," "plans to," "ought," "could," "will," "should," "likely," "appears," "projects," "forecasts," "outlook" or other similar words or phrases, as well as by discussions of strategy, plans, or intentions. Our forward-looking statements are based on management’s expectations and beliefs as of the date of this presentation. Although we believe that our expectations are reasonable, we can give no assurance that these expectations will prove to have been correct, and actual results may vary materially. Except as required by law, we undertake no obligation to update, amend or clarify any forward-looking statements to reflect changed assumptions, the occurrence of anticipated or unanticipated events, new information or circumstances or any other changes. Important factors that could cause actual results to differ materially from our expectations include those described in our filings with the Securities and Exchange Commission, including, but not limited to, in Part I, Item 1A, "Risk Factors" of our annual report on Form 10-K for the fiscal year ended August 31, 2022 and Part II, Item 1A, “Risk Factors” of our most recent quarterly report on 10-Q, as well as the following: changes in economic conditions which affect demand for our products or construction activity generally, and the impact of such changes on the highly cyclical steel industry; rapid and significant changes in the price of metals, potentially impairing our inventory values due to declines in commodity prices or reducing the profitability of our downstream contracts due to rising commodity pricing; impacts from global health crises, including the COVID-19 pandemic, on the economy, demand for our products, global supply chain and on our operations; excess capacity in our industry, particularly in China, and product availability from competing steel mills and other steel suppliers including import quantities and pricing; the impact of the Russian invasion of Ukraine on the global economy, inflation, energy supplies and raw materials; increased attention to environmental, social and governance (“ESG”) matters, including any targets or other ESG or environmental justice initiatives; operating and startup risks, as well as market risks associated with the commissioning of new projects could prevent us from realizing anticipated benefits and could result in a loss of all or a substantial part of our investments; compliance with and changes in existing and future laws, regulations and other legal requirements and judicial decisions that govern our business, including increased environmental regulations associated with climate change and greenhouse gas emissions; involvement in various environmental matters that may result in fines, penalties or judgments; evolving remediation technology, changing regulations, possible third-party contributions, the inherent uncertainties of the estimation process and other factors that may impact amounts accrued for environmental liabilities; potential limitations in our or our customers' abilities to access credit and non- compliance of their contractual obligations, including payment obligations; activity in repurchasing shares of our common stock under our repurchase program; financial covenants and restrictions on the operation of our business contained in agreements governing our debt; our ability to successfully identify, consummate and integrate acquisitions and realize any or all of the anticipated synergies or other benefits of acquisitions; the effects that acquisitions may have on our financial leverage; risks associated with acquisitions generally, such as the inability to obtain, or delays in obtaining, required approvals under applicable antitrust legislation and other regulatory and third party consents and approvals; lower than expected future levels of revenues and higher than expected future costs; failure or inability to implement growth strategies in a timely manner; impact of goodwill or other indefinite lived intangible asset impairment charges; impact of long-lived asset impairment charges; currency fluctuations; global factors, such as trade measures, military conflicts and political uncertainties, including changes to current trade regulations, such as Section 232 trade tariffs and quotas, tax legislation and other regulations which might adversely impact our business; availability and pricing of electricity, electrodes and natural gas for mill operations; ability to hire and retain key executives and other employees; competition from other materials or from competitors that have a lower cost structure or access to greater financial resources; information technology interruptions and breaches in security; ability to make necessary capital expenditures; availability and pricing of raw materials and other items over which we exert little influence, including scrap metal, energy and insurance; unexpected equipment failures; losses or limited potential gains due to hedging transactions; litigation claims and settlements, court decisions, regulatory rulings and legal compliance risks; risk of injury or death to employees, customers or other visitors to our operations; and civil unrest, protests and riots. .
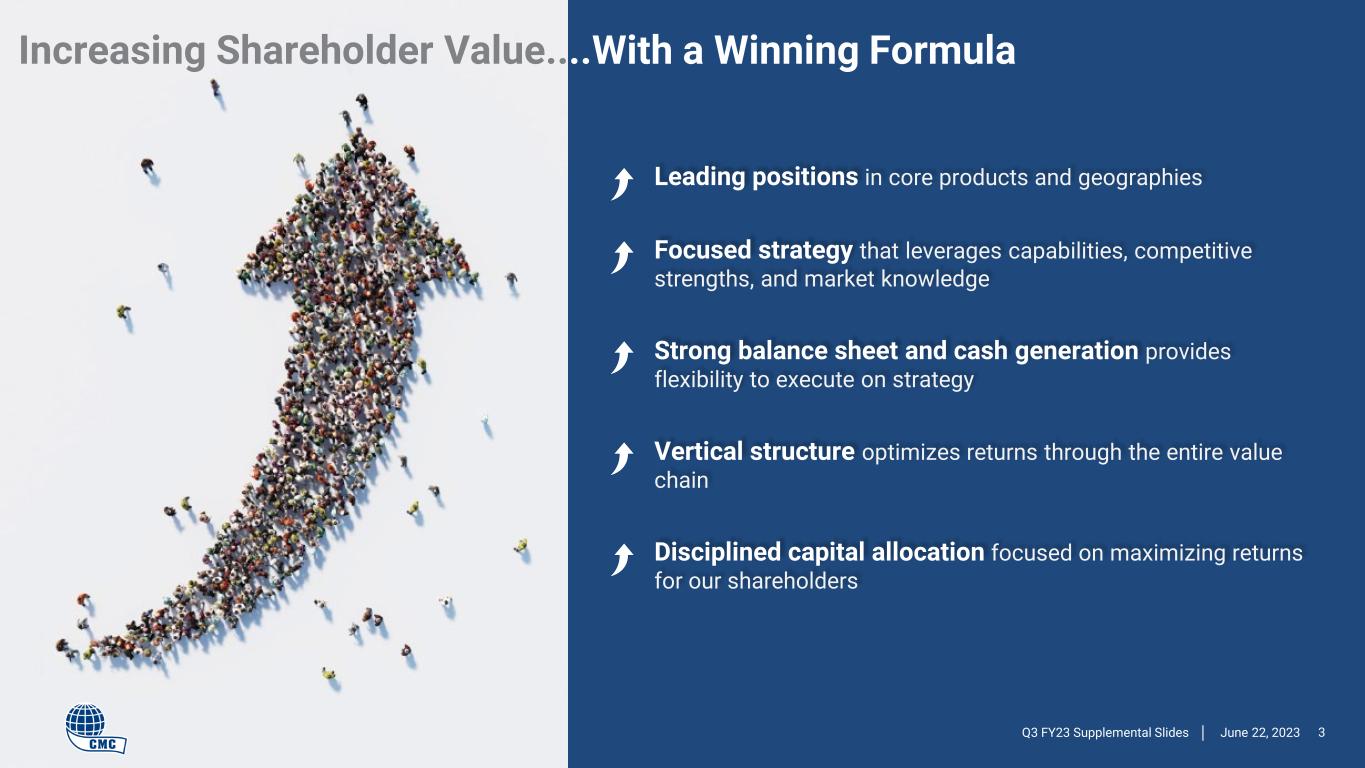
3Q3 FY23 Supplemental Slides │ June 22, 2023 Leading positions in core products and geographies Focused strategy that leverages capabilities, competitive strengths, and market knowledge Strong balance sheet and cash generation provides flexibility to execute on strategy Vertical structure optimizes returns through the entire value chain Disciplined capital allocation focused on maximizing returns for our shareholders Increasing Shareholder Value....With a Winning Formula
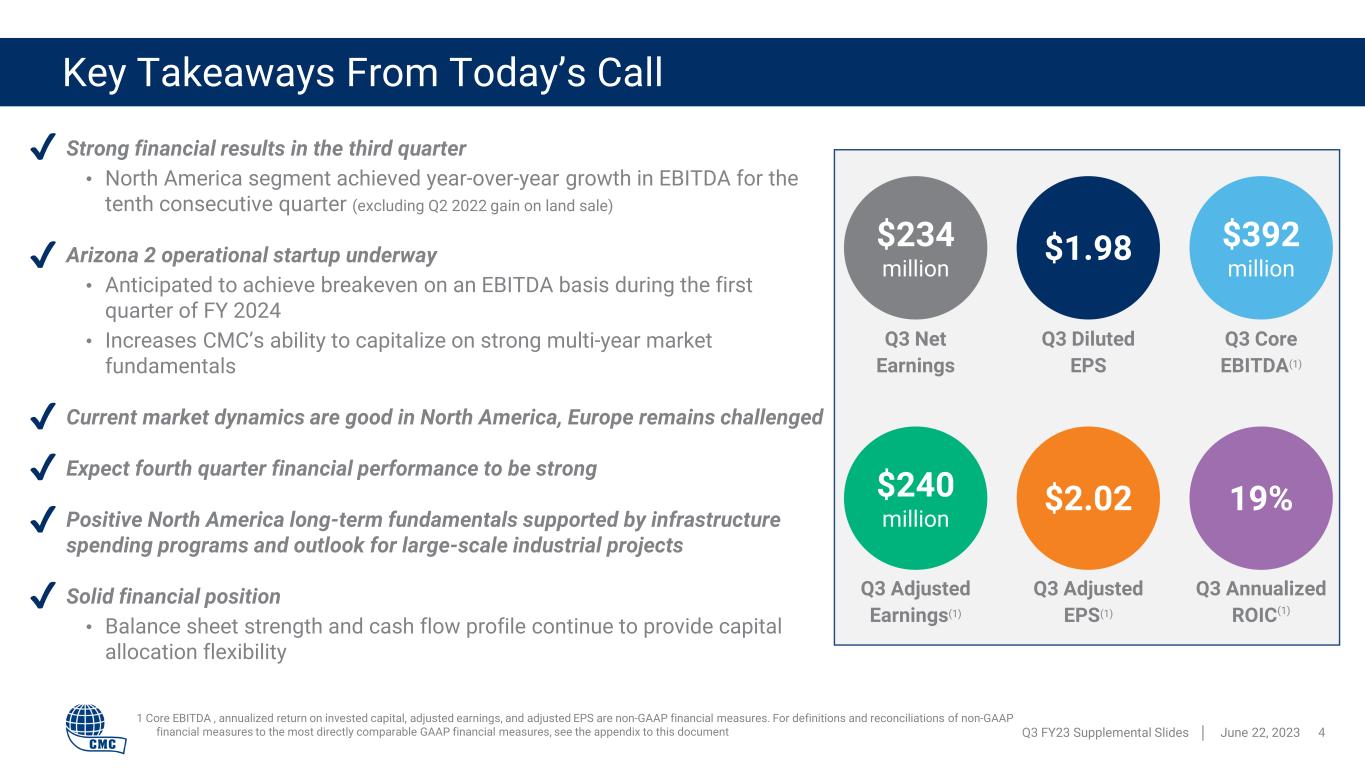
Strong financial results in the third quarter • North America segment achieved year-over-year growth in EBITDA for the tenth consecutive quarter (excluding Q2 2022 gain on land sale) Arizona 2 operational startup underway • Anticipated to achieve breakeven on an EBITDA basis during the first quarter of FY 2024 • Increases CMC’s ability to capitalize on strong multi-year market fundamentals Current market dynamics are good in North America, Europe remains challenged Expect fourth quarter financial performance to be strong Positive North America long-term fundamentals supported by infrastructure spending programs and outlook for large-scale industrial projects Solid financial position • Balance sheet strength and cash flow profile continue to provide capital allocation flexibility Key Takeaways From Today’s Call Q3 FY23 Supplemental Slides │ June 22, 2023 4 $1.98 Q3 Diluted EPS 1 Core EBITDA , annualized return on invested capital, adjusted earnings, and adjusted EPS are non-GAAP financial measures. For definitions and reconciliations of non-GAAP financial measures to the most directly comparable GAAP financial measures, see the appendix to this document $392 million $2.02 19% Q3 Core EBITDA(1) Q3 Adjusted EPS(1) Q3 Annualized ROIC(1) ✔ ✔ ✔ ✔ ✔ ✔ $234 million Q3 Net Earnings $240 million Q3 Adjusted Earnings(1)
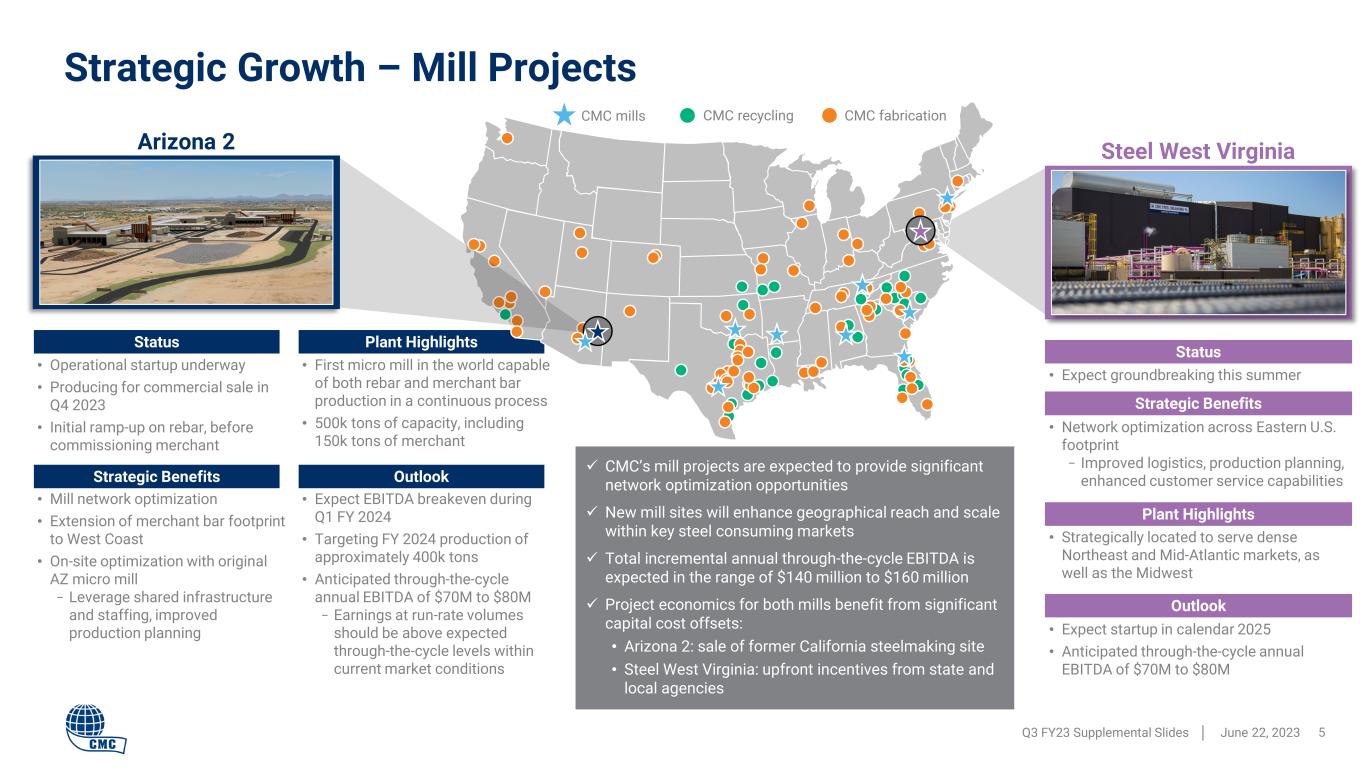
• Operational startup underway • Producing for commercial sale in Q4 2023 • Initial ramp-up on rebar, before commissioning merchant • First micro mill in the world capable of both rebar and merchant bar production in a continuous process • 500k tons of capacity, including 150k tons of merchant • Mill network optimization • Extension of merchant bar footprint to West Coast • On-site optimization with original AZ micro mill − Leverage shared infrastructure and staffing, improved production planning • Expect EBITDA breakeven during Q1 FY 2024 • Targeting FY 2024 production of approximately 400k tons • Anticipated through-the-cycle annual EBITDA of $70M to $80M − Earnings at run-rate volumes should be above expected through-the-cycle levels within current market conditions OutlookStrategic Benefits Status Plant Highlights Strategic Growth – Mill Projects Q3 FY23 Supplemental Slides │ June 22, 2023 5 Arizona 2 • Expect groundbreaking this summer • Network optimization across Eastern U.S. footprint − Improved logistics, production planning, enhanced customer service capabilities • Strategically located to serve dense Northeast and Mid-Atlantic markets, as well as the Midwest • Expect startup in calendar 2025 • Anticipated through-the-cycle annual EBITDA of $70M to $80M Strategic Benefits Status Plant Highlights Outlook CMC’s mill projects are expected to provide significant network optimization opportunities New mill sites will enhance geographical reach and scale within key steel consuming markets Total incremental annual through-the-cycle EBITDA is expected in the range of $140 million to $160 million Project economics for both mills benefit from significant capital cost offsets: • Arizona 2: sale of former California steelmaking site • Steel West Virginia: upfront incentives from state and local agencies CMC recycling CMC fabricationCMC mills Steel West Virginia
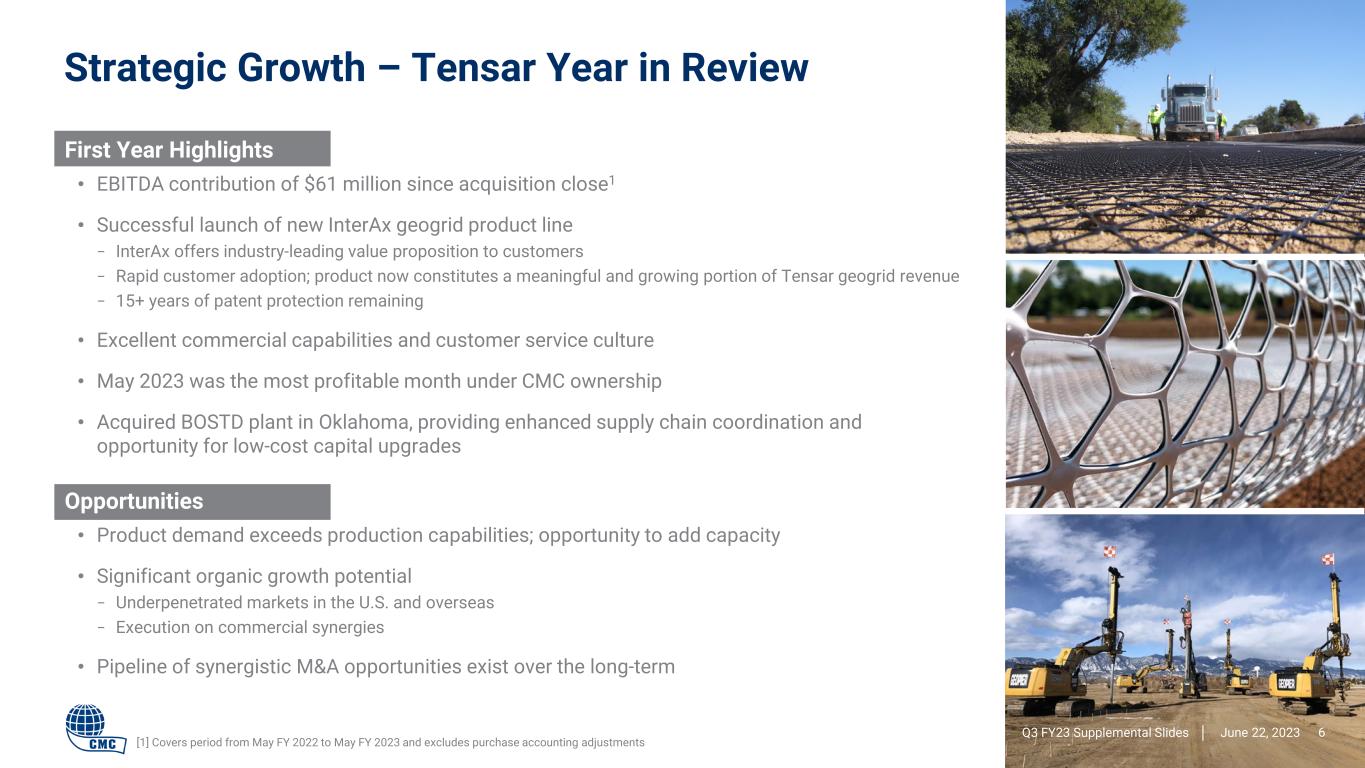
Opportunities • Product demand exceeds production capabilities; opportunity to add capacity • Significant organic growth potential − Underpenetrated markets in the U.S. and overseas − Execution on commercial synergies • Pipeline of synergistic M&A opportunities exist over the long-term First Year Highlights • EBITDA contribution of $61 million since acquisition close1 • Successful launch of new InterAx geogrid product line − InterAx offers industry-leading value proposition to customers − Rapid customer adoption; product now constitutes a meaningful and growing portion of Tensar geogrid revenue − 15+ years of patent protection remaining • Excellent commercial capabilities and customer service culture • May 2023 was the most profitable month under CMC ownership • Acquired BOSTD plant in Oklahoma, providing enhanced supply chain coordination and opportunity for low-cost capital upgrades Strategic Growth – Tensar Year in Review Q3 FY23 Supplemental Slides │ June 22, 2023 6 [1] Covers period from May FY 2022 to May FY 2023 and excludes purchase accounting adjustments
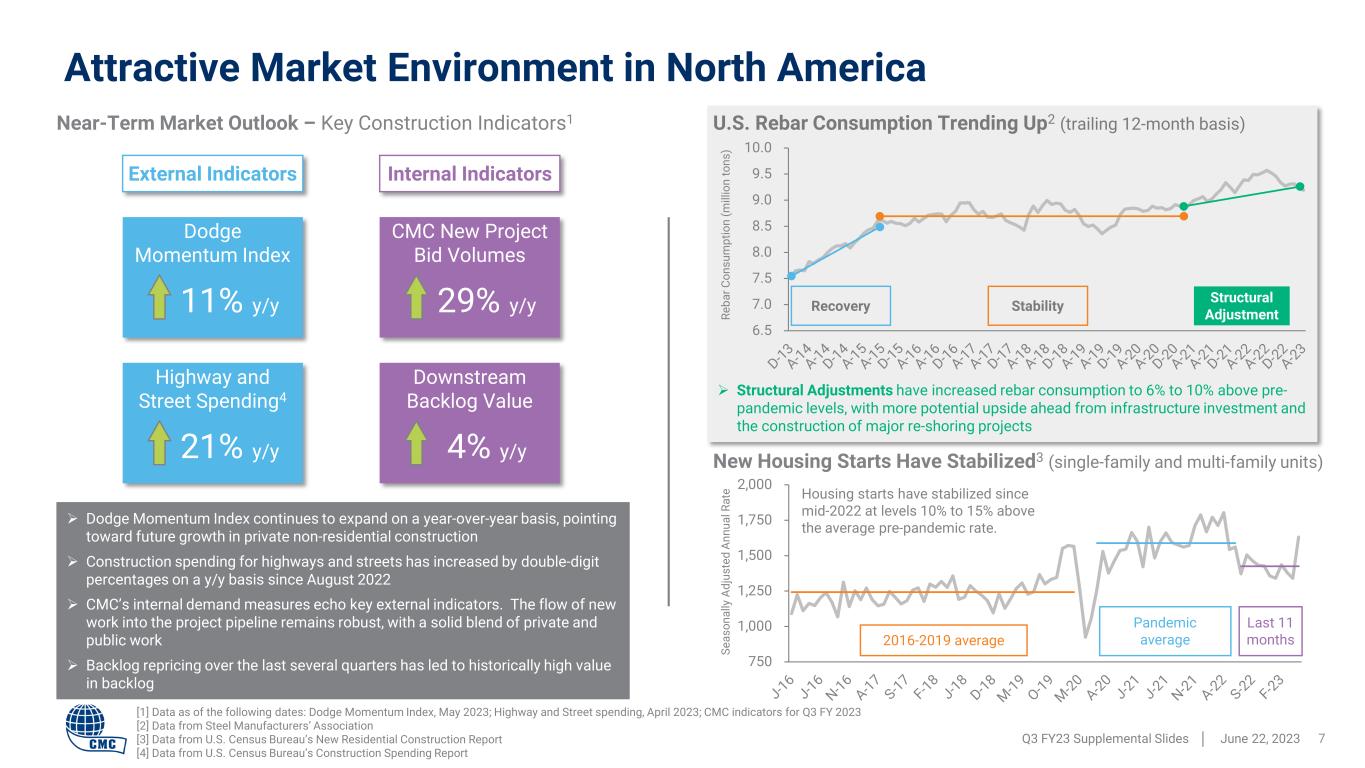
750 1,000 1,250 1,500 1,750 2,000 Attractive Market Environment in North America Dodge Momentum Index continues to expand on a year-over-year basis, pointing toward future growth in private non-residential construction Construction spending for highways and streets has increased by double-digit percentages on a y/y basis since August 2022 CMC’s internal demand measures echo key external indicators. The flow of new work into the project pipeline remains robust, with a solid blend of private and public work Backlog repricing over the last several quarters has led to historically high value in backlog Q3 FY23 Supplemental Slides │ June 22, 2023 7 [1] Data as of the following dates: Dodge Momentum Index, May 2023; Highway and Street spending, April 2023; CMC indicators for Q3 FY 2023 [2] Data from Steel Manufacturers’ Association [3] Data from U.S. Census Bureau’s New Residential Construction Report [4] Data from U.S. Census Bureau’s Construction Spending Report Dodge Momentum Index 11% y/y Highway and Street Spending4 21% y/y CMC New Project Bid Volumes 29% y/y Downstream Backlog Value 4% y/y Near-Term Market Outlook – Key Construction Indicators1 External Indicators Internal Indicators Structural Adjustments have increased rebar consumption to 6% to 10% above pre- pandemic levels, with more potential upside ahead from infrastructure investment and the construction of major re-shoring projects Re ba r C on su m pt io n (m ill io n to ns ) U.S. Rebar Consumption Trending Up2 (trailing 12-month basis) 6.5 7.0 7.5 8.0 8.5 9.0 9.5 10.0 Recovery Stability Structural Adjustment New Housing Starts Have Stabilized3 (single-family and multi-family units) Se as on al ly A dj us te d An nu al R at e Housing starts have stabilized since mid-2022 at levels 10% to 15% above the average pre-pandemic rate. 2016-2019 average Pandemic average Last 11 months
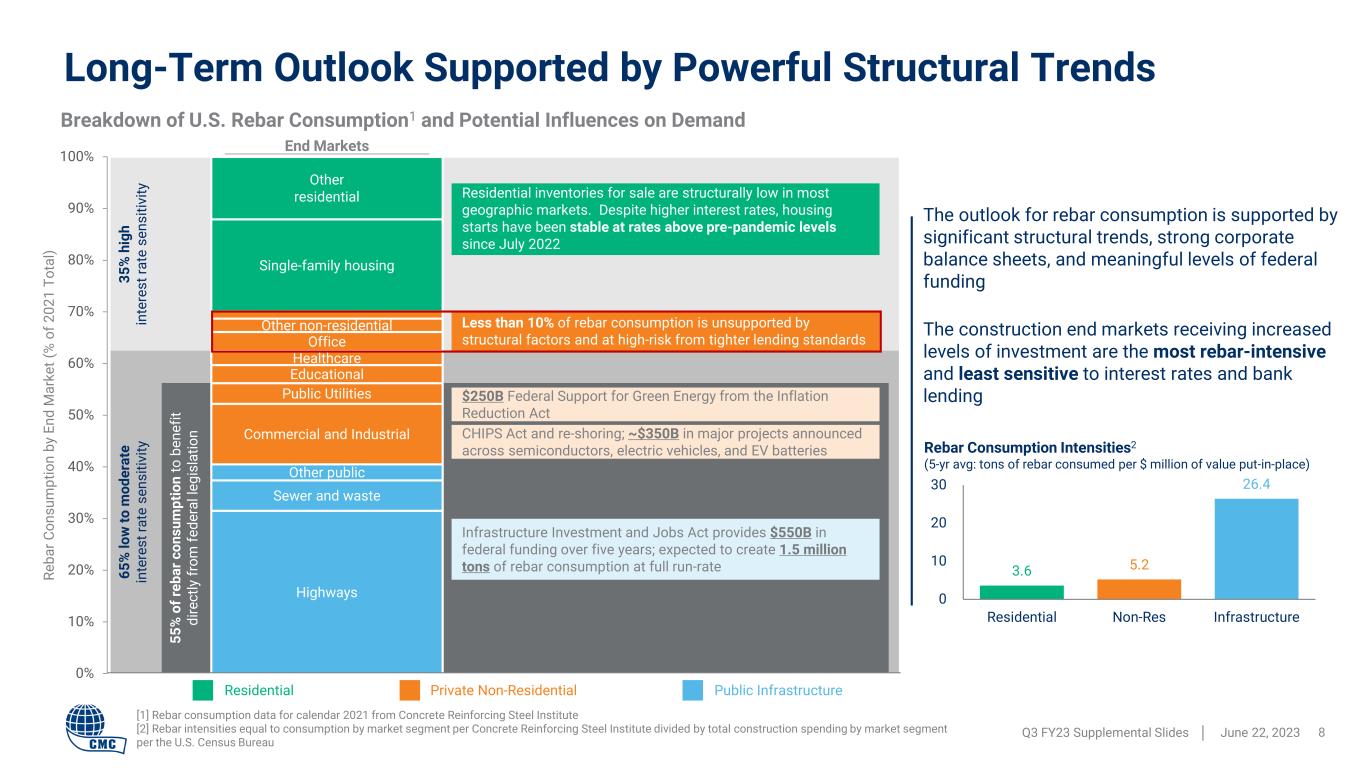
Long-Term Outlook Supported by Powerful Structural Trends Q3 FY23 Supplemental Slides │ June 22, 2023 8 [1] Rebar consumption data for calendar 2021 from Concrete Reinforcing Steel Institute [2] Rebar intensities equal to consumption by market segment per Concrete Reinforcing Steel Institute divided by total construction spending by market segment per the U.S. Census Bureau Breakdown of U.S. Rebar Consumption1 and Potential Influences on Demand The outlook for rebar consumption is supported by significant structural trends, strong corporate balance sheets, and meaningful levels of federal funding The construction end markets receiving increased levels of investment are the most rebar-intensive and least sensitive to interest rates and bank lending 3.6 5.2 26.4 0 10 20 30 Residential Non-Res Infrastructure Rebar Consumption Intensities2 (5-yr avg: tons of rebar consumed per $ million of value put-in-place) 35 % h ig h in te re st ra te s en si tiv ity 65 % lo w to m od er at e in te re st ra te s en si tiv ity 55 % o f r eb ar c on su m pt io n to b en ef it di re ct ly fr om fe de ra l l eg is la tio n Highways Sewer and waste Other public Commercial and Industrial Public Utilities Educational Healthcare Office Other non-residential Single-family housing Other residential 0% 10% 20% 30% 40% 50% 60% 70% 80% 90% 100% $250B Federal Support for Green Energy from the Inflation Reduction Act CHIPS Act and re-shoring; ~$350B in major projects announced across semiconductors, electric vehicles, and EV batteries Infrastructure Investment and Jobs Act provides $550B in federal funding over five years; expected to create 1.5 million tons of rebar consumption at full run-rate Residential inventories for sale are structurally low in most geographic markets. Despite higher interest rates, housing starts have been stable at rates above pre-pandemic levels since July 2022 Less than 10% of rebar consumption is unsupported by structural factors and at high-risk from tighter lending standards Re ba r C on su m pt io n by E nd M ar ke t ( % o f 2 02 1 To ta l) End Markets Residential Private Non-Residential Public Infrastructure
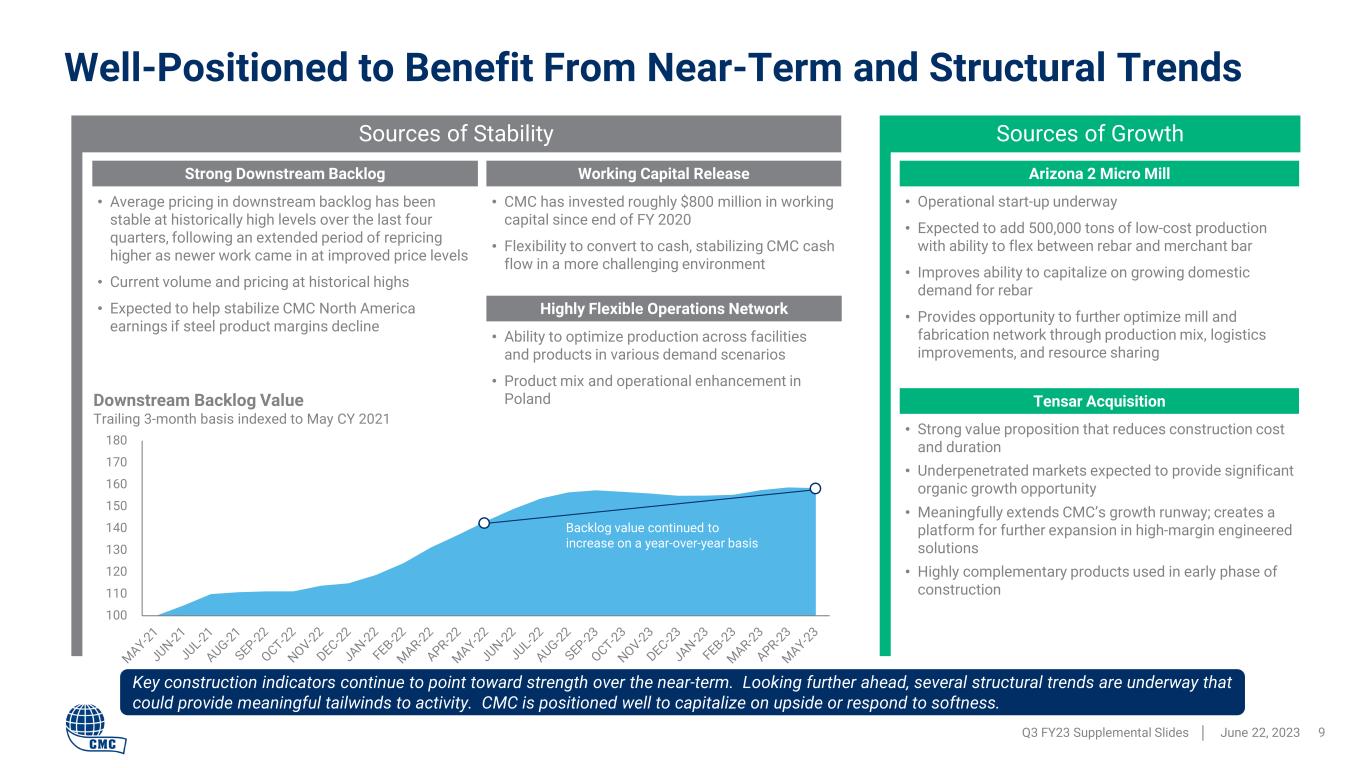
100 110 120 130 140 150 160 170 180 Well-Positioned to Benefit From Near-Term and Structural Trends Key construction indicators continue to point toward strength over the near-term. Looking further ahead, several structural trends are underway that could provide meaningful tailwinds to activity. CMC is positioned well to capitalize on upside or respond to softness. Q3 FY23 Supplemental Slides │ June 22, 2023 9 Arizona 2 Micro Mill • Operational start-up underway • Expected to add 500,000 tons of low-cost production with ability to flex between rebar and merchant bar • Improves ability to capitalize on growing domestic demand for rebar • Provides opportunity to further optimize mill and fabrication network through production mix, logistics improvements, and resource sharing Tensar Acquisition • Strong value proposition that reduces construction cost and duration • Underpenetrated markets expected to provide significant organic growth opportunity • Meaningfully extends CMC’s growth runway; creates a platform for further expansion in high-margin engineered solutions • Highly complementary products used in early phase of construction Strong Downstream Backlog • Average pricing in downstream backlog has been stable at historically high levels over the last four quarters, following an extended period of repricing higher as newer work came in at improved price levels • Current volume and pricing at historical highs • Expected to help stabilize CMC North America earnings if steel product margins decline Working Capital Release • CMC has invested roughly $800 million in working capital since end of FY 2020 • Flexibility to convert to cash, stabilizing CMC cash flow in a more challenging environment Highly Flexible Operations Network • Ability to optimize production across facilities and products in various demand scenarios • Product mix and operational enhancement in Poland Sources of GrowthSources of Stability Downstream Backlog Value Trailing 3-month basis indexed to May CY 2021 Backlog value continued to increase on a year-over-year basis
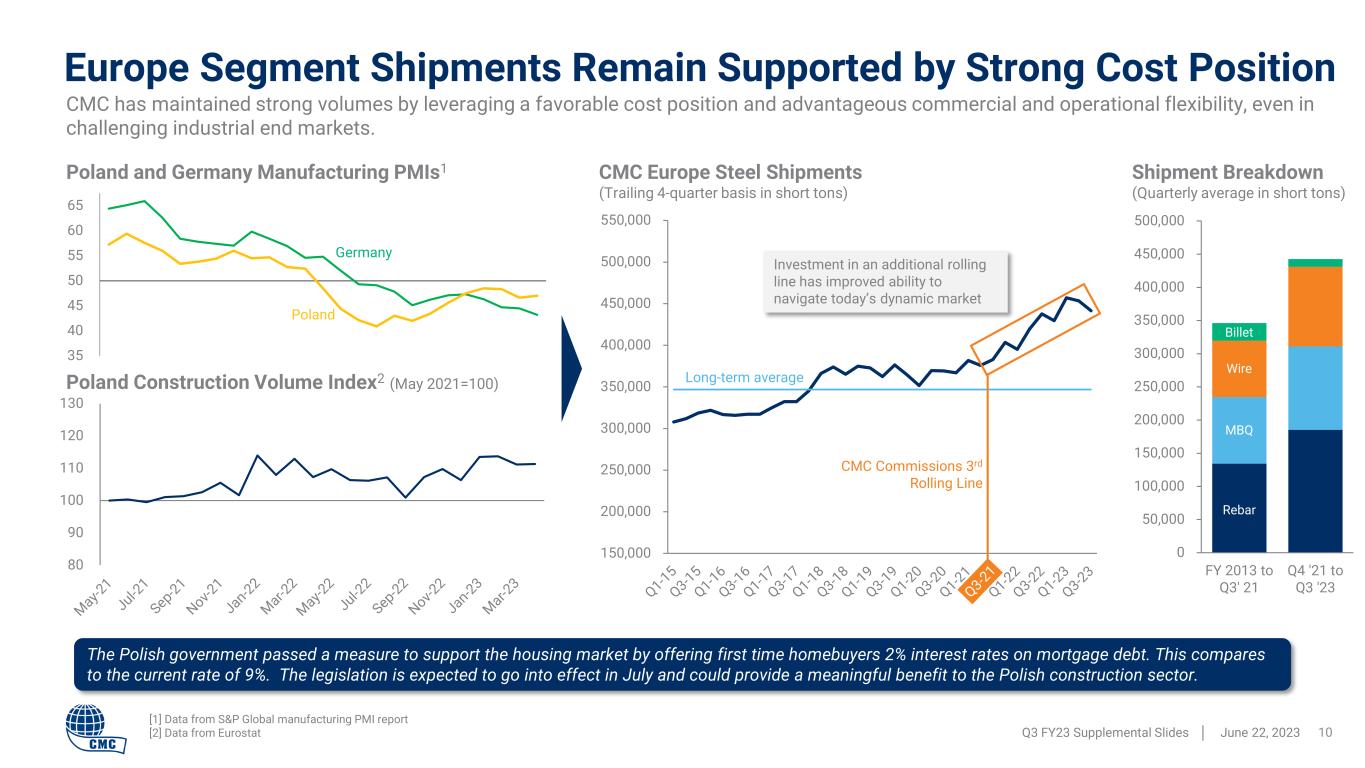
0 50,000 100,000 150,000 200,000 250,000 300,000 350,000 400,000 450,000 500,000 FY 2013 to Q3' 21 Q4 '21 to Q3 '23 150,000 200,000 250,000 300,000 350,000 400,000 450,000 500,000 550,000 35 40 45 50 55 60 65 Europe Segment Shipments Remain Supported by Strong Cost Position Q3 FY23 Supplemental Slides │ June 22, 2023 10 Poland and Germany Manufacturing PMIs1 [1] Data from S&P Global manufacturing PMI report [2] Data from Eurostat Long-term average CMC Commissions 3rd Rolling Line CMC Europe Steel Shipments (Trailing 4-quarter basis in short tons) Rebar MBQ Wire Billet Shipment Breakdown (Quarterly average in short tons) The Polish government passed a measure to support the housing market by offering first time homebuyers 2% interest rates on mortgage debt. This compares to the current rate of 9%. The legislation is expected to go into effect in July and could provide a meaningful benefit to the Polish construction sector. 80 90 100 110 120 130 Poland Construction Volume Index2 (May 2021=100) CMC has maintained strong volumes by leveraging a favorable cost position and advantageous commercial and operational flexibility, even in challenging industrial end markets. Investment in an additional rolling line has improved ability to navigate today’s dynamic market Germany Poland
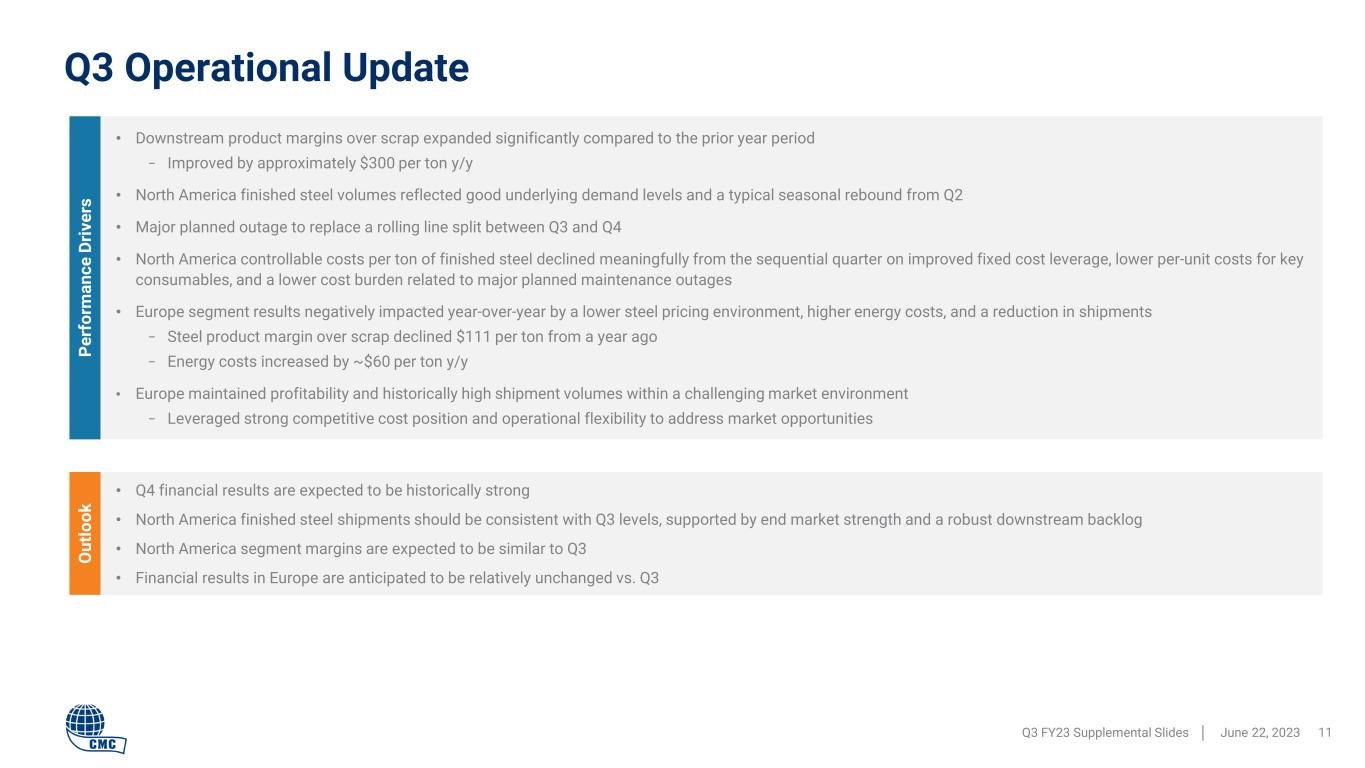
• Downstream product margins over scrap expanded significantly compared to the prior year period − Improved by approximately $300 per ton y/y • North America finished steel volumes reflected good underlying demand levels and a typical seasonal rebound from Q2 • Major planned outage to replace a rolling line split between Q3 and Q4 • North America controllable costs per ton of finished steel declined meaningfully from the sequential quarter on improved fixed cost leverage, lower per-unit costs for key consumables, and a lower cost burden related to major planned maintenance outages • Europe segment results negatively impacted year-over-year by a lower steel pricing environment, higher energy costs, and a reduction in shipments − Steel product margin over scrap declined $111 per ton from a year ago − Energy costs increased by ~$60 per ton y/y • Europe maintained profitability and historically high shipment volumes within a challenging market environment − Leveraged strong competitive cost position and operational flexibility to address market opportunities • Q4 financial results are expected to be historically strong • North America finished steel shipments should be consistent with Q3 levels, supported by end market strength and a robust downstream backlog • North America segment margins are expected to be similar to Q3 • Financial results in Europe are anticipated to be relatively unchanged vs. Q3 Pe rf or m an ce D riv er s O ut lo ok Q3 Operational Update Q3 FY23 Supplemental Slides │ June 22, 2023 11
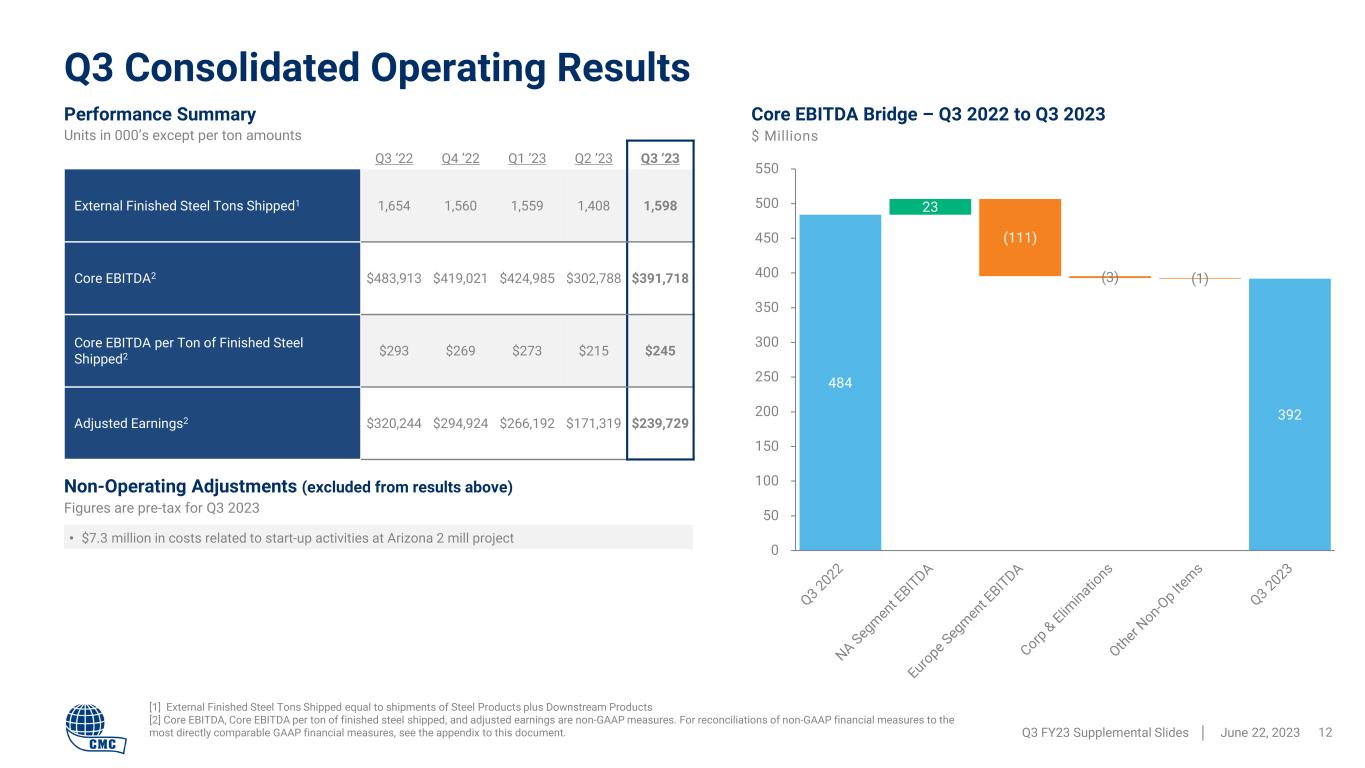
484 392 23 (111) (3) (1) 0 50 100 150 200 250 300 350 400 450 500 550 Q3 Consolidated Operating Results Q3 FY23 Supplemental Slides │ June 22, 2023 12 Q3 ‘22 Q4 ’22 Q1 ’23 Q2 ’23 Q3 ’23 External Finished Steel Tons Shipped1 1,654 1,560 1,559 1,408 1,598 Core EBITDA2 $483,913 $419,021 $424,985 $302,788 $391,718 Core EBITDA per Ton of Finished Steel Shipped2 $293 $269 $273 $215 $245 Adjusted Earnings2 $320,244 $294,924 $266,192 $171,319 $239,729 Performance Summary Units in 000’s except per ton amounts • $7.3 million in costs related to start-up activities at Arizona 2 mill project Non-Operating Adjustments (excluded from results above) Figures are pre-tax for Q3 2023 [1] External Finished Steel Tons Shipped equal to shipments of Steel Products plus Downstream Products [2] Core EBITDA, Core EBITDA per ton of finished steel shipped, and adjusted earnings are non-GAAP measures. For reconciliations of non-GAAP financial measures to the most directly comparable GAAP financial measures, see the appendix to this document. Core EBITDA Bridge – Q3 2022 to Q3 2023 $ Millions
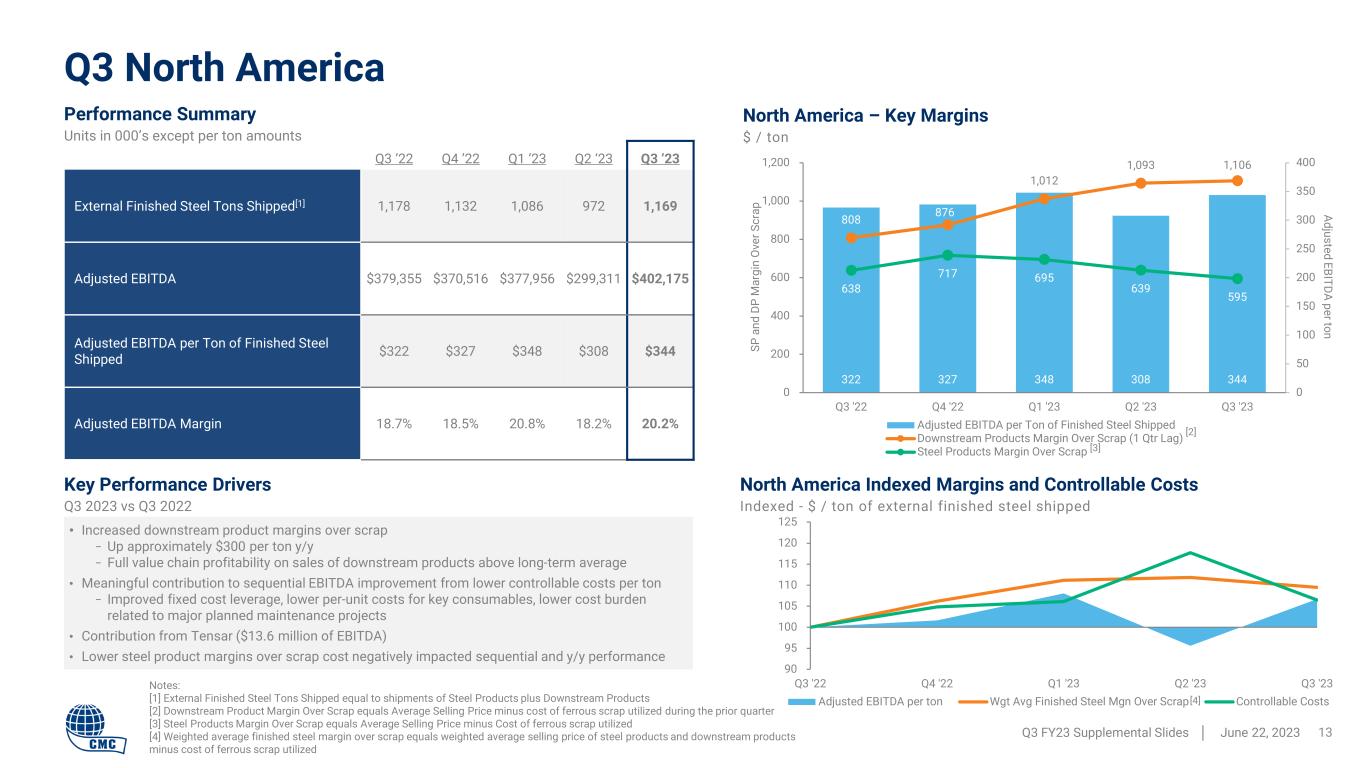
90 95 100 105 110 115 120 125 Q3 '22 Q4 '22 Q1 '23 Q2 '23 Q3 '23 Adjusted EBITDA per ton Wgt Avg Finished Steel Mgn Over Scrap Controllable Costs 322 327 348 308 344 808 876 1,012 1,093 1,106 638 717 695 639 595 0 50 100 150 200 250 300 350 400 0 200 400 600 800 1,000 1,200 Q3 '22 Q4 '22 Q1 '23 Q2 '23 Q3 '23 Adjusted EBITDA per Ton of Finished Steel Shipped Downstream Products Margin Over Scrap (1 Qtr Lag) Steel Products Margin Over Scrap Key Performance Drivers Q3 2023 vs Q3 2022 Q3 North America Q3 FY23 Supplemental Slides │ June 22, 2023 13 Q3 ’22 Q4 ’22 Q1 ‘23 Q2 ‘23 Q3 ’23 External Finished Steel Tons Shipped[1] 1,178 1,132 1,086 972 1,169 Adjusted EBITDA $379,355 $370,516 $377,956 $299,311 $402,175 Adjusted EBITDA per Ton of Finished Steel Shipped $322 $327 $348 $308 $344 Adjusted EBITDA Margin 18.7% 18.5% 20.8% 18.2% 20.2% Performance Summary Units in 000’s except per ton amounts • Increased downstream product margins over scrap − Up approximately $300 per ton y/y − Full value chain profitability on sales of downstream products above long-term average • Meaningful contribution to sequential EBITDA improvement from lower controllable costs per ton − Improved fixed cost leverage, lower per-unit costs for key consumables, lower cost burden related to major planned maintenance projects • Contribution from Tensar ($13.6 million of EBITDA) • Lower steel product margins over scrap cost negatively impacted sequential and y/y performance Notes: [1] External Finished Steel Tons Shipped equal to shipments of Steel Products plus Downstream Products [2] Downstream Product Margin Over Scrap equals Average Selling Price minus cost of ferrous scrap utilized during the prior quarter [3] Steel Products Margin Over Scrap equals Average Selling Price minus Cost of ferrous scrap utilized [4] Weighted average finished steel margin over scrap equals weighted average selling price of steel products and downstream products minus cost of ferrous scrap utilized North America – Key Margins $ / ton SP a nd D P M ar gi n O ve r S cr ap Adjusted EBITDA per ton North America Indexed Margins and Controllable Costs Indexed - $ / ton of external finished steel shipped [2] [4] [3]
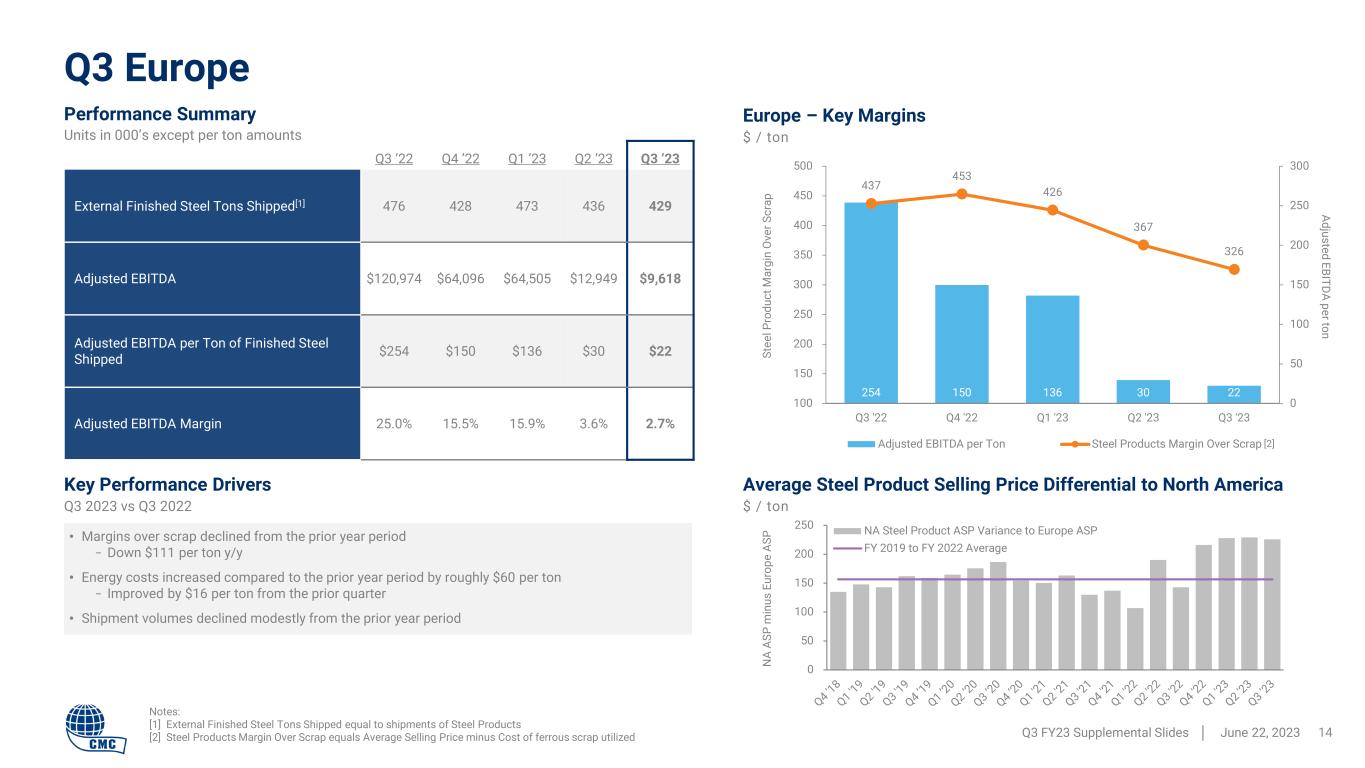
0 50 100 150 200 250 NA Steel Product ASP Variance to Europe ASP FY 2019 to FY 2022 Average 254 150 136 30 22 437 453 426 367 326 0 50 100 150 200 250 300 100 150 200 250 300 350 400 450 500 Q3 '22 Q4 '22 Q1 '23 Q2 '23 Q3 '23 Adjusted EBITDA per Ton Steel Products Margin Over Scrap Key Performance Drivers Q3 2023 vs Q3 2022 Q3 Europe Q3 FY23 Supplemental Slides │ June 22, 2023 14 Q3 ’22 Q4 ’22 Q1 ’23 Q2 ’23 Q3 ’23 External Finished Steel Tons Shipped[1] 476 428 473 436 429 Adjusted EBITDA $120,974 $64,096 $64,505 $12,949 $9,618 Adjusted EBITDA per Ton of Finished Steel Shipped $254 $150 $136 $30 $22 Adjusted EBITDA Margin 25.0% 15.5% 15.9% 3.6% 2.7% Performance Summary Units in 000’s except per ton amounts • Margins over scrap declined from the prior year period − Down $111 per ton y/y • Energy costs increased compared to the prior year period by roughly $60 per ton − Improved by $16 per ton from the prior quarter • Shipment volumes declined modestly from the prior year period Europe – Key Margins $ / ton Adjusted EBITDA per ton Average Steel Product Selling Price Differential to North America $ / ton [2] Notes: [1] External Finished Steel Tons Shipped equal to shipments of Steel Products [2] Steel Products Margin Over Scrap equals Average Selling Price minus Cost of ferrous scrap utilized St ee l P ro du ct M ar gi n O ve r S cr ap N A AS P m in us E ur op e AS P
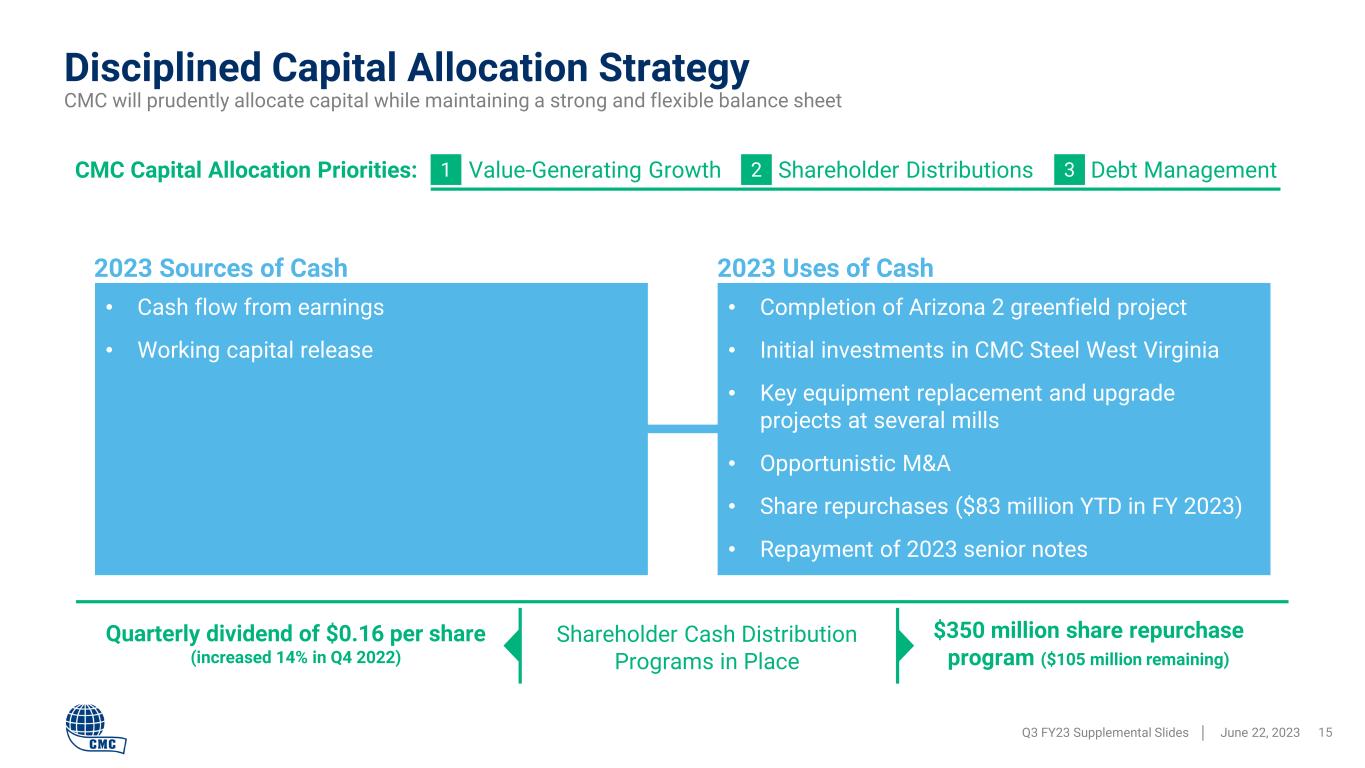
2 31 Disciplined Capital Allocation Strategy Q3 FY23 Supplemental Slides │ June 22, 2023 15 CMC Capital Allocation Priorities: $350 million share repurchase program ($105 million remaining) Quarterly dividend of $0.16 per share (increased 14% in Q4 2022) Shareholder Cash Distribution Programs in Place • Cash flow from earnings • Working capital release • Completion of Arizona 2 greenfield project • Initial investments in CMC Steel West Virginia • Key equipment replacement and upgrade projects at several mills • Opportunistic M&A • Share repurchases ($83 million YTD in FY 2023) • Repayment of 2023 senior notes Value-Generating Growth Shareholder Distributions Debt Management CMC will prudently allocate capital while maintaining a strong and flexible balance sheet 2023 Sources of Cash 2023 Uses of Cash
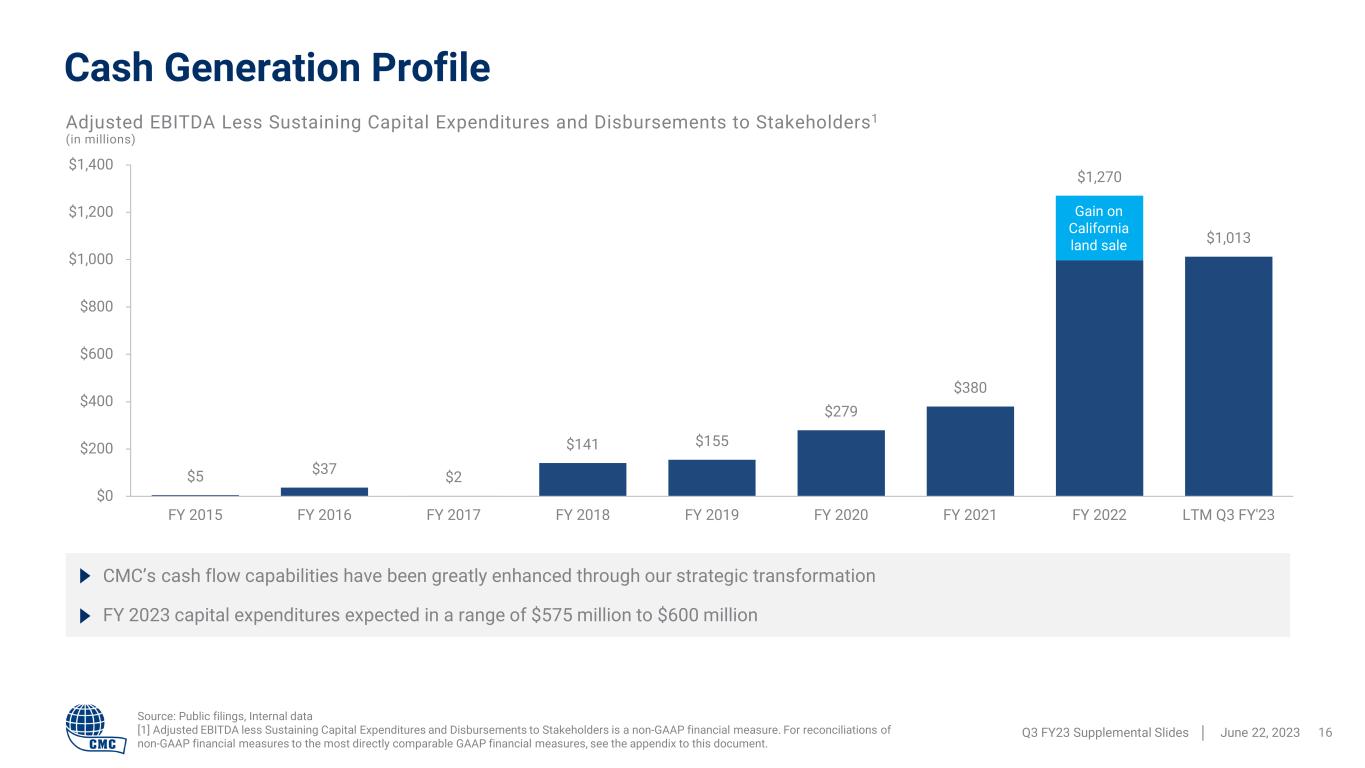
$5 $37 $2 $141 $155 $279 $380 $1,270 $1,013 $0 $200 $400 $600 $800 $1,000 $1,200 $1,400 FY 2015 FY 2016 FY 2017 FY 2018 FY 2019 FY 2020 FY 2021 FY 2022 LTM Q3 FY'23 Cash Generation Profile Q3 FY23 Supplemental Slides │ June 22, 2023 16 Adjusted EBITDA Less Sustaining Capital Expenditures and Disbursements to Stakeholders1 (in millions) CMC’s cash flow capabilities have been greatly enhanced through our strategic transformation FY 2023 capital expenditures expected in a range of $575 million to $600 million Source: Public filings, Internal data [1] Adjusted EBITDA less Sustaining Capital Expenditures and Disbursements to Stakeholders is a non-GAAP financial measure. For reconciliations of non-GAAP financial measures to the most directly comparable GAAP financial measures, see the appendix to this document. Gain on California land sale
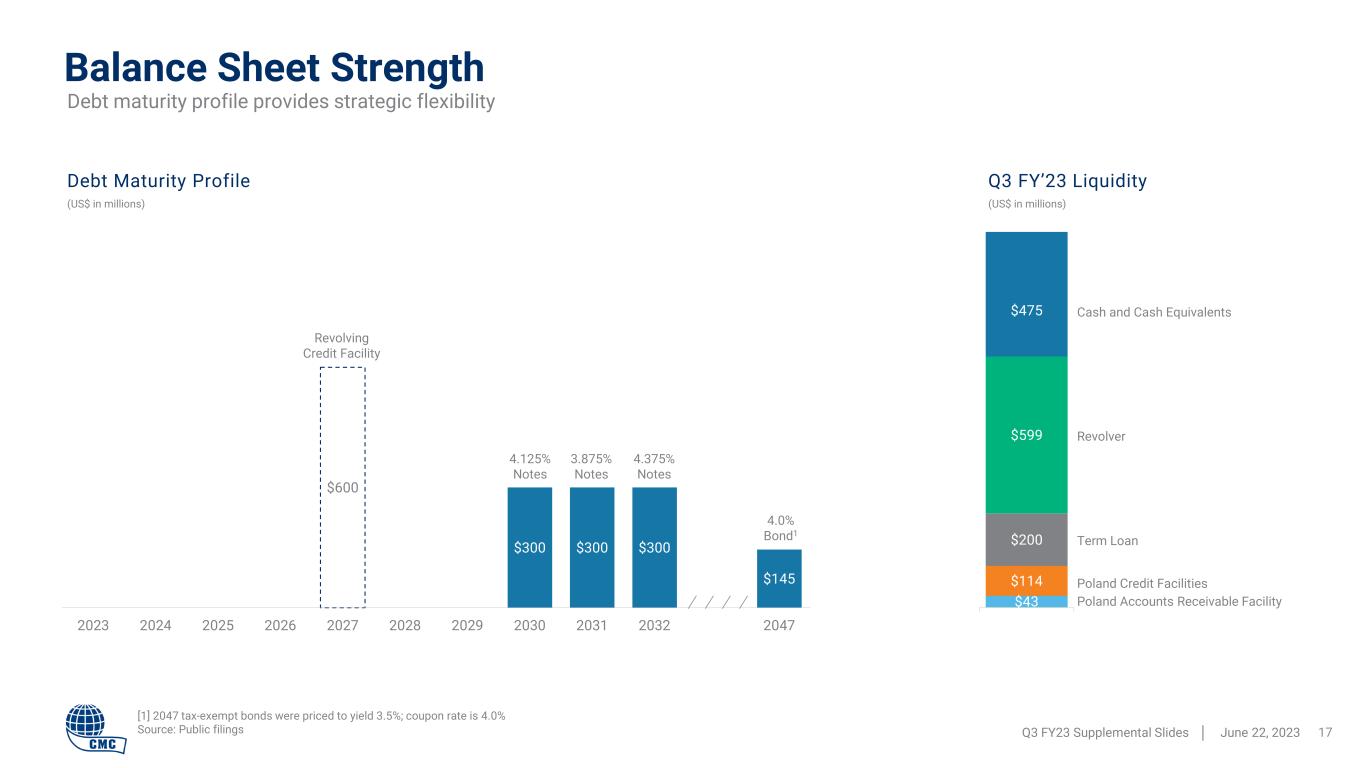
$43 $114 $200 $599 $475 $300 $300 $300 $145 $600 2023 2024 2025 2026 2027 2028 2029 2030 2031 2032 2047 Balance Sheet Strength Q3 FY23 Supplemental Slides │ June 22, 2023 17 [1] 2047 tax-exempt bonds were priced to yield 3.5%; coupon rate is 4.0% Source: Public filings Revolver Term Loan Poland Credit Facilities (US$ in millions) Revolving Credit Facility 4.125% Notes Cash and Cash Equivalents 3.875% Notes Debt maturity profile provides strategic flexibility Debt Maturity Profile Q3 FY’23 Liquidity (US$ in millions) 4.375% Notes 4.0% Bond1 Poland Accounts Receivable Facility
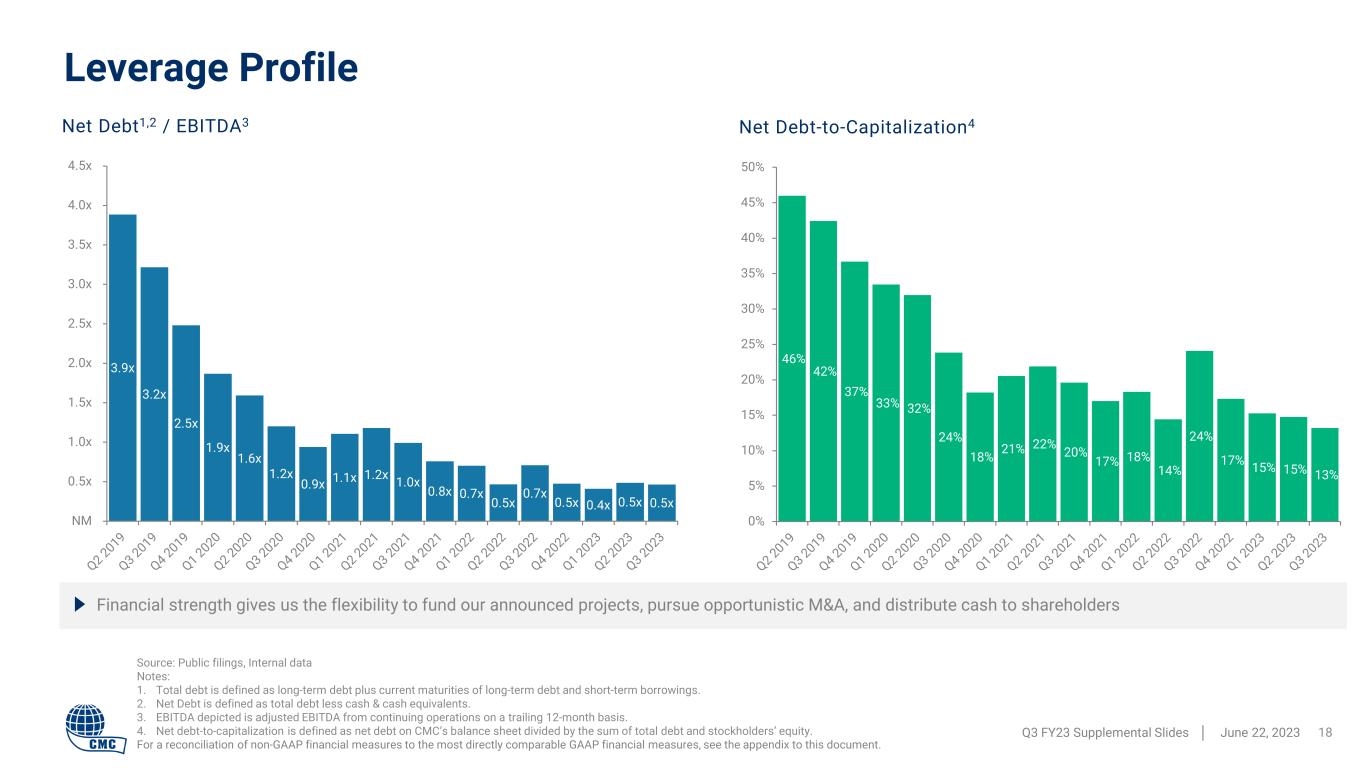
46% 42% 37% 33% 32% 24% 18% 21% 22% 20% 17% 18% 14% 24% 17% 15% 15% 13% 0% 5% 10% 15% 20% 25% 30% 35% 40% 45% 50% 3.9x 3.2x 2.5x 1.9x 1.6x 1.2x 0.9x 1.1x 1.2x 1.0x 0.8x 0.7x 0.5x 0.7x 0.5x 0.4x 0.5x 0.5x NM 0.5x 1.0x 1.5x 2.0x 2.5x 3.0x 3.5x 4.0x 4.5x Leverage Profile Q3 FY23 Supplemental Slides │ June 22, 2023 18 Source: Public filings, Internal data Notes: 1. Total debt is defined as long-term debt plus current maturities of long-term debt and short-term borrowings. 2. Net Debt is defined as total debt less cash & cash equivalents. 3. EBITDA depicted is adjusted EBITDA from continuing operations on a trailing 12-month basis. 4. Net debt-to-capitalization is defined as net debt on CMC’s balance sheet divided by the sum of total debt and stockholders’ equity. For a reconciliation of non-GAAP financial measures to the most directly comparable GAAP financial measures, see the appendix to this document. Financial strength gives us the flexibility to fund our announced projects, pursue opportunistic M&A, and distribute cash to shareholders Net Debt1,2 / EBITDA3 Net Debt-to-Capitalization4
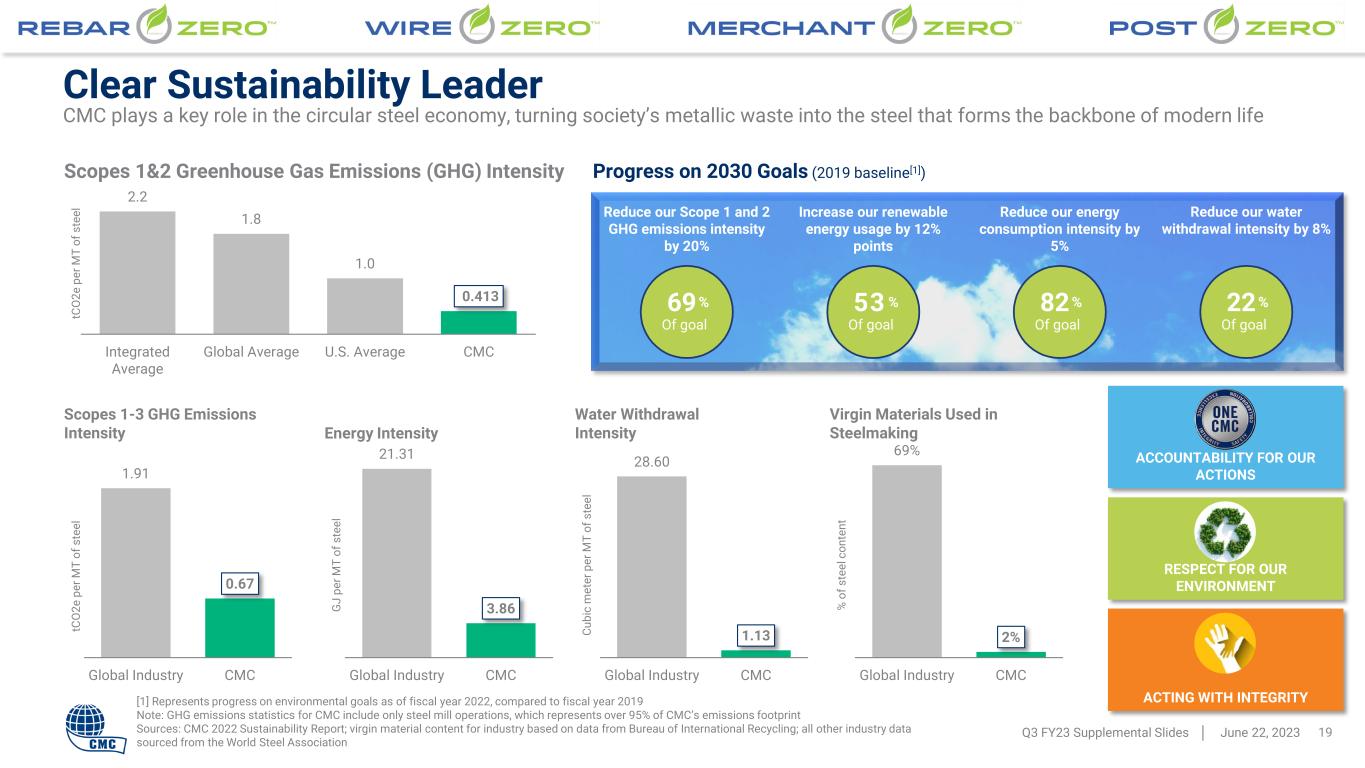
69% Of goal Clear Sustainability Leader Q3 FY23 Supplemental Slides │ June 22, 2023 19 [1] Represents progress on environmental goals as of fiscal year 2022, compared to fiscal year 2019 Note: GHG emissions statistics for CMC include only steel mill operations, which represents over 95% of CMC’s emissions footprint Sources: CMC 2022 Sustainability Report; virgin material content for industry based on data from Bureau of International Recycling; all other industry data sourced from the World Steel Association CMC plays a key role in the circular steel economy, turning society’s metallic waste into the steel that forms the backbone of modern life ACCOUNTABILITY FOR OUR ACTIONS RESPECT FOR OUR ENVIRONMENT ACTING WITH INTEGRITY 2.2 1.8 1.0 0.413 Integrated Average Global Average U.S. Average CMC Scopes 1&2 Greenhouse Gas Emissions (GHG) Intensity tC O 2e p er M T of s te el 1.91 0.67 Global Industry CMC 21.31 3.86 Global Industry CMC 28.60 1.13 Global Industry CMC 69% 2% Global Industry CMC Reduce our Scope 1 and 2 GHG emissions intensity by 20% Increase our renewable energy usage by 12% points Reduce our energy consumption intensity by 5% Reduce our water withdrawal intensity by 8% 5 3 % Of goal 82% Of goal 22% Of goal Progress on 2030 Goals (2019 baseline[1]) Scopes 1-3 GHG Emissions Intensity tC O 2e p er M T of s te el Energy Intensity G J pe r M T of s te el Water Withdrawal Intensity Cu bi c m et er p er M T of s te el Virgin Materials Used in Steelmaking % o f s te el c on te nt

Q3 FY23 Supplemental Slides │ June 22, 2023 20 Appendix: Non-GAAP Financial Reconciliations
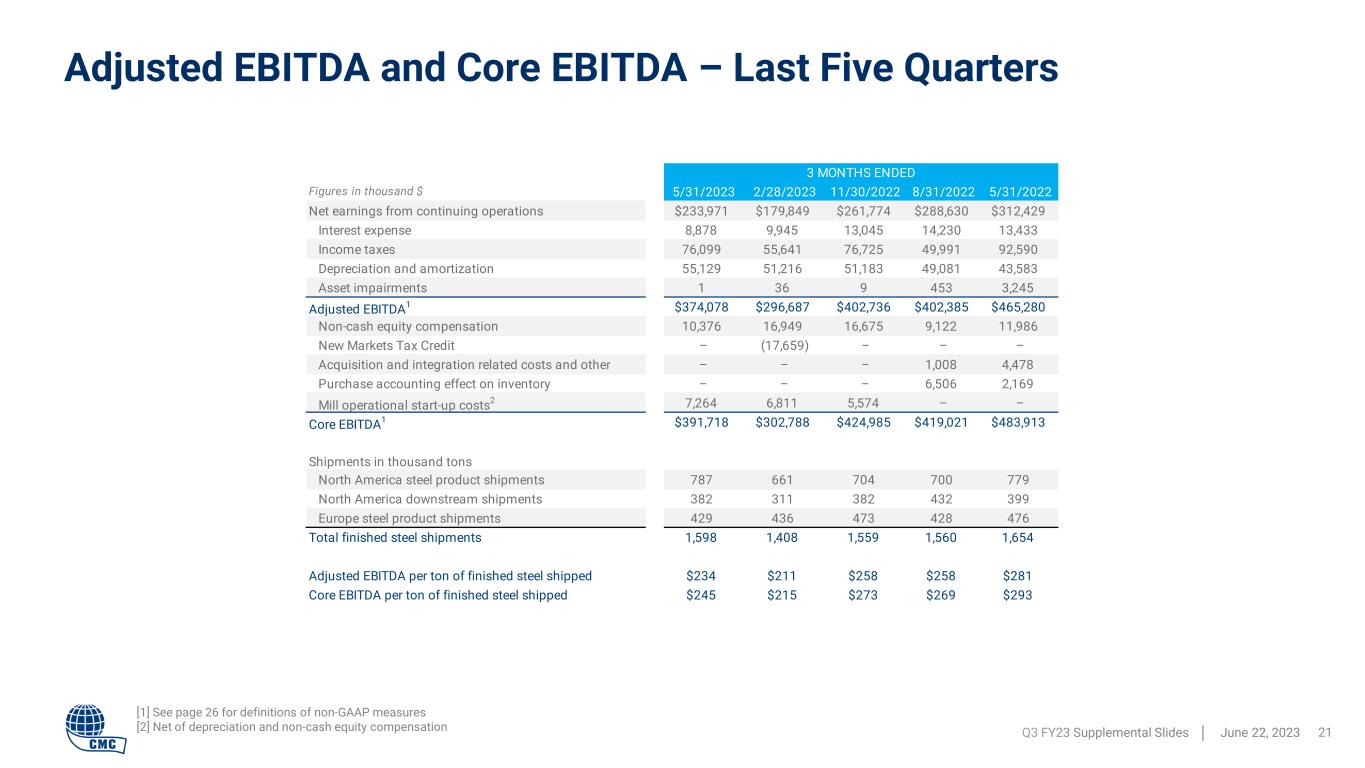
Adjusted EBITDA and Core EBITDA – Last Five Quarters Q3 FY23 Supplemental Slides │ June 22, 2023 21 [1] See page 26 for definitions of non-GAAP measures [2] Net of depreciation and non-cash equity compensation 3 MONTHS ENDED Figures in thousand $ 5/31/2023 2/28/2023 11/30/2022 8/31/2022 5/31/2022 Net earnings from continuing operations $233,971 $179,849 $261,774 $288,630 $312,429 Interest expense 8,878 9,945 13,045 14,230 13,433 Income taxes 76,099 55,641 76,725 49,991 92,590 Depreciation and amortization 55,129 51,216 51,183 49,081 43,583 Asset impairments 1 36 9 453 3,245 Adjusted EBITDA1 $374,078 $296,687 $402,736 $402,385 $465,280 Non-cash equity compensation 10,376 16,949 16,675 9,122 11,986 New Markets Tax Credit – (17,659) – – – Acquisition and integration related costs and other – – – 1,008 4,478 Purchase accounting effect on inventory – – – 6,506 2,169 Mill operational start-up costs2 7,264 6,811 5,574 – – Core EBITDA1 $391,718 $302,788 $424,985 $419,021 $483,913 Shipments in thousand tons North America steel product shipments 787 661 704 700 779 North America downstream shipments 382 311 382 432 399 Europe steel product shipments 429 436 473 428 476 Total finished steel shipments 1,598 1,408 1,559 1,560 1,654 Adjusted EBITDA per ton of finished steel shipped $234 $211 $258 $258 $281 Core EBITDA per ton of finished steel shipped $245 $215 $273 $269 $293
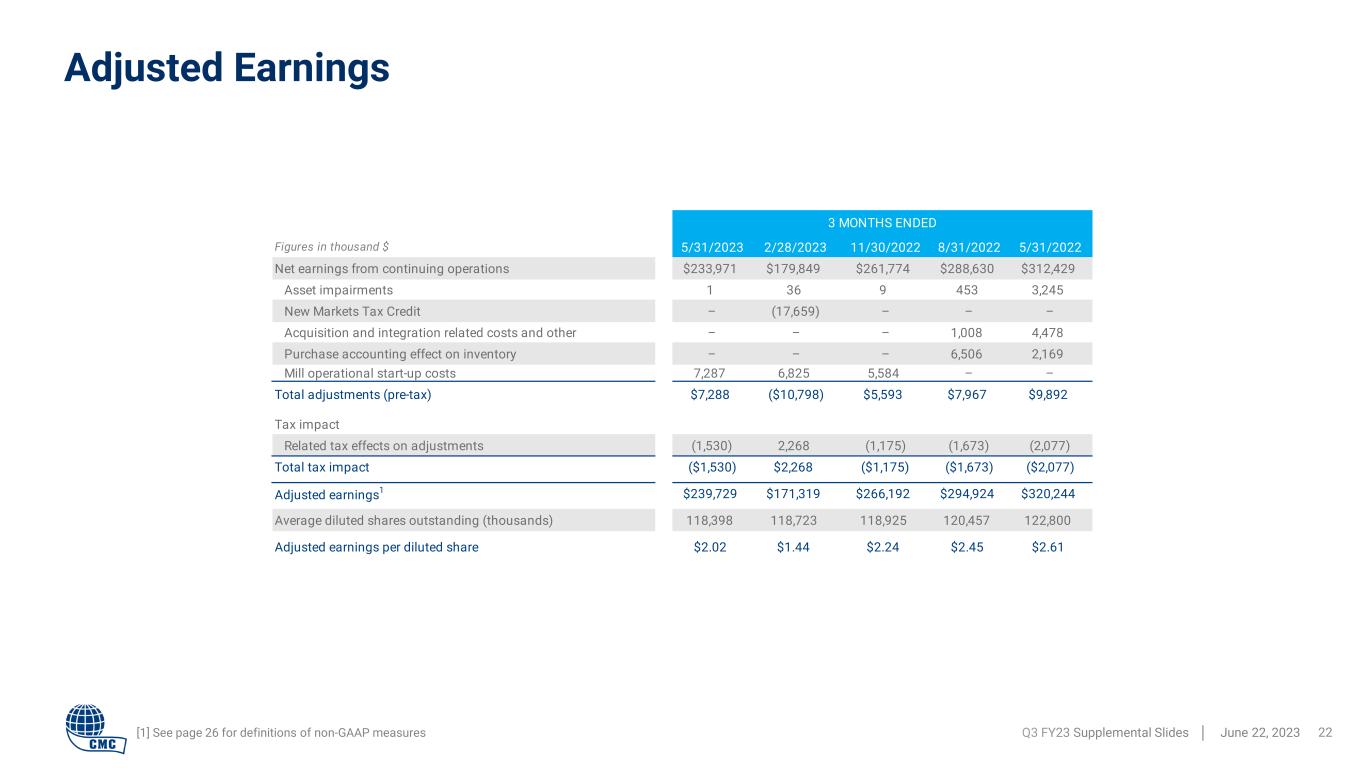
Adjusted Earnings Q3 FY23 Supplemental Slides │ June 22, 2023 22[1] See page 26 for definitions of non-GAAP measures 3 MONTHS ENDED Figures in thousand $ 5/31/2023 2/28/2023 11/30/2022 8/31/2022 5/31/2022 Net earnings from continuing operations $233,971 $179,849 $261,774 $288,630 $312,429 Asset impairments 1 36 9 453 3,245 New Markets Tax Credit – (17,659) – – – Acquisition and integration related costs and other – – – 1,008 4,478 Purchase accounting effect on inventory – – – 6,506 2,169 Mill operational start-up costs 7,287 6,825 5,584 – – Total adjustments (pre-tax) $7,288 ($10,798) $5,593 $7,967 $9,892 Tax impact Related tax effects on adjustments (1,530) 2,268 (1,175) (1,673) (2,077) Total tax impact ($1,530) $2,268 ($1,175) ($1,673) ($2,077) Adjusted earnings1 $239,729 $171,319 $266,192 $294,924 $320,244 Average diluted shares outstanding (thousands) 118,398 118,723 118,925 120,457 122,800 Adjusted earnings per diluted share $2.02 $1.44 $2.24 $2.45 $2.61
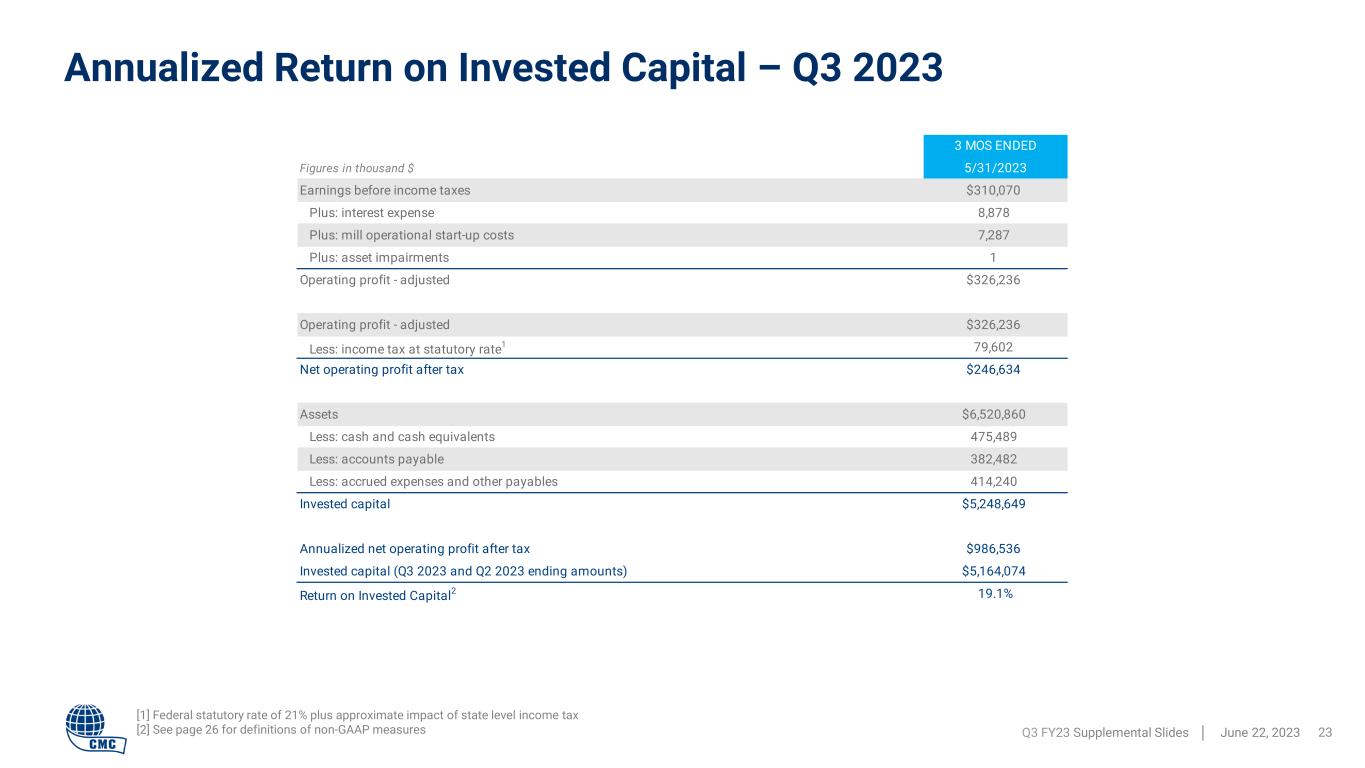
3 MOS ENDED Figures in thousand $ 5/31/2023 Earnings before income taxes $310,070 Plus: interest expense 8,878 Plus: mill operational start-up costs 7,287 Plus: asset impairments 1 Operating profit - adjusted $326,236 Operating profit - adjusted $326,236 Less: income tax at statutory rate1 79,602 Net operating profit after tax $246,634 Assets $6,520,860 Less: cash and cash equivalents 475,489 Less: accounts payable 382,482 Less: accrued expenses and other payables 414,240 Invested capital $5,248,649 Annualized net operating profit after tax $986,536 Invested capital (Q3 2023 and Q2 2023 ending amounts) $5,164,074 Return on Invested Capital2 19.1% Annualized Return on Invested Capital – Q3 2023 Q3 FY23 Supplemental Slides │ June 22, 2023 23 [1] Federal statutory rate of 21% plus approximate impact of state level income tax [2] See page 26 for definitions of non-GAAP measures
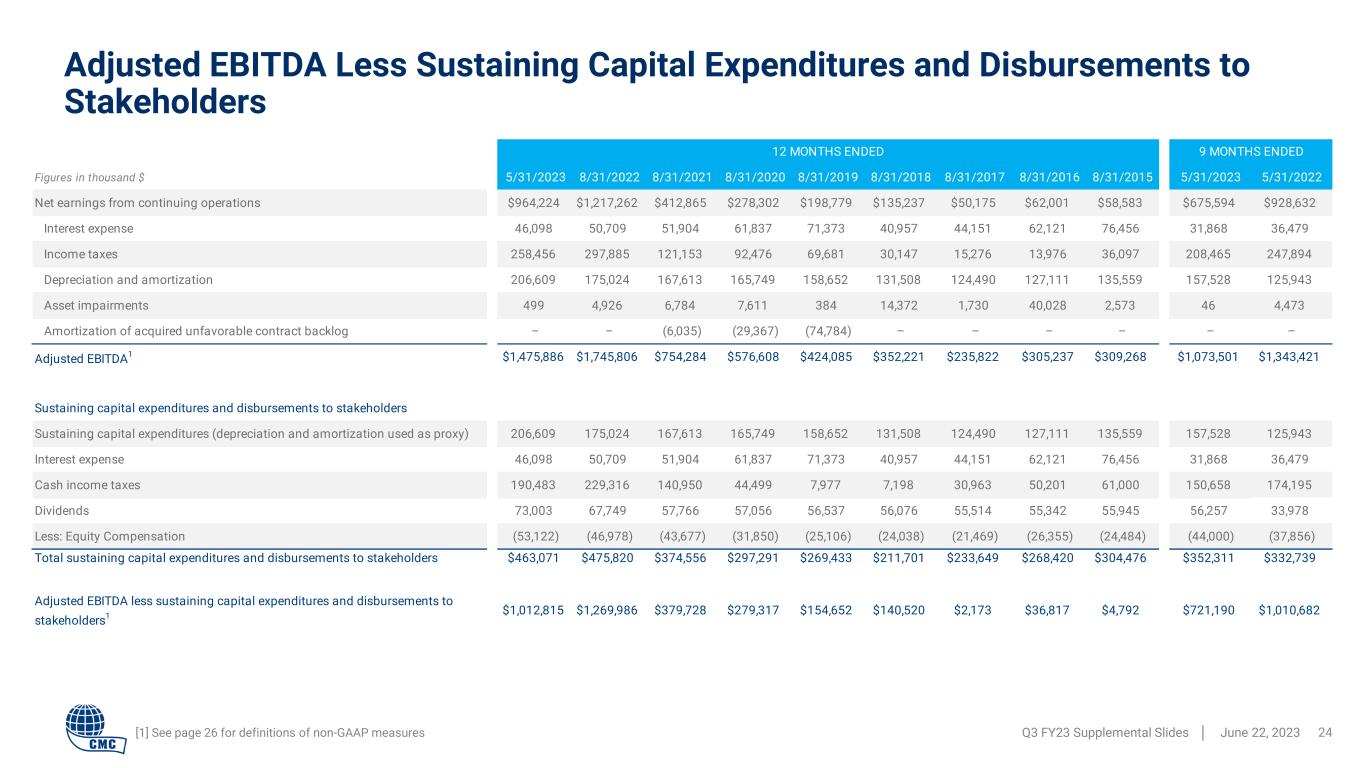
[1] See page 26 for definitions of non-GAAP measures Adjusted EBITDA Less Sustaining Capital Expenditures and Disbursements to Stakeholders Q3 FY23 Supplemental Slides │ June 22, 2023 24 Figures in thousand $ 5/31/2023 8/31/2022 8/31/2021 8/31/2020 8/31/2019 8/31/2018 8/31/2017 8/31/2016 8/31/2015 5/31/2023 5/31/2022 Net earnings from continuing operations $964,224 $1,217,262 $412,865 $278,302 $198,779 $135,237 $50,175 $62,001 $58,583 $675,594 $928,632 Interest expense 46,098 50,709 51,904 61,837 71,373 40,957 44,151 62,121 76,456 31,868 36,479 Income taxes 258,456 297,885 121,153 92,476 69,681 30,147 15,276 13,976 36,097 208,465 247,894 Depreciation and amortization 206,609 175,024 167,613 165,749 158,652 131,508 124,490 127,111 135,559 157,528 125,943 Asset impairments 499 4,926 6,784 7,611 384 14,372 1,730 40,028 2,573 46 4,473 Amortization of acquired unfavorable contract backlog – – (6,035) (29,367) (74,784) – – – – – – Adjusted EBITDA1 $1,475,886 $1,745,806 $754,284 $576,608 $424,085 $352,221 $235,822 $305,237 $309,268 $1,073,501 $1,343,421 Sustaining capital expenditures and disbursements to stakeholders Sustaining capital expenditures (depreciation and amortization used as proxy) 206,609 175,024 167,613 165,749 158,652 131,508 124,490 127,111 135,559 157,528 125,943 Interest expense 46,098 50,709 51,904 61,837 71,373 40,957 44,151 62,121 76,456 31,868 36,479 Cash income taxes 190,483 229,316 140,950 44,499 7,977 7,198 30,963 50,201 61,000 150,658 174,195 Dividends 73,003 67,749 57,766 57,056 56,537 56,076 55,514 55,342 55,945 56,257 33,978 Less: Equity Compensation (53,122) (46,978) (43,677) (31,850) (25,106) (24,038) (21,469) (26,355) (24,484) (44,000) (37,856) Total sustaining capital expenditures and disbursements to stakeholders $463,071 $475,820 $374,556 $297,291 $269,433 $211,701 $233,649 $268,420 $304,476 $352,311 $332,739 Adjusted EBITDA less sustaining capital expenditures and disbursements to stakeholders1 $1,012,815 $1,269,986 $379,728 $279,317 $154,652 $140,520 $2,173 $36,817 $4,792 $721,190 $1,010,682 12 MONTHS ENDED 9 MONTHS ENDED
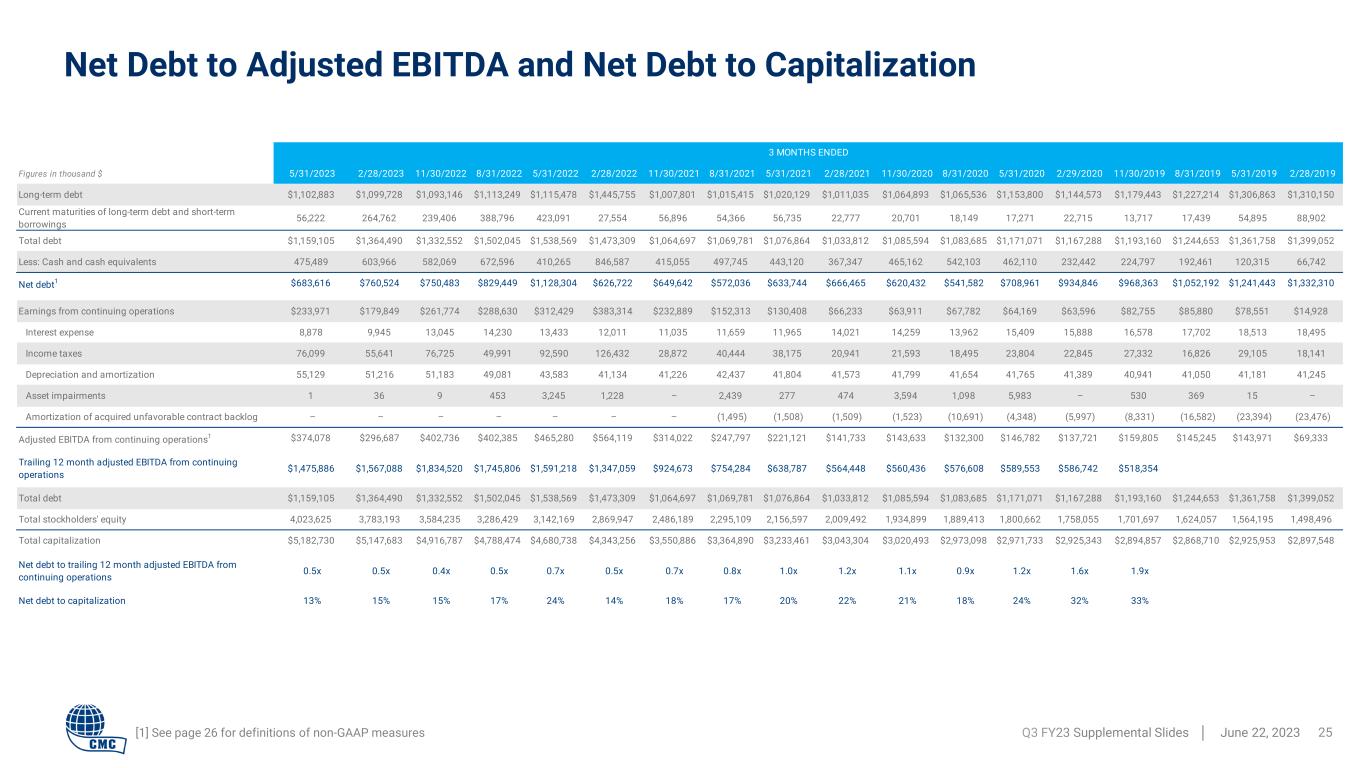
Net Debt to Adjusted EBITDA and Net Debt to Capitalization Q3 FY23 Supplemental Slides │ June 22, 2023 25[1] See page 26 for definitions of non-GAAP measures Figures in thousand $ 5/31/2023 2/28/2023 11/30/2022 8/31/2022 5/31/2022 2/28/2022 11/30/2021 8/31/2021 5/31/2021 2/28/2021 11/30/2020 8/31/2020 5/31/2020 2/29/2020 11/30/2019 8/31/2019 5/31/2019 2/28/2019 Long-term debt $1,102,883 $1,099,728 $1,093,146 $1,113,249 $1,115,478 $1,445,755 $1,007,801 $1,015,415 $1,020,129 $1,011,035 $1,064,893 $1,065,536 $1,153,800 $1,144,573 $1,179,443 $1,227,214 $1,306,863 $1,310,150 Current maturities of long-term debt and short-term borrowings 56,222 264,762 239,406 388,796 423,091 27,554 56,896 54,366 56,735 22,777 20,701 18,149 17,271 22,715 13,717 17,439 54,895 88,902 Total debt $1,159,105 $1,364,490 $1,332,552 $1,502,045 $1,538,569 $1,473,309 $1,064,697 $1,069,781 $1,076,864 $1,033,812 $1,085,594 $1,083,685 $1,171,071 $1,167,288 $1,193,160 $1,244,653 $1,361,758 $1,399,052 Less: Cash and cash equivalents 475,489 603,966 582,069 672,596 410,265 846,587 415,055 497,745 443,120 367,347 465,162 542,103 462,110 232,442 224,797 192,461 120,315 66,742 Net debt1 $683,616 $760,524 $750,483 $829,449 $1,128,304 $626,722 $649,642 $572,036 $633,744 $666,465 $620,432 $541,582 $708,961 $934,846 $968,363 $1,052,192 $1,241,443 $1,332,310 Earnings from continuing operations $233,971 $179,849 $261,774 $288,630 $312,429 $383,314 $232,889 $152,313 $130,408 $66,233 $63,911 $67,782 $64,169 $63,596 $82,755 $85,880 $78,551 $14,928 Interest expense 8,878 9,945 13,045 14,230 13,433 12,011 11,035 11,659 11,965 14,021 14,259 13,962 15,409 15,888 16,578 17,702 18,513 18,495 Income taxes 76,099 55,641 76,725 49,991 92,590 126,432 28,872 40,444 38,175 20,941 21,593 18,495 23,804 22,845 27,332 16,826 29,105 18,141 Depreciation and amortization 55,129 51,216 51,183 49,081 43,583 41,134 41,226 42,437 41,804 41,573 41,799 41,654 41,765 41,389 40,941 41,050 41,181 41,245 Asset impairments 1 36 9 453 3,245 1,228 – 2,439 277 474 3,594 1,098 5,983 – 530 369 15 – Amortization of acquired unfavorable contract backlog – – – – – – – (1,495) (1,508) (1,509) (1,523) (10,691) (4,348) (5,997) (8,331) (16,582) (23,394) (23,476) Adjusted EBITDA from continuing operations1 $374,078 $296,687 $402,736 $402,385 $465,280 $564,119 $314,022 $247,797 $221,121 $141,733 $143,633 $132,300 $146,782 $137,721 $159,805 $145,245 $143,971 $69,333 Trailing 12 month adjusted EBITDA from continuing operations $1,475,886 $1,567,088 $1,834,520 $1,745,806 $1,591,218 $1,347,059 $924,673 $754,284 $638,787 $564,448 $560,436 $576,608 $589,553 $586,742 $518,354 Total debt $1,159,105 $1,364,490 $1,332,552 $1,502,045 $1,538,569 $1,473,309 $1,064,697 $1,069,781 $1,076,864 $1,033,812 $1,085,594 $1,083,685 $1,171,071 $1,167,288 $1,193,160 $1,244,653 $1,361,758 $1,399,052 Total stockholders' equity 4,023,625 3,783,193 3,584,235 3,286,429 3,142,169 2,869,947 2,486,189 2,295,109 2,156,597 2,009,492 1,934,899 1,889,413 1,800,662 1,758,055 1,701,697 1,624,057 1,564,195 1,498,496 Total capitalization $5,182,730 $5,147,683 $4,916,787 $4,788,474 $4,680,738 $4,343,256 $3,550,886 $3,364,890 $3,233,461 $3,043,304 $3,020,493 $2,973,098 $2,971,733 $2,925,343 $2,894,857 $2,868,710 $2,925,953 $2,897,548 Net debt to trailing 12 month adjusted EBITDA from continuing operations 0.5x 0.5x 0.4x 0.5x 0.7x 0.5x 0.7x 0.8x 1.0x 1.2x 1.1x 0.9x 1.2x 1.6x 1.9x Net debt to capitalization 13% 15% 15% 17% 24% 14% 18% 17% 20% 22% 21% 18% 24% 32% 33% 3 MONTHS ENDED
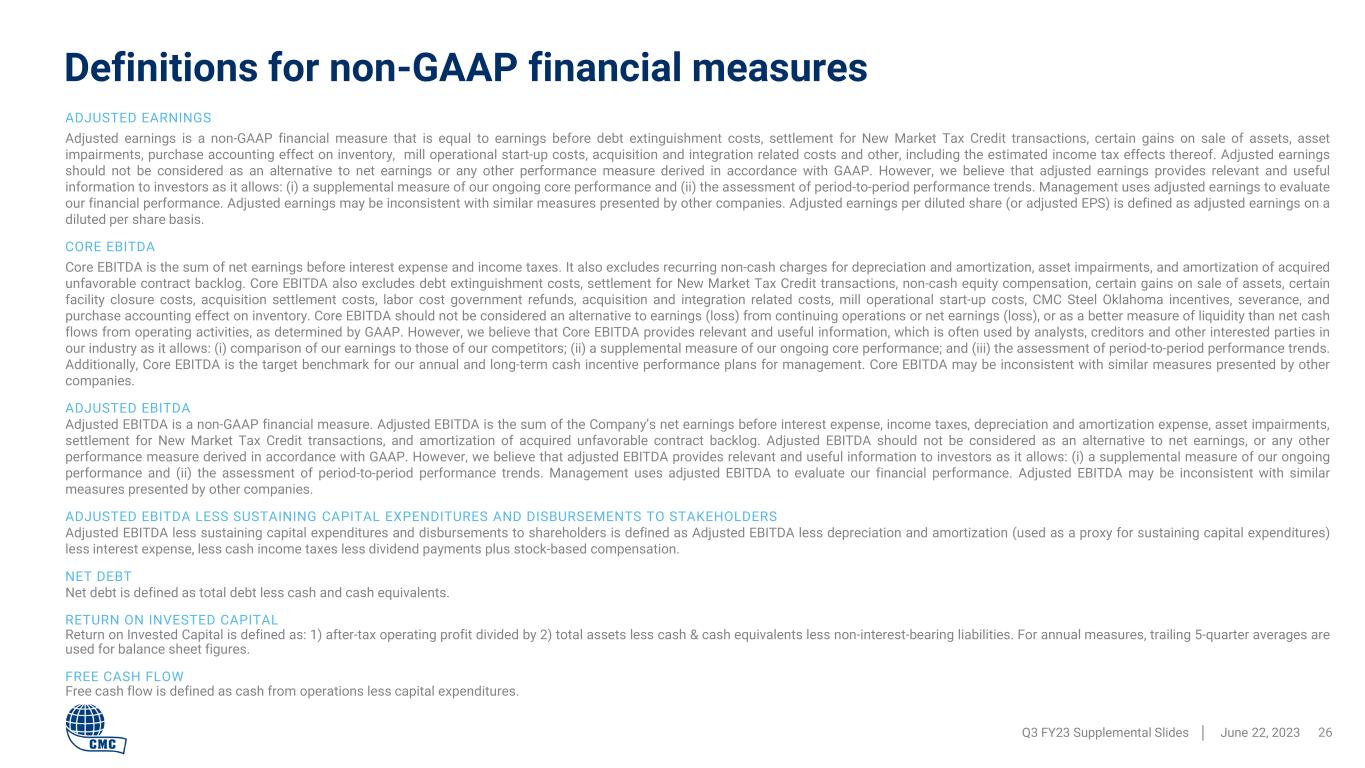
Definitions for non-GAAP financial measures Q3 FY23 Supplemental Slides │ June 22, 2023 26 ADJUSTED EARNINGS Adjusted earnings is a non-GAAP financial measure that is equal to earnings before debt extinguishment costs, settlement for New Market Tax Credit transactions, certain gains on sale of assets, asset impairments, purchase accounting effect on inventory, mill operational start-up costs, acquisition and integration related costs and other, including the estimated income tax effects thereof. Adjusted earnings should not be considered as an alternative to net earnings or any other performance measure derived in accordance with GAAP. However, we believe that adjusted earnings provides relevant and useful information to investors as it allows: (i) a supplemental measure of our ongoing core performance and (ii) the assessment of period-to-period performance trends. Management uses adjusted earnings to evaluate our financial performance. Adjusted earnings may be inconsistent with similar measures presented by other companies. Adjusted earnings per diluted share (or adjusted EPS) is defined as adjusted earnings on a diluted per share basis. CORE EBITDA Core EBITDA is the sum of net earnings before interest expense and income taxes. It also excludes recurring non-cash charges for depreciation and amortization, asset impairments, and amortization of acquired unfavorable contract backlog. Core EBITDA also excludes debt extinguishment costs, settlement for New Market Tax Credit transactions, non-cash equity compensation, certain gains on sale of assets, certain facility closure costs, acquisition settlement costs, labor cost government refunds, acquisition and integration related costs, mill operational start-up costs, CMC Steel Oklahoma incentives, severance, and purchase accounting effect on inventory. Core EBITDA should not be considered an alternative to earnings (loss) from continuing operations or net earnings (loss), or as a better measure of liquidity than net cash flows from operating activities, as determined by GAAP. However, we believe that Core EBITDA provides relevant and useful information, which is often used by analysts, creditors and other interested parties in our industry as it allows: (i) comparison of our earnings to those of our competitors; (ii) a supplemental measure of our ongoing core performance; and (iii) the assessment of period-to-period performance trends. Additionally, Core EBITDA is the target benchmark for our annual and long-term cash incentive performance plans for management. Core EBITDA may be inconsistent with similar measures presented by other companies. ADJUSTED EBITDA Adjusted EBITDA is a non-GAAP financial measure. Adjusted EBITDA is the sum of the Company’s net earnings before interest expense, income taxes, depreciation and amortization expense, asset impairments, settlement for New Market Tax Credit transactions, and amortization of acquired unfavorable contract backlog. Adjusted EBITDA should not be considered as an alternative to net earnings, or any other performance measure derived in accordance with GAAP. However, we believe that adjusted EBITDA provides relevant and useful information to investors as it allows: (i) a supplemental measure of our ongoing performance and (ii) the assessment of period-to-period performance trends. Management uses adjusted EBITDA to evaluate our financial performance. Adjusted EBITDA may be inconsistent with similar measures presented by other companies. ADJUSTED EBITDA LESS SUSTAINING CAPITAL EXPENDITURES AND DISBURSEMENTS TO STAKEHOLDERS Adjusted EBITDA less sustaining capital expenditures and disbursements to shareholders is defined as Adjusted EBITDA less depreciation and amortization (used as a proxy for sustaining capital expenditures) less interest expense, less cash income taxes less dividend payments plus stock-based compensation. NET DEBT Net debt is defined as total debt less cash and cash equivalents. RETURN ON INVESTED CAPITAL Return on Invested Capital is defined as: 1) after-tax operating profit divided by 2) total assets less cash & cash equivalents less non-interest-bearing liabilities. For annual measures, trailing 5-quarter averages are used for balance sheet figures. FREE CASH FLOW Free cash flow is defined as cash from operations less capital expenditures.

Q3 FY23 Supplemental Slides │ June 22, 2023 27 Thank You
