| UNITED STATES SECURITIES AND EXCHANGE COMMISSION Washington, D.C. 20549 | |||||||||||||||||||||||||||||||||||
 | |||||||||||||||||||||||||||||||||||
| FORM | 8-K | ||||||||||||||||||||||||||||||||||
| Current Report | |||||||||||||||||||||||||||||||||||
|
Pursuant to Section 13 or 15(d) of the Securities Exchange Act of 1934
| |||||||||||||||||||||||||||||||||||
| Date of Report (Date of earliest event reported): | August 6, 2024 | ||||||||||||||||||||||||||||||||||
| CATERPILLAR INC. | |||||||||||||||||||||||||||||||||||
| (Exact name of registrant as specified in its charter) | |||||||||||||||||||||||||||||||||||
| Delaware | 1-768 | 37-0602744 | |||||||||||||||||||||||||||||||||
| (State or other jurisdiction of incorporation) | (Commission File Number) |
(I.R.S Employer Identification No.) |
|||||||||||||||||||||||||||||||||
| 5205 N. O'Connor Blvd., | Suite 100, | Irving, | Texas | 75039 | ||||||||||||||||||||||||||||
| (Address of principal executive offices) | (Zip Code) | |||||||||||||||||||||||||||||||
| Registrant’s telephone number, including area code: | (972) | 891-7700 | ||||||||||||||||||||||||||||||
| Former name or former address, if changed since last report: | N/A | |||||||||||||||||||||||||||||||
| ☐ | Written communications pursuant to Rule 425 under the Securities Act (17 CFR 230.425) | ||||||||||||||||||||||||||||||||||
| ☐ | Soliciting material pursuant to Rule 14a-12 under the Exchange Act (17 CFR 240.14a-12) | ||||||||||||||||||||||||||||||||||
| ☐ | Pre-commencement communications pursuant to Rule 14d-2(b) under the Exchange Act (17 CFR 240.14d-2(b)) | ||||||||||||||||||||||||||||||||||
| ☐ | Pre-commencement communications pursuant to Rule 13e-4(c) under the Exchange Act (17 CFR 240.13e-4(c)) | ||||||||||||||||||||||||||||||||||
|
Securities registered pursuant to Section 12(b) of the Act:
| |||||||||||||||||||||||||||||||||||
| Title of each class | Trading Symbol (s) | Name of each exchange which registered | |||||||||||||||||||||||||||||||||
| Common Stock ($1.00 par value) | CAT | The New York Stock Exchange | |||||||||||||||||||||||||||||||||
| 5.3% Debentures due September 15, 2035 | CAT35 | The New York Stock Exchange | |||||||||||||||||||||||||||||||||
| Check the appropriate box below if the Form 8-K filing is intended to simultaneously satisfy the filing obligation of the registrant under any of the following provisions: | |||||||||||||||||||||||||||||||||||
| Indicate by check mark whether the registrant is an emerging growth company as defined by Rule 405 of the Securities Act of | |||||||||||||||||||||||||||||||||||
| 1933 (17 CFR §230.405 of this chapter) or Rule 12b-2 of the Securities Exchange Act of 1934 (17 CFR §240.12b-2 of this chapter). | |||||||||||||||||||||||||||||||||||
| Emerging growth company | ☐ | ||||||||||||||||||||||||||||||||||
| If an emerging growth company, indicate by check mark if the registrant has elected not to use the extended transition period | |||||||||||||||||||||||||||||||||||
| for complying with any new or revised financial accounting standards provided pursuant to Section 13(a) of the Exchange Act. | ☐ | ||||||||||||||||||||||||||||||||||
| (d) | Exhibits: | ||||||||||
| The following is furnished as an exhibit to this report: | |||||||||||
| 99.1 | |||||||||||
| 99.2 | |||||||||||
| 104 | The cover page from this Current Report on Form 8-K, formatted in Inline XBRL. | ||||||||||
|
SIGNATURES
| ||||||||
| Pursuant to the requirements of the Securities Exchange Act of 1934, the registrant has duly caused this report to be signed on its behalf by the undersigned hereunto duly authorized. | ||||||||
| CATERPILLAR INC. | ||||||||
August 6, 2024 |
By: | /s/ Derek Owens | ||||||
| Derek Owens Chief Legal Officer and General Counsel |
||||||||
| Second Quarter | |||||||||||
| ($ in billions except profit per share) | 2024 | 2023 | |||||||||
| Sales and Revenues | $16.7 | $17.3 | |||||||||
| Profit Per Share | $5.48 | $5.67 | |||||||||
| Adjusted Profit Per Share | $5.99 | $5.55 | |||||||||
Please see a reconciliation of GAAP to non-GAAP financial measures in the appendix on pages 13 and 14. | |||||||||||
| ● | Second-quarter 2024 profit per share of $5.48; adjusted profit per share of $5.99 | ||||
| ● | Enterprise operating cash flow was $3.0 billion in the second quarter of 2024 | ||||
| ● | Deployed $2.5 billion of cash for share repurchases and dividends in the second quarter | ||||
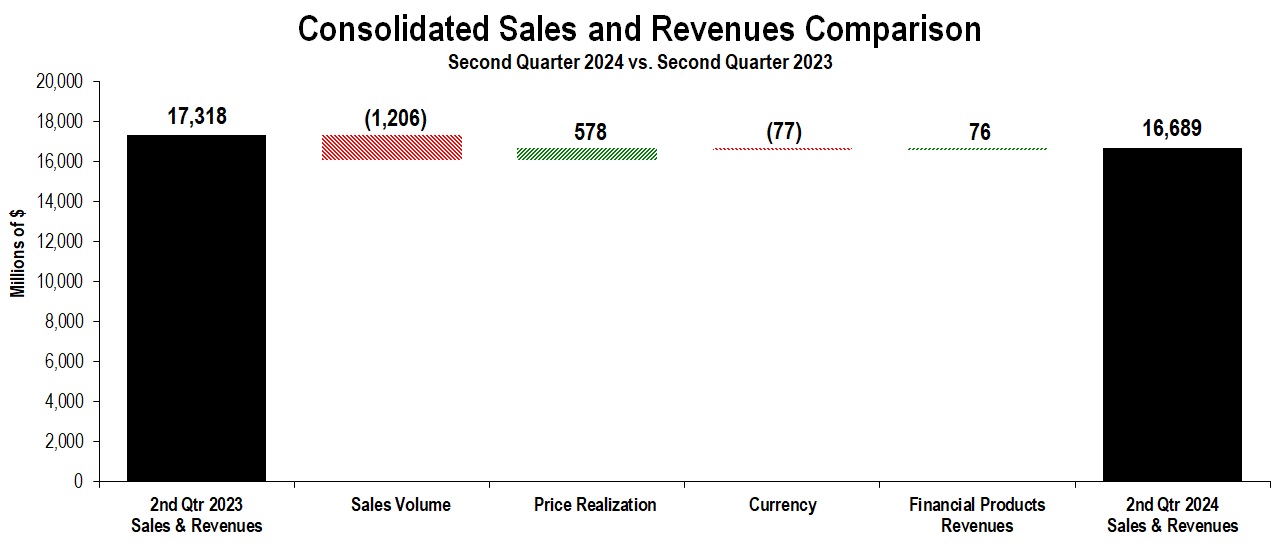
| Sales and Revenues by Segment | |||||||||||||||||||||||||||||||||||||||||||||||
| (Millions of dollars) | Second Quarter 2023 | Sales Volume |
Price Realization |
Currency | Inter-Segment / Other | Second Quarter 2024 | $ Change |
% Change |
|||||||||||||||||||||||||||||||||||||||
| Construction Industries | $ | 7,154 | $ | (588) | $ | 178 | $ | (55) | $ | (6) | $ | 6,683 | $ | (471) | (7%) | ||||||||||||||||||||||||||||||||
| Resource Industries | 3,563 | (475) | 133 | (9) | (6) | 3,206 | (357) | (10%) | |||||||||||||||||||||||||||||||||||||||
| Energy & Transportation | 7,219 | (129) | 264 | (12) | (5) | 7,337 | 118 | 2% | |||||||||||||||||||||||||||||||||||||||
| All Other Segment | 116 | (7) | 3 | (1) | (3) | 108 | (8) | (7%) | |||||||||||||||||||||||||||||||||||||||
| Corporate Items and Eliminations | (1,507) | (7) | — | — | 20 | (1,494) | 13 | ||||||||||||||||||||||||||||||||||||||||
| Machinery, Energy & Transportation | 16,545 | (1,206) | 578 | (77) | — | 15,840 | (705) | (4%) | |||||||||||||||||||||||||||||||||||||||
| Financial Products Segment | 923 | — | — | — | 81 | 1,004 | 81 | 9% | |||||||||||||||||||||||||||||||||||||||
| Corporate Items and Eliminations | (150) | — | — | — | (5) | (155) | (5) | ||||||||||||||||||||||||||||||||||||||||
| Financial Products Revenues | 773 | — | — | — | 76 | 849 | 76 | 10% | |||||||||||||||||||||||||||||||||||||||
| Consolidated Sales and Revenues | $ | 17,318 | $ | (1,206) | $ | 578 | $ | (77) | $ | 76 | $ | 16,689 | $ | (629) | (4%) | ||||||||||||||||||||||||||||||||
| Sales and Revenues by Geographic Region | |||||||||||||||||||||||||||||||||||||||||||||||||||||||||||||||||||||||||||||||||||
| North America | Latin America | EAME | Asia/Pacific | External Sales and Revenues | Inter-Segment | Total Sales and Revenues | |||||||||||||||||||||||||||||||||||||||||||||||||||||||||||||||||||||||||||||
| (Millions of dollars) | $ | % Chg | $ | % Chg | $ | % Chg | $ | % Chg | $ | % Chg | $ | % Chg | $ | % Chg | |||||||||||||||||||||||||||||||||||||||||||||||||||||||||||||||||||||
| Second Quarter 2024 | |||||||||||||||||||||||||||||||||||||||||||||||||||||||||||||||||||||||||||||||||||
| Construction Industries | $ | 3,957 | —% | $ | 677 | 20% | $ | 1,047 | (27%) | $ | 975 | (15%) | $ | 6,656 | (7%) | $ | 27 | (18%) | $ | 6,683 | (7%) | ||||||||||||||||||||||||||||||||||||||||||||||||||||||||||||||
| Resource Industries | 1,206 | (10%) | 524 | (3%) | 442 | (15%) | 950 | (12%) | 3,122 | (10%) | 84 | (7%) | 3,206 | (10%) | |||||||||||||||||||||||||||||||||||||||||||||||||||||||||||||||||||||
| Energy & Transportation | 3,308 | 6% | 439 | (4%) | 1,421 | (4%) | 912 | 1% | 6,080 | 2% | 1,257 | —% | 7,337 | 2% | |||||||||||||||||||||||||||||||||||||||||||||||||||||||||||||||||||||
| All Other Segment | 13 | (19%) | — | —% | 4 | —% | 12 | (14%) | 29 | (15%) | 79 | (4%) | 108 | (7%) | |||||||||||||||||||||||||||||||||||||||||||||||||||||||||||||||||||||
| Corporate Items and Eliminations | (20) | (1) | (21) | (5) | (47) | (1,447) | (1,494) | ||||||||||||||||||||||||||||||||||||||||||||||||||||||||||||||||||||||||||||
| Machinery, Energy & Transportation | 8,464 | 1% | 1,639 | 5% | 2,893 | (16%) | 2,844 | (9%) | 15,840 | (4%) | — | —% | 15,840 | (4%) | |||||||||||||||||||||||||||||||||||||||||||||||||||||||||||||||||||||
| Financial Products Segment | 668 | 13% | 101 | (1%) | 124 | 5% | 111 | 1% | 1,004 | 9% | — | —% | 1,004 | 9% | |||||||||||||||||||||||||||||||||||||||||||||||||||||||||||||||||||||
| Corporate Items and Eliminations | (89) | (21) | (20) | (25) | (155) | — | (155) | ||||||||||||||||||||||||||||||||||||||||||||||||||||||||||||||||||||||||||||
| Financial Products Revenues | 579 | 14% | 80 | (1%) | 104 | 7% | 86 | (1%) | 849 | 10% | — | —% | 849 | 10% | |||||||||||||||||||||||||||||||||||||||||||||||||||||||||||||||||||||
| Consolidated Sales and Revenues | $ | 9,043 | 1% | $ | 1,719 | 5% | $ | 2,997 | (15%) | $ | 2,930 | (9%) | $ | 16,689 | (4%) | $ | — | —% | $ | 16,689 | (4%) | ||||||||||||||||||||||||||||||||||||||||||||||||||||||||||||||
| Second Quarter 2023 | |||||||||||||||||||||||||||||||||||||||||||||||||||||||||||||||||||||||||||||||||||
| Construction Industries | $ | 3,968 | $ | 566 | $ | 1,438 | $ | 1,149 | $ | 7,121 | $ | 33 | $ | 7,154 | |||||||||||||||||||||||||||||||||||||||||||||||||||||||||||||||||||||
| Resource Industries | 1,342 | 538 | 517 | 1,076 | 3,473 | 90 | 3,563 | ||||||||||||||||||||||||||||||||||||||||||||||||||||||||||||||||||||||||||||
| Energy & Transportation | 3,120 | 459 | 1,479 | 899 | 5,957 | 1,262 | 7,219 | ||||||||||||||||||||||||||||||||||||||||||||||||||||||||||||||||||||||||||||
| All Other Segment | 16 | — | 4 | 14 | 34 | 82 | 116 | ||||||||||||||||||||||||||||||||||||||||||||||||||||||||||||||||||||||||||||
| Corporate Items and Eliminations | (32) | (2) | (2) | (4) | (40) | (1,467) | (1,507) | ||||||||||||||||||||||||||||||||||||||||||||||||||||||||||||||||||||||||||||
| Machinery, Energy & Transportation | 8,414 | 1,561 | 3,436 | 3,134 | 16,545 | — | 16,545 | ||||||||||||||||||||||||||||||||||||||||||||||||||||||||||||||||||||||||||||
| Financial Products Segment | 593 | 102 | 118 | 110 | 923 | — | 923 | ||||||||||||||||||||||||||||||||||||||||||||||||||||||||||||||||||||||||||||
| Corporate Items and Eliminations | (85) | (21) | (21) | (23) | (150) | — | (150) | ||||||||||||||||||||||||||||||||||||||||||||||||||||||||||||||||||||||||||||
| Financial Products Revenues | 508 | 81 | 97 | 87 | 773 | — | 773 | ||||||||||||||||||||||||||||||||||||||||||||||||||||||||||||||||||||||||||||
| Consolidated Sales and Revenues | $ | 8,922 | $ | 1,642 | $ | 3,533 | $ | 3,221 | $ | 17,318 | $ | — | $ | 17,318 | |||||||||||||||||||||||||||||||||||||||||||||||||||||||||||||||||||||
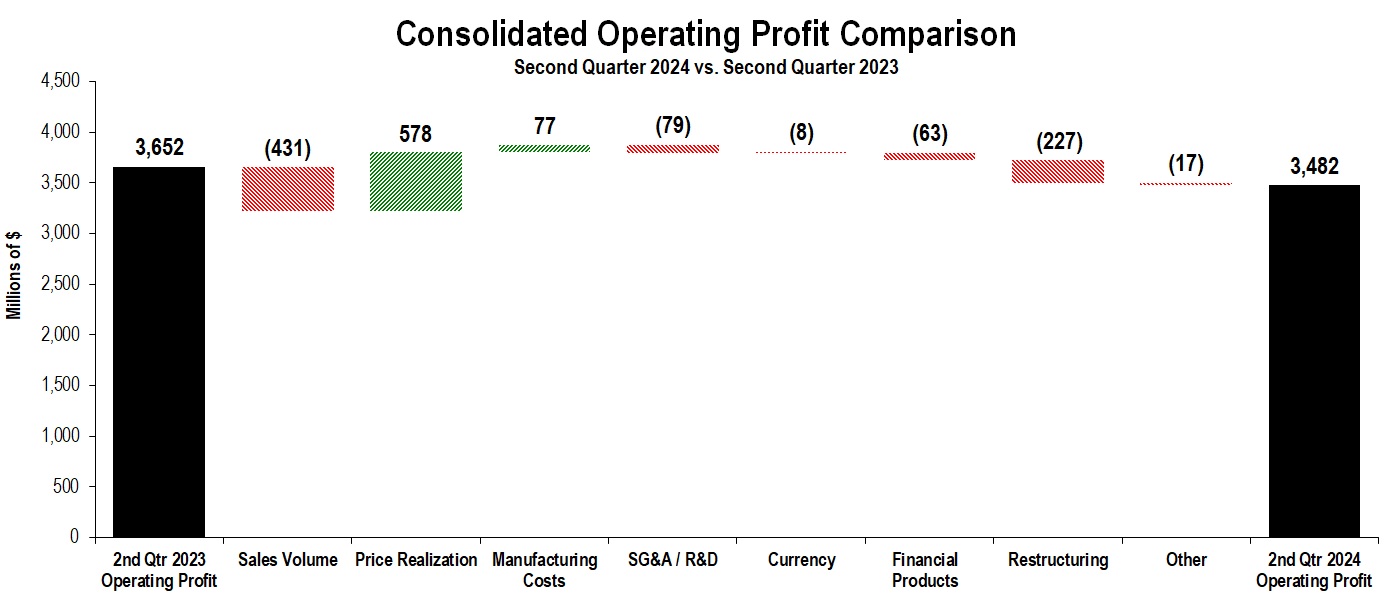
| Profit (Loss) by Segment | |||||||||||||||||||||||
| (Millions of dollars) | Second Quarter 2024 | Second Quarter 2023 | $ Change |
%
Change
|
|||||||||||||||||||
| Construction Industries | $ | 1,741 | $ | 1,803 | $ | (62) | (3 | %) | |||||||||||||||
| Resource Industries | 718 | 740 | (22) | (3 | %) | ||||||||||||||||||
| Energy & Transportation | 1,525 | 1,269 | 256 | 20 | % | ||||||||||||||||||
| All Other Segment | 21 | 10 | 11 | 110 | % | ||||||||||||||||||
| Corporate Items and Eliminations | (344) | (272) | (72) | ||||||||||||||||||||
| Machinery, Energy & Transportation | 3,661 | 3,550 | 111 | 3 | % | ||||||||||||||||||
| Financial Products Segment | 227 | 240 | (13) | (5 | %) | ||||||||||||||||||
| Corporate Items and Eliminations | (243) | 17 | (260) | ||||||||||||||||||||
| Financial Products | (16) | 257 | (273) | (106 | %) | ||||||||||||||||||
| Consolidating Adjustments | (163) | (155) | (8) | ||||||||||||||||||||
| Consolidated Operating Profit | $ | 3,482 | $ | 3,652 | $ | (170) | (5 | %) | |||||||||||||||
| CONSTRUCTION INDUSTRIES | ||||||||||||||||||||||||||||||||||||||||||||||||||
| (Millions of dollars) | ||||||||||||||||||||||||||||||||||||||||||||||||||
| Segment Sales | ||||||||||||||||||||||||||||||||||||||||||||||||||
| Second Quarter 2023 | Sales Volume | Price Realization | Currency | Inter-Segment | Second Quarter 2024 | $ Change |
% Change |
|||||||||||||||||||||||||||||||||||||||||||
| Total Sales | $ | 7,154 | $ | (588) | $ | 178 | $ | (55) | $ | (6) | $ | 6,683 | $ | (471) | (7 | %) | ||||||||||||||||||||||||||||||||||
| Sales by Geographic Region | ||||||||||||||||||||||||||||||||||||||||||||||||||
| Second Quarter 2024 | Second Quarter 2023 | $ Change |
% Change |
|||||||||||||||||||||||||||||||||||||||||||||||
| North America | $ | 3,957 | $ | 3,968 | $ | (11) | — | % | ||||||||||||||||||||||||||||||||||||||||||
| Latin America | 677 | 566 | 111 | 20 | % | |||||||||||||||||||||||||||||||||||||||||||||
| EAME | 1,047 | 1,438 | (391) | (27 | %) | |||||||||||||||||||||||||||||||||||||||||||||
| Asia/Pacific | 975 | 1,149 | (174) | (15 | %) | |||||||||||||||||||||||||||||||||||||||||||||
| External Sales | 6,656 | 7,121 | (465) | (7 | %) | |||||||||||||||||||||||||||||||||||||||||||||
| Inter-segment | 27 | 33 | (6) | (18 | %) | |||||||||||||||||||||||||||||||||||||||||||||
| Total Sales | $ | 6,683 | $ | 7,154 | $ | (471) | (7 | %) | ||||||||||||||||||||||||||||||||||||||||||
| Segment Profit | ||||||||||||||||||||||||||||||||||||||||||||||||||
| Second Quarter 2024 | Second Quarter 2023 |
Change |
% Change |
|||||||||||||||||||||||||||||||||||||||||||||||
| Segment Profit | $ | 1,741 | $ | 1,803 | $ | (62) | (3 | %) | ||||||||||||||||||||||||||||||||||||||||||
| Segment Profit Margin | 26.1 | % | 25.2 | % | 0.9 | pts | ||||||||||||||||||||||||||||||||||||||||||||
| RESOURCE INDUSTRIES | ||||||||||||||||||||||||||||||||||||||||||||||||||
| (Millions of dollars) | ||||||||||||||||||||||||||||||||||||||||||||||||||
| Segment Sales | ||||||||||||||||||||||||||||||||||||||||||||||||||
| Second Quarter 2023 | Sales Volume | Price Realization | Currency | Inter-Segment | Second Quarter 2024 | $ Change |
% Change |
|||||||||||||||||||||||||||||||||||||||||||
| Total Sales | $ | 3,563 | $ | (475) | $ | 133 | $ | (9) | $ | (6) | $ | 3,206 | $ | (357) | (10 | %) | ||||||||||||||||||||||||||||||||||
| Sales by Geographic Region | ||||||||||||||||||||||||||||||||||||||||||||||||||
| Second Quarter 2024 | Second Quarter 2023 | $ Change |
% Change |
|||||||||||||||||||||||||||||||||||||||||||||||
| North America | $ | 1,206 | $ | 1,342 | $ | (136) | (10 | %) | ||||||||||||||||||||||||||||||||||||||||||
| Latin America | 524 | 538 | (14) | (3 | %) | |||||||||||||||||||||||||||||||||||||||||||||
| EAME | 442 | 517 | (75) | (15 | %) | |||||||||||||||||||||||||||||||||||||||||||||
| Asia/Pacific | 950 | 1,076 | (126) | (12 | %) | |||||||||||||||||||||||||||||||||||||||||||||
| External Sales | 3,122 | 3,473 | (351) | (10 | %) | |||||||||||||||||||||||||||||||||||||||||||||
| Inter-segment | 84 | 90 | (6) | (7 | %) | |||||||||||||||||||||||||||||||||||||||||||||
| Total Sales | $ | 3,206 | $ | 3,563 | $ | (357) | (10 | %) | ||||||||||||||||||||||||||||||||||||||||||
| Segment Profit | ||||||||||||||||||||||||||||||||||||||||||||||||||
| Second Quarter 2024 | Second Quarter 2023 |
Change |
% Change |
|||||||||||||||||||||||||||||||||||||||||||||||
| Segment Profit | $ | 718 | $ | 740 | $ | (22) | (3 | %) | ||||||||||||||||||||||||||||||||||||||||||
| Segment Profit Margin | 22.4 | % | 20.8 | % | 1.6 | pts | ||||||||||||||||||||||||||||||||||||||||||||
| ENERGY & TRANSPORTATION | ||||||||||||||||||||||||||||||||||||||||||||||||||
| (Millions of dollars) | ||||||||||||||||||||||||||||||||||||||||||||||||||
| Segment Sales | ||||||||||||||||||||||||||||||||||||||||||||||||||
| Second Quarter 2023 | Sales Volume | Price Realization | Currency | Inter-Segment | Second Quarter 2024 | $ Change |
% Change |
|||||||||||||||||||||||||||||||||||||||||||
| Total Sales | $ | 7,219 | $ | (129) | $ | 264 | $ | (12) | $ | (5) | $ | 7,337 | $ | 118 | 2 | % | ||||||||||||||||||||||||||||||||||
| Sales by Application | ||||||||||||||||||||||||||||||||||||||||||||||||||
| Second Quarter 2024 | Second Quarter 2023 | $ Change |
% Change |
|||||||||||||||||||||||||||||||||||||||||||||||
| Oil and Gas | $ | 1,829 | $ | 1,760 | $ | 69 | 4 | % | ||||||||||||||||||||||||||||||||||||||||||
| Power Generation | 1,885 | 1,645 | 240 | 15 | % | |||||||||||||||||||||||||||||||||||||||||||||
| Industrial | 1,045 | 1,318 | (273) | (21 | %) | |||||||||||||||||||||||||||||||||||||||||||||
| Transportation | 1,321 | 1,234 | 87 | 7 | % | |||||||||||||||||||||||||||||||||||||||||||||
| External Sales | 6,080 | 5,957 | 123 | 2 | % | |||||||||||||||||||||||||||||||||||||||||||||
| Inter-segment | 1,257 | 1,262 | (5) | — | % | |||||||||||||||||||||||||||||||||||||||||||||
| Total Sales | $ | 7,337 | $ | 7,219 | $ | 118 | 2 | % | ||||||||||||||||||||||||||||||||||||||||||
| Segment Profit | ||||||||||||||||||||||||||||||||||||||||||||||||||
| Second Quarter 2024 | Second Quarter 2023 |
Change |
% Change |
|||||||||||||||||||||||||||||||||||||||||||||||
| Segment Profit | $ | 1,525 | $ | 1,269 | $ | 256 | 20 | % | ||||||||||||||||||||||||||||||||||||||||||
| Segment Profit Margin | 20.8 | % | 17.6 | % | 3.2 | pts | ||||||||||||||||||||||||||||||||||||||||||||
| FINANCIAL PRODUCTS SEGMENT | ||||||||||||||||||||||||||||||||||||||||||||||||||
| (Millions of dollars) | ||||||||||||||||||||||||||||||||||||||||||||||||||
| Revenues by Geographic Region | ||||||||||||||||||||||||||||||||||||||||||||||||||
| Second Quarter 2024 | Second Quarter 2023 | $ Change |
% Change |
|||||||||||||||||||||||||||||||||||||||||||||||
| North America | $ | 668 | $ | 593 | $ | 75 | 13 | % | ||||||||||||||||||||||||||||||||||||||||||
| Latin America | 101 | 102 | (1) | (1 | %) | |||||||||||||||||||||||||||||||||||||||||||||
| EAME | 124 | 118 | 6 | 5 | % | |||||||||||||||||||||||||||||||||||||||||||||
| Asia/Pacific | 111 | 110 | 1 | 1 | % | |||||||||||||||||||||||||||||||||||||||||||||
| Total Revenues | $ | 1,004 | $ | 923 | $ | 81 | 9 | % | ||||||||||||||||||||||||||||||||||||||||||
| Segment Profit | ||||||||||||||||||||||||||||||||||||||||||||||||||
| Second Quarter 2024 | Second Quarter 2023 |
Change |
% Change |
|||||||||||||||||||||||||||||||||||||||||||||||
| Segment Profit | $ | 227 | $ | 240 | $ | (13) | (5 | %) | ||||||||||||||||||||||||||||||||||||||||||
| (Dollars in millions except per share data) | Operating Profit | Operating Profit Margin | Profit Before Taxes | Provision (Benefit) for Income Taxes | Profit | Profit per Share | |||||||||||||||||||||||||||||||||||
Three Months Ended June 30, 2024 - U.S. GAAP |
$ | 3,482 | 20.9 | % | $ | 3,500 | $ | 836 | $ | 2,681 | $ | 5.48 | |||||||||||||||||||||||||||||
| Restructuring costs - divestiture of two non-U.S. entities | 228 | 1.3 | % | 228 | — | 228 | 0.47 | ||||||||||||||||||||||||||||||||||
| Other restructuring (income) costs | 30 | 0.2 | % | 30 | 6 | 24 | 0.04 | ||||||||||||||||||||||||||||||||||
Three Months Ended June 30, 2024 - Adjusted |
$ | 3,740 | 22.4 | % | $ | 3,758 | $ | 842 | $ | 2,933 | $ | 5.99 | |||||||||||||||||||||||||||||
Three Months Ended June 30, 2023 - U.S. GAAP |
$ | 3,652 | 21.1 | % | $ | 3,652 | $ | 752 | $ | 2,922 | $ | 5.67 | |||||||||||||||||||||||||||||
| Other restructuring (income) costs | 31 | 0.2 | % | 31 | 6 | 25 | 0.05 | ||||||||||||||||||||||||||||||||||
| Deferred tax valuation allowance adjustments | — | — | % | — | 88 | (88) | (0.17) | ||||||||||||||||||||||||||||||||||
Three Months Ended June 30, 2023 - Adjusted |
$ | 3,683 | 21.3 | % | $ | 3,683 | $ | 846 | $ | 2,859 | $ | 5.55 | |||||||||||||||||||||||||||||
| (Dollars in millions) | Profit Before Taxes | Provision (Benefit) for Income Taxes | Effective Tax Rate | |||||||||||||||||
Three Months Ended June 30, 2024 - U.S. GAAP |
$ | 3,500 | $ | 836 | 23.9 | % | ||||||||||||||
| Restructuring costs - divestiture of two non-U.S. entities | 228 | — | ||||||||||||||||||
| Excess stock-based compensation | — | 4 | ||||||||||||||||||
| Annual effective tax rate, excluding discrete items | $ | 3,728 | $ | 840 | 22.5 | % | ||||||||||||||
| Excess stock-based compensation | — | (4) | ||||||||||||||||||
| Other restructuring (income) costs | 30 | 6 | ||||||||||||||||||
Three Months Ended June 30, 2024 - Adjusted |
$ | 3,758 | $ | 842 | ||||||||||||||||
Three Months Ended June 30, 2023 - U.S. GAAP |
$ | 3,652 | $ | 752 | 20.6 | % | ||||||||||||||
| Deferred tax valuation allowance adjustments | — | 88 | ||||||||||||||||||
| Annual effective tax rate, excluding discrete items | $ | 3,652 | $ | 840 | 23.0 | % | ||||||||||||||
| Other restructuring (income) costs | 31 | 6 | ||||||||||||||||||
Three Months Ended June 30, 2023 - Adjusted |
$ | 3,683 | $ | 846 | ||||||||||||||||
| Three Months Ended June 30, | Six Months Ended June 30, | ||||||||||||||||||||||
| 2024 | 2023 | 2024 | 2023 | ||||||||||||||||||||
| Sales and revenues: | |||||||||||||||||||||||
| Sales of Machinery, Energy & Transportation | $ | 15,840 | $ | 16,545 | $ | 30,800 | $ | 31,644 | |||||||||||||||
| Revenues of Financial Products | 849 | 773 | 1,688 | 1,536 | |||||||||||||||||||
| Total sales and revenues | 16,689 | 17,318 | 32,488 | 33,180 | |||||||||||||||||||
| Operating costs: | |||||||||||||||||||||||
| Cost of goods sold | 10,150 | 11,065 | 19,812 | 21,168 | |||||||||||||||||||
| Selling, general and administrative expenses | 1,652 | 1,528 | 3,229 | 2,991 | |||||||||||||||||||
| Research and development expenses | 535 | 528 | 1,055 | 1,000 | |||||||||||||||||||
| Interest expense of Financial Products | 314 | 245 | 612 | 462 | |||||||||||||||||||
| Other operating (income) expenses | 556 | 300 | 779 | 1,176 | |||||||||||||||||||
| Total operating costs | 13,207 | 13,666 | 25,487 | 26,797 | |||||||||||||||||||
| Operating profit | 3,482 | 3,652 | 7,001 | 6,383 | |||||||||||||||||||
| Interest expense excluding Financial Products | 137 | 127 | 280 | 256 | |||||||||||||||||||
| Other income (expense) | 155 | 127 | 311 | 159 | |||||||||||||||||||
| Consolidated profit before taxes | 3,500 | 3,652 | 7,032 | 6,286 | |||||||||||||||||||
| Provision (benefit) for income taxes | 836 | 752 | 1,524 | 1,460 | |||||||||||||||||||
| Profit of consolidated companies | 2,664 | 2,900 | 5,508 | 4,826 | |||||||||||||||||||
| Equity in profit (loss) of unconsolidated affiliated companies | 17 | 24 | 27 | 40 | |||||||||||||||||||
| Profit of consolidated and affiliated companies | 2,681 | 2,924 | 5,535 | 4,866 | |||||||||||||||||||
| Less: Profit (loss) attributable to noncontrolling interests | — | 2 | (2) | 1 | |||||||||||||||||||
Profit 1 |
$ | 2,681 | $ | 2,922 | $ | 5,537 | $ | 4,865 | |||||||||||||||
| Profit per common share | $ | 5.50 | $ | 5.70 | $ | 11.28 | $ | 9.46 | |||||||||||||||
Profit per common share — diluted 2 |
$ | 5.48 | $ | 5.67 | $ | 11.23 | $ | 9.41 | |||||||||||||||
| Weighted-average common shares outstanding (millions) | |||||||||||||||||||||||
| – Basic | 487.2 | 512.9 | 490.7 | 514.3 | |||||||||||||||||||
– Diluted 2 |
489.5 | 515.0 | 493.3 | 517.1 | |||||||||||||||||||
| 1 | Profit attributable to common shareholders. | ||||
| 2 | Diluted by assumed exercise of stock-based compensation awards using the treasury stock method. | ||||
| June 30, 2024 |
December 31, 2023 |
||||||||||
| Assets | |||||||||||
| Current assets: | |||||||||||
| Cash and cash equivalents | $ | 4,341 | $ | 6,978 | |||||||
| Receivables – trade and other | 9,421 | 9,310 | |||||||||
| Receivables – finance | 9,516 | 9,510 | |||||||||
| Prepaid expenses and other current assets | 2,736 | 4,586 | |||||||||
| Inventories | 17,082 | 16,565 | |||||||||
| Total current assets | 43,096 | 46,949 | |||||||||
| Property, plant and equipment – net | 12,582 | 12,680 | |||||||||
| Long-term receivables – trade and other | 1,181 | 1,238 | |||||||||
| Long-term receivables – finance | 12,797 | 12,664 | |||||||||
| Noncurrent deferred and refundable income taxes | 2,920 | 2,816 | |||||||||
| Intangible assets | 488 | 564 | |||||||||
| Goodwill | 5,264 | 5,308 | |||||||||
| Other assets | 5,008 | 5,257 | |||||||||
| Total assets | $ | 83,336 | $ | 87,476 | |||||||
| Liabilities | |||||||||||
| Current liabilities: | |||||||||||
| Short-term borrowings: | |||||||||||
| -- Machinery, Energy & Transportation | $ | — | $ | — | |||||||
| -- Financial Products | 5,298 | 4,643 | |||||||||
| Accounts payable | 7,575 | 7,906 | |||||||||
| Accrued expenses | 4,947 | 4,958 | |||||||||
| Accrued wages, salaries and employee benefits | 1,677 | 2,757 | |||||||||
| Customer advances | 2,324 | 1,929 | |||||||||
| Dividends payable | 684 | 649 | |||||||||
| Other current liabilities | 2,882 | 3,123 | |||||||||
| Long-term debt due within one year: | |||||||||||
| -- Machinery, Energy & Transportation | 45 | 1,044 | |||||||||
| -- Financial Products | 8,132 | 7,719 | |||||||||
| Total current liabilities | 33,564 | 34,728 | |||||||||
| Long-term debt due after one year: | |||||||||||
| -- Machinery, Energy & Transportation | 8,537 | 8,579 | |||||||||
| -- Financial Products | 15,299 | 15,893 | |||||||||
| Liability for postemployment benefits | 3,993 | 4,098 | |||||||||
| Other liabilities | 4,807 | 4,675 | |||||||||
| Total liabilities | 66,200 | 67,973 | |||||||||
| Shareholders’ equity | |||||||||||
| Common stock | 5,517 | 6,403 | |||||||||
| Treasury stock | (41,612) | (36,339) | |||||||||
| Profit employed in the business | 55,455 | 51,250 | |||||||||
| Accumulated other comprehensive income (loss) | (2,230) | (1,820) | |||||||||
| Noncontrolling interests | 6 | 9 | |||||||||
| Total shareholders’ equity | 17,136 | 19,503 | |||||||||
| Total liabilities and shareholders’ equity | $ | 83,336 | $ | 87,476 | |||||||
| Six Months Ended June 30, |
|||||||||||
| 2024 | 2023 | ||||||||||
| Cash flow from operating activities: | |||||||||||
| Profit of consolidated and affiliated companies | $ | 5,535 | $ | 4,866 | |||||||
| Adjustments to reconcile profit to net cash provided by operating activities: | |||||||||||
| Depreciation and amortization | 1,055 | 1,074 | |||||||||
| Provision (benefit) for deferred income taxes | (133) | (355) | |||||||||
| (Gain) loss on divestiture | 164 | 572 | |||||||||
| Other | 105 | 106 | |||||||||
| Changes in assets and liabilities, net of acquisitions and divestitures: | |||||||||||
| Receivables – trade and other | (245) | (465) | |||||||||
| Inventories | (643) | (1,560) | |||||||||
| Accounts payable | (21) | 34 | |||||||||
| Accrued expenses | 69 | 381 | |||||||||
| Accrued wages, salaries and employee benefits | (1,056) | (562) | |||||||||
| Customer advances | 341 | 284 | |||||||||
| Other assets – net | 20 | 81 | |||||||||
| Other liabilities – net | (118) | 366 | |||||||||
| Net cash provided by (used for) operating activities | 5,073 | 4,822 | |||||||||
| Cash flow from investing activities: | |||||||||||
| Capital expenditures – excluding equipment leased to others | (841) | (683) | |||||||||
| Expenditures for equipment leased to others | (614) | (774) | |||||||||
| Proceeds from disposals of leased assets and property, plant and equipment | 342 | 368 | |||||||||
| Additions to finance receivables | (7,446) | (6,973) | |||||||||
| Collections of finance receivables | 6,743 | 6,759 | |||||||||
| Proceeds from sale of finance receivables | 37 | 29 | |||||||||
| Investments and acquisitions (net of cash acquired) | (32) | (20) | |||||||||
| Proceeds from sale of businesses and investments (net of cash sold) | (61) | (14) | |||||||||
| Proceeds from maturities and sale of securities | 2,574 | 463 | |||||||||
| Investments in securities | (523) | (1,078) | |||||||||
| Other – net | 57 | 41 | |||||||||
| Net cash provided by (used for) investing activities | 236 | (1,882) | |||||||||
| Cash flow from financing activities: | |||||||||||
| Dividends paid | (1,283) | (1,238) | |||||||||
| Common stock issued, including treasury shares reissued | 8 | (22) | |||||||||
| Payments to purchase common stock | (6,275) | (1,829) | |||||||||
| Proceeds from debt issued (original maturities greater than three months) | 4,151 | 3,299 | |||||||||
| Payments on debt (original maturities greater than three months) | (5,217) | (2,303) | |||||||||
| Short-term borrowings – net (original maturities three months or less) | 687 | (406) | |||||||||
| Net cash provided by (used for) financing activities | (7,929) | (2,499) | |||||||||
| Effect of exchange rate changes on cash | (17) | (60) | |||||||||
| Increase (decrease) in cash, cash equivalents and restricted cash | (2,637) | 381 | |||||||||
| Cash, cash equivalents and restricted cash at beginning of period | 6,985 | 7,013 | |||||||||
| Cash, cash equivalents and restricted cash at end of period | $ | 4,348 | $ | 7,394 | |||||||
Cash equivalents primarily represent short-term, highly liquid investments with original maturities of generally three months or less. | ||
| Supplemental Consolidating Data | ||||||||||||||||||||||||||
| Consolidated | Machinery, Energy & Transportation | Financial Products |
Consolidating Adjustments |
|||||||||||||||||||||||
| Sales and revenues: | ||||||||||||||||||||||||||
| Sales of Machinery, Energy & Transportation | $ | 15,840 | $ | 15,840 | $ | — | $ | — | ||||||||||||||||||
| Revenues of Financial Products | 849 | — | 1,043 | (194) | 1 | |||||||||||||||||||||
| Total sales and revenues | 16,689 | 15,840 | 1,043 | (194) | ||||||||||||||||||||||
| Operating costs: | ||||||||||||||||||||||||||
| Cost of goods sold | 10,150 | 10,152 | — | (2) | 2 | |||||||||||||||||||||
| Selling, general and administrative expenses | 1,652 | 1,449 | 185 | 18 | 2 | |||||||||||||||||||||
| Research and development expenses | 535 | 535 | — | — | ||||||||||||||||||||||
| Interest expense of Financial Products | 314 | — | 314 | — | ||||||||||||||||||||||
| Other operating (income) expenses | 556 | 43 | 560 | (47) | 2 | |||||||||||||||||||||
| Total operating costs | 13,207 | 12,179 | 1,059 | (31) | ||||||||||||||||||||||
| Operating profit | 3,482 | 3,661 | (16) | (163) | ||||||||||||||||||||||
| Interest expense excluding Financial Products | 137 | 137 | — | — | ||||||||||||||||||||||
| Other income (expense) | 155 | (21) | 13 | 163 | 3 | |||||||||||||||||||||
| Consolidated profit before taxes | 3,500 | 3,503 | (3) | — | ||||||||||||||||||||||
| Provision (benefit) for income taxes | 836 | 786 | 50 | — | ||||||||||||||||||||||
| Profit of consolidated companies | 2,664 | 2,717 | (53) | — | ||||||||||||||||||||||
| Equity in profit (loss) of unconsolidated affiliated companies | 17 | 17 | — | — | ||||||||||||||||||||||
| Profit of consolidated and affiliated companies | 2,681 | 2,734 | (53) | — | ||||||||||||||||||||||
| Less: Profit (loss) attributable to noncontrolling interests | — | — | — | — | ||||||||||||||||||||||
Profit 4 |
$ | 2,681 | $ | 2,734 | $ | (53) | $ | — | ||||||||||||||||||
| 1 | Elimination of Financial Products’ revenues earned from ME&T. |
||||
| 2 | Elimination of net expenses recorded between ME&T and Financial Products. |
||||
| 3 | Elimination of discount recorded by ME&T on receivables sold to Financial Products and of interest earned between ME&T and Financial Products as well as dividends paid by Financial Products to ME&T. |
||||
| 4 | Profit attributable to common shareholders. | ||||
| Supplemental Consolidating Data | ||||||||||||||||||||||||||
| Consolidated | Machinery, Energy & Transportation | Financial Products |
Consolidating Adjustments |
|||||||||||||||||||||||
| Sales and revenues: | ||||||||||||||||||||||||||
| Sales of Machinery, Energy & Transportation | $ | 16,545 | $ | 16,545 | $ | — | $ | — | ||||||||||||||||||
| Revenues of Financial Products | 773 | — | 955 | (182) | 1 | |||||||||||||||||||||
| Total sales and revenues | 17,318 | 16,545 | 955 | (182) | ||||||||||||||||||||||
| Operating costs: | ||||||||||||||||||||||||||
| Cost of goods sold | 11,065 | 11,068 | — | (3) | 2 | |||||||||||||||||||||
| Selling, general and administrative expenses | 1,528 | 1,389 | 143 | (4) | 2 | |||||||||||||||||||||
| Research and development expenses | 528 | 528 | — | — | ||||||||||||||||||||||
| Interest expense of Financial Products | 245 | — | 245 | — | ||||||||||||||||||||||
| Other operating (income) expenses | 300 | 10 | 310 | (20) | 2 | |||||||||||||||||||||
| Total operating costs | 13,666 | 12,995 | 698 | (27) | ||||||||||||||||||||||
| Operating profit | 3,652 | 3,550 | 257 | (155) | ||||||||||||||||||||||
| Interest expense excluding Financial Products | 127 | 127 | — | — | ||||||||||||||||||||||
| Other income (expense) | 127 | (10) | (18) | 155 | 3 | |||||||||||||||||||||
| Consolidated profit before taxes | 3,652 | 3,413 | 239 | — | ||||||||||||||||||||||
| Provision (benefit) for income taxes | 752 | 691 | 61 | — | ||||||||||||||||||||||
| Profit of consolidated companies | 2,900 | 2,722 | 178 | — | ||||||||||||||||||||||
| Equity in profit (loss) of unconsolidated affiliated companies | 24 | 24 | — | — | ||||||||||||||||||||||
| Profit of consolidated and affiliated companies | 2,924 | 2,746 | 178 | — | ||||||||||||||||||||||
| Less: Profit (loss) attributable to noncontrolling interests | 2 | (1) | 3 | — | ||||||||||||||||||||||
Profit 4 |
$ | 2,922 | $ | 2,747 | $ | 175 | $ | — | ||||||||||||||||||
| 1 | Elimination of Financial Products’ revenues earned from ME&T. |
||||
| 2 | Elimination of net expenses recorded by ME&T paid to Financial Products. |
||||
| 3 | Elimination of discount recorded by ME&T on receivables sold to Financial Products and of interest earned between ME&T and Financial Products as well as dividends paid by Financial Products to ME&T. |
||||
| 4 | Profit attributable to common shareholders. | ||||
| Supplemental Consolidating Data | ||||||||||||||||||||||||||
| Consolidated | Machinery, Energy & Transportation | Financial Products |
Consolidating Adjustments |
|||||||||||||||||||||||
| Sales and revenues: | ||||||||||||||||||||||||||
| Sales of Machinery, Energy & Transportation | $ | 30,800 | $ | 30,800 | $ | — | $ | — | ||||||||||||||||||
| Revenues of Financial Products | 1,688 | — | 2,072 | (384) | 1 | |||||||||||||||||||||
| Total sales and revenues | 32,488 | 30,800 | 2,072 | (384) | ||||||||||||||||||||||
| Operating costs: | ||||||||||||||||||||||||||
| Cost of goods sold | 19,812 | 19,816 | — | (4) | 2 | |||||||||||||||||||||
| Selling, general and administrative expenses | 3,229 | 2,862 | 363 | 4 | 2 | |||||||||||||||||||||
| Research and development expenses | 1,055 | 1,055 | — | — | ||||||||||||||||||||||
| Interest expense of Financial Products | 612 | — | 612 | — | ||||||||||||||||||||||
| Other operating (income) expenses | 779 | 2 | 845 | (68) | 2 | |||||||||||||||||||||
| Total operating costs | 25,487 | 23,735 | 1,820 | (68) | ||||||||||||||||||||||
| Operating profit | 7,001 | 7,065 | 252 | (316) | ||||||||||||||||||||||
| Interest expense excluding Financial Products | 280 | 280 | — | — | ||||||||||||||||||||||
| Other income (expense) | 311 | (41) | 36 | 316 | 3 | |||||||||||||||||||||
| Consolidated profit before taxes | 7,032 | 6,744 | 288 | — | ||||||||||||||||||||||
| Provision (benefit) for income taxes | 1,524 | 1,401 | 123 | — | ||||||||||||||||||||||
| Profit of consolidated companies | 5,508 | 5,343 | 165 | — | ||||||||||||||||||||||
| Equity in profit (loss) of unconsolidated affiliated companies | 27 | 27 | — | — | ||||||||||||||||||||||
| Profit of consolidated and affiliated companies | 5,535 | 5,370 | 165 | — | ||||||||||||||||||||||
| Less: Profit (loss) attributable to noncontrolling interests | (2) | (3) | 1 | — | ||||||||||||||||||||||
Profit 4 |
$ | 5,537 | $ | 5,373 | $ | 164 | $ | — | ||||||||||||||||||
| 1 | Elimination of Financial Products’ revenues earned from ME&T. |
||||
| 2 | Elimination of net expenses recorded between ME&T and Financial Products. |
||||
| 3 | Elimination of discount recorded by ME&T on receivables sold to Financial Products and of interest earned between ME&T and Financial Products as well as dividends paid by Financial Products to ME&T. |
||||
| 4 | Profit attributable to common shareholders. | ||||
| Supplemental Consolidating Data | ||||||||||||||||||||||||||
| Consolidated | Machinery, Energy & Transportation | Financial Products |
Consolidating Adjustments |
|||||||||||||||||||||||
| Sales and revenues: | ||||||||||||||||||||||||||
| Sales of Machinery, Energy & Transportation | $ | 31,644 | $ | 31,644 | $ | — | $ | — | ||||||||||||||||||
| Revenues of Financial Products | 1,536 | — | 1,890 | (354) | 1 | |||||||||||||||||||||
| Total sales and revenues | 33,180 | 31,644 | 1,890 | (354) | ||||||||||||||||||||||
| Operating costs: | ||||||||||||||||||||||||||
| Cost of goods sold | 21,168 | 21,172 | — | (4) | 2 | |||||||||||||||||||||
| Selling, general and administrative expenses | 2,991 | 2,709 | 301 | (19) | 2 | |||||||||||||||||||||
| Research and development expenses | 1,000 | 1,000 | — | — | ||||||||||||||||||||||
| Interest expense of Financial Products | 462 | — | 462 | — | ||||||||||||||||||||||
| Other operating (income) expenses | 1,176 | 599 | 613 | (36) | 2 | |||||||||||||||||||||
| Total operating costs | 26,797 | 25,480 | 1,376 | (59) | ||||||||||||||||||||||
| Operating profit | 6,383 | 6,164 | 514 | (295) | ||||||||||||||||||||||
| Interest expense excluding Financial Products | 256 | 256 | — | — | ||||||||||||||||||||||
| Other income (expense) | 159 | (24) | (37) | 220 | 3 | |||||||||||||||||||||
| Consolidated profit before taxes | 6,286 | 5,884 | 477 | (75) | ||||||||||||||||||||||
| Provision (benefit) for income taxes | 1,460 | 1,339 | 121 | — | ||||||||||||||||||||||
| Profit of consolidated companies | 4,826 | 4,545 | 356 | (75) | ||||||||||||||||||||||
| Equity in profit (loss) of unconsolidated affiliated companies | 40 | 43 | — | (3) | 4 | |||||||||||||||||||||
| Profit of consolidated and affiliated companies | 4,866 | 4,588 | 356 | (78) | ||||||||||||||||||||||
| Less: Profit (loss) attributable to noncontrolling interests | 1 | (1) | 5 | (3) | 5 | |||||||||||||||||||||
Profit 6 |
$ | 4,865 | $ | 4,589 | $ | 351 | $ | (75) | ||||||||||||||||||
| 1 | Elimination of Financial Products’ revenues earned from ME&T. |
||||
| 2 | Elimination of net expenses recorded by ME&T paid to Financial Products. |
||||
| 3 | Elimination of discount recorded by ME&T on receivables sold to Financial Products and of interest earned between ME&T and Financial Products as well as dividends paid by Financial Products to ME&T. |
||||
| 4 | Elimination of equity profit (loss) earned from Financial Products’ subsidiaries partially owned by ME&T subsidiaries. |
||||
| 5 | Elimination of noncontrolling interest profit (loss) recorded by Financial Products for subsidiaries partially owned by ME&T subsidiaries. |
||||
| 6 | Profit attributable to common shareholders. | ||||
| Supplemental Consolidating Data | ||||||||||||||||||||||||||
| Consolidated | Machinery, Energy & Transportation |
Financial Products |
Consolidating Adjustments |
|||||||||||||||||||||||
| Assets | ||||||||||||||||||||||||||
| Current assets: | ||||||||||||||||||||||||||
| Cash and cash equivalents | $ | 4,341 | $ | 3,481 | $ | 860 | $ | — | ||||||||||||||||||
| Receivables – trade and other | 9,421 | 3,672 | 643 | 5,106 | 1,2 |
|||||||||||||||||||||
| Receivables – finance | 9,516 | — | 14,826 | (5,310) | 2 | |||||||||||||||||||||
| Prepaid expenses and other current assets | 2,736 | 2,549 | 390 | (203) | 3 | |||||||||||||||||||||
| Inventories | 17,082 | 17,082 | — | — | ||||||||||||||||||||||
| Total current assets | 43,096 | 26,784 | 16,719 | (407) | ||||||||||||||||||||||
| Property, plant and equipment – net | 12,582 | 8,653 | 3,929 | — | ||||||||||||||||||||||
| Long-term receivables – trade and other | 1,181 | 501 | 55 | 625 | 1,2 |
|||||||||||||||||||||
| Long-term receivables – finance | 12,797 | — | 13,490 | (693) | 2 | |||||||||||||||||||||
| Noncurrent deferred and refundable income taxes | 2,920 | 3,433 | 120 | (633) | 4 | |||||||||||||||||||||
| Intangible assets | 488 | 488 | — | — | ||||||||||||||||||||||
| Goodwill | 5,264 | 5,264 | — | — | ||||||||||||||||||||||
| Other assets | 5,008 | 3,934 | 2,112 | (1,038) | 5 | |||||||||||||||||||||
| Total assets | $ | 83,336 | $ | 49,057 | $ | 36,425 | $ | (2,146) | ||||||||||||||||||
| Liabilities | ||||||||||||||||||||||||||
| Current liabilities: | ||||||||||||||||||||||||||
| Short-term borrowings | $ | 5,298 | $ | — | $ | 5,298 | $ | — | ||||||||||||||||||
| Accounts payable | 7,575 | 7,523 | 274 | (222) | 6,7 | |||||||||||||||||||||
| Accrued expenses | 4,947 | 4,315 | 632 | — | ||||||||||||||||||||||
| Accrued wages, salaries and employee benefits | 1,677 | 1,637 | 40 | — | ||||||||||||||||||||||
| Customer advances | 2,324 | 2,303 | 3 | 18 | 7 | |||||||||||||||||||||
| Dividends payable | 684 | 684 | — | — | ||||||||||||||||||||||
| Other current liabilities | 2,882 | 2,365 | 744 | (227) | 4,8 |
|||||||||||||||||||||
| Long-term debt due within one year | 8,177 | 45 | 8,132 | — | ||||||||||||||||||||||
| Total current liabilities | 33,564 | 18,872 | 15,123 | (431) | ||||||||||||||||||||||
| Long-term debt due after one year | 23,836 | 8,605 | 15,299 | (68) | 9 | |||||||||||||||||||||
| Liability for postemployment benefits | 3,993 | 3,993 | — | — | ||||||||||||||||||||||
| Other liabilities | 4,807 | 3,931 | 1,550 | (674) | 4 | |||||||||||||||||||||
| Total liabilities | 66,200 | 35,401 | 31,972 | (1,173) | ||||||||||||||||||||||
| Shareholders’ equity | ||||||||||||||||||||||||||
| Common stock | 5,517 | 5,517 | 905 | (905) | 10 | |||||||||||||||||||||
| Treasury stock | (41,612) | (41,612) | — | — | ||||||||||||||||||||||
| Profit employed in the business | 55,455 | 50,824 | 4,621 | 10 | 10 | |||||||||||||||||||||
| Accumulated other comprehensive income (loss) | (2,230) | (1,082) | (1,148) | — | ||||||||||||||||||||||
| Noncontrolling interests | 6 | 9 | 75 | (78) | 10 | |||||||||||||||||||||
| Total shareholders’ equity | 17,136 | 13,656 | 4,453 | (973) | ||||||||||||||||||||||
| Total liabilities and shareholders’ equity | $ | 83,336 | $ | 49,057 | $ | 36,425 | $ | (2,146) | ||||||||||||||||||
| 1 | Elimination of receivables between ME&T and Financial Products. |
||||
| 2 | Reclassification of ME&T’s trade receivables purchased by Financial Products and Financial Products’ wholesale inventory receivables. |
||||
| 3 | Elimination of ME&T's insurance premiums that are prepaid to Financial Products. | ||||
| 4 | Reclassification reflecting required netting of deferred tax assets/liabilities by taxing jurisdiction. |
||||
| 5 | Elimination of other intercompany assets between ME&T and Financial Products. |
||||
| 6 | Elimination of payables between ME&T and Financial Products. |
||||
| 7 | Reclassification of Financial Products' payables to customer advances. | ||||
| 8 | Elimination of prepaid insurance in Financial Products’ other liabilities. | ||||
| 9 | Elimination of debt between ME&T and Financial Products. |
||||
| 10 | Eliminations associated with ME&T’s investments in Financial Products’ subsidiaries. |
||||
| Supplemental Consolidating Data | ||||||||||||||||||||||||||
| Consolidated | Machinery, Energy & Transportation |
Financial Products |
Consolidating Adjustments |
|||||||||||||||||||||||
| Assets | ||||||||||||||||||||||||||
| Current assets: | ||||||||||||||||||||||||||
| Cash and cash equivalents | $ | 6,978 | $ | 6,106 | $ | 872 | $ | — | ||||||||||||||||||
| Receivables – trade and other | 9,310 | 3,971 | 570 | 4,769 | 1,2 |
|||||||||||||||||||||
| Receivables – finance | 9,510 | — | 14,499 | (4,989) | 2 | |||||||||||||||||||||
| Prepaid expenses and other current assets | 4,586 | 4,327 | 341 | (82) | 3 | |||||||||||||||||||||
| Inventories | 16,565 | 16,565 | — | — | ||||||||||||||||||||||
| Total current assets | 46,949 | 30,969 | 16,282 | (302) | ||||||||||||||||||||||
| Property, plant and equipment – net | 12,680 | 8,694 | 3,986 | — | ||||||||||||||||||||||
| Long-term receivables – trade and other | 1,238 | 565 | 85 | 588 | 1,2 |
|||||||||||||||||||||
| Long-term receivables – finance | 12,664 | — | 13,299 | (635) | 2 | |||||||||||||||||||||
| Noncurrent deferred and refundable income taxes | 2,816 | 3,360 | 148 | (692) | 4 | |||||||||||||||||||||
| Intangible assets | 564 | 564 | — | — | ||||||||||||||||||||||
| Goodwill | 5,308 | 5,308 | — | — | ||||||||||||||||||||||
| Other assets | 5,257 | 4,218 | 2,082 | (1,043) | 5 | |||||||||||||||||||||
| Total assets | $ | 87,476 | $ | 53,678 | $ | 35,882 | $ | (2,084) | ||||||||||||||||||
| Liabilities | ||||||||||||||||||||||||||
| Current liabilities: | ||||||||||||||||||||||||||
| Short-term borrowings | $ | 4,643 | $ | — | $ | 4,643 | $ | — | ||||||||||||||||||
| Accounts payable | 7,906 | 7,827 | 314 | (235) | 6,7 | |||||||||||||||||||||
| Accrued expenses | 4,958 | 4,361 | 597 | — | ||||||||||||||||||||||
| Accrued wages, salaries and employee benefits | 2,757 | 2,696 | 61 | — | ||||||||||||||||||||||
| Customer advances | 1,929 | 1,912 | 2 | 15 | 7 | |||||||||||||||||||||
| Dividends payable | 649 | 649 | — | — | ||||||||||||||||||||||
| Other current liabilities | 3,123 | 2,583 | 647 | (107) | 4,8 |
|||||||||||||||||||||
| Long-term debt due within one year | 8,763 | 1,044 | 7,719 | — | ||||||||||||||||||||||
| Total current liabilities | 34,728 | 21,072 | 13,983 | (327) | ||||||||||||||||||||||
| Long-term debt due after one year | 24,472 | 8,626 | 15,893 | (47) | 9 | |||||||||||||||||||||
| Liability for postemployment benefits | 4,098 | 4,098 | — | — | ||||||||||||||||||||||
| Other liabilities | 4,675 | 3,806 | 1,607 | (738) | 4 | |||||||||||||||||||||
| Total liabilities | 67,973 | 37,602 | 31,483 | (1,112) | ||||||||||||||||||||||
| Shareholders’ equity | ||||||||||||||||||||||||||
| Common stock | 6,403 | 6,403 | 905 | (905) | 10 | |||||||||||||||||||||
| Treasury stock | (36,339) | (36,339) | — | — | ||||||||||||||||||||||
| Profit employed in the business | 51,250 | 46,783 | 4,457 | 10 | 10 | |||||||||||||||||||||
| Accumulated other comprehensive income (loss) | (1,820) | (783) | (1,037) | — | ||||||||||||||||||||||
| Noncontrolling interests | 9 | 12 | 74 | (77) | 10 | |||||||||||||||||||||
| Total shareholders’ equity | 19,503 | 16,076 | 4,399 | (972) | ||||||||||||||||||||||
| Total liabilities and shareholders’ equity | $ | 87,476 | $ | 53,678 | $ | 35,882 | $ | (2,084) | ||||||||||||||||||
| 1 | Elimination of receivables between ME&T and Financial Products. |
||||
| 2 | Reclassification of ME&T’s trade receivables purchased by Financial Products and Financial Products’ wholesale inventory receivables. |
||||
| 3 | Elimination of ME&T’s insurance premiums that are prepaid to Financial Products. | ||||
| 4 | Reclassification reflecting required netting of deferred tax assets/liabilities by taxing jurisdiction. |
||||
| 5 | Elimination of other intercompany assets between ME&T and Financial Products. |
||||
| 6 | Elimination of payables between ME&T and Financial Products. | ||||
| 7 | Reclassification of Financial Products' payables to customer advances. | ||||
| 8 | Elimination of prepaid insurance in Financial Products’ other liabilities. |
||||
| 9 | Elimination of debt between ME&T and Financial Products. | ||||
| 10 | Eliminations associated with ME&T’s investments in Financial Products’ subsidiaries. |
||||
| Supplemental Consolidating Data | ||||||||||||||||||||||||||
| Consolidated | Machinery, Energy & Transportation | Financial Products |
Consolidating Adjustments |
|||||||||||||||||||||||
| Cash flow from operating activities: | ||||||||||||||||||||||||||
| Profit of consolidated and affiliated companies | $ | 5,535 | $ | 5,370 | $ | 165 | $ | — | ||||||||||||||||||
| Adjustments to reconcile profit to net cash provided by operating activities: | ||||||||||||||||||||||||||
| Depreciation and amortization | 1,055 | 662 | 393 | — | ||||||||||||||||||||||
| Provision (benefit) for deferred income taxes | (133) | (81) | (52) | — | ||||||||||||||||||||||
| (Gain) loss on divestiture | 164 | (46) | 210 | — | ||||||||||||||||||||||
| Other | 105 | 104 | (280) | 281 | 1 | |||||||||||||||||||||
| Changes in assets and liabilities, net of acquisitions and divestitures: | ||||||||||||||||||||||||||
| Receivables – trade and other | (245) | 195 | 96 | (536) | 1,2 |
|||||||||||||||||||||
| Inventories | (643) | (638) | — | (5) | 1 | |||||||||||||||||||||
| Accounts payable | (21) | 6 | (58) | 31 | 1 | |||||||||||||||||||||
| Accrued expenses | 69 | (41) | 110 | — | ||||||||||||||||||||||
| Accrued wages, salaries and employee benefits | (1,056) | (1,035) | (21) | — | ||||||||||||||||||||||
| Customer advances | 341 | 341 | — | — | ||||||||||||||||||||||
| Other assets – net | 20 | (108) | 5 | 123 | 1 | |||||||||||||||||||||
| Other liabilities – net | (118) | (156) | 147 | (109) | 1 | |||||||||||||||||||||
| Net cash provided by (used for) operating activities | 5,073 | 4,573 | 715 | (215) | ||||||||||||||||||||||
| Cash flow from investing activities: | ||||||||||||||||||||||||||
| Capital expenditures – excluding equipment leased to others | (841) | (831) | (13) | 3 | 1 | |||||||||||||||||||||
| Expenditures for equipment leased to others | (614) | (10) | (612) | 8 | 1 | |||||||||||||||||||||
| Proceeds from disposals of leased assets and property, plant and equipment | 342 | 13 | 335 | (6) | 1 | |||||||||||||||||||||
| Additions to finance receivables | (7,446) | — | (7,951) | 505 | 2 | |||||||||||||||||||||
| Collections of finance receivables | 6,743 | — | 7,176 | (433) | 2 | |||||||||||||||||||||
| Net intercompany purchased receivables | — | — | (138) | 138 | 2 | |||||||||||||||||||||
| Proceeds from sale of finance receivables | 37 | — | 37 | — | ||||||||||||||||||||||
| Net intercompany borrowings | — | — | 9 | (9) | 3 | |||||||||||||||||||||
| Investments and acquisitions (net of cash acquired) | (32) | (32) | — | — | ||||||||||||||||||||||
| Proceeds from sale of businesses and investments (net of cash sold) | (61) | 92 | (153) | — | ||||||||||||||||||||||
| Proceeds from maturities and sale of securities | 2,574 | 2,402 | 172 | — | ||||||||||||||||||||||
| Investments in securities | (523) | (300) | (223) | — | ||||||||||||||||||||||
| Other – net | 57 | 47 | 10 | — | ||||||||||||||||||||||
| Net cash provided by (used for) investing activities | 236 | 1,381 | (1,351) | 206 | ||||||||||||||||||||||
| Cash flow from financing activities: | ||||||||||||||||||||||||||
| Dividends paid | (1,283) | (1,283) | — | — | ||||||||||||||||||||||
| Common stock issued, including treasury shares reissued | 8 | 8 | — | — | ||||||||||||||||||||||
| Payments to purchase common stock | (6,275) | (6,275) | — | — | ||||||||||||||||||||||
| Net intercompany borrowings | — | (9) | — | 9 | 3 | |||||||||||||||||||||
| Proceeds from debt issued (original maturities greater than three months) | 4,151 | — | 4,151 | — | ||||||||||||||||||||||
| Payments on debt (original maturities greater than three months) | (5,217) | (1,014) | (4,203) | — | ||||||||||||||||||||||
| Short-term borrowings – net (original maturities three months or less) | 687 | — | 687 | — | ||||||||||||||||||||||
| Net cash provided by (used for) financing activities | (7,929) | (8,573) | 635 | 9 | ||||||||||||||||||||||
| Effect of exchange rate changes on cash | (17) | (7) | (10) | — | ||||||||||||||||||||||
| Increase (decrease) in cash, cash equivalents and restricted cash | (2,637) | (2,626) | (11) | — | ||||||||||||||||||||||
| Cash, cash equivalents and restricted cash at beginning of period | 6,985 | 6,111 | 874 | — | ||||||||||||||||||||||
| Cash, cash equivalents and restricted cash at end of period | $ | 4,348 | $ | 3,485 | $ | 863 | $ | — | ||||||||||||||||||
| 1 | Elimination of non-cash adjustments and changes in assets and liabilities related to consolidated reporting. | ||||
| 2 | Reclassification of Financial Products’ cash flow activity from investing to operating for receivables that arose from the sale of inventory. | ||||
| 3 | Elimination of net proceeds and payments to/from ME&T and Financial Products. | ||||
| Supplemental Consolidating Data | ||||||||||||||||||||||||||
| Consolidated | Machinery, Energy & Transportation | Financial Products |
Consolidating Adjustments |
|||||||||||||||||||||||
| Cash flow from operating activities: | ||||||||||||||||||||||||||
| Profit of consolidated and affiliated companies | $ | 4,866 | $ | 4,588 | $ | 356 | $ | (78) | 1,5 | |||||||||||||||||
| Adjustments to reconcile profit to net cash provided by operating activities: | ||||||||||||||||||||||||||
| Depreciation and amortization | 1,074 | 690 | 384 | — | ||||||||||||||||||||||
| Provision (benefit) for deferred income taxes | (355) | (338) | (17) | — | ||||||||||||||||||||||
| (Gain) loss on divestiture | 572 | 572 | — | — | ||||||||||||||||||||||
| Other | 106 | 198 | (368) | 276 | 2 | |||||||||||||||||||||
| Changes in assets and liabilities, net of acquisitions and divestitures: | ||||||||||||||||||||||||||
| Receivables – trade and other | (465) | 132 | 57 | (654) | 2,3 |
|||||||||||||||||||||
| Inventories | (1,560) | (1,558) | — | (2) | 2 | |||||||||||||||||||||
| Accounts payable | 34 | (28) | 2 | 60 | 2 | |||||||||||||||||||||
| Accrued expenses | 381 | 318 | 63 | — | ||||||||||||||||||||||
| Accrued wages, salaries and employee benefits | (562) | (550) | (12) | — | ||||||||||||||||||||||
| Customer advances | 284 | 283 | 1 | — | ||||||||||||||||||||||
| Other assets – net | 81 | 149 | 5 | (73) | 2 | |||||||||||||||||||||
| Other liabilities – net | 366 | 211 | 71 | 84 | 2 | |||||||||||||||||||||
| Net cash provided by (used for) operating activities | 4,822 | 4,667 | 542 | (387) | ||||||||||||||||||||||
| Cash flow from investing activities: | ||||||||||||||||||||||||||
| Capital expenditures – excluding equipment leased to others | (683) | (678) | (11) | 6 | 2 | |||||||||||||||||||||
| Expenditures for equipment leased to others | (774) | (7) | (772) | 5 | 2 | |||||||||||||||||||||
| Proceeds from disposals of leased assets and property, plant and equipment | 368 | 27 | 350 | (9) | 2 | |||||||||||||||||||||
| Additions to finance receivables | (6,973) | — | (7,957) | 984 | 3 | |||||||||||||||||||||
| Collections of finance receivables | 6,759 | — | 7,516 | (757) | 3 | |||||||||||||||||||||
| Net intercompany purchased receivables | — | — | (83) | 83 | 3 | |||||||||||||||||||||
| Proceeds from sale of finance receivables | 29 | — | 29 | — | ||||||||||||||||||||||
| Net intercompany borrowings | — | — | 4 | (4) | 4 | |||||||||||||||||||||
| Investments and acquisitions (net of cash acquired) | (20) | (20) | — | — | ||||||||||||||||||||||
| Proceeds from sale of businesses and investments (net of cash sold) | (14) | (14) | — | — | ||||||||||||||||||||||
| Proceeds from sale of securities | 463 | 332 | 131 | — | ||||||||||||||||||||||
| Investments in securities | (1,078) | (866) | (212) | — | ||||||||||||||||||||||
| Other – net | 41 | 41 | — | — | ||||||||||||||||||||||
| Net cash provided by (used for) investing activities | (1,882) | (1,185) | (1,005) | 308 | ||||||||||||||||||||||
| Cash flow from financing activities: | ||||||||||||||||||||||||||
| Dividends paid | (1,238) | (1,238) | (75) | 75 | 5 | |||||||||||||||||||||
| Common stock issued, including treasury shares reissued | (22) | (22) | — | — | ||||||||||||||||||||||
| Payments to purchase common stock | (1,829) | (1,829) | — | — | ||||||||||||||||||||||
| Net intercompany borrowings | — | (4) | — | 4 | 4 | |||||||||||||||||||||
| Proceeds from debt issued (original maturities greater than three months) | 3,299 | — | 3,299 | — | ||||||||||||||||||||||
| Payments on debt (original maturities greater than three months) | (2,303) | (95) | (2,208) | — | ||||||||||||||||||||||
| Short-term borrowings – net (original maturities three months or less) | (406) | (3) | (403) | — | ||||||||||||||||||||||
| Net cash provided by (used for) financing activities | (2,499) | (3,191) | 613 | 79 | ||||||||||||||||||||||
| Effect of exchange rate changes on cash | (60) | (12) | (48) | — | ||||||||||||||||||||||
| Increase (decrease) in cash, cash equivalents and restricted cash | 381 | 279 | 102 | — | ||||||||||||||||||||||
| Cash, cash equivalents and restricted cash at beginning of period | 7,013 | 6,049 | 964 | — | ||||||||||||||||||||||
| Cash, cash equivalents and restricted cash at end of period | $ | 7,394 | $ | 6,328 | $ | 1,066 | $ | — | ||||||||||||||||||
| 1 | Elimination of equity profit earned from Financial Products' subsidiaries partially owned by ME&T subsidiaries. | ||||
| 2 | Elimination of non-cash adjustments and changes in assets and liabilities related to consolidated reporting. | ||||
| 3 | Reclassification of Financial Products’ cash flow activity from investing to operating for receivables that arose from the sale of inventory. | ||||
| 4 | Elimination of net proceeds and payments to/from ME&T and Financial Products. | ||||
| 5 | Elimination of dividend activity between Financial Products and ME&T. | ||||
| Caterpillar Inc. Quarterly Retail Sales Statistics | ||||||||||||||
| Machines and E&T Combined | 2nd Quarter 2024 | 1st Quarter 2024 | 4th Quarter 2023 | 3rd Quarter 2023 | ||||||||||
| World | DOWN 3% | DOWN 5% | UP 8% | UP 13% | ||||||||||
| Machines | 2nd Quarter 2024 | 1st Quarter 2024 | 4th Quarter 2023 | 3rd Quarter 2023 | ||||||||||
| Asia/Pacific | DOWN 24% | DOWN 10% | DOWN 5% | DOWN 14% | ||||||||||
| EAME | DOWN 12% | DOWN 29% | DOWN 3% | DOWN 1% | ||||||||||
| Latin America | UP 6% | UP 4% | DOWN 1% | DOWN 5% | ||||||||||
| North America | DOWN 3% | DOWN 1% | UP 11% | UP 25% | ||||||||||
| World | DOWN 8% | DOWN 9% | UP 3% | UP 7% | ||||||||||
| Resource Industries (RI) | 2nd Quarter 2024 | 1st Quarter 2024 | 4th Quarter 2023 | 3rd Quarter 2023 | ||||||||||
| Asia/Pacific | DOWN 37% | DOWN 16% | DOWN 1% | DOWN 10% | ||||||||||
| EAME | DOWN 19% | DOWN 39% | UP 1% | DOWN 6% | ||||||||||
| Latin America | UP 11% | UP 38% | UP 1% | UP 3% | ||||||||||
| North America | DOWN 2% | DOWN 17% | UP 3% | UP 49% | ||||||||||
| World | DOWN 15% | DOWN 17% | UP 1% | UP 10% | ||||||||||
| Construction Industries (CI) | 2nd Quarter 2024 | 1st Quarter 2024 | 4th Quarter 2023 | 3rd Quarter 2023 | ||||||||||
| Asia/Pacific | DOWN 12% | DOWN 6% | DOWN 8% | DOWN 17% | ||||||||||
| EAME | DOWN 10% | DOWN 24% | DOWN 5% | UP 1% | ||||||||||
| Latin America | UP 4% | DOWN 10% | DOWN 1% | DOWN 9% | ||||||||||
| North America | DOWN 3% | UP 4% | UP 13% | UP 20% | ||||||||||
| World | DOWN 5% | DOWN 5% | UP 4% | UP 6% | ||||||||||
| Reported in dollars and based on unit sales as reported primarily by dealers. | ||||||||||||||
Energy & Transportation (E&T) Retail Sales by industry for the quarter ended as indicated compared with the same period of the prior year: | ||||||||||||||
| Energy & Transportation (E&T) | 2nd Quarter 2024 | 1st Quarter 2024 | 4th Quarter 2023 | 3rd Quarter 2023 | ||||||||||
| Power Gen | UP 28% | UP 9% | UP 26% | UP 44% | ||||||||||
| Industrial | DOWN 40% | DOWN 39% | DOWN 21% | UP 6% | ||||||||||
| Transportation | UP 68% | UP 45% | UP 54% | UP 3% | ||||||||||
| Oil & Gas | UP 9% | UP 35% | UP 25% | UP 45% | ||||||||||
| Total | UP 10% | UP 9% | UP 20% | UP 34% | ||||||||||
| Reported in dollars based on reporting from dealers and direct sales. | ||||||||||||||