| UNITED STATES SECURITIES AND EXCHANGE COMMISSION Washington, D.C. 20549 | |||||||||||||||||||||||||||||||||||
 | |||||||||||||||||||||||||||||||||||
| FORM | 8-K | ||||||||||||||||||||||||||||||||||
| Current Report | |||||||||||||||||||||||||||||||||||
|
Pursuant to Section 13 or 15(d) of the Securities Exchange Act of 1934
| |||||||||||||||||||||||||||||||||||
| Date of Report (Date of earliest event reported): | April 25, 2024 | ||||||||||||||||||||||||||||||||||
| CATERPILLAR INC. | |||||||||||||||||||||||||||||||||||
| (Exact name of registrant as specified in its charter) | |||||||||||||||||||||||||||||||||||
| Delaware | 1-768 | 37-0602744 | |||||||||||||||||||||||||||||||||
| (State or other jurisdiction of incorporation) | (Commission File Number) |
(I.R.S Employer Identification No.) |
|||||||||||||||||||||||||||||||||
| 5205 N. O'Connor Blvd., | Suite 100, | Irving, | Texas | 75039 | ||||||||||||||||||||||||||||
| (Address of principal executive offices) | (Zip Code) | |||||||||||||||||||||||||||||||
| Registrant’s telephone number, including area code: | (972) | 891-7700 | ||||||||||||||||||||||||||||||
| Former name or former address, if changed since last report: | N/A | |||||||||||||||||||||||||||||||
| ☐ | Written communications pursuant to Rule 425 under the Securities Act (17 CFR 230.425) | ||||||||||||||||||||||||||||||||||
| ☐ | Soliciting material pursuant to Rule 14a-12 under the Exchange Act (17 CFR 240.14a-12) | ||||||||||||||||||||||||||||||||||
| ☐ | Pre-commencement communications pursuant to Rule 14d-2(b) under the Exchange Act (17 CFR 240.14d-2(b)) | ||||||||||||||||||||||||||||||||||
| ☐ | Pre-commencement communications pursuant to Rule 13e-4(c) under the Exchange Act (17 CFR 240.13e-4(c)) | ||||||||||||||||||||||||||||||||||
|
Securities registered pursuant to Section 12(b) of the Act:
| |||||||||||||||||||||||||||||||||||
| Title of each class | Trading Symbol (s) | Name of each exchange which registered | |||||||||||||||||||||||||||||||||
| Common Stock ($1.00 par value) | CAT | The New York Stock Exchange | |||||||||||||||||||||||||||||||||
| 5.3% Debentures due September 15, 2035 | CAT35 | The New York Stock Exchange | |||||||||||||||||||||||||||||||||
| Check the appropriate box below if the Form 8-K filing is intended to simultaneously satisfy the filing obligation of the registrant under any of the following provisions: | |||||||||||||||||||||||||||||||||||
| Indicate by check mark whether the registrant is an emerging growth company as defined by Rule 405 of the Securities Act of | |||||||||||||||||||||||||||||||||||
| 1933 (17 CFR §230.405 of this chapter) or Rule 12b-2 of the Securities Exchange Act of 1934 (17 CFR §240.12b-2 of this chapter). | |||||||||||||||||||||||||||||||||||
| Emerging growth company | ☐ | ||||||||||||||||||||||||||||||||||
| If an emerging growth company, indicate by check mark if the registrant has elected not to use the extended transition period | |||||||||||||||||||||||||||||||||||
| for complying with any new or revised financial accounting standards provided pursuant to Section 13(a) of the Exchange Act. | ☐ | ||||||||||||||||||||||||||||||||||
| (d) | Exhibits: | ||||||||||
| The following is furnished as an exhibit to this report: | |||||||||||
| 99.1 | |||||||||||
| 99.2 | |||||||||||
| 104 | The cover page from this Current Report on Form 8-K, formatted in Inline XBRL. | ||||||||||
|
SIGNATURES
| ||||||||
| Pursuant to the requirements of the Securities Exchange Act of 1934, the registrant has duly caused this report to be signed on its behalf by the undersigned hereunto duly authorized. | ||||||||
| CATERPILLAR INC. | ||||||||
April 25, 2024 |
By: | /s/ Derek Owens | ||||||
| Derek Owens Chief Legal Officer and General Counsel |
||||||||
| First Quarter | |||||||||||
| ($ in billions except profit per share) | 2024 | 2023 | |||||||||
| Sales and Revenues | $15.8 | $15.9 | |||||||||
| Profit Per Share | $5.75 | $3.74 | |||||||||
| Adjusted Profit Per Share | $5.60 | $4.91 | |||||||||
Please see a reconciliation of GAAP to non-GAAP financial measures in the appendix on pages 12 and 13. | |||||||||||
| ● | First-quarter 2024 profit per share of $5.75; adjusted profit per share of $5.60 | ||||
| ● | Enterprise operating cash flow was $2.1 billion in the first quarter of 2024 | ||||
| ● | Deployed $5.1 billion of cash for share repurchases and dividends in the first quarter | ||||
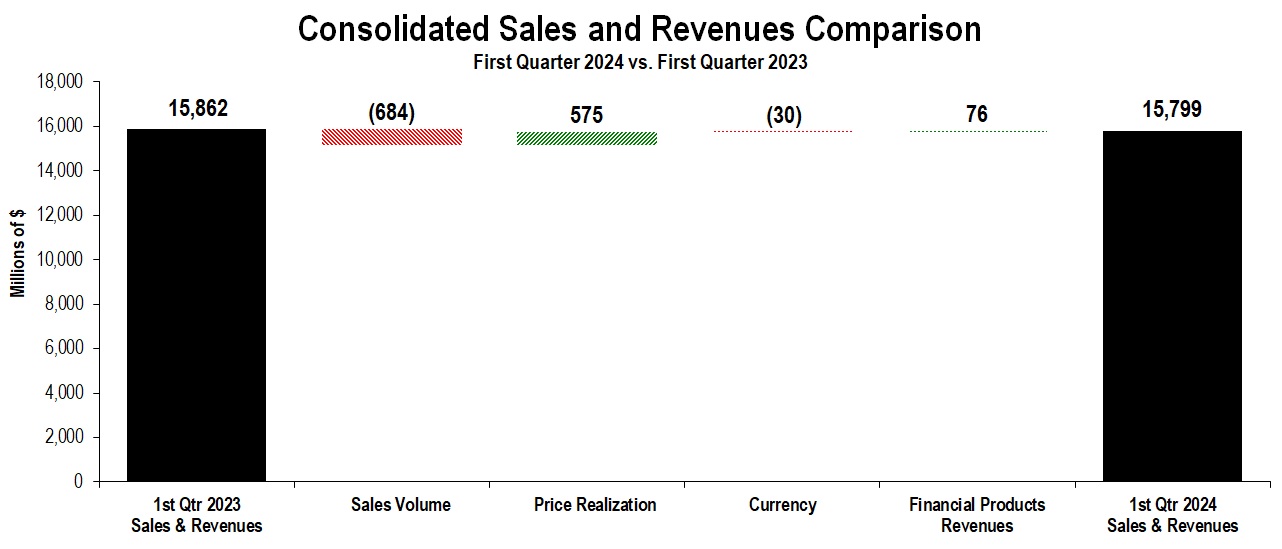
| Sales and Revenues by Segment | |||||||||||||||||||||||||||||||||||||||||||||||
| (Millions of dollars) | First Quarter 2023 | Sales Volume |
Price Realization |
Currency | Inter-Segment / Other | First Quarter 2024 | $ Change |
% Change |
|||||||||||||||||||||||||||||||||||||||
| Construction Industries | $ | 6,746 | $ | (464) | $ | 199 | $ | (22) | $ | (35) | $ | 6,424 | $ | (322) | (5%) | ||||||||||||||||||||||||||||||||
| Resource Industries | 3,427 | (425) | 173 | (11) | 29 | 3,193 | (234) | (7%) | |||||||||||||||||||||||||||||||||||||||
| Energy & Transportation | 6,254 | 231 | 202 | (1) | (5) | 6,681 | 427 | 7% | |||||||||||||||||||||||||||||||||||||||
| All Other Segment | 111 | (1) | — | — | (1) | 109 | (2) | (2%) | |||||||||||||||||||||||||||||||||||||||
| Corporate Items and Eliminations | (1,439) | (25) | 1 | 4 | 12 | (1,447) | (8) | ||||||||||||||||||||||||||||||||||||||||
| Machinery, Energy & Transportation | 15,099 | (684) | 575 | (30) | — | 14,960 | (139) | (1%) | |||||||||||||||||||||||||||||||||||||||
| Financial Products Segment | 902 | — | — | — | 89 | 991 | 89 | 10% | |||||||||||||||||||||||||||||||||||||||
| Corporate Items and Eliminations | (139) | — | — | — | (13) | (152) | (13) | ||||||||||||||||||||||||||||||||||||||||
| Financial Products Revenues | 763 | — | — | — | 76 | 839 | 76 | 10% | |||||||||||||||||||||||||||||||||||||||
| Consolidated Sales and Revenues | $ | 15,862 | $ | (684) | $ | 575 | $ | (30) | $ | 76 | $ | 15,799 | $ | (63) | —% | ||||||||||||||||||||||||||||||||
| Sales and Revenues by Geographic Region | |||||||||||||||||||||||||||||||||||||||||||||||||||||||||||||||||||||||||||||||||||
| North America | Latin America | EAME | Asia/Pacific | External Sales and Revenues | Inter-Segment | Total Sales and Revenues | |||||||||||||||||||||||||||||||||||||||||||||||||||||||||||||||||||||||||||||
| (Millions of dollars) | $ | % Chg | $ | % Chg | $ | % Chg | $ | % Chg | $ | % Chg | $ | % Chg | $ | % Chg | |||||||||||||||||||||||||||||||||||||||||||||||||||||||||||||||||||||
| First Quarter 2024 | |||||||||||||||||||||||||||||||||||||||||||||||||||||||||||||||||||||||||||||||||||
| Construction Industries | $ | 3,833 | 6% | $ | 595 | (1%) | $ | 996 | (25%) | $ | 993 | (14%) | $ | 6,417 | (4%) | $ | 7 | (83%) | $ | 6,424 | (5%) | ||||||||||||||||||||||||||||||||||||||||||||||||||||||||||||||
| Resource Industries | 1,264 | (3%) | 476 | —% | 465 | (22%) | 891 | (9%) | 3,096 | (8%) | 97 | 43% | 3,193 | (7%) | |||||||||||||||||||||||||||||||||||||||||||||||||||||||||||||||||||||
| Energy & Transportation | 2,951 | 15% | 408 | 7% | 1,294 | (7%) | 834 | 16% | 5,487 | 9% | 1,194 | —% | 6,681 | 7% | |||||||||||||||||||||||||||||||||||||||||||||||||||||||||||||||||||||
| All Other Segment | 18 | —% | (1) | —% | 4 | —% | 13 | —% | 34 | (3%) | 75 | (1%) | 109 | (2%) | |||||||||||||||||||||||||||||||||||||||||||||||||||||||||||||||||||||
| Corporate Items and Eliminations | (58) | (2) | (11) | (3) | (74) | (1,373) | (1,447) | ||||||||||||||||||||||||||||||||||||||||||||||||||||||||||||||||||||||||||||
| Machinery, Energy & Transportation | 8,008 | 7% | 1,476 | 2% | 2,748 | (17%) | 2,728 | (5%) | 14,960 | (1%) | — | —% | 14,960 | (1%) | |||||||||||||||||||||||||||||||||||||||||||||||||||||||||||||||||||||
| Financial Products Segment | 659 | 15% | 101 | (3%) | 123 | 8% | 108 | (1%) | 991 | 10% | — | —% | 991 | 10% | |||||||||||||||||||||||||||||||||||||||||||||||||||||||||||||||||||||
| Corporate Items and Eliminations | (94) | (18) | (19) | (21) | (152) | — | (152) | ||||||||||||||||||||||||||||||||||||||||||||||||||||||||||||||||||||||||||||
| Financial Products Revenues | 565 | 15% | 83 | (3%) | 104 | 8% | 87 | (2%) | 839 | 10% | — | —% | 839 | 10% | |||||||||||||||||||||||||||||||||||||||||||||||||||||||||||||||||||||
| Consolidated Sales and Revenues | $ | 8,573 | 8% | $ | 1,559 | 1% | $ | 2,852 | (17%) | $ | 2,815 | (5%) | $ | 15,799 | —% | $ | — | —% | $ | 15,799 | —% | ||||||||||||||||||||||||||||||||||||||||||||||||||||||||||||||
| First Quarter 2023 | |||||||||||||||||||||||||||||||||||||||||||||||||||||||||||||||||||||||||||||||||||
| Construction Industries | $ | 3,608 | $ | 599 | $ | 1,336 | $ | 1,161 | $ | 6,704 | $ | 42 | $ | 6,746 | |||||||||||||||||||||||||||||||||||||||||||||||||||||||||||||||||||||
| Resource Industries | 1,308 | 474 | 599 | 978 | 3,359 | 68 | 3,427 | ||||||||||||||||||||||||||||||||||||||||||||||||||||||||||||||||||||||||||||
| Energy & Transportation | 2,572 | 380 | 1,384 | 719 | 5,055 | 1,199 | 6,254 | ||||||||||||||||||||||||||||||||||||||||||||||||||||||||||||||||||||||||||||
| All Other Segment | 18 | — | 4 | 13 | 35 | 76 | 111 | ||||||||||||||||||||||||||||||||||||||||||||||||||||||||||||||||||||||||||||
| Corporate Items and Eliminations | (48) | — | (1) | (5) | (54) | (1,385) | (1,439) | ||||||||||||||||||||||||||||||||||||||||||||||||||||||||||||||||||||||||||||
| Machinery, Energy & Transportation | 7,458 | 1,453 | 3,322 | 2,866 | 15,099 | — | 15,099 | ||||||||||||||||||||||||||||||||||||||||||||||||||||||||||||||||||||||||||||
| Financial Products Segment | 575 | 104 | 114 | 109 | 902 | — | 902 | ||||||||||||||||||||||||||||||||||||||||||||||||||||||||||||||||||||||||||||
| Corporate Items and Eliminations | (83) | (18) | (18) | (20) | (139) | — | (139) | ||||||||||||||||||||||||||||||||||||||||||||||||||||||||||||||||||||||||||||
| Financial Products Revenues | 492 | 86 | 96 | 89 | 763 | — | 763 | ||||||||||||||||||||||||||||||||||||||||||||||||||||||||||||||||||||||||||||
| Consolidated Sales and Revenues | $ | 7,950 | $ | 1,539 | $ | 3,418 | $ | 2,955 | $ | 15,862 | $ | — | $ | 15,862 | |||||||||||||||||||||||||||||||||||||||||||||||||||||||||||||||||||||
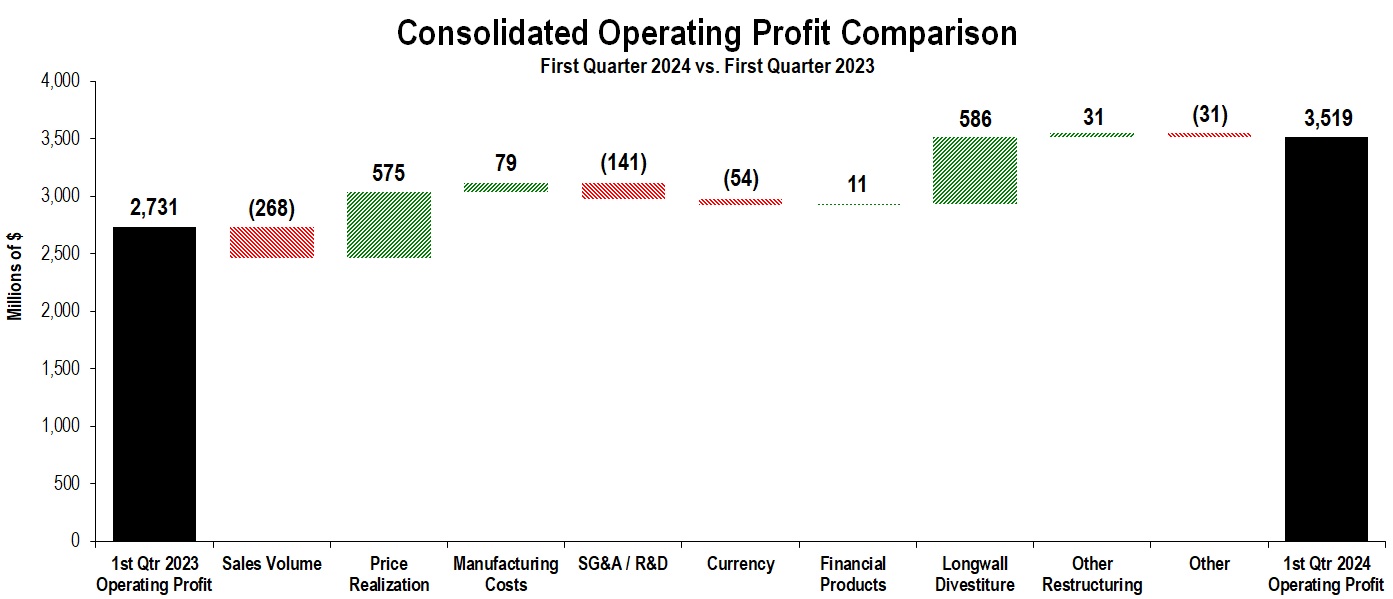
| Profit (Loss) by Segment | |||||||||||||||||||||||
| (Millions of dollars) | First Quarter 2024 | First Quarter 2023 | $ Change |
%
Change
|
|||||||||||||||||||
| Construction Industries | $ | 1,764 | $ | 1,790 | $ | (26) | (1 | %) | |||||||||||||||
| Resource Industries | 730 | 764 | (34) | (4 | %) | ||||||||||||||||||
| Energy & Transportation | 1,301 | 1,057 | 244 | 23 | % | ||||||||||||||||||
| All Other Segment | 24 | 11 | 13 | 118 | % | ||||||||||||||||||
| Corporate Items and Eliminations | (415) | (1,008) | 593 | ||||||||||||||||||||
| Machinery, Energy & Transportation | 3,404 | 2,614 | 790 | 30 | % | ||||||||||||||||||
| Financial Products Segment | 293 | 232 | 61 | 26 | % | ||||||||||||||||||
| Corporate Items and Eliminations | (25) | 25 | (50) | ||||||||||||||||||||
| Financial Products | 268 | 257 | 11 | 4 | % | ||||||||||||||||||
| Consolidating Adjustments | (153) | (140) | (13) | ||||||||||||||||||||
| Consolidated Operating Profit | $ | 3,519 | $ | 2,731 | $ | 788 | 29 | % | |||||||||||||||
| CONSTRUCTION INDUSTRIES | ||||||||||||||||||||||||||||||||||||||||||||||||||
| (Millions of dollars) | ||||||||||||||||||||||||||||||||||||||||||||||||||
| Segment Sales | ||||||||||||||||||||||||||||||||||||||||||||||||||
| First Quarter 2023 | Sales Volume | Price Realization | Currency | Inter-Segment | First Quarter 2024 | $ Change |
% Change |
|||||||||||||||||||||||||||||||||||||||||||
| Total Sales | $ | 6,746 | $ | (464) | $ | 199 | $ | (22) | $ | (35) | $ | 6,424 | $ | (322) | (5 | %) | ||||||||||||||||||||||||||||||||||
| Sales by Geographic Region | ||||||||||||||||||||||||||||||||||||||||||||||||||
| First Quarter 2024 | First Quarter 2023 | $ Change |
% Change |
|||||||||||||||||||||||||||||||||||||||||||||||
| North America | $ | 3,833 | $ | 3,608 | $ | 225 | 6 | % | ||||||||||||||||||||||||||||||||||||||||||
| Latin America | 595 | 599 | (4) | (1 | %) | |||||||||||||||||||||||||||||||||||||||||||||
| EAME | 996 | 1,336 | (340) | (25 | %) | |||||||||||||||||||||||||||||||||||||||||||||
| Asia/Pacific | 993 | 1,161 | (168) | (14 | %) | |||||||||||||||||||||||||||||||||||||||||||||
| External Sales | 6,417 | 6,704 | (287) | (4 | %) | |||||||||||||||||||||||||||||||||||||||||||||
| Inter-segment | 7 | 42 | (35) | (83 | %) | |||||||||||||||||||||||||||||||||||||||||||||
| Total Sales | $ | 6,424 | $ | 6,746 | $ | (322) | (5 | %) | ||||||||||||||||||||||||||||||||||||||||||
| Segment Profit | ||||||||||||||||||||||||||||||||||||||||||||||||||
| First Quarter 2024 | First Quarter 2023 |
Change |
% Change |
|||||||||||||||||||||||||||||||||||||||||||||||
| Segment Profit | $ | 1,764 | $ | 1,790 | $ | (26) | (1 | %) | ||||||||||||||||||||||||||||||||||||||||||
| Segment Profit Margin | 27.5 | % | 26.5 | % | 1.0 | pts | ||||||||||||||||||||||||||||||||||||||||||||
| RESOURCE INDUSTRIES | ||||||||||||||||||||||||||||||||||||||||||||||||||
| (Millions of dollars) | ||||||||||||||||||||||||||||||||||||||||||||||||||
| Segment Sales | ||||||||||||||||||||||||||||||||||||||||||||||||||
| First Quarter 2023 | Sales Volume | Price Realization | Currency | Inter-Segment | First Quarter 2024 | $ Change |
% Change |
|||||||||||||||||||||||||||||||||||||||||||
| Total Sales | $ | 3,427 | $ | (425) | $ | 173 | $ | (11) | $ | 29 | $ | 3,193 | $ | (234) | (7 | %) | ||||||||||||||||||||||||||||||||||
| Sales by Geographic Region | ||||||||||||||||||||||||||||||||||||||||||||||||||
| First Quarter 2024 | First Quarter 2023 | $ Change |
% Change |
|||||||||||||||||||||||||||||||||||||||||||||||
| North America | $ | 1,264 | $ | 1,308 | $ | (44) | (3 | %) | ||||||||||||||||||||||||||||||||||||||||||
| Latin America | 476 | 474 | 2 | — | % | |||||||||||||||||||||||||||||||||||||||||||||
| EAME | 465 | 599 | (134) | (22 | %) | |||||||||||||||||||||||||||||||||||||||||||||
| Asia/Pacific | 891 | 978 | (87) | (9 | %) | |||||||||||||||||||||||||||||||||||||||||||||
| External Sales | 3,096 | 3,359 | (263) | (8 | %) | |||||||||||||||||||||||||||||||||||||||||||||
| Inter-segment | 97 | 68 | 29 | 43 | % | |||||||||||||||||||||||||||||||||||||||||||||
| Total Sales | $ | 3,193 | $ | 3,427 | $ | (234) | (7 | %) | ||||||||||||||||||||||||||||||||||||||||||
| Segment Profit | ||||||||||||||||||||||||||||||||||||||||||||||||||
| First Quarter 2024 | First Quarter 2023 |
Change |
% Change |
|||||||||||||||||||||||||||||||||||||||||||||||
| Segment Profit | $ | 730 | $ | 764 | $ | (34) | (4 | %) | ||||||||||||||||||||||||||||||||||||||||||
| Segment Profit Margin | 22.9 | % | 22.3 | % | 0.6 | pts | ||||||||||||||||||||||||||||||||||||||||||||
| ENERGY & TRANSPORTATION | ||||||||||||||||||||||||||||||||||||||||||||||||||
| (Millions of dollars) | ||||||||||||||||||||||||||||||||||||||||||||||||||
| Segment Sales | ||||||||||||||||||||||||||||||||||||||||||||||||||
| First Quarter 2023 | Sales Volume | Price Realization | Currency | Inter-Segment | First Quarter 2024 | $ Change |
% Change |
|||||||||||||||||||||||||||||||||||||||||||
| Total Sales | $ | 6,254 | $ | 231 | $ | 202 | $ | (1) | $ | (5) | $ | 6,681 | $ | 427 | 7 | % | ||||||||||||||||||||||||||||||||||
| Sales by Application | ||||||||||||||||||||||||||||||||||||||||||||||||||
| First Quarter 2024 | First Quarter 2023 | $ Change |
% Change |
|||||||||||||||||||||||||||||||||||||||||||||||
| Oil and Gas | $ | 1,568 | $ | 1,314 | $ | 254 | 19 | % | ||||||||||||||||||||||||||||||||||||||||||
| Power Generation | 1,618 | 1,284 | 334 | 26 | % | |||||||||||||||||||||||||||||||||||||||||||||
| Industrial | 989 | 1,255 | (266) | (21 | %) | |||||||||||||||||||||||||||||||||||||||||||||
| Transportation | 1,312 | 1,202 | 110 | 9 | % | |||||||||||||||||||||||||||||||||||||||||||||
| External Sales | 5,487 | 5,055 | 432 | 9 | % | |||||||||||||||||||||||||||||||||||||||||||||
| Inter-segment | 1,194 | 1,199 | (5) | — | % | |||||||||||||||||||||||||||||||||||||||||||||
| Total Sales | $ | 6,681 | $ | 6,254 | $ | 427 | 7 | % | ||||||||||||||||||||||||||||||||||||||||||
| Segment Profit | ||||||||||||||||||||||||||||||||||||||||||||||||||
| First Quarter 2024 | First Quarter 2023 |
Change |
% Change |
|||||||||||||||||||||||||||||||||||||||||||||||
| Segment Profit | $ | 1,301 | $ | 1,057 | $ | 244 | 23 | % | ||||||||||||||||||||||||||||||||||||||||||
| Segment Profit Margin | 19.5 | % | 16.9 | % | 2.6 | pts | ||||||||||||||||||||||||||||||||||||||||||||
| FINANCIAL PRODUCTS SEGMENT | ||||||||||||||||||||||||||||||||||||||||||||||||||
| (Millions of dollars) | ||||||||||||||||||||||||||||||||||||||||||||||||||
| Revenues by Geographic Region | ||||||||||||||||||||||||||||||||||||||||||||||||||
| First Quarter 2024 | First Quarter 2023 | $ Change |
% Change |
|||||||||||||||||||||||||||||||||||||||||||||||
| North America | $ | 659 | $ | 575 | $ | 84 | 15 | % | ||||||||||||||||||||||||||||||||||||||||||
| Latin America | 101 | 104 | (3) | (3 | %) | |||||||||||||||||||||||||||||||||||||||||||||
| EAME | 123 | 114 | 9 | 8 | % | |||||||||||||||||||||||||||||||||||||||||||||
| Asia/Pacific | 108 | 109 | (1) | (1 | %) | |||||||||||||||||||||||||||||||||||||||||||||
| Total Revenues | $ | 991 | $ | 902 | $ | 89 | 10 | % | ||||||||||||||||||||||||||||||||||||||||||
| Segment Profit | ||||||||||||||||||||||||||||||||||||||||||||||||||
| First Quarter 2024 | First Quarter 2023 |
Change |
% Change |
|||||||||||||||||||||||||||||||||||||||||||||||
| Segment Profit | $ | 293 | $ | 232 | $ | 61 | 26 | % | ||||||||||||||||||||||||||||||||||||||||||
| (Dollars in millions except per share data) | Operating Profit | Operating Profit Margin | Profit Before Taxes | Provision (Benefit) for Income Taxes | Profit | Profit per Share | |||||||||||||||||||||||||||||||||||
Three Months Ended March 31, 2024 - U.S. GAAP |
$ | 3,519 | 22.3 | % | $ | 3,532 | $ | 688 | $ | 2,856 | $ | 5.75 | |||||||||||||||||||||||||||||
| Restructuring (income) - non-US mining entity divestiture | (64) | (0.5) | % | (64) | 54 | (118) | (0.24) | ||||||||||||||||||||||||||||||||||
| Other restructuring (income) costs | 58 | 0.4 | % | 58 | 14 | 44 | 0.09 | ||||||||||||||||||||||||||||||||||
Three Months Ended March 31, 2024 - Adjusted |
$ | 3,513 | 22.2 | % | $ | 3,526 | $ | 756 | $ | 2,782 | $ | 5.60 | |||||||||||||||||||||||||||||
Three Months Ended March 31, 2023 - U.S. GAAP |
$ | 2,731 | 17.2 | % | $ | 2,634 | $ | 708 | $ | 1,943 | $ | 3.74 | |||||||||||||||||||||||||||||
| Restructuring costs - Longwall divestiture | 586 | 3.7 | % | 586 | — | 586 | 1.13 | ||||||||||||||||||||||||||||||||||
| Other restructuring (income) costs | 25 | 0.2 | % | 25 | 5 | 20 | 0.04 | ||||||||||||||||||||||||||||||||||
Three Months Ended March 31, 2023 - Adjusted |
$ | 3,342 | 21.1 | % | $ | 3,245 | $ | 713 | $ | 2,549 | $ | 4.91 | |||||||||||||||||||||||||||||
| (Dollars in millions) | Profit Before Taxes | Provision (Benefit) for Income Taxes | Effective Tax Rate | |||||||||||||||||
Three Months Ended March 31, 2024 - U.S. GAAP |
$ | 3,532 | $ | 688 | 19.5 | % | ||||||||||||||
| Restructuring (income) - non-US mining entity divestiture | (64) | 54 | ||||||||||||||||||
| Excess stock-based compensation | — | 38 | ||||||||||||||||||
| Annual effective tax rate, excluding discrete items | $ | 3,468 | $ | 780 | 22.5 | % | ||||||||||||||
| Excess stock-based compensation | — | (38) | ||||||||||||||||||
| Other restructuring (income) costs | 58 | 14 | ||||||||||||||||||
Three Months Ended March 31, 2024 - Adjusted |
$ | 3,526 | $ | 756 | ||||||||||||||||
Three Months Ended March 31, 2023 - U.S. GAAP |
$ | 2,634 | $ | 708 | 26.9 | % | ||||||||||||||
| Restructuring costs - Longwall divestiture | 586 | — | ||||||||||||||||||
| Excess stock-based compensation | — | 32 | ||||||||||||||||||
| Annual effective tax rate, excluding discrete items | $ | 3,220 | $ | 740 | 23.0 | % | ||||||||||||||
| Excess stock-based compensation | — | (32) | ||||||||||||||||||
| Other restructuring (income) costs | 25 | 5 | ||||||||||||||||||
Three Months Ended March 31, 2023 - Adjusted |
$ | 3,245 | $ | 713 | ||||||||||||||||
| Three Months Ended March 31, | |||||||||||
| 2024 | 2023 | ||||||||||
| Sales and revenues: | |||||||||||
| Sales of Machinery, Energy & Transportation | $ | 14,960 | $ | 15,099 | |||||||
| Revenues of Financial Products | 839 | 763 | |||||||||
| Total sales and revenues | 15,799 | 15,862 | |||||||||
| Operating costs: | |||||||||||
| Cost of goods sold | 9,662 | 10,103 | |||||||||
| Selling, general and administrative expenses | 1,577 | 1,463 | |||||||||
| Research and development expenses | 520 | 472 | |||||||||
| Interest expense of Financial Products | 298 | 217 | |||||||||
| Other operating (income) expenses | 223 | 876 | |||||||||
| Total operating costs | 12,280 | 13,131 | |||||||||
| Operating profit | 3,519 | 2,731 | |||||||||
| Interest expense excluding Financial Products | 143 | 129 | |||||||||
| Other income (expense) | 156 | 32 | |||||||||
| Consolidated profit before taxes | 3,532 | 2,634 | |||||||||
| Provision (benefit) for income taxes | 688 | 708 | |||||||||
| Profit of consolidated companies | 2,844 | 1,926 | |||||||||
| Equity in profit (loss) of unconsolidated affiliated companies | 10 | 16 | |||||||||
| Profit of consolidated and affiliated companies | 2,854 | 1,942 | |||||||||
| Less: Profit (loss) attributable to noncontrolling interests | (2) | (1) | |||||||||
Profit 1 |
$ | 2,856 | $ | 1,943 | |||||||
| Profit per common share | $ | 5.78 | $ | 3.76 | |||||||
Profit per common share — diluted 2 |
$ | 5.75 | $ | 3.74 | |||||||
| Weighted-average common shares outstanding (millions) | |||||||||||
| – Basic | 493.9 | 516.2 | |||||||||
– Diluted 2 |
496.9 | 519.4 | |||||||||
| 1 | Profit attributable to common shareholders. | ||||
| 2 | Diluted by assumed exercise of stock-based compensation awards using the treasury stock method. | ||||
| March 31, 2024 |
December 31, 2023 |
||||||||||
| Assets | |||||||||||
| Current assets: | |||||||||||
| Cash and cash equivalents | $ | 4,959 | $ | 6,978 | |||||||
| Receivables – trade and other | 9,296 | 9,310 | |||||||||
| Receivables – finance | 9,446 | 9,510 | |||||||||
| Prepaid expenses and other current assets | 3,010 | 4,586 | |||||||||
| Inventories | 16,953 | 16,565 | |||||||||
| Total current assets | 43,664 | 46,949 | |||||||||
| Property, plant and equipment – net | 12,538 | 12,680 | |||||||||
| Long-term receivables – trade and other | 1,200 | 1,238 | |||||||||
| Long-term receivables – finance | 12,531 | 12,664 | |||||||||
| Noncurrent deferred and refundable income taxes | 2,860 | 2,816 | |||||||||
| Intangible assets | 516 | 564 | |||||||||
| Goodwill | 5,277 | 5,308 | |||||||||
| Other assets | 5,155 | 5,257 | |||||||||
| Total assets | $ | 83,741 | $ | 87,476 | |||||||
| Liabilities | |||||||||||
| Current liabilities: | |||||||||||
| Short-term borrowings: | |||||||||||
| -- Machinery, Energy & Transportation | $ | — | $ | — | |||||||
| -- Financial Products | 3,568 | 4,643 | |||||||||
| Accounts payable | 7,778 | 7,906 | |||||||||
| Accrued expenses | 4,821 | 4,958 | |||||||||
| Accrued wages, salaries and employee benefits | 1,291 | 2,757 | |||||||||
| Customer advances | 2,194 | 1,929 | |||||||||
| Dividends payable | — | 649 | |||||||||
| Other current liabilities | 3,265 | 3,123 | |||||||||
| Long-term debt due within one year: | |||||||||||
| -- Machinery, Energy & Transportation | 1,045 | 1,044 | |||||||||
| -- Financial Products | 8,409 | 7,719 | |||||||||
| Total current liabilities | 32,371 | 34,728 | |||||||||
| Long-term debt due after one year: | |||||||||||
| -- Machinery, Energy & Transportation | 8,539 | 8,579 | |||||||||
| -- Financial Products | 16,292 | 15,893 | |||||||||
| Liability for postemployment benefits | 4,068 | 4,098 | |||||||||
| Other liabilities | 4,826 | 4,675 | |||||||||
| Total liabilities | 66,096 | 67,973 | |||||||||
| Shareholders’ equity | |||||||||||
| Common stock | 5,663 | 6,403 | |||||||||
| Treasury stock | (40,039) | (36,339) | |||||||||
| Profit employed in the business | 54,108 | 51,250 | |||||||||
| Accumulated other comprehensive income (loss) | (2,093) | (1,820) | |||||||||
| Noncontrolling interests | 6 | 9 | |||||||||
| Total shareholders’ equity | 17,645 | 19,503 | |||||||||
| Total liabilities and shareholders’ equity | $ | 83,741 | $ | 87,476 | |||||||
| Three Months Ended March 31, | |||||||||||
| 2024 | 2023 | ||||||||||
| Cash flow from operating activities: | |||||||||||
| Profit of consolidated and affiliated companies | $ | 2,854 | $ | 1,942 | |||||||
| Adjustments to reconcile profit to net cash provided by operating activities: | |||||||||||
| Depreciation and amortization | 524 | 532 | |||||||||
| Provision (benefit) for deferred income taxes | (54) | (191) | |||||||||
| (Gain) loss on divestiture | (64) | 572 | |||||||||
| Other | (5) | 117 | |||||||||
| Changes in assets and liabilities, net of acquisitions and divestitures: | |||||||||||
| Receivables – trade and other | (81) | (329) | |||||||||
| Inventories | (439) | (1,403) | |||||||||
| Accounts payable | 203 | 477 | |||||||||
| Accrued expenses | (38) | 38 | |||||||||
| Accrued wages, salaries and employee benefits | (1,454) | (950) | |||||||||
| Customer advances | 279 | 365 | |||||||||
| Other assets – net | 60 | 107 | |||||||||
| Other liabilities – net | 267 | 296 | |||||||||
| Net cash provided by (used for) operating activities | 2,052 | 1,573 | |||||||||
| Cash flow from investing activities: | |||||||||||
| Capital expenditures – excluding equipment leased to others | (500) | (422) | |||||||||
| Expenditures for equipment leased to others | (236) | (328) | |||||||||
| Proceeds from disposals of leased assets and property, plant and equipment | 155 | 184 | |||||||||
| Additions to finance receivables | (3,256) | (3,020) | |||||||||
| Collections of finance receivables | 3,140 | 3,169 | |||||||||
| Proceeds from sale of finance receivables | 13 | 24 | |||||||||
| Investments and acquisitions (net of cash acquired) | — | (5) | |||||||||
| Proceeds from sale of businesses and investments (net of cash sold) | 42 | (14) | |||||||||
| Proceeds from maturities and sale of securities | 1,867 | 239 | |||||||||
| Investments in securities | (275) | (536) | |||||||||
| Other – net | 8 | 26 | |||||||||
| Net cash provided by (used for) investing activities | 958 | (683) | |||||||||
| Cash flow from financing activities: | |||||||||||
| Dividends paid | (648) | (620) | |||||||||
| Common stock issued, including treasury shares reissued | (8) | (25) | |||||||||
| Common shares repurchased | (4,455) | (400) | |||||||||
| Proceeds from debt issued (original maturities greater than three months) | 2,731 | 1,517 | |||||||||
| Payments on debt (original maturities greater than three months) | (1,570) | (1,475) | |||||||||
| Short-term borrowings – net (original maturities three months or less) | (1,050) | (103) | |||||||||
| Net cash provided by (used for) financing activities | (5,000) | (1,106) | |||||||||
| Effect of exchange rate changes on cash | (30) | (1) | |||||||||
| Increase (decrease) in cash, cash equivalents and restricted cash | (2,020) | (217) | |||||||||
| Cash, cash equivalents and restricted cash at beginning of period | 6,985 | 7,013 | |||||||||
| Cash, cash equivalents and restricted cash at end of period | $ | 4,965 | $ | 6,796 | |||||||
Cash equivalents primarily represent short-term, highly liquid investments with original maturities of generally three months or less. | ||
| Supplemental Consolidating Data | ||||||||||||||||||||||||||
| Consolidated | Machinery, Energy & Transportation | Financial Products |
Consolidating Adjustments |
|||||||||||||||||||||||
| Sales and revenues: | ||||||||||||||||||||||||||
| Sales of Machinery, Energy & Transportation | $ | 14,960 | $ | 14,960 | $ | — | $ | — | ||||||||||||||||||
| Revenues of Financial Products | 839 | — | 1,029 | (190) | 1 | |||||||||||||||||||||
| Total sales and revenues | 15,799 | 14,960 | 1,029 | (190) | ||||||||||||||||||||||
| Operating costs: | ||||||||||||||||||||||||||
| Cost of goods sold | 9,662 | 9,664 | — | (2) | 2 | |||||||||||||||||||||
| Selling, general and administrative expenses | 1,577 | 1,413 | 178 | (14) | 2 | |||||||||||||||||||||
| Research and development expenses | 520 | 520 | — | — | ||||||||||||||||||||||
| Interest expense of Financial Products | 298 | — | 298 | — | ||||||||||||||||||||||
| Other operating (income) expenses | 223 | (41) | 285 | (21) | 2 | |||||||||||||||||||||
| Total operating costs | 12,280 | 11,556 | 761 | (37) | ||||||||||||||||||||||
| Operating profit | 3,519 | 3,404 | 268 | (153) | ||||||||||||||||||||||
| Interest expense excluding Financial Products | 143 | 143 | — | — | ||||||||||||||||||||||
| Other income (expense) | 156 | (20) | 23 | 153 | 3 | |||||||||||||||||||||
| Consolidated profit before taxes | 3,532 | 3,241 | 291 | — | ||||||||||||||||||||||
| Provision (benefit) for income taxes | 688 | 615 | 73 | — | ||||||||||||||||||||||
| Profit of consolidated companies | 2,844 | 2,626 | 218 | — | ||||||||||||||||||||||
| Equity in profit (loss) of unconsolidated affiliated companies | 10 | 10 | — | — | ||||||||||||||||||||||
| Profit of consolidated and affiliated companies | 2,854 | 2,636 | 218 | — | ||||||||||||||||||||||
| Less: Profit (loss) attributable to noncontrolling interests | (2) | (3) | 1 | — | ||||||||||||||||||||||
Profit 4 |
$ | 2,856 | $ | 2,639 | $ | 217 | $ | — | ||||||||||||||||||
| 1 | Elimination of Financial Products’ revenues earned from ME&T. |
||||
| 2 | Elimination of net expenses recorded between ME&T and Financial Products. |
||||
| 3 | Elimination of discount recorded by ME&T on receivables sold to Financial Products and of interest earned between ME&T and Financial Products as well as dividends paid by Financial Products to ME&T. |
||||
| 4 | Profit attributable to common shareholders. | ||||
| Supplemental Consolidating Data | ||||||||||||||||||||||||||
| Consolidated | Machinery, Energy & Transportation | Financial Products |
Consolidating Adjustments |
|||||||||||||||||||||||
| Sales and revenues: | ||||||||||||||||||||||||||
| Sales of Machinery, Energy & Transportation | $ | 15,099 | $ | 15,099 | $ | — | $ | — | ||||||||||||||||||
| Revenues of Financial Products | 763 | — | 935 | (172) | 1 | |||||||||||||||||||||
| Total sales and revenues | 15,862 | 15,099 | 935 | (172) | ||||||||||||||||||||||
| Operating costs: | ||||||||||||||||||||||||||
| Cost of goods sold | 10,103 | 10,104 | — | (1) | 2 | |||||||||||||||||||||
| Selling, general and administrative expenses | 1,463 | 1,320 | 158 | (15) | 2 | |||||||||||||||||||||
| Research and development expenses | 472 | 472 | — | — | ||||||||||||||||||||||
| Interest expense of Financial Products | 217 | — | 217 | — | ||||||||||||||||||||||
| Other operating (income) expenses | 876 | 589 | 303 | (16) | 2 | |||||||||||||||||||||
| Total operating costs | 13,131 | 12,485 | 678 | (32) | ||||||||||||||||||||||
| Operating profit | 2,731 | 2,614 | 257 | (140) | ||||||||||||||||||||||
| Interest expense excluding Financial Products | 129 | 129 | — | — | ||||||||||||||||||||||
| Other income (expense) | 32 | (14) | (19) | 65 | 3 | |||||||||||||||||||||
| Consolidated profit before taxes | 2,634 | 2,471 | 238 | (75) | ||||||||||||||||||||||
| Provision (benefit) for income taxes | 708 | 648 | 60 | — | ||||||||||||||||||||||
| Profit of consolidated companies | 1,926 | 1,823 | 178 | (75) | ||||||||||||||||||||||
| Equity in profit (loss) of unconsolidated affiliated companies | 16 | 19 | — | (3) | 4 | |||||||||||||||||||||
| Profit of consolidated and affiliated companies | 1,942 | 1,842 | 178 | (78) | ||||||||||||||||||||||
| Less: Profit (loss) attributable to noncontrolling interests | (1) | — | 2 | (3) | 5 | |||||||||||||||||||||
Profit 6 |
$ | 1,943 | $ | 1,842 | $ | 176 | $ | (75) | ||||||||||||||||||
| 1 | Elimination of Financial Products’ revenues earned from ME&T. |
||||
| 2 | Elimination of net expenses recorded by ME&T paid to Financial Products. |
||||
| 3 | Elimination of discount recorded by ME&T on receivables sold to Financial Products and of interest earned between ME&T and Financial Products as well as dividends paid by Financial Products to ME&T. |
||||
| 4 | Elimination of equity profit (loss) earned from Financial Products’ subsidiaries partially owned by ME&T subsidiaries. |
||||
| 5 | Elimination of noncontrolling interest profit (loss) recorded by Financial Products for subsidiaries partially owned by ME&T subsidiaries. |
||||
| 6 | Profit attributable to common shareholders. | ||||
| Supplemental Consolidating Data | ||||||||||||||||||||||||||
| Consolidated | Machinery, Energy & Transportation |
Financial Products |
Consolidating Adjustments |
|||||||||||||||||||||||
| Assets | ||||||||||||||||||||||||||
| Current assets: | ||||||||||||||||||||||||||
| Cash and cash equivalents | $ | 4,959 | $ | 3,963 | $ | 996 | $ | — | ||||||||||||||||||
| Receivables – trade and other | 9,296 | 3,814 | 658 | 4,824 | 1,2 |
|||||||||||||||||||||
| Receivables – finance | 9,446 | — | 14,509 | (5,063) | 2 | |||||||||||||||||||||
| Prepaid expenses and other current assets | 3,010 | 2,665 | 379 | (34) | 3 | |||||||||||||||||||||
| Inventories | 16,953 | 16,953 | — | — | ||||||||||||||||||||||
| Total current assets | 43,664 | 27,395 | 16,542 | (273) | ||||||||||||||||||||||
| Property, plant and equipment – net | 12,538 | 8,647 | 3,891 | — | ||||||||||||||||||||||
| Long-term receivables – trade and other | 1,200 | 538 | 57 | 605 | 1,2 |
|||||||||||||||||||||
| Long-term receivables – finance | 12,531 | — | 13,191 | (660) | 2 | |||||||||||||||||||||
| Noncurrent deferred and refundable income taxes | 2,860 | 3,382 | 138 | (660) | 4 | |||||||||||||||||||||
| Intangible assets | 516 | 516 | — | — | ||||||||||||||||||||||
| Goodwill | 5,277 | 5,277 | — | — | ||||||||||||||||||||||
| Other assets | 5,155 | 4,081 | 2,117 | (1,043) | 5 | |||||||||||||||||||||
| Total assets | $ | 83,741 | $ | 49,836 | $ | 35,936 | $ | (2,031) | ||||||||||||||||||
| Liabilities | ||||||||||||||||||||||||||
| Current liabilities: | ||||||||||||||||||||||||||
| Short-term borrowings | $ | 3,568 | $ | — | $ | 3,568 | $ | — | ||||||||||||||||||
| Accounts payable | 7,778 | 7,699 | 337 | (258) | 6,7 | |||||||||||||||||||||
| Accrued expenses | 4,821 | 4,287 | 534 | — | ||||||||||||||||||||||
| Accrued wages, salaries and employee benefits | 1,291 | 1,262 | 29 | — | ||||||||||||||||||||||
| Customer advances | 2,194 | 2,173 | 2 | 19 | 7 | |||||||||||||||||||||
| Other current liabilities | 3,265 | 2,601 | 725 | (61) | 4,8 |
|||||||||||||||||||||
| Long-term debt due within one year | 9,454 | 1,045 | 8,409 | — | ||||||||||||||||||||||
| Total current liabilities | 32,371 | 19,067 | 13,604 | (300) | ||||||||||||||||||||||
| Long-term debt due after one year | 24,831 | 8,594 | 16,292 | (55) | 9 | |||||||||||||||||||||
| Liability for postemployment benefits | 4,068 | 4,068 | — | — | ||||||||||||||||||||||
| Other liabilities | 4,826 | 3,979 | 1,553 | (706) | 4 | |||||||||||||||||||||
| Total liabilities | 66,096 | 35,708 | 31,449 | (1,061) | ||||||||||||||||||||||
| Shareholders’ equity | ||||||||||||||||||||||||||
| Common stock | 5,663 | 5,663 | 905 | (905) | 10 | |||||||||||||||||||||
| Treasury stock | (40,039) | (40,039) | — | — | ||||||||||||||||||||||
| Profit employed in the business | 54,108 | 49,422 | 4,674 | 12 | 10 | |||||||||||||||||||||
| Accumulated other comprehensive income (loss) | (2,093) | (926) | (1,167) | — | ||||||||||||||||||||||
| Noncontrolling interests | 6 | 8 | 75 | (77) | 10 | |||||||||||||||||||||
| Total shareholders’ equity | 17,645 | 14,128 | 4,487 | (970) | ||||||||||||||||||||||
| Total liabilities and shareholders’ equity | $ | 83,741 | $ | 49,836 | $ | 35,936 | $ | (2,031) | ||||||||||||||||||
| 1 | Elimination of receivables between ME&T and Financial Products. |
||||
| 2 | Reclassification of ME&T’s trade receivables purchased by Financial Products and Financial Products’ wholesale inventory receivables. |
||||
| 3 | Elimination of ME&T's insurance premiums that are prepaid to Financial Products. | ||||
| 4 | Reclassification reflecting required netting of deferred tax assets/liabilities by taxing jurisdiction. |
||||
| 5 | Elimination of other intercompany assets between ME&T and Financial Products. |
||||
| 6 | Elimination of payables between ME&T and Financial Products. |
||||
| 7 | Reclassification of Financial Products' payables to accrued expenses or customer advances. | ||||
| 8 | Elimination of prepaid insurance in Financial Products’ other liabilities. | ||||
| 9 | Elimination of debt between ME&T and Financial Products. |
||||
| 10 | Eliminations associated with ME&T’s investments in Financial Products’ subsidiaries. |
||||
| Supplemental Consolidating Data | ||||||||||||||||||||||||||
| Consolidated | Machinery, Energy & Transportation |
Financial Products |
Consolidating Adjustments |
|||||||||||||||||||||||
| Assets | ||||||||||||||||||||||||||
| Current assets: | ||||||||||||||||||||||||||
| Cash and cash equivalents | $ | 6,978 | $ | 6,106 | $ | 872 | $ | — | ||||||||||||||||||
| Receivables – trade and other | 9,310 | 3,971 | 570 | 4,769 | 1,2 |
|||||||||||||||||||||
| Receivables – finance | 9,510 | — | 14,499 | (4,989) | 2 | |||||||||||||||||||||
| Prepaid expenses and other current assets | 4,586 | 4,327 | 341 | (82) | 3 | |||||||||||||||||||||
| Inventories | 16,565 | 16,565 | — | — | ||||||||||||||||||||||
| Total current assets | 46,949 | 30,969 | 16,282 | (302) | ||||||||||||||||||||||
| Property, plant and equipment – net | 12,680 | 8,694 | 3,986 | — | ||||||||||||||||||||||
| Long-term receivables – trade and other | 1,238 | 565 | 85 | 588 | 1,2 |
|||||||||||||||||||||
| Long-term receivables – finance | 12,664 | — | 13,299 | (635) | 2 | |||||||||||||||||||||
| Noncurrent deferred and refundable income taxes | 2,816 | 3,360 | 148 | (692) | 4 | |||||||||||||||||||||
| Intangible assets | 564 | 564 | — | — | ||||||||||||||||||||||
| Goodwill | 5,308 | 5,308 | — | — | ||||||||||||||||||||||
| Other assets | 5,257 | 4,218 | 2,082 | (1,043) | 5 | |||||||||||||||||||||
| Total assets | $ | 87,476 | $ | 53,678 | $ | 35,882 | $ | (2,084) | ||||||||||||||||||
| Liabilities | ||||||||||||||||||||||||||
| Current liabilities: | ||||||||||||||||||||||||||
| Short-term borrowings | $ | 4,643 | $ | — | $ | 4,643 | $ | — | ||||||||||||||||||
| Accounts payable | 7,906 | 7,827 | 314 | (235) | 6,7 | |||||||||||||||||||||
| Accrued expenses | 4,958 | 4,361 | 597 | — | ||||||||||||||||||||||
| Accrued wages, salaries and employee benefits | 2,757 | 2,696 | 61 | — | ||||||||||||||||||||||
| Customer advances | 1,929 | 1,912 | 2 | 15 | 7 | |||||||||||||||||||||
| Dividends payable | 649 | 649 | — | — | ||||||||||||||||||||||
| Other current liabilities | 3,123 | 2,583 | 647 | (107) | 4,8 |
|||||||||||||||||||||
| Long-term debt due within one year | 8,763 | 1,044 | 7,719 | — | ||||||||||||||||||||||
| Total current liabilities | 34,728 | 21,072 | 13,983 | (327) | ||||||||||||||||||||||
| Long-term debt due after one year | 24,472 | 8,626 | 15,893 | (47) | 9 | |||||||||||||||||||||
| Liability for postemployment benefits | 4,098 | 4,098 | — | — | ||||||||||||||||||||||
| Other liabilities | 4,675 | 3,806 | 1,607 | (738) | 4 | |||||||||||||||||||||
| Total liabilities | 67,973 | 37,602 | 31,483 | (1,112) | ||||||||||||||||||||||
| Shareholders’ equity | ||||||||||||||||||||||||||
| Common stock | 6,403 | 6,403 | 905 | (905) | 10 | |||||||||||||||||||||
| Treasury stock | (36,339) | (36,339) | — | — | ||||||||||||||||||||||
| Profit employed in the business | 51,250 | 46,783 | 4,457 | 10 | 10 | |||||||||||||||||||||
| Accumulated other comprehensive income (loss) | (1,820) | (783) | (1,037) | — | ||||||||||||||||||||||
| Noncontrolling interests | 9 | 12 | 74 | (77) | 10 | |||||||||||||||||||||
| Total shareholders’ equity | 19,503 | 16,076 | 4,399 | (972) | ||||||||||||||||||||||
| Total liabilities and shareholders’ equity | $ | 87,476 | $ | 53,678 | $ | 35,882 | $ | (2,084) | ||||||||||||||||||
| 1 | Elimination of receivables between ME&T and Financial Products. |
||||
| 2 | Reclassification of ME&T’s trade receivables purchased by Financial Products and Financial Products’ wholesale inventory receivables. |
||||
| 3 | Elimination of ME&T’s insurance premiums that are prepaid to Financial Products. | ||||
| 4 | Reclassification reflecting required netting of deferred tax assets/liabilities by taxing jurisdiction. |
||||
| 5 | Elimination of other intercompany assets between ME&T and Financial Products. |
||||
| 6 | Elimination of payables between ME&T and Financial Products. | ||||
| 7 | Reclassification of Financial Products' payables to accrued expenses or customer advances. | ||||
| 8 | Elimination of prepaid insurance in Financial Products’ other liabilities. |
||||
| 9 | Elimination of debt between ME&T and Financial Products. | ||||
| 10 | Eliminations associated with ME&T’s investments in Financial Products’ subsidiaries. |
||||
| Supplemental Consolidating Data | ||||||||||||||||||||||||||
| Consolidated | Machinery, Energy & Transportation | Financial Products |
Consolidating Adjustments |
|||||||||||||||||||||||
| Cash flow from operating activities: | ||||||||||||||||||||||||||
| Profit of consolidated and affiliated companies | $ | 2,854 | $ | 2,636 | $ | 218 | $ | — | ||||||||||||||||||
| Adjustments to reconcile profit to net cash provided by operating activities: | ||||||||||||||||||||||||||
| Depreciation and amortization | 524 | 328 | 196 | — | ||||||||||||||||||||||
| Provision (benefit) for deferred income taxes | (54) | (23) | (31) | — | ||||||||||||||||||||||
| (Gain) loss on divestiture | (64) | (64) | — | — | ||||||||||||||||||||||
| Other | (5) | (16) | (120) | 131 | 1 | |||||||||||||||||||||
| Changes in assets and liabilities, net of acquisitions and divestitures: | ||||||||||||||||||||||||||
| Receivables – trade and other | (81) | 111 | (40) | (152) | 1,2 |
|||||||||||||||||||||
| Inventories | (439) | (434) | — | (5) | 1 | |||||||||||||||||||||
| Accounts payable | 203 | 179 | 30 | (6) | 1 | |||||||||||||||||||||
| Accrued expenses | (38) | (47) | 9 | — | ||||||||||||||||||||||
| Accrued wages, salaries and employee benefits | (1,454) | (1,422) | (32) | — | ||||||||||||||||||||||
| Customer advances | 279 | 279 | — | — | ||||||||||||||||||||||
| Other assets – net | 60 | 102 | 3 | (45) | 1 | |||||||||||||||||||||
| Other liabilities – net | 267 | 142 | 75 | 50 | 1 | |||||||||||||||||||||
| Net cash provided by (used for) operating activities | 2,052 | 1,771 | 308 | (27) | ||||||||||||||||||||||
| Cash flow from investing activities: | ||||||||||||||||||||||||||
| Capital expenditures – excluding equipment leased to others | (500) | (493) | (8) | 1 | 1 | |||||||||||||||||||||
| Expenditures for equipment leased to others | (236) | (9) | (233) | 6 | 1 | |||||||||||||||||||||
| Proceeds from disposals of leased assets and property, plant and equipment | 155 | 5 | 152 | (2) | 1 | |||||||||||||||||||||
| Additions to finance receivables | (3,256) | — | (3,573) | 317 | 2 | |||||||||||||||||||||
| Collections of finance receivables | 3,140 | — | 3,572 | (432) | 2 | |||||||||||||||||||||
| Net intercompany purchased receivables | — | — | (137) | 137 | 2 | |||||||||||||||||||||
| Proceeds from sale of finance receivables | 13 | — | 13 | — | ||||||||||||||||||||||
| Net intercompany borrowings | — | — | 3 | (3) | 3 | |||||||||||||||||||||
| Investments and acquisitions (net of cash acquired) | — | — | — | — | ||||||||||||||||||||||
| Proceeds from sale of businesses and investments (net of cash sold) | 42 | 42 | — | — | ||||||||||||||||||||||
| Proceeds from maturities and sale of securities | 1,867 | 1,797 | 70 | — | ||||||||||||||||||||||
| Investments in securities | (275) | (148) | (127) | — | ||||||||||||||||||||||
| Other – net | 8 | 31 | (23) | — | ||||||||||||||||||||||
| Net cash provided by (used for) investing activities | 958 | 1,225 | (291) | 24 | ||||||||||||||||||||||
| Cash flow from financing activities: | ||||||||||||||||||||||||||
| Dividends paid | (648) | (648) | — | — | ||||||||||||||||||||||
| Common stock issued, including treasury shares reissued | (8) | (8) | — | — | ||||||||||||||||||||||
| Common shares repurchased | (4,455) | (4,455) | — | — | ||||||||||||||||||||||
| Net intercompany borrowings | — | (3) | — | 3 | 3 | |||||||||||||||||||||
| Proceeds from debt issued > 90 days | 2,731 | — | 2,731 | — | ||||||||||||||||||||||
| Payments on debt > 90 days | (1,570) | (6) | (1,564) | — | ||||||||||||||||||||||
| Short-term borrowings – net < 90 days | (1,050) | — | (1,050) | — | ||||||||||||||||||||||
| Net cash provided by (used for) financing activities | (5,000) | (5,120) | 117 | 3 | ||||||||||||||||||||||
| Effect of exchange rate changes on cash | (30) | (20) | (10) | — | ||||||||||||||||||||||
| Increase (decrease) in cash, cash equivalents and restricted cash | (2,020) | (2,144) | 124 | — | ||||||||||||||||||||||
| Cash, cash equivalents and restricted cash at beginning of period | 6,985 | 6,111 | 874 | — | ||||||||||||||||||||||
| Cash, cash equivalents and restricted cash at end of period | $ | 4,965 | $ | 3,967 | $ | 998 | $ | — | ||||||||||||||||||
| 1 | Elimination of non-cash adjustments and changes in assets and liabilities related to consolidated reporting. | ||||
| 2 | Reclassification of Financial Products’ cash flow activity from investing to operating for receivables that arose from the sale of inventory. | ||||
| 3 | Elimination of net proceeds and payments to/from ME&T and Financial Products. | ||||
| Supplemental Consolidating Data | ||||||||||||||||||||||||||
| Consolidated | Machinery, Energy & Transportation | Financial Products |
Consolidating Adjustments |
|||||||||||||||||||||||
| Cash flow from operating activities: | ||||||||||||||||||||||||||
| Profit of consolidated and affiliated companies | $ | 1,942 | $ | 1,842 | $ | 178 | $ | (78) | 1,5 | |||||||||||||||||
| Adjustments to reconcile profit to net cash provided by operating activities: | ||||||||||||||||||||||||||
| Depreciation and amortization | 532 | 342 | 190 | — | ||||||||||||||||||||||
| Provision (benefit) for deferred income taxes | (191) | (169) | (22) | — | ||||||||||||||||||||||
| (Gain) loss on divestiture | 572 | 572 | — | — | ||||||||||||||||||||||
| Other | 117 | 124 | (143) | 136 | 2 | |||||||||||||||||||||
| Changes in assets and liabilities, net of acquisitions and divestitures: | ||||||||||||||||||||||||||
| Receivables – trade and other | (329) | 205 | 14 | (548) | 2,3 |
|||||||||||||||||||||
| Inventories | (1,403) | (1,402) | — | (1) | 2 | |||||||||||||||||||||
| Accounts payable | 477 | 465 | 34 | (22) | 2 | |||||||||||||||||||||
| Accrued expenses | 38 | 6 | 32 | — | ||||||||||||||||||||||
| Accrued wages, salaries and employee benefits | (950) | (928) | (22) | — | ||||||||||||||||||||||
| Customer advances | 365 | 365 | — | — | ||||||||||||||||||||||
| Other assets – net | 107 | 223 | 4 | (120) | 2 | |||||||||||||||||||||
| Other liabilities – net | 296 | 134 | 37 | 125 | 2 | |||||||||||||||||||||
| Net cash provided by (used for) operating activities | 1,573 | 1,779 | 302 | (508) | ||||||||||||||||||||||
| Cash flow from investing activities: | ||||||||||||||||||||||||||
| Capital expenditures – excluding equipment leased to others | (422) | (414) | (9) | 1 | 2 | |||||||||||||||||||||
| Expenditures for equipment leased to others | (328) | — | (330) | 2 | 2 | |||||||||||||||||||||
| Proceeds from disposals of leased assets and property, plant and equipment | 184 | 7 | 179 | (2) | 2 | |||||||||||||||||||||
| Additions to finance receivables | (3,020) | — | (3,462) | 442 | 3 | |||||||||||||||||||||
| Collections of finance receivables | 3,169 | — | 3,437 | (268) | 3 | |||||||||||||||||||||
| Net intercompany purchased receivables | — | — | (258) | 258 | 3 | |||||||||||||||||||||
| Proceeds from sale of finance receivables | 24 | — | 24 | — | ||||||||||||||||||||||
| Net intercompany borrowings | — | — | 2 | (2) | 4 | |||||||||||||||||||||
| Investments and acquisitions (net of cash acquired) | (5) | (5) | — | — | ||||||||||||||||||||||
| Proceeds from sale of businesses and investments (net of cash sold) | (14) | (14) | — | — | ||||||||||||||||||||||
| Proceeds from sale of securities | 239 | 162 | 77 | — | ||||||||||||||||||||||
| Investments in securities | (536) | (433) | (103) | — | ||||||||||||||||||||||
| Other – net | 26 | 27 | (1) | — | ||||||||||||||||||||||
| Net cash provided by (used for) investing activities | (683) | (670) | (444) | 431 | ||||||||||||||||||||||
| Cash flow from financing activities: | ||||||||||||||||||||||||||
| Dividends paid | (620) | (620) | (75) | 75 | 5 | |||||||||||||||||||||
| Common stock issued, including treasury shares reissued | (25) | (25) | — | — | ||||||||||||||||||||||
| Common shares repurchased | (400) | (400) | — | — | ||||||||||||||||||||||
| Net intercompany borrowings | — | (2) | — | 2 | 4 | |||||||||||||||||||||
| Proceeds from debt issued > 90 days | 1,517 | — | 1,517 | — | ||||||||||||||||||||||
| Payments on debt > 90 days | (1,475) | (90) | (1,385) | — | ||||||||||||||||||||||
| Short-term borrowings – net < 90 days | (103) | (3) | (100) | — | ||||||||||||||||||||||
| Net cash provided by (used for) financing activities | (1,106) | (1,140) | (43) | 77 | ||||||||||||||||||||||
| Effect of exchange rate changes on cash | (1) | 4 | (5) | — | ||||||||||||||||||||||
| Increase (decrease) in cash, cash equivalents and restricted cash | (217) | (27) | (190) | — | ||||||||||||||||||||||
| Cash, cash equivalents and restricted cash at beginning of period | 7,013 | 6,049 | 964 | — | ||||||||||||||||||||||
| Cash, cash equivalents and restricted cash at end of period | $ | 6,796 | $ | 6,022 | $ | 774 | $ | — | ||||||||||||||||||
| 1 | Elimination of equity profit earned from Financial Products' subsidiaries partially owned by ME&T subsidiaries. | ||||
| 2 | Elimination of non-cash adjustments and changes in assets and liabilities related to consolidated reporting. | ||||
| 3 | Reclassification of Financial Products’ cash flow activity from investing to operating for receivables that arose from the sale of inventory. | ||||
| 4 | Elimination of net proceeds and payments to/from ME&T and Financial Products. | ||||
| 5 | Elimination of dividend activity between Financial Products and ME&T. | ||||
| Caterpillar Inc. Quarterly Retail Sales Statistics | ||||||||||||||
| Machines and E&T Combined | 1st Quarter 2024 | 4th Quarter 2023 | 3rd Quarter 2023 | 2nd Quarter 2023 | ||||||||||
| World | DOWN 5% | UP 8% | UP 13% | UP 16% | ||||||||||
| Machines | 1st Quarter 2024 | 4th Quarter 2023 | 3rd Quarter 2023 | 2nd Quarter 2023 | ||||||||||
| Asia/Pacific | DOWN 10% | DOWN 5% | DOWN 14% | UP 2% | ||||||||||
| EAME | DOWN 29% | DOWN 3% | DOWN 1% | DOWN 10% | ||||||||||
| Latin America | UP 4% | DOWN 1% | DOWN 5% | UNCHANGED | ||||||||||
| North America | DOWN 1% | UP 11% | UP 25% | UP 21% | ||||||||||
| World | DOWN 9% | UP 3% | UP 7% | UP 8% | ||||||||||
| Resource Industries (RI) | 1st Quarter 2024 | 4th Quarter 2023 | 3rd Quarter 2023 | 2nd Quarter 2023 | ||||||||||
| Asia/Pacific | DOWN 16% | DOWN 1% | DOWN 10% | UP 31% | ||||||||||
| EAME | DOWN 39% | UP 1% | DOWN 6% | DOWN 10% | ||||||||||
| Latin America | UP 38% | UP 1% | UP 3% | UP 28% | ||||||||||
| North America | DOWN 17% | UP 3% | UP 49% | UP 47% | ||||||||||
| World | DOWN 17% | UP 1% | UP 10% | UP 26% | ||||||||||
| Construction Industries (CI) | 1st Quarter 2024 | 4th Quarter 2023 | 3rd Quarter 2023 | 2nd Quarter 2023 | ||||||||||
| Asia/Pacific | DOWN 6% | DOWN 8% | DOWN 17% | DOWN 14% | ||||||||||
| EAME | DOWN 24% | DOWN 5% | UP 1% | DOWN 9% | ||||||||||
| Latin America | DOWN 10% | DOWN 1% | DOWN 9% | DOWN 8% | ||||||||||
| North America | UP 4% | UP 13% | UP 20% | UP 16% | ||||||||||
| World | DOWN 5% | UP 4% | UP 6% | UP 3% | ||||||||||
| Reported in dollars and based on unit sales as reported primarily by dealers. | ||||||||||||||
Energy & Transportation (E&T) Retail Sales by industry for the quarter ended as indicated compared with the same period of the prior year: | ||||||||||||||
| Energy & Transportation (E&T) | 1st Quarter 2024 | 4th Quarter 2023 | 3rd Quarter 2023 | 2nd Quarter 2023 | ||||||||||
| Power Gen | UP 9% | UP 26% | UP 44% | UP 30% | ||||||||||
| Industrial | DOWN 39% | DOWN 21% | UP 6% | UP 39% | ||||||||||
| Transportation | UP 45% | UP 54% | UP 3% | UP 48% | ||||||||||
| Oil & Gas | UP 35% | UP 25% | UP 45% | UP 71% | ||||||||||
| Total | UP 9% | UP 20% | UP 34% | UP 47% | ||||||||||
| Reported in dollars based on reporting from dealers and direct sales. | ||||||||||||||
| · Asphalt Pavers | · Motor Graders | · Track-Type Tractors (small, medium) | ||||||
· Backhoe Loaders |
· Pipelayers | · Track Excavators (mini, small, | ||||||
· Cold Planers |
· Road Reclaimers | medium, large) | ||||||
· Compactors |
· Skid Steer Loaders | · Wheel Excavators |
||||||
· Compact Track Loaders |
· Telehandlers | · Wheel Loaders (compact, small, | ||||||
| · Forestry Machines | · Track-Type Loaders | medium) | ||||||
| · Material Handlers | ||||||||
| · Large Track-Type tractors | · Hydraulic Shovels | · Wheel Tractor Scrapers | ||||||
| · Large Mining Trucks | · Rotary Drills | · Wheel Dozers | ||||||
| · Hard Rock Vehicles | · Large Wheel Loaders | · Landfill Compactors | ||||||
| · Electric Rope Shovels | · Off-Highway Trucks | · Soil Compactors | ||||||
| · Draglines | · Articulated Trucks | |||||||