| UNITED STATES SECURITIES AND EXCHANGE COMMISSION Washington, D.C. 20549 | |||||||||||||||||||||||||||||||||||
 | |||||||||||||||||||||||||||||||||||
| FORM | 8-K | ||||||||||||||||||||||||||||||||||
| Current Report | |||||||||||||||||||||||||||||||||||
|
Pursuant to Section 13 or 15(d) of the Securities Exchange Act of 1934
| |||||||||||||||||||||||||||||||||||
| Date of Report (Date of earliest event reported): | February 5, 2024 | ||||||||||||||||||||||||||||||||||
| CATERPILLAR INC. | |||||||||||||||||||||||||||||||||||
| (Exact name of registrant as specified in its charter) | |||||||||||||||||||||||||||||||||||
| Delaware | 1-768 | 37-0602744 | |||||||||||||||||||||||||||||||||
| (State or other jurisdiction of incorporation) | (Commission File Number) |
(I.R.S Employer Identification No.) |
|||||||||||||||||||||||||||||||||
| 5205 N. O'Connor Blvd. | Suite 100, | Irving, | Texas | 75039 | ||||||||||||||||||||||||||||
| (Address of principal executive offices) | (Zip Code) | |||||||||||||||||||||||||||||||
| Registrant’s telephone number, including area code: | (972) | 891-7700 | ||||||||||||||||||||||||||||||
| Former name or former address, if changed since last report: | N/A | |||||||||||||||||||||||||||||||
| ☐ | Written communications pursuant to Rule 425 under the Securities Act (17 CFR 230.425) | ||||||||||||||||||||||||||||||||||
| ☐ | Soliciting material pursuant to Rule 14a-12 under the Exchange Act (17 CFR 240.14a-12) | ||||||||||||||||||||||||||||||||||
| ☐ | Pre-commencement communications pursuant to Rule 14d-2(b) under the Exchange Act (17 CFR 240.14d-2(b)) | ||||||||||||||||||||||||||||||||||
| ☐ | Pre-commencement communications pursuant to Rule 13e-4(c) under the Exchange Act (17 CFR 240.13e-4(c)) | ||||||||||||||||||||||||||||||||||
|
Securities registered pursuant to Section 12(b) of the Act:
| |||||||||||||||||||||||||||||||||||
| Title of each class | Trading Symbol (s) | Name of each exchange which registered | |||||||||||||||||||||||||||||||||
| Common Stock ($1.00 par value) | CAT | The New York Stock Exchange | |||||||||||||||||||||||||||||||||
| 5.3% Debentures due September 15, 2035 | CAT35 | The New York Stock Exchange | |||||||||||||||||||||||||||||||||
| Check the appropriate box below if the Form 8-K filing is intended to simultaneously satisfy the filing obligation of the registrant under any of the following provisions: | |||||||||||||||||||||||||||||||||||
| Indicate by check mark whether the registrant is an emerging growth company as defined by Rule 405 of the Securities Act of | |||||||||||||||||||||||||||||||||||
| 1933 (17 CFR §230.405 of this chapter) or Rule 12b-2 of the Securities Exchange Act of 1934 (17 CFR §240.12b-2 of this chapter). | |||||||||||||||||||||||||||||||||||
| Emerging growth company | ☐ | ||||||||||||||||||||||||||||||||||
| If an emerging growth company, indicate by check mark if the registrant has elected not to use the extended transition period | |||||||||||||||||||||||||||||||||||
| for complying with any new or revised financial accounting standards provided pursuant to Section 13(a) of the Exchange Act. | ☐ | ||||||||||||||||||||||||||||||||||
| (d) | Exhibits: | ||||||||||
| The following is furnished as an exhibit to this report: | |||||||||||
| 99.1 | |||||||||||
| 99.2 | |||||||||||
| 104 | The cover page from this Current Report on Form 8-K, formatted in Inline XBRL. | ||||||||||
|
SIGNATURES
| ||||||||
| Pursuant to the requirements of the Securities Exchange Act of 1934, the registrant has duly caused this report to be signed on its behalf by the undersigned hereunto duly authorized. | ||||||||
| CATERPILLAR INC. | ||||||||
| February 5, 2024 | By: | /s/ Derek Owens | ||||||
| Derek Owens Chief Legal Officer and General Counsel |
||||||||
| ● | Fourth-quarter 2023 sales and revenues up 3%; full-year sales and revenues up 13% |
||||
| ● | Fourth-quarter 2023 profit per share of $5.28; adjusted profit per share of $5.23 |
||||
| ● | Full-year profit per share of $20.12; adjusted profit per share of $21.21 |
||||
| ● | Strong operating cash flow of $12.9 billion; ended the year with $7.0 billion of enterprise cash |
||||
| ● | Returned $7.5 billion to shareholders through share repurchases and dividends in 2023 |
||||
| Fourth Quarter | Full Year | |||||||||||||||||||
| ($ in billions except profit per share) | 2023 | 2022 | 2023 | 2022 | ||||||||||||||||
| Sales and Revenues | $17.1 | $16.6 | $67.1 | $59.4 | ||||||||||||||||
| Profit Per Share | $5.28 | $2.79 | $20.12 | $12.64 | ||||||||||||||||
| Adjusted Profit Per Share | $5.23 | $3.86 | $21.21 | $13.84 | ||||||||||||||||
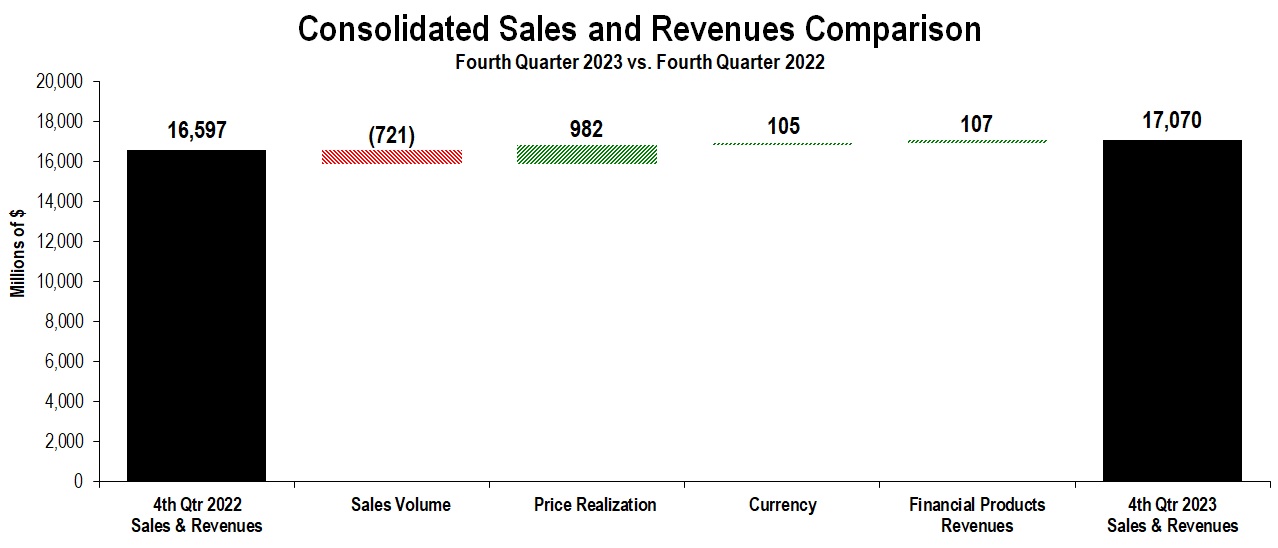
| Sales and Revenues by Segment | |||||||||||||||||||||||||||||||||||||||||||||||
| (Millions of dollars) | Fourth Quarter 2022 | Sales Volume |
Price Realization |
Currency | Inter-Segment / Other | Fourth Quarter 2023 | $ Change |
% Change |
|||||||||||||||||||||||||||||||||||||||
| Construction Industries | $ | 6,845 | $ | (809) | $ | 445 | $ | 38 | $ | — | $ | 6,519 | $ | (326) | (5%) | ||||||||||||||||||||||||||||||||
| Resource Industries | 3,436 | (440) | 239 | 8 | (1) | 3,242 | (194) | (6%) | |||||||||||||||||||||||||||||||||||||||
| Energy & Transportation | 6,823 | 561 | 305 | 54 | (74) | 7,669 | 846 | 12% | |||||||||||||||||||||||||||||||||||||||
| All Other Segment | 111 | 5 | (7) | 1 | 6 | 116 | 5 | 5% | |||||||||||||||||||||||||||||||||||||||
| Corporate Items and Eliminations | (1,344) | (38) | — | 4 | 69 | (1,309) | 35 | ||||||||||||||||||||||||||||||||||||||||
| Machinery, Energy & Transportation | 15,871 | (721) | 982 | 105 | — | 16,237 | 366 | 2% | |||||||||||||||||||||||||||||||||||||||
| Financial Products Segment | 853 | — | — | — | 128 | 981 | 128 | 15% | |||||||||||||||||||||||||||||||||||||||
| Corporate Items and Eliminations | (127) | — | — | — | (21) | (148) | (21) | ||||||||||||||||||||||||||||||||||||||||
| Financial Products Revenues | 726 | — | — | — | 107 | 833 | 107 | 15% | |||||||||||||||||||||||||||||||||||||||
| Consolidated Sales and Revenues | $ | 16,597 | $ | (721) | $ | 982 | $ | 105 | $ | 107 | $ | 17,070 | $ | 473 | 3% | ||||||||||||||||||||||||||||||||
| Sales and Revenues by Geographic Region | |||||||||||||||||||||||||||||||||||||||||||||||||||||||||||||||||||||||||||||||||||
| North America | Latin America | EAME | Asia/Pacific | External Sales and Revenues | Inter-Segment | Total Sales and Revenues | |||||||||||||||||||||||||||||||||||||||||||||||||||||||||||||||||||||||||||||
| (Millions of dollars) | $ | % Chg | $ | % Chg | $ | % Chg | $ | % Chg | $ | % Chg | $ | % Chg | $ | % Chg | |||||||||||||||||||||||||||||||||||||||||||||||||||||||||||||||||||||
| Fourth Quarter 2023 | |||||||||||||||||||||||||||||||||||||||||||||||||||||||||||||||||||||||||||||||||||
| Construction Industries | $ | 3,689 | 4% | $ | 587 | (25%) | $ | 1,129 | (18%) | $ | 1,083 | (4%) | $ | 6,488 | (5%) | $ | 31 | —% | $ | 6,519 | (5%) | ||||||||||||||||||||||||||||||||||||||||||||||||||||||||||||||
| Resource Industries | 1,240 | (9%) | 529 | 5% | 445 | (25%) | 939 | 6% | 3,153 | (6%) | 89 | (1%) | 3,242 | (6%) | |||||||||||||||||||||||||||||||||||||||||||||||||||||||||||||||||||||
| Energy & Transportation | 3,324 | 31% | 684 | 10% | 1,638 | 5% | 942 | (1%) | 6,588 | 16% | 1,081 | (6%) | 7,669 | 12% | |||||||||||||||||||||||||||||||||||||||||||||||||||||||||||||||||||||
| All Other Segment | 15 | 25% | — | (100%) | 5 | 106% | 12 | (88%) | 32 | (3%) | 84 | 8% | 116 | 5% | |||||||||||||||||||||||||||||||||||||||||||||||||||||||||||||||||||||
| Corporate Items and Eliminations | (18) | (2) | (2) | (2) | (24) | (1,285) | (1,309) | ||||||||||||||||||||||||||||||||||||||||||||||||||||||||||||||||||||||||||||
| Machinery, Energy & Transportation | 8,250 | 11% | 1,798 | (6%) | 3,215 | (7%) | 2,974 | (3%) | 16,237 | 2% | — | —% | 16,237 | 2% | |||||||||||||||||||||||||||||||||||||||||||||||||||||||||||||||||||||
| Financial Products Segment | 645 | 18% | 100 | 2% | 127 | 23% | 109 | 5% | 981 | 15% | —% | 981 | 15% | ||||||||||||||||||||||||||||||||||||||||||||||||||||||||||||||||||||||
| Corporate Items and Eliminations | (88) | (17) | (22) | (21) | (148) | (148) | |||||||||||||||||||||||||||||||||||||||||||||||||||||||||||||||||||||||||||||
| Financial Products Revenues | 557 | 17% | 83 | 6% | 105 | 21% | 88 | 2% | 833 | 15% | — | —% | 833 | 15% | |||||||||||||||||||||||||||||||||||||||||||||||||||||||||||||||||||||
| Consolidated Sales and Revenues | $ | 8,807 | 11% | $ | 1,881 | (5%) | $ | 3,320 | (6%) | $ | 3,062 | (3%) | $ | 17,070 | 3% | $ | — | —% | $ | 17,070 | 3% | ||||||||||||||||||||||||||||||||||||||||||||||||||||||||||||||
| Fourth Quarter 2022 | |||||||||||||||||||||||||||||||||||||||||||||||||||||||||||||||||||||||||||||||||||
| Construction Industries | $ | 3,535 | $ | 782 | $ | 1,373 | $ | 1,124 | $ | 6,814 | $ | 31 | $ | 6,845 | |||||||||||||||||||||||||||||||||||||||||||||||||||||||||||||||||||||
| Resource Industries | 1,364 | 503 | 596 | 883 | 3,346 | 90 | 3,436 | ||||||||||||||||||||||||||||||||||||||||||||||||||||||||||||||||||||||||||||
| Energy & Transportation | 2,538 | 624 | 1,553 | 953 | 5,668 | 1,155 | 6,823 | ||||||||||||||||||||||||||||||||||||||||||||||||||||||||||||||||||||||||||||
| All Other Segment | 12 | 2 | (80) | 99 | 33 | 78 | 111 | ||||||||||||||||||||||||||||||||||||||||||||||||||||||||||||||||||||||||||||
| Corporate Items and Eliminations | 14 | — | (3) | (1) | 10 | (1,354) | (1,344) | ||||||||||||||||||||||||||||||||||||||||||||||||||||||||||||||||||||||||||||
| Machinery, Energy & Transportation | 7,463 | 1,911 | 3,439 | 3,058 | 15,871 | — | 15,871 | ||||||||||||||||||||||||||||||||||||||||||||||||||||||||||||||||||||||||||||
| Financial Products Segment | 548 | 98 | 103 | 104 | 853 | — | 853 | ||||||||||||||||||||||||||||||||||||||||||||||||||||||||||||||||||||||||||||
| Corporate Items and Eliminations | (73) | (20) | (16) | (18) | (127) | — | (127) | ||||||||||||||||||||||||||||||||||||||||||||||||||||||||||||||||||||||||||||
| Financial Products Revenues | 475 | 78 | 87 | 86 | 726 | — | 726 | ||||||||||||||||||||||||||||||||||||||||||||||||||||||||||||||||||||||||||||
| Consolidated Sales and Revenues | $ | 7,938 | $ | 1,989 | $ | 3,526 | $ | 3,144 | $ | 16,597 | $ | — | $ | 16,597 | |||||||||||||||||||||||||||||||||||||||||||||||||||||||||||||||||||||
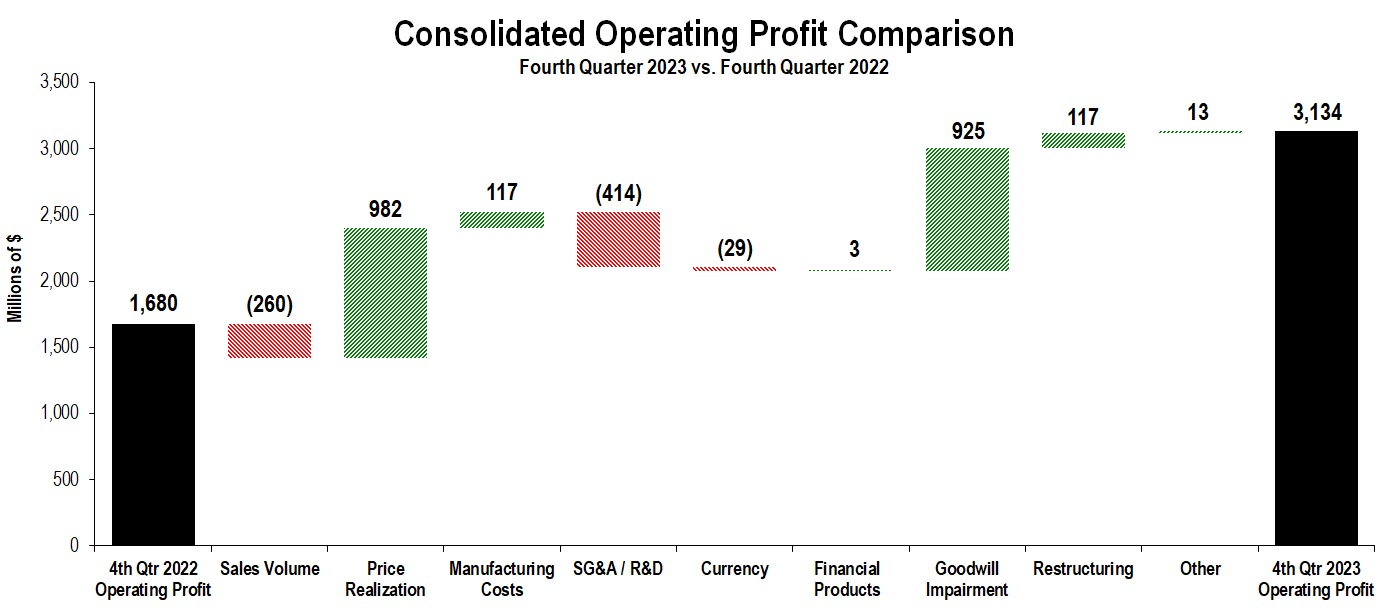
| Profit (Loss) by Segment | |||||||||||||||||||||||
| (Millions of dollars) | Fourth Quarter 2023 | Fourth Quarter 2022 | $ Change |
%
Change
|
|||||||||||||||||||
| Construction Industries | $ | 1,535 | $ | 1,488 | $ | 47 | 3 | % | |||||||||||||||
| Resource Industries | 600 | 605 | (5) | (1 | %) | ||||||||||||||||||
| Energy & Transportation | 1,429 | 1,177 | 252 | 21 | % | ||||||||||||||||||
| All Other Segment | (24) | (53) | 29 | 55 | % | ||||||||||||||||||
| Corporate Items and Eliminations | (438) | (1,588) | 1,150 | ||||||||||||||||||||
| Machinery, Energy & Transportation | 3,102 | 1,629 | 1,473 | 90 | % | ||||||||||||||||||
| Financial Products Segment | 234 | 189 | 45 | 24 | % | ||||||||||||||||||
| Corporate Items and Eliminations | (46) | (4) | (42) | ||||||||||||||||||||
| Financial Products | 188 | 185 | 3 | 2 | % | ||||||||||||||||||
| Consolidating Adjustments | (156) | (134) | (22) | ||||||||||||||||||||
| Consolidated Operating Profit | $ | 3,134 | $ | 1,680 | $ | 1,454 | 87 | % | |||||||||||||||
| CONSTRUCTION INDUSTRIES | ||||||||||||||||||||||||||||||||||||||||||||||||||
| (Millions of dollars) | ||||||||||||||||||||||||||||||||||||||||||||||||||
| Segment Sales | ||||||||||||||||||||||||||||||||||||||||||||||||||
| Fourth Quarter 2022 | Sales Volume | Price Realization | Currency | Inter-Segment | Fourth Quarter 2023 | $ Change |
% Change |
|||||||||||||||||||||||||||||||||||||||||||
| Total Sales | $ | 6,845 | $ | (809) | $ | 445 | $ | 38 | $ | — | $ | 6,519 | $ | (326) | (5 | %) | ||||||||||||||||||||||||||||||||||
| Sales by Geographic Region | ||||||||||||||||||||||||||||||||||||||||||||||||||
| Fourth Quarter 2023 | Fourth Quarter 2022 | $ Change |
% Change |
|||||||||||||||||||||||||||||||||||||||||||||||
| North America | $ | 3,689 | $ | 3,535 | $ | 154 | 4 | % | ||||||||||||||||||||||||||||||||||||||||||
| Latin America | 587 | 782 | (195) | (25 | %) | |||||||||||||||||||||||||||||||||||||||||||||
| EAME | 1,129 | 1,373 | (244) | (18 | %) | |||||||||||||||||||||||||||||||||||||||||||||
| Asia/Pacific | 1,083 | 1,124 | (41) | (4 | %) | |||||||||||||||||||||||||||||||||||||||||||||
| External Sales | 6,488 | 6,814 | (326) | (5 | %) | |||||||||||||||||||||||||||||||||||||||||||||
| Inter-segment | 31 | 31 | — | — | % | |||||||||||||||||||||||||||||||||||||||||||||
| Total Sales | $ | 6,519 | $ | 6,845 | $ | (326) | (5 | %) | ||||||||||||||||||||||||||||||||||||||||||
| Segment Profit | ||||||||||||||||||||||||||||||||||||||||||||||||||
| Fourth Quarter 2023 | Fourth Quarter 2022 |
Change |
% Change |
|||||||||||||||||||||||||||||||||||||||||||||||
| Segment Profit | $ | 1,535 | $ | 1,488 | $ | 47 | 3 | % | ||||||||||||||||||||||||||||||||||||||||||
| Segment Profit Margin | 23.5 | % | 21.7 | % | 1.8 | pts | ||||||||||||||||||||||||||||||||||||||||||||
| RESOURCE INDUSTRIES | ||||||||||||||||||||||||||||||||||||||||||||||||||
| (Millions of dollars) | ||||||||||||||||||||||||||||||||||||||||||||||||||
| Segment Sales | ||||||||||||||||||||||||||||||||||||||||||||||||||
| Fourth Quarter 2022 | Sales Volume | Price Realization | Currency | Inter-Segment | Fourth Quarter 2023 | $ Change |
% Change |
|||||||||||||||||||||||||||||||||||||||||||
| Total Sales | $ | 3,436 | $ | (440) | $ | 239 | $ | 8 | $ | (1) | $ | 3,242 | $ | (194) | (6 | %) | ||||||||||||||||||||||||||||||||||
| Sales by Geographic Region | ||||||||||||||||||||||||||||||||||||||||||||||||||
| Fourth Quarter 2023 | Fourth Quarter 2022 | $ Change |
% Change |
|||||||||||||||||||||||||||||||||||||||||||||||
| North America | $ | 1,240 | $ | 1,364 | $ | (124) | (9 | %) | ||||||||||||||||||||||||||||||||||||||||||
| Latin America | 529 | 503 | 26 | 5 | % | |||||||||||||||||||||||||||||||||||||||||||||
| EAME | 445 | 596 | (151) | (25 | %) | |||||||||||||||||||||||||||||||||||||||||||||
| Asia/Pacific | 939 | 883 | 56 | 6 | % | |||||||||||||||||||||||||||||||||||||||||||||
| External Sales | 3,153 | 3,346 | (193) | (6 | %) | |||||||||||||||||||||||||||||||||||||||||||||
| Inter-segment | 89 | 90 | (1) | (1 | %) | |||||||||||||||||||||||||||||||||||||||||||||
| Total Sales | $ | 3,242 | $ | 3,436 | $ | (194) | (6 | %) | ||||||||||||||||||||||||||||||||||||||||||
| Segment Profit | ||||||||||||||||||||||||||||||||||||||||||||||||||
| Fourth Quarter 2023 | Fourth Quarter 2022 |
Change |
% Change |
|||||||||||||||||||||||||||||||||||||||||||||||
| Segment Profit | $ | 600 | $ | 605 | $ | (5) | (1 | %) | ||||||||||||||||||||||||||||||||||||||||||
| Segment Profit Margin | 18.5 | % | 17.6 | % | 0.9 | pts | ||||||||||||||||||||||||||||||||||||||||||||
| ENERGY & TRANSPORTATION | ||||||||||||||||||||||||||||||||||||||||||||||||||
| (Millions of dollars) | ||||||||||||||||||||||||||||||||||||||||||||||||||
| Segment Sales | ||||||||||||||||||||||||||||||||||||||||||||||||||
| Fourth Quarter 2022 | Sales Volume | Price Realization | Currency | Inter-Segment | Fourth Quarter 2023 | $ Change |
% Change |
|||||||||||||||||||||||||||||||||||||||||||
| Total Sales | $ | 6,823 | $ | 561 | $ | 305 | $ | 54 | $ | (74) | $ | 7,669 | $ | 846 | 12 | % | ||||||||||||||||||||||||||||||||||
| Sales by Application | ||||||||||||||||||||||||||||||||||||||||||||||||||
| Fourth Quarter 2023 | Fourth Quarter 2022 | $ Change |
% Change |
|||||||||||||||||||||||||||||||||||||||||||||||
| Oil and Gas | $ | 2,247 | $ | 1,827 | $ | 420 | 23 | % | ||||||||||||||||||||||||||||||||||||||||||
| Power Generation | 1,835 | 1,422 | 413 | 29 | % | |||||||||||||||||||||||||||||||||||||||||||||
| Industrial | 1,078 | 1,131 | (53) | (5 | %) | |||||||||||||||||||||||||||||||||||||||||||||
| Transportation | 1,428 | 1,288 | 140 | 11 | % | |||||||||||||||||||||||||||||||||||||||||||||
| External Sales | 6,588 | 5,668 | 920 | 16 | % | |||||||||||||||||||||||||||||||||||||||||||||
| Inter-segment | 1,081 | 1,155 | (74) | (6 | %) | |||||||||||||||||||||||||||||||||||||||||||||
| Total Sales | $ | 7,669 | $ | 6,823 | $ | 846 | 12 | % | ||||||||||||||||||||||||||||||||||||||||||
| Segment Profit | ||||||||||||||||||||||||||||||||||||||||||||||||||
| Fourth Quarter 2023 | Fourth Quarter 2022 |
Change |
% Change |
|||||||||||||||||||||||||||||||||||||||||||||||
| Segment Profit | $ | 1,429 | $ | 1,177 | $ | 252 | 21 | % | ||||||||||||||||||||||||||||||||||||||||||
| Segment Profit Margin | 18.6 | % | 17.3 | % | 1.3 | pts | ||||||||||||||||||||||||||||||||||||||||||||
| FINANCIAL PRODUCTS SEGMENT | ||||||||||||||||||||||||||||||||||||||||||||||||||
| (Millions of dollars) | ||||||||||||||||||||||||||||||||||||||||||||||||||
| Revenues by Geographic Region | ||||||||||||||||||||||||||||||||||||||||||||||||||
| Fourth Quarter 2023 | Fourth Quarter 2022 | $ Change |
% Change |
|||||||||||||||||||||||||||||||||||||||||||||||
| North America | $ | 645 | $ | 548 | $ | 97 | 18 | % | ||||||||||||||||||||||||||||||||||||||||||
| Latin America | 100 | 98 | 2 | 2 | % | |||||||||||||||||||||||||||||||||||||||||||||
| EAME | 127 | 103 | 24 | 23 | % | |||||||||||||||||||||||||||||||||||||||||||||
| Asia/Pacific | 109 | 104 | 5 | 5 | % | |||||||||||||||||||||||||||||||||||||||||||||
| Total Revenues | $ | 981 | $ | 853 | $ | 128 | 15 | % | ||||||||||||||||||||||||||||||||||||||||||
| Segment Profit | ||||||||||||||||||||||||||||||||||||||||||||||||||
| Fourth Quarter 2023 | Fourth Quarter 2022 |
Change |
% Change |
|||||||||||||||||||||||||||||||||||||||||||||||
| Segment Profit | $ | 234 | $ | 189 | $ | 45 | 24 | % | ||||||||||||||||||||||||||||||||||||||||||
| (Dollars in millions except per share data) | Operating Profit | Operating Profit Margin | Profit Before Taxes | Provision (Benefit) for Income Taxes | Effective Tax Rate | Profit | Profit per Share | |||||||||||||||||||||||||||||||||||||
| Three Months Ended December 31, 2023 - U.S. GAAP | $ | 3,134 | 18.4 | % | $ | 3,249 | $ | 587 | 18.1 | % | $ | 2,676 | $ | 5.28 | ||||||||||||||||||||||||||||||
| Restructuring costs | 92 | 0.5 | % | 92 | 27 | 29.3 | % | 65 | 0.13 | |||||||||||||||||||||||||||||||||||
| Pension/OPEB mark-to-market (gains) losses | — | — | % | (97) | (26) | 26.8 | % | (71) | (0.14) | |||||||||||||||||||||||||||||||||||
| Deferred tax valuation allowance adjustments | — | — | % | — | 18 | — | % | (18) | (0.04) | |||||||||||||||||||||||||||||||||||
| Three Months Ended December 31, 2023 - Adjusted | $ | 3,226 | 18.9 | % | $ | 3,244 | $ | 606 | 18.7 | % | $ | 2,652 | $ | 5.23 | ||||||||||||||||||||||||||||||
| Three Months Ended December 31, 2022 - U.S. GAAP | $ | 1,680 | 10.1 | % | $ | 2,099 | $ | 644 | 30.7 | % | $ | 1,454 | $ | 2.79 | ||||||||||||||||||||||||||||||
| Goodwill impairment | 925 | 5.6 | % | 925 | 36 | 3.9 | % | 889 | 1.71 | |||||||||||||||||||||||||||||||||||
| Restructuring costs | 209 | 1.3 | % | 209 | 59 | 28.2 | % | 150 | 0.29 | |||||||||||||||||||||||||||||||||||
| Pension/OPEB mark-to-market (gains) losses | — | — | % | (606) | (124) | 20.5 | % | (482) | (0.93) | |||||||||||||||||||||||||||||||||||
| Three Months Ended December 31, 2022 - Adjusted | $ | 2,814 | 17.0 | % | $ | 2,627 | $ | 615 | 23.4 | % | $ | 2,011 | $ | 3.86 | ||||||||||||||||||||||||||||||
| Twelve Months Ended December 31, 2023 - U.S. GAAP | $ | 12,966 | 19.3 | % | $ | 13,050 | $ | 2,781 | 21.3 | % | $ | 10,335 | $ | 20.12 | ||||||||||||||||||||||||||||||
| Restructuring costs - Longwall divestiture | 586 | 0.9 | % | 586 | — | — | % | 586 | 1.14 | |||||||||||||||||||||||||||||||||||
| Other restructuring costs | 194 | 0.3 | % | 194 | 48 | 25.0 | % | 146 | 0.30 | |||||||||||||||||||||||||||||||||||
| Pension/OPEB mark-to-market (gains) losses | — | — | % | (97) | (26) | 26.8 | % | (71) | (0.14) | |||||||||||||||||||||||||||||||||||
| Deferred tax valuation allowance adjustments | — | — | % | — | 106 | — | % | (106) | (0.21) | |||||||||||||||||||||||||||||||||||
| Twelve Months Ended December 31, 2023 - Adjusted | $ | 13,746 | 20.5 | % | $ | 13,733 | $ | 2,909 | 21.2 | % | $ | 10,890 | $ | 21.21 | ||||||||||||||||||||||||||||||
| Twelve Months Ended December 31, 2022 - U.S. GAAP | $ | 7,904 | 13.3 | % | $ | 8,752 | $ | 2,067 | 23.6 | % | $ | 6,705 | $ | 12.64 | ||||||||||||||||||||||||||||||
| Goodwill impairment | 925 | 1.6 | % | 925 | 36 | 3.9 | % | 889 | 1.68 | |||||||||||||||||||||||||||||||||||
| Restructuring costs | 299 | 0.5 | % | 299 | 72 | 24.0 | % | 227 | 0.43 | |||||||||||||||||||||||||||||||||||
| Pension/OPEB mark-to-market (gains) losses | — | — | % | (606) | (124) | 20.5 | % | (482) | (0.91) | |||||||||||||||||||||||||||||||||||
| Twelve Months Ended December 31, 2022 - Adjusted | $ | 9,128 | 15.4 | % | $ | 9,370 | $ | 2,051 | 21.9 | % | $ | 7,339 | $ | 13.84 | ||||||||||||||||||||||||||||||
| Three Months Ended December 31, | Twelve Months Ended December 31, | ||||||||||||||||||||||
| 2023 | 2022 | 2023 | 2022 | ||||||||||||||||||||
| Sales and revenues: | |||||||||||||||||||||||
| Sales of Machinery, Energy & Transportation | $ | 16,237 | $ | 15,871 | $ | 63,869 | $ | 56,574 | |||||||||||||||
| Revenues of Financial Products | 833 | 726 | 3,191 | 2,853 | |||||||||||||||||||
| Total sales and revenues | 17,070 | 16,597 | 67,060 | 59,427 | |||||||||||||||||||
| Operating costs: | |||||||||||||||||||||||
| Cost of goods sold | 11,016 | 11,614 | 42,767 | 41,350 | |||||||||||||||||||
| Selling, general and administrative expenses | 1,756 | 1,479 | 6,371 | 5,651 | |||||||||||||||||||
| Research and development expenses | 554 | 401 | 2,108 | 1,814 | |||||||||||||||||||
| Interest expense of Financial Products | 288 | 188 | 1,030 | 565 | |||||||||||||||||||
| Goodwill impairment charge | — | 925 | — | 925 | |||||||||||||||||||
| Other operating (income) expenses | 322 | 310 | 1,818 | 1,218 | |||||||||||||||||||
| Total operating costs | 13,936 | 14,917 | 54,094 | 51,523 | |||||||||||||||||||
| Operating profit | 3,134 | 1,680 | 12,966 | 7,904 | |||||||||||||||||||
| Interest expense excluding Financial Products | 126 | 117 | 511 | 443 | |||||||||||||||||||
| Other income (expense) | 241 | 536 | 595 | 1,291 | |||||||||||||||||||
| Consolidated profit before taxes | 3,249 | 2,099 | 13,050 | 8,752 | |||||||||||||||||||
| Provision (benefit) for income taxes | 587 | 644 | 2,781 | 2,067 | |||||||||||||||||||
| Profit of consolidated companies | 2,662 | 1,455 | 10,269 | 6,685 | |||||||||||||||||||
| Equity in profit (loss) of unconsolidated affiliated companies | 11 | (1) | 63 | 19 | |||||||||||||||||||
| Profit of consolidated and affiliated companies | 2,673 | 1,454 | 10,332 | 6,704 | |||||||||||||||||||
| Less: Profit (loss) attributable to noncontrolling interests | (3) | — | (3) | (1) | |||||||||||||||||||
Profit 1 |
$ | 2,676 | $ | 1,454 | $ | 10,335 | $ | 6,705 | |||||||||||||||
| Profit per common share | $ | 5.31 | $ | 2.81 | $ | 20.24 | $ | 12.72 | |||||||||||||||
Profit per common share — diluted 2 |
$ | 5.28 | $ | 2.79 | $ | 20.12 | $ | 12.64 | |||||||||||||||
| Weighted-average common shares outstanding (millions) | |||||||||||||||||||||||
| – Basic | 504.4 | 517.4 | 510.6 | 526.9 | |||||||||||||||||||
– Diluted 2 |
507.0 | 520.9 | 513.6 | 530.4 | |||||||||||||||||||
| 1 | Profit attributable to common shareholders. | ||||
| 2 | Diluted by assumed exercise of stock-based compensation awards using the treasury stock method. | ||||
| December 31, 2023 |
December 31, 2022 |
||||||||||
| Assets | |||||||||||
| Current assets: | |||||||||||
| Cash and cash equivalents | $ | 6,978 | $ | 7,004 | |||||||
| Receivables – trade and other | 9,310 | 8,856 | |||||||||
| Receivables – finance | 9,510 | 9,013 | |||||||||
| Prepaid expenses and other current assets | 4,586 | 2,642 | |||||||||
| Inventories | 16,565 | 16,270 | |||||||||
| Total current assets | 46,949 | 43,785 | |||||||||
| Property, plant and equipment – net | 12,680 | 12,028 | |||||||||
| Long-term receivables – trade and other | 1,238 | 1,265 | |||||||||
| Long-term receivables – finance | 12,664 | 12,013 | |||||||||
| Noncurrent deferred and refundable income taxes | 2,816 | 2,213 | |||||||||
| Intangible assets | 564 | 758 | |||||||||
| Goodwill | 5,308 | 5,288 | |||||||||
| Other assets | 5,257 | 4,593 | |||||||||
| Total assets | $ | 87,476 | $ | 81,943 | |||||||
| Liabilities | |||||||||||
| Current liabilities: | |||||||||||
| Short-term borrowings: | |||||||||||
| -- Machinery, Energy & Transportation | $ | — | $ | 3 | |||||||
| -- Financial Products | 4,643 | 5,954 | |||||||||
| Accounts payable | 7,906 | 8,689 | |||||||||
| Accrued expenses | 4,958 | 4,080 | |||||||||
| Accrued wages, salaries and employee benefits | 2,757 | 2,313 | |||||||||
| Customer advances | 1,929 | 1,860 | |||||||||
| Dividends payable | 649 | 620 | |||||||||
| Other current liabilities | 3,123 | 2,690 | |||||||||
| Long-term debt due within one year: | |||||||||||
| -- Machinery, Energy & Transportation | 1,044 | 120 | |||||||||
| -- Financial Products | 7,719 | 5,202 | |||||||||
| Total current liabilities | 34,728 | 31,531 | |||||||||
| Long-term debt due after one year: | |||||||||||
| -- Machinery, Energy & Transportation | 8,579 | 9,498 | |||||||||
| -- Financial Products | 15,893 | 16,216 | |||||||||
| Liability for postemployment benefits | 4,098 | 4,203 | |||||||||
| Other liabilities | 4,675 | 4,604 | |||||||||
| Total liabilities | 67,973 | 66,052 | |||||||||
| Shareholders’ equity | |||||||||||
| Common stock | 6,403 | 6,560 | |||||||||
| Treasury stock | (36,339) | (31,748) | |||||||||
| Profit employed in the business | 51,250 | 43,514 | |||||||||
| Accumulated other comprehensive income (loss) | (1,820) | (2,457) | |||||||||
| Noncontrolling interests | 9 | 22 | |||||||||
| Total shareholders’ equity | 19,503 | 15,891 | |||||||||
| Total liabilities and shareholders’ equity | $ | 87,476 | $ | 81,943 | |||||||
| Twelve Months Ended December 31, |
|||||||||||
| 2023 | 2022 | ||||||||||
| Cash flow from operating activities: | |||||||||||
| Profit of consolidated and affiliated companies | $ | 10,332 | $ | 6,704 | |||||||
| Adjustments for non-cash items: | |||||||||||
| Depreciation and amortization | 2,144 | 2,219 | |||||||||
| Actuarial (gain) loss on pension and postretirement benefits | (97) | (606) | |||||||||
| Provision (benefit) for deferred income taxes | (592) | (377) | |||||||||
| Loss on divestiture | 572 | — | |||||||||
| Goodwill impairment charge | — | 925 | |||||||||
| Other | 375 | 701 | |||||||||
| Changes in assets and liabilities, net of acquisitions and divestitures: | |||||||||||
| Receivables – trade and other | (437) | (220) | |||||||||
| Inventories | (364) | (2,589) | |||||||||
| Accounts payable | (754) | 798 | |||||||||
| Accrued expenses | 796 | 317 | |||||||||
| Accrued wages, salaries and employee benefits | 486 | 90 | |||||||||
| Customer advances | 80 | 768 | |||||||||
| Other assets – net | (95) | (210) | |||||||||
| Other liabilities – net | 439 | (754) | |||||||||
| Net cash provided by (used for) operating activities | 12,885 | 7,766 | |||||||||
| Cash flow from investing activities: | |||||||||||
| Capital expenditures – excluding equipment leased to others | (1,597) | (1,296) | |||||||||
| Expenditures for equipment leased to others | (1,495) | (1,303) | |||||||||
| Proceeds from disposals of leased assets and property, plant and equipment | 781 | 830 | |||||||||
| Additions to finance receivables | (15,161) | (13,239) | |||||||||
| Collections of finance receivables | 14,034 | 13,177 | |||||||||
| Proceeds from sale of finance receivables | 63 | 57 | |||||||||
| Investments and acquisitions (net of cash acquired) | (75) | (88) | |||||||||
| Proceeds from sale of businesses and investments (net of cash sold) | (4) | 1 | |||||||||
| Proceeds from maturities and sale of securities | 1,891 | 2,383 | |||||||||
| Investments in securities | (4,405) | (3,077) | |||||||||
| Other – net | 97 | 14 | |||||||||
| Net cash provided by (used for) investing activities | (5,871) | (2,541) | |||||||||
| Cash flow from financing activities: | |||||||||||
| Dividends paid | (2,563) | (2,440) | |||||||||
| Common stock issued, including treasury shares reissued | 12 | 51 | |||||||||
| Common shares repurchased | (4,975) | (4,230) | |||||||||
| Proceeds from debt issued (original maturities greater than three months) | 8,257 | 6,674 | |||||||||
| Payments on debt (original maturities greater than three months) | (6,318) | (7,728) | |||||||||
| Short-term borrowings – net (original maturities three months or less) | (1,345) | 402 | |||||||||
| Other – net | — | (10) | |||||||||
| Net cash provided by (used for) financing activities | (6,932) | (7,281) | |||||||||
| Effect of exchange rate changes on cash | (110) | (194) | |||||||||
| Increase (decrease) in cash, cash equivalents and restricted cash | (28) | (2,250) | |||||||||
| Cash, cash equivalents and restricted cash at beginning of period | 7,013 | 9,263 | |||||||||
| Cash, cash equivalents and restricted cash at end of period | $ | 6,985 | $ | 7,013 | |||||||
| Cash equivalents primarily represent short-term, highly liquid investments with original maturities of generally three months or less. | ||
| Supplemental Consolidating Data | ||||||||||||||||||||||||||
| Consolidated | Machinery, Energy & Transportation |
Financial Products |
Consolidating Adjustments |
|||||||||||||||||||||||
| Sales and revenues: | ||||||||||||||||||||||||||
| Sales of Machinery, Energy & Transportation | $ | 16,237 | $ | 16,237 | $ | — | $ | — | ||||||||||||||||||
| Revenues of Financial Products | 833 | — | 1,020 | (187) | 1 | |||||||||||||||||||||
| Total sales and revenues | 17,070 | 16,237 | 1,020 | (187) | ||||||||||||||||||||||
| Operating costs: | ||||||||||||||||||||||||||
| Cost of goods sold | 11,016 | 11,018 | — | (2) | 2 | |||||||||||||||||||||
| Selling, general and administrative expenses | 1,756 | 1,557 | 197 | 2 | 2 | |||||||||||||||||||||
| Research and development expenses | 554 | 554 | — | — | ||||||||||||||||||||||
| Interest expense of Financial Products | 288 | — | 290 | (2) | 2 | |||||||||||||||||||||
| Other operating (income) expenses | 322 | 6 | 345 | (29) | 2 | |||||||||||||||||||||
| Total operating costs | 13,936 | 13,135 | 832 | (31) | ||||||||||||||||||||||
| Operating profit | 3,134 | 3,102 | 188 | (156) | ||||||||||||||||||||||
| Interest expense excluding Financial Products | 126 | 126 | — | — | ||||||||||||||||||||||
| Other income (expense) | 241 | 322 | 33 | (114) | 3 | |||||||||||||||||||||
| Consolidated profit before taxes | 3,249 | 3,298 | 221 | (270) | ||||||||||||||||||||||
| Provision (benefit) for income taxes | 587 | 567 | 20 | — | ||||||||||||||||||||||
| Profit of consolidated companies | 2,662 | 2,731 | 201 | (270) | ||||||||||||||||||||||
| Equity in profit (loss) of unconsolidated affiliated companies | 11 | 12 | — | (1) | 4 | |||||||||||||||||||||
| Profit of consolidated and affiliated companies | 2,673 | 2,743 | 201 | (271) | ||||||||||||||||||||||
| Less: Profit (loss) attributable to noncontrolling interests | (3) | (2) | — | (1) | 5 | |||||||||||||||||||||
Profit 6 |
$ | 2,676 | $ | 2,745 | $ | 201 | $ | (270) | ||||||||||||||||||
| 1 | Elimination of Financial Products’ revenues earned from ME&T. |
||||
| 2 | Elimination of net expenses recorded between ME&T and Financial Products. | ||||
| 3 | Elimination of discount recorded by ME&T on receivables sold to Financial Products and of interest earned between ME&T and Financial Products as well as dividends paid by Financial Products to ME&T. |
||||
| 4 | Elimination of equity profit (loss) earned from Financial Products’ subsidiaries partially owned by ME&T subsidiaries. |
||||
| 5 | Elimination of noncontrolling interest profit (loss) recorded by Financial Products for subsidiaries partially owned by ME&T subsidiaries. |
||||
| 6 | Profit attributable to common shareholders. | ||||
| Supplemental Consolidating Data | ||||||||||||||||||||||||||
| Consolidated | Machinery, Energy & Transportation | Financial Products |
Consolidating Adjustments |
|||||||||||||||||||||||
| Sales and revenues: | ||||||||||||||||||||||||||
| Sales of Machinery, Energy & Transportation | $ | 15,871 | $ | 15,871 | $ | — | $ | — | ||||||||||||||||||
| Revenues of Financial Products | 726 | — | 883 | (157) | 1 | |||||||||||||||||||||
| Total sales and revenues | 16,597 | 15,871 | 883 | (157) | ||||||||||||||||||||||
| Operating costs: | ||||||||||||||||||||||||||
| Cost of goods sold | 11,614 | 11,615 | — | (1) | 2 | |||||||||||||||||||||
| Selling, general and administrative expenses | 1,479 | 1,285 | 197 | (3) | 2 | |||||||||||||||||||||
| Research and development expenses | 401 | 401 | — | — | ||||||||||||||||||||||
| Interest expense of Financial Products | 188 | — | 188 | — | ||||||||||||||||||||||
| Goodwill impairment charge | 925 | 925 | — | — | ||||||||||||||||||||||
| Other operating (income) expenses | 310 | 16 | 313 | (19) | 2 | |||||||||||||||||||||
| Total operating costs | 14,917 | 14,242 | 698 | (23) | ||||||||||||||||||||||
| Operating profit | 1,680 | 1,629 | 185 | (134) | ||||||||||||||||||||||
| Interest expense excluding Financial Products | 117 | 117 | — | — | ||||||||||||||||||||||
| Other income (expense) | 536 | 877 | — | (341) | 3 | |||||||||||||||||||||
| Consolidated profit before taxes | 2,099 | 2,389 | 185 | (475) | ||||||||||||||||||||||
| Provision (benefit) for income taxes | 644 | 608 | 36 | — | ||||||||||||||||||||||
| Profit of consolidated companies | 1,455 | 1,781 | 149 | (475) | ||||||||||||||||||||||
| Equity in profit (loss) of unconsolidated affiliated companies | (1) | — | — | (1) | 4 | |||||||||||||||||||||
| Profit of consolidated and affiliated companies | 1,454 | 1,781 | 149 | (476) | ||||||||||||||||||||||
| Less: Profit (loss) attributable to noncontrolling interests | — | — | 1 | (1) | 5 | |||||||||||||||||||||
Profit 6 |
$ | 1,454 | $ | 1,781 | $ | 148 | $ | (475) | ||||||||||||||||||
| 1 | Elimination of Financial Products’ revenues earned from ME&T. |
||||
| 2 | Elimination of net expenses recorded by ME&T paid to Financial Products. |
||||
| 3 | Elimination of discount recorded by ME&T on receivables sold to Financial Products and of interest earned between ME&T and Financial Products as well as dividends paid by Financial Products to ME&T. |
||||
| 4 | Elimination of equity profit (loss) earned from Financial Products’ subsidiaries partially owned by ME&T subsidiaries. |
||||
| 5 | Elimination of noncontrolling interest profit (loss) recorded by Financial Products for subsidiaries partially owned by ME&T subsidiaries. |
||||
| 6 | Profit attributable to common shareholders. | ||||
| Supplemental Consolidating Data | ||||||||||||||||||||||||||
| Consolidated | Machinery, Energy & Transportation | Financial Products |
Consolidating Adjustments |
|||||||||||||||||||||||
| Sales and revenues: | ||||||||||||||||||||||||||
| Sales of Machinery, Energy & Transportation | $ | 63,869 | $ | 63,869 | $ | — | $ | — | ||||||||||||||||||
| Revenues of Financial Products | 3,191 | — | 3,927 | (736) | 1 | |||||||||||||||||||||
| Total sales and revenues | 67,060 | 63,869 | 3,927 | (736) | ||||||||||||||||||||||
| Operating costs: | ||||||||||||||||||||||||||
| Cost of goods sold | 42,767 | 42,776 | — | (9) | 2 | |||||||||||||||||||||
| Selling, general and administrative expenses | 6,371 | 5,696 | 704 | (29) | 2 | |||||||||||||||||||||
| Research and development expenses | 2,108 | 2,108 | — | — | ||||||||||||||||||||||
| Interest expense of Financial Products | 1,030 | — | 1,032 | (2) | 2 | |||||||||||||||||||||
| Other operating (income) expenses | 1,818 | 630 | 1,268 | (80) | 2 | |||||||||||||||||||||
| Total operating costs | 54,094 | 51,210 | 3,004 | (120) | ||||||||||||||||||||||
| Operating profit | 12,966 | 12,659 | 923 | (616) | ||||||||||||||||||||||
| Interest expense excluding Financial Products | 511 | 511 | — | — | ||||||||||||||||||||||
| Other income (expense) | 595 | 340 | (16) | 271 | 3 | |||||||||||||||||||||
| Consolidated profit before taxes | 13,050 | 12,488 | 907 | (345) | ||||||||||||||||||||||
| Provision (benefit) for income taxes | 2,781 | 2,560 | 221 | — | ||||||||||||||||||||||
| Profit of consolidated companies | 10,269 | 9,928 | 686 | (345) | ||||||||||||||||||||||
| Equity in profit (loss) of unconsolidated affiliated companies | 63 | 67 | — | (4) | 4 | |||||||||||||||||||||
| Profit of consolidated and affiliated companies | 10,332 | 9,995 | 686 | (349) | ||||||||||||||||||||||
| Less: Profit (loss) attributable to noncontrolling interests | (3) | (4) | 5 | (4) | 5 | |||||||||||||||||||||
Profit 6 |
$ | 10,335 | $ | 9,999 | $ | 681 | $ | (345) | ||||||||||||||||||
| 1 | Elimination of Financial Products’ revenues earned from ME&T. |
||||
| 2 | Elimination of net expenses recorded between ME&T and Financial Products. |
||||
| 3 | Elimination of discount recorded by ME&T on receivables sold to Financial Products and of interest earned between ME&T and Financial Products as well as dividends paid by Financial Products to ME&T. |
||||
| 4 | Elimination of equity profit (loss) earned from Financial Products’ subsidiaries partially owned by ME&T subsidiaries. |
||||
| 5 | Elimination of noncontrolling interest profit (loss) recorded by Financial Products for subsidiaries partially owned by ME&T subsidiaries. |
||||
| 6 | Profit attributable to common shareholders. | ||||
| Supplemental Consolidating Data | ||||||||||||||||||||||||||
| Consolidated | Machinery, Energy & Transportation | Financial Products |
Consolidating Adjustments |
|||||||||||||||||||||||
| Sales and revenues: | ||||||||||||||||||||||||||
| Sales of Machinery, Energy & Transportation | $ | 56,574 | $ | 56,574 | $ | — | $ | — | ||||||||||||||||||
| Revenues of Financial Products | 2,853 | — | 3,376 | (523) | 1 | |||||||||||||||||||||
| Total sales and revenues | 59,427 | 56,574 | 3,376 | (523) | ||||||||||||||||||||||
| Operating costs: | ||||||||||||||||||||||||||
| Cost of goods sold | 41,350 | 41,356 | — | (6) | 2 | |||||||||||||||||||||
| Selling, general and administrative expenses | 5,651 | 4,999 | 672 | (20) | 2 | |||||||||||||||||||||
| Research and development expenses | 1,814 | 1,814 | — | — | ||||||||||||||||||||||
| Interest expense of Financial Products | 565 | — | 565 | — | ||||||||||||||||||||||
| Goodwill impairment charge | 925 | 925 | — | — | ||||||||||||||||||||||
| Other operating (income) expenses | 1,218 | 47 | 1,249 | (78) | 2 | |||||||||||||||||||||
| Total operating costs | 51,523 | 49,141 | 2,486 | (104) | ||||||||||||||||||||||
| Operating profit | 7,904 | 7,433 | 890 | (419) | ||||||||||||||||||||||
| Interest expense excluding Financial Products | 443 | 444 | — | (1) | 3 | |||||||||||||||||||||
| Other income (expense) | 1,291 | 1,374 | (26) | (57) | 4 | |||||||||||||||||||||
| Consolidated profit before taxes | 8,752 | 8,363 | 864 | (475) | ||||||||||||||||||||||
| Provision (benefit) for income taxes | 2,067 | 1,858 | 209 | — | ||||||||||||||||||||||
| Profit of consolidated companies | 6,685 | 6,505 | 655 | (475) | ||||||||||||||||||||||
| Equity in profit (loss) of unconsolidated affiliated companies | 19 | 26 | — | (7) | 5 | |||||||||||||||||||||
| Profit of consolidated and affiliated companies | 6,704 | 6,531 | 655 | (482) | ||||||||||||||||||||||
| Less: Profit (loss) attributable to noncontrolling interests | (1) | (1) | 7 | (7) | 6 | |||||||||||||||||||||
Profit 7 |
$ | 6,705 | $ | 6,532 | $ | 648 | $ | (475) | ||||||||||||||||||
| 1 | Elimination of Financial Products’ revenues earned from ME&T. |
||||
| 2 | Elimination of net expenses recorded by ME&T paid to Financial Products. |
||||
| 3 | Elimination of interest expense recorded between Financial Products and ME&T. | ||||
| 4 | Elimination of discount recorded by ME&T on receivables sold to Financial Products and of interest earned between ME&T and Financial Products as well as dividends paid by Financial Products to ME&T. |
||||
| 5 | Elimination of equity profit (loss) earned from Financial Products’ subsidiaries partially owned by ME&T subsidiaries. |
||||
| 6 | Elimination of noncontrolling interest profit (loss) recorded by Financial Products for subsidiaries partially owned by ME&T subsidiaries. |
||||
| 7 | Profit attributable to common shareholders. | ||||
| Supplemental Consolidating Data | ||||||||||||||||||||||||||
| Consolidated | Machinery, Energy & Transportation |
Financial Products |
Consolidating Adjustments |
|||||||||||||||||||||||
| Assets | ||||||||||||||||||||||||||
| Current assets: | ||||||||||||||||||||||||||
| Cash and cash equivalents | $ | 6,978 | $ | 6,106 | $ | 872 | $ | — | ||||||||||||||||||
| Receivables – trade and other | 9,310 | 3,971 | 570 | 4,769 | 1,2 |
|||||||||||||||||||||
| Receivables – finance | 9,510 | — | 14,499 | (4,989) | 2 | |||||||||||||||||||||
| Prepaid expenses and other current assets | 4,586 | 4,327 | 341 | (82) | 3 | |||||||||||||||||||||
| Inventories | 16,565 | 16,565 | — | — | ||||||||||||||||||||||
| Total current assets | 46,949 | 30,969 | 16,282 | (302) | ||||||||||||||||||||||
| Property, plant and equipment – net | 12,680 | 8,694 | 3,986 | — | ||||||||||||||||||||||
| Long-term receivables – trade and other | 1,238 | 565 | 85 | 588 | 1,2 |
|||||||||||||||||||||
| Long-term receivables – finance | 12,664 | — | 13,299 | (635) | 2 | |||||||||||||||||||||
| Noncurrent deferred and refundable income taxes | 2,816 | 3,360 | 148 | (692) | 4 | |||||||||||||||||||||
| Intangible assets | 564 | 564 | — | — | ||||||||||||||||||||||
| Goodwill | 5,308 | 5,308 | — | — | ||||||||||||||||||||||
| Other assets | 5,257 | 4,218 | 2,082 | (1,043) | 5 | |||||||||||||||||||||
| Total assets | $ | 87,476 | $ | 53,678 | $ | 35,882 | $ | (2,084) | ||||||||||||||||||
| Liabilities | ||||||||||||||||||||||||||
| Current liabilities: | ||||||||||||||||||||||||||
| Short-term borrowings | $ | 4,643 | $ | — | $ | 4,643 | $ | — | ||||||||||||||||||
| Accounts payable | 7,906 | 7,827 | 314 | (235) | 6,7 | |||||||||||||||||||||
| Accrued expenses | 4,958 | 4,361 | 597 | — | ||||||||||||||||||||||
| Accrued wages, salaries and employee benefits | 2,757 | 2,696 | 61 | — | ||||||||||||||||||||||
| Customer advances | 1,929 | 1,912 | 2 | 15 | 7 | |||||||||||||||||||||
| Dividends payable | 649 | 649 | — | — | ||||||||||||||||||||||
| Other current liabilities | 3,123 | 2,583 | 647 | (107) | 4,8 |
|||||||||||||||||||||
| Long-term debt due within one year | 8,763 | 1,044 | 7,719 | — | ||||||||||||||||||||||
| Total current liabilities | 34,728 | 21,072 | 13,983 | (327) | ||||||||||||||||||||||
| Long-term debt due after one year | 24,472 | 8,626 | 15,893 | (47) | 9 | |||||||||||||||||||||
| Liability for postemployment benefits | 4,098 | 4,098 | — | — | ||||||||||||||||||||||
| Other liabilities | 4,675 | 3,806 | 1,607 | (738) | 4 | |||||||||||||||||||||
| Total liabilities | 67,973 | 37,602 | 31,483 | (1,112) | ||||||||||||||||||||||
| Shareholders’ equity | ||||||||||||||||||||||||||
| Common stock | 6,403 | 6,403 | 905 | (905) | 10 | |||||||||||||||||||||
| Treasury stock | (36,339) | (36,339) | — | — | ||||||||||||||||||||||
| Profit employed in the business | 51,250 | 46,783 | 4,457 | 10 | 10 | |||||||||||||||||||||
| Accumulated other comprehensive income (loss) | (1,820) | (783) | (1,037) | — | ||||||||||||||||||||||
| Noncontrolling interests | 9 | 12 | 74 | (77) | 10 | |||||||||||||||||||||
| Total shareholders’ equity | 19,503 | 16,076 | 4,399 | (972) | ||||||||||||||||||||||
| Total liabilities and shareholders’ equity | $ | 87,476 | $ | 53,678 | $ | 35,882 | $ | (2,084) | ||||||||||||||||||
| 1 | Elimination of receivables between ME&T and Financial Products. |
||||
| 2 | Reclassification of ME&T’s trade receivables purchased by Financial Products and Financial Products’ wholesale inventory receivables. |
||||
| 3 | Elimination of ME&T's insurance premiums that are prepaid to Financial Products. | ||||
| 4 | Reclassification reflecting required netting of deferred tax assets/liabilities by taxing jurisdiction. |
||||
| 5 | Elimination of other intercompany assets between ME&T and Financial Products. |
||||
| 6 | Elimination of payables between ME&T and Financial Products. |
||||
| 7 | Reclassification of Financial Products' payables to accrued expenses or customer advances | ||||
| 8 | Elimination of prepaid insurance in Financial Products’ other liabilities. | ||||
| 9 | Elimination of debt between ME&T and Financial Products. |
||||
| 10 | Eliminations associated with ME&T’s investments in Financial Products’ subsidiaries. |
||||
| Supplemental Consolidating Data | ||||||||||||||||||||||||||
| Consolidated | Machinery, Energy & Transportation |
Financial Products |
Consolidating Adjustments |
|||||||||||||||||||||||
| Assets | ||||||||||||||||||||||||||
| Current assets: | ||||||||||||||||||||||||||
| Cash and cash equivalents | $ | 7,004 | $ | 6,042 | $ | 962 | $ | — | ||||||||||||||||||
| Receivables – trade and other | 8,856 | 3,710 | 519 | 4,627 | 1,2 |
|||||||||||||||||||||
| Receivables – finance | 9,013 | — | 13,902 | (4,889) | 2 | |||||||||||||||||||||
| Prepaid expenses and other current assets | 2,642 | 2,488 | 290 | (136) | 3 | |||||||||||||||||||||
| Inventories | 16,270 | 16,270 | — | — | ||||||||||||||||||||||
| Total current assets | 43,785 | 28,510 | 15,673 | (398) | ||||||||||||||||||||||
| Property, plant and equipment – net | 12,028 | 8,186 | 3,842 | — | ||||||||||||||||||||||
| Long-term receivables – trade and other | 1,265 | 418 | 339 | 508 | 1,2 |
|||||||||||||||||||||
| Long-term receivables – finance | 12,013 | — | 12,552 | (539) | 2 | |||||||||||||||||||||
| Noncurrent deferred and refundable income taxes | 2,213 | 2,755 | 115 | (657) | 4 | |||||||||||||||||||||
| Intangible assets | 758 | 758 | — | — | ||||||||||||||||||||||
| Goodwill | 5,288 | 5,288 | — | — | ||||||||||||||||||||||
| Other assets | 4,593 | 3,882 | 1,892 | (1,181) | 5 | |||||||||||||||||||||
| Total assets | $ | 81,943 | $ | 49,797 | $ | 34,413 | $ | (2,267) | ||||||||||||||||||
| Liabilities | ||||||||||||||||||||||||||
| Current liabilities: | ||||||||||||||||||||||||||
| Short-term borrowings | $ | 5,957 | $ | 3 | $ | 5,954 | $ | — | ||||||||||||||||||
| Accounts payable | 8,689 | 8,657 | 294 | (262) | 6 | |||||||||||||||||||||
| Accrued expenses | 4,080 | 3,687 | 393 | — | ||||||||||||||||||||||
| Accrued wages, salaries and employee benefits | 2,313 | 2,264 | 49 | — | ||||||||||||||||||||||
| Customer advances | 1,860 | 1,860 | — | — | ||||||||||||||||||||||
| Dividends payable | 620 | 620 | — | — | ||||||||||||||||||||||
| Other current liabilities | 2,690 | 2,215 | 635 | (160) | 4,7 |
|||||||||||||||||||||
| Long-term debt due within one year | 5,322 | 120 | 5,202 | — | ||||||||||||||||||||||
| Total current liabilities | 31,531 | 19,426 | 12,527 | (422) | ||||||||||||||||||||||
| Long-term debt due after one year | 25,714 | 9,529 | 16,216 | (31) | 8 | |||||||||||||||||||||
| Liability for postemployment benefits | 4,203 | 4,203 | — | — | ||||||||||||||||||||||
| Other liabilities | 4,604 | 3,677 | 1,638 | (711) | 4 | |||||||||||||||||||||
| Total liabilities | 66,052 | 36,835 | 30,381 | (1,164) | ||||||||||||||||||||||
| Shareholders’ equity | ||||||||||||||||||||||||||
| Common stock | 6,560 | 6,560 | 905 | (905) | 9 | |||||||||||||||||||||
| Treasury stock | (31,748) | (31,748) | — | — | ||||||||||||||||||||||
| Profit employed in the business | 43,514 | 39,435 | 4,068 | 11 | 9 | |||||||||||||||||||||
| Accumulated other comprehensive income (loss) | (2,457) | (1,310) | (1,147) | — | ||||||||||||||||||||||
| Noncontrolling interests | 22 | 25 | 206 | (209) | 9 | |||||||||||||||||||||
| Total shareholders’ equity | 15,891 | 12,962 | 4,032 | (1,103) | ||||||||||||||||||||||
| Total liabilities and shareholders’ equity | $ | 81,943 | $ | 49,797 | $ | 34,413 | $ | (2,267) | ||||||||||||||||||
| 1 | Elimination of receivables between ME&T and Financial Products. |
||||
| 2 | Reclassification of ME&T’s trade receivables purchased by Financial Products and Financial Products’ wholesale inventory receivables. |
||||
| 3 | Elimination of ME&T’s insurance premiums that are prepaid to Financial Products. | ||||
| 4 | Reclassification reflecting required netting of deferred tax assets/liabilities by taxing jurisdiction. |
||||
| 5 | Elimination of other intercompany assets between ME&T and Financial Products. |
||||
| 6 | Elimination of payables between ME&T and Financial Products. |
||||
| 7 | Elimination of prepaid insurance in Financial Products’ other liabilities. | ||||
| 8 | Elimination of debt between ME&T and Financial Products. |
||||
| 9 | Eliminations associated with ME&T’s investments in Financial Products’ subsidiaries. |
||||
| Supplemental Consolidating Data | ||||||||||||||||||||||||||
| Consolidated | Machinery, Energy & Transportation | Financial Products |
Consolidating Adjustments |
|||||||||||||||||||||||
| Cash flow from operating activities: | ||||||||||||||||||||||||||
| Profit of consolidated and affiliated companies | $ | 10,332 | $ | 9,995 | $ | 686 | $ | (349) | 1,5 | |||||||||||||||||
| Adjustments for non-cash items: | ||||||||||||||||||||||||||
| Depreciation and amortization | 2,144 | 1,361 | 783 | — | ||||||||||||||||||||||
| Actuarial (gain) loss on pension and postretirement benefits | (97) | (97) | — | — | ||||||||||||||||||||||
| Provision (benefit) for deferred income taxes | (592) | (576) | (16) | — | ||||||||||||||||||||||
| Loss on divestiture | 572 | 572 | — | — | ||||||||||||||||||||||
| Other | 375 | 444 | (577) | 508 | 2 | |||||||||||||||||||||
| Changes in assets and liabilities, net of acquisitions and divestitures: | ||||||||||||||||||||||||||
| Receivables – trade and other | (437) | (367) | 61 | (131) | 2,3 |
|||||||||||||||||||||
| Inventories | (364) | (360) | — | (4) | 2 | |||||||||||||||||||||
| Accounts payable | (754) | (836) | 41 | 41 | 2 | |||||||||||||||||||||
| Accrued expenses | 796 | 690 | 106 | — | ||||||||||||||||||||||
| Accrued wages, salaries and employee benefits | 486 | 474 | 12 | — | ||||||||||||||||||||||
| Customer advances | 80 | 78 | 2 | — | ||||||||||||||||||||||
| Other assets – net | (95) | 94 | (110) | (79) | 2 | |||||||||||||||||||||
| Other liabilities – net | 439 | 216 | 118 | 105 | 2 | |||||||||||||||||||||
| Net cash provided by (used for) operating activities | 12,885 | 11,688 | 1,106 | 91 | ||||||||||||||||||||||
| Cash flow from investing activities: | ||||||||||||||||||||||||||
| Capital expenditures – excluding equipment leased to others | (1,597) | (1,624) | (22) | 49 | 2 | |||||||||||||||||||||
| Expenditures for equipment leased to others | (1,495) | (39) | (1,466) | 10 | 2 | |||||||||||||||||||||
| Proceeds from disposals of leased assets and property, plant and equipment | 781 | 55 | 781 | (55) | 2 | |||||||||||||||||||||
| Additions to finance receivables | (15,161) | — | (17,321) | 2,160 | 3 | |||||||||||||||||||||
| Collections of finance receivables | 14,034 | — | 15,634 | (1,600) | 3 | |||||||||||||||||||||
| Net intercompany purchased receivables | — | — | 1,080 | (1,080) | 3 | |||||||||||||||||||||
| Proceeds from sale of finance receivables | 63 | — | 63 | — | ||||||||||||||||||||||
| Net intercompany borrowings | — | — | 10 | (10) | 4 | |||||||||||||||||||||
| Investments and acquisitions (net of cash acquired) | (75) | (75) | — | — | ||||||||||||||||||||||
| Proceeds from sale of businesses and investments (net of cash sold) | (4) | (4) | — | — | ||||||||||||||||||||||
| Proceeds from maturities and sale of securities | 1,891 | 1,642 | 249 | — | ||||||||||||||||||||||
| Investments in securities | (4,405) | (3,982) | (423) | — | ||||||||||||||||||||||
| Other – net | 97 | 106 | (9) | — | ||||||||||||||||||||||
| Net cash provided by (used for) investing activities | (5,871) | (3,921) | (1,424) | (526) | ||||||||||||||||||||||
| Cash flow from financing activities: | ||||||||||||||||||||||||||
| Dividends paid | (2,563) | (2,563) | (425) | 425 | 5 | |||||||||||||||||||||
| Common stock issued, including treasury shares reissued | 12 | 12 | — | — | ||||||||||||||||||||||
| Common shares repurchased | (4,975) | (4,975) | — | — | ||||||||||||||||||||||
| Net intercompany borrowings | — | (10) | — | 10 | 4 | |||||||||||||||||||||
| Proceeds from debt issued > 90 days | 8,257 | — | 8,257 | — | ||||||||||||||||||||||
| Payments on debt > 90 days | (6,318) | (106) | (6,212) | — | ||||||||||||||||||||||
| Short-term borrowings – net < 90 days | (1,345) | (3) | (1,342) | — | ||||||||||||||||||||||
| Net cash provided by (used for) financing activities | (6,932) | (7,645) | 278 | 435 | ||||||||||||||||||||||
| Effect of exchange rate changes on cash | (110) | (60) | (50) | — | ||||||||||||||||||||||
| Increase (decrease) in cash, cash equivalents and restricted cash | (28) | 62 | (90) | — | ||||||||||||||||||||||
| Cash, cash equivalents and restricted cash at beginning of period | 7,013 | 6,049 | 964 | — | ||||||||||||||||||||||
| Cash, cash equivalents and restricted cash at end of period | $ | 6,985 | $ | 6,111 | $ | 874 | $ | — | ||||||||||||||||||
| 1 | Elimination of equity profit earned from Financial Products' subsidiaries partially owned by ME&T subsidiaries. | ||||
| 2 | Elimination of non-cash adjustments and changes in assets and liabilities related to consolidated reporting. | ||||
| 3 | Reclassification of Financial Products’ cash flow activity from investing to operating for receivables that arose from the sale of inventory. | ||||
| 4 | Elimination of net proceeds and payments to/from ME&T and Financial Products. | ||||
| 5 | Elimination of dividend activity between Financial Products and ME&T. | ||||
| Supplemental Consolidating Data | ||||||||||||||||||||||||||
| Consolidated | Machinery, Energy & Transportation | Financial Products |
Consolidating Adjustments |
|||||||||||||||||||||||
| Cash flow from operating activities: | ||||||||||||||||||||||||||
| Profit of consolidated and affiliated companies | $ | 6,704 | $ | 6,531 | $ | 655 | $ | (482) | 1,5 | |||||||||||||||||
| Adjustments for non-cash items: | ||||||||||||||||||||||||||
| Depreciation and amortization | 2,219 | 1,439 | 780 | — | ||||||||||||||||||||||
| Actuarial (gain) loss on pension and postretirement benefits | (606) | (606) | — | — | ||||||||||||||||||||||
| Provision (benefit) for deferred income taxes |
(377) | (368) | (9) | — | ||||||||||||||||||||||
| Goodwill impairment charge | 925 | 925 | — | — | ||||||||||||||||||||||
| Other | 701 | 452 | (205) | 454 | 2 | |||||||||||||||||||||
| Changes in assets and liabilities, net of acquisitions and divestitures: | ||||||||||||||||||||||||||
| Receivables – trade and other | (220) | (390) | 143 | 27 | 2,3 |
|||||||||||||||||||||
| Inventories | (2,589) | (2,572) | — | (17) | 2 | |||||||||||||||||||||
| Accounts payable | 798 | 811 | 82 | (95) | 2 | |||||||||||||||||||||
| Accrued expenses | 317 | 274 | 43 | — | ||||||||||||||||||||||
| Accrued wages, salaries and employee benefits | 90 | 97 | (7) | — | ||||||||||||||||||||||
| Customer advances | 768 | 769 | (1) | — | ||||||||||||||||||||||
| Other assets – net | (210) | (183) | (35) | 8 | 2 | |||||||||||||||||||||
| Other liabilities – net | (754) | (821) | 71 | (4) | 2 | |||||||||||||||||||||
| Net cash provided by (used for) operating activities | 7,766 | 6,358 | 1,517 | (109) | ||||||||||||||||||||||
| Cash flow from investing activities: | ||||||||||||||||||||||||||
| Capital expenditures – excluding equipment leased to others | (1,296) | (1,279) | (20) | 3 | 2 | |||||||||||||||||||||
| Expenditures for equipment leased to others | (1,303) | (19) | (1,310) | 26 | 2 | |||||||||||||||||||||
| Proceeds from disposals of leased assets and property, plant and equipment | 830 | 78 | 764 | (12) | 2 | |||||||||||||||||||||
| Additions to finance receivables | (13,239) | — | (14,223) | 984 | 3 | |||||||||||||||||||||
| Collections of finance receivables | 13,177 | — | 14,052 | (875) | 3 | |||||||||||||||||||||
| Net intercompany purchased receivables | — | — | 492 | (492) | 3 | |||||||||||||||||||||
| Proceeds from sale of finance receivables | 57 | — | 57 | — | ||||||||||||||||||||||
| Net intercompany borrowings | — | — | 9 | (9) | 4 | |||||||||||||||||||||
| Investments and acquisitions (net of cash acquired) | (88) | (88) | — | — | ||||||||||||||||||||||
| Proceeds from sale of businesses and investments (net of cash sold) | 1 | 1 | — | — | ||||||||||||||||||||||
| Proceeds from maturities and sale of securities | 2,383 | 1,948 | 435 | — | ||||||||||||||||||||||
| Investments in securities | (3,077) | (2,549) | (528) | — | ||||||||||||||||||||||
| Other – net | 14 | 98 | (84) | — | ||||||||||||||||||||||
| Net cash provided by (used for) investing activities | (2,541) | (1,810) | (356) | (375) | ||||||||||||||||||||||
| Cash flow from financing activities: | ||||||||||||||||||||||||||
| Dividends paid | (2,440) | (2,440) | (475) | 475 | 5 | |||||||||||||||||||||
| Common stock issued, including treasury shares reissued | 51 | 51 | — | — | ||||||||||||||||||||||
| Common shares repurchased | (4,230) | (4,230) | — | — | ||||||||||||||||||||||
| Net intercompany borrowings | — | (9) | — | 9 | 4 | |||||||||||||||||||||
| Proceeds from debt issued > 90 days | 6,674 | — | 6,674 | — | ||||||||||||||||||||||
| Payments on debt > 90 days | (7,728) | (25) | (7,703) | — | ||||||||||||||||||||||
| Short-term borrowings – net < 90 days | 402 | (138) | 540 | — | ||||||||||||||||||||||
| Other – net | (10) | (10) | — | — | ||||||||||||||||||||||
| Net cash provided by (used for) financing activities | (7,281) | (6,801) | (964) | 484 | ||||||||||||||||||||||
| Effect of exchange rate changes on cash | (194) | (131) | (63) | — | ||||||||||||||||||||||
| Increase (decrease) in cash, cash equivalents and restricted cash | (2,250) | (2,384) | 134 | — | ||||||||||||||||||||||
| Cash, cash equivalents and restricted cash at beginning of period | 9,263 | 8,433 | 830 | — | ||||||||||||||||||||||
| Cash, cash equivalents and restricted cash at end of period | $ | 7,013 | $ | 6,049 | $ | 964 | $ | — | ||||||||||||||||||
| 1 | Elimination of equity profit earned from Financial Products' subsidiaries partially owned by ME&T subsidiaries. | ||||
| 2 | Elimination of non-cash adjustments and changes in assets and liabilities related to consolidated reporting. | ||||
| 3 | Reclassification of Financial Products’ cash flow activity from investing to operating for receivables that arose from the sale of inventory. | ||||
| 4 | Elimination of net proceeds and payments to/from ME&T and Financial Products. | ||||
| 5 | Elimination of dividend activity between Financial Products and ME&T. | ||||
| Caterpillar Inc. Quarterly Retail Sales Statistics |
|||||||||||||||||
| Machines and E&T Combined | 4th Quarter 2023 | 3rd Quarter 2023 | 2nd Quarter 2023 | 1st Quarter 2023 | |||||||||||||
| World | UP 8% | UP 13% | UP 16% | UP 13% | |||||||||||||
| Machines | 4th Quarter 2023 | 3rd Quarter 2023 | 2nd Quarter 2023 | 1st Quarter 2023 | |||||||||||||
| Asia/Pacific | DOWN 5% | DOWN 14% | UP 2% | DOWN 14% | |||||||||||||
| EAME | DOWN 3% | DOWN 1% | DOWN 10% | UP 13% | |||||||||||||
| Latin America | DOWN 1% | DOWN 5% | UNCHANGED | DOWN 6% | |||||||||||||
| North America | UP 11% | UP 25% | UP 21% | UP 15% | |||||||||||||
| World | UP 3% | UP 7% | UP 8% | UP 5% | |||||||||||||
| Resource Industries (RI) | 4th Quarter 2023 | 3rd Quarter 2023 | 2nd Quarter 2023 | 1st Quarter 2023 | |||||||||||||
| Asia/Pacific | DOWN 1% | DOWN 10% | UP 31% | DOWN 12% | |||||||||||||
| EAME | UP 1% | DOWN 6% | DOWN 10% | UP 27% | |||||||||||||
| Latin America | UP 1% | UP 3% | UP 28% | DOWN 12% | |||||||||||||
| North America | UP 3% | UP 49% | UP 47% | UP 56% | |||||||||||||
| World | UP 1% | UP 10% | UP 26% | UP 18% | |||||||||||||
| Construction Industries (CI) | 4th Quarter 2023 | 3rd Quarter 2023 | 2nd Quarter 2023 | 1st Quarter 2023 | |||||||||||||
| Asia/Pacific | DOWN 8% | DOWN 17% | DOWN 14% | DOWN 15% | |||||||||||||
| EAME | DOWN 5% | UP 1% | DOWN 9% | UP 7% | |||||||||||||
| Latin America | DOWN 1% | DOWN 9% | DOWN 8% | DOWN 4% | |||||||||||||
| North America | UP 13% | UP 20% | UP 16% | UP 5% | |||||||||||||
| World | UP 4% | UP 6% | UP 3% | UNCHANGED | |||||||||||||
| Reported in dollars and based on unit sales as reported primarily by dealers. | |||||||||||||||||
Energy & Transportation (E&T) Retail Sales by industry for the quarter ended as indicated compared with the same period of the prior year: |
|||||||||||||||||
| Energy & Transportation (E&T) | 4th Quarter 2023 | 3rd Quarter 2023 | 2nd Quarter 2023 | 1st Quarter 2023 | |||||||||||||
| Power Gen | UP 26% | UP 44% | UP 30% | UP 43% | |||||||||||||
| Industrial | DOWN 21% | UP 6% | UP 39% | UP 42% | |||||||||||||
| Transportation | UP 54% | UP 3% | UP 48% | DOWN 8% | |||||||||||||
| Oil & Gas | UP 25% | UP 45% | UP 71% | UP 43% | |||||||||||||
| Total | UP 20% | UP 34% | UP 47% | UP 39% | |||||||||||||
| Reported in dollars based on reporting from dealers and direct sales. | |||||||||||||||||
· asphalt pavers |
· forestry machines |
· small and medium |
||||||
· backhoe loaders |
· material handlers |
track-type tractors |
||||||
· compactors |
· motorgraders |
· track-type loaders |
||||||
· cold planers |
· pipelayers |
· wheel excavators |
||||||
· compact track and |
· road reclaimers |
· compact, small and medium |
||||||
multi-terrain loaders |
· skid steer loaders |
wheel loaders |
||||||
· mini, small, medium |
· telehandlers |
|||||||
and large track excavators |
||||||||
· electric rope shovels |
· longwall miners |
· landfill compactors |
||||||
· draglines |
· large wheel loaders |
· soil compactors |
||||||
· hydraulic shovels |
· off-highway trucks |
· machinery components |
||||||
· rotary drills |
· articulated trucks |
· autonomous ready vehicles and |
||||||
· hard rock vehicles |
· wheel tractor scrapers |
solutions |
||||||
· large track-type tractors |
· wheel dozers |
|||||||
· large mining trucks |
||||||||