| UNITED STATES SECURITIES AND EXCHANGE COMMISSION Washington, D.C. 20549 | |||||||||||||||||||||||||||||||||||
 | |||||||||||||||||||||||||||||||||||
| FORM | 8-K | ||||||||||||||||||||||||||||||||||
| Current Report | |||||||||||||||||||||||||||||||||||
|
Pursuant to Section 13 or 15(d) of the Securities Exchange Act of 1934
| |||||||||||||||||||||||||||||||||||
| Date of Report (Date of earliest event reported): | August 2, 2022 | ||||||||||||||||||||||||||||||||||
| CATERPILLAR INC. | |||||||||||||||||||||||||||||||||||
| (Exact name of registrant as specified in its charter) | |||||||||||||||||||||||||||||||||||
| Delaware | 1-768 | 37-0602744 | |||||||||||||||||||||||||||||||||
| (State or other jurisdiction of incorporation) | (Commission File Number) |
(I.R.S Employer Identification No.) |
|||||||||||||||||||||||||||||||||
| 510 Lake Cook Road, | Suite 100, | Deerfield, | Illinois | 60015 | ||||||||||||||||||||||||||||
| (Address of principal executive offices) | (Zip Code) | |||||||||||||||||||||||||||||||
| Registrant’s telephone number, including area code: | (224) | 551-4000 | ||||||||||||||||||||||||||||||
| Former name or former address, if changed since last report: | N/A | |||||||||||||||||||||||||||||||
| ☐ | Written communications pursuant to Rule 425 under the Securities Act (17 CFR 230.425) | ||||||||||||||||||||||||||||||||||
| ☐ | Soliciting material pursuant to Rule 14a-12 under the Exchange Act (17 CFR 240.14a-12) | ||||||||||||||||||||||||||||||||||
| ☐ | Pre-commencement communications pursuant to Rule 14d-2(b) under the Exchange Act (17 CFR 240.14d-2(b)) | ||||||||||||||||||||||||||||||||||
| ☐ | Pre-commencement communications pursuant to Rule 13e-4(c) under the Exchange Act (17 CFR 240.13e-4(c)) | ||||||||||||||||||||||||||||||||||
|
Securities registered pursuant to Section 12(b) of the Act:
| |||||||||||||||||||||||||||||||||||
| Title of each class | Trading Symbol (s) | Name of each exchange which registered | |||||||||||||||||||||||||||||||||
| Common Stock ($1.00 par value) | CAT | The New York Stock Exchange | |||||||||||||||||||||||||||||||||
| 8% Debentures due February 15, 2023 | CAT23 | The New York Stock Exchange | |||||||||||||||||||||||||||||||||
| 5.3% Debentures due September 15, 2035 | CAT35 | The New York Stock Exchange | |||||||||||||||||||||||||||||||||
| Check the appropriate box below if the Form 8-K filing is intended to simultaneously satisfy the filing obligation of the registrant under any of the following provisions: | |||||||||||||||||||||||||||||||||||
| Indicate by check mark whether the registrant is an emerging growth company as defined by Rule 405 of the Securities Act of | |||||||||||||||||||||||||||||||||||
| 1933 (17 CFR §230.405 of this chapter) or Rule 12b-2 of the Securities Exchange Act of 1934 (17 CFR §240.12b-2 of this chapter). | |||||||||||||||||||||||||||||||||||
| Emerging growth company | ☐ | ||||||||||||||||||||||||||||||||||
| If an emerging growth company, indicate by check mark if the registrant has elected not to use the extended transition period | |||||||||||||||||||||||||||||||||||
| for complying with any new or revised financial accounting standards provided pursuant to Section 13(a) of the Exchange Act. | ☐ | ||||||||||||||||||||||||||||||||||
| (d) | Exhibits: | ||||||||||
| The following is furnished as an exhibit to this report: | |||||||||||
| 99.1 | |||||||||||
| 99.2 | |||||||||||
| 104 | The cover page from this Current Report on Form 8-K, formatted in Inline XBRL. | ||||||||||
|
SIGNATURES
| ||||||||
| Pursuant to the requirements of the Securities Exchange Act of 1934, the registrant has duly caused this report to be signed on its behalf by the undersigned hereunto duly authorized. | ||||||||
| CATERPILLAR INC. | ||||||||
| August 2, 2022 | By: | /s/ Suzette M. Long | ||||||
| Suzette M. Long Chief Legal Officer and General Counsel |
||||||||
| Second Quarter | |||||||||||
| ($ in billions except profit per share) | 2022 | 2021 | |||||||||
| Sales and Revenues | $14.2 | $12.9 | |||||||||
| Profit Per Share | $3.13 | $2.56 | |||||||||
| Adjusted Profit Per Share | $3.18 | $2.60 | |||||||||
| ● | Second-quarter 2022 sales and revenues increased 11% to $14.2 billion |
||||
| ● | Second-quarter 2022 profit per share of $3.13; adjusted profit per share of $3.18 |
||||
| ● | Returned $1.7 billion to shareholders through share repurchases and dividends in the quarter |
||||
| Sales and Revenues by Segment | |||||||||||||||||||||||||||||||||||||||||||||||
| (Millions of dollars) | Second Quarter 2021 | Sales Volume |
Price Realization |
Currency | Inter-Segment / Other | Second Quarter 2022 | $ Change |
% Change |
|||||||||||||||||||||||||||||||||||||||
| Construction Industries | $ | 5,656 | $ | (25) | $ | 535 | $ | (122) | $ | (11) | $ | 6,033 | $ | 377 | 7% | ||||||||||||||||||||||||||||||||
| Resource Industries | 2,547 | 140 | 317 | (33) | (10) | 2,961 | 414 | 16% | |||||||||||||||||||||||||||||||||||||||
| Energy & Transportation | 4,975 | 363 | 260 | (103) | 210 | 5,705 | 730 | 15% | |||||||||||||||||||||||||||||||||||||||
| All Other Segment | 128 | 4 | 1 | (1) | (14) | 118 | (10) | (8%) | |||||||||||||||||||||||||||||||||||||||
| Corporate Items and Eliminations | (1,113) | 17 | (8) | 1 | (175) | (1,278) | (165) | ||||||||||||||||||||||||||||||||||||||||
| Machinery, Energy & Transportation | 12,193 | 499 | 1,105 | (258) | — | 13,539 | 1,346 | 11% | |||||||||||||||||||||||||||||||||||||||
| Financial Products Segment | 774 | — | — | — | 24 | 798 | 24 | 3% | |||||||||||||||||||||||||||||||||||||||
| Corporate Items and Eliminations | (78) | — | — | — | (12) | (90) | (12) | ||||||||||||||||||||||||||||||||||||||||
| Financial Products Revenues | 696 | — | — | — | 12 | 708 | 12 | 2% | |||||||||||||||||||||||||||||||||||||||
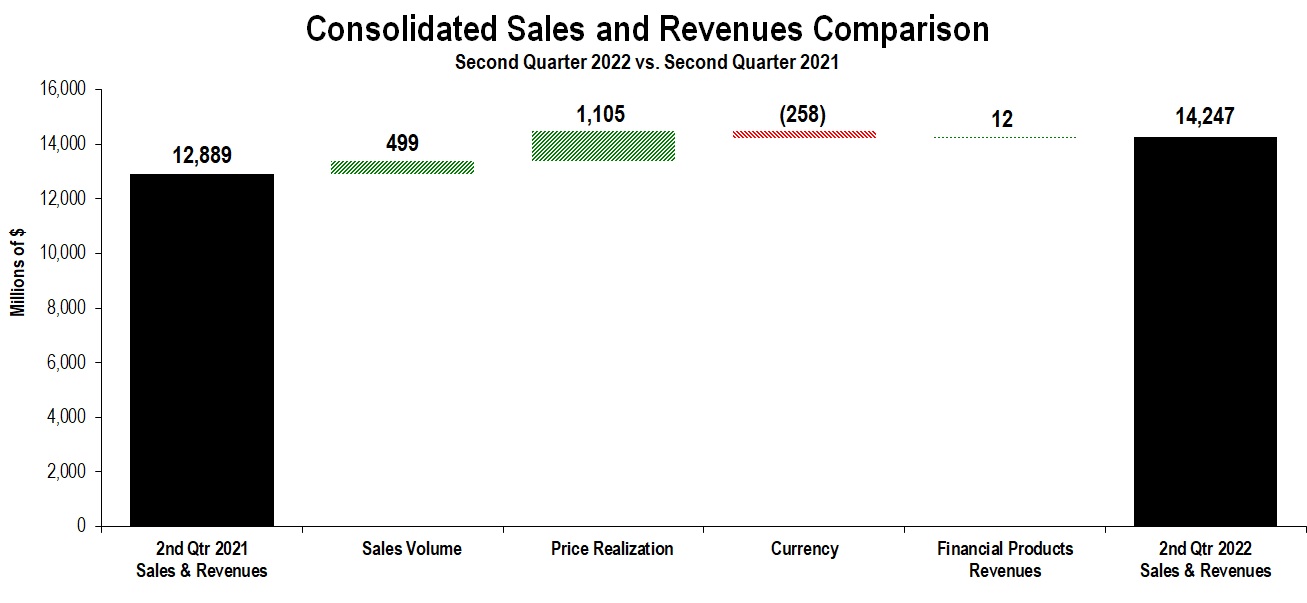
| Consolidated Sales and Revenues | $ | 12,889 | $ | 499 | $ | 1,105 | $ | (258) | $ | 12 | $ | 14,247 | $ | 1,358 | 11% | ||||||||||||||||||||||||||||||||
| Sales and Revenues by Geographic Region | |||||||||||||||||||||||||||||||||||||||||||||||||||||||||||||||||||||||||||||||||||
| North America | Latin America | EAME | Asia/Pacific | External Sales and Revenues | Inter-Segment | Total Sales and Revenues | |||||||||||||||||||||||||||||||||||||||||||||||||||||||||||||||||||||||||||||
| (Millions of dollars) | $ | % Chg | $ | % Chg | $ | % Chg | $ | % Chg | $ | % Chg | $ | % Chg | $ | % Chg | |||||||||||||||||||||||||||||||||||||||||||||||||||||||||||||||||||||
| Second Quarter 2022 | |||||||||||||||||||||||||||||||||||||||||||||||||||||||||||||||||||||||||||||||||||
| Construction Industries | $ | 3,006 | 20% | $ | 635 | 48% | $ | 1,202 | (7%) | $ | 1,148 | (17%) | $ | 5,991 | 7% | $ | 42 | (21%) | $ | 6,033 | 7% | ||||||||||||||||||||||||||||||||||||||||||||||||||||||||||||||
| Resource Industries | 1,027 | 29% | 466 | (4%) | 489 | (7%) | 913 | 38% | 2,895 | 17% | 66 | (13%) | 2,961 | 16% | |||||||||||||||||||||||||||||||||||||||||||||||||||||||||||||||||||||
| Energy & Transportation | 2,277 | 14% | 382 | 53% | 1,215 | 2% | 766 | 12% | 4,640 | 13% | 1,065 | 25% | 5,705 | 15% | |||||||||||||||||||||||||||||||||||||||||||||||||||||||||||||||||||||
| All Other Segment | 18 | 64% | — | (100%) | 5 | 25% | 15 | (17%) | 38 | 12% | 80 | (15%) | 118 | (8%) | |||||||||||||||||||||||||||||||||||||||||||||||||||||||||||||||||||||
| Corporate Items and Eliminations | (20) | (2) | — | (3) | (25) | (1,253) | (1,278) | ||||||||||||||||||||||||||||||||||||||||||||||||||||||||||||||||||||||||||||
| Machinery, Energy & Transportation | 6,308 | 20% | 1,481 | 27% | 2,911 | (3%) | 2,839 | 4% | 13,539 | 11% | — | —% | 13,539 | 11% | |||||||||||||||||||||||||||||||||||||||||||||||||||||||||||||||||||||
| Financial Products Segment | 505 | 3% | 87 | 34% | 97 | 1% | 109 | (13%) | 798 | 3% | — | —% | 798 | 3% | |||||||||||||||||||||||||||||||||||||||||||||||||||||||||||||||||||||
| Corporate Items and Eliminations | (42) | (21) | (10) | (17) | (90) | — | (90) | ||||||||||||||||||||||||||||||||||||||||||||||||||||||||||||||||||||||||||||
| Financial Products Revenues | 463 | 3% | 66 | 22% | 87 | —% | 92 | (12%) | 708 | 2% | — | —% | 708 | 2% | |||||||||||||||||||||||||||||||||||||||||||||||||||||||||||||||||||||
| Consolidated Sales and Revenues | $ | 6,771 | 18% | $ | 1,547 | 27% | $ | 2,998 | (3%) | $ | 2,931 | 3% | $ | 14,247 | 11% | $ | — | —% | $ | 14,247 | 11% | ||||||||||||||||||||||||||||||||||||||||||||||||||||||||||||||
| Second Quarter 2021 | |||||||||||||||||||||||||||||||||||||||||||||||||||||||||||||||||||||||||||||||||||
| Construction Industries | $ | 2,498 | $ | 430 | $ | 1,291 | $ | 1,384 | $ | 5,603 | $ | 53 | $ | 5,656 | |||||||||||||||||||||||||||||||||||||||||||||||||||||||||||||||||||||
| Resource Industries | 799 | 487 | 525 | 660 | 2,471 | 76 | 2,547 | ||||||||||||||||||||||||||||||||||||||||||||||||||||||||||||||||||||||||||||
| Energy & Transportation | 1,992 | 250 | 1,196 | 682 | 4,120 | 855 | 4,975 | ||||||||||||||||||||||||||||||||||||||||||||||||||||||||||||||||||||||||||||
| All Other Segment | 11 | 1 | 4 | 18 | 34 | 94 | 128 | ||||||||||||||||||||||||||||||||||||||||||||||||||||||||||||||||||||||||||||
| Corporate Items and Eliminations | (31) | (1) | (1) | (2) | (35) | (1,078) | (1,113) | ||||||||||||||||||||||||||||||||||||||||||||||||||||||||||||||||||||||||||||
| Machinery, Energy & Transportation | 5,269 | 1,167 | 3,015 | 2,742 | 12,193 | — | 12,193 | ||||||||||||||||||||||||||||||||||||||||||||||||||||||||||||||||||||||||||||
| Financial Products Segment | 488 | 65 | 96 | 125 | 774 | — | 774 | ||||||||||||||||||||||||||||||||||||||||||||||||||||||||||||||||||||||||||||
| Corporate Items and Eliminations | (38) | (11) | (9) | (20) | (78) | — | (78) | ||||||||||||||||||||||||||||||||||||||||||||||||||||||||||||||||||||||||||||
| Financial Products Revenues | 450 | 54 | 87 | 105 | 696 | — | 696 | ||||||||||||||||||||||||||||||||||||||||||||||||||||||||||||||||||||||||||||
| Consolidated Sales and Revenues | $ | 5,719 | $ | 1,221 | $ | 3,102 | $ | 2,847 | $ | 12,889 | $ | — | $ | 12,889 | |||||||||||||||||||||||||||||||||||||||||||||||||||||||||||||||||||||
| Profit (Loss) by Segment | |||||||||||||||||||||||
| (Millions of dollars) | Second Quarter 2022 | Second Quarter 2021 | $ Change |
%
Change
|
|||||||||||||||||||
| Construction Industries | $ | 989 | $ | 1,029 | $ | (40) | (4 | %) | |||||||||||||||
| Resource Industries | 355 | 349 | 6 | 2 | % | ||||||||||||||||||
| Energy & Transportation | 659 | 738 | (79) | (11 | %) | ||||||||||||||||||
| All Other Segment | 31 | (10) | 41 | n/a | |||||||||||||||||||
| Corporate Items and Eliminations | (230) | (453) | 223 | ||||||||||||||||||||
| Machinery, Energy & Transportation | 1,804 | 1,653 | 151 | 9 | % | ||||||||||||||||||
| Financial Products Segment | 217 | 243 | (26) | (11 | %) | ||||||||||||||||||
| Corporate Items and Eliminations | 17 | (29) | 46 | ||||||||||||||||||||
| Financial Products | 234 | 214 | 20 | 9 | % | ||||||||||||||||||
| Consolidating Adjustments | (94) | (78) | (16) | ||||||||||||||||||||
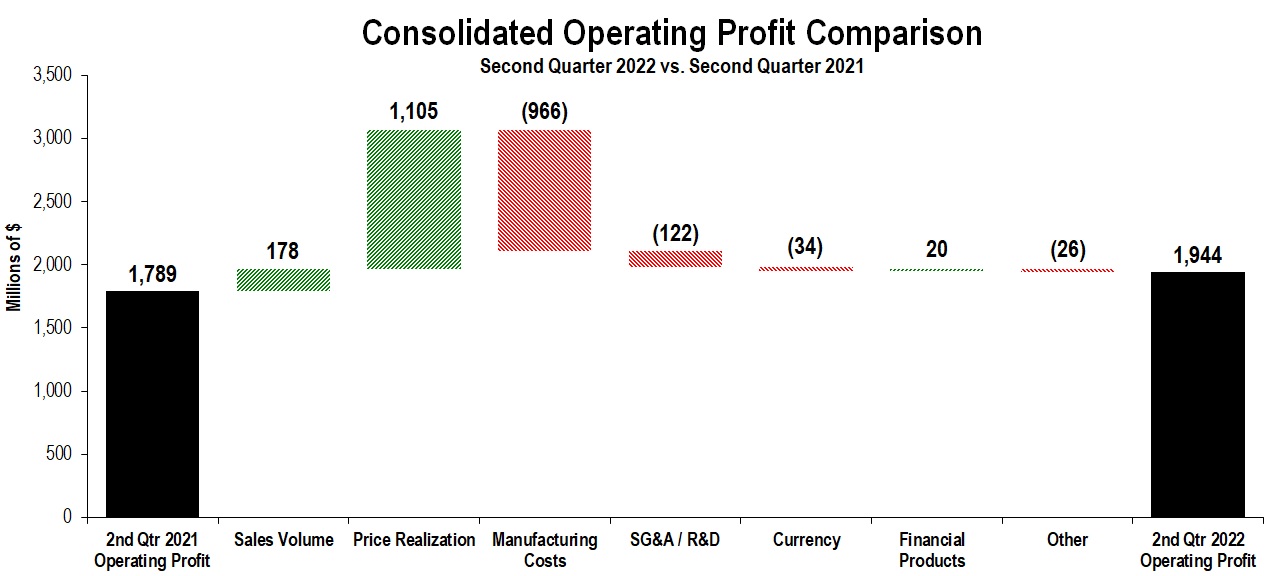
| Consolidated Operating Profit | $ | 1,944 | $ | 1,789 | $ | 155 | 9 | % | |||||||||||||||
Corporate Items and Eliminations included corporate-level expenses, timing differences (as some expenses are reported in segment profit on a cash basis), methodology differences between segment and consolidated external reporting (the company values segment inventories and cost of sales using a current cost methodology), certain restructuring costs and inter-segment eliminations. | |||||||||||||||||||||||
| CONSTRUCTION INDUSTRIES | ||||||||||||||||||||||||||||||||||||||||||||||||||
| (Millions of dollars) | ||||||||||||||||||||||||||||||||||||||||||||||||||
| Segment Sales | ||||||||||||||||||||||||||||||||||||||||||||||||||
| Second Quarter 2021 | Sales Volume | Price Realization | Currency | Inter-Segment | Second Quarter 2022 | $ Change |
% Change |
|||||||||||||||||||||||||||||||||||||||||||
| Total Sales | $ | 5,656 | $ | (25) | $ | 535 | $ | (122) | $ | (11) | $ | 6,033 | $ | 377 | 7 | % | ||||||||||||||||||||||||||||||||||
| Sales by Geographic Region | ||||||||||||||||||||||||||||||||||||||||||||||||||
| Second Quarter 2022 | Second Quarter 2021 | $ Change |
% Change |
|||||||||||||||||||||||||||||||||||||||||||||||
| North America | $ | 3,006 | $ | 2,498 | $ | 508 | 20 | % | ||||||||||||||||||||||||||||||||||||||||||
| Latin America | 635 | 430 | 205 | 48 | % | |||||||||||||||||||||||||||||||||||||||||||||
| EAME | 1,202 | 1,291 | (89) | (7 | %) | |||||||||||||||||||||||||||||||||||||||||||||
| Asia/Pacific | 1,148 | 1,384 | (236) | (17 | %) | |||||||||||||||||||||||||||||||||||||||||||||
| External Sales | 5,991 | 5,603 | 388 | 7 | % | |||||||||||||||||||||||||||||||||||||||||||||
| Inter-segment | 42 | 53 | (11) | (21 | %) | |||||||||||||||||||||||||||||||||||||||||||||
| Total Sales | $ | 6,033 | $ | 5,656 | $ | 377 | 7 | % | ||||||||||||||||||||||||||||||||||||||||||
| Segment Profit | ||||||||||||||||||||||||||||||||||||||||||||||||||
| Second Quarter 2022 | Second Quarter 2021 |
Change |
% Change |
|||||||||||||||||||||||||||||||||||||||||||||||
| Segment Profit | $ | 989 | $ | 1,029 | $ | (40) | (4 | %) | ||||||||||||||||||||||||||||||||||||||||||
| Segment Profit Margin | 16.4 | % | 18.2 | % | (1.8 | pts) | ||||||||||||||||||||||||||||||||||||||||||||
| RESOURCE INDUSTRIES | ||||||||||||||||||||||||||||||||||||||||||||||||||
| (Millions of dollars) | ||||||||||||||||||||||||||||||||||||||||||||||||||
| Segment Sales | ||||||||||||||||||||||||||||||||||||||||||||||||||
| Second Quarter 2021 | Sales Volume | Price Realization | Currency | Inter-Segment | Second Quarter 2022 | $ Change |
% Change |
|||||||||||||||||||||||||||||||||||||||||||
| Total Sales | $ | 2,547 | $ | 140 | $ | 317 | $ | (33) | $ | (10) | $ | 2,961 | $ | 414 | 16 | % | ||||||||||||||||||||||||||||||||||
| Sales by Geographic Region | ||||||||||||||||||||||||||||||||||||||||||||||||||
| Second Quarter 2022 | Second Quarter 2021 | $ Change |
% Change |
|||||||||||||||||||||||||||||||||||||||||||||||
| North America | $ | 1,027 | $ | 799 | $ | 228 | 29 | % | ||||||||||||||||||||||||||||||||||||||||||
| Latin America | 466 | 487 | (21) | (4 | %) | |||||||||||||||||||||||||||||||||||||||||||||
| EAME | 489 | 525 | (36) | (7 | %) | |||||||||||||||||||||||||||||||||||||||||||||
| Asia/Pacific | 913 | 660 | 253 | 38 | % | |||||||||||||||||||||||||||||||||||||||||||||
| External Sales | 2,895 | 2,471 | 424 | 17 | % | |||||||||||||||||||||||||||||||||||||||||||||
| Inter-segment | 66 | 76 | (10) | (13 | %) | |||||||||||||||||||||||||||||||||||||||||||||
| Total Sales | $ | 2,961 | $ | 2,547 | $ | 414 | 16 | % | ||||||||||||||||||||||||||||||||||||||||||
| Segment Profit | ||||||||||||||||||||||||||||||||||||||||||||||||||
| Second Quarter 2022 | Second Quarter 2021 |
Change |
% Change |
|||||||||||||||||||||||||||||||||||||||||||||||
| Segment Profit | $ | 355 | $ | 349 | $ | 6 | 2 | % | ||||||||||||||||||||||||||||||||||||||||||
| Segment Profit Margin | 12.0 | % | 13.7 | % | (1.7 | pts) | ||||||||||||||||||||||||||||||||||||||||||||
| ENERGY & TRANSPORTATION | ||||||||||||||||||||||||||||||||||||||||||||||||||
| (Millions of dollars) | ||||||||||||||||||||||||||||||||||||||||||||||||||
| Segment Sales | ||||||||||||||||||||||||||||||||||||||||||||||||||
| Second Quarter 2021 | Sales Volume | Price Realization | Currency | Inter-Segment | Second Quarter 2022 | $ Change |
% Change |
|||||||||||||||||||||||||||||||||||||||||||
| Total Sales | $ | 4,975 | $ | 363 | $ | 260 | $ | (103) | $ | 210 | $ | 5,705 | $ | 730 | 15 | % | ||||||||||||||||||||||||||||||||||
| Sales by Application | ||||||||||||||||||||||||||||||||||||||||||||||||||
| Second Quarter 2022 | Second Quarter 2021 | $ Change |
% Change |
|||||||||||||||||||||||||||||||||||||||||||||||
| Oil and Gas | $ | 1,232 | $ | 1,137 | $ | 95 | 8 | % | ||||||||||||||||||||||||||||||||||||||||||
| Power Generation | 1,186 | 1,052 | 134 | 13 | % | |||||||||||||||||||||||||||||||||||||||||||||
| Industrial | 1,117 | 899 | 218 | 24 | % | |||||||||||||||||||||||||||||||||||||||||||||
| Transportation | 1,105 | 1,032 | 73 | 7 | % | |||||||||||||||||||||||||||||||||||||||||||||
| External Sales | 4,640 | 4,120 | 520 | 13 | % | |||||||||||||||||||||||||||||||||||||||||||||
| Inter-segment | 1,065 | 855 | 210 | 25 | % | |||||||||||||||||||||||||||||||||||||||||||||
| Total Sales | $ | 5,705 | $ | 4,975 | $ | 730 | 15 | % | ||||||||||||||||||||||||||||||||||||||||||
| Segment Profit | ||||||||||||||||||||||||||||||||||||||||||||||||||
| Second Quarter 2022 | Second Quarter 2021 |
Change |
% Change |
|||||||||||||||||||||||||||||||||||||||||||||||
| Segment Profit | $ | 659 | $ | 738 | $ | (79) | (11 | %) | ||||||||||||||||||||||||||||||||||||||||||
| Segment Profit Margin | 11.6 | % | 14.8 | % | (3.2 | pts) | ||||||||||||||||||||||||||||||||||||||||||||
| FINANCIAL PRODUCTS SEGMENT | ||||||||||||||||||||||||||||||||||||||||||||||||||
| (Millions of dollars) | ||||||||||||||||||||||||||||||||||||||||||||||||||
| Revenues by Geographic Region | ||||||||||||||||||||||||||||||||||||||||||||||||||
| Second Quarter 2022 | Second Quarter 2021 | $ Change |
% Change |
|||||||||||||||||||||||||||||||||||||||||||||||
| North America | $ | 505 | $ | 488 | $ | 17 | 3 | % | ||||||||||||||||||||||||||||||||||||||||||
| Latin America | 87 | 65 | 22 | 34 | % | |||||||||||||||||||||||||||||||||||||||||||||
| EAME | 97 | 96 | 1 | 1 | % | |||||||||||||||||||||||||||||||||||||||||||||
| Asia/Pacific | 109 | 125 | (16) | (13 | %) | |||||||||||||||||||||||||||||||||||||||||||||
| Total Revenues | $ | 798 | $ | 774 | $ | 24 | 3 | % | ||||||||||||||||||||||||||||||||||||||||||
| Segment Profit | ||||||||||||||||||||||||||||||||||||||||||||||||||
| Second Quarter 2022 | Second Quarter 2021 |
Change |
% Change |
|||||||||||||||||||||||||||||||||||||||||||||||
| Segment Profit | $ | 217 | $ | 243 | $ | (26) | (11 | %) | ||||||||||||||||||||||||||||||||||||||||||
| (Dollars in millions except per share data) | Operating Profit | Operating Profit Margin | Profit Before Taxes | Provision (Benefit) for Income Taxes | Effective Tax Rate | Profit | Profit per Share | |||||||||||||||||||||||||||||||||||||
Three Months Ended June 30, 2022 - U.S. GAAP |
$ | 1,944 | 13.6 | % | $ | 2,096 | $ | 427 | 20.4 | % | $ | 1,673 | $ | 3.13 | ||||||||||||||||||||||||||||||
| Restructuring costs | 28 | 0.2 | % | 28 | 2 | 10.0 | % | 26 | $ | 0.05 | ||||||||||||||||||||||||||||||||||
Three Months Ended June 30, 2022 - Adjusted |
$ | 1,972 | 13.8 | % | $ | 2,124 | $ | 429 | 20.2 | % | $ | 1,699 | $ | 3.18 | ||||||||||||||||||||||||||||||
Three Months Ended June 30, 2021 - U.S. GAAP |
$ | 1,789 | 13.9 | % | $ | 1,870 | $ | 470 | 25.1 | % | $ | 1,413 | $ | 2.56 | ||||||||||||||||||||||||||||||
| Restructuring costs | 25 | 0.2 | % | 25 | 3 | 15.0 | % | 22 | $ | 0.04 | ||||||||||||||||||||||||||||||||||
Three Months Ended June 30, 2021 - Adjusted |
$ | 1,814 | 14.1 | % | $ | 1,895 | $ | 473 | 25.0 | % | $ | 1,435 | $ | 2.60 | ||||||||||||||||||||||||||||||
| Three Months Ended June 30, | Six Months Ended June 30, | ||||||||||||||||||||||
| 2022 | 2021 | 2022 | 2021 | ||||||||||||||||||||
| Sales and revenues: | |||||||||||||||||||||||
| Sales of Machinery, Energy & Transportation | $ | 13,539 | $ | 12,193 | $ | 26,425 | $ | 23,384 | |||||||||||||||
| Revenues of Financial Products | 708 | 696 | 1,411 | 1,392 | |||||||||||||||||||
| Total sales and revenues | 14,247 | 12,889 | 27,836 | 24,776 | |||||||||||||||||||
| Operating costs: | |||||||||||||||||||||||
| Cost of goods sold | 9,975 | 8,881 | 19,534 | 16,893 | |||||||||||||||||||
| Selling, general and administrative expenses | 1,425 | 1,364 | 2,771 | 2,603 | |||||||||||||||||||
| Research and development expenses | 480 | 446 | 937 | 820 | |||||||||||||||||||
| Interest expense of Financial Products | 120 | 116 | 226 | 241 | |||||||||||||||||||
| Other operating (income) expenses | 303 | 293 | 569 | 616 | |||||||||||||||||||
| Total operating costs | 12,303 | 11,100 | 24,037 | 21,173 | |||||||||||||||||||
| Operating profit | 1,944 | 1,789 | 3,799 | 3,603 | |||||||||||||||||||
| Interest expense excluding Financial Products | 108 | 120 | 217 | 262 | |||||||||||||||||||
| Other income (expense) | 260 | 201 | 513 | 526 | |||||||||||||||||||
| Consolidated profit before taxes | 2,096 | 1,870 | 4,095 | 3,867 | |||||||||||||||||||
| Provision (benefit) for income taxes | 427 | 470 | 896 | 945 | |||||||||||||||||||
| Profit of consolidated companies | 1,669 | 1,400 | 3,199 | 2,922 | |||||||||||||||||||
| Equity in profit (loss) of unconsolidated affiliated companies | 4 | 14 | 11 | 23 | |||||||||||||||||||
| Profit of consolidated and affiliated companies | 1,673 | 1,414 | 3,210 | 2,945 | |||||||||||||||||||
| Less: Profit (loss) attributable to noncontrolling interests | — | 1 | — | 2 | |||||||||||||||||||
Profit 1 |
$ | 1,673 | $ | 1,413 | $ | 3,210 | $ | 2,943 | |||||||||||||||
| Profit per common share | $ | 3.15 | $ | 2.58 | $ | 6.03 | $ | 5.38 | |||||||||||||||
Profit per common share — diluted 2 |
$ | 3.13 | $ | 2.56 | $ | 5.99 | $ | 5.33 | |||||||||||||||
| Weighted-average common shares outstanding (millions) | |||||||||||||||||||||||
| – Basic | 531.0 | 547.9 | 532.6 | 547.1 | |||||||||||||||||||
– Diluted 2 |
534.1 | 552.1 | 536.1 | 551.8 | |||||||||||||||||||
| 1 | Profit attributable to common shareholders. | ||||
| 2 | Diluted by assumed exercise of stock-based compensation awards using the treasury stock method. | ||||
| June 30, 2022 |
December 31, 2021 |
||||||||||
| Assets | |||||||||||
| Current assets: | |||||||||||
| Cash and cash equivalents | $ | 6,014 | $ | 9,254 | |||||||
| Receivables – trade and other | 8,393 | 8,477 | |||||||||
| Receivables – finance | 8,922 | 8,898 | |||||||||
| Prepaid expenses and other current assets | 2,772 | 2,788 | |||||||||
| Inventories | 15,881 | 14,038 | |||||||||
| Total current assets | 41,982 | 43,455 | |||||||||
| Property, plant and equipment – net | 11,744 | 12,090 | |||||||||
| Long-term receivables – trade and other | 1,197 | 1,204 | |||||||||
| Long-term receivables – finance | 12,372 | 12,707 | |||||||||
| Noncurrent deferred and refundable income taxes | 2,121 | 1,840 | |||||||||
| Intangible assets | 889 | 1,042 | |||||||||
| Goodwill | 6,195 | 6,324 | |||||||||
| Other assets | 4,607 | 4,131 | |||||||||
| Total assets | $ | 81,107 | $ | 82,793 | |||||||
| Liabilities | |||||||||||
| Current liabilities: | |||||||||||
| Short-term borrowings: | |||||||||||
| -- Machinery, Energy & Transportation | $ | — | $ | 9 | |||||||
| -- Financial Products | 5,002 | 5,395 | |||||||||
| Accounts payable | 8,092 | 8,154 | |||||||||
| Accrued expenses | 3,782 | 3,757 | |||||||||
| Accrued wages, salaries and employee benefits | 1,772 | 2,242 | |||||||||
| Customer advances | 1,608 | 1,087 | |||||||||
| Dividends payable | 633 | 595 | |||||||||
| Other current liabilities | 2,333 | 2,256 | |||||||||
| Long-term debt due within one year: | |||||||||||
| -- Machinery, Energy & Transportation | 124 | 45 | |||||||||
| -- Financial Products | 5,617 | 6,307 | |||||||||
| Total current liabilities | 28,963 | 29,847 | |||||||||
| Long-term debt due after one year: | |||||||||||
| -- Machinery, Energy & Transportation | 9,589 | 9,746 | |||||||||
| -- Financial Products | 16,630 | 16,287 | |||||||||
| Liability for postemployment benefits | 5,160 | 5,592 | |||||||||
| Other liabilities | 5,006 | 4,805 | |||||||||
| Total liabilities | 65,348 | 66,277 | |||||||||
| Shareholders’ equity | |||||||||||
| Common stock | 6,464 | 6,398 | |||||||||
| Treasury stock | (29,501) | (27,643) | |||||||||
| Profit employed in the business | 41,263 | 39,282 | |||||||||
| Accumulated other comprehensive income (loss) | (2,499) | (1,553) | |||||||||
| Noncontrolling interests | 32 | 32 | |||||||||
| Total shareholders’ equity | 15,759 | 16,516 | |||||||||
| Total liabilities and shareholders’ equity | $ | 81,107 | $ | 82,793 | |||||||
| Six Months Ended June 30, | |||||||||||
| 2022 | 2021 | ||||||||||
| Cash flow from operating activities: | |||||||||||
| Profit of consolidated and affiliated companies | $ | 3,210 | $ | 2,945 | |||||||
| Adjustments for non-cash items: | |||||||||||
| Depreciation and amortization | 1,110 | 1,173 | |||||||||
| Provision (benefit) for deferred income taxes | (283) | 68 | |||||||||
| Other | 49 | (20) | |||||||||
| Changes in assets and liabilities, net of acquisitions and divestitures: | |||||||||||
| Receivables – trade and other | 283 | (343) | |||||||||
| Inventories | (2,003) | (1,179) | |||||||||
| Accounts payable | 427 | 893 | |||||||||
| Accrued expenses | (80) | 22 | |||||||||
| Accrued wages, salaries and employee benefits | (445) | 618 | |||||||||
| Customer advances | 514 | 49 | |||||||||
| Other assets – net | 86 | (47) | |||||||||
| Other liabilities – net | (322) | (133) | |||||||||
| Net cash provided by (used for) operating activities | 2,546 | 4,046 | |||||||||
| Cash flow from investing activities: | |||||||||||
| Capital expenditures – excluding equipment leased to others | (586) | (419) | |||||||||
| Expenditures for equipment leased to others | (688) | (681) | |||||||||
| Proceeds from disposals of leased assets and property, plant and equipment | 468 | 636 | |||||||||
| Additions to finance receivables | (6,705) | (6,203) | |||||||||
| Collections of finance receivables | 6,519 | 5,580 | |||||||||
| Proceeds from sale of finance receivables | 21 | 27 | |||||||||
| Investments and acquisitions (net of cash acquired) | (36) | (398) | |||||||||
| Proceeds from sale of businesses and investments (net of cash sold) | 1 | 28 | |||||||||
| Proceeds from sale of securities | 1,204 | 276 | |||||||||
| Investments in securities | (2,118) | (500) | |||||||||
| Other – net | 32 | (63) | |||||||||
| Net cash provided by (used for) investing activities | (1,888) | (1,717) | |||||||||
| Cash flow from financing activities: | |||||||||||
| Dividends paid | (1,187) | (1,126) | |||||||||
| Common stock issued, including treasury shares reissued | 4 | 123 | |||||||||
| Common shares repurchased | (1,924) | (251) | |||||||||
| Proceeds from debt issued (original maturities greater than three months) | 4,015 | 4,906 | |||||||||
| Payments on debt (original maturities greater than three months) | (4,246) | (5,966) | |||||||||
| Short-term borrowings – net (original maturities three months or less) | (553) | 1,460 | |||||||||
| Other – net | — | (2) | |||||||||
| Net cash provided by (used for) financing activities | (3,891) | (856) | |||||||||
| Effect of exchange rate changes on cash | (7) | 3 | |||||||||
| Increase (decrease) in cash, cash equivalents and restricted cash | (3,240) | 1,476 | |||||||||
| Cash, cash equivalents and restricted cash at beginning of period | 9,263 | 9,366 | |||||||||
| Cash, cash equivalents and restricted cash at end of period | $ | 6,023 | $ | 10,842 | |||||||
Cash equivalents primarily represent short-term, highly liquid investments with original maturities of generally three months or less. | ||
| Supplemental Consolidating Data | ||||||||||||||||||||||||||
| Consolidated | Machinery, Energy & Transportation | Financial Products |
Consolidating Adjustments |
|||||||||||||||||||||||
| Sales and revenues: | ||||||||||||||||||||||||||
| Sales of Machinery, Energy & Transportation | $ | 13,539 | $ | 13,539 | $ | — | $ | — | ||||||||||||||||||
| Revenues of Financial Products | 708 | — | 828 | (120) | 1 | |||||||||||||||||||||
| Total sales and revenues | 14,247 | 13,539 | 828 | (120) | ||||||||||||||||||||||
| Operating costs: | ||||||||||||||||||||||||||
| Cost of goods sold | 9,975 | 9,978 | — | (3) | 2 | |||||||||||||||||||||
| Selling, general and administrative expenses | 1,425 | 1,261 | 167 | (3) | 2 | |||||||||||||||||||||
| Research and development expenses | 480 | 480 | — | — | ||||||||||||||||||||||
| Interest expense of Financial Products | 120 | — | 120 | — | ||||||||||||||||||||||
| Other operating (income) expenses | 303 | 16 | 307 | (20) | 2 | |||||||||||||||||||||
| Total operating costs | 12,303 | 11,735 | 594 | (26) | ||||||||||||||||||||||
| Operating profit | 1,944 | 1,804 | 234 | (94) | ||||||||||||||||||||||
| Interest expense excluding Financial Products | 108 | 108 | — | — | ||||||||||||||||||||||
| Other income (expense) | 260 | 180 | (14) | 94 | 3 | |||||||||||||||||||||
| Consolidated profit before taxes | 2,096 | 1,876 | 220 | — | ||||||||||||||||||||||
| Provision (benefit) for income taxes | 427 | 374 | 53 | — | ||||||||||||||||||||||
| Profit of consolidated companies | 1,669 | 1,502 | 167 | — | ||||||||||||||||||||||
| Equity in profit (loss) of unconsolidated affiliated companies | 4 | 7 | — | (3) | 4 | |||||||||||||||||||||
| Profit of consolidated and affiliated companies | 1,673 | 1,509 | 167 | (3) | ||||||||||||||||||||||
| Less: Profit (loss) attributable to noncontrolling interests | — | — | 3 | (3) | 5 | |||||||||||||||||||||
Profit 6 |
$ | 1,673 | $ | 1,509 | $ | 164 | $ | — | ||||||||||||||||||
| 1 | Elimination of Financial Products’ revenues earned from ME&T. |
||||
| 2 | Elimination of net expenses recorded by ME&T paid to Financial Products. |
||||
| 3 | Elimination of discount recorded by ME&T on receivables sold to Financial Products and of interest earned between ME&T and Financial Products as well as dividends paid by Financial Products to ME&T. |
||||
| 4 | Elimination of equity profit (loss) earned from Financial Products’ subsidiaries partially owned by ME&T subsidiaries. |
||||
| 5 | Elimination of noncontrolling interest profit (loss) recorded by Financial Products for subsidiaries partially owned by ME&T subsidiaries. |
||||
| 6 | Profit attributable to common shareholders. | ||||
| Supplemental Consolidating Data | ||||||||||||||||||||||||||
| Consolidated | Machinery, Energy & Transportation | Financial Products |
Consolidating Adjustments |
|||||||||||||||||||||||
| Sales and revenues: | ||||||||||||||||||||||||||
| Sales of Machinery, Energy & Transportation | $ | 12,193 | $ | 12,193 | $ | — | $ | — | ||||||||||||||||||
| Revenues of Financial Products | 696 | — | 796 | (100) | 1 | |||||||||||||||||||||
| Total sales and revenues | 12,889 | 12,193 | 796 | (100) | ||||||||||||||||||||||
| Operating costs: | ||||||||||||||||||||||||||
| Cost of goods sold | 8,881 | 8,884 | — | (3) | 2 | |||||||||||||||||||||
| Selling, general and administrative expenses | 1,364 | 1,210 | 159 | (5) | 2 | |||||||||||||||||||||
| Research and development expenses | 446 | 446 | — | — | ||||||||||||||||||||||
| Interest expense of Financial Products | 116 | — | 116 | — | ||||||||||||||||||||||
| Other operating (income) expenses | 293 | — | 307 | (14) | 2 | |||||||||||||||||||||
| Total operating costs | 11,100 | 10,540 | 582 | (22) | ||||||||||||||||||||||
| Operating profit | 1,789 | 1,653 | 214 | (78) | ||||||||||||||||||||||
| Interest expense excluding Financial Products | 120 | 120 | — | — | ||||||||||||||||||||||
| Other income (expense) | 201 | 445 | 28 | (272) | 3 | |||||||||||||||||||||
| Consolidated profit before taxes | 1,870 | 1,978 | 242 | (350) | ||||||||||||||||||||||
| Provision (benefit) for income taxes | 470 | 415 | 55 | — | ||||||||||||||||||||||
| Profit of consolidated companies | 1,400 | 1,563 | 187 | (350) | ||||||||||||||||||||||
| Equity in profit (loss) of unconsolidated affiliated companies | 14 | 17 | — | (3) | 4 | |||||||||||||||||||||
| Profit of consolidated and affiliated companies | 1,414 | 1,580 | 187 | (353) | ||||||||||||||||||||||
| Less: Profit (loss) attributable to noncontrolling interests | 1 | 1 | 3 | (3) | 5 | |||||||||||||||||||||
Profit 6 |
$ | 1,413 | $ | 1,579 | $ | 184 | $ | (350) | ||||||||||||||||||
| 1 | Elimination of Financial Products’ revenues earned from ME&T. |
||||
| 2 | Elimination of net expenses recorded by ME&T paid to Financial Products. |
||||
| 3 | Elimination of discount recorded by ME&T on receivables sold to Financial Products and of interest earned between ME&T and Financial Products as well as dividends paid by Financial Products to ME&T. |
||||
| 4 | Elimination of equity profit (loss) earned from Financial Products’ subsidiaries partially owned by ME&T subsidiaries. |
||||
| 5 | Elimination of noncontrolling interest profit (loss) recorded by Financial Products for subsidiaries partially owned by ME&T subsidiaries. |
||||
| 6 | Profit attributable to common shareholders. | ||||
| Supplemental Consolidating Data | ||||||||||||||||||||||||||
| Consolidated | Machinery, Energy & Transportation | Financial Products |
Consolidating Adjustments |
|||||||||||||||||||||||
| Sales and revenues: | ||||||||||||||||||||||||||
| Sales of Machinery, Energy & Transportation | $ | 26,425 | $ | 26,425 | $ | — | $ | — | ||||||||||||||||||
| Revenues of Financial Products | 1,411 | — | 1,641 | (230) | 1 | |||||||||||||||||||||
| Total sales and revenues | 27,836 | 26,425 | 1,641 | (230) | ||||||||||||||||||||||
| Operating costs: | ||||||||||||||||||||||||||
| Cost of goods sold | 19,534 | 19,538 | — | (4) | 2 | |||||||||||||||||||||
| Selling, general and administrative expenses | 2,771 | 2,443 | 339 | (11) | 2 | |||||||||||||||||||||
| Research and development expenses | 937 | 937 | — | — | ||||||||||||||||||||||
| Interest expense of Financial Products | 226 | — | 226 | — | ||||||||||||||||||||||
| Other operating (income) expenses | 569 | (12) | 621 | (40) | 2 | |||||||||||||||||||||
| Total operating costs | 24,037 | 22,906 | 1,186 | (55) | ||||||||||||||||||||||
| Operating profit | 3,799 | 3,519 | 455 | (175) | ||||||||||||||||||||||
| Interest expense excluding Financial Products | 217 | 217 | — | — | ||||||||||||||||||||||
| Other income (expense) | 513 | 337 | 1 | 175 | 3 | |||||||||||||||||||||
| Consolidated profit before taxes | 4,095 | 3,639 | 456 | — | ||||||||||||||||||||||
| Provision (benefit) for income taxes | 896 | 786 | 110 | — | ||||||||||||||||||||||
| Profit of consolidated companies | 3,199 | 2,853 | 346 | — | ||||||||||||||||||||||
| Equity in profit (loss) of unconsolidated affiliated companies | 11 | 15 | — | (4) | 4 | |||||||||||||||||||||
| Profit of consolidated and affiliated companies | 3,210 | 2,868 | 346 | (4) | ||||||||||||||||||||||
| Less: Profit (loss) attributable to noncontrolling interests | — | — | 4 | (4) | 5 | |||||||||||||||||||||
Profit 6 |
$ | 3,210 | $ | 2,868 | $ | 342 | $ | — | ||||||||||||||||||
| 1 | Elimination of Financial Products’ revenues earned from ME&T. |
||||
| 2 | Elimination of net expenses recorded by ME&T paid to Financial Products. |
||||
| 3 | Elimination of discount recorded by ME&T on receivables sold to Financial Products and of interest earned between ME&T and Financial Products as well as dividends paid by Financial Products to ME&T. |
||||
| 4 | Elimination of equity profit (loss) earned from Financial Products’ subsidiaries partially owned by ME&T subsidiaries. |
||||
| 5 | Elimination of noncontrolling interest profit (loss) recorded by Financial Products for subsidiaries partially owned by ME&T subsidiaries. |
||||
| 6 | Profit attributable to common shareholders. | ||||
| Supplemental Consolidating Data | ||||||||||||||||||||||||||
| Consolidated | Machinery, Energy & Transportation | Financial Products |
Consolidating Adjustments |
|||||||||||||||||||||||
| Sales and revenues: | ||||||||||||||||||||||||||
| Sales of Machinery, Energy & Transportation | $ | 23,384 | $ | 23,384 | $ | — | $ | — | ||||||||||||||||||
| Revenues of Financial Products | 1,392 | — | 1,584 | (192) | 1 | |||||||||||||||||||||
| Total sales and revenues | 24,776 | 23,384 | 1,584 | (192) | ||||||||||||||||||||||
| Operating costs: | ||||||||||||||||||||||||||
| Cost of goods sold | 16,893 | 16,897 | — | (4) | 2 | |||||||||||||||||||||
| Selling, general and administrative expenses | 2,603 | 2,324 | 283 | (4) | 2 | |||||||||||||||||||||
| Research and development expenses | 820 | 820 | — | — | ||||||||||||||||||||||
| Interest expense of Financial Products | 241 | — | 241 | — | ||||||||||||||||||||||
| Other operating (income) expenses | 616 | 26 | 621 | (31) | 2 | |||||||||||||||||||||
| Total operating costs | 21,173 | 20,067 | 1,145 | (39) | ||||||||||||||||||||||
| Operating profit | 3,603 | 3,317 | 439 | (153) | ||||||||||||||||||||||
| Interest expense excluding Financial Products | 262 | 262 | — | — | ||||||||||||||||||||||
| Other income (expense) | 526 | 676 | 47 | (197) | 3 | |||||||||||||||||||||
| Consolidated profit before taxes | 3,867 | 3,731 | 486 | (350) | ||||||||||||||||||||||
| Provision (benefit) for income taxes | 945 | 827 | 118 | — | ||||||||||||||||||||||
| Profit of consolidated companies | 2,922 | 2,904 | 368 | (350) | ||||||||||||||||||||||
| Equity in profit (loss) of unconsolidated affiliated companies | 23 | 29 | — | (6) | 4 | |||||||||||||||||||||
| Profit of consolidated and affiliated companies | 2,945 | 2,933 | 368 | (356) | ||||||||||||||||||||||
| Less: Profit (loss) attributable to noncontrolling interests | 2 | 2 | 6 | (6) | 5 | |||||||||||||||||||||
Profit 6 |
$ | 2,943 | $ | 2,931 | $ | 362 | $ | (350) | ||||||||||||||||||
| 1 | Elimination of Financial Products’ revenues earned from ME&T. |
||||
| 2 | Elimination of net expenses recorded by ME&T paid to Financial Products. |
||||
| 3 | Elimination of discount recorded by ME&T on receivables sold to Financial Products and of interest earned between ME&T and Financial Products as well as dividends paid by Financial Products to ME&T. |
||||
| 4 | Elimination of equity profit (loss) earned from Financial Products’ subsidiaries partially owned by ME&T subsidiaries. |
||||
| 5 | Elimination of noncontrolling interest profit (loss) recorded by Financial Products for subsidiaries partially owned by ME&T subsidiaries. |
||||
| 6 | Profit attributable to common shareholders. | ||||
| Supplemental Consolidating Data | ||||||||||||||||||||||||||
| Consolidated | Machinery, Energy & Transportation |
Financial Products |
Consolidating Adjustments |
|||||||||||||||||||||||
| Assets | ||||||||||||||||||||||||||
| Current assets: | ||||||||||||||||||||||||||
| Cash and cash equivalents | $ | 6,014 | $ | 5,213 | $ | 801 | $ | — | ||||||||||||||||||
| Receivables – trade and other | 8,393 | 3,422 | 541 | 4,430 | 1,2 |
|||||||||||||||||||||
| Receivables – finance | 8,922 | — | 13,499 | (4,577) | 2 | |||||||||||||||||||||
| Prepaid expenses and other current assets | 2,772 | 2,706 | 320 | (254) | 3 | |||||||||||||||||||||
| Inventories | 15,881 | 15,881 | — | — | ||||||||||||||||||||||
| Total current assets | 41,982 | 27,222 | 15,161 | (401) | ||||||||||||||||||||||
| Property, plant and equipment – net | 11,744 | 7,852 | 3,892 | — | ||||||||||||||||||||||
| Long-term receivables – trade and other | 1,197 | 324 | 398 | 475 | 1,2 |
|||||||||||||||||||||
| Long-term receivables – finance | 12,372 | — | 12,877 | (505) | 2 | |||||||||||||||||||||
| Noncurrent deferred and refundable income taxes | 2,121 | 2,644 | 109 | (632) | 4 | |||||||||||||||||||||
| Intangible assets | 889 | 889 | — | — | ||||||||||||||||||||||
| Goodwill | 6,195 | 6,195 | — | — | ||||||||||||||||||||||
| Other assets | 4,607 | 3,801 | 2,005 | (1,199) | 5 | |||||||||||||||||||||
| Total assets | $ | 81,107 | $ | 48,927 | $ | 34,442 | $ | (2,262) | ||||||||||||||||||
| Liabilities | ||||||||||||||||||||||||||
| Current liabilities: | ||||||||||||||||||||||||||
| Short-term borrowings | $ | 5,002 | $ | — | $ | 5,002 | $ | — | ||||||||||||||||||
| Accounts payable | 8,092 | 8,008 | 231 | (147) | 6 | |||||||||||||||||||||
| Accrued expenses | 3,782 | 3,398 | 384 | — | ||||||||||||||||||||||
| Accrued wages, salaries and employee benefits | 1,772 | 1,737 | 35 | — | ||||||||||||||||||||||
| Customer advances | 1,608 | 1,608 | — | — | ||||||||||||||||||||||
| Dividends payable | 633 | 633 | — | — | ||||||||||||||||||||||
| Other current liabilities | 2,333 | 1,865 | 745 | (277) | 4,7 |
|||||||||||||||||||||
| Long-term debt due within one year | 5,741 | 124 | 5,617 | — | ||||||||||||||||||||||
| Total current liabilities | 28,963 | 17,373 | 12,014 | (424) | ||||||||||||||||||||||
| Long-term debt due after one year | 26,219 | 9,619 | 16,630 | (30) | 8 | |||||||||||||||||||||
| Liability for postemployment benefits | 5,160 | 5,160 | — | — | ||||||||||||||||||||||
| Other liabilities | 5,006 | 4,179 | 1,517 | (690) | 4 | |||||||||||||||||||||
| Total liabilities | 65,348 | 36,331 | 30,161 | (1,144) | ||||||||||||||||||||||
| Shareholders’ equity | ||||||||||||||||||||||||||
| Common stock | 6,464 | 6,464 | 919 | (919) | 9 | |||||||||||||||||||||
| Treasury stock | (29,501) | (29,501) | — | — | ||||||||||||||||||||||
| Profit employed in the business | 41,263 | 37,029 | 4,223 | 11 | 9 | |||||||||||||||||||||
| Accumulated other comprehensive income (loss) | (2,499) | (1,430) | (1,069) | — | ||||||||||||||||||||||
| Noncontrolling interests | 32 | 34 | 208 | (210) | 9 | |||||||||||||||||||||
| Total shareholders’ equity | 15,759 | 12,596 | 4,281 | (1,118) | ||||||||||||||||||||||
| Total liabilities and shareholders’ equity | $ | 81,107 | $ | 48,927 | $ | 34,442 | $ | (2,262) | ||||||||||||||||||
| 1 | Elimination of receivables between ME&T and Financial Products. |
||||
| 2 | Reclassification of ME&T’s trade receivables purchased by Financial Products and Financial Products’ wholesale inventory receivables. |
||||
| 3 | Elimination of ME&T's insurance premiums that are prepaid to Financial Products. | ||||
| 4 | Reclassification reflecting required netting of deferred tax assets/liabilities by taxing jurisdiction. |
||||
| 5 | Elimination of other intercompany assets between ME&T and Financial Products. |
||||
| 6 | Elimination of payables between ME&T and Financial Products. |
||||
| 7 | Elimination of prepaid insurance in Financial Products’ other liabilities. | ||||
| 8 | Elimination of debt between ME&T and Financial Products. |
||||
| 9 | Eliminations associated with ME&T’s investments in Financial Products’ subsidiaries. |
||||
| Supplemental Consolidating Data | ||||||||||||||||||||||||||
| Consolidated | Machinery, Energy & Transportation |
Financial Products |
Consolidating Adjustments |
|||||||||||||||||||||||
| Assets | ||||||||||||||||||||||||||
| Current assets: | ||||||||||||||||||||||||||
| Cash and cash equivalents | $ | 9,254 | $ | 8,428 | $ | 826 | $ | — | ||||||||||||||||||
| Receivables – trade and other | 8,477 | 3,279 | 435 | 4,763 | 1,2 |
|||||||||||||||||||||
| Receivables – finance | 8,898 | — | 13,828 | (4,930) | 2 | |||||||||||||||||||||
| Prepaid expenses and other current assets | 2,788 | 2,567 | 358 | (137) | 3 | |||||||||||||||||||||
| Inventories | 14,038 | 14,038 | — | — | ||||||||||||||||||||||
| Total current assets | 43,455 | 28,312 | 15,447 | (304) | ||||||||||||||||||||||
| Property, plant and equipment – net | 12,090 | 8,172 | 3,918 | — | ||||||||||||||||||||||
| Long-term receivables – trade and other | 1,204 | 375 | 204 | 625 | 1,2 |
|||||||||||||||||||||
| Long-term receivables – finance | 12,707 | — | 13,358 | (651) | 2 | |||||||||||||||||||||
| Noncurrent deferred and refundable income taxes | 1,840 | 2,396 | 105 | (661) | 4 | |||||||||||||||||||||
| Intangible assets | 1,042 | 1,042 | — | — | ||||||||||||||||||||||
| Goodwill | 6,324 | 6,324 | — | — | ||||||||||||||||||||||
| Other assets | 4,131 | 3,388 | 1,952 | (1,209) | 5 | |||||||||||||||||||||
| Total assets | $ | 82,793 | $ | 50,009 | $ | 34,984 | $ | (2,200) | ||||||||||||||||||
| Liabilities | ||||||||||||||||||||||||||
| Current liabilities: | ||||||||||||||||||||||||||
| Short-term borrowings | $ | 5,404 | $ | 9 | $ | 5,395 | $ | — | ||||||||||||||||||
| Accounts payable | 8,154 | 8,079 | 242 | (167) | 6 | |||||||||||||||||||||
| Accrued expenses | 3,757 | 3,385 | 372 | — | ||||||||||||||||||||||
| Accrued wages, salaries and employee benefits | 2,242 | 2,186 | 56 | — | ||||||||||||||||||||||
| Customer advances | 1,087 | 1,086 | 1 | — | ||||||||||||||||||||||
| Dividends payable | 595 | 595 | — | — | ||||||||||||||||||||||
| Other current liabilities | 2,256 | 1,773 | 642 | (159) | 4,7 |
|||||||||||||||||||||
| Long-term debt due within one year | 6,352 | 45 | 6,307 | — | ||||||||||||||||||||||
| Total current liabilities | 29,847 | 17,158 | 13,015 | (326) | ||||||||||||||||||||||
| Long-term debt due after one year | 26,033 | 9,772 | 16,287 | (26) | 8 | |||||||||||||||||||||
| Liability for postemployment benefits | 5,592 | 5,592 | — | — | ||||||||||||||||||||||
| Other liabilities | 4,805 | 4,106 | 1,425 | (726) | 4 | |||||||||||||||||||||
| Total liabilities | 66,277 | 36,628 | 30,727 | (1,078) | ||||||||||||||||||||||
| Shareholders’ equity | ||||||||||||||||||||||||||
| Common stock | 6,398 | 6,398 | 919 | (919) | 9 | |||||||||||||||||||||
| Treasury stock | (27,643) | (27,643) | — | — | ||||||||||||||||||||||
| Profit employed in the business | 39,282 | 35,390 | 3,881 | 11 | 9 | |||||||||||||||||||||
| Accumulated other comprehensive income (loss) | (1,553) | (799) | (754) | — | ||||||||||||||||||||||
| Noncontrolling interests | 32 | 35 | 211 | (214) | 9 | |||||||||||||||||||||
| Total shareholders’ equity | 16,516 | 13,381 | 4,257 | (1,122) | ||||||||||||||||||||||
| Total liabilities and shareholders’ equity | $ | 82,793 | $ | 50,009 | $ | 34,984 | $ | (2,200) | ||||||||||||||||||
| 1 | Elimination of receivables between ME&T and Financial Products. |
||||
| 2 | Reclassification of ME&T’s trade receivables purchased by Financial Products and Financial Products’ wholesale inventory receivables. |
||||
| 3 | Elimination of ME&T’s insurance premiums that are prepaid to Financial Products. | ||||
| 4 | Reclassification reflecting required netting of deferred tax assets/liabilities by taxing jurisdiction. |
||||
| 5 | Elimination of other intercompany assets between ME&T and Financial Products. |
||||
| 6 | Elimination of payables between ME&T and Financial Products. | ||||
| 7 | Elimination of prepaid insurance in Financial Products’ other liabilities. |
||||
| 8 | Elimination of debt between ME&T and Financial Products. | ||||
| 9 | Eliminations associated with ME&T’s investments in Financial Products’ subsidiaries. |
||||
| Supplemental Consolidating Data | ||||||||||||||||||||||||||
| Consolidated | Machinery, Energy & Transportation | Financial Products |
Consolidating Adjustments |
|||||||||||||||||||||||
| Cash flow from operating activities: | ||||||||||||||||||||||||||
| Profit of consolidated and affiliated companies | $ | 3,210 | $ | 2,868 | $ | 346 | $ | (4) | 1 | |||||||||||||||||
| Adjustments for non-cash items: | ||||||||||||||||||||||||||
| Depreciation and amortization | 1,110 | 715 | 395 | — | ||||||||||||||||||||||
| Provision (benefit) for deferred income taxes | (283) | (232) | (51) | — | ||||||||||||||||||||||
| Other | 49 | (54) | (93) | 196 | 2 | |||||||||||||||||||||
| Changes in assets and liabilities, net of acquisitions and divestitures: | ||||||||||||||||||||||||||
| Receivables – trade and other | 283 | (32) | 12 | 303 | 2,3 |
|||||||||||||||||||||
| Inventories | (2,003) | (2,003) | — | — | ||||||||||||||||||||||
| Accounts payable | 427 | 396 | 11 | 20 | 2 | |||||||||||||||||||||
| Accrued expenses | (80) | (89) | 9 | — | ||||||||||||||||||||||
| Accrued wages, salaries and employee benefits | (445) | (428) | (17) | — | ||||||||||||||||||||||
| Customer advances | 514 | 515 | (1) | — | ||||||||||||||||||||||
| Other assets – net | 86 | (44) | (25) | 155 | 2 | |||||||||||||||||||||
| Other liabilities – net | (322) | (323) | 149 | (148) | 2 | |||||||||||||||||||||
| Net cash provided by (used for) operating activities | 2,546 | 1,289 | 735 | 522 | ||||||||||||||||||||||
| Cash flow from investing activities: | ||||||||||||||||||||||||||
| Capital expenditures – excluding equipment leased to others | (586) | (583) | (5) | 2 | 2 | |||||||||||||||||||||
| Expenditures for equipment leased to others | (688) | (11) | (683) | 6 | 2 | |||||||||||||||||||||
| Proceeds from disposals of leased assets and property, plant and equipment | 468 | 43 | 433 | (8) | 2 | |||||||||||||||||||||
| Additions to finance receivables | (6,705) | — | (7,175) | 470 | 3 | |||||||||||||||||||||
| Collections of finance receivables | 6,519 | — | 6,896 | (377) | 3 | |||||||||||||||||||||
| Net intercompany purchased receivables | — | — | 615 | (615) | 3 | |||||||||||||||||||||
| Proceeds from sale of finance receivables | 21 | — | 21 | — | ||||||||||||||||||||||
| Net intercompany borrowings | — | — | 3 | (3) | 4 | |||||||||||||||||||||
| Investments and acquisitions (net of cash acquired) | (36) | (36) | — | — | ||||||||||||||||||||||
| Proceeds from sale of businesses and investments (net of cash sold) | 1 | 1 | — | — | ||||||||||||||||||||||
| Proceeds from sale of securities | 1,204 | 1,014 | 190 | — | ||||||||||||||||||||||
| Investments in securities | (2,118) | (1,724) | (394) | — | ||||||||||||||||||||||
| Other – net | 32 | 58 | (26) | — | ||||||||||||||||||||||
| Net cash provided by (used for) investing activities | (1,888) | (1,238) | (125) | (525) | ||||||||||||||||||||||
| Cash flow from financing activities: | ||||||||||||||||||||||||||
| Dividends paid | (1,187) | (1,187) | — | — | ||||||||||||||||||||||
| Common stock issued, including treasury shares reissued | 4 | 4 | — | — | ||||||||||||||||||||||
| Common shares repurchased | (1,924) | (1,924) | — | — | ||||||||||||||||||||||
| Net intercompany borrowings | — | (3) | — | 3 | 4 | |||||||||||||||||||||
| Proceeds from debt issued > 90 days | 4,015 | — | 4,015 | — | ||||||||||||||||||||||
| Payments on debt > 90 days | (4,246) | (13) | (4,233) | — | ||||||||||||||||||||||
| Short-term borrowings – net < 90 days | (553) | (141) | (412) | — | ||||||||||||||||||||||
| Net cash provided by (used for) financing activities | (3,891) | (3,264) | (630) | 3 | ||||||||||||||||||||||
| Effect of exchange rate changes on cash | (7) | — | (7) | — | ||||||||||||||||||||||
| Increase (decrease) in cash, cash equivalents and restricted cash | (3,240) | (3,213) | (27) | — | ||||||||||||||||||||||
| Cash, cash equivalents and restricted cash at beginning of period | 9,263 | 8,433 | 830 | — | ||||||||||||||||||||||
| Cash, cash equivalents and restricted cash at end of period | $ | 6,023 | $ | 5,220 | $ | 803 | $ | — | ||||||||||||||||||
| 1 | Elimination of equity profit earned from Financial Products' subsidiaries partially owned by ME&T subsidiaries. | ||||
| 2 | Elimination of non-cash adjustments and changes in assets and liabilities related to consolidated reporting. | ||||
| 3 | Reclassification of Financial Products’ cash flow activity from investing to operating for receivables that arose from the sale of inventory. | ||||
| 4 | Elimination of net proceeds and payments to/from ME&T and Financial Products. | ||||
| Supplemental Consolidating Data | ||||||||||||||||||||||||||
| Consolidated | Machinery, Energy & Transportation | Financial Products |
Consolidating Adjustments |
|||||||||||||||||||||||
| Cash flow from operating activities: | ||||||||||||||||||||||||||
| Profit of consolidated and affiliated companies | $ | 2,945 | $ | 2,933 | $ | 368 | $ | (356) | 1,5 | |||||||||||||||||
| Adjustments for non-cash items: | ||||||||||||||||||||||||||
| Depreciation and amortization | 1,173 | 772 | 401 | — | ||||||||||||||||||||||
| Provision (benefit) for deferred income taxes | 68 | 111 | (43) | — | ||||||||||||||||||||||
| Other | (20) | 74 | (169) | 75 | 2 | |||||||||||||||||||||
| Changes in assets and liabilities, net of acquisitions and divestitures: | ||||||||||||||||||||||||||
| Receivables – trade and other | (343) | (206) | 11 | (148) | 2,3 |
|||||||||||||||||||||
| Inventories | (1,179) | (1,180) | — | 1 | 2 | |||||||||||||||||||||
| Accounts payable | 893 | 871 | 2 | 20 | 2 | |||||||||||||||||||||
| Accrued expenses | 22 | 93 | (71) | — | ||||||||||||||||||||||
| Accrued wages, salaries and employee benefits | 618 | 593 | 25 | — | ||||||||||||||||||||||
| Customer advances | 49 | 49 | — | — | ||||||||||||||||||||||
| Other assets – net | (47) | (154) | 15 | 92 | 2 | |||||||||||||||||||||
| Other liabilities – net | (133) | (157) | 97 | (73) | 2 | |||||||||||||||||||||
| Net cash provided by (used for) operating activities | 4,046 | 3,799 | 636 | (389) | ||||||||||||||||||||||
| Cash flow from investing activities: | ||||||||||||||||||||||||||
| Capital expenditures – excluding equipment leased to others | (419) | (417) | (7) | 5 | 2 | |||||||||||||||||||||
| Expenditures for equipment leased to others | (681) | (13) | (670) | 2 | 2 | |||||||||||||||||||||
| Proceeds from disposals of leased assets and property, plant and equipment | 636 | 49 | 595 | (8) | 2 | |||||||||||||||||||||
| Additions to finance receivables | (6,203) | — | (6,680) | 477 | 3 | |||||||||||||||||||||
| Collections of finance receivables | 5,580 | — | 6,095 | (515) | 3 | |||||||||||||||||||||
| Net intercompany purchased receivables | — | — | (78) | 78 | 3 | |||||||||||||||||||||
| Proceeds from sale of finance receivables | 27 | — | 27 | — | ||||||||||||||||||||||
| Net intercompany borrowings | — | 1,000 | 2 | (1,002) | 4 | |||||||||||||||||||||
| Investments and acquisitions (net of cash acquired) | (398) | (398) | — | — | ||||||||||||||||||||||
| Proceeds from sale of businesses and investments (net of cash sold) | 28 | 28 | — | — | ||||||||||||||||||||||
| Proceeds from sale of securities | 276 | 35 | 241 | — | ||||||||||||||||||||||
| Investments in securities | (500) | (225) | (275) | — | ||||||||||||||||||||||
| Other – net | (63) | 26 | (89) | — | ||||||||||||||||||||||
| Net cash provided by (used for) investing activities | (1,717) | 85 | (839) | (963) | ||||||||||||||||||||||
| Cash flow from financing activities: | ||||||||||||||||||||||||||
| Dividends paid | (1,126) | (1,126) | (350) | 350 | 5 | |||||||||||||||||||||
| Common stock issued, including treasury shares reissued | 123 | 123 | — | — | ||||||||||||||||||||||
| Common shares repurchased | (251) | (251) | — | — | ||||||||||||||||||||||
| Net intercompany borrowings | — | (2) | (1,000) | 1,002 | 4 | |||||||||||||||||||||
| Proceeds from debt issued > 90 days | 4,906 | 494 | 4,412 | — | ||||||||||||||||||||||
| Payments on debt > 90 days | (5,966) | (1,902) | (4,064) | — | ||||||||||||||||||||||
| Short-term borrowings – net < 90 days | 1,460 | (6) | 1,466 | — | ||||||||||||||||||||||
| Other – net | (2) | (2) | — | — | ||||||||||||||||||||||
| Net cash provided by (used for) financing activities | (856) | (2,672) | 464 | 1,352 | ||||||||||||||||||||||
| Effect of exchange rate changes on cash | 3 | (5) | 8 | — | ||||||||||||||||||||||
| Increase (decrease) in cash, cash equivalents and restricted cash | 1,476 | 1,207 | 269 | — | ||||||||||||||||||||||
| Cash, cash equivalents and restricted cash at beginning of period | 9,366 | 8,822 | 544 | — | ||||||||||||||||||||||
| Cash, cash equivalents and restricted cash at end of period | $ | 10,842 | $ | 10,029 | $ | 813 | $ | — | ||||||||||||||||||
| 1 | Elimination of equity profit earned from Financial Products' subsidiaries partially owned by ME&T subsidiaries. | ||||
| 2 | Elimination of non-cash adjustments and changes in assets and liabilities related to consolidated reporting. | ||||
| 3 | Reclassification of Financial Products’ cash flow activity from investing to operating for receivables that arose from the sale of inventory. | ||||
| 4 | Elimination of net proceeds and payments to/from ME&T and Financial Products. | ||||
| 5 | Elimination of dividend activity between Financial Products and ME&T. | ||||
| Caterpillar Inc. Quarterly Retail Sales Statistics | ||||||||||||||
| Machines and E&T Combined | 2nd Quarter 2022 | 1st Quarter 2022 | 4th Quarter 2021 | 3rd Quarter 2021 | ||||||||||
| World | DOWN 3% | UP 2% | UP 7% | UP 14% | ||||||||||
| Machines | 2nd Quarter 2022 | 1st Quarter 2022 | 4th Quarter 2021 | 3rd Quarter 2021 | ||||||||||
| Asia/Pacific | DOWN 14% | DOWN 18% | DOWN 8% | DOWN 4% | ||||||||||
| EAME | DOWN 3% | UP 10% | UP 24% | UP 22% | ||||||||||
| Latin America | UP 18% | DOWN 1% | UP 15% | UP 57% | ||||||||||
| North America | DOWN 3% | UP 17% | UP 1% | UP 19% | ||||||||||
| World | DOWN 4% | UP 3% | UP 5% | UP 17% | ||||||||||
| Resource Industries (RI) | 2nd Quarter 2022 | 1st Quarter 2022 | 4th Quarter 2021 | 3rd Quarter 2021 | ||||||||||
| Asia/Pacific | UP 3% | UP 23% | UP 47% | UP 18% | ||||||||||
| EAME | DOWN 1% | UP 17% | UP 13% | UP 20% | ||||||||||
| Latin America | DOWN 4% | DOWN 34% | DOWN 20% | UP 130% | ||||||||||
| North America | DOWN 7% | UP 36% | DOWN 7% | UP 30% | ||||||||||
| World | DOWN 2% | UP 13% | UP 10% | UP 33% | ||||||||||
| Construction Industries (CI) | 2nd Quarter 2022 | 1st Quarter 2022 | 4th Quarter 2021 | 3rd Quarter 2021 | ||||||||||
| Asia/Pacific | DOWN 21% | DOWN 31% | DOWN 23% | DOWN 10% | ||||||||||
| EAME | DOWN 3% | UP 8% | UP 29% | UP 23% | ||||||||||
| Latin America | UP 28% | UP 25% | UP 40% | UP 31% | ||||||||||
| North America | DOWN 3% | UP 14% | UP 3% | UP 17% | ||||||||||
| World | DOWN 4% | UNCHANGED | UP 4% | UP 12% | ||||||||||
| Reported in dollars and based on unit sales as reported primarily by dealers. | ||||||||||||||
Energy & Transportation (E&T) Retail Sales by industry for the quarter ended as indicated compared with the same period of the prior year: | ||||||||||||||
| Energy & Transportation (E&T) | 2nd Quarter 2022 | 1st Quarter 2022 | 4th Quarter 2021 | 3rd Quarter 2021 | ||||||||||
| Power Gen | UP 7% | DOWN 10% | UP 3% | DOWN 8% | ||||||||||
| Industrial | UP 19% | UP 26% | UP 30% | UP 36% | ||||||||||
| Transportation | DOWN 9% | UP 50% | UP 42% | DOWN 12% | ||||||||||
| Oil & Gas | DOWN 13% | DOWN 12% | UP 9% | UP 21% | ||||||||||
| Total | UNCHANGED | DOWN 1% | UP 12% | UP 8% | ||||||||||
| Reported in dollars based on reporting from dealers and direct sales. | ||||||||||||||
| · asphalt pavers | · forestry machines | · small and medium | ||||||
· backhoe loaders |
· material handlers | track-type tractors | ||||||
· compactors |
· motorgraders | · track-type loaders | ||||||
· cold planers |
· pipelayers | · wheel excavators |
||||||
· compact track and |
· road reclaimers | · compact, small and medium |
||||||
| multi-terrain loaders | · skid steer loaders | wheel loaders | ||||||
| · mini, small, medium | · telehandlers | |||||||
| and large track excavators | ||||||||
| · electric rope shovels | · longwall miners | · landfill compactors | ||||||
| · draglines | · large wheel loaders | · soil compactors | ||||||
| · hydraulic shovels | · off-highway trucks | · machinery components | ||||||
| · rotary drills | · articulated trucks | · autonomous ready vehicles and | ||||||
| · hard rock vehicles | · wheel tractor scrapers | solutions | ||||||
| · large track-type tractors | · wheel dozers | |||||||
| · large mining trucks | ||||||||