Document
UNITED STATES
SECURITIES AND EXCHANGE COMMISSION
Washington D.C. 20549
FORM 6-K
REPORT OF FOREIGN PRIVATE ISSUER
PURSUANT TO RULE 13a-16 OR 15d-16 OF
THE SECURITIES EXCHANGE ACT OF 1934
For the month of Aug 2025
Comission File Number 001-32535
Grupo Cibest S.A.
(Translation of registrant’s name into English)
Cra. 48 # 26-85
Medellín, Colombia
(Address of principal executive offices)
Indicate by check mark whether the registrant files or will file annual reports under cover of Form 20-F or Form 40-F.
Form 20-F þ Form 40-F o
Indicate by check mark if the registrant is submitting the Form 6-K in paper as permitted by Regulation S-T Rule 101(b)(1):___
Indicate by check mark if the registrant is submitting the Form 6-K in paper as permitted by Regulation S-T Rule 101(b)(2):___
Indicate by check mark whether the registrant by furnishing the information contained in this form is also thereby furnishing the information to the Commission pursuant to Rule 12g3-2(b) under the Securities Exchange Act of 1934.
Yes o No þ
If “Yes” is marked, indicate below the file number assigned to the registrant in connection with Rule 12g3-2(b): 82-__________.
GRUPO CIBEST (NYSE: CIB; BVC: CIBEST Y PFCIBEST) REPORTS FINANCIAL RESULTS FOR THE SECOND QUARTER OF 2025
•Net income attributable to shareholders for the second quarter of 2025 was COP 1.8 trillion. This value represents an increase of 3.1% compared to the previous quarter and 24.4% compared to 2Q24. The quarterly annualized return on equity (ROE) for Grupo Cibest was 17.5% for the quarter and 16.1% for the last twelve months.
•The net interest margin for the second quarter of 2025 was 6.57%, increasing by 14 basis points compared to 1Q25. Net interest income reached COP 5.2 trillion, up 3.2% quarter-over-quarter and down 0.5% year-over-year.
•Grupo Cibest's gross loan portfolio amounted to COP 280 trillion, an increase of 0.4% from the previous quarter and 4.4% from 2Q24. The quarterly growth is explained by higher balances across all loan portfolios. Deposits closed 2Q25 at COP 283 trillion, up 2.4% over 1Q25 and 9.6% over 2Q24. The quarterly increase was mainly due to growth in savings accounts.
•The 30-day past-due loan ratio stood at 4.54%, and the 90-day ratio at 3.19%. Total provisions charges for 2Q25 decreased by 0.3% compared to 1Q25 and were COP 1,100 billion, representing a quarterly annualized cost of credit of 1.57%. All loan portfolios showed a reduction in provision expenses.
•Shareholders’ equity closed at COP 41.3 trillion as of June 30, 2025, showing a 1.6% growth compared to the previous quarter and 5.3% year-over-year; the quarterly increase is explained by the increase in retained earnings during the period.
•In terms of digital strategy, a favorable trend is observed in line with results from the past year. As of June 2025, Bancolombia had 9.4 million active digital clients in the APP Personas (measured over a 90-day period), as well as 25.5 million accounts on its financial inclusion platform Nequi.
•On page 12 of this document, the statement of financial position, income statement, and key indicators of Bancolombia S.A. as of 2Q25 are presented, compared to pro forma figures from previous quarters that assume the completion of the corporate evolution toward Grupo Cibest, solely for the purpose of providing comparability in analyzing the entity’s performance in 2Q25. Additionally, Annex 1 on page 26 presents the details of the corporate structure evolution transactions.
August 6, 2025. Medellín, Colombia – Today, GRUPO CIBEST announced its financial results for the second quarter of 2025.
_________________________________________
This report corresponds to the unaudited consolidated financial information of GRUPO CIBEST S.A. and its subsidiaries (“Grupo Cibest” or “Cibest”), which it controls, among others, by directly or indirectly owning more than 50% of the voting equity interest. This financial information has been prepared based on accounting records in accordance with International Financial Reporting Standards (IFRS) and is presented in nominal terms. The financial information for the quarter ended June 30, 2025, is not necessarily indicative of results expected for any other future period. For further information, please refer to the SEC website, where company-related releases can be found: www.sec.gov.FORWARD-LOOKING STATEMENTS DISCLAIMER: This release contains statements that may be considered forward-looking within the meaning of Section 27A of the U.S. Securities Act of 1933 and Section 21E of the U.S. Securities Exchange Act of 1934. All forward-looking statements made in this release or in future filings or press releases are subject to risks and uncertainties; factors such as changes in the general economic situation and business conditions, exchange rate and interest rate volatility, introduction of competing products by other companies, lack of acceptance of new products or services by our target customers, changes in business strategy, and other factors could cause actual results to differ materially from those set forth in such statements. CIBEST does not intend, and assumes no obligation, to update these statements. Some figures included in this release may be subject to rounding adjustments. Any reference to CIBEST or GRUPO EMPRESARIAL CIBEST should be understood as Grupo Cibest and its subsidiaries, unless otherwise specified. The comma (,) is used as a decimal separator and the period (.) as a thousand separator.
Representative Exchange Rate: July 1, 2025, $4,069.67 = US$ 1
GRUPO CIBEST: Summary of consolidated financial quarterly results
|
|
|
|
|
|
|
|
|
|
|
|
|
|
|
|
|
|
|
|
|
|
|
|
STATEMENT OF FINANCIAL POSITION AND INCOME STATEMENT, CONSOLIDATED |
Quarter |
Change |
|
| (COP million) |
2Q24 |
1Q25 |
2Q25 |
2Q25 / 1Q25 |
|
2Q25 / 2Q24 |
|
| ASSETS |
|
|
|
|
|
|
|
| Net Loans |
251,427,847 |
|
262,990,202 |
|
265,000,599 |
|
0.76 |
% |
5.40 |
% |
| Investments |
30,573,634 |
|
36,394,058 |
|
40,910,075 |
|
12.41 |
% |
33.81 |
% |
| Other assets |
70,197,591 |
|
64,741,051 |
|
69,340,052 |
|
7.10 |
% |
-1.22 |
% |
| Total assets |
352,199,072 |
|
364,125,311 |
|
375,250,726 |
|
3.06 |
% |
6.55 |
% |
|
|
|
|
|
|
|
|
| LIABILITIES AND SHAREHOLDERS’ EQUITY |
|
|
|
|
|
|
|
| Deposits |
257,869,276 |
|
276,030,117 |
|
282,647,329 |
|
2.40 |
% |
9.61 |
% |
| Other liabilities |
54,124,846 |
|
46,406,159 |
|
50,219,111 |
|
8.22 |
% |
-7.22 |
% |
| Total liabilities |
311,994,122 |
|
322,436,276 |
|
332,866,440 |
|
3.23 |
% |
6.69 |
% |
| Non-controlling interest |
985,035 |
|
1,054,609 |
|
1,090,211 |
|
3.38 |
% |
10.68 |
% |
| Shareholders' equity |
39,219,915 |
|
40,634,426 |
|
41,294,075 |
|
1.62 |
% |
5.29 |
% |
| Total liabilities and shareholders' equity |
352,199,072 |
|
364,125,311 |
|
375,250,726 |
|
3.06 |
% |
6.55 |
% |
|
|
|
|
|
|
|
|
| Interest income |
8,943,475 |
|
8,413,459 |
|
8,619,933 |
|
2.45 |
% |
-3.62 |
% |
| Interest expense |
(3,756,886) |
|
(3,349,459) |
|
(3,393,009) |
|
1.30 |
% |
-9.69 |
% |
| Net interest income |
5,186,589 |
|
5,064,000 |
|
5,226,924 |
|
3.22 |
% |
0.78 |
% |
| Net provisions |
(1,618,783) |
|
(1,099,549) |
|
(1,096,335) |
|
-0.29 |
% |
-32.27 |
% |
| Fees and income from service, net |
1,041,798 |
|
1,017,768 |
|
1,091,880 |
|
7.28 |
% |
4.81 |
% |
| Other operating income |
741,084 |
|
836,571 |
|
830,720 |
|
-0.70 |
% |
12.10 |
% |
| Total Dividends received and equity method |
(225,575) |
|
137,325 |
|
121,351 |
|
-11.63 |
% |
-153.80 |
% |
| Total operating expense |
(3,300,036) |
|
(3,492,428) |
|
(3,690,544) |
|
5.67 |
% |
11.83 |
% |
| Profit before tax |
1,825,077 |
|
2,463,687 |
|
2,483,996 |
|
0.82 |
% |
36.10 |
% |
| Income tax |
(363,323) |
|
(698,912) |
|
(655,050) |
|
-6.28 |
% |
80.29 |
% |
| Net income before non-controlling interest |
1,461,754 |
|
1,764,775 |
|
1,828,946 |
|
3.64 |
% |
25.12 |
% |
| Non-controlling interest |
(21,980) |
|
(27,111) |
|
(37,643) |
|
38.85 |
% |
71.26 |
% |
| Net income |
1,439,774 |
|
1,737,664 |
|
1,791,303 |
|
3.09 |
% |
24.42 |
% |
|
|
|
|
|
|
|
|
|
|
|
|
|
|
|
|
|
|
|
|
|
|
|
|
|
|
|
|
|
|
|
|
|
|
|
|
|
Quarter |
|
As of |
|
| PRINCIPAL RATIOS |
2Q24 |
|
1Q25 |
|
2Q25 |
|
2Q24 |
|
2Q25 |
|
| PROFITABILITY |
|
|
|
|
|
|
|
|
|
|
| Net interest margin (1) from continuing operations |
7.05 |
|
% |
6.43 |
|
% |
6.57 |
|
% |
7.09 |
|
% |
6.50 |
|
% |
| Return on average total assets (2) from continuing operations |
1.69 |
|
% |
1.91 |
|
% |
1.94 |
|
% |
1.82 |
|
% |
1.92 |
|
% |
| Return on average shareholders´ equity (3) |
15.32 |
|
% |
16.26 |
|
% |
17.49 |
|
% |
16.26 |
|
% |
16.80 |
|
% |
| EFFICIENCY |
|
|
|
|
|
|
|
|
— |
|
|
| Operating expenses to net operating income |
48.93 |
|
% |
49.57 |
|
% |
50.69 |
|
% |
47.62 |
|
% |
50.14 |
|
% |
| Operating expenses to average total assets |
3.87 |
|
% |
3.84 |
|
% |
3.99 |
|
% |
3.81 |
|
% |
3.91 |
|
% |
| Operating expenses to productive assets |
4.49 |
|
% |
4.44 |
|
% |
4.62 |
|
% |
4.45 |
|
% |
4.53 |
|
% |
| KEY FINANCIAL HIGHLIGHTS |
|
|
|
|
|
|
|
|
|
|
| Net income per ADS from continuing operations |
1.54 |
|
|
1.74 |
|
|
1.79 |
|
|
3.32 |
|
|
3.53 |
|
|
| Net income per share $COP from continuing operations |
1,511 |
|
|
1,822 |
|
|
1,877 |
|
|
3,256 |
|
|
3,699 |
|
|
| P/BV ADS (4) |
0.83 |
|
|
1.00 |
|
|
1.09 |
|
|
0.83 |
|
|
1.09 |
|
|
| P/BV Local (5) (6) |
0.87 |
|
|
1.11 |
|
|
1.19 |
|
|
0.87 |
|
|
1.19 |
|
|
| P/E (7) from continuing operations |
5.78 |
|
|
6.19 |
|
|
6.59 |
|
|
5.37 |
|
|
6.69 |
|
|
| ADR price |
32.65 |
|
|
40.20 |
|
|
46.19 |
|
|
32.65 |
|
|
46.19 |
|
|
| Common share price (8) |
35,300 |
|
|
47,000 |
|
|
51,000 |
|
|
35,300 |
|
|
51,000 |
|
|
| Weighted average of Preferred Shares outstanding |
961,827,000 |
|
|
961,827,000 |
|
|
961,827,000 |
|
|
961,827,000 |
|
|
961,827,000 |
|
|
| USD exchange rate (quarter end) |
4,148.04 |
|
|
4,191.79 |
|
|
4,069.67 |
|
|
4,148.04 |
|
|
4,069.67 |
|
|
(1)Defined as net interest income divided by monthly average interest-earning assets. (2) Net income divided by monthly average assets. (3) Net income divided by monthly average shareholders’ equity. (4) Defined as ADS price divided by ADS book value. (5) Defined as share price divided by share book value. (6) Share prices on the Colombian Stock Exchange. (7) Defined as market capitalization divided by annualized quarter results. (8) Prices at the end of the respective quarter.
1. CONSOLIDATED STATEMENT OF FINANCIAL POSITION GRUPO CIBEST
1.1. Loan Portfolio
The following table shows the composition of Grupo Cibest loans on a consolidated basis by type and currency:
|
|
|
|
|
|
|
|
|
|
|
|
|
|
|
|
|
|
|
|
|
|
|
|
|
|
|
|
|
|
|
|
|
|
|
|
|
|
|
| (COP Million) |
Amounts in COP |
|
Amounts in USD
converted to COP |
|
Amounts in USD
(thousands) |
|
Total |
|
| (1 USD = 4069.67 COP) |
2Q25 |
2Q25 / 1Q25 |
|
2Q25 |
2Q25 / 1Q25 |
|
2Q25 |
2Q25 / 1Q25 |
|
2Q25 |
2Q25 / 1Q25 |
|
| Commercial loans |
127,272,864 |
|
0.47 |
% |
53,373,873 |
|
-0.97 |
% |
13,115,037 |
|
2.00 |
% |
180,646,737 |
|
0.04 |
% |
| Consumer loans |
36,894,375 |
|
2.27 |
% |
18,212,843 |
|
-1.76 |
% |
4,475,263 |
|
1.18 |
% |
55,107,218 |
|
0.90 |
% |
| Mortgage loans |
27,209,082 |
|
4.30 |
% |
15,293,080 |
|
-3.67 |
% |
3,757,818 |
|
-0.78 |
% |
42,502,162 |
|
1.28 |
% |
| Small business loans |
912,050 |
|
18.89 |
% |
630,718 |
|
-0.05 |
% |
154,980 |
|
2.95 |
% |
1,542,768 |
|
10.34 |
% |
| Interests paid in advance |
(23,733) |
|
-0.08 |
% |
(3,466) |
|
-3.90 |
% |
(852) |
|
-1.02 |
% |
(27,198) |
|
-0.58 |
% |
| Gross loans |
192,264,639 |
|
1.41 |
% |
87,507,047 |
|
-1.61 |
% |
21,502,246 |
|
1.34 |
% |
279,771,686 |
|
0.45 |
% |
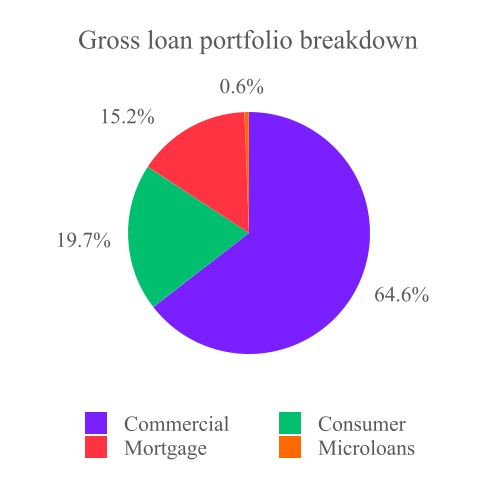
Gross loan portfolio slightly grew compared to the previous quarter, driven by increases in all loan segments, with the highest percentage growth in the mortgage portfolio. This segment continues the positive trend observed since last year, recording a quarterly increase of 1.3% and an annual increase of 9.8%.
The quarterly and annual increases in the mortgage portfolio are attributed to the interest rate reduction strategy implemented in Colombia since July 2024. In Panama, Guatemala, and El Salvador, there was a slight decrease in the quarter.
Unlike the previous quarter, the consumer loan portfolio grew, mainly driven by Nequi, extending the trend from the previous quarter, as well as by credit card and payroll products. It is noteworthy that Bancolombia S.A. posted increases in the balance for each of the three months that make up the quarter, a contrast to the behavior observed in 2023 and 2024. Likewise, Banco Agricola continued its growth trend from previous quarters in this portfolio, focusing on higher risk-adjusted return segments. In contrast, Banistmo maintained its downward trend for the last three quarters, due to lower activity in credit card and unsecured loan products.
The commercial loan portfolio posted a slight growth of 0.04% for the quarter and 4.3% year-over-year. While quarterly increases were recorded at Banistmo, Bam, and Banco Agricola, the moderate growth in Colombia and the appreciation of the Colombian peso limited the consolidated portfolio grow.
On a quarterly basis, Bancolombia S.A. grew 1.1% in gross loan portfolio, Banco Agricola 3.5% (measured in USD), Banco Agromercantil 1.4% (measured in USD), while Banistmo posted a decrease of 0.1% (measured in USD).
In 2Q25, the gross loan portfolio increased 0.4% compared to 1Q25 (1.4% excluding the FX effect) and 4.4% compared to 2Q24 (5.0% excluding the FX effect). Over the past twelve months, the peso-denominated portfolio grew 6.9%, while the dollar-denominated portfolio (measured in USD) decreased 0.9%. The Colombian peso appreciated 2.9% against the US dollar during 2Q25, and 1.9% over the last twelve months. The average exchange rate was 0.1% higher in 2Q25 versus the previous quarter, and 7.0% higher year-over-year.
Allowances for loan losses decreased 4.9% during the quarter, totaling COP 14,771 billion, which is equivalent to 5.3% of the gross loan portfolio.
For a more detailed explanation regarding portfolio coverage and asset quality, see section 2.4. asset quality and provision charges.
The following table summarizes Grupo Cibest’s total loan portfolio:
|
|
|
|
|
|
|
|
|
|
|
|
|
|
|
|
|
|
|
|
|
|
|
|
|
|
|
|
|
|
|
LOAN PORTFOLIO
(COP million)
|
2Q24 |
1Q25 |
2Q25 |
2Q25 / 1Q25 |
|
2Q25 / 2Q24 |
|
% of total
loans |
|
| Commercial |
173,269,881 |
|
180,571,209 |
|
180,646,737 |
|
0.04 |
% |
4.26 |
% |
64.57 |
% |
| Consumer |
55,049,622 |
|
54,616,427 |
|
55,107,218 |
|
0.90 |
% |
0.10 |
% |
19.70 |
% |
| Mortgage |
38,713,478 |
|
41,964,536 |
|
42,502,162 |
|
1.28 |
% |
9.79 |
% |
15.19 |
% |
| Microcredit |
1,096,958 |
|
1,398,191 |
|
1,542,768 |
|
10.34 |
% |
40.64 |
% |
0.55 |
% |
| Interests received in advance |
(21,257) |
|
(27,358) |
|
(27,198) |
|
-0.58 |
% |
27.95 |
% |
-0.01 |
% |
| Total loan portfolio |
268,108,682 |
|
278,523,006 |
|
279,771,686 |
|
0.45 |
% |
4.35 |
% |
100.00 |
% |
| Allowance for loan losses |
(16,680,835) |
|
(15,532,803) |
|
(14,771,088) |
|
-4.90 |
% |
-11.45 |
% |
|
|
| Total loans, net |
251,427,847 |
|
262,990,203 |
|
265,000,598 |
|
0.76 |
% |
5.40 |
% |
|
|
Loan portfolio breakdown by currency and region
1.2. Funding
As of the second quarter of 2025, customer deposits totaled COP 282,647 billion, representing 84.9% of total liabilities. This balance reflects a 2.4% increase compared to the previous quarter, mainly driven by higher savings accounts balances, largely explained by a higher remuneration rate at Bancolombia. To a lesser extent, checking accounts also grew, primarily associated with the corporate segment's activity at Bam. Time deposits registered a slight increase of 0.1%, due to the positive performance of the online time deposits product. On an annual basis, deposits grew by 9.6%, with savings accounts showing the highest level of dynamism.
In the funding mix, sight deposits remain as the main source of funding, accounting for 53.5% of the total. Within this category, savings accounts maintained their relevance and increased their share, reaching 41.8% of Grupo Cibest’s total funding during the quarter. Checking accounts also posted a slight increase in participation, while time deposits reduced their contribution given the modest quarterly growth versus total deposits. Finally, other sources of funding increased their quarterly share, mainly driven by the growth in repo operations as a result of liquidity management during the period.
|
|
|
|
|
|
|
|
|
|
|
|
|
|
|
|
|
|
|
|
|
|
|
|
|
|
|
|
|
|
|
|
|
|
|
|
|
|
|
|
|
|
FUNDING MIX COP Million |
2Q24 |
% Liabilities with cost |
2Q25/ 2Q24 |
1Q25 |
% Liabilities with cost |
2Q25/ 1Q25 |
2Q25 |
% Liabilities with cost |
| Checking accounts |
35,245,828 |
|
12 |
|
% |
2.22 |
|
% |
35,588,232 |
|
12 |
|
% |
1.23 |
|
% |
36,027,027 |
|
12 |
|
% |
| Saving accounts |
111,241,322 |
|
39 |
|
% |
16.26 |
|
% |
124,114,011 |
|
41 |
|
% |
4.20 |
|
% |
129,326,941 |
|
42 |
|
% |
| Time deposits |
106,871,203 |
|
37 |
|
% |
4.24 |
|
% |
111,289,855 |
|
37 |
|
% |
0.10 |
|
% |
111,403,425 |
|
36 |
|
% |
| Other deposits |
5,105,906 |
|
2 |
|
% |
92.53 |
|
% |
6,303,747 |
|
2 |
|
% |
55.94 |
|
% |
9,830,290 |
|
3 |
|
% |
| Long term debt |
16,107,674 |
|
6 |
|
% |
(35.51) |
|
% |
10,878,328 |
|
4 |
|
% |
(4.50) |
|
% |
10,388,366 |
|
3 |
|
% |
| Loans with banks |
13,449,759 |
|
5 |
|
% |
(8.98) |
|
% |
12,533,751 |
|
4 |
|
% |
(2.32) |
|
% |
12,242,580 |
|
4 |
|
% |
| Total Funds |
288,021,692 |
|
100 |
|
% |
7.36 |
|
% |
300,707,924 |
|
100 |
|
% |
2.83 |
|
% |
309,218,629 |
|
100 |
|
% |
1.3. Shareholders’ Equity
Shareholders’ equity attributable at the end of 2Q25 stood at COP 41,294 billion, representing a 1.6% increase compared to 1Q25 and a 5.3% increase versus 2Q24. This growth is explained by higher retained earnings during the quarter.
2.INCOME STATEMENT GRUPO CIBEST
Net income attributable to equity holders totaled COP 1,791 billion in 2Q25, or COP 1,876.8 per share (USD $1.79 per ADR). Net income increased by 3.1% compared to 1Q25, primarily driven by higher net interest and fee income. The quarterly annualized return on equity (ROE) for Grupo Cibest reached 17.5% in 2Q25 and 16.13% over the last 12 months.
2.1.Net Interest Income & Net Interest Income
Net interest income totaled COP 5,227 billion in 2Q25, reflecting a 3.2% increase compared to 1Q25. This performance was mostly due to loan portfolio interest income growth across all segments, supported by higher balances and improved yield rates against the previous quarter. Interest expense increased slightly, reflecting a higher cost of funds in Colombia, along with an increase in time deposits at Bancolombia S.A., Banco Agricola, and Banistmo.
Additionally, interest income from debt instruments and valuation of financial instruments reached COP 672 billion, representing a 12.2% increase quarter-over-quarter. This variation was mainly attributable to higher yields on debt securities, associated with active liquidity portfolio management.
The annualized weighted average cost of deposits was 4.18% in 2Q25, up 9 basis points compared to 1Q25.
As a result, the loan portfolio NIM reached 7.06% for the quarter, increasing 6 basis points from 1Q25 and decreasing 63 basis points year-over-year. The NIM on investments was 3.38%, up 59 basis points from 1Q25. Finally, the consolidated NIM increased by 14 basis points in the quarter, rising from 6.43% to 6.57%.
|
|
|
|
|
|
|
|
|
|
|
|
|
|
|
|
|
|
|
|
|
|
|
|
Portfolio yield by category |
|
2Q24 |
|
1Q25 |
|
2Q25 |
|
| Commercial Portfolio |
|
12.71 |
% |
11.02 |
% |
11.08 |
% |
| Consumer Portfolio |
|
16.12 |
% |
14.43 |
% |
14.60 |
% |
| Housing Portfolio |
|
8.55 |
% |
8.29 |
% |
8.42 |
% |
| Microcredit Portfolio |
|
19.56 |
% |
18.38 |
% |
19.72 |
% |
| Total Portfolio |
|
12.85 |
% |
11.32 |
% |
11.41 |
% |
|
|
|
|
|
|
|
|
|
|
|
|
|
|
|
|
|
|
|
|
|
Average weighted
funding cost |
2Q24 |
|
1Q25 |
|
2Q25 |
|
| Checking accounts |
0.33 |
% |
0.27 |
% |
0.34 |
% |
| Saving accounts |
2.71 |
% |
2.23 |
% |
2.34 |
% |
| Time deposits |
8.81 |
% |
7.55 |
% |
7.61 |
% |
| Total deposits |
4.89 |
% |
4.09 |
% |
4.18 |
% |
| Others |
6.06 |
% |
5.28 |
% |
4.89 |
% |
| Total cost of liabilities (1) |
5.04 |
% |
4.20 |
% |
4.23 |
% |
(1) refers to interest-bearing liabilities.
|
|
|
|
|
|
|
|
|
|
|
|
|
|
|
|
|
|
|
|
|
Annualized Interest
Margin |
2Q24 |
|
1Q25 |
|
2Q25 |
|
| Loans' Interest margin |
7.69 |
|
% |
7.00 |
|
% |
7.06 |
|
% |
| Debt investments' margin |
2.60 |
|
% |
2.80 |
|
% |
3.38 |
|
% |
Net interest margin (1) |
7.05 |
|
% |
6.43 |
|
% |
6.57 |
|
% |
| (1) Net interest margin and valuation income on financial instruments. |
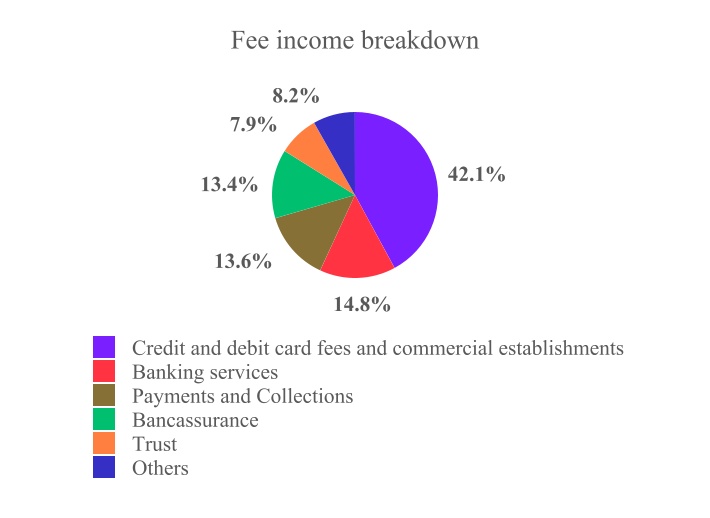
2.2. Fees and Income from Services
Net fee and service income for 2Q25 amounted to COP 1,092 billion, representing a 7.3% increase compared to 1Q25.
On a quarterly basis, bancassurance revenues posted the strongest growth, driven by the higher origination of the consumer loan portfolio; additionally, there was a moderate increase in debit and credit card fees, and commercial establishments, due to higher transaction volumes during the period compared to 1Q25.
Fee expenses grew during the quarter, mainly explained by increased payments to franchises due to a greater transaction volume in banking services, as well as higher outflows to banking agents driven by an increased level of transactions through this channel.
2.3. Other Operating Income
Total other operating income amounted to COP 831 billion in 2Q25, representing a 0.7% decrease compared to the first quarter of the year and a 12.1% increase compared to 2Q24. This decrease is mainly due to the net effect of foreign exchange derivatives and foreign exchange, resulting from the variation in the exchange rate during the period, an effect partially offset by a revaluation of investment properties in FCP Fondo Inmobiliario Colombia, driven by UVR indexation and new property appraisals. It is worth noting the increase in income from hedging derivatives offered to clients, associated with greater market uncertainty.
On the other hand, operating lease income totaled COP 434 billion in the second quarter, representing a 3.3% decrease compared to the previous quarter. This decline was mainly due to a reduction in vehicle leasing in Renting Colombia.
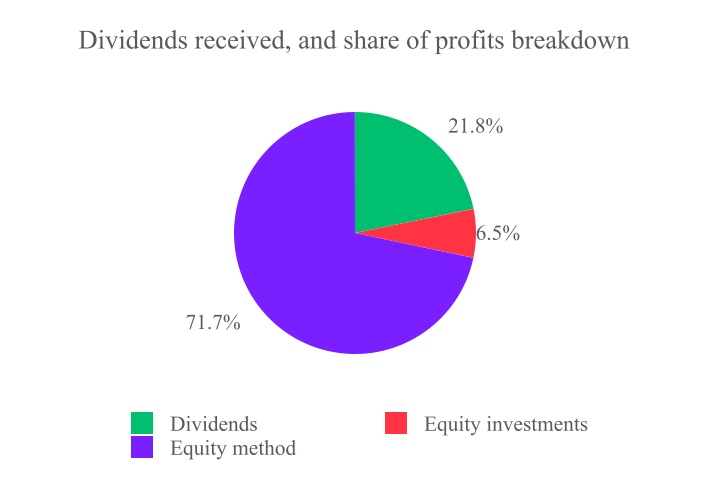
2.4. Dividends received, and share of profits
Total dividend and other net income from equity investments for 2Q25 amounted to COP 121 billion, representing an 11.6% decrease compared to 1Q25 and a 153.8% increase versus 2Q24. The quarterly decrease was mainly due to lower income from the equity method in P.A. Viva Malls, while the annual increase was explained by a base effect, as in 2Q24 there was an impairment of associates and joint ventures related to Tuya S.A. based on market valuation.
2.5. Asset Quality and Provision Charges
The principal balance for past due loans (those that are overdue for more than 30 days) totaled COP 12,401 billion at the end of 2Q25, representing 4.54% of total gross loans, while 90-day past-due totaled COP 8,717 billion, accounting for 3.19%. The decrease in the 30-day indicator was mainly attributable to improved performance in the retail segment at Bancolombia S.A. and Banistmo. On the other hand, the slight increase in the 90-day ratio was driven by a higher balance of the consumer portfolio entering past-due at Banco Agricola.
Coverage, measured as the ratio of loan loss reserves (principal) to past due loans (over 30 days), stood at 107.7% at the close of 2Q25, down from 111.2% in 1Q25. Loan deterioration (new past due loans including charge-offs) during 1Q25 was COP 1,376 billion. The higher value compared to 1Q25 was mainly explained by the consumer portfolio at Bam.
Provision charges (after recoveries) totaled COP 1,096 billion in 2Q25, a decrease of 0.3% compared to 1Q25. During the quarter, the positive outlook for loan quality persisted, reflected by a widespread decrease in provision expenses across most segments and geographies. However, there were some exceptions in the retail segment at Banco Agricola and Bam, and specific clients in Banistmo. Additionally, there was an increase in provisions related to models and macroeconomic forecasts, explained by methodological updates and adjustments in economic expectations across all regions.
Provisions as a percentage of average gross loans, quarterly annualized, were 1.57% for 2Q25 and 1.71% for the last 12 months. Grupo Cibest maintains a statement of financial position supported by an adequate level of past-due loan reserves. Loan loss provisions (for the principal) totaled COP 13,358 billion, or 4.9% of gross loans as of the end of 2Q25, decreasing compared to 1Q24.
Stage 2+3 loan portfolio continued to decrease compared to the previous quarter, mainly driven by the positive performance of the portfolios, especially at Bancolombia S.A. and Banistmo, with the respective coverage level remaining stable.
The following tables present key metrics related to asset quality:
|
|
|
|
|
|
|
|
|
|
|
|
|
|
|
|
|
|
|
|
|
| ASSET QUALITY |
As of |
|
| (COP millions) |
2Q24 |
|
1Q25 |
|
2Q25 |
|
| Total 30-day past due loans |
13,503,420 |
|
|
12,581,781 |
|
|
12,401,167 |
|
|
Allowance for loan losses (1) |
15,131,222 |
|
|
13,986,022 |
|
|
13,358,386 |
|
|
| Past due loans to total loans |
5.17 |
% |
4.64 |
% |
4.54 |
% |
| Allowances to past due loans |
112.05 |
% |
111.16 |
% |
107.72 |
% |
| Allowance for loan losses as a percentage of total loans |
5.80 |
% |
5.16 |
% |
4.89 |
% |
___________________
(1)Allowances for the principal of loans.
|
|
|
|
|
|
|
|
|
|
|
|
|
|
|
|
|
|
|
|
|
|
|
|
|
|
|
|
% Of loan
Portfolio |
|
30 days |
|
| PDL Per Category |
|
2Q24 |
|
1Q25 |
|
2Q25 |
|
| Commercial loans |
64.6 |
% |
3.53 |
% |
3.43 |
% |
3.53 |
% |
| Consumer loans |
19.7 |
% |
8.33 |
% |
6.72 |
% |
6.05 |
% |
| Mortgage loans |
15.2 |
% |
7.83 |
% |
6.98 |
% |
6.76 |
% |
| Microcredit |
0.6 |
% |
10.62 |
% |
7.39 |
% |
7.12 |
% |
| PDL TOTAL |
|
|
5.17 |
% |
4.64 |
% |
4.54 |
% |
|
|
|
|
|
|
|
|
|
|
|
|
|
|
|
|
|
|
|
|
|
|
|
|
|
|
|
|
% Of loan
Portfolio |
|
90 days |
|
| PDL Per Category |
|
2Q24 |
|
1Q25 |
|
2Q25 |
|
| Commercial loans |
64.6 |
% |
2.94 |
% |
2.94 |
% |
3.08 |
% |
| Consumer loans |
19.7 |
% |
4.93 |
% |
3.84 |
% |
3.55 |
% |
| Mortgage loans* |
15.2 |
% |
3.38 |
% |
3.25 |
% |
3.18 |
% |
| Microcredit |
0.6 |
% |
6.81 |
% |
4.23 |
% |
4.30 |
% |
| PDL TOTAL |
|
|
3.43 |
% |
3.17 |
% |
3.19 |
% |
________________________
*Mortgage loans that were overdue were calculated for past due loans for 120 days instead of 90 days.
|
|
|
|
|
|
|
|
|
|
|
|
|
|
|
|
|
|
|
|
|
|
|
|
|
|
|
|
|
|
|
|
|
|
|
|
|
|
|
Loans by stages |
|
1Q25 |
|
2Q25 |
|
2Q25 / 1Q25 |
|
|
Loans |
Allowances |
% |
|
Loans |
Allowances |
% |
|
Loans |
|
Allowances |
|
| Stage 1 |
245,451,655 |
|
2,088,823 |
|
0.9 |
% |
247,706,322 |
|
2,087,982 |
|
0.8 |
% |
0.9 |
% |
(0.04) |
% |
| Stage 2 |
16,560,544 |
|
2,740,331 |
|
16.5 |
% |
16,578,878 |
|
2,683,361 |
|
16.2 |
% |
0.1 |
% |
(2.1) |
% |
| Stage 3 |
16,510,806 |
|
10,703,649 |
|
64.8 |
% |
15,486,487 |
|
9,999,745 |
|
64.6 |
% |
(6.2) |
% |
(6.6) |
% |
| Total |
278,523,005 |
|
15,532,803 |
|
5.6 |
% |
279,771,687 |
|
14,771,088 |
|
5.3 |
% |
0.4 |
% |
(4.9) |
% |
Stage 1. Financial instruments that do not deteriorate since their initial recognition or that have low credit risk at the end of the reporting period. (12-month expected credit losses).
Stage 2. Financial instruments that have significantly increased their risk since their initial recognition. (Lifetime expected credit losses).
Stage 3. Financial instruments that have Objective Evidence of Impairment in the reported period. (Lifetime expected credit losses).
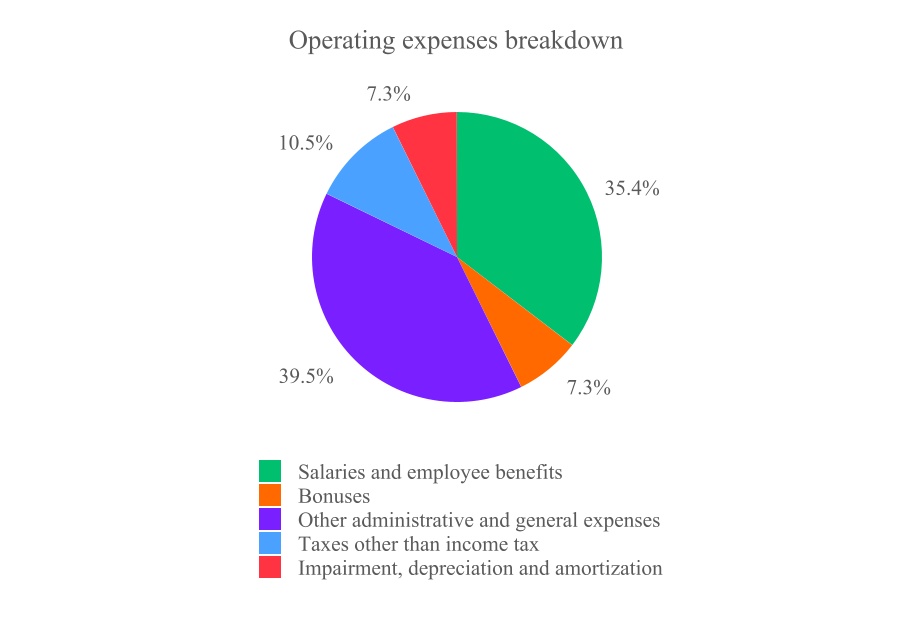
2.6. Operating Expenses
During 2Q25, operating expenses totaled COP 3,691 billion, reflecting a 5.7% increase compared to 1Q25 and an 11.8% growth versus 2Q24.
The efficiency ratio was 50.7% in 2Q25 and 50.2% over the last twelve months. Personnel expenses (salaries, employee benefits, and bonuses) amounted to COP 1,575 billion in 2Q25, representing a 2.9% increase over 1Q25, primarily due to higher bonus payments.
Year over year, there is a 16.8% increase, mainly due to the annual salary adjustment and higher bonuses, in line with the increased earnings recorded as of June.
General expenses totaled COP 2,115 billion for the quarter, representing a 7.8% increase over the previous quarter and an 8.4% rise compared to the second quarter of 2024. The quarterly increase was largely explained by the financial transaction tax associated with the one-time payment of ordinary and extraordinary dividends, as well as fees related to the corporate evolution towards Grupo Cibest. On an annual basis, the increase was also mainly due to fees related to the corporate evolution towards Grupo Cibest and higher technology licensing and maintenance costs.
As of June 30, 2025, Grupo Cibest had 33,993 employees, 850 branches, 6,105 ATMs, 35,235 banking agents, and more than 33 million clients.
2.7. Taxes
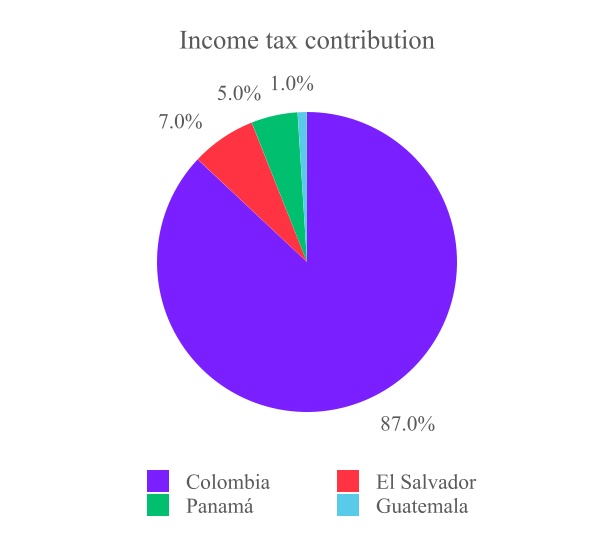
Grupo Cibest recorded an income tax expense of COP 655 billion, resulting in an effective tax rate of 28%. This outcome was driven by tax benefits in Colombia related to exempt income from the mortgage portfolio for social housing, investments in productive fixed assets, and investments in non-conventional renewable energy. Additionally, fiscal benefits in Guatemala, El Salvador, and Panama contributed, mainly due to exempt income from returns on securities issued by the respective governments.
3.BREAK DOWN OF PRINCIPAL OPERATIONS
The following tables summarize the financial statements of our operations in each country.
BANCOLOMBIA S.A. (STAND ALONE) – COLOMBIA
Colombia’s economy is showing signs of stabilization, with GDP growth of 2.7% in the first quarter of 2025 and an annual projection of 2.6%. Inflation has gradually declined to 4.8% as of June, approaching the target range for 2026. The Central Bank reduced its benchmark interest rate to 9.25%. However, fiscal challenges persist, with a projected deficit of 7.1% of GDP and public debt above 63%. Furthermore, international uncertainty, marked by geopolitical conflicts and new trade tariffs, could influence inflation and local monetary policy.
The loan portfolio of Bancolombia S.A. increased by 1.1% in the second quarter of 2025 against the previous quarter, and by 6.8% year-over-year. The largest quarterly growth was registered in the mortgage portfolio, mainly driven by the interest rate reduction strategy. Contrary to the trend observed over the last three quarters, the consumer loan portfolio posted an increase for the period, explained by strong performance in Nequi, credit cards, and payroll loans. Meanwhile, the commercial loan portfolio recorded the lowest growth; however, the quarter-over-quarter increase was largely attributable to improved performance in leasing.
Regarding funding structure, a higher balance was recorded during the quarter, driven by growth in savings accounts, time deposits, and checking accounts, in that order. The increase in savings accounts was concentrated primarily in the retail segment. Growth in time deposits was mainly due to higher balances in online time deposits product, while the rise in checking accounts was mostly observed in the corporate segment.
Net income for Bancolombia S.A. in 2Q25 amounted to COP 1.4 trillion, representing a 23.3% decrease compared to 1Q25. This reduction is mainly explained by lower dividends and other equity income as a result of the new corporate structure. Interest income increased, driven by the recovery of reliefs in the commercial portfolio, higher volumes in the consumer portfolio with stable yield, and a rise in the mortgage portfolio balance. Treasury income also increased, mainly due to better yields on debt securities. Interest expenses rose, reflecting higher balances in savings accounts and an increase in their funding rate. Provision expenses decreased, explained by better performance in the corporate and retail segments, as well as higher recoveries from charged-off loans. Operating expenses increased, mainly due to fees related to the formation of Grupo Cibest and the financial transaction tax arising from the payment of dividends.
Finally, the net interest margin for 2Q25 stood at 7.38%, the quarterly annualized ROE was 16.55%, and the cost of risk was 1.65%.
Below are the statement of financial position, income statement, and main indicators of Bancolombia S.A. as of 2Q25, compared to pro forma figures from previous quarters, which assume the completion of the corporate evolution towards Grupo Cibest at the relevant dates for comparability purposes.
|
|
|
|
|
|
|
|
|
|
|
|
|
|
|
|
|
|
| STATEMENT OF FINANCIAL POSITION |
Proforma
2Q24 |
Proforma
3Q24 |
Proforma
4Q24 |
Proforma
1Q25 |
Real
2Q25 |
|
|
|
|
|
|
| ASSETS |
|
|
|
|
|
| Cash and cash equivalents |
15,033,451 |
11,441,762 |
17,354,652 |
13,344,089 |
17,598,994 |
| Loan portfolio and leasing operations, net |
173,075,084 |
173,398,753 |
179,696,275 |
184,621,327 |
187,416,836 |
| Equity investments |
7,878,190 |
8,212,288 |
8,521,597 |
8,014,928 |
8,170,951 |
| Other assets |
12,803,489 |
13,310,860 |
12,308,566 |
11,382,861 |
10,395,477 |
| TOTAL ASSETS |
230,382,429 |
231,152,456 |
243,185,736 |
241,161,688 |
255,655,406 |
| LIABILITIES AND SHAREHOLDERS' EQUITY |
|
|
|
|
|
| LIABILITIES |
|
|
|
|
|
| Customer deposits |
170,986,606 |
172,270,646 |
185,801,073 |
185,175,224 |
194,416,941 |
| Financial obligations |
8,850,477 |
8,530,013 |
8,887,289 |
7,451,133 |
7,888,588 |
| Other liabilities |
24,523,873 |
21,798,851 |
19,374,972 |
21,409,303 |
22,108,867 |
| TOTAL LIABILITIES |
208,410,996 |
207,438,268 |
217,360,102 |
217,568,859 |
231,106,888 |
| TOTAL SHAREHOLDERS' EQUITY |
21,971,433 |
23,714,188 |
25,825,634 |
23,592,830 |
24,548,518 |
| TOTAL LIABILITIES AND SHAREHOLDERS' EQUITY |
230,382,429 |
231,152,455 |
243,185,736 |
241,161,689 |
255,655,406 |
|
|
|
|
|
|
|
|
|
|
|
|
|
|
|
|
|
|
| CONSOLIDATED STATEMENT OF FINANCIAL POSITION |
Proforma 2Q24 |
Proforma 3Q24 |
Proforma 4Q24 |
Proforma 1Q25 |
Real 2Q25 |
|
| Interest income and valuation allowance |
7,032,319 |
6,866,374 |
6,608,529 |
6,472,948 |
6,636,440 |
| Interest expense |
(3,015,082) |
(2,918,214) |
(2,774,081) |
(2,538,966) |
(2,536,529) |
| Provisions and impairment, net |
(1,320,138) |
(1,197,544) |
(624,999) |
(877,789) |
(814,368) |
| Fee and commission income, net |
666,325 |
676,578 |
729,600 |
675,891 |
710,931 |
| Other operating income, net |
330,619 |
488,528 |
468,745 |
515,413 |
386,782 |
| Equity method |
275,843 |
275,023 |
432,987 |
298,108 |
94.960 |
| Operating expenses |
(2,318,800) |
(2,280,195) |
(2,557,212) |
(2,413,975) |
(2,494,808) |
| Earnings before income tax |
1,651,086 |
1,910,548 |
2,283,569 |
2,131,631 |
1,856,099 |
| Income tax |
(325,280) |
(447,642) |
(680,196) |
(587,371) |
(499,844) |
| Net income |
1,325,806 |
1,462,906 |
1,603,374 |
1,544,260 |
1,356,255 |
Principal ratios Bancolombia S.A.
|
|
|
|
|
|
|
|
|
|
|
|
|
|
|
|
|
|
PRINCIPAL RATIOS BANCOLOMBIA S.A. |
Proforma 2Q24 |
Proforma 1Q25 |
Proforma 2Q25 |
Proforma as of jun 24 |
Proforma as of jun 25 |
|
|
|
|
|
|
| Net Interest Margin |
7.91% |
7.28% |
7.31% |
7.98% |
7.28% |
| Net Portfolio Margin and Leasing |
8.70% |
7.95% |
7.88% |
8.64% |
7.94% |
| NIM Investments, Debt Securities and Derivatives |
1.41% |
2.34% |
3.19% |
2.54% |
2.60% |
| ROA |
2.33% |
2.55% |
2.54% |
2.47% |
2.53% |
| ROE |
24.58% |
25.00% |
26.25% |
25.93% |
25.34% |
|
|
|
|
|
|
| EFFICIENCY |
|
|
|
|
|
| Efficiency |
43.94% |
44.65% |
47.27% |
42.22% |
45.97% |
| Operational Efficiency |
3.95% |
4.13% |
4.23% |
3.92% |
4.07% |
|
|
|
|
|
|
| PORTFOLIO INDICATORS |
|
|
|
|
|
| Portfolio Quality 30 Days |
5.29% |
4.62% |
4.41% |
5.29% |
4.41% |
| Portfolio Coverage 30 Days |
125.61% |
123.39% |
121.79% |
125.61% |
121.79% |
| Portfolio Quality 90 Days |
3.60% |
3.26% |
3.14% |
3.60% |
3.14% |
| Portfolio Coverage 90 Days |
184.67% |
174.75% |
171.11% |
184.67% |
171.11% |
| Cost of Credit |
2.85% |
1.81% |
1.65% |
2.58% |
1.78% |
|
|
|
|
|
|
|
|
|
|
|
|
|
CONSOLIDATED SOLVENCY RATIO
Consolidated (COP millions)
|
Proforma 2Q24 |
Proforma 1Q25 |
Real 2Q25 |
| Technical Equity |
24,057,005 |
25,805,125 |
|
26,953,192 |
|
| Basic Solvency Ratio |
10.24% |
10.56% |
10.99% |
| Total Solvency Ratio |
12.55% |
13.25% |
13.47% |
| Risk-weighted assets |
155,444,116 |
156,471,474 |
161,584,531 |
| Total Market Risk |
14,217,042 |
16,016,179 |
12,452,630 |
| Total Operational Risk |
22,019,038 |
22,245,364 |
26,046,098 |
BANISTMO- PANAMA
Panama’s economy slowed in 2024 following the closure of the Cobre Panama mine. However, a recovery in Canal activity and tourism helped mitigate the impact. Inflation was negative due to price controls and lower oil costs, but could rebound in the face of ongoing geopolitical tensions. Labor market challenges persist due to layoffs in the mining sector and the potential closure of Chiquita Panama. Additionally, the new government is facing fiscal difficulties caused by low tax collection and rigid expenditures such as the pension system. President Mulino has indicated a willingness to address public finances, though significant obstacles remain.
Banistmo’s loan portfolio closed the quarter with a 0.1% decline (measured in USD). The mortgage and consumer portfolios contracted; in the case of mortgages, this reduction was due to the tightening of origination policies. The consumer portfolio was affected by weaker demand in credit cards and unsecured personal loan products. In contrast, the commercial portfolio posted slight growth. On the funding structure side, there was a 2.1% increase, mainly driven by higher time deposits from the corporate segment, while sight deposits decreased.
Banistmo’s net result for the second quarter of 2025 was a profit of COP 99.5 billion, representing a 15.0% increase compared to the previous quarter. Net interest income from the loan portfolio grew, supported by higher returns from both lending and treasury, along with a reduction in interest expenses, mainly due to lower liquidity operation costs. Provision expenses increased this quarter, as there were no significant reversals like those recorded in the previous quarter for mortgage models. Additionally, higher provisions expenses for specific clients. It is worth noting the improved performance of the consumer loan portfolio and the effectiveness of collection strategies.
Operating expenses rose compared to the previous quarter, mainly due to higher impairment charges on assets, attributable to the revaluation of certain properties. To a lesser extent, fees and tax expenses also increased. The net interest margin for 2Q25 stood at 3.49%, quarterly annualized ROE was 8.48%, and the cost of credit was 0.45%.
|
|
|
|
|
|
|
|
|
|
|
|
|
|
|
|
|
|
|
|
|
|
|
|
STATEMENT OF FINANCIAL POSITION AND INCOME STATEMENT, CONSOLIDATED(1) |
Quarter |
Change |
|
| (COP million) |
2Q24 |
1Q25 |
2Q25 |
2Q25 / 1Q25 |
|
2Q25 / 2Q24 |
|
| ASSETS |
|
|
|
|
|
|
|
| Gross loans |
34,234,897 |
|
32,661,341 |
|
31,686,840 |
|
-2.98 |
% |
-7.44 |
% |
| Allowances for loans |
(1,755,837) |
|
(1,748,298) |
|
(1,610,976) |
|
-7.85 |
% |
-8.25 |
% |
| Investments |
6,309,037 |
|
6,127,140 |
|
6,520,926 |
|
6.43 |
% |
3.36 |
% |
| Other assets |
4,936,154 |
|
4,718,949 |
|
5,298,689 |
|
12.29 |
% |
7.34 |
% |
| Total assets |
43,724,250 |
|
41,759,133 |
|
41,895,480 |
|
0.33 |
% |
-4.18 |
% |
|
|
|
|
|
|
|
|
| LIABILITIES AND SHAREHOLDERS’ EQUITY |
|
|
|
|
|
|
|
| Deposits |
29,872,766 |
|
29,960,745 |
|
29,695,876 |
|
-0.88 |
% |
-0.59 |
% |
| Other liabilities |
8,868,098 |
|
7,115,616 |
|
7,557,703 |
|
6.21 |
% |
-14.78 |
% |
| Total liabilities |
38,740,864 |
|
37,076,361 |
|
37,253,579 |
|
0.48 |
% |
-3.84 |
% |
| Shareholders’ equity |
4,983,386 |
|
4,682,771 |
|
4,641,900 |
|
-0.87 |
% |
-6.85 |
% |
| Total liabilities and shareholders’ equity |
43,724,250 |
|
41,759,133 |
|
41,895,480 |
|
0.33 |
% |
-4.18 |
% |
|
|
|
|
|
|
|
|
| Interest income |
662,757 |
|
642,020 |
|
662,898 |
|
3.25 |
% |
0.02 |
% |
| Interest expense |
(332,655) |
|
(332,070) |
|
(318,300) |
|
-4.15 |
% |
-4.32 |
% |
| Net interest income |
330,102 |
|
309,950 |
|
344,599 |
|
11.18 |
% |
4.39 |
% |
| Net provisions |
(132,549) |
|
(18,051) |
|
(36,490) |
|
102.15 |
% |
-72.47 |
% |
| Fees and income from service, net |
85,816 |
|
55,453 |
|
61,604 |
|
11.09 |
% |
-28.21 |
% |
| Other operating income |
13,569 |
|
13,992 |
|
15,101 |
|
7.92 |
% |
11.29 |
% |
| Total operating expense |
(231,947) |
|
(243,657) |
|
(250,240) |
|
2.70 |
% |
7.89 |
% |
| Profit before tax |
64,992 |
|
117,687 |
|
134,573 |
|
14.35 |
% |
107.06 |
% |
| Income tax |
47 |
|
(31,160) |
|
(35,080) |
|
12.58 |
% |
-74987.79 |
% |
| Net income |
65,039 |
|
86,527 |
|
99,493 |
|
14.99 |
% |
52.98 |
% |
(1)Corresponds to the results of Banistmo and its subsidiaries before eliminating intercompany transactions with other Grupo Cibest companies
|
|
|
|
|
|
|
|
|
|
|
|
|
|
|
|
|
|
|
|
|
|
|
|
| PRINCIPAL RATIOS |
|
2Q24 |
|
1Q25 |
|
2Q25 |
|
| NIM |
|
3.42 |
% |
3.11 |
% |
3.49 |
% |
| ROE |
|
5.53 |
% |
7.39 |
% |
8.48 |
% |
| ROA |
|
0.63 |
% |
0.81 |
% |
0.94 |
% |
| CoR |
|
1.64 |
% |
0.22 |
% |
0.45 |
% |
| Efficiency |
|
54.01 |
% |
64.22 |
% |
59.4 |
% |
BANAGRICOLA- EL SALVADOR
El Salvador is experiencing a mild economic slowdown, mainly due to the decline in the textile sector in the face of Asian competition. Inflation has decreased as a result of lower fuel prices, although there could be a temporary rebound due to global disruptions. Lower external demand and a reduction in remittances are expected, impacting consumption. Fiscal space remains limited due to commitments with the IMF and rigidities in spending. Nevertheless, a short-term improvement in public finances is projected, with medium-term inflation expected to be around 1.3%.
Banco Agricola's loan portfolio closed the quarter with 3.5% growth (measured in USD). Growth was mainly driven by the commercial portfolio, particularly in the corporate segment. Additionally, there was a moderate increase in the consumer portfolio, fueled by unsecured loans and credit cards. On the deposit side, the quarter saw growth, mainly in time deposits from retail. There was also a less pronounced increase in current and savings accounts, driven by both the business and retail segments.
Net income for Banco Agricola in 2Q25 totaled COP 139.2 billion, representing a 9.1% decrease compared to 1Q25. Net interest income increased versus the previous quarter, mainly due to higher interest income from the loan portfolio, especially in consumer segments with higher risk-adjusted returns. To a lesser extent, interest expenses also increased, mainly as a result of higher time deposits. Net fee income grew, largely driven by the increase in remittance activity, which was influenced by events in the United States. Faced with a greater probability of deportation, a greater number of people have sent larger amounts of money to their home countries as a precautionary measure in the event of a possible forced departure from the US. Net provisions for the period increased due to the growth in the consumer portfolio in higher-risk segments. Operating expenses were up, primarily reflecting higher spending on advertising and repairs and maintenance of assets. Banco Agricola’s net interest margin for 2Q25 stood at 7.47%, quarterly annualized ROE was 20.0%, and the cost of risk was 1.82%.
|
|
|
|
|
|
|
|
|
|
|
|
|
|
|
|
|
|
|
|
|
|
|
|
STATEMENT OF FINANCIAL POSITION AND INCOME STATEMENT, CONSOLIDATED (1) |
Quarter |
Change |
|
| (COP million) |
2Q24 |
1Q25 |
2Q25 |
2Q25 / 1Q25 |
|
2Q25 / 2Q24 |
|
| ASSETS |
|
|
|
|
|
|
|
| Gross loans |
17,632,311 |
|
18,052,091 |
|
18,147,217 |
|
0.53 |
% |
2.92 |
% |
| Allowances for loans |
(590,211) |
|
(560,656) |
|
(563,127) |
|
0.44 |
% |
-4.59 |
% |
| Investments |
2,766,074 |
|
4,148,720 |
|
3,317,820 |
|
-20.03 |
% |
19.95 |
% |
| Other assets |
4,722,296 |
|
5,062,786 |
|
4,759,210 |
|
-6.00 |
% |
0.78 |
% |
| Total assets |
24,530,470 |
|
26,702,940 |
|
25,661,120 |
|
-3.90 |
% |
4.61 |
% |
|
|
|
|
|
|
|
|
| LIABILITIES AND SHAREHOLDERS’ EQUITY |
|
|
|
|
|
|
|
| Deposits |
18,690,453 |
|
21,303,465 |
|
21,037,764 |
|
-1.25 |
% |
12.56 |
% |
| Other liabilities |
3,497,018 |
|
2,608,616 |
|
1,776,397 |
|
-31.90 |
% |
-49.20 |
% |
| Total liabilities |
22,187,470 |
|
23,912,081 |
|
22,814,160 |
|
-4.59 |
% |
2.82 |
% |
| Non-controlling interest |
32,109 |
|
47,631 |
|
48,825 |
|
2.51 |
% |
52.06 |
% |
| Stockholders’ equity attributable to the owners of the parent company |
2,310,891 |
|
2,743,229 |
|
2,798,134 |
|
2.00 |
% |
21.08 |
% |
| Total liabilities and shareholders’ equity |
24,530,470 |
|
26,702,940 |
|
25,661,120 |
|
-3.90 |
% |
4.61 |
% |
|
|
|
|
|
|
|
|
| Interest income |
442,709 |
|
494,800 |
|
526,014 |
|
6.31 |
% |
18.82 |
% |
| Interest expense |
(109,648) |
|
(112,513) |
|
(115,968) |
|
3.07 |
% |
5.76 |
% |
| Net interest income |
333,062 |
|
382,287 |
|
410,046 |
|
7.26 |
% |
23.11 |
% |
| Net provisions |
(63,769) |
|
(60,500) |
|
(83,272) |
|
37.64 |
% |
30.58 |
% |
| Fees and income from service, net |
66,747 |
|
75,599 |
|
80,923 |
|
7.04 |
% |
21.24 |
% |
| Other operating income |
13,609 |
|
19,483 |
|
19,342 |
|
-0.72 |
% |
42.13 |
% |
| Total operating expense |
(197,262) |
|
(218,643) |
|
(233,781) |
|
6.92 |
% |
18.51 |
% |
| Profit before tax |
152,386 |
|
198,226 |
|
193,259 |
|
-2.51 |
% |
26.82 |
% |
| Income tax |
(34,178) |
|
(42,107) |
|
(51,391) |
|
22.05 |
% |
50.36 |
% |
| Net income before non-controlling interest |
118,208 |
|
156,119 |
|
141,868 |
|
-9.13 |
% |
20.02 |
% |
| Non-controlling interest |
(2,283) |
|
(2,945) |
|
(2,665) |
|
-9.51 |
% |
16.74 |
% |
| Net income |
115,925 |
|
153,174 |
|
139,203 |
|
-9.12 |
% |
20.08 |
% |
(1)Corresponds to the results of Banagricola and its subsidiaries before eliminating intercompany transactions with other Grupo Cibest companies
|
|
|
|
|
|
|
|
|
|
|
|
|
|
|
|
|
|
|
|
|
|
|
|
| PRINCIPAL RATIOS |
|
2Q24 |
|
1Q25 |
|
2Q25 |
|
| NIM |
|
6.89 |
% |
6.96 |
% |
7.47 |
% |
| ROE |
|
21.72 |
% |
22.73 |
% |
19.98 |
% |
| ROA |
|
1.99 |
% |
2.34 |
% |
2.1 |
% |
| CoR |
|
1.54 |
% |
1.34 |
% |
1.82 |
% |
| Efficiency |
|
47.71 |
% |
45.8 |
% |
45.81 |
% |
GRUPO AGROMERCANTIL HOLDING – GUATEMALA
Guatemala's economy has remained one of the strongest in Central America, driven by the financial sector, textile exports, and tourism. Inflation has stayed low due to lower oil prices and normalized supply chains. Public investment in infrastructure and increased government spending are expected to support growth, even as remittance inflows may decline due to stricter U.S. migration policies. The Arévalo administration plans to expand public spending without compromising fiscal stability. Furthermore, two policy rate cuts by the Bank of Guatemala are anticipated in 2025, reaching 4.00%.
Bam's loan portfolio closed 2Q25 with 1.4% quarterly growth (measured in USD), mainly driven by the commercial portfolio in the corporate segment. Consumer lending also saw an increase, primarily in credit cards. On the funding side, a favorable dynamic was seen in savings and checking accounts, especially within the corporate segment, while time deposit balances decreased.
Bam posted a net profit of COP 32.6 billion for 2Q25. Net interest income showed a slight increase versus the previous quarter, mainly from higher interest generation in the commercial loan portfolio. This was partially offset by higher interest expenses, largely due to growth in savings accounts. Provision expenses rose, primarily explained by the expansion of the consumer portfolio, particularly unsecured loans. Operating expenses declined, mostly attributed to lower personnel expenses, partially offset by higher general expenses. Bam’s net interest margin for 1Q25 was 4.59%, quarterly annualized ROE stood at 6.0%, and credit cost was 2.45%.
|
|
|
|
|
|
|
|
|
|
|
|
|
|
|
|
|
|
|
|
|
|
|
|
|
|
|
|
|
|
|
|
|
|
|
|
STATEMENT OF FINANCIAL POSITION AND INCOME STATEMENT, CONSOLIDATED (1) |
|
Quarter |
|
Change |
|
| (COP million) |
|
2Q24 |
|
1Q25 |
|
2Q25 |
|
2Q25 / 1Q25 |
|
2Q25 / 2Q24 |
|
| ASSETS |
|
|
|
|
|
|
|
|
|
|
|
| Gross loans |
|
18,917,726 |
|
|
20,224,335 |
|
|
19,903,624 |
|
|
-1.59 |
% |
5.21 |
% |
| Allowances for loans |
|
(960,229) |
|
|
(959,125) |
|
|
(949,930) |
|
|
-0.96 |
% |
-1.07 |
% |
| Investments |
|
1,776,066 |
|
|
2,553,753 |
|
|
2,646,227 |
|
|
3.62 |
% |
48.99 |
% |
| Other assets |
|
4,089,367 |
|
|
4,185,643 |
|
|
4,396,525 |
|
|
5.04 |
% |
7.51 |
% |
| Total assets |
|
23,822,930 |
|
|
26,004,607 |
|
|
25,996,446 |
|
|
-0.03 |
% |
9.12 |
% |
|
|
|
|
|
|
|
|
|
|
|
|
| LIABILITIES AND SHAREHOLDERS’ EQUITY |
|
|
|
|
|
|
|
|
|
|
|
| Deposits |
|
17,481,634 |
|
|
18,785,092 |
|
|
18,743,098 |
|
|
-0.22 |
% |
7.22 |
% |
| Other liabilities |
|
4,246,356 |
|
|
5,001,123 |
|
|
5,052,117 |
|
|
1.02 |
% |
18.98 |
% |
| Total liabilities |
|
21,727,989 |
|
|
23,786,215 |
|
|
23,795,215 |
|
|
0.04 |
% |
9.51 |
% |
| Non-controlling interest |
|
47,897 |
|
|
49,423 |
|
|
50,563 |
|
|
2.31 |
% |
5.57 |
% |
| Stockholders’ equity attributable to the owners of the parent company |
|
2,047,044 |
|
|
2,168,969 |
|
|
2,150,667 |
|
|
-0.84 |
% |
5.06 |
% |
| Total liabilities and shareholders’ equity |
|
23,822,930 |
|
|
26,004,607 |
|
|
25,996,446 |
|
|
-0.03 |
% |
9.12 |
% |
|
|
|
|
|
|
|
|
|
|
|
|
| Interest income |
|
475,361 |
|
|
512,737 |
|
|
519,880 |
|
|
1.39 |
% |
9.37 |
% |
| Interest expense |
|
(208,178) |
|
|
(252,847) |
|
|
(259,290) |
|
|
2.55 |
% |
24.55 |
% |
| Net interest income |
|
267,183 |
|
|
259,890 |
|
|
260,590 |
|
|
0.27 |
% |
-2.47 |
% |
| Net provisions |
|
(89,964) |
|
|
(113,873) |
|
|
(124,233) |
|
|
9.10 |
% |
38.09 |
% |
| Fees and income from service, net |
|
30,065 |
|
|
27,506 |
|
|
38,291 |
|
|
39.21 |
% |
27.36 |
% |
| Other operating income |
|
18,778 |
|
|
26,007 |
|
|
54,559 |
|
|
109.78 |
% |
190.55 |
% |
| Total operating expense |
|
(157,307) |
|
|
(179,169) |
|
|
(178,294) |
|
|
-0.49 |
% |
13.34 |
% |
| Profit before tax |
|
68,755 |
|
|
20,362 |
|
|
50,913 |
|
|
150.04 |
% |
-25.95 |
% |
| Income tax |
|
(10,465) |
|
|
1,349 |
|
|
(15,669) |
|
|
-1261.63 |
% |
49.73 |
% |
| Net income before non-controlling interest |
|
58,290 |
|
|
21,710 |
|
|
35,244 |
|
|
62.34 |
% |
-39.54 |
% |
| Non-controlling interest |
|
601 |
|
|
(864) |
|
|
(2,648) |
|
|
20668 |
% |
% |
-540.87 |
% |
| Net income |
|
58,891 |
|
|
20,847 |
|
|
32,596 |
|
|
56.36 |
% |
-44.65 |
% |
(1)Corresponds to the results of Grupo Agromercantil Holding and its subsidiaries before eliminating intercompany transactions with other Grupo Cibest companies
|
|
|
|
|
|
|
|
|
|
|
|
|
|
|
|
|
|
|
|
|
|
|
|
| PRINCIPAL RATIOS |
|
2Q24 |
|
1Q25 |
|
2Q25 |
|
| NIM |
|
5.44 |
% |
4.58 |
% |
4.59 |
% |
| ROE |
|
12.42 |
% |
3.82 |
% |
5.99 |
% |
| ROA |
|
1.04 |
% |
0.32 |
% |
0.5 |
% |
| CoR |
|
1.99 |
% |
2.24 |
% |
2.45 |
% |
| Efficiency |
|
49.78 |
% |
57.17 |
% |
50.45 |
% |
4.Grupo Cibest Company Description (NYSE: CIB, BVC: CIBEST Y PFCIBEST)
Grupo Cibest is a conglomerate of financial institutions and complementary businesses that offers a broad portfolio of products and services to a diversified base of over 33 million entities and individual clients. Grupo Cibest distributes its products and services through a regional platform comprising the largest private banking network in Colombia, with further presence in the Central American market through El Salvador's leading financial group, as well as international banking subsidiaries and local licenses in Panama, Guatemala, and Puerto Rico. BANCOLOMBIA and its business lines provide brokerage services, investment banking, financial leasing, factoring, consumer credit, fiduciary services, asset management, among others.
|
|
|
|
|
|
|
Contact Information |
|
Grupo Cibest Investor Relations |
| Phone: |
(601) 4885371 |
| E-mail: |
IR@Grupocibest.com.co |
| Contacts: |
Catalina Tobón Rivera (IR Director) |
| Website: |
https://www.grupocibest.com/Investor-relations |
|
|
|
|
|
|
|
|
|
|
|
|
|
|
|
|
|
|
|
|
|
|
|
|
|
|
|
|
|
|
|
|
|
|
|
|
CONSOLIDATED STATEMENT OF FINANCIAL POSITION |
|
|
|
Change |
|
|
|
% of
Liabilities |
|
| (COP million) |
2Q24 |
1Q25 |
2Q25 |
2Q25 / 1Q25 |
|
2Q25 / 2Q24 |
|
% of Assets |
|
|
| ASSETS |
|
|
|
|
|
|
|
|
|
|
|
| Cash and balances at central bank |
21,374,700 |
20,493,453 |
|
24,244,363 |
|
18.30 |
% |
13.43 |
% |
6.46 |
% |
|
|
| Interbank borrowings |
3,717,447 |
|
4,345,084 |
|
4,375,272 |
|
0.69 |
% |
17.70 |
% |
1.17 |
% |
|
|
| Reverse repurchase agreements and other similar secured lend |
6,373,029 |
|
3,436,757 |
|
2,735,369 |
|
(20.41) |
|
% |
(57.08) |
|
% |
0.73 |
|
% |
|
|
| Financial assets investment |
30,573,634 |
|
36,394,058 |
|
40,910,075 |
|
12.41 |
|
% |
33.81 |
|
% |
10.90 |
|
% |
|
|
| Derivative financial instruments |
3,444,239 |
|
2,529,449 |
|
3,239,291 |
|
28.06 |
|
% |
(5.95) |
|
% |
0.86 |
|
% |
|
|
| Loans and advances to customers |
268,108,682 |
|
278,523,005 |
|
279,771,687 |
|
0.45 |
|
% |
4.35 |
|
% |
74.56 |
|
% |
|
|
| Allowance for loan and lease losses |
(16,680,835) |
|
(15,532,803) |
|
(14,771,088) |
|
(4.90) |
|
% |
(11.45) |
|
% |
(3.94) |
|
% |
|
|
| Investment in associates and joint ventures |
2,850,311 |
|
2,962,639 |
|
3,045,408 |
|
2.79 |
|
% |
6.84 |
|
% |
0.81 |
|
% |
|
|
| Goodwill and Intangible assets, net |
9,191,298 |
|
9,301,046 |
|
9,056,528 |
|
(2.63) |
|
% |
(1.47) |
|
% |
2.41 |
|
% |
|
|
| Premises and equipment, net |
6,048,006 |
|
5,708,321 |
|
5,608,169 |
|
(1.75) |
|
% |
(7.27) |
|
% |
1.49 |
|
% |
|
|
| Investment property |
5,423,018 |
|
5,608,037 |
|
5,761,117 |
|
2.73 |
|
% |
6.23 |
|
% |
1.54 |
|
% |
|
|
| Right of use assets |
1,668,641 |
|
1,725,559 |
|
1,525,340 |
|
(11.60) |
|
% |
(8.59) |
|
% |
0.41 |
|
% |
|
|
| Prepayments |
839,285 |
|
988,935 |
|
923,716 |
|
(6.59) |
|
% |
10.06 |
|
% |
0.25 |
|
% |
|
|
| Tax receivables |
1,993,175 |
|
1,303,756 |
|
1,832,435 |
|
40.55 |
|
% |
(8.06) |
|
% |
0.49 |
|
% |
|
|
| Deferred tax |
796,955 |
|
692,119 |
|
639,837 |
|
(7.55) |
|
% |
(19.71) |
|
% |
0.17 |
|
% |
|
|
| Assets held for sale and inventories |
993,902 |
|
816,077 |
|
816,784 |
|
0.09 |
|
% |
(17.82) |
|
% |
0.22 |
|
% |
|
|
| Other assets |
5,483,585 |
|
4,829,819 |
|
5,536,423 |
|
14.63 |
|
% |
0.96 |
|
% |
1.48 |
|
% |
|
|
| Total assets |
352,199,072 |
|
364,125,311 |
|
375,250,726 |
|
3.06 |
|
% |
6.55 |
|
% |
100.00 |
|
% |
|
|
| LIABILITIES AND SHAREHOLDERS’ EQUITY |
|
|
|
|
|
|
|
|
|
|
|
| LIABILITIES |
|
|
|
|
|
|
|
|
|
|
|
| Deposit by customers |
257,869,276 |
|
276,030,117 |
|
282,647,329 |
|
2.40 |
|
% |
9.61 |
|
% |
75.32 |
|
% |
84.91 |
|
% |
| Interbank Deposits |
511,000 |
|
634,414 |
|
811,328 |
|
27.89 |
|
% |
58.77 |
|
% |
0.22 |
|
% |
0.24 |
|
% |
| Derivative financial instrument |
3,680,218 |
|
2,516,148 |
|
3,524,458 |
|
40.07 |
|
% |
(4.23) |
|
% |
0.94 |
|
% |
1.06 |
|
% |
| Borrowings from other financial institutions |
12,938,759 |
|
11,899,337 |
|
11,431,252 |
|
(3.93) |
|
% |
(11.65) |
|
% |
3.05 |
|
% |
3.43 |
|
% |
| Debt securities in issue |
16,107,674 |
|
10,878,328 |
|
10,388,366 |
|
(4.50) |
|
% |
(35.51) |
|
% |
2.77 |
|
% |
3.12 |
|
% |
| Lease liability |
1,817,740 |
|
1,857,875 |
|
1,635,793 |
|
(11.95) |
|
% |
(10.01) |
|
% |
0.44 |
|
% |
0.49 |
|
% |
| Preferred shares |
555,152 |
|
541,340 |
|
555,152 |
|
2.55 |
|
% |
— |
|
% |
0.15 |
|
% |
0.17 |
|
% |
| Repurchase agreements and other similar secured borrowing |
594,983 |
|
1,265,728 |
|
3,940,354 |
|
211.31 |
|
% |
562.26 |
|
% |
1.05 |
|
% |
1.18 |
|
% |
| Current tax |
695,645 |
|
755,481 |
|
1,248,967 |
|
65.32 |
|
% |
79.54 |
|
% |
0.33 |
|
% |
0.38 |
|
% |
| Deferred tax |
2,128,321 |
|
2,734,413 |
|
2,771,024 |
|
1.34 |
|
% |
30.20 |
|
% |
0.74 |
|
% |
0.83 |
|
% |
| Employees benefit plans |
895,682 |
|
941,706 |
|
928,875 |
|
(1.36) |
|
% |
3.71 |
|
% |
0.25 |
|
% |
0.28 |
|
% |
| Other liabilities |
14,199,672 |
|
12,381,389 |
|
12,983,542 |
|
4.86 |
|
% |
(8.56) |
|
% |
3.46 |
|
% |
3.90 |
|
% |
| Total liabilities |
311,994,122 |
|
322,436,276 |
|
332,866,440 |
|
3.23 |
|
% |
6.69 |
|
% |
88.71 |
|
% |
100.00 |
|
% |
| SHAREHOLDERS’ EQUITY |
|
|
|
|
|
|
|
|
|
|
|
| Share Capital |
480,914 |
|
480,914 |
|
480,914 |
|
— |
|
% |
— |
|
% |
0.13 |
|
% |
|
|
| Additional paid-in-capital |
4,857,454 |
|
4,857,454 |
|
4,857,491 |
|
— |
|
% |
— |
|
% |
1.29 |
|
% |
|
|
| Appropriated reserves |
22,632,835 |
|
24,302,796 |
|
23,702,075 |
|
(2.47) |
|
% |
4.72 |
|
% |
6.32 |
|
% |
|
|
| Retained earnings |
5,779,197 |
|
5,299,318 |
|
7,094,311 |
|
33.87 |
|
% |
22.76 |
|
% |
1.89 |
|
% |
|
|
|
|
|
|
|
|
|
|
|
|
|
|
|
|
|
|
|
|
|
|
|
|
|
|
|
|
|
|
|
|
|
|
|
|
|
|
| Accumulated other comprehensive income, net of tax |
5,469,515 |
|
5,693,944 |
|
5,159,284 |
|
(9.39) |
|
% |
(5.67) |
|
% |
1.37 |
|
% |
|
|
| Stockholders’ equity attributable to the owners of the parent company |
39,219,915 |
|
40,634,426 |
|
41,294,075 |
|
1.62 |
|
% |
5.29 |
|
% |
11.00 |
|
% |
|
|
| Non-controlling interest |
985,035 |
|
1,054,609 |
|
1,090,211 |
|
3.38 |
|
% |
10.68 |
|
% |
0.29 |
|
% |
|
|
| Total liabilities and equity |
352,199,072 |
|
364,125,311 |
|
375,250,726 |
|
3.06 |
|
% |
6.55 |
|
% |
100.00 |
|
% |
|
|
|
|
|
|
|
|
|
|
|
|
|
|
|
|
|
|
|
|
|
|
|
|
|
|
|
|
|
|
|
|
|
|
|
|
|
|
CONSOLIDATED STATEMENT OF INCOME |
As of |
Jun-25 / Jun-24 |
|
|
|
|
Change |
|
| (COP million) |
Jun-24 |
Jun-25 |
|
2Q24 |
1Q25 |
2Q25 |
2Q25 / 1Q25 |
|
2Q25 / 2Q24 |
|
| Interest income and expenses |
|
|
|
|
|
|
|
|
|
|
|
| Interest on loans and financial leases |
|
|
|
|
|
|
|
|
|
|
|
| Commercial |
8,358,202 |
|
7,741,324 |
|
(7.38) |
|
% |
4,160,195 |
|
3,828,165 |
|
3,913,159 |
|
2.22 |
|
% |
(5.94) |
|
% |
| Consumer |
4,340,212 |
|
3,983,079 |
|
(8.23) |
|
% |
2,188,049 |
|
1,977,301 |
|
2,005,778 |
|
1.44 |
|
% |
(8.33) |
|
% |
| Small business loans |
104,983 |
|
132,423 |
|
26.14 |
|
% |
51,279 |
|
61,442 |
|
70,981 |
|
15.53 |
|
% |
38.42 |
|
% |
| Mortgage |
2,032,457 |
|
2,201,429 |
|
8.31 |
|
% |
1,019,405 |
|
1,096,470 |
|
1,104,959 |
|
0.77 |
|
% |
8.39 |
|
% |
| Financial leases |
1,872,129 |
|
1,610,868 |
|
(13.96) |
|
% |
917,304 |
|
800,230 |
|
810,638 |
|
1.30 |
|
% |
(11.63) |
|
% |
| Total interest income on loans and financial leases |
16,707,983 |
|
15,669,123 |
|
(6.22) |
|
% |
8,336,232 |
|
7,763,608 |
|
7,905,515 |
|
1.83 |
|
% |
(5.17) |
|
% |
| Interest income on overnight and market funds |
126,418 |
|
93,453 |
|
(26.08) |
|
% |
64,595 |
|
50,969 |
|
42,484 |
|
(16.65) |
|
% |
(34.23) |
|
% |
| Interest and valuation on financial instruments |
|
|
|
|
|
|
|
|
|
|
|
| Interest on debt instruments using the effective interest method |
497,912 |
|
471,841 |
|
(5.24) |
|
% |
240,138 |
|
233,730 |
|
238,111 |
|
1.87 |
|
% |
(0.84) |
|
% |
| Valuation on financial instruments |
|
|
|
|
|
|
|
|
|
|
|
| Debt investments |
583,100 |
|
841,175 |
|
44.26 |
|
% |
284,827 |
|
399,865 |
|
441,310 |
|
10.36 |
|
% |
54.94 |
|
% |
| Derivatives |
(12,274) |
|
(52,303) |
|
326.13 |
|
% |
(18,588) |
|
(42,830) |
|
(9,473) |
|
(77.88) |
|
% |
(49.04) |
|
% |
| Repos |
159,184 |
|
(28,094) |
|
(117.65) |
|
% |
50,792 |
|
(11,265) |
|
(16,829) |
|
49.39 |
|
% |
(133.13) |
|
% |
| Others |
(21,454) |
|
38,197 |
|
(278.04) |
|
% |
(14,521) |
|
19,382 |
|
18,815 |
|
(2.93) |
|
% |
(229.57) |
|
% |
| Total valuation on financial instruments |
708,556 |
|
798,975 |
|
12.76 |
|
% |
302,510 |
|
365,152 |
|
433,823 |
|
18.81 |
|
% |
43.41 |
|
% |
| Total Interest on debt instruments and valuation on financial instruments |
1,206,468 |
|
1,270,816 |
|
5.33 |
|
% |
542,648 |
|
598,882 |
|
671,934 |
|
12.20 |
|
% |
23.83 |
|
% |
| Total interest and valuation on financial instruments |
18,040,869 |
|
17,033,392 |
|
(5.58) |
|
% |
8,943,475 |
|
8,413,459 |
|
8,619,933 |
|
2.45 |
|
% |
(3.62) |
|
% |
| Interest expense |
|
|
|
|
|
|
|
|
|
|
|
| Borrowings from other financial institutions |
(734,351) |
|
(518,020) |
|
(29.46) |
|
% |
(332,778) |
|
(272,541) |
|
(245,479) |
|
(9.93) |
|
% |
(26.23) |
|
% |
| Overnight funds |
(10,012) |
|
(14,471) |
|
44.54 |
|
% |
(5,459) |
|
(6,245) |
|
(8,226) |
|
31.72 |
|
% |
50.69 |
|
% |
| Debt securities in issue |
(595,519) |
|
(415,995) |
|
(30.15) |
|
% |
(310,348) |
|
(208,711) |
|
(207,284) |
|
(0.68) |
|
% |
(33.21) |
|
% |
| Deposits |
(6,235,521) |
|
(5,692,598) |
|
(8.71) |
|
% |
(3,047,647) |
|
(2,803,210) |
|
(2,889,388) |
|
3.07 |
|
% |
(5.19) |
|
% |
| Preferred shares |
(28,650) |
|
(28,650) |
|
— |
|
% |
(13,813) |
|
(14,837) |
|
(13,813) |
|
(6.90) |
|
% |
— |
|
% |
| Lease liabilities |
(68,723) |
|
(55,459) |
|
(19.30) |
|
% |
(35,509) |
|
(33,829) |
|
(21,630) |
|
(36.06) |
|
% |
(39.09) |
|
% |
| Other interest |
(23,189) |
|
(17,275) |
|
(25.50) |
|
% |
(11,332) |
|
(10,086) |
|
(7,189) |
|
(28.72) |
|
% |
(36.56) |
|
% |
| Total interest expenses |
(7,695,965) |
|
(6,742,468) |
|
(12.39) |
|
% |
(3,756,886) |
|
(3,349,459) |
|
(3,393,009) |
|
1.30 |
|
% |
(9.69) |
|
% |
| Net interest margin and valuation on financial instruments before impairment on loans and financial leases, off balance sheet credit instruments and other financial instruments |
10,344,904 |
|
10,290,924 |
|
(0.52) |
|
% |
5,186,589 |
|
5,064,000 |
|
5,226,924 |
|
3.22 |
|
% |
0.78 |
|
% |
| Credit impairment charges on loans and advance and financial leases |
(3,352,038) |
|
(2,578,487) |
|
(23.08) |
|
% |
(1,848,078) |
|
(1,274,877) |
|
(1,303,610) |
|
2.25 |
|
% |
(29.46) |
|
% |
| Recovery of charged - off loans |
394,114 |
|
416,868 |
|
5.77 |
|
% |
225,017 |
|
171,353 |
|
245,515 |
|
43.28 |
|
% |
9.11 |
|
% |
|
|
|
|
|
|
|
|
|
|
|
|
|
|
|
|
|
|
|
|
|
|
|
|
|
|
|
|
|
|
|
|
|
|
|
|
| Credit impairment charges on off balance sheet credit instruments |
11,904 |
|
(26,653) |
|
(323.90) |
|
% |
5,068 |
|
(5,710) |
|
(20,943) |
|
266.78 |
|
% |
(513.24) |
|
% |
| Credit impairment charges/recovery on investments |
12,257 |
|
(7,612) |
|
(162.10) |
|
% |
(790) |
|
9,685 |
|
(17,297) |
|
(278.60) |
|
% |
2,089.49 |
|
% |
| Total credit impairment charges, net |
(2,933,763) |
|
(2,195,884) |
|
(25.15) |
|
% |
(1,618,783) |
|
(1,099,549) |
|
(1,096,335) |
|
(0.29) |
|
% |
(32.27) |
|
% |
| Net interest margin and valuation on financial instruments after impairment on loans and financial leases and off balance sheet credit instruments and other financial instruments |
7,411,141 |
|
8,095,040 |
|
9.23 |
|
% |
3,567,806 |
|
3,964,451 |
|
4,130,589 |
|
4.19 |
|
% |
15.77 |
|
% |
| Fees and commission income |
|
|
|
|
|
|
|
|
|
|
|
| Banking services |
538,362 |
|
595,241 |
|
10.57 |
|
% |
289,528 |
|
293,287 |
|
301,954 |
|
2.96 |
|
% |
4.29 |
|
% |
| Credit and debit card fees and commercial establishments |
1,581,663 |
|
1,689,363 |
|
6.81 |
|
% |
796,641 |
|
829,936 |
|
859,427 |
|
3.55 |
|
% |
7.88 |
|
% |
| Brokerage |
20,686 |
|
21,163 |
|
2.31 |
|
% |
13,735 |
|
9,740 |
|
11,423 |
|
17.28 |
|
% |
(16.83) |
|
% |
| Acceptances, Guarantees and Standby Letters of Credit |
55,375 |
|
54,030 |
|
(2.43) |
|
% |
27,985 |
|
28,976 |
|
25,054 |
|
(13.54) |
|
% |
(10.47) |
|
% |
| Trust |
272,014 |
|
317,908 |
|
16.87 |
|
% |
135,747 |
|
156,208 |
|
161,700 |
|
3.52 |
|
% |
19.12 |
|
% |
| Placement of securities and investment banking |
47,069 |
|
22,377 |
|
(52.46) |
|
% |
35,975 |
|
5,050 |
|
17,327 |
|
243.11 |
|
% |
(51.84) |
|
% |
| Bancassurance |
494,385 |
|
500,849 |
|
1.31 |
|
% |
286,073 |
|
226,643 |
|
274,206 |
|
20.99 |
|
% |
(4.15) |
|
% |
| Payments and Collections |
505,422 |
|
541,100 |
|
7.06 |
|
% |
265,605 |
|
263,664 |
|
277,436 |
|
5.22 |
|
% |
4.45 |
|
% |
| Others |
184,962 |
|
219,154 |
|
18.49 |
|
% |
96,757 |
|
107,731 |
|
111,423 |
|
3.43 |
|
% |
15.16 |
|
% |
| Total fees and commission income |
3,699,938 |
|
3,961,185 |
|
7.06 |
|
% |
1,948,046 |
|
1,921,235 |
|
2,039,950 |
|
6.18 |
|
% |
4.72 |
|
% |
| Fees and commission expenses |
|
|
|
|
|
|
|
|
|
|
|
| Banking services |
(808,218) |
|
(960,463) |
|
18.84 |
% |
(426,369) |
|
(466,832) |
|
(493,631) |
|
5.74 |
% |
15.78 |
% |
| Sales, collections and other services |
(436,239) |
|
(450,303) |
|
3.22 |
% |
(228,748) |
|
(223,097) |
|
(227,206) |
|
1.84 |
% |
-0.67 |
% |
| Bank correspondents |
(296,448) |
|
(311,734) |
|
5.16 |
% |
(188,367) |
|
(148,996) |
|
(162,738) |
|
9.22 |
% |
-13.61 |
% |
| Others |
(104,169) |
|
(129,037) |
|
23.87 |
% |
(62,764) |
|
(64,542) |
|
(64,495) |
|
-0.07 |
% |
2.76 |
% |
| Fees and commission expenses |
(1,645,074) |
|
(1,851,537) |
|
12.55 |
|
% |
(906,248) |
|
(903,467) |
|
(948,070) |
|
4.94 |
|
% |
4.61 |
|
% |
| Total fees and comissions, net |
2,054,864 |
2,109,648 |
2.67 |
|
% |
1,041,798 |
1,017,768 |
|
1,091,880 |
7.28 |
|
% |
4.81 |
|
% |
| Other operating income |
|
|
|
|
|
|
|
|
|
|
|
| Derivatives FX contracts |
62,225 |
|
(127,091) |
|
(304.24) |
|
% |
160,894 |
|
(11,917) |
|
(115,174) |
|
866.47 |
|
% |
(171.58) |
|
% |
| Net foreign exchange |
100,826 |
|
468,458 |
|
364.62 |
|
% |
(17,357) |
|
213,211 |
|
255,247 |
|
19.72 |
|
% |
(1,570.57) |
|
% |
| Hedging |
— |
|
(2,908) |
|
100.00 |
|
% |
623 |
|
(3,233) |
|
325 |
|
110.05 |
|
% |
(47.83) |
|
% |
| Leases |
902,031 |
|
882,144 |
|
(2.20) |
|
% |
441,935 |
|
448,497 |
|
433,647 |
|
(3.31) |
|
% |
(1.88) |
|
% |
| Gains (or losses) on sale of assets |
32,995 |
|
107,091 |
|
224.57 |
|
% |
15,090 |
|
49,760 |
|
57,331 |
|
15.22 |
|
% |
279.93 |
|
% |
| Other reversals |
18,453 |
|
4,512 |
|
(75.55) |
|
% |
4,723 |
|
1,829 |
|
2,683 |
|
46.69 |
|
% |
(43.19) |
|
% |
| Others |
253,883 |
|
335,085 |
|
31.98 |
|
% |
135,176 |
|
138,424 |
|
196,661 |
|
42.07 |
|
% |
45.49 |
|
% |
| Total other operating income |
1,370,413 |
1,667,291 |
21.66 |
|
% |
741,084 |
836,571 |
|
830,720 |
(0.70) |
|
% |
12.10 |
|
% |
| Dividends received, and share of profits of equity method investees |
|
|
|
|
|
|
|
|
|
|
|
| Dividends |
33,867 |
|
31,403 |
|
(7.28) |
|
% |
23,867 |
|
4,967 |
|
26,436 |
|
432.23 |
|
% |
10.76 |
|
% |
| Equity investments |
(8,183) |
|
27,765 |
|
(439.30) |
|
% |
(5,701) |
|
19848 |
7,917 |
|
(60.11) |
|
% |
(238.87) |
|
% |
|
|
|
|
|
|
|
|
|
|
|
|
|
|
|
|
|
|
|
|
|
|
|
|
|
|
|
|
|
|
|
|
|
|
|
|
| Equity method |
133,312 |
|
199,668 |
|
49.77 |
|
% |
56,023 |
|
112,510 |
|
87,158 |
|
(22.53) |
|
% |
55.58 |
|
% |
| Others |
13,520 |
|
(160) |
|
(101.18) |
|
|
13,520 |
|
— |
|
(160) |
|
100.00 |
|
% |
(101.18) |
|
% |
| Total dividends received, and share of profits of equity method investees |
(140,768) |
|
258,676 |
|
(283.76) |
|
% |
(225,575) |
|
137,325 |
|
121,351 |
|
(11.63) |
|
% |
(153.80) |
|
% |
| Total operating income, net |
10,695,650 |
|
12,130,655 |
|
13.42 |
|
% |
5,125,113 |
|
5,956,115 |
|
6,174,540 |
|
3.67 |
|
% |
20.48 |
|
% |
| Operating expenses |
|
|
|
|
|
|
|
|
|
|
|
| Salaries and employee benefits |
(2,376,018) |
|
(2,585,814) |
|
8.83 |
|
% |
(1,194,440) |
|
(1,280,879) |
|
(1,304,935) |
|
1.88 |
|
% |
9.25 |
|
% |
| Bonuses |
(307,329) |
|
(519,864) |
|
69.16 |
|
% |
(153,956) |
|
(249,645) |
|
(270,219) |
|
8.24 |
|
% |
75.52 |
|
% |
| Other administrative and general expenses |
(2,492,765) |
|
(2,796,090) |
|
12.17 |
|
% |
(1,288,226) |
|
(1,339,181) |
|
(1,456,909) |
|
8.79 |
|
% |
13.09 |
|
% |
| Taxes other than income tax |
(780,826) |
|
(746,403) |
|
(4.41) |
|
% |
(389,932) |
|
(356,466) |
|
(389,937) |
|
9.39 |
|
% |
— |
|
% |
| Impairment, depreciation and amortization |
(533,744) |
|
(534,801) |
|
0.20 |
|
% |
(273,482) |
|
(266,257) |
|
(268,544) |
|
0.86 |
|
% |
(1.81) |
|
% |
| Total operating expenses |
(6,490,682) |
|
(7,182,972) |
|
10.67 |
|
% |
(3,300,036) |
|
-3492428 |
(3,690,544) |
|
5.67 |
|
% |
11.83 |
|
% |
| Profit before tax |
4,204,968 |
|
4,947,683 |
|
17.66 |
|
% |
1,825,077 |
|
2,463,687 |
|
2,483,996 |
|
0.82 |
|
% |
36.10 |
|
% |
| Income tax |
(1,058,203) |
|
(1,353,962) |
|
27.95 |
|
% |
(363,323) |
|
(698,912) |
|
(655,050) |
|
(6.28) |
|
% |
80.29 |
|
% |
| Net income |
3,146,765 |
|
3,593,721 |
|
14.20 |
|
% |
1,461,754 |
|
1,764,775 |
|
1,828,946 |
|
3.64 |
|
% |
25.12 |
|
% |
| Non-controlling interest |
(43,519) |
|
(64,754) |
|
48.79 |
|
% |
(21,980) |
|
(27,111) |
|
(37,643) |
|
38.85 |
|
% |
71.26 |
|
% |
| Net income attributable to equity holders of the Parent Company |
3,103,246 |
|
3,528,967 |
|
13.72 |
|
% |
1,439,774 |
|
1,737,664 |
|
1,791,303 |
|
4.47 |
|
% |
4.46 |
|
% |
ANNEX 1
DETAILS OF CORPORATE STRUCTURE EVOLUTION OPERATIONS
(Amounts expressed in millions of Colombian pesos)
On October 29, 2024, the Bank announced to the market that its Board of Directors had authorized management to proceed with the steps necessary to modify the corporate structure of Grupo Bancolombia and its subsidiaries, through the creation of a parent company named Grupo Cibest S.A. (“Cibest”), and the completion of a series of corporate operations to achieve this goal.
The changes in the corporate structure included the following corporate operations (the “Corporate Operations”) which, after obtaining the required regulatory approvals in Colombia and the Group’s various jurisdictions, were approved by the Shareholders’ Meetings of the entities involved. This process included an extraordinary meeting of the Bank’s Shareholders’ Assembly held on April 23, 2025, with the participation of holders of common shares and holders of preferred dividend shares without voting rights. The approved corporate operations were as follows:
i.Partial spin-off of Bancolombia (Panama) S.A. in favor of the Beneficiary Company BC Panama S.A.S.
ii.Merger by absorption by the Bank of the Beneficiary Company BC Panama S.A.S.
iii.Partial spin-off of Banca de Inversión Bancolombia S.A. Corporación Financiera in favor of the Bank.
iv.Partial spin-off of the Bank in favor of Cibest.
Corporate Operations (ii), (iii), and (iv) were authorized by the Colombian Financial Superintendence through Resolutions No. 0356 of 2025 dated February 28, 2025, and 0901 dated May 7, 2025.
The notice of merger by absorption and partial spin-off of the Bank was published on January 13, 2025. Changes to the corporate structure were formalized on May 12, 2025, through public deed No. 386 of Notary Thirty of Medellin, and on May 16, 2025—the date of completion of the operation—the Bank’s shareholders (except for Cibest) became shareholders of Cibest. Cibest issued, in their name, the same number and types of shares (common shares and preferred dividend shares without voting rights), preserving the terms and conditions previously held in the Bank and their percentage of ownership. In turn, the shares previously held in the Bank (except those of Cibest) were canceled. Holders of the Bank’s ADRs received equivalent Cibest ADRs, and their Bank ADRs were canceled; therefore, no dilution or accretion was generated for the Bank’s shareholders, nor any transfer of value to third parties.
Upon completion of the Corporate Operations, Cibest became the parent company (holding) of all financial entities and other companies that make up the Group, including the Bank.
With the completion of the Corporate Transactions, Cibest became the holding company of all financial entities and other companies within the Group, including the Bank.
The value of the assets, liabilities, and equity spun off from Bancolombia S.A. to Grupo Cibest S.A. is detailed as follows:
|
|
|
|
|
|
| RECORDED SECURITIES OF THE SPIN-OFF STATEMENT OF FINANCIAL POSITION |
Value |
| ASSETS |
|
| Cash |
1,527,432 |
| Equity Instruments |
4,247 |
| Trust Law PA Cadenalco 75 years |
4,247 |
| Investments in Subsidiaries |
19,823,908 |
| Banistmo S.A. |
11,125,504 |
| Banagrícola S.A. and Subsidiaries |
4,676,277 |
| Grupo Agromercantil Holding |
3,465,595 |
| Nequi S.A. Financing Company |
45,390 |
| Renting Colombia S.A. |
324,563 |
| Negocios Digitales Colombia S.A.S. |
102,321 |
| Wompi S.A.S. |
38,692 |
| Wenia Ltd |
45,566 |
| Investments in Associates and Joint Ventures |
50,507 |
| Deferred Tax Assets |
59,373 |
| Other Assets, Net |
688 |
| TOTAL ASSETS |
21,466,155 |
| LIABILITIES |
|
| Financial Obligations |
1,527,432 |
| Preferred Shares |
545,873 |
| Deferred Tax Liabilities |
1,569,650 |
| TOTAL LIABILITIES |
3,642,955 |
| TOTAL SHAREHOLDERS' EQUITY |
17,823,200 |
|
|
|
|
|
|
| VALUES RECORDED FROM THE SPIN-OFF IN THE INCOME STATEMENT |
Value |
| Interest expense |
19,370 |
| Net interest income and valuation of financial instruments |
19,370 |
| Banistmo S.A. |
(107,923) |
| Banagrícola S.A. and Subsidiaries |
(187,877) |
| Grupo Agromercantil Holding |
(38,940) |
| Nequi S.A. Financing Company |
15,646 |
| Renting Colombia S.A. |
(4,676) |
| Negocios Digitales Colombia S.A.S. |
(566) |
| Wompi S.A.S. |
(82) |
| Wenia Ltd |
13,956 |
Others |
(4,470) |
| Equity method |
(314,932) |
| Total income, net |
(295,562) |
| Earnings before income tax |
(295,562) |
| Income tax |
337 |
| Net income |
(295,225) |
With the completion of the Corporate Transactions, Cibest became the parent company or holding company of all the financial entities and other companies that are part of the Group, including the Bank. Once the Corporate Transactions were finalized, the Bank's subsidiaries are as follows:
|
|
|
|
|
|
|
|
|
|
|
|
|
|
|
| Company |
Address |
Corporate Purpose |
% of participation and voting rights as of June 30, 2025 |
| Investment Banking |
Colombia |
Financial Services |
89.74 |
% |
| Bancolombia Panama |
Panama |
Commercial Bank |
100 |
% |
| Bancolombia Puerto Rico International Inc. |
Puerto Rico |
Commercial Bank |
100 |
% |
| Fiduciaria Bancolombia S.A. |
Colombia |
Trust Business |
94.97 |
% |
| FCP Fondo Inmobiliario Colombia |
Colombia |
Real Estate |
80.43 |
% |
| Valores Bancolombia S.A. |
Colombia |
Stockbroker |
93.61 |
% |
| P.A. FAI Calle 77 (Nomad77) |
Colombia |
Commercial Trust |
98 |
% |
| P.A. Nomad Central 2 |
Colombia |
Commercial Trust |
98 |
% |
| P.A. Mercurio - Combinado Habitat - others |
Colombia |
Commercial Trust |
100 |
% |
| P.A. Nomad Salitre |
Colombia |
Commercial Trust |
98 |
% |
| P.A. Nomad Cabrera |
Colombia |
Commercial Trust |
98 |
% |
| P.A. Sodimac |
Colombia |
Commercial Trust |
100 |
% |
| P.A. Nomad Distrito Vera |
Colombia |
Commercial Trust |
98 |
% |
| P.A. Nomad Nexo |
Colombia |
Fiducia mercantil |
98 |
% |
SIGNATURE
Pursuant to the requirements of the Securities Exchange Act of 1934, the registrant has duly caused this report to be signed on its behalf by the undersigned, thereunto duly authorized.
|
|
|
|
|
|
|
|
|
|
BANCOLOMBIA S.A.
(Registrant)
|
|
|
|
| Date: August 6, 2025 |
By: |
/s/ MAURICIO BOTERO WOLFF |
|
Name: |
Mauricio Botero Wolff |
|
Title: |
Vice President of Strategy and Finance |