株探米国株
日本語 英語
エドガーで原本を確認する
false000196433300019643332024-04-262024-04-26

UNITED STATES
SECURITIES AND EXCHANGE COMMISSION
Washington, D.C. 20549
___________________________________
FORM 8-K
___________________________________
CURRENT REPORT
Pursuant to Section 13 or 15(d)
of the Securities Exchange Act of 1934

April 26, 2024
Date of Report (date of earliest event reported)
___________________________________
Burke & Herbert Financial Services Corp.
(Exact name of registrant as specified in its charter)
___________________________________

Virginia
(State or other jurisdiction of
incorporation or organization)
001-41633
(Commission File Number)
92-0289417
(I.R.S. Employer Identification Number)
100 S. Fairfax Street
Alexandria, VA 22314
(Address of principal executive offices and zip code)
(703) 666-3555
(Registrant's telephone number, including area code)
___________________________________
Check the appropriate box below if the Form 8-K filing is intended to simultaneously satisfy the filing obligation of the registrant under any of the following provisions:

Written communications pursuant to Rule 425 under the Securities Act (17 CFR 230.425)
Soliciting material pursuant to Rule 14a-12 under the Exchange Act (17 CFR 240.14a-12)
Pre-commencement communications pursuant to Rule 14d-2(b) under the Exchange Act (17 CFR 240.14d-2(b))
Pre-commencement communications pursuant to Rule 13e-4(c) under the Exchange Act (17 CFR 240.13e-4(c))
Securities registered pursuant to Section 12(b) of the Act:
Title of each class
Trading Symbol
Name of each exchange on which registered
Common stock, par value $0.50 BHRB The Nasdaq Stock Market LLC
Indicate by check mark whether the registrant is an emerging growth company as defined in Rule 12b-2 of the Exchange Act.
Emerging growth company ☒
If an emerging growth company, indicate by check mark if the registrant has elected not to use the extended transition period for complying with any new or revised financial accounting standards provided pursuant to Section 13(a) of the Exchange Act. ☐


Item 2.02 - Results of Operations and Financial Condition.
On April 26, 2024, Burke & Herbert Financial Services Corp. (the "Company") issued a press release announcing its results of operations and financial condition for the quarter ended March 31, 2024. A copy of the press release is included as Exhibit 99.1 to this report.
Item 7.01 - Regulation FD Disclosure
The management of Burke & Herbert Financial Services Corp. anticipates meetings with investors during 2024. A copy of presentation materials will be made available on the investor relations section of the Company's website (https://www.burkeandherbertbank.com) and is furnished as exhibit 99.2 to this report. All information included in this presentation is presented as of the dates indicated, and the Company does not assume any obligation to correct or update such information in the future. The Company disclaims any inferences regarding the materiality of such information which otherwise may arise as a result of it furnishing such information under Item 7.01 of this Form 8-K.

In accordance with General Instruction B.2 of Form 8-K, the information furnished in this Item 7.01, including Exhibit 99.2, shall not be deemed "filed" for purposes of Section 18 of the Securities Exchange Act of 1934, as amended (the "Exchange Act"), or otherwise be subject to the liabilities of Section 18 of the Exchange Act.
Item 8.01 - Other Events
On April 25, 2024, the Company announced its Board of Directors declared a regular quarterly cash dividend on the Company's common stock of $0.53 per share, payable on June 3, 2024, to shareholders of record as of the close of business on May 15, 2024.

Item 9.01 - Financial Statements and Exhibits
(d) The following exhibits are being filed herewith:

Exhibit No. Description
99.1
99.2
104
Cover Page Interactive Data File (embedded within the Inline XBRL document)


SIGNATURE

Pursuant to the requirements of the Securities Exchange Act of 1934, as amended, the Registrant has duly caused this report to be signed on its behalf by the undersigned hereunto duly authorized on this 26th day of April, 2024.


Burke & Herbert Financial Services Corp.
By:
/s/ Roy E. Halyama
Name:
Roy E. Halyama
Title:
Executive Vice President, CFO

EX-99.1 2 a1q2024earningspressrelease.htm EX-99.1 Document
bh_logoxsubbrandxfinanciala.jpg

Burke & Herbert Financial Services Corp. Announces First Quarter 2024 Results and Declares Common Stock Dividend

For Immediate Release
April 26, 2024


Alexandria, VA – Burke & Herbert Financial Services Corp. (the “Company” or “Burke & Herbert”) (Nasdaq: BHRB) reported financial results for the quarter ended March 31, 2024. In addition, at its meeting on April 25, 2024, the board of directors declared a $0.53 per share regular cash dividend to be paid on June 3, 2024, to shareholders of record as of the close of business on May 15, 2024.

•Net income totaled $5.2 million for the quarter, compared to $5.1 million the previous quarter and $7.5 million for the same quarter in 2023. Diluted earnings per share for the quarter was $0.69, compared to $0.67 the previous quarter and $1.00 for the same quarter in 2023.

•Excluding significant items1, operating net income (non-GAAP2) totaled $5.7 million for the quarter, compared to $6.2 million the previous quarter and $7.7 million for the same quarter in 2023. Excluding significant items1, adjusted diluted earnings per share (non-GAAP2) for the quarter was $0.76, compared to $0.83 the previous quarter and $1.02 for the same quarter in 2023.

The Company notes the following highlights:

•Balance sheet remains strong with ample liquidity. Total liquidity, including all available borrowing capacity with cash and cash equivalents, totaled $758.3 million at the end of the first quarter.

•Total gross loans increased $166.4 million, or 8.5%, year-over-year and the Company ended the first quarter with a loan-to-deposit ratio of 70.8%.

•Total deposits were relatively stable and ended the quarter at $3.0 billion.

•Asset quality remains stable across the loan portfolio with adequate reserves.

•The Company continues to be well-capitalized, ending the quarter with 16.6% Common Equity Tier 1 capital to risk-weighted assets, 17.5% Total risk-based capital to risk-weighted assets, and a leverage ratio of 11.4%.

•On April 19, 2024, the Company and Summit Financial Group, Inc. (“Summit”) (Nasdaq: SMMF) announced receipt of the final regulatory approval required to complete the previously announced merger of equals pursuant to the Agreement and Plan of Reorganization, dated as of August 24, 2023, by and between Burke & Herbert and Summit. The merger is expected to close on May 3, 2024, pending satisfaction of customary closing conditions.

•When the merger is completed, the combination will create a financial holding company with more than $8 billion in assets and more than 75 branches across Virginia, West Virginia, Maryland, Delaware, and Kentucky, with more than 800 employees serving our communities.

From David P. Boyle, Company Chair, President and Chief Executive Officer
“I’m pleased with the progress being made on our financial results compared to the previous quarters. Our balance sheet is well-positioned for multiple economic scenarios, asset quality is stable, our lending teams remain active in our markets, our deposit base is strong and dependable, and our merger integration teams are working hard to ensure a smooth and successful outcome for our customers, communities, employees, and shareholders.”

(1) Significant items include items such as merger-related expenses and for the first quarter of 2023, listing-related expenses are further described below in our non-GAAP reconciliation tables.
(2) Non-GAAP financial measures referenced in this release are used by management to measure performance in operating the business that management believes enhances investors’ ability to better understand the underlying business performance and trends related to core business activities. Reconciliations of non-GAAP operating measures to the most directly comparable GAAP financial measures are included in the non-GAAP reconciliation tables in this release. Non-GAAP measures should not be used as a substitute for the closest comparable GAAP measurements.
1

bh_logoxsubbrandxfinanciala.jpg

Results of Operations

First Quarter 2024 - Comparison to prior year quarter

Net income for the three months ended March 31, 2024, was $5.2 million, or $2.3 million lower than the three months ended March 31, 2023, primarily due to increased funding costs and merger-related costs that were partially offset by an increase in loan interest income, due to increased loan balances and higher rates, and a recapture of credit loss provision in the current quarter.

Total revenue (non-GAAP2) for the three months ended March 31, 2024, was $26.4 million, or 9% lower than the three months ended March 31, 2023, and included $28.0 million in interest and fees on loans and $10.3 million in investment security income, which was a 23% increase and a 8% decrease, respectively, over the prior year three months ended March 31, 2023. Overall, interest income for the three months ended March 31, 2024, was $38.7 million, or 13% higher than the three months ended March 31, 2023. The increase in interest income for the Company’s loans was due to increased loan balances and higher rates, and the interest income decrease in investment securities was due to a lower level of investment securities. Loans, net of allowance for credit losses, ended the quarter at $2.1 billion, or 9% higher than March 31, 2023, while the investment portfolio fair value ended the quarter at $1.3 billion, or 6% lower than the prior year quarter.

The increase in interest income was offset by an increase in interest expense, which was $16.6 million for the three months ended March 31, 2024, or $7.1 million higher than the prior year quarter. The rapid rise in interest rates last year resulted in an increase in the Company’s cost of funds that outpaced the resulting benefit of higher rates on assets. The Company’s deposit interest expense was $12.9 million, or $7.5 million higher, for the three months ended March 31, 2024, compared to the three months ended March 31, 2023. Total deposits ended the quarter at $3.0 billion, which was slightly lower than the balance in the prior year quarter. Non-interest-bearing deposits decreased by 9% to $822.8 million, and interest-bearing deposits increased by 2% to $2.2 billion from the prior year quarter ended March 31, 2023, reflecting the changing deposit mix from non-interest-bearing to interest-bearing that has resulted in higher interest rate expense. The Company’s borrowed funds increased by 12% to $360.0 million from the prior year quarter ended March 31, 2023. Overall, net interest income decreased by $2.6 million from the prior year quarter.

Non-interest income for the three months ended March 31, 2024, increased slightly from the same period last year and totaled $4.3 million for the current period. The slight increase was primarily related to an increase in fiduciary and wealth management fees of $0.1 million when compared to the prior year quarter.

For the three months ended March 31, 2024, the Company recorded a recapture of credit losses of $0.7 million, compared to a provision for credit losses of $0.5 million in the prior year quarter due to improving portfolio credit quality and continued diversification of the loan portfolio. Total revenue (non-GAAP2) after provision for credit losses was $27.1 million for the three months ended March 31, 2024, which was a decrease of 5% compared to the same period last year.

Non-interest expense increased by $0.8 million, or 4%, for the three months ended March 31, 2024, from the prior year three months ended March 31, 2023. The increase was primarily due to other non-interest expenses associated with merger-related activities, including legal, consulting, and integration-related costs.

As of March 31, 2024, total shareholders’ equity was $319.3 million, or $29.5 million higher than March 31, 2023, primarily the result of higher fair value marks for our security portfolio resulting in lower accumulated other comprehensive loss by $22.9 million.
2

bh_logoxsubbrandxfinanciala.jpg

Regulatory capital ratios

The Company continues to be well-capitalized with capital ratios that are above regulatory requirements. As of March 31, 2024, our Common Equity Tier 1 capital to risk-weighted asset and Total risk-based capital to risk-weighted asset ratios were 16.6% and 17.5%, respectively, and significantly above the well-capitalized requirements of 6.5% and 10%, respectively. The leverage ratio was 11.4% compared to a 5% level to be considered well-capitalized.

Burke & Herbert Bank & Trust Company (“the Bank”), the Company’s wholly-owned bank subsidiary, also continues to be well-capitalized with capital ratios that are above regulatory requirements. As of March 31, 2024, the Bank’s Common Equity Tier 1 capital to risk-weighted asset and Total risk-based capital to risk-weighted asset ratios were 16.4% and 17.4%, respectively, and significantly above the well-capitalized requirements. In addition, the Bank’s leverage ratio of 11.3% is considered to be well-capitalized.

For more information about the Company’s financial condition, including additional disclosures pertinent to recent events in the banking industry, please see our financial statements and supplemental information attached to this release.

About Burke & Herbert

Burke & Herbert Financial Services Corp. is the financial holding company for Burke & Herbert Bank & Trust Company. Burke & Herbert Bank & Trust Company is the oldest continuously operating bank under its original name headquartered in the greater Washington DC Metro area. The Bank offers a full range of business and personal financial solutions designed to meet customers’ banking, borrowing, and investment needs and has over 20 branches throughout the Northern Virginia region and commercial loan offices in Fredericksburg, Loudoun County, Richmond, and in Bethesda, Maryland. Learn more at www.burkeandherbertbank.com.

Member FDIC; Equal Housing Lender

Cautionary Note Regarding Forward-Looking Statements

This communication includes “forward–looking statements” within the meaning of the Private Securities Litigation Reform Act of 1995, Section 27A of the Securities Act of 1933, as amended, and Section 21E of the Securities Exchange Act of 1934, as amended, with respect to the beliefs, goals, intentions, and expectations of Burke & Herbert regarding the proposed merger, revenues, earnings, earnings per share, loan production, asset quality, and capital levels, among other matters; our estimates of future costs and benefits of the actions we may take; our assessments of expected losses on loans; our assessments of interest rate and other market risks; our ability to achieve our financial and other strategic goals; the expected timing of completion of the proposed merger; the expected cost savings, synergies, returns, and other anticipated benefits from the proposed merger; and other statements that are not historical facts.

Forward–looking statements are typically identified by such words as “believe,” “expect,” “anticipate,” “intend,” “outlook,” “estimate,” “forecast,” “project,” “will,” “should,” and other similar words and expressions, and are subject to numerous assumptions, risks, and uncertainties, which change over time. These forward-looking statements include, without limitation, those relating to the terms, timing, and closing of the proposed merger.

Additionally, forward–looking statements speak only as of the date they are made; Burke & Herbert does not assume any duty, and does not undertake, to update such forward–looking statements, whether written or oral, that may be made from time to time, whether as a result of new information, future events, or otherwise. Furthermore, because forward–looking statements are subject to assumptions and uncertainties, actual results or future events could differ, possibly materially, from those indicated in or implied by such forward-looking statements as a result of a variety of factors, many of which are beyond the control of Burke & Herbert.


3

bh_logoxsubbrandxfinanciala.jpg

Such statements are based upon the current beliefs and expectations of the management of Burke & Herbert and are subject to significant risks and uncertainties outside of the control of the parties. Caution should be exercised against placing undue reliance on forward-looking statements. The factors that could cause actual results to differ materially include the following: the occurrence of any event, change or other circumstances that could give rise to the right of one or both of the parties to terminate the definitive merger agreement between Burke & Herbert and Summit; the outcome of any legal proceedings that may be instituted against Burke & Herbert or Summit; the possibility that the proposed merger will not close when expected, or at all; the ability of Burke & Herbert and Summit to meet expectations regarding the timing, completion, and accounting and tax treatments of the proposed merger; the risk that any announcements relating to the proposed merger could have adverse effects on the market price of the common stock of either or both parties to the proposed merger; the possibility that the anticipated benefits of the proposed merger will not be realized when expected, or at all, including as a result of the impact of, or problems arising from, the integration of the two companies or as a result of the strength of the economy and competitive factors in the areas where Burke & Herbert and Summit do business; certain restrictions during the pendency of the proposed merger that may impact the parties’ ability to pursue certain business opportunities or strategic transactions; the possibility that the merger may be more expensive to complete than anticipated, including as a result of unexpected factors or events; diversion of management’s attention from ongoing business operations and opportunities; the possibility that the parties may be unable to achieve expected synergies and operating efficiencies in the merger within the expected timeframes, or at all and to successfully integrate Summit’s operations and those of Burke & Herbert; such integration may be more difficult, time-consuming or costly than expected; revenues following the proposed merger may be lower than expected; Burke & Herbert’s and Summit’s success in executing their respective business plans and strategies and managing the risks involved in the foregoing; the dilution caused by Burke & Herbert’s issuance of additional shares of its capital stock in connection with the proposed merger; effects of the announcement, pendency, or completion of the proposed merger on the ability of Burke & Herbert and Summit to retain customers and retain and hire key personnel and maintain relationships with their suppliers, and on their operating results and businesses generally; and risks related to the potential impact of general economic, political and market factors on the companies or the proposed merger and other factors that may affect future results of Burke & Herbert and Summit; and the other factors discussed in the “Risk Factors” and “Management’s Discussion and Analysis of Financial Condition and Results of Operations” section of Burke & Herbert’s Annual Report on Form 10–K for the year ended December 31, 2023, and other reports Burke & Herbert files with the SEC.

4

Burke & Herbert Financial Services Corp.
Consolidated Statements of Income (unaudited)
(In thousands)
Three months ended March 31,
2024 2023
Interest income
Loans, including fees $ 28,045  $ 22,760 
Taxable securities 8,943  9,802 
Tax-exempt securities 1,361  1,458 
Other interest income 396  308 
Total interest income 38,745  34,328 
Interest expense
Deposits 12,931  5,401 
Borrowed funds 3,655  4,138 
Other interest expense 28  15 
Total interest expense 16,614  9,554 
Net interest income 22,131  24,774 
Provision for (recapture of) credit losses (670) 515 
Net interest income after credit loss expense 22,801  24,259 
Non-interest income
Fiduciary and wealth management 1,419  1,337 
Service charges and fees 1,606  1,635 
Net gains (losses) on securities —  — 
Income from company-owned life insurance 547  560 
Other non-interest income 682  682 
Total non-interest income 4,254  4,214 
Non-interest expense
Salaries and wages 9,518  9,494 
Pensions and other employee benefits 2,365  2,468 
Occupancy 1,538  1,457 
Equipment rentals, depreciation, and maintenance
1,281  1,339 
Other operating 6,463  5,607 
Total non-interest expense 21,165  20,365 
Income before income taxes 5,890  8,108 
Income tax expense 678  584 
Net income $ 5,212  $ 7,524 


5

Burke & Herbert Financial Services Corp.
Consolidated Balance Sheets
(In thousands)
March 31, 2024 December 31, 2023
(Unaudited) (Audited)
Assets
Cash and due from banks $ 9,152  $ 8,896 
Interest-earning deposits with banks 44,925  35,602 
Cash and cash equivalents 54,077  44,498 
Securities available-for-sale, at fair value 1,275,520  1,248,439 
Restricted stock, at cost 16,357  5,964 
Loans held-for-sale, at fair value 2,422  1,497 
Loans 2,118,155  2,087,756 
Allowance for credit losses (24,606) (25,301)
Net loans 2,093,549  2,062,455 
Premises and equipment, net 61,576  61,128 
Accrued interest receivable 16,328  15,895 
Company-owned life insurance 94,755  94,159 
Other assets 81,806  83,544 
Total Assets
$ 3,696,390  $ 3,617,579 
Liabilities and Shareholders’ Equity
Liabilities
Non-interest-bearing deposits $ 822,767  $ 830,320 
Interest-bearing deposits 2,167,346  2,171,561 
Total deposits 2,990,113  3,001,881 
Borrowed funds 360,000  272,000 
Accrued interest and other liabilities 26,969  28,948 
Total Liabilities 3,377,082  3,302,829 
Shareholders’ Equity
Common Stock 4,006  4,000 
Additional paid-in capital 15,308  14,495 
Retained earnings 428,532  427,333 
Accumulated other comprehensive income (loss) (100,954) (103,494)
Treasury stock (27,584) (27,584)
Total Shareholders’ Equity 319,308  314,750 
Total Liabilities and Shareholders’ Equity $ 3,696,390  $ 3,617,579 
6

Burke & Herbert Financial Services Corp.
Supplemental Information (unaudited)
As of or for the three months ended
(In thousands, except ratios and per share amounts)


March 31 December 31 September 30 June 30 March 31
2024 2023 2023 2023 2023
Per common share information
Basic earnings $ 0.70  $ 0.68  $ 0.55  $ 0.81  $ 1.01 
Diluted earnings 0.69  0.67  0.55  0.80  1.00 
Cash dividends 0.53  0.53  0.53  0.53  0.53 
Book value 42.92  42.37  36.46  39.05  39.02 
Balance sheet-related (at period end, unless indicated)
Assets $ 3,696,390  $ 3,617,579  $ 3,585,188  $ 3,569,226  $ 3,671,186 
Average earning assets 3,377,092  3,332,733  3,337,282  3,379,534  3,331,920 
Loans (gross) 2,118,155  2,087,756  2,070,616  2,000,969  1,951,738 
Loans (net) 2,093,549  2,062,455  2,044,505  1,975,050  1,926,034 
Securities, available-for-sale, at fair value 1,275,520  1,248,439  1,224,395  1,252,190  1,362,785 
Non-interest-bearing deposits 822,767  830,320  853,385  876,396  906,723 
Interest-bearing deposits 2,167,346  2,171,561  2,132,233  2,128,867  2,125,668 
Deposits, total 2,990,113  3,001,881  2,985,618  3,005,263  3,032,391 
Brokered deposits 370,847  389,011  389,018  389,051  389,185 
Uninsured deposits 700,846  677,308  670,735  681,908  715,053 
Borrowed funds 360,000  272,000  299,000  249,000  321,700 
Unused borrowing capacity3
704,233  914,980  883,525  958,962  809,127 
Equity 319,308  314,750  270,819  290,072  289,783 
Accumulated other comprehensive income (loss) (100,954) (103,494) (146,159) (126,177) (123,809)


(3) Includes Federal Home Loan Bank and correspondent bank availability.


7

Burke & Herbert Financial Services Corp.
Supplemental Information (unaudited)
As of or for the three months ended
(In thousands, except ratios and per share amounts)


March 31 December 31 September 30 June 30 March 31
2024 2023 2023 2023 2023
Income statement
Interest income $ 38,745  $ 38,180  $ 37,272  $ 37,116  $ 34,328 
Interest expense 16,614  15,876  14,383  13,324  9,554 
Non-interest income 4,254  4,824  4,289  4,625  4,214 
Total revenue (non-GAAP2)
26,385  27,128  27,178  28,417  28,988 
Non-interest expense 21,165  22,300  22,423  21,348  20,365 
Pretax, pre-provision earnings (non-GAAP2)
5,220  4,828  4,755  7,069  8,623 
Provision for (recapture of) credit losses (670) (750) 235  214  515 
Income before income taxes 5,890  5,578  4,520  6,855  8,108 
Income tax expense 678  500  464  821  584 
Net income $ 5,212  $ 5,078  $ 4,056  $ 6,034  $ 7,524 
Ratios
Return on average assets (annualized) 0.58  % 0.56  % 0.45  % 0.67  % 0.85  %
Return on average equity (annualized) 6.67  7.30  5.60  8.34  10.83 
Net interest margin (non-GAAP2)
2.68  2.70  2.76  2.87  3.06 
Efficiency ratio 80.22  82.20  82.50  75.12  70.25 
Loan-to-deposit ratio
70.84  69.55  69.35  66.58  64.36 
Common Equity Tier 1 (CET1) capital ratio 16.56  16.85  16.44  17.60  17.55 
Total risk-based capital ratio 17.54  17.88  17.48  18.71  18.65 
Leverage ratio 11.36  11.31  11.32  11.20  11.19 


8

Burke & Herbert Financial Services Corp.
Non-GAAP Reconciliations (unaudited)
(In thousands, except ratios and per share amounts)

Operating net income (non-GAAP)
For the three months ended
March 31 December 31 September 30 June 30 March 31
2024 2023 2023 2023 2023
Net income $ 5,212  $ 5,078  $ 4,056  $ 6,034  $ 7,524 
Add back significant items (tax effected):
Listing-related —  —  —  79  160 
Merger-related 537  1,141  1,592  92  — 
Total significant items 537  1,141  1,592  171  160 
Operating net income $ 5,749  $ 6,219  $ 5,648  $ 6,205  $ 7,684 
Weighted average diluted shares 7,527,489  7,508,289  7,499,278  7,514,955  7,504,473 
Adjusted diluted EPS
$ 0.76  $ 0.83  $ 0.75  $ 0.83  $ 1.02 
Operating net income is a non-GAAP measure that is derived from net income adjusted for significant items. The Company believes that operating net income is useful in periods with certain significant items, such as listing-related or merger-related expenses. The operating net income is more reflective of management’s ability to grow the business and manage expenses.

Total Revenue (non-GAAP)
For the three months ended
March 31 December 31 September 30 June 30 March 31
2024 2023 2023 2023 2023
Interest income $ 38,745  $ 38,180  $ 37,272  $ 37,116  $ 34,328 
Interest expense 16,614  15,876  14,383  13,324  9,554 
Non-interest income 4,254  4,824  4,289  4,625  4,214 
Total revenue (non-GAAP) $ 26,385  $ 27,128  $ 27,178  $ 28,417  $ 28,988 
Total revenue is a non-GAAP measure and is derived from total interest income less total interest expense plus total non-interest income. We believe that total revenue is a useful tool to determine how the Company is managing its business and demonstrates how stable our revenue sources are from period to period.

9

Burke & Herbert Financial Services Corp.
Non-GAAP Reconciliations (unaudited)
(In thousands, except ratios and per share amounts)
Pretax, Pre-Provision Earnings (non-GAAP)
For the three months ended
March 31 December 31 September 30 June 30 March 31
2024 2023 2023 2023 2023
Income before taxes $ 5,890  $ 5,578  $ 4,520  $ 6,855  $ 8,108 
Provision for (recapture of) credit losses (670) (750) 235  214  515 
Pretax, pre-provision earnings (non-GAAP) $ 5,220  $ 4,828  $ 4,755  $ 7,069  $ 8,623 
Pretax, pre-provision earnings is a non-GAAP measure and is based on adjusting income before income taxes and to exclude provision for (recapture of) credit losses. We believe that pretax, pre-provision earnings is a useful tool to help evaluate the ability to provide for credit costs through operations and provides an additional basis to compare results between periods by isolating the impact of provision for (recapture of) credit losses, which can vary significantly between periods.

Net Interest Margin & Taxable-Equivalent Net Interest Income (non-GAAP)
As of or for the three months ended
March 31 December 31 September 30 June 30 March 31
2024 2023 2023 2023 2023
Net interest income $ 22,131  $ 22,304  $ 22,889  $ 23,792  $ 24,774 
Taxable-equivalent adjustments 362  365  366  375  387 
Net interest income (Fully Taxable-Equivalent - FTE) $ 22,493  $ 22,669  $ 23,255  $ 24,167  $ 25,161 
Average earning assets $ 3,377,092  $ 3,332,733  $ 3,337,282  $ 3,379,534  $ 3,331,920 
Net interest margin (non-GAAP) 2.68  % 2.70  % 2.76  % 2.87  % 3.06  %
The interest income earned on certain earning assets is completely or partially exempt from federal income tax. As such, these tax-exempt instruments typically yield lower returns than taxable investments. To provide more meaningful comparisons of net interest income, we use net interest income on a fully taxable-equivalent (FTE) basis by increasing the interest income earned on tax-exempt assets to make it fully equivalent to interest income earned on taxable investments. FTE net interest income is calculated by adding the tax benefit on certain financial interest earning assets, whose interest is tax-exempt, to total interest income then subtracting total interest expense. Management believes FTE net interest income is a standard practice in the banking industry, and when net interest income is adjusted on an FTE basis, yields on taxable, nontaxable, and partially taxable assets are comparable; however, the adjustment to an FTE basis has no impact on net income and this adjustment is not permitted under GAAP. FTE net interest income is only used for calculating FTE net interest margin, which is calculated by annualizing FTE net interest income and then dividing by the average earning assets. The tax-rate used for this adjustment is 21%. Net interest income shown elsewhere in this presentation is GAAP net interest income.
10
EX-99.2 3 bhfs_investordeckxq1x202.htm EX-99.2 bhfs_investordeckxq1x202
1 1Q24 Update (Nasdaq: BHRB) April 2024 On April 19, 2024, the Company and Summit Financial Group, Inc. (“Summit”) (Nasdaq: SMMF) announced receipt of the final regulatory approval required to complete the previously announced merger of equals pursuant to the Agreement and Plan of Reorganization, dated as of August 24, 2023, by and between Burke & Herbert and Summit. The merger is expected to close on May 3, 2024, pending satisfaction of customary closing conditions. When the merger is completed, the combination will create a company with more than $8 billion in assets and more than 75 branches across Virginia, West Virginia, Maryland, Delaware, and Kentucky, with more than 800 employees serving our communities.


2 Cautionary Statement Regarding Forward-Looking Information This communication includes “forward–looking statements” within the meaning of the Private Securities Litigation Reform Act of 1995, Section 27A of the Securities Act of 1933, as amended, and Section 21E of the Securities Exchange Act of 1934, as amended, with respect to the beliefs, goals, intentions, and expectations of Burke & Herbert regarding the proposed merger, revenues, earnings, earnings per share, loan production, asset quality, and capital levels, among other matters; our estimates of future costs and benefits of the actions we may take; our assessments of expected losses on loans; our assessments of interest rate and other market risks; our ability to achieve our financial and other strategic goals; the expected timing of completion of the proposed merger; the expected cost savings, synergies, returns and other anticipated benefits from the proposed merger; and other statements that are not historical facts. Forward–looking statements are typically identified by such words as “believe,” “expect,” “anticipate,” “intend,” “outlook,” “estimate,” “forecast,” “project,” “will,” “should,” and other similar words and expressions, and are subject to numerous assumptions, risks, and uncertainties, which change over time. These forward-looking statements include, without limitation, those relating to the terms, timing, and closing of the proposed merger. Additionally, forward–looking statements speak only as of the date they are made; Burke & Herbert does not assume any duty, and does not undertake, to update such forward–looking statements, whether written or oral, that may be made from time to time, whether as a result of new information, future events, or otherwise. Furthermore, because forward–looking statements are subject to assumptions and uncertainties, actual results or future events could differ, possibly materially, from those indicated in or implied by such forward-looking statements as a result of a variety of factors, many of which are beyond the control of Burke & Herbert. Such statements are based upon the current beliefs and expectations of the management of Burke & Herbert and are subject to significant risks and uncertainties outside of the control of the parties. Caution should be exercised against placing undue reliance on forward-looking statements. The factors that could cause actual results to differ materially include the following: the occurrence of any event, change or other circumstances that could give rise to the right of one or both of the parties to terminate the definitive merger agreement between Burke & Herbert and Summit; the outcome of any legal proceedings that may be instituted against Burke & Herbert or Summit; the possibility that the proposed merger will not close when expected, or at all; the ability of Burke & Herbert and Summit to meet expectations regarding the timing, completion, and accounting and tax treatments of the proposed merger; the risk that any announcements relating to the proposed merger could have adverse effects on the market price of the common stock of either or both parties to the proposed merger; the possibility that the anticipated benefits of the proposed merger will not be realized when expected, or at all, including as a result of the impact of, or problems arising from, the integration of the two companies or as a result of the strength of the economy and competitive factors in the areas where Burke & Herbert and Summit do business; certain restrictions during the pendency of the proposed merger that may impact the parties’ ability to pursue certain business opportunities or strategic transactions; the possibility that the merger may be more expensive to complete than anticipated, including as a result of unexpected factors or events; diversion of management’s attention from ongoing business operations and opportunities; the possibility that the parties may be unable to achieve expected synergies and operating efficiencies in the merger within the expected timeframes, or at all and to successfully integrate Summit’s operations and those of Burke & Herbert; such integration may be more difficult, time-consuming or costly than expected; revenues following the proposed merger may be lower than expected; Burke & Herbert’s and Summit’s success in executing their respective business plans and strategies and managing the risks involved in the foregoing; the dilution caused by Burke & Herbert’s issuance of additional shares of its capital stock in connection with the proposed merger; effects of the announcement, pendency, or completion of the proposed merger on the ability of Burke & Herbert and Summit to retain customers and retain and hire key personnel and maintain relationships with their suppliers, and on their operating results and businesses generally; and risks related to the potential impact of general economic, political and market factors on the companies or the proposed merger and other factors that may affect future results of Burke & Herbert and Summit; and the other factors discussed in the in the “Risk Factors” and “Management’s Discussion and Analysis of Financial Condition and Results of Operations” section of Burke & Herbert’s Annual Report on Form 10–K for the year ended December 31, 2023 and other reports Burke & Herbert files with the SEC.


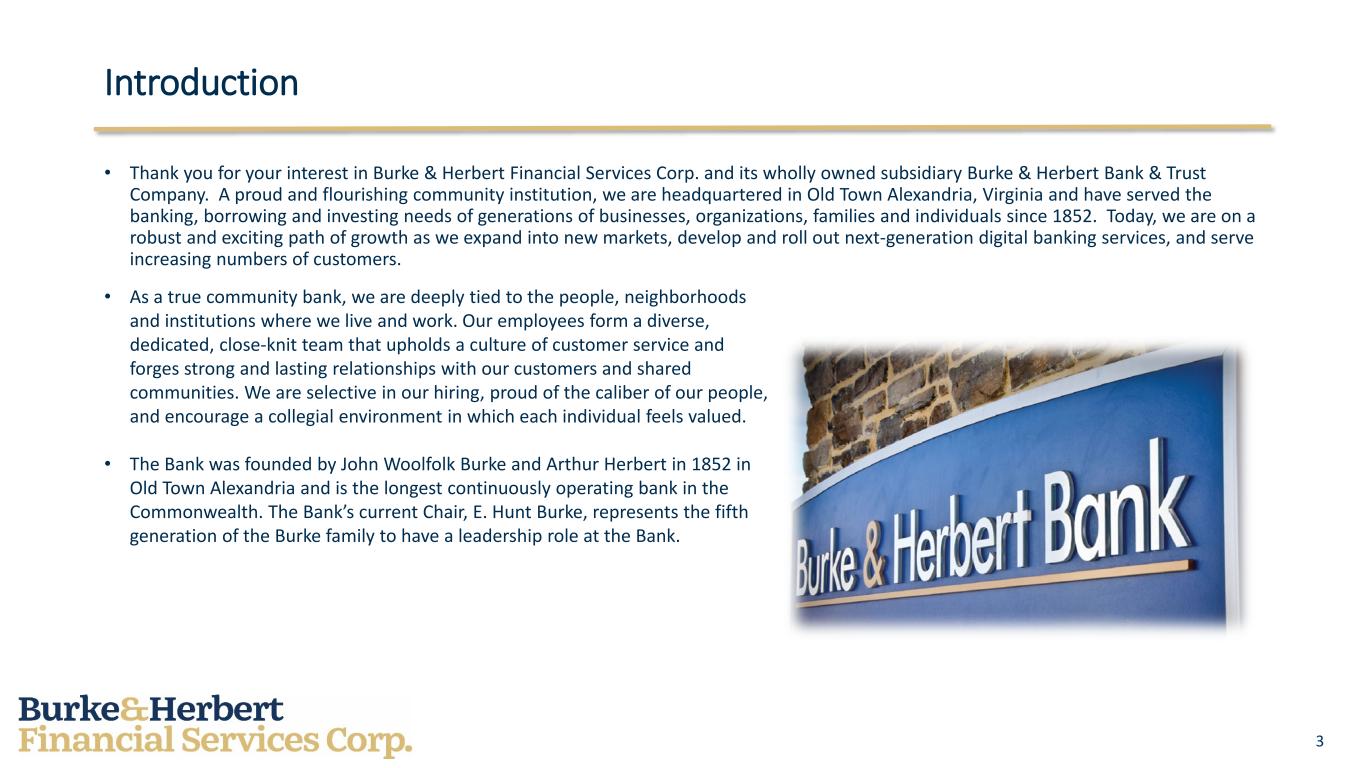
3 Introduction • Thank you for your interest in Burke & Herbert Financial Services Corp. and its wholly owned subsidiary Burke & Herbert Bank & Trust Company. A proud and flourishing community institution, we are headquartered in Old Town Alexandria, Virginia and have served the banking, borrowing and investing needs of generations of businesses, organizations, families and individuals since 1852. Today, we are on a robust and exciting path of growth as we expand into new markets, develop and roll out next-generation digital banking services, and serve increasing numbers of customers. • As a true community bank, we are deeply tied to the people, neighborhoods and institutions where we live and work. Our employees form a diverse, dedicated, close-knit team that upholds a culture of customer service and forges strong and lasting relationships with our customers and shared communities. We are selective in our hiring, proud of the caliber of our people, and encourage a collegial environment in which each individual feels valued. • The Bank was founded by John Woolfolk Burke and Arthur Herbert in 1852 in Old Town Alexandria and is the longest continuously operating bank in the Commonwealth. The Bank’s current Chair, E. Hunt Burke, represents the fifth generation of the Burke family to have a leadership role at the Bank.


4 Key Takeaways • Burke & Herbert Financial Services Corp. was established in September 2022 as the holding company for Burke & Herbert Bank & Trust Company, which has been offering banking services in Northern Virginia since 1852 • We have a seasoned executive management team and an experienced Board of Directors all focused on delivering long-term value for our shareholders • Our recent performance has been solid and we are well-positioned to execute our strategic plan to: - Profitably expand our market share - Transform our digital capabilities - Grow fee-based sources of revenue


5 Executive Team Name Role Years in Banking Years at BHRB Prior Institution Experience David Boyle Roy Halyama Joseph Collum Jeffrey Welch Emily Debeniotis Shannon Rowan Kendrick Smith Alexis Santin Greg Mellors Jennifer Schmidt Chair, CEO, President EVP, Chief Financial Officer EVP, Branch & Business Banking EVP, Chief Credit Officer EVP, Human Resources EVP, Wealth Services EVP, Operations EVP, Payments & Digital Strategy EVP, Chief Lending Officer EVP, Enterprise Risk 25+ years 25+ years 25+ years 25+ years 25+ years 25+ years 25+ years 20+ years 25+ years 15+ years 5 years 3 years 25+ years 10 years 25+ years 13 years 4 years 5 years 4 years 9 years PNC Financial Services / National City Bank JP Morgan / PNC Financial Services / Fifth Third Bank All with BHRB TD Bank / Sandy Spring Bank All with BHRB Capital One Financial / Chevy Chase Orrstown Bank / First National Community Bank Eagle Bancorp Wells Fargo Capital One Financial / BP Oil


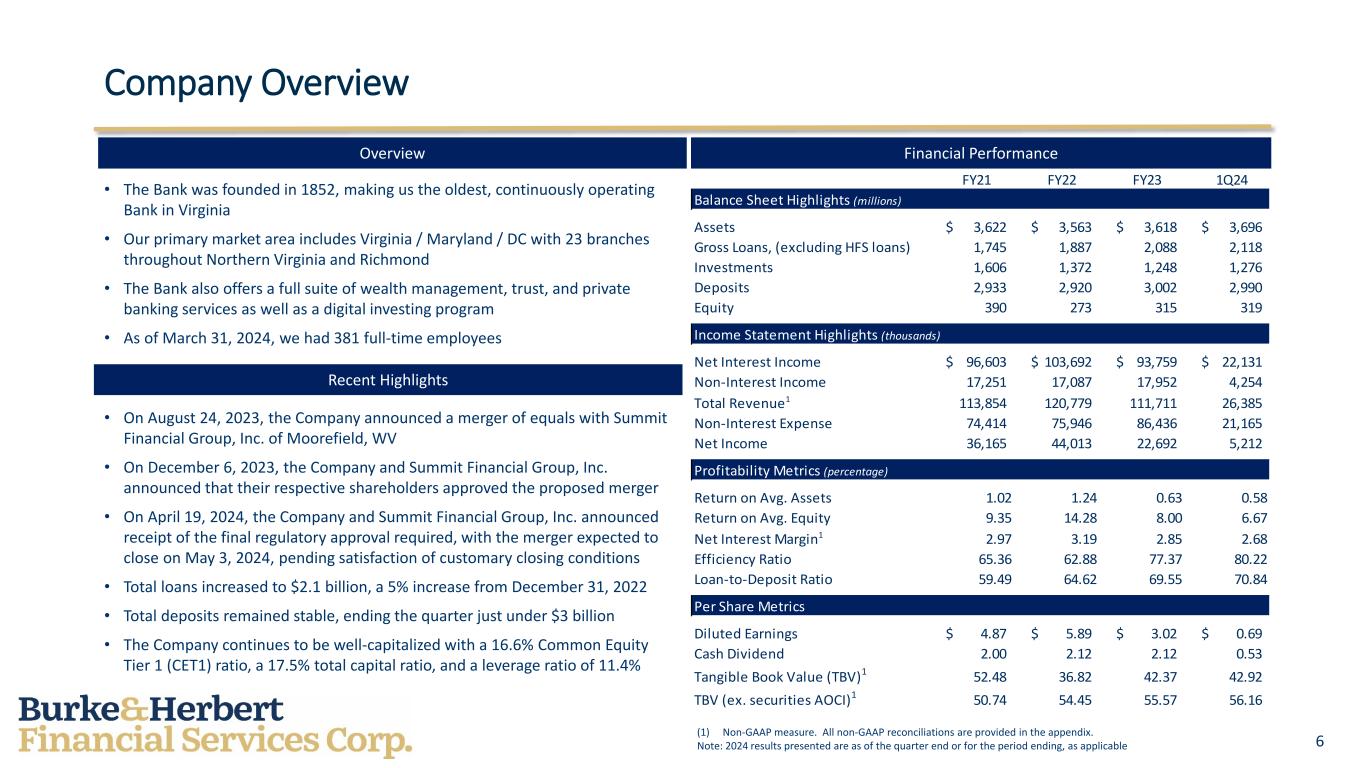
6 Company Overview • The Bank was founded in 1852, making us the oldest, continuously operating Bank in Virginia • Our primary market area includes Virginia / Maryland / DC with 23 branches throughout Northern Virginia and Richmond • The Bank also offers a full suite of wealth management, trust, and private banking services as well as a digital investing program • As of March 31, 2024, we had 381 full-time employees Overview Financial Performance (1) Non-GAAP measure. All non-GAAP reconciliations are provided in the appendix. Note: 2024 results presented are as of the quarter end or for the period ending, as applicable Recent Highlights • On August 24, 2023, the Company announced a merger of equals with Summit Financial Group, Inc. of Moorefield, WV • On December 6, 2023, the Company and Summit Financial Group, Inc. announced that their respective shareholders approved the proposed merger • On April 19, 2024, the Company and Summit Financial Group, Inc. announced receipt of the final regulatory approval required, with the merger expected to close on May 3, 2024, pending satisfaction of customary closing conditions • Total loans increased to $2.1 billion, a 5% increase from December 31, 2022 • Total deposits remained stable, ending the quarter just under $3 billion • The Company continues to be well-capitalized with a 16.6% Common Equity Tier 1 (CET1) ratio, a 17.5% total capital ratio, and a leverage ratio of 11.4% FY21 FY22 FY23 1Q24 Assets 3,622$ 3,563$ 3,618$ 3,696$ Gross Loans, (excluding HFS loans) 1,745 1,887 2,088 2,118 Investments 1,606 1,372 1,248 1,276 Deposits 2,933 2,920 3,002 2,990 Equity 390 273 315 319 Net Interest Income 96,603$ 103,692$ 93,759$ 22,131$ Non-Interest Income 17,251 17,087 17,952 4,254 Total Revenue1 113,854 120,779 111,711 26,385 Non-Interest Expense 74,414 75,946 86,436 21,165 Net Income 36,165 44,013 22,692 5,212 Return on Avg. Assets 1.02 1.24 0.63 0.58 Return on Avg. Equity 9.35 14.28 8.00 6.67 Net Interest Margin1 2.97 3.19 2.85 2.68 Efficiency Ratio 65.36 62.88 77.37 80.22 Loan-to-Deposit Ratio 59.49 64.62 69.55 70.84 Diluted Earnings 4.87$ 5.89$ 3.02$ 0.69$ Cash Dividend 2.00 2.12 2.12 0.53 Tangible Book Value (TBV)1 52.48 36.82 42.37 42.92 TBV (ex. securities AOCI)1 50.74 54.45 55.57 56.16 Balance Sheet Highlights (millions) Income Statement Highlights (thousands) Profitability Metrics (percentage) Per Share Metrics


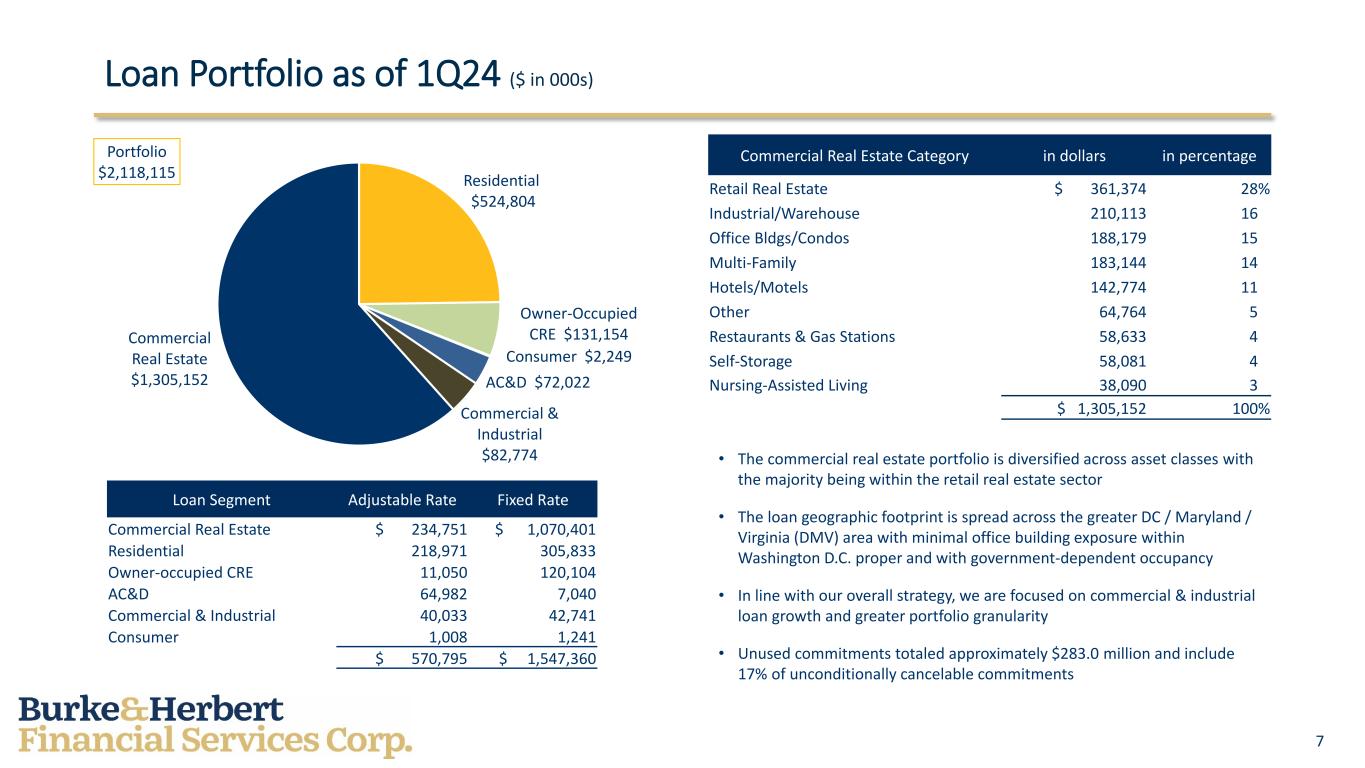
7 Loan Portfolio as of 1Q24 ($ in 000s) Residential $524,804 Owner-Occupied CRE $131,154 Consumer $2,249 AC&D $72,022 Commercial & Industrial $82,774 Commercial Real Estate $1,305,152 Portfolio $2,118,115 Loan Segment Adjustable Rate Fixed Rate Commercial Real Estate $ 234,751 $ 1,070,401 Residential 218,971 305,833 Owner-occupied CRE 11,050 120,104 AC&D 64,982 7,040 Commercial & Industrial 40,033 42,741 Consumer 1,008 1,241 $ 570,795 $ 1,547,360 • The commercial real estate portfolio is diversified across asset classes with the majority being within the retail real estate sector • The loan geographic footprint is spread across the greater DC / Maryland / Virginia (DMV) area with minimal office building exposure within Washington D.C. proper and with government-dependent occupancy • In line with our overall strategy, we are focused on commercial & industrial loan growth and greater portfolio granularity • Unused commitments totaled approximately $283.0 million and include 17% of unconditionally cancelable commitments Commercial Real Estate Category in dollars in percentage Retail Real Estate $ 361,374 28% Industrial/Warehouse 210,113 16% Office Bldgs/Condos 188,179 15% Multi-Family 183,144 14% Hotels/Motels 142,774 11% Other 64,764 5% Restaurants & Gas Stations 58,633 4% Self-Storage 58,081 4% Nursing-Assisted Living 38,090 3% $ 1,305,152 100%


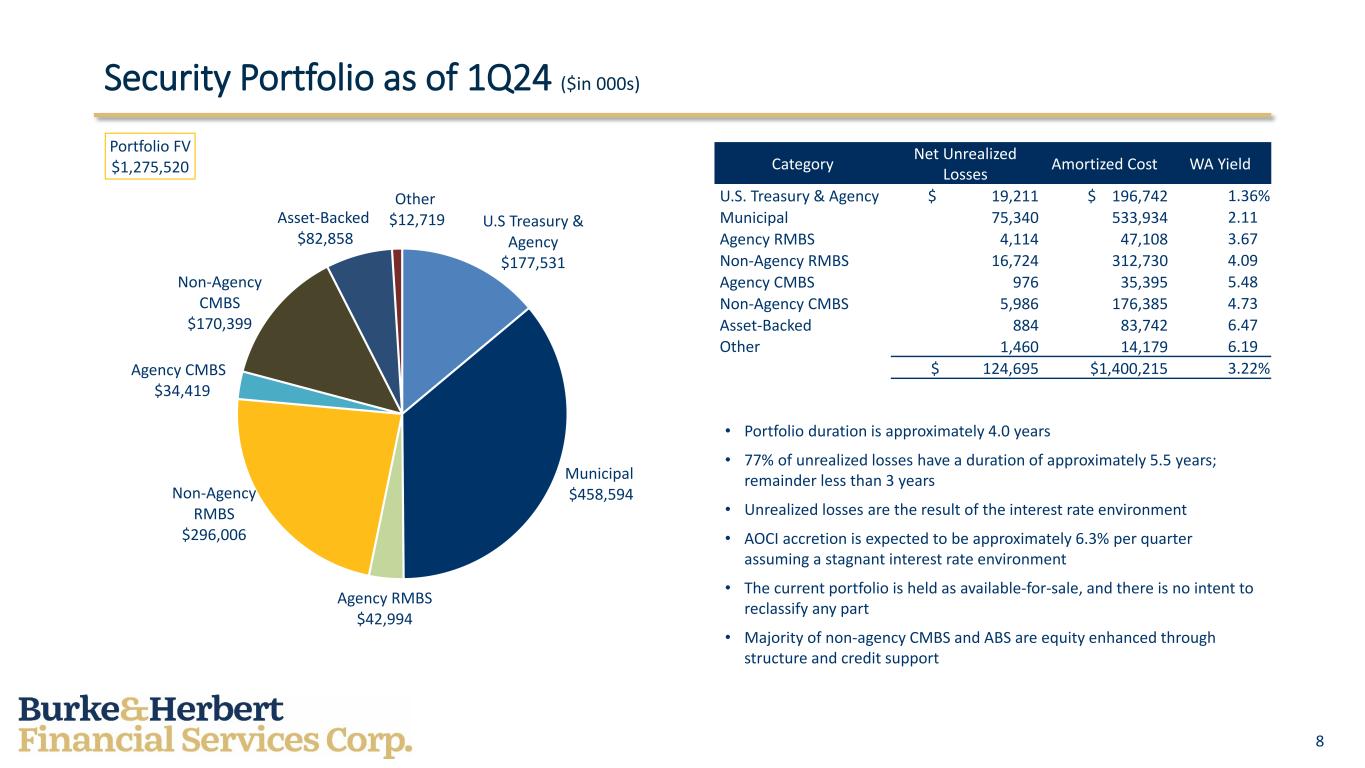
8 Security Portfolio as of 1Q24 ($in 000s) U.S Treasury & Agency $177,531 Municipal $458,594 Agency RMBS $42,994 Non-Agency RMBS $296,006 Agency CMBS $34,419 Non-Agency CMBS $170,399 Asset-Backed $82,858 Other $12,719 Portfolio FV $1,275,520 • Portfolio duration is approximately 4.0 years • 77% of unrealized losses have a duration of approximately 5.5 years; remainder less than 3 years • Unrealized losses are the result of the interest rate environment • AOCI accretion is expected to be approximately 6.3% per quarter assuming a stagnant interest rate environment • The current portfolio is held as available-for-sale, and there is no intent to reclassify any part • Majority of non-agency CMBS and ABS are equity enhanced through structure and credit support Category Net Unrealized Losses Amortized Cost WA Yield U.S. Treasury & Agency $ 19,211 $ 196,742 1.36% Municipal 75,340 533,934 2.11% Agency RMBS 4,114 47,108 3.67% Non-Agency RMBS 16,724 312,730 4.09% Agency CMBS 976 35,395 5.48% Non-Agency CMBS 5,986 176,385 4.73% Asset-Backed 884 83,742 6.47% Other 1,460 14,179 6.19% $ 124,695 $1,400,215 3.22%


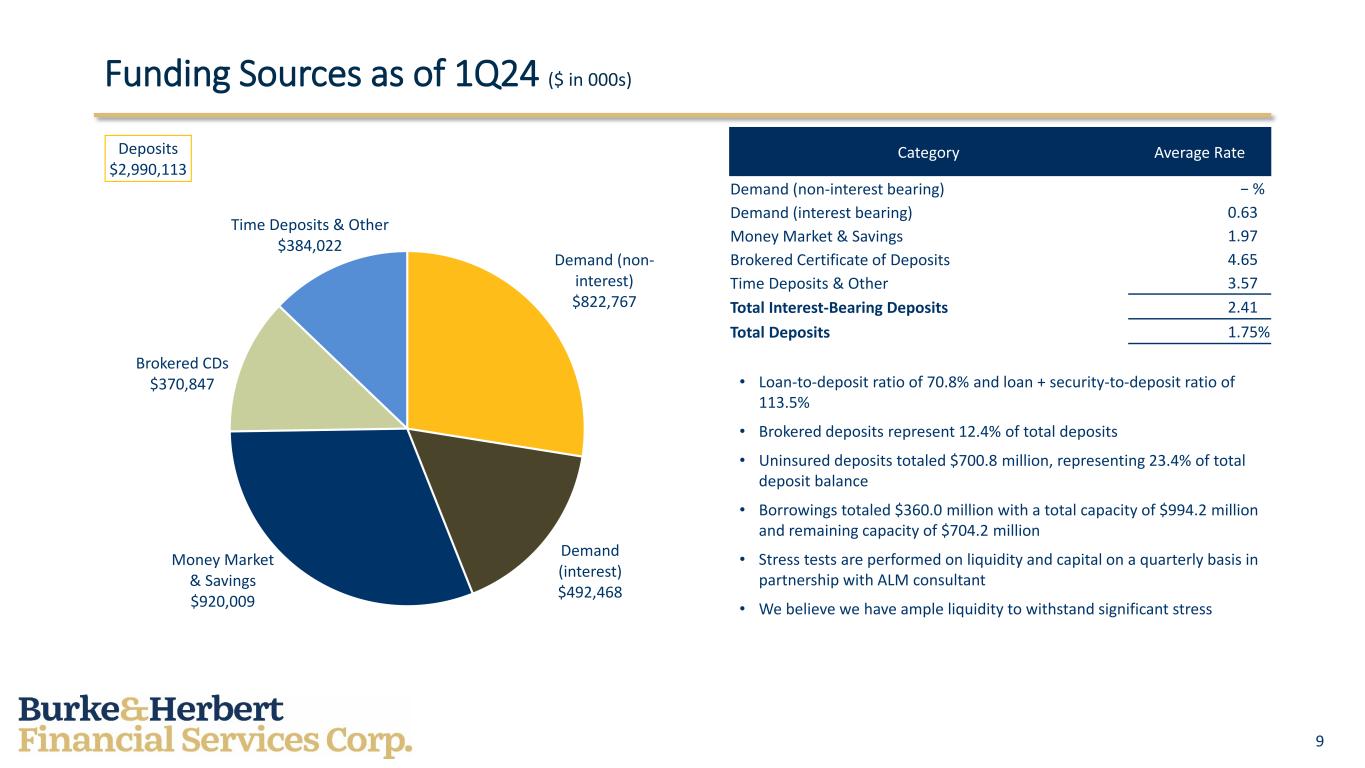
9 Funding Sources as of 1Q24 ($ in 000s) Demand (non- interest) $822,767 Demand (interest) $492,468 Money Market & Savings $920,009 Brokered CDs $370,847 Time Deposits & Other $384,022 Deposits $2,990,113 Category Average Rate Demand (non-interest bearing) − % Demand (interest bearing) 0.63% Money Market & Savings 1.97% Brokered Certificate of Deposits 4.65% Time Deposits & Other 3.57% Total Interest-Bearing Deposits 2.41% Total Deposits 1.75% • Loan-to-deposit ratio of 70.8% and loan + security-to-deposit ratio of 113.5% • Brokered deposits represent 12.4% of total deposits • Uninsured deposits totaled $700.8 million, representing 23.4% of total deposit balance • Borrowings totaled $360.0 million with a total capacity of $994.2 million and remaining capacity of $704.2 million • Stress tests are performed on liquidity and capital on a quarterly basis in partnership with ALM consultant • We believe we have ample liquidity to withstand significant stress


10 Capital Trends as of 1Q24 17.6% 18.0% 16.9% 16.6% FY21 FY22 FY23 1Q24 Common Equity Tier 1 Ratio 17.6% 18.0% 16.9% 16.6% FY21 FY22 FY23 1Q24 Tier 1 Capital Ratio 18.8% 18.9% 17.9% 17.5% FY21 FY22 FY23 1Q24 Total Capital Ratio 10.9% 8.7% 7.9% 8.7% FY21 FY22 FY23 1Q24 Average Equity to Average Assets Capital Management • We take a forward-looking, disciplined approach to capital management that emphasizes acceptable risk- adjusted returns over the long-term • Our capital management priorities include - Supporting customers - Funding business investments - Maintaining appropriate capital in light of economic conditions and regulatory expectations - Returning excess capital to shareholders • Modeled stress scenarios include evaluating the impact of deposit shocks, interest rate scenarios, and general balance sheet repositioning • Stress scenarios result in capital levels well above well- capitalized levels • Including the impact of the securities portfolio AOCI, our capital ratios as of 1Q24 would be 12.7% (for CET 1 and Tier 1 Capital) and 13.7% (Total Capital) • Capital ratios are for Burke & Herbert Financial Services Corp. except for FY21, which are for Burke & Herbert Bank & Trust Company


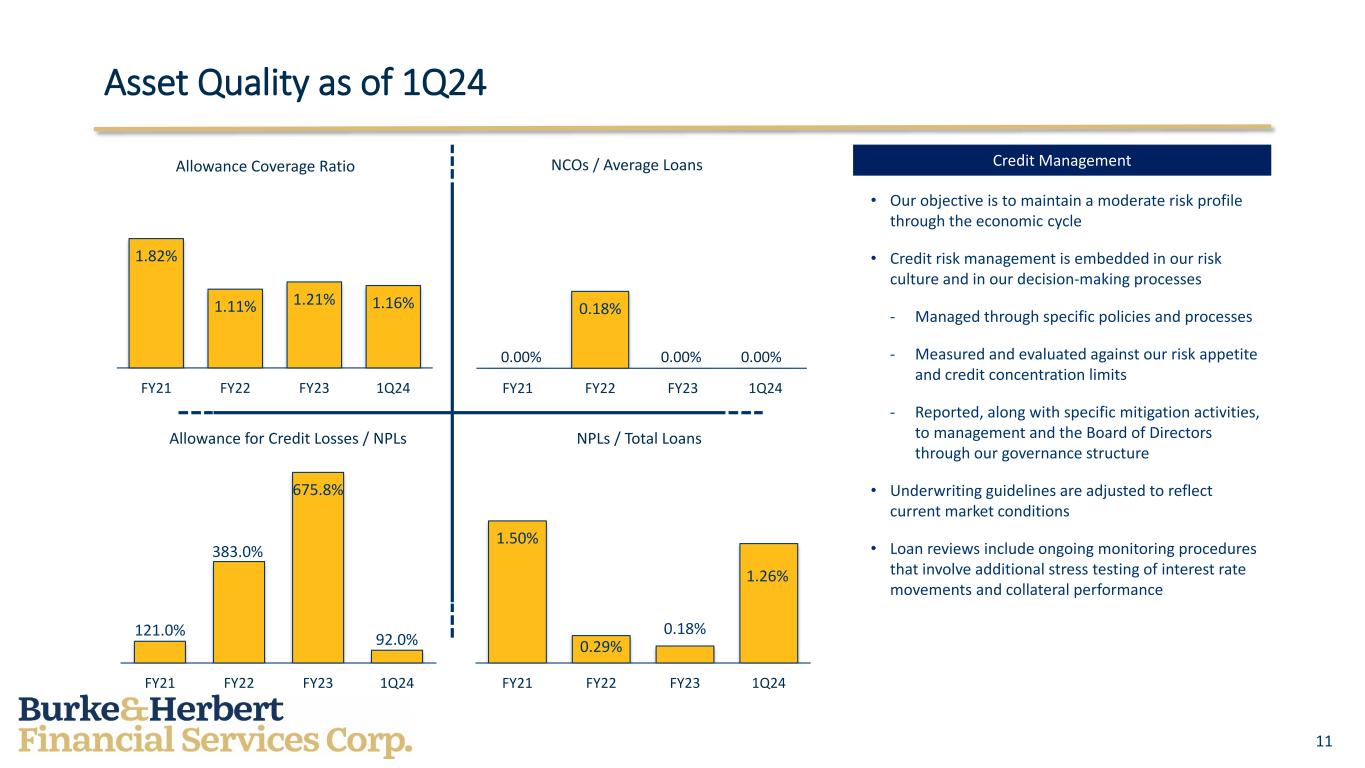
11 Asset Quality as of 1Q24 1.82% 1.11% 1.21% 1.16% FY21 FY22 FY23 1Q24 Allowance Coverage Ratio 0.18% FY21 FY22 FY23 1Q24 NCOs / Average Loans 121.0% 383.0% 675.8% 92.0% FY21 FY22 FY23 1Q24 Allowance for Credit Losses / NPLs 1.50% 0.29% 0.18% 1.26% FY21 FY22 FY23 1Q24 NPLs / Total Loans Credit Management • Our objective is to maintain a moderate risk profile through the economic cycle • Credit risk management is embedded in our risk culture and in our decision-making processes - Managed through specific policies and processes - Measured and evaluated against our risk appetite and credit concentration limits - Reported, along with specific mitigation activities, to management and the Board of Directors through our governance structure • Underwriting guidelines are adjusted to reflect current market conditions • Loan reviews include ongoing monitoring procedures that involve additional stress testing of interest rate movements and collateral performance 0.00% 0.00% 0.00%


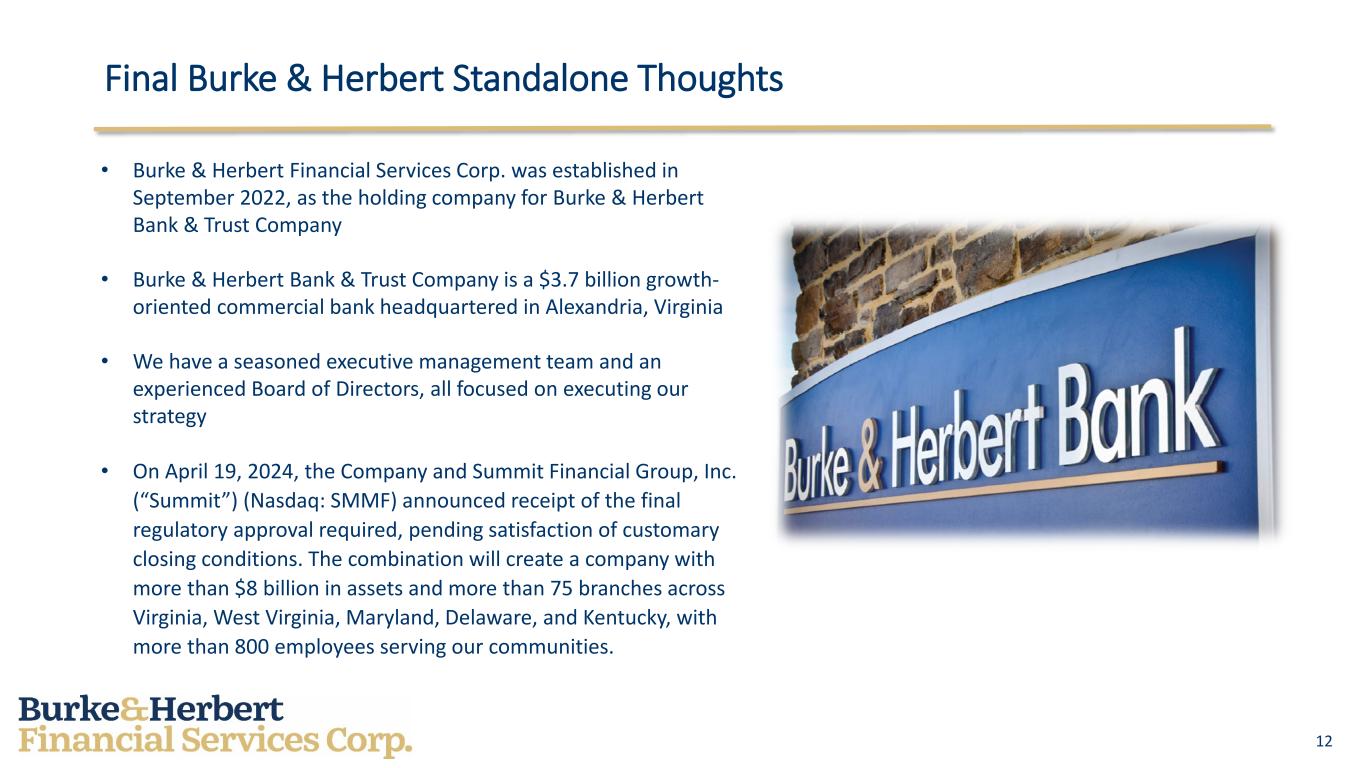
12 Final Burke & Herbert Standalone Thoughts • Burke & Herbert Financial Services Corp. was established in September 2022, as the holding company for Burke & Herbert Bank & Trust Company • Burke & Herbert Bank & Trust Company is a $3.7 billion growth- oriented commercial bank headquartered in Alexandria, Virginia • We have a seasoned executive management team and an experienced Board of Directors, all focused on executing our strategy • On April 19, 2024, the Company and Summit Financial Group, Inc. (“Summit”) (Nasdaq: SMMF) announced receipt of the final regulatory approval required, pending satisfaction of customary closing conditions. The combination will create a company with more than $8 billion in assets and more than 75 branches across Virginia, West Virginia, Maryland, Delaware, and Kentucky, with more than 800 employees serving our communities.


Burke & Herbert Financial Services Corp. (Nasdaq: BHRB) Merger of Equals with Summit Financial Group, Inc. (Nasdaq: SMMF) Previously Announced on August 24th, 2023 13 All data related to pages 13 – 20 are as of the merger announcement date or otherwise indicated


1 2 3 4 5 Strategically Compelling: Strong pro forma profitability, complementary strengths and enhanced strategic positioning, particularly in Virginia, West Virginia, and Maryland Scale: Creates a ~$8 billion bank with >75 branch locations across an attractive 5-state Mid-Atlantic and Southeast footprint Management Strength: Culturally compatible organizations with combined management depth supportive of growth to $10 billion of assets and beyond Investment in Franchise: >$115 million combined earnings stream and strong capital position provide runway for future investment and growth Balance Sheet Flexibility: >$600 million of marked securities able to be converted to immediate liquidity with no negative capital implications Strategic Rationale 14


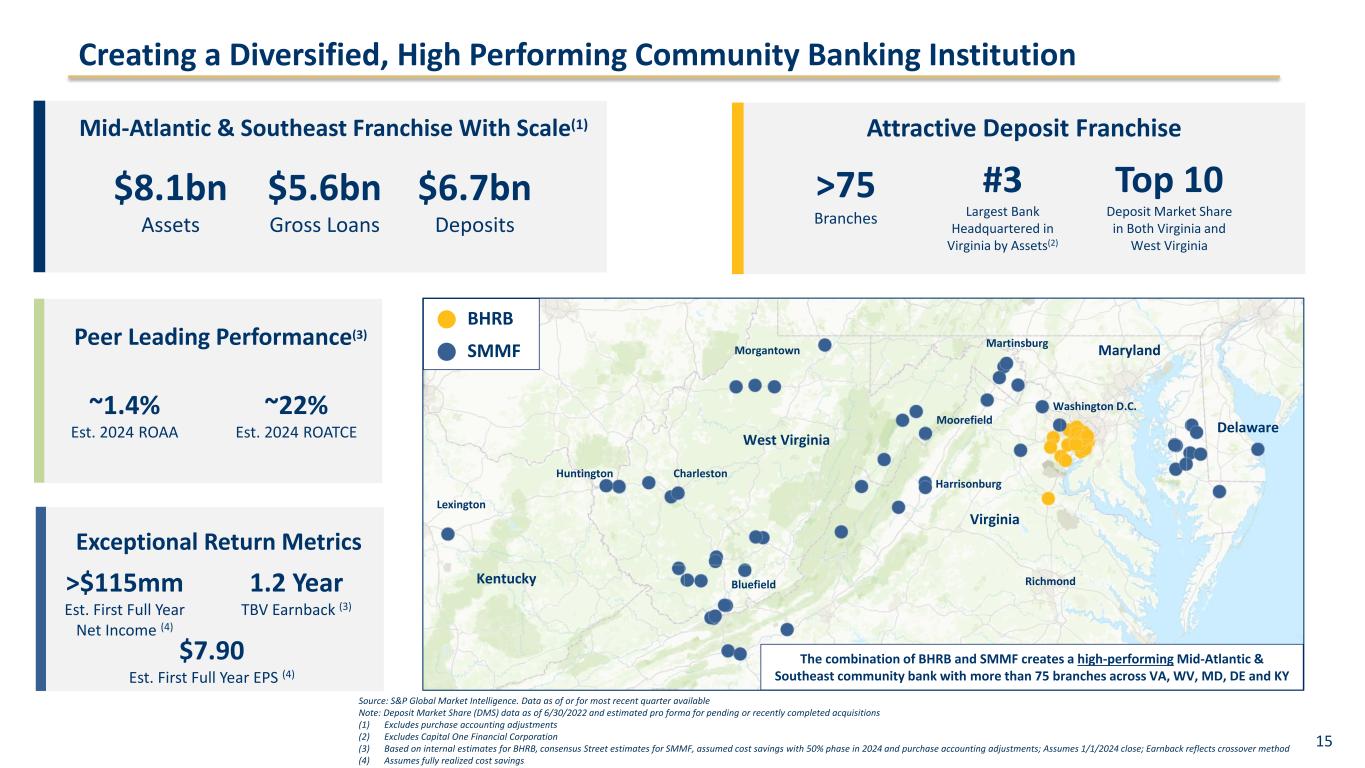
Creating a Diversified, High Performing Community Banking Institution BHRB SMMF The combination of BHRB and SMMF creates a high-performing Mid-Atlantic & Southeast community bank with more than 75 branches across VA, WV, MD, DE and KY $8.1bn Assets $5.6bn Gross Loans $6.7bn Deposits Mid-Atlantic & Southeast Franchise With Scale(1) Exceptional Return Metrics >$115mm Est. First Full Year Net Income (4) 1.2 Year TBV Earnback (3) Attractive Deposit Franchise >75 Branches #3 Largest Bank Headquartered in Virginia by Assets(2) Top 10 Deposit Market Share in Both Virginia and West Virginia Peer Leading Performance(3) ~1.4% Est. 2024 ROAA ~22% Est. 2024 ROATCE Source: S&P Global Market Intelligence. Data as of or for most recent quarter available Note: Deposit Market Share (DMS) data as of 6/30/2022 and estimated pro forma for pending or recently completed acquisitions (1) Excludes purchase accounting adjustments (2) Excludes Capital One Financial Corporation (3) Based on internal estimates for BHRB, consensus Street estimates for SMMF, assumed cost savings with 50% phase in 2024 and purchase accounting adjustments; Assumes 1/1/2024 close; Earnback reflects crossover method (4) Assumes fully realized cost savings West Virginia Washington D.C. Delaware Morgantown Bluefield Virginia Lexington Charleston Martinsburg Maryland Kentucky $7.90 Est. First Full Year EPS (4) Richmond Moorefield Huntington Harrisonburg 15


 Served as the President and CEO of BHRB since 2020, prior to which he was the President and COO after joining in 2019  Named Chair of the Board in 2023  Served as EVP and CFO at Orrstown Bank prior to joining BHRB David Boyle Chief Executive Officer  Served as Chief Credit Officer, EVP and Chair of the Loan Committee at BHRB  Previously served as its SVP in the years since joining the Bank in 2014  Has over 40 years of experience working in credit and lending Jeff Welch Chief Credit Officer Combined Leadership: Executive Management Bios  Served as the President and Chief Executive Officer of SMMF since 1994  Served as a member of the Board of Directors since 1993 and as CEO of Summit Community Bank, Inc. since 2013 Charlie Maddy President  Served as EVP and CFO at SMMF  Since joining in 1998, had previously served as the Senior VP and CAO  Has 30+ years of experience; before joining SMMF he worked in public accounting at Arnett Carbis Toothman Rob Tissue EVP of Financial Strategy  Served as EVP of SMMF and President of the subsidiary, Summit Community Bank, Inc. since 2012  Joined SMMF in 2008, prior to which he served as Regional President at United Bank Brad Ritchie Chief Lending Officer  Served as EVP and CRO of SMMF since 2022, and served as EVP and CRO of Summit Community Bank, Inc. since 2023  Joined SMMF in 2016, serving as the Chief Audit Officer Joe Hager Chief Operating Officer  Served as the EVP and CFO of BHRB since joining in 2021  Previously served as the CFO of PNC Capital Finance  Has 30+ years of experience in various other finance related roles Roy Halyama Chief Financial Officer  Served as the Chief Compliance Officer for BHRB since joining in 2014  Previously served as the Principal VP of Compliance until being promoted to SVP in 2021 and then EVP in 2023  Has over 30 years of experience Jennifer Schmidt Chief Risk Officer  Served as Director of Trust & Wealth Management and EVP at BHRB  Previously worked as SVP after joining BHRB in 2011  Served as an area director of financial advisors prior to start at BHRB Shannon Rowan Director of Trust & Wealth Mgmt.  Served as EVP & Chief Human Resources Officer since 2019  Began career at SMMF in 1991 and has overseen HR functions since 1997  Teaches classes at the WV School of Banking, one being Principles of Banking Danyl Freeman EVP & Chief HR Officer 16


(1) Assumes removal of all purchase accounting rate marks (Loans, Securities, AOCI, Leases, Deposits, Subordinated Debt and Preferred Equity) (2) Shown for illustrative purposes; Contemplates potential new FASB accounting implementation (3) Tangible book value earnback calculated using the crossover method Pro Forma Financial Impact Earnings Impact TBV Impact Pro Forma Capital GAAP Financial Results Financial Results Excluding AOCI and Rate Marks (1) 71% 2024E EPS Accretion 92% 2025E EPS Accretion GAAP Financial Results Excluding CECL Day-2 Double Count (2) 12.7% Dilution at Close 1.2 Year Earnback(3) 6.4% TCE / TA 8.1% Leverage Ratio 10.4% CET1 Ratio 12.5% TRBC Ratio 30% 2024E EPS Accretion 49% 2025E EPS Accretion 4.1% Accretion at Close 7.5% TCE / TA 9.3% Leverage Ratio 11.9% CET1 Ratio 14.4% TRBC Ratio 63% 2024E EPS Accretion 86% 2025E EPS Accretion 10.5% Dilution at Close 1.1 Year Earnback(3) 6.6% TCE / TA 8.3% Leverage Ratio 10.7% CET1 Ratio 12.5% TRBC Ratio 17


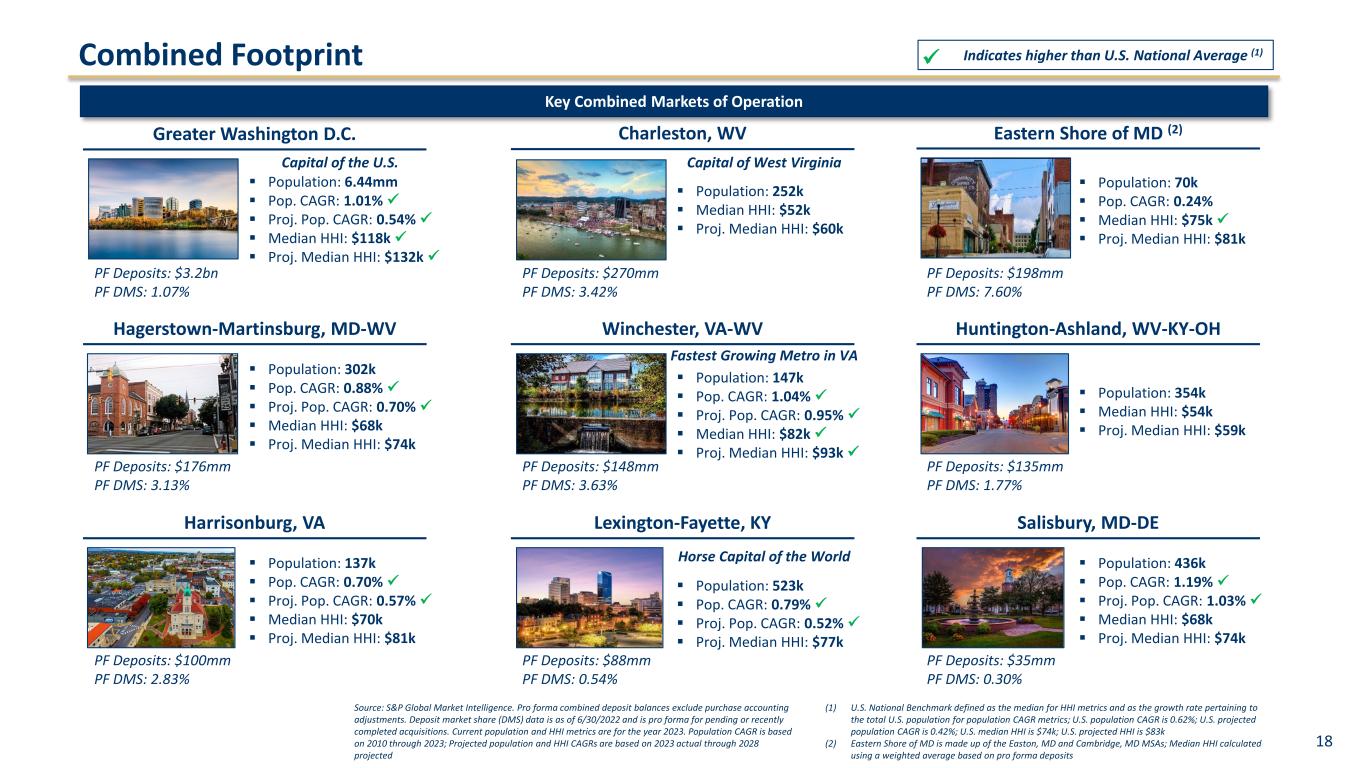
 Population: 137k  Pop. CAGR: 0.70%   Proj. Pop. CAGR: 0.57%   Median HHI: $70k  Proj. Median HHI: $81k PF Deposits: $100mm PF DMS: 2.83% Harrisonburg, VA Combined Footprint Key Combined Markets of Operation Eastern Shore of MD (2)  Population: 70k  Pop. CAGR: 0.24%  Median HHI: $75k   Proj. Median HHI: $81k PF Deposits: $198mm PF DMS: 7.60% Charleston, WV  Population: 252k  Median HHI: $52k  Proj. Median HHI: $60k PF Deposits: $270mm PF DMS: 3.42% Source: S&P Global Market Intelligence. Pro forma combined deposit balances exclude purchase accounting adjustments. Deposit market share (DMS) data is as of 6/30/2022 and is pro forma for pending or recently completed acquisitions. Current population and HHI metrics are for the year 2023. Population CAGR is based on 2010 through 2023; Projected population and HHI CAGRs are based on 2023 actual through 2028 projected (1) U.S. National Benchmark defined as the median for HHI metrics and as the growth rate pertaining to the total U.S. population for population CAGR metrics; U.S. population CAGR is 0.62%; U.S. projected population CAGR is 0.42%; U.S. median HHI is $74k; U.S. projected HHI is $83k (2) Eastern Shore of MD is made up of the Easton, MD and Cambridge, MD MSAs; Median HHI calculated using a weighted average based on pro forma deposits Hagerstown-Martinsburg, MD-WV  Population: 302k  Pop. CAGR: 0.88%   Proj. Pop. CAGR: 0.70%   Median HHI: $68k  Proj. Median HHI: $74k PF Deposits: $176mm PF DMS: 3.13% PF Deposits: $3.2bn PF DMS: 1.07%  Population: 6.44mm  Pop. CAGR: 1.01%   Proj. Pop. CAGR: 0.54%   Median HHI: $118k   Proj. Median HHI: $132k  Greater Washington D.C. Indicates higher than U.S. National Average (1) Lexington-Fayette, KY  Population: 523k  Pop. CAGR: 0.79%   Proj. Pop. CAGR: 0.52%   Proj. Median HHI: $77k PF Deposits: $88mm PF DMS: 0.54%  Population: 147k  Pop. CAGR: 1.04%   Proj. Pop. CAGR: 0.95%   Median HHI: $82k   Proj. Median HHI: $93k  Winchester, VA-WV PF Deposits: $148mm PF DMS: 3.63% Huntington-Ashland, WV-KY-OH  Population: 354k  Median HHI: $54k  Proj. Median HHI: $59k PF Deposits: $135mm PF DMS: 1.77% Salisbury, MD-DE  Population: 436k  Pop. CAGR: 1.19%   Proj. Pop. CAGR: 1.03%   Median HHI: $68k  Proj. Median HHI: $74k PF Deposits: $35mm PF DMS: 0.30% Fastest Growing Metro in VA Horse Capital of the World Capital of the U.S. Capital of West Virginia 18


Construction 4.6% Residential R.E. 23.6% Owner Occupied CRE 6.2% Non-Owner Occupied CRE 59.9% Commercial & Industrial 3.0% Consumer & Other 2.7% Source: S&P Global Market Intelligence. Loan data per consolidated regulatory filings as of 6/30/2023. Pro forma BHRB / SMMF loan balances exclude purchase accounting adjustments. Loan balances may not add to 100% due to rounding Note: Yield on Loans, Loan / Deposit ratio, Cycle Beta and Floating Rate data per GAAP filings as of 6/30/2023 (1) Represents the difference between Q4 ’2021 and Q2 ’2023 in the indicated yield or cost metric divided by 5.16%, or the change in the federal funds rate between 12/15/2021 and 6/30/2023 (2) Commercial real estate loans as defined in the regulatory agencies guidance on commercial real estate (CRE) as a percent of total risk-based capital Construction 9.4% Residential R.E. 19.3% Owner Occupied CRE 11.5% Non-Owner Occupied CRE 44.0% Commercial & Industrial 9.4% Consumer & Other 6.4% Construction 12.0% Residential R.E. 16.9% Owner Occupied CRE 14.4% Non-Owner Occupied CRE 35.1% Commercial & Industrial 13.0% Consumer & Other 8.5% Diversified Pro Forma Loan Composition Yield on Loans: 5.13% Loans / Deposits: 66.7% Cycle Beta: 22.2%(1) Floating Rate: 26.4% Reg. CRE Concentration: 292%(2) Yield on Loans: 6.20% Loans / Deposits: 95.1% Cycle Beta: 37.1%(1) Floating Rate: 30.3% Reg. CRE Concentration: 308%(2) Yield on Loans: 5.82% Loans / Deposits: 82.4% Weighted Cycle Beta: 31.7%(1) Weighted Floating Rate: 28.9% $2.0bn $3.6bn $5.6bn BHRB SMMF Pro Forma 19


Demand Deposits 18.2% NOW & Other Trans. Accts 21.7% MMDA & Other Savings 46.2% Retail Time Deposits 8.3% Jumbo Time Deposits 5.6% Demand Deposits 23.1% NOW & Other Trans. Accts 20.0% MMDA & Other Savings 39.8% Retail Time Deposits 12.1% Jumbo Time Deposits 5.0% Demand Deposits 29.2% NOW & Other Trans. Accts 17.8% MMDA & Other Savings 32.0% Retail Time Deposits 16.9% Jumbo Time Deposits 4.2% Source: S&P Global Market Intelligence; Deposit data per consolidated regulatory filings as of 6/30/2023. Pro forma BHRB / SMMF deposit balances exclude purchase accounting adjustments. Deposit balances may not add to 100% due to rounding Note: Cost of Deposits, Cycle Beta and Brokered Deposit data per GAAP filings; Uninsured Deposit data per regulatory filings as of 6/30/2023. Retail Time Deposits < $100k and Jumbo Time Deposits >$100k (1) Represents the difference between Q4 ’2021 and Q2 ’2023 in the indicated yield or cost metric divided by 5.16%, or the change in the federal funds rate between 12/15/2021 and 6/30/2023 (2) Estimated uninsured deposit data as of 6/30/2023 Pro Forma Deposit Composition Cost of Deposits: 1.33% Cycle Beta: 25.8%(1) % Uninsured: 22.7%(2) Brokered Deposits: 12.9% Cost of Deposits: 1.92% Cycle Beta: 34.3%(1) % Uninsured: 31.8%(2) Brokered Deposits: 1.5% Cost of Deposits: 1.66% Weighted Cycle Beta: 30.5%(1) % Uninsured: 27.7%(2) Brokered Deposits: 6.6% BHRB SMMF Pro Forma $3.0bn $3.7bn $6.7bn 20


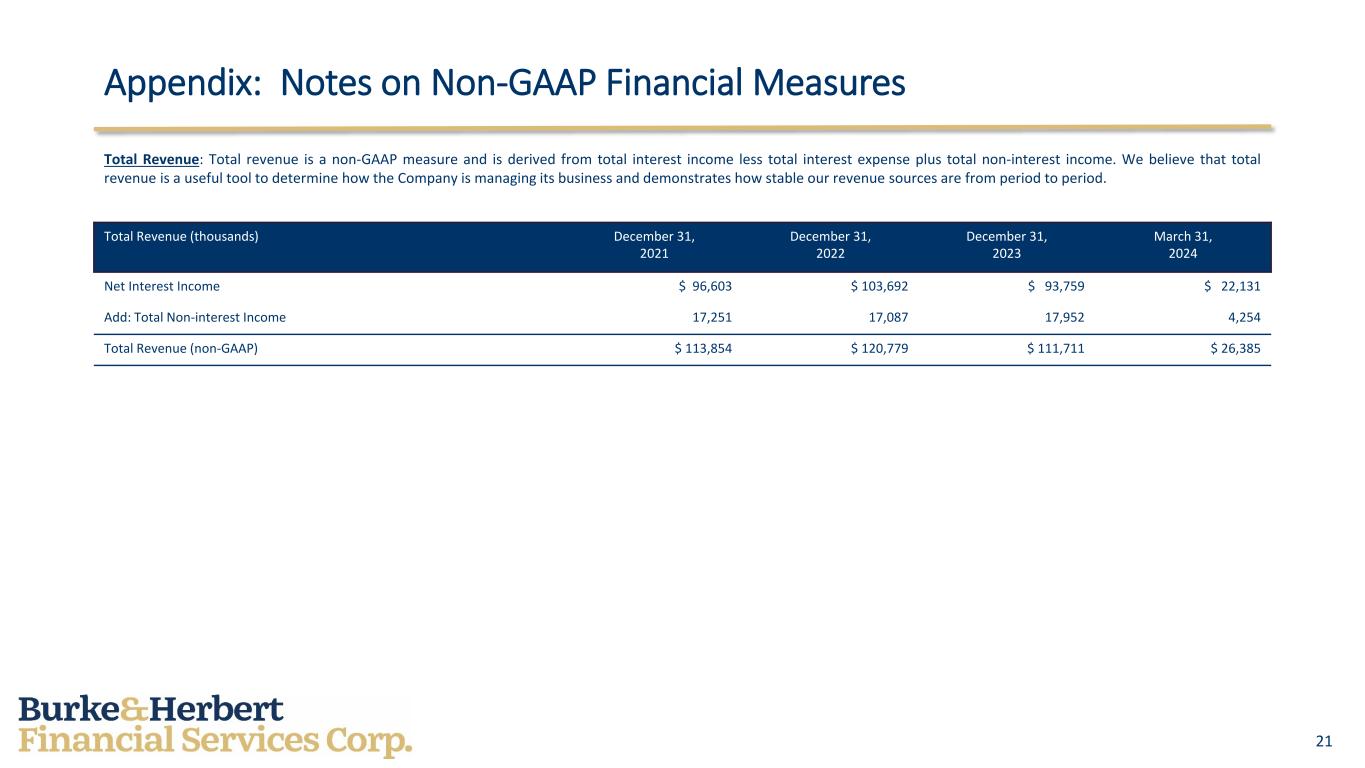
21 Appendix: Notes on Non-GAAP Financial Measures Total Revenue: Total revenue is a non-GAAP measure and is derived from total interest income less total interest expense plus total non-interest income. We believe that total revenue is a useful tool to determine how the Company is managing its business and demonstrates how stable our revenue sources are from period to period. Total Revenue (thousands) December 31, 2021 December 31, 2022 December 31, 2023 March 31, 2024 Net Interest Income $ 96,603 $ 103,692 $ 93,759 $ 22,131 Add: Total Non-interest Income 17,251 17,087 17,952 4,254 Total Revenue (non-GAAP) $ 113,854 $ 120,779 $ 111,711 $ 26,385


22 Appendix: Notes on Non-GAAP Financial Measures Net Interest Margin: The interest income earned on certain earning assets is completely or partially exempt from federal income tax. As such, these tax-exempt instruments typically yield lower returns than taxable investments. To provide more meaningful comparisons of net interest income, we use net interest income on a fully taxable-equivalent (FTE) basis by increasing the interest income earned on tax-exempt assets to make it fully equivalent to interest income earned on taxable investments. FTE net interest income is calculated by adding the tax benefit on certain financial interest earning assets, whose interest is tax-exempt, to total interest income then subtracting total interest expense. Management believes FTE net interest income is a standard practice in the banking industry, and when net interest income is adjusted on an FTE basis, yields on taxable, nontaxable, and partially taxable assets are comparable; however, the adjustment to an FTE basis has no impact on net income and this adjustment is not permitted under GAAP. FTE net interest income is only used for calculating FTE net interest margin, which is calculated by annualizing FTE net interest income and then dividing by the average earning assets. The tax-rate used for this adjustment is 21%. Net interest income shown elsewhere in this presentation is GAAP net interest income. Tax-Equivalent Net Interest Income (thousands) December 31, 2021 December 31, 2022 December 31, 2023 March 31, 2024 Interest Income – Loans $ 73,170 $ 73,640 $ 101,800 $ 28,045 Interest Income – Securities (taxable) 17,537 29,616 37,179 8,943 Interest Income – Securities (tax-exempt) 9,907 8,940 5,615 1,361 Interest Income – Other 206 437 2,302 396 Interest Expense – Deposits (2,746) (3,742) (39,195) (12,931) Interest Expense – Borrowed Funds (1,432) (5,136) (13,856) (3,655) Interest Expense – Other (39) (63) (86) (28) Total Net Interest Income $ 96,603 $ 103,692 $ 93,759 $ 22,131 Add: Tax benefit on Interest Income – Securities (tax-exempt) 2,634 2,375 1,493 362 Total Tax-Equivalent Net Interest Income (non-GAAP) $ 99,237 $ 106,067 $ 95,252 $ 22,493 Average earning assets $ 3,341,443 $ 3,327,272 $ 3,345,347 $ 3,377,092 Net interest Margin (percentage) (non-GAAP) 2.97 3.19 2.85 2.68


23 Appendix: Notes on Non-GAAP Financial Measures Tangible Book Value per share (TBVPS) & TBVPS (excluding Securities AOCI): TBVPS represents the Company’s tangible common equity at period-end divided by common shares at period-end. Currently, there are no adjustments from common equity to determine tangible common equity for the periods presented. TBVPS (excluding Securities AOCI) is tangible common equity defined above less tax-effected accumulated securities other comprehensive income. Tangible book value per common share (thousands, except share data) December 31, 2021 December 31, 2022 December 31, 2023 March 31, 2024 Total shareholders’ equity $ 389,627 $ 273,453 $ 314,750 $ 319,308 Less: Adjustments ̶ ̶ ̶ ̶ Tangible common equity (non-GAAP) $ 389,627 $ 273,453 $ 314,750 $ 319,308 Less: Securities AOCI 12,975 (130,875) (98,068) (98,509) TCE less Securities AOCI (non-GAAP) $ 376,652 $ 404,328 $ 412,818 $ 417,817 Ending common shares outstanding 7,423,760 7,425,760 7,428,710 7,440,025 Tangible book value per share (TBVPS) $ 52.48 $ 36.82 $ 42.37 $ 42.92 TBVPS less Securities AOCI $ 50.74 $ 54.45 $ 55.57 $ 56.16