
| Maryland | 001-41812 | 92-0887849 | |||||||||
| (State or other jurisdiction of incorporation) | (Commission File Number) | (IRS Employer Identification No.) | |||||||||
| One Manhattan West, 395 9th Avenue, 58th Floor | |||||||||||
| New York, | New York | 10001 | |||||||||
| (Address of principal executive offices) | (Zip Code) | ||||||||||
| Title of each class | Trading Symbol(s) | Name of each exchange on which registered | ||||||||||||
| Common Shares of Beneficial Interest, par value $0.001 per share | NLOP | New York Stock Exchange | ||||||||||||
| Exhibit No. | Description | |||||||
| 99.1 | ||||||||
| 99.2 | ||||||||
| 104 | Cover Page Interactive Data File (embedded within the Inline XBRL document). | |||||||
| Net Lease Office Properties | |||||||||||
| Date: | November 7, 2025 | By: | /s/ ToniAnn Sanzone | ||||||||
| ToniAnn Sanzone | |||||||||||
| Chief Financial Officer | |||||||||||

| REIT | Real estate investment trust | ||||
| WPC | W. P. Carey Inc., a net-lease REIT (also our “Advisor”) | ||||
| U.S. | United States | ||||
| ABR | Contractual minimum annualized base rent | ||||
| NAREIT | National Association of Real Estate Investment Trusts (an industry trade group) | ||||
| WALT | Weighted-average lease term | ||||
| CPI | Consumer price index | ||||
| Table of Contents | |||||
| Appendix | |||||
| Summary Metrics | |||||
| Financial Results | |||||||||||||||||||||||
| Revenues, including reimbursable costs – consolidated ($000s) | $ | 29,784 | |||||||||||||||||||||
| Net loss attributable to NLOP ($000s) | (64,161) | ||||||||||||||||||||||
| Net loss attributable to NLOP per diluted share | (4.33) | ||||||||||||||||||||||
Normalized pro rata cash NOI ($000s) (a) (b) |
17,169 | ||||||||||||||||||||||
AFFO attributable to NLOP ($000s) (a) (b) |
19,931 | ||||||||||||||||||||||
AFFO attributable to NLOP per diluted share (a) (b) |
1.35 | ||||||||||||||||||||||
Special cash distribution declared per share – August 2025 (c) |
$ | 3.10 | |||||||||||||||||||||
| Balance Sheet and Capitalization | |||||||||||||||||||||||
| Equity market capitalization – based on quarter end share price of $29.66 ($000s) | $ | 439,385 | |||||||||||||||||||||
| Total consolidated debt ($000s) | 47,120 | ||||||||||||||||||||||
Gross assets ($000s) (d) |
647,333 | ||||||||||||||||||||||
| Total consolidated debt to gross assets | 7.3 | % | |||||||||||||||||||||
| Advisory Fees and Reimbursements Paid to WPC | |||||||||||||||||||||||
Asset management fees (e) |
$ | 1,121 | |||||||||||||||||||||
Administrative reimbursements (f) |
1,000 | ||||||||||||||||||||||
Portfolio (Pro Rata) (b) |
|||||||||||||||||||||||
ABR (in thousands) (g) |
$ | 72,612 | |||||||||||||||||||||
| Number of properties | 32 | ||||||||||||||||||||||
| Number of tenants | 36 | ||||||||||||||||||||||
| Occupancy | 82.2 | % | |||||||||||||||||||||
| Weighted-average lease term (in years) | 4.3 | ||||||||||||||||||||||
Leasable square footage (in thousands) (h) |
4,813 | ||||||||||||||||||||||
ABR from investment grade tenants as a % of total ABR (i) |
40.9 | % | |||||||||||||||||||||
| Dispositions – number of properties sold | 4 | ||||||||||||||||||||||
Dispositions – gross proceeds (in thousands) (j) |
$ | 92,924 | |||||||||||||||||||||
Net Lease Office Properties | 1 |
|||||
| Components of Net Asset Value | |||||
Three Months Ended September 30, 2025 |
|||||
Normalized Pro Rata Cash NOI (a) (b) |
$ | 17,169 | |||
| Balance Sheet – Selected Information | As of September 30, 2025 |
||||
| Assets | |||||
Book value of select real estate (c) |
$ | 25,740 | |||
| Cash and cash equivalents | 38,689 | ||||
| Restricted cash, including escrow | 2,442 | ||||
| Other assets, net: | |||||
| Straight-line rent adjustments | $ | 17,990 | |||
| Accounts receivable | 5,599 | ||||
| Prepaid expenses | 2,567 | ||||
| Deferred charges | 1,919 | ||||
| Taxes receivable | 222 | ||||
| Other | 2,708 | ||||
| Total other assets, net | $ | 31,005 | |||
| Liabilities | |||||
| Non-recourse mortgages, net | $ | 47,120 | |||
| Accounts payable, accrued expenses and other liabilities: | |||||
| Accounts payable and accrued expenses | $ | 12,213 | |||
| Prepaid and deferred rents | 6,345 | ||||
| Tenant security deposits | 814 | ||||
| Accrued taxes payable | 631 | ||||
| Operating lease liabilities | 177 | ||||
| Other | 18,288 | ||||
| Total accounts payable, accrued expenses and other liabilities | $ | 38,468 | |||
Net Lease Office Properties | 2 |
|||||
| Consolidated Statement of Operations | |||||
Three Months Ended September 30, 2025 |
|||||
| Revenues | |||||
| Lease revenues | $ | 24,099 | |||
| Other lease-related income | 5,685 | ||||
| 29,784 | |||||
| Operating Expenses | |||||
| Impairment charges — real estate | 50,892 | ||||
| Depreciation and amortization | 8,978 | ||||
| Reimbursable tenant costs | 4,931 | ||||
| Property expenses, excluding reimbursable tenant costs | 1,933 | ||||
General and administrative (a) |
1,658 | ||||
Asset management fees (b) |
1,121 | ||||
| 69,513 | |||||
| Other Income and Expenses | |||||
Loss on sale of real estate, net (c) |
(23,693) | ||||
| Interest expense | (1,657) | ||||
| Other gains and (losses) | 969 | ||||
| (24,381) | |||||
| Loss before income taxes | (64,110) | ||||
| Provision for income taxes | (30) | ||||
| Net Loss | (64,140) | ||||
| Net income attributable to noncontrolling interests | (21) | ||||
| Net Loss Attributable to NLOP | $ | (64,161) | |||
| Basic and Diluted Loss Per Share | $ | (4.33) | |||
| Weighted-Average Shares Outstanding | |||||
| Basic and Diluted | 14,814,075 | ||||
Net Lease Office Properties | 3 |
|||||
| FFO and AFFO, Consolidated | |||||
Three Months Ended September 30, 2025 |
|||||
| Net loss attributable to NLOP | $ | (64,161) | |||
| Adjustments: | |||||
| Impairment charges — real estate | 50,892 | ||||
Loss on sale of real estate, net (a) |
23,693 | ||||
| Depreciation and amortization of real property | 8,977 | ||||
Proportionate share of adjustments for noncontrolling interests (b) |
(51) | ||||
| Total adjustments | 83,511 | ||||
FFO (as defined by NAREIT) Attributable to NLOP (c) |
19,350 | ||||
| Adjustments: | |||||
| Straight-line and other leasing and financing adjustments | 632 | ||||
| Other (gains) and losses | (361) | ||||
Above- and below-market rent intangible lease amortization, net |
202 | ||||
| Other amortization and non-cash items | 111 | ||||
| Amortization of deferred financing costs | 10 | ||||
Proportionate share of adjustments for noncontrolling interests (b) |
(13) | ||||
| Total adjustments | 581 | ||||
AFFO Attributable to NLOP (c) |
$ | 19,931 | |||
| Summary | |||||
FFO (as defined by NAREIT) attributable to NLOP (c) |
$ | 19,350 | |||
FFO (as defined by NAREIT) attributable to NLOP per diluted share (c) |
$ | 1.31 | |||
AFFO attributable to NLOP (c) |
$ | 19,931 | |||
AFFO attributable to NLOP per diluted share (c) |
$ | 1.35 | |||
| Diluted weighted-average shares outstanding | 14,814,075 | ||||
Net Lease Office Properties | 4 |
|||||
| Consolidated Balance Sheets | |||||
| September 30, 2025 | December 31, 2024 | ||||||||||
| Assets | |||||||||||
| Investments in real estate: | |||||||||||
| Land, buildings and improvements | $ | 477,947 | $ | 730,345 | |||||||
| In-place lease intangible assets and other | 185,125 | 209,968 | |||||||||
| Above-market rent intangible assets | 26,188 | 30,512 | |||||||||
| Investments in real estate | 689,260 | 970,825 | |||||||||
| Accumulated depreciation and amortization | (266,244) | (292,679) | |||||||||
| Assets held for sale, net | 27,399 | 29,297 | |||||||||
| Net investments in real estate | 450,415 | 707,443 | |||||||||
| Cash and cash equivalents | 38,689 | 25,121 | |||||||||
| Restricted cash | 2,442 | 43,305 | |||||||||
| Other assets, net | 31,005 | 29,200 | |||||||||
| Total assets | $ | 522,551 | $ | 805,069 | |||||||
| Liabilities and Equity | |||||||||||
| Debt: | |||||||||||
| Non-recourse mortgages, net | $ | 47,120 | $ | 111,259 | |||||||
| NLOP Mezzanine Loan, net | — | 57,957 | |||||||||
| Debt, net | 47,120 | 169,216 | |||||||||
| Accounts payable, accrued expenses and other liabilities | 38,468 | 44,145 | |||||||||
| Below-market rent intangible liabilities, net | 2,743 | 6,305 | |||||||||
| Total liabilities | 88,331 | 219,666 | |||||||||
Preferred stock, $0.001 par value, 5,000,000 shares authorized; none issued |
— | — | |||||||||
Common stock, $0.001 par value, 45,000,000 shares authorized; 14,814,075 shares issued and outstanding |
15 | 15 | |||||||||
| Additional paid-in capital | 855,813 | 855,813 | |||||||||
| Distributions in excess of accumulated earnings | (425,576) | (234,443) | |||||||||
| Accumulated other comprehensive loss | — | (40,157) | |||||||||
| Total shareholders' equity | 430,252 | 581,228 | |||||||||
| Noncontrolling interests | 3,968 | 4,175 | |||||||||
| Total equity | 434,220 | 585,403 | |||||||||
| Total liabilities and equity | $ | 522,551 | $ | 805,069 | |||||||
Net Lease Office Properties | 5 |
|||||
| Capitalization and Debt Overview | |||||
| Total Enterprise Value | Shares | Share Price | Market Value | |||||||||||||||||||||||
| Equity | ||||||||||||||||||||||||||
| Common equity | 14,814,075 | $ | 29.66 | $ | 439,385 | |||||||||||||||||||||
| Total Equity Market Capitalization | 439,385 | |||||||||||||||||||||||||
| Outstanding Balance | ||||||||||||||||||||||||||
| Debt | ||||||||||||||||||||||||||
| Non-recourse mortgages | 47,120 | |||||||||||||||||||||||||
| Total Debt | 47,120 | |||||||||||||||||||||||||
| Less: Cash and cash equivalents | (38,689) | |||||||||||||||||||||||||
| Net Debt | 8,431 | |||||||||||||||||||||||||
| Total Enterprise Value | $ | 447,816 | ||||||||||||||||||||||||
| Maturity Date | Fixed / Floating | Interest Rate | Total Outstanding Balance | % of Total | ||||||||||||||||||||||||||||
| Mortgages (Tenant Listed) | ||||||||||||||||||||||||||||||||
Northrop Grumman Systems Corporation (a) |
1/6/2025 | Fixed | 9.2 | % | $ | 25,220 | 53.5 | % | ||||||||||||||||||||||||
| Intuit Inc. | 7/6/2026 | Fixed | 7.0 | % | 21,900 | 46.5 | % | |||||||||||||||||||||||||
| Total Debt Outstanding | 8.2 | % | $ | 47,120 | 100.0 | % | ||||||||||||||||||||||||||
Net Lease Office Properties | 6 |
|||||
| Dispositions | |||||
| Tenant / Lease Guarantor | Property Location(s) | Gross Sale Price | ABR (a) |
Closing Date | Gross Square Footage | |||||||||||||||||||||||||||
| 4Q23 | ||||||||||||||||||||||||||||||||
| Raytheon Company | Tucson, AZ | $ | 24,575 | $ | 1,978 | Dec-23 | 143,650 | |||||||||||||||||||||||||
| Carhartt, Inc. | Dearborn, MI | 9,806 | 748 | Dec-23 | 58,722 | |||||||||||||||||||||||||||
| BCBSM, Inc. | Eagan, MN | 2,500 | 298 | Dec-23 | 29,916 | |||||||||||||||||||||||||||
| AVL Michigan Holding Corporation | Plymouth, MI | 6,200 | 575 | Dec-23 | 70,000 | |||||||||||||||||||||||||||
| 4Q23 Total | 43,081 | 3,599 | 302,288 | |||||||||||||||||||||||||||||
| 1Q24 | ||||||||||||||||||||||||||||||||
Undisclosed – UK insurance company (b) |
Newport, United Kingdom | 10,497 | 1,761 | Jan-24 | 80,664 | |||||||||||||||||||||||||||
Total E&P Norge AS (b) |
Stavanger, Norway | 33,072 | 5,185 | Mar-24 | 275,725 | |||||||||||||||||||||||||||
| 1Q24 Total | 43,569 | 6,946 | 356,389 | |||||||||||||||||||||||||||||
| 2Q24 | ||||||||||||||||||||||||||||||||
Exelon Generation Company, LLC (c) |
Warrenville, IL | 19,830 | 2,935 | Apr-24 | 146,745 | |||||||||||||||||||||||||||
Vacant (formerly AVT Technology Solutions LLC) (c) |
Tempe, AZ | 13,160 | — | Apr-24 | 132,070 | |||||||||||||||||||||||||||
| FedEx Corporation | Collierville, TN | 62,500 | 5,491 | Apr-24 | 390,380 | |||||||||||||||||||||||||||
| DMG MORI SEIKI U.S.A., INC. | Hoffman Estates, IL | 35,984 | 2,458 | Apr-24 | 104,598 | |||||||||||||||||||||||||||
| BCBSM, Inc. (2 properties) | Eagan, MN | 60,700 | 4,663 | Jun-24 | 347,472 | |||||||||||||||||||||||||||
| 2Q24 Total | 192,174 | 15,547 | 1,121,265 | |||||||||||||||||||||||||||||
| 3Q24 | ||||||||||||||||||||||||||||||||
| CVS Health Corporation | Scottsdale, AZ | 71,500 | 4,252 | Aug-24 | 354,888 | |||||||||||||||||||||||||||
| Xileh Holding Inc. | Auburn Hills, MI | 9,000 | 711 | Sep-24 | 55,490 | |||||||||||||||||||||||||||
| 3Q24 Total | 80,500 | 4,963 | 410,378 | |||||||||||||||||||||||||||||
| 4Q24 | ||||||||||||||||||||||||||||||||
E.On UK PLC (b) |
Houghton le Spring, United Kingdom |
3,924 | 3,819 | Oct-24 | 217,339 | |||||||||||||||||||||||||||
| Vacant (formerly BCBSM, Inc.) | Eagan, MN | 11,650 | — | Nov-24 | 227,666 | |||||||||||||||||||||||||||
| Merative L.P. | Hartland, WI | 6,750 | 669 | Dec-24 | 81,082 | |||||||||||||||||||||||||||
| Charter Communications Operating, LLC | Bridgeton, MO | 7,350 | 820 | Dec-24 | 78,080 | |||||||||||||||||||||||||||
| Caremark RX, L.L.C. | Chandler, AZ | 15,000 | 1,645 | Dec-24 | 183,000 | |||||||||||||||||||||||||||
| Cofinity, Inc./ Aetna Life Insurance Co. | Southfield, MI | 2,500 | 1,833 | Dec-24 | 94,453 | |||||||||||||||||||||||||||
| 4Q24 Total | 47,174 | 8,786 | 881,620 | |||||||||||||||||||||||||||||
| Total 2023-2024 Dispositions | $ | 406,498 | $ | 39,841 | 3,071,940 | |||||||||||||||||||||||||||
Net Lease Office Properties | 7 |
|||||
| Dispositions (continued) | |||||
| Tenant / Lease Guarantor | Property Location(s) | Gross Sale Price | ABR (a) |
Closing Date | Gross Square Footage | |||||||||||||||||||||||||||
| 1Q25 | ||||||||||||||||||||||||||||||||
| Emerson Electric Co. | Houston, TX | 4,180 | 1,108 | Mar-25 | 52,144 | |||||||||||||||||||||||||||
Nokia Corporation (b) |
Krakow, Poland | 5,595 | 779 | Mar-25 | 53,400 | |||||||||||||||||||||||||||
| 1Q25 Total | 9,775 | 1,887 | 105,544 | |||||||||||||||||||||||||||||
| 2Q25 | ||||||||||||||||||||||||||||||||
| Vacant (formerly McKesson Corporation) | The Woodlands, TX | 16,300 | — | May-25 | 204,063 | |||||||||||||||||||||||||||
| 2Q25 Total | 16,300 | — | 204,063 | |||||||||||||||||||||||||||||
| 3Q25 | ||||||||||||||||||||||||||||||||
| JPMorgan Chase Bank, N.A. | Tampa, FL | 25,180 | 3,053 | Jul-25 | 176,150 | |||||||||||||||||||||||||||
| Acosta, Inc. | Jacksonville, FL | 10,550 | 1,541 | Aug-25 | 88,062 | |||||||||||||||||||||||||||
Siemens AS (b) (c) |
Oslo, Norway | 45,694 | 4,842 | Sep-25 | 165,905 | |||||||||||||||||||||||||||
| Midcontinent Independent Stm Op Inc. | Eagan, MN | 11,500 | 1,148 | Sep-25 | 60,463 | |||||||||||||||||||||||||||
| 3Q25 Total | 92,924 | 10,584 | 490,580 | |||||||||||||||||||||||||||||
| Total 2025 Dispositions | 118,999 | 12,471 | 800,187 | |||||||||||||||||||||||||||||
| Total Dispositions | $ | 525,497 | $ | 52,312 | 3,872,127 | |||||||||||||||||||||||||||
Net Lease Office Properties | 8 |
|||||
| Capital Expenditures and Leasing Activity | |||||
| Tenant Improvements and Leasing Costs | |||||
| Tenant Improvements | $ | — | |||
| Leasing Costs (Tenant Listed) | |||||
| Midcontinent Independent Stm Op Inc. | 605 | ||||
| ICU MEDICAL, INC. | 24 | ||||
| 629 | |||||
| Tenant Improvements and Leasing Costs | 629 | ||||
| Maintenance Capital Expenditures (Tenant Listed) | |||||
| KBR, Inc. | 57 | ||||
| Thermo Fisher Scientific Inc. | 25 | ||||
| JPMorgan Chase Bank, N.A. | 19 | ||||
| 101 | |||||
| Total: Tenant Improvements and Leasing Costs, and Maintenance Capital Expenditures | $ | 730 | |||
Lease Renewals and Extensions (a) |
Expected Tenant Improvements ($000s) | Leasing Commissions ($000s) | ||||||||||||||||||||||||||||||||||||||||||||||||
| ABR | ||||||||||||||||||||||||||||||||||||||||||||||||||
| Tenant | Location | Square Feet | Prior Lease ($000s) | New Lease ($000s) (b) |
Rent Recapture | Incremental Lease Term | ||||||||||||||||||||||||||||||||||||||||||||
| North American Lighting, Inc. | Farmington Hills, MI | 75,286 | $ | 1,084 | $ | 979 | 90.3 | % | $ | 3,171 | $ | 541 | 15.0 years | |||||||||||||||||||||||||||||||||||||
Total / Weighted Average (c) |
75,286 | $ | 1,084 | $ | 979 | 90.3 | % | $ | 3,171 | $ | 541 | 15.0 years | ||||||||||||||||||||||||||||||||||||||
Net Lease Office Properties | 9 |
|||||
| Top Ten Tenants | |||||
| Tenant / Lease Guarantor | State / Country | ABR | ABR % | Square Footage | Number of Properties | Weighted-Average Lease Term (Years) | ||||||||||||||||||||||||||||||||
KBR, Inc. (a) |
Texas | $ | 20,158 | 27.8 | % | 913,713 | 1 | 4.7 | ||||||||||||||||||||||||||||||
| JPMorgan Chase Bank, N.A. | Florida, Texas | 6,713 | 9.2 | % | 490,719 | 2 | 3.9 | |||||||||||||||||||||||||||||||
| Thermo Fisher Scientific Inc. | North Carolina | 4,063 | 5.6 | % | 219,812 | 1 | 8.2 | |||||||||||||||||||||||||||||||
| Omnicom Group, Inc. | California | 3,961 | 5.4 | % | 120,000 | 1 | 3.0 | |||||||||||||||||||||||||||||||
| R.R. Donnelley & Sons Company | Illinois | 3,461 | 4.8 | % | 167,215 | 1 | 2.0 | |||||||||||||||||||||||||||||||
| Board of Regents, State of Iowa | Iowa | 3,254 | 4.5 | % | 191,700 | 1 | 5.1 | |||||||||||||||||||||||||||||||
| Google, LLC | California | 3,018 | 4.2 | % | 67,681 | 1 | 5.1 | |||||||||||||||||||||||||||||||
| Northrop Grumman Systems Corporation | Minnesota | 2,679 | 3.7 | % | 191,336 | 1 | 4.2 | |||||||||||||||||||||||||||||||
| Intuit Inc. | Texas | 2,577 | 3.5 | % | 166,033 | 1 | 0.7 | |||||||||||||||||||||||||||||||
| Radiate Holdings, L.P. | Texas | 2,407 | 3.3 | % | 134,009 | 5 | 2.9 | |||||||||||||||||||||||||||||||
Total (b) |
$ | 52,291 | 72.0 | % | 2,662,218 | 15 | 4.3 | |||||||||||||||||||||||||||||||
Net Lease Office Properties | 10 |
|||||
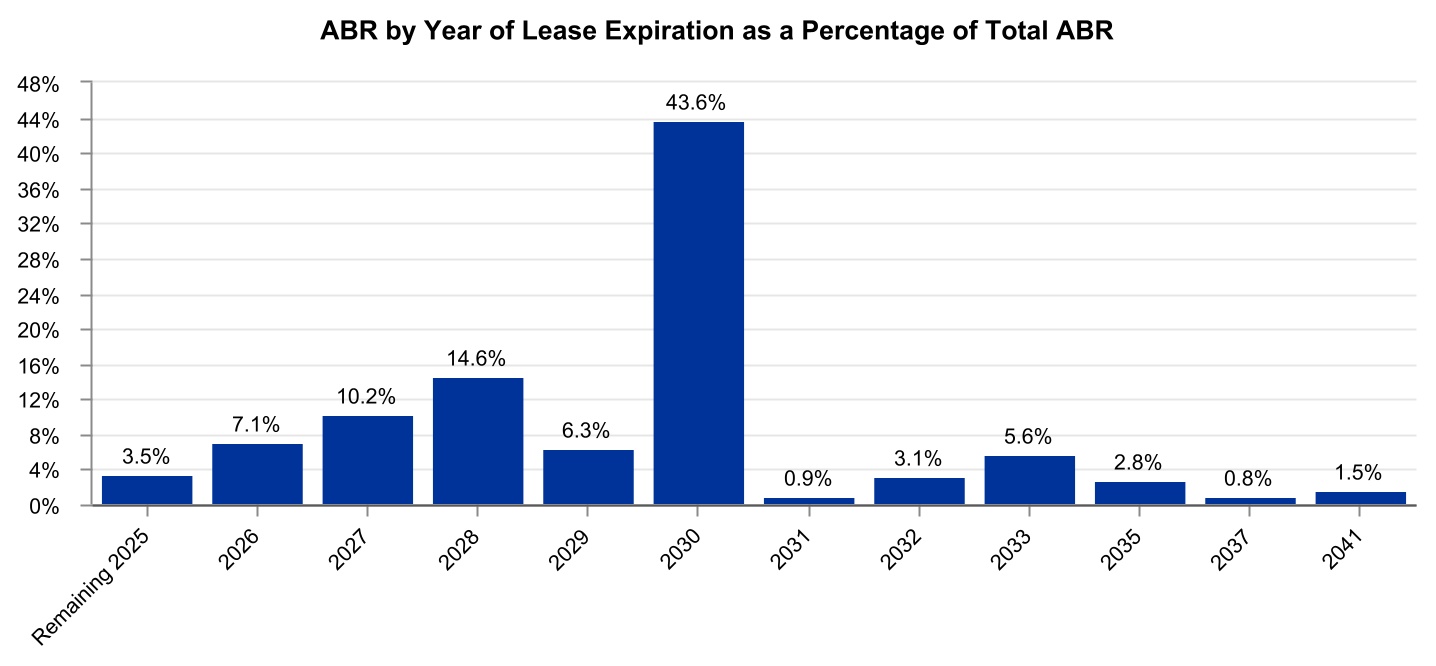
| Lease Expirations | |||||
Year of Lease Expiration (a) |
Number of Leases Expiring | Number of Tenants with Leases Expiring | ABR | ABR % | Square Footage (b) |
Square Footage % | ||||||||||||||||||||||||||||||||
| Remaining 2025 | 5 | 5 | $ | 2,547 | 3.5 | % | 191,345 | 4.0 | % | |||||||||||||||||||||||||||||
| 2026 | 7 | 7 | 5,156 | 7.1 | % | 341,531 | 7.1 | % | ||||||||||||||||||||||||||||||
| 2027 | 6 | 5 | 7,406 | 10.2 | % | 411,509 | 8.5 | % | ||||||||||||||||||||||||||||||
| 2028 | 7 | 6 | 10,609 | 14.6 | % | 476,036 | 9.9 | % | ||||||||||||||||||||||||||||||
| 2029 | 4 | 3 | 4,597 | 6.3 | % | 304,613 | 6.3 | % | ||||||||||||||||||||||||||||||
| 2030 | 6 | 6 | 31,669 | 43.6 | % | 1,596,473 | 33.2 | % | ||||||||||||||||||||||||||||||
| 2031 | 1 | 1 | 631 | 0.9 | % | 50,600 | 1.1 | % | ||||||||||||||||||||||||||||||
| 2032 | 1 | 1 | 2,255 | 3.1 | % | 136,125 | 2.8 | % | ||||||||||||||||||||||||||||||
| 2033 | 1 | 1 | 4,063 | 5.6 | % | 219,812 | 4.6 | % | ||||||||||||||||||||||||||||||
| 2035 | 1 | 1 | 2,050 | 2.8 | % | 120,147 | 2.5 | % | ||||||||||||||||||||||||||||||
| 2037 | 1 | 1 | 545 | 0.8 | % | 31,120 | 0.6 | % | ||||||||||||||||||||||||||||||
| 2041 | 1 | 1 | 1,084 | 1.5 | % | 75,286 | 1.6 | % | ||||||||||||||||||||||||||||||
| Vacant | — | — | — | — | % | 858,376 | 17.8 | % | ||||||||||||||||||||||||||||||
Total (c) |
41 | $ | 72,612 | 100.0 | % | 4,812,973 | 100.0 | % | ||||||||||||||||||||||||||||||
Net Lease Office Properties | 11 |
|||||
| Property List | |||||
| Encumbered Status | |||||||||||||||||||||||||||||||||||
| # | Primary Tenant | Industry | Credit (a) |
City | State | Square Footage (b) |
ABR | Rent Increase Type | Date of Next Increase | WALT (c) |
In-Place Mortgage Debt | ||||||||||||||||||||||||
| 1 | KBR, Inc. (d) (e) |
Construction & Engineering | Non-IG | Houston | Texas | 1,064,788 | $21,288 | Fixed: One-time 7.78% | Jan-27 | 4.6 | $— | ||||||||||||||||||||||||
| 2 | JPMorgan Chase Bank, N.A. | Diversified Banks | IG | Fort Worth | Texas | 386,154 | $4,850 | CPI: 0.0% Floor / 2.0% Cap | Mar-26 | 4.4 | $— | ||||||||||||||||||||||||
| 3 | Thermo Fisher Scientific Inc. | Pharmaceuticals | IG | Morrisville | North Carolina | 219,812 | $4,063 | Fixed: 2.00% annually | Oct-25 | 8.2 | $— | ||||||||||||||||||||||||
| 4 | Omnicom Group, Inc. | Advertising | IG | Playa Vista | California | 120,000 | $3,961 | None | N/A | 3.0 | $— | ||||||||||||||||||||||||
| 5 | R.R. Donnelley & Sons Company | Commercial Printing | Non-IG | Warrenville | Illinois | 167,215 | $3,461 | Fixed: 2.00% annually | Sep-26 | 2.0 | $— | ||||||||||||||||||||||||
| 6 | Board of Regents, State of Iowa (f) |
Government Related Services | IG | Coralville | Iowa | 191,700 | $3,254 | CPI: 0.0% Floor / No Cap | Nov-25 | 5.1 | $— | ||||||||||||||||||||||||
| 7 | Google, LLC | Internet Software & Services | IG | Venice | California | 67,681 | $3,018 | Fixed: 3.00% annually | Nov-25 | 5.1 | $— | ||||||||||||||||||||||||
| 8 | Northrop Grumman Systems Corporation | Aerospace & Defense | IG | Plymouth | Minnesota | 191,336 | $2,679 | Fixed: 2.00% annually | Dec-25 | 4.2 | $25,220 | ||||||||||||||||||||||||
| 9 | Intuit Inc. | Internet Software & Services | IG | Plano | Texas | 166,033 | $2,577 | Fixed: One-time $2.00/SF in '21 | N/A | 0.7 | $21,900 | ||||||||||||||||||||||||
| 10 | Cohesity Inc. | Systems Software | Non-IG | Roseville | Minnesota | 136,125 | $2,255 | Fixed: 2.00% annually | Dec-25 | 7.2 | $— | ||||||||||||||||||||||||
| 11 | Cenlar FSB | Regional Banks | Non-IG | Yardley | Pennsylvania | 105,584 | $2,105 | Fixed: 2.50% annually | Jan-26 | 2.7 | $— | ||||||||||||||||||||||||
| 12 | iHeartCommunications, Inc. | Broadcasting | Non-IG | San Antonio | Texas | 120,147 | $2,050 | Fixed: 2.00% annually | Feb-26 | 9.3 | $— | ||||||||||||||||||||||||
| 13 | JPMorgan Chase Bank, N.A. (d) (e) |
Diversified Banks | IG | Tampa | Florida | 135,733 | $1,934 | CPI: 0.0% Floor / 2.0% Cap | Mar-26 | 2.4 | $— | ||||||||||||||||||||||||
| 14 | Arbella Service Company, Inc. | Property & Casualty Insurance | IG | Quincy | Massachusetts | 132,160 | $1,850 | Fixed: One-time $1.00/SF in '22 | N/A | 1.7 | $— | ||||||||||||||||||||||||
| 15 | ICF Consulting Group, Inc. | IT Consulting & Other Services | Non-IG | Martinsville | Virginia | 93,333 | $1,830 | CPI: 0.0% Floor / No Cap | Jan-26 | 1.3 | $— | ||||||||||||||||||||||||
| 16 | Safelite Group, Inc. | Specialized Consumer Services | Non-IG | Rio Rancho | New Mexico | 94,649 | $1,527 | Fixed: 2.00% annually | Jan-26 | 3.7 | $— | ||||||||||||||||||||||||
| 17 | Master Lock Company, LLC (g) (h) |
Building Products | Non-IG | Oak Creek | Wisconsin | 120,883 | $1,466 | Fixed: 2.00% annually | N/A | 0.1 | $— | ||||||||||||||||||||||||
| 18 | Securitas Electronic, Security, Inc (d) (e) |
Electronic Equipment & Instruments | IG | Plymouth | Minnesota | 182,250 | $1,218 | Fixed: 3.25% annually | N/A | 0.5 | $— | ||||||||||||||||||||||||
| 19 | Radiate Holdings, L.P. | Cable & Satellite | Non-IG | San Marcos | Texas | 47,000 | $1,101 | CPI: 0.0% Floor / 3.0% Cap | Aug-26 | 2.9 | $— | ||||||||||||||||||||||||
| 20 | North American Lighting, Inc. (i) |
Auto Parts & Equipment | Non-IG | Farmington Hills | Michigan | 75,286 | $1,084 | Fixed: 2.50% annually | Apr-27 | 15.5 | $— | ||||||||||||||||||||||||
| 21 | Arcfield Acquisition Corporation | Aerospace & Defense | Non-IG | King of Prussia | Pennsylvania | 88,578 | $1,000 | Fixed: One-time 17.50% in '23 | N/A | 0.3 | $— | ||||||||||||||||||||||||
| 22 | Pioneer Credit Recovery, Inc. (d) |
Diversified Support Services | Non-IG | Moorestown | New Jersey | 65,567 | $931 | Fixed: 2.50% annually | Jan-26 | 2.4 | $— | ||||||||||||||||||||||||
| 23 | APCO Holdings, Inc. | Property & Casualty Insurance | Non-IG | Norcross | Georgia | 50,600 | $631 | Fixed: 2.50% annually | Mar-26 | 5.4 | $— | ||||||||||||||||||||||||
| 24 | Undisclosed – multi-national provider of industrial gases | Industrial Gases | IG | Houston | Texas | 49,821 | $629 | Fixed: 2.00% annually | N/A | 0.3 | $— | ||||||||||||||||||||||||
| 25 | S&ME, Inc. | Environmental & Facilities Services | Non-IG | Raleigh | North Carolina | 31,120 | $544 | Fixed: 2.75% annually | Mar-26 | 11.4 | $— | ||||||||||||||||||||||||
| 26 | Radiate Holdings, L.P. | Cable & Satellite | Non-IG | Waco | Texas | 30,699 | $484 | CPI: 0.0% Floor / 3.0% Cap | Aug-26 | 2.9 | $— | ||||||||||||||||||||||||
Net Lease Office Properties | 12 |
|||||
| 27 | Radiate Holdings, L.P. | Cable & Satellite | Non-IG | Corpus Christi | Texas | 20,717 | $363 | CPI: 0.0% Floor / 3.0% Cap | Aug-26 | 2.9 | $— | ||||||||||||||||||||||||
| 28 | Radiate Holdings, L.P. | Cable & Satellite | Non-IG | Odessa | Texas | 21,193 | $242 | CPI: 0.0% Floor / 3.0% Cap | Aug-26 | 2.9 | $— | ||||||||||||||||||||||||
| 29 | Radiate Holdings, L.P. | Cable & Satellite | Non-IG | San Marcos | Texas | 14,400 | $217 | CPI: 0.0% Floor / 3.0% Cap | Aug-26 | 2.9 | $— | ||||||||||||||||||||||||
| 30 | Vacant (formerly BCBSM, Inc.) (g) |
N/A | N/A | Eagan | Minnesota | 442,542 | $0 | N/A | N/A | 0.0 | $— | ||||||||||||||||||||||||
| 31 | Vacant (formerly Bankers Financial Corporation) (g) |
N/A | N/A | St. Petersburg | Florida | 167,581 | $0 | N/A | N/A | 0.0 | $— | ||||||||||||||||||||||||
| 32 | Vacant (formerly BCBSM, Inc.) (g) |
N/A | N/A | Eagan | Minnesota | 12,286 | $0 | N/A | N/A | 0.0 | $— | ||||||||||||||||||||||||
Total (j) |
4,812,973 | $72,612 | 4.3 | $47,120 | |||||||||||||||||||||||||||||||
Net Lease Office Properties | 13 |
|||||

Net Lease Office Properties | 14 |
|||||
| Normalized Pro Rata Cash NOI | |||||
Three Months Ended September 30, 2025 |
|||||
| Consolidated Lease Revenues and Other | |||||
| Total lease revenues – as reported | $ | 24,099 | |||
Parking garage revenues (a) |
445 | ||||
| Less: Consolidated Reimbursable and Non-Reimbursable Property Expenses | |||||
| Reimbursable property expenses – as reported | 4,931 | ||||
| Non-reimbursable property expenses – as reported | 1,933 | ||||
| 17,680 | |||||
| Adjustments for Pro Rata Ownership of Real Estate Joint Ventures: | |||||
| Less: Pro rata share of NOI attributable to noncontrolling interests | (90) | ||||
| (90) | |||||
| 17,590 | |||||
| Adjustments for Pro Rata Non-Cash Items: | |||||
| Add: Straight-line and other leasing and financing adjustments | 632 | ||||
| Add: Above- and below-market rent intangible lease amortization | 202 | ||||
| Add: Other non-cash items | 110 | ||||
| 944 | |||||
Pro Rata Cash NOI (b) |
18,534 | ||||
Adjustment to normalize for intra-period dispositions (c) |
(1,365) | ||||
Normalized Pro Rata Cash NOI (b) |
$ | 17,169 | |||
Net Lease Office Properties | 15 |
|||||
Three Months Ended September 30, 2025 |
|||||
| Net Loss Attributable to NLOP | |||||
| Net loss attributable to NLOP – as reported | $ | (64,161) | |||
| Adjustments for Consolidated Operating Expenses | |||||
| Add: Operating expenses – as reported | 69,513 | ||||
| Less: Property expenses, excluding reimbursable tenant costs – as reported | (1,933) | ||||
| 67,580 | |||||
| Adjustments for Other Consolidated Revenues and Expenses: | |||||
| Less: Other lease-related income (excluding parking garage revenues) | (5,240) | ||||
| Less: Reimbursable property expenses – as reported | (4,931) | ||||
| Add: Other income and (expenses) – as reported | 24,381 | ||||
| Add: Provision for income taxes – as reported | 30 | ||||
| 14,240 | |||||
| Other Adjustments: | |||||
Adjustment to normalize for intra-period dispositions (c) |
(1,365) | ||||
| Add: Straight-line and other leasing and financing adjustments | 632 | ||||
| Add: Above- and below-market rent intangible lease amortization | 202 | ||||
| Add: Property expenses, excluding reimbursable tenant costs, non-cash | 110 | ||||
| Less: Adjustments for pro rata ownership | (69) | ||||
| (490) | |||||
Normalized Pro Rata Cash NOI (b) |
$ | 17,169 | |||
Net Lease Office Properties | 16 |
|||||
| Disclosures Regarding Non-GAAP and Other Metrics | |||||
Net Lease Office Properties | 17 |
|||||
Net Lease Office Properties | 18 |
|||||


