Document
BROOKFIELD ASSET MANAGEMENT LTD.
SUSTAINABILITY
Sustainability at Brookfield
Our sustainability strategy is centered on supporting business resilience and creating value for our investors and stakeholders—now and in the future. We manage our investments by combining economic goals with responsible corporate citizenship. This is consistent with our longstanding philosophy of conducting business with a long-term perspective in a sustainable and ethical manner. It also requires operating with robust sustainability principles and practices, and maintaining a disciplined focus on integrating these into everything we do.
While sustainability principles have long been embedded in how we run our business, this approach was formalized in Brookfield’s sustainability principles in 2016 and is described in our global Sustainability Policy. Our Sustainability Policy codifies our commitment to integrating sustainability considerations into our decision-making and day-to-day asset management activities. This policy is reviewed annually and updated periodically by senior executives at Brookfield, as well as each of Brookfield’s business groups. Our Sustainability Policy outlines our approach and is based on the following guiding principles:
Mitigate the impact of our operations on the environment
•Strive to minimize the environmental impact of our operations and improve our efficient use of resources over time.
•Support the goal of net-zero greenhouse gas (“GHG”) emissions by 2050 or sooner.
Strive to ensure the well-being and safety of employees
•Foster a positive work environment based on respect for human rights, valuing diversity and having zero tolerance for workplace discrimination, violence or harassment.
•Operate with leading health and safety practices to support the goal of achieving zero serious safety incidents.
Uphold strong governance practices
•Operate to the highest ethical standards by conducting business activities in accordance with our Code.
•Maintain strong stakeholder relationships through transparency and active engagement.
Be good corporate citizens
•Strive to ensure the interests, safety and well-being of the communities in which we operate are integrated into our business decisions.
•Support philanthropy and volunteerism by our employees.
Sustainability Affiliations and Partnerships
Through our engagement with sustainability frameworks and organizations, we continue to be actively involved in discussions to advance sustainability awareness across private and public markets, and we are continuing to enhance our sustainability reporting and protocols in line with evolving best practices. The following are some of the frameworks and organizations with which we are affiliated:
•Net Zero Asset Managers (“NZAM”) initiative - We have been a signatory to NZAM since 2021 and are committed to supporting the goal of net-zero GHG emissions by 2050 or sooner, emphasizing our alignment with the Paris Agreement.
•Task Force on Climate-related Financial Disclosures (“TCFD”) – We have been supporters since 2021 of the TCFD, which aims to guide companies in considering the effects of climate change in business and financial decisions, and we report in alignment with their recommendations.
•Principles for Responsible Investment (“PRI”) - We have been signatories to the PRI since 2020, which reinforces our longstanding commitment to responsible investment and sustainability best practices.
•International Financial Reporting Standards (“IFRS”) Sustainability Alliance - We are members of the IFRS Sustainability Alliance, a global program established to develop globally accepted accounting and sustainability disclosures.
•Sustainable Markets Initiative's (“SMI”) Asset Manager and Asset Owner (“AMAO”) Task Force - We have been involved with SMI’s AMAO Task Force since 2021. It focuses on scalable ways for institutional investors to allocate capital towards sustainable solutions leveraging expertise from each member firm.
Sustainability Organization and Governance
Robust sustainability programs throughout our firm, business groups and underlying portfolio companies remain an important priority. We understand that good governance is essential to sustainable business operations. The governance of sustainability matters is integrated into Brookfield’s overall governance framework and is aligned with our governance approach. We are committed to governance practices to monitor and oversee our business, including our sustainability strategy.
Our Board is focused on maintaining strong corporate governance and prioritizing the interests of our shareholders and other stakeholders. The Board has oversight of our business and affairs, reviews progress on major strategic initiatives, and receives progress and status reports on the firm’s sustainability initiatives throughout the year.
Brookfield’s sustainability programs are overseen by its senior executives, including its Chief Operating Officer (COO) (Governance and Risk Management), Head of Transition Investing (Decarbonization and Investment), Head of Sustainability Management and the Chief Financial Officer (CFO) (GHG Reporting and Measurement). Alongside this group, our sustainability programs have sponsorship and oversight from senior leadership within each business group including each group’s CEO and sustainability lead. Since sustainability covers a vast range of priorities that are varied in scope, we believe that sustainability initiatives should be overseen by individuals closest to the particular business activity. Functional leads are responsible for developing, implementing and monitoring relevant sustainability factors within their functional area, such as Risk Management and Human Resources. Program Leads and Management Committees, such as the Net Zero Steering Committee and Safety Leadership Committee, bring together expertise to manage key sustainability areas, ensuring appropriate application and coordination of approaches across our business and functional groups. Supporting our Program Leads and Management Committees, we have Working Groups, such as the Sustainability Working Group, Net Zero Operational Committee and Sustainability Financial Reporting Working Group, dedicated to specialized areas with the objective of ensuring that key priorities for Brookfield are being advanced. Our sustainability-focused professionals and functional experts work with our Program Leads, Management Committees and Working Groups to drive sustainability-related initiatives.
Sustainability Integration into the Investment Process
As part of investment due diligence, Brookfield seeks to assess sustainability-related risks and opportunities and factor them into the overall investment decision. This includes leveraging leading industry guidance to identify sustainability factors most likely to materially impact the financial condition or operating performance of companies in a sector. As part of our Sustainability Due Diligence Protocol, Brookfield provides specific guidance to investment teams on assessing climate change, bribery and corruption, cybersecurity, health and safety and human rights and modern slavery risks. Where warranted, Brookfield performs deeper due diligence, working with internal and third-party experts as appropriate.
All investments must be approved by the applicable Investment Committee. Investment teams outline for the Investment Committee the merits of the transaction and material risks, mitigants and significant opportunities for improvement, including those related to sustainability.
As part of each acquisition1, investment teams create a tailored integration plan that includes, among other things, material sustainability-related matters for review or execution. We believe there is a strong relationship between managing these considerations and enhancing investment returns.
Consistent with our management approach, it is the responsibility of the management teams within each portfolio company to manage sustainability risks and opportunities through the investment’s lifecycle, supported by the applicable investment team within Brookfield. The combination of local accountability and expertise in tandem with Brookfield's investment and operating experience and insight is important when managing a wide range of asset types across jurisdictions. We leverage these capabilities in collaborating on sustainability initiatives, where appropriate, to drive best practices and assist with any remediation. As it relates to sustainability, where appropriate, we encourage our portfolio companies to organize training for relevant staff.
Management teams regularly report to their respective boards of directors from both financial and operating perspectives, including key performance indicators that incorporate material sustainability factors, such as health and safety, environmental management, compliance with regulatory requirements, and, increasingly, GHG emissions.
For investments where Brookfield has a non-controlling interest, where we are a debt holder or in other circumstances where Brookfield does not have the ability to exercise influence through its contractual rights, Brookfield actively monitors the performance of its investments and, where appropriate, utilizes its stewardship practices to encourage sustainability outcomes that are aligned with Brookfield’s sustainability approach.
1 Refers to investments where Brookfield has control and significant influence.
When preparing an asset for divestiture, we outline potential value creation deriving from several different factors, including relevant sustainability considerations. Where applicable, we also prepare both qualitative and quantitative data that summarize the sustainability performance of the investment and provide a holistic understanding of how we have managed the investment during the holding period.
Stewardship and Engagement
Stewardship is an important element of our sustainability strategy, and we have defined it in alignment with the PRI. We seek to engage with our portfolio companies and collaborate with industry peers to help inform and improve our sustainability strategies and practices. Though the majority of our investments are in private markets, we will use our Proxy Voting Guidelines, where applicable, and ensure our disclosures address how we incorporate sustainability factors into our investment process. In managing our assets, we utilize our significant influence and investing and operating capabilities in collaborating with our portfolio companies to encourage sound sustainability practices that are essential for resilient businesses, while seeking to create long-term value for our investors and stakeholders. As well, through our ongoing engagement with portfolio companies, we may partner with or support our portfolio companies to facilitate constructive dialogue with external stakeholders with the intent of positively influencing industry standards or practices that are aligned with our sustainability principles.
Below is a summary of some of the sustainability initiatives that we undertook in 2023.
Environmental
Climate change mitigation and adaptation continues to be a key area of focus for our business. Brookfield believes it can contribute meaningfully to the global economy’s transition to net zero.
Increased transparency and alignment to the TCFD
Since becoming supporters of the TCFD in 2021, Brookfield has made progress on aligning with the TCFD’s recommended disclosures. We have also implemented a climate risk assessment process to better understand the physical risk and transition risk and opportunity profile across our businesses. We leverage the results of the assessment to identify improvement opportunities in approaching climate change mitigation and adaptation and continue to work to integrate those considerations into Brookfield’s business.
Decarbonization: Supporting the World’s Transition to a Net-Zero Economy
We recognize that the road to a net-zero economy will take time, requiring the alignment of government policy and technological development. We intend to support this goal by contributing operational and investment expertise to execute practical decarbonization strategies that will prepare businesses for the future economy. We also believe that decarbonization is an important long-term transition risk mitigation strategy that is complementary to preserving and enhancing value.
We remain focused on our sustainability approach, which, at its core, is aligned with our fiduciary duty to create long-term value for our investors and stakeholders, while managing our businesses responsibly. We will continue to buy long-life assets and businesses that can generate stable cash flows that grow over time. We believe that with proper management and stewardship, including preparing them for a low-carbon future, these assets will tend to increase in value over time.
We are focused on developing foundational processes to catalyze decarbonization and will continue to take action across all of our businesses. We are focused on providing support to our businesses through the sharing of best practices and resources, as well as regular and systematic monitoring to understand our progress.
Net Zero Asset Managers initiative
To further our commitment to support the transition to a net zero carbon economy, Brookfield is a signatory to the Net Zero Asset Managers initiative. NZAM is a group of international asset managers committed to supporting the goal of net zero GHG emissions by 2050 or sooner.
Following the formalization of our interim target commitment set in 2022, in 2023, and ahead of NZAM’s requirements, we increased our interim target commitment by $54 billion of AUM. Our updated interim target commitment is to reduce emissions across $201 billion of AUM by at least 50% from a 2020 base year.
An integral part of Brookfield’s net-zero commitment is the allocation of capital towards climate solutions. Our interim emissions target is comprised of assets across our businesses, including renewable power and transition, infrastructure, private equity, and real estate. In setting our interim target, we focused on investments where:
1.We have control and therefore sufficient influence over the outcomes;
2.We could identify and implement actionable initiatives in the near term; and
3.We assessed it to be value accretive to do so over the life of the investment.
Our intention is to increase the proportion of assets to be managed in line with net zero annually or as frequently as possible, consistent with our ambition to reach 100% over time. Our net-zero interim target includes Scope 1 and 2 emissions of Brookfield's portfolio companies.
To support our progress towards achieving our net-zero ambition, our focus over the past year has been on building teams and devoting additional resources to facilitate the development of credible decarbonization plans across our assets under management. In undertaking this work, we will focus our net-zero efforts on investments where we have the best opportunity to achieve meaningful outcomes.
In addition to the work that we are undertaking with our existing assets, two years ago we launched BGTF I, the first in a series of funds for our transition strategy that is dedicated to accelerating the transition to a net-zero economy by catalyzing businesses onto net-zero pathways aligned with the goals of the Paris Agreement. BGTF II, launched in 2023, will follow the strategy of its predecessor fund, and invest in developing new clean energy capacity, scaling sustainable solutions and providing capital for transforming businesses in carbon-intensive sectors. At COP28, Brookfield and Altérra, announced the creation of a multi-billion dollar Catalytic Transition Fund (“CTF”). CTF will have a differentiated and focused mandate, deploying capital exclusively for emerging and developing markets, with a dedicated focus on supporting energy transition, industrial decarbonization, sustainable living and climate technologies. In addition to driving impact through transition investing, including supporting the growth of significant new clean energy capacity, we are one of the world’s largest owners and operators of renewable power globally.
Water, Waste & Biodiversity
Reducing the impact of our water consumption and waste generation helps build efficient systems, business resiliency and contributes to a sustainable future. We utilize industry best practices to efficiently monitor and manage performance and seek to ensure continual reduction of water consumption. In addition, we adhere to all applicable local and regional waste regulations and track waste and recycling metrics. Encouraging conservation of biodiversity is an important component in achieving our net zero goals and managing physical risks as we strive to protect biodiversity and ecosystems near our businesses.
Social
Culture Matters: Human Capital Development
Our people are our most important asset—collaboration, entrepreneurship and discipline underpin our winning culture. Brookfield invests in its people and prepares them for future leadership. Everything Brookfield does, from its dealings with clients to the interactions among employees and executives, is governed by a sense of fair play. This has been critical to the success of the partnership in building relationships that are long-lasting and mutually rewarding. Brookfield’s firmwide culture is defined by mutual respect, teamwork and passion, and revolves around our core values:
•Collaboration: Leadership works side by side with colleagues throughout the organization and is committed to achieving shared success. One of the key attributes that Brookfield screens carefully for in new hires is their aptitude to collaborate with others. The firm wants people to share information across groups and take an interest in all the businesses, not just the one they happen to work for at the moment. Brookfield does not hire people just for a specific job; it hires for the potential of all the future positions they might hold and that will contribute to the larger success of the firm. Brookfield actively looks for people who want to learn, grow, and develop—and demonstrate a willingness to be stretched outside their comfort zone.
•Entrepreneurship: Our flat organization is results oriented—responsibility is earned based on initiative and hard work, rather than job title—and decisions are made close to the action. This idea is not uncommon, but Brookfield has encouraged its entrepreneurial spirit throughout its growth during the past 20 years. Brookfield looks for employees who have a passion not only for what they do but also for what the firm does. The shared values of ownership extend beyond helping the company succeed or generate more revenue. It means caring about the little things as well, such as not wasting money and treating everyone with respect.
•Discipline: Our team shares an awareness of, and commitment to, our goal of generating superior long-term returns for investors. Discipline also requires that each person is expected to have a realistic understanding of his or her own abilities. Brookfield expects employees to understand their strengths, recognize their weaknesses, be willing to stretch outside their comfort zones, and be willing to ask for help when necessary.
The three attributes—collaboration, entrepreneurship, and discipline—form the foundation of Brookfield. By hiring talented people and giving them opportunities to move into different businesses, Brookfield has been able to build its expertise into a broad ecosystem that allows it to collaborate very effectively across different areas and geographies as needed. The teams draw on sound data and expertise to identify emergent themes—informing their investment process and enabling Brookfield to draw upon actionable intelligence for the benefit of its investors.
Employee Composition
Building a diverse, equitable and inclusive work environment reinforces our culture of collaboration and strengthens our ability to develop and promote all of our people to their potential. Our approach to diversity, equity and inclusion is deliberate and integrated into our human capital development processes and initiatives. Our initial focus on gender diversity led to a significant increase in female representation at the senior levels. Over the past few years, we have applied the same disciplined human capital processes and development activities to foster more ethnic diversity and are immediately seeing the results of these efforts. Some of the more impactful initiatives are centered around how we hire, our succession process and how we engage our people. We are involved with several organizations to promote diverse representation in our talent pool, including summer interns and MBA Associates. Our succession process includes identifying a diverse slate of candidates and focuses on the development of early career candidates through stretch roles and exposure. We support a number of Employee Resource Groups organized by employees around shared interests, characteristics or experiences.
Occupational Health and Safety
Managing health and safety risk is an integral part of the management of our business. Our goal is to have zero serious safety incidents. We have implemented a health and safety governance initiative to propagate a strong health and safety culture, encourage the sharing of best practices, support the continuous improvement of safety performance and help eliminate serious safety incidents. The initiative is overseen by the Safety Leadership Committee, which comprises senior operations executives from across our business groups and regions, and reports on health and safety trends and key initiatives are provided to the Board as part of the quarterly operational risk update. Portfolio company management is responsible for ensuring that their company’s health and safety policies and systems are developed, operationalized, and reviewed regularly to address their specific risk areas. Portfolio company CEOs report to their respective board of directors on safety performance, incidents, and the status of improvement initiatives.
Human Rights and Modern Slavery
In relation to human rights, we seek to act in a way that aligns with the Organization for Economic Co-operation and Development Guidelines for Multinational Enterprises and the United Nations Guiding Principles on Business and Human Rights. We are committed to conducting our business in an ethical and responsible manner, including by carrying out our activities in a manner that respects fundamental human rights and supports the prevention of human rights violations within our business. We strive to embed this into our core business activities, including training, communications, contracts and due diligence processes set out in our Human Rights and Anti-Modern Slavery Policy (“Human Rights Policy”), Sustainability Due Diligence Protocol and Vendor Management Program.
Integrity, fairness and respect are hallmarks of our culture, including by carrying out our activities by respecting fundamental human rights and our efforts to identify and prevent human rights violations within our business and supply chain. We are committed to maintaining a workplace free of discrimination, violence and harassment and we expect our staff to act in a way which promotes a positive working environment. Our Human Rights Policy aims to codify our approach to minimizing the risk of modern slavery within our business and supply chain. We also have specific tools and processes aimed at identifying human rights and modern slavery as part of due diligence for new investments and which include risk assessments, remedies, training and governance.
In addition, our Human Rights Policy consolidates the relevant commitments set out in the Code, Sustainability Policy, financial crimes policies, and the Whistleblowing Policy. We also have several additional policies and procedures that provide guidance on the identification of human rights and modern slavery risks and the steps to be taken to mitigate these risks. These include our Vendor Code of Conduct and Anti-Money Laundering and Trade Sanctions Policy. We are cognizant of the fact that the risks of human rights, modern slavery and human trafficking are complex and evolving, and we will continue to work on addressing them.
Governance
Strong governance is essential to sustainable business operations, and we aim to conduct our business according to high ethical and legal standards.
Sustainability Regulation and Frameworks
Our governance practices are the foundation upon which we operate our business. We continue to adapt and enhance our policies to meet evolving standards and regulations in our industry, including legislation, guidelines and practices in all jurisdictions in which we operate.
We seek to continuously improve and refine our processes by actively participating in the development and implementation of new industry standards and best practices.
Data Privacy and Cybersecurity
Data privacy and cybersecurity remain key sustainability focus areas. Brookfield undertook initiatives to further enhance our data protection and threat-intelligence capabilities, and Brookfield worked on improving our processes for third-party risk management. Brookfield reviews and updates our cybersecurity program annually and conducts regular external-party assessments of our program maturity based on the National Institute of Standards and Technology (“NIST”) Cybersecurity Framework. Finally, in addition to continued mandatory cybersecurity education for all employees, Brookfield enhanced our phishing simulations to include more advanced simulations and social engineering.
BROOKFIELD ASSET MANAGEMENT LTD.
MANAGEMENT’S DISCUSSION AND ANALYSIS
ORGANIZATION OF MANAGEMENT’S DISCUSSION AND ANALYSIS (“MD&A”)
|
|
|
|
|
|
|
|
|
|
|
|
|
|
|
PART 1 – OVERVIEW OF OUR BUSINESS |
|
Real Estate |
|
| Introduction |
|
|
Private Equity |
|
| Basis of Presentation |
|
|
Credit and Other |
|
| Business History |
|
|
PART 6 – RECONCILIATION OF U.S. GAAP TO |
| Business Overview |
|
|
NON-GAAP MEASURES |
|
| Value Creation |
|
|
Reconciliation of Net Income to Fee-Related |
|
| Competitive Advantages |
|
|
Earnings and Distributable Earnings |
|
| Our People |
|
|
Reconciliation of Revenues to Fee Revenues |
|
| Investment Process |
|
|
PART 7 – LIQUIDITY AND CAPITAL RESOURCES |
| Products and Principal Strategies |
|
|
Liquidity |
|
PART 2 – REVIEW OF FINANCIAL RESULTS |
|
Capital Resources |
|
| Income Statement Analysis |
|
|
Contractual Obligations |
|
| Balance Sheet Analysis |
|
|
Exposures to Financial Instruments |
|
| Cash Flows Statement Analysis |
|
|
Off-Balance Sheet Arrangements |
|
| Summary of Quarterly Results |
|
|
Related Party Transactions |
|
PART 3 – KEY FINANCIAL OPERATING MEASURES |
|
Recent Developments |
|
| Non-GAAP Measures |
|
|
PART 8 – SUMMARY OF SIGNIFICANT |
|
| Supplemental Financial Measures Utilized by |
|
|
ACCOUNTING POLICIES |
|
| Our Asset Management Business |
|
|
Accounting Policies, Estimates, and Judgements |
|
| Fee-Bearing Capital Diversification |
|
|
Assessments and Changes in Internal Control Over |
|
PART 4 – ANALYSIS OF KEY NON-GAAP FINANCIAL |
|
Financial Reporting |
|
AND OPERATING MEASURES |
|
|
PART 9 – BUSINESS ENVIRONMENT AND |
|
| Distributable Earnings |
|
|
RISK DISCLOSURES |
|
| Fee-Bearing Capital |
|
|
Risks Relating to the Manager |
|
| Fee Revenues and Fee-Related Earnings |
|
|
Risks Relating to our Business |
|
PART 5 – INVESTMENT STRATEGY RESULTS |
|
Risks Relating to Taxation |
|
| Renewable Power and Transition |
|
|
GLOSSARY OF TERMS |
|
| Infrastructure |
|
|
|
|
"BAM Ltd." or the "Manager" refers to Brookfield Asset Management Ltd. The "Asset Management Company", the "asset management business", "BAM ULC", or the "Company" refers to Brookfield Asset Management ULC. Please refer to the Glossary of Terms beginning on page
101 which defines certain key terms.
Additional information about the Manager, including our Annual Information Form, is available on our website at www.bam.brookfield.com, on the Canadian Securities Administrators’ website at www.sedarplus.ca and on the EDGAR section of the U.S. Securities and Exchange Commission’s (“SEC”) website at www.sec.gov.
The Manager is incorporated in British Columbia, Canada, and qualify as an eligible Canadian issuer under the Multijurisdictional Disclosure System and as a “foreign private issuer” as such term is defined in Rule 405 under the U.S. Securities Act of 1933, as amended, and Rule 3b-4 under the U.S. Securities Exchange Act of 1934, as amended. As a result, the Manager complies with U.S. continuous reporting requirements by filing the Canadian disclosure documents with the SEC; the Manager's annual report is filed under Form 40-F and the Manager furnishes its quarterly interim reports under Form 6-K.
Information contained in or otherwise accessible through the websites mentioned throughout this report does not form part of this report. All references in this report to websites are inactive textual references and are not incorporated by reference. Any other reports of the company referred to herein are not incorporated by reference unless explicitly stated otherwise.
CAUTIONARY STATEMENT REGARDING FORWARD-LOOKING STATEMENTS AND INFORMATION
This MD&A contains “forward-looking information” within the meaning of Canadian provincial securities laws and “forward-looking statements” within the meaning of the U.S. Securities Act of 1933, the U.S. Securities Exchange Act of 1934, “safe harbor” provisions of the United States Private Securities Litigation Reform Act of 1995 and in any applicable Canadian securities regulations (collectively, “forward-looking statements”). Forward-looking statements include statements that are predictive in nature, depend upon or refer to future results, events or conditions, and include, but are not limited to, statements which reflect management’s current estimates, beliefs and assumptions regarding the operations, business, financial condition, expected financial results, performance, prospects, opportunities, priorities, targets, goals, ongoing objectives, strategies, capital management and outlook of the Manager, the Asset Management Company and its subsidiaries, as well as the outlook for North American and international economies for the current fiscal year and subsequent periods, and which are in turn based on our experience and perception of historical trends, current conditions and expected future developments, as well as other factors management believes are appropriate in the circumstances. The estimates, beliefs and assumptions of the Manager are inherently subject to significant business, economic, competitive and other uncertainties and contingencies regarding future events and as such, are subject to change. Forward-looking statements are typically identified by words such as “expect”, “anticipate”, “believe”, “foresee”, “could”, “estimate”, “goal”, “intend”, “plan”, “seek”, “strive”, “will”, “may” and “should” and similar expressions.
Although the Manager believes that such forward-looking statements are based upon reasonable estimates, beliefs and assumptions, actual results may differ materially from the forward-looking statements. Factors that could cause actual results to differ materially from those contemplated or implied by forward-looking statements include, but are not limited to:
•the Manager’s lack of independent means of generating revenue;
•the Manager’s material assets consisting solely of its interest in the Asset Management Company;
•challenges relating to maintaining our relationship with the Corporation (as defined below) and potential conflicts of interest;
•the Manager being a newly formed company;
•our liability for our asset management business;
•the difficulty for investors to effect service of process and enforce judgments in the United States, Canada and/or other applicable jurisdictions;
•the impact on growth in Fee-Bearing Capital of poor product development or marketing efforts;
•our ability to maintain our global reputation;
•volatility in the trading price of the Class A Shares;
•being subjected to numerous laws, rules and regulatory requirements;
•the potential ineffectiveness of our policies to prevent violations of applicable law;
•meeting our financial obligations due to our cash flow from our asset management business;
•foreign currency risk and exchange rate fluctuations;
•requirement of temporary investments and backstop commitments to support our asset management business;
•rising interest rates;
•revenues impacted by a decline in the size or pace of investments made by our managed assets;
•our earnings growth can vary, which may affect our dividend and the trading price of the Class A Shares;
•exposed risk due to increased amount and type of investment products in our managed assets;
•difficulty in maintaining our culture or managing our human capital;
•political instability or changes in government;
•inflationary pressures;
•unfavorable economic conditions or changes in the industries in which we operate;
•catastrophic events, such as earthquakes, hurricanes, or pandemics/epidemics;
•deficiencies in public company financial reporting and disclosures;
•ineffective management of sustainability considerations, and inadequate or ineffective health and safety programs;
•failure of our information technology systems;
•us and our managed assets becoming involved in legal disputes;
•losses not covered by insurance;
•inability to collect on amounts owing to us;
•information barriers that may give rise to conflicts and risks;
•risks related to our renewable power and transition, infrastructure, private equity, real estate, and other alternatives, including credit strategies;
•risks relating to Canadian and United States taxation laws; and
•other factors described in this MD&A.
We caution that the foregoing list of important factors that may affect future results is not exhaustive and other factors could also adversely affect future results. Readers are urged to consider these risks, as well as other uncertainties, factors and assumptions carefully in evaluating the forward-looking statements and are cautioned not to place undue reliance on such forward-looking statements, which are based only on information available to us as of the date of this MD&A. Except as required by law, the Manager undertakes no obligation to publicly update or revise any forward-looking statements, whether written or oral, that may be as a result of new information, future events or otherwise. For further information on these known and unknown risks, please see Part 9 “Business Environment and Risk Disclosures”.
Certain of the information contained herein is based on or derived from information provided by independent third-party sources. While the Manager believes that such information is accurate as of the date it was produced and that the sources from which such information has been obtained are reliable, the Manager makes no representation or warranty, express or implied, with respect to the accuracy, reasonableness or completeness of any of the information or the assumptions on which such information is based, contained herein, including but not limited to, information obtained from third parties.
CAUTIONARY STATEMENT REGARDING THE USE OF NON-GAAP MEASURES
The Manager and the Asset Management Company prepare their financial statements in conformity with the accounting principles generally accepted in the United States of America ("U.S. GAAP"). This MD&A discloses a number of non-GAAP financial and supplemental financial measures which are utilized in monitoring the Manager and our asset management business, including for performance measurement, capital allocation and valuation purposes. The Manager believes that providing these performance measures is helpful to investors in assessing the overall performance of our asset management business. These non-GAAP financial measures should not be considered as the sole measure of the Manager’s or our asset management business’ performance and should not be considered in isolation from, or as a substitute for, similar financial measures calculated in conformity with U.S. GAAP financial measures. Non-GAAP measures include, but are not limited to: (i) distributable earnings (“Distributable Earnings”), (ii) fee revenues (“Fee Revenues”) and (iii) fee-related earnings (“Fee-Related Earnings”). These non-GAAP measures are not standardized financial measures and may not be comparable to similar financial measures used by other issuers. Supplemental financial measures include assets under management (“AUM”), fee-bearing capital (“Fee-Bearing Capital”) and uncalled fund commitments. The Manager includes the asset management activities of Oaktree (meaning collectively Oaktree Capital II, L.P., Oaktree Capital Management, L.P., Oaktree AIF Investments, L.P., Oaktree Capital Management (Cayman) L.P. and Oaktree Investment Holdings, L.P. and their consolidated subsidiaries), an equity accounted affiliate, in its key financial and operating measures for the asset management business.
For more information on non-GAAP measures and other financial metrics, see “Key Financial and Operating Measures” and “Glossary of Terms” in our MD&A. Reconciliations of these non-GAAP financial measures to the most directly comparable financial measures calculated and presented in accordance with GAAP, where applicable, are included in Part 6 "Reconciliation of U.S. GAAP to Non-GAAP Measures" of this MD&A. The MD&A is available on SEDAR+ at www.sedarplus.ca and on EDGAR at www.sec.gov/edgar.
PART 1
OVERVIEW OF OUR BUSINESS
Introduction
This management’s discussion and analysis (“MD&A”) included in this Annual Report presents the financial position of Brookfield Asset Management Ltd. and its consolidated subsidiaries (the "Manager") as at December 31, 2023, and December 31, 2022, and the results of operations for the year ended December 31, 2023 and for the period from July 4, 2022 to December 31, 2022. This MD&A also presents the financial position of Brookfield Asset Management ULC and its consolidated subsidiaries (the "Asset Management Company", the "asset management business" or the "Company") as at December 31, 2023, and December 31, 2022, and the results of operations for the years ended December 31, 2023 and 2022. Unless context suggest otherwise, references to "we", "us", and "our" refers to our asset management business and the Manager, individually or collectively, where applicable.
The information in this MD&A should be read in conjunction with the following Consolidated Financial Statements included elsewhere in this Annual Report: (i) the audited Consolidated Financial Statements of the Manager as at December 31, 2023 and December 31, 2022, and the results of operations for the year ended December 31, 2023, and for the period from July 4, 2022 to December 31, 2022 (ii) the audited Consolidated and Combined Financial Statements of the Asset Management Company as at December 31, 2023 and December 31, 2022 and the results of operations for the years ended December 31, 2023 and 2022.
The financial information contained in this MD&A is presented in U.S. dollars and, unless otherwise indicated, all references to “$” are to U.S. dollars.
Basis of Presentation
The Manager, a Canadian corporation, through its ownership interests in its single investment, our asset management business, is a leading global alternative asset manager. The Manager was incorporated on July 4, 2022 and does not have historical operations or activities. The Manager’s sole material asset is its 25% interest in the Asset Management Company, which is accounted for using the equity method. The Manager’s returns are earned from its interest in our asset management business, and therefore this MD&A focuses on the results and operations thereof, underlying the equity earnings of the Manager.
All financial data is presented in U.S. dollars and, unless otherwise indicated, has been prepared in conformity with U.S. GAAP. Non-GAAP measures used in this MD&A are reconciled to the most directly comparable GAAP measure.
Business History
The Manager and the Asset Management Company were formed by Brookfield Corporation (the “Corporation”), formerly known as Brookfield Asset Management Inc., to facilitate a plan of arrangement (the “Arrangement”). The Arrangement, which closed on December 9, 2022, involved the division of Brookfield Asset Management Inc. into two publicly traded companies – the Manager, which is listed on the NYSE and TSX under the ticker symbol “BAM”, is a pure-play leading global alternative asset management business; and the Corporation, listed under the ticker symbol "BN", a leading global investment firm focused on building long-term wealth for institutions and individuals around the world.
The Manager allows investors to directly access the global alternative asset management business previously carried on by the Corporation and its subsidiaries. This business is now owned and operated through the Asset Management Company, which is owned approximately 75% by the Corporation and approximately 25% by the Manager.
Business Overview
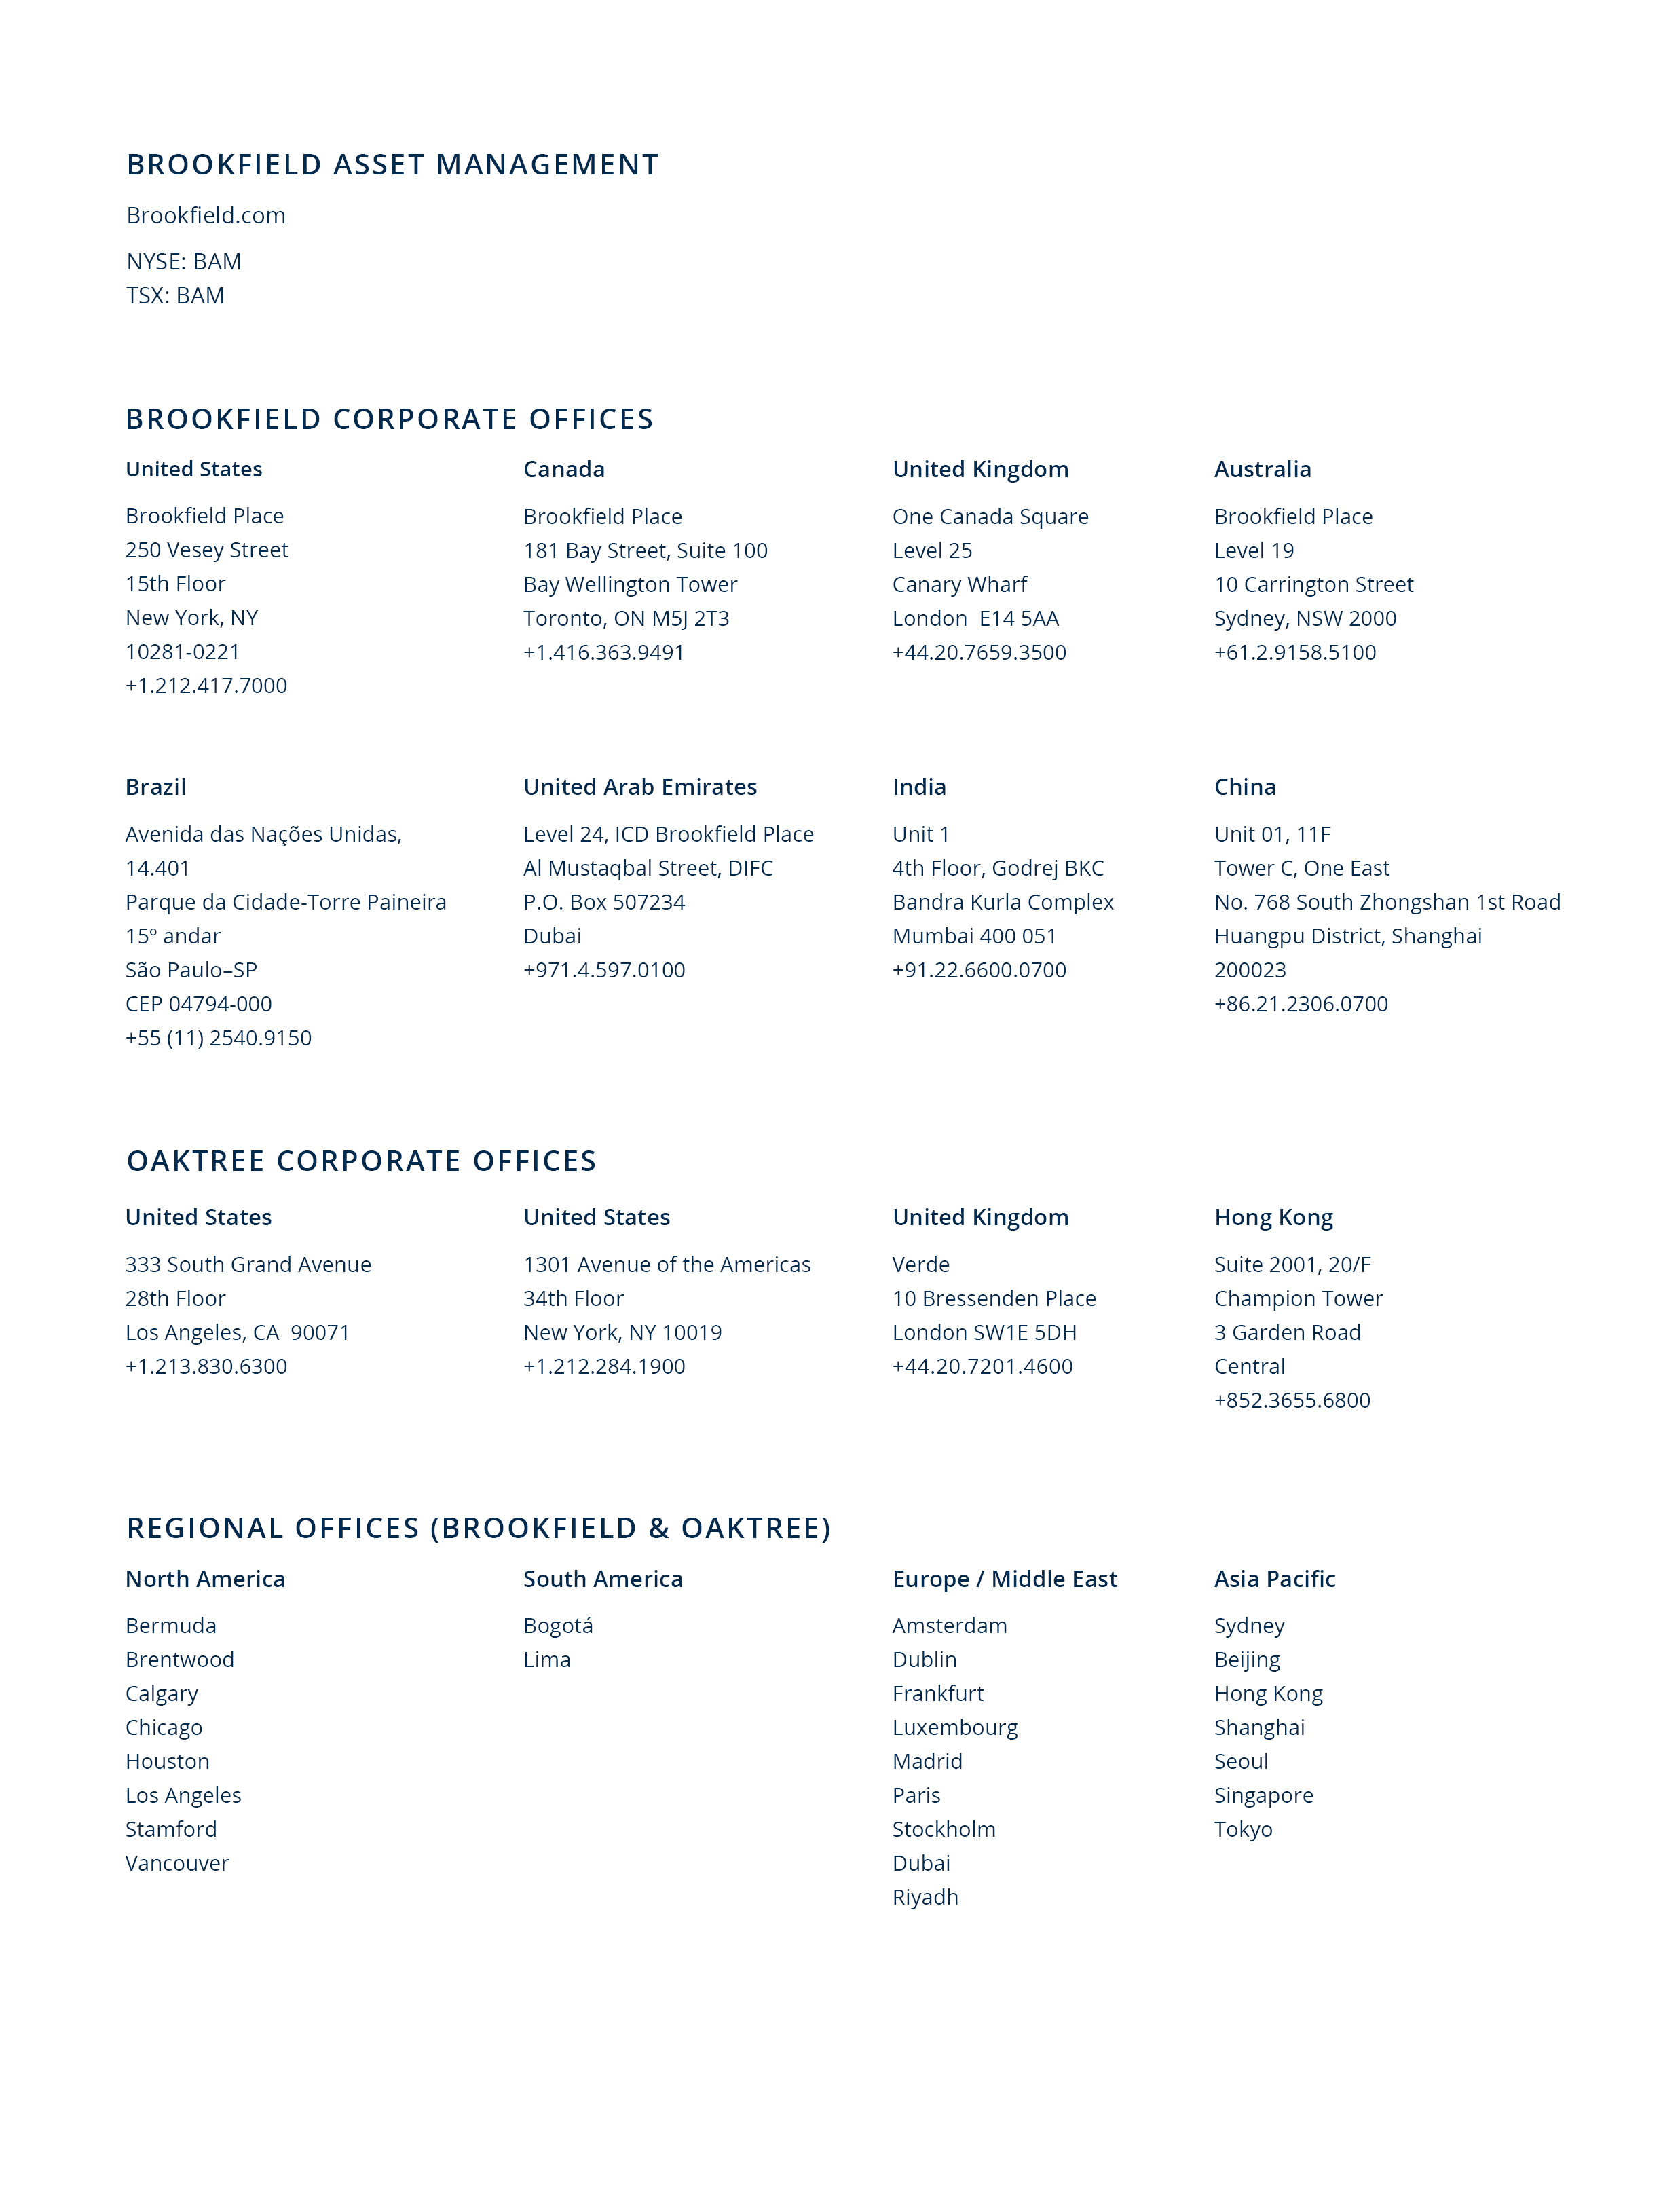
We are one of the world’s leading global alternative asset managers, with $916 billion of assets under management ("AUM") as of December 31, 2023, across renewable power and transition, infrastructure, real estate, private equity, and credit. We invest client capital for the long-term with a focus on real assets and essential service businesses that form the backbone of the global economy. We draw on our heritage as an owner and operator to invest for value and generate strong returns for our clients across economic cycles.
To do this, we leverage our team of over 2,400 investment and asset management professionals, our global reach, deep operating expertise, and access to large-scale capital to identify attractive investment opportunities and invest on a proprietary basis. Our investment approach and strong track record have been the foundation and driver of our growth.
We provide a highly diversified suite of alternative investment strategies to our clients and are constantly seeking to innovate new strategies to meet their needs. We have approximately 50 unique active strategies that span a wide range of risk-adjusted returns, including opportunistic, value-add, core, super-core, and credit. We evaluate the performance of these product offerings and our investment strategies using a number of non-GAAP measures as outlined in "Key Financial and Operating Measures" within this MD&A. The Manager utilizes Fee-Bearing Capital, Fee Revenues, Fee-Related Earnings and Distributable Earnings to assess the performance of our asset management business.
We are in a fortunate position to be trusted with our clients’ capital and our objective is to meet their financial goals and provide for a better financial future while providing a market leading experience. Our team of approximately 200 client service professionals across 18 global offices are dedicated to ensuring that the business is exceeding their service expectations.
We have over 2,300 clients, with some of our clients being among the world’s largest institutional investors, including sovereign wealth funds, pension plans, endowments, foundations, financial institutions, insurance companies, and individual investors.
Our guiding principle is to operate our business and conduct our relationships with the highest level of integrity. Our emphasis on diversity and inclusion reinforces our culture of collaboration, allowing us to attract and retain top talent. We strive to embed strong sustainability practices throughout our business, underpinning our goal of having a positive impact on the communities and environment in which we operate.
Value Creation
We create shareholder value by increasing the earnings profile of our asset management business. Alternative asset management businesses such as ours are typically valued based on a multiple of their Fee-Related Earnings and performance income. Accordingly, we create value by increasing the amount and quality of Fee-Related Earnings and carried interest, net of associated costs. This growth is achieved primarily by expanding the amount of Fee-Bearing Capital we manage, earning performance income such as carried interest, through strong investment results and maintaining competitive operating margins.
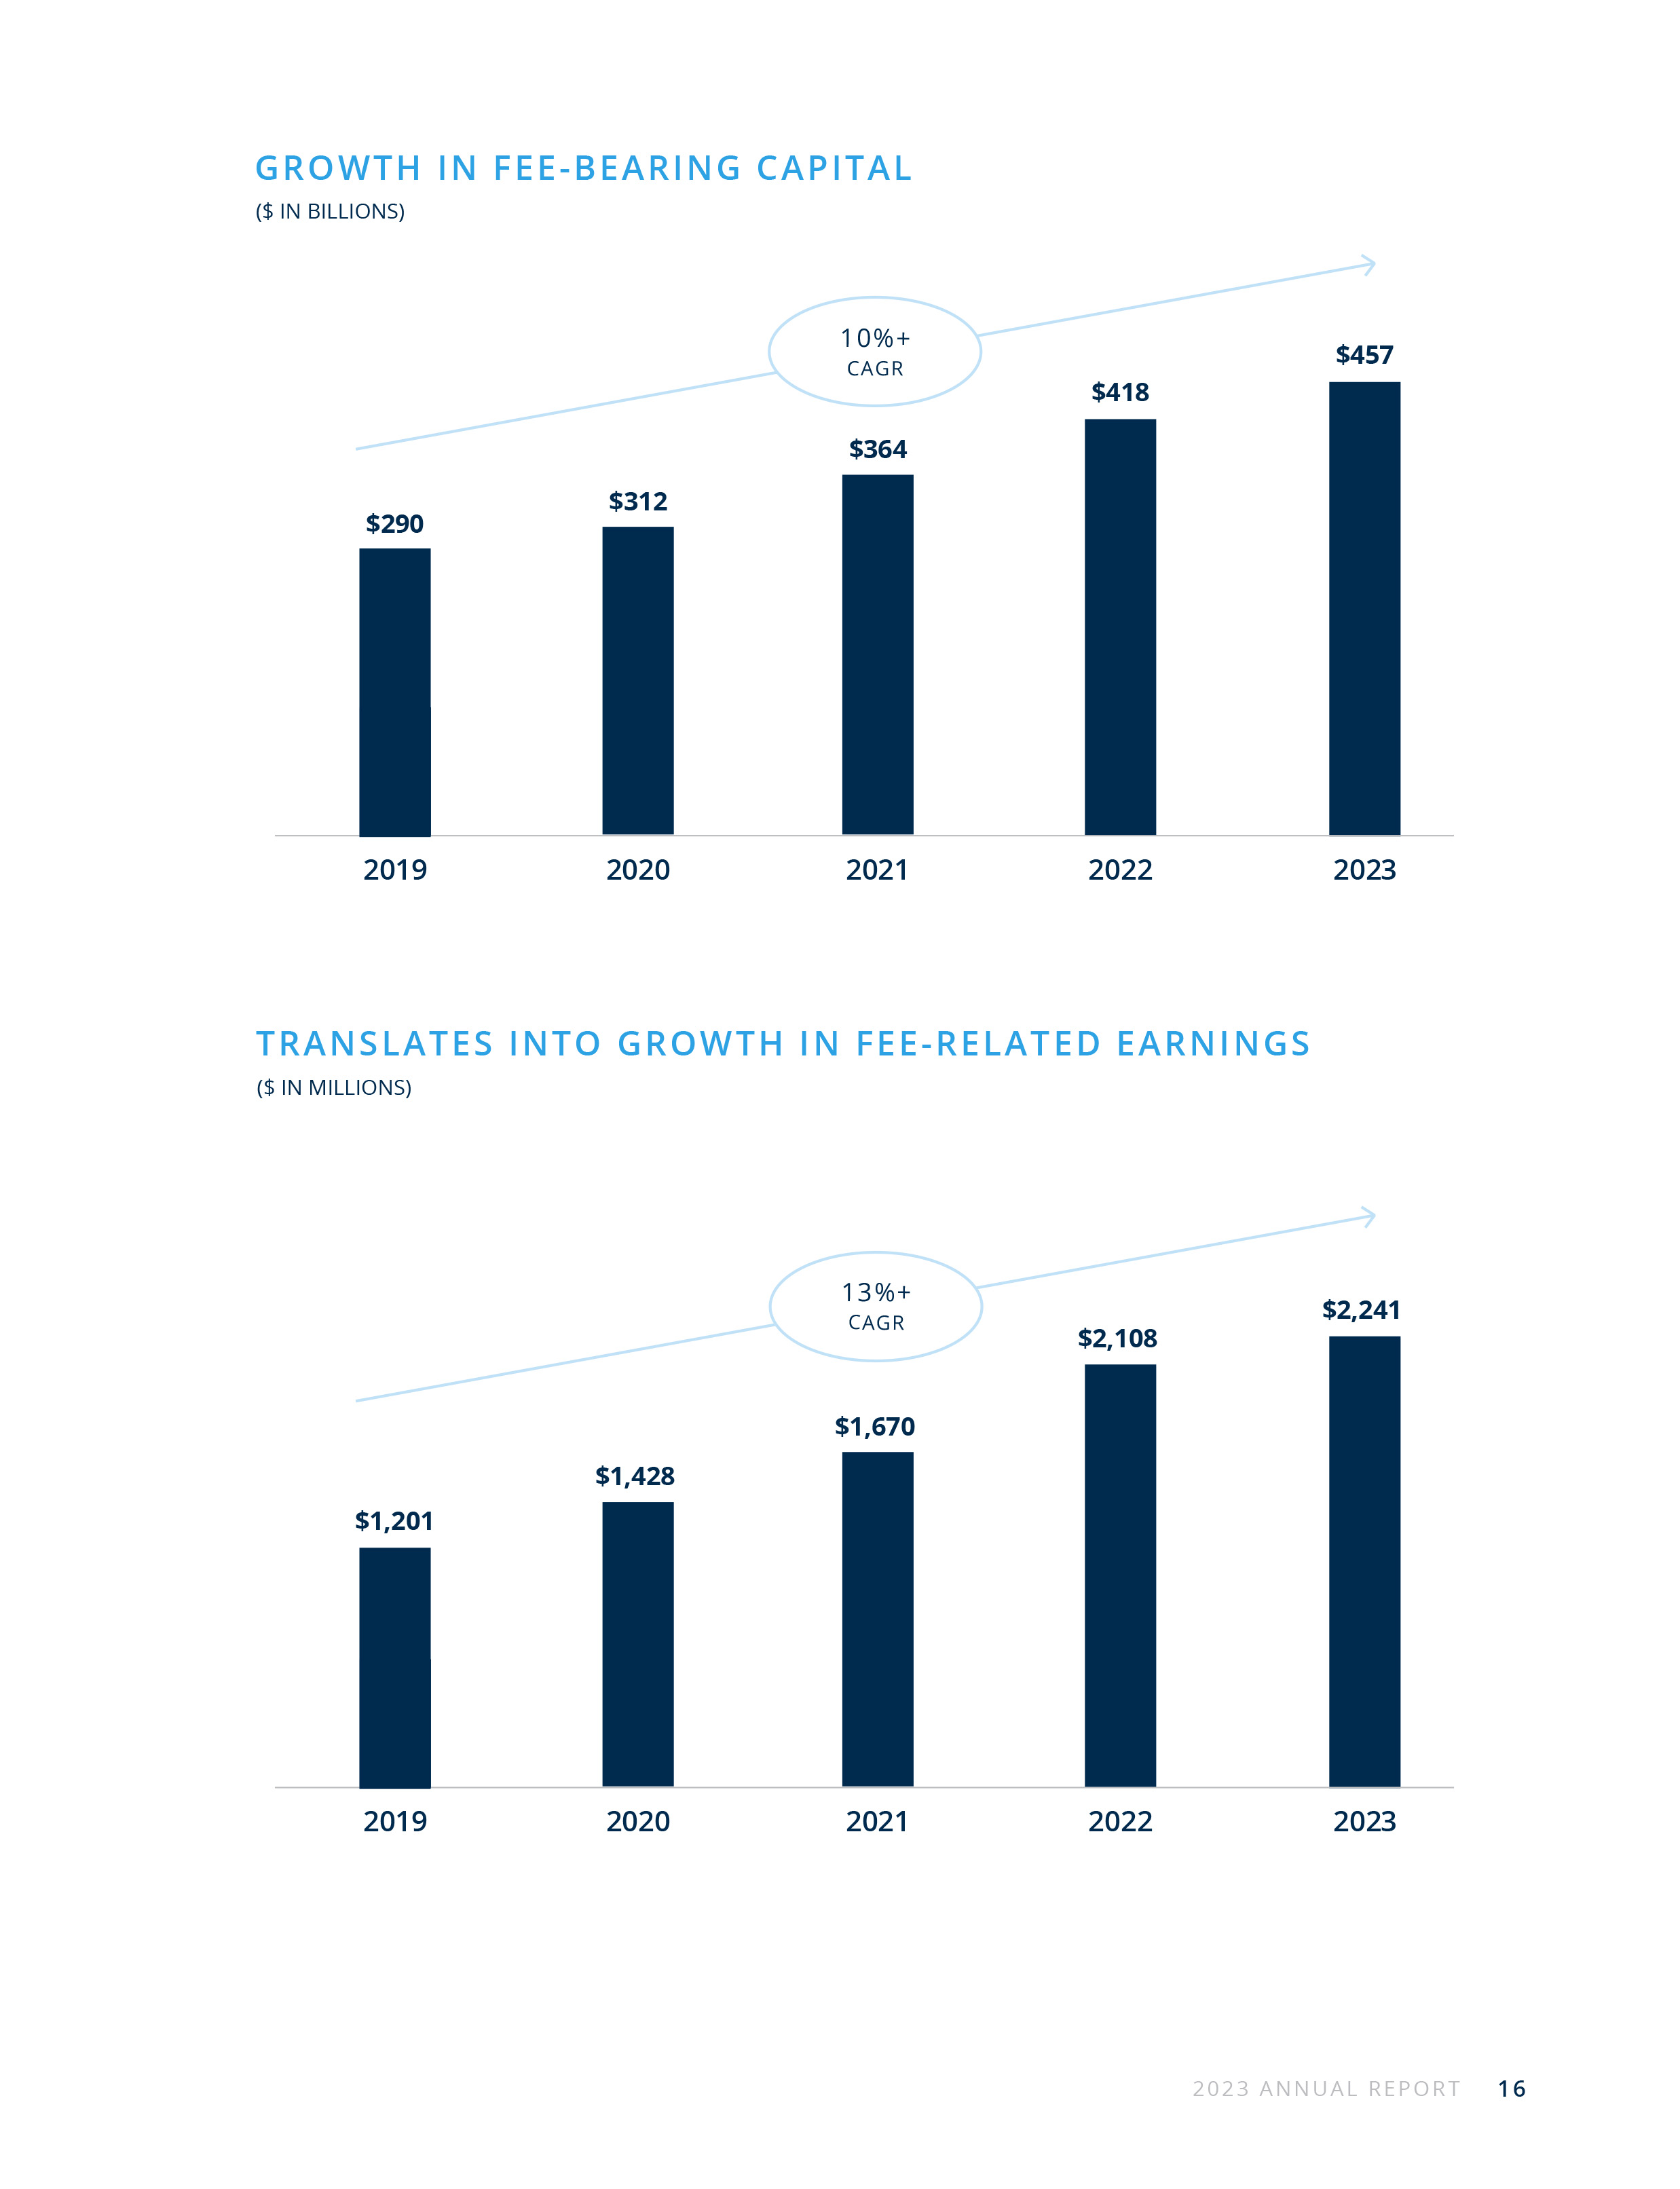
As at December 31, 2023, we had Fee-Bearing Capital of $457 billion, of which 86% is long-dated or perpetual in nature, providing significant stability to our earnings profile. We consider Fee-Bearing Capital that is long-dated or perpetual in nature to be Fee-Bearing Capital relating to our long-term private funds, which are typically committed for 10 years with 2 one-year extension options, and Fee-Bearing Capital relating to our perpetual strategies, which include our permanent capital vehicles as well as capital we manage in our perpetual core and core plus private fund strategies. We seek to increase our Fee-Bearing Capital by growing the size of our existing product offerings and developing new strategies that cater to our clients’ investment needs. We also aim to deepen our existing institutional relationships, develop new institutional relationships, and access new distribution channels such as high net worth individuals and retail.
As of December 31, 2023, we had a diversified client base of over 2,300 clients, which continues to grow. Our private wealth channel also continues to grow and represents over 5% of capital raised. We have a dedicated team of over 100 people that are focused on distributing and developing catered products to the private wealth channel.
We are also actively progressing new growth strategies, including transition, insurance, secondaries, and technology. These new initiatives, in addition to our existing strategies are expected to have a very meaningful impact on our growth trajectory in the long term.
As we grow our Fee-Bearing Capital, we earn incremental base management fees. In order to support this growth, we have been growing our team of investment and asset management professionals. Our costs are predominantly in the form of compensation for the over 2,400 professionals we employ globally.
When deploying our clients’ capital, we seek to leverage our competitive advantages to acquire high-quality real assets and essential service businesses that form the backbone of the global economy. We use our global reach and access to scale capital to source attractive investment opportunities and leverage our deep operating expertise to underwrite investments and create value throughout our ownership. Our goal is to deliver superior investment returns to our clients and successfully doing so should result in the growth of realized carried interest over time.
We generate robust Distributable Earnings, which is our primary financial performance metric. Distributable Earnings of the Manager represent our share of Distributable Earnings from the Asset Management Company less general and administrative expenses, but excluding equity-based compensation costs of the Manager. The Manager intends to pay out approximately 90% of its Distributable Earnings to shareholders quarterly and reinvest the balance back into the business.
We also monitor the broader markets and occasionally identify attractive, strategic investment opportunities that have the potential to supplement our existing business. We expect acquisitions to allow us to achieve immediate scale in a new asset class or grant us access to additional distribution channels.
An example of such growth is the partnership we formed with Oaktree in 2019, which deepened the capabilities we offer our clients and better positions us across market cycles. Such acquisitions may occur from time to time should they be additive to our franchise, attractive to our clients, and accretive to our shareholders.
Competitive Advantages
We seek to harness the following four distinct competitive advantages that enable us to consistently identify and acquire high-quality assets and create significant value in the assets that we invest in and operate on behalf of our clients.
Large Scale
We have $916 billion in assets under management and approximately $457 billion in Fee-Bearing Capital as of December 31, 2023. We offer our investors a large portfolio of private funds that have global mandates and diversified strategies. Our access to large-scale, flexible capital that is further enhanced by our relationship with the Corporation, enables us to pursue transactions of a size that others cannot.
Operating Expertise
We are supported globally by approximately 240,000 operating employees of our managed businesses, who are instrumental in maximizing the value and cash flows of our managed assets. We believe that strong operating experience is essential in maximizing efficiency and productivity – and ultimately, returns. We do this by maintaining a culture of long-term focus, alignment of interest and collaboration through the people we hire, our compensation philosophy, and our operating philosophy. This operating expertise developed through our heritage as an owner-operator is invaluable in underwriting acquisitions and executing value-creating development and capital projects.
Global Reach
We invest on behalf of our clients in more than 30 countries on five continents around the world. We believe that our global reach allows us to diversify and identify a broad range of opportunities. We can invest where capital is scarce, and we believe that our scale enables us to move quickly and pursue multiple opportunities across different markets. Our global reach also allows us to operate our assets more effectively: we believe that a strong on-the-ground presence is critical to operating successfully in many of our markets, and many of our businesses are truly local. Furthermore, the combination of our strong local presence and global reach enables us to bring global relationships and operating practices to bear across markets to enhance returns.
Brookfield Ecosystem
The unique intelligence we generate from the ongoing interconnectivity between our over $900 billion portfolio, our global partnerships and our visibility into global capital flows helps us identify themes and trends in investing, spot pockets of value and source attractive investment opportunities. This competitive advantage has allowed us to build leading positions in assets classes that are most in favor and deliver strong investment returns to our clients across multiple business cycles.
Our People
We have a team of over 2,400 investment and asset management professionals that are integral to the business, including individuals focused on our core investment strategies and those undertaking various corporate activities. Approximately 200 of these are employed by the Manager and the remainder are employed by the Asset Management Company and their subsidiaries. The Manager provides the services of our employees to the Asset Management Company on a cost recovery basis under the Asset Management Services Agreement, which is described in Note 1 of the Consolidated and Combined Financial Statements of the Asset Management Company - "Organization". Our long-term approach to our business influences everything we do, including how we make investment decisions, how we support and oversee our businesses, and how we develop our people and compensate them. Our employee compensation programs link a significant portion of employee rewards to successful investment outcomes. Our emphasis on fostering collaboration enables us to benefit from a diverse set of skills and experiences. Our talent management processes and our approach to long-term compensation encourage collaboration. This shows itself in a number of ways, including in the sharing of expertise and best practices through both formal and informal channels and building relationships and capabilities through employee secondments and transfers.
We have a group of dedicated operations professionals in all our key regions that have extensive experience leading businesses. We take an active role in enhancing the performance of the assets and businesses we acquire. As a result, our operations team is fully integrated – meaning our operations professionals sit alongside our experienced investment team working hand in hand from diligence to the execution of our business plan and through the monetization phase of an investment. The team works closely with the senior management teams of the companies in which we invest to develop and implement business improvements that enable
us to increase cash flow and our return on capital. While enhancement opportunities may differ across assets and businesses, they generally involve a combination of strategic repositioning, focus on operational excellence and enhanced commercial execution.
We recognize that people drive our success, and therefore hiring, developing and retaining our people is one of our top priorities. We do this by ensuring our people are constantly engaged and provide a wide range of development opportunities across all levels. We aim to create an environment that is built on strong relationships and conducive to developing our workforce, and where individuals from diverse backgrounds can thrive.
Investment Process
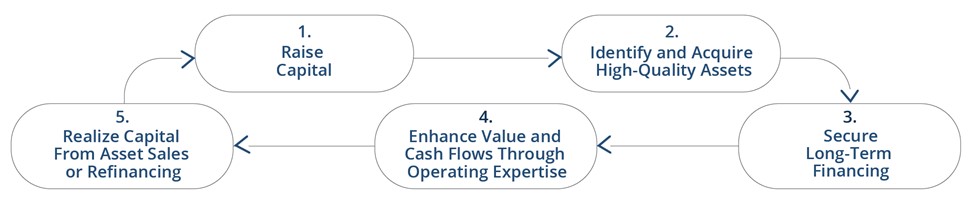
Our Investment Process Leads to Value Creation
Earning robust returns on the investments we make on behalf of our clients enhances our ability to increase our Fee-Bearing Capital and generates carried interest, both of which grow our cash flows and create value for our shareholders.
1. Raise Capital
As an asset manager, the starting point to the investment cycle is establishing new funds and other investment products for our clients. This in turn provides the capital to invest, from which we earn base management fees, incentive distributions and performance-based returns such as carried interest. Accordingly, we create value by increasing our amount of Fee-Bearing Capital and by achieving strong investment performance that leads to growth in Fee-Bearing Capital and increased cash flows.
2. Identify and Acquire High-Quality Assets
We follow a value-based approach to investing and allocating capital. We believe that our disciplined approach, global reach and our operating expertise afford us access to a wide range of potential opportunities and enable us to invest at attractive valuations and generate superior risk-adjusted returns for our clients. We also leverage our considerable expertise in executing recapitalizations, operational turnarounds and large development and capital projects, providing additional opportunities to deploy capital.
3. Secure Long-Term Financing
We finance the investments we make on behalf of our clients predominantly on a long-term investment-grade basis and asset-by-asset, where possible, with minimal recourse. This financing approach provides us with considerable stability, improves our ability to withstand financial downturns and enables our asset management teams to focus on operations and other growth initiatives.
4. Enhance Value and Cash Flows Through Operating Expertise
We use our operating capabilities to increase the value of the assets within our product offerings and the cash flows they produce, and they help to protect our clients’ capital in adverse conditions. The combination of operating expertise, development capabilities and effective financing can help ensure that an investment’s full value creation potential is realized, which we believe is one of our most important competitive advantages.
5. Realize Capital from Asset Sales or Refinancing
We actively monitor opportunities to sell or refinance assets to generate proceeds for our investors. Capital generated in our limited life funds is returned to investors, and in the case of our perpetual funds, we then redeploy the capital to enhance returns. In many cases, returning capital from private funds completes the investment process, locks in investor returns and gives rise to performance income.
Products and Principal Strategies
Our products broadly fall into one of three categories: (i) long-term private funds, (ii) permanent capital vehicles and perpetual strategies, and (iii) liquid strategies. These are invested across five principal strategies: (i) renewable power and transition, (ii) infrastructure, (iii) real estate, (iv) private equity, and (v) credit and other.
Renewable Power and Transition
Overview
•We are a leading global investment manager in renewable power and transition, with $102 billion of AUM as of December 31, 2023.
•Clean energy occupies a uniquely complementary position to the global goals of net-zero emissions, low-cost energy, and energy security. We believe that the growing global demand for low-carbon energy, especially amongst corporate off-takers, will lead to continued growth opportunities for us in the future. The investment environment for renewable power and transition remains favorable and we expect to continue to advance our substantial pipeline of renewable power and transition opportunities on behalf of our clients and managed assets.
•We have approximately 140 investment and asset management professionals globally that are focused on our renewable power and transition strategy, supported by approximately 19,200 operating employees in the renewable power and transition operating businesses that we manage. Our extensive experience and knowledge in this industry enable us to be a leader in all major technologies with deep operating and development capabilities.
Our Products
Long-term Private Funds
•Brookfield Global Transition Fund (“BGTF”) is our flagship transition fund series which is focused on investments aimed at accelerating the global transition to a net-zero carbon economy. The mandate of this product is to assist utility, energy and industrial businesses reduce carbon dioxide emissions, expand low-carbon and renewable energy production levels and advance sustainable solutions.
Permanent Capital Vehicles and Perpetual Strategies
•We also manage Brookfield Renewable Partners L.P. (“BEP”), one of the world’s largest publicly traded renewable power platforms, which is listed on the NYSE and TSX and had a market capitalization of over $17.9 billion as of December 31, 2023.
Across our renewable power and transition products, we have invested on behalf of our clients in:
•Hydroelectric operations, through river systems and facilities that provide electricity and have grid stabilizing capabilities;
•Wind operations that use turbines to create electricity;
•Utility solar operations that harness energy from the sun to generate electricity;
•Distributed energy and storage which provides small-scale generation that can be locally installed, and pump storage facilities; and
•Sustainable solutions including renewable natural gas, carbon capture and storage, recycling, cogeneration biomass, nuclear services, and power transformation.
Infrastructure
Overview
•We are one of the world’s largest investment managers in infrastructure, with $191 billion of AUM as of December 31, 2023.
•We focus on acquiring high-quality businesses on behalf of our clients that deliver essential goods and services, diversified across the utilities, transport, midstream and data infrastructure sectors. We partner closely with management teams to enable long-term success through operational and other improvements.
•We have approximately 240 investment and asset management professionals globally that are focused on our infrastructure strategy, supported by approximately 53,400 operating employees in the infrastructure operating businesses that we manage.
Our Products
Long-term Private Funds
•Brookfield Infrastructure Funds (“BIF”) is our flagship infrastructure fund series. In this product offering, we invest on behalf of our clients in high-quality infrastructure assets on a value basis and seek to add value through the investment life cycle by utilizing our operations-oriented approach.
•Brookfield Infrastructure Debt (“BID”) is our infrastructure debt fund series, which invests on behalf of our clients in mezzanine debt investments in high-quality, core infrastructure assets.
Permanent Capital Vehicles and Perpetual Strategies
•We manage Brookfield Infrastructure Partners L.P. (“BIP”), one of the largest, pure-play, publicly traded global infrastructure platforms, which is listed on the NYSE and TSX and had a market capitalization of $25.6 billion as of December 31, 2023. In this product offering, we invest on behalf of our clients in high-quality, long-life assets that provide essential products and services for the global economy.
•We manage Brookfield Super-Core Infrastructure Partners (“BSIP”), which is our perpetual infrastructure private fund strategy. In this product offering, we invest on behalf of our clients in core infrastructure assets in developed markets, with a focus on yield, diversification, and inflation-protection.
•We also manage Brookfield Infrastructure Income Fund (“BII”), a semi-liquid infrastructure product strategy, offering private wealth investors access to our best-in-class infrastructure platform.
The infrastructure investments that we manage provide a diversified exposure for our clients to scarce, high-quality businesses that benefit from significant barriers to entry and deliver essential goods and services. Through the various products outlined, we have invested in:
•Regulated or contracted businesses that earn a return on asset base, including electricity and gas connections, natural gas pipelines and electricity transmission lines;
•Systems involved in the movement of freight, commodities and passengers, including rail operations, toll roads, terminal and export facilities;
•Assets that handle the movement and storage of commodities from a source of supply to a demand center, including transmission pipelines, natural gas process plants and natural gas storage; and
•Businesses that provide essential services and critical infrastructure to transmit and store data globally, including telecom towers and active rooftop sites, fiber optic cable and data centers.
Real Estate
Overview
•We are one of the world’s largest investment managers in real estate, with over $276 billion of AUM as of December 31, 2023.
•We have invested, on behalf of clients, in iconic properties in the world’s most dynamic markets with the goal of generating stable and growing distributions for our investors while protecting them against downside risk.
•We have approximately 660 investment and asset management professionals that are focused on generating superior returns across our real estate strategies, supported by approximately 29,400 operating employees in the real estate operating businesses that we manage.
Our Products
Long-term Private Funds
•Our opportunistic real estate flagship fund series is Brookfield Strategic Real Estate Partners (“BSREP”). Through this product, we invest globally across various sectors and geographies on behalf of our clients in high-quality real estate with a focus on large, complex, distressed assets, turnarounds, and recapitalizations.
•Our commercial real estate debt fund series, Brookfield Real Estate Finance Fund (“BREF”), targets investments in transactions, predominantly in the U.S., that are senior to traditional equity and subordinate to first mortgages or investment-grade corporate debt.
•We also manage a real estate secondaries strategy, Brookfield Real Estate Secondaries (“BRES”), with a focus on providing liquidity solutions for other real estate general partners.
Permanent Capital Vehicles and Perpetual Strategies
•We manage $18 billion of Fee-Bearing Capital in Brookfield Property Group (“BPG”) as of December 31, 2023, which we invest, on behalf of the Corporation, directly in real estate assets or through our real estate private fund offerings. BPG owns, operates, and develops iconic properties in the world’s most dynamic markets with a global portfolio of office, retail, multifamily, logistics, hospitality, land and housing, triple net lease, manufactured housing, and student housing assets on five continents.
•We also manage capital in our perpetual private fund real estate strategy, Brookfield Premier Real Estate Partners (“BPREP”). This is a core plus strategy that invests in high-quality, stabilized real assets located primarily in the U.S. with a focus on office, retail, multifamily and logistics real estate assets. We also have two regional BPREP strategies that are dedicated specifically to investments in Australia (“BPREP-A”) and Europe (“BPREP-E”).
•We manage capital across our perpetual real estate debt strategy, Brookfield Senior Mezzanine Real Estate Finance Fund (“BSREF”). We seek to originate, acquire, and actively manage investments in U.S. senior commercial real estate debt for this strategy.
•We also manage a non-traded REIT, Brookfield Real Estate Income Trust (“Brookfield REIT”), which is a semi-liquid strategy catering specifically to the private wealth channel. This product invests in high quality income-producing opportunities globally through equity or real estate-related debt.
Through the various products outlined, we have invested in multiple asset classes including:
•Office properties in key gateway cities in the U.S., Canada, the U.K., Germany, Australia, Brazil and India;
•High-quality retail destinations that are central gathering places for the communities they serve, combining shopping, dining, entertainment and other activities;
•Full-service hotels and leisure-style hospitality assets in high-barrier markets across North America, the U.K. and Australia; and
•High-quality assets with operational upside across multifamily, alternative living, life sciences and logistics sectors globally.
Private Equity
Overview
•We are a leading private equity investment manager with $130 billion of AUM as of December 31, 2023.
•We focus on high-quality businesses that provide essential products and services, diversified across business services and industrials sectors. We partner closely with management teams to enable long-term success through operational and other improvements.
•We have approximately 280 investment and asset management professionals globally that are focused on our private equity strategy, supported by approximately 133,700 operating employees in the operating businesses that we manage.
Our Products
Long-term Private Funds
•Our global opportunistic flagship fund series, Brookfield Capital Partners (“BCP”), is our leading private equity offering. The series of funds focuses on owning and operating operations that benefit from a strong competitive position, with high barriers to entry that provide essential products and services. We seek to build value through enhancing the cash flows of our businesses by improving strategy and execution and opportunistically recycling capital generated from operations and dispositions.
•Our special investments strategy, Brookfield Special Investments (“BSI”), is focused on structured, large-scale, non-control investments. This product capitalizes on transactions that do not fit our traditional control-oriented flagship private equity fund series. Transactions may include recapitalizations or strategic growth capital where we expect to generate equity-like returns while ensuring downside protection through contracted returns.
•Our growth equity strategy, Brookfield Growth (“BTG”), focuses on investing in technology-related growth stage companies that surround our broader ecosystem of managed assets.
•Our secondaries strategy, Brookfield Sponsor Solutions (“BSS”), provides bespoke capital solutions to sponsor-backed companies at an inflection point of growth.
Permanent Capital Vehicles and Perpetual Strategies
•We manage Brookfield Business Partners L.P. (“BBU”), which is a publicly traded global business services and industrials company focused on owning and operating high-quality providers of essential products and services. BBU is listed on the NYSE and TSX and had a market capitalization of $4.7 billion as at December 31, 2023.
Our private equity vehicles acquire high-quality operations globally. The broad investment mandate provides us with the flexibility to invest on behalf of our clients across multiple industries through many forms. Through the various products outlined above, we have invested on behalf of our clients in:
•Leading service providers to large-scale infrastructure assets, including a leading provider of work access services, modular building leasing services and a leading global provider of lottery services and technology solutions;
•Operationally intense industrial businesses that benefit from a strong competitive position, including a leading global provider of advanced automotive battery technology, a leading private water and wastewater services company in Brazil, and a leading manufacturer of engineered components for industrial trailers and other towable equipment providers, among others; and
•Essential services providers, including the largest private sector residential mortgage insurer in Canada and a leading provider of software and technology services to automotive dealers.
Credit and Other
Overview
•As a result of our partnership with Oaktree in 2019, we established ourselves as a leader among global investment managers specializing in alternative credit investments. As of December 31, 2023, our ownership interest in Oaktree is approximately 68%. Oaktree is one of the premier credit franchises globally and an expert in investing across the capital structure with an emphasis on an opportunistic, value-oriented, and risk-controlled approach to investing.
•We provide one of the most comprehensive alternative credit offerings available today, with $164 billion of Fee-Bearing Capital as of December 31, 2023, and an experienced team of investment professionals around the world.
Our Products
•Our credit strategies invest in both liquid and illiquid instruments, sourced directly from borrowers and via public markets. We focus primarily on rated and non-rated debt of sub-investment grade issuers in developed and emerging markets, and we invest in an array of private credit, high yield bonds, convertible securities, leveraged loans, structured credit instruments, and opportunistic credit.
•The flagship credit strategy, Global Opportunities, seeks to generate current income and long-term capital appreciation by investing in private loans to large private-equity-owned companies by focusing on protecting against loss by buying claims on assets at bargain prices. We aim to achieve substantial gains by actively participating in restructurings to restore companies to financial viability and creating value at every stage of the investment process.
•The recently launched credit strategy, Oaktree Lending Partners (“OLP”), seeks to generate current income and long-term capital appreciation by investing in private loans to large private-equity-owned companies in the U.S. We aim to build a diverse portfolio of first-lien secured loans to mature, buyout, and late-stage (primarily for life sciences businesses) companies across industries.
•Included in our other strategies is our Insurance Solutions Business, a leading capital solutions business providing insurance and reinsurance services to individuals and institutions. This business manages policy capital and deploys it across liquid credit strategies, direct loans, and private funds.
•Also included amongst our strategies is our Public Securities Group (“PSG”), which manages the Fee-Bearing Capital associated with our liquid strategies. PSG serves institutions and individuals seeking the investment advantages of real assets through actively managed listed equity and debt strategies.
PART 2
REVIEW OF FINANCIAL RESULTS
Income Statement Analysis
Consolidated Statement of Comprehensive Income
The following table summarizes the financial results of the Manager for the year ended December 31, 2023 and the period from July 4, 2022 to December 31, 2022:
|
|
|
|
|
|
|
|
|
|
|
|
|
|
|
|
|
|
|
|
|
FOR THE YEAR ENDED DECEMBER 31, 2023 AND FOR THE PERIOD JULY 4, 2022 TO DECEMBER 31, 2022
(MILLIONS)
|
|
|
2023 |
|
2022 |
| Operating recoveries |
|
|
$ |
383 |
|
|
$ |
37 |
|
|
|
|
|
|
|
| Expenses |
|
|
|
|
|
| Compensation and benefits |
|
|
(326) |
|
|
(1) |
|
| Other operating expense |
|
|
(5) |
|
|
(35) |
|
| Carried interest allocation compensation |
|
|
|
|
|
| Realized |
|
|
(24) |
|
|
— |
|
| Unrealized |
|
|
(38) |
|
|
(3) |
|
| Total carried interest allocation compensation |
|
|
(62) |
|
|
(3) |
|
| Interest expense |
|
|
(9) |
|
|
— |
|
| Total expenses |
|
|
(402) |
|
|
(39) |
|
| Share of income from Brookfield Asset Management ULC |
|
|
470 |
|
|
21 |
|
|
|
|
|
|
|
|
|
|
|
|
|
|
|
|
|
|
|
|
|
|
|
|
|
| Net income |
|
|
$ |
451 |
|
|
$ |
19 |
|
For the year ended December 31, 2023
During the year ended December 31, 2023, the Manager recorded net income of $451 million. Net income consists of the Manager’s equity interest in the earnings of the Asset Management Company and compensation and benefit costs, primarily attributable to executive compensation costs of the Manager and unrealized carried interest compensation expense. A material portion of these costs are reimbursed by the Corporation and the Asset Management Company in accordance with the Relationship Agreement and the Asset Management Services Agreement. Refer to the following discussion for details on the earnings of the Asset Management Company.
For the period from July 4, 2022 to December 31, 2022
During the period ended December 31, 2022, the Manager recorded net income of $19 million, driven mostly by the Manager's equity interest in the earnings of the Asset Management Company offset by compensation and benefit costs. A material portion of these costs are reimbursed by the Corporation and the asset management business in accordance with the Asset Management Services Agreement and the Relationship Agreement. Refer to the following discussion for details on the earnings of the Asset Management Company.
Consolidated and Combined Statement of Operations
The following table summarizes the Consolidated and Combined Statement Of Operations for BAM ULC for the years ended December 31, 2023 and 2022:
|
|
|
|
|
|
|
|
|
|
|
|
|
|
|
|
|
|
|
|
|
|
|
|
|
FOR THE YEARS ENDED DECEMBER 31,
(MILLIONS)
|
|
|
|
|
2023 |
|
2022 |
|
|
| Revenues |
|
|
|
|
|
|
|
|
|
|
|
|
|
|
|
|
|
|
|
| Base management and advisory fees |
|
|
|
|
$ |
3,142 |
|
|
$ |
2,835 |
|
|
|
|
|
|
|
|
|
|
|
|
|
|
|
|
|
|
|
|
|
|
|
| Investment income |
|
|
|
|
|
|
|
|
|
| Carried interest allocations |
|
|
|
|
|
|
|
|
|
| Realized |
|
|
|
|
51 |
|
|
241 |
|
|
|
| Unrealized |
|
|
|
|
348 |
|
|
249 |
|
|
|
| Total investment income |
|
|
|
|
399 |
|
|
490 |
|
|
|
| Interest and dividend revenue |
|
|
|
|
172 |
|
|
258 |
|
|
|
Other revenues |
|
|
|
|
349 |
|
|
44 |
|
|
|
| Total revenues |
|
|
|
|
4,062 |
|
|
3,627 |
|
|
|
| Expenses |
|
|
|
|
|
|
|
|
|
| Compensation, operating, and general and administrative expenses |
|
|
|
|
|
|
|
|
|
| Compensation and benefits |
|
|
|
|
(1,048) |
|
|
(700) |
|
|
|
| Other operating expenses |
|
|
|
|
(342) |
|
|
(236) |
|
|
|
| General, administrative and other |
|
|
|
|
(56) |
|
|
(81) |
|
|
|
| Total compensation, operating, and general and administrative expenses |
|
|
|
|
(1,446) |
|
|
(1,017) |
|
|
|
| Carried interest allocation compensation |
|
|
|
|
|
|
|
|
|
| Realized |
|
|
|
|
(26) |
|
|
(61) |
|
|
|
| Unrealized |
|
|
|
|
(60) |
|
|
(139) |
|
|
|
| Total carried interest allocation compensation |
|
|
|
|
(86) |
|
|
(200) |
|
|
|
| Interest expense |
|
|
|
|
(14) |
|
|
(154) |
|
|
|
| Total expenses |
|
|
|
|
(1,546) |
|
|
(1,371) |
|
|
|
| Other (expenses) income, net |
|
|
|
|
(129) |
|
|
1,090 |
|
|
|
| Share of income from equity accounted investments |
|
|
|
|
167 |
|
|
146 |
|
|
|
| Income before taxes |
|
|
|
|
2,554 |
|
|
3,492 |
|
|
|
| Income tax expense |
|
|
|
|
(417) |
|
|
(627) |
|
|
|
| Net income |
|
|
|
|
2,137 |
|
|
2,865 |
|
|
|
| Net (income) attributable to: |
|
|
|
|
|
|
|
|
|
| Redeemable non-controlling interests in consolidated funds |
|
|
|
|
— |
|
|
(909) |
|
|
|
| Preferred shares redeemable non-controlling interest |
|
|
|
|
(262) |
|
|
(35) |
|
|
|
| Non-controlling interest |
|
|
|
|
(36) |
|
|
(6) |
|
|
|
| Net income attributable to the common stockholders |
|
|
|
|
$ |
1,839 |
|
|
$ |
1,915 |
|
|
|
For the years ended December 31, 2023 and 2022
Net income for the year ended December 31, 2023 was $2.1 billion, of which $1.8 billion was attributable to common stockholders. This compares to net income of $2.9 billion for the year ended December 31, 2022, of which $1.9 billion was attributable to common stockholders.
Revenues
Revenues for the year ended December 31, 2023 were $4.1 billion, which represents an increase of $435 million or 12% compared to $3.6 billion of revenue for the year ended December 31, 2022.
Base Management and Advisory Fees
Base management and advisory fees, excluding incentive distributions, for the year ended December 31, 2023 were $2.8 billion, which represents an increase of $266 million or 11% compared to the year ended December 31, 2022. The increase was predominantly driven by incremental contributions from capital raised for our latest flagship funds and capital deployed across our complementary strategies. Incentive distributions for the year ended December 31, 2023, were $376 million, an increase of $41 million or 12% from the year ended December 31, 2022, driven by growth in BIP and BEP's dividends of 6% and 5%, respectively.
Carried Interest Allocations
Realized carried interest allocations were $51 million for the year ended December 31, 2023, which represents a decrease of $190 million compared to the year ended December 31, 2022. Realized carried interest allocations in the year were primarily driven by dispositions within our real estate flagship funds. Realized carried interest allocations of $241 million for the year ended December 31, 2022 were primarily driven by realizations within our real estate long-term and perpetual funds, as well as a realization within our infrastructure business.
Unrealized carried interest allocations were $348 million for the year ended December 31, 2023, which represents an increase of $99 million compared to the year ended December 31, 2022. The unrealized carried interest allocations were primarily related to growth in valuations in our private equity, real estate and transition flagship funds, partially offset by realizations in the year.
Unrealized carried interest allocations attributable to the asset management business, which represents unrealized carried interest on new funds, was $167 million for the year ended December 31, 2023, compared to $124 million for the year ended December 31, 2022. The Asset Management Company is entitled to 66.67% of unrealized carried interest on new funds with the remaining 33.33% interest attributable to the Corporation.
Interest and Dividend Revenue
Interest and dividend revenue for the year ended December 31, 2023 were $172 million, which represents a decrease of $86 million compared to the year ended December 31, 2022. The decrease was a result of the transfer of certain investments and loans of the asset management business to the Corporation as part of the Arrangement. Prior year interest and dividend income was earned from legacy investments and interest bearing loans with affiliates.
Other Revenues
Other revenues were $349 million for the year ended December 31, 2023, an increase of $305 million compared to the year ended December 31, 2023. The increase is due to amounts recoverable from the Corporation associated with share and performance based compensation as defined by the Relationship Agreement.
Expenses
Total expenses for the year ended December 31, 2023 were $1.5 billion, an increase of $175 million or 13% compared to the year ended December 31, 2022.
Compensation and Benefits
Compensation and benefits for the year ended December 31, 2023 were $1.0 billion, which represents an increase of $348 million compared to the year ended December 31, 2022. This is primarily attributable to increased compensation costs resulting from the ongoing growth of our asset management business and mark-to-market increases of liability based awards.
Other Operating Expenses
Other operating expenses are comprised of professional fees, facilities costs, as well as costs directly associated with our fundraising and investment functions. Other operating expenses were $342 million for the year ended December 31, 2023, compared to $236 million for the year ended December 31, 2022. The increase was primarily attributable to the growth in our business relative to the prior year.
Carried Interest Allocation Compensation
Compensation expenses related to carried interest allocation compensation were $86 million for the year ended December 31, 2023, which represents a decrease of $114 million compared to the year ended December 31, 2022. This is predominantly driven by lower relative valuation gains compared to the year ended December 31, 2022 across certain of our funds. As outlined in the Relationship Agreement, the carried interest compensation expense associated with mature funds is fully recoverable from the Corporation. Carried interest compensation expense on new funds was $2 million on a net basis.
Other (Expenses) Income, net
Other (expenses) income, net for the year ended December 31, 2023, primarily consists of mark-to-market movements on our investment in BSREP III and mark-to-market adjustments on call and put options to acquire an additional interest in Oaktree and Primary Wave in the future. BSREP III mark-to-market movements and dividend distributions during 2023 are not attributable to the Asset Management Company on a net basis. The Asset Management Company also recorded impairment charges associated with intangible assets and goodwill of $30 million related to legacy acquisitions, and transaction costs related to the spin-off of the asset management business. Other income in the prior year relates to dividend income received from BSREP III.
Share of Income from Equity Accounted Investments
Our share of income from equity accounted investments was $167 million compared to $146 million in the prior year, or an increase of 14%. This is predominantly our share of income from our investment in Oaktree, primarily driven by unrealized carried interest generated during the year.
Income Tax Expense
Income tax expense was $417 million for the year ended December 31, 2023, which represents a decrease of $210 million compared to the year ended December 31, 2022. This decrease was driven by lower taxable income relative to prior year.
Net (Income) Attributable to Preferred Share Redeemable Non-Controlling Interest
Net (income) attributable to preferred redeemable non-controlling interest was $262 million for the year ended December 31, 2023. This balance primarily represents the movement in carried interest net of carried interest allocation expense and taxes associated with mature funds owing to the Corporation.
Net (Income) Attributable to Non-Controlling Interest
Net (income) attributable to non-controlling interest was $36 million for the year ended December 31, 2023. This balance is primarily the carried interest generated on new funds that is attributable to the Corporation.
Balance Sheet Analysis
Consolidated Balance Sheets
The following table summarizes the Consolidated Balance Sheets of the Manager as at December 31, 2023 and December 31, 2022:
|
|
|
|
|
|
|
|
|
|
|
|
|
AS AT DECEMBER 31,
(MILLIONS)
|
2023 |
|
2022 |
| Assets |
|
|
|
| Cash and cash equivalents |
$ |
9 |
|
|
$ |
1 |
|
|
|
|
|
| Due from affiliates |
886 |
|
|
782 |
|
| Other assets |
40 |
|
|
— |
|
| Investment in Brookfield Asset Management ULC |
2,270 |
|
|
2,378 |
|
|
|
|
|
| Total assets |
$ |
3,205 |
|
|
$ |
3,161 |
|
|
|
|
|
| Liabilities |
|
|
|
| Accounts payable and accrued liabilities |
$ |
859 |
|
|
$ |
781 |
|
| Due to affiliates |
261 |
|
|
3 |
|
| Total liabilities |
1,120 |
|
|
784 |
|
| Equity |
|
|
|
|
|
|
|
| Common Stock: |
|
|
|
Class A (unlimited authorized and 413,026,253 issued and 388,733,466 outstanding) |
2,354 |
|
|
2,410 |
|
Class B (unlimited authorized and 21,280 issued and outstanding) |
— |
|
|
— |
|
Class A held in treasury (24,292,787 shares) |
(649) |
|
|
(330) |
|
| Additional paid-in-capital |
403 |
|
|
278 |
|
| Retained (deficit) earnings |
(35) |
|
|
19 |
|
| Accumulated other comprehensive income |
3 |
|
|
— |
|
| Total common equity |
2,076 |
|
|
2,377 |
|
| Non-controlling interest |
9 |
|
|
— |
|
| Total equity |
2,085 |
|
|
2,377 |
|
| Total liabilities, non-controlling interest and equity |
$ |
3,205 |
|
|
$ |
3,161 |
|
As at December 31, 2023 and December 31, 2022
As at December 31, 2023, the Manager’s total assets were $3.2 billion. Total assets consist primarily of the 25% interest in the Asset Management Company and reimbursements due from affiliates related to long-term executive compensation programs of the Manager.
As at December 31, 2023, the Manager’s total liabilities were $1.1 billion, an increase of $336 million compared to the prior year, driven by an increase in due to affiliates of $258 million primarily due to draws on the Manager credit facility with the Asset Management Company to fund share repurchases.
As at December 31, 2023, the Manager's total equity was $2.1 billion, which decreased by $292 million compared to the prior year due to share buybacks and distributions in the year, partially offset by increases in additional paid-in-capital related to stock based compensation plans.
Consolidated and Combined Balance Sheets
The following table is the BAM ULC Consolidated and Combined Balance Sheets as at December 31, 2023 and December 31, 2022:
|
|
|
|
|
|
|
|
|
|
|
|
AS AT DECEMBER 31,
(MILLIONS) |
2023 |
|
2022 |
| Assets |
|
|
|
| Cash and cash equivalents |
$ |
2,667 |
|
|
$ |
3,545 |
|
| Accounts receivable and other |
588 |
|
|
429 |
|
| Due from affiliates |
2,504 |
|
|
2,121 |
|
| Investments |
7,522 |
|
|
6,877 |
|
| Property, plant and equipment |
73 |
|
|
68 |
|
| Intangible assets |
42 |
|
|
59 |
|
| Goodwill |
251 |
|
|
249 |
|
| Deferred income tax assets |
643 |
|
|
739 |
|
| Total assets |
$ |
14,290 |
|
|
$ |
14,087 |
|
|
|
|
|
| Liabilities |
|
|
|
| Accounts payable and other |
$ |
1,799 |
|
|
$ |
1,842 |
|
| Due to affiliates |
986 |
|
|
811 |
|
| Deferred income tax liabilities |
40 |
|
|
17 |
| Total liabilities |
2,825 |
|
|
2,670 |
|
|
|
|
|
| Preferred shares redeemable non-controlling interest |
2,166 |
|
|
1,811 |
|
|
|
|
|
| Equity |
|
|
|
| Common equity (common shares - unlimited authorized, 1,635,349,629 issued and outstanding) |
9,014 |
|
|
9,271 |
|
| Retained (deficit) earnings |
(178) |
|
|
84 |
|
| Accumulated other comprehensive income |
168 |
|
|
153 |
|
| Additional paid-in capital |
122 |
|
|
— |
|
| Total common equity |
9,126 |
|
|
9,508 |
|
| Non-controlling interest |
173 |
|
|
98 |
|
| Total equity |
9,299 |
|
|
9,606 |
|
| Total liabilities, redeemable non-controlling interest and equity |
$ |
14,290 |
|
|
$ |
14,087 |
|
As at December 31, 2023 and December 31, 2022
Assets
Total assets were $14.3 billion as at December 31, 2023, an increase of $203 million or 1% compared to December 31, 2022 due to increases in investments and due from affiliates, partially offset by a decrease in cash and cash equivalents and deferred income tax assets.
Cash and Cash Equivalents
Cash and cash equivalents were $2.7 billion, a decrease of $878 million or 25% from the prior year. This decrease is largely due to the acquisition of our incremental 4% ownership interest in Oaktree, temporary working capital provided to our managed funds, interest bearing loans to affiliates and the Manager, and the settlements of amounts owing to affiliates. Of this balance, $2.5 billion is on deposit with the Corporation.
Accounts Receivable and Other
Accounts receivable and other of $588 million primarily consists of receivables from third parties and prepaid expenses. The increase of $159 million or 37% over the prior year is largely driven by the prepayments of stock based compensation costs to the Manager in accordance with the Asset Management Services Agreement.
Due from Affiliates
Due from affiliates of $2.5 billion primarily relates to management fees earned but not collected from our managed funds, as well as reimbursements due from the Corporation for long-term compensation awards. The increase of $383 million or 18% from the prior year was primarily the result of the timing of settlements, higher recharges associated with long-term compensation awards, draws on the Manager credit facility, and other interest bearing related party loans.
Investments
Investments are predominantly comprised of our 16% limited partnership interest in BSREP III and an approximate 68% ownership interest in Oaktree. The increase from the prior year of $645 million or 9% was primarily a result of income earned from our investment in Oaktree as well as the increase in our ownership interest in Oaktree from approximately 64% to approximately 68% during the year.
Liabilities
Total liabilities were $2.8 billion as at December 31, 2023, an increase of $155 million or 6% compared to the prior year.
Accounts Payable and Other
Accounts payable and other primarily consists of accrued bonus compensation, performance and cash settled share based compensation, and the mark-to-market of derivatives associated with put options on certain of our investments. The increase in 2023 of $43 million reflects the timing of payments and movements in the mark-to-market of put options to acquire additional interests in Oaktree and Primary Wave in the future.
Due to Affiliates
Due to affiliates of $986 million reflects amounts owed to affiliates. The increase of $175 million or 22% relative to the prior year was the result of higher borrowings on our credit facility with the Corporation and reflects the timing of payments in the normal course of operations.
Preferred Shares Redeemable Non-Controlling Interest
Preferred shares redeemable non-controlling interest was $2.2 billion as at December 31, 2023, an increase of $355 million or 20% compared to $1.8 billion as at December 31, 2022. This increase was due to carried interest generated on mature funds during the year.
Non-Controlling Interest
Non-controlling interest was $173 million as at December 31, 2023, an increase of $75 million compared to $98 million as at December 31, 2022. This increase was primarily due to carried interest generated by new funds that is owed to the Corporation and other non-controlling interests associated with various entities within the asset management business.
Cash Flow Statement Analysis
Review of Consolidated Statement of Cash Flows
The following table summarizes the changes in the Manager’s cash for the year ended December 31, 2023 and the period from July 4, 2022 to December 31, 2022:
|
|
|
|
|
|
|
|
|
|
|
|
|
|
|
|
|
|
|
|
FOR THE YEAR ENDED DECEMBER 31, 2023 AND FOR THE PERIOD JULY 4, 2022 TO DECEMBER 31, 2022
(MILLIONS) |
|
|
2023 |
|
2022 |
|
|
|
|
|
|
|
|
|
|
|
|
|
|
|
|
|
|
| Operating activities |
|
|
$ |
508 |
|
|
$ |
(2) |
|
| Investing activities |
|
|
(41) |
|
|
— |
|
| Financing activities |
|
|
(459) |
|
|
3 |
|
| Change in cash and cash equivalents |
|
|
$ |
8 |
|
|
$ |
1 |
|
For the year ended December 31, 2023 and period ended December 31, 2022
During the year, the Manager's operating activities generated positive cashflows of $508 million primarily attributable to the share of income driven from its investment in the Asset Management Company. During the period ended December 31, 2022, the Manager's operating cash outflows were $2 million.
Net cash outflows from investing activities totaled $41 million, primarily reflecting the purchase of an option to acquire additional shares of the Asset Management Company.
Net cash outflows from financing activities totaled $459 million, primarily attributed to the distributions paid to the Manager's shareholders and share buybacks. These outflows were partially offset by cash drawn on the credit facility between the Manager and the Asset Management Company.
During the period ended December 31, 2022, net cash inflows from financing activities totaled $3 million, primarily attributed to movements of loan balances from an affiliate of the Corporation as a result of the Arrangement and share subscriptions of the Corporation. These inflows were partially offset by share repurchases.
Review of Consolidated and Combined Statement of Cash Flows
Refer to the following table that summarizes the Consolidated and Combined Statement of Cash Flows for our asset management business for the years ended December 31, 2023 and 2022:
|
|
|
|
|
|
|
|
|
|
|
|
|
|
|
|
|
|
|
|
|
|
|
|
FOR THE YEARS ENDED DECEMBER 31,
(MILLIONS) |
|
|
|
|
2023 |
|
2022 |
|
|
|
|
|
|
|
|
|
|
|
|
|
|
|
|
|
|
|
|
|
|
|
|
|
|
|
|
|
|
|
|
| Operating activities |
|
|
|
|
$ |
1,439 |
|
|
$ |
(374) |
|
|
|
| Investing activities |
|
|
|
|
(475) |
|
|
1,706 |
|
|
|
| Financing activities |
|
|
|
|
(1,842) |
|
|
(280) |
|
|
|
| Change in cash and cash equivalents |
|
|
|
|
$ |
(878) |
|
|
$ |
1,052 |
|
|
|
For the years ended December 31, 2023 and 2022
During the year, the Company's operating activities generated positive cashflows of $1.4 billion, compared to cash outflows of $374 million in the prior year. Excluding the net change in working capital and other non-cash operating items, operating cash inflows were $2.1 billion, representing an increase of $76 million or 4% compared to the prior year, primarily driven by the impact of the Arrangement.
Investing Activities
Net cash outflows from investing activities totaled $475 million, compared to inflows of $1.7 billion in the prior year. The current year investing activity primarily consists of the purchase of the incremental 4% ownership interest in Oaktree and advances provided to the Manager on its credit facility. The prior year investing activity inflow was predominantly driven by the disposition of financial assets as part of the Arrangement.
Financing Activities
Net cash outflows from financing activities totaled $1.8 billion, compared to outflows of $280 million in the prior year. The current year primarily consists of distributions to shareholders of $2.1 billion, partially offset by borrowings from related parties of $197 million. The prior year outflows were primarily as a result of distributions to parent, distributions to redeemable non-controlling interests and capital borrowings, partially offset by inflows from contributions from the parent.
Summary of Quarterly Results
Summary of Quarterly Results for the Manager
The quarterly variances in operating recoveries since July 4, 2022 are due primarily to related party recharges to the Asset Management Company and the Corporation for executive compensation costs of the Manager and performance based compensation expense. The operating recoveries associated with our Deferred Share Unit ("DSU") and Restricted Share Unit ("RSU") plans, which are recorded at fair value being the market value of the Class A shares of the Corporation and the Manager as at the period then ended, may fluctuate materially on a quarterly basis. These recharges are reimbursements by the Corporation and the Asset Management Company of costs incurred associated with these liability based awards in accordance with the Relationship Agreement and the Asset Management Services Agreement, respectively. Variances in net income relate primarily to our equity interest in the earnings of the Asset Management Company.
Our consolidated statement of comprehensive income for the five most recent quarters are as follows:
|
|
|
|
|
|
|
|
|
|
|
|
|
|
|
|
|
|
|
|
|
|
|
|
|
|
|
|
|
|
|
|
|
|
|
|
|
|
|
FOR THE PERIODS ENDED
(MILLIONS, EXCEPT PER SHARE AMOUNTS) |
|
2023 |
|
2022 |
|
Q4 |
|
Q3 |
|
Q2 |
|
Q1 |
|
Q4 |
|
|
|
|
|
|
Operating recoveries |
|
$ |
160 |
|
|
$ |
38 |
|
|
$ |
47 |
|
|
$ |
138 |
|
|
$ |
37 |
|
|
|
|
|
|
|
|
|
|
|
|
|
|
|
|
|
|
|
|
|
|
|
|
|
|
|
|
|
|
|
|
|
|
|
|
|
|
|
|
|
| Net income |
|
95 |
|
|
122 |
|
|
109 |
|
|
125 |
|
|
19 |
|
|
|
|
|
|
|
| Earnings per share |
|
|
|
|
|
|
|
|
|
|
|
|
|
|
|
|
| – basic |
|
0.24 |
|
|
0.31 |
|
|
0.28 |
|
|
0.31 |
|
|
0.05 |
|
|
|
|
|
|
|
| – diluted |
|
0.24 |
|
|
0.31 |
|
|
0.28 |
|
|
0.31 |
|
|
0.05 |
|
|
|
|
|
|
|
Over the last five quarters, the factors discussed below caused variations in revenues and net income on a quarterly basis:
•In the fourth quarter of 2023, operating recoveries increased in comparison to the prior quarter primarily due to an increase in amounts recoverable from related parties associated with share based compensation, partially offset by a decrease in performance based compensation. The decrease in net income in the quarter compared to the prior quarter is primarily a result of a decrease in earnings of the Asset Management Company.
•In the third quarter of 2023, operating recoveries decreased in comparison to the prior quarter primarily due to a decrease in amounts recoverable from related parties associated with share and performance based compensation. The increase in net income in the quarter compared to the prior quarter is primarily a result of an increase in earnings of the Asset Management Company.
•In the second quarter of 2023, operating recoveries decreased in comparison to the prior quarter primarily due to a decrease in amounts recoverable from related parties associated with share and performance based compensation. The decrease in net income in the quarter compared to the prior quarter is primarily a result of a decrease in earnings of the Asset Management Company.
•In the first quarter of 2023, operating recoveries and net income increased as a result of a full quarter of recoveries from the Corporation and the Asset Management Company, as well as the equity pick-up of our interest in the Asset Management Company.
•In the fourth quarter of 2022, operating recoveries and net income reflect activity for the period from December 9, 2022 to December 31, 2022 as a result of timing of the Arrangement.
Summary of Quarterly Results for BAM ULC
The quarterly variances in revenues over the past two years are due primarily to management fees earned from our funds, accrued carried interest, interest income earned on our deposit with the Corporation and related party recoveries for executive and performance based compensation expense. Management fees and accrued carried interest are dependent on fundraising and fund performance, and will therefore fluctuate over time. Variances in net income are primarily attributable to the movements in revenue as well as movements in employee compensation and professional fees, and our share of income from equity method investments. Net income attributable to common stockholders reflects net income adjusted for the attribution of unrealized and realized carried interest net of cost associated with mature funds, as well as unrealized and realized carried interest owed to the Corporation on new funds.
Our Consolidated and Combined Statements of Operations for the eight most recent quarters are as follows:
|
|
|
|
|
|
|
|
|
|
|
|
|
|
|
|
|
|
|
|
|
|
|
|
|
|
|
|
|
|
|
|
|
|
|
|
|
|
|
|
|
|
|
|
|
|
|
|
|
|
|
FOR THE PERIODS ENDED
(MILLIONS) |
|
2023 |
|
2022 |
|
Q4 |
|
Q3 |
|
Q2 |
|
Q1 |
|
Q4 |
|
Q3 |
|
Q2 |
|
Q1 |
| Revenues |
|
$ |
1,130 |
|
|
$ |
893 |
|
|
$ |
985 |
|
|
$ |
1,054 |
|
|
$ |
1,117 |
|
|
$ |
831 |
|
|
$ |
924 |
|
|
$ |
755 |
|
| Net income |
|
531 |
|
|
510 |
|
|
580 |
|
|
516 |
|
|
613 |
|
|
695 |
|
|
834 |
|
|
723 |
|
| Net income attributable to common stockholders |
|
374 |
|
|
494 |
|
|
455 |
|
|
516 |
|
|
504 |
|
|
395 |
|
|
668 |
|
|
348 |
|
|
|
|
|
|
|
|
|
|
|
|
|
|
|
|
|
|
|
|
|
|
|
|
|
|
|
|
|
|
|
|
|
|
|
|
|
|
|
|
|
|
|
|
|
|
|
|
|
|
|
|
Over the last eight quarters, the factors discussed below caused variations in revenues and net income to stockholders on a quarterly basis:
•In the fourth quarter of 2023, revenues increased relative to the prior quarter due to growth in base management and advisory fees, higher recoveries from related parties associated with share based compensation and an increase in unrealized carried interest generated as a result of higher returns on our long-term private funds. Net income decreased due to the aforementioned increases in revenues and an increase in our share of income from Oaktree, which were more than offset by mark-to-market losses on our investment in BSREP III and higher employee compensation related expenses. This activity, net of accrued carried interest attributable to our redeemable preferred shares and non-controlling interests, as well as BSREP III movements attributable to the Corporation, resulted in a decrease to net income to stockholders relative to the prior quarter.
•In the third quarter of 2023, revenues decreased relative to the prior quarter due to lower recoverables from related parties associated with share and performance based compensation, decreased unrealized carried interest generated as a result of lower returns on our long-term private funds, partially offset by higher market values of our perpetual funds. Net income decreased due to the aforementioned decreases in revenues as well as mark-to-market losses on our investment in BSREP III, partially offset by a decrease in employee compensation related expenses. This activity, net of accrued carried interest attributable to our redeemable preferred shares and non-controlling interests, as well as BSREP III movements attributable to the Corporation, resulted in an increase to net income to stockholders relative to the prior quarter.
•In the second quarter of 2023, revenues decreased relative to the prior quarter due to lower recoverables from related parties associated with share and performance based compensation and lower base management fees earned on our long-term private funds. Net income increased due to lower performance based compensation costs, mark-to-market gains on our investment in BSREP III and a decrease in employee compensation related expenses, partially offset by the aforementioned decreases in revenues. This activity, net of accrued carried interest attributable to our redeemable preferred shares and non-controlling interests, as well as BSREP III movements attributable to the Corporation, resulted in a decrease to net income to stockholders relative to the prior quarter.
•In the first quarter of 2023, revenues decreased relative to the prior quarter due to lower unrealized carry allocations as a result of lower returns on certain of our funds compared to the prior quarter, partially offset by higher recoverables from related parties associated with share and performance based compensation. Net income decreased due to the aforementioned decreases in revenues as well as by higher compensation costs as a result of annual salary increases. This increase was partially offset by higher earnings from our investment in Oaktree. This activity, net of accrued carried interest attributable to our redeemable preferred shares and non-controlling interests, as well as BSREP III movements attributable to the Corporation, resulted in an increase to net income to stockholders relative to the prior quarter.
•In the fourth quarter of 2022, revenues increased relative to the prior quarter due to strong growth in base management and advisory fees as a result of contributions from flagship fundraising and fees on co-investment capital. These increases were partially offset by lower market capitalizations of the perpetual affiliates and lower interest income as a result of the transfer of certain investments and loans of the asset management business to the Corporation as part of the Arrangement. In addition, increased unrealized carried interest allocations resulted from higher valuation gains recognized for our real estate long-term private funds. Net income decreased due to the aforementioned increases in revenues, which were more than offset by the deconsolidation of BSREP III as part of the Arrangement, higher performance based compensation expense on carried interest generated, and negative earnings pickup from our investment in Oaktree. This activity, net of accrued carried interest attributable to our redeemable preferred shares and non-controlling interests resulted in an increase to net income to stockholders relative to the prior quarter.
•In the third quarter of 2022, revenues decreased relative to the prior quarter due to decreased unrealized carried interest allocations as a result of lower returns on our second real estate flagship fund, partially offset by higher base management fees earned on our long-term private funds. Net income decreased due to the aforementioned decreases in revenues as well as higher compensation costs as a result of hiring investment professionals to support our flagship funds and expanding product offerings, and mark-to-market valuation losses on our investment in BSREP III. This activity, net of non-controlling interest in consolidated funds, resulted in a decrease to net income to BAM ULC relative to the prior quarter.
•In the second quarter of 2022, revenues increased relative to the prior quarter due to strong growth in base management and advisory fees as a result of contributions from flagship fundraising and new products and the higher market capitalizations of the perpetual affiliates, as well as increased unrealized carried interest allocations as a result of higher valuation gains recognized for our real-estate long-term private funds. Net income increased due to the aforementioned increases in revenues, partially offset by higher compensation costs as a result of annual salary increases and hiring investment professionals to support our flagship funds and expanding product offerings. This activity, net of non-controlling interest in consolidated funds, resulted in an increase to net income to BAM ULC relative to the prior quarter.
•In the first quarter of 2022, revenues declined relative to the prior quarter due to a decrease in unrealized carried interest allocations as a result of lower valuation gains recognized for our real estate long-term private funds, partially offset by an increase in base management and advisory fees as a result of higher market capitalizations of the perpetual affiliates, contributions from flagship fundraising and new products. Net income decreased due to the aforementioned decreases in revenues, and higher compensation costs as a result of annual salary increases. This activity, net of non-controlling interest in consolidated funds, resulted in a decrease to net income to BAM ULC relative to the prior quarter.
PART 3
KEY FINANCIAL AND OPERATING MEASURES
The Manager and the Asset Management Company prepare their financial statements in conformity with U.S. GAAP. This MD&A discloses a number of non-GAAP financial and supplemental financial measures which are utilized in monitoring our asset management business, including for performance measurement, capital allocation and valuation purposes. The Manager believes that providing these performance measures is helpful to investors in assessing overall performance, as well as the performance of our asset management business. These non-GAAP financial measures should not be considered as the sole measure of the Manager’s or our asset management business’ performance and should not be considered in isolation from, or as a substitute for, similar financial measures calculated in conformity with U.S. GAAP financial measures. These non-GAAP financial measures are not standardized financial measures and may not be comparable to similar financial measures used by other issuers. The asset management business includes the asset management activities of Oaktree, an equity accounted affiliate, in its key financial and operating measures for our asset management business. See “Reconciliation of U.S. GAAP to Non-GAAP Measures.”
Non-GAAP Measures
Fee Revenues
Fee Revenues is a key metric analyzed by management to determine the growth in recurring cash flows from our asset management business. Fee Revenues include base management fees, incentive distributions, performance fees and transaction fees. Fee Revenues exclude carried interest but include Fee Revenues earned by Oaktree. The most directly comparable measure of Fee Revenues disclosed in the financial statements is base management and advisory fees.
Fee-Related Earnings
Fee-Related Earnings is used to provide additional insight into the operating profitability of our asset management activities. Fee-Related Earnings are recurring in nature and not based on future realization events. Fee-Related Earnings is comprised of Fee Revenues less direct costs associated with earning those fees, which include employee compensation and professional fees as well as business related technology costs, and other shared services costs. The most directly comparable measure of Fee-Related Earnings disclosed in the primary financial statements is net income.
Distributable Earnings
Distributable Earnings used by the Manager provides insight into earnings that are available for distribution or to be reinvested by the Manager. Distributable Earnings of the Manager represent its share of Distributable Earnings from our asset management business less general and administrative expenses, but excluding equity-based compensation expenses, of the Manager. The most directly comparable measure disclosed in our primary financial statements for Distributable Earnings of the Manager is net income.
The Manager intends to pay out approximately 90% of its Distributable Earnings to shareholders quarterly and reinvest the balance back into the business. The asset management business intends to pay dividends to the Manager on a quarterly basis sufficient to ensure that the Manager can pay its intended dividend.
Distributable Earnings used by our asset management business provides insight into earnings that are available for distribution or to be reinvested by our asset management business. It is calculated as the sum of its Fee-Related Earnings, realized carried interest, returns from our corporate cash and financial assets, interest expense, cash taxes, and general and administrative expenses excluding equity-based compensation expenses and depreciation and amortization. The most directly comparable measure disclosed in the primary financial statements of our asset management business for Distributable Earnings is net income.
Supplemental Financial Measures Utilized by Our Asset Management Business
Assets Under Management
AUM refers to the total fair value of assets managed, calculated as follows:
•Investments that Brookfield, which includes the Corporation, the asset management business, or their affiliates, either:
◦Consolidates for accounting purposes (generally, investments in respect of which Brookfield has a significant economic interest and unilaterally directs day-to-day operating, investing and financing activities), or
◦Does not consolidate for accounting purposes but over which Brookfield has significant influence by virtue of one or more attributes (e.g., being the largest investor in the investment, having the largest representation on the investment’s governance body, being the primary manager and/or operator of the investment, and/or having other significant influence attributes),
◦Are calculated at 100% of the total fair value of the investment taking into account its full capital structure — equity and debt — on a gross asset value basis, even if Brookfield does not own 100% of the investment, with the exception of investments held through our perpetual funds, which are calculated at its proportionate economic share of the investment’s net asset value.
•All other investments are calculated at Brookfield’s proportionate economic share of the total fair value of the investment taking into account its full capital structure — equity and debt — on a gross asset value basis.
Our methodology for determining AUM differs from the methodology that is employed by other alternative asset managers as well as the methodology for calculating regulatory AUM that is prescribed for certain regulatory filings (e.g., Form ADV and Form PF).
Fee-Bearing Capital
Fee-Bearing Capital represents the capital committed, pledged, or invested in our permanent capital vehicles, private funds and liquid strategies that we manage which entitles us to earn Fee Revenues. Fee-Bearing Capital includes both called (“invested”) and uncalled (“pledged” or “committed”) amounts.
When reconciling period amounts, we utilize the following definitions:
•Inflows include capital commitments and contributions to our private and liquid strategies funds, and equity issuances from the permanent capital vehicles.
•Outflows represent distributions and redemptions of capital from within the liquid strategies capital.
•Distributions represent quarterly distributions from the permanent capital vehicles as well as returns of committed capital (excluding market valuation adjustments), redemptions and expiry of uncalled commitments within our private funds.
•Market valuation includes gains (losses) on portfolio investments, the permanent capital vehicles and liquid strategies based on market prices.
•Other includes changes in net non-recourse leverage included in the determination of the permanent capital vehicle capitalizations and the impact of foreign exchange fluctuations on non-U.S. dollar commitments.
Uncalled Fund Commitments
Total Uncalled Fund Commitments includes capital callable from fund investors, including funds outside of their investment period, for which capital is callable for follow-on investments.
Fee-Bearing Capital Diversification
AS AT DEC. 31, 2023 (BILLIONS)
|
|
|
|
|
|
|
|
|
|
|
|
|
|
|
| By Fund Type |
|
|
By Business Line |
|
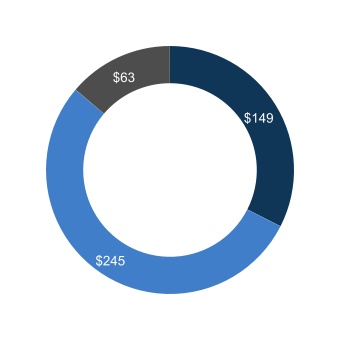
|
|
|
|
|
|
| ■ |
Long-term private funds |
| ■ |
Permanent capital vehicles and perpetual strategies |
| ■ |
Liquid strategies |
|
|
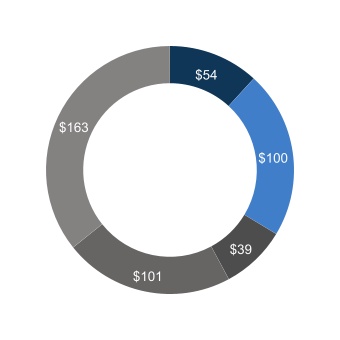
|
|
|
|
|
|
| ■ |
Renewable power and transition |
| ■ |
Infrastructure |
| ■ |
Real estate |
| ■ |
Private equity |
| ■ |
Credit and other |
Long-term Private Funds
As of December 31, 2023, we managed approximately $245 billion of Fee-Bearing Capital across a diverse range of long-term private funds that target opportunistic (20%+, gross), value-add (15%-16%, gross), core and core plus (9%-13%, gross) returns. These funds are generally closed-end and have a long duration, typically committed for 10 years with 2 one-year extension options.
On these products, we earn:
•Diversified and long-term base management fees, typically on committed capital or invested capital, depending on the nature of the fund and where the fund is in its life,
•Transaction and advisory fees on co-investment capital that we raise and deploy alongside our long-term private funds, which vary based on transaction agreements, and
•Carried interest or performance fees, which entitle us to a portion of overall fund profits, provided that investors receive a minimum prescribed preferred return. Carried interest is typically paid towards the end of the life of a fund after capital has been returned to investors and may be subject to “clawback” until all investments have been monetized and minimum investment returns are sufficiently assured. The Corporation is entitled to receive 33.3% of the carried interest on new sponsored funds of our asset management business and will retain all of the carried interest earned on our existing mature funds.
Permanent Capital Vehicles and Perpetual Strategies
As of December 31, 2023, we managed approximately $149 billion of Fee-Bearing Capital across our permanent capital vehicles, perpetual core, and core plus private funds.
On these products, we earn:
•Long-term perpetual base management fees, which are based on the market capitalization or net asset value of our permanent capital vehicles and on the net asset value of our perpetual private funds.
•Stable incentive distribution fees from BEP and BIP, which are linked to the growth in cash distributions paid to investors above a predetermined hurdle. Both BEP and BIP have a long-standing track record of growing distributions annually within their target range of 5-9%.
•Performance fees from BBU are based on unit price performance above a prescribed high-water mark price, which are not subject to clawback, as well as carried interest on our perpetual private funds.
Liquid Strategies
As of December 31, 2023, we managed approximately $63 billion of Fee-Bearing Capital across our liquid strategies, which included capital that we manage on behalf of our publicly listed funds and separately managed accounts, with a focus on fixed income and equity securities across real estate, infrastructure, and natural resources.
On these products, we earn:
•Base management fees, which are based on committed capital or fund net asset value, and
•Performance income based on investment returns above a minimum prescribed return.
PART 4
ANALYSIS OF KEY NON-GAAP FINANCIAL AND OPERATING MEASURES OF OUR ASSET MANAGEMENT BUSINESS
The following section contains a discussion and analysis of key financial and operating measures utilized in managing our asset management business, including for performance measurement, capital allocation and valuation purposes. For further detail on our non-GAAP and performance measures, please refer to “Key Financial and Operating Measures.”
Distributable Earnings
|
|
|
|
|
|
|
|
|
|
|
|
|
|
|
|
|
|
|
|
|
|
|
|
FOR THE YEARS ENDED DECEMBER 31,
(MILLIONS) |
|
|
|
|
2023 |
|
2022 |
|
|
| Fee Revenues |
|
|
|
|
$ |
4,381 |
|
|
$ |
4,048 |
|
|
|
|
|
|
|
|
|
|
|
|
|
Fee-Related Earnings1 |
|
|
|
|
2,241 |
|
|
2,108 |
|
|
|
| Add back: equity-based compensation costs and other income |
|
|
|
|
199 |
|
|
86 |
|
|
|
|
|
|
|
|
|
|
|
|
|
| Cash taxes |
|
|
|
|
(196) |
|
|
(98) |
|
|
|
| Distributable Earnings |
|
|
|
|
$ |
2,244 |
|
|
$ |
2,096 |
|
|
|
|
|
|
|
|
|
|
|
|
|
|
|
|
|
|
|
|
|
|
|
|
|
|
|
|
|
|
|
|
|
|
|
|
|
|
|
|
|
|
|
|
|
|
|
|
|
|
|
|
|
|
|
|
|
|
|
|
|
|
|
|
|
|
|
|
|
|
|
|
|
|
|
|
|
|
|
|
|
|
|
|
|
|
|
|
|
|
|
|
|
|
|
|
|
|
|
|
|
|
|
|
|
|
|
|
|
|
|
|
|
1. Fee-Related Earnings include Oaktree’s Fee-Related Earnings at our approximate 68% ownership interest (2022 - 64%).
For the year ended December 31, 2023
Distributable Earnings were $2.2 billion for the year ended December 31, 2023, an increase of $148 million or 7% compared to the prior year. The increase was driven by higher Fee-Related Earnings, primarily attributable to our fundraising and capital deployment efforts. These increases were partially offset by lower fees from our permanent capital vehicles due to a decline in their average market capitalization compared to the prior year and an increase in costs as we continue to scale our asset management business. In addition, there was a $113 million increase in equity-based compensation costs and other income, primarily driven by higher interest income on our deposit with the Corporation. The overall increase in Distributable Earnings was partially offset by an increase in Cash taxes of $98 million due to higher Fee-Related Earnings.
Fee-Bearing Capital
The following table summarizes Fee-Bearing Capital as at December 31, 2023 and December 31, 2022:
|
|
|
|
|
|
|
|
|
|
|
|
|
|
|
|
|
|
|
|
|
|
|
|
|
AS AT
(MILLIONS)
|
Long-term private funds |
|
Perpetual strategies |
|
Liquid strategies |
|
Total |
| Renewable power and transition |
$ |
31,187 |
|
|
$ |
22,700 |
|
|
$ |
— |
|
|
$ |
53,887 |
|
| Infrastructure |
52,220 |
|
|
47,290 |
|
|
— |
|
|
99,510 |
|
| Real estate |
72,037 |
|
|
28,951 |
|
|
— |
|
|
100,988 |
|
| Private equity |
33,249 |
|
|
5,600 |
|
|
— |
|
|
38,849 |
|
| Credit and other |
56,795 |
|
|
44,031 |
|
|
62,938 |
|
|
163,764 |
|
| December 31, 2023 |
$ |
245,488 |
|
|
$ |
148,572 |
|
|
$ |
62,938 |
|
|
$ |
456,998 |
|
| December 31, 2022 |
$ |
218,992 |
|
|
$ |
135,575 |
|
|
$ |
63,296 |
|
|
$ |
417,863 |
|
The changes in Fee-Bearing Capital are set out in the following table for the year ended December 31, 2023:
|
|
|
|
|
|
|
|
|
|
|
|
|
|
|
|
|
|
|
|
|
|
|
|
|
|
|
|
|
|
|
|
|
|
|
|
|
AS AT AND FOR THE YEAR ENDED
(MILLIONS)
|
Renewable power and transition |
|
Infrastructure |
|
Real estate |
|
Private equity |
|
Credit and other |
|
Total |
| Balance, December 31, 2022 |
$ |
47,218 |
|
|
$ |
85,887 |
|
|
$ |
103,025 |
|
|
$ |
39,317 |
|
|
$ |
142,416 |
|
|
$ |
417,863 |
|
| Inflows |
6,848 |
|
|
14,059 |
|
|
12,042 |
|
|
4,424 |
|
|
35,807 |
|
|
73,180 |
|
| Outflows |
— |
|
|
(6) |
|
|
(508) |
|
|
— |
|
|
(19,848) |
|
|
(20,362) |
|
| Distributions |
(1,626) |
|
|
(3,062) |
|
|
(5,415) |
|
|
(1,200) |
|
|
(4,977) |
|
|
(16,280) |
|
| Market valuation |
1,757 |
|
|
2,241 |
|
|
(3,016) |
|
|
(816) |
|
|
7,906 |
|
|
8,072 |
|
| Other |
(310) |
|
|
391 |
|
|
(5,140) |
|
|
(2,876) |
|
|
2,460 |
|
|
(5,475) |
|
| Change |
6,669 |
|
|
13,623 |
|
|
(2,037) |
|
|
(468) |
|
|
21,348 |
|
|
39,135 |
|
| Balance, December 31, 2023 |
$ |
53,887 |
|
|
$ |
99,510 |
|
|
$ |
100,988 |
|
|
$ |
38,849 |
|
|
$ |
163,764 |
|
|
$ |
456,998 |
|
Fee-Bearing Capital was $457 billion as at December 31, 2023 compared to $418 billion as at December 31, 2022. The increase of $39 billion was primarily attributable to fundraising and capital deployments across our strategies, including our fifth real estate and infrastructure flagship funds, and our sixth private equity flagship fund. Inflows within our credit and other strategy due to capital deployed within our closed-end funds and other investments in our insurance solutions business also contributed to the increase of Fee-Bearing Capital. The overall increase of Fee-Bearing Capital was partially offset by distributions to our clients and outflows due to redemptions within our credit funds and liquid strategies.
The following table summarizes Fee-Bearing Capital as at December 31, 2022 and 2021:
|
|
|
|
|
|
|
|
|
|
|
|
|
|
|
|
|
|
|
|
|
|
|
|
|
AS AT
(MILLIONS)
|
Long-term private funds |
|
Perpetual strategies |
|
Liquid strategies |
|
Total |
| Renewable power and transition |
$ |
26,708 |
|
|
$ |
20,510 |
|
|
$ |
— |
|
|
$ |
47,218 |
|
| Infrastructure |
44,512 |
|
|
41,375 |
|
|
— |
|
|
85,887 |
|
| Real estate |
69,473 |
|
|
33,552 |
|
|
— |
|
|
103,025 |
|
| Private equity |
31,501 |
|
|
7,816 |
|
|
— |
|
|
39,317 |
|
| Credit and other |
46,798 |
|
|
32,322 |
|
|
63,296 |
|
|
142,416 |
|
| December 31, 2022 |
$ |
218,992 |
|
|
$ |
135,575 |
|
|
$ |
63,296 |
|
|
$ |
417,863 |
|
| December 31, 2021 |
$ |
169,346 |
|
|
$ |
117,549 |
|
|
$ |
77,238 |
|
|
$ |
364,133 |
|
The changes in Fee-Bearing Capital are set out in the following table for the year ended December 31, 2022:
|
|
|
|
|
|
|
|
|
|
|
|
|
|
|
|
|
|
|
|
|
|
|
|
|
|
|
|
|
|
|
|
|
|
|
|
|
AS AT AND FOR THE YEAR ENDED
(MILLIONS)
|
Renewable power and transition |
|
Infrastructure |
|
Real estate |
|
Private equity |
|
Credit and other |
|
Total |
Balance, December 31, 2021 |
$ |
47,525 |
|
|
$ |
67,736 |
|
|
$ |
82,282 |
|
|
$ |
34,395 |
|
|
$ |
132,195 |
|
|
$ |
364,133 |
|
| Inflows |
6,823 |
|
|
26,974 |
|
|
18,850 |
|
|
9,135 |
|
|
45,887 |
|
|
107,669 |
|
| Outflows |
— |
|
|
— |
|
|
(394) |
|
|
— |
|
|
(21,648) |
|
|
(22,042) |
|
| Distributions |
(1,428) |
|
|
(3,794) |
|
|
(4,556) |
|
|
(810) |
|
|
(1,573) |
|
|
(12,161) |
|
| Market valuation |
(5,873) |
|
|
(5,053) |
|
|
1,645 |
|
|
(2,534) |
|
|
(8,432) |
|
|
(20,247) |
|
| Other |
171 |
|
|
24 |
|
|
5,198 |
|
|
(869) |
|
|
(4,013) |
|
|
511 |
|
| Change |
(307) |
|
|
18,151 |
|
|
20,743 |
|
|
4,922 |
|
|
10,221 |
|
|
53,730 |
|
Balance, December 31, 2022 |
$ |
47,218 |
|
|
$ |
85,887 |
|
|
$ |
103,025 |
|
|
$ |
39,317 |
|
|
$ |
142,416 |
|
|
$ |
417,863 |
|
Fee-Bearing Capital was $418 billion as at December 31, 2022 compared to $364 billion as at December 31, 2021. The increase of $54 billion was primarily attributable to inflows of $108 billion resulting from capital raised across flagship funds, capital inflows within credit and other funds in our insurance solutions business, and capital raised and deployed across various strategies. These increases were partially offset by lower market valuations and outflows within our liquid credit strategies and decreases in the market capitalizations of BEP and BIP due to a decline in share prices compared to prior year.
Fee Revenues and Fee-Related Earnings
|
|
|
|
|
|
|
|
|
|
|
|
|
|
|
|
|
|
|
|
|
|
|
|
FOR THE YEARS ENDED DECEMBER 31,
(MILLIONS) |
|
|
|
|
2023 |
|
2022 |
|
|
Base management fees1 |
|
|
|
|
$ |
3,956 |
|
|
$ |
3,620 |
|
|
|
| Incentive distributions |
|
|
|
|
378 |
|
|
335 |
|
|
|
| Transaction and advisory fees |
|
|
|
|
47 |
|
|
93 |
|
|
|
|
|
|
|
|
|
|
|
|
|
| Fee Revenues |
|
|
|
|
4,381 |
|
|
4,048 |
|
|
|
Less: direct costs1,2 |
|
|
|
|
(2,014) |
|
|
(1,792) |
|
|
|
|
|
|
|
|
2,367 |
|
|
2,256 |
|
|
|
| Less: Fee-Related Earnings not attributable to the asset management business |
|
|
|
|
(126) |
|
|
(148) |
|
|
|
| Fee-Related Earnings |
|
|
|
|
$ |
2,241 |
|
|
$ |
2,108 |
|
|
|
1.Base management fees and direct costs are presented on a 100% basis. Base management fees and direct costs for Oaktree totaled $1.2 billion and $824 million, respectively, for the year ended December 31, 2023 (2022 - $1.2 billion and $760 million, respectively). Refer to Note 3 - “Investments” of the Consolidated and Combined Financial Statements included elsewhere in this Annual Report for additional disclosures related to Oaktree revenues, expenses, and net income.
2. Direct costs include compensation expense, other operating expenses and general, administrative, and other expenses and related Oaktree direct costs at 100%.
For the year ended December 31, 2023
Fee Revenues for the year ended December 31, 2023 were $4.4 billion, an increase of $333 million or 8% compared to prior year. This increase was predominantly due to an increase in base management fees of $336 million or 9%, driven by fees earned from fundraising for our latest infrastructure, real estate and private equity flagship funds and incremental fees earned in our credit and other platform as a result of capital deployed across our opportunistic credit funds. In addition, fees from our perpetual strategy increased due to the increase in net asset values of underlying assets. The increase in base management fees was partially offset by lower fees from our listed permanent capital vehicles due to decreases in market capitalizations.
Incentive distributions increased by $43 million or 13% as a result of an increase in BEP and BIP's quarterly dividend over the prior year of 5% and 6%, respectively.
Direct costs increased by $222 million or 12% from the prior year as we continue to scale our asset management business and higher equity-based compensation.
Fee-Related Earnings increased by $133 million or 6%, primarily attributable to the aforementioned increase in Fee Revenues, partially offset by increased direct costs.
PART 5
INVESTMENT STRATEGY RESULTS
In each of our product categories, we invest globally in various investment strategies, each benefiting from strong secular tailwinds that provide an expanding multi-trillion dollar investable universe. Our investment strategies are (a) renewable power and transition, (b) infrastructure, (c) real estate, (d) private equity, and (e) credit and other.
The following tables summarize Fee-Bearing Capital and Fee Revenues by investment strategy:
Fee-Bearing Capital
|
|
|
|
|
|
|
|
|
|
|
|
|
|
|
AS AT DECEMBER 31,
(MILLIONS)
|
2023 |
|
2022 |
|
|
| Renewable power and transition |
$ |
53,887 |
|
|
$ |
47,218 |
|
|
|
| Infrastructure |
99,510 |
|
|
85,887 |
|
|
|
| Real estate |
100,988 |
|
|
103,025 |
|
|
|
| Private equity |
38,849 |
|
|
39,317 |
|
|
|
| Credit and other |
163,764 |
|
|
142,416 |
|
|
|
| Total Fee-Bearing Capital |
$ |
456,998 |
|
|
$ |
417,863 |
|
|
|
|
|
|
|
|
|
Fee Revenues
|
|
|
|
|
|
|
|
|
|
|
|
|
|
|
|
|
|
|
|
|
|
|
|
FOR THE YEARS ENDED DECEMBER 31,
(MILLIONS) |
|
|
|
|
2023 |
|
2022 |
|
|
| Renewable power and transition |
|
|
|
|
$ |
606 |
|
|
$ |
578 |
|
|
|
| Infrastructure |
|
|
|
|
1,247 |
|
1,067 |
|
|
| Real estate |
|
|
|
|
1,000 |
|
937 |
|
|
| Private equity |
|
|
|
|
476 |
|
435 |
|
|
| Credit and other |
|
|
|
|
1,052 |
|
1,031 |
|
|
| Total Fee Revenues |
|
|
|
|
$ |
4,381 |
|
|
$ |
4,048 |
|
|
|
Renewable Power and Transition
Summary of Key Financial and Operating Measures
The following charts provide the Fee-Bearing Capital of our renewable power and transition investment strategy as at December 31, 2023, and 2022, and Fee Revenues for the years then ended.
Fee-Bearing Capital Fee Revenues
AS AT DEC 31 (BILLIONS) FOR THE YEARS ENDED DEC 31 (MILLIONS)
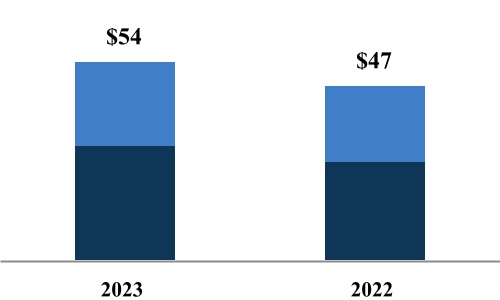
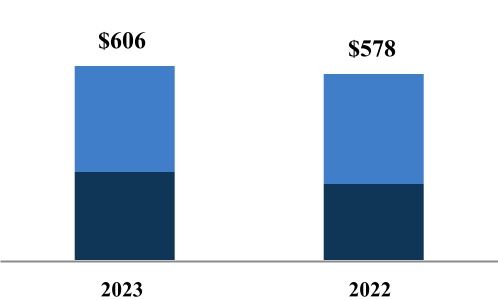
|
|
|
■ Long-term Private Funds |
■ Permanent Capital Vehicles and Perpetual Strategies |
|
|
|
■ Long-term Private Funds |
■ Permanent Capital Vehicles and Perpetual Strategies |
The following provides explanations of significant movements in Fee-Bearing Capital for the current period.
Fee-Bearing Capital
|
|
|
|
|
|
|
|
|
|
|
|
|
|
AS AT DECEMBER 31,
(MILLIONS) |
2023 |
|
2022 |
|
|
| Long-term private funds |
$ |
31,187 |
|
|
$ |
26,708 |
|
|
|
| Permanent capital vehicles and perpetual strategies |
22,700 |
|
|
20,510 |
|
|
|
| Total Fee-Bearing Capital |
$ |
53,887 |
|
|
$ |
47,218 |
|
|
|
|
|
|
|
|
|
|
|
|
|
|
|
|
|
|
|
|
|
|
|
|
|
|
|
FOR THE YEARS ENDED DECEMBER 31,
(MILLIONS) |
|
|
|
|
2023 |
|
2022 |
|
|
| Balance, beginning of period |
|
|
|
|
$ |
47,218 |
|
|
$ |
47,525 |
|
|
|
| Inflows |
|
|
|
|
6,848 |
|
|
6,823 |
|
|
|
| Outflows |
|
|
|
|
— |
|
|
— |
|
|
|
| Distributions |
|
|
|
|
(1,626) |
|
|
(1,428) |
|
|
|
| Market valuation |
|
|
|
|
1,757 |
|
|
(5,873) |
|
|
|
| Other |
|
|
|
|
(310) |
|
|
171 |
|
|
|
| Change |
|
|
|
|
6,669 |
|
|
(307) |
|
|
|
| Balance, end of period |
|
|
|
|
$ |
53,887 |
|
|
$ |
47,218 |
|
|
|
For the year ended December 31, 2023
During the year ended December 31, 2023, Fee-Bearing Capital increased by $6.7 billion or 14% to $54 billion. This increase was driven by inflows attributable to fundraising for the second vintage of our global transition fund, capital deployments across our fund strategies, as well as BEP's $650 million equity offering in the second quarter of 2023. In addition, the market capitalization of BEP increased due to an increase in its share price during the year. These increases were partially offset by distributions paid to BEP’s unitholders and limited partners of our long-term private funds.
Fee Revenues
|
|
|
|
|
|
|
|
|
|
|
|
|
|
|
|
|
|
|
|
|
|
|
|
FOR THE YEARS ENDED DECEMBER 31,
(MILLIONS) |
|
|
|
|
2023 |
|
2022 |
|
|
| Management and advisory fees |
|
|
|
|
|
|
|
|
|
| Long-term private funds |
|
|
|
|
|
|
|
|
|
Flagship funds |
|
|
|
|
$ |
237 |
|
|
$ |
206 |
|
|
|
Co-investment and other funds |
|
|
|
|
23 |
|
|
19 |
|
|
|
|
|
|
|
|
260 |
|
|
225 |
|
|
|
| Perpetual strategies |
|
|
|
|
|
|
|
|
|
BEP1 |
|
|
|
|
205 |
|
|
244 |
|
|
|
Co-investment and other funds |
|
|
|
|
10 |
|
|
— |
|
|
|
|
|
|
|
|
215 |
|
|
244 |
|
|
|
| Catch-up fees |
|
|
|
|
10 |
|
|
12 |
|
|
|
| Transaction and advisory fees |
|
|
|
|
9 |
|
|
2 |
|
|
|
| Total management and advisory fees |
|
|
|
|
494 |
|
|
483 |
|
|
|
| Incentive distributions |
|
|
|
|
112 |
|
|
95 |
|
|
|
| Total Fee Revenues |
|
|
|
|
$ |
606 |
|
|
$ |
578 |
|
|
|
1.BEP Fee-Bearing Capital as at December 31, 2023 is $22.1 billion (2022 - $20.5 billion)
For the year ended December 31, 2023
Fee Revenues increased by $28 million, or 5% for the year ended December 31, 2023 relative to the year ended December 31, 2022. Fees from our long-term private funds increased $35 million relative to the prior year due to an increase in fees earned on our first global transition fund, which benefitted from a full year of fee revenues from 2022 fundraising, as well as an increase in fundraising and capital deployments across our other private funds. Incentive distributions from BEP increased by $17 million, due to a 5% increase in distributions compared to the prior year. These increases were partially offset by a decrease in perpetual strategy fees of $29 million predominantly due to lower fees earned from BEP resulting from a decrease in its average market capitalization relative to the prior year.
Infrastructure
Summary of Key Financial and Operating Measures
The following charts provide the Fee-Bearing Capital of our Infrastructure investment strategy as at December 31, 2023, and 2022, and Fee Revenues for the years then ended.
Fee-Bearing Capital Fee Revenues
AS AT DEC 31 (BILLIONS) FOR THE YEARS ENDED DEC 31 (MILLIONS)
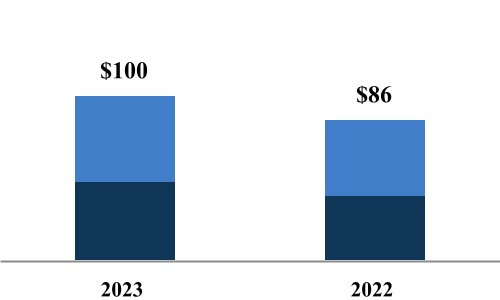
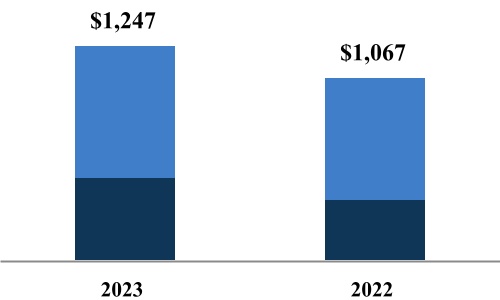
|
|
|
■ Long-term Private Funds |
■ Permanent Capital Vehicles and Perpetual Strategies |
|
|
|
■ Long-term Private Funds |
■ Permanent Capital Vehicles and Perpetual Strategies |
The following provides explanations of significant movements in Fee-Bearing Capital for the current period.
Fee-Bearing Capital
|
|
|
|
|
|
|
|
|
|
|
|
|
|
AS AT DECEMBER 31,
(MILLIONS) |
2023 |
|
2022 |
|
|
| Long-term private funds |
$ |
52,220 |
|
|
$ |
44,512 |
|
|
|
| Permanent capital vehicles and perpetual strategies |
47,290 |
|
|
41,375 |
|
|
|
| Total Fee-Bearing Capital |
$ |
99,510 |
|
|
$ |
85,887 |
|
|
|
|
|
|
|
|
|
|
|
|
|
|
|
|
|
|
|
|
|
|
|
|
|
|
|
FOR THE YEARS ENDED DECEMBER 31,
(MILLIONS) |
|
|
|
|
2023 |
|
2022 |
|
|
| Balance, beginning of period |
|
|
|
|
$ |
85,887 |
|
|
$ |
67,736 |
|
|
|
| Inflows |
|
|
|
|
14,059 |
|
|
26,974 |
|
|
|
| Outflows |
|
|
|
|
(6) |
|
|
— |
|
|
|
| Distributions |
|
|
|
|
(3,062) |
|
|
(3,794) |
|
|
|
| Market valuation |
|
|
|
|
2,241 |
|
|
(5,053) |
|
|
|
| Other |
|
|
|
|
391 |
|
|
24 |
|
|
|
| Change |
|
|
|
|
13,623 |
|
|
18,151 |
|
|
|
| Balance, end of period |
|
|
|
|
$ |
99,510 |
|
|
$ |
85,887 |
|
|
|
For the year ended December 31, 2023
During the year ended December 31, 2023, Fee-Bearing Capital increased by $13.6 billion or 16% to $100 billion. This increase was predominantly due to capital raised for our fifth flagship fund, as well as capital deployed for follow-on investments within our third flagship fund. Additionally, Fee-Bearing Capital increased as a result of debt issuances from BIP, follow-on investments within our other perpetual and long-term strategies, and an increase in market valuations as a result of a higher market capitalization of BIP and other perpetual strategies. These increases were partially offset by distributions paid to limited partners in our long-term private funds and to BIP and other unitholders across our permanent capital vehicles.
Fee Revenues
|
|
|
|
|
|
|
|
|
|
|
|
|
|
|
|
|
|
|
|
|
|
|
|
FOR THE YEARS ENDED DECEMBER 31,
(MILLIONS) |
|
|
|
|
2023 |
|
2022 |
|
|
| Management and advisory fees |
|
|
|
|
|
|
|
|
|
| Long-term private funds |
|
|
|
|
|
|
|
|
|
Flagship funds |
|
|
|
|
$ |
369 |
|
|
$ |
279 |
|
|
|
Co-investment and other funds |
|
|
|
|
54 |
|
|
39 |
|
|
|
|
|
|
|
|
423 |
|
|
318 |
|
|
|
| Perpetual strategies |
|
|
|
|
|
|
|
|
|
BIP1 |
|
|
|
|
401 |
|
|
421 |
|
|
|
Co-investment and other funds |
|
|
|
|
96 |
|
|
53 |
|
|
|
|
|
|
|
|
497 |
|
|
474 |
|
|
|
| Catch-up fees |
|
|
|
|
37 |
|
|
2 |
|
|
|
| Transaction and advisory fees |
|
|
|
|
24 |
|
|
33 |
|
|
|
| Total management and advisory fees |
|
|
|
|
981 |
|
|
827 |
|
|
|
| Incentive distributions |
|
|
|
|
266 |
|
|
240 |
|
|
|
| Total Fee Revenues |
|
|
|
|
$ |
1,247 |
|
|
$ |
1,067 |
|
|
|
1.BIP Fee-Bearing Capital as at December 31, 2023 is $31.2 billion (2022 - $29.2 billion).
For the year ended December 31, 2023
Fee Revenues increased by $180 million or 17% for the year ended December 31, 2023 relative to the year ended December 31, 2022. Fees from our long-term private funds increased by $105 million primarily due to capital raised for our fifth flagship fund. Fee Revenues from our perpetual strategies increased by $23 million, driven by capital deployed by BSIP, partially offset by lower fees earned from BIP due to a lower average market capitalization compared to the prior year. Catch-up fees increased by $35 million due to follow on closes for our fifth flagship fund and incentive distributions increased by $26 million due to an increase in BIP's quarterly dividend. The increases were partially offset by a decrease of $9 million of transaction and advisory fees as the prior year benefited from higher fees on co-investment transactions.
Real Estate
Summary of Key Financial and Operating Measures
The following charts provide the Fee-Bearing Capital for our Real Estate investment strategy as at December 31, 2023, and 2022, and Fee Revenues for the years then ended.
Fee-Bearing Capital Fee Revenues
AS AT DEC 31 (BILLIONS) FOR THE YEARS ENDED DEC 31 (MILLIONS)
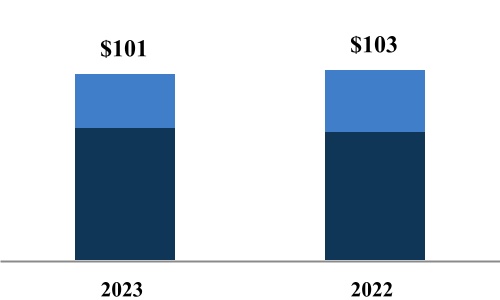
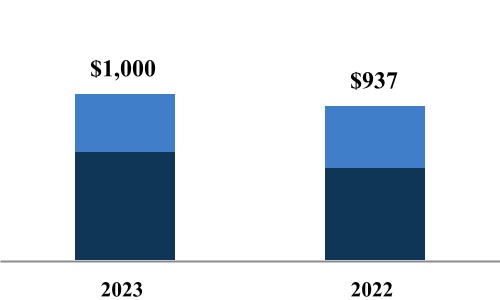
|
|
|
■ Long-term Private Funds |
■ Permanent Capital Vehicles and Perpetual Strategies |
|
|
|
■ Long-term Private Funds |
■ Permanent Capital Vehicles and Perpetual Strategies |
The following provides explanations of significant movements in Fee-Bearing Capital for the current period.
Fee-Bearing Capital
|
|
|
|
|
|
|
|
|
|
|
|
|
|
AS AT DECEMBER 31,
(MILLIONS) |
2023 |
|
2022 |
|
|
| Long-term private funds |
$ |
72,037 |
|
|
$ |
69,473 |
|
|
|
| Permanent capital vehicles and perpetual strategies |
28,951 |
|
|
33,552 |
|
|
|
| Total Fee-Bearing Capital |
$ |
100,988 |
|
|
$ |
103,025 |
|
|
|
|
|
|
|
|
|
|
|
|
|
|
|
|
|
|
|
|
|
|
|
|
|
|
|
FOR THE YEARS ENDED DECEMBER 31,
(MILLIONS) |
|
|
|
|
2023 |
|
2022 |
|
|
| Balance, beginning of period |
|
|
|
|
$ |
103,025 |
|
|
$ |
82,282 |
|
|
|
| Inflows |
|
|
|
|
12,042 |
|
|
18,850 |
|
|
|
| Outflows |
|
|
|
|
(508) |
|
|
(394) |
|
|
|
| Distributions |
|
|
|
|
(5,415) |
|
|
(4,556) |
|
|
|
| Market valuation |
|
|
|
|
(3,016) |
|
|
1,645 |
|
|
|
| Other |
|
|
|
|
(5,140) |
|
|
5,198 |
|
|
|
| Change |
|
|
|
|
(2,037) |
|
|
20,743 |
|
|
|
| Balance, end of period |
|
|
|
|
$ |
100,988 |
|
|
$ |
103,025 |
|
|
|
For the year ended December 31, 2023
During the year ended December 31, 2023, Fee-Bearing Capital decreased by $2.0 billion or 2% to $101 billion, predominantly due to distributions from our perpetual strategies, flagship and other private funds. Additionally, our long-term private funds Fee-Bearing Capital decreased due to the change in the fee base of one of our flagship funds from committed capital to invested capital as a result of the end of its commitment period. Our permanent capital vehicles and perpetual strategies decreased due to a decline in the market valuation of certain assets. These decreases were partially offset by inflows attributable to fundraising within our fifth flagship fund, follow-on investments in our third flagship fund, and capital deployed across various other fund strategies.
Fee Revenues
|
|
|
|
|
|
|
|
|
|
|
|
|
|
|
|
|
|
|
|
|
|
|
|
FOR THE YEARS ENDED DECEMBER 31,
(MILLIONS) |
|
|
|
|
2023 |
|
2022 |
|
|
| Management and advisory fees |
|
|
|
|
|
|
|
|
|
| Long-term private funds |
|
|
|
|
|
|
|
|
|
Flagship funds |
|
|
|
|
$ |
395 |
|
|
$ |
354 |
|
|
|
Co-investment and other funds |
|
|
|
|
294 |
|
|
217 |
|
|
|
|
|
|
|
|
689 |
|
|
571 |
|
|
|
| Perpetual strategies |
|
|
|
|
|
|
|
|
|
BPG1 |
|
|
|
|
196 |
|
|
225 |
|
|
|
Co-investment and other funds |
|
|
|
|
107 |
|
|
107 |
|
|
|
|
|
|
|
|
303 |
|
|
332 |
|
|
|
| Catch-up fees |
|
|
|
|
5 |
|
|
34 |
|
|
|
| Transaction and advisory fees |
|
|
|
|
3 |
|
|
— |
|
|
|
| Total management and advisory fees |
|
|
|
|
1,000 |
|
|
937 |
|
|
|
|
|
|
|
|
|
|
|
|
|
| Total Fee Revenues |
|
|
|
|
$ |
1,000 |
|
|
$ |
937 |
|
|
|
1.BPG Fee-Bearing Capital as at December 31, 2023 is $17.9 billion (2022 - $20.8 billion).
For the year ended December 31, 2023
During the year ended December 31, 2023, Fee Revenues increased by $63 million or 7% due to the increase in revenues earned from fundraising for our fifth flagship fund and commitments throughout 2022 to our fourth flagship fund. In addition, fees increased from capital invested in our residential, U.S., and other fund investments. These increases were partially offset by catch-up fees recognized on our fourth flagship fund in the prior year and a decrease in fees earned by our perpetual vehicle due to the decrease in Fee-Bearing Capital of BPG as well as the disposition of investments within earlier vintages of our flagship funds.
Private Equity
Summary of Key Financial and Operating Measures
The following charts provide the Fee-Bearing Capital of our Private Equity investment strategy as at December 31, 2023, and 2022, and Fee Revenues for the years then ended.
Fee-Bearing Capital Fee Revenues
AS AT DEC 31 (BILLIONS) FOR THE YEARS ENDED DEC 31 (MILLIONS)
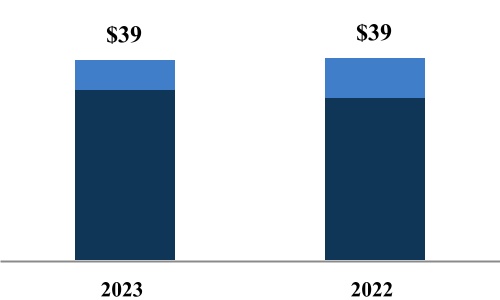
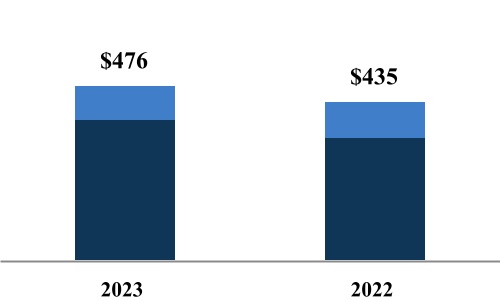
|
|
|
■ Long-term Private Funds |
■ Permanent Capital Vehicles and Perpetual Strategies |
|
|
|
■ Long-term Private Funds |
■ Permanent Capital Vehicles and Perpetual Strategies |
The following provides explanations of significant movements in Fee-Bearing Capital for the current period.
Fee-Bearing Capital
|
|
|
|
|
|
|
|
|
|
|
|
|
|
AS AT DECEMBER 31,
(MILLIONS) |
2023 |
|
2022 |
|
|
| Long-term private funds |
$ |
33,249 |
|
|
$ |
31,501 |
|
|
|
| Permanent capital vehicles and perpetual strategies |
5,600 |
|
|
7,816 |
|
|
|
| Total Fee-Bearing Capital |
$ |
38,849 |
|
|
$ |
39,317 |
|
|
|
|
|
|
|
|
|
|
|
|
|
|
|
|
|
|
|
|
|
|
|
|
|
|
|
FOR THE YEARS ENDED DECEMBER 31,
(MILLIONS) |
|
|
|
|
2023 |
|
2022 |
|
|
| Balance, beginning of period |
|
|
|
|
$ |
39,317 |
|
|
$ |
34,395 |
|
|
|
| Inflows |
|
|
|
|
4,424 |
|
|
9,135 |
|
|
|
| Outflows |
|
|
|
|
— |
|
|
— |
|
|
|
| Distributions |
|
|
|
|
(1,200) |
|
|
(810) |
|
|
|
| Market valuation |
|
|
|
|
(816) |
|
|
(2,534) |
|
|
|
| Other |
|
|
|
|
(2,876) |
|
|
(869) |
|
|
|
| Change |
|
|
|
|
(468) |
|
|
4,922 |
|
|
|
| Balance, end of period |
|
|
|
|
$ |
38,849 |
|
|
$ |
39,317 |
|
|
|
For the year ended December 31, 2023
During the year ended December 31, 2023, Fee-Bearing Capital decreased by $468 million or 1% to $39 billion. The expiration of the management fee period of a mature flagship fund and distributions to our investors was partially offset by inflows of $4.4 billion for our long-term private funds. This was largely driven by capital raised for our sixth flagship private equity fund and capital deployed across other strategies.
Fee Revenues
|
|
|
|
|
|
|
|
|
|
|
|
|
|
|
|
|
|
|
|
|
|
|
|
FOR THE YEARS ENDED DECEMBER 31,
(MILLIONS) |
|
|
|
|
2023 |
|
2022 |
|
|
| Management and advisory fees |
|
|
|
|
|
|
|
|
|
| Long-term private funds |
|
|
|
|
|
|
|
|
|
Flagship funds |
|
|
|
|
$ |
177 |
|
|
$ |
137 |
|
|
|
Co-investment and other funds |
|
|
|
|
185 |
|
|
195 |
|
|
|
|
|
|
|
|
362 |
|
|
332 |
|
|
|
| Perpetual strategies |
|
|
|
|
|
|
|
|
|
BBU1 |
|
|
|
|
87 |
|
|
94 |
|
|
|
|
|
|
|
|
|
|
|
|
|
|
|
|
|
|
87 |
|
|
94 |
|
|
|
| Catch-up fees |
|
|
|
|
16 |
|
|
— |
|
|
|
| Transaction and advisory fees |
|
|
|
|
11 |
|
|
9 |
|
|
|
| Total management and advisory fees |
|
|
|
|
476 |
|
|
435 |
|
|
|
|
|
|
|
|
|
|
|
|
|
|
|
|
|
|
|
|
|
|
|
| Total Fee Revenues |
|
|
|
|
$ |
476 |
|
|
$ |
435 |
|
|
|
1.BBU Fee-Bearing Capital as at December 31, 2023 was $5.6 billion (2022 - $7.8 billion).
For the year ended December 31, 2023
Fee Revenues increased by $41 million or 9% for the year ended December 31, 2023 relative to the year ended December 31, 2022. This increase was primarily due to capital raised for our sixth flagship fund which experienced a $59 million increase in Fee Revenues and catch up fees attributable to the timing of fundraising. This increase was partially offset by a decrease in fees earned within our other funds due to the end of the management fee period for certain earlier vintage funds.
Credit and Other
Summary of Key Financial and Operating Measures
The following charts provide the Fee-Bearing Capital of our credit and other investment strategy as at December 31, 2023, and 2022, and Fee Revenues for the years then ended.
Fee-Bearing Capital Fee Revenues
AS AT DEC 31 (BILLIONS) FOR THE YEARS ENDED DEC 31 (MILLIONS)
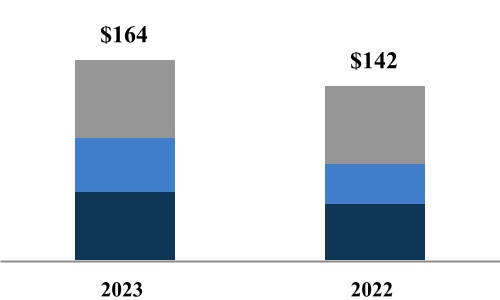
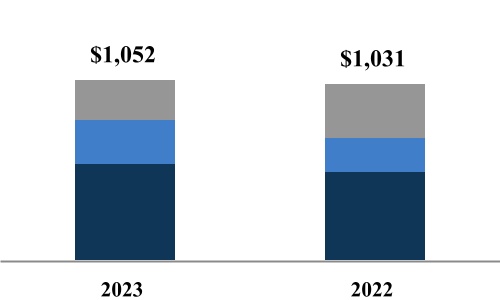
|
|
|
■ Long-term Private Funds |
■ Perpetual Strategies |
■ Liquid Strategies |
|
|
|
■ Long-term Private Funds |
■ Perpetual Strategies |
■ Liquid Strategies |
The following provides explanations of significant movements in Fee-Bearing Capital for the current period.
Fee-Bearing Capital
|
|
|
|
|
|
|
|
|
|
|
|
|
|
AS AT DECEMBER 31,
(MILLIONS) |
2023 |
|
2022 |
|
|
| Long-term private funds |
$ |
56,795 |
|
|
$ |
46,798 |
|
|
|
| Perpetual strategies |
44,031 |
|
|
32,322 |
|
|
|
| Liquid strategies |
62,938 |
|
|
63,296 |
|
|
|
| Total Fee-Bearing Capital |
$ |
163,764 |
|
|
$ |
142,416 |
|
|
|
|
|
|
|
|
|
|
|
|
|
|
|
|
|
|
|
|
|
|
|
|
|
|
|
FOR THE YEARS ENDED DECEMBER 31,
(MILLIONS) |
|
|
|
|
2023 |
|
2022 |
|
|
| Balance, beginning of period |
|
|
|
|
$ |
142,416 |
|
|
$ |
132,195 |
|
|
|
| Inflows |
|
|
|
|
35,807 |
|
|
45,887 |
|
|
|
| Outflows |
|
|
|
|
(19,848) |
|
|
(21,648) |
|
|
|
| Distributions |
|
|
|
|
(4,977) |
|
|
(1,573) |
|
|
|
| Market valuation |
|
|
|
|
7,906 |
|
|
(8,432) |
|
|
|
| Other |
|
|
|
|
2,460 |
|
|
(4,013) |
|
|
|
| Change |
|
|
|
|
21,348 |
|
|
10,221 |
|
|
|
| Balance, end of period |
|
|
|
|
$ |
163,764 |
|
|
$ |
142,416 |
|
|
|
For the year ended December 31, 2023
During the year ended December 31, 2023, Fee-Bearing Capital increased by $21 billion or 15% to $164 billion, due to growth across all strategies. Our long-term private funds' increase is driven by deployments within our eleventh and twelfth flagship opportunistic credit funds, and capital deployed in certain of our debt funds. In addition, our perpetual strategies increased primarily due to capital deployments and acquisitions within our Insurance Solutions business as well as higher market valuations in our liquid strategy and open-end credit portfolios. This overall increase was partially offset by redemptions adversely impacting our liquid strategies.
Fee Revenues
|
|
|
|
|
|
|
|
|
|
|
|
|
|
|
|
|
|
|
|
|
|
|
|
FOR THE YEARS ENDED DECEMBER 31,
(MILLIONS) |
|
|
|
|
2023 |
|
2022 |
|
|
| Management and advisory fees |
|
|
|
|
|
|
|
|
|
| Long-term private funds |
|
|
|
|
$ |
570 |
|
|
$ |
529 |
|
|
|
Perpetual strategies |
|
|
|
|
252 |
|
|
191 |
|
|
|
Liquid strategies1 |
|
|
|
|
230 |
|
|
262 |
|
|
|
| Transaction and advisory fees |
|
|
|
|
— |
|
|
49 |
|
|
|
| Total Fee Revenues |
|
|
|
|
$ |
1,052 |
|
|
$ |
1,031 |
|
|
|
1.Represents open-end funds within our credit strategies, and Oaktree's investment in a fixed income manager, as well as in publicly listed securities.
For the year ended December 31, 2023
Fee Revenues increased by $21 million or 2% for the year ended December 31, 2023 relative to the year ended December 31, 2022. The increase was predominately attributable to incremental fees earned on our long-term private funds and perpetual strategies. Fees from our long-term private funds increased due to deployments across our credit flagship and other debt funds. In addition, fees from perpetual strategies increased by $61 million as a result of higher Fee-Bearing Capital driven by valuation increases and capital deployed across these strategies. These increases were partially offset by a $32 million decrease in our liquid strategies due to redemptions.
PART 6
RECONCILIATION OF U.S. GAAP TO NON-GAAP MEASURES
Reconciliations of Distributable Earnings, Fee-Related Earnings and Fee Revenues to the most directly comparable financial measures calculated and presented in conformity with U.S. GAAP are presented below. In addition to net income and revenue, management assesses the performance of its business based on these non-GAAP financial measures. These non-GAAP financial measures should be considered in addition to, and not as a substitute for or superior to, net income or other financial measures presented in conformity with U.S. GAAP.
Reconciliation of Net Income to Fee-Related Earnings and Distributable Earnings
The following presents a reconciliation of net income to Fee-Related Earnings and Distributable Earnings for the year presented for the asset management business.
|
|
|
|
|
|
|
|
|
|
|
|
|
|
|
|
|
|
|
|
|
|
|
|
FOR THE YEARS ENDED DECEMBER 31,
(MILLIONS) |
|
|
|
|
2023 |
|
2022 |
|
|
| Net Income |
|
|
|
|
$ |
2,137 |
|
$ |
2,865 |
|
|
| Add or subtract the following: |
|
|
|
|
|
|
|
|
|
Provision for taxes(a) |
|
|
|
|
417 |
|
|
627 |
|
|
|
Depreciation, amortization and other(b) |
|
|
|
|
14 |
|
13 |
|
|
Carried interest allocations(c) |
|
|
|
|
(399) |
|
|
(490) |
|
|
|
Carried interest allocation compensation(c) |
|
|
|
|
86 |
|
|
200 |
|
|
|
Other income and expenses(d) |
|
|
|
|
129 |
|
|
(1,090) |
|
|
|
Interest expense paid to related parties(e) |
|
|
|
|
14 |
|
|
154 |
|
|
|
Interest and dividend revenue(e) |
|
|
|
|
(172) |
|
|
(258) |
|
|
|
Other revenues(f) |
|
|
|
|
(300) |
|
|
(44) |
|
|
|
Share of income from equity accounted investments(g) |
|
|
|
|
(167) |
|
|
(146) |
|
|
|
Fee-related earnings of partly owned subsidiaries at our share(h) |
|
|
|
|
271 |
|
|
252 |
|
|
|
Compensation costs recovered from affiliates(j) |
|
|
|
|
156 |
|
|
— |
|
|
|
Non-recurring restructuring costs(i) |
|
|
|
|
35 |
|
|
— |
|
|
|
Fee Revenues from BSREP III & other(j) |
|
|
|
|
20 |
|
|
25 |
|
|
|
| Fee-Related Earnings |
|
|
|
|
$ |
2,241 |
|
|
$ |
2,108 |
|
|
|
|
|
|
|
|
|
|
|
|
|
Cash taxes(k) |
|
|
|
|
(196) |
|
|
(98) |
|
|
|
Equity-based compensation expense and other(l) |
|
|
|
|
199 |
|
|
86 |
|
|
|
| Distributable Earnings |
|
|
|
|
$ |
2,244 |
|
|
$ |
2,096 |
|
|
|
(a)This adjustment removes the impact of income tax provisions (benefit) on the basis that we do not believe this item reflects the present value of the actual tax obligations that we expect to incur over the long-term due to the substantial deferred tax assets of our asset management business.
(b)This adjustment removes the depreciation and amortization on property, plant and equipment and intangible assets, which are non-cash in nature and therefore excluded from Fee-Related Earnings.
(c)These adjustments remove the impact of both unrealized and realized carried interest allocations and the associated compensation expense. Unrealized carried interest allocations and associated compensation expense are non-cash in nature. Carried interest allocations and associated compensation costs are included in Distributable Earnings once realized.
(d)This adjustment removes other income and expenses associated with non-cash fair value changes
(e)This adjustment removes interest and charges paid or received from related party loans.
(f)This adjustment adds back other revenues earned that are non-cash in nature.
(g)These adjustments remove our share of partly owned subsidiaries’ earnings, including items (a) to (e) above and include its share of partly owned subsidiaries’ Fee-Related Earnings.
(h)This item adds back compensation costs that will be borne by affiliates and are non-cash in nature.
(i)This item represents non-recurring restructuring costs that are not considered as part of the ongoing asset management business.
(j)This adjustment adds base management fees earned from funds that are eliminated upon consolidation and other items.
(k)Represents the impact of cash taxes paid by the business.
(l)This adjustment adds back equity-based compensation and other income associated with the Company's portion of partly owned subsidiaries’ investment income, realized carried interest and other income.
Reconciliation of Revenues to Fee Revenues
The following presents our reconciliation of management fee revenues to Fee Revenues for the years presented.
|
|
|
|
|
|
|
|
|
|
|
|
|
|
|
|
|
|
|
|
|
|
|
|
FOR THE YEARS ENDED DECEMBER 31,
(MILLIONS) |
|
|
|
|
2023 |
|
2022 |
|
|
| Total management fee revenues |
|
|
|
|
$ |
3,142 |
|
|
$ |
2,835 |
|
|
|
Fee Revenues from equity-accounted investments (a) |
|
|
|
|
1,240 |
|
|
1,165 |
|
|
|
BSREP III Fees & other(b) |
|
|
|
|
(1) |
|
|
48 |
|
|
|
| Fee Revenues |
|
|
|
|
$ |
4,381 |
|
|
$ |
4,048 |
|
|
|
(a)This adjustment adds management fees at 100% ownership.
(b)This adjustment involves base management fees earned from BSREP III and other funds that are eliminated upon consolidation as prior to the Arrangement we consolidated both the entities which earned these base management fees and BSREP III in the combined financial statements.
PART 7
LIQUIDITY AND CAPITAL RESOURCES
Liquidity
The Manager undertakes limited activities, primarily receiving dividends from our asset management business as its main source of income and, in turn, making distributions to shareholders in accordance with its dividend policy. It employs a limited number of resources who provide services to our asset management business and for whom associated costs are largely reimbursed. Additional liquidity is available through a credit facility that is provided by our asset management business.
Manager Credit Facility with the Asset Management Business
On November 8, 2022, the Asset Management Company, as lender, established a five-year revolving credit facility with the Manager for the amount of $500 million. This is available in U.S. and Canadian dollars, where U.S. dollar borrowings are subject to the U.S. Base Rate or SOFR plus a margin of 165 basis points, and Canadian Dollar borrowings are subject to the Canadian Prime Rate or Canadian dollar bankers' acceptance rate (“CDOR”) plus a margin of 165 basis points. As at December 31, 2023, the Manager has drawn $256 million from this credit facility.
Our Asset Management Business Liquidity
Our asset management business maintains sufficient liquidity at all times enabling it to participate in opportunities as they arise, withstand sudden adverse changes in economic conditions, and sustain distributions to the Manager and the Corporation. Its primary sources of liquidity, which we refer to as core liquidity, consists of cash and financial assets, as well as the undrawn credit facility with the Corporation.
As at December 31, 2023, core liquidity for our asset management business is $2.8 billion, consisting of $2.7 billion of cash and financial assets, of which $2.5 billion was on deposit with the Corporation. Additionally, the asset management business has a $300 million revolving credit facility established on November 8, 2022, with the Corporation as lender. The facility is available in U.S. and Canadian dollars, where U.S. dollar borrowings are subject to the U.S. Base Rate or SOFR plus a margin of 165 basis points, while Canadian Dollar borrowings are subject to the Canadian Prime Rate or CDOR plus a margin of 165 basis points. This liquidity is readily available for use without any material tax consequences and can be deployed to support our asset management business in funding strategic transactions as well as seeding new investment products. As at December 31, 2023 the Asset Management Company has drawn $197 million from this credit facility.
The following table presents deployable capital of our asset management business:
|
|
|
|
|
|
|
|
|
|
|
|
|
|
|
|
|
|
|
|
|
|
|
|
|
Company |
|
Group(a) |
AS AT
(MILLIONS) |
December 31, |
|
December 31, |
|
December 31, |
|
December 31, |
| 2023 |
|
2022 |
|
2023 |
|
2022 |
| Cash and financial assets |
$ |
2,667 |
|
|
$ |
3,545 |
|
|
$ |
29,042 |
|
|
$ |
29,809 |
|
| Undrawn committed credit facility |
103 |
|
|
300 |
|
|
5,764 |
|
|
5,438 |
|
| Core liquidity |
2,770 |
|
|
3,845 |
|
|
34,806 |
|
|
35,247 |
|
| Uncalled private fund commitments |
— |
|
|
— |
|
|
85,658 |
|
|
87,364 |
|
| Total deployable capital |
$ |
2,770 |
|
|
$ |
3,845 |
|
|
$ |
120,464 |
|
|
$ |
122,611 |
|
(a) Group deployable capital consists of: (1) core liquidity (cash, financial assets, and undrawn credit facilities) of the Company and the perpetual affiliates, and (2) uncalled private fund commitments, which are third-party commitments available for drawdown in the private funds of our asset management business.
Uncalled Fund Commitments
The following presents our Uncalled Fund Commitments as of December 31, 2023 by period and December 31, 2022:
|
|
|
|
|
|
|
|
|
|
|
|
|
|
|
|
|
|
|
|
|
|
|
|
|
|
|
|
|
|
|
|
|
|
|
|
|
|
AS AT DECEMBER 31
(MILLIONS) |
|
|
2024 |
|
2025 |
|
2026 |
|
2027 + |
|
Total 2023 |
|
Dec. 2022 |
| Renewable power and transition |
|
|
$ |
64 |
|
|
$ |
117 |
|
|
$ |
— |
|
|
$ |
16,948 |
|
|
$ |
17,129 |
|
|
$ |
14,835 |
|
| Infrastructure |
|
|
44 |
|
|
192 |
|
|
— |
|
|
14,028 |
|
|
14,264 |
|
|
21,981 |
|
| Real estate |
|
|
793 |
|
|
778 |
|
|
3,150 |
|
|
17,786 |
|
|
22,507 |
|
|
21,895 |
|
| Private equity |
|
|
66 |
|
|
425 |
|
|
— |
|
|
8,297 |
|
|
8,788 |
|
|
11,003 |
|
| Credit and other |
|
|
1,129 |
|
|
341 |
|
|
621 |
|
|
20,879 |
|
|
22,970 |
|
|
17,650 |
|
|
|
|
$ |
2,096 |
|
|
$ |
1,853 |
|
|
$ |
3,771 |
|
|
$ |
77,938 |
|
|
$ |
85,658 |
|
|
$ |
87,364 |
|
Approximately $47 billion of the Uncalled Fund Commitments are currently not earning fees, but will become fee-bearing once the capital is invested. Once invested, these commitments will earn approximately $470 million of additional Fee Revenues.
Manager Dividends
The dividends paid by the Manager on outstanding securities for the years 2023 and 2022 are summarized in the table below. No dividend was paid for 2021 as the Manager was formed per the Arrangement in 2022.
|
|
|
|
|
|
|
|
|
|
|
|
|
|
| |
Distribution per Security |
| |
2023 |
|
2022 |
|
|
Per Class A Share and Class B Share |
$ |
1.28 |
|
|
$ |
— |
|
|
|
Capital Resources
Clawback Obligations
Performance allocations are subject to clawback to the extent that the performance allocations received to date with respect to a fund exceed the amount due to our asset management business based on cumulative results of that fund. The amounts and nature of our clawback obligations are described in Note 2 “Summary of Significant Accounting Policies” of the Consolidated and Combined Financial Statements of the Asset Management Company as at December 31, 2023, and December 31, 2022 and for the years ended December 31, 2023 and December 31, 2022.
Capital Requirements
Certain U.S. and non-U.S. entities of the Manager are subject to various investment advisor and other financial regulatory rules and requirements that may include minimum net capital requirements. These requirements have been met for the year ended December 31, 2023.
Contractual Obligations
On January 31, 2019, a subsidiary of the Company committed $2.8 billion to BSREP III, of which $2.1 billion has been funded as at December 31, 2023 (December 31, 2022 – $1.8 billion). The remainder of the commitment will be funded by the Corporation.
In the normal course of business, the Company enters into contractual obligations which include commitments to provide bridge financing and other equity commitments. As at December 31, 2023, the Company had $2.1 billion of such commitments outstanding.
The following table presents the contractual obligations of the Manager and asset management business by payment periods:
|
|
|
|
|
|
|
|
|
|
|
|
|
|
|
|
|
|
|
|
|
|
|
|
|
|
|
|
|
|
|
Payments Due by Period of the Manager |
|
AS AT DEC. 31, 2023
(MILLIONS)
|
Less than 1 Year |
|
1 – 3
Years |
|
4 – 5
Years |
|
After 5
Years |
|
Total |
|
|
|
|
|
|
|
|
|
|
Accounts payable and other |
$ |
128 |
|
|
$ |
134 |
|
|
$ |
66 |
|
|
$ |
531 |
|
|
$ |
859 |
|
| Due to affiliates |
6 |
|
|
— |
|
|
255 |
|
|
— |
|
|
261 |
|
|
|
|
|
|
|
|
|
|
|
|
Payments Due by Period of the Company |
|
AS AT DEC. 31, 2023
(MILLIONS)
|
Less than 1 Year |
|
1 – 3
Years |
|
4 – 5
Years |
|
After 5
Years |
|
Total |
|
|
|
|
|
|
|
|
|
|
Accounts payable and other |
$ |
1,063 |
|
|
$ |
184 |
|
|
$ |
81 |
|
|
$ |
410 |
|
|
$ |
1,738 |
|
| Due to affiliates |
578 |
|
|
46 |
|
|
221 |
|
|
141 |
|
|
986 |
|
| Lease obligations |
9 |
|
|
18 |
|
|
14 |
|
|
20 |
|
|
61 |
|
|
|
|
|
|
|
|
|
|
|
Accounts payable and other of the Manager represent amounts owing to employees for carried interest compensation and share based compensation, both of which have vesting periods of up to 5 years. Due to affiliates of the Manager represents amount due to the asset management business associated with the revolving credit facility established with the company. This revolving credit facility is due on demand.
Accounts payable and other of the company represents amounts due to employees for equity based compensations costs and carried interest compensation costs. Most awards have a vesting period of up to 5 years. Due to affiliates represents amounts owed to related parties associated with equity and liability based compensation as well as carried interest compensation. Additionally due to affiliates includes amounts owing with the corporation on the revolving credit facility which has no fixed period of repayment. Lease obligations represents expected payments associated with current leases entered into by the company.
Exposures to Financial Instruments
As discussed elsewhere in this MD&A, we utilize various financial instruments in our business to manage risk and make better use of our capital. The fair values of these instruments that are reflected on our balance sheets are disclosed in Note 5 "Fair Value Measurements of Financial Instruments" to our Consolidated and Combined Financial Statements of the Asset Management Company as at and for the years ended December 31, 2023 and December 31, 2022.
Off-Balance Sheet Arrangements
The Manager may from time to time enter into guarantees given in respect of co-investments in which there is carried interest. The amount guaranteed is up to the carry amount paid to the General Partner, net of taxes. No known amounts are currently due or owed under these guarantees.
Related Party Transactions
The Manager and our asset management business entered into a number of related party transactions with the Corporation and other affiliates. See Note 15 "Related Party Transactions" of the Consolidated and Combined Financial Statements of the Asset Management Company as at and for the years ended December 31, 2023 and December 31, 2022 and Note 7 "Related Party Transactions" of the Consolidated Financial Statements of the Manager.
Recent Developments
On July 5, 2023, Brookfield Reinsurance ("BNRE") and American Equity Investment Life Holding Company (“AEL”) entered into a merger agreement whereby BNRE will acquire all of the outstanding common stock of AEL it does not already own. As part of the agreement, each AEL shareholder will receive $55.00 per AEL share, consisting of $38.85 in cash and 0.49707 of a Class A Share of the Manager, subject to adjustment in certain circumstances.
BNRE, the Corporation and the Manager entered into a share purchase agreement in connection with the transaction pursuant to which the Corporation will facilitate the delivery of Class A Shares of the Manager offered as consideration under the merger agreement.
Subject to this occurring, the Manager’s public float will increase by approximately 10% and the Manager’s interest in the Asset Management Company will increase from 25% to approximately 27%. The impact of this transaction will not be dilutive to the shareholders of the Manager. The Manager will not have any ownership interest in AEL following the completion of the transaction.
PART 8
SUMMARY OF SIGNIFICANT ACCOUNTING POLICIES
Accounting Policies, Estimates and Judgements of the Manager
The Manager prepares consolidated financial statements in conformity with U.S. GAAP. The preparation of the consolidated financial statements in conformity with U.S. GAAP requires management to make estimates that affect the amounts reported. Management believes that estimates utilized in the preparation of the consolidated financial statements are presented fairly, in all material respects. Such estimates include those used in the valuation of investments and the measurement of deferred tax balances (including valuation allowances) and the determination of control or significant influence. Actual results could differ from those estimates and such differences could be material. The Manager believes the following critical accounting policies could potentially produce materially different results of the Manager, if underlying assumptions, estimates and/or judgments were to be changed. For a full description of accounting policies, see Note 2 “Summary of Significant Accounting Policies” of the Consolidated Financial Statements of the Manager as at December 31, 2023 and December 31, 2022 and for the year ended December 31, 2023 and period from July 4, 2022 to December 31, 2022.
For further reference on accounting policies, including new and revised standards see our accounting policies contained in Note 2 of the 2023 consolidated financial statements.
Consolidation
The Manager consolidates all entities that it controls through a majority voting interest and all variable interest entities (“VIE”) for which it is the primary beneficiary. An enterprise is determined to be the primary beneficiary of a VIE if it holds a controlling financial interest. A controlling financial interest is defined as (a) the power to direct the activities of a VIE that most significantly impact the entity’s economic performance and (b) the obligation to absorb losses of the entity or the right to receive benefits from the entity that could potentially be significant to the VIE. The Manager determines whether it is the primary beneficiary of a VIE at the time it becomes involved with a VIE and upon events warranting reconsideration. In determining whether the Manager is the primary beneficiary, the company evaluates its control rights as well as economic interests in the entity held either directly or indirectly by the company. The consolidation analysis can generally be performed qualitatively; however, if it is not readily apparent that the company is not the primary beneficiary, a quantitative analysis may also be performed. Investments and redemptions (either by the Manager, affiliates of the company or third parties) and amendments to governing documents could affect an entity’s status as a VIE or the determination of the primary beneficiary. As at December 31, 2023, the Manager is not the primary beneficiary of any VIE.
All intercompany balances and transactions have been eliminated on consolidation.
Equity Method Investments
Investments in which the Manager is deemed to exert significant influence, but not control, are accounted for using the equity method of accounting. The Manager has significant influence over the Asset Management Company and therefore accounts for its investment under the equity method.
The carrying value of equity method investments is determined based on amounts invested by the company, adjusted for the equity in earnings or losses of the investee allocated based on the relevant agreements, less distributions received. Further, the carrying value of the equity method investment is adjusted as a result of any share-based awards granted by the Manager to employees of the Asset Management Company. Under the equity method of accounting, the Manager's share of earnings from equity investments is included in the Share of income from equity investments in the Consolidated Statements of Comprehensive Income. The Manager evaluates its equity method investments for impairment whenever events or changes in circumstances indicate that the carrying amounts of such investments may not be recoverable.
Refer to Note 3 "Investments" of the Consolidated Financial Statements of the Manager for further details of the Manager's equity method investments.
Estimates and Judgements of the Manager
Management is required to make critical judgements and estimates when applying its accounting policies. The following judgements and estimates have the most significant effect on the consolidated financial statements.
Control or Level of Influence
When determining the appropriate basis of accounting for the Manager's and the asset management business’s investees, the company makes judgments about the degree of influence that it exerts directly or through an arrangement over the investees’ relevant activities. This may include the ability to elect investee directors or appoint management. Control is obtained when the company has the power to direct the relevant investing, financing and operating decisions of an entity and does so in its capacity as principal of the operations, rather than as an agent for other investors. Operating as a principal includes having sufficient capital at risk in any investee and exposure to the variability of the returns generated as a result of the decisions of the company as principal. Judgment is used in determining the sufficiency of the capital at risk or variability of returns. In making these judgments, the company considers the ability of other investors to remove the company as a manager or general partner in a controlled partnership.
Indicators of Impairment
Judgment is applied when determining whether indicators of impairment exist when assessing the carrying values of the company’s assets, including: the determination of the company’s ability to hold financial assets; the determination of discount and capitalization rates; and when an asset’s carrying value is above the value derived using publicly traded prices which are quoted in a liquid market.
Income Taxes
The company makes judgments when determining the future tax rates applicable and identifying the temporary differences. Deferred income tax assets and liabilities are measured at the tax rates that are expected to apply during the period when the assets are realized or the liabilities settled, using the tax rates and laws enacted or substantively enacted at the consolidated balance sheet dates.
Carried Interest allocations - Unrealized
The change in the fair value of investments is a significant input into carried interest allocations - unrealized. Estimates and assumptions are made when determining the fair value of the underlying investments within the funds. See “— Fair Value” below for further discussion related to significant estimates and assumptions used for determining fair value of the underlying investments.
Fair Value
The asset management business uses fair value throughout the reporting process. For details of our accounting policies related to fair value refer to Note 2. “Summary of Significant Accounting Policies — Fair Value of Financial Instruments” and “Summary of Significant Accounting Policies — Revenue Recognition” in the “Notes to Consolidated and Combined Financial Statements”. The following discussion is intended to provide supplemental information about how the application of fair value principles impact our financial results, and management’s process for implementing those principles including areas of significant judgment.
The fair value of the investments held by the asset management business's funds is the primary input to the calculation of certain of our management fees, incentive fees, performance fees and the related compensation we recognize. In the absence of observable market prices, we utilize valuation methodologies applied on a consistent basis and assumptions that we believe market participants would use to determine the fair value of the investments. For investments where little market activity exists management’s determination of fair value is based on the best information available in the circumstances, which may incorporate management’s own assumptions and involves a significant degree of judgment, and the consideration of a combination of internal and external factors, including the appropriate risk adjustments for non-performance and liquidity risks.
Assessments and Changes in Internal Control over Financial Reporting
Management has evaluated the effectiveness of the Manager’s internal control over financial reporting (as defined in the applicable U.S. and Canadian securities laws) as of December 31, 2023 and based on that assessment concluded that, as of December 31, 2023, our internal control over financial reporting was effective. Refer to Management’s Report on Internal Control Over Financial Reporting. There have been no changes in our internal control over financial reporting during the quarter or year ended December 31, 2023 that have materially affected, or are reasonably likely to materially affect, our internal control over financial reporting.
Management, including the Chief Executive Officer and Chief Financial Officer, has evaluated the effectiveness of the Manager's disclosure controls and procedures (as defined in the applicable U.S. and Canadian securities laws) as of December 31, 2023. Based on that evaluation, the Chief Executive Officer and Chief Financial Officer concluded that such disclosure controls and procedures were effective as of December 31, 2023.
PART 9
BUSINESS ENVIRONMENT AND RISK DISCLOSURES
Market Risk
The primary market risk exposure of our asset management business relates to its role as an asset manager of the publicly listed permanent capital vehicles and the sensitivity of base management fees earned from these affiliates due to movements in their underlying trading price. Specifically, with respect to the market risk related to base management fees earned based on the market capitalization of BEP, BIP and BBU.
The table below outlines the impact to base management and advisory fee revenues if there was a 10% decline in the market capitalization of the aforementioned permanent capital vehicles:
|
|
|
|
|
|
|
|
|
|
|
|
|
|
|
FOR THE YEARS ENDED DECEMBER 31,
(MILLIONS)
|
2023 |
|
2022 |
|
|
| BEP |
$ |
22 |
|
|
$ |
19 |
|
|
|
| BIP |
32 |
|
|
33 |
|
|
|
| BBU |
4 |
|
|
7 |
|
|
|
|
|
|
|
|
|
| Revenues |
$ |
58 |
|
|
$ |
59 |
|
|
|
Foreign Currency Risk
We have very limited exposure to foreign currency risk as a majority of our private funds are denominated in USD. This means that a majority of the base management fees and carried interest that we earn are paid in USD, irrespective of the local currency of our underlying investment base.
Interest Rate Risk
The Manager has interest rate exposure through balances held with affiliates and does not hold debt or term deposits with third parties. The Manager incurs interest expense on its revolving credit facility borrowings with the Asset Management Company. Interest expense on this balance is at a variable rate of interest. In fiscal 2023, a 50 basis-point increase (decrease) in interest rates, with all other variables held constant, would have resulted in an approximate increase (decrease) of $0.7 million in interest expense. A 50 basis-point increase (decrease) in interest rates would result in an approximate increase (decrease) of $1.3 million in interest expense assuming December 31, 2023 year end balances remain constant throughout 2024.
The Asset Management Company has interest rate exposure through balances held with affiliates and does not hold debt or term deposits with third parties. BAM ULC earns interest income on its deposit balance with the Corporation and as the lender on the revolving credit facility it extends to the Manager. The Asset Management Company incurs interest expense on its revolving credit facility borrowings with the Corporation. Interest income and expenses on these balances are at variable rates of interest. In fiscal 2023, a 50 basis-point increase (decrease) in interest rates, with all other variables held constant, would have resulted in an approximate increase (decrease) of $13.6 million in net interest income. A 50 basis-point increase (decrease) in interest rates would result in an approximate increase (decrease) of $12.6 million in net interest income assuming December 31, 2023 year end balances remain constant throughout 2024.
Credit Risk
Investors in our private funds make capital commitments to these vehicles via subscription agreements. When a private fund makes an investment, these capital commitments are then satisfied by our investors via capital contributions as prescribed under these subscription agreements. Investors in our private funds may default on their capital commitment obligations, which could have an adverse impact on our earnings or result in other negative implications to our businesses such as the requirement to deploy our own capital to cover such obligations. This impact would be magnified if the investor that does so is in multiple funds. Given the diversity and creditworthiness of our over 2,300 clients, including some of the world’s largest institutional investors, sovereign wealth funds and pension plans, we are of the view that there is not a material credit risk present in our asset management business.
Risks Relating to the Manager
You should carefully consider the following factors in addition to other information set forth in this Annual Report. If any of the following risks were actually to occur, our business, financial condition and results of operations and the prospects and value of the Class A Shares would likely suffer.
The material assets of the Manager consist solely of its approximate 25% interest in the common shares of the Asset Management Company.
The material assets of the Manager consist solely of its approximate 25% interest in the common shares of the Asset Management Company. While the Manager has the right to nominate one-half of the board of the Asset Management Company, the Corporation holds the remaining approximate 75% interest in the common shares of the Asset Management Company and has the right to nominate the other one-half of the board of the Asset Management Company. Therefore, the Manager relies on the cooperation of the Corporation to make decisions regarding our asset management business. If the interests of the Manager and the Corporation differ with respect to our asset management business, the Manager may not be able to implement policies at our asset management business that it determines are desirable.
For example, while the Manager intends to pay regular dividends to shareholders, the Manager has no independent means of generating revenue. The Manager depends on distributions and other payments from our asset management business to provide it with the funds necessary to meet its financial obligations, as well as pay dividends to shareholders. The Manager intends to pay dividends to shareholders on a quarterly basis equal to approximately 90% of its Distributable Earnings in the preceding quarter and our asset management business intends to pay dividends to the Manager and the Corporation on a quarterly basis sufficient to ensure that the Manager can pay its intended dividend. Dividends will be variable and will change in line with the growth of Distributable Earnings. The declaration and payment of any dividends will be at the discretion of the Board (and the board of the Asset Management Company), and may change at any time, including, without limitation, to reduce such quarterly dividends or to eliminate such dividends entirely.
Our asset management business and our managed assets are legally distinct from the Manager and some of them are or may become restricted in their ability to pay dividends and distributions or otherwise make funds available to the Manager pursuant to local law, regulatory requirements and their contractual agreements, including agreements governing their financing arrangements. Our asset management business and our managed assets will generally be required to service their debt and other obligations before making distributions to the Manager.
The trading price of the Class A Shares is subject to volatility due to market conditions and other factors and cannot be predicted.
The market price of our Class A Shares may be volatile and could fluctuate significantly in response to factors both related and unrelated to our operating performance and/or future prospects, including, but not limited to: (i) variations in our operating results and financial condition; (ii) actual or prospective changes in government laws, rules or regulations affecting our business and our managed assets; (iii) material announcements by us, our affiliates or our competitors; (iv) the general state of the securities markets; (v) market conditions and events specific to the industries in which we and our managed assets operate; (vi) changes and developments in general economic, political, or social conditions, including as a result of pandemics/epidemics and related economic disruptions; (vii) changes in the values of our investments and distributions or changes in the amount of interest paid in respect of investments; (viii) differences between our actual financial results and those expected by investors and analysts; (ix) changes in analysts’ recommendations or earnings projections; (x) the depth and liquidity of the market for the Class A Shares; (xi) dilution from the issuance of additional equity; (xii) investor perception of our business, our managed assets and the sectors in which we deploy the funds from our strategies; (xiii) investment restrictions; (xiv) our dividend policy; (xv) the departure of key executives; (xvi) sales of Class A Shares by senior management or significant shareholders; and (xvii) the materialization of other risks.
The Corporation’s actions could adversely affect our business and financial condition.
The Corporation is a significant investor in our asset management business and we rely on the Corporation for many aspects of our business. In addition, the Corporation has the right (but not the obligation) to participate up to 25% (net of any participation of our asset management business) in each new sponsored fund of our asset management business. This participation includes any participation by the Corporation’s perpetual affiliates and Brookfield Reinsurance, but they are also not obligated to invest capital in our funds. Any fees to be paid to our asset management business on the Corporation’s managed capital must be agreed to by the Corporation, in its sole discretion. It is expected that most of the Corporation’s capital will continue to be provided by the perpetual affiliates, for whom existing fee arrangements will continue to apply. For greater certainty, for any new capital, the Corporation has a right to determine that no fees will apply.
If the Corporation does not commit all the capital it is entitled to provide, or does not agree for its capital to be fee-bearing, we may have difficultly growing our managed capital or our revenues.
In addition, the Corporation has substantial influence on our asset management business through its approximate 75% interest in the common shares of the Asset Management Company. While the Manager has the right to nominate one-half of the board of the Asset Management Company, the Corporation holds the remaining approximate 75% interest in the common shares of the Asset Management Company and has the right to nominate the other one-half of the board of the Asset Management Company. If the interests of the Manager and the Corporation differ with respect to our asset management business, the Manager may not be able to implement policies at our asset management business that it determines are desirable. There is no formal dispute resolution mechanism in the Voting Agreement relating to the voting of shares of our asset management business, and, if we are unable to agree, we may be prevented from achieving our objectives, including our financial objectives.
In addition, a significant portion of our Fee-Bearing Capital is represented by the capital of the perpetual affiliates, which are controlled by the Corporation. The Corporation will therefore exercise significant influence over their operation, including (among other things) distribution policies that enable us to earn incentive distributions.
The Corporation has no obligation to provide backstops or other guarantees relating to new investments or acquisitions, or to commit capital on a transitional basis while other investors are being sourced, but any arrangements or understandings existing at the time of completion of the Arrangement will be continued. Moreover, if the Corporation does make transitory investments it will generally be entitled to receive the same cost of carry for such investment as the relevant fund of our asset management business is entitled to under its fund documents (typically 8%) as well as stand-by / commitment fees at market rates and such other compensation as otherwise may be mutually agreed. It is possible that our ability to deploy capital may be adversely affected by not having the Corporation’s backstops or other guarantees, or we may be required to deploy our own capital, or to pay for other sources of capital.
We depend on our global reputation for integrity and investment acumen. Our business could be negatively impacted by changes in the Corporation’s global reputation. In addition, other than as described in this Annual Report, the Corporation is not committed to an exclusive relationship with us, and we may compete with the Corporation (except for capital represented by the perpetual affiliates, which is exclusive) or compete with other asset managers for the Corporation’s capital.
The Manager is a newly formed company and has a limited operating history as an independent public company and the historical financial information included herein may not reflect the financial condition or operating results we would have achieved during the periods presented, and therefore may not be a reliable indicator of our future financial performance.
The Manager was formed on July 4, 2022 and has a limited operating history as an independent public company and the historical financial information included herein may not reflect the financial condition or operating results we would have achieved during the periods presented in this Annual Report and therefore, may not be a reliable indicator of our or our asset management business’ future financial performance. Our limited operating history will make it difficult to assess our ability to operate profitably and make distributions to shareholders. Although our business has been under the Corporation’s control prior to the formation of the Manager, its results have not previously been reported on a stand-alone basis and, therefore, may not be indicative of our future financial condition or operating results. We urge you to carefully consider the basis on which the historical financial information included herein was prepared and presented.
Deficiencies in our public company financial reporting and disclosures could adversely impact our reputation.
As we expand the size and scope of our business, there is a greater susceptibility that our financial reporting and other public disclosure documents may contain material misstatements and that the controls we maintain to attempt to ensure the complete accuracy of our public disclosures may fail to operate as intended. The occurrence of such events could adversely impact our reputation and financial condition. In addition, we disclose certain metrics that do not have standardized meaning, are based on our own methodologies and assumptions and may not properly convey the information they purport to reflect.
Management is responsible for establishing and maintaining adequate internal controls over financial reporting to give our stakeholders assurance regarding the reliability of our financial reporting and the preparation of financial statements for external purposes in conformity with U.S. GAAP. However, the process for establishing and maintaining adequate internal controls over financial reporting has inherent limitations, including the possibility of human error. In addition, we may exclude recently acquired companies from our evaluation of internal controls.
Our internal controls over financial reporting may not prevent or detect misstatements in our financial disclosures on a timely basis, or at all. Some of these processes may be new for certain subsidiaries in our structure, and in the case of acquisitions, may take time to be fully implemented.
Our disclosure controls and procedures are designed to provide assurance that information required to be disclosed by us in reports filed or submitted under Canadian and U.S. securities laws is recorded, processed, summarized and reported within the time periods specified. Our policies and procedures governing disclosures may not ensure that all material information regarding us is disclosed in a proper and timely fashion, or that we will be successful in preventing the disclosure of material information to a single person or a limited group of people before such information is generally disseminated.
The Manager uses the equity method of accounting for its interest in our asset management business, and our asset management business’ results will not be consolidated into our financial statements, and therefore the recording of our asset management business’ transactions into its accounts is not part of the Manager’s internal control structure. The Manager expects to provide Asset Management Company stand-alone financial statements. However, our asset management business will not be independently required to meet Sarbanes-Oxley requirements and the Manager will not have the same control and certification processes with respect to the information on our asset management business that it would have if it were a wholly-owned subsidiary of the Manager.
If the Manager or our auditors were to conclude that our internal controls over financial reporting were not effective in respect of any reporting period, investors could lose confidence in our reported financial information and the price of our Class A Shares could decline. Our failure to achieve and maintain effective internal controls could have a material adverse effect on our business, our ability to access capital markets and our reputation. In addition, material weaknesses in our internal controls could require significant expense and management time to remediate.
We may be liable for the debts and liabilities of our asset management business.
The Asset Management Company is an unlimited liability company formed under the laws of British Columbia, and certain of its subsidiaries are also unlimited liability companies. As a result, the Manager and the Corporation will be jointly and severally liable to contribute to the assets of our asset management business for the payment of its debts and liabilities on a liquidation or a dissolution. If the Manager has assets other than its interest in our asset management business, and if the assets of our asset management business are not sufficient to cover its debts and liabilities (including those arising as a result of its obligations towards its unlimited liability company subsidiaries), then the Manager’s assets may be required to be contributed to the Asset Management Company, potentially to a degree that exceeds its approximate 25% interest, further reducing the assets of the Manager available to its shareholders.
Our organizational and ownership structure may create conflicts of interest that may be resolved in a manner that is not in our best interests or the best interests of our shareholders.
Our organizational and ownership structure involves a number of relationships that may give rise to conflicts of interest between us and our shareholders, on the one hand, and the Corporation, on the other hand. For example, except to a limited extent, the Corporation is not committed to an exclusive relationship with us, and we may compete with the Corporation (except for capital represented by the perpetual affiliates, which is exclusive) or may compete with other asset managers for the Corporation’s capital.
Many of our executives and employees have a material portion of their equity compensation awards that are tied to the performance of the shares of the Corporation. If the market value of the Manager’s shares and the Corporation’s shares are not fully aligned, the existence of these awards may result in our executives and employees being less focused on the Manager’s financial success.
Canadian and U.S. investors may find it difficult or impossible to effect service of process and enforce judgments against us, our directors and our executive officers.
Certain directors of the Manager reside outside of Canada. Consequently, it may not be possible for Canadian investors to enforce judgments obtained in Canada against any person who resides outside of Canada, even if the party has appointed an agent for service of process. Furthermore, it may be difficult to realize upon or enforce in Canada any judgment of a court of Canada against the directors of the Manager who reside outside of Canada since a substantial portion of the assets of such person may be located outside of Canada.
Similarly, the Manager is a company incorporated under the laws of British Columbia, Canada, most of its officers and directors are not residents of the United States, and a substantial portion of the assets of the Manager and said persons are located outside the United States. As a result, it may be difficult for U.S. investors to: (i) effect service of process within the United States upon the Manager or those directors and officers who are not residents of the United States; or (ii) realize in the United States upon judgments of courts of the United States predicated upon the civil liability provisions of the United States federal securities laws.
Risks Relating to our Business
Growth in Fee-Bearing Capital could be adversely impacted by poor product development or marketing efforts. In addition, investment returns could be lower than target returns due to inappropriate allocation of capital or ineffective investment management.
Our business depends on our ability to fundraise third-party capital, deploy that capital effectively and produce targeted investment returns.
Our ability to raise third-party capital depends on a number of factors, including many that are outside our control such as the general economic environment and market conditions (including the performance of the stock market), investment rules or policies to which third party investors are subject, and the number of other investment funds being raised at the same time by our competitors. Investors may reduce (or even eliminate) their investment allocations to alternative investments, including closed-ended private funds. Investors that are required to maintain specific asset class allocations within their portfolio may be required to reduce their investment allocations to alternative investments, particularly during periods when other asset classes, such as public securities, are decreasing in value. In addition, investors may prefer to insource and make direct investments; therefore, becoming competitors and ceasing to be clients and/or make new capital commitments.
Competition from other asset managers for raising public and private capital is intense, with competition based on a variety of factors, including investment performance, the quality of service provided to investors, the quality and availability of investment products, marketing efforts, investor liquidity and willingness to invest, and reputation. Poor investment performance could hamper our ability to compete for these sources of capital or force us to reduce our management fees. Our investors and potential investors continually assess investment performance and our ability to raise capital for existing and future funds depends on our funds’ relative and absolute performance. If poor investment returns or changes in investment mandates prevent us from raising further capital from our existing partners, we may need to identify and attract new investors in order to maintain or increase the size of our private funds, and there are no assurances that we will be able to find new investors. Further, as competition and disintermediation in the asset management industry increase, we may face pressure to reduce or modify our asset management fees, including base management fees and/or carried interest, or modify other terms governing our current asset management fee structure, in order to attract and retain investors.
The successful execution of our investing strategy is uncertain as it requires suitable opportunities, careful timing and business judgment, as well as the resources to complete asset purchases and restructure them, if required, notwithstanding difficulties experienced in a particular industry.
There is no certainty that we will be able to identify suitable or sufficient opportunities that meet our investment criteria and be able to acquire additional high-quality assets at attractive prices to supplement our growth in a timely manner, or at all. In pursuing investment opportunities and returns, we and our managed assets face competition from other investment managers and investors worldwide. Each of our strategies is subject to competition in varying degrees and our competitors may have certain competitive advantages over us when pursuing investment opportunities. Some of our competitors may have higher risk tolerances, different risk assessments, lower return thresholds, a lower cost of capital, or a lower effective tax rate (or no tax rate at all), all of which could allow them to consider a wider variety of investments and to bid more aggressively than us for investments. We may lose investment opportunities in the future if we do not match investment prices, structures and terms offered by our competitors, some of whom may have synergistic businesses which allow them to consider bidding a higher price than we can reasonably offer. While we will continue to attempt to deal with competitive pressures by leveraging our asset management strengths and the operating capabilities of the Corporation and compete on more than just price, there is no guarantee these measures will be successful, and we may have difficulty competing for investment opportunities, particularly those offered through auction or other competitive processes. If we are unable to successfully raise, retain and deploy third-party capital into investments, or make acquisitions which yield attractive returns, we may be unable to collect management fees, carried interest or transaction fees, which would materially reduce our revenue and cash flows and adversely affect our financial condition.
Our approach to investing may entail adding assets to our existing managed assets through tuck-in acquisitions when the competition for assets is weakest; typically, when depressed economic conditions exist in the market relating to a particular entity or industry. Such an investing style carries with it inherent risks when investments are made in either markets or industries that are undergoing some form of dislocation. We may fail to value opportunities accurately or to consider all relevant factors that may be necessary or helpful in evaluating an opportunity, may underestimate the costs necessary to bring an acquisition up to standards established for its intended market position, may be exposed to unexpected risks and costs associated with these investments, including risks arising from alternative technologies that could impair or eliminate the competitive advantage of our managed assets in a particular industry, and/or may be unable to quickly and effectively integrate new acquisitions into existing operations or exit from the investment on favorable terms. In addition, liabilities may exist that we or our managed assets do not
discover in due diligence prior to the consummation of an acquisition, or circumstances may exist with respect to the entities or assets acquired that could lead to future liabilities and, in each case, we or our managed assets may not be entitled to sufficient, or any, recourse against the contractual counterparties to an acquisition.
Our credit strategies, the majority of which are managed through Oaktree, offer a broad diverse range of long-term and perpetual strategies to our investors. Similar to our other long-term private funds, we earn base management fees and carried interest on fund capital in our credit strategies. Cyclicality is important to credit strategies and weak economic environments have tended to afford the best investment opportunities and best relative investment performance to such strategies. Any prolonged economic expansion or recession could have an adverse impact on certain credit strategies and materially affect the ability to deliver superior investment returns for clients or generate incentive or other income in respect of those strategies.
We generally pursue investment opportunities that involve business, regulatory, legal and other complexities. Our tolerance for complexity presents risks, as completing complex transactions on behalf of our managed assets can be more difficult, expensive and time-consuming to finance and execute, and have a higher risk of execution failure. It can also be more difficult to manage or realize value from the assets acquired in such transactions and such transactions sometimes entail a higher level of regulatory scrutiny or a greater risk of contingent liabilities.
At times, we make investments (for one or more of our funds or managed assets) in companies that we do not control. These investments are subject to the risk that the company in which the investment is made may make business, financial or management decisions with which we do not agree or that the majority stakeholders or the management of the company may take risks or otherwise act in a manner that does not serve our interests.
Certain strategies may be concentrated in particular asset types or geographic regions, which could exacerbate any negative performance of one or more of our managed assets to the extent those concentrated investments are in assets or regions that experience market dislocation. In addition, certain of our funds hold publicly traded securities, the price of which will be volatile and are likely to fluctuate due to a number of factors beyond our control, including actual or anticipated changes in the profitability of the issuers of such securities; general economic, social, or political developments; changes in industry conditions; changes in governance regulation; inflation; the general state of the securities markets; pandemics/epidemics; and other material events.
The failure of a newly acquired business to perform according to expectations could have a material adverse effect on our assets, liabilities, business, financial condition, results of operations and cash flows. Alternatively, we may be required to sell a business before it has realized our expected level of returns for such business.
If any of our managed investments perform poorly or experience prolonged periods of volatility, or we are unable to deploy capital effectively, our fee-based revenue, cash available for distribution and/or carried interest would decline. Accordingly, our expected returns on these investments may be less than we have assumed in forecasting the value of our business.
Actions or conduct that have a negative impact on our investors’ or stakeholders’ perception of us could adversely impact our ability to attract and/or retain investor capital and generate fee revenue.
The growth of our business relies on continuous fundraising for various private and public investment products, and retention of capital raised from third-party investors. We depend on our business relationships and our global reputation for integrity and high-caliber asset management services to attract and retain investors and advisory clients, and to pursue investment opportunities for our clients. Our business relationships and reputation could be negatively impacted by a number of factors including poor performance; actual, potential or perceived conflicts of interest that are not adequately addressed; misconduct or alleged misconduct by employees; rumors or innuendos; or failed or ineffective implementation of new investments or strategies. If we are unable to continue to raise and retain capital from third-party investors, including from the Corporation, either privately, publicly or both, or otherwise are unable to pursue our investment opportunities, this could materially reduce our revenue and cash flows and adversely affect our financial condition.
Poor performance of any kind could damage our reputation with current and potential investors in our managed assets, making it more difficult for us to raise new capital. Investors may decline to invest in current and future managed assets and may withdraw their investments from our managed assets as a result of poor performance in the entity in which they are invested, and investors in our private funds may demand lower fees for new or existing funds, all of which would decrease our revenue.
As a global alternative asset manager with various lines of business and investment products, some of which have overlapping mandates, we may be subject to a number of actual, potential or perceived conflicts of interest.
In addressing these conflicts, we have implemented a variety of policies and procedures; however, there can be no assurances that these will be effective at mitigating actual, potential or perceived conflicts of interest in all circumstances, or will not reduce the positive synergies that we seek to cultivate.
It is also possible that actual, potential or perceived conflicts of interest, if not properly addressed, could give rise to investor dissatisfaction, litigation, regulatory enforcement actions or other detrimental outcomes. See “Risks Relating to the Manager — Our organizational and ownership structure may create conflicts of interest that may be resolved in a manner that is not in our best interests or the best interests of our shareholders”.
Appropriately dealing with conflicts of interest for an asset manager like us is a priority and our reputation could be damaged if we fail, or appear to fail, to deal appropriately with actual, potential or perceived conflicts of interest. Asset manager conflicts are subject to enhanced regulatory scrutiny in the markets in which we operate and in the U.S. in particular. Such regulatory scrutiny can lead to fines, penalties and other negative consequences. Regulatory scrutiny of, or litigation in connection with, conflicts of interest could have a material adverse effect on our reputation, business, financial condition or results of operations in a number of ways, including an inability to adequately capitalize existing managed assets or raise new managed assets, including private funds, and a reluctance of counterparties to do business with us. For information regarding conflicts of interests between the businesses within our asset management operations that operate on opposite sides of an information barrier, see “—Information barriers may give rise to certain conflicts and risks and investment teams managing the activities of businesses that operate on opposite sides of an information barrier will not be aware of, and will not have the ability to manage, such conflicts and risks” herein.
Our reputation could also be negatively impacted if there is misconduct or alleged misconduct by our personnel or those of our managed assets, including historical misconduct prior to the investment in such managed asset. Risks associated with misconduct at our managed assets is heightened in cases where we do not have legal control or significant influence over a particular managed asset or are not otherwise involved in actively managing an investment. In such situations, given our management position and affiliation with the managed asset, we may still be negatively impacted from a reputational perspective through this association. In addition, even where we have management over an asset, if it is a newly acquired asset that we are in the process of integrating then we may face reputational risks related to historical or current misconduct or alleged misconduct at such managed asset for a period of time. We may also face increased risk of misconduct to the extent investments in operating assets in emerging markets and distressed companies increases. If we face allegations of improper conduct by private litigants or regulators, whether the allegations are valid or invalid or whether the ultimate outcome is favorable or unfavorable to us, such allegations may result in negative publicity and press speculation about us, our investment activities or the asset management industry in general, which could harm our reputation and may be more damaging to our business than to other types of businesses.
We are subject to a number of obligations and standards arising from our business and our authority over the assets we manage. The violation of these obligations and standards by any of our employees may adversely affect our partners and our business and reputation. Our business often requires that we deal with confidential matters. If our employees were to improperly use or disclose confidential information, or a security breach results in an inadvertent disclosure of such information, we could suffer serious harm to our reputation, financial position and current and future business relationships. It is not always possible to detect or deter employee misconduct or security breaches, and the precautions we take in this regard may not be effective.
Implementation of new investment and growth strategies involves a number of risks that could result in losses and harm to our professional reputation, including the risk that the expected results are not achieved, that new strategies are not appropriately planned for or integrated, that new strategies may conflict with, detract from or compete against our managed assets, and that the investment process, controls and procedures that we have developed will prove insufficient or inadequate. Furthermore, our strategic initiatives may include joint ventures, in which case we will be subject to additional risks and uncertainties in that we may be dependent upon and subject to liability, losses or reputational damage relating to systems, controls and personnel that are not under our complete control or under the control of another.
In addition to impacting our ability to raise and retain third-party capital and pursue investment opportunities, certain of the risks identified herein that may have a negative impact on our reputation also could, in extreme cases, result in our removal as general partner or an acceleration of the liquidation date of the private funds that we manage. The governing agreements of our private funds provide that, subject to certain conditions (which may, particularly in the case of our removal as general partner, include final legal adjudications of the merits of the particular issue), third-party investors in these funds will have the right to remove us as general partner or to accelerate the liquidation date of the fund. Additionally, at any time, investors may seek to terminate a fund and accelerate the liquidation date upon the vote of a super-majority of investors in such fund. A significant negative impact to our reputation would be expected to increase the likelihood that investors could seek to terminate a private fund. This effect would be magnified if, as is often the case, an investor is invested in more than one fund. Such an event, were it to occur, would result in a reduction in the fees we would earn from such fund, particularly if we are unable to maximize the value of the fund’s investments during the liquidation process or in the event of the triggering of a “clawback” for fees already paid out to us as general partner.
We are subject to numerous laws, rules and regulatory requirements which may impact our business, including resulting in financial penalties, loss of business and/or damage to our reputation in instances of non-compliance.
There are many laws, governmental rules and regulations and listing exchange rules that apply to our business and our managed assets. Changes in these laws, rules and regulations, or their interpretation by governmental agencies or the courts, could adversely affect our business, our managed assets, or our prospects, or those of our affiliates, customers, clients or partners. The failure of the Manager, our asset management business or the entities that we manage to comply with these laws, rules and regulations, or with the rules and registration requirements of the respective stock exchanges on which we and they are listed, could adversely affect our reputation and financial condition.
Our business, including our investment advisory and broker-dealer business, is subject to substantial and increasing regulatory compliance obligations and oversight, and this higher level of scrutiny may lead to more regulatory enforcement actions. There continues to be uncertainty regarding the appropriate level of regulation and oversight of asset management businesses in a number of jurisdictions in which we operate. The financial services industry has been the subject of heightened scrutiny and enforcement actions. Regulatory investigations and/or enforcement actions by our regulators could have a material adverse effect on our business and/or reputation. In addition, the introduction of new legislation and increased regulation may result in increased compliance costs and could materially affect the manner in which we conduct our business and adversely affect our profitability. Although there may be some areas where governments in certain jurisdictions propose deregulation, it is difficult to predict the timing and impact of any such deregulation, and we may not materially benefit from any such changes.
Our business is not only regulated in the U.S., but also in other jurisdictions where we conduct operations including the E.U., the U.K., Canada, Brazil, Colombia, Australia, India, South Korea and China. Similar to the environment in the U.S., our business and how we market in jurisdictions outside the U.S. has become subject to further regulation. Governmental agencies around the world have proposed or implemented a number of initiatives and additional rules and regulations that could adversely affect our business and our managed assets, and governmental agencies may propose or implement further rules and regulations in the future. These rules and regulations may impact how we market in these jurisdictions and introduce compliance obligations with respect to disclosure and transparency, as well as restrictions on investor participation and distributions. Such regulations may also prescribe certain capital requirements on our managed assets, and conditions on the leverage our managed assets may employ and the liquidity these managed assets must have. Compliance with additional regulatory requirements will impose additional restrictions and expenses for us and could reduce our operating flexibility and fundraising opportunities.
The broker-dealer side of our managed assets is regulated by the SEC, the various Canadian provincial securities commissions, as well as self-regulatory organizations, including the Financial Industry Regulatory Authority in the U.S. These regulatory bodies may conduct administrative or enforcement proceedings that can result in censure, fine, suspension or expulsion of a broker-dealer, its directors, officers or employees. Such proceedings, whether or not resulting in adverse findings, can require substantial expenditures and can have an adverse impact on the reputation of a broker-dealer.
The advisors of certain of our managed assets are registered as investment advisers with the SEC. Registered investment advisers are subject to the requirements and regulations of the Investment Advisers Act of 1940, which grants U.S. supervisory agencies broad administrative powers, including the power to limit or restrict the carrying on of business for failure to comply with laws or regulations. If such powers are exercised, the possible sanctions that may be imposed include the suspension of individual employees, limitations on the activities in which the investment adviser may engage, suspension or revocation of the investment adviser’s registration, censure and fines. Compliance with these requirements and regulations results in the expenditure of resources, and a failure to comply could result in investigations, financial or other sanctions, and reputational damage.
The Investment Company Act and the rules promulgated thereunder provide certain protections to investors and impose certain restrictions on entities that are deemed “investment companies” under the Investment Company Act. We are not currently, nor do we intend to become, an investment company under the Investment Company Act. To ensure that we are not deemed to be an investment company, we may be required to materially restrict or limit the scope of our operations or plans and the types of acquisitions that we may make, and we may need to modify our organizational structure or dispose of assets that we would not otherwise dispose of. If we were required to register as an investment company, we would face severe limitations on the operation of our business. Among other things, we would be prohibited from engaging in certain business activities (or have conditions placed on our business activities), face restrictions on engaging in transactions with affiliated entities and issuing certain securities or engaging in certain types of financings, be restricted with respect to the amount and types of borrowings we are permitted to obtain, be required to limit the amount of investments that we make as principal, and face other limitations on our activities.
We have and may become subject to additional regulatory and compliance requirements as we expand our product offerings and investment platform which likely will carry additional legal and compliance costs, as well as additional operating requirements that may also increase costs.
Our strategies primarily invest in renewable power and transition, infrastructure, business services, real estate and industrial assets. In doing so, our managed assets are required to comply with extensive and complex municipal, state or provincial, national and international laws and regulations. These laws and regulations can result in uncertainty and delays and impose additional costs, which may adversely affect our results of operations. Changes in these laws and regulations may negatively impact us and our managed assets or may benefit our competitors and their businesses.
Additionally, liability under such laws, rules and regulations may occur without our fault. In certain cases, parties can pursue legal actions against us to enforce compliance as well as seek damages for non-compliance or for personal injury or property damage. Our insurance may not provide sufficient coverage in the event that a successful claim is made against us.
Most of our funds rely on Rule 506 of Regulation D under the U.S. Securities Act to raise capital from investors. Rule 506 is not available to issuers deemed to be “bad actors” under Rule 506 if a covered person of the issuer has been the subject to certain criminal, civil or regulatory disqualifying events. Covered persons include, among others, the issuer, executive officer or other officer participating in the offering of the issuer, any general partner or managing member of the foregoing entities, any promoter of the issuer and any beneficial owner of 20% or more of the issuer’s outstanding voting equity securities. If one or more of our funds were to lose the ability to rely on the Rule 506 exemption because a covered person has been the subject of a disqualifying event, our business, financial condition and results of operations could be materially and adversely affected.
Federal, state and foreign anti-bribery and corruption and trade sanctions laws and restrictions on foreign direct investment applicable to us and our managed assets create the potential for significant liabilities and penalties, the inability to complete transactions, imposition of significant costs and burdens, and reputational harm and we may also be subject to various governmental investigations.
We are from time to time subject to various governmental investigations, audits and inquiries, both formal and informal. These investigations, regardless of their outcome, can be costly, divert management attention and damage our reputation. The unfavorable resolution of such investigations could result in criminal liability, fines, penalties or other monetary or non-monetary sanctions and could materially affect our business or results of operations.
We are subject to a number of laws and regulations governing payments and contributions to public officials or other third parties both domestically and in respect of managed assets abroad, including the U.S. Foreign Corrupt Practices Act of 1977 (the “FCPA”), various federal and state corruption laws, and similar laws in non-U.S. jurisdictions, such as the U.K. Bribery Act 2010, the Canadian Corruption of Foreign Public Officials Act (the “CFPOA”), the Brazilian Clean Companies Act, the Australian Criminal Code Act 1995, the Indian Prevention of Corruption Act, the Chinese Criminal Law and the Anti-Unfair Competition Law (China), and the Bermudian Bribery Act 2016. This global focus on anti-bribery and corruption enforcement may also lead to more investigations, both formal and informal, in this area, the results of which cannot be predicted.
Instances of bribery, fraud, accounting irregularities and other improper, illegal or corrupt practices can be difficult to detect, in particular when conducting due diligence in connection with acquisitions, and fraud and other deceptive practices can be widespread in certain jurisdictions. We invest in emerging market countries that may not have established stringent anti-bribery and corruption laws and regulations, where existing laws and regulations may not be consistently enforced, or that are perceived to have materially higher levels of corruption according to international rating standards. Due diligence on investment opportunities in these jurisdictions is frequently more challenging because consistent and uniform commercial practices in such locations may not have developed or do not meet international standards. Bribery, fraud, accounting irregularities and corrupt practices can be especially difficult to detect in such locations. When acquiring assets in distress, the quality of financial information of the target may also make it difficult to identify irregularities.
The FCPA prohibits bribery of non-U.S. officials, candidates for office and political parties, and requires U.S. companies to keep books and records that accurately and fairly reflect those companies’ transactions. Similar laws in non-U.S. jurisdictions, such as the U.K. Bribery Act 2010 and the CFPOA, as well as other applicable anti-bribery and corruption or related laws in the United States and abroad, may also impose stricter or more onerous requirements than the FCPA, and implementing them may disrupt our business or cause us to incur significantly more costs to comply with those laws. The policies and procedures we have implemented to comply with anti-bribery and corruption legislation may be inadequate. If we fail to comply with such laws and regulations, we could be exposed to claims for damages, financial penalties, incarceration of our employees, reputational harm, restrictions on our operations and other liabilities, which could negatively affect our operating results and financial condition. In addition, we may be subject to successor liability for violations under these laws and regulations or other acts of bribery committed by entities in which we or our managed assets invest.
We are also subject to laws and regulations governing trade and economic sanctions. The Office of Foreign Assets Control of the U.S. Department of the Treasury (“OFAC”), the U.S. Department of Commerce and the U.S. Department of State administer and
enforce various trade control laws and regulations, including economic and trade sanctions based on U.S. foreign policy and national security goals against targeted foreign states, organizations and individuals. These laws and regulations implicate a number of aspects of our business, including servicing existing fund investors, finding new fund investors, and sourcing new investments, as well as activities by our managed assets or other controlled investments. Some of these regulations provide that penalties can be imposed on us for the conduct of our managed assets, even if we have not ourselves violated any regulation. Similar laws in non-U.S. jurisdictions, such as the Special Economic Measures Act (Canada), the United Nations Act (Canada) and the Justice for Victims of Corrupt Foreign Officials Act (Canada), and E.U. sanctions, may also impose restrictions or requirements on us or our managed assets. Applicable laws of various jurisdictions may contain conflicting provisions, making our compliance more difficult. For example, Canada has adopted measures, such as the Canadian Foreign Extraterritorial Measures Act, that could restrict certain persons and entities subject to Canadian jurisdiction from complying with extra-territorial sanctions imposed by other jurisdictions, such as the U.S. Beginning in February 2022, the United States and other countries began imposing meaningful sanctions targeting Russia as a result of actions taken by Russia in Ukraine. We and our managed assets are required to comply with these and potentially additional sanctions imposed by the United States and by other countries, for which the full costs, burdens and limitations on our business and prospects are currently unknown and may become significant.
In addition, the U.S. and many non-U.S. countries that have laws designed to protect national security or to restrict foreign direct investment. For example, under the United States Foreign Investment Risk Review Modernization Act (“FIRRMA”), the Committee on Foreign Investment in the United States (“CFIUS”) has the authority to review, block or impose conditions on investments by non-U.S. persons in U.S. companies or real assets deemed critical or sensitive to the United States. Many non-U.S. jurisdictions have similar laws. For example, the E.U. has adopted an E.U.-wide mechanism to screen foreign investment on national security grounds and most E.U. member states now have a foreign investment screening mechanism in place or has initiated a consultative or legislative process expected to result in the adoption of a new mechanism or amendments to an existing mechanism, adopted a regulation aimed at regulation of foreign subsidies that could distort the internal E.U. market.
Under these laws, governments have the authority to impose a variety of actions, including requirements for the advance screening or notification of certain transactions, blocking or imposing conditions on certain transactions, limiting the size of foreign equity investments or control by foreign investors, and restricting the employment of foreigners as key personnel. These actions could limit our ability to find suitable investments, cause delays in consummating transactions, result in the abandonment of transactions, and impose burdensome operational requirements on us or our managed assets. These laws could also negatively impact our fundraising and syndication activities by causing us to exclude or limit certain investors in our funds or co-investors for our transactions. Moreover, these laws may make it difficult for us to identify suitable buyers for our investments that we want to exit and could constrain the universe of exit opportunities generally. Complying with these laws imposes potentially significant costs and complex additional burdens, and any failure by us or our managed assets to comply with them could expose us to significant penalties, sanctions, loss of future investment opportunities, additional regulatory scrutiny, and reputational harm.
Our cash flow, all of which will come from our asset management business, must be available to meet our financial obligations when due and enable us to capitalize on investment opportunities when they arise.
We employ debt and other forms of leverage in the ordinary course of business to enhance returns. We are therefore subject to the risks associated with debt financing (directly and indirectly through our managed assets) and refinancing, including but not limited to the following: (i) our cash flow may be insufficient to meet required payments of principal and interest; (ii) payments of principal and interest on borrowings may leave us with insufficient cash resources to pay operating expenses and dividends; (iii) if we are unable to obtain committed debt financing for potential acquisitions or can only obtain debt at high interest rates or on other unfavorable terms, we may have difficulty completing acquisitions or may generate profits that are lower than would otherwise be the case; (iv) we may not be able to refinance indebtedness at maturity due to company and market factors such as the estimated cash flow produced by our assets, the value of our assets, liquidity in the debt markets and/or financial, competitive, business and other factors; and (v) if we are able to refinance our indebtedness, the terms of a refinancing may not be as favorable as the original terms for such indebtedness. If we are unable to refinance our indebtedness on acceptable terms, or at all, we may need to utilize available liquidity, which would reduce our ability to pursue new investment opportunities, or we may need to dispose of one or more of our or our managed assets on disadvantageous terms, or raise equity, thereby causing dilution to existing shareholders. Regulatory changes or changes in economic or market conditions may also result in higher borrowing costs and reduced access to credit.
The terms of our various credit agreements and other financing documents may require us to comply with a number of customary financial and other covenants, such as maintaining debt service coverage and leverage ratios, adequate insurance coverage and certain credit ratings. These covenants may limit our flexibility in conducting our business and breaches of these covenants could result in defaults under the instruments governing the applicable indebtedness, even if we have satisfied and continue to satisfy our payment obligations.
A large proportion of our managed assets include physical assets and securities that can be hard to sell, especially if market conditions are poor. Further, because our investment strategy can entail our having representation on public company boards, we may be restricted in our ability to effect sales during certain time periods. A lack of liquidity could limit our ability to vary our managed assets promptly in response to changing economic or investment conditions. Additionally, if financial or operating difficulties of other owners result in distress sales, such sales could depress asset values in the markets in which we manage assets. The restrictions inherent in managing physical assets could reduce our ability to respond to changes in market conditions and could adversely affect the performance of investments across our fund strategies, our financial condition and our results of operations.
Because there is significant uncertainty in the valuation of, or in the stability of the value of illiquid or non-public investments, the fair values of such investments do not necessarily reflect the prices that would actually be obtained when such investments are realized. Realizations at values significantly lower than the values at which investments have been recorded would result in losses, a decline in asset management fees and the potential loss of carried interest and incentive fees.
Additionally, from time to time, we may guarantee the obligations of other entities that we manage. If we are required to fund these commitments and are unable to do so, this could result in damages being pursued against us or a loss of opportunity through default under contracts that are otherwise to our benefit.
We may be exposed to risks associated with acquisitions.
A part of the Manager’s growth strategy involves seeking acquisition opportunities. We will face competition for acquisitions, including from our competitors, many of whom will have greater financial resources than us. There can be no assurance that we will identify and successfully complete acquisitions that will advance our growth strategy, or at all. Though we are not currently pursuing any strategic acquisitions, future acquisitions will likely involve some or all of the following risks, which could materially and adversely affect our business, financial condition or results of operations: the difficulty of integrating the acquired operations and personnel into our current operations; potential disruption of our current operations; diversion of resources, including our management’s time and attention; the difficulty of managing the growth of a larger organization; the risk of entering markets in which we have little experience; the risk of becoming involved in labor, commercial or regulatory disputes or litigation related to the new enterprise; the risk of environmental or other liabilities associated with the acquired business; and the risk of a change of control resulting from an acquisition triggering rights of third parties or government agencies under contracts with, or authorizations held by, the managed assets being acquired. It is possible that due diligence investigations into businesses being acquired may fail to uncover all material risks, or to identify a change of control trigger in a material contract or authorization, or that a contractual counterparty or government agency may take a different view on the interpretation of such a provision to that taken by us, thereby resulting in a dispute.
Foreign exchange rate fluctuations could adversely impact our aggregate foreign currency exposure and hedging strategies may not be effective.
We have pursued and intend to continue to pursue growth opportunities in international markets, and often deploy capital in countries where the U.S. dollar is not the local currency. As a result, we are subject to foreign currency risk due to potential fluctuations in exchange rates between foreign currencies and the U.S. dollar. A significant depreciation in the value of the currency utilized in one or more countries where we have a significant presence may have a material adverse effect on the results of our operations and financial position. In addition, we are active in certain markets where economic growth is dependent on the price of commodities and the currencies in these markets can be more volatile as a result.
Our business and our managed assets are impacted by changes in currency rates, interest rates, commodity prices and other financial exposures. We selectively utilize financial instruments to manage these exposures, including credit default swaps and other derivatives to hedge certain of our financial positions. However, a significant portion of these risks may remain unhedged. We may also choose to establish unhedged positions in the ordinary course of business.
There is no assurance that hedging strategies, to the extent they are used, will fully mitigate the risks they are intended to offset. Additionally, derivatives that we use are also subject to their own unique set of risks, including counterparty risk with respect to the financial well-being of the party on the other side of these transactions and a potential requirement to fund mark-to-market adjustments. Our financial risk management policies may not ultimately be effective at managing these risks.
The Dodd-Frank Wall Street Reform and Consumer Protection Act of 2010 and similar laws in other jurisdictions impose rules and regulations governing oversight of the over-the-counter derivatives market and its participants. These regulations may impose
additional costs and regulatory scrutiny on us. If our derivative transactions are required to be executed through exchanges or regulated facilities, we will face incremental collateral requirements in the form of initial margin and require variation margin to be cash settled on a daily basis. Such an increase in margin requirements (relative to bilateral agreements) or a more restricted list of securities that qualify as eligible collateral, would require us to hold larger positions in cash and treasuries, which could reduce income. We cannot predict the effect of changing derivatives legislation on our hedging costs, our hedging strategy or its implementation, or the risks that we hedge. Regulation of derivatives may increase the cost of derivative contracts, reduce the availability of derivatives to protect against operational risk and reduce the liquidity of the derivatives market, all of which may reduce our use of derivatives and result in the increased volatility and decreased predictability of our cash flows.
We may be required to make temporary investments and backstop commitments with respect to our business and managed assets and may be unable to syndicate, assign or transfer such investments and commitments.
We periodically may be asked to enter into agreements that commit us to acquire or stand in place of another entity to acquire assets or securities in order to support our managed assets with the expectation that our commitment is temporary. For example, we may acquire an asset suitable for a particular managed business that is fundraising and warehouse that asset through the fundraising period before transferring the asset to the managed business for which it was intended. As another example, our asset management business may commit capital for a particular acquisition transaction as part of a consortium alongside certain of our managed assets with the expectation that we will syndicate or assign all or a portion of our own commitment to investors prior to, at the same time as, or subsequent to, the anticipated closing of the transaction. In all of these cases, our support is intended to be of a temporary nature and we engage in this activity in order to further the growth and development of our asset management business.
Even if our asset management business’ direct participation is intended to be of a temporary nature, our asset management business may be unable to syndicate, assign or transfer its interest or commitment as our asset management business intended and therefore may be required to take or keep ownership of assets or securities for an extended period. This would increase the amount of our asset management business’ own capital deployed to certain assets and could have an adverse impact on our asset management business’ liquidity, which may negatively impact its ability to meet other financial commitments.
Rising interest rates could increase our interest costs and adversely affect our financial performance.
Many long-life assets are interest rate sensitive. Increases in interest rates will, other things being equal, decrease the value of an asset by reducing the present value of the cash flows expected to be produced by such asset. As the present value of an income-producing asset may decline as a result of interest rate increases, certain financial and other covenants under credit agreements governing such asset could be breached, even if we have satisfied and continue to satisfy our payment obligations thereunder. Such a breach could result in negative consequences on our financial performance and results of operations.
Additionally, any of our debt or preferred shares that are subject to variable interest rates, either as an obligation with a variable interest rate or as an obligation with a fixed interest rate that resets into a variable interest rate in the future, are subject to interest rate risk. Further, the value of any debt or preferred share that is subject to a fixed interest rate will be determined based on the prevailing interest rates and, accordingly, this type of debt or preferred share is also subject to interest rate risk.
In many jurisdictions in which we operate, a period of sharply increasing interest rates may cause certain market dislocations that could negatively impact our financial performance, increase the cost and impact the availability of debt financing and thereby negatively impact the ability of our managed assets to obtain attractive financing or refinancing and could increase the cost of such financing if obtained. Many factors may impact us and our managed assets, including interest rate increases, which would impact the amount of revenue generated by our managed assets and may lead to an increase in the amount of cash required to service our obligations.
Our revenues may be adversely affected by a decline in the size or pace of investments made by our managed assets.
The revenues that we earn are driven in part by the pace at which our funds make investments and the size of those investments, and a decline in the pace or the size of such investments may reduce our revenues. In particular, in recent years we have meaningfully increased the number of perpetual strategies we offer and the assets under management in such strategies. The fees we earn from our perpetual capital strategies represent a significant and growing portion of our overall revenues. If our funds, including our perpetual capital strategies, are unable to deploy capital at a sufficient pace, our revenues would be adversely impacted. Many factors could cause a decline in the pace of investment, including a market environment characterized by relative high prices, the inability of our investment professionals to identify attractive investment opportunities, competition for such opportunities among other potential acquirers, decreased availability of capital on attractive terms. Further, we may fail to consummate identified investment opportunities because of business, regulatory or legal complexities or uncertainty and adverse developments in the markets in which we operate, financial markets or geopolitical conditions, and our ability to deploy capital in certain countries may be adversely impacted by government policy changes and regulations.
Our revenue, earnings, net income and cash flow can materially vary from quarter to quarter, which may affect our earnings growth and dividend on a quarterly basis and can affect the trading price of the Class A Shares.
Our revenue, net income and cash flow, substantially all of which is derived from our asset management business, can vary materially due to our reliance on incentive distributions and performance-based returns, such as carried interest. We may experience fluctuations in our results, including our revenue and net income, from quarter to quarter due to a number of other factors, including timing of realizations, changes in the valuations of our funds’ investments, changes in the amount of distributions, dividends or interest paid in respect of investments, changes in our operating expenses, the degree to which we encounter competition and general economic and market conditions. Achieving steady growth in net income and cash flow on a quarterly basis may be difficult, which could in turn cause our dividend and our ability to pay dividends to fluctuate and lead to large adverse movements or general increased volatility in the price of the Class A Shares. We also do not provide any guidance regarding our expected quarterly and annual operating results. The lack of guidance may affect the expectations of public market analysts and could cause increased volatility in the Class A Shares.
Our cash flow may fluctuate significantly due to the fact that we receive carried interest from certain of our funds only when investments are realized and achieve a certain preferred return. The payment of performance-based returns, including carried interest, depends on the applicable funds’ performance and opportunities for realizing gains, which may be limited. It takes a substantial period of time to identify attractive investment opportunities, to raise all the funds needed to make an investment and then to realize the cash value (or other proceeds) of an investment through a sale, public offering, recapitalization or other exit. Even if an investment proves to be profitable, it may be a number of years before any profits can be realized in cash (or other proceeds). We cannot predict when, or if, any realization of investments will occur.
The mark-to-market valuations of investments made by our funds are subject to volatility driven by economic and market conditions. Economic and market conditions may also negatively impact our realization opportunities.
The valuations of and realization opportunities for investments made by our funds could also be subject to high volatility as a result of uncertainty regarding governmental policy with respect to, among other things, tax, financial services regulation, international trade, immigration, healthcare, labor, infrastructure and energy.
In addition, upon the realization of a profitable investment by any of our funds featuring performance-based returns and prior to our receiving any carried interest in respect of that investment, 100% of the proceeds of that investment must generally be paid to the investors in such fund until they have recovered certain fees and expenses and achieved a certain return on all realized investments by that fund as well as a recovery of any unrealized losses. A particular realization event may have a significant impact on our results for that particular quarter that may not be replicated in subsequent quarters. We recognize revenue on investments in our funds based on our allocable share of realized and unrealized gains (or losses) reported by such funds, and a decline in realized or unrealized gains, or an increase in realized or unrealized losses, would adversely affect our revenue and possibly cash flow, which could further increase the volatility of our quarterly results. Because our funds have preferred return thresholds to investors that need to be met prior to our receiving any carried interest or other performance-based returns, substantial declines in the carrying value of the investment portfolios of such funds can significantly delay or eliminate any performance-based returns paid to us in respect of that fund since the value of the assets in the fund would need to recover to their aggregate cost basis plus the preferred return over time before we would be entitled to receive any performance-based returns, including carried interest, from that fund.
The timing and receipt of performance-based returns also varies with the life cycle of our funds. During periods in which a relatively large portion of our assets under management is attributable to funds and investments in their “harvesting” period, our funds would make larger distributions than in the fundraising or investment periods that precede harvesting. During periods in which a significant portion of our assets under management is attributable to funds that are not in their harvesting periods, we may receive substantially lower performance-based returns, including carried interest.
The varying frequency of payments of our different funds and strategies will contribute to the volatility of our cash flow. Furthermore, we earn this incentive income only if the net asset value of a vehicle has increased or, in the case of certain vehicles, increased beyond a particular return threshold, or if the vehicle has earned a net profit. Certain of these vehicles also have “high water marks” whereby we do not earn incentive income during a particular period even though the vehicle had positive returns in such period as a result of losses in prior periods. If one of these vehicles experiences losses, we will not earn incentive income from it until it surpasses the previous high water mark. The incentive income we earn is therefore dependent on the net asset value or the net profit of the vehicle, which could lead to significant volatility in our results.
Our access to retail investors and selling retail directed products in numerous jurisdictions opens us up to potential litigation and regulatory enforcement risks.
In 2021, we created a business group in partnership with Oaktree to serve the global wealth management channel, delivering access to Brookfield and Oaktree’s private and public funds. Our goal is to increase the number and type of investment products we offer to high-net-worth individuals and mass affluent investors in the U.S. and other jurisdictions around the world. In some cases, our unregistered funds are distributed to retail investors indirectly through third-party managed vehicles sponsored by brokerage firms, private banks or third-party feeder providers, and in other cases directly to the qualified clients of private banks, independent investment advisors and brokers. In other cases, we create investment products specifically designed for direct investment by retail investors in the U.S., some of whom are not accredited investors, or similar investors in non-U.S. jurisdictions, including in Europe. Such investment products are regulated by the SEC in the U.S. and by other similar regulatory bodies in other jurisdictions.
Accessing retail investors and selling retail directed products expose us to new and greater levels of risk, including heightened litigation and regulatory enforcement risks. To the extent distribution of retail products is through new channels, including through an increasing number of distributors with whom we engage, we may not be able to effectively monitor or control the manner of their distribution, which could result in litigation or regulatory action against us, including with respect to, among other things, claims that products distributed through such channels are distributed to customers for whom they are unsuitable or that they are distributed in an otherwise inappropriate manner. Although we seek to ensure through due diligence and onboarding procedures that the third-party channels through which retail investors access our investment products conduct themselves responsibly, we are exposed to the risks of reputational damage and legal liability to the extent such third parties improperly sell our products to investors. This risk is heightened by the continuing increase in the number of third parties through whom we distribute our investment products around the world and who we do not control. For example, in certain cases, we may be viewed by a regulator as responsible for the content of materials prepared by third-party distributors.
Similarly, there is a risk that employees involved in the direct distribution of our products, or employees who oversee independent advisors, brokerage firms and other third parties around the world involved in distributing our products, do not follow our compliance and supervisory procedures. In addition, the distribution of retail products, including through new channels whether directly or through market intermediaries, could expose us to allegations of improper conduct and/or actions by state and federal regulators in the U.S. and regulators in jurisdictions outside of the U.S. with respect to, among other things, product suitability, investor classification, compliance with securities laws, conflicts of interest and the adequacy of disclosure to customers to whom our products are distributed through those channels.
As we expand the distribution of products to retail investors outside of the U.S., we are increasingly exposed to risks in non-U.S. jurisdictions. While these risks are similar to those that we face in the distribution of products to retail investors in the U.S., securities laws and other applicable regulatory regimes in many jurisdictions, including the U.K. and the European Economic Area, are extensive, complex, and vary by local jurisdiction. As a result, this expansion subjects us to additional litigation and regulatory risk.
In addition, our initiatives to expand our retail investor base, including outside of the U.S., require the investment of significant time, effort and resources, including the potential hiring of additional personnel, the implementation of new operational, compliance and other systems and processes and the development or implementation of new technology. There is no assurance that our efforts to grow our retail assets under management will be successful.
Ineffective maintenance of our culture or ineffective management of human capital could adversely impact our business and financial performance.
Our ability to compete effectively in our business will depend upon our ability to attract new employees and retain and motivate our existing employees. Our senior management team has a significant role in our success and oversees the execution of our investment strategies. If we are unable to attract and retain qualified employees, our ability to compete successfully and achieve our business objectives could be limited, and our business, financial condition and results of operations could be negatively impacted.
Our ability to retain and motivate our management team, attract suitable replacements should any members of our management team leave, or attract new investment professionals as our business grows, is dependent on, among other things, the competitive nature of the employment market and the career opportunities and compensation that we can offer. In all of our markets, we face intense competition in connection with the attraction and retention of qualified employees.
We may experience departures of key professionals in the future. We cannot predict the impact that any such departures will have on our ability to achieve our objectives. Our senior management team possesses substantial experience and expertise and has strong business relationships with investors in our managed assets and other members of the business communities and industries in which we operate.
As a result, the loss of these personnel could jeopardize our relationships with investors in our managed assets and other members of the business communities and industries in which we operate and result in the reduction of our assets under management or fewer investment opportunities. Accordingly, the loss of services from key professionals or a limitation in their availability could adversely impact our financial condition and cash flow. Furthermore, such a loss could be negatively perceived in the capital markets.
Additionally, the departure of certain individuals could trigger certain “key person” provisions in the documentation governing certain of our private funds, which would permit the limited partners of those funds to suspend or terminate the funds’ investment periods or withdraw their capital prior to the expiration of the applicable lock-up date. Our key person provisions vary by both strategy and fund and, with respect to each strategy and fund, are typically tied to multiple individuals, meaning that it would require the departure of more than one individual to trigger the key person provisions. Our human capital risks may be exacerbated by the fact that we do not maintain any key person insurance.
The conduct of our business and the execution of our strategy rely heavily on teamwork. Our continued ability to respond promptly to opportunities and challenges as they arise depends on co-operation and co-ordination across our organization and our team-oriented management structure, which may not materialize in the way we expect.
A portion of the workforce in some of our managed assets is unionized. If we are unable to negotiate acceptable collective bargaining agreements with any of our unions as existing agreements expire, we could experience a work stoppage, which could result in a significant disruption to the affected operations, higher ongoing labor costs and restrictions on our ability to maximize the efficiency of our operations, all of which could have an adverse effect on our financial results.
Political instability, changes in government policy or unfamiliar cultural factors could adversely impact the value of our investments.
We are subject to geopolitical uncertainties in all jurisdictions in which we operate. We make investments in businesses that are based outside of North America and we may pursue investments in unfamiliar markets, which may expose us to additional risks not typically associated with investing in North America. We may not properly adjust to the local culture and business practices in such markets, and there is the prospect that we may hire personnel or partner with local persons who might not comply with our culture and ethical business practices; either scenario could result in the failure of our initiatives in new or existing markets and lead to financial losses for us and our managed assets. There are risks of political instability in several of our major markets and in other parts of the world in which we conduct business from factors such as political conflict, tariffs and other protectionist trade policies, including the encouragement of the onshoring of manufacturing in the U.S. and other countries, income inequality, refugee migration, terrorism, armed conflict, the potential break-up of countries or political-economic unions and political corruption; the materialization of one or more of these risks could negatively affect our financial performance.
For example, recent and ongoing conflict in the Middle East and Eastern Europe have contributed to global economic uncertainty, resulted in volatility in fuel prices, amplified existing supply chain challenges caused by increases in shipping costs (including as a result of conflicts and other attacks in or near shipping channels) and heightened cybersecurity disruptions and threats. Further economic and political instability and the escalation or expansion of armed conflict in Eastern Europe, the Middle East, or elsewhere in the world could significantly disrupt the free movement of goods, services and people, have a destabilizing effect on energy markets and result in potential higher costs of conducting business. Similarly, an inability of local and national governments to effectively manage ongoing political disputes could result in local, regional and/or global instability. The materialization of one or more of these risks could negatively affect our financial performance and adversely impact our business.
Any existing or new operations may be subject to significant political, economic and financial risks, which vary by country, and may include: (i) changes in government policies and regulations, including protectionist policies, or personnel; (ii) changes in general economic or social conditions; (iii) restrictions on currency transfer or convertibility; (iv) changes in labor relations; (v) military conflict, political instability and civil unrest; (vi) less developed or efficient financial markets than in North America; (vii) the absence of uniform accounting, auditing and financial reporting standards, practices and disclosure requirements; (viii) less government supervision and regulation; (ix) a less developed legal or regulatory environment; (x) heightened exposure to corruption risk; (xi) political hostility to investments by foreign investors; (xii) less publicly available information in respect of companies in non-North American markets; (xiii) adversely higher or lower rates of inflation; (xiv) higher transaction costs; (xv) difficulty in enforcing contractual obligations and expropriation or confiscation of assets; and (xvi) fewer investor protections.
Unforeseen political events in markets where we have significant investors and/or where we have managed assets or may look to for further growth of our assets and businesses, such as the U.S., Canadian, Brazilian, Australian, European, Middle Eastern and Asian markets, may create economic uncertainty that has a negative impact on our financial performance. Such uncertainty could
cause disruptions to our businesses, including affecting our managed assets and/or our relationships with our investors, customers and suppliers, as well as altering the relationship among tariffs and currencies, including the value of foreign currencies relative to the U.S. dollar. Disruptions and uncertainties could adversely affect our financial condition, operating results and cash flows. In addition, political outcomes in the markets in which we operate may also result in legal uncertainty and potentially divergent national laws and regulations, which can contribute to general economic uncertainty. Economic uncertainty impacting us and our managed assets could be exacerbated by supply chain disruptions, trade policy and geopolitical tensions.
Unfavorable economic conditions or changes in the industries in which we operate could adversely impact our financial performance.
We are exposed to local, regional, national and international economic conditions and other events and occurrences beyond our control, including, but not limited to, the following: short-term and long-term interest rates; inflation; credit and capital market volatility; business investment levels; government spending levels; sovereign debt risks; consumer spending levels; changes in laws, rules or regulations; trade barriers; supply chain disruptions; commodity prices; currency exchange rates and controls; national and international political circumstances (including wars, terrorist acts or security operations); catastrophic events (including pandemics/epidemics, earthquakes, tornadoes or floods); the rate and direction of economic growth; and general economic uncertainty. On a global basis, certain industries and sectors have created capacity that anticipated higher growth, which has caused volatility across all markets, including commodity markets, which may have a negative impact on our financial performance. Unfavorable economic conditions could affect the jurisdictions in which our entities are formed and where we and our managed assets operate businesses, and may cause a reduction in: (i) securities prices; (ii) the liquidity of investments made by our managed assets; (iii) the value or performance of the investments made by our managed assets; and (iv) the ability of us and our managed assets to raise or deploy capital, each of which could adversely impact our financial condition.
In general, a decline in economic conditions, either in the markets or industries in which our strategies invest, or both, will result in downward pressure on our operating margins and asset values as a result of lower demand and increased price competition for the services and products that we provide. In particular, given the importance of the U.S. to our operations, an economic downturn in this market could have a significant adverse effect on our operating margins and asset values.
Many of our private funds have a finite life that may require us to exit an investment made in a fund at an inopportune time. Volatility in the exit markets for these investments, increasing levels of capital required to finance companies to exit and rising enterprise value thresholds to go public or complete a strategic sale can all contribute to the risk that we will not be able to exit a private fund investment successfully. We cannot always control the timing of our private fund investment exits or our realizations upon exit. See “—Actions or conduct that have a negative impact on our investors’ or stakeholders’ perception of us could adversely impact our ability to attract and/or retain investor capital and generate fee revenue”. If global economic conditions deteriorate, our investment performance could suffer, resulting in, for example, the payment of less or no carried interest to us. The payment of less or no carried interest to us could cause our cash flow from operations to decrease, which could materially adversely affect our liquidity position and the amount of cash we have on hand to conduct our operations. A reduction in our cash flow from our Fee-Bearing Capital strategies and products could, in turn, require us to rely on other sources of cash such as the capital markets, which may not be available to us on acceptable terms, or debt and other forms of leverage.
In addition, in an economic downturn, there is an increased risk of default by counterparties to our investments and other transactions. In these circumstances, it is more likely that such transactions will fail or perform poorly, which may in turn have a material adverse effect on our business, results of operation and financial condition.
Inflationary pressures could adversely impact our businesses.
Our managed assets are impacted by heightened inflationary pressures. High inflation continued to drive tightening in monetary policies by major central banks in 2023, posing risks to economic growth ahead. Central banks in various countries may continue to raise interest rates in response to concerns about inflation, which, coupled with reduced government spending and volatility in financial markets, may have the effect of further increasing economic uncertainty and heightening these risks. Interest rate increases or other government actions taken to reduce inflation could also result in recessionary pressures in many parts of the world. Interest rate risk poses a significant market risk to us as a result of interest rate-sensitive assets and liabilities held by us and our managed assets. Higher interest rates or elevated interest rates for a sustained period could also result in an economic slowdown. Economic contraction or further deceleration in the rate of growth in certain industries, sectors or geographies may contribute to poor financial results at our managed assets. A significant portion of the upward pressure on prices has been attributed to the rising costs of labor, energy, food, motor vehicles and housing and continuing global supply-chain disruptions. Inflation increases may or may not be transitory and future inflation may be impacted by labor market constraints reducing, supply-chain disruptions easing and commodity prices moderating. While regulated and contractual arrangements in our managed assets can provide significant protection against inflationary pressures, any sustained upward trajectory in the inflation rate may still have an impact on our managed assets and our investors, and could impact our ability to source suitable investment opportunities, match or exceed prior investment strategy performance and secure attractive debt financing, all of which could adversely impact our managed assets and our growth and capital recycling initiatives.
Catastrophic events (or combination of events), such as earthquakes, tornadoes, floods, wildfires, pandemics/epidemics, climate change, military conflict/war or terrorism/sabotage, could adversely impact our financial performance.
Our managed assets could be exposed to effects of catastrophic events, such as severe weather conditions, natural disasters, major accidents, pandemics/epidemics, acts of malicious destruction, climate change, war/military conflict or terrorism, which could materially adversely impact our operations.
A local, regional, national or international outbreak of a contagious disease, such as COVID-19, which spreads across the globe at a rapid pace impacting global commercial activity and travel, or future public health crises, epidemics or pandemics, could materially and adversely affect our results of operations and financial condition due to disruptions to commerce, reduced economic activity and other unforeseen consequences that are beyond our control.
Natural disasters and ongoing changes to the physical climate in which we and our managed assets operate may have an adverse impact on our business, financial position, results of operations or cash flows. Changes in weather patterns or extreme weather (such as floods, wildfires, droughts, hurricanes and other storms) may negatively affect our managed assets’ operations or damage assets that we may own or develop. Further, rising sea levels could, in the future, affect the value of any low-lying coastal real assets that we may manage. Climate change may increase the frequency and severity of severe weather conditions and may change existing weather patterns in ways that are difficult to anticipate. Responses to these changes could result in higher costs, such as the imposition of new property taxes and increases in insurance rates or additional capital expenditures.
Our managed assets forming part of our commercial office strategy are concentrated in large metropolitan areas, some of which have been or may be perceived to be threatened by terrorist attacks or acts of war. Furthermore, many of such properties consist of high rise buildings that may also be subject to this actual or perceived threat. The perceived threat of a terrorist attack or outbreak of war could negatively impact our ability to lease office space in our managed real estate portfolio. Renewable power and infrastructure assets that we manage, such as roads, railways, power generation facilities and ports, may also be targeted by terrorist organizations or in acts of war. Any damage or business interruption costs as a result of uninsured or underinsured acts of terrorism or war could result in a material cost to us and could adversely affect our business, financial condition or results of operation. Adequate terrorism insurance may not be available at rates we believe to be reasonable in the future. These risks could be heightened by foreign policy decisions of the U.S. (where we have significant operations) and other influential countries or general geopolitical conditions.
Additionally, our managed assets rely on free movement of goods, services and capital from around the globe. Any slowdown in international investment, business or trade as a result of catastrophic events could also have a material adverse effect on our business, financial position, results of operations or cash flows.
Ineffective management of environmental and sustainability issues, including climate change, and inadequate or ineffective health and safety programs could damage our reputation, adversely impact our financial performance and lead to regulatory action.
There is increasing stakeholder interest in sustainability considerations and how they are managed. Sustainability considerations include climate change, human capital and labor management, corporate governance, diversity and privacy and data security, among others. Increasingly, investors and lenders are incorporating sustainability considerations into their investment or lending process, respectively, alongside traditional financial considerations. Investors or potential investors may not invest in all our products given certain industries in which we operate. If we are unable to successfully integrate sustainability considerations into our practices, we may incur a higher cost of capital, lower interest in our debt securities and/or equity securities or otherwise face a negative impact on our business, operating results and cash flows and result in reputational damage.
Certain of our managed assets may be subject to compliance with laws, regulations, regulatory rules and/or guidance relating to sustainability, and any failure to comply with these laws, regulations, regulatory rules or guidance could expose us to material adverse consequences, including loss, limitations on our ability to undertake licensable business, legal liabilities, financial and non-financial sanctions and penalties, and/or reputational damage. New sustainability requirements imposed by jurisdictions in which we do business, such as the E.U. Sustainable Finance Disclosure Regulation (2019/2088), could (a) result in additional compliance costs, disclosure obligations or other implications or restrictions; and/or (b) impact our established business practices, cost base and, by extension, our profitability.
Sustainability-related requirements and market practices differ by region, industry and issue and are evolving dynamically, and the sustainability requirements applicable to us, our managed assets or our assessment of such requirements or practices may change over time. Under emerging sustainability requirements, we may be required to classify our businesses against, or determine the alignment of underlying investments under, Sustainability-related legislative and regulatory criteria and taxonomies, some of which can be open to subjective interpretation. Our view on the appropriate classifications may develop over time, including in response to statutory or regulatory guidance or changes in industry approach to classification. A change to the relevant classification may require further actions to be taken, for example it may require further disclosures, or it may require new processes to be set up to capture data, which may lead to additional cost, disclosure obligations or other implications or restrictions.
The transition to a lower-carbon economy has the potential to be disruptive to traditional business models and investment strategies. Efforts to limit global warming may give rise to changes in regulations, reporting and consumer sentiment that could have a negative impact on our existing operations by increasing the costs of operating our business or reducing demand for our products and services. The adverse effects of climate change and related regulation at state, provincial, federal or international levels could have a material adverse effect on our business, financial position, results of operations or cash flows.
The ownership and operation of some of our managed assets carry varying degrees of inherent risk or liability related to worker health and safety and the environment, including the risk of government-imposed orders to remedy unsafe conditions and contaminated lands and potential civil liability. Compliance with health, safety and environmental standards and the requirements set out in the relevant licenses, permits and other approvals obtained by the managed assets is crucial.
Our managed assets have incurred and will continue to incur significant capital and operating expenditures to comply with sustainability requirements, including health and safety standards, to obtain and comply with licenses, permits and other approvals, and to assess and manage potential liability exposure. Nevertheless, they may be unsuccessful in obtaining or maintaining an important license, permit or other approval or become subject to government orders, investigations, inquiries or other proceedings (including civil claims) relating to health, safety and environmental matters, any of which could have a material adverse effect on us.
Health, safety and environmental laws and regulations can change rapidly and significantly, and we and/or our managed assets may become subject to more stringent laws and regulations in the future. The occurrence of any adverse health, safety or environmental event, or any changes, additions to, or more rigorous enforcement of, health, safety and environmental standards, licenses, permits or other approvals could have a significant impact on operations and/or result in material expenditures.
Owners and operators of real assets may become liable for the costs of removal and remediation of certain hazardous substances released or deposited on or in their properties, or at other locations regardless of whether the owner and operator caused the release or deposit of such hazardous materials. These costs could be significant and could reduce cash available for our managed assets. The failure to remove or remediate such substances, if any, could adversely affect our ability to sell our assets or to borrow using these assets as collateral, and could potentially result in claims or other proceedings.
Certain of our managed assets are involved in using, handling or transporting substances that are toxic, combustible or otherwise hazardous to the environment and may be in close proximity to environmentally sensitive areas or densely populated communities. If a leak, spill or other environmental incident occurred, it could result in substantial fines or penalties being imposed by regulatory authorities, revocation of licenses or permits required to operate the business, the imposition of more stringent conditions in those licenses or permits or legal claims for compensation (including punitive damages) by affected stakeholders.
Global sustainability challenges, such as carbon emissions, privacy and data security, demographic shifts and regulatory pressures are introducing new risk factors for us that we may not have dealt with previously. We are also engaged with various sustainability frameworks and organizations through which we have stated certain ambitions and commitments regarding sustainability best practices. If we are unable to successfully manage our sustainability compliance, this could have a negative impact on our reputation and our ability to raise capital and could be detrimental to our economic value and the value of our managed assets.
Failure to maintain the security of our information and technology systems could have a material adverse effect on us.
We rely on the use of technology and information systems, many of which are controlled by third-party service providers, which may not be able to accommodate our growth or may increase in cost and may become subject to cyber-terrorism or other compromises and shut-downs, and any failures or interruptions of these systems could adversely affect our businesses and results of operations.
We and our managed assets operate in businesses that are dependent on information systems and other technology, such as computer systems used for information storage, processing, administrative and commercial functions as well as the machinery and other equipment used in certain parts of our operations. In addition, our managed assets rely on telecommunication services to interface with their business networks and customers. The information and embedded systems of key business partners and regulatory agencies are also important to our operations. We rely on this technology functioning as intended. Our information systems and technology may not continue to be able to accommodate our growth, and the cost of maintaining such systems may increase from its current level. Such a failure to accommodate growth, or an increase in costs related to such information systems, could have a material adverse effect on us.
We rely heavily on certain financial, accounting, communications and other data processing systems. We collect, store and use large amounts of sensitive information, including personally identifiable information, through our information technology systems. Our information technology systems face ongoing cybersecurity threats and attacks, which could result in the failure of such infrastructure. We may in the future be subject to cyber-terrorism or other cybersecurity risks or other breaches of information technology security, noting the increasing frequency, sophistication and severity of these kinds of incidents. In particular, our information technology systems may be subject to cyber terrorism intended to obtain unauthorized access to our proprietary information, personally identifiable information or to client or third-party data stored on our systems, destroy or disable our data, and/or that of our business partners, disclose confidential data in breach of data privacy legislation, destroy data or disable, degrade or sabotage our systems, through the introduction of computer viruses, cyber-attacks and other means. Such attacks could originate from a wide variety of sources, including internal actors or unknown third parties. Further, unauthorized parties may also gain physical access to our facilities and infiltrate our information systems or attempt to gain access to information and data. The sophistication of the threats continue to evolve and grow, including the risk associated with the use of emerging technologies, such as artificial intelligence and quantum computing, for nefarious purposes. We cannot predict what effects such cyber-attacks or compromises or shut-downs may have on our business and on the privacy of the individuals or entities affected, and the consequences could be material. Cyber incidents may remain undetected for an extended period, which could exacerbate these consequences. A significant actual or potential theft, loss, corruption, exposure, fraudulent, unauthorized or accidental use or misuse of investor, policyholder, employee or other personally identifiable or proprietary business data, whether by third parties or as a result of employee malfeasance or otherwise, non-compliance with our contractual or other legal obligations regarding such data or intellectual property or a violation of our privacy and security policies with respect to such data could result in significant remediation and other costs, fines, litigation and regulatory actions against us by governments, various regulatory organizations or exchanges, or affected individuals, in addition to significant reputational harm and/or financial loss, and it may not be possible to recover losses suffered from such incidents under our insurance policies.
In addition, our operating equipment may not continue to perform as it has in the past, and there is a risk of equipment failure due to wear and tear, latent defect, design or operator errors or early obsolescence, among other things.
A breach of our cyber security measures or the failure or malfunction of any of our computerized business systems, associated backup or data storage systems could cause us to suffer a disruption in one or more parts of our business and experience, among other things, financial loss, reputational damage, a loss of business opportunities, misappropriation or unauthorized release of confidential or personal information, damage to our systems and those with whom we do business, violation of privacy and other laws, litigation, regulatory penalties and remediation and restoration costs as well as increased costs to maintain our systems.
We are reliant on third party service providers for certain aspects of our business, including for the administration of certain funds we manage, as well as for certain information systems and technology platforms, trustee services, legal services, technology, administration, tax, accounting and compliance matters. A disaster, disruption or compromise in technology or infrastructure that supports our managed assets, including a disruption involving electronic communications or other services used by us, our vendors or third parties with whom we conduct business, may have an adverse impact on our ability to continue to manage our assets without interruption which could have a material adverse effect on us. These risks could increase as vendors increasingly offer cloud-based software services rather than software services that can be operated within our own data centers. These risks also increase to the extent we engage with vendors and third-party services providers in jurisdictions with which we are not familiar. In addition to the fact that these third-party service providers could also face ongoing cyber security threats and compromises of their systems, we generally have less control over the delivery of such third-party services, and as a result, we
may face disruptions to our ability to manage an asset as a result of interruptions of such services. A prolonged global failure of cloud services provided by a variety of cloud services providers that we engage could result in cascading systems failures for us. Although we are continuing to develop measures to ensure the integrity of our systems, we can provide no assurance that our efforts or those of third-party service providers will be successful in protecting our systems and preventing or ameliorating damage from a cyber incident.
Data protection and privacy rules have become a focus for regulators globally. For instance, the European General Data Protection Regulation (“GDPR”) sets out data protection rules for individuals that are residents of the E.U. The GDPR imposes stringent rules and penalties for non- compliance. Other countries where we operate are enacting or amending data protection, artificial intelligence and other technology laws to empower regulators to impose financial penalties and injunctions on certain data processing activities, which could have an adverse effect on our business.
We and our managed assets may become involved in legal disputes in Canada, the U.S. and internationally that could adversely impact our financial performance and reputation.
In the normal course of our and our managed assets’ businesses, we become involved in various legal actions, including claims relating to personal injury, property damage, property taxes, land rights and contract and other commercial disputes. The investment decisions we make and the activities of our investment professionals on behalf of our managed assets may subject us and our managed assets to the risk of third-party litigation. Further, we have significant operations in the U.S. which may, as a result of the prevalence of litigation in the U.S., be more susceptible to legal action than certain of our other competitors.
The final outcome with respect to outstanding, pending or future litigation cannot be predicted with certainty, and the resolution of such actions may have an adverse effect on our financial position or results of our operations in a particular quarter or fiscal year. Any litigation may consume substantial amounts of our management’s time and attention, and that time and the devotion of these resources to litigation may, at times, be disproportionate to the amounts at stake in the litigation. Even if ultimately unsuccessful against us, any litigation has the potential to adversely affect our business, including by damaging our reputation.
Losses not covered by insurance may be large, which could adversely impact the assets under management.
We and our managed assets carry various insurance policies in relation to our respective business activities. These policies contain policy specifications, limits and deductibles that may mean that such policies do not provide coverage or sufficient coverage against all potential material losses. We or those also part of the group policy may also self-insure a portion of certain of these risks, and therefore we may not be able to recover from a third-party insurer in the event that we, if we had separate insurance coverage from a third party, could make a claim for recovery. There are certain types of risk (generally of a catastrophic nature such as war or environmental contamination) that are either uninsurable or not economically insurable. Further, there are certain types of risk for which insurance coverage is not equal to the full replacement cost of the insured assets.
Should any uninsured or underinsured loss occur, we could lose our anticipated profits and cash flows from one or more of our assets under management.
We also carry directors’ and officers’ liability insurance (“D&O insurance”) for losses or advancement of defense costs in the event a legal action is brought against our directors, officers or employees for alleged wrongful acts in their capacity as directors, officers or employees. Our D&O insurance contains certain customary exclusions that may make it unavailable for us in the event it is needed; and in any case our D&O insurance may not be adequate to fully protect us against liability for the conduct of our directors, officers or employees. We may also self-insure a portion of our D&O insurance, and therefore we may not be able to recover from a third-party insurer in the event that we, if we had D&O insurance from a third-party insurer, could make a claim for recovery.
For economic efficiency and other reasons, we may enter into insurance policies as a group (which may include the Corporation) that are intended to provide coverage for the entire group. Where group policies are in place, any payments under such policy could have a negative impact on other entities covered under the policy as they may not be able to access adequate insurance in the event it is needed. While management attempts to design coverage limits under group policies to ensure that all entities covered under a policy have access to sufficient insurance coverage, there are no guarantees that these efforts will be effective in obtaining this result.
Inability to collect amounts owing to us could adversely impact financial performance.
Third parties may not fulfill their payment obligations to us, which could include money, securities or other assets, thereby impacting our operations and financial results. These parties include deal and trading counterparties, governmental agencies, customers and financial intermediaries. Third parties may default on their obligations to us due to bankruptcy, lack of liquidity, operational failure, general economic conditions or other reasons.
We manage assets that loan money to distressed companies, either privately or via an investment in publicly traded debt securities. As a result, we actively take heightened credit risk in other entities from time to time and whether we realize satisfactory investment returns on these loans is uncertain and may be beyond our control. If some of these debt investments fail, our financial performance could be negatively impacted.
Investors in our private funds, including the Corporation and its affiliates, make capital commitments to these vehicles through the execution of subscription agreements. When a private fund makes an investment, these capital commitments are then satisfied by our investors via capital contributions. Investors in our private funds may default on their capital commitment obligations, which could have an adverse impact on our earnings or result in other negative implications to our business and our managed assets, such as the requirement to redeploy our own capital to cover such obligations. This impact would be magnified if the investor that does so is in multiple funds.
Information barriers may give rise to certain conflicts and risks and investment teams managing the activities of businesses that operate on opposite sides of an information barrier will not be aware of, and will not have the ability to manage, such conflicts and risks.
Certain of our investment professionals operate largely independently of one another pursuant to an information barrier. The information barrier restricts businesses on opposite sides from coordinating or consulting with one another with respect to investment activities and/or decisions. Accordingly, these businesses manage their investment operations independently of each other. The investment activities and decisions made by a business on one side of an information barrier are not expected to be subject to any internal approvals by any person who would have knowledge and/or decision-making control of the investment activities and decisions made by a business on the other side of the information barrier. This absence of coordination and consultation will give rise to certain conflicts and risks in connection with the activities of the businesses within our asset management strategies and make it more difficult to mitigate, ameliorate or avoid such situations. These conflicts (and potential conflicts) of interests may include: (i) competing from time to time for the same investment opportunities, (ii) the pursuit by a business on one side of the information barrier of investment opportunities suitable for a business on the other side of the information barrier, without making such opportunities available to such business, and (iii) the formation or establishment of new strategies or products that could compete or otherwise conduct their affairs without regard as to whether or not they adversely impact the strategies or products of businesses operating on the other side of the information barrier. Investment teams managing the activities of businesses that operate on opposite sides of an information barrier are not expected to be aware of, and will not have the need or ability to manage, such conflicts which may impact the investment strategy, performance and investment returns of certain businesses within our asset management strategies.
The investment professionals that operate on opposite sides of an information barrier are likely to be deemed affiliates for purposes of certain laws and regulations notwithstanding that they may be operationally independent from one another. The information barrier does not eliminate the requirement to aggregate certain investment holdings for certain securities laws and other regulatory purposes. This may result in, among other things, earlier public disclosure of investments; restrictions on transactions (including the ability to make or dispose of certain investments at certain times); potential short-swing profit disgorgement; penalties and/or regulatory remedies; or adverse effects on the prices of investments for our investment professionals’ businesses that operate on the other side of such information barrier.
Although these information barriers are intended to address the potential conflicts of interests and regulatory, legal and contractual requirements applicable to us, we may decide, at any time and without notice to our shareholders, to remove or modify the information barriers. In addition, there may be breaches (including inadvertent breaches) of the information barriers and related internal controls. In the event that the information barrier is removed or modified, it would be expected that we will adopt certain protocols designed to address potential conflicts and other considerations relating to the management of the investment activities of those businesses that previously operated on opposite sides of an information barrier. See “Risks Relating to the Manager — Our organizational and ownership structure may create conflicts of interest that may be resolved in a manner that is not in the best interests of our company or the best interests of our shareholders”.
The breach or failure of our information barriers could result in the sharing of material non-public information between investment professionals that operate on opposite sides of an information barrier, which may restrict the acquisition or disposition activities of one of our strategies and ultimately impact the returns generated for our investors. In addition, any such breach or failure could also result in potential regulatory investigations and claims for securities laws violations in connection with our direct and/or indirect investment activities. Any inadvertent trading on material non-public information, or perception of trading on material non-public information by our personnel, could have a significant adverse effect on our reputation, result in the imposition of regulatory or financial sanctions and negatively impact our ability to raise third-party capital and provide investment management services to our clients, all of which could result in negative financial impact to our investment activities.
We face risks specific to our renewable power and transition strategies.
Our renewable power and transition strategies invest in assets that are subject to changes in the weather, hydrology and price, but also include risks related to equipment or dam failure, counterparty performance, water rental costs, land rental costs, changes in regulatory requirements and other material disruptions.
The revenues generated by the power facilities we manage are correlated to the amount of electricity generated, which in turn is dependent upon available water flows, wind, irradiance and other elements beyond our control. Hydrology, wind and irradiance levels vary naturally from year to year and may also change permanently because of climate change or other factors. It is therefore possible that low water, wind and irradiance levels at certain of our power generating operations could occur at any time and potentially continue for indefinite periods.
A portion of the renewable power and transition revenue is tied, either directly or indirectly, to the wholesale market price for electricity, which is impacted by a number of external factors beyond our control. Additionally, a portion of the power that is generated is sold under long-term power purchase agreements, shorter-term financial instruments and physical electricity contracts which are intended to mitigate the impact of fluctuations in wholesale electricity prices; however, they may not be effective in achieving this outcome. Certain of the power purchase agreements of our managed assets will be subject to re-contracting in the future. If the price of electricity in power markets is declining at the time of such re-contracting, it may impact our ability to re-negotiate or replace these contracts on terms that are acceptable to us. Conversely, what appears to be an attractive price at the time of re-contracting could, if power prices rise over the power purchase agreement’s term, result in us having committed to sell power in the future at below market rate. If we are unable to re-negotiate or replace these contracts, or unable to secure prices at least equal to the current prices we receive, our business, financial condition, results of operation and prospects could be adversely affected.
In our renewable power and transition portfolio, there is a risk of equipment failure due to severe weather conditions (including as a result of climate change), wear and tear, latent defect, design error or operator error, among other things. The occurrence of such failures could result in a loss of generating capacity and repairing such failures could require the expenditure of significant capital and other resources. Failures could also result in exposure to significant liability for damages due to harm to the environment, to the public generally or to specific third parties. Equipment that our renewable power and transition operations need, including spare parts and components required for project development, may become unavailable or difficult to procure, inhibiting our ability to maintain full availability of existing plants and also our ability to complete development projects on scope, schedule and budget.
In certain cases, some catastrophic events may not excuse us from performing our obligations pursuant to agreements with third parties and we may be liable for damages or suffer further losses as a result.
Our renewable power and transition portfolio is exposed to performance and operational risks in respect of certain nuclear technologies. The nuclear fuel and power industries are heavily regulated and could be significantly impacted by changes in government policies and priorities such as increased regulation and/or more onerous operating requirements that negatively impact our nuclear technology services. A future accident at a nuclear reactor could result in the shutdown of existing plants or impact the continued acceptance by the public and regulatory authorities of nuclear energy and the future prospects for nuclear generators. Accidents, terrorism, natural disasters or other incidents occurring at nuclear facilities or involving shipments of nuclear materials could reduce the demand for nuclear technology services.
The ability of the platforms we manage to develop greenfield renewable power projects in our development pipeline may be affected by a number of factors, including the state of capital markets, the ability to secure project financing (including from equity investors and through tax and other government incentives), the ability to secure approvals, licenses and permits and the ability to secure a long-term power purchase agreement or other sales contracts on reasonable terms. The development of our pipeline of greenfield renewable power projects is also subject to environmental, engineering and construction risks that could result in cost-overruns, delays and reduced performance.
New regulatory initiatives related to sustainability could adversely impact our managed assets. While we believe that regulatory initiatives and market trends towards an increased focus on sustainability are generally beneficial to our renewable power and transition group, any such regulatory initiatives also have the potential to adversely impact us. For example, regulatory initiatives seeking to reorient investment toward sustainability by regulating green financial products could have the effect of increasing burdensome disclosure requirements around sustainability and prescribing approaches to sustainability policies that are inconsistent with our current practices. If regulators disagree with the sustainability disclosures that we make, or with the categorization of our financial products, we may face regulatory enforcement action, and our business or reputation could be adversely affected.
We face risks specific to our infrastructure strategies.
Our infrastructure managed assets include utilities, transport, midstream and data businesses.
Our infrastructure assets include toll roads, telecommunication towers, electricity transmission systems, terminal operations, electricity and gas distribution companies, residential infrastructure, rail networks, ports and data centers. The principal risks facing the regulated and unregulated businesses comprising our infrastructure assets relate to government regulation, general economic conditions and other material disruptions, counterparty performance and capital expenditure requirements.
Many of the infrastructure assets we manage are subject to government regulation, including with respect to revenues and environmental sustainability. If any of the respective regulators in the jurisdictions in which we operate decides to change the tolls or rates we are allowed to charge or the amounts of the provisions we are allowed to collect, we may not be able to earn the rate of return on our investments that we had planned, or we may not be able to recover our initial cost.
With environmental regulation becoming more stringent, our managed assets may become subject to increasing environmental responsibility and liability. These regulations may result in increased costs to our managed assets that may not be able to be passed onto their customers and may have an adverse impact on prospects for growth of some businesses.
General economic conditions (including those resulting from climate change and severe weather conditions) affect international demand for the commodities handled and services provided by operators in our infrastructure managed assets. A downturn in the economy generally or specific to any of our infrastructure managed assets, may lead to a reduction in volumes, disruption to business, bankruptcies or liquidations of one or more large customers, which could reduce our revenues, increase our bad debt expense, reduce our ability to make capital expenditures or have other adverse effects on us.
Some of our managed assets have customer contracts as well as concession agreements in place with public and private sector clients. Our managed assets with customer contracts could be adversely affected by any material change in the assets, financial condition or results of operations of such customers. Protecting the quality of our revenue streams through the inclusion of take-or-pay or guaranteed minimum volume provisions into our contracts is not always possible or fully effective.
Some of our managed assets may require substantial capital expenditures to maintain their asset base. Any failure to make necessary expenditures to maintain their operations could impair their ability to serve existing customers or accommodate increased volumes. In addition, we may not be able to recover investments in capital expenditures based upon the rates our operations are able to charge.
We face risks specific to our private equity strategies.
The principal risks for our private equity managed assets are potential loss of invested capital as well as insufficient investment or fee income to cover operating expenses and cost of capital. Our private equity platform is invested in industrial operations, business services operations and infrastructure services operations, many of which can be cyclical and/or illiquid and therefore may be difficult to monetize at our discretion, limiting our flexibility to react to changing economic or investment conditions. In addition, increasingly we have certain managed assets that provide goods and services directly to consumers across a variety of industries. These businesses are prone to greater liabilities, as well as reputational, litigation and other risks by virtue of being more public-facing and reliant on their ability to develop and preserve consumer relationships and achieve consumer satisfaction.
Unfavorable economic conditions could negatively impact the ability of our managed assets to repay debt. Adverse economic conditions facing our managed assets may adversely impact the value of our investments or deplete our financial or management resources. These investments are also subject to the risks inherent in the underlying businesses, some of which are facing difficult business conditions and may continue to do so for the foreseeable future. These risks are compounded by recent growth, as new acquisitions have increased the scale and scope of our operations, including in new geographic areas and industry sectors, and we may have difficulty managing these additional operations.
We may deploy our client’s capital in managed assets that are experiencing significant financial or business difficulties, including companies involved in work-outs, liquidations, spin-outs, reorganizations, bankruptcies and similar transactions. Such an investment entails the risk that the transaction will be unsuccessful, will take considerable time or will result in a distribution of cash or new securities, the value of which may be less than the purchase price of the securities in respect of which such distribution is received. In addition, if an anticipated transaction does not occur, we may be required to sell our investment at a loss. These managed assets may become subject to legal and/or regulatory proceedings and our investment may be adversely affected by external events beyond our control, leading to legal, indemnification or other expenses.
We have several managed assets that operate in the highly competitive service industry. A wide variety of micro and macroeconomic factors affecting our clients and over which we have no control can impact how these companies operate. For
example, our Canadian residential mortgage insurer is subject to significant regulation and may be adversely affected by changes in government policy. The majority of the revenue from our healthcare services operation is derived from private health insurance funds, which may be affected by a deterioration in the economic climate, a change in economic incentives, increases in private health insurance premiums and other factors. In addition, alternative technologies in the health care industry could impact the demand for, or use of, our services and could impair or eliminate the competitive advantage of our businesses in this industry.
Our infrastructure services operations include companies in lottery services, marine transportation and scaffolding services. Our lottery services operation is heavily dependent on long-term contracts and failure to win, maintain and renew these contracts could substantially impact revenue. Our lottery services operation also often requires entering into strategic relationships with third parties, including competitors, which we do not control, and which may have inconsistent business interests or goals from us. Marine transportation and oil production is inherently risky, particularly in the extreme conditions in which many of our vessels operate. An incident involving significant loss of product or environmental contamination by any of our vessels could harm our reputation and business. Our scaffolding services business is subject to the risks inherent to construction operations, including risks relating to seasonal fluctuations in the demand for our services, a dependence on labor and performance being materially impacted by a lack of availability of labor force or increases in the cost of labor available, and operational hazards that could result in personal injury or death, work stoppage or serious property and equipment damage.
We face risks specific to our real estate strategies.
Our real estate strategies invest in commercial properties and are therefore exposed to certain risks inherent in the commercial real estate business. Commercial real estate investments are subject to varying degrees of risk depending on the nature of the property. These risks include changes in general economic conditions (such as the availability and cost of mortgage capital), local conditions (such as an oversupply of space or a reduction in demand for real estate in the markets in which we operate), the attractiveness of the properties to tenants, competition from other landlords and our ability to provide adequate maintenance at an economical cost.
Certain expenditures, including property taxes, maintenance costs, mortgage payments, insurance costs and related charges, must be made whether or not a property is producing sufficient income to service these expenses. These commercial properties are typically subject to mortgages that require debt service payments. If we become unable or unwilling to meet mortgage payments on any property, losses could be sustained as a result of the mortgagee’s exercise of its rights of foreclosure or of sale.
Continuation of rental income is dependent on favorable leasing markets to ensure expiring leases are renewed and new tenants are found promptly to fill vacancies. It is possible that we may face a disproportionate amount of space expiring in any one year. Additionally, rental rates could decline, tenant bankruptcies could increase and tenant renewals may not be achieved, particularly in the event of an economic slowdown.
Our real estate strategies invest in businesses that operate in industries or geographies that may be impacted by a local, regional, national or international outbreak of a contagious disease. Adverse impacts on our managed assets may also include:
•a complete or partial closure of, or other operational issues at, one or more of our properties resulting from government or tenant action and climate change events including hurricanes, earthquakes, tsunamis and other natural and man-made disasters;
•a slowdown in business activity may severely impact our tenants’ businesses, financial condition and liquidity and may cause one or more of our tenants to be unable to fund their business operations, meet their obligations to us in full, or at all, or to otherwise seek modifications of such obligations;
•an increase in re-leasing timelines, potential delays in lease-up of vacant space and the market rates at which such lease will be executed;
•reduced economic activity could result in a prolonged recession, which could negatively impact consumer discretionary spending; and
•expected completion dates for our development and redevelopment projects may be subject to delay as a result of the disruption of local economic conditions.
The retail real estate assets in our managed assets are susceptible to any economic factors that have a negative impact on consumer spending. Lower consumer spending would have an unfavorable effect on the sales of our retail tenants, which could result in their inability or unwillingness to make all payments owing to us, and on our ability to keep existing tenants and attract new tenants. Significant expenditures associated with each equity investment in real estate assets, such as mortgage payments, property taxes and maintenance costs, are generally not reduced when there is a reduction in income from the investment, so our income and cash flow would be adversely affected by a decline in income from our retail properties.
In addition, low occupancy or sales at our retail properties, as a result of competition or otherwise, could result in termination of or reduced rent payable under certain of our retail leases, which could adversely affect our retail property revenues.
The hospitality and multifamily assets in our managed assets are subject to a range of operating risks common to these industries, many of which are outside our control, and the profitability of our investments in these industries may be adversely affected by these factors. For example, our hospitality business faces risks relating to climate change; hurricanes, earthquakes, tsunamis and other natural and man-made disasters; the potential spread of contagious diseases; and insect infestations more common to rental accommodations. Such factors could limit or reduce the demand for or the prices our hospitality properties are able to obtain for their accommodations or could increase our costs and therefore reduce the profitability of our hospitality businesses. There are numerous housing alternatives that compete with our multifamily properties, including other multifamily properties as well as condominiums and single-family homes. This competitive environment could have a material adverse effect on our ability to lease apartment homes at our present properties or any newly developed or acquired real estate, as well as on the rents realized.
Risks Related to Taxation
Changes in Canadian federal income tax law might adversely affect the Manager and/or Holders of Class A Shares.
There can be no assurance that Canadian federal income tax laws, the judicial interpretation thereof, or the administrative policies and assessing practices of the CRA will not be changed in a manner that adversely affects the Manager and/or Holders of Class A Shares. Any such developments could have a material adverse effect on the Holders of Class A Shares or our business, financial condition and results of operations.
Reassessments by tax authorities or changes in tax laws could create additional tax costs for us.
We operate in countries with differing tax laws and tax rates. Our tax reporting is supported by tax laws in the countries in which we operate and the application of tax treaties between the various countries in which we operate. Our income tax reporting is subject to audit by tax authorities in the countries in which we operate. Our effective tax rate may change from year to year, based on changes in the mix of activities and income earned among the different jurisdictions in which we operate, changes in tax laws in these jurisdictions, changes in the tax treaties between the countries in which we operate, changes in our eligibility for benefits under those tax treaties, and changes in the estimated values of deferred tax assets and liabilities. Tax laws, regulations and administrative practices in various jurisdictions may be subject to significant change, with or without notice, due to economic, political and other conditions, and significant judgment is required in evaluating and estimating our provision and accruals for these taxes. Such changes could result in a substantial increase in the effective tax rate on all or a portion of our income.
Governments around the world increasingly seek to regulate multinational companies and the application of differential tax rates between jurisdictions. This effort includes a greater emphasis by various nations on coordinating and sharing information regarding companies and the taxes they pay. A number of countries across the globe have also agreed to implement a “two pillar” plan for global tax reform, developed by the OECD/G20 Inclusive Framework on BEPS, to address perceived base erosion and profit shifting (“BEPS”) by some multinational groups. Governmental taxation reforms, policies and practices could adversely affect us and, depending on the nature of such reforms, policies and practices, including the implementation of the BEPS proposals in the jurisdictions in which we operate, could have an impact on us. As a result of this increased focus on the use of tax planning by multinational companies, our company could be subject to negative media coverage, which may adversely impact our reputation.
To preserve the intended Canadian and U.S. federal income tax treatment of the arrangement undertaken to implement the special distribution of the asset management business (“Arrangement”), the Manager agreed to certain restrictions that may significantly reduce its strategic and operating flexibility. In connection with the Arrangement, the Corporation engaged in various restructuring transactions (the “Pre-Arrangement Reorganization”). To preserve the intended Canadian federal income tax treatment of these transactions as generally tax deferred under the Income Tax Act (Canada), the Manager, the Corporation and their subsidiaries are prohibited for a period of two years following the effective date of the Arrangement, except in specific circumstances, from taking any action, omitting to take any action or entering into any transaction that could cause the Pre-Arrangement Reorganization, the Arrangement or certain other transactions occurring in conjunction therewith to be taxed in a manner that is inconsistent with that provided for in an opinion of counsel addressed to the board of directors of the Corporation and the board of directors of the Manager confirming the Canadian federal income tax consequences of certain aspects of the Pre-Arrangement Reorganization and the Arrangement to the parties thereto. To preserve the intended U.S. federal income tax treatment of these transactions, for a period of time following the Arrangement, the Manager covenanted with the Corporation and others, except in specific circumstances, not to take certain actions that would prevent certain steps pursuant to the Arrangement from qualifying as a transaction that is generally tax-free for U.S. federal income tax purposes. The foregoing restrictions may
limit for a period of time the Manager’s ability to pursue certain strategic transactions or other transactions that it believes to be in the best interests of our shareholders or that might increase the value of our business.
If the Manager is classified as a passive foreign investment company, U.S. persons who own Class A Shares could be subject to adverse U.S. federal income tax consequences.
If the Manager is classified as a PFIC for U.S. federal income tax purposes, a U.S. Holder that owns Class A Shares could be subject to adverse tax consequences, including a greater tax liability than might otherwise apply, an interest charge on certain taxes deemed deferred as a result of the Manager’s non-U.S. status and additional U.S. tax reporting obligations. In general, a non-U.S. corporation will be a PFIC during a taxable year if, taking into account the income and assets of certain of its affiliates, (i) 75% or more of its gross income constitutes passive income or (ii) 50% or more of its assets produce, or are held for the production of, passive income. Passive income generally includes interest, dividends and other investment income.
Based on its current and expected income, assets and activities, the Manager does not expect to be classified as a PFIC for the current taxable year or in the foreseeable future. However, the determination of whether the Manager is a PFIC depends upon the composition of its income and assets and the nature of its activities from time to time and must be made annually as of the close of each taxable year. The PFIC determination also depends on the application of complex U.S. federal income tax rules that are subject to differing interpretations. Thus, there can be no assurance that the Manager will not be classified as a PFIC for any taxable year, or that the IRS or a court will agree with the Manager’s determination as to its PFIC status. U.S. Holders are urged to consult their tax advisers regarding the application of the PFIC rules, including the related reporting requirements and the advisability of making any available election under the PFIC rules, with respect to their ownership and disposition of Class A Shares.
Tax laws and regulations may change in the jurisdictions in which we operate, which may affect the effective tax rate on all or a portion of our income.
We operate in countries with differing tax laws and tax rates. Our tax reporting is supported by tax laws in the countries in which we operate and the application of tax treaties between the various countries in which we operate. Our income tax reporting is subject to audit by tax authorities in the countries in which we operate. Our effective tax rate may change from year to year, based on (i) changes in the mix of activities and income earned among the different jurisdictions in which we operate, (ii) changes in tax laws in these jurisdictions, (iii) changes in the tax treaties between the countries in which we operate, (iv) changes in our eligibility for benefits under those tax treaties, and (v) changes in the estimated values of deferred tax assets and liabilities. Tax laws, regulations and administrative practices in various jurisdictions may be subject to significant change, with or without notice, due to economic, political and other conditions, and significant judgment is required in evaluating and estimating our provision and accruals for these taxes. Such changes could result in a substantial increase in the effective tax rate on all or a portion of our income.
To preserve the intended Canadian and U.S. federal income tax treatment of the Arrangement, the Manager agreed to certain restrictions that may significantly reduce its strategic and operating flexibility.
The Corporation engaged in various restructuring transactions in connection with the Arrangement. To preserve the intended Canadian federal income tax treatment of these transactions, as generally tax deferred under the Tax Act, the Corporation, the Manager and their subsidiaries (including the Asset Management Company) are prohibited for a period of two years following the effective date of the Arrangement, except in specific circumstances, from taking any action, omitting to take any action or entering into any transaction that could cause the Pre-Arrangement Reorganization, the Arrangement or certain other transactions occurring in conjunction therewith to be taxed in a manner that is inconsistent with that provided for in the legal opinion addressed to the board of directors of the Corporation and the Board confirming the Canadian federal income tax consequences of certain aspects of the Pre-Arrangement Reorganization and the Arrangement to the parties thereto. To preserve the intended U.S. federal income tax treatment of these transactions, for a period of time following the Arrangement, the Manager covenanted with the Corporation and others, except in specific circumstances, not to take certain actions that would prevent certain steps pursuant to the Arrangement from qualifying as a transaction that is generally tax-free for U.S. federal income tax purposes under Section 355(a) of the Code. The foregoing restrictions may limit for a period of time the Manager’s ability to pursue certain strategic transactions or other transactions that it believes to be in the best interests of its shareholders or that might increase the value of its business.
GLOSSARY OF TERMS
Unless otherwise specified, information provided in this Management's Discussion and Analysis (this “MD&A”) is as of December 31, 2023. Unless the context requires otherwise, when used in this MD&A, the terms “we”, “us”, “our” means our asset management business and the Manager, individually or collectively, where applicable, and the term “Corporation” means Brookfield Corporation and its subsidiaries (including the perpetual affiliates (as defined below)) other than the Asset Management Company (as defined below) and its subsidiaries and does not, for greater certainty, include the Manager, Brookfield Reinsurance (as defined below) or Oaktree and their affiliates. The term "Brookfield" means the Corporation, the Manager and the Asset Management Company, collectively.
Unless the context suggests otherwise, references to:
•“MSOP” means the 2022 Management Share Option Plan of the Manager adopted on December 9, 2022;
•“Arrangement” means the court approved plan of arrangement of the Corporation as a result of which (i) the shareholders of the Corporation, while retaining their shares of the Corporation, became shareholders of the Manager, which acquired a 25% interest in our asset management business through common shares of the Asset Management Company, and (ii) the Corporation changed its name from “Brookfield Asset Management Inc.” to “Brookfield Corporation”;
•“Asset Management Company” means Brookfield Asset Management ULC;
•“Asset Management Services Agreement” means the agreement dated November 8, 2022 between the Manager and the Asset Management Company to govern the provision of services by the Manager’s employees to the Asset Management Company on a cost recovery basis under a perpetual agreement, as further described in Note 1 “Organization” of the Consolidated Financial Statements of the Manager;
•“Assets Under Management” or “AUM” has the meaning ascribed thereto under Part 3 “Key Financial and Operating Measures”;
•“BBU” means Brookfield Business Partners L.P., together with its subsidiaries including its paired corporation, Brookfield Business Corporation;
•“BEP” means Brookfield Renewable Partners L.P., together with its subsidiaries including its paired corporation, Brookfield Renewable Corporation;
•“BIP” means Brookfield Infrastructure Partners L.P., together with its subsidiaries including its paired corporation, Brookfield Infrastructure Corporation;
•“Board” means the board of directors of the Manager;
•“BPG” means Brookfield Property Group, including BPY and the Corporation’s wholly owned real estate directly held entities;
•“BPY” means Brookfield Property Partners L.P., together with its subsidiaries;
•“Brookfield Reinsurance” means Brookfield Reinsurance Ltd. (formerly known as Brookfield Asset Management Reinsurance Partners Ltd.);
•“Class A Shares” means the class A limited voting shares in the capital of the Manager;
•“Class B Shares” means the class B limited voting shares in the capital of the Manager;
•“Code” means the U.S. Internal Revenue Code of 1986, as amended;
•“Code of Conduct” means the code of business conduct and ethics of the Manager;
•“Corporation” means Brookfield Corporation and its subsidiaries (including the perpetual affiliates) other than the Asset Management Company and its subsidiaries and does not, for greater certainty, include the Manager, Brookfield Reinsurance or Oaktree and their subsidiaries;
•“CRA” means the Canada Revenue Agency;
•“Distributable Earnings” is intended to represent the cash available for distribution to shareholders or to be reinvested by the Manager or the Asset Management Company, as applicable. Distributable Earnings of the Manager represent its share of Distributable Earnings from the Asset Management Company less general and administrative expenses, but excluding equity-based compensation costs, of the Manager. Distributable Earnings of the Asset Management Company is calculated as the sum of its Fee-Related Earnings, realized carried interest, realized principal investments, interest expense, and general and
administrative expenses; excluding equity-based compensation costs and depreciation and amortization. For a discussion of the Manager’s and our asset management business’ calculation of Distributable Earnings, see Part 3 “Key Financial and Operating Measures”;
•“EDGAR” means the Electronic Data Gathering, Analysis, and Retrieval system at www.sec.gov;
•“Fed” means the Federal Reserve System, or the central banking system of the United States;
•“Fee-Bearing Capital” has the meaning ascribed thereto under Part 3 “Key Financial and Operating Measures”;
•“Fee Revenues” has the meaning ascribed thereto under Part 3 “Key Financial and Operating Measures”;
•“Investment Company Act” means the United States Investment Company Act of 1940, as amended;
•“IRS” means the United States Internal Revenue Service;
•“managed assets” means the businesses, operations and other assets managed by the Corporation prior to completion of the Arrangement and to be managed by the Manager and our asset management business following completion of the Arrangement;
•“Manager” means Brookfield Asset Management Ltd. and its consolidated subsidiaries;
•“Manager Credit Facility” means the credit agreement dated November 8, 2022 between the Manager and the Asset Management Company, pursuant to which the Asset Management Company has provided a five-year revolving $500 million credit facility to the Manager, as further described under Part 7 “Liquidity and Capital Resources”;
•“mature fund” means manager funds which were already significantly deployed upon completion of the Arrangement;
•“new sponsored fund” or “new fund” means all manager funds launched on or after the date of the Arrangement;
•“NYSE” means the New York Stock Exchange;
•“Oaktree” means Oaktree Capital Management, L.P., together with its affiliates, Oaktree Capital II, L.P. General ("OCM II General"), Oaktree Capital II, L.P. Manager ("OCM II Manager"), Oaktree Capital II, L.P New Fund ("OCM II New Fund"), Oaktree AIF Investments, L.P., Oaktree Capital Management (Cayman) L.P. and Oaktree Investment Holdings, L.P. and their consolidated subsidiaries;
•“our asset management business” means the global alternative asset management business previously carried on by the Corporation and its subsidiaries, which, following completion of the Arrangement, is owned approximately 75% by the Corporation and approximately 25% by the Manager through their ownership of common shares of the Asset Management Company;
•“parent” means Brookfield Corporation, unless otherwise indicated;
•“perpetual affiliates” means BEP, BIP, BBU and BPY;
•“PFIC” means a passive foreign investment company for U.S. federal income tax purposes;
•“Pre-Arrangement Reorganization” means the preliminary transactions to reorganize the business of Brookfield Corporation (formerly known as Brookfield Asset Management Inc.) that have been undertaken to facilitate the Arrangement;
•“Relationship Agreement” means the agreement dated November 8, 2022 among the Corporation, the Manager and the Asset Management Company to govern aspects of their relationship following the Arrangement, as further described under Note 1 “Organization” of the Consolidated Financial Statements of the Manager;
•“Sarbanes-Oxley Act” or “Sarbanes-Oxley” means the United States Sarbanes-Oxley Act of 2002, as amended;
•“SEC” means the United States Securities and Exchange Commission;
•“SEDAR+” means the System for Electronic Data Analysis and Retrieval + at www.sedarplus.ca;
•“SOFR” means the Secured Overnight Financing Rate published by the Federal Reserve Bank of New York (or a successor administrator);
•“Tax Act” means the Income Tax Act (Canada);
•“Transitional Services Agreement” means the agreement dated November 8, 2022 among the Corporation, the Manager and the Asset Management Company described under Note 1 “Organization” of the Consolidated Financial Statements of the Manager;
•“TSX” means the Toronto Stock Exchange;
•“U.K.” or “United Kingdom” means the United Kingdom of Great Britain and Northern Ireland.
•“U.S. Exchange Act” means the United States Securities Exchange Act of 1934, as amended, and the rules and regulations promulgated from time to time thereunder;
•“U.S. GAAP” means the accounting principles generally accepted in the United States;
•“U.S. Holder” is a beneficial owner of Class A Shares that for U.S. federal income tax purposes is: (1) an individual who is a citizen or resident of the United states, (2) a corporation (or other entity classified as a corporation for U.S. federal income tax purposes) created or organized in the United States, any state thereof, or the District of Columbia, (3) an estate the income of which is subject to U.S. federal income taxation regardless of its source; or (4) a trust if (i) a court within the United States is able to exercise primary supervision over the administration of the trust and one or more U.S. persons have the authority to control all substantial decisions of the trust, or (ii) the trust has a valid election in effect under applicable Treasury Regulations to be treated as a U.S. person for U.S. federal income tax purposes;
•“U.S. Securities Act” means the United States Securities Act of 1933, as amended, and the rules and regulations promulgated from time to time thereunder; and
•“Voting Agreement” means the agreement dated December 9, 2022 between the Corporation and the Manager providing for the election of directors of the Asset Management Company.
BROOKFIELD ASSET MANAGEMENT LTD.
CONSOLIDATED FINANCIAL STATEMENTS
AS AT AND FOR THE YEAR ENDED DECEMBER 31, 2023 AND AS AT AND FOR THE PERIOD ENDED DECEMBER 31, 2022
INTERNAL CONTROL OVER FINANCIAL REPORTING
MANAGEMENT’S REPORT ON INTERNAL CONTROL OVER FINANCIAL REPORTING
Management of Brookfield Asset Management Ltd. (the "Manager") is responsible for establishing and maintaining adequate internal control over financial reporting as such term is defined in Rule 13a-15(f) under the Exchange Act. Internal control over financial reporting is a process designed by, or under the supervision of, the Chief Executive Officer and the Chief Financial Officer and effected by the Board of Directors, management and other personnel to provide reasonable assurance regarding the reliability of financial reporting and the preparation of financial statements for external purposes in accordance with generally accepted accounting principles.
Management assessed the effectiveness of the Manager’s internal control over financial reporting as of December 31, 2023, based on the criteria set forth in Internal Control – Integrated Framework (2013) issued by the Committee of Sponsoring Organizations of the Treadway Commission. Based on this assessment, management concludes that, as of December 31, 2023, the Manager’s internal control over financial reporting is effective.
The Manager’s internal control over financial reporting as of December 31, 2023, has been audited by Deloitte LLP, the Independent Registered Public Accounting Firm, who also audited the Manager’s consolidated financial statements for the year ended December 31, 2023. As stated in the Report of Independent Registered Public Accounting Firm, Deloitte LLP expressed an unqualified opinion on the effectiveness of the Manager’s internal control over financial reporting as of December 31, 2023.
|
|
|
|
|
|
|
|
|
|
|
|
|
|
|
|
| /s/ Bruce Flatt |
|
|
/s/ Bahir Manios |
Bruce Flatt
Chief Executive Officer |
|
|
Bahir Manios
Chief Financial Officer
|
|
|
|
|
|
|
|
|
| March 19, 2024 |
|
|
|
| Toronto, Canada |
|
|
|
|
|
|
|
|
|
|
|
|
|
|
|
|
|
|
|
REPORT OF INDEPENDENT REGISTERED PUBLIC ACCOUNTING FIRM
To the Shareholders and the Board of Directors of Brookfield Asset Management Ltd.
Opinion on Internal Control over Financial Reporting
We have audited the internal control over financial reporting of Brookfield Asset Management Ltd. and subsidiaries (the “Company”) as of December 31, 2023, based on criteria established in Internal Control — Integrated Framework (2013) issued by the Committee of Sponsoring Organizations of the Treadway Commission (COSO). In our opinion, the Company maintained, in all material respects, effective internal control over financial reporting as of December 31, 2023, based on criteria established in Internal Control — Integrated Framework (2013) issued by COSO.
We have also audited, in accordance with the standards of the Public Company Accounting Oversight Board (United States) (PCAOB), the consolidated financial statements as at and for the year ended December 31, 2023, of the Company and our report dated March 19, 2024, expressed an unqualified opinion on those financial statements.
Basis for Opinion
The Company’s management is responsible for maintaining effective internal control over financial reporting and for its assessment of the effectiveness of internal control over financial reporting, included in the accompanying Management’s Report on Internal Control Over Financial Reporting. Our responsibility is to express an opinion on the Company’s internal control over financial reporting based on our audit. We are a public accounting firm registered with the PCAOB and are required to be independent with respect to the Company in accordance with the U.S. federal securities laws and the applicable rules and regulations of the Securities and Exchange Commission and the PCAOB.
We conducted our audit in accordance with the standards of the PCAOB. Those standards require that we plan and perform the audit to obtain reasonable assurance about whether effective internal control over financial reporting was maintained in all material respects. Our audit included obtaining an understanding of internal control over financial reporting, assessing the risk that a material weakness exists, testing and evaluating the design and operating effectiveness of internal control based on the assessed risk, and performing such other procedures as we considered necessary in the circumstances. We believe that our audit provides a reasonable basis for our opinion.
Definition and Limitations of Internal Control over Financial Reporting
A company’s internal control over financial reporting is a process designed to provide reasonable assurance regarding the reliability of financial reporting and the preparation of financial statements for external purposes in accordance with generally accepted accounting principles. A company’s internal control over financial reporting includes those policies and procedures that (1) pertain to the maintenance of records that, in reasonable detail, accurately and fairly reflect the transactions and dispositions of the assets of the company; (2) provide reasonable assurance that transactions are recorded as necessary to permit preparation of financial statements in accordance with generally accepted accounting principles, and that receipts and expenditures of the company are being made only in accordance with authorizations of management and directors of the company; and (3) provide reasonable assurance regarding prevention or timely detection of unauthorized acquisition, use, or disposition of the company’s assets that could have a material effect on the financial statements.
Because of its inherent limitations, internal control over financial reporting may not prevent or detect misstatements. Also, projections of any evaluation of effectiveness to future periods are subject to the risk that controls may become inadequate because of changes in conditions, or that the degree of compliance with the policies or procedures may deteriorate.
/s/ Deloitte LLP
Chartered Professional Accountants
Licensed Public Accountants
Toronto, Canada
March 19, 2024
REPORT OF INDEPENDENT REGISTERED PUBLIC ACCOUNTING FIRM
To the Shareholders and the Board of Directors of Brookfield Asset Management Ltd.
Opinion on the Financial Statements
We have audited the accompanying consolidated balance sheets of Brookfield Asset Management Ltd. and subsidiaries (the “Company”) as at December 31, 2023 and 2022, the related consolidated statements of comprehensive income, changes in equity, and cash flows, for the year ended December 31, 2023 and for the period from July 4, 2022 to December 31, 2022, and the related notes (collectively referred to as the "financial statements"). In our opinion, the financial statements present fairly, in all material respects, the financial position of the Company as of December 31, 2023 and 2022, and the results of its operations and its cash flows for the year ended December 31, 2023 and for the period from July 4, 2022 to December 31, 2022, in conformity with accounting principles generally accepted in the United States of America.
We have also audited, in accordance with the standards of the Public Company Accounting Oversight Board (United States) (PCAOB), the Company's internal control over financial reporting as of December 31, 2023, based on criteria established in Internal Control — Integrated Framework (2013) issued by the Committee of Sponsoring Organizations of the Treadway Commission and our report dated March 19, 2024, expressed an unqualified opinion on the Company's internal control over financial reporting.
Basis for Opinion
These financial statements are the responsibility of the Company’s management. Our responsibility is to express an opinion on the Company’s financial statements based on our audits. We are a public accounting firm registered with the PCAOB and are required to be independent with respect to the Company in accordance with the U.S. federal securities laws and the applicable rules and regulations of the Securities and Exchange Commission and the PCAOB.
We conducted our audits in accordance with the standards of the PCAOB. Those standards require that we plan and perform the audit to obtain reasonable assurance about whether the financial statements are free of material misstatement, whether due to error or fraud. Our audits included performing procedures to assess the risks of material misstatement of the financial statements, whether due to error or fraud, and performing procedures that respond to those risks. Such procedures included examining, on a test basis, evidence regarding the amounts and disclosures in the financial statements. Our audits also included evaluating the accounting principles used and significant estimates made by management, as well as evaluating the overall presentation of the financial statements. We believe that our audits provide a reasonable basis for our opinion.
Critical Audit Matter
The critical audit matter communicated below is a matter arising from the current-period audit of the financial statements that was communicated or required to be communicated to the audit committee and that (1) relates to accounts or disclosures that are material to the financial statements and (2) involved our especially challenging, subjective, or complex judgments. The communication of critical audit matters does not alter in any way our opinion on the financial statements, taken as a whole, and we are not, by communicating the critical audit matter below, providing a separate opinion on the critical audit matter or on the accounts or disclosures to which it relates.
Accounting for Equity Method Investment in Brookfield Asset Management ULC – Refer to Notes 2 and 3 to the financial statements
Critical Audit Matter Description
The Company has an approximate 25% interest in Brookfield Asset Management ULC and the remaining approximate 75% interest is held by Brookfield Corporation. The Company has accounted for its interest in Brookfield Asset Management ULC under the equity method of accounting as it is deemed to exert significant influence over the investee. The carrying value of the equity method investment is determined based on the amounts invested by the Company, adjusted for the equity in earnings or losses of the investee allocated based on the relevant agreements, less distributions received and impairment losses, if any.
We identified the accounting for the equity method investment as a critical audit matter because of the significance of the equity method investment and earnings impact to the Company’s financial statements. This required an increased extent of audit effort, including the need to involve the auditor of Brookfield Asset Management ULC and senior members of the engagement team.
How the Critical Audit Matter Was Addressed in the Audit
Our audit procedures related to accounting for the equity method investment in Brookfield Asset Management ULC included the following, among others:
•Tested the effectiveness of controls related to the accounting for the equity method investment in Brookfield Asset Management ULC, which includes management’s receipt and review of Brookfield Asset Management ULC financial information;
•Evaluated significant judgments and estimates at the underlying equity method investment through oversight of the auditor of Brookfield Asset Management ULC by obtaining and assessing information from the auditor to understand significant judgments and estimates, significant findings or issues identified, actions taken to address them, and conclusions reached;
•Agreed the underlying information related to the changes in the equity method investment to the audited financial statements of Brookfield Asset Management ULC; and
•Performed procedures to evaluate subsequent events related to the equity method investment and to assess their impact, if any, on the financial information, up to the date of our auditor’s report on the Company’s financial statements.
/s/ Deloitte LLP
Chartered Professional Accountants
Licensed Public Accountants
Toronto, Canada
March 19, 2024
We have served as the Company's auditor since 2022.
BROOKFIELD ASSET MANAGEMENT LTD.
CONSOLIDATED BALANCE SHEETS
|
|
|
|
|
|
|
|
|
|
|
|
|
AS AT DECEMBER 31,
(MILLIONS, EXCEPT SHARE AMOUNTS)
|
2023 |
|
2022 |
| Assets |
|
|
|
| Cash and cash equivalents |
$ |
9 |
|
|
$ |
1 |
|
|
|
|
|
| Due from affiliates |
886 |
|
|
782 |
|
| Other assets |
40 |
|
|
— |
|
| Investment in Brookfield Asset Management ULC |
2,270 |
|
|
2,378 |
|
|
|
|
|
| Total assets |
$ |
3,205 |
|
|
$ |
3,161 |
|
|
|
|
|
| Liabilities |
|
|
|
| Accounts payable and accrued liabilities |
$ |
859 |
|
|
$ |
781 |
|
| Due to affiliates |
261 |
|
|
3 |
|
| Total liabilities |
1,120 |
|
|
784 |
|
|
|
|
|
| Commitment and contingencies |
|
|
|
|
|
|
|
| Equity |
|
|
|
| Common Stock: |
|
|
|
Class A (unlimited authorized and 413,026,253 issued and 388,733,466 outstanding) |
2,354 |
|
|
2,410 |
|
Class B (unlimited authorized and 21,280 issued and outstanding) |
— |
|
|
— |
|
Class A held in treasury (24,292,787 shares) |
(649) |
|
|
(330) |
|
| Additional paid-in-capital |
403 |
|
|
278 |
|
| Retained (deficit) earnings |
(35) |
|
|
19 |
|
| Accumulated other comprehensive income |
3 |
|
|
— |
|
| Total common equity |
2,076 |
|
|
2,377 |
|
| Non-controlling interest |
9 |
|
|
— |
|
| Total equity |
2,085 |
|
|
2,377 |
|
| Total liabilities, non-controlling interest and equity |
$ |
3,205 |
|
|
$ |
3,161 |
|
BROOKFIELD ASSET MANAGEMENT LTD.
CONSOLIDATED STATEMENT OF COMPREHENSIVE INCOME
|
|
|
|
|
|
|
|
|
|
|
|
|
|
|
|
|
|
|
|
FOR THE YEAR ENDED DECEMBER 31, 2023 AND FOR THE PERIOD JULY 4, 2022 TO DECEMBER 31, 2022
(MILLIONS, EXCEPT PER SHARE AMOUNTS) |
|
|
2023 |
|
2022 |
| Operating recoveries |
|
|
$ |
383 |
|
|
$ |
37 |
|
|
|
|
|
|
|
| Expenses |
|
|
|
|
|
| Compensation and benefits |
|
|
(326) |
|
|
(1) |
|
| Other operating expense |
|
|
(5) |
|
|
(35) |
|
| Carried interest allocation compensation |
|
|
|
|
|
| Realized |
|
|
(24) |
|
|
— |
|
| Unrealized |
|
|
(38) |
|
|
(3) |
|
| Total carried interest allocation compensation |
|
|
(62) |
|
|
(3) |
|
| Interest expense |
|
|
(9) |
|
|
— |
|
| Total expenses |
|
|
(402) |
|
|
(39) |
|
| Share of income from Brookfield Asset Management ULC |
|
|
470 |
|
|
21 |
|
|
|
|
|
|
|
|
|
|
|
|
|
| Net income |
|
|
$ |
451 |
|
|
$ |
19 |
|
|
|
|
|
|
|
| Earnings per share |
|
|
|
|
|
| Basic |
|
|
$ |
1.15 |
|
|
$ |
0.05 |
|
| Diluted |
|
|
$ |
1.13 |
|
|
$ |
0.05 |
|
|
|
|
|
|
|
| Weighted-average shares |
|
|
|
|
|
| Basic |
|
|
391.7 |
|
|
396.2 |
|
| Diluted |
|
|
396.5 |
|
|
400.9 |
|
|
|
|
|
|
|
Comprehensive income: |
|
|
|
|
|
| Net income |
|
|
$ |
451 |
|
|
$ |
19 |
|
Other comprehensive income: |
|
|
|
|
|
| Share of other comprehensive income from Brookfield Asset Management ULC |
|
|
3 |
|
|
— |
|
Other comprehensive income |
|
|
3 |
|
|
— |
|
| Comprehensive income |
|
|
$ |
454 |
|
|
$ |
19 |
|
BROOKFIELD ASSET MANAGEMENT LTD.
CONSOLIDATED STATEMENT OF CHANGES IN EQUITY
|
|
|
|
|
|
|
|
|
|
|
|
|
|
|
|
|
|
|
|
|
|
|
|
|
|
|
|
|
|
|
|
|
|
|
|
|
|
|
|
|
|
|
|
|
|
|
|
|
|
|
|
|
|
|
AS AT
(MILLIONS, EXCEPT SHARE AMOUNTS)
|
Shares of Brookfield Asset Management Ltd. |
|
Brookfield Asset Management Ltd. |
| Class A common stock |
|
Class B common stock |
|
Common stock |
|
Treasury stock |
|
Additional paid-in-capital |
|
Retained (deficit) earnings |
|
Accumulated
other
comprehensive
income |
|
Non-controlling interest |
|
Total equity |
Balance at July 4, 2022 |
— |
|
|
— |
|
|
$ |
— |
|
|
$ |
— |
|
|
$ |
— |
|
|
$ |
— |
|
|
$ |
— |
|
|
$ |
— |
|
|
$ |
— |
|
Net income |
— |
|
|
— |
|
|
|
|
— |
|
|
— |
|
|
19 |
|
|
— |
|
|
— |
|
|
19 |
|
Share subscriptions |
2,404,747 |
|
|
— |
|
|
52 |
|
|
— |
|
|
— |
|
|
— |
|
|
— |
|
|
— |
|
|
52 |
|
| Purchase of treasury shares, net |
— |
|
|
— |
|
|
— |
|
|
(330) |
|
|
— |
|
|
— |
|
|
— |
|
|
— |
|
|
(330) |
|
Capital contribution |
393,749,981 |
|
|
21,280 |
|
|
2,358 |
|
|
— |
|
|
278 |
|
|
— |
|
|
— |
|
|
— |
|
|
2,636 |
|
| Balance at December 31, 2022 |
396,154,728 |
|
|
21,280 |
|
|
2,410 |
|
|
(330) |
|
|
278 |
|
|
19 |
|
|
— |
|
|
— |
|
|
2,377 |
|
| Net income |
— |
|
|
— |
|
|
— |
|
|
— |
|
|
— |
|
|
451 |
|
|
— |
|
|
— |
|
|
451 |
|
| Other comprehensive income |
— |
|
|
— |
|
|
— |
|
|
— |
|
— |
|
— |
|
— |
|
— |
|
— |
|
3 |
|
|
— |
|
|
3 |
|
| Share subscriptions |
813,290 |
|
|
— |
|
|
— |
|
|
— |
|
|
(4) |
|
|
— |
|
|
— |
|
|
— |
|
|
(4) |
|
| Purchase of treasury shares, net |
(8,234,552) |
|
|
— |
|
|
— |
|
|
(319) |
|
|
— |
|
|
— |
|
|
— |
|
|
— |
|
|
(319) |
|
| Contributions |
— |
|
|
— |
|
|
— |
|
|
— |
|
|
129 |
|
|
— |
|
|
— |
|
|
9 |
|
|
138 |
|
| Distributions |
— |
|
|
— |
|
|
(56) |
|
|
— |
|
|
— |
|
|
(505) |
|
|
— |
|
|
— |
|
|
(561) |
|
| Balance at December 31, 2023 |
388,733,466 |
|
|
21,280 |
|
|
$ |
2,354 |
|
|
$ |
(649) |
|
|
$ |
403 |
|
|
$ |
(35) |
|
|
$ |
3 |
|
|
$ |
9 |
|
|
$ |
2,085 |
|
BROOKFIELD ASSET MANAGEMENT LTD.
CONSOLIDATED STATEMENT OF CASH FLOWS
|
|
|
|
|
|
|
|
|
|
|
|
|
|
|
|
|
|
|
|
FOR THE YEAR ENDED DECEMBER 31, 2023 AND FOR THE PERIOD JULY 4, 2022 TO DECEMBER 31, 2022
(MILLIONS) |
|
|
2023 |
|
2022 |
| Operating activities |
|
|
|
|
|
| Net income |
|
|
$ |
451 |
|
|
$ |
19 |
|
| Non-cash adjustments: |
|
|
|
|
|
|
|
|
|
|
|
| Share of income from Brookfield Asset Management ULC, net of dividends |
|
|
56 |
|
|
(21) |
|
|
|
|
|
|
|
| Stock based equity awards |
|
|
6 |
|
|
— |
|
Other expense |
|
|
— |
|
|
1 |
|
|
|
|
|
|
|
| Net change in working capital |
|
|
(5) |
|
|
(1) |
|
|
|
|
|
|
|
|
|
|
|
|
|
|
|
|
|
|
|
|
|
|
|
|
|
|
|
|
|
|
|
|
|
|
508 |
|
|
(2) |
|
| Investing activities |
|
|
|
|
|
| Acquisitions |
|
|
|
|
|
| Purchase of other assets |
|
|
(41) |
|
|
— |
|
|
|
|
|
|
|
|
|
|
(41) |
|
|
— |
|
| Financing activities |
|
|
|
|
|
| Stock-based compensation prepayment from affiliates |
|
|
104 |
|
|
— |
|
Share subscriptions |
|
|
(4) |
|
|
52 |
|
| Capital provided by non-controlling interest |
|
|
9 |
|
|
— |
|
| Change in due to affiliates |
|
|
256 |
|
|
281 |
|
|
|
|
|
|
|
| Distributions paid to common stockholders |
|
|
(505) |
|
|
— |
|
| Share repurchases |
|
|
(319) |
|
|
(330) |
|
|
|
|
(459) |
|
|
3 |
|
| Cash and cash equivalents |
|
|
|
|
|
| Change in cash and cash equivalents |
|
|
8 |
|
|
1 |
|
| Balance, beginning of period |
|
|
1 |
|
|
— |
|
| Balance, end of period |
|
|
$ |
9 |
|
|
$ |
1 |
|
|
|
|
|
|
|
|
|
|
|
|
|
FOR THE YEAR ENDED DECEMBER 31, 2023 AND FOR THE PERIOD JULY 4, 2022 TO DECEMBER 31, 2022
(MILLIONS) |
2023 |
|
2022 |
| Supplemental cash flow disclosures |
|
|
|
| Net change in working capital |
|
|
|
| Accounts payable and other |
$ |
63 |
|
|
$ |
781 |
|
| Due from affiliates |
(70) |
|
|
(782) |
|
| Due to affiliates |
2 |
|
|
— |
|
| Income taxes paid |
— |
|
|
— |
|
| Interest paid |
9 |
|
|
— |
|
| Non-Cash Financing Activities |
|
|
|
| Settlement of due to affiliates |
56 |
|
|
278 |
|
BROOKFIELD ASSET MANAGEMENT LTD.
NOTES TO THE CONSOLIDATED FINANCIAL STATEMENTS
1. ORGANIZATION
Brookfield Asset Management Ltd. (the “Manager”), through its investment in Brookfield Asset Management ULC (“asset management business” or the “Company”) is an alternative asset manager. The Manager is listed on the New York and Toronto stock exchanges under the symbol BAM. The Manager was incorporated on July 4, 2022 and its head office is located at Suite 100, Brookfield Place, 181 Bay Street, Toronto, Ontario M5J 2T3 and its registered office is located at 1055 West Georgia Street, 1500 Royal Centre, P.O. Box 11117, Vancouver, British Columbia V6E 4N7.
On December 9, 2022, Brookfield Corporation (the "Corporation") completed the spin-off of Brookfield Asset Management ULC (the "Arrangement"). The Manager was incorporated for the purpose of holding a 25% interest in Brookfield Asset Management ULC and to facilitate the Arrangement. As part of the Arrangement, the Corporation contributed certain indirect wholly owned asset management subsidiaries to Brookfield Asset Management ULC. The contribution of these entities was considered a common control transaction and was measured at historical cost. Further, the Corporation contributed a 25% interest of Brookfield Asset Management ULC to the Manager, and in exchange, the Manager issued securities of the Manager to the Corporation’s shareholders at that time on a pro-rata basis.
The Manager entered into several agreements and arrangements resulting from the Arrangement, among which include:
•The Asset Management Services Agreement (the "AMSA") under which the Manager provides the services of its employees and its Chief Executive Officer to Brookfield Asset Management ULC which pays the Manager for the services of these individuals on a cost recovery basis such that neither party receives financial gain nor suffers financial loss. Most of the Manager's employees/executives spend their time discharging their duties as officers and employees of the Manager and towards responsibilities related to Brookfield Asset Management ULC which include investment, corporate and other services. In addition, at the request of Brookfield Asset Management ULC, the Manager may provide options and long term incentive awards to its employees, which will be reimbursed under this agreement. See discussion of the accounting for this agreement in the Operating Recoveries accounting policy in Note 2;
•The Transitional Services Agreement (the "TSA") pursuant to which (i) Brookfield Asset Management ULC will provide the Corporation and the Manager, on a transitional basis, certain services to support day-to-day corporate activities (including services relating to finance, treasury, accounting, legal and regulatory, marketing, communications, human resources, internal audit, information technology), and (ii) the Corporation will provide, on a transitional basis, certain services to Brookfield Asset Management ULC to facilitate the orderly transfer of the asset management business. See discussion of the accounting for this agreement in the Related Parties accounting policy in Note 2; and
•The Relationship Agreement under which certain employee share-based and performance-based compensation costs are recovered from the Corporation. See discussion of the accounting for this agreement in the Operating Recoveries accounting policy in Note 2.
2. SUMMARY OF SIGNIFICANT ACCOUNTING POLICIES
Basis of Presentation
The accompanying Consolidated Financial Statements of the Manager have been prepared in conformity with accounting principles generally accepted in the United States of America (“U.S. GAAP”) and are presented in U.S. Dollars. The Consolidated Financial Statements have been prepared in accordance with the accounting policies set out below.
Use of Estimates
The preparation of the Consolidated Financial Statements in accordance with U.S. GAAP requires management to make estimates that affect the amounts reported in the Consolidated Financial Statements and accompanying notes. Management believes that estimates utilized in the preparation of the Consolidated Financial Statements are reasonable. Such estimates include those used in the valuation of investments and the accounting for share-based and performance-based compensation. Actual results may differ from those estimates and such differences may be material.
Consolidation
The Manager consolidates all entities that it controls through a majority voting interest and all variable interest entities (“VIE”) for which it is the primary beneficiary. An enterprise is determined to be the primary beneficiary of a VIE if it holds a controlling financial interest. A controlling financial interest is defined as (a) the power to direct the activities of a VIE that most significantly
impact the entity’s economic performance and (b) the obligation to absorb losses of the entity or the right to receive benefits from the entity that could potentially be significant to the VIE. The Manager determines whether it is the primary beneficiary of a VIE at the time it becomes involved with a VIE and upon events warranting reconsideration. In determining whether the Manager is the primary beneficiary, the company evaluates its control rights as well as economic interests in the entity held either directly or indirectly by the company. The consolidation analysis can generally be performed qualitatively; however, if it is not readily apparent that the company is not the primary beneficiary, a quantitative analysis may also be performed. Investments and redemptions (either by the Manager, affiliates of the company or third parties) and amendments to governing documents could affect an entity’s status as a VIE or the determination of the primary beneficiary. As at December 31, 2023, the Manager is not the primary beneficiary of any VIE.
All intercompany balances and transactions have been eliminated on consolidation.
Foreign Currency
In the normal course of business, the Manager may enter into transactions not denominated in U.S. Dollars. Foreign exchange gains and losses arising on such transactions are recorded in Net Income. In addition, where the Manager consolidates entities that have a non-U.S. Dollar functional currency those non-U.S. Dollar denominated assets and liabilities are translated to U.S. Dollars at the exchange rate prevailing at the reporting date and income, expenses, gains and losses are translated at the prevailing exchange rate on the dates that they were recorded. Cumulative translation adjustments arising from the translation of non-U.S. Dollar denominated operations are recorded in Other Comprehensive Income.
Cash and Cash Equivalents
Cash and cash equivalents represent cash on hand and cash held in banks. Interest income from cash and cash equivalents is recorded in the Consolidated Statements of Comprehensive Income.
Equity Method Investments
Investments in which the Manager is deemed to exert significant influence, but does not have a controlling financial interest are accounted for using the equity method of accounting. The Manager has significant influence over Brookfield Asset Management ULC and therefore accounts for its investment under the equity method.
The carrying value of equity method investments is determined based on amounts invested by the Company, adjusted for the share of earnings or losses of the investee allocated based on the relevant agreements, less distributions received. Under the equity method of accounting, the Manager's share of earnings from equity investments is included in the share of income from equity method investments in the Consolidated Statement of Comprehensive Income. The Manager evaluates its equity method investments for impairment whenever events or changes in circumstances indicate that the carrying amounts of such investments may not be recoverable.
Refer to Note 3 for further details of the Manager's equity method investments.
Accounts Payable and Accrued Liabilities
Accounts payable primarily consists of long-term compensation liabilities due to the employees of the Manager.
Other Assets
Other assets include investments in options to acquire shares of the Company. The Manager has elected the measurement alternative for equity investments without readily determinable fair values to be measured at cost minus impairment, if any. The carrying amount of these investments as of December 31, 2023 is $40 million. For the year ended December 31, 2023, there has been no downward or upward adjustments made to the carrying amount of these investments due to impairment or observable price changes in orderly transactions for identical or similar investment of the same issuer.
Operating Recoveries
Operating Recoveries arise from the AMSA between the Manager and Brookfield Asset Management ULC and the Relationship Agreement between the Manager, Brookfield Asset Management ULC and the Corporation.
Under the AMSA, recoveries are recognized on a cost recovery basis such that neither party receives financial gain nor suffers financial loss. Income generated under the AMSA relating to these services is recognized as Operating Recoveries in the Consolidated Statement of Comprehensive Income on a gross basis as and when the services are performed by the Manager.
Under the Relationship Agreement, certain employee share-based and performance-based compensation costs are recovered from the Corporation. Income generated under the Relationship Agreement relating to these awards is recognized as Operating Recoveries in the Consolidated Statement of Comprehensive Income on a gross basis.
Certain liabilities classified as share-based awards covered by the AMSA and the Relationship Agreement are required to be revalued at each balance sheet date. As a result, where the revaluation results in an increase in the share-based award liability, the Corporation and Brookfield Asset Management ULC will reimburse the Manager while conversely, where the revaluation results in a decrease in the share-based award liability, the Manager will be responsible for refunding the difference to the Corporation and Brookfield Asset Management ULC.
Under the TSA, the Manager is responsible for the costs of transitional services provided by Brookfield Asset Management ULC and the Corporation. Such costs are recognized as Operating Recoveries in the Consolidated Statement of Comprehensive Income when services are performed.
To the extent that Brookfield Asset Management ULC makes payments to the Manager under the AMSA for share-based awards before they vest, such prepayments are recognized by the Manager as deferred income included in Accounts payable and accrued liabilities on the Consolidated Balance Sheets.
Compensation and Benefits
Compensation consists of (a) salary and bonus, and benefits paid and payable to employees and (b) share-based compensation associated with the grants of share-based awards to employees of the Manager. Compensation costs relating to the issuance of share-based awards to senior management and employees of the Manager is accounted for in accordance with ASC 718, Compensation - Stock Compensation, which measures the equity-classified awards at fair value on the grant date and expenses the awards over the vesting period. Cash settled share-based awards and awards settled in a variable number of shares for a fixed monetary amount are classified as liabilities and are remeasured at the end of each reporting period. The Manager recognizes forfeitures as they occur.
In the normal course of business, the Manager issues share-based compensation awards to employees of Brookfield Asset Management ULC. Such awards are accounted for as awards issued to employees of equity method investees under ASC 323 Investments – Equity Method and Joint Ventures. As the awards vest, the Manager recognizes the entire cost of the awards as an expense included in share of income from equity method investments, as no proportionate funding by the other investors occurs and the Manager does not receive any increase in its relative ownership percentage of Brookfield Asset Management ULC. However, the cost associated with the Manager’s ownership interest is recognized when the Manager recognizes its share of Brookfield Asset Management ULC’s earnings. Brookfield Asset Management ULC reimburses the Manager for such awards, which the Manager recognizes as income included in share of income from equity method investments in the same period as the associated cost of the awards. As such, this arrangement with Brookfield Asset Management ULC has no net impact on the Manager’s Consolidated Statement of Comprehensive Income. To the extent that Brookfield Asset Management ULC reimburses the Manager for such awards before they vest, the Manager recognizes the reimbursement in additional paid-in capital.
Refer to Note 5 for further details of the Manager's share-based compensation.
Carried Interest Compensation Expense
Carried interest is performance-based compensation associated with realized or unrealized carried interest earned on the performance of investments on a fund-by-fund basis. Employees of the Manager earn carried interest compensation which is subject to both positive and negative adjustments and recoverable from Brookfield Asset Management ULC and the Corporation under the terms of the ASMA and the Relationship Agreement.
Related Parties
In the normal course of operations, the Manager enters into various transactions on market terms with related parties, including amounts in Due from/to affiliates. The Manager and its subsidiaries may also transact with entities that share a common parent. Amounts owed to and by equity method investments are not eliminated on consolidation. See Note 7 for further detail.
Dividends
Dividends are reflected in the Consolidated Financial Statements when declared.
Segment Information
The Manager operates as a single operating segment. The Manager's chief operating decision maker, it's Chief Executive Officer, manages operations on a consolidated basis for the purposes of allocating resources, making operating decisions and evaluating financial performance.
Earnings per Share
The Manager uses the two class method to calculate basic and diluted net income per share. Earnings for each period are allocated to participating securities based on the contractual participation rights of the security to share in the current earnings as if all current period earnings had been distributed. Undistributed losses are not allocated to participating securities that do not have a contractual obligation to share in losses.
Diluted net income per share reflects the impact of dilutive instruments, which are generally determined using the treasury stock method. For potentially dilutive instruments that are also participating securities, the treasury stock method or the two-class method, whichever, produces the more diluted result, is used to determine diluted net income per share.
Recent Accounting Pronouncements
The Manager considers the applicability and impact of all Accounting Standard Updates ("ASUs") issued by the Financial Accounting Standards Board ("FASB"). ASUs not listed below were assessed and either determined to be not applicable or expected to have minimal impact on the company's consolidated financial statements.
In November 2023, the FASB issued ASU 2023-07, which requires the disclosure of significant segment expenses that are part of an entity’s segment measure of profit or loss and regularly provided to the chief operating decision maker. In addition, it adds or makes clarifications to other segment-related disclosures, such as clarifying that the disclosure requirements in ASC 280 are required for entities with a single reportable segment and that an entity may disclose multiple measures of segment profit and loss. The amendments in this update apply to all public entities that are required to report segment information in accordance with Topic 280, Segment Reporting. ASU 2023-07 is effective for fiscal years beginning after December 15, 2023 and interim periods beginning after December 15, 2024. The Manager is currently assessing the impact of this update.
In December 2023, the FASB issued ASU 2023-09, which amends the Codification to enhance the transparency and decision usefulness of income tax disclosures. This ASU requires additional disaggregation of the reconciliation between the statutory and effective tax rate for an entity and of income taxes paid, both of which are disclosures required by current GAAP. The amendments improve the transparency of income tax disclosures by requiring (1) consistent categories and greater disaggregation of information in the rate reconciliation and (2) income taxes paid disaggregated by jurisdiction. The amendments in this update apply to all entities that are subject to Topic 740, Income Taxes. For public business entities, the amendments in the update are effective for annual periods beginning after December 15, 2024. The Manager is currently assessing the impact of this update.
3. INVESTMENTS
The Manager has a variable interest in the Company, an unconsolidated VIE. It has been determined that the Manager is not the primary beneficiary mainly due to its lack of power to unilaterally make decisions about the activities that most significantly impact the VIE’s returns. The Manager accounts for its interest in Brookfield Asset Management ULC using the equity method of accounting as it has significant influence from its 25% equity interest and its ability to appoint two directors on the VIE’s board.
The summarized financial information and results of the Manager’s equity method investment in Brookfield Asset Management ULC are outlined in the tables below:
|
|
|
|
|
|
|
|
|
|
|
|
AS AT DECEMBER 31,
(MILLIONS) |
2023 |
|
2022 |
| Cash |
$ |
2,667 |
|
|
$ |
3,545 |
|
| Investments |
7,522 |
|
|
6,877 |
|
| Assets |
14,290 |
|
|
14,087 |
|
| Liabilities |
2,825 |
|
|
2,670 |
|
| Preferred shares redeemable non-controlling interest |
2,166 |
|
|
1,811 |
|
| Equity |
9,299 |
|
|
9,606 |
|
|
|
|
|
|
|
|
|
|
|
|
|
|
|
FOR THE YEAR ENDED DECEMBER 31, 2023 AND FOR THE PERIOD JULY 4, 2022 TO DECEMBER 31, 2022
(MILLIONS) |
|
|
2023 |
|
2022 |
| Revenues |
|
|
$ |
4,062 |
|
|
$ |
174 |
|
| Expenses |
|
|
(1,546) |
|
|
(61) |
|
| Net income |
|
|
2,137 |
|
|
84 |
|
|
|
|
|
|
|
| Net income attributable to preferred shares redeemable non-controlling interest |
|
|
262 |
|
|
6 |
|
| Net income attributable to non-controlling interest |
|
|
36 |
|
|
35 |
|
| Net income attributable to the common stockholders |
|
|
1,839 |
|
|
43 |
|
As of December 31, 2023, the carrying value of the equity method investment was equal to the Manager’s interest in the Company’s underlying net assets.
For the year ended December 31, 2023 and period from December 9, 2022 to December 31, 2022, the Manager’s share of net income from the Company was $470 million and $21 million, respectively. The Manager received cash distributions from the Company of $526 million for the year ended December 31, 2023.
The assets and liabilities recognized in the Manager’s Consolidated Balance Sheet as of December 31, 2023 and 2022, related to its maximum exposure to the loss of the Company as an unconsolidated VIE, are as follows:
|
|
|
|
|
|
|
|
|
|
|
|
AS AT DECEMBER 31,
(MILLIONS) |
2023 |
|
2022 |
Investments |
$ |
2,270 |
|
|
$ |
2,378 |
|
Due from affiliates |
394 |
|
|
4 |
|
VIE related assets |
2,664 |
|
|
2,382 |
|
Accounts payable |
859 |
|
|
781 |
|
Due to affiliates |
256 |
|
|
3 |
|
Maximum exposure to loss |
$ |
3,779 |
|
|
$ |
3,166 |
|
The Manager has not provided financial or other support to the Company during the years presented above.
4. INCOME TAXES
The income before provision for taxes consists of income earned in Canada. The Manager does not currently carry a provision for taxes as there is no tax obligation on current period net income. The Manager's equity-accounted investment in the Company is expected to be realized through non-taxable dividends. Accordingly, no tax provision has been recorded.
The Manager's effective income tax rate is different from the Manager's statutory income tax rate due to the following differences set out below:
|
|
|
|
|
|
|
|
|
|
|
|
| FOR THE YEAR ENDED DECEMBER 31, 2023 AND FOR THE PERIOD JULY 4, 2022 TO DECEMBER 31, 2022 |
2023 |
|
2022 |
| Statutory income tax rate |
27 |
% |
|
27 |
% |
| (Reduction) increase in rate resulting from: |
|
|
|
Non-taxable amounts |
(28) |
% |
|
(27) |
% |
Valuation allowance |
1 |
% |
|
— |
% |
| Effective income tax rate |
— |
% |
|
— |
% |
A summary of the tax effects of the temporary differences is as follows:
|
|
|
|
|
|
|
|
|
|
|
|
AS AT DECEMBER 31,
(MILLIONS) |
2023 |
|
2022 |
|
|
|
|
| Losses (Canada) |
$ |
2 |
|
|
$ |
— |
|
| Valuation allowance |
(2) |
|
|
— |
|
Deferred income tax assets |
$ |
— |
|
|
$ |
— |
|
As of December 31, 2023 and December 31, 2022, the Manager did not have any material unrecognized tax benefits related to uncertain tax positions.
The Manager files its tax returns as prescribed by the tax laws of the jurisdictions in which it operates. In the normal course of business, the company is subject to examination by Canadian and foreign tax authorities. As of December 31, 2023, no tax returns are subject to examination.
5. SHARE-BASED COMPENSATION
The Manager and the Corporation have granted share-based compensation awards to certain employees and directors of the Manager, under a number of compensation plans (the “Equity Plans”). The Equity Plans provide for the granting of share options, restricted shares, escrowed shares and deferred share and restricted share units which contain certain service or performance requirements of the Manager or the Corporation.
For the year ended December 31, 2023, the Manager granted 7.9 million stock options at a weighted average exercise price of $35.13. The compensation expense was calculated using the Black-Scholes method of valuation, assuming an average 7.5 year term, 28.5% volatility, a weighted average expected dividend yield of 4.6% annually, a risk-free rate of 3.9% and a liquidity discount of 25%, with a fair value of $5.26 per unit. The total fair value of the options granted was $41.3 million.
For the year ended December 31, 2023 the Manager granted 4.8 million escrowed shares at a weighted average exercise price of $35.13. The compensation expense was calculated using the Black-Scholes method of valuation, assuming an average 7.5 year term, 28.5% volatility, a weighted average expected dividend yield of 4.6% annually, a risk-free rate of 3.9% and a liquidity discount of 25%, with a fair value of $5.26 per unit. The total fair value of the escrowed shares granted was $25.2 million.
The expenses of the share-based compensation are recognized on the financial statements of the Manager and are summarized in the following table:
|
|
|
|
|
|
|
|
|
|
|
|
FOR THE YEAR ENDED DECEMBER 31, 2023 AND FOR THE PERIOD JULY 4, 2022 TO DECEMBER 31, 2022
(MILLIONS) |
2023 |
|
2022 |
| Expense arising from equity classified share-based payment transactions |
$ |
37 |
|
|
$ |
5 |
|
| Expense (recovery) arising from liability classified share-based payment transactions |
156 |
|
|
(45) |
|
|
$ |
193 |
|
|
$ |
(40) |
|
Management Share Option Plan
The Manager recognizes any awards associated with the existing Equity Plans for its employees irrespective of whether the awards were granted by the Corporation or the Manager. Options issued under the Management Share Option Plan (“MSOP”) of both the Corporation and the Manager vest over a period of up to five years, expire ten years after the grant date and are settled through issuance of Class A shares of the Corporation or the Manager. The exercise price is equal to the market price at the grant date.
For the year ended December 31, 2023 and period ended December 31, 2022, the total expense incurred by the Manager with respect to MSOP totaled $10 million and $1 million, respectively.
The change in the number of options during the year ended December 31, 2023 was as follows:
|
|
|
|
|
|
|
|
|
|
|
|
|
|
|
|
|
|
|
|
|
|
|
|
|
Brookfield Asset Management Ltd.1 |
|
Brookfield Corporation2 |
|
Number of Options (000's) |
|
Weighted-Average Exercise Price |
|
Number of Options (000's) |
|
Weighted-Average Exercise Price |
|
|
|
|
|
|
|
|
|
|
|
|
|
|
|
|
|
|
|
|
|
|
|
|
|
|
|
|
|
|
|
|
|
|
|
|
|
|
|
|
Outstanding as at January 1, 2023 |
3,639 |
|
|
$ |
22.45 |
|
|
14,553 |
|
|
$ |
25.38 |
|
| Transferred |
778 |
|
18.54 |
|
|
3,111 |
|
|
20.95 |
|
| Granted |
2,104 |
|
|
35.13 |
|
|
— |
|
|
— |
|
| Exercised |
(710) |
|
|
14.31 |
|
|
(2,535) |
|
|
16.12 |
|
| Cancelled |
(53) |
|
|
35.02 |
|
|
(41) |
|
|
38.89 |
|
Outstanding as at December 31, 2023 |
5,758 |
|
|
$ |
26.57 |
|
|
15,088 |
|
|
$ |
24.48 |
|
|
1 - Represents the continuity of the Manager options relating to only those employees of the Manager based on the Manager's weighted average exercise price which differs from that of the Corporation. The 5.8 million remaining shares, not included in the table above, are Manager options related to employees of the Asset Management Company.
2 - Represents the continuity of the Corporation's options relating to only those employees of the Manager based on the Corporation's weighted average exercise price which differs from that of the Manager.
|
The weighted-average grant date fair value of the Manager MSOP granted for the year ended December 31, 2023 and the period ended December 31, 2022 was $5.26 and $3.50, respectively, and was determined using the Black-Scholes valuation model, with inputs to the model as follows:
|
|
|
|
|
|
|
|
|
|
|
|
|
|
|
|
|
|
FOR THE YEAR ENDED DECEMBER 31, 2023 AND FOR THE PERIOD JULY 4, 2022 TO DECEMBER 31, 2022
(MILLIONS) |
Unit |
|
2023 |
|
2022 |
| Weighted-average share price |
US$ |
|
$ |
35.13 |
|
|
$ |
22.39 |
|
| Average term to exercise |
Years |
|
7.5 |
|
7.4 |
Share price volatility1 |
% |
|
28.5 |
|
|
22.2 |
|
| Liquidity discount |
% |
|
25.0 |
|
|
25.0 |
|
| Weighted-average annual dividend yield |
% |
|
4.6 |
|
|
1.8 |
|
| Risk-free rate |
% |
|
3.9 |
|
|
2.1 |
|
| 1 - Share price volatility was determined based on historical share prices of a similar or comparable entity for the prior period to the average term to exercise. |
The weighted-average grant date fair value of the Corporation MSOP granted for the year ended December 31, 2022 was $8.82, and was determined using the Black-Scholes valuation model, with inputs to the model as follows:
|
|
|
|
|
|
|
|
|
|
|
|
|
|
FOR THE PERIOD JULY 4, 2022 TO DECEMBER 31, 2022
(MILLIONS) |
Unit |
|
|
|
2022 |
| Weighted-average share price |
US$ |
|
|
|
$ |
46.62 |
|
| Average term to exercise |
Years |
|
|
|
7.5 |
Share price volatility1 |
% |
|
|
|
24.8 |
|
| Liquidity discount |
% |
|
|
|
25.0 |
|
| Weighted-average annual dividend yield |
% |
|
|
|
1.4 |
|
| Risk-free rate |
% |
|
|
|
1.9 |
|
1 - Share price volatility was determined based on implied volatilities consistent with Brookfield Corporation's historical share price of a similar or comparable entity for the prior period to the average term to exercise. |
Escrowed Stock Plan
The Escrowed Stock ("ES") shares generally vest over five years and must be held to the fifth anniversary of the grant date. At a date no more than ten years from the grant date, all outstanding ES shares will be exchanged for Class A shares issued by the Corporation or the Manager based on the market value of the respective Class A shares at the time of the exchange. The number of Class A shares issued on exchange will be less than the Class A shares purchased under the ES Plan resulting in a net reduction in the number of Class A shares issued by the Manager.
For the year ended December 31, 2023 and period ended December 31, 2022, the total expense incurred with respect to the ES Plan totaled $20 million and $3 million, respectively.
|
|
|
|
|
|
|
|
|
|
|
|
|
|
|
|
|
|
|
|
|
|
|
|
|
Brookfield Asset Management Ltd.1 |
|
Brookfield Corporation2 |
|
Number of Options (000's) |
|
Weighted-Average Exercise Price |
|
Number of Options (000's) |
|
Weighted-Average Exercise Price |
|
|
|
|
|
|
|
|
|
|
|
|
|
|
|
|
|
|
|
|
|
|
|
|
Outstanding as at January 1, 2023 |
5,452 |
|
|
$ |
29.64 |
|
|
16,324 |
|
|
$ |
34.84 |
|
| Transferred |
335 |
|
|
29.64 |
|
|
1,334 |
|
|
34.85 |
|
| Granted |
3,251 |
|
|
35.13 |
|
|
— |
|
|
— |
|
|
|
|
|
|
|
|
|
|
|
|
|
|
|
|
|
Outstanding as at December 31, 2023 |
9,038 |
|
|
$ |
31.62 |
|
|
17,658 |
|
|
$ |
34.84 |
|
1 - Represents the continuity of the Manager ES relating to only those employees of the Manager based on the Manager's weighted average exercise price which differs from that of the Corporation.
2 - Represents the continuity of the Corporation ES relating to only those employees of the Manager. Based on the Corporation's weighted average exercise price which differs from that of the Manager. |
The weighted-average grant date fair value of the Manager escrowed shares granted for the year ended December 31, 2023 and the period ended December 31, 2022 was $5.26 and $3.83, respectively, and was determined using the Black-Scholes model of valuation with inputs to the model as follows:
|
|
|
|
|
|
|
|
|
|
|
|
|
|
|
|
|
|
|
FOR THE YEAR ENDED DECEMBER 31, 2023 AND FOR THE PERIOD JULY 4, 2022 TO DECEMBER 31, 2022
(MILLIONS)
|
Unit |
|
2023 |
|
2022 |
| Weighted-average share price |
US$ |
|
$ |
35.13 |
|
|
$ |
29.64 |
|
| Average term to exercise |
Years |
|
7.5 |
|
6.9 |
Share price volatility1 |
% |
|
28.5 |
|
|
28.9 |
|
| Liquidity discount |
% |
|
25.0 |
|
|
25.0 |
|
| Weighted-average annual dividend yield |
% |
|
4.6 |
|
|
5.3 |
|
| Risk-free rate |
% |
|
3.9 |
|
|
3.7 |
|
1 - Share price volatility was determined based on implied volatilities consistent with Brookfield Corporation's historical share price of a similar or comparable entity for the prior period to the average term to exercise. |
The weighted-average grant date fair value of the Corporation escrowed shares granted for the period ended December 31, 2022 was $7.50, and was determined using the Black-Scholes valuation model, with inputs to the model as follows:
|
|
|
|
|
|
|
|
|
|
|
|
|
|
FOR THE PERIOD JULY 4, 2022 TO DECEMBER 31, 2022
(MILLIONS) |
Unit |
|
|
|
2022 |
| Weighted-average share price |
US$ |
|
|
|
$ |
34.84 |
|
| Average term to exercise |
Years |
|
|
|
7.10 |
Share price volatility1 |
% |
|
|
|
27.00 |
|
| Liquidity discount |
% |
|
|
|
25.00 |
|
| Weighted-average annual dividend yield |
% |
|
|
|
1.00 |
|
| Risk-free rate |
% |
|
|
|
4.00 |
|
| 1 - Share price volatility was determined based on historical share prices of a similar or comparable entity for the prior period to the average term to exercise. |
Restricted Stock Plan
The Restricted Stock Plan awards executives with Class A shares of the Corporation and the Manager purchased on the open market (“Restricted Shares”). Under the Restricted Stock Plan, Restricted Shares awarded vest over a period of up to five years, except for Restricted Shares awarded in lieu of a cash bonus, which may vest immediately. Vested and unvested Restricted Shares are subject to a hold period of up to five years. Holders of Restricted Shares are entitled to vote Restricted Shares and to receive associated dividends. Employee compensation expense for the Restricted Stock Plan is charged against income over the vesting period.
Compensation expense recognized for the year ended December 31, 2023 and period ended December 31, 2022 was $7 million and $1 million, respectively.
Deferred Share Unit Plan and Restricted Share Unit Plan
The Deferred Share Unit ("DSU") Plan and Restricted Share Unit ("RSU") Plan provides for the issuance of DSUs and RSUs, respectively. Under these plans, qualifying employees and directors receive varying percentages of their annual incentive bonus or directors’ fees in the form of DSUs and RSUs. The DSUs and RSUs vest over periods of up to five years, and DSUs accumulate additional DSUs at the same rate as dividends on Class A shares of the Corporation and the Manager based on the market value of the Class A shares of the Manager at the time of the dividend. Participants may convert vested DSUs and RSUs into cash upon retirement or cessation of employment.
The value of these DSUs, when converted to cash, will be equivalent to the market value of the Class A shares of the Corporation and the Manager at the time the conversion takes place. The value of the RSUs, when converted into cash, will be equivalent to the difference between the market price of equivalent number of Class A shares of the Corporation or the Manager at the time the conversion takes place and the market price on the date the RSUs are granted. The fair value of the vested DSUs and RSUs as at December 31, 2023 was $531 million (2022 – $369 million).
Employee compensation expense for these plans is charged against income over the vesting period of the DSUs and RSUs. As these awards are liability classified, the amount payable in respect of vested DSUs and RSUs changes as a result of dividends and share price movements. All of the amounts attributable to changes in the amounts payable by the company are recorded as employee compensation expense in the period of the change. For awards issued as part of the Arrangement, the mark-to-market movement in the awards is recoverable from the Asset Management Company.
For the year ended December 31, 2023 and period ended December 31, 2022, employee compensation expense (recovery) totaled $156 million and $(45) million, respectively due to a change in the underlying share price.
The change in the number of the Corporation DSUs and RSUs outstanding to employees of the Manager for the year ended December 31, 2023 was as follows:
|
|
|
|
|
|
|
|
|
|
|
|
|
|
|
|
|
|
|
DSUs |
|
RSUs |
|
Number of Units Tracking to BAM Ltd. share price (000's) |
Number of Units Tracking to BN share price (000's) |
|
Number of Units Tracking to BN share price (000's) |
Weighted-Average Exercise Price (CAD) |
|
|
|
|
|
|
|
|
|
|
|
|
|
|
|
|
|
|
Outstanding as at January 1, 2023 |
1,207 |
|
6,067 |
|
|
5,488 |
|
$ |
6.11 |
|
| Transferred |
190 |
|
747 |
|
|
— |
|
— |
|
| Granted and reinvested |
115 |
|
56 |
|
|
— |
|
— |
|
| Exercised and cancelled |
(9) |
|
(36) |
|
|
— |
|
— |
|
Outstanding as at December 31, 2023 |
1,503 |
|
6,834 |
|
|
5,488 |
|
$ |
6.11 |
|
6. EARNINGS PER SHARE
Basic earnings per share is computed by dividing net income by the weighted average number of common shares outstanding during the period. The Manager applies the two-class method in calculating earnings per share for each of its two classes of shares and participating securities, based on their pro-rata share of earnings. Class A shares held under the ES Plans in one or more private wholly owned subsidiaries of the Manager are classified as treasury shares and have been excluded from the calculation of earnings per share. The Manager has certain dilutive securities relating to outstanding restricted stock and options held by employees and non-employees and have been reflected accordingly in diluted earnings per share figures. Basic and diluted net income per share of common stock for the year ended December 31, 2023 and period ended December 31, 2022 was calculated as follows:
|
|
|
|
|
|
|
|
|
|
|
|
|
|
|
|
|
|
|
|
|
|
|
|
|
|
|
|
FOR THE YEAR ENDED DECEMBER 31, 2023 AND FOR THE PERIOD JULY 4, 2022 TO DECEMBER 31, 2022
(MILLIONS) |
|
|
Year Ended |
|
Period Ended |
|
|
|
|
2023 |
|
2023 |
|
2022 |
|
2022 |
|
|
|
|
|
Class A Shares |
|
Class B Shares |
|
Class A Shares |
|
Class B Shares |
| Numerator |
|
|
|
|
|
|
|
|
|
|
|
| Net income |
|
|
|
|
$ |
449 |
|
|
$ |
— |
|
|
$ |
19 |
|
|
$ |
— |
|
| Denominator |
|
|
|
|
|
|
|
|
|
|
|
| Weighted average of common stock outstanding - basic |
|
|
|
|
391.7 |
|
|
— |
|
|
396.2 |
|
|
— |
|
| Dilutive effect of conversion of options and escrowed shares using treasury stock method |
|
|
|
|
4.8 |
|
|
— |
|
|
4.7 |
|
|
— |
|
| Weighted average of common stock outstanding - diluted |
|
|
|
|
396.5 |
|
|
— |
|
|
400.9 |
|
|
— |
|
| Net Income per Share |
|
|
|
|
|
|
|
|
|
|
|
| Earnings per share - basic |
|
|
|
|
1.15 |
|
|
1.15 |
|
|
0.05 |
|
|
0.05 |
|
| Earnings per share - diluted |
|
|
|
|
$ |
1.13 |
|
|
$ |
1.15 |
|
|
$ |
0.05 |
|
|
$ |
0.05 |
|
The following weighted average potentially dilutive securities were evaluated under the treasury stock method for potentially dilutive effects and have been excluded in the above computation of diluted net income per share attributable to common shareholders for the period presented due to their anti-dilutive effect:
|
|
|
|
|
|
|
|
|
|
|
|
|
|
|
|
|
|
|
|
FOR THE YEAR ENDED DECEMBER 31, 2023 AND FOR THE PERIOD JULY 4, 2022 TO DECEMBER 31, 2022
(MILLIONS) |
|
|
2023 |
|
2022 |
| Management stock options of the Manager |
|
|
8.2 |
|
|
3.4 |
|
| Escrow shares of the Manager |
|
|
5.0 |
|
|
0.8 |
|
| Restricted shares of the Manager |
|
|
— |
|
|
0.6 |
|
| Total |
|
|
13.2 |
|
|
4.8 |
|
7. RELATED PARTY TRANSACTIONS
In the normal course of business, the Manager enters into transactions with related parties by recovering or bearing the cost of certain employee compensation with the Corporation and Brookfield Asset Management ULC and by borrowing on its $500 million credit facility with Brookfield Asset Management ULC to fund short-term capital requirements.
Under the AMSA, the Manager provides the services of its employees and its Chief Executive Officer to Brookfield Asset Management ULC on a cost recovery basis. For the year ended December 31, 2023 and period ended December 31, 2022, under this arrangement the Manager has recognized $177 million and $nil, respectively in Operating Recoveries. In addition, the Manager recovered $4 million in unrealized carried interest compensation expense from the asset management business for the year ended.
As outlined in the Relationship Agreement, the Corporation is responsible for the share based awards issued by the Corporation, some of which are subject to revaluation at each balance sheet date and will also bear the cost of the employee entitlement to carried interest on mature funds either directly or indirectly through reimbursement to the Company. For the year ended December 31, 2023 and period ended December 31, 2022, the Manager has recognized $206 million in Operating Recoveries and $35 million in Operating Expenses under this arrangement, respectively.
Under the TSA, Brookfield Asset Management ULC will provide the Corporation and the Manager certain services to support day-to-day corporate activities on a transitional basis. For services provided to the Manager, costs are recorded on a gross basis in the Consolidated Statement of Comprehensive Income. For the year ended December 31, 2023 and period ended December 31, 2022, the Manager has recognized less than $1 million in the Consolidated Statement of Comprehensive Income under this arrangement.
For the year ended December 31, 2023, the Manager received from Brookfield Asset Management ULC prepayments under the AMSA for share-based compensation of $16 million, which represent deferred income and have been included in Accounts payable and accrued liabilities. For the year ended December 31, 2023 and the period ended December 31, 2022 the Manager received from Brookfield Asset Management ULC advanced reimbursements for Manager share-based awards issued to employees of Brookfield Asset Management ULC of $88 million and $nil, respectively, which has been recorded in additional paid-in capital.
The balances due from affiliates related to compensation costs are presented in Due from affiliates on the Consolidated Balance Sheets and the balances due to affiliates are presented in Due to Affiliates.
Due from affiliates and Due to affiliates consisted of the following:
|
|
|
|
|
|
|
|
|
|
|
|
|
|
AS AT DECEMBER 31,
(MILLIONS) |
2023 |
|
2022 |
|
|
| Due from Affiliates |
|
|
|
|
|
| Receivables related to share and cash-based compensation |
$ |
824 |
|
|
$ |
782 |
|
|
|
| Other transactions with related parties |
62 |
|
— |
|
|
|
|
$ |
886 |
|
|
$ |
782 |
|
|
|
|
|
|
|
|
|
| Due to Affiliates |
|
|
|
|
|
| Borrowings on short-term credit facility |
$ |
256 |
|
|
$ |
— |
|
|
|
| Other transactions with related parties |
5 |
|
3 |
|
|
|
|
$ |
261 |
|
|
$ |
3 |
|
|
|
For the year ended December 31, 2023 the Manager recorded its share of a non-cash distributions declared by ULC to the Corporation in the amount of $56 million within the Consolidated Statement of Changes in Equity.
In addition, the Manager purchased options to acquire Brookfield Asset Management ULC’s shares for $41 million during the year ended December 31, 2023. These options track certain options issued under our Management Share Option Plan and are automatically exercised at the same time and the same exercise prices as the tracked Manager options. As of December 31, 2023, the carrying amount of these options is $40 million, and is included in other assets on the Consolidated Balance Sheets.
8. COMMITMENTS AND CONTINGENCIES
Guarantees
The Manager may from time to time enter into guarantees in respect of certain co-investments in which there is carried interest. The amount guaranteed is up to the carry amount paid to the general partners of the respective funds, net of taxes. In the event that the general partners default on their carry clawback obligations, the Manager will make payments under the guarantees. As at December 31, 2023, the Manager has not recognized any liabilities with respect to such guarantees as no carry has been paid in the relevant funds.
Litigation
The Manager may from time to time be involved in litigation and claims incidental to the conduct of its business. The Manager’s business is also subject to extensive regulation, which may result in regulatory proceedings against the company. As of December 31, 2023 there is no outstanding litigation.
The Manager accrues a liability for legal proceedings only when those matters present loss contingencies that are both probable and reasonably estimable. In such cases, there may be an exposure to loss in excess of any amounts accrued. Although there can be no assurance of the outcome of such legal actions, based on information known by management, the Manager does not have a potential liability related to any current legal proceeding or claim that would individually or in the aggregate materially affect its results of operations, financial position or cash flows.
9. SUBSEQUENT EVENTS
On February 6, 2024, the Board of the Manager declared a quarterly dividend of $0.38 per share, payable on March 28, 2024 to shareholders of record as at the close of business on February 29, 2024.
BROOKFIELD ASSET MANAGEMENT ULC
CONSOLIDATED AND COMBINED
FINANCIAL STATEMENTS
AS AT AND FOR THE YEAR ENDED DECEMBER 31, 2023 AND DECEMBER 31, 2022
INDEPENDENT AUDITOR'S REPORT
To the Board of Directors of Brookfield Asset Management ULC
Opinion
We have audited the consolidated and combined financial statements of Brookfield Asset Management ULC and subsidiaries (the “Company”), which comprise the consolidated and combined balance sheets as of December 31, 2023 and 2022, and the related consolidated and combined statements of operations, comprehensive income, changes in equity, and cash flows for years then ended, and the related notes to the consolidated and combined financial statements (collectively referred to as the "financial statements").
In our opinion, the accompanying financial statements present fairly, in all material respects, the financial position of the Company as of December 31, 2023 and 2022, and the results of its operations and its cash flows for the years then ended in accordance with accounting principles generally accepted in the United States of America.
Basis for Opinion
We conducted our audits in accordance with auditing standards generally accepted in the United States of America (GAAS). Our responsibilities under those standards are further described in the Auditor’s Responsibilities for the Audit of the Financial Statements section of our report. We are required to be independent of the Company and to meet our other ethical responsibilities, in accordance with the relevant ethical requirements relating to our audits. We believe that the audit evidence we have obtained is sufficient and appropriate to provide a basis for our audit opinion.
Responsibilities of Management for the Financial Statements
Management is responsible for the preparation and fair presentation of the financial statements in accordance with accounting principles generally accepted in the United States of America, and for the design, implementation, and maintenance of internal control relevant to the preparation and fair presentation of financial statements that are free from material misstatement, whether due to fraud or error.
In preparing the financial statements, management is required to evaluate whether there are conditions or events, considered in the aggregate, that raise substantial doubt about the Company’s ability to continue as a going concern for one year after the date that the financial statements are issued.
Auditor’s Responsibilities for the Audit of the Financial Statements
Our objectives are to obtain reasonable assurance about whether the financial statements as a whole are free from material misstatement, whether due to fraud or error, and to issue an auditor’s report that includes our opinion. Reasonable assurance is a high level of assurance but is not absolute assurance and therefore is not a guarantee that an audit conducted in accordance with GAAS will always detect a material misstatement when it exists. The risk of not detecting a material misstatement resulting from fraud is higher than for one resulting from error, as fraud may involve collusion, forgery, intentional omissions, misrepresentations, or the override of internal control. Misstatements are considered material if there is a substantial likelihood that, individually or in the aggregate, they would influence the judgment made by a reasonable user based on the financial statements.
In performing an audit in accordance with GAAS, we:
•Exercise professional judgment and maintain professional skepticism throughout the audit.
•Identify and assess the risks of material misstatement of the financial statements, whether due to fraud or error, and design and perform audit procedures responsive to those risks. Such procedures include examining, on a test basis, evidence regarding the amounts and disclosures in the financial statements.
•Obtain an understanding of internal control relevant to the audit in order to design audit procedures that are appropriate in the circumstances, but not for the purpose of expressing an opinion on the effectiveness of the Company’s internal control. Accordingly, no such opinion is expressed.
•Evaluate the appropriateness of accounting policies used and the reasonableness of significant accounting estimates made by management, as well as evaluate the overall presentation of the financial statements.
•Conclude whether, in our judgment, there are conditions or events, considered in the aggregate, that raise substantial doubt about the Company’s ability to continue as a going concern for a reasonable period of time.
We are required to communicate with those charged with governance regarding, among other matters, the planned scope and timing of the audit, significant audit findings, and certain internal control-related matters that we identified during the audit.
/s/ Deloitte LLP
Chartered Professional Accountants
Licensed Public Accountants
Toronto, Canada
March 19, 2024
BROOKFIELD ASSET MANAGEMENT ULC
CONSOLIDATED AND COMBINED BALANCE SHEETS
|
|
|
|
|
|
|
|
|
|
|
|
|
AS AT DECEMBER 31,
(MILLIONS, EXCEPT SHARE AMOUNTS)
|
2023 |
|
2022 |
| Assets |
|
|
|
| Cash and cash equivalents |
$ |
2,667 |
|
|
$ |
3,545 |
|
| Accounts receivable and other |
588 |
|
|
429 |
|
| Due from affiliates |
2,504 |
|
|
2,121 |
|
| Investments |
7,522 |
|
|
6,877 |
|
| Property, plant and equipment |
73 |
|
|
68 |
|
| Intangible assets |
42 |
|
|
59 |
|
| Goodwill |
251 |
|
|
249 |
|
| Deferred income tax assets |
643 |
|
|
739 |
|
| Total assets |
$ |
14,290 |
|
|
$ |
14,087 |
|
|
|
|
|
| Liabilities |
|
|
|
| Accounts payable and other |
$ |
1,799 |
|
|
$ |
1,842 |
|
| Due to affiliates |
986 |
|
|
811 |
|
| Deferred income tax liabilities |
40 |
|
|
17 |
| Total liabilities |
2,825 |
|
|
2,670 |
|
|
|
|
|
| Commitments and contingencies |
|
|
|
|
|
|
|
| Preferred shares redeemable non-controlling interest |
2,166 |
|
|
1,811 |
|
|
|
|
|
| Equity |
|
|
|
| Common equity (common shares - unlimited authorized, 1,635,349,629 issued and outstanding) |
9,014 |
|
|
9,271 |
|
| Retained (deficit) earnings |
(178) |
|
|
84 |
|
| Accumulated other comprehensive income |
168 |
|
|
153 |
|
| Additional paid-in capital |
122 |
|
|
— |
|
| Total common equity |
9,126 |
|
|
9,508 |
|
| Non-controlling interest |
173 |
|
|
98 |
|
| Total equity |
9,299 |
|
|
9,606 |
|
| Total liabilities, redeemable non-controlling interest and equity |
$ |
14,290 |
|
|
$ |
14,087 |
|
BROOKFIELD ASSET MANAGEMENT ULC
CONSOLIDATED AND COMBINED STATEMENTS OF OPERATIONS
|
|
|
|
|
|
|
|
|
|
|
|
|
|
|
|
|
|
|
|
|
|
|
|
FOR THE YEARS ENDED DECEMBER 31,
(MILLIONS) |
|
|
|
|
2023 |
|
2022 |
|
|
| Revenues |
|
|
|
|
|
|
|
|
|
| Base management and advisory fees |
|
|
|
|
$ |
3,142 |
|
|
$ |
2,835 |
|
|
|
|
|
|
|
|
|
|
|
|
|
|
|
|
|
|
|
|
|
|
|
| Investment income |
|
|
|
|
|
|
|
|
|
| Carried interest allocations |
|
|
|
|
|
|
|
|
|
| Realized |
|
|
|
|
51 |
|
|
241 |
|
|
|
| Unrealized |
|
|
|
|
348 |
|
|
249 |
|
|
|
| Total investment income |
|
|
|
|
399 |
|
|
490 |
|
|
|
| Interest and dividend revenue |
|
|
|
|
172 |
|
|
258 |
|
|
|
Other revenues |
|
|
|
|
349 |
|
|
44 |
|
|
|
| Total revenues |
|
|
|
|
4,062 |
|
|
3,627 |
|
|
|
| Expenses |
|
|
|
|
|
|
|
|
|
| Compensation, operating, and general and administrative expenses |
|
|
|
|
|
|
|
|
|
| Compensation and benefits |
|
|
|
|
(1,048) |
|
|
(700) |
|
|
|
| Other operating expenses |
|
|
|
|
(342) |
|
|
(236) |
|
|
|
| General, administrative and other |
|
|
|
|
(56) |
|
|
(81) |
|
|
|
| Total compensation, operating, and general and administrative expenses |
|
|
|
|
(1,446) |
|
|
(1,017) |
|
|
|
| Carried interest allocation compensation |
|
|
|
|
|
|
|
|
|
| Realized |
|
|
|
|
(26) |
|
|
(61) |
|
|
|
| Unrealized |
|
|
|
|
(60) |
|
|
(139) |
|
|
|
| Total carried interest allocation compensation |
|
|
|
|
(86) |
|
|
(200) |
|
|
|
| Interest expense |
|
|
|
|
(14) |
|
|
(154) |
|
|
|
| Total expenses |
|
|
|
|
(1,546) |
|
|
(1,371) |
|
|
|
| Other (expenses) income, net |
|
|
|
|
(129) |
|
|
1,090 |
|
|
|
| Share of income from equity accounted investments |
|
|
|
|
167 |
|
|
146 |
|
|
|
| Income before taxes |
|
|
|
|
2,554 |
|
|
3,492 |
|
|
|
| Income tax expense |
|
|
|
|
(417) |
|
|
(627) |
|
|
|
| Net income |
|
|
|
|
2,137 |
|
|
2,865 |
|
|
|
| Net (income) attributable to: |
|
|
|
|
|
|
|
|
|
| Redeemable non-controlling interests in consolidated funds |
|
|
|
|
— |
|
|
(909) |
|
|
|
| Preferred shares redeemable non-controlling interest |
|
|
|
|
(262) |
|
|
(35) |
|
|
|
| Non-controlling interest |
|
|
|
|
(36) |
|
|
(6) |
|
|
|
| Net income attributable to the common stockholders |
|
|
|
|
$ |
1,839 |
|
|
$ |
1,915 |
|
|
|
BROOKFIELD ASSET MANAGEMENT ULC
CONSOLIDATED AND COMBINED STATEMENTS OF COMPREHENSIVE INCOME
|
|
|
|
|
|
|
|
|
|
|
|
|
|
|
|
|
|
|
|
|
|
|
|
FOR THE YEARS ENDED DECEMBER 31,
(MILLIONS) |
|
|
|
|
2023 |
|
2022 |
|
|
| Net income |
|
|
|
|
$ |
2,137 |
|
|
$ |
2,865 |
|
|
|
| Currency translation |
|
|
|
|
15 |
|
|
(32) |
|
|
|
| Comprehensive income |
|
|
|
|
2,152 |
|
|
2,833 |
|
|
|
| Comprehensive (income) loss attributable to: |
|
|
|
|
|
|
|
|
|
| Redeemable non-controlling interest in consolidated funds |
|
|
|
|
— |
|
|
(909) |
|
|
|
| Preferred share redeemable non-controlling interest |
|
|
|
|
(262) |
|
|
(35) |
|
|
|
| Non-controlling interest |
|
|
|
|
(36) |
|
|
(6) |
|
|
|
| Comprehensive income attributable to common stockholders |
|
|
|
|
$ |
1,854 |
|
|
$ |
1,883 |
|
|
|
BROOKFIELD ASSET MANAGEMENT ULC
CONSOLIDATED AND COMBINED STATEMENTS OF CHANGES IN EQUITY
|
|
|
|
|
|
|
|
|
|
|
|
|
|
|
|
|
|
|
|
|
|
|
|
|
|
|
|
|
|
|
|
|
|
|
|
|
|
|
|
|
|
|
|
|
|
|
|
|
|
|
|
AS AT
(MILLIONS) |
Common equity |
|
|
|
|
|
|
Net Parent Investment |
|
Common
shares |
|
Additional
paid-in
capital |
|
Retained
(deficit)
earnings |
|
Accumulated
other
comprehensive
income |
|
Total
common equity |
|
Non-controlling
interest |
|
Total
equity |
|
|
|
|
|
|
|
|
|
|
|
|
|
|
|
|
|
|
|
|
|
|
|
|
|
|
|
|
|
|
|
|
|
|
|
|
|
|
|
|
|
|
|
|
|
|
|
|
|
|
|
|
|
|
|
|
|
|
|
|
|
|
|
|
|
|
|
|
|
|
|
|
|
|
|
|
|
|
|
|
|
|
|
|
|
|
|
|
|
|
|
|
Balance at December 31, 2021 |
$ |
9,715 |
|
|
$ |
— |
|
|
$ |
— |
|
|
$ |
— |
|
|
$ |
156 |
|
|
$ |
9,871 |
|
|
$ |
— |
|
|
$ |
9,871 |
|
|
|
| Net income |
1,831 |
|
|
— |
|
|
— |
|
|
84 |
|
|
— |
|
|
1,915 |
|
|
6 |
|
|
1,921 |
|
|
|
| Other comprehensive income |
(29) |
|
|
— |
|
|
— |
|
|
— |
|
|
(3) |
|
|
(32) |
|
|
— |
|
|
(32) |
|
|
|
| Contributions |
3,897 |
|
|
— |
|
|
— |
|
|
— |
|
|
— |
|
|
3,897 |
|
|
92 |
|
|
3,989 |
|
|
|
| Distributions |
(6,143) |
|
|
— |
|
|
— |
|
|
— |
|
|
— |
|
|
(6,143) |
|
|
— |
|
|
(6,143) |
|
|
|
| Transfer of interest |
(9,271) |
|
|
9,271 |
|
|
— |
|
|
— |
|
|
— |
|
|
— |
|
|
— |
|
|
— |
|
|
|
| Balance at December 31, 2022 |
— |
|
|
9,271 |
|
|
— |
|
|
84 |
|
|
153 |
|
|
9,508 |
|
|
98 |
|
|
9,606 |
|
|
|
| Net income |
— |
|
|
— |
|
|
— |
|
|
1,839 |
|
|
— |
|
|
1,839 |
|
|
36 |
|
|
1,875 |
|
|
|
| Other comprehensive income |
— |
|
|
— |
|
|
— |
|
|
— |
|
|
15 |
|
|
15 |
|
|
— |
|
|
15 |
|
|
|
| Contributions |
— |
|
|
1 |
|
|
122 |
|
|
— |
|
|
— |
|
|
123 |
|
|
10 |
|
|
133 |
|
|
|
| Distributions |
— |
|
|
(229) |
|
|
— |
|
|
(2,101) |
|
|
— |
|
|
(2,330) |
|
|
— |
|
|
(2,330) |
|
|
|
| Transfer of interest |
— |
|
|
(29) |
|
|
— |
|
|
— |
|
|
— |
|
|
(29) |
|
|
29 |
|
|
— |
|
|
|
| Balance at December 31, 2023 |
$ |
— |
|
|
$ |
9,014 |
|
|
$ |
122 |
|
|
$ |
(178) |
|
|
$ |
168 |
|
|
$ |
9,126 |
|
|
$ |
173 |
|
|
$ |
9,299 |
|
|
|
BROOKFIELD ASSET MANAGEMENT ULC
CONSOLIDATED AND COMBINED STATEMENTS OF CASH FLOWS
|
|
|
|
|
|
|
|
|
|
|
|
|
|
|
|
|
|
|
|
|
|
|
|
FOR THE YEARS ENDED DECEMBER 31,
(MILLIONS) |
|
|
|
|
2023 |
|
2022 |
|
|
| Operating activities |
|
|
|
|
|
|
|
|
|
| Net income |
|
|
|
|
$ |
2,137 |
|
|
$ |
2,865 |
|
|
|
| Other income (expenses), net |
|
|
|
|
54 |
|
|
(1,090) |
|
|
|
|
|
|
|
|
|
|
|
|
|
| Share of income (loss) from investments accounted for under the equity method, net of cash dividends |
|
|
|
|
21 |
|
|
22 |
|
|
|
| Depreciation and amortization |
|
|
|
|
14 |
|
|
13 |
|
|
|
| Deferred income taxes |
|
|
|
|
92 |
|
|
336 |
|
|
|
| Stock based equity awards |
|
|
|
|
33 |
|
|
(48) |
|
|
|
|
|
|
|
|
|
|
|
|
|
| Unrealized carried interest allocation, net |
|
|
|
|
(288) |
|
|
(110) |
|
|
|
| Net change in working capital |
|
|
|
|
(642) |
|
|
(3,020) |
|
|
|
| Other non-cash operating items |
|
|
|
|
18 |
|
|
658 |
|
|
|
|
|
|
|
|
1,439 |
|
|
(374) |
|
|
|
| Investing activities |
|
|
|
|
|
|
|
|
|
| Acquisitions |
|
|
|
|
|
|
|
|
|
| Property, plant and equipment |
|
|
|
|
(17) |
|
|
(13) |
|
|
|
| Equity accounted investments |
|
|
|
|
(282) |
|
|
(279) |
|
|
|
| Financial assets and other |
|
|
|
|
(4) |
|
|
(84) |
|
|
|
| Dispositions and distributions received |
|
|
|
|
|
|
|
|
|
|
|
|
|
|
|
|
|
|
|
|
|
|
|
|
|
|
|
|
|
| Financial assets and other |
|
|
|
|
84 |
|
|
2,082 |
|
|
|
| Advances provided to related parties |
|
|
|
|
(256) |
|
|
— |
|
|
|
|
|
|
|
|
(475) |
|
|
1,706 |
|
|
|
| Financing activities |
|
|
|
|
|
|
|
|
|
| Corporate borrowings |
|
|
|
|
— |
|
|
(1,612) |
|
|
|
Contributions from parent |
|
|
|
|
— |
|
|
5,155 |
|
|
|
|
|
|
|
|
|
|
|
|
|
| Contributions from redeemable non-controlling interests |
|
|
|
|
2 |
|
|
517 |
|
|
|
|
|
|
|
|
|
|
|
|
|
| Issuance of related party loans |
|
|
|
|
197 |
|
|
461 |
|
|
|
| Repayment of related party loans |
|
|
|
|
— |
|
|
(324) |
|
|
|
|
|
|
|
|
|
|
|
|
|
|
|
|
|
|
|
|
|
|
|
Issuance of non-operating loans to affiliates |
|
|
|
|
— |
|
|
35 |
|
|
|
| Preferred equity issuances |
|
|
|
|
63 |
|
|
— |
|
|
|
| Issuance of tracking option |
|
|
|
|
41 |
|
|
— |
|
|
|
| Distributions to redeemable non-controlling interests |
|
|
|
|
(44) |
|
|
(1,328) |
|
|
|
| Distributions to common stockholders |
|
|
|
|
(2,101) |
|
|
(3,184) |
|
|
|
|
|
|
|
|
(1,842) |
|
|
(280) |
|
|
|
| Cash and cash equivalents |
|
|
|
|
|
|
|
|
|
| Change in cash and cash equivalents |
|
|
|
|
(878) |
|
|
1,052 |
|
|
|
| Effect of exchange rate changes on cash and cash equivalents |
|
|
|
|
— |
|
|
(1) |
|
|
|
| Balance, beginning of year |
|
|
|
|
3,545 |
|
|
2,494 |
|
|
|
| Balance, end of year |
|
|
|
|
$ |
2,667 |
|
|
$ |
3,545 |
|
|
|
BROOKFIELD ASSET MANAGEMENT ULC
CONSOLIDATED AND COMBINED STATEMENTS OF CASH FLOWS (CONTINUED)
|
|
|
|
|
|
|
|
|
|
|
|
|
|
|
|
|
|
|
|
|
|
|
|
FOR THE YEARS ENDED DECEMBER 31,
(MILLIONS) |
|
|
|
|
2023 |
|
2022 |
|
|
| Supplemental cash flow disclosures |
|
|
|
|
|
|
|
|
|
| Net change in working capital |
|
|
|
|
|
|
|
|
|
| Accounts receivable and other |
|
|
|
|
$ |
(200) |
|
|
$ |
(205) |
|
|
|
| Accounts payable and other |
|
|
|
|
(26) |
|
|
(30) |
|
|
|
| Due from affiliates |
|
|
|
|
(559) |
|
|
4,611 |
|
|
|
| Due to affiliates |
|
|
|
|
372 |
|
|
(7,396) |
|
|
|
| Income taxes paid |
|
|
|
|
171 |
|
|
291 |
|
|
|
| Interest paid |
|
|
|
|
11 |
|
|
37 |
|
|
|
| Non-cash Financing Activities |
|
|
|
|
|
|
|
|
|
| Non-cash contribution |
|
|
|
|
42 |
|
|
— |
|
|
|
| Non-cash distribution |
|
|
|
|
229 |
|
|
— |
|
|
|
BROOKFIELD ASSET MANAGEMENT ULC
NOTES TO THE CONSOLIDATED AND COMBINED FINANCIAL STATEMENTS
1. ORGANIZATION
On May 12, 2022, Brookfield Corporation (formerly known as Brookfield Asset Management Inc.) (the “Corporation”) announced that it would separately list and distribute to its shareholders a 25% interest in its asset management business. The transaction was completed on December 9, 2022 by way of an arrangement agreement (the “Arrangement”), which resulted in the transfer of the Corporation's historical asset management business into the newly incorporated Brookfield Asset Management ULC ("our asset management business"). On completion of the Arrangement, the Corporation transferred a 25% interest in Brookfield Asset Management ULC to Brookfield Asset Management Ltd. (the “Manager”). These Consolidated and Combined Financial Statements represent the activities, assets and liabilities of the Corporation's historical asset management business using a legal entity approach.
References in these financial statements to “us,” “we,” “our” or “the Company” refer to our asset management business and its direct and indirect subsidiaries and consolidated entities. Brookfield Asset Management ULC's asset management business focuses on renewable power and transition, infrastructure, real estate, private equity, and credit, operating in various markets globally.
The Company was formed on July 4, 2022 as an unlimited liability company under, and governed by, the laws of British Columbia. The registered office of the company is 1055 West Georgia Street, 1500 Royal Centre, P.O. Box 11117, Vancouver, British Columbia V6E 4N7.
We describe in these footnotes the business held by us after the Arrangement as if it were a standalone business for all historical periods described. However, we were not a standalone separate entity with independently conducted operations prior to the completion of the Arrangement.
The Company entered into several agreements and arrangements resulting from the Arrangement, among which include:
•The Asset Management Services Agreement (the "AMSA") under which the Manager provides the services of its employees and its Chief Executive Officer to the Company who in turn pays the Manager for the services of these individuals on a cost recovery basis such that neither party receives financial gain nor suffers financial loss. Most of the Manager's employees/executives spend their time discharging their duties as officers and employees of the Manager and towards responsibilities related to the Company which include investment, corporate and other services. In addition, at the request of the Company, the Manager may provide options and long term incentive awards to its employees, which will be reimbursed under this agreement. See discussion of the accounting for this agreement in the Other (expenses) revenues accounting policy in Note 2;
•The Transitional Services Agreement (the "TSA") pursuant to which (i) the Company provides the Corporation and the Manager, on a transitional basis, certain services to support day-to-day corporate activities (including services relating to finance, treasury, accounting, legal and regulatory, marketing, communications, human resources, internal audit, information technology), and (ii) the Corporation provides, on a transitional basis, certain services to the Company to facilitate the orderly transfer of the asset management business. See discussion of the accounting for this agreement in the Related Parties accounting policy in Note 2; and
•The Relationship Agreement under which (i) carried interest generated by our asset management business is allocated to the Corporation at 100% with respect to mature funds and at 33.3% with respect to current funds, new funds and open-ended funds, through the Company’s non-controlling interest and redeemable preferred shares non-controlling interest held by the Corporation, and (ii) certain employee share-based and performance-based compensation costs are recovered from the Corporation. See discussion of the accounting for this agreement in the Other (expenses) revenues accounting policy in Note 2.
2. SUMMARY OF SIGNIFICANT ACCOUNTING POLICIES
Basis of Presentation
The financial statements for periods prior to and through the date of the Arrangement were prepared on a combined standalone basis and were derived from the consolidated financial statements and accounting records of the Corporation. The financial statements for the year ended December 31, 2023, and as of December 31, 2023 are consolidated and combined financial statements of the Company and its subsidiaries, each of which is wholly owned, and is based on the financial position and results of operations of the Company as a standalone company. Intercompany balances and transactions between consolidated entities
have been eliminated. These consolidated and combined financial statements reflect the historical results of operations, financial position and cash flows of the Company in accordance with accounting principles generally accepted in the United States ("U.S. GAAP"). The historical results of operations and cash flows of the Company prior to the Arrangement presented in these consolidated and combined financial statements may not be indicative of what they would have been had the Company been an independent standalone entity, nor are they necessarily indicative of the Company's future results of operations, financial position and cash flows.
The consolidated and combined statements of operations for periods prior to and through the Arrangement include all revenues and costs directly attributable to the Company and an allocation of expenses related to certain Corporation corporate functions. These allocated costs and expenses include executive management, finance, treasury, tax, audit, legal, information technology, human resources and risk management functions and the related benefit/cost associated with such functions, including employee share-based and performance based compensation. These costs and expenses have been allocated to the Company based on direct usage or benefit where specifically identifiable, with the remaining expenses allocated primarily on a pro rata basis using an applicable measure of revenues, headcount or other relevant measures. The Company considers these allocations to be a reasonable reflection of the utilization of services or the benefit received.
The preparation of the Company's consolidated and combined financial statements in conformity with U.S. GAAP requires management to make estimates and assumptions that affect the amounts reported in these financial statements and accompanying notes. Actual results could differ from those estimates. Generally, actual experience has been consistent with management's prior estimates and assumptions. In many cases, management's estimates and assumptions are dependent on estimates of such future developments which may change in the future. In the opinion of management, all adjustments considered necessary for a fair presentation have been included in the accompanying consolidated and combined financial statements.
Certain of the comparative figures have been reclassified to conform to the consolidated and combined financial statement presentation adopted in the current year.
Use of Estimates
The preparation of the Consolidated and Combined Financial Statements in accordance with U.S. GAAP requires management to make estimates that affect the amounts reported in the Consolidated and Combined Financial Statements and accompanying notes. Management believes that estimates utilized in the preparation of the Consolidated and Combined Financial Statements are reasonable. Such estimates include those used in the valuation of investments and financial instruments, the measurement of deferred tax balances (including valuation allowances), accrued carried interest, incentive distributions and the accounting for share-based and performance-based compensation. Actual results may differ from those estimates and such differences may be material.
Consolidation
The Company consolidates all entities that it controls through a majority voting interest and all variable interest entities (“VIE”) for which it is the primary beneficiary. An enterprise is determined to be the primary beneficiary if it holds a controlling financial interest. A controlling financial interest is defined as (a) the power to direct the activities of a VIE that most significantly impact the entity’s economic performance and (b) the obligation to absorb losses of the entity or the right to receive benefits from the entity that could potentially be significant to the VIE. The Company determines whether it is the primary beneficiary of a VIE at the time it becomes involved with a variable interest entity and reconsiders that conclusion upon certain events. In determining whether the Company is the primary beneficiary, the Company evaluates its control rights as well as economic interests in the entity held either directly or indirectly by the Company. The consolidation analysis can generally be performed qualitatively; however, if it is not readily apparent that the Company is not the primary beneficiary, a quantitative analysis may also be performed. Investments and redemptions (either by the Company, affiliates of the Company or third parties) or amendments to the governing documents of an entity could affect its status as a VIE or the determination of the primary beneficiary. Assets of a consolidated VIE can only be used to settle obligations of the consolidated VIE and creditors and other beneficial interest holders do not have recourse to the Company with respect to liabilities of its consolidated VIEs. The Company’s other disclosures regarding VIEs are discussed in Note 4 “Variable Interest Entities.”
All intercompany balances and transactions have been eliminated on consolidation.
Redeemable Non-Controlling Interests in Consolidated Funds
Non-controlling interests of unaffiliated limited partners in Brookfield Strategic Real Estate Partners III ("BSREP III") are presented as redeemable non-controlling interests within the Consolidated and Combined Balance Sheet, outside of permanent equity as these limited partnership interests have withdrawal or redemption rights in certain limited circumstances that are beyond the control of the Company, such as instances in which retaining the limited partnership interest could cause the limited partner to violate a law, regulation or rule.
The allocation of net income or loss to redeemable non-controlling interests is based on the relative ownership interest of the unaffiliated limited partners after the consideration of contractual arrangements that govern allocation of income or loss. At the consolidated level, potential incentives are allocated to redeemable non-controlling interests in consolidated funds until such incentives become allocable to the Company under the substantive contractual terms of the BSREP III limited partnership agreement. When redeemable amounts become contractually payable to the unaffiliated limited partners, they are classified as a liability in the Consolidated and Combined Balance Sheet. The Company no longer consolidates BSREP III as of December 9, 2023 as a result of the Arrangement.
Redeemable Preferred Shares Non-Controlling Interest
Upon completion of the Arrangement, the Company issued various special tracking preferred shares of subsidiaries of the Company (“Tracking Shares”) which provides the Corporation with a redemption right, upon a liquidation or redemption event, to receive a preferred amount equal to the fair value of carried interest entitlement from certain tracked assets, net of any compensation related costs. These returns are realized through the payment of cumulative dividends, as and when declared by the board of directors of the relevant Brookfield Asset Management ULC subsidiaries. These tracking shares are entitled to vote, together with the common shares owned indirectly by the Company, in respect of those subsidiaries. The tracking shares are presented as preferred share redeemable non-controlling interest within the Consolidated and Combined Balance Sheets, outside of permanent equity.
The first series of Tracking Shares issued by Brookfield US Holdings Inc. ("BUSHI"), a subsidiary of the Company, provides the Corporation with economic interest equal to effectively 100% of the carried interest earned in mature funds. This series of Tracking Shares has a redemption clause whereby the issuer, whose board is controlled by the Corporation, may elect to redeem the tracking shares upon the tenth anniversary of issuance. While this series of tracking shares are not currently redeemable, the Company considers that it is probable that the instrument will become redeemable as the redemption requirement is only through passage of time. As such, the relevant redeemable non-controlling interest recognized outside of permanent equity requires remeasurement at each reporting period.
The second series of Tracking Shares issued by Brookfield Manager Holdings Ltd. ("BMHL") provides the Corporation with the economic interest equal to effectively a 33.3% share of similar distributions on open-ended funds. This series of Tracking Shares can only be redeemed upon exceptional circumstances that cause a materially adverse impact to the subsidiary. As the instrument is not currently redeemable and the Company considers such a triggering event to be remote and outside of the control of the entity, the relevant redeemable non-controlling interest recognized outside of permanent equity does not require remeasurement at each reporting period.
In addition to the Tracking Shares, BUSHI also has class B senior preferred shares and class B preferred shares outstanding as at December 31, 2023, all of which are held by the Corporation. The class B senior preferred shares entitle the holder to cumulative preferential cash dividends at $1.36375 per share per annum and are ranked senior to the BUSHI Tracking Shares, class B preferred shares and common shares. The class B senior preferred shares are redeemable by the issuer, whose board is controlled by the Corporation, upon the tenth anniversary of issuance at a redemption amount of $25 per share plus accrued and unpaid dividends. The class B preferred shares of BUSHI are redeemable at the option of both the holder and the issuer at a redemption amount of $25 per share plus declared and unpaid dividends, and title the holder to non-cumulative preferential cash dividends at 6.7% per annum on the redemption amount. These preferred shares are non-voting and rank junior to the class B senior preferred shares and the BUSHI Tracking Shares and senior to common shares of the entity. Due to the currently exercisable holder redemption option, these shares are presented as a part of preferred share redeemable non-controlling interest within the Company’s Consolidated and Combined Balance Sheet, outside of permanent equity and measured at their redemption amount plus any dividends declared and unpaid at each reporting date.
The Company recognizes any change of the carrying amount of its preferred shares redeemable non-controlling interest in net income (loss) attributable to preferred share redeemable non-controlling interest in its Consolidated and Combined Statement of Operations.
Non-Controlling Interest of Consolidated Subsidiaries
Upon completion of the Arrangement, the Company issued various classes of equity interests of the Company’s subsidiaries to the Corporation which have rights to priority distributions. Net income (loss) and other comprehensive income, if applicable, generated by the respective subsidiaries is allocated to non-controlling interest in consolidated entities based on the substantive contractual terms of the subsidiaries’ governing agreements that specify the allocation of income or loss.
Revenue Recognition
Revenue is measured based on the amount the Company expects to be entitled to under the contract with the customer and excludes amounts collected on behalf of third parties. A performance obligation is a promise in a contract to transfer a distinct good or service (or a bundle of goods and services) to the customer and is the unit of account in ASC 606. In determining the transaction price, an entity may include variable consideration only to the extent that it is probable that a significant reversal in the amount of cumulative revenue recognized would not occur when the uncertainty associated with the variable consideration is resolved. A contract’s transaction price is allocated to each distinct performance obligation and recognized as revenue, as, or when, the performance obligation is satisfied. The Company recognizes revenue when it transfers control of a product or service to a customer.
Revenues primarily consist of management and advisory fees, incentive fees (including incentive distributions and performance fees), investment income, interest and dividend revenue and other revenue.
Management and advisory fees — Management and advisory fees are comprised of base management fees and transaction, advisory and other fees and are accounted for as contracts with customers.
The Company earns base management fees from its customers at a fixed percentage of a calculation base which is typically committed capital or invested capital or net asset value. The Company identifies its customers on a fund-by-fund basis in accordance with the terms and circumstances of the individual fund. Generally, the customer is identified as the investor in its managed funds and investment vehicles, but for certain widely held funds or vehicles, the fund or vehicle itself may be identified as the customer. These customer contracts require the Company to provide investment management services over a period of time, which represents a performance obligation that the Company satisfies over time. Management fees are a form of variable consideration because the fees that the Company is entitled to vary based on fluctuations in the basis for the management fee. The amount recorded as revenue is generally determined at the end of the period because these management fees are payable on a regular basis (typically quarterly) and are not subject to claw back once paid.
Transaction, advisory and other fees are principally fees charged to the investors of funds indirectly through the managed funds and portfolio companies. These fees are based on a fixed percentage of enterprise value or equity value of pooled capital raised and are earned which generally coincides with when the capital is called. These fees are not tied to performance or ongoing investment management services, are not subject to claw back and are recorded in the period in which the related transaction closes.
Accrued but unpaid management and advisory fees, net of management fee reductions and management fee offsets, as of the reporting date are included in Accounts receivable and other or Due from affiliates in the Consolidated and Combined Balance Sheets.
Incentive distributions — Incentive distributions are incentive payments to reward the Company for meeting or exceeding certain performance thresholds of managed entities. They are comprised of incentive distributions and performance fees.
Incentive distributions paid to us by our permanent capital vehicles are determined by contractual arrangements and represent a portion of distributions paid by the permanent capital vehicles above a predetermined hurdle. They are accrued as revenue on the respective affiliates’ distribution record dates only if the predetermined hurdle has been achieved. They are not subject to claw back.
Incentive distributions will not be recognized until (a) it is probable that a significant reversal in the amount of cumulative revenue recognized will not occur, or (b) the uncertainty associated with the variable consideration is subsequently resolved.
Performance fees — Performance fees are generated when the Company exceeds predetermined investment returns within Brookfield Business Partners L.P. ("BBU") and on certain liquid strategy portfolios. BBU performance fees are based on the quarterly volume-weighted average increase in BBU unit price over the previous threshold and are accrued on a quarterly basis, whereas performance fees within liquid strategy funds are typically determined on an annual basis. These fees are not subject to claw back.
Accrued but unpaid incentive distributions and performance fees are recorded within Due from affiliates in the Consolidated and Combined Balance Sheets as of the reporting date.
Investment income (loss) — Investment income (loss) represents the unrealized and realized gains and losses on carried interest and movements in the fair value of the principal investments.
Carried interest is a performance fee arrangement in which the Company receives a percentage of investment returns, generated within a private fund on carry eligible capital, based on a contractual formula. We are eligible to earn carried interest from a fund once returns exceed the fund’s contractually defined performance hurdles at which point, we earn an accelerated percentage of the additional fund profit until we have earned the percentage of total fund profit, net of fees and expenses, to which we are entitled. At the end of each reporting period, the Company calculates the balance of accrued carried interest that would be due to the company for each fund, pursuant to the fund agreements, as if the fair value of the underlying investments were realized as of such date, irrespective of whether such amounts have been realized. As the fair value of underlying investments varies between reporting periods, it is necessary to make adjustments to amounts recorded as accrued carried interest to reflect either (a) positive performance resulting in an increase in the accrued carried interest to the general partner or (b) negative performance that would cause the amount due to the Company to be less than the amount previously recognized as revenue, resulting in a negative adjustment to the accrued carried interest to the general partner. These adjustments are recorded in the Consolidated and Combined Statements of Operations as unrealized carried interest allocations in Investment income. In each scenario, it is necessary to calculate the accrued carried interest on cumulative results compared to the accrued carried interest recorded to date and make the required positive or negative adjustments. The Company ceases to record negative carried interest once previously accrued carried interest for such funds have been fully reversed. The Company is not obligated to pay guaranteed returns or hurdles, and therefore, cannot have negative carried interest over the life of a fund. Accrued carried interest as of the reporting date is reflected in Investments on the Consolidated and Combined Balance Sheets.
Carried interest is realized when an underlying investment is profitably disposed of and the fund’s cumulative returns are in excess of the preferred return or, in limited instances, after certain thresholds for return of capital are met. Carried interest is subject to claw back to the extent that the carried interest received to date exceeds the amount due to the Company based on cumulative results. The accrual for potential repayment of previously received carried interest would represent amounts previously paid to the Company that would need to be repaid if these funds accruing carry were to be liquidated based on the fair value of their underlying investments. This amount is estimated to be $nil for all periods presented and as a result no clawback provision has been recognized in these Consolidated and Combined Financial Statements.
Fair value gains (losses) on principal investments include the unrealized and realized gains and losses on the Company’s principal investments, including its investments in the funds that are not consolidated and receive pro-rata allocations and other principal investments. Income (loss) on principal investments is realized when the Company redeems all or a portion of its investment or when the Company receives cash income, such as dividends or distributions. Unrealized income (loss) on principal investments results from changes in the fair value of the underlying investment as well as the reversal of unrealized gain (loss) at the time an investment is realized.
Interest and dividend revenue — Interest and dividend revenue comprise primarily of interest and dividend income earned on principal investments not accounted for under the equity method held by the Company.
Other (Expenses) Revenues
Other (expenses) revenues arises from the AMSA between the Manager and the Company and the Relationship Agreement between the Manager, the Company, and the Corporation.
Under the AMSA, the Manager provides the services of its employees on a cost recovery basis. Expenses incurred under the AMSA relating to these services is recognized as Other (expenses) revenues in the Consolidated and Combined Statement of Operations on a gross basis as and when the services are performed by the Manager.
Under the Relationship Agreement, certain employee share-based and performance-based compensation costs are recovered from the Corporation. Income generated under the Relationship Agreement relating to these instruments is recognized as Other (expenses) revenues in the Consolidated and Combined Statement of Operations on a gross basis as the instruments vest.
Certain liability classified share-based awards covered by the AMSA and Relationship Agreement are required to be revalued at each balance sheet date. As a result, where the revaluation results in an increase in the share-based award liability, the Corporation and the Company will reimburse the Manager while conversely, where the revaluation results in a decrease in the share-based award liability, the Manager will be responsible for reimbursing the difference to the Corporation or the Company.
Fair Value of Financial Instruments
U.S. GAAP establishes a hierarchical disclosure framework which prioritizes and ranks the level of market price observability used in measuring financial instruments at fair value. Market price observability is affected by a number of factors, including the
type of financial instrument, the characteristics specific to the financial instrument and the state of the marketplace, including the existence and transparency of transactions between market participants. Financial instruments with readily available quoted prices in active markets generally will have a higher degree of market price observability and a lesser degree of judgment used in measuring fair value.
Financial instruments measured and reported at fair value are classified and disclosed based on the observability of inputs used in the determination of fair values, as follows:
•Level I — Quoted prices are available in active markets for identical financial instruments as of the reporting date. The types of financial instruments in Level I include listed equities and mutual funds with quoted prices. The Company does not adjust the quoted price for these investments, even in situations where the Company holds a large position and a sale could reasonably impact the quoted price.
•Level II — Pricing inputs are other than quoted prices in active markets, which are either directly or indirectly observable as of the reporting date, and fair value is determined through the use of models or other valuation methodologies.
•Level III — Pricing inputs are unobservable for the financial instruments and include situations where there is little, if any, market activity for the financial instrument. The inputs into the determination of fair value require significant management judgment or estimation.
In certain cases, the inputs used to measure fair value may fall into different levels of the fair value hierarchy. In such cases, the determination of which category within the fair value hierarchy is appropriate for any given financial instrument is based on the lowest level of input that is significant to the fair value measurement. The Company’s assessment of the significance of a particular input to the fair value measurement in its entirety requires judgment and considers factors specific to the financial instrument.
Level II Valuation Techniques
Financial instruments classified within Level II of the fair value hierarchy are comprised of certain equity securities.
The valuation techniques used to value financial instruments classified within Level II of the fair value hierarchy are as follows:
•Equity Securities are valued on the basis of prices from an orderly transaction between market participants provided by reputable dealers or pricing services. In determining the value of a particular investment, the Company may use certain information with respect to quotations from dealers, pricing matrices and market transactions in comparable investments and various relationships between investments. The valuation of certain equity securities is based on an observable price for an identical security adjusted for the effect of a restriction that is embodied in the security.
Level III Valuation Techniques
In the absence of observable market prices, the Company values its investments using valuation methodologies applied on a consistent basis. For some investments where little market activity may exist; management’s determination of fair value is then based on the best information available in the circumstances and may incorporate management’s own assumptions and involves a significant degree of judgment, taking into consideration a combination of internal and external factors, including the appropriate risk adjustments for non-performance and liquidity risks.
Real estate investments — The Company uses both the discounted cash flow method or the direct capitalization method to value the real estate investments held in consolidated funds. Valuations may be derived by referencing observable valuation measures for comparable assets and recent market transactions, adjusted for asset specific factors. Where a discounted cash flow method is used, a terminal value is derived by referencing to a stabilized exit EBITDA and a capitalization rate.
Credit investments — The Company uses the discounted cash flow method to value credit investments that are not publicly traded or whose market prices are not readily available. The discounted cash flow method projects the expected cash flows of the debt instrument based on contractual terms and discounts such cash flows back to the valuation date using a market-based yield. The market-based yield is estimated using yields of similar publicly traded debt instruments, subject to a liquidity discount.
Investments
Investments include (i) investments held by funds which the Company controls and consolidates and (ii) the Company’s ownership interests (typically general partner interests) in nonconsolidated funds which are accounted for as equity method investments.
(i) Investments at fair value under Consolidated Funds
Investments held in consolidated funds are measured at fair value as disclosed in Note 3. Upon the sale of an investment, the realized net gain or loss is computed using the weighted average cost on a first in, first out basis. Securities transactions are recorded on the trade date.
(ii) Company’s ownership interests in funds accounted for as equity method investments
Investments in which the Company is deemed to exert significant influence, but not control, are accounted for using the equity method of accounting. The Company has significant influence over certain Brookfield funds in which it invests but does not consolidate. Therefore, its investments in such Brookfield funds, which include both a proportionate and disproportionate allocation of the profits and losses, are accounted for under the equity method.
In cases where the Company’s equity method investments provide for a disproportionate allocation of the profits and losses, the Company’s share of earnings (losses) from equity method investments is determined using a balance sheet approach referred to as the hypothetical liquidation at book value (“HLBV”) method. Under the HLBV method, at the end of each reporting period the Company calculates the accrued carried interest that would be due to the Company pursuant to fund agreements as if the fair value of the underlying investments were realized as of such date, irrespective of whether such amounts have been realized. As the fair value of the underlying investments varies between reporting periods, it is necessary to make adjustments to the amounts recorded as carried interest to reflect either a positive performance resulting in an increase in the carried interest allocated to the general partner or a negative performance that would cause the amount due to the Company to be less than the amount previously recognized, resulting in a negative adjustment to carried interest allocated to the general partner. In each case, such accrued carried interest will be recognized in the Consolidated and Combined Statements of Operations.
Refer to Note 3 for details in relation to equity method investments.
Cash and Cash Equivalents
Cash and cash equivalents represents cash on hand, cash held in banks, money market funds and liquid investments with original maturities of three months or less. Interest income from cash and cash equivalents is recorded in Interest and dividend revenue in the Consolidated and Combined Statements of Operations.
Intangibles and Goodwill
Identifiable finite-lived intangible assets are amortized on a straight-line basis over their estimated useful lives, ranging from three to twenty years, reflecting the contractual lives of such assets. Amortization expense is included within General and administrative in the Consolidated and Combined Statements of Operations. Intangible assets are reviewed for impairment when events or changes in circumstances indicate that the carrying amount may not be recoverable.
Goodwill is reviewed for impairment at least annually utilizing a qualitative or quantitative approach, and more frequently if circumstances indicate impairment may have occurred. The impairment testing for goodwill under the qualitative approach is based first on a qualitative assessment to determine if it is more likely than not that the fair value of the Company’s operating segments is less than their respective carrying values. The operating segments are considered the reporting units for testing the impairment of goodwill. If it is determined that it is more likely than not that an operating segment’s fair value is less than its carrying value or when the quantitative approach is used, an impairment loss is recognized to the extent by which the carrying value exceeds the fair value, not to exceed the total amount of goodwill allocated to that reporting unit.
Property, Plant and Equipment
Property, plant and equipment consist primarily of leasehold improvements, furniture, fixtures and equipment, computer hardware and software and are recorded at cost less accumulated depreciation and amortization. Depreciation and amortization are calculated using the straight-line method over the assets’ estimated useful economic lives, which for leasehold improvements are the lesser of the lease term or the life of the asset, generally ten to fifteen years, and three to seven years for other fixed assets. The Company evaluates long-lived assets for impairment whenever events or changes in circumstances indicate that the carrying amount may not be recoverable.
Accounts Receivable
Accounts receivable includes management fees receivable from limited partners, receivables from underlying funds in the fund of hedge funds business, placement and advisory fees receivables, receivables relating to unsettled sale transactions and loans extended to unaffiliated third parties. Accounts receivable are assessed for credit loss at each reporting date. Amounts determined to be uncollectible are charged directly to General and administrative expenses in the Consolidated and Combined Statements of Operations.
Foreign Currency
The U.S. Dollar is the functional and presentation currency of the Company. The Company consolidates a number of entities that have a non-U.S. Dollar functional currency. Each of the Company’s subsidiaries and associates determines its own functional currency and items of each subsidiary and associate included in the Consolidated and Combined financial statements are measured using that functional currency. Assets and liabilities of foreign operations having a functional currency other than the U.S. Dollar are translated at the rate of exchange prevailing at the reporting date and revenues and expenses at average rates during the period. Gains or losses on translation are accumulated as a component of equity. On the disposal of a foreign operation, or the loss of control, joint control or significant influence, the component of Accumulated other comprehensive income relating to that foreign operation is reclassified to Net income in the Consolidated and Combined Statement of Operations. Gains or losses on foreign currency denominated balances and transactions that are designated as hedges of net investments in these operations are reported in the same manner.
Foreign currency-denominated monetary assets and liabilities of the Company are translated using the rate of exchange prevailing at the reporting date, and non-monetary assets and liabilities measured at fair value are translated at the rate of exchange prevailing at the date when the fair value was determined. Revenues and expenses are measured at average rates during the period. Gains or losses on translation of these items are included in earnings. Foreign currency denominated non-monetary assets and liabilities, measured at historic cost, are translated at the rate of exchange at the transaction date.
Compensation, benefits and fund operating expenses — Compensation and carried interest compensation
Compensation — Compensation consists of (a) salary and bonus, and benefits paid and payable to employees, and (b) share-based compensation associated with the grants of share-based awards to employees. Compensation cost relating to the issuance of share-based awards to senior management and employees is accounted for in accordance with ASC 718, Compensation — Stock Compensation. These awards are measured at fair value at the grant date and expensed over the vesting period, except in the case of share-based awards that do not require future service, which are expensed immediately. Cash settled share-based awards and awards settled in a variable number of shares for a fixed monetary amount are classified as liabilities and are remeasured at the end of each reporting period. The Company accounts for forfeitures as they occur.
Prior to the completion of the Arrangement, share-based compensation expense was allocated to the Company based on the awards and terms previously granted to its employees under the Corporation's share-based compensation plans. The value of these long term incentive plans changed as a result of the spin-off of the asset management business. In order to make award participants whole following the Arrangement, the Corporation and the Manager modified the strike price of the historical awards and issued additional Manager awards such that participants would receive the same economic outcome immediately before and after the spin-off. As part of the execution of the Arrangement, certain employees are now employed by the Company and any unvested amounts cease to be recognized by the non-employing entity. The Company assessed the fair value of the modified instruments immediately before and after the spin-off date to determine if there was any change in value and will account for the impact of the modification and recognizes any relevant incremental fair value generated at the time of the spin-off prospectively.
In addition, the Manager may issue options and other long-term incentive awards to employees of the Company, and the Company may reimburse the Manager for the costs associated with these awards. Compensation costs associated with these instruments are recorded on a gross basis in the Consolidated and Combined Statements of Operations as the instruments vest.
Refer to Note 8 for further details of the Company's share-based compensation.
Carried Interest Compensation — Unrealized and realized carried interest is performance-based compensation associated with realized or unrealized carried interest based on performance of investments on a fund-by-fund basis. Such compensation expense is subject to both positive and negative adjustments.
Other (expenses) income, net
Other (expenses) income, net in the Consolidated and Combined Statement of Operations includes net unrealized gains (losses) resulting from changes in the fair value of the company’s investments in common shares in addition to investments in its sponsored funds.
Income taxes
The Company is an unlimited liability company organized under the provincial laws of British Columbia and is subject to Canadian federal and provincial income taxes.
Prior to the Arrangement, the Company's domestic and foreign operating results were included in the income tax returns of the Corporation. The Company accounted for income taxes under the separate return method. Under the approach, the Company determined its deferred tax assets and liabilities and related tax expenses as if it were filing separate tax returns.
The provision for income taxes is determined using the asset and liability approach of accounting for income taxes. Under this approach, deferred taxes represent the future tax consequences expected to occur when the reported amounts of assets and liabilities are recovered or paid. Income taxes as presented attribute deferred income taxes of the Company's standalone Consolidated and Combined Financial Statements in a manner that is systematic, rational, and consistent with the asset and liability method.
The provision for income taxes represents income taxes paid or payable for the current year plus the change in deferred taxes during the year. Deferred taxes result from differences between the financial and tax basis of the Company's assets and liabilities and are adjusted for changes in tax rates and tax laws when such changes are enacted. Valuation allowances are recorded to reduce deferred tax assets when it is more likely than not that a tax benefit will not be realized.
The Company analyzes its tax filing positions in all jurisdictions where it is required to file income tax returns, as well as for all open tax years in these jurisdictions. Tax benefits associated with actual or expected income tax positions are recognized when the “more likely than not” recognition threshold is met. The tax benefits are measured at the largest amount of benefit that is greater than 50% likely to be realized upon settlement with the related tax authority.
The Company recognizes accrued interest and penalties related to uncertain tax positions within the provision for income taxes in the Consolidated and Combined Statements of Operations.
Related parties
In the normal course of operations, the Company enters into various transactions on market terms with related parties, including amounts in Due from/to affiliates. The Company and its subsidiaries may also transact with entities that share a common parent. Amounts owed to and by associates and joint ventures are not eliminated on consolidation.
The Company has certain loans and receivables within Due from Affiliates (Note 10) which are long-term in nature. These receivables are initially recognized at fair value and subsequently measured at their amortized cost bases with interest recognized using the interest method.
In addition to the Relationship Agreement and AMSA, the Corporation, the Manager and the Company have entered into the TSA pursuant to which (i) the Company agrees to provide the Corporation and the Manager, on a transitional basis, certain services to support day-to-day corporate activities (including services related to finance, treasury, accounting, legal and regulatory, marketing, communications, human resources, internal audit, information technology) and (ii) the Corporation provides, on a transitional basis, certain services to the Manager and the Company to facilitate the orderly transition of the asset management business (the services, collectively, being "Transitional Services"). The Transitional Services are provided, at cost, for a period of three years from December 9, 2022, unless extended by mutual agreement. The Company also provides to the Corporation, as required from time to time and on a cost recovery basis, services of its investment personnel to assist in acquisitions or other transactions undertaken by the Corporation.
In the normal course of business, the Manager issues its share-based compensation awards to the Company’s employees. The Company accounts for such transactions in accordance with ASC 323 Equity Method Investments and Joint Ventures, and recognizes the entire cost of the awards, as they vest, as compensation expense and a corresponding increase in additional paid-in capital. As the Company reimburses the Manager for the cost of these awards, the reimbursement is recognized as a decrease in additional paid-in capital. As such, this arrangement with the Manager has a net impact on the Company’s Consolidated and Combined Financial Statements as if the Company had paid for the employee compensation in cash. To the extent that the Company reimburses the Manager before the associated awards vest, the Company recognizes the prepayment in Due from Affiliates.
See Note 15 for further detail on the related party transactions.
Dividends
Dividends are reflected in the Consolidated and Combined Financial Statements when declared.
Derivatives
Derivative financial instruments under ASC 815, Derivative and Hedging are recognized on the Consolidated and Combined Balance Sheet at fair value with changes in fair value recognized in earnings.
Purchased or written options on equity interests of several of our equity method investments that do not meet the definition of a derivative are recognized on the Consolidated and Combined Balance Sheet on a gross basis as Other Assets or Other Liabilities within Accounts Receivable and Other or Accounts Payable and Other, respectively. These financial instruments are measured at fair value with changes in fair value recognized in Other Income (Expense), net.
Recent accounting pronouncements
The Brookfield Asset Management ULC considers the applicability and impact of all Accounting Standard Updates ("ASUs") issued by the Financial Accounting Standards Board ("FASB"). ASUs not listed below were assessed and either determined to be not applicable or expected to have minimal impact on the company's consolidated financial statements.
In November 2023, the FASB issued ASU 2023-07, which requires the disclosure of significant segment expenses that are part of an entity’s segment measure of profit or loss and regularly provided to the chief operating decision maker. In addition, it adds or makes clarifications to other segment-related disclosures, such as clarifying that the disclosure requirements in ASC 280 are required for entities with a single reportable segment and that an entity may disclose multiple measures of segment profit and loss. The amendments in this update apply to all public entities that are required to report segment information in accordance with Topic 280, Segment Reporting. ASU 2023-07 is effective for fiscal years beginning after December 15, 2023 and interim periods beginning after December 15, 2024. The Company is currently assessing the impact of this update.
In December 2023, the FASB issued ASU 2023-09, which amends the Codification to enhance the transparency and decision usefulness of income tax disclosures. This ASU requires additional disaggregation of the reconciliation between the statutory and effective tax rate for an entity and of income taxes paid, both of which are disclosures required by current GAAP. The amendments improve the transparency of income tax disclosures by requiring (1) consistent categories and greater disaggregation of information in the rate reconciliation and (2) income taxes paid disaggregated by jurisdiction. The amendments in the update are effective for annual periods beginning after December 15, 2024. For entities other than public business entities, the amendments are effective for annual periods beginning after December 15, 2025. Management is currently evaluating the impact of this update.
In addition to the ASUs identified above management has considered the proposal by the Organization for Economic Co-operating and Development ("OECD") which has proposed a global minimum tax of 15% of reported profits ("Pillar 2") that has been agreed upon in principle by over 140 countries. The Company operates in countries which have enacted new legislation to implement the global minimum top-up tax. The newly enacted legislation is effective from January 1, 2024 and there is no current tax impact for the year ended December 31, 2023. The global minimum top-up tax is not anticipated to have a significant impact on the financial position of the Company.
Correction of Immaterial Errors in Previously Issued Consolidated and Combined Financial Statements
In the current period, Brookfield Asset Management ULC identified an immaterial error which has been corrected in the current period. The error relates to the recognition of carried interest earned from certain mature funds. The impact of this error on the Consolidated and Combined Balance Sheet results in an increase in carried interest receivable of $133 million in fiscal 2022. As this accrued carried interest relates to funds attributable to our redeemable preferred shares, there is an increase in preferred shares redeemable non-controlling interest of $104 million in fiscal 2022 with the difference recognized in deferred tax liabilities and accounts payable and other liabilities.
The impact of the above error to the Consolidated and Combined Statements of Operations results in an increase in carried interest revenue of $1 million and an increase in other revenue of $16 million in fiscal 2022, with an increase in compensation expense by $8 million, income tax expense by $2 million as well as net income attributable to preferred share redeemable non-controlling interest by $7 million for fiscal 2022. The impact to net income is $7 million in fiscal 2022, and has no impact to net income attributable to common stockholders and no impact on BAM ULC's Consolidated and Combined Statements of Comprehensive Income, and Consolidated and Combined Statements of Cash flows.
The comparative figures have not been corrected to reflect the correction of this immaterial error.
3. INVESTMENTS
|
|
|
|
|
|
|
|
|
|
|
|
|
|
AS AT DECEMBER 31,
(MILLIONS)
|
2023 |
|
2022 |
|
| Common shares (a) |
$ |
77 |
|
|
$ |
75 |
|
|
| Investments in affiliates (b) |
1,197 |
|
|
1,309 |
|
|
| Accrued carried interest - mature funds (c) |
1,394 |
|
|
1,147 |
|
|
| Accrued carried interest - new funds (c) |
305 |
|
|
124 |
|
|
| Equity method investments (d) |
|
|
|
|
| Equity interest in Oaktree |
4,191 |
|
|
3,940 |
|
|
| Equity interest in other affiliates |
358 |
|
|
282 |
|
|
|
$ |
7,522 |
|
|
$ |
6,877 |
|
|
Where appropriate, the accounting for the Company’s investments incorporates the changes in fair value of those investments.
(a) As at December 31, 2023, common share investments were $77 million. Common shares primarily represents investments of $64 million in Brookfield Renewable Energy L.P. (2022 - $64 million). Common share investments are carried at fair value with changes in fair value recorded on the Consolidated and Combined Statements of Operations in Other (expenses) income, net.
(b) As at December 31, 2023, Investments in affiliates are primarily comprised of an interest in BSREP III of $1.1 billion (2022 – $1.2 billion) which is accounted for as an equity investment measured at its net asset value ("NAV") in accordance with ASC 321, Investments - Equity Securities.
(c) Accrued carried interest represents the disproportionate allocation of capital from our private funds to the extent that such interest is provided for in the relevant fund agreements. Accrued carried interest is accounted for using the equity method of accounting based on the Company’s entitlement to the funds’ net assets as if all investments were liquidated at fair value and all liabilities were satisfied, net of the cumulative amounts that have already been realized. As stipulated in the Relationship Agreement, accrued carried interest in mature funds, as defined therein is attributed to the Corporation at 100% and accrued carried interest in new funds, including current funds and open-ended funds, as defined therein, is attributed to the Corporation at 33.3%. Such attribution is achieved via Tracking Shares and non-controlling interests in some of our subsidiaries that are entitled to such carried interest.
The change in the Company’s accrued carried interest for mature funds during the years ended December 31, 2023 and 2022 is as follows:
|
|
|
|
|
|
|
|
|
|
|
|
|
|
|
|
|
|
|
|
|
|
FOR THE YEARS ENDED DECEMBER 31,
(MILLIONS)
|
|
|
|
2023 |
|
2022 |
|
| Balance, beginning of period |
|
|
|
$ |
1,147 |
|
|
$ |
676 |
|
|
| Changes in fund fair values |
|
|
|
298 |
|
|
600 |
|
|
| Realized carried interest |
|
|
|
(51) |
|
|
(129) |
|
|
| Balance, end of period |
|
|
|
$ |
1,394 |
|
|
$ |
1,147 |
|
|
The change in the Company’s accrued carried interest for new funds during the years ended December 31, 2023 and 2022 is as follows:
|
|
|
|
|
|
|
|
|
|
|
|
|
|
|
|
|
|
|
|
FOR THE YEARS ENDED DECEMBER 31,
(MILLIONS) |
|
|
2023 |
|
2022 |
|
| Balance, beginning of period |
|
|
$ |
124 |
|
|
$ |
— |
|
|
| Changes in fund fair values |
|
|
181 |
|
|
124 |
|
|
|
|
|
|
|
|
|
| Balance, end of period |
|
|
$ |
305 |
|
|
$ |
124 |
|
|
(d) The Company’s equity method investments include a 68% (2022 - 64%) economic interest in Oaktree which was initially acquired on September 30, 2019, a 49.9% (2022 – 49.9%) economic interest in LCM Partner Group transferred into the Company as part of the Arrangement, a 35% economic interest in Primary Wave acquired on October 3, 2022, a 24.9% economic interest in Concord acquired on December 8, 2023, and a number of general partner investments in our private funds. The Company has
significant influence, but not control, over the operating and financial policies of these equity method investees by virtue of having the ability to appoint members of these investee’s governing bodies.
The Company's increased investment in Oaktree during the year resulted in the recognition of an incremental $141 million of intangible assets related to customer relationships, which will be amortized over a period of 10 to 15 years. The Company does not control Oaktree due to its less than 50% of board representation and other contractual agreements that prevent the Company from having a controlling financial interest.
The Company recognized in Share of Income from Equity Accounted Investments in its Consolidated and Combined Statement of Operations its share of earnings or losses from all of its equity method investments of $167 million and $146 million for the years ended December 31, 2023 and December 31, 2022 respectively.
The summarized financial information of all of the Company’s equity method investments for the years ended December 31, 2023 and 2022, is as follows:
|
|
|
|
|
|
|
|
|
|
|
|
|
|
|
|
|
|
|
|
|
|
|
|
AS AT DECEMBER 31
(MILLIONS) |
|
|
|
|
2023 |
|
2022 |
|
|
| Investments |
|
|
|
|
$ |
64,978 |
|
|
$ |
40,019 |
|
|
|
| Assets |
|
|
|
|
69,392 |
|
|
44,908 |
|
|
|
| Liabilities |
|
|
|
|
22,324 |
|
|
21,256 |
|
|
|
| Capital |
|
|
|
|
46,606 |
|
|
23,168 |
|
|
|
| Non-controlling interest |
|
|
|
|
462 |
|
|
483 |
|
|
|
|
|
|
|
|
|
|
|
|
|
|
|
|
|
|
|
|
|
|
FOR THE YEARS ENDED DECEMBER 31,
(MILLIONS)
|
|
|
|
|
2023 |
|
2022 |
|
|
| Revenues |
|
|
|
|
$ |
2,426 |
|
|
$ |
3,462 |
|
|
|
| Expense |
|
|
|
|
(2,806) |
|
|
(3,559) |
|
|
|
| Net loss |
|
|
|
|
(380) |
|
|
(97) |
|
|
|
| Net income attributable to non-controlling interest |
|
|
|
|
12 |
|
|
186 |
|
|
|
4. VARIABLE INTEREST ENTITIES
The Company consolidates certain VIEs for which it is the primary beneficiary either directly or indirectly, through another consolidated entity. VIEs include certain credit focused entities within the Oaktree platform, whereby the purpose of such VIEs is to provide a vehicle that allocates our share of its performance-based fees between the Company and the Corporation. The fundamental risks of these consolidated VIEs, mainly include loss of invested capital and performance-based fees. The Company does not provide performance guarantees and has no other financial obligation to provide funding to consolidated VIEs. The assets of consolidated VIEs may only be used to settle obligations of these entities. In addition, there is no recourse to the Company for the consolidated VIEs’ liabilities. For the years ended December 31, 2023 and 2022, the Company did not provide financial or other support to consolidated VIEs.
|
|
|
|
|
|
|
AS AT DECEMBER 31,
(MILLIONS)
|
2023 |
| Cash and Cash Equivalents |
$ |
— |
|
| Investments |
891 |
|
| Other Assets |
— |
|
| Total Assets |
891 |
|
|
|
| Other Liabilities |
$ |
— |
|
| Total Liabilities |
— |
|
|
|
| Equity |
$ |
891 |
|
|
|
|
|
|
|
|
|
The Company holds variable interests in certain VIEs which are not consolidated as it has been determined that the Company is not the primary beneficiary. VIEs that are not consolidated predominately include investment funds sponsored by or managed by the Company. The Company's investment strategies differ by investment fund; however, the fundamental risks have similar characteristics, including loss of invested capital and loss of management and performance income. The Company's maximum exposure to loss as a result of its investments in the unconsolidated investment funds is the carrying value of such investments, including the Company's capital interest and any unrealized carried interest.
For the years ended December 31, 2023 and 2022 the Company did not provide any financial and other support to unconsolidated VIEs other than its obligated commitments.
The assets and liabilities recognized in the Company's Consolidated and Combined Balance Sheets related to its maximum exposure to loss of those VIEs of which the Company is determined not to be the primary beneficiary, the non-consolidated VIEs, are as follows:
|
|
|
|
|
|
|
|
|
|
|
AS AT DECEMBER 31,
(MILLIONS)
|
2023 |
|
|
| Investments |
$ |
893 |
|
|
|
|
|
| Due from affiliates |
5 |
|
|
|
|
|
| VIE related assets |
898 |
|
|
|
|
|
| Maximum exposure to loss |
$ |
898 |
|
|
|
|
|
|
|
|
|
|
|
|
|
|
|
|
|
|
|
|
|
|
|
|
|
|
|
|
|
5. FAIR VALUE MEASUREMENTS OF FINANCIAL INSTRUMENTS
Fair value approximates carrying value for the following financial instruments that are not measured at fair value in the Consolidated and Combined Financial Statements: Accounts receivable and other (except as otherwise indicated below), Accounts payable and other (except as otherwise indicated below), Due to affiliates and Due from affiliates, and Accrued carried interest.
The following tables summarize the fair value hierarchy of financial assets and liabilities of the Company that are measured at fair value as at December 31, 2023 and December 31, 2022:
|
|
|
|
|
|
|
|
|
|
|
|
|
|
|
|
|
|
|
|
|
|
|
|
|
AS AT DECEMBER 31, 2023
(MILLIONS)
|
Level I |
|
Level II |
|
Level III |
|
Total |
| Assets |
|
|
|
|
|
|
|
| Cash and cash equivalents |
$ |
2,667 |
|
|
$ |
— |
|
|
$ |
— |
|
|
$ |
2,667 |
|
| Accounts receivable and other |
— |
|
|
— |
|
|
37 |
|
|
37 |
|
| Common shares |
— |
|
|
— |
|
|
77 |
|
|
77 |
|
| Total assets |
$ |
2,667 |
|
|
$ |
— |
|
|
$ |
114 |
|
|
$ |
2,781 |
|
| Liabilities |
|
|
|
|
|
|
— |
|
| Accounts payable and other |
$ |
— |
|
|
$ |
— |
|
|
$ |
122 |
|
|
$ |
122 |
|
| Total liabilities |
$ |
— |
|
|
$ |
— |
|
|
$ |
122 |
|
|
$ |
122 |
|
|
|
|
|
|
|
|
|
|
|
|
|
|
|
|
|
|
|
|
|
|
|
|
|
|
|
|
|
|
|
|
|
|
|
|
|
|
|
|
|
|
|
|
|
|
|
|
|
|
|
|
|
|
|
|
|
|
AS AT DECEMBER 31, 2022
(MILLIONS)
|
Level I |
|
Level II |
|
Level III |
|
Total |
| Assets |
|
|
|
|
|
|
|
| Cash and cash equivalents |
$ |
3,545 |
|
|
$ |
— |
|
|
$ |
— |
|
|
$ |
3,545 |
|
| Accounts receivable and other |
— |
|
|
— |
|
|
52 |
|
|
52 |
|
| Common shares |
— |
|
|
— |
|
|
75 |
|
|
75 |
|
| Total assets |
$ |
3,545 |
|
|
$ |
— |
|
|
$ |
127 |
|
|
$ |
3,672 |
|
| Liabilities |
|
|
|
|
|
|
— |
|
| Accounts payable and other |
$ |
— |
|
|
$ |
— |
|
|
$ |
190 |
|
|
$ |
190 |
|
| Total liabilities |
$ |
— |
|
|
$ |
— |
|
|
$ |
190 |
|
|
$ |
190 |
|
The fair value measurement of items categorized in Level III of the fair value hierarchy is subject to valuation uncertainty arising from the use of significant unobservable inputs. The significant unobservable inputs used in the fair value measurement of financial assets and liabilities recurringly measured at fair value are discount rates and capitalization rates. Significant increases (decreases) in these inputs in isolation would have resulted in a significantly lower (higher) fair value measurement. The following tables summarize the quantitative inputs and assumptions used for items categorized in Level III of the fair value hierarchy as of December 31, 2023 and December 31, 2022:
|
|
|
|
|
|
|
|
|
|
|
|
|
|
|
|
|
|
|
|
|
|
|
|
AS AT DECEMBER 31, 2023
(MILLIONS)
|
|
Fair Value |
|
Valuation techniques |
|
|
|
|
|
|
|
|
| Common shares |
|
$ |
77 |
|
|
See note (a) and (b) |
|
|
|
|
|
|
|
|
| Accounts receivable and other |
|
37 |
|
|
See note (a) and (d) |
|
|
|
|
|
|
|
|
| Accounts payable and other |
|
122 |
|
|
See note (a) and (c) |
|
|
|
|
|
|
|
|
|
|
|
|
|
|
|
|
|
|
|
|
|
|
|
|
|
|
|
|
|
|
|
|
|
|
|
|
|
|
|
|
|
|
|
|
|
|
|
|
|
|
|
|
|
|
|
|
|
|
|
|
|
|
|
|
|
|
|
|
|
|
|
|
|
|
|
|
|
|
|
|
|
|
|
|
|
|
|
|
|
|
|
|
|
|
|
AS AT DECEMBER 31, 2022
(MILLIONS)
|
|
Fair Value |
|
Valuation techniques |
|
|
|
|
|
|
|
|
| Common shares |
|
$ |
75 |
|
|
See note (a) and (b) |
|
|
|
|
|
|
|
|
| Accounts receivable and other |
|
52 |
|
|
See note (a) and (d) |
|
|
|
|
|
|
|
|
| Accounts payable and other |
|
190 |
|
|
See note (a) and (c) |
|
|
|
|
|
|
|
|
(a) Unobservable inputs were weighted based on the fair value of the investments included in the range.
(b) Common shares as at December 31, 2023 primarily represents investments related to the Company’s $64 million (2022- $64 million) investment in Brookfield Renewable Energy L.P. which are being recorded at fair value on the Consolidated and Combined Balance Sheets.
(c) Accounts payable and other recorded at fair value and categorized in Level III relate to a put option held by other investors of Oaktree and Primary Wave under which the Company may be required to purchase additional shares of these investees using a prescribed valuation methodology in exchange for cash, Class A shares of the Corporation or other forms of consideration at the discretion of the Company. The fair value of these instruments is determined quarterly using a Monte Carlo simulation and various inputs prepared by management.
(d) Accounts receivable and other recorded at fair value and categorized in Level III relate to a call option held by the Company to acquire additional shares of Primary Wave from other investors of the investee using a prescribed valuation methodology in exchange for cash, Class A shares of the Corporation or other forms of consideration at the discretion of the Company. The fair value of this instrument is determined quarterly using a Monte Carlo simulation and various inputs prepared by management.
During the year ended December 31, 2023, there have been no changes in valuation techniques within Level III that have had a material impact on the valuation of financial instruments.
The following tables summarize the changes in financial assets and liabilities measured at fair value for which the Company has used Level III inputs to determine fair value. These tables also exclude financial assets and liabilities measured at fair value on a non-recurring basis. Total realized and unrealized gains and losses recorded for Level III investments are reported in Other (expenses) income, net in the Consolidated and Combined Statements of Operations.
|
|
|
|
|
|
|
|
|
|
|
|
|
|
|
|
|
|
|
|
|
|
|
|
|
|
|
AS AT AND FOR THE YEAR ENDED DECEMBER 31, 2023
(MILLIONS)
|
Common shares |
|
Accounts receivable and other |
|
|
|
|
|
|
|
|
|
Accounts payable and other |
| Balance as at December 31, 2022 |
$ |
75 |
|
|
$ |
52 |
|
|
|
|
|
|
|
|
|
|
$ |
190 |
|
| Net purchases |
2 |
|
|
— |
|
|
|
|
|
|
|
|
|
|
— |
|
| Gains (losses) included in earnings |
— |
|
|
(15) |
|
|
|
|
|
|
|
|
|
|
(68) |
|
| Balance as at December 31, 2023 |
$ |
77 |
|
|
$ |
37 |
|
|
|
|
|
|
|
|
|
|
$ |
122 |
|
|
|
|
|
|
|
|
|
|
|
|
|
|
|
|
|
|
|
|
|
|
|
|
|
|
|
|
|
|
|
|
|
|
|
|
|
|
|
|
|
|
|
|
AS AT AND FOR THE YEAR ENDED DECEMBER 31, 2022
(MILLIONS)
|
Common
shares |
|
Investment
in affiliates |
|
Accounts receivable and other |
|
Preferred
shares |
|
Loans to
related
parties |
|
Borrowings
from
parties |
|
Accounts
payable
and other |
| Balance as at December 31, 2021 |
$ |
562 |
|
|
$ |
6,204 |
|
|
$ |
— |
|
|
$ |
1,557 |
|
|
$ |
545 |
|
|
$ |
4,102 |
|
|
$ |
69 |
|
| Net (redemptions) purchases |
(487) |
|
|
(7,122) |
|
|
52 |
|
|
(1,557) |
|
|
(540) |
|
|
(4,102) |
|
|
121 |
|
| Activity included within earnings |
— |
|
|
918 |
|
|
— |
|
|
— |
|
|
(5) |
|
|
— |
|
|
— |
|
| Balance as at December 31, 2022 |
$ |
75 |
|
|
$ |
— |
|
|
$ |
52 |
|
|
$ |
— |
|
|
$ |
— |
|
|
$ |
— |
|
|
$ |
190 |
|
6. REVENUE
The Company focuses on a number of investment strategies, specifically renewable power and transition, infrastructure, real estate, private equity, and credit and other, operating in various markets including the United States, Canada, and the rest of the world.
The following table sets out revenue disaggregated by investment strategy.
|
|
|
|
|
|
|
|
|
|
|
|
|
|
|
|
|
|
|
|
|
|
|
|
|
|
|
|
|
|
|
|
|
|
|
|
|
|
|
FOR THE YEAR ENDED DECEMBER 31, 2023 |
|
Renewable power and transition |
|
Infrastructure |
|
Real estate |
|
Private equity |
|
Credit and other |
|
Total |
| Management and advisory fees, net |
|
$ |
454 |
|
|
$ |
821 |
|
|
$ |
781 |
|
|
$ |
279 |
|
|
$ |
431 |
|
|
$ |
2,766 |
|
| Incentive distributions |
|
111 |
|
|
265 |
|
|
— |
|
|
— |
|
|
— |
|
|
376 |
|
|
|
$ |
565 |
|
|
$ |
1,086 |
|
|
$ |
781 |
|
|
$ |
279 |
|
|
$ |
431 |
|
|
$ |
3,142 |
|
|
|
|
|
|
|
|
|
|
|
|
|
|
|
|
|
|
|
|
|
|
|
|
|
|
|
|
|
|
|
|
|
|
|
|
|
|
|
|
FOR THE YEAR ENDED DECEMBER 31, 2022 |
|
Renewable power and transition |
|
Infrastructure |
|
Real estate |
|
Private equity |
|
Credit and other |
|
Total |
| Management and advisory fees, net |
|
$ |
455 |
|
|
$ |
737 |
|
|
$ |
800 |
|
|
$ |
218 |
|
|
$ |
290 |
|
|
$ |
2,500 |
|
| Incentive distributions |
|
95 |
|
|
240 |
|
|
— |
|
|
— |
|
|
— |
|
|
335 |
|
|
|
$ |
550 |
|
|
$ |
977 |
|
|
$ |
800 |
|
|
$ |
218 |
|
|
$ |
290 |
|
|
$ |
2,835 |
|
7. INCOME TAXES
The Company’s Canadian statutory income tax rate has remained consistent at 27% during the year ended December 31, 2023, and 2022.
The following is a summary of the Company's income tax expense.
The income before provision for taxes consists of the following:
|
|
|
|
|
|
|
|
|
|
|
|
|
|
|
FOR THE YEARS ENDED DECEMBER 31,
(MILLIONS)
|
2023 |
|
2022 |
|
|
| Canadian |
$ |
952 |
|
|
$ |
752 |
|
|
|
| Foreign |
1,602 |
|
|
2,740 |
|
|
|
|
$ |
2,554 |
|
|
$ |
3,492 |
|
|
|
The provision for taxes consists of the following:
|
|
|
|
|
|
|
|
|
|
|
|
|
|
FOR THE YEARS ENDED DECEMBER 31,
(MILLIONS) |
2023 |
|
2022 |
|
|
| Current |
|
|
|
|
|
| Canadian |
$ |
84 |
|
|
$ |
174 |
|
|
|
| Foreign |
251 |
|
|
117 |
|
|
|
| Total provision for current tax |
335 |
|
|
291 |
|
|
|
| Deferred |
|
|
|
|
|
| Canadian |
26 |
|
|
29 |
|
|
|
| Foreign |
56 |
|
|
307 |
|
|
|
| Total provision for deferred tax |
82 |
|
|
336 |
|
|
|
|
$ |
417 |
|
|
$ |
627 |
|
|
|
The company's effective income tax rate is different from the company's statutory income tax rate due to the following differences set out below:
|
|
|
|
|
|
|
|
|
|
|
|
|
|
FOR THE YEARS ENDED DECEMBER 31,
(MILLIONS) |
2023 |
|
2022 |
|
|
| Statutory income tax rate |
27 |
% |
|
27 |
% |
|
|
| (Reduction) increase in rate resulting from: |
|
|
|
|
|
| Incentive distributions |
(3) |
% |
|
(3) |
% |
|
|
| International operations subject to different tax rates |
(4) |
% |
|
— |
% |
|
|
| Taxable income attributable to non-controlling interests |
(1) |
% |
|
(7) |
% |
|
|
| Portion of gains subject to different tax rates |
(2) |
% |
|
— |
% |
|
|
| Other |
(1) |
% |
|
1 |
% |
|
|
| Effective income tax rate |
16 |
% |
|
18 |
% |
|
|
A summary of the tax effects of the temporary differences is as follows:
|
|
|
|
|
|
|
|
|
|
|
|
|
AS AT DECEMBER 31,
(MILLIONS)
|
2023 |
|
2022 |
| Assets |
|
|
|
| Losses (Canada) |
$ |
— |
|
|
$ |
24 |
|
| Losses (Foreign) |
726 |
|
|
1,023 |
|
| Investment basis differences/net unrealized gains and losses |
(83) |
|
|
(308) |
|
| Deferred income tax assets |
$ |
643 |
|
|
$ |
739 |
|
|
|
|
|
| Liabilities |
|
|
|
| Investment basis differences/net unrealized gains and losses |
40 |
|
|
17 |
|
| Deferred income tax liabilities |
$ |
40 |
|
|
$ |
17 |
|
As at December 31, 2023, the company has Canadian non-capital loss carryforwards of nil (as at December 31, 2022 – $89 million), and foreign net operating loss carryforwards of approximately $3.5 billion (2022 – $5 billion) that expire after 2026.
As of December 31, 2023, the company has accumulated undistributed earnings generated by certain foreign subsidiaries, which it intends to indefinitely reinvest and have not recorded any deferred taxes with respect to outside tax basis difference on these subsidiaries.
As of December 31, 2023 and December 31, 2022, the Company did not have any material unrecognized tax benefits related to uncertain tax positions.
The Company files its tax returns as prescribed by the tax laws of the jurisdictions in which it operates. In the normal course of business, the Company is subject to examination by Canadian and foreign tax authorities. As of December 31, 2023, the company’s Canadian income tax returns for the years 2019 through 2022 are open under the normal four-year statute of limitations and therefore subject to examination. Certain subsidiaries’ tax returns for 2018 through 2022 are open to examination.
8. SHARE-BASED COMPENSATION
The Manager and the Corporation, related parties of the Company, have granted share-based compensation awards to certain employees and non-employee directors of the Company under a number of compensation plans (the “Equity Plans”). The Equity Plans provide for the granting of share options, restricted shares, escrowed shares and deferred share and restricted share units which contain certain service or performance requirements of the Manager or the Corporation.
The expense recognized for share-based compensation is summarized in the following table:
|
|
|
|
|
|
|
|
|
|
|
|
|
|
|
|
FOR THE YEARS ENDED DECEMBER 31,
(MILLIONS) |
2023 |
|
|
2022 |
|
|
|
| Expenses arising from equity-settled share-based payment transactions |
$ |
86 |
|
|
|
$ |
132 |
|
|
|
|
| Expense (recovery) arising from cash-settled share-based payment transactions |
12 |
|
|
|
(195) |
|
|
|
|
|
$ |
98 |
|
|
|
$ |
(63) |
|
|
|
|
The share-based payment plans are described below.
Management Share Option Plan
Options issued under the Management Share Option Plan (“MSOP”) of both the Corporation and the Manager vest over a period of up to five years, expire ten years after the grant date and are settled through issuance of Class A shares of the Corporation or the Manager. The exercise price is equal to the market price at the grant date. For the year ended December 31, 2023, the total expense incurred with respect to MSOP totaled $24 million (2022 – $26 million).
The change in the number of options during the year ended December 31, 2023 was as follows:
|
|
|
|
|
|
|
|
|
|
|
|
|
|
|
|
|
|
|
|
|
|
|
|
|
Brookfield Asset Management Ltd.1 |
|
Brookfield Corporation2 |
|
Number of Options (000's) |
|
Weighted-Average Exercise Price |
|
Number of Options (000's) |
|
Weighted-Average Exercise Price |
|
|
|
|
|
|
|
|
|
|
|
|
|
|
|
|
|
|
|
|
|
|
|
|
|
|
|
|
|
|
|
|
|
|
|
|
|
|
|
|
Outstanding as at January 1, 2023 |
5,631 |
|
|
$ |
22.87 |
|
|
21,828 |
|
|
$ |
25.61 |
|
| Transferred |
(455) |
|
|
19.18 |
|
|
(1,771) |
|
|
21.60 |
|
| Granted |
5,721 |
|
|
35.13 |
|
|
— |
|
|
— |
|
| Exercised |
(652) |
|
|
16.99 |
|
|
(1,351) |
|
|
17.18 |
|
| Cancelled |
(276) |
|
|
35.27 |
|
|
(239) |
|
|
39.87 |
|
Outstanding as at December 31, 2023 |
9,969 |
|
|
$ |
30.81 |
|
|
18,467 |
|
|
$ |
28.15 |
|
|
1 - Represents the continuity of the Manager options relating to only those employees of the Company based on the Manager's weighted average exercise price which differs from that of the Corporation.
2 - Represents the continuity of the Corporation's options relating to only those employees of the Company based on the Corporation's weighted average exercise price which differs from that of the Manager.
|
The weighted-average grant date fair value of the Manager MSOP granted for the year ended December 31, 2023 was $5.26 (2022- $3.50), and was determined using the Black-Scholes valuation model, with inputs to the model as follows:
|
|
|
|
|
|
|
|
|
|
|
|
|
|
|
|
|
|
|
|
|
FOR THE YEAR ENDED DECEMBER 31
(MILLIONS)
|
Unit |
|
|
|
2023 |
|
2022 |
| Weighted-average share price |
US$ |
|
|
|
$ |
35.13 |
|
|
$ |
22.90 |
|
| Average term to exercise |
Years |
|
|
|
7.5 |
|
|
7.4 |
|
Share price volatility1 |
% |
|
|
|
28.5 |
|
|
22.2 |
|
| Liquidity discount |
% |
|
|
|
25.0 |
|
|
25.0 |
|
| Weighted-average annual dividend yield |
% |
|
|
|
4.6 |
|
|
1.8 |
|
| Risk-free rate |
% |
|
|
|
3.9 |
|
|
2.1 |
|
1 - Share price volatility was determined based on implied volatilities consistent with Brookfield Corporation's historical share prices over a similar period to the average term to exercise. |
The weighted-average grant date fair value of the Corporation MSOP granted for the year ended December 31, 2022 was $8.82, and was determined using the Black-Scholes valuation model, with inputs to the model as follows:
|
|
|
|
|
|
|
|
|
|
|
|
|
|
|
FOR THE YEAR ENDED DECEMBER 31
(MILLIONS)
|
Unit |
|
|
|
2022 |
| Weighted-average share price |
US$ |
|
|
|
$ |
46.62 |
|
| Average term to exercise |
Years |
|
|
|
7.5 |
Share price volatility1 |
% |
|
|
|
24.8 |
|
| Liquidity discount |
% |
|
|
|
25.0 |
|
| Weighted-average annual dividend yield |
% |
|
|
|
1.4 |
|
| Risk-free rate |
% |
|
|
|
1.9 |
|
1 - Share price volatility was determined based on implied volatilities consistent with Brookfield Corporation's historical share price over a similar period to the average term to exercise. |
Escrowed Stock Plan
Under the Escrowed Stock ("ES") Plans, executives are granted common shares (the “ES Shares”) in one or more private escrowed companies that own Class A shares of the Manager and the Corporation. The ES Shares generally vest over five years
and must be held to the fifth anniversary of the grant date. At a date no more than ten years from the grant date, all outstanding ES Shares will be exchanged for Class A shares issued by the Corporation or the Manager based on the increase in market value between the date of grant and date of exercise of the respective Class A shares at the time of the exchange. An equal number of Class A shares held in the private escrow companies will be cancelled such that the issuance of shares to employees is non-dilutive. In general, the shares issued on exchange will be less than the Class A shares purchased under the ES Plan resulting in a net reduction in the number of Class A shares issued. For the year ended December 31, 2023, the total expense incurred with respect to the ES Plan totaled $14 million (2022 – $51 million).
The changes in the number of ES shares during 2023 were as follows:
|
|
|
|
|
|
|
|
|
|
|
|
|
|
|
|
|
|
|
|
|
|
|
|
|
Brookfield Asset Management Ltd.1 |
|
Brookfield Corporation2 |
|
Number of Options (000's) |
|
Weighted-Average Exercise Price |
|
Number of Options (000's) |
|
Weighted-Average Exercise Price |
Outstanding as at January 1, 2023 |
2,361 |
|
|
$ |
29.64 |
|
|
10,141 |
|
|
$ |
35.23 |
|
| Transferred |
(575) |
|
|
29.64 |
|
|
(2,299) |
|
|
34.71 |
|
| Granted |
1,535 |
|
|
35.13 |
|
|
— |
|
|
— |
|
|
|
|
|
|
|
|
|
| Cancelled |
— |
|
|
— |
|
|
(15) |
|
— |
|
43.51 |
|
Outstanding as at December 31, 2023 |
3,321 |
|
|
$ |
32.18 |
|
|
7,827 |
|
$ |
32.18 |
|
$ |
35.36 |
|
1 - Represents the continuity of the Manager ES relating to only those employees of the Company based on the Manager's weighted average exercise price which differs from that of the Corporation.
2 - Represents the continuity of the Corporation ES relating to only those employees of the Company. based on the Corporation's weighted average exercise price which differs from that of the Manager. |
The weighted-average grant date fair value of Brookfield Asset Management Ltd. escrowed shares granted for the year ended December 31, 2023 was $5.26 (2022 – $3.83), and was determined using the Black-Scholes model of valuation with inputs to the model as follows:
|
|
|
|
|
|
|
|
|
|
|
|
|
|
|
|
|
|
|
FOR THE YEAR AND PERIOD ENDED DECEMBER 31,
(MILLIONS)
|
Unit |
|
2023 |
|
2022 |
| Weighted-average share price |
US$ |
|
$ |
35.13 |
|
|
$ |
29.64 |
|
| Average term to exercise |
Years |
|
7.5 |
|
|
6.9 |
|
Share price volatility1 |
% |
|
28.5 |
|
|
28.9 |
|
| Liquidity discount |
% |
|
25.0 |
|
|
25.0 |
|
| Weighted-average annual dividend yield |
% |
|
4.6 |
|
|
5.3 |
|
| Risk-free rate |
% |
|
3.9 |
|
|
3.7 |
|
1 - Share price volatility was determined based on implied volatilities consistent with the Corporation's historical share prices over a similar period to the average term to exercise. |
The weighted-average grant date fair value of Brookfield Corporation escrowed shares granted for the year ended December 31, 2022 was $7.66, and was determined using the Black-Scholes model of valuation with inputs to the model as follows:
|
|
|
|
|
|
|
|
|
|
|
|
|
|
FOR THE YEAR ENDED DECEMBER 31
(MILLIONS)
|
Unit |
|
|
2022 |
| Weighted-average share price |
US$ |
|
|
$ |
36.28 |
|
| Average term to exercise |
Years |
|
|
7.2 |
|
Share price volatility1 |
% |
|
|
26.7 |
|
| Liquidity discount |
% |
|
|
25.0 |
|
| Weighted-average annual dividend yield |
% |
|
|
1.0 |
|
| Risk-free rate |
% |
|
|
3.7 |
|
1 - Share price volatility was determined based on implied volatilities consistent with the Corporation's historical share prices over a similar period to the average term to exercise. |
Restricted Stock Plan
The Restricted Stock Plan awards executives with Class A shares of the Corporation and the Manager purchased on the open market (“Restricted Shares”). Under the Restricted Stock Plan, Restricted Shares awarded vest over a period of up to five years, except for Restricted Shares awarded in lieu of a cash bonus, which may vest immediately. Vested and unvested Restricted Shares are subject to a hold period of up to five years. Holders of Restricted Shares are entitled to vote Restricted Shares and to receive associated dividends. Employee compensation expense for the Restricted Stock Plan is charged against income over the vesting period.
Compensation expense for the year ended December 31, 2023 was $48 million (2022 – $55 million).
Deferred Share Unit Plan and Restricted Share Unit Plan
The Deferred Share Unit ("DSU") Plan and Restricted Share Unit ("RSU") Plan provides for the issuance of DSUs and RSUs, respectively. Under these plans, qualifying employees and directors receive varying percentages of their annual incentive bonus or directors’ fees in the form of DSUs and RSUs. The DSUs and RSUs vest over periods of up to five years, and DSUs accumulate additional DSUs at the same rate as dividends on Class A shares of the Corporation and the Manager based on the market value of the Class A shares at the time of the dividend. Participants are not allowed to convert DSUs and RSUs into cash until retirement or cessation of employment.
The value of the DSUs, when converted to cash, will be equivalent to the market value of the Class A shares of the Corporation and the Manager at the time the conversion takes place. The value of the RSUs, when converted into cash, will be equivalent to the difference between the market price of equivalent number of Class A shares of the Corporation or the Manager at the time the conversion takes place and the market price on the date the RSUs are granted. The fair value of the vested DSUs and RSUs as at December 31, 2023 was $181 million (2022 – $168 million).
Employee compensation expense for these plans is charged against net income over the vesting period of the DSUs and RSUs. For those awards issued as part of the Arrangement, the mark-to-market movement is recoverable from the Corporation. The amount payable in respect of vested DSUs and RSUs changes as a result of dividends and share price movements. All of the amounts attributable to changes in the amounts payable by the Company are recorded as employee compensation expense in the period of the change. For the year ended December 31, 2023, employee compensation expense totaled $12 million (2022 – recovery of $195 million).
The change in the number of DSUs and RSUs outstanding for the year ended December 31, 2023 was as follows:
|
|
|
|
|
|
|
|
|
|
|
|
|
|
|
|
|
|
|
DSUs |
|
RSUs |
|
Number of Units Tracking to BAM Ltd. share price (000's) |
Number of Units Tracking to BN share price (000's) |
|
Number of Units Tracking to BN share price (000's) |
Weighted-Average Exercise Price (CAD) |
| Outstanding as at January 1, 2023 |
915 |
|
3,856 |
|
|
823 |
|
$ |
3.92 |
|
| Transferred |
(123) |
|
(547) |
|
|
(253) |
|
3.92 |
|
| Granted and reinvested |
30 |
|
27 |
|
|
— |
|
— |
|
| Exercised and cancelled |
(34) |
|
(133) |
|
|
— |
|
— |
|
| Outstanding as at December 31, 2023 |
788 |
|
3,203 |
|
|
570 |
|
$ |
3.92 |
|
9. PREFERRED SHARES REDEEMABLE NON-CONTROLLING INTEREST
In December 2022, at the time of the spin-off, BUSHI and BMHL, subsidiaries of the Company, entered into arrangements with the Corporation whereby BUSHI and BMHL issued preferred shares to the Corporation in exchange for the Corporation's holdings in BUSHI's and BMHL's common shares.
The preferred shares, which we also refer to as tracking shares, represent a class of ownership senior to common stock and subordinate to debt and are entitled to quarterly dividends when declared by BUSHI and BMHL. The BUSHI preferred shares are redeemable at the option of the issuer, whose board is controlled by the holder, after 10 years and the BMHL preferred shares are redeemable when a redemption triggering event has occurred. As the Company does not solely control the redemption event, these preferred shares are accounted for as redeemable non-controlling interests.
In addition to the tracking shares, BUSHI has also issued class B senior preferred shares and class B preferred shares. The class B senior preferred shares entitle the holder to cumulative preferential cash dividends at $1.36375 per share per annum and are
ranked senior to the Tracking Shares, class B preferred shares and common shares. The class B senior preferred shares are redeemable by the issuer, whose board is controlled by the Corporation, upon the tenth anniversary of issuance at a redemption amount of $25 per share plus accrued and unpaid dividend. The class B preferred shares are redeemable at the option of both the holder and the issuer at $25 per share (the redemption amount) plus unpaid dividends. These preferred shares are non-voting and rank junior to the BUSHI tracking shares and senior to common shares of the entity, and are entitled to non-cumulative cash dividends at 6.7% per annum on their redemption amount.
The Company accounts for the changes in the value of the redeemable non-controlling interest in accordance with ASC 480, Distinguishing Liabilities from Equity. The Company elects for the BUSHI tracking shares and class B senior preferred shares to recognize changes in the redemption value immediately as they occur and adjust the carrying amount to equal the redemption value at the end of each reporting period. As the BMHL tracking shares are not currently redeemable and management has determined that it is not probable that the instrument will become redeemable no subsequent adjustment in the value of the preferred shares is expected. The BUSHI class B preferred shares are currently redeemable and are therefore measured at their redemption amount at each reporting date. However, no adjustment to the carrying value of the class B preferred shares is expected as dividends declared are expected to be paid on or prior to each reporting date.
The Company had 100 BUSHI Tracking Shares and 100 BMHL Tracking Shares outstanding as at December 31, 2023 with a carrying value equal to redemption value of $2.2 billion and $nil, respectively. In addition, the company had 1,621,093 BUSHI class B senior preferred shares and 2,520,571 BUSHI class B preferred shares outstanding as at December 31, 2023 with a carrying value equal to their redemption value of $41 million and $63 million, respectively.
The movement in the carrying value of the preferred shares redeemable non-controlling interest is as follows:
|
|
|
|
|
|
|
|
|
|
|
|
|
|
|
|
|
|
|
|
|
AS AT AND FOR THE YEAR ENDED DECEMBER 31, 2023
(MILLIONS)
|
|
|
2023 |
|
2022 |
| Opening balance |
|
|
$ |
1,811 |
|
|
$ |
— |
|
| Net issuances |
|
|
93 |
|
|
1,776 |
|
| Changes in redemption value included in net income attributable to preferred shares non-controlling interest |
|
|
262 |
|
|
35 |
|
Balance as at December 31, 2023 |
|
|
$ |
2,166 |
|
|
$ |
1,811 |
|
10. ACCOUNTS RECEIVABLE AND OTHER
|
|
|
|
|
|
|
|
|
|
|
|
|
|
|
|
|
|
|
|
|
|
|
|
|
AS AT DECEMBER 31,
(MILLIONS)
|
|
|
|
|
2023 |
|
2022 |
|
|
| Accounts receivable |
|
|
|
|
$ |
278 |
|
|
$ |
245 |
|
|
|
| Prepaid expenses |
|
|
|
|
124 |
|
|
61 |
|
|
|
| Other assets |
|
|
|
|
186 |
|
|
123 |
|
|
|
|
|
|
|
|
$ |
588 |
|
|
$ |
429 |
|
|
|
|
|
|
|
|
|
|
|
|
|
|
|
|
|
|
|
|
|
|
|
|
|
|
|
|
|
|
|
|
|
|
|
|
|
|
|
|
|
|
|
Other assets is primarily comprised of tax recoveries not yet collected.
11. ACCOUNTS PAYABLE AND OTHER
|
|
|
|
|
|
|
|
|
|
|
|
|
|
|
|
|
|
|
|
|
|
|
|
|
AS AT DECEMBER 31,
(MILLIONS)
|
|
|
|
|
2023 |
|
2022 |
|
|
| Accounts payable |
|
|
|
|
$ |
537 |
|
|
$ |
376 |
|
|
|
| Accrued liabilities |
|
|
|
|
774 |
|
|
991 |
|
|
|
| Other liabilities |
|
|
|
|
488 |
|
|
475 |
|
|
|
|
|
|
|
|
$ |
1,799 |
|
|
$ |
1,842 |
|
|
|
|
|
|
|
|
|
|
|
|
|
|
|
|
|
|
|
|
|
|
|
|
|
|
|
|
|
|
|
|
|
|
|
|
|
|
|
|
|
|
|
Other liabilities are primarily comprised of current taxes payable and accrued bonuses.
12. PROPERTY, PLANT AND EQUIPMENT
|
|
|
|
|
|
|
|
|
|
|
|
|
|
|
|
|
AS AT DECEMBER 31,
(MILLIONS)
|
2023 |
|
2022 |
Property, plant, and equipment |
$ |
33 |
|
|
$ |
24 |
|
Leasehold improvements |
40 |
|
|
44 |
|
|
|
|
|
|
$ |
73 |
|
|
$ |
68 |
|
13. GOODWILL AND INTANGIBLE ASSETS
The carrying value of Goodwill was $251 million as of December 31, 2023 ($249 million - 2022).
Intangible assets, net consists of the following:
|
|
|
|
|
|
|
|
|
|
|
|
|
|
|
|
|
|
|
|
|
|
|
|
|
AS AT DECEMBER 31,
(MILLIONS)
|
|
|
|
|
2023 |
|
2022 |
|
|
| Contractual customer relationships |
|
|
|
|
$ |
155 |
|
|
$ |
82 |
|
|
|
| Accumulated amortization and impairment |
|
|
|
|
(113) |
|
|
(23) |
|
|
|
| Intangible assets, net |
|
|
|
|
$ |
42 |
|
|
$ |
59 |
|
|
|
|
|
|
|
|
|
|
|
|
|
|
|
|
|
|
|
|
|
|
|
|
|
|
|
|
|
|
|
|
|
|
|
|
|
|
|
|
|
|
|
Changes in intangible assets, net consists of the following:
|
|
|
|
|
|
|
|
|
|
|
|
|
|
|
|
|
|
|
|
|
|
|
|
|
|
|
AS AT DECEMBER 31,
(MILLIONS)
|
|
|
|
|
2023 |
|
2022 |
|
|
| Balance, beginning of year |
|
|
|
|
$ |
59 |
|
|
$ |
64 |
|
|
|
| Amortization |
|
|
|
|
(3) |
|
|
(2) |
|
|
|
| Impairment and other |
|
|
|
|
(14) |
|
|
(3) |
|
|
|
| Balance, end of year |
|
|
|
|
$ |
42 |
|
|
$ |
59 |
|
|
|
|
|
|
|
|
|
|
|
|
|
|
|
|
|
|
|
|
|
|
|
|
|
|
|
|
|
|
|
|
|
|
|
|
|
|
|
|
|
|
|
Intangible assets consist of acquired contractual rights to earn future fee income, which have a weighted-average amortization period of 6 years as well as indefinite life intangible assets. Amortization of intangible assets held at December 31, 2023 is expected to be $3 million, $3 million, $2 million, $2 million, and $2 million for each of the years ending December 31, 2024, 2025, 2026, 2027 and 2028, respectively.
In accordance with ASC 350 Intangibles — Goodwill and Other, management has performed an annual impairment assessment of goodwill. In each instance the fair value was found to be in excess of the carrying value of the relevant reporting unit. In one instance a goodwill balance of Public Securities Group Holdings LLC, associated with historical acquisitions was identified as having a carrying value in excess of fair value by $13 million which has been recognized as an impairment recorded in Other (expenses) income, net in the Consolidated and Combined Statement of Operations.
In addition, an assessment of impairment was performed with respect to certain intangible assets and it was found that the fair value of certain contractual customer relationships was less than the carrying value. As a result an impairment of $13 million has been recorded in Other (expenses) income, net in the Consolidated and Combined Statement of Operations.
The fair value of the reporting units for both goodwill and intangibles was determined utilizing a discounted cashflow model along with inputs from assessing multiples of publicly traded companies.
The key assumptions used in the calculation of fair value included assumptions on growth rates, effective tax rates, operating margins, and the weighted average cost of capital, ("WACC"). Specifically, we calculated the residual value by dividing the residual free cash flow by a capitalization rate equal to the WACC 15.5% (2022 – 15.5%) minus the expected long-term growth rate of the free cash flows 3.0% (2022 - 3.0%). No significant changes have occurred since the impairment test was performed.
14. CASH AND CASH EQUIVALENTS
|
|
|
|
|
|
|
|
|
|
|
|
|
|
|
|
|
|
|
|
|
|
|
AS AT DECEMBER 31, |
2023 |
|
|
|
|
|
|
2022 |
| Cash and bank balances |
$ |
184 |
|
|
|
|
|
|
|
$ |
272 |
|
| Cash equivalents |
2,483 |
|
|
|
|
|
|
|
3,273 |
|
|
$ |
2,667 |
|
|
|
|
|
|
|
$ |
3,545 |
|
The carrying value of cash and cash equivalents approximates their fair value. Cash equivalents comprise of a deposit with the Corporation of $2.5 billion (2022- $3.3 billion).
15. RELATED PARTY TRANSACTIONS
In the normal course of business, the Company entered into transactions with related parties and derived the majority of its revenue from the provision of asset management services to the Corporation along with its subsidiaries and operating entities. During the year ended December 31, 2023, the Company recorded $3.5 billion of revenues derived from related party transactions on its Consolidated and Combined Statement of Operations (2022 – $3.2 billion).
In the normal course of business, the Company entered into transactions with related parties by providing and borrowing on short-term credit facilities, working capital facilities, as well as unsecured loans. The balances due and from these facilities as well as those amounts due and from share-based compensation recharge and recovery arrangements are recorded as Due from affiliates and Due to affiliates on the Consolidated and Combined Balance Sheets.
Under the AMSA, the Manager provides the services of its employees and its Chief Executive Officer to the Company on a cost recovery basis. For services received, costs are recorded on a gross basis in the Consolidated and Combined Statements of Operations. During the year ended December 31, 2023, under this arrangement, the Company has recognized $177 million (2022 - $6 million) in the Consolidated and Combined Statements of Operations which includes the impacts of the fair value movements of the cash-settled equity instruments provided by the Manager to employees of the Company. The Company also made a $16 million prepayment to the Manager under the AMSA for share-based compensation, which has been recognized in Accounts receivable and other.
As outlined in the Relationship Agreement, the Corporation is responsible for costs associated with certain share-based awards for certain employees, some of which are subject to revaluation at each balance sheet date, and will also bear the cost of the employee entitlement to carried interest on mature funds either directly or indirectly through reimbursement to the Company. Income generated under the Relationships Agreement relating to these instruments is recognized as Other (expenses) revenues in the Consolidated and Combined Statement of Operations on a gross basis as the instruments vest. During the year ended December 31, 2023, the Asset Management Company has recognized a recharge of $142 million (2022 - charge of $12 million) in the Consolidated and Combined Statement of Operations under this arrangement.
Under the TSA, Brookfield Asset Management ULC will provide the Corporation and the Manager certain services to support day-to-day corporate activities on a transitional basis. For services provided to the Corporation, costs are recorded on a gross basis in the Consolidated Statement of Operations. For the year ended December 31, 2023, the Corporation has recognized $14 million (2022 - $nil) in the Consolidated Statement of Operations under this arrangement.
The Company also issued to the Manager options to acquire the Company's shares, which are accounted for as the Company's equity in Additional Paid-in Capital at their fair value on issuance of $41 million. These are options that track to certain Manager stock options issued under its Management Share Option Plan and are exercised at the same time and the same exercise prices as these awards.
For the year ended December 31, 2023, the Company recognized tax attributes purchased from a related party of $90 million.
For the year ended December 31, 2023 the Asset Management Company declared a non-cash distribution to the Corporation in the amount of $229 million which has been recorded in the Consolidated and Combined Statement of Changes in Equity.
Due from affiliates and due to affiliates consisted of the following:
|
|
|
|
|
|
|
|
|
|
|
|
|
AS AT DECEMBER 31,
(MILLIONS)
|
2023 |
|
2022 |
| Due from Affiliates |
|
|
|
| Loans to affiliates |
$ |
1,654 |
|
|
$ |
1,317 |
|
| Receivables from affiliates related to share and cash-based compensation |
650 |
|
|
801 |
|
| Loans to related parties |
200 |
|
|
3 |
|
|
$ |
2,504 |
|
|
$ |
2,121 |
|
|
|
|
|
| Due to Affiliates |
|
|
|
| Operating payables due to related parties |
$ |
659 |
|
|
$ |
786 |
|
| Payables to affiliates related to share and cash-based compensation to carried interest |
129 |
|
|
25 |
|
| Borrowings from related parties |
198 |
|
|
— |
|
|
$ |
986 |
|
|
$ |
811 |
|
Due from affiliates
Due from affiliates of $2.5 billion (2022 – $2.1 billion) consists of $1.7 billion (2022 – $1.3 billion) of loans from affiliates which are comprised of asset management fees receivables, working capital facilities, and other outstanding short-term credit facilities provided to the Corporation and its subsidiaries in the normal course of business. Loans to related parties are unsecured with floating rates of Secured Overnight Financing Rate published by the Federal Reserve Bank of New York ("SOFR") less 375 bps or a fixed interest rate of 0.14% to 8%. The Company recently issued a related party loan for $174 million with a fixed interest rate of 8%. The prior year non-operating loans to related parties are unsecured with floating rates of the London Inter-Bank Offered Rate ("LIBOR") less 375bps or fixed interest rates ranging from 2.5% – 6.5%. Maturities on loans to related parties range from 2024 to 2057. The loans were generally issued to finance acquisitions and fund commitments.
The Manager is entitled to reimbursement for costs incurred associated with stock based compensation awards issued to employees of the Asset Management Company by the Manager. The Asset Management Company reimburses these costs at the time that the awards are issued. During the year ended December 31, 2023, the Company paid the Manager $88 million as a prepayment for equity based compensation granted to the Company's employees which has been recognized by the Company as a prepayment for compensation expense in Due from affiliates. The Company also made a $16 million prepayment to the Manager under the AMSA for equity based compensation, which has been recognized in Accounts receivable and other. The Company also issued to the Manager options to acquire the Company’s shares, which are accounted for as the Company’s equity in Additional Paid-in Capital at their fair value on issuance date of $41 million. These options are options that track to certain Manager stock options issued under its Management Share Option Plan and are automatically exercised at the same time and the same exercise prices as these awards.
Due to affiliates
Due to affiliates of $986 million (2022 - $811 million) consists of amounts payable to related parties for services received in the normal course of business including operating expenses payable and borrowings from the Corporation under the line of credit.
16. COMMITMENTS AND CONTINGENCIES
Commitments
On January 31, 2019, a subsidiary of the Company committed $2.8 billion to BSREP III, of which $2.1 billion has been funded as at December 31, 2023 (December 31, 2022 – $1.8 billion). The remainder of the commitment will be funded by the Corporation.
In the normal course of business, the Company enters into contractual obligations which include commitments to provide bridge financing and other equity commitments. As at December 31, 2023, the Company had $2.1 billion of such commitments outstanding.
Contingencies
Carried interests clawback
Carried interests are realized when an underlying investment is profitably disposed of after the fund’s cumulative returns have met a certain thresholds for return of capital. When applicable, the Company records a liability for potential clawback obligations due to changes in the unrealized value of a fund’s remaining investments and where the Company has previously received carried interest distributions.
The actual clawback liability, however, generally does not become payable until the end of a fund’s life. No liability for potential clawback obligations has been recorded associated with any of our funds as at December 31, 2023 and December 31, 2022.
Litigation
The Company may from time to time be involved in litigation and claims incidental to the conduct of its business. The Company’s businesses are also subject to extensive regulation, which may result in regulatory proceedings against the Company. As of December 31, 2023 there is no outstanding litigation.
The Company accrues a liability for legal proceedings only when those matters present loss contingencies that are both probable and reasonably estimable. In such cases, there may be exposure to loss in excess of any amounts accrued. Although there can be no assurance of the outcome of such legal actions, based on information known by management, the Company does not have a potential liability related to any current legal proceeding or claim that would individually or in the aggregate materially affect its results of operations, financial condition or cash flows.
17. SUBSEQUENT EVENTS
Subsequent to December 31, 2023, the Company evaluated events and transactions occurring up to March 18, 2024.
On March 1, 2024, other investors of Oaktree exercised their put option and as a result, the Company, in conjunction with the Corporation, will acquire an additional 4.5% interest in Oaktree in exchange for total consideration of $523 million. This will increase the Company's ownership interest from approximately 68% to approximately 72%.
Shareholder Information
|
|
|
|
|
|
|
|
|
|
|
|
|
|
|
|
Shareholder Enquiries
Shareholder enquiries should be directed to our Investor Relations group at:
Brookfield Asset Management Limited
Brookfield Place, 181 Bay Street, Suite 100
Toronto, Ontario M5J 2T3
T: 416-363-9491 or toll free in North America: 1-866-989-0311
E: bam.enquiries@brookfield.com
www.bam.brookfield.com
Shareholder enquiries relating to dividends, address changes and share certificates should be directed to our Transfer Agent:
TSX Trust Company
301 - 100 Adelaide Street West
Toronto, ON M5H 4H1
T: 416-682-3860 or toll free in North America (1-877-715-0498)
F: 1-888-249-6189
E: inquiries@tmx.com
www.tsxtrust.com
|
|
Investor Relations and Communications
We are committed to informing our shareholders of our progress through our comprehensive communications program which includes publication of materials such as our annual report, quarterly interim reports and news releases. We also maintain a website that provides ready access to these materials, as well as statutory filings, stock and dividend information and other presentations.
Meeting with shareholders is an integral part of our communications program. Directors and management meet with Brookfield Asset Management Ltd. shareholders at our annual meeting and are available to respond to questions. Management is also available to investment analysts, financial advisors and media.
The text of our 2023 Annual Report is available in French on request from the company and is filed with and available through SEDAR+ at www.sedarplus.ca.
Dividends
The quarterly dividend payable on Class A shares is declared in U.S. dollars. Registered shareholders who are U.S. residents receive their dividends in U.S. dollars, unless they request the Canadian dollar equivalent. Registered shareholders who are Canadian residents receive their dividends in the Canadian dollar equivalent, unless they request to receive dividends in U.S. dollars. The Canadian dollar equivalent of the quarterly dividend is based on the Bank of Canada daily average exchange rate exactly two weeks (or 14 days) prior to the payment date for the dividend.
Dividend Reinvestment Plan
The Manager has a Dividend Reinvestment Plan which enables registered holders of Class A Shares who are resident in Canada to receive their dividends in the form of newly issued Class A shares.
Registered holders of our Class A Shares who are resident in Canada have the opportunity to acquire additional Class A Shares by reinvesting all or a portion of their cash dividend without paying commissions through our Distribution Reinvestment Plan. The plan is currently not available for Registered shareholders of our Class A Shares who are resident in the United States.
Pursuant to our Dividend Reinvestment Plan, registered holders our Class A Shares who are resident in Canada may also elect to receive their dividends in the form of newly issued Class A Shares at a price equal to the volume weighted average price (in U.S. dollars) at which board lots of Class A Shares have traded on the NYSE based on the average closing price during each of the five trading days immediately preceding the relevant Investment Date on which at least one board lot of Class A Shares has traded, as reported by the NYSE. multiplied by an exchange factor which is calculated as the average daily exchange rate as reported by the Bank of Canada during each of the five trading days immediately preceding the relevant Investment Date.
Further details on the Dividend Reinvestment Plan and a Participation Form can be obtained from our Toronto office, our transfer agent or from our website.
|
| Stock Exchange Listings |
|
| |
Symbol |
Stock Exchange |
|
| Class A Limited Voting Shares |
BAM |
New York |
|
|
BAM |
Toronto |
|
|
|
|
|
|
|
|
|
|
|
|
|
|
|
|
|
|
|
1 “Investment Date” means each dividend payment date upon which cash dividends paid on all Class A Shares registered in the name of a shareholder, net of any applicable withholding taxes, are reinvested.
|
|
|
|
|
|
|
|
|
|
|
|
|
|
|
|
| Dividend Record and Payment Dates |
Security1 |
|
Record Date2 |
|
Payment Date3 |
| Class A |
|
Last day of February, May, August and November |
|
Last day of March, June, September and December |
| 1. All dividend payments are subject to declaration by the Board of Directors. 2. If the Record Date is not a business day, the Record Date will be the previous business day.
3. If the Payment Date is not a business day, the Payment Date will be the previous business day.
|
Board of Directors and Officers
BOARD OF DIRECTORS
|
|
|
|
|
|
|
|
|
|
MARK CARNEY
Chair of the Board and Head of Transition Investing of Brookfield Asset Management Ltd.
|
MARCEL R. COUTU
Corporate Director
|
BRUCE FLATT
Chief Executive Officer of Brookfield Asset Management Ltd. and Brookfield Corporation
|
|
OLIVIA GARFIELD
Chief Executive Officer of Severn Trent, a FTSE 100 water utilities company.
|
NILI GILBERT
Vice Chairwoman of Carbon Direct LLC, a leader in scaling carbon management.
|
KEITH JOHNSON
Founding Partner and Chief Executive Officer of Sequoia Heritage
|
|
BRIAN W. KINGSTON
Managing Partner and Chief Executive Officer of Real Estate of Brookfield Asset Management Ltd.
|
ALLISON KIRKBY
Chief Executive Officer of BT Group plc, a leading UK provider of digital infrastructure and communication services.
|
CYRUS MADON
Managing Partner and Executive Chair of Private Equity of Brookfield Asset Management Ltd.
|
|
DIANA NOBLE
Founder of Kirkos Partners.
|
SAMUEL J.B. POLLOCK
Managing Partner and Chief Executive Officer of Infrastructure of Brookfield Asset Management Ltd.
|
SATISH RAI
Senior Advisor at OMERS, Former Chief Investment Officer of OMERS.
|
|
Details on Brookfield Asset Management Ltd.'s directors are provided in the Management Information Circular and on Brookfield Asset Management Ltd.'s website at https://bam.brookfield.com
CORPORATE OFFICERS
Bruce Flatt, Chief Executive Officer
Bahir Manios, Chief Financial Officer
Connor Teskey, President; Chief Executive Officer, Renewable Power and Transition
Justin B. Beber, Chief Operating Officer
Brian W. Kingston, Chief Executive Office, Real Estate
Cyrus Madon, Executive Chair, Private Equity
Craig W.A. Noble, Chief Executive Officer, Credit
Samuel J.B. Pollock, Chief Executive Officer, Infrastructure
Anuj Ranjan, Chief Executive Officer, Private Equity