株探米国株
エドガーで原本を確認する
0001934850false00019348502026-08-052026-08-050001934850us-gaap:CommonStockMember2026-08-052026-08-050001934850fg:A7.950SeniorNotesDue2053Member2026-08-052026-08-050001934850fg:A7.300JuniorSubordinatedNotesDue2065Member2026-08-052026-08-05

UNITED STATES
SECURITIES AND EXCHANGE COMMISSION
Washington, D.C. 20549
FORM 8-K
Current Report
Pursuant to Section 13 or 15(d) of the Securities Exchange Act of 1934
Date of Report (Date of Earliest Event Reported): August 5, 2026
F&G Annuities & Life, Inc. 
(Exact Name of Registrant as Specified in its Charter)
001-41490
(Commission File Number)
Delaware
85-2487422
(State or Other Jurisdiction of 
Incorporation)
(IRS Employer Identification No.)
801 Grand Avenue, Suite 2600
Des Moines, Iowa 50309
(Address of Principal Executive Offices)
(866) 846-4660
(Registrant’s Telephone Number, Including Area Code)
(Former Name or Former Address, if Changed Since Last Report)
Check the appropriate box below if the Form 8-K filing is intended to simultaneously satisfy the filing obligation of the registrant under any of the following provisions:
Written communications pursuant to Rule 425 under the Securities Act (17 CFR 230.425)
Soliciting material pursuant to Rule 14a-12 under the Exchange Act (17 CFR 240.14a-12)
Pre-commencement communications pursuant to Rule 14d-2(b) under the Exchange Act (17 CFR 240.14d-2(b))
Pre-commencement communications pursuant to Rule 13e-4(c) under the Exchange Act (17 CFR 240.13e-4(c))
Securities registered pursuant to Section 12(b) of the Act:
Title of Each Class
Trading Symbol
Name of Each Exchange on Which Registered
F&G Common Stock, $0.001 par value
FG
New York Stock Exchange
7.950% Senior Notes due 2053
FGN
New York Stock Exchange
7.300% Junior Subordinated Notes due 2065
FGSN
New York Stock Exchange
Indicate by check mark whether the registrant is an emerging growth company as defined in Rule 405 of the Securities Act of 1933 (§230.405 of this chapter) or Rule 12b-2 of the Securities Exchange Act of 1934 (§240.12b-2 of this chapter).
Emerging growth company  
If an emerging growth company, indicate by check mark if the registrant has elected not to use the extended transition period for complying with any new or revised financial accounting standards provided pursuant to Section 13(a) of the Exchange Act.   


Item 2.02. Results of Operations and Financial Condition
On August 5, 2026, F&G Annuities & Life, Inc. (the “Company” or “F&G”) issued a press release announcing its financial results for the second quarter ended June 30, 2026. A copy of such press release is furnished as Exhibit 99.1 to this Current Report on Form 8-K. In addition, the Company is furnishing the quarterly financial supplement as Exhibit 99.2 to this Current Report on Form 8-K.

The following information, including the exhibits referenced in this Item 2.02, are being furnished pursuant to this Item 2.02 and shall not be deemed “filed” for purposes of Section 18 of the Securities Exchange Act of 1934, as amended, or otherwise subject to the liabilities of that Section, nor shall it be deemed incorporated by reference into any registration statement or other document pursuant to the Securities Act of 1933, as amended, except as shall be expressly set forth by specific reference in such filing.

Item 7.01. Regulation FD Disclosure
On August 5, 2026, the Company made available to investors a supplemental presentation for the second quarter ended June 30, 2026. A copy of the F&G investor presentation is furnished as Exhibit 99.3 to this Current Report on Form 8-K.

The following information, including the exhibit referenced in this Item 7.01, is being furnished pursuant to this Item 7.01 and shall not be deemed “filed” for purposes of Section 18 of the Securities Exchange Act of 1934, as amended, or otherwise subject to the liabilities of that Section, nor shall it be deemed incorporated by reference into any registration statement or other document pursuant to the Securities Act of 1933, as amended, except as shall be expressly set forth by specific reference in such filing.
Item 9.01 Financial Statements and Exhibits.
(d)    Exhibits.
Exhibit
Description
99.1
99.2
99.3
104
Cover Page Interactive Data File - the cover page XBRL tags are embedded within the Inline XBRL document.


SIGNATURE
Pursuant to the requirements of the Securities Exchange Act of 1934, the Registrant has duly caused this report to be signed on its behalf by the undersigned hereunto duly authorized.
F&G Annuities & Life, Inc.
Date: August 5, 2026
By:
/s/ Michael L. Gravelle
Name:
Michael L. Gravelle
Title:
Executive Vice President, General Counsel and Corporate Secretary

EX-99.1 2 a2q26fgearningsrelease_f.htm EX-99.1 a2q26fgearningsrelease_f
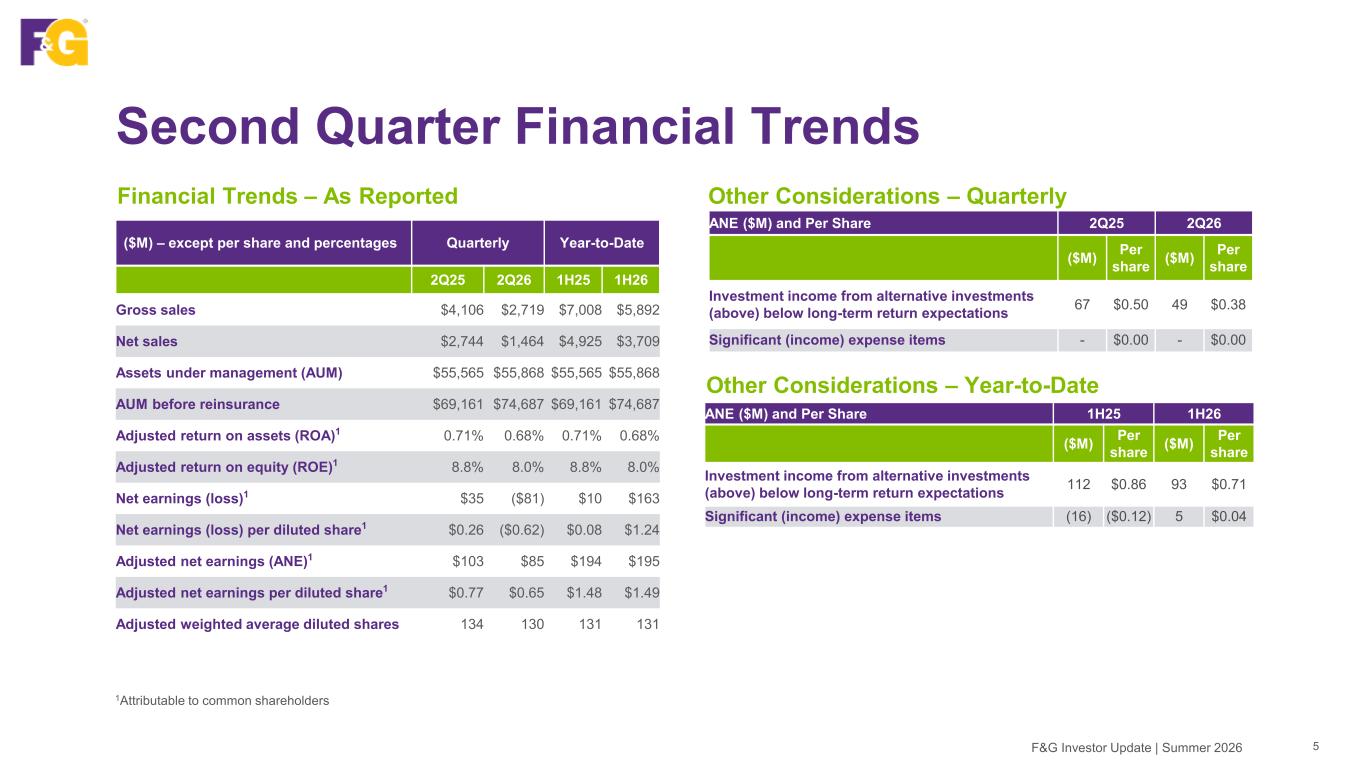
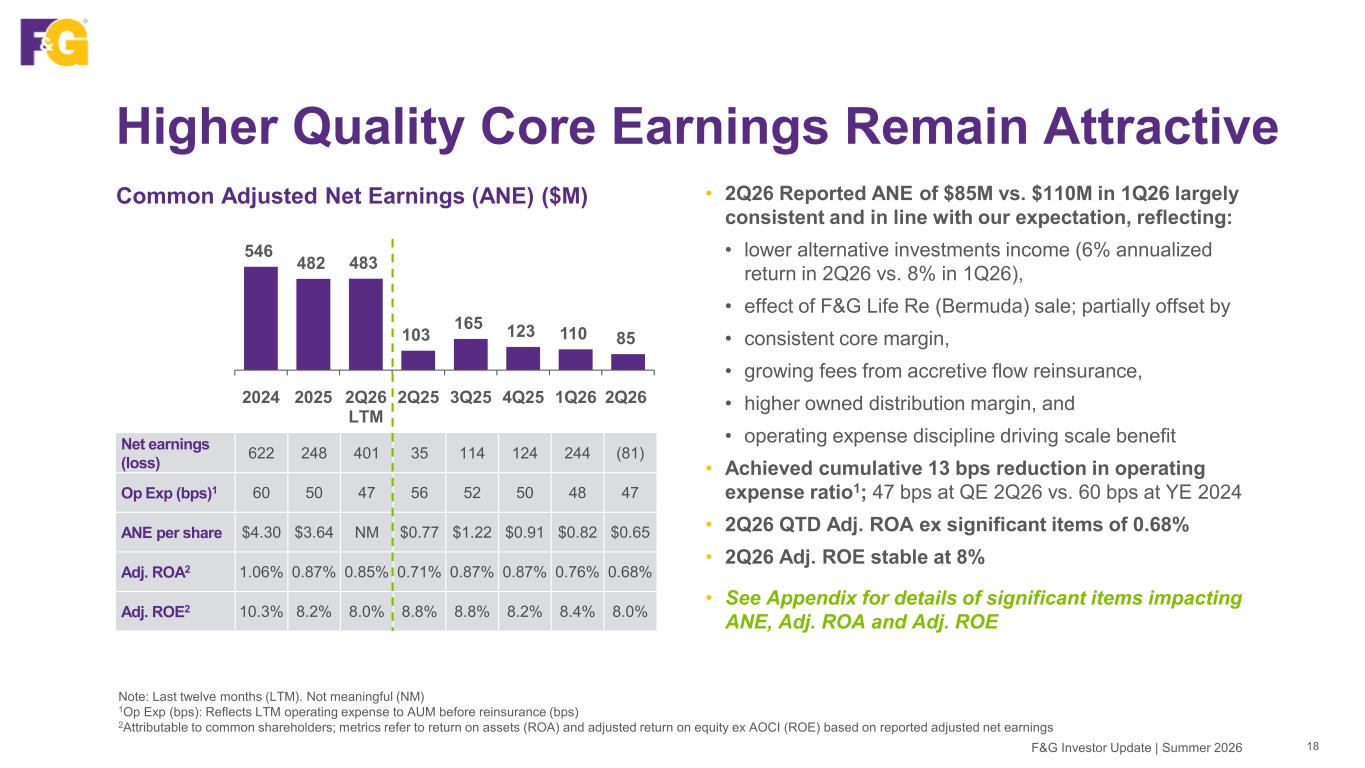
F&G Annuities & Life Reports Second Quarter 2026 Results Des Moines, Iowa – (August 5, 2026) – F&G Annuities & Life, Inc. (NYSE: FG) (F&G or the Company) a leading provider of insurance solutions serving retail annuity and life customers and institutional clients, today reported financial results for the second quarter ended June 30, 2026. Net loss attributable to common shareholders for the second quarter of $81 million, or $0.62 per diluted share (per share), compared to net earnings of $35 million, or $0.26 per share, for the second quarter of 2025. Net loss for the second quarter included $144 million of net unfavorable mark-to-market effects and $22 million of other unfavorable items; all of which are excluded from adjusted net earnings. Net earnings for the second quarter of 2025 included $49 million of net unfavorable mark-to-market effects and $19 million of other unfavorable items; all of which are excluded from adjusted net earnings. Adjusted net earnings attributable to common shareholders (adjusted net earnings) for the second quarter were $85 million, or $0.65 per share, compared with $103 million, or $0.77 per share, for the second quarter of 2025. Adjusted net earnings include significant income and expense items, as well as investment income from alternative investments below management’s long-term expected return. Please see the “Second Quarter 2026 Results” and “Non- GAAP Measures and Other Information” sections for further explanation. Company Highlights • Achieved record assets under management before reinsurance of nearly $75 billion: F&G achieved assets under management before reinsurance of $74.7 billion as of June 30, 2026, an increase of 8% over the second quarter of 2025. This included retained AUM of $55.9 billion. F&G’s gross sales were $2.7 billion and net sales were $1.5 billion for the second quarter • Excellent credit performance in our high quality asset portfolio: The retained investment portfolio is performing well, with 97% of fixed maturities being investment grade. It is well matched to our liability profile and diversified across asset types. Credit-related impairments have remained low and stable, averaging 6 basis points over the past five years, and continuing below pricing assumptions through the first half of 2026 • Reported adjusted return on equity (ROE) ex AOCI and adjusted return on assets (ROA) include short-term fluctuations in investment income from alternative investments: Adjusted ROE excluding AOCI was 8.0% and adjusted ROA was 68 basis points for the second quarter; adjusted ROA of 85 basis points over the last twelve months (LTM) was in line with full year 2025 • Solid balance sheet supports both organic growth and higher return of capital to shareholders: During the second quarter, F&G returned $128 million of capital to shareholders through $37 million of common and preferred dividends and $91 million of share repurchases. This brought the first half of 2026 capital returned to shareholders to approximately $195 million, through $75 million of dividends and $120 million of share repurchases Conor Murphy, F&G’s Chief Executive Officer and President, commented, “The second quarter reflects the strength and resilience of the business we have built at F&G. We achieved record assets under management before reinsurance


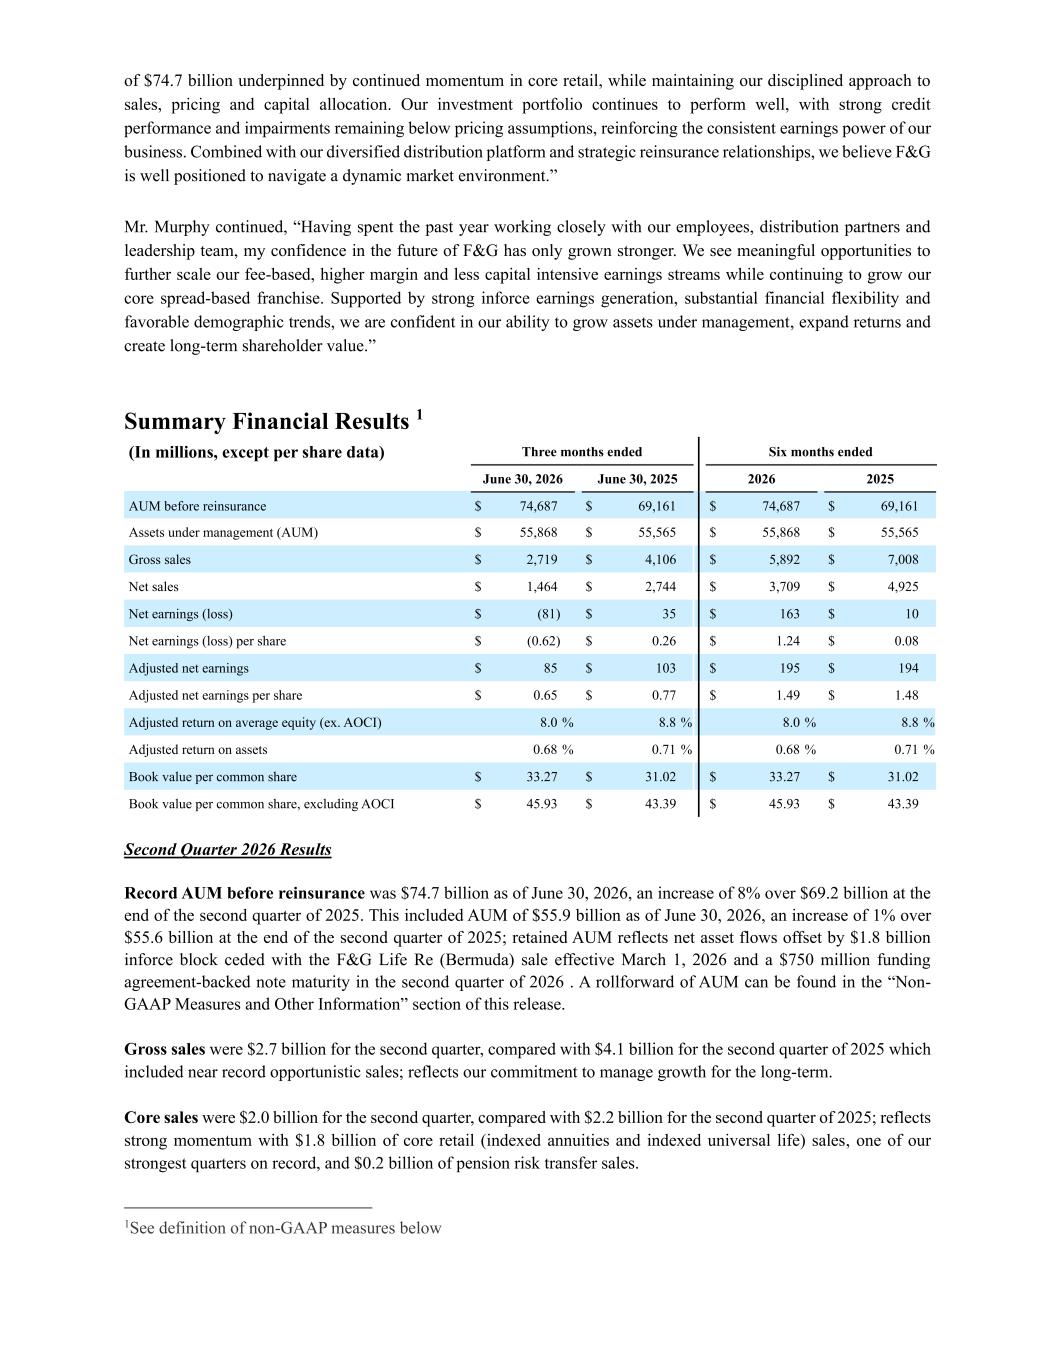
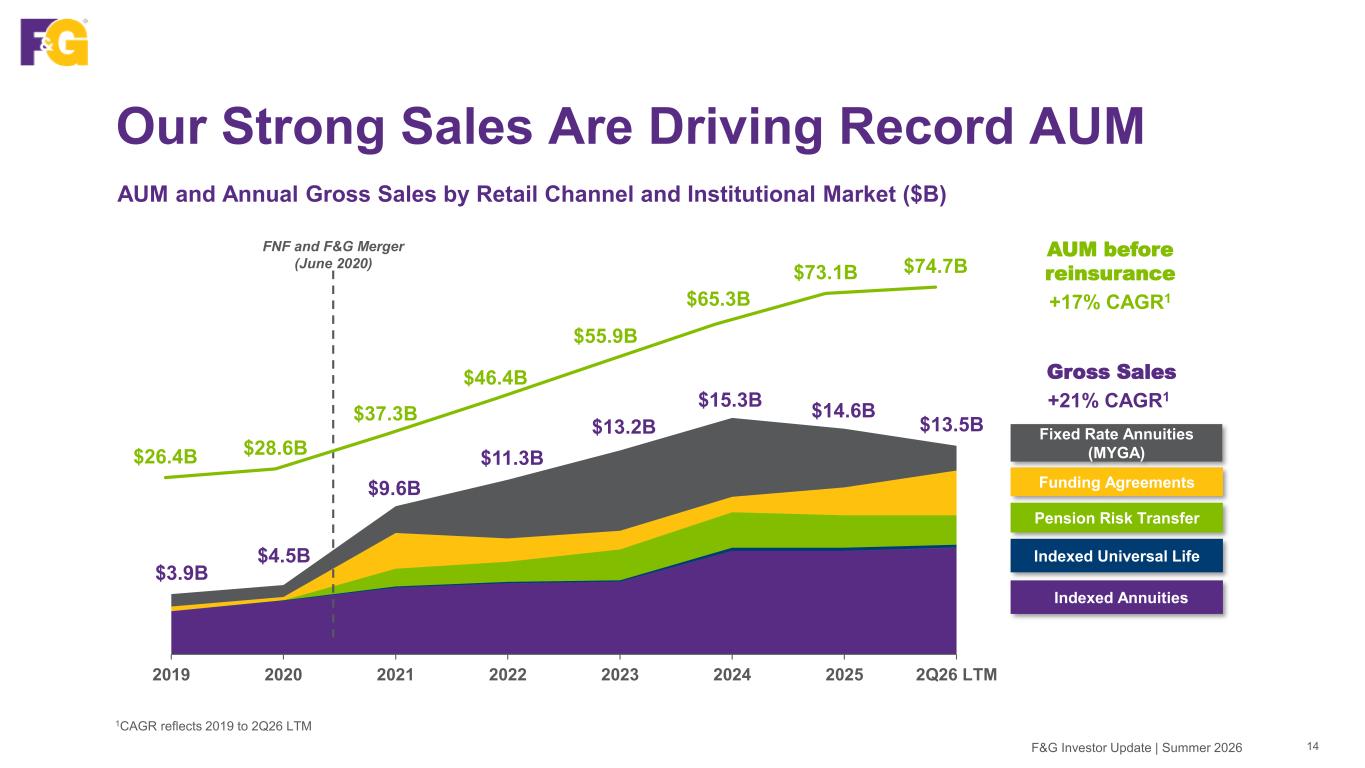
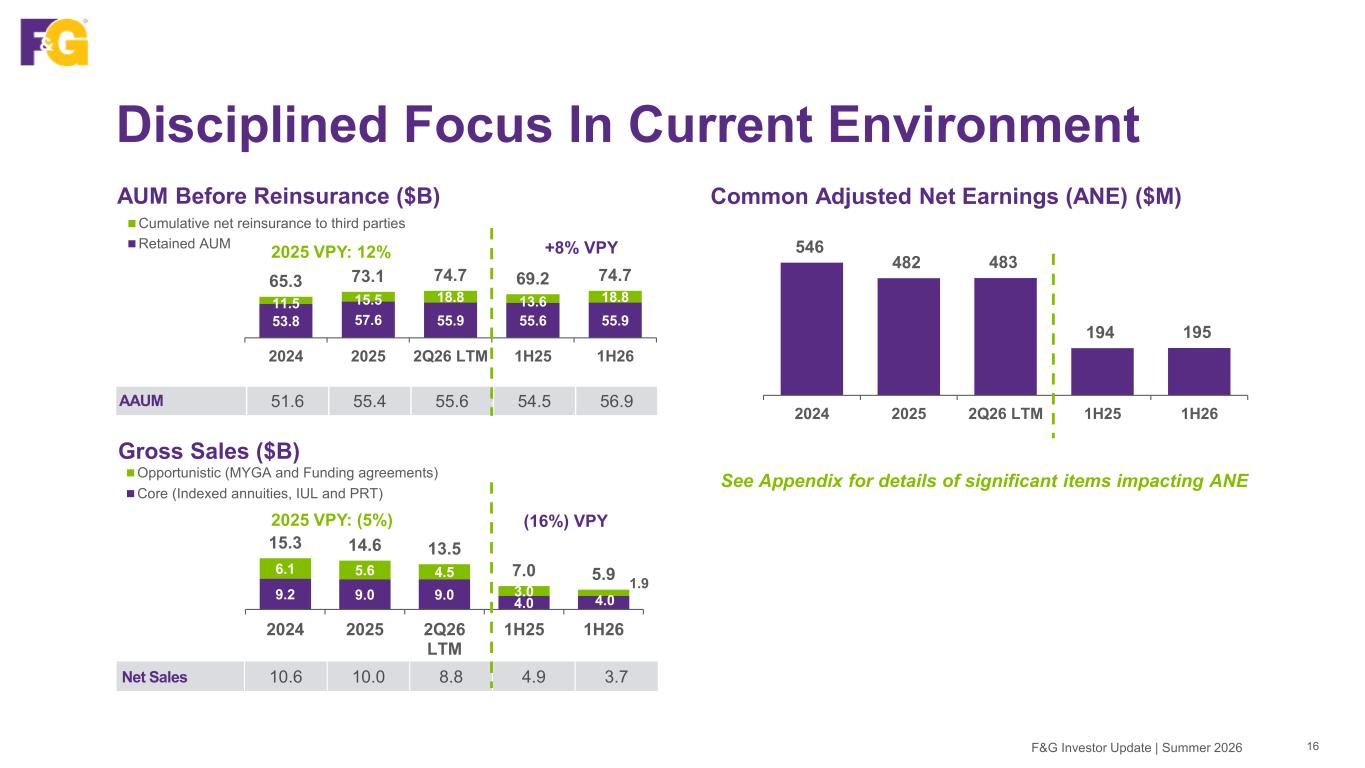
of $74.7 billion underpinned by continued momentum in core retail, while maintaining our disciplined approach to sales, pricing and capital allocation. Our investment portfolio continues to perform well, with strong credit performance and impairments remaining below pricing assumptions, reinforcing the consistent earnings power of our business. Combined with our diversified distribution platform and strategic reinsurance relationships, we believe F&G is well positioned to navigate a dynamic market environment.” Mr. Murphy continued, “Having spent the past year working closely with our employees, distribution partners and leadership team, my confidence in the future of F&G has only grown stronger. We see meaningful opportunities to further scale our fee-based, higher margin and less capital intensive earnings streams while continuing to grow our core spread-based franchise. Supported by strong inforce earnings generation, substantial financial flexibility and favorable demographic trends, we are confident in our ability to grow assets under management, expand returns and create long-term shareholder value.” Summary Financial Results 1 (In millions, except per share data) Three months ended Six months ended June 30, 2026 June 30, 2025 2026 2025 AUM before reinsurance $ 74,687 $ 69,161 $ 74,687 $ 69,161 Assets under management (AUM) $ 55,868 $ 55,565 $ 55,868 $ 55,565 Gross sales $ 2,719 $ 4,106 $ 5,892 $ 7,008 Net sales $ 1,464 $ 2,744 $ 3,709 $ 4,925 Net earnings (loss) $ (81) $ 35 $ 163 $ 10 Net earnings (loss) per share $ (0.62) $ 0.26 $ 1.24 $ 0.08 Adjusted net earnings $ 85 $ 103 $ 195 $ 194 Adjusted net earnings per share $ 0.65 $ 0.77 $ 1.49 $ 1.48 Adjusted return on average equity (ex. AOCI) 8.0 % 8.8 % 8.0 % 8.8 % Adjusted return on assets 0.68 % 0.71 % 0.68 % 0.71 % Book value per common share $ 33.27 $ 31.02 $ 33.27 $ 31.02 Book value per common share, excluding AOCI $ 45.93 $ 43.39 $ 45.93 $ 43.39 Second Quarter 2026 Results Record AUM before reinsurance was $74.7 billion as of June 30, 2026, an increase of 8% over $69.2 billion at the end of the second quarter of 2025. This included AUM of $55.9 billion as of June 30, 2026, an increase of 1% over $55.6 billion at the end of the second quarter of 2025; retained AUM reflects net asset flows offset by $1.8 billion inforce block ceded with the F&G Life Re (Bermuda) sale effective March 1, 2026 and a $750 million funding agreement-backed note maturity in the second quarter of 2026 . A rollforward of AUM can be found in the “Non- GAAP Measures and Other Information” section of this release. Gross sales were $2.7 billion for the second quarter, compared with $4.1 billion for the second quarter of 2025 which included near record opportunistic sales; reflects our commitment to manage growth for the long-term. Core sales were $2.0 billion for the second quarter, compared with $2.2 billion for the second quarter of 2025; reflects strong momentum with $1.8 billion of core retail (indexed annuities and indexed universal life) sales, one of our strongest quarters on record, and $0.2 billion of pension risk transfer sales. 1See definition of non-GAAP measures below


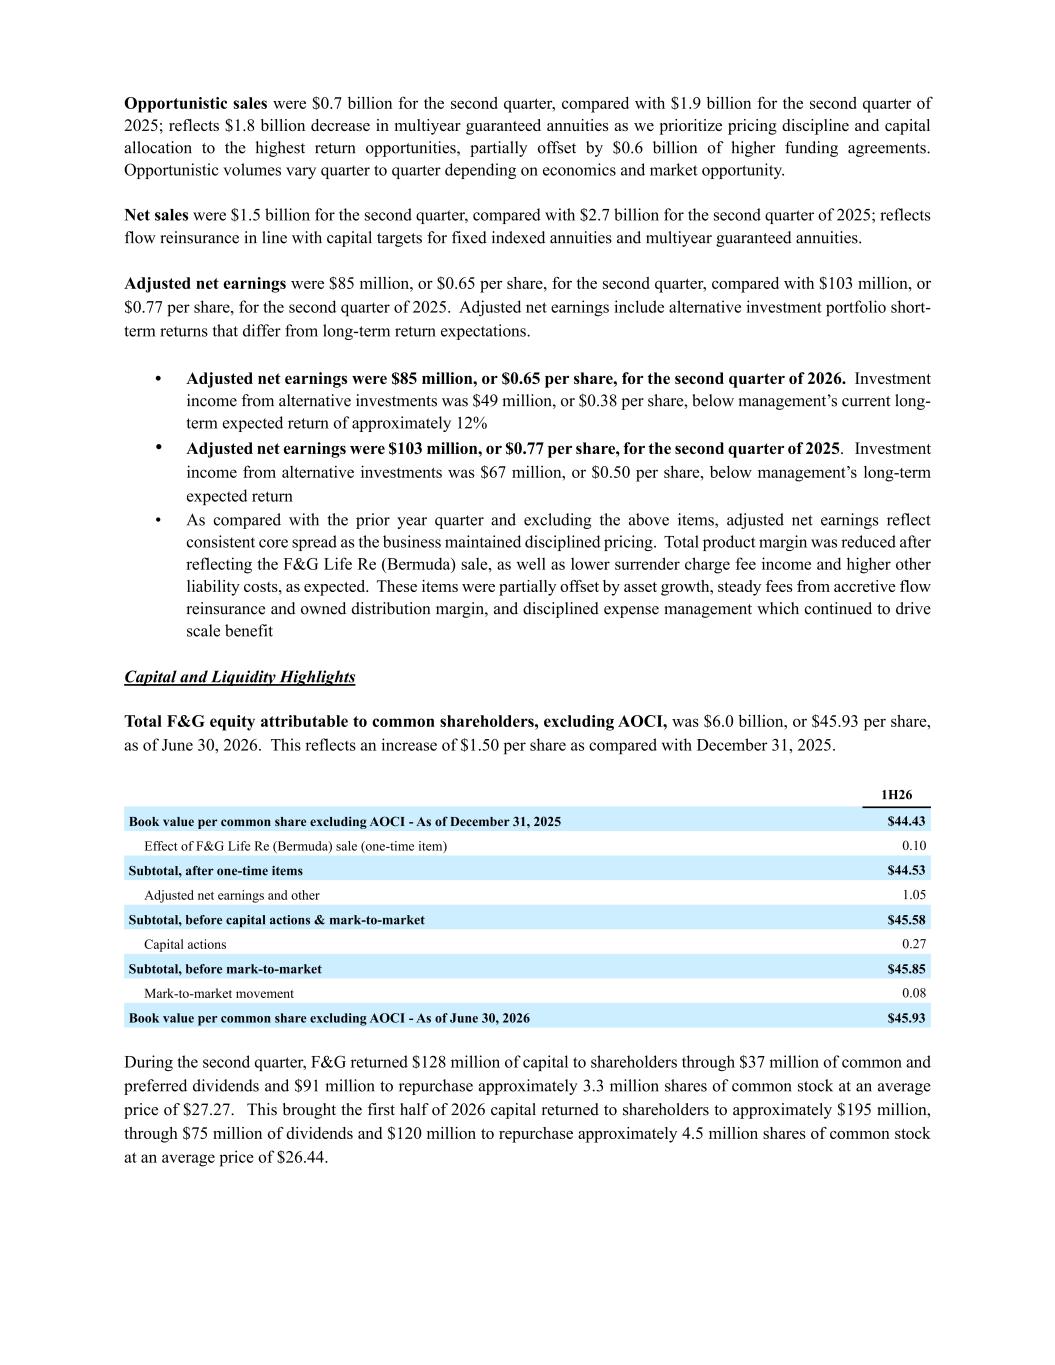
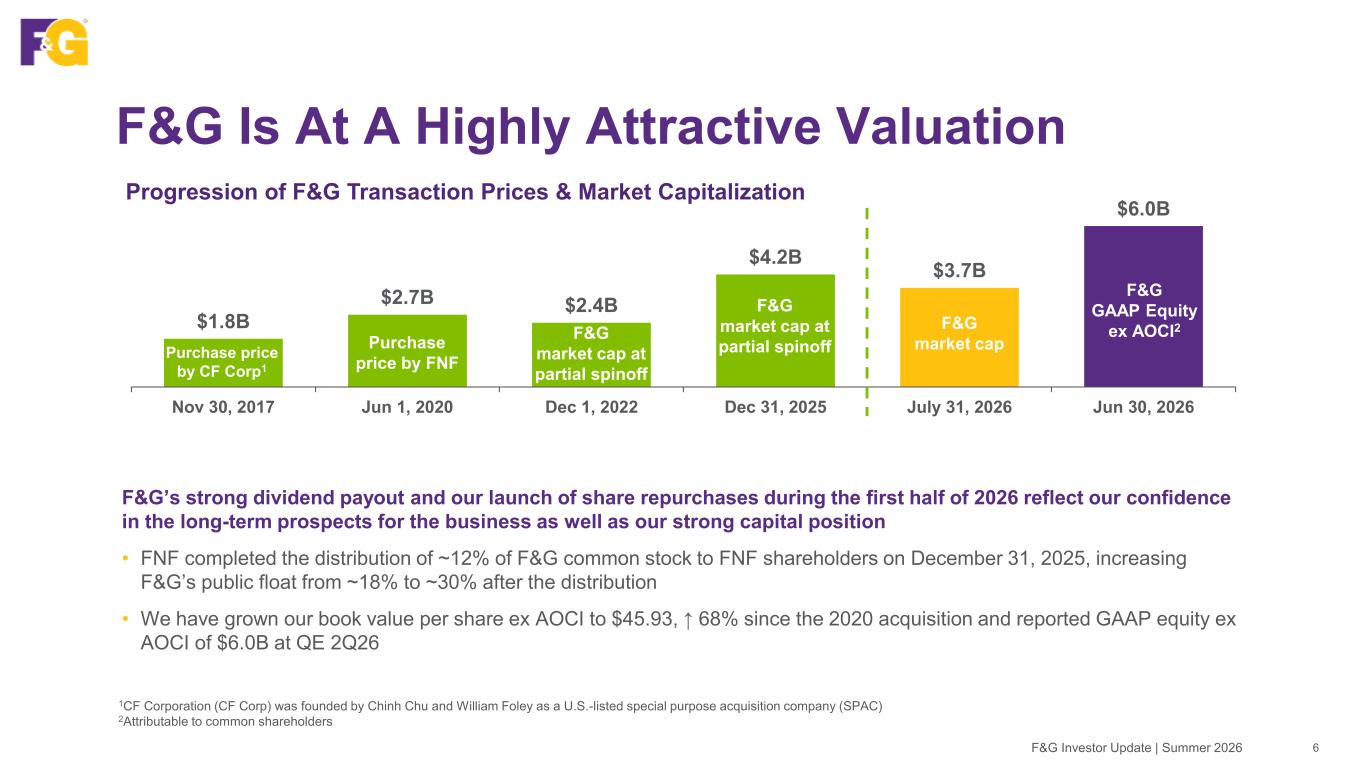
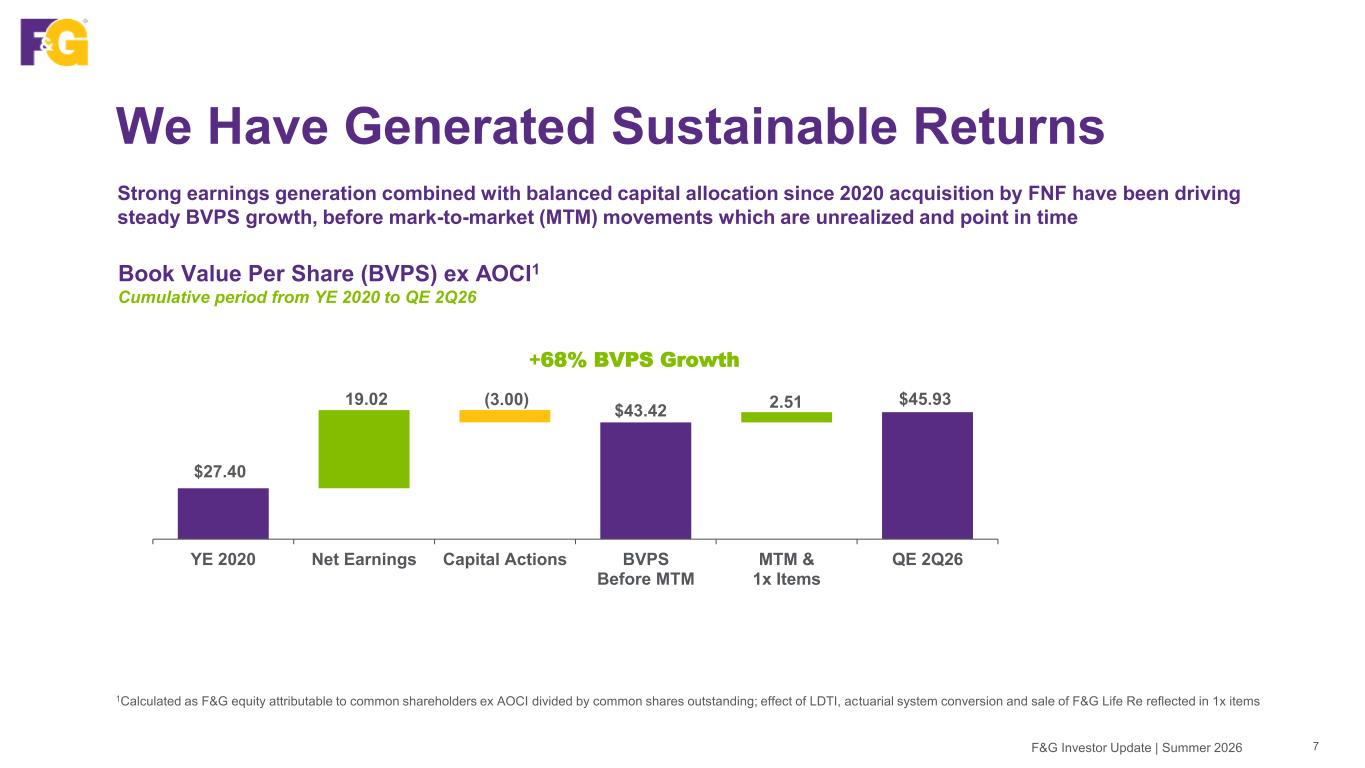
Opportunistic sales were $0.7 billion for the second quarter, compared with $1.9 billion for the second quarter of 2025; reflects $1.8 billion decrease in multiyear guaranteed annuities as we prioritize pricing discipline and capital allocation to the highest return opportunities, partially offset by $0.6 billion of higher funding agreements. Opportunistic volumes vary quarter to quarter depending on economics and market opportunity. Net sales were $1.5 billion for the second quarter, compared with $2.7 billion for the second quarter of 2025; reflects flow reinsurance in line with capital targets for fixed indexed annuities and multiyear guaranteed annuities. Adjusted net earnings were $85 million, or $0.65 per share, for the second quarter, compared with $103 million, or $0.77 per share, for the second quarter of 2025. Adjusted net earnings include alternative investment portfolio short- term returns that differ from long-term return expectations. • Adjusted net earnings were $85 million, or $0.65 per share, for the second quarter of 2026. Investment income from alternative investments was $49 million, or $0.38 per share, below management’s current long- term expected return of approximately 12% • Adjusted net earnings were $103 million, or $0.77 per share, for the second quarter of 2025. Investment income from alternative investments was $67 million, or $0.50 per share, below management’s long-term expected return • As compared with the prior year quarter and excluding the above items, adjusted net earnings reflect consistent core spread as the business maintained disciplined pricing. Total product margin was reduced after reflecting the F&G Life Re (Bermuda) sale, as well as lower surrender charge fee income and higher other liability costs, as expected. These items were partially offset by asset growth, steady fees from accretive flow reinsurance and owned distribution margin, and disciplined expense management which continued to drive scale benefit Capital and Liquidity Highlights Total F&G equity attributable to common shareholders, excluding AOCI, was $6.0 billion, or $45.93 per share, as of June 30, 2026. This reflects an increase of $1.50 per share as compared with December 31, 2025. 1H26 Book value per common share excluding AOCI - As of December 31, 2025 $44.43 Effect of F&G Life Re (Bermuda) sale (one-time item) 0.10 Subtotal, after one-time items $44.53 Adjusted net earnings and other 1.05 Subtotal, before capital actions & mark-to-market $45.58 Capital actions 0.27 Subtotal, before mark-to-market $45.85 Mark-to-market movement 0.08 Book value per common share excluding AOCI - As of June 30, 2026 $45.93 During the second quarter, F&G returned $128 million of capital to shareholders through $37 million of common and preferred dividends and $91 million to repurchase approximately 3.3 million shares of common stock at an average price of $27.27. This brought the first half of 2026 capital returned to shareholders to approximately $195 million, through $75 million of dividends and $120 million to repurchase approximately 4.5 million shares of common stock at an average price of $26.44.


Earnings Conference Call Members of F&G’s senior management team will host a conference call with the investment community to discuss F&G’s second quarter 2026 results on Thursday, August 6, 2026, beginning at 9:00 a.m. Eastern Time. The conference call will be broadcast live over F&G’s Investor Relations website at investors.fglife.com. A replay will also be available at the same location. About F&G F&G is committed to helping Americans turn their aspirations into reality. F&G is a leading provider of insurance solutions serving retail annuity and life customers and institutional clients and is headquartered in Des Moines, Iowa. For more information, please visit fglife.com. Use of Non-GAAP Financial Information Generally Accepted Accounting Principles (GAAP) is the term used to refer to the standard framework of guidelines for financial accounting. GAAP includes the standards, conventions, and rules accountants follow in recording and summarizing transactions and in the preparation of financial statements. In addition to reporting financial results in accordance with GAAP, this presentation includes non-GAAP financial measures, which the Company believes are useful to help investors better understand its financial performance, competitive position and prospects for the future. Management believes these non-GAAP financial measures may be useful in certain instances to provide additional meaningful comparisons between current results and results in prior operating periods. Our non-GAAP financial measures may not be comparable to similarly titled measures of other organizations because other organizations may not calculate such non-GAAP measures in the same manner as we do. The presentation of this financial information is not intended to be considered in isolation of or as a substitute for, or superior to, the financial information prepared and presented in accordance with GAAP. By disclosing these non-GAAP financial measures, the Company believes it offers investors a greater understanding of, and an enhanced level of transparency into, the means by which the Company’s management operates the Company. Any non-GAAP measures should be considered in context with the GAAP financial presentation and should not be considered in isolation or as a substitute for GAAP net earnings, net earnings attributable to common shareholders, or any other measures derived in accordance with GAAP as measures of operating performance or liquidity. Reconciliations of these non-GAAP financial measures to the most directly comparable GAAP measures are provided within. Forward-Looking Statements and Risk Factors This press release contains forward-looking statements that are subject to known and unknown risks and uncertainties, many of which are beyond our control. Some of the forward-looking statements can be identified by the use of terms such as “believes”, “expects”, “may”, “will”, “could”, “seeks”, “intends”, “plans”, “estimates”, “anticipates” or other comparable terms. Statements that are not historical facts, including statements regarding our expectations, hopes, intentions or strategies regarding the future are forward-looking statements. Forward-looking statements are based on management's beliefs, as well as assumptions made by, and information currently available to, management. Because such statements are based on expectations as to future financial and operating results and are not statements of fact, actual results may differ materially from those projected. We undertake no obligation to update any forward-looking statements, whether as a result of new information, future events or otherwise. The risks and uncertainties which forward-looking statements are subject to include, but are not limited to: general economic conditions and other factors, including prevailing interest and unemployment rate levels and stock and credit market performance; consumer spending; government spending; the volatility and strength of the capital markets; investor and consumer confidence; foreign currency exchange rates; commodity prices; inflation levels; changes in trade policy; tariffs and trade sanctions on goods; trade wars; supply chain disruptions; natural disasters, public health crises, international tensions and conflicts, geopolitical events, terrorist acts, labor strikes, political crisis, accidents and other events; concentration in certain states for distribution of our products; the impact of interest rate fluctuations; equity market volatility or disruption; the impact of credit risk of our counterparties; changes in our assumptions and estimates regarding amortization of our deferred acquisition costs, deferred sales inducements and value of business acquired balances; regulatory changes or actions, including those relating to regulation of financial services affecting (among other things) underwriting of insurance products and regulation of the sale, underwriting and pricing of products and minimum capitalization and statutory reserve requirements for insurance companies, or the ability of our insurance


subsidiaries to make cash distributions to us; and other factors discussed in “Risk Factors” and other sections of F&G's Form 10-K and other filings with the Securities and Exchange Commission (SEC). SOURCE: F&G Annuities & Life, Inc. CONTACT: Lisa Foxworthy-Parker SVP of Investor & External Relations Investor.relations@fglife.com 515.330.3307


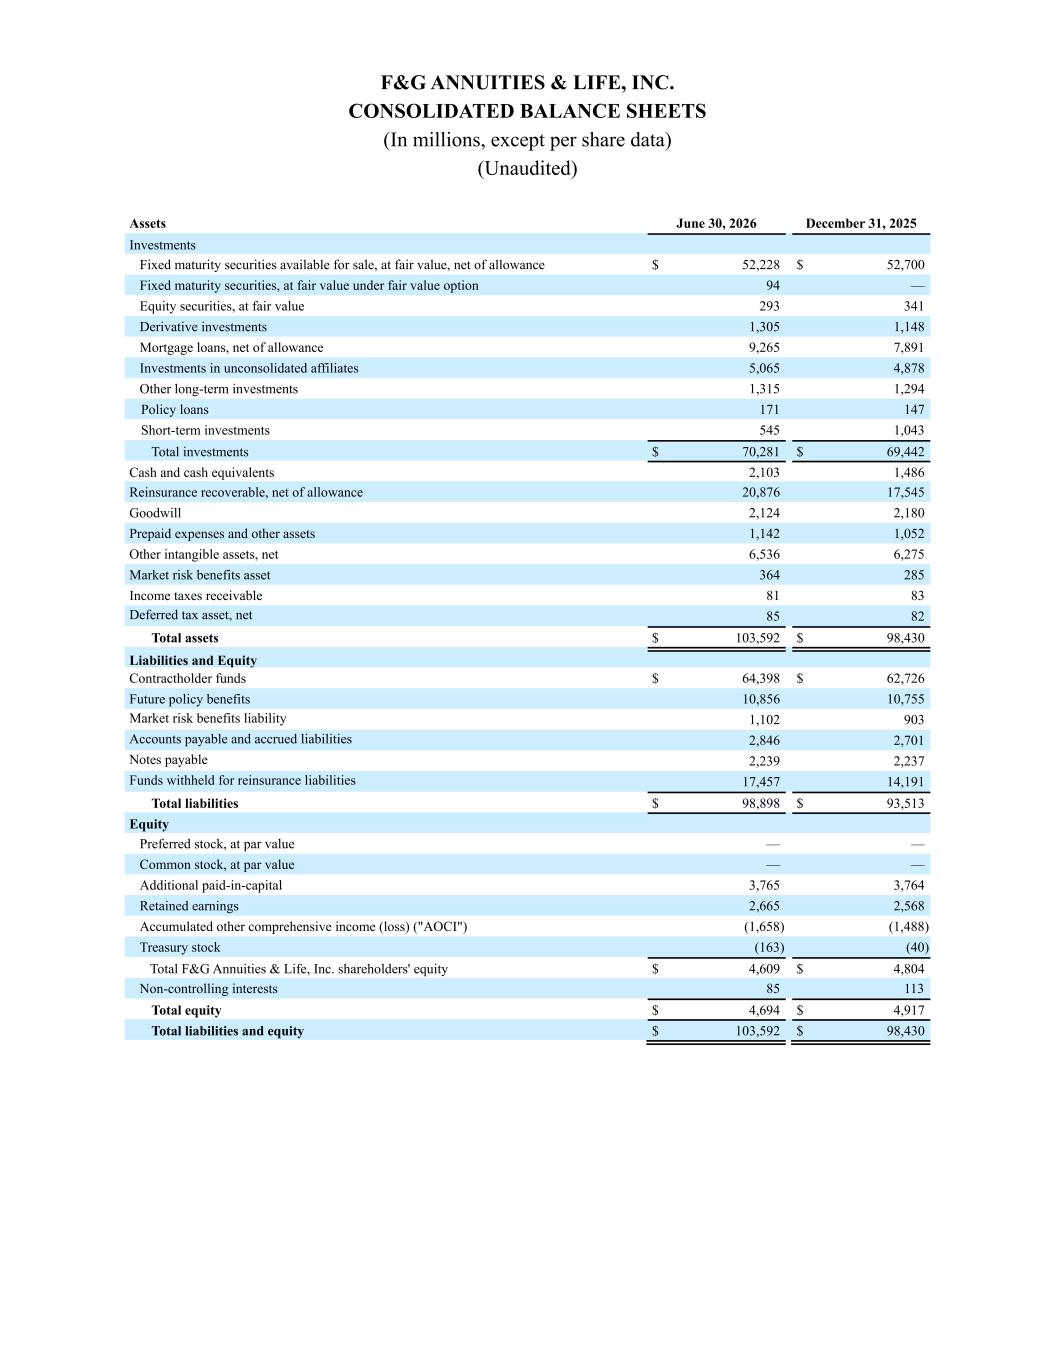
F&G ANNUITIES & LIFE, INC. CONSOLIDATED BALANCE SHEETS (In millions, except per share data) (Unaudited) Assets June 30, 2026 December 31, 2025 Investments Fixed maturity securities available for sale, at fair value, net of allowance $ 52,228 $ 52,700 Fixed maturity securities, at fair value under fair value option 94 — Equity securities, at fair value 293 341 Derivative investments 1,305 1,148 Mortgage loans, net of allowance 9,265 7,891 Investments in unconsolidated affiliates 5,065 4,878 Other long-term investments 1,315 1,294 Policy loans 171 147 Short-term investments 545 1,043 Total investments $ 70,281 $ 69,442 Cash and cash equivalents 2,103 1,486 Reinsurance recoverable, net of allowance 20,876 17,545 Goodwill 2,124 2,180 Prepaid expenses and other assets 1,142 1,052 Other intangible assets, net 6,536 6,275 Market risk benefits asset 364 285 Income taxes receivable 81 83 Deferred tax asset, net 85 82 Total assets $ 103,592 $ 98,430 Liabilities and Equity Contractholder funds $ 64,398 $ 62,726 Future policy benefits 10,856 10,755 Market risk benefits liability 1,102 903 Accounts payable and accrued liabilities 2,846 2,701 Notes payable 2,239 2,237 Funds withheld for reinsurance liabilities 17,457 14,191 Total liabilities $ 98,898 $ 93,513 Equity Preferred stock, at par value — — Common stock, at par value — — Additional paid-in-capital 3,765 3,764 Retained earnings 2,665 2,568 Accumulated other comprehensive income (loss) ("AOCI") (1,658) (1,488) Treasury stock (163) (40) Total F&G Annuities & Life, Inc. shareholders' equity $ 4,609 $ 4,804 Non-controlling interests 85 113 Total equity $ 4,694 $ 4,917 Total liabilities and equity $ 103,592 $ 98,430


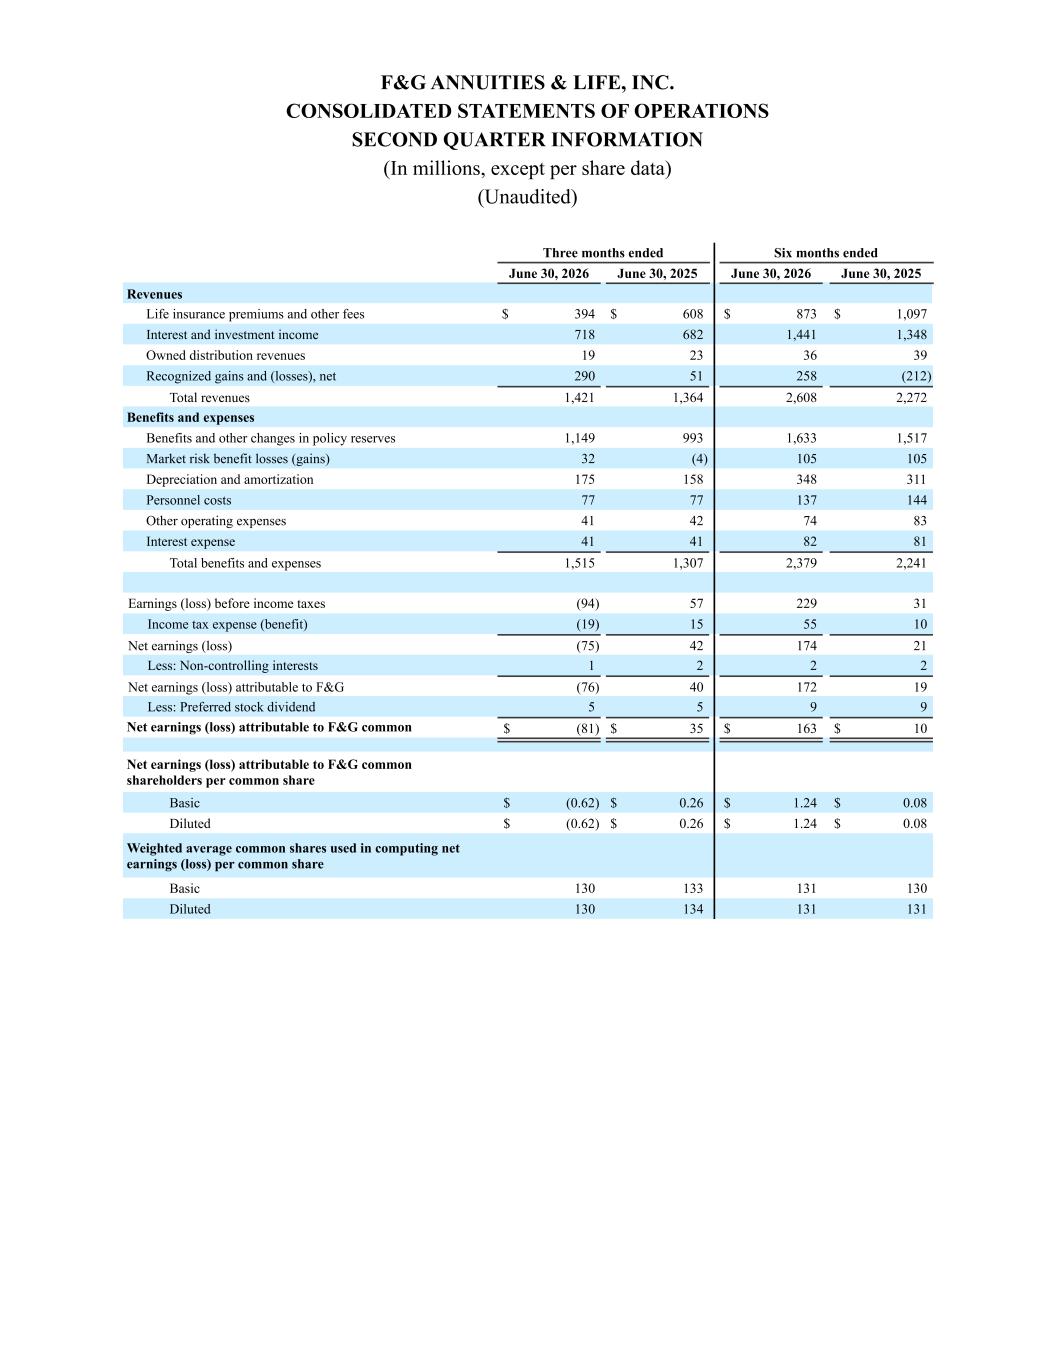
F&G ANNUITIES & LIFE, INC. CONSOLIDATED STATEMENTS OF OPERATIONS SECOND QUARTER INFORMATION (In millions, except per share data) (Unaudited) Three months ended Six months ended June 30, 2026 June 30, 2025 June 30, 2026 June 30, 2025 Revenues Life insurance premiums and other fees $ 394 $ 608 $ 873 $ 1,097 Interest and investment income 718 682 1,441 1,348 Owned distribution revenues 19 23 36 39 Recognized gains and (losses), net 290 51 258 (212) Total revenues 1,421 1,364 2,608 2,272 Benefits and expenses Benefits and other changes in policy reserves 1,149 993 1,633 1,517 Market risk benefit losses (gains) 32 (4) 105 105 Depreciation and amortization 175 158 348 311 Personnel costs 77 77 137 144 Other operating expenses 41 42 74 83 Interest expense 41 41 82 81 Total benefits and expenses 1,515 1,307 2,379 2,241 Earnings (loss) before income taxes (94) 57 229 31 Income tax expense (benefit) (19) 15 55 10 Net earnings (loss) (75) 42 174 21 Less: Non-controlling interests 1 2 2 2 Net earnings (loss) attributable to F&G (76) 40 172 19 Less: Preferred stock dividend 5 5 9 9 Net earnings (loss) attributable to F&G common shareholders $ (81) $ 35 $ 163 $ 10 Net earnings (loss) attributable to F&G common shareholders per common share Basic $ (0.62) $ 0.26 $ 1.24 $ 0.08 Diluted $ (0.62) $ 0.26 $ 1.24 $ 0.08 Weighted average common shares used in computing net earnings (loss) per common share Basic 130 133 131 130 Diluted 130 134 131 131


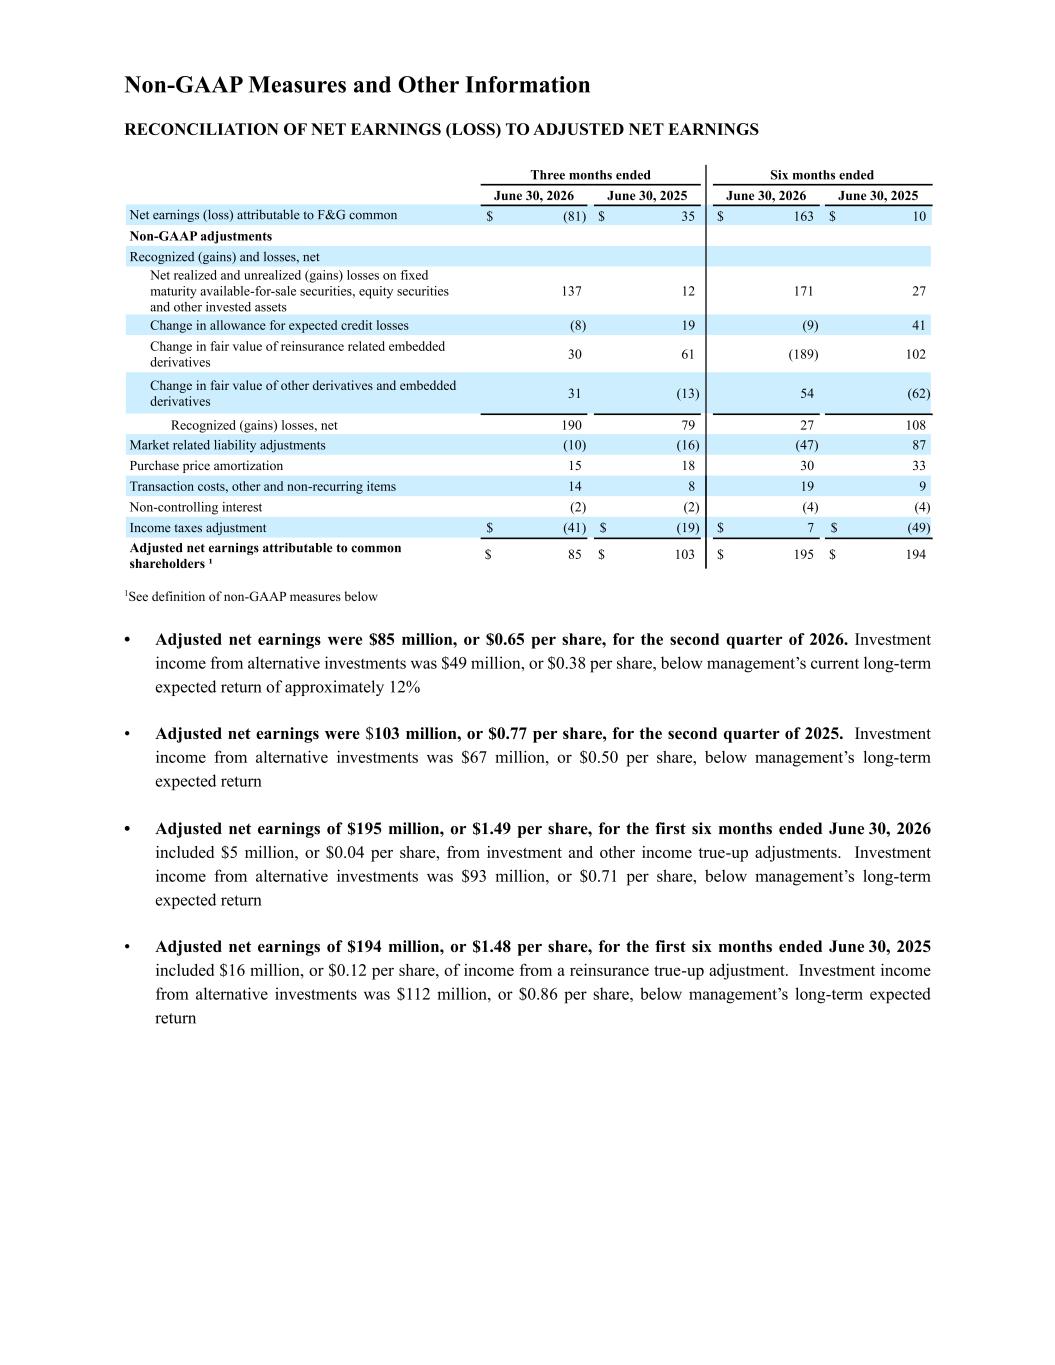
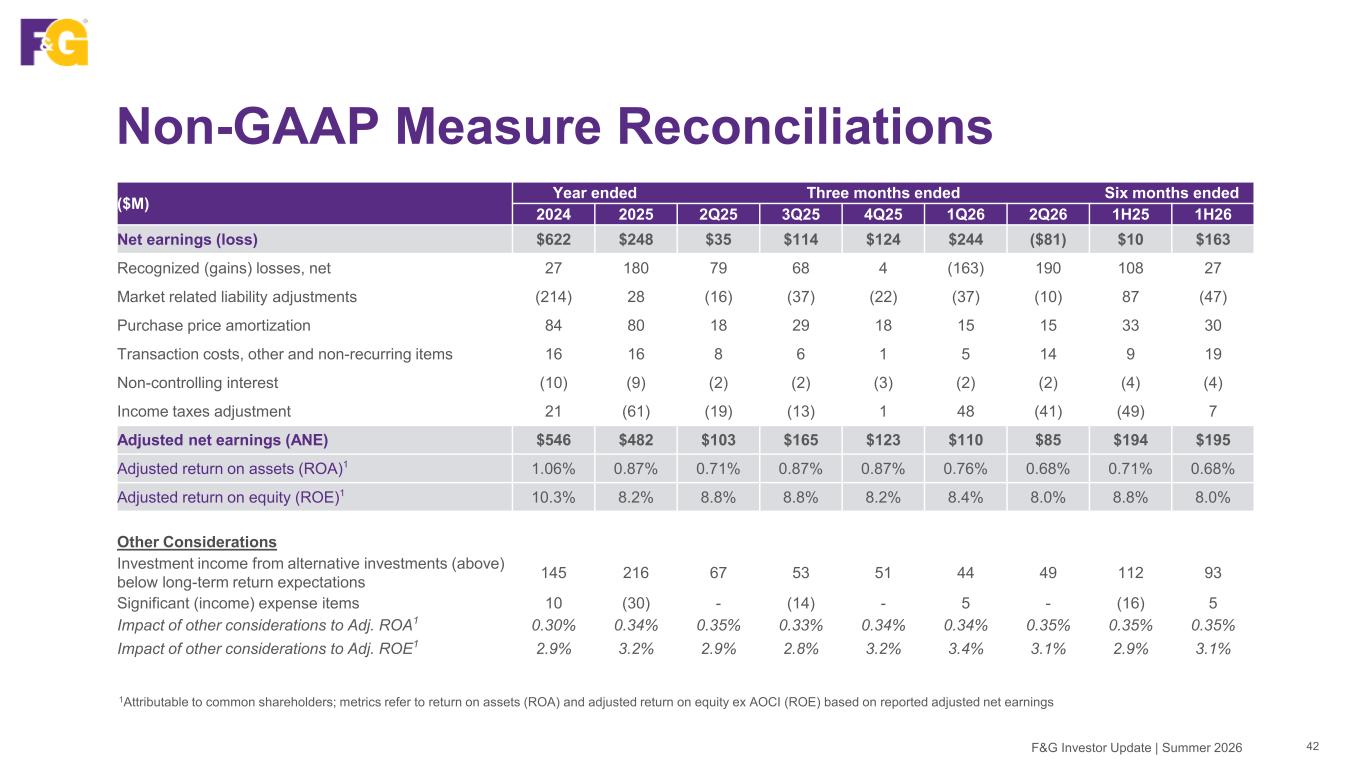
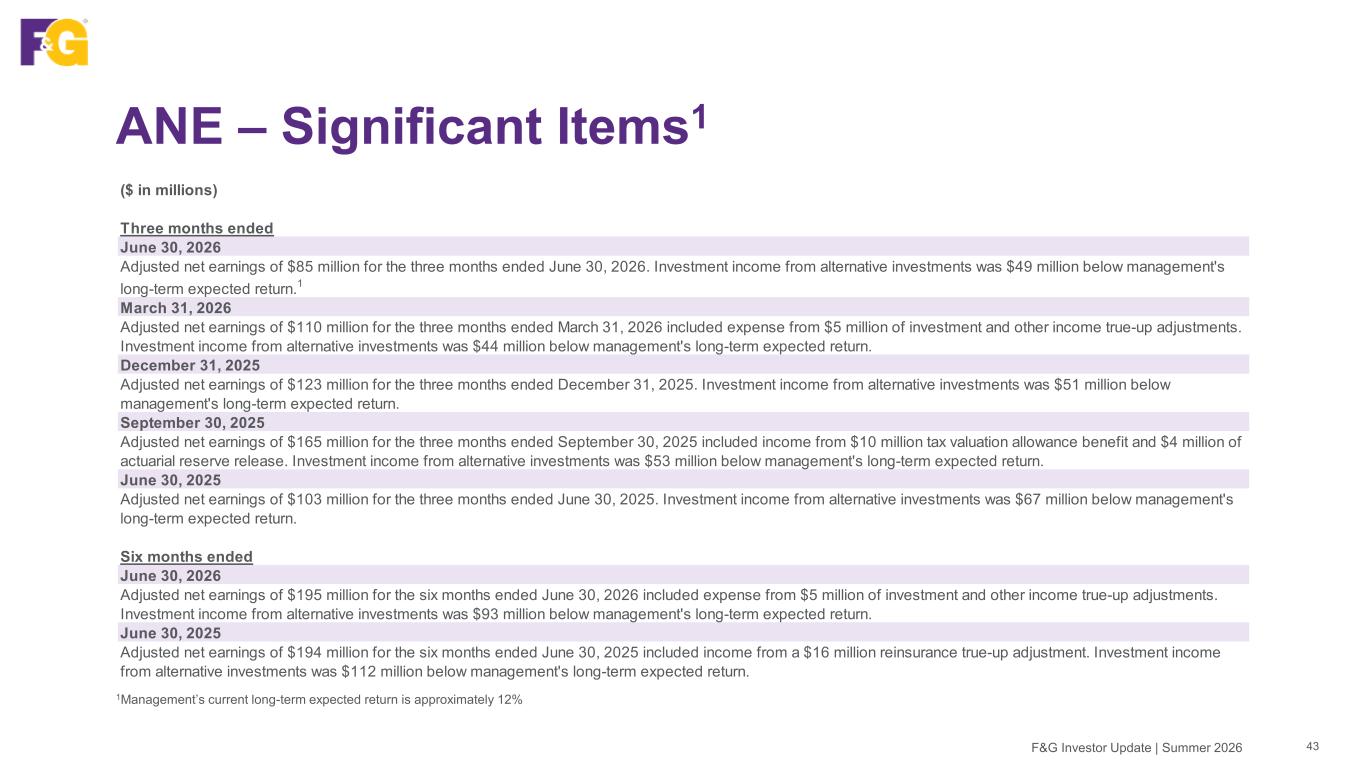
Non-GAAP Measures and Other Information RECONCILIATION OF NET EARNINGS (LOSS) TO ADJUSTED NET EARNINGS Three months ended Six months ended June 30, 2026 June 30, 2025 June 30, 2026 June 30, 2025 Net earnings (loss) attributable to F&G common shareholders $ (81) $ 35 $ 163 $ 10 Non-GAAP adjustments Recognized (gains) and losses, net Net realized and unrealized (gains) losses on fixed maturity available-for-sale securities, equity securities and other invested assets 137 12 171 27 Change in allowance for expected credit losses (8) 19 (9) 41 Change in fair value of reinsurance related embedded derivatives 30 61 (189) 102 Change in fair value of other derivatives and embedded derivatives 31 (13) 54 (62) Recognized (gains) losses, net 190 79 27 108 Market related liability adjustments (10) (16) (47) 87 Purchase price amortization 15 18 30 33 Transaction costs, other and non-recurring items 14 8 19 9 Non-controlling interest (2) (2) (4) (4) Income taxes adjustment $ (41) $ (19) $ 7 $ (49) Adjusted net earnings attributable to common shareholders ¹ $ 85 $ 103 $ 195 $ 194 1See definition of non-GAAP measures below • Adjusted net earnings were $85 million, or $0.65 per share, for the second quarter of 2026. Investment income from alternative investments was $49 million, or $0.38 per share, below management’s current long-term expected return of approximately 12% • Adjusted net earnings were $103 million, or $0.77 per share, for the second quarter of 2025. Investment income from alternative investments was $67 million, or $0.50 per share, below management’s long-term expected return • Adjusted net earnings of $195 million, or $1.49 per share, for the first six months ended June 30, 2026 included $5 million, or $0.04 per share, from investment and other income true-up adjustments. Investment income from alternative investments was $93 million, or $0.71 per share, below management’s long-term expected return • Adjusted net earnings of $194 million, or $1.48 per share, for the first six months ended June 30, 2025 included $16 million, or $0.12 per share, of income from a reinsurance true-up adjustment. Investment income from alternative investments was $112 million, or $0.86 per share, below management’s long-term expected return


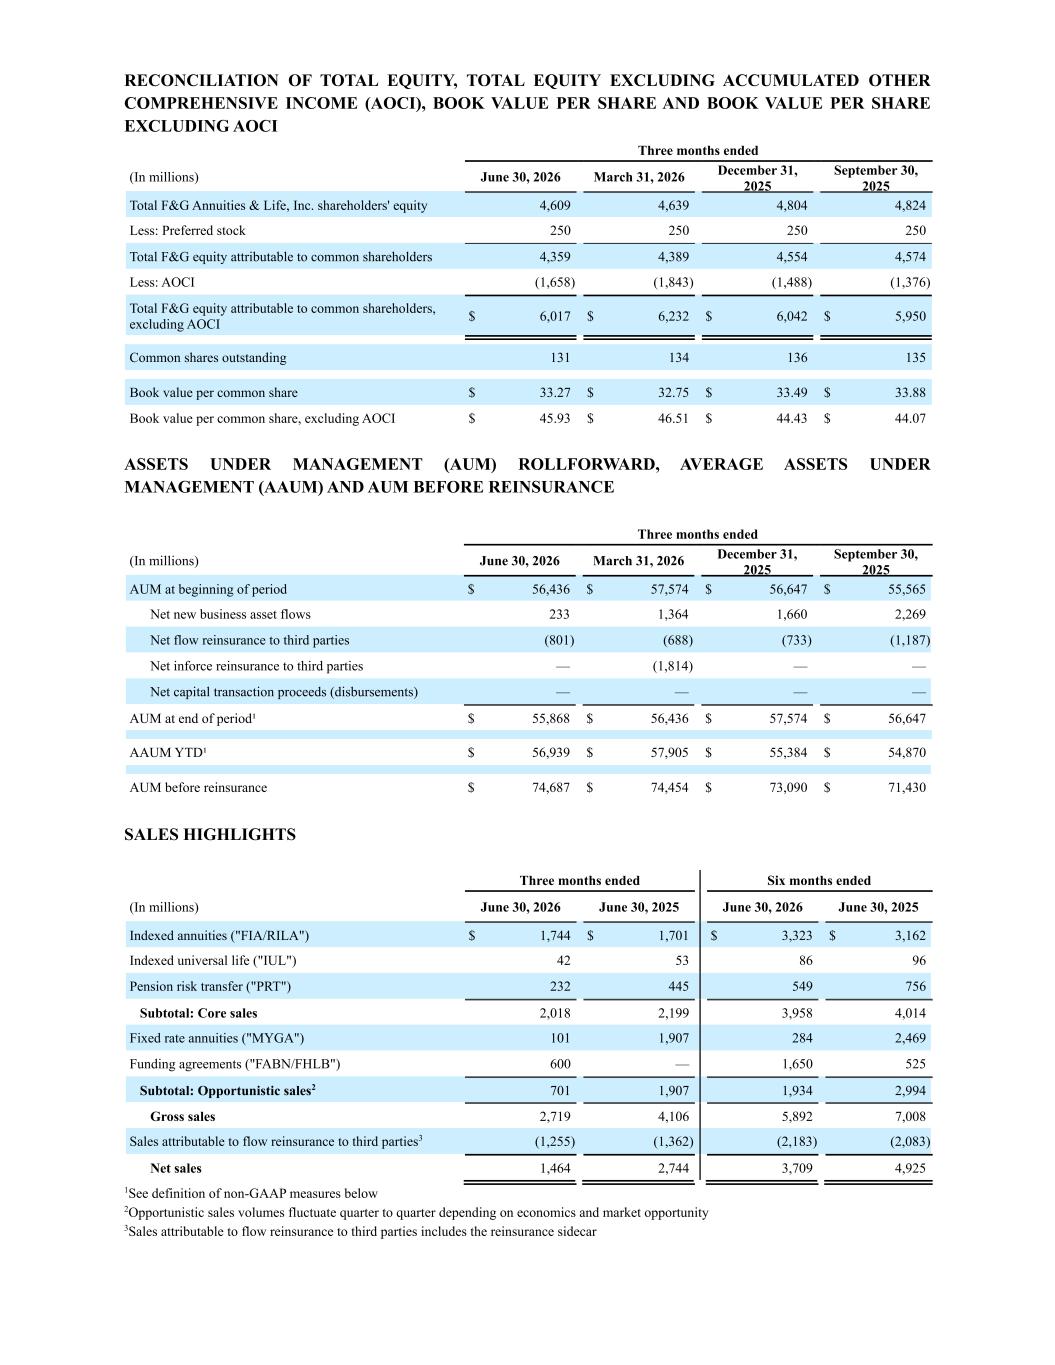
RECONCILIATION OF TOTAL EQUITY, TOTAL EQUITY EXCLUDING ACCUMULATED OTHER COMPREHENSIVE INCOME (AOCI), BOOK VALUE PER SHARE AND BOOK VALUE PER SHARE EXCLUDING AOCI Three months ended (In millions) June 30, 2026 March 31, 2026 December 31, 2025 September 30, 2025 Total F&G Annuities & Life, Inc. shareholders' equity 4,609 4,639 4,804 4,824 Less: Preferred stock 250 250 250 250 Total F&G equity attributable to common shareholders 4,359 4,389 4,554 4,574 Less: AOCI (1,658) (1,843) (1,488) (1,376) Total F&G equity attributable to common shareholders, excluding AOCI $ 6,017 $ 6,232 $ 6,042 $ 5,950 Common shares outstanding 131 134 136 135 Book value per common share $ 33.27 $ 32.75 $ 33.49 $ 33.88 Book value per common share, excluding AOCI $ 45.93 $ 46.51 $ 44.43 $ 44.07 ASSETS UNDER MANAGEMENT (AUM) ROLLFORWARD, AVERAGE ASSETS UNDER MANAGEMENT (AAUM) AND AUM BEFORE REINSURANCE Three months ended (In millions) June 30, 2026 March 31, 2026 December 31, 2025 September 30, 2025 AUM at beginning of period $ 56,436 $ 57,574 $ 56,647 $ 55,565 Net new business asset flows 233 1,364 1,660 2,269 Net flow reinsurance to third parties (801) (688) (733) (1,187) Net inforce reinsurance to third parties — (1,814) — — Net capital transaction proceeds (disbursements) — — — — AUM at end of period¹ $ 55,868 $ 56,436 $ 57,574 $ 56,647 AAUM YTD¹ $ 56,939 $ 57,905 $ 55,384 $ 54,870 AUM before reinsurance $ 74,687 $ 74,454 $ 73,090 $ 71,430 SALES HIGHLIGHTS Three months ended Six months ended (In millions) June 30, 2026 June 30, 2025 June 30, 2026 June 30, 2025 Indexed annuities ("FIA/RILA") $ 1,744 $ 1,701 $ 3,323 $ 3,162 Indexed universal life ("IUL") 42 53 86 96 Pension risk transfer ("PRT") 232 445 549 756 Subtotal: Core sales 2,018 2,199 3,958 4,014 Fixed rate annuities ("MYGA") 101 1,907 284 2,469 Funding agreements ("FABN/FHLB") 600 — 1,650 525 Subtotal: Opportunistic sales2 701 1,907 1,934 2,994 Gross sales 2,719 4,106 5,892 7,008 Sales attributable to flow reinsurance to third parties3 (1,255) (1,362) (2,183) (2,083) Net sales 1,464 2,744 3,709 4,925 1See definition of non-GAAP measures below 2Opportunistic sales volumes fluctuate quarter to quarter depending on economics and market opportunity 3Sales attributable to flow reinsurance to third parties includes the reinsurance sidecar


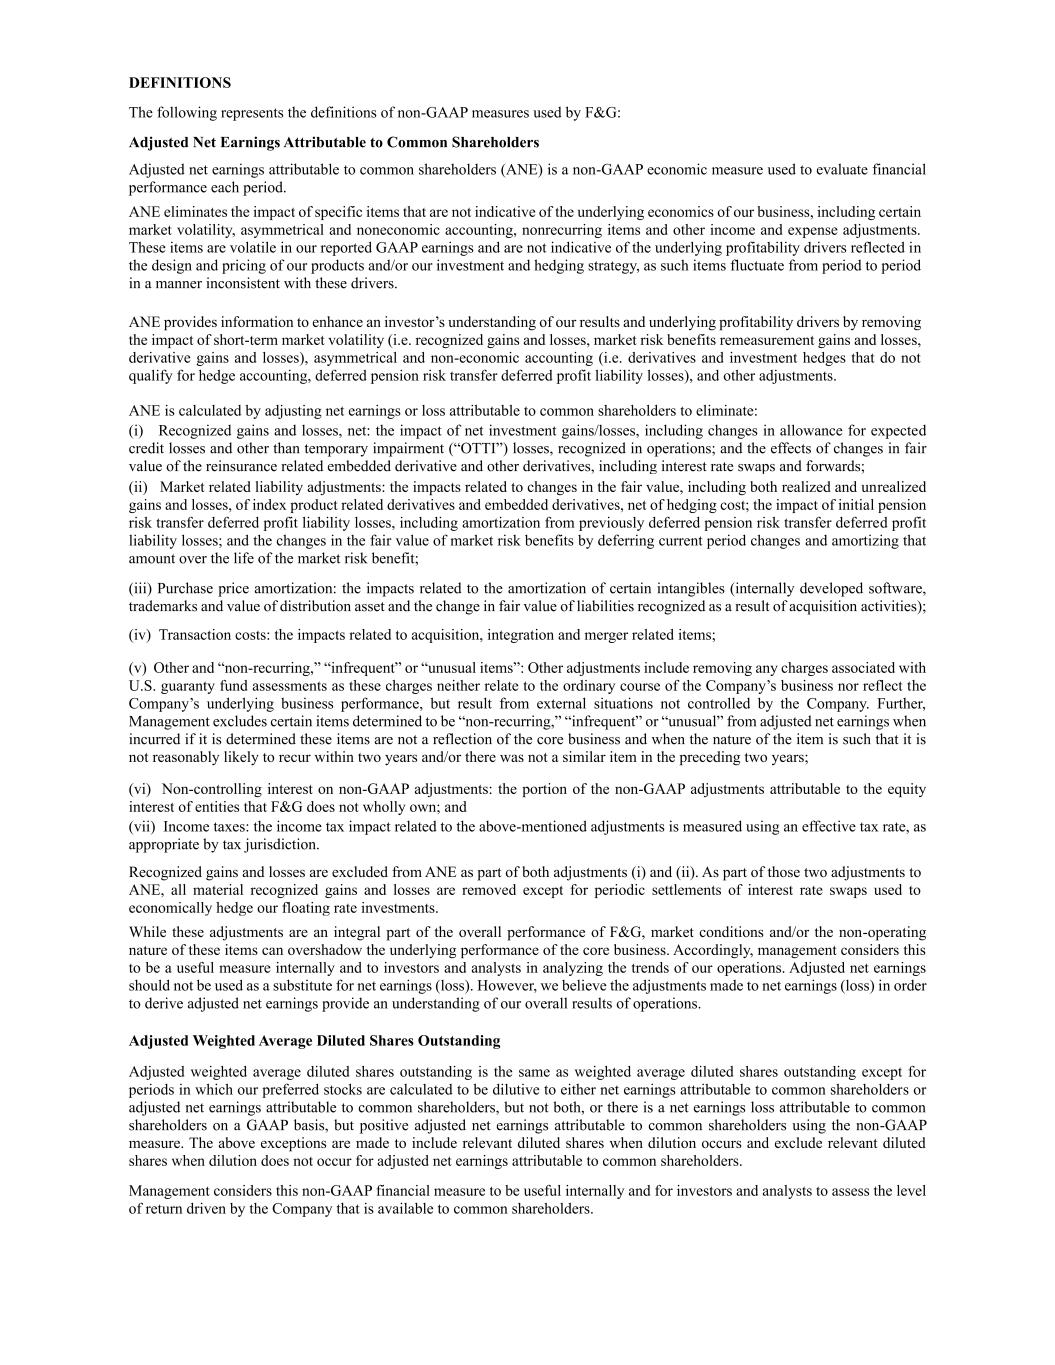
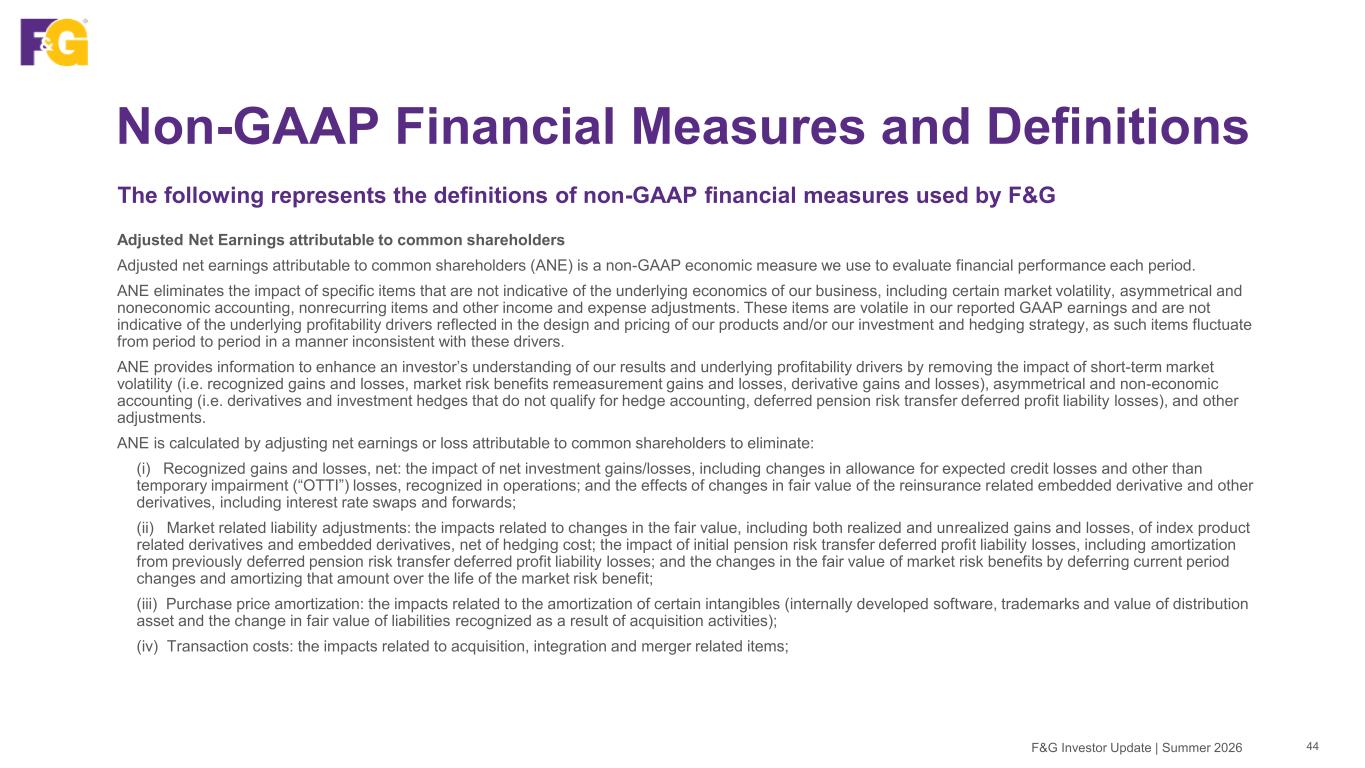
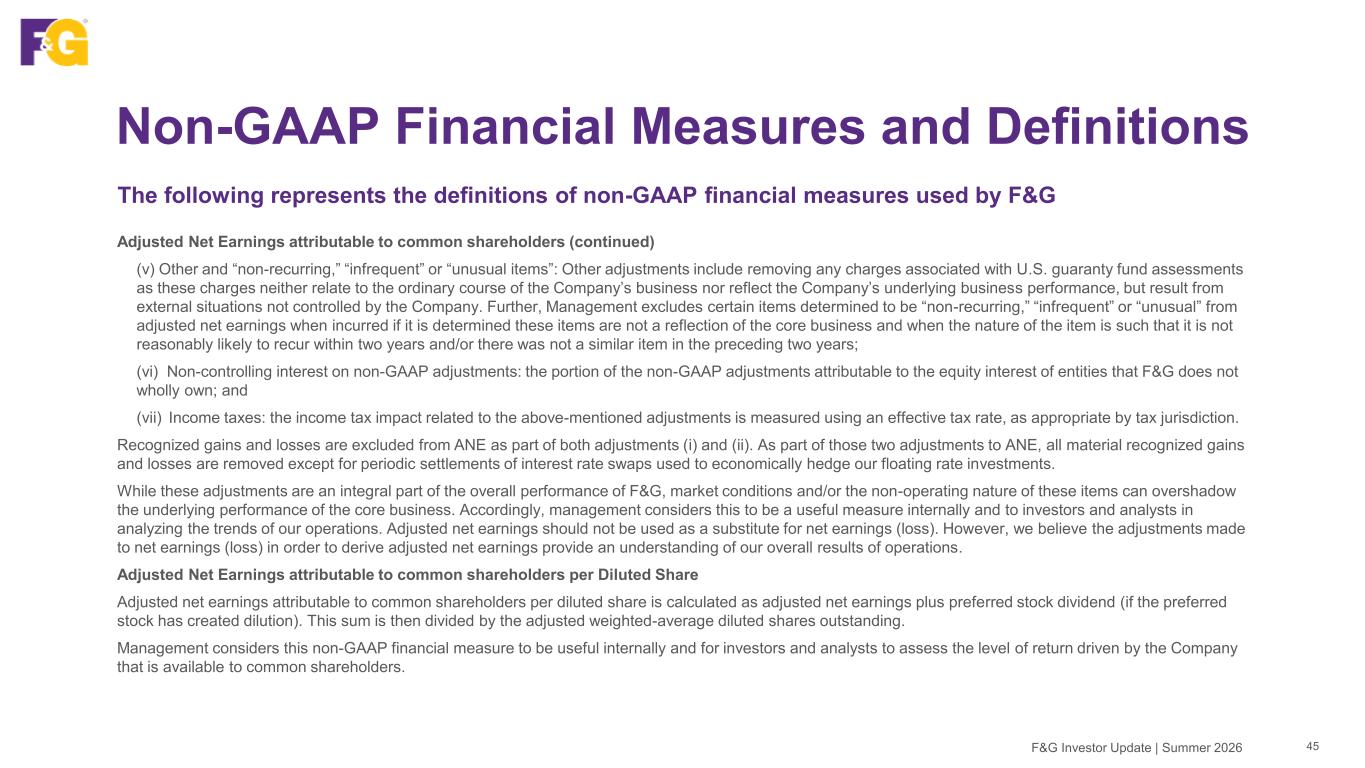
DEFINITIONS The following represents the definitions of non-GAAP measures used by F&G: Adjusted Net Earnings Attributable to Common Shareholders Adjusted net earnings attributable to common shareholders (ANE) is a non-GAAP economic measure used to evaluate financial performance each period. ANE eliminates the impact of specific items that are not indicative of the underlying economics of our business, including certain market volatility, asymmetrical and noneconomic accounting, nonrecurring items and other income and expense adjustments. These items are volatile in our reported GAAP earnings and are not indicative of the underlying profitability drivers reflected in the design and pricing of our products and/or our investment and hedging strategy, as such items fluctuate from period to period in a manner inconsistent with these drivers. ANE provides information to enhance an investor’s understanding of our results and underlying profitability drivers by removing the impact of short-term market volatility (i.e. recognized gains and losses, market risk benefits remeasurement gains and losses, derivative gains and losses), asymmetrical and non-economic accounting (i.e. derivatives and investment hedges that do not qualify for hedge accounting, deferred pension risk transfer deferred profit liability losses), and other adjustments. ANE is calculated by adjusting net earnings or loss attributable to common shareholders to eliminate: (i) Recognized gains and losses, net: the impact of net investment gains/losses, including changes in allowance for expected credit losses and other than temporary impairment (“OTTI”) losses, recognized in operations; and the effects of changes in fair value of the reinsurance related embedded derivative and other derivatives, including interest rate swaps and forwards; (ii) Market related liability adjustments: the impacts related to changes in the fair value, including both realized and unrealized gains and losses, of index product related derivatives and embedded derivatives, net of hedging cost; the impact of initial pension risk transfer deferred profit liability losses, including amortization from previously deferred pension risk transfer deferred profit liability losses; and the changes in the fair value of market risk benefits by deferring current period changes and amortizing that amount over the life of the market risk benefit; (iii) Purchase price amortization: the impacts related to the amortization of certain intangibles (internally developed software, trademarks and value of distribution asset and the change in fair value of liabilities recognized as a result of acquisition activities); (iv) Transaction costs: the impacts related to acquisition, integration and merger related items; (v) Other and “non-recurring,” “infrequent” or “unusual items”: Other adjustments include removing any charges associated with U.S. guaranty fund assessments as these charges neither relate to the ordinary course of the Company’s business nor reflect the Company’s underlying business performance, but result from external situations not controlled by the Company. Further, Management excludes certain items determined to be “non-recurring,” “infrequent” or “unusual” from adjusted net earnings when incurred if it is determined these items are not a reflection of the core business and when the nature of the item is such that it is not reasonably likely to recur within two years and/or there was not a similar item in the preceding two years; (vi) Non-controlling interest on non-GAAP adjustments: the portion of the non-GAAP adjustments attributable to the equity interest of entities that F&G does not wholly own; and (vii) Income taxes: the income tax impact related to the above-mentioned adjustments is measured using an effective tax rate, as appropriate by tax jurisdiction. Recognized gains and losses are excluded from ANE as part of both adjustments (i) and (ii). As part of those two adjustments to ANE, all material recognized gains and losses are removed except for periodic settlements of interest rate swaps used to economically hedge our floating rate investments. While these adjustments are an integral part of the overall performance of F&G, market conditions and/or the non-operating nature of these items can overshadow the underlying performance of the core business. Accordingly, management considers this to be a useful measure internally and to investors and analysts in analyzing the trends of our operations. Adjusted net earnings should not be used as a substitute for net earnings (loss). However, we believe the adjustments made to net earnings (loss) in order to derive adjusted net earnings provide an understanding of our overall results of operations. Adjusted Weighted Average Diluted Shares Outstanding Adjusted weighted average diluted shares outstanding is the same as weighted average diluted shares outstanding except for periods in which our preferred stocks are calculated to be dilutive to either net earnings attributable to common shareholders or adjusted net earnings attributable to common shareholders, but not both, or there is a net earnings loss attributable to common shareholders on a GAAP basis, but positive adjusted net earnings attributable to common shareholders using the non-GAAP measure. The above exceptions are made to include relevant diluted shares when dilution occurs and exclude relevant diluted shares when dilution does not occur for adjusted net earnings attributable to common shareholders. Management considers this non-GAAP financial measure to be useful internally and for investors and analysts to assess the level of return driven by the Company that is available to common shareholders.


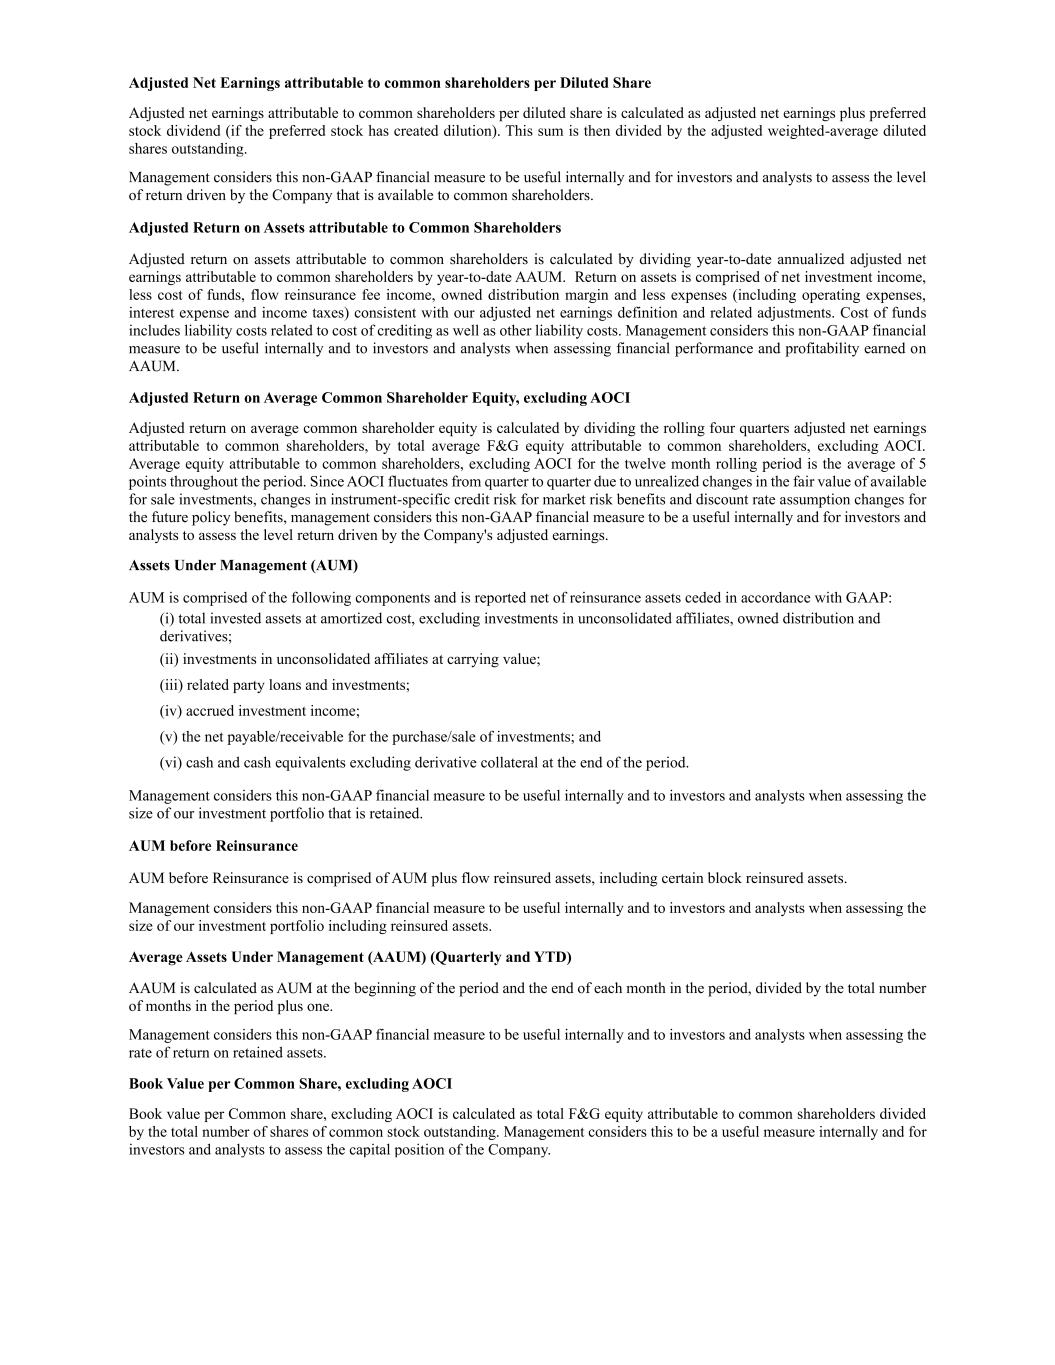
Adjusted Net Earnings attributable to common shareholders per Diluted Share Adjusted net earnings attributable to common shareholders per diluted share is calculated as adjusted net earnings plus preferred stock dividend (if the preferred stock has created dilution). This sum is then divided by the adjusted weighted-average diluted shares outstanding. Management considers this non-GAAP financial measure to be useful internally and for investors and analysts to assess the level of return driven by the Company that is available to common shareholders. Adjusted Return on Assets attributable to Common Shareholders Adjusted return on assets attributable to common shareholders is calculated by dividing year-to-date annualized adjusted net earnings attributable to common shareholders by year-to-date AAUM. Return on assets is comprised of net investment income, less cost of funds, flow reinsurance fee income, owned distribution margin and less expenses (including operating expenses, interest expense and income taxes) consistent with our adjusted net earnings definition and related adjustments. Cost of funds includes liability costs related to cost of crediting as well as other liability costs. Management considers this non-GAAP financial measure to be useful internally and to investors and analysts when assessing financial performance and profitability earned on AAUM. Adjusted Return on Average Common Shareholder Equity, excluding AOCI Adjusted return on average common shareholder equity is calculated by dividing the rolling four quarters adjusted net earnings attributable to common shareholders, by total average F&G equity attributable to common shareholders, excluding AOCI. Average equity attributable to common shareholders, excluding AOCI for the twelve month rolling period is the average of 5 points throughout the period. Since AOCI fluctuates from quarter to quarter due to unrealized changes in the fair value of available for sale investments, changes in instrument-specific credit risk for market risk benefits and discount rate assumption changes for the future policy benefits, management considers this non-GAAP financial measure to be a useful internally and for investors and analysts to assess the level return driven by the Company's adjusted earnings. Assets Under Management (AUM) AUM is comprised of the following components and is reported net of reinsurance assets ceded in accordance with GAAP: (i) total invested assets at amortized cost, excluding investments in unconsolidated affiliates, owned distribution and derivatives; (ii) investments in unconsolidated affiliates at carrying value; (iii) related party loans and investments; (iv) accrued investment income; (v) the net payable/receivable for the purchase/sale of investments; and (vi) cash and cash equivalents excluding derivative collateral at the end of the period. Management considers this non-GAAP financial measure to be useful internally and to investors and analysts when assessing the size of our investment portfolio that is retained. AUM before Reinsurance AUM before Reinsurance is comprised of AUM plus flow reinsured assets, including certain block reinsured assets. Management considers this non-GAAP financial measure to be useful internally and to investors and analysts when assessing the size of our investment portfolio including reinsured assets. Average Assets Under Management (AAUM) (Quarterly and YTD) AAUM is calculated as AUM at the beginning of the period and the end of each month in the period, divided by the total number of months in the period plus one. Management considers this non-GAAP financial measure to be useful internally and to investors and analysts when assessing the rate of return on retained assets. Book Value per Common Share, excluding AOCI Book value per Common share, excluding AOCI is calculated as total F&G equity attributable to common shareholders divided by the total number of shares of common stock outstanding. Management considers this to be a useful measure internally and for investors and analysts to assess the capital position of the Company.


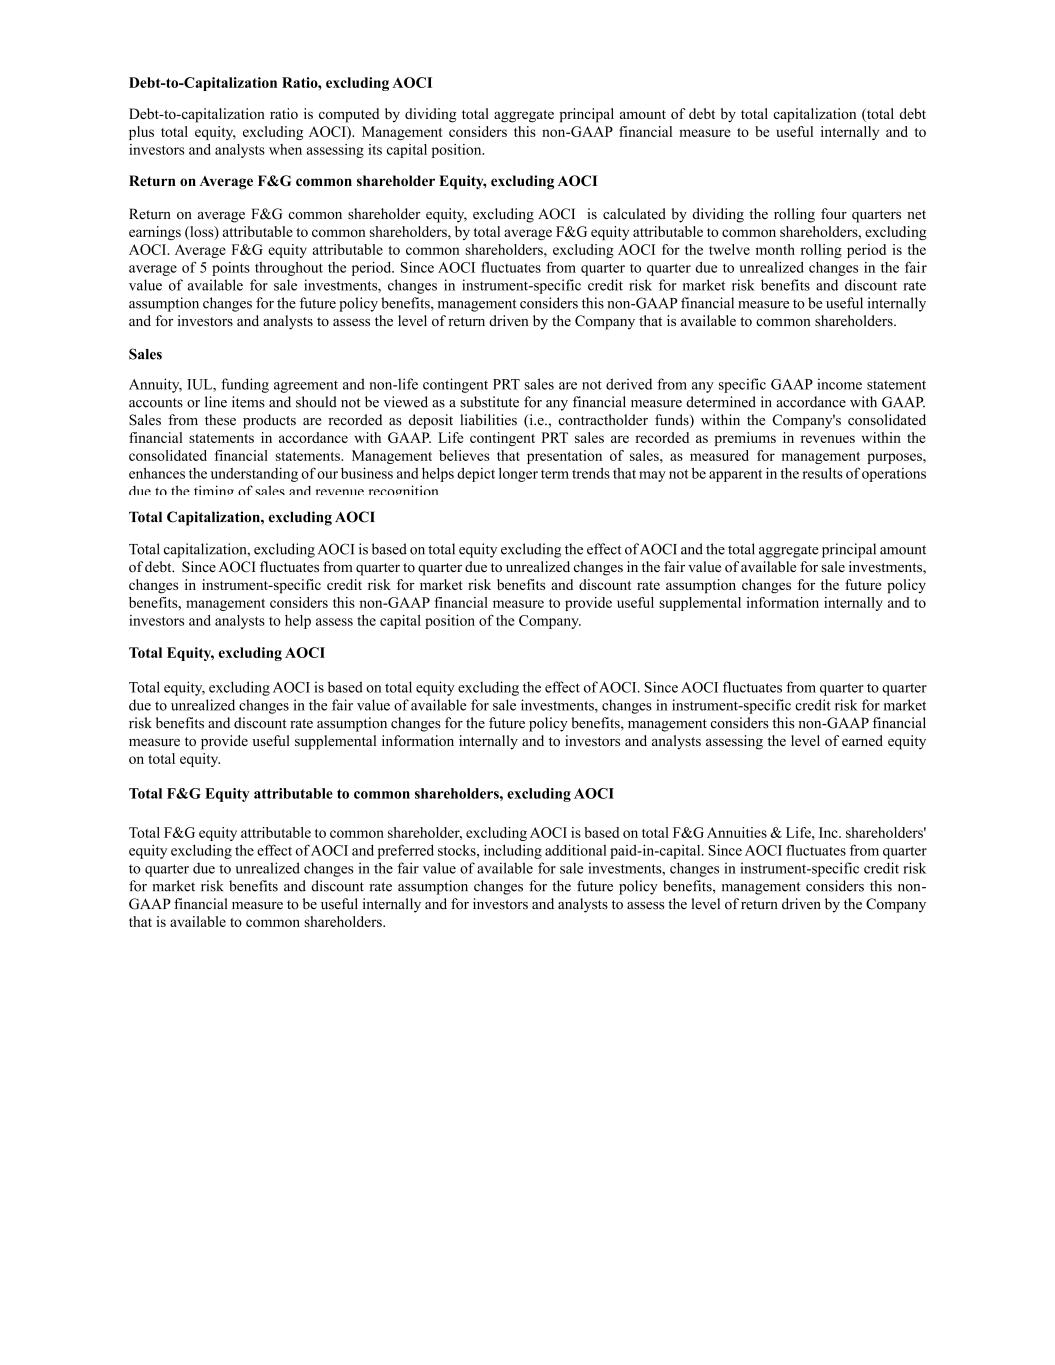
Debt-to-Capitalization Ratio, excluding AOCI Debt-to-capitalization ratio is computed by dividing total aggregate principal amount of debt by total capitalization (total debt plus total equity, excluding AOCI). Management considers this non-GAAP financial measure to be useful internally and to investors and analysts when assessing its capital position. Return on Average F&G common shareholder Equity, excluding AOCI Return on average F&G common shareholder equity, excluding AOCI is calculated by dividing the rolling four quarters net earnings (loss) attributable to common shareholders, by total average F&G equity attributable to common shareholders, excluding AOCI. Average F&G equity attributable to common shareholders, excluding AOCI for the twelve month rolling period is the average of 5 points throughout the period. Since AOCI fluctuates from quarter to quarter due to unrealized changes in the fair value of available for sale investments, changes in instrument-specific credit risk for market risk benefits and discount rate assumption changes for the future policy benefits, management considers this non-GAAP financial measure to be useful internally and for investors and analysts to assess the level of return driven by the Company that is available to common shareholders. Sales Annuity, IUL, funding agreement and non-life contingent PRT sales are not derived from any specific GAAP income statement accounts or line items and should not be viewed as a substitute for any financial measure determined in accordance with GAAP. Sales from these products are recorded as deposit liabilities (i.e., contractholder funds) within the Company's consolidated financial statements in accordance with GAAP. Life contingent PRT sales are recorded as premiums in revenues within the consolidated financial statements. Management believes that presentation of sales, as measured for management purposes, enhances the understanding of our business and helps depict longer term trends that may not be apparent in the results of operations due to the timing of sales and revenue recognition. Total Capitalization, excluding AOCI Total capitalization, excluding AOCI is based on total equity excluding the effect of AOCI and the total aggregate principal amount of debt. Since AOCI fluctuates from quarter to quarter due to unrealized changes in the fair value of available for sale investments, changes in instrument-specific credit risk for market risk benefits and discount rate assumption changes for the future policy benefits, management considers this non-GAAP financial measure to provide useful supplemental information internally and to investors and analysts to help assess the capital position of the Company. Total Equity, excluding AOCI Total equity, excluding AOCI is based on total equity excluding the effect of AOCI. Since AOCI fluctuates from quarter to quarter due to unrealized changes in the fair value of available for sale investments, changes in instrument-specific credit risk for market risk benefits and discount rate assumption changes for the future policy benefits, management considers this non-GAAP financial measure to provide useful supplemental information internally and to investors and analysts assessing the level of earned equity on total equity. Total F&G Equity attributable to common shareholders, excluding AOCI Total F&G equity attributable to common shareholder, excluding AOCI is based on total F&G Annuities & Life, Inc. shareholders' equity excluding the effect of AOCI and preferred stocks, including additional paid-in-capital. Since AOCI fluctuates from quarter to quarter due to unrealized changes in the fair value of available for sale investments, changes in instrument-specific credit risk for market risk benefits and discount rate assumption changes for the future policy benefits, management considers this non- GAAP financial measure to be useful internally and for investors and analysts to assess the level of return driven by the Company that is available to common shareholders.


EX-99.2 3 fg2q2026financialsupplem.htm EX-99.2 fg2q2026financialsupplem
Quarterly Financial Supplement ——————————— Second Quarter 2026 The financial statements and financial exhibits included herein are unaudited. These financial statements and exhibits should be read in conjunction with the Company's periodic reports on Form 10-K, Form 10-Q and Form 8-K as applicable. All dollar amounts are presented in millions except for per share amounts. Exhibit 99.2
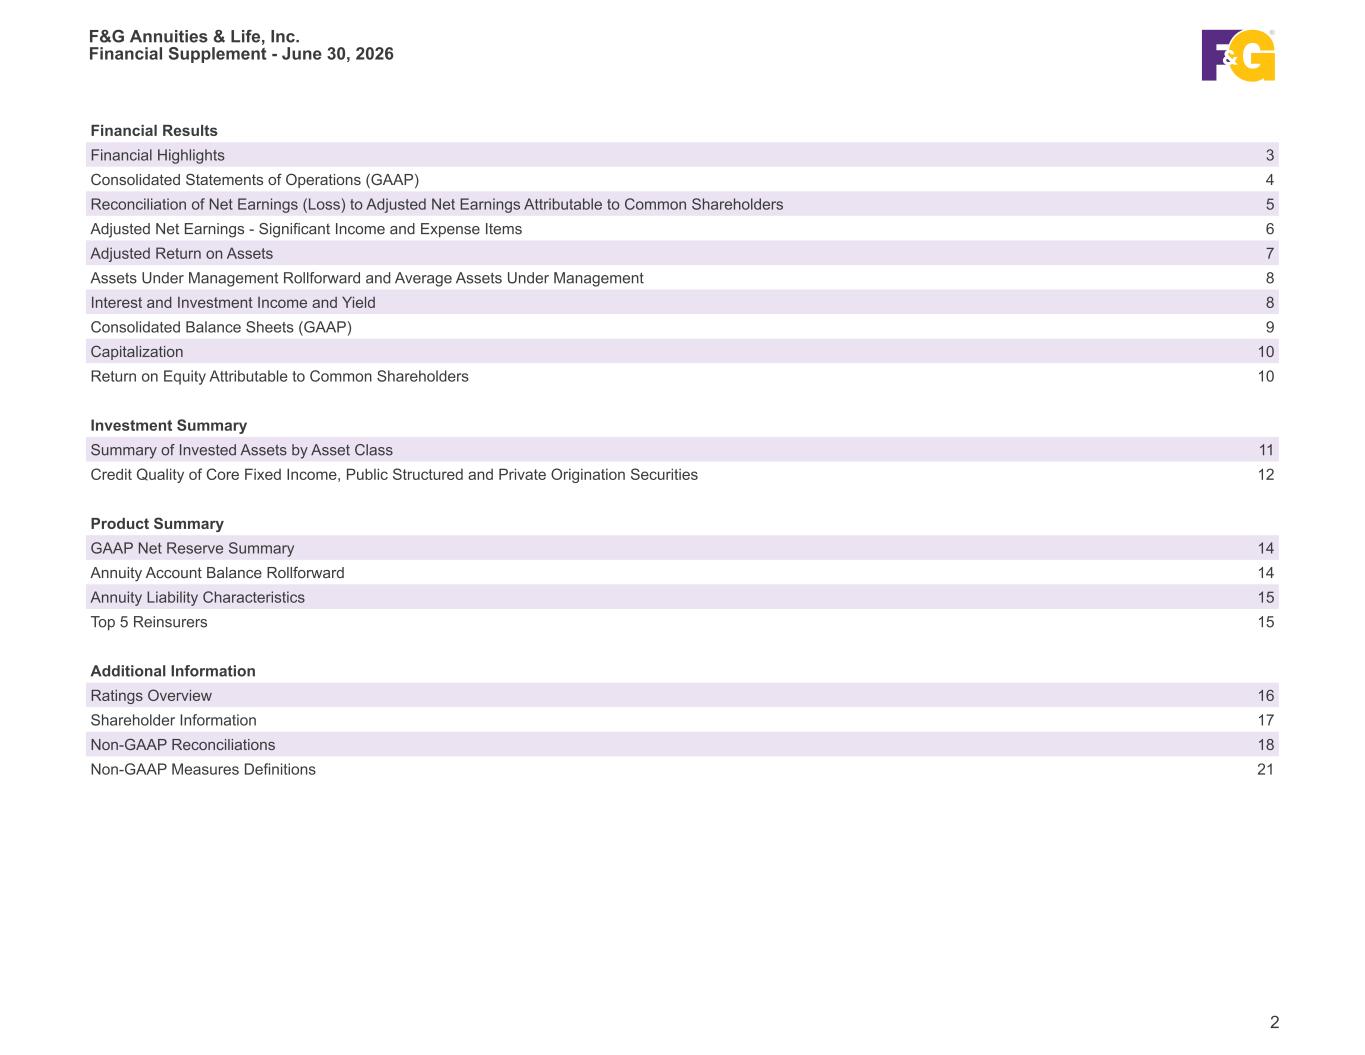

 
Financial Results Financial Highlights 3 Consolidated Statements of Operations (GAAP) 4 Reconciliation of Net Earnings (Loss) to Adjusted Net Earnings Attributable to Common Shareholders 5 Adjusted Net Earnings - Significant Income and Expense Items 6 Adjusted Return on Assets 7 Assets Under Management Rollforward and Average Assets Under Management 8 Interest and Investment Income and Yield 8 Consolidated Balance Sheets (GAAP) 9 Capitalization 10 Return on Equity Attributable to Common Shareholders 10 Investment Summary Summary of Invested Assets by Asset Class 11 Credit Quality of Core Fixed Income, Public Structured and Private Origination Securities 12 Product Summary GAAP Net Reserve Summary 14 Annuity Account Balance Rollforward 14 Annuity Liability Characteristics 15 Top 5 Reinsurers 15 Additional Information Ratings Overview 16 Shareholder Information 17 Non-GAAP Reconciliations 18 Non-GAAP Measures Definitions 21 F&G Annuities & Life, Inc. Financial Supplement - June 30, 2026 2
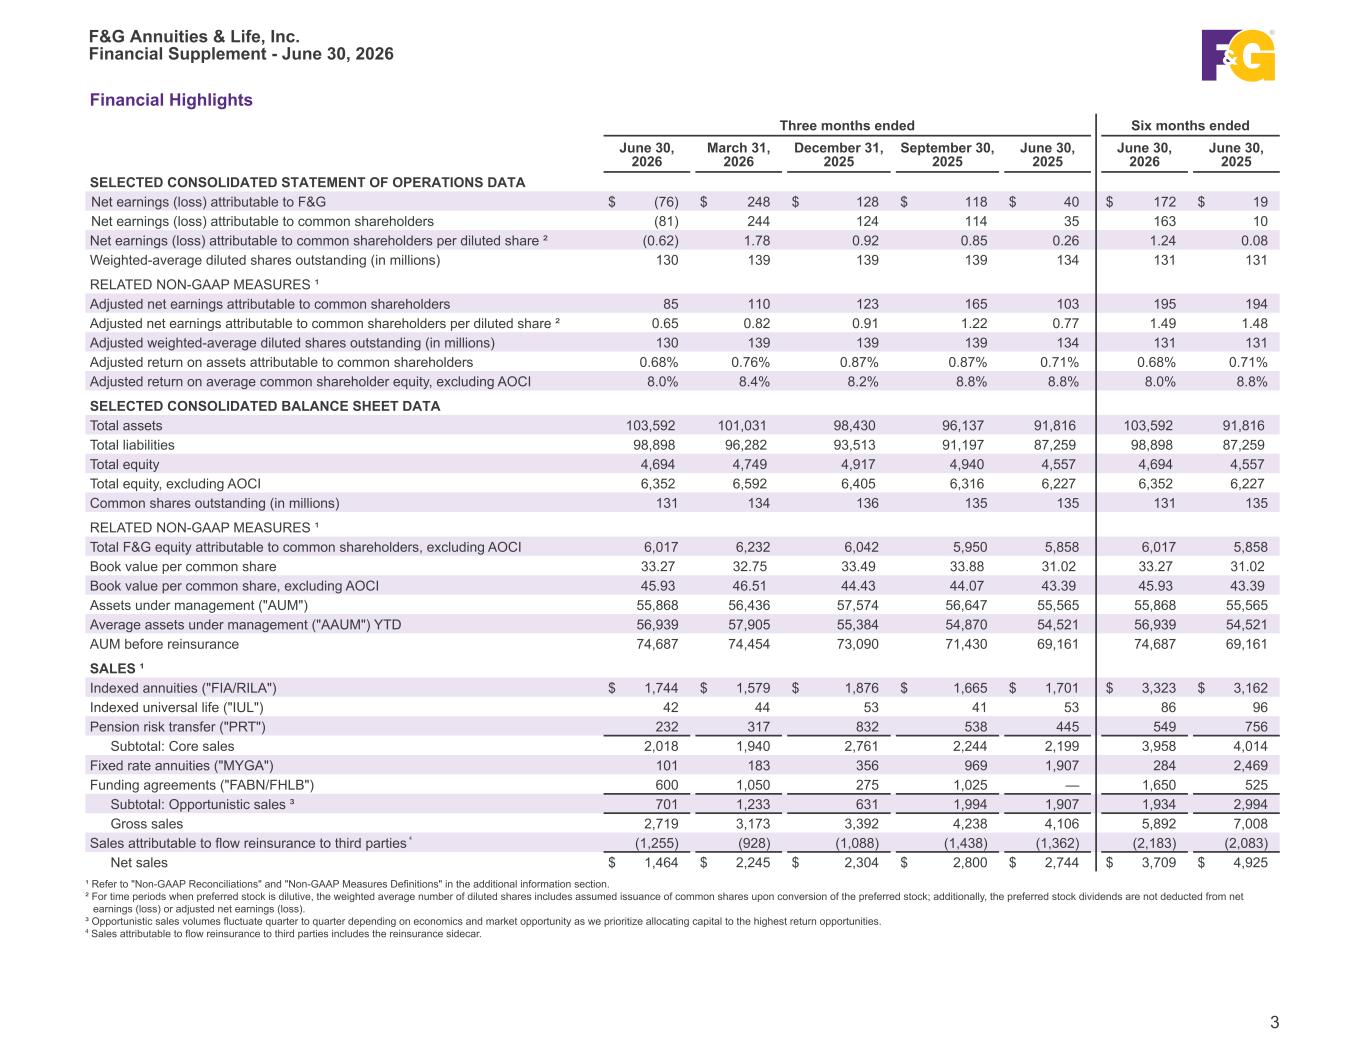

 
Financial Highlights Three months ended Six months ended June 30, 2026 March 31, 2026 December 31, 2025 September 30, 2025 June 30, 2025 June 30, 2026 June 30, 2025 SELECTED CONSOLIDATED STATEMENT OF OPERATIONS DATA Net earnings (loss) attributable to F&G $ (76) $ 248 $ 128 $ 118 $ 40 $ 172 $ 19 Net earnings (loss) attributable to common shareholders (81) 244 124 114 35 163 10 Net earnings (loss) attributable to common shareholders per diluted share ² (0.62) 1.78 0.92 0.85 0.26 1.24 0.08 Weighted-average diluted shares outstanding (in millions) 130 139 139 139 134 131 131 RELATED NON-GAAP MEASURES ¹ Adjusted net earnings attributable to common shareholders 85 110 123 165 103 195 194 Adjusted net earnings attributable to common shareholders per diluted share ² 0.65 0.82 0.91 1.22 0.77 1.49 1.48 Adjusted weighted-average diluted shares outstanding (in millions) 130 139 139 139 134 131 131 Adjusted return on assets attributable to common shareholders 0.68 % 0.76 % 0.87 % 0.87 % 0.71 % 0.68 % 0.71 % Adjusted return on average common shareholder equity, excluding AOCI 8.0 % 8.4 % 8.2 % 8.8 % 8.8 % 8.0 % 8.8 % SELECTED CONSOLIDATED BALANCE SHEET DATA Total assets 103,592 101,031 98,430 96,137 91,816 103,592 91,816 Total liabilities 98,898 96,282 93,513 91,197 87,259 98,898 87,259 Total equity 4,694 4,749 4,917 4,940 4,557 4,694 4,557 Total equity, excluding AOCI 6,352 6,592 6,405 6,316 6,227 6,352 6,227 Common shares outstanding (in millions) 131 134 136 135 135 131 135 RELATED NON-GAAP MEASURES ¹ Total F&G equity attributable to common shareholders, excluding AOCI 6,017 6,232 6,042 5,950 5,858 6,017 5,858 Book value per common share 33.27 32.75 33.49 33.88 31.02 33.27 31.02 Book value per common share, excluding AOCI 45.93 46.51 44.43 44.07 43.39 45.93 43.39 Assets under management ("AUM") 55,868 56,436 57,574 56,647 55,565 55,868 55,565 Average assets under management ("AAUM") YTD 56,939 57,905 55,384 54,870 54,521 56,939 54,521 AUM before reinsurance 74,687 74,454 73,090 71,430 69,161 74,687 69,161 SALES ¹ Indexed annuities ("FIA/RILA") $ 1,744 $ 1,579 $ 1,876 $ 1,665 $ 1,701 $ 3,323 $ 3,162 Indexed universal life ("IUL") 42 44 53 41 53 86 96 Pension risk transfer ("PRT") 232 317 832 538 445 549 756 Subtotal: Core sales 2,018 1,940 2,761 2,244 2,199 3,958 4,014 Fixed rate annuities ("MYGA") 101 183 356 969 1,907 284 2,469 Funding agreements ("FABN/FHLB") 600 1,050 275 1,025 — 1,650 525 Subtotal: Opportunistic sales ³ 701 1,233 631 1,994 1,907 1,934 2,994 Gross sales 2,719 3,173 3,392 4,238 4,106 5,892 7,008 Sales attributable to flow reinsurance to third parties ⁴ (1,255) (928) (1,088) (1,438) (1,362) (2,183) (2,083) Net sales $ 1,464 $ 2,245 $ 2,304 $ 2,800 $ 2,744 $ 3,709 $ 4,925 ¹ Refer to "Non-GAAP Reconciliations" and "Non-GAAP Measures Definitions" in the additional information section. ² For time periods when preferred stock is dilutive, the weighted average number of diluted shares includes assumed issuance of common shares upon conversion of the preferred stock; additionally, the preferred stock dividends are not deducted from net earnings (loss) or adjusted net earnings (loss). ³ Opportunistic sales volumes fluctuate quarter to quarter depending on economics and market opportunity as we prioritize allocating capital to the highest return opportunities. ⁴ Sales attributable to flow reinsurance to third parties includes the reinsurance sidecar. F&G Annuities & Life, Inc. Financial Supplement - June 30, 2026 3
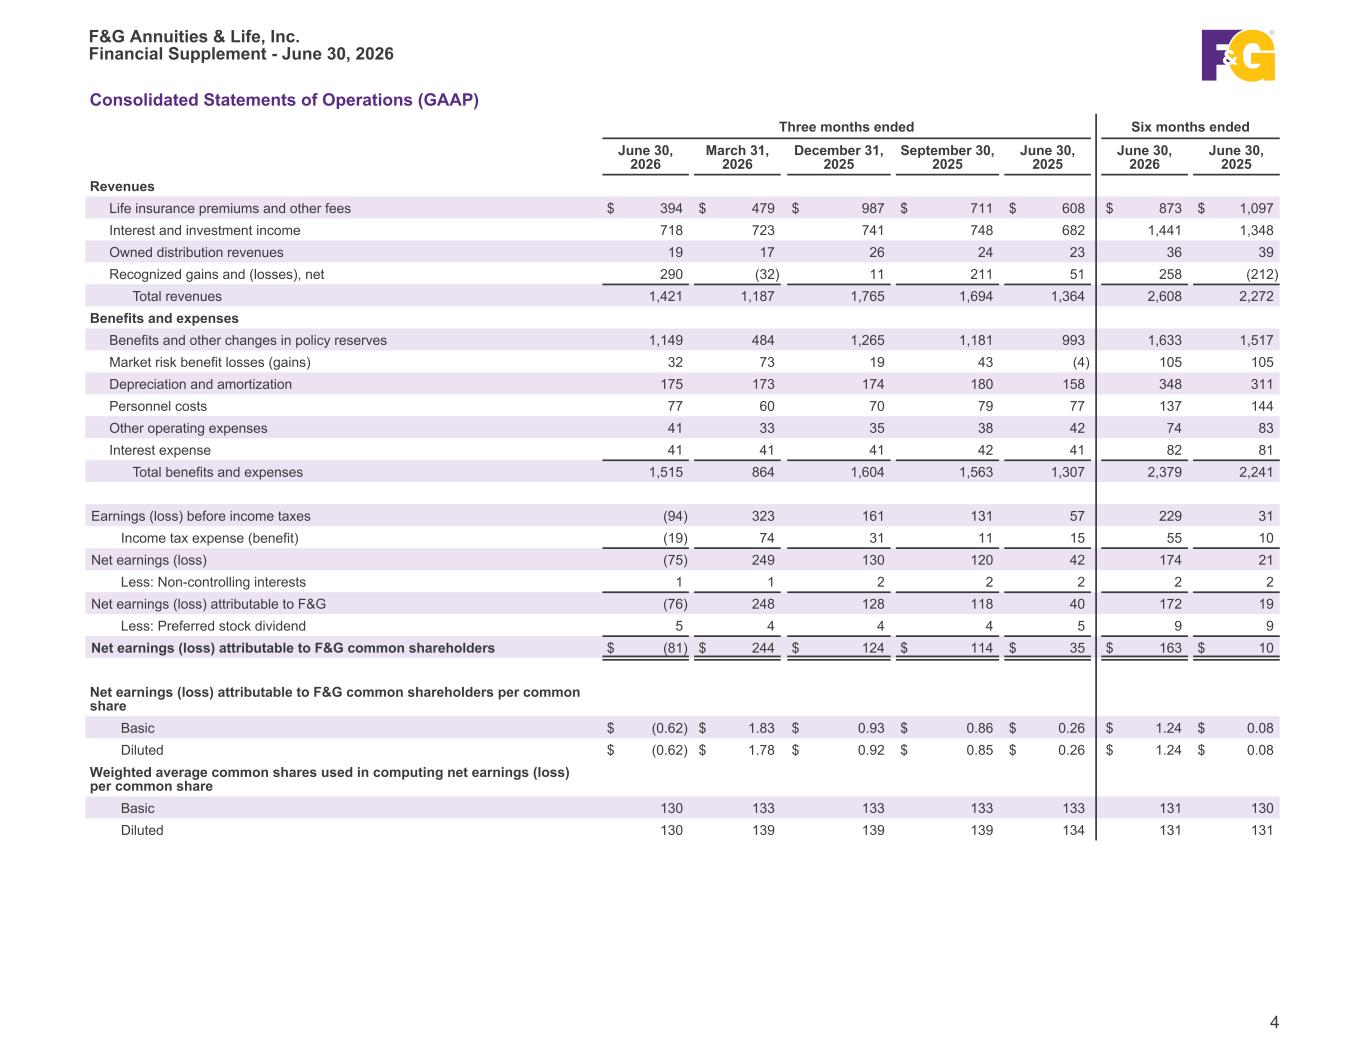

 
Consolidated Statements of Operations (GAAP) Three months ended Six months ended June 30, 2026 March 31, 2026 December 31, 2025 September 30, 2025 June 30, 2025 June 30, 2026 June 30, 2025 Revenues Life insurance premiums and other fees $ 394 $ 479 $ 987 $ 711 $ 608 $ 873 $ 1,097 Interest and investment income 718 723 741 748 682 1,441 1,348 Owned distribution revenues 19 17 26 24 23 36 39 Recognized gains and (losses), net 290 (32) 11 211 51 258 (212) Total revenues 1,421 1,187 1,765 1,694 1,364 2,608 2,272 Benefits and expenses Benefits and other changes in policy reserves 1,149 484 1,265 1,181 993 1,633 1,517 Market risk benefit losses (gains) 32 73 19 43 (4) 105 105 Depreciation and amortization 175 173 174 180 158 348 311 Personnel costs 77 60 70 79 77 137 144 Other operating expenses 41 33 35 38 42 74 83 Interest expense 41 41 41 42 41 82 81 Total benefits and expenses 1,515 864 1,604 1,563 1,307 2,379 2,241 Earnings (loss) before income taxes (94) 323 161 131 57 229 31 Income tax expense (benefit) (19) 74 31 11 15 55 10 Net earnings (loss) (75) 249 130 120 42 174 21 Less: Non-controlling interests 1 1 2 2 2 2 2 Net earnings (loss) attributable to F&G (76) 248 128 118 40 172 19 Less: Preferred stock dividend 5 4 4 4 5 9 9 Net earnings (loss) attributable to F&G common shareholders $ (81) $ 244 $ 124 $ 114 $ 35 $ 163 $ 10 Net earnings (loss) attributable to F&G common shareholders per common share Basic $ (0.62) $ 1.83 $ 0.93 $ 0.86 $ 0.26 $ 1.24 $ 0.08 Diluted $ (0.62) $ 1.78 $ 0.92 $ 0.85 $ 0.26 $ 1.24 $ 0.08 Weighted average common shares used in computing net earnings (loss) per common share Basic 130 133 133 133 133 131 130 Diluted 130 139 139 139 134 131 131 F&G Annuities & Life, Inc. Financial Supplement - June 30, 2026 4
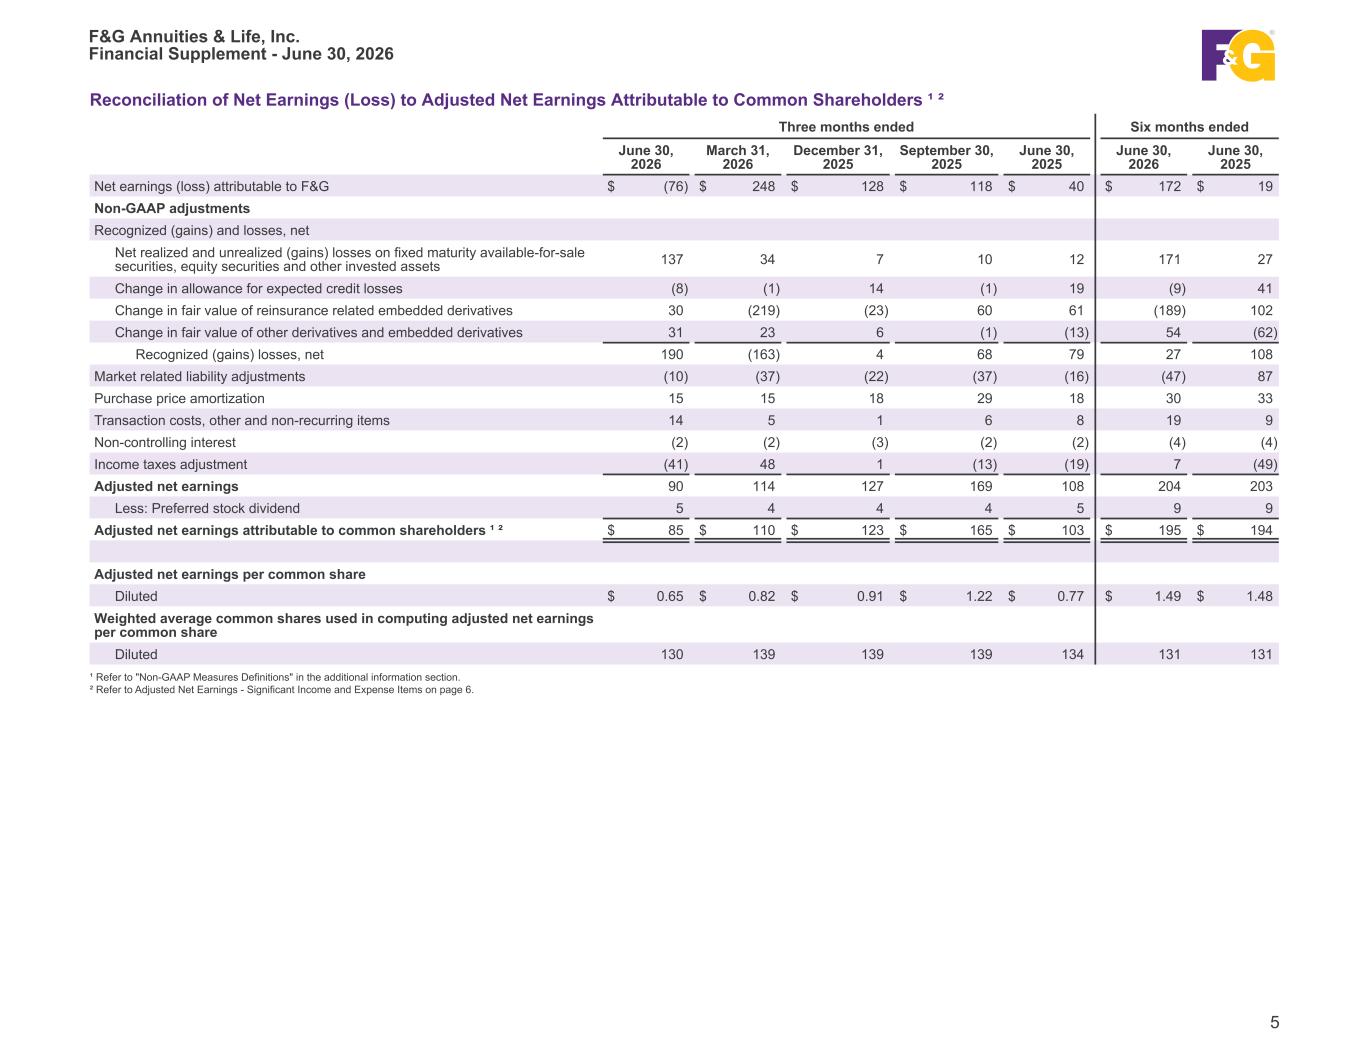

 
Reconciliation of Net Earnings (Loss) to Adjusted Net Earnings Attributable to Common Shareholders ¹ ² Three months ended Six months ended June 30, 2026 March 31, 2026 December 31, 2025 September 30, 2025 June 30, 2025 June 30, 2026 June 30, 2025 Net earnings (loss) attributable to F&G $ (76) $ 248 $ 128 $ 118 $ 40 $ 172 $ 19 Non-GAAP adjustments Recognized (gains) and losses, net Net realized and unrealized (gains) losses on fixed maturity available-for-sale securities, equity securities and other invested assets 137 34 7 10 12 171 27 Change in allowance for expected credit losses (8) (1) 14 (1) 19 (9) 41 Change in fair value of reinsurance related embedded derivatives 30 (219) (23) 60 61 (189) 102 Change in fair value of other derivatives and embedded derivatives 31 23 6 (1) (13) 54 (62) Recognized (gains) losses, net 190 (163) 4 68 79 27 108 Market related liability adjustments (10) (37) (22) (37) (16) (47) 87 Purchase price amortization 15 15 18 29 18 30 33 Transaction costs, other and non-recurring items 14 5 1 6 8 19 9 Non-controlling interest (2) (2) (3) (2) (2) (4) (4) Income taxes adjustment (41) 48 1 (13) (19) 7 (49) Adjusted net earnings 90 114 127 169 108 204 203 Less: Preferred stock dividend 5 4 4 4 5 9 9 Adjusted net earnings attributable to common shareholders ¹ ² $ 85 $ 110 $ 123 $ 165 $ 103 $ 195 $ 194 Adjusted net earnings per common share Diluted $ 0.65 $ 0.82 $ 0.91 $ 1.22 $ 0.77 $ 1.49 $ 1.48 Weighted average common shares used in computing adjusted net earnings per common share Diluted 130 139 139 139 134 131 131 ¹ Refer to "Non-GAAP Measures Definitions" in the additional information section. ² Refer to Adjusted Net Earnings - Significant Income and Expense Items on page 6. F&G Annuities & Life, Inc. Financial Supplement - June 30, 2026 5
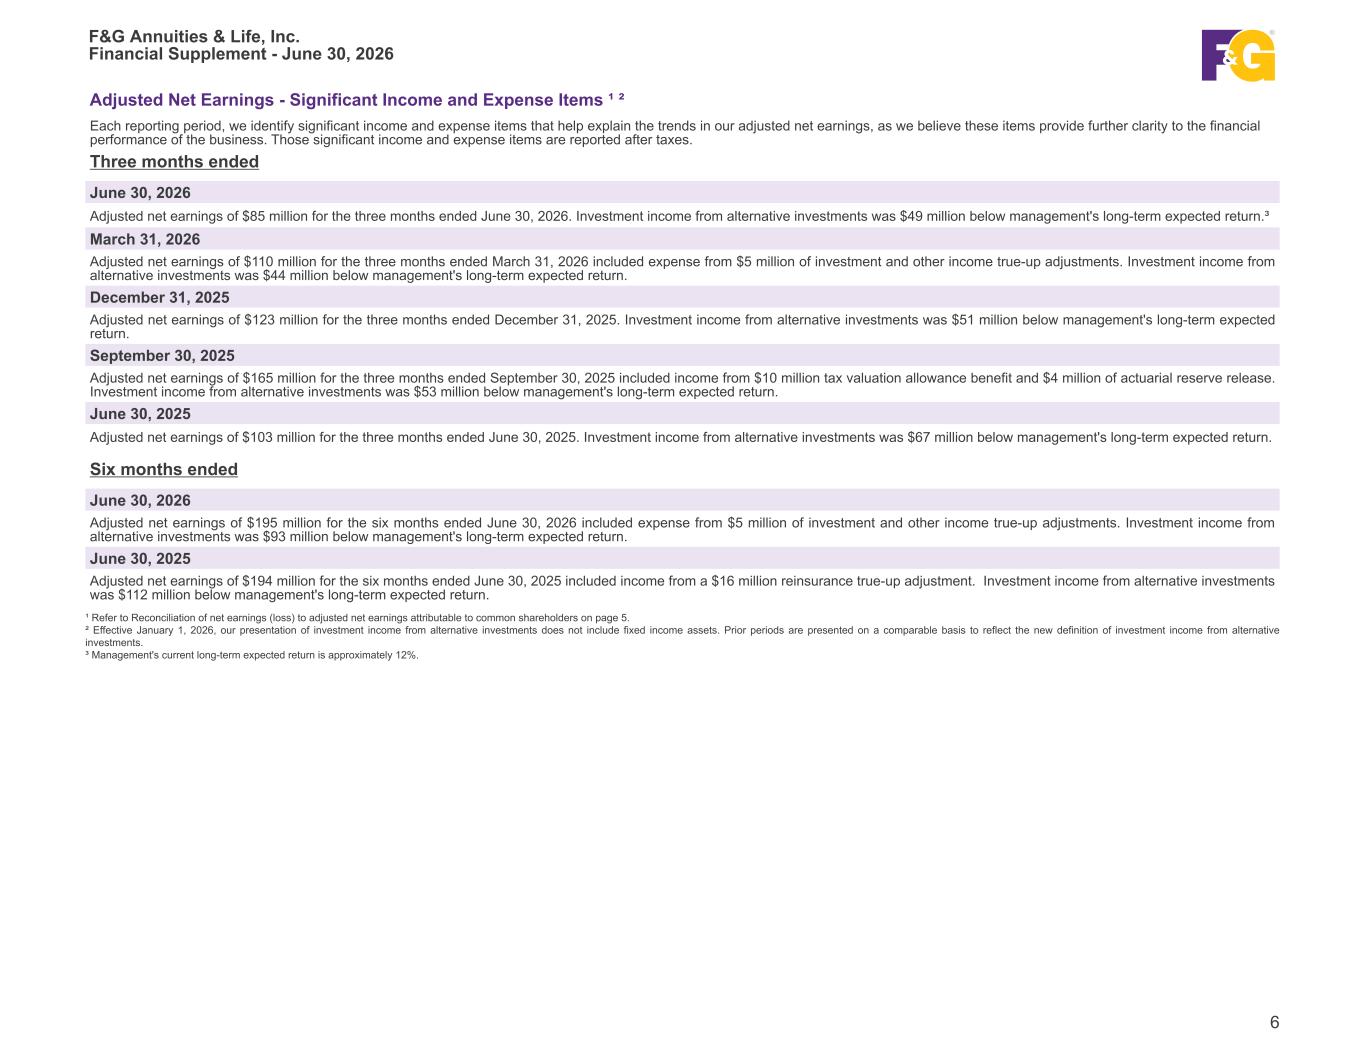

 
Adjusted Net Earnings - Significant Income and Expense Items ¹ ² Each reporting period, we identify significant income and expense items that help explain the trends in our adjusted net earnings, as we believe these items provide further clarity to the financial performance of the business. Those significant income and expense items are reported after taxes. Three months ended June 30, 2026 Adjusted net earnings of $85 million for the three months ended June 30, 2026. Investment income from alternative investments was $49 million below management's long-term expected return.³ March 31, 2026 Adjusted net earnings of $110 million for the three months ended March 31, 2026 included expense from $5 million of investment and other income true-up adjustments. Investment income from alternative investments was $44 million below management's long-term expected return. December 31, 2025 Adjusted net earnings of $123 million for the three months ended December 31, 2025. Investment income from alternative investments was $51 million below management's long-term expected return. September 30, 2025 Adjusted net earnings of $165 million for the three months ended September 30, 2025 included income from $10 million tax valuation allowance benefit and $4 million of actuarial reserve release. Investment income from alternative investments was $53 million below management's long-term expected return. June 30, 2025 Adjusted net earnings of $103 million for the three months ended June 30, 2025. Investment income from alternative investments was $67 million below management's long-term expected return. Six months ended June 30, 2026 Adjusted net earnings of $195 million for the six months ended June 30, 2026 included expense from $5 million of investment and other income true-up adjustments. Investment income from alternative investments was $93 million below management's long-term expected return. June 30, 2025 Adjusted net earnings of $194 million for the six months ended June 30, 2025 included income from a $16 million reinsurance true-up adjustment. Investment income from alternative investments was $112 million below management's long-term expected return. ¹ Refer to Reconciliation of net earnings (loss) to adjusted net earnings attributable to common shareholders on page 5. ² Effective January 1, 2026, our presentation of investment income from alternative investments does not include fixed income assets. Prior periods are presented on a comparable basis to reflect the new definition of investment income from alternative investments. ³ Management's current long-term expected return is approximately 12%. F&G Annuities & Life, Inc. Financial Supplement - June 30, 2026 6
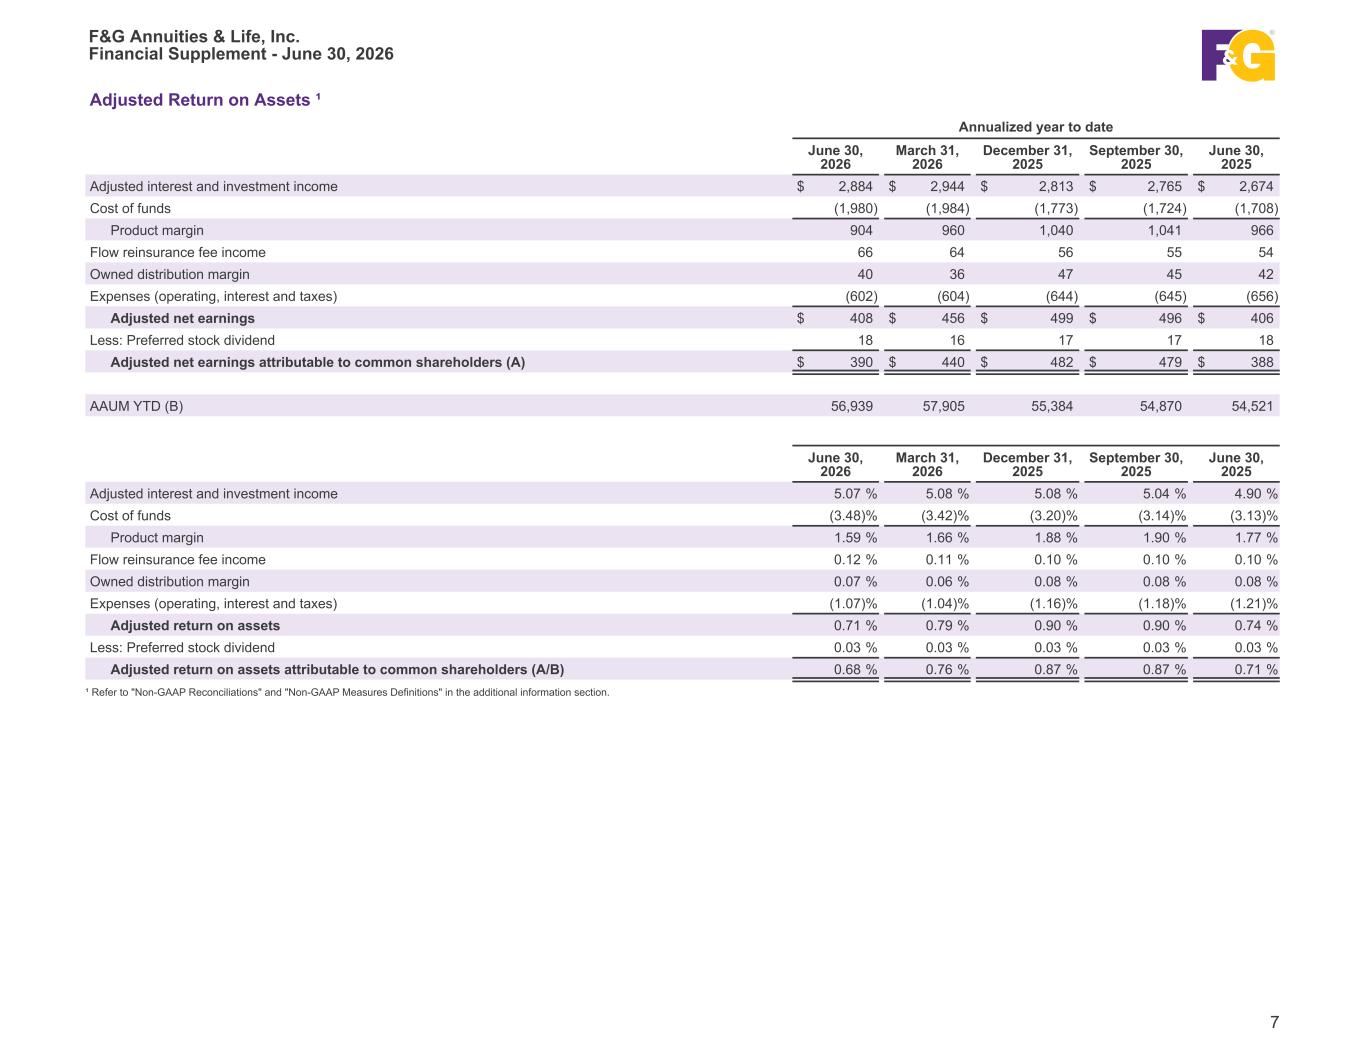

 
Adjusted Return on Assets ¹ Annualized year to date June 30, 2026 March 31, 2026 December 31, 2025 September 30, 2025 June 30, 2025 Adjusted interest and investment income $ 2,884 $ 2,944 $ 2,813 $ 2,765 $ 2,674 Cost of funds (1,980) (1,984) (1,773) (1,724) (1,708) Product margin 904 960 1,040 1,041 966 Flow reinsurance fee income 66 64 56 55 54 Owned distribution margin 40 36 47 45 42 Expenses (operating, interest and taxes) (602) (604) (644) (645) (656) Adjusted net earnings $ 408 $ 456 $ 499 $ 496 $ 406 Less: Preferred stock dividend 18 16 17 17 18 Adjusted net earnings attributable to common shareholders (A) $ 390 $ 440 $ 482 $ 479 $ 388 AAUM YTD (B) 56,939 57,905 55,384 54,870 54,521 June 30, 2026 March 31, 2026 December 31, 2025 September 30, 2025 June 30, 2025 Adjusted interest and investment income 5.07 % 5.08 % 5.08 % 5.04 % 4.90 % Cost of funds (3.48) % (3.42) % (3.20) % (3.14) % (3.13) % Product margin 1.59 % 1.66 % 1.88 % 1.90 % 1.77 % Flow reinsurance fee income 0.12 % 0.11 % 0.10 % 0.10 % 0.10 % Owned distribution margin 0.07 % 0.06 % 0.08 % 0.08 % 0.08 % Expenses (operating, interest and taxes) (1.07) % (1.04) % (1.16) % (1.18) % (1.21) % Adjusted return on assets 0.71 % 0.79 % 0.90 % 0.90 % 0.74 % Less: Preferred stock dividend 0.03 % 0.03 % 0.03 % 0.03 % 0.03 % Adjusted return on assets attributable to common shareholders (A/B) 0.68 % 0.76 % 0.87 % 0.87 % 0.71 % ¹ Refer to "Non-GAAP Reconciliations" and "Non-GAAP Measures Definitions" in the additional information section. F&G Annuities & Life, Inc. Financial Supplement - June 30, 2026 7
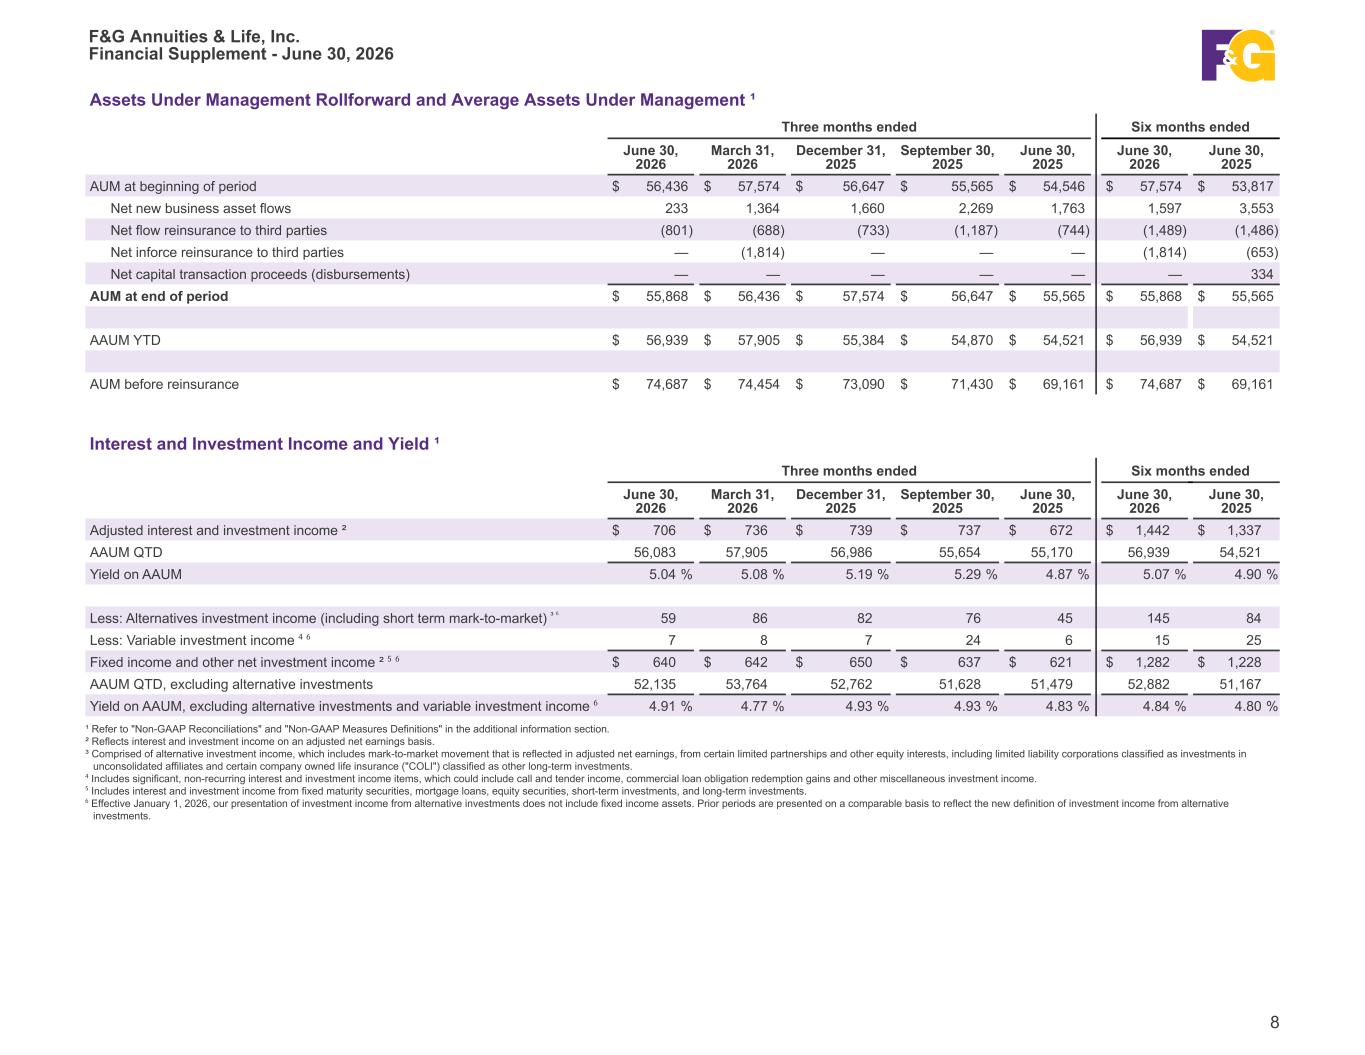

 
Assets Under Management Rollforward and Average Assets Under Management ¹ Three months ended Six months ended June 30, 2026 March 31, 2026 December 31, 2025 September 30, 2025 June 30, 2025 June 30, 2026 June 30, 2025 AUM at beginning of period $ 56,436 $ 57,574 $ 56,647 $ 55,565 $ 54,546 $ 57,574 $ 53,817 Net new business asset flows 233 1,364 1,660 2,269 1,763 1,597 3,553 Net flow reinsurance to third parties (801) (688) (733) (1,187) (744) (1,489) (1,486) Net inforce reinsurance to third parties — (1,814) — — — (1,814) (653) Net capital transaction proceeds (disbursements) — — — — — — 334 AUM at end of period $ 55,868 $ 56,436 $ 57,574 $ 56,647 $ 55,565 $ 55,868 $ 55,565 AAUM YTD $ 56,939 $ 57,905 $ 55,384 $ 54,870 $ 54,521 $ 56,939 $ 54,521 AUM before reinsurance $ 74,687 $ 74,454 $ 73,090 $ 71,430 $ 69,161 $ 74,687 $ 69,161 Interest and Investment Income and Yield ¹ Three months ended Six months ended June 30, 2026 March 31, 2026 December 31, 2025 September 30, 2025 June 30, 2025 June 30, 2026 June 30, 2025 Adjusted interest and investment income ² $ 706 $ 736 $ 739 $ 737 $ 672 $ 1,442 $ 1,337 AAUM QTD 56,083 57,905 56,986 55,654 55,170 56,939 54,521 Yield on AAUM 5.04 % 5.08 % 5.19 % 5.29 % 4.87 % 5.07 % 4.90 % Less: Alternatives investment income (including short term mark-to-market) ³ ⁶ 59 86 82 76 45 145 84 Less: Variable investment income ⁴ ⁶ 7 8 7 24 6 15 25 Fixed income and other net investment income ² ⁵ ⁶ $ 640 $ 642 $ 650 $ 637 $ 621 $ 1,282 $ 1,228 AAUM QTD, excluding alternative investments 52,135 53,764 52,762 51,628 51,479 52,882 51,167 Yield on AAUM, excluding alternative investments and variable investment income ⁶ 4.91 % 4.77 % 4.93 % 4.93 % 4.83 % 4.84 % 4.80 % ¹ Refer to "Non-GAAP Reconciliations" and "Non-GAAP Measures Definitions" in the additional information section. ² Reflects interest and investment income on an adjusted net earnings basis. ³ Comprised of alternative investment income, which includes mark-to-market movement that is reflected in adjusted net earnings, from certain limited partnerships and other equity interests, including limited liability corporations classified as investments in unconsolidated affiliates and certain company owned life insurance ("COLI") classified as other long-term investments. ⁴ Includes significant, non-recurring interest and investment income items, which could include call and tender income, commercial loan obligation redemption gains and other miscellaneous investment income. ⁵ Includes interest and investment income from fixed maturity securities, mortgage loans, equity securities, short-term investments, and long-term investments. ⁶ Effective January 1, 2026, our presentation of investment income from alternative investments does not include fixed income assets. Prior periods are presented on a comparable basis to reflect the new definition of investment income from alternative investments. F&G Annuities & Life, Inc. Financial Supplement - June 30, 2026 8
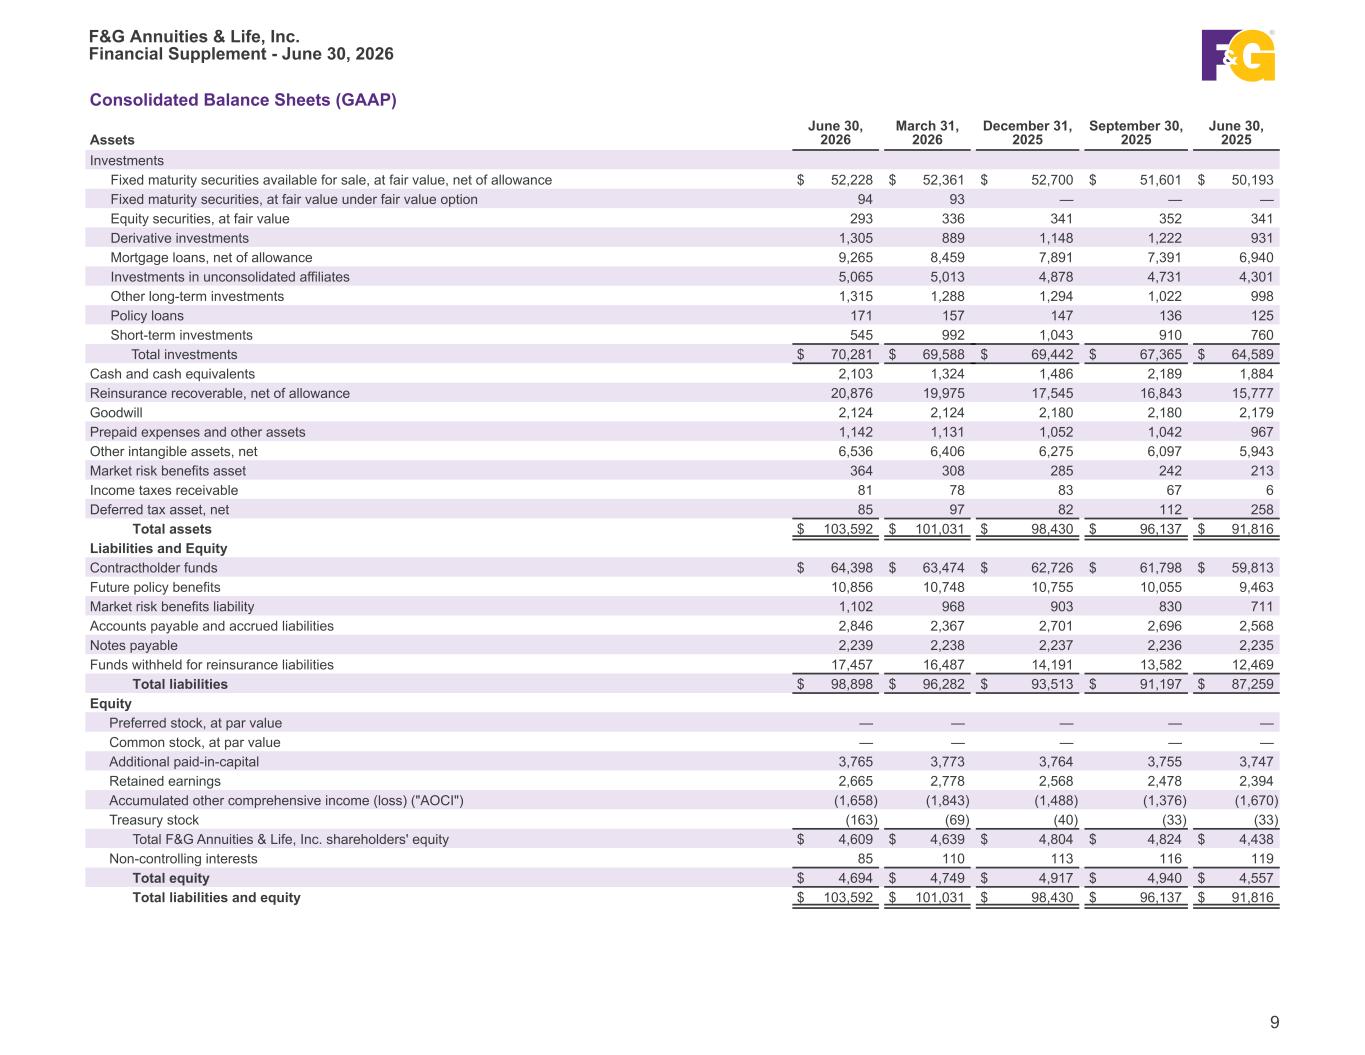

 
Consolidated Balance Sheets (GAAP) Assets June 30, 2026 March 31, 2026 December 31, 2025 September 30, 2025 June 30, 2025 Investments Fixed maturity securities available for sale, at fair value, net of allowance $ 52,228 $ 52,361 $ 52,700 $ 51,601 $ 50,193 Fixed maturity securities, at fair value under fair value option 94 93 — — — Equity securities, at fair value 293 336 341 352 341 Derivative investments 1,305 889 1,148 1,222 931 Mortgage loans, net of allowance 9,265 8,459 7,891 7,391 6,940 Investments in unconsolidated affiliates 5,065 5,013 4,878 4,731 4,301 Other long-term investments 1,315 1,288 1,294 1,022 998 Policy loans 171 157 147 136 125 Short-term investments 545 992 1,043 910 760 Total investments $ 70,281 $ 69,588 $ 69,442 $ 67,365 $ 64,589 Cash and cash equivalents 2,103 1,324 1,486 2,189 1,884 Reinsurance recoverable, net of allowance 20,876 19,975 17,545 16,843 15,777 Goodwill 2,124 2,124 2,180 2,180 2,179 Prepaid expenses and other assets 1,142 1,131 1,052 1,042 967 Other intangible assets, net 6,536 6,406 6,275 6,097 5,943 Market risk benefits asset 364 308 285 242 213 Income taxes receivable 81 78 83 67 6 Deferred tax asset, net 85 97 82 112 258 Total assets $ 103,592 $ 101,031 $ 98,430 $ 96,137 $ 91,816 Liabilities and Equity Contractholder funds $ 64,398 $ 63,474 $ 62,726 $ 61,798 $ 59,813 Future policy benefits 10,856 10,748 10,755 10,055 9,463 Market risk benefits liability 1,102 968 903 830 711 Accounts payable and accrued liabilities 2,846 2,367 2,701 2,696 2,568 Notes payable 2,239 2,238 2,237 2,236 2,235 Funds withheld for reinsurance liabilities 17,457 16,487 14,191 13,582 12,469 Total liabilities $ 98,898 $ 96,282 $ 93,513 $ 91,197 $ 87,259 Equity Preferred stock, at par value — — — — — Common stock, at par value — — — — — Additional paid-in-capital 3,765 3,773 3,764 3,755 3,747 Retained earnings 2,665 2,778 2,568 2,478 2,394 Accumulated other comprehensive income (loss) ("AOCI") (1,658) (1,843) (1,488) (1,376) (1,670) Treasury stock (163) (69) (40) (33) (33) Total F&G Annuities & Life, Inc. shareholders' equity $ 4,609 $ 4,639 $ 4,804 $ 4,824 $ 4,438 Non-controlling interests 85 110 113 116 119 Total equity $ 4,694 $ 4,749 $ 4,917 $ 4,940 $ 4,557 Total liabilities and equity $ 103,592 $ 101,031 $ 98,430 $ 96,137 $ 91,816 F&G Annuities & Life, Inc. Financial Supplement - June 30, 2026 9
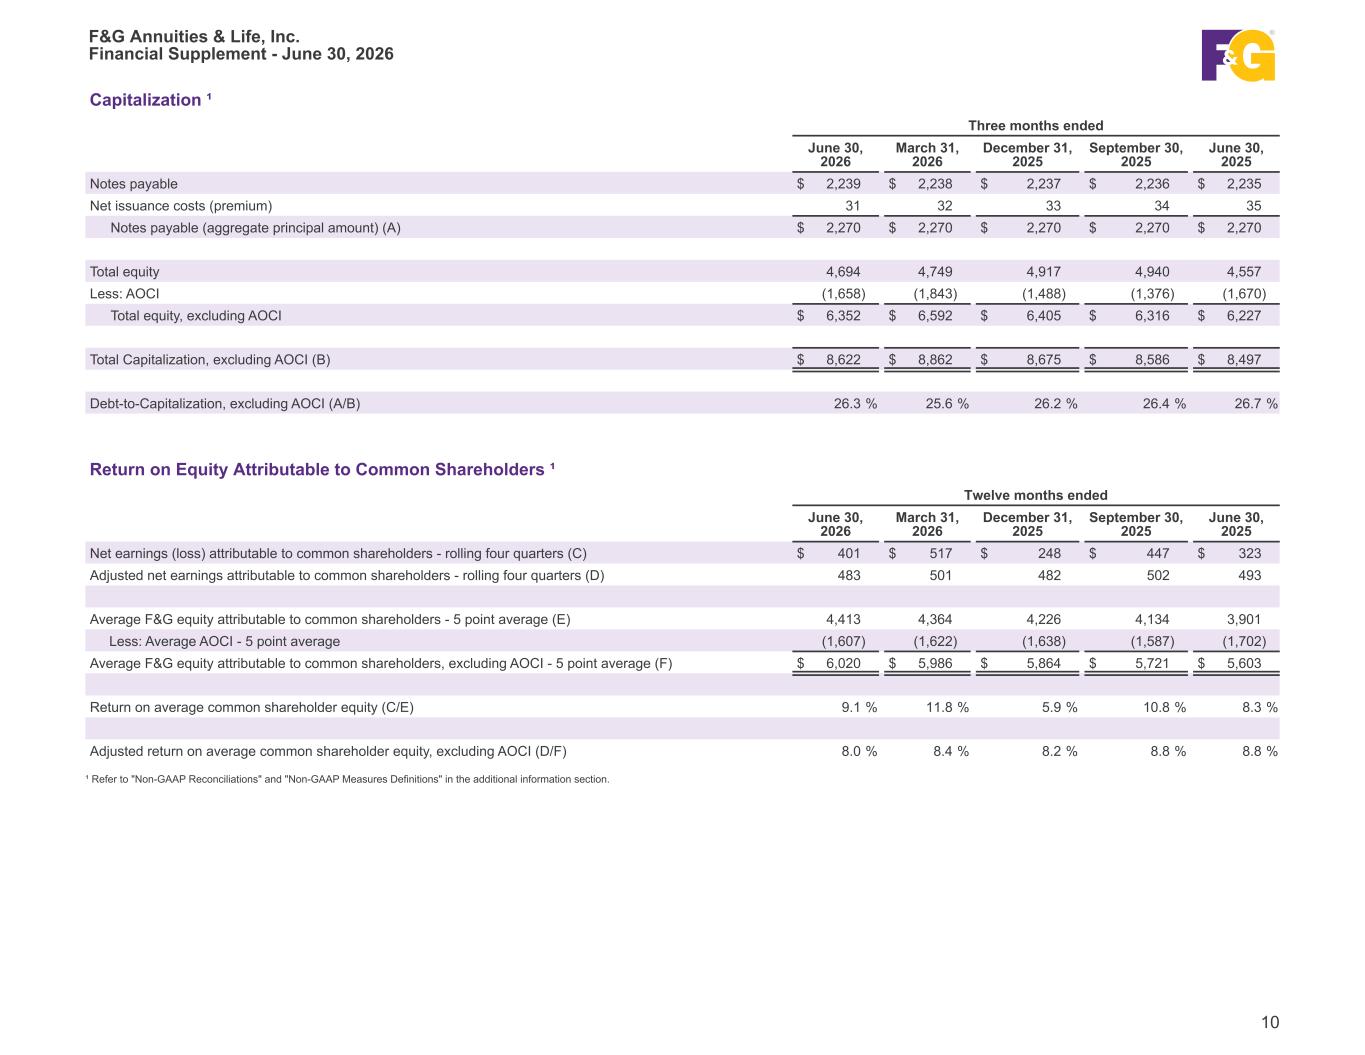

 
Capitalization ¹ Three months ended June 30, 2026 March 31, 2026 December 31, 2025 September 30, 2025 June 30, 2025 Notes payable $ 2,239 $ 2,238 $ 2,237 $ 2,236 $ 2,235 Net issuance costs (premium) 31 32 33 34 35 Notes payable (aggregate principal amount) (A) $ 2,270 $ 2,270 $ 2,270 $ 2,270 $ 2,270 Total equity 4,694 4,749 4,917 4,940 4,557 Less: AOCI (1,658) (1,843) (1,488) (1,376) (1,670) Total equity, excluding AOCI $ 6,352 $ 6,592 $ 6,405 $ 6,316 $ 6,227 Total Capitalization, excluding AOCI (B) $ 8,622 $ 8,862 $ 8,675 $ 8,586 $ 8,497 Debt-to-Capitalization, excluding AOCI (A/B) 26.3 % 25.6 % 26.2 % 26.4 % 26.7 % Return on Equity Attributable to Common Shareholders ¹ Twelve months ended June 30, 2026 March 31, 2026 December 31, 2025 September 30, 2025 June 30, 2025 Net earnings (loss) attributable to common shareholders - rolling four quarters (C) $ 401 $ 517 $ 248 $ 447 $ 323 Adjusted net earnings attributable to common shareholders - rolling four quarters (D) 483 501 482 502 493 Average F&G equity attributable to common shareholders - 5 point average (E) 4,413 4,364 4,226 4,134 3,901 Less: Average AOCI - 5 point average (1,607) (1,622) (1,638) (1,587) (1,702) Average F&G equity attributable to common shareholders, excluding AOCI - 5 point average (F) $ 6,020 $ 5,986 $ 5,864 $ 5,721 $ 5,603 Return on average common shareholder equity (C/E) 9.1 % 11.8 % 5.9 % 10.8 % 8.3 % Adjusted return on average common shareholder equity, excluding AOCI (D/F) 8.0 % 8.4 % 8.2 % 8.8 % 8.8 % ¹ Refer to "Non-GAAP Reconciliations" and "Non-GAAP Measures Definitions" in the additional information section. F&G Annuities & Life, Inc. Financial Supplement - June 30, 2026 10
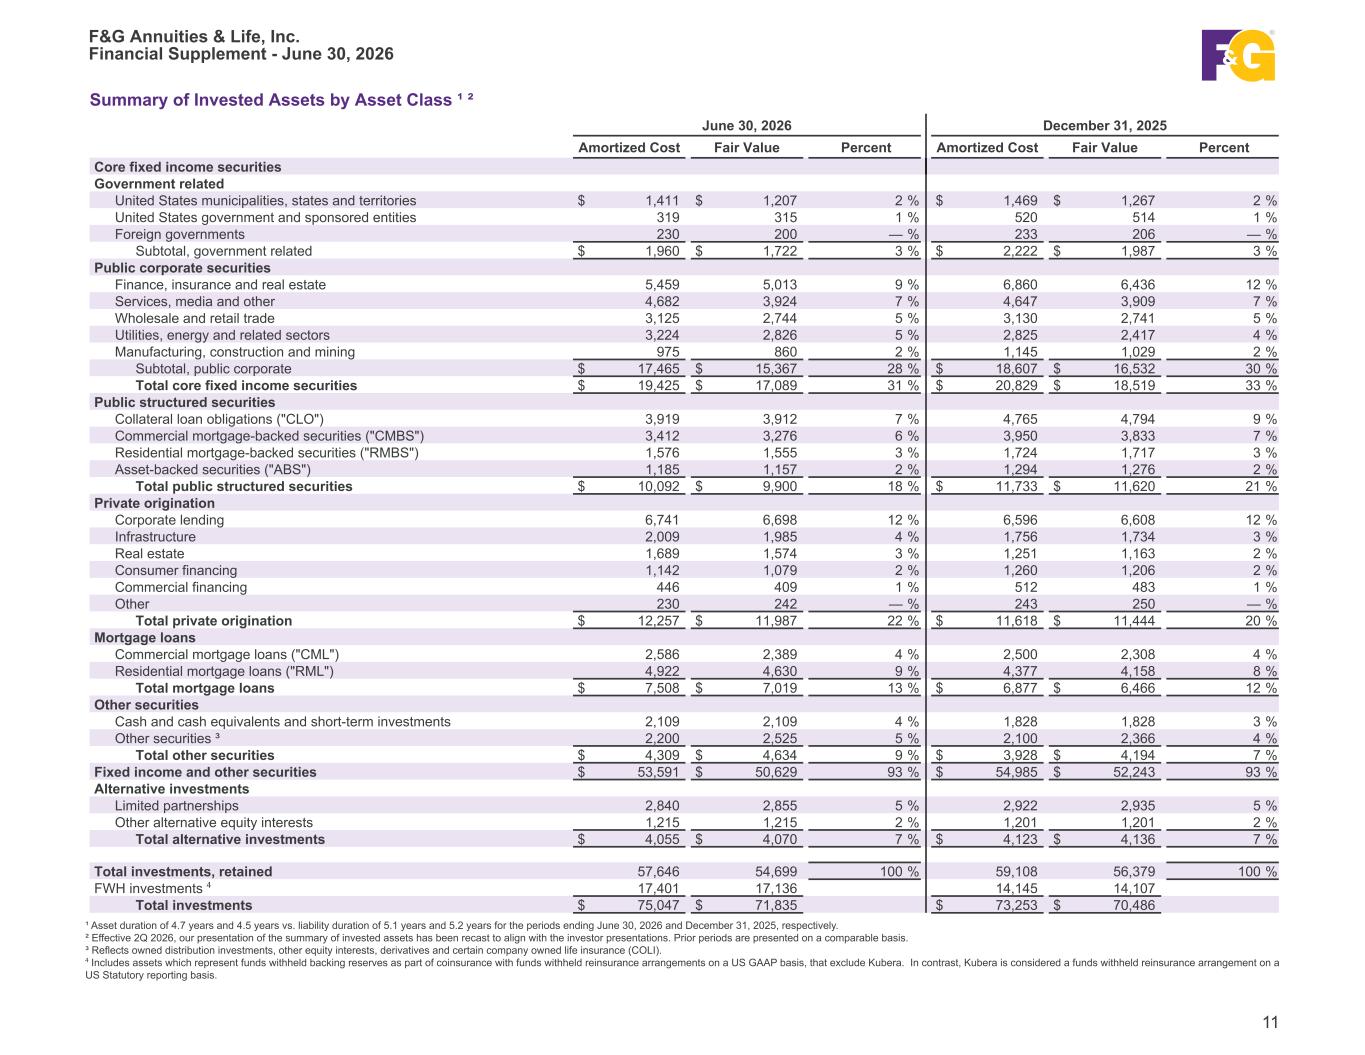

 
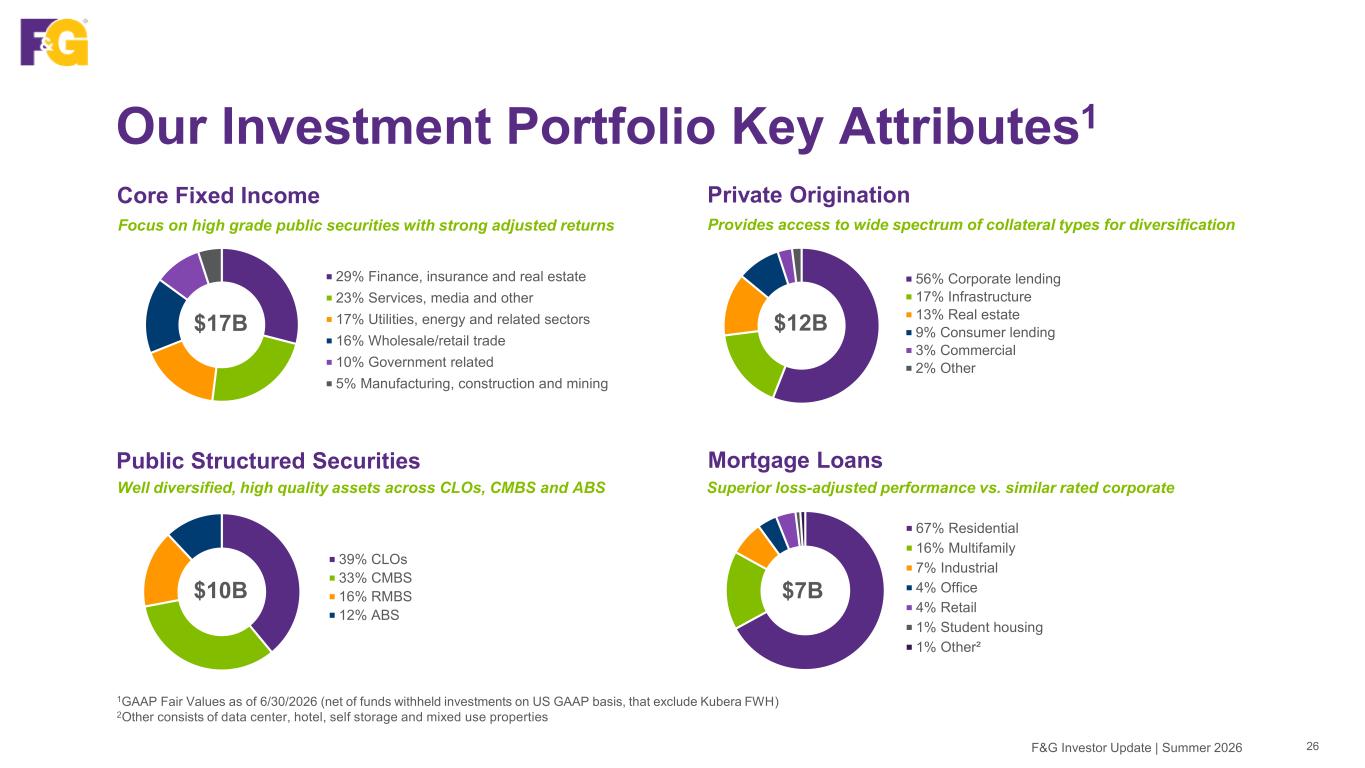
Summary of Invested Assets by Asset Class ¹ ² June 30, 2026 December 31, 2025 Amortized Cost Fair Value Percent Amortized Cost Fair Value Percent Core fixed income securities Government related United States municipalities, states and territories $ 1,411 $ 1,207 2 % $ 1,469 $ 1,267 2 % United States government and sponsored entities 319 315 1 % 520 514 1 % Foreign governments 230 200 — % 233 206 — % Subtotal, government related $ 1,960 $ 1,722 3 % $ 2,222 $ 1,987 3 % Public corporate securities Finance, insurance and real estate 5,459 5,013 9 % 6,860 6,436 12 % Services, media and other 4,682 3,924 7 % 4,647 3,909 7 % Wholesale and retail trade 3,125 2,744 5 % 3,130 2,741 5 % Utilities, energy and related sectors 3,224 2,826 5 % 2,825 2,417 4 % Manufacturing, construction and mining 975 860 2 % 1,145 1,029 2 % Subtotal, public corporate $ 17,465 $ 15,367 28 % $ 18,607 $ 16,532 30 % Total core fixed income securities $ 19,425 $ 17,089 31 % $ 20,829 $ 18,519 33 % Public structured securities Collateral loan obligations ("CLO") 3,919 3,912 7 % 4,765 4,794 9 % Commercial mortgage-backed securities ("CMBS") 3,412 3,276 6 % 3,950 3,833 7 % Residential mortgage-backed securities ("RMBS") 1,576 1,555 3 % 1,724 1,717 3 % Asset-backed securities ("ABS") 1,185 1,157 2 % 1,294 1,276 2 % Total public structured securities $ 10,092 $ 9,900 18 % $ 11,733 $ 11,620 21 % Private origination Corporate lending 6,741 6,698 12 % 6,596 6,608 12 % Infrastructure 2,009 1,985 4 % 1,756 1,734 3 % Real estate 1,689 1,574 3 % 1,251 1,163 2 % Consumer financing 1,142 1,079 2 % 1,260 1,206 2 % Commercial financing 446 409 1 % 512 483 1 % Other 230 242 — % 243 250 — % Total private origination $ 12,257 $ 11,987 22 % $ 11,618 $ 11,444 20 % Mortgage loans Commercial mortgage loans ("CML") 2,586 2,389 4 % 2,500 2,308 4 % Residential mortgage loans ("RML") 4,922 4,630 9 % 4,377 4,158 8 % Total mortgage loans $ 7,508 $ 7,019 13 % $ 6,877 $ 6,466 12 % Other securities Cash and cash equivalents and short-term investments 2,109 2,109 4 % 1,828 1,828 3 % Other securities ³ 2,200 2,525 5 % 2,100 2,366 4 % Total other securities $ 4,309 $ 4,634 9 % $ 3,928 $ 4,194 7 % Fixed income and other securities $ 53,591 $ 50,629 93 % $ 54,985 $ 52,243 93 % Alternative investments Limited partnerships 2,840 2,855 5 % 2,922 2,935 5 % Other alternative equity interests 1,215 1,215 2 % 1,201 1,201 2 % Total alternative investments $ 4,055 $ 4,070 7 % $ 4,123 $ 4,136 7 % Total investments, retained 57,646 54,699 100 % 59,108 56,379 100 % FWH investments ⁴ 17,401 17,136 14,145 14,107 Total investments $ 75,047 $ 71,835 $ 73,253 $ 70,486 ¹ Asset duration of 4.7 years and 4.5 years vs. liability duration of 5.1 years and 5.2 years for the periods ending June 30, 2026 and December 31, 2025, respectively. ² Effective 2Q 2026, our presentation of the summary of invested assets has been recast to align with the investor presentations. Prior periods are presented on a comparable basis. ³ Reflects owned distribution investments, other equity interests, derivatives and certain company owned life insurance (COLI). ⁴ Includes assets which represent funds withheld backing reserves as part of coinsurance with funds withheld reinsurance arrangements on a US GAAP basis, that exclude Kubera. In contrast, Kubera is considered a funds withheld reinsurance arrangement on a US Statutory reporting basis. F&G Annuities & Life, Inc. Financial Supplement - June 30, 2026 11
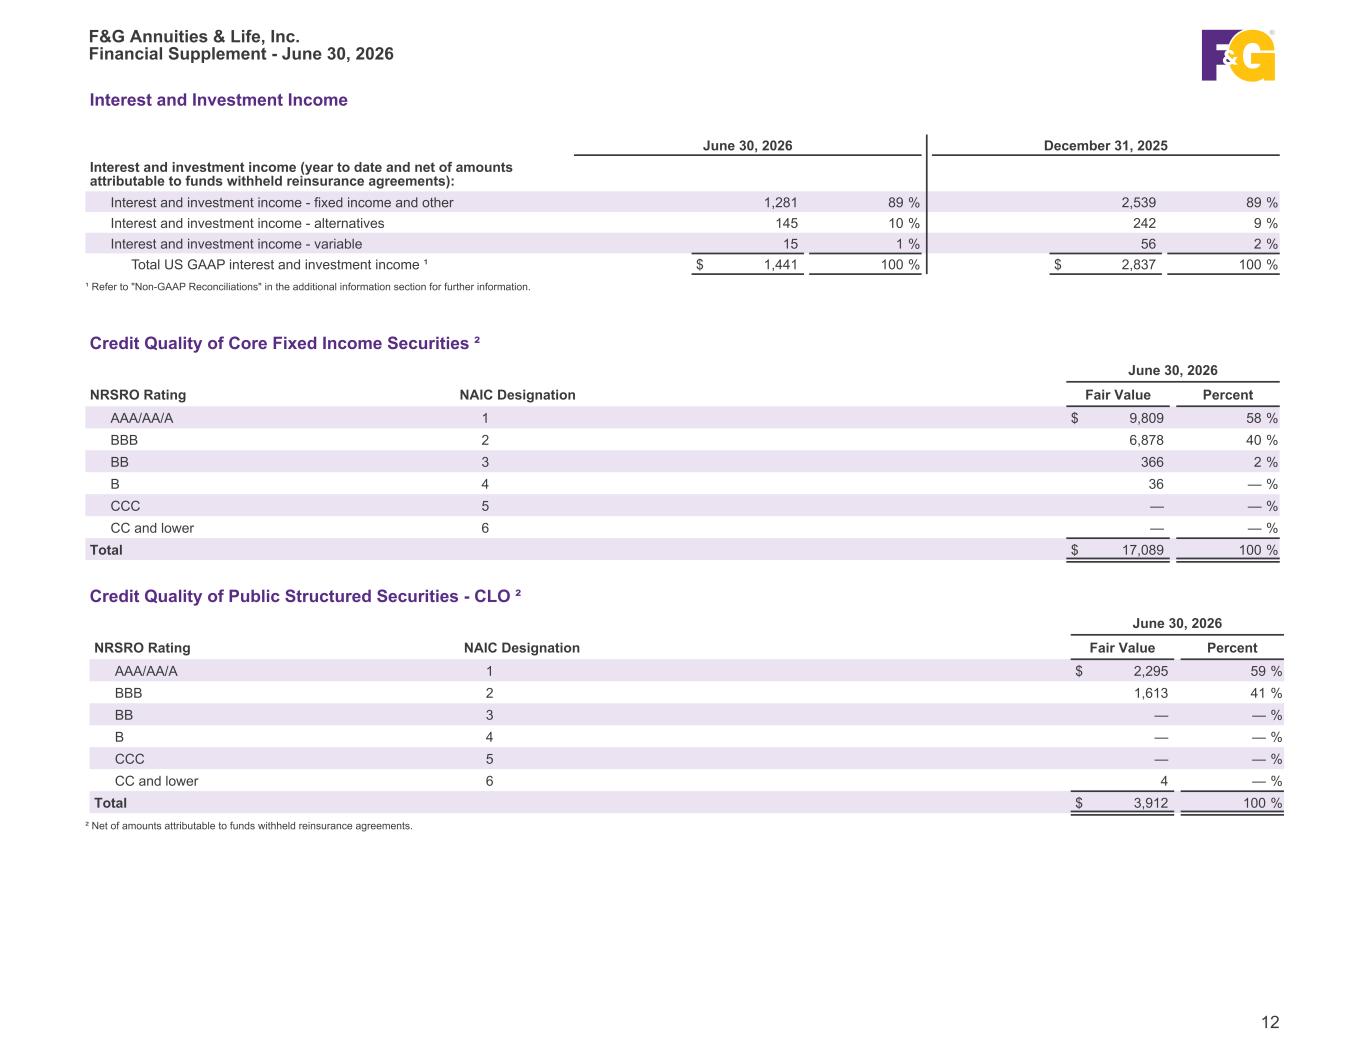

 
Interest and Investment Income June 30, 2026 December 31, 2025 Interest and investment income (year to date and net of amounts attributable to funds withheld reinsurance agreements): Interest and investment income - fixed income and other 1,281 89 % 2,539 89 % Interest and investment income - alternatives 145 10 % 242 9 % Interest and investment income - variable 15 1 % 56 2 % Total US GAAP interest and investment income ¹ $ 1,441 100 % $ 2,837 100 % ¹ Refer to "Non-GAAP Reconciliations" in the additional information section for further information. Credit Quality of Core Fixed Income Securities ² June 30, 2026 NRSRO Rating NAIC Designation Fair Value Percent AAA/AA/A 1 $ 9,809 58 % BBB 2 6,878 40 % BB 3 366 2 % B 4 36 — % CCC 5 — — % CC and lower 6 — — % Total $ 17,089 100 % Credit Quality of Public Structured Securities - CLO ² June 30, 2026 NRSRO Rating NAIC Designation Fair Value Percent AAA/AA/A 1 $ 2,295 59 % BBB 2 1,613 41 % BB 3 — — % B 4 — — % CCC 5 — — % CC and lower 6 4 — % Total $ 3,912 100 % ² Net of amounts attributable to funds withheld reinsurance agreements. F&G Annuities & Life, Inc. Financial Supplement - June 30, 2026 12
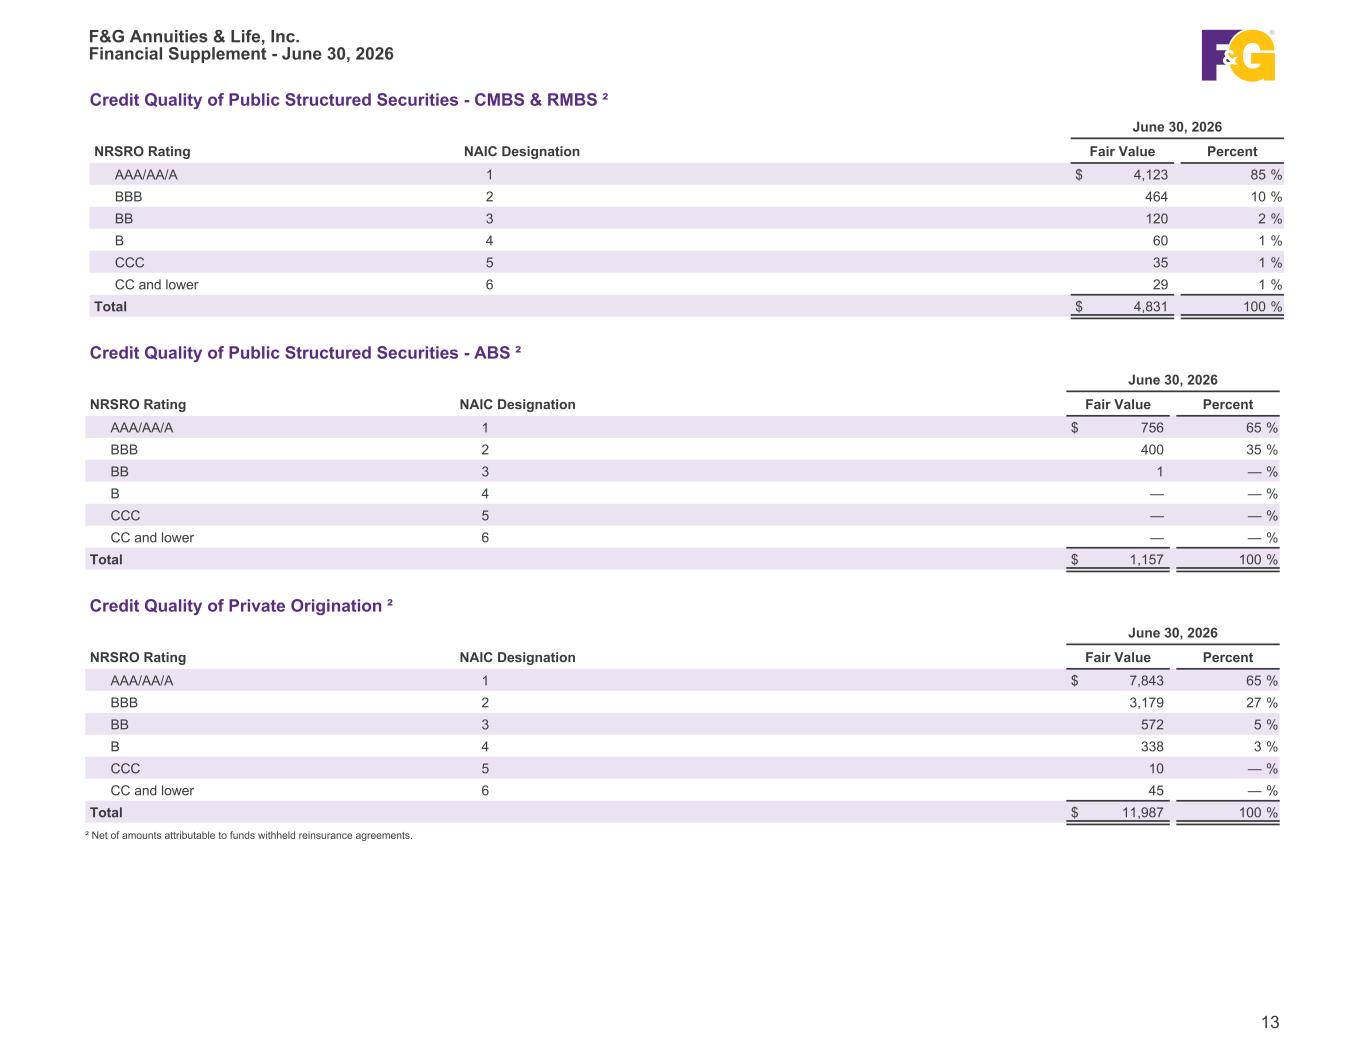

 
Credit Quality of Public Structured Securities - CMBS & RMBS ² June 30, 2026 NRSRO Rating NAIC Designation Fair Value Percent AAA/AA/A 1 $ 4,123 85 % BBB 2 464 10 % BB 3 120 2 % B 4 60 1 % CCC 5 35 1 % CC and lower 6 29 1 % Total $ 4,831 100 % Credit Quality of Public Structured Securities - ABS ² June 30, 2026 NRSRO Rating NAIC Designation Fair Value Percent AAA/AA/A 1 $ 756 65 % BBB 2 400 35 % BB 3 1 — % B 4 — — % CCC 5 — — % CC and lower 6 — — % Total $ 1,157 100 % Credit Quality of Private Origination ² June 30, 2026 NRSRO Rating NAIC Designation Fair Value Percent AAA/AA/A 1 $ 7,843 65 % BBB 2 3,179 27 % BB 3 572 5 % B 4 338 3 % CCC 5 10 — % CC and lower 6 45 — % Total $ 11,987 100 % ² Net of amounts attributable to funds withheld reinsurance agreements. F&G Annuities & Life, Inc. Financial Supplement - June 30, 2026 13
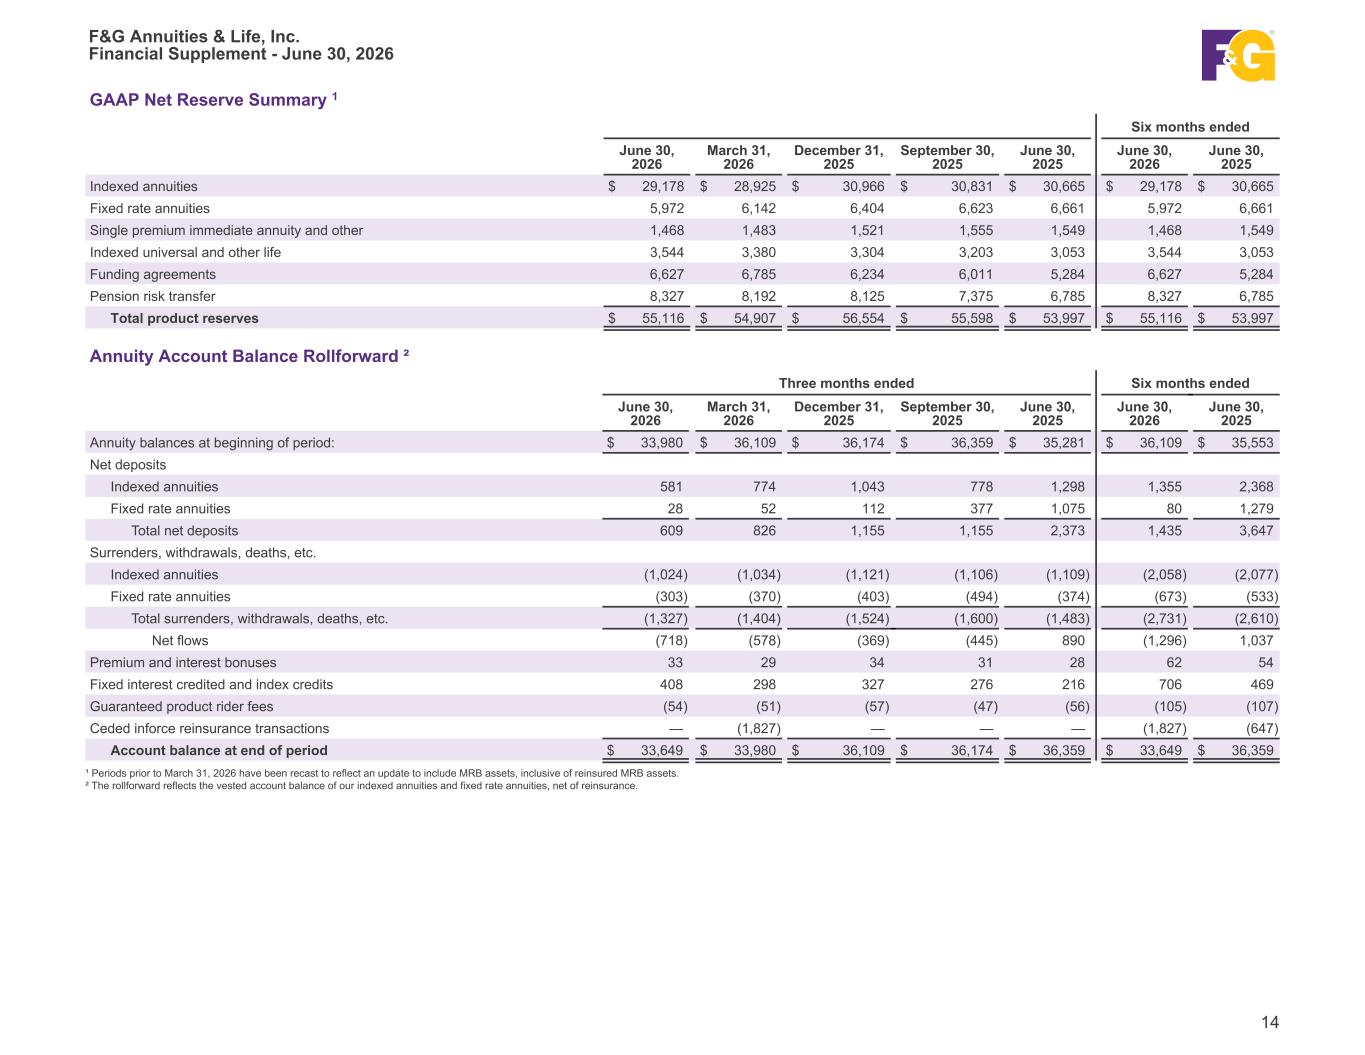

 
GAAP Net Reserve Summary 1 Six months ended June 30, 2026 March 31, 2026 December 31, 2025 September 30, 2025 June 30, 2025 June 30, 2026 June 30, 2025 Indexed annuities $ 29,178 $ 28,925 $ 30,966 $ 30,831 $ 30,665 $ 29,178 $ 30,665 Fixed rate annuities 5,972 6,142 6,404 6,623 6,661 5,972 6,661 Single premium immediate annuity and other 1,468 1,483 1,521 1,555 1,549 1,468 1,549 Indexed universal and other life 3,544 3,380 3,304 3,203 3,053 3,544 3,053 Funding agreements 6,627 6,785 6,234 6,011 5,284 6,627 5,284 Pension risk transfer 8,327 8,192 8,125 7,375 6,785 8,327 6,785 Total product reserves $ 55,116 $ 54,907 $ 56,554 $ 55,598 $ 53,997 $ 55,116 $ 53,997 Annuity Account Balance Rollforward ² Three months ended Six months ended June 30, 2026 March 31, 2026 December 31, 2025 September 30, 2025 June 30, 2025 June 30, 2026 June 30, 2025 Annuity balances at beginning of period: $ 33,980 $ 36,109 $ 36,174 $ 36,359 $ 35,281 $ 36,109 $ 35,553 Net deposits Indexed annuities 581 774 1,043 778 1,298 1,355 2,368 Fixed rate annuities 28 52 112 377 1,075 80 1,279 Total net deposits 609 826 1,155 1,155 2,373 1,435 3,647 Surrenders, withdrawals, deaths, etc. Indexed annuities (1,024) (1,034) (1,121) (1,106) (1,109) (2,058) (2,077) Fixed rate annuities (303) (370) (403) (494) (374) (673) (533) Total surrenders, withdrawals, deaths, etc. (1,327) (1,404) (1,524) (1,600) (1,483) (2,731) (2,610) Net flows (718) (578) (369) (445) 890 (1,296) 1,037 Premium and interest bonuses 33 29 34 31 28 62 54 Fixed interest credited and index credits 408 298 327 276 216 706 469 Guaranteed product rider fees (54) (51) (57) (47) (56) (105) (107) Ceded inforce reinsurance transactions — (1,827) — — — (1,827) (647) Account balance at end of period $ 33,649 $ 33,980 $ 36,109 $ 36,174 $ 36,359 $ 33,649 $ 36,359 ¹ Periods prior to March 31, 2026 have been recast to reflect an update to include MRB assets, inclusive of reinsured MRB assets. ² The rollforward reflects the vested account balance of our indexed annuities and fixed rate annuities, net of reinsurance. F&G Annuities & Life, Inc. Financial Supplement - June 30, 2026 14
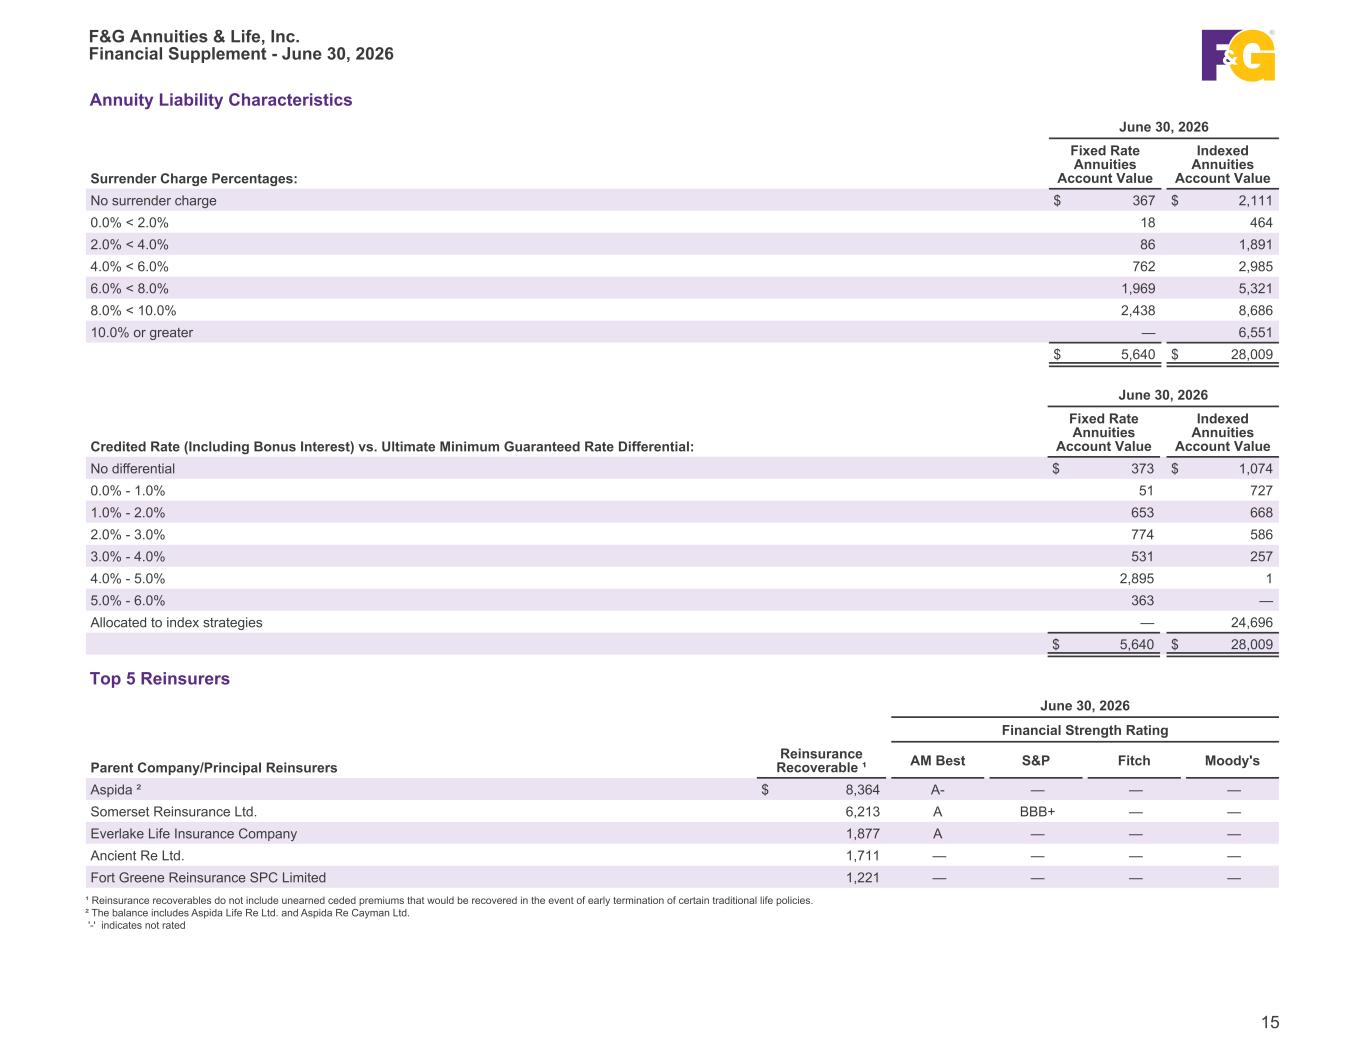

 
Annuity Liability Characteristics June 30, 2026 Surrender Charge Percentages: Fixed Rate Annuities Account Value Indexed Annuities Account Value No surrender charge $ 367 $ 2,111 0.0% < 2.0% 18 464 2.0% < 4.0% 86 1,891 4.0% < 6.0% 762 2,985 6.0% < 8.0% 1,969 5,321 8.0% < 10.0% 2,438 8,686 10.0% or greater — 6,551 $ 5,640 $ 28,009 June 30, 2026 Credited Rate (Including Bonus Interest) vs. Ultimate Minimum Guaranteed Rate Differential: Fixed Rate Annuities Account Value Indexed Annuities Account Value No differential $ 373 $ 1,074 0.0% - 1.0% 51 727 1.0% - 2.0% 653 668 2.0% - 3.0% 774 586 3.0% - 4.0% 531 257 4.0% - 5.0% 2,895 1 5.0% - 6.0% 363 — Allocated to index strategies — 24,696 $ 5,640 $ 28,009 Top 5 Reinsurers June 30, 2026 Financial Strength Rating Parent Company/Principal Reinsurers Reinsurance Recoverable ¹ AM Best S&P Fitch Moody's Aspida ² $ 8,364 A- — — — Somerset Reinsurance Ltd. 6,213 A BBB+ — — Everlake Life Insurance Company 1,877 A — — — Ancient Re Ltd. 1,711 — — — — Fort Greene Reinsurance SPC Limited 1,221 — — — — ¹ Reinsurance recoverables do not include unearned ceded premiums that would be recovered in the event of early termination of certain traditional life policies. ² The balance includes Aspida Life Re Ltd. and Aspida Re Cayman Ltd. '-' indicates not rated F&G Annuities & Life, Inc. Financial Supplement - June 30, 2026 15
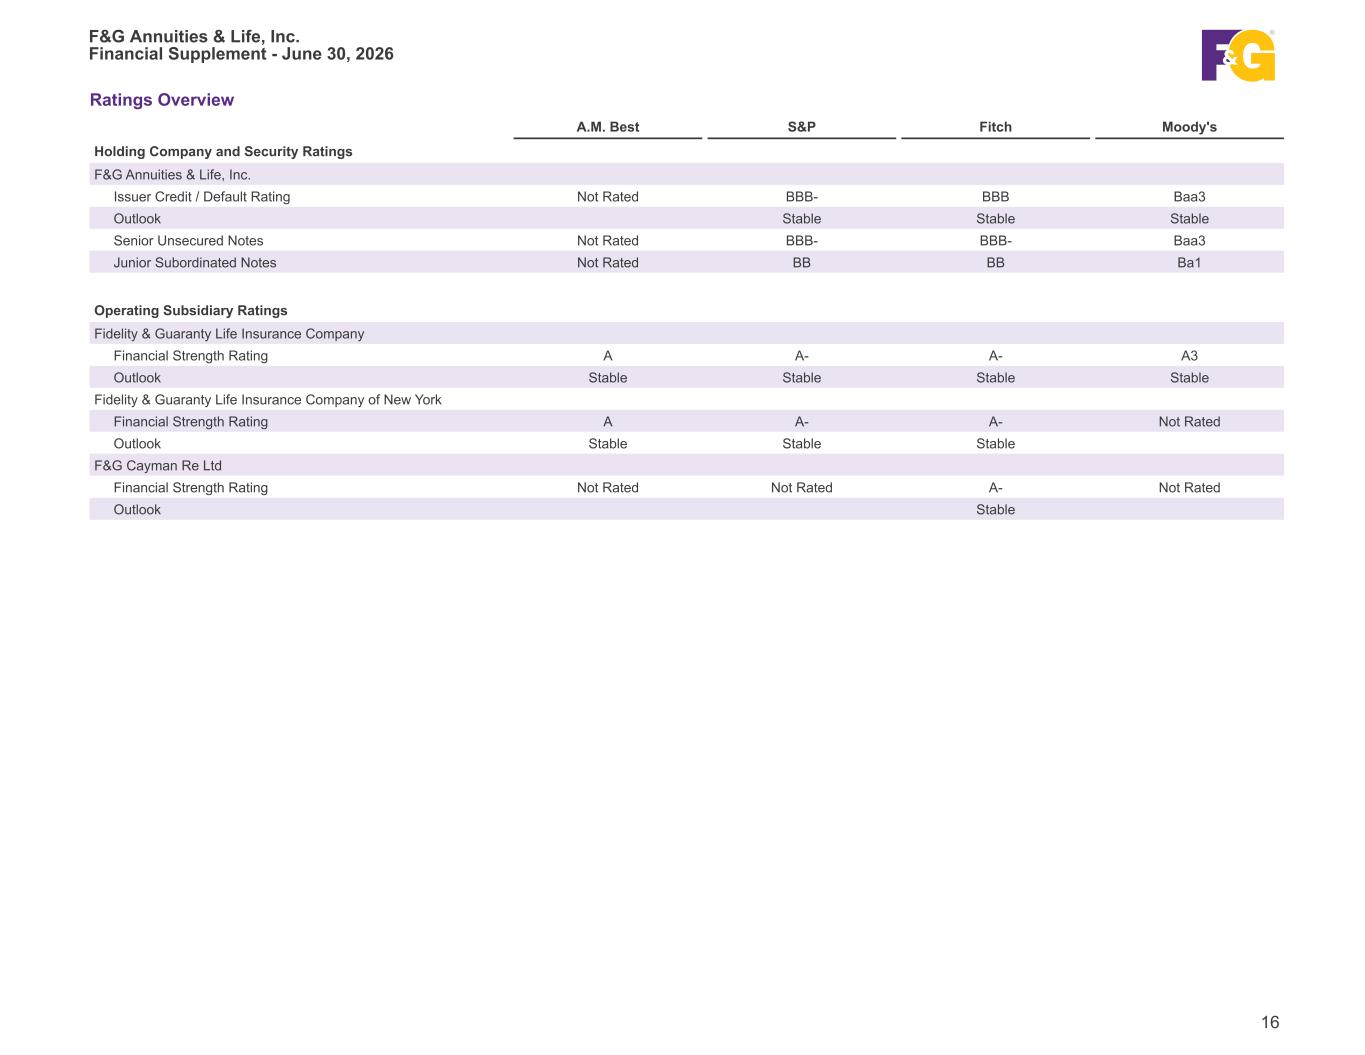

 
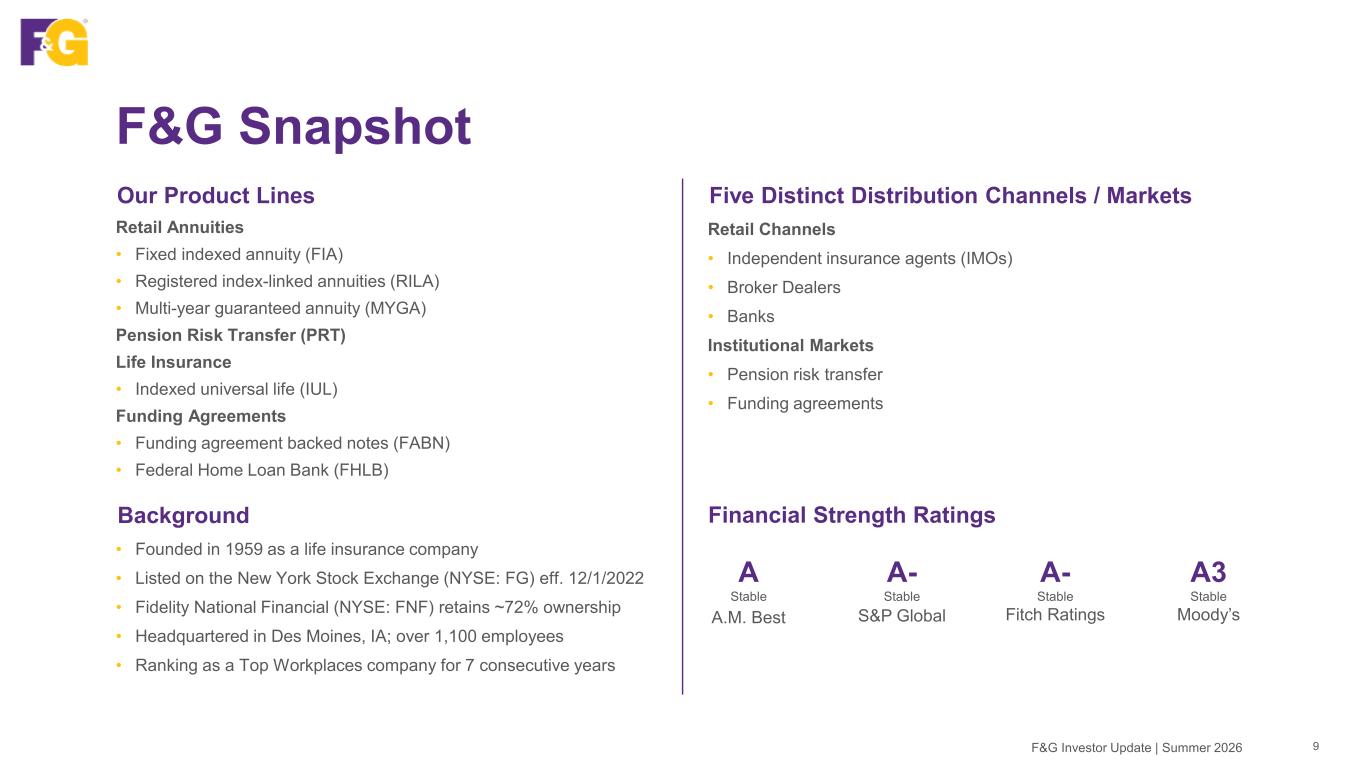
Ratings Overview A.M. Best S&P Fitch Moody's Holding Company and Security Ratings F&G Annuities & Life, Inc. Issuer Credit / Default Rating Not Rated BBB- BBB Baa3 Outlook Stable Stable Stable Senior Unsecured Notes Not Rated BBB- BBB- Baa3 Junior Subordinated Notes Not Rated BB BB Ba1 Operating Subsidiary Ratings Fidelity & Guaranty Life Insurance Company Financial Strength Rating A A- A- A3 Outlook Stable Stable Stable Stable Fidelity & Guaranty Life Insurance Company of New York Financial Strength Rating A A- A- Not Rated Outlook Stable Stable Stable F&G Cayman Re Ltd Financial Strength Rating Not Rated Not Rated A- Not Rated Outlook Stable F&G Annuities & Life, Inc. Financial Supplement - June 30, 2026 16
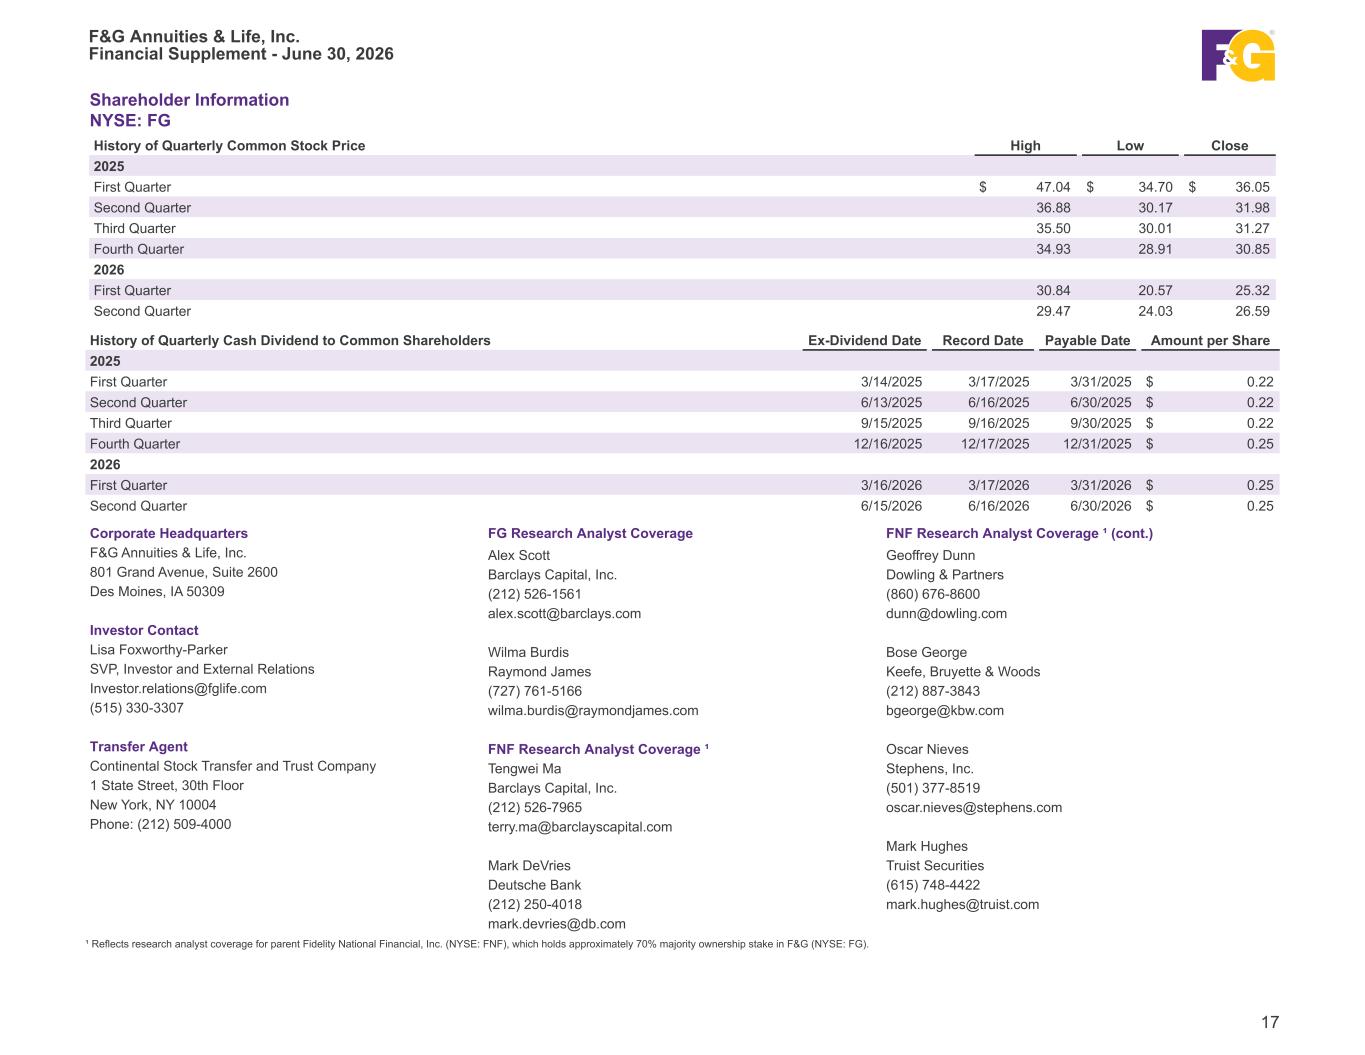

 
Shareholder Information NYSE: FG History of Quarterly Common Stock Price High Low Close 2025 First Quarter $ 47.04 $ 34.70 $ 36.05 Second Quarter 36.88 30.17 31.98 Third Quarter 35.50 30.01 31.27 Fourth Quarter 34.93 28.91 30.85 2026 First Quarter 30.84 20.57 25.32 Second Quarter 29.47 24.03 26.59 History of Quarterly Cash Dividend to Common Shareholders Ex-Dividend Date Record Date Payable Date Amount per Share 2025 First Quarter 3/14/2025 3/17/2025 3/31/2025 $ 0.22 Second Quarter 6/13/2025 6/16/2025 6/30/2025 $ 0.22 Third Quarter 9/15/2025 9/16/2025 9/30/2025 $ 0.22 Fourth Quarter 12/16/2025 12/17/2025 12/31/2025 $ 0.25 2026 First Quarter 3/16/2026 3/17/2026 3/31/2026 $ 0.25 Second Quarter 6/15/2026 6/16/2026 6/30/2026 $ 0.25 Corporate Headquarters FG Research Analyst Coverage FNF Research Analyst Coverage ¹ (cont.) F&G Annuities & Life, Inc. Alex Scott Geoffrey Dunn 801 Grand Avenue, Suite 2600 Barclays Capital, Inc. Dowling & Partners Des Moines, IA 50309 (212) 526-1561 (860) 676-8600 alex.scott@barclays.com dunn@dowling.com Investor Contact Lisa Foxworthy-Parker Wilma Burdis Bose George SVP, Investor and External Relations Raymond James Keefe, Bruyette & Woods Investor.relations@fglife.com (727) 761-5166 (212) 887-3843 (515) 330-3307 wilma.burdis@raymondjames.com bgeorge@kbw.com Transfer Agent FNF Research Analyst Coverage ¹ Oscar Nieves Continental Stock Transfer and Trust Company Tengwei Ma Stephens, Inc. 1 State Street, 30th Floor Barclays Capital, Inc. (501) 377-8519 New York, NY 10004 (212) 526-7965 oscar.nieves@stephens.com Phone: (212) 509-4000 terry.ma@barclayscapital.com Mark Hughes Mark DeVries Truist Securities Deutsche Bank (615) 748-4422 (212) 250-4018 mark.hughes@truist.com mark.devries@db.com ¹ Reflects research analyst coverage for parent Fidelity National Financial, Inc. (NYSE: FNF), which holds approximately 70% majority ownership stake in F&G (NYSE: FG). F&G Annuities & Life, Inc. Financial Supplement - June 30, 2026 17
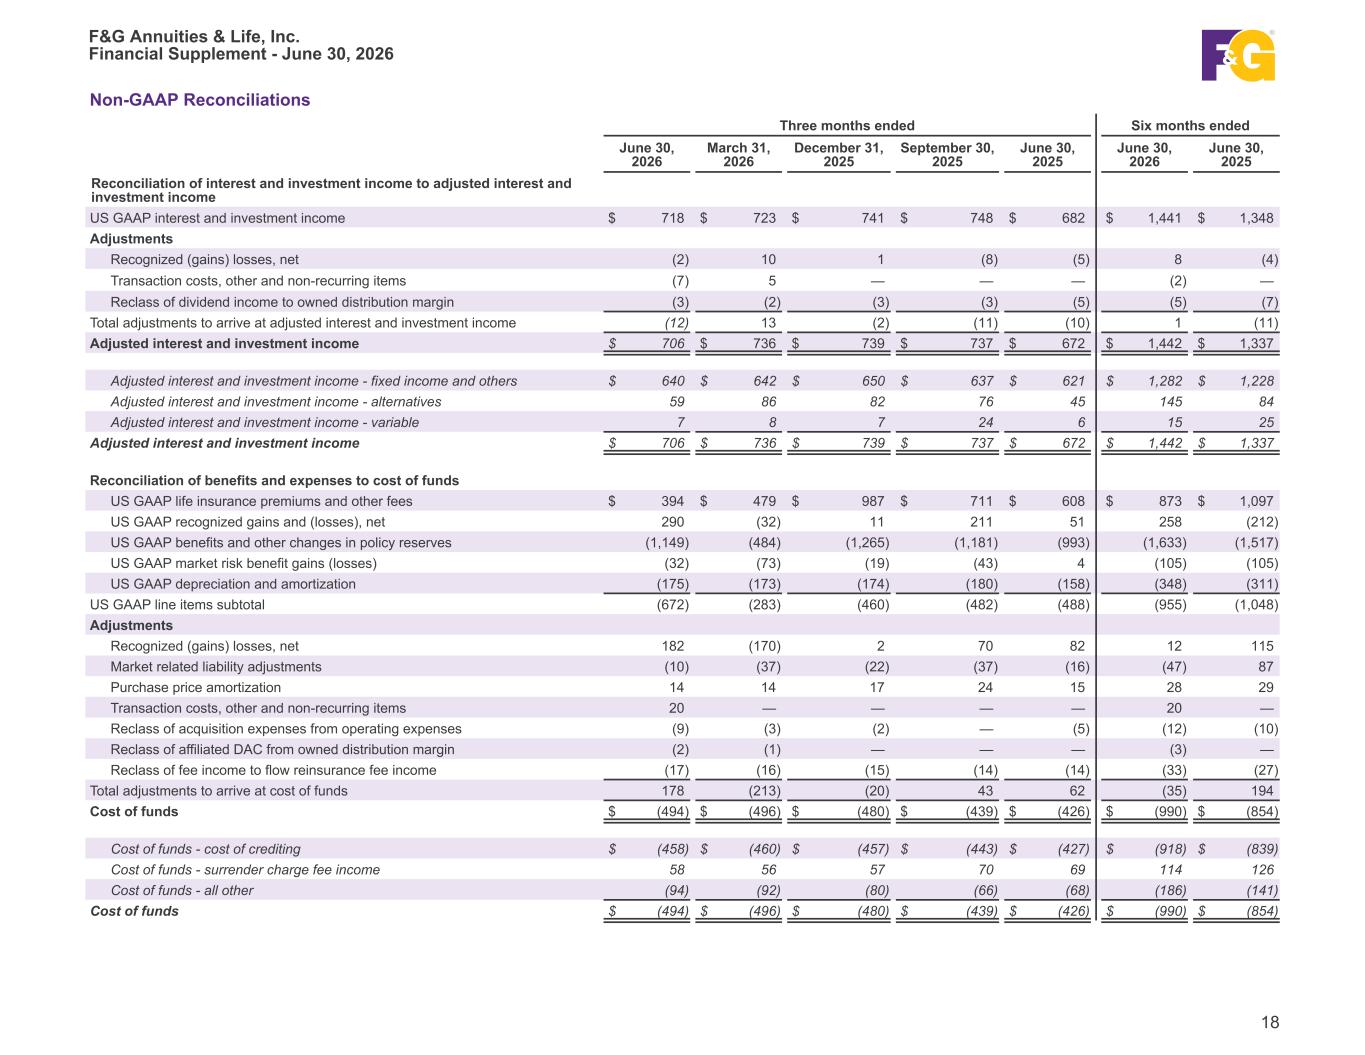

 
Non-GAAP Reconciliations Three months ended Six months ended June 30, 2026 March 31, 2026 December 31, 2025 September 30, 2025 June 30, 2025 June 30, 2026 June 30, 2025 Reconciliation of interest and investment income to adjusted interest and investment income US GAAP interest and investment income $ 718 $ 723 $ 741 $ 748 $ 682 $ 1,441 $ 1,348 Adjustments Recognized (gains) losses, net (2) 10 1 (8) (5) 8 (4) Transaction costs, other and non-recurring items (7) 5 — — — (2) — Reclass of dividend income to owned distribution margin (3) (2) (3) (3) (5) (5) (7) Total adjustments to arrive at adjusted interest and investment income (12) 13 (2) (11) (10) 1 (11) Adjusted interest and investment income $ 706 $ 736 $ 739 $ 737 $ 672 $ 1,442 $ 1,337 Adjusted interest and investment income - fixed income and others $ 640 $ 642 $ 650 $ 637 $ 621 $ 1,282 $ 1,228 Adjusted interest and investment income - alternatives 59 86 82 76 45 145 84 Adjusted interest and investment income - variable 7 8 7 24 6 15 25 Adjusted interest and investment income $ 706 $ 736 $ 739 $ 737 $ 672 $ 1,442 $ 1,337 Reconciliation of benefits and expenses to cost of funds US GAAP life insurance premiums and other fees $ 394 $ 479 $ 987 $ 711 $ 608 $ 873 $ 1,097 US GAAP recognized gains and (losses), net 290 (32) 11 211 51 258 (212) US GAAP benefits and other changes in policy reserves (1,149) (484) (1,265) (1,181) (993) (1,633) (1,517) US GAAP market risk benefit gains (losses) (32) (73) (19) (43) 4 (105) (105) US GAAP depreciation and amortization (175) (173) (174) (180) (158) (348) (311) US GAAP line items subtotal (672) (283) (460) (482) (488) (955) (1,048) Adjustments Recognized (gains) losses, net 182 (170) 2 70 82 12 115 Market related liability adjustments (10) (37) (22) (37) (16) (47) 87 Purchase price amortization 14 14 17 24 15 28 29 Transaction costs, other and non-recurring items 20 — — — — 20 — Reclass of acquisition expenses from operating expenses (9) (3) (2) — (5) (12) (10) Reclass of affiliated DAC from owned distribution margin (2) (1) — — — (3) — Reclass of fee income to flow reinsurance fee income (17) (16) (15) (14) (14) (33) (27) Total adjustments to arrive at cost of funds 178 (213) (20) 43 62 (35) 194 Cost of funds $ (494) $ (496) $ (480) $ (439) $ (426) $ (990) $ (854) Cost of funds - cost of crediting $ (458) $ (460) $ (457) $ (443) $ (427) $ (918) $ (839) Cost of funds - surrender charge fee income 58 56 57 70 69 114 126 Cost of funds - all other (94) (92) (80) (66) (68) (186) (141) Cost of funds $ (494) $ (496) $ (480) $ (439) $ (426) $ (990) $ (854) F&G Annuities & Life, Inc. Financial Supplement - June 30, 2026 18
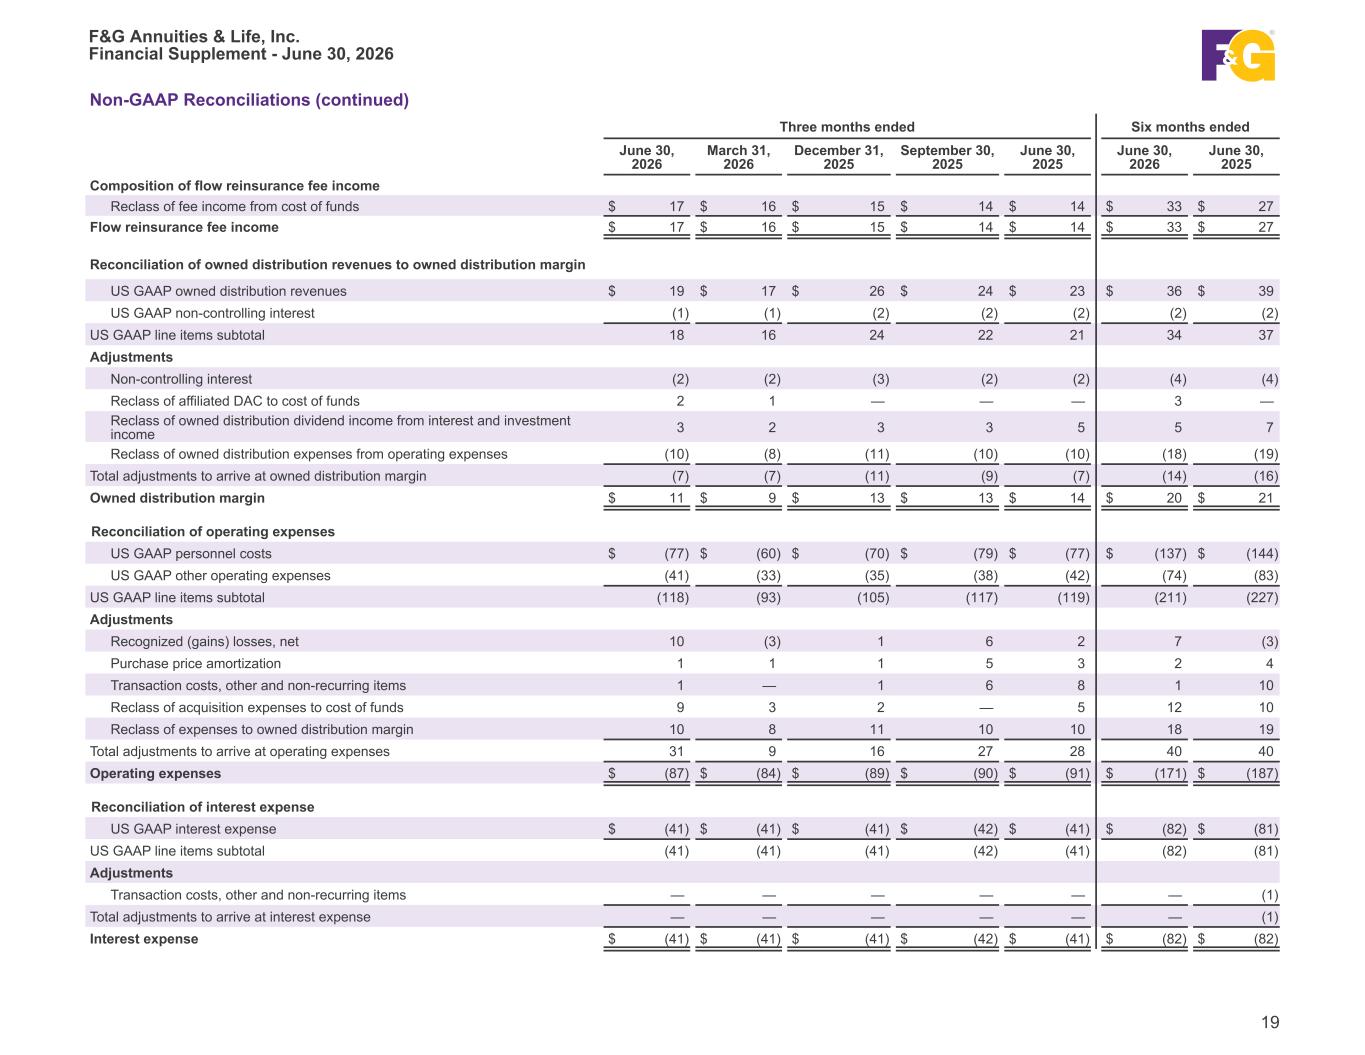

 
Non-GAAP Reconciliations (continued) Three months ended Six months ended June 30, 2026 March 31, 2026 December 31, 2025 September 30, 2025 June 30, 2025 June 30, 2026 June 30, 2025 Composition of flow reinsurance fee income Reclass of fee income from cost of funds $ 17 $ 16 $ 15 $ 14 $ 14 $ 33 $ 27 Flow reinsurance fee income $ 17 $ 16 $ 15 $ 14 $ 14 $ 33 $ 27 Reconciliation of owned distribution revenues to owned distribution margin US GAAP owned distribution revenues $ 19 $ 17 $ 26 $ 24 $ 23 $ 36 $ 39 US GAAP non-controlling interest (1) (1) (2) (2) (2) (2) (2) US GAAP line items subtotal 18 16 24 22 21 34 37 Adjustments Non-controlling interest (2) (2) (3) (2) (2) (4) (4) Reclass of affiliated DAC to cost of funds 2 1 — — — 3 — Reclass of owned distribution dividend income from interest and investment income 3 2 3 3 5 5 7 Reclass of owned distribution expenses from operating expenses (10) (8) (11) (10) (10) (18) (19) Total adjustments to arrive at owned distribution margin (7) (7) (11) (9) (7) (14) (16) Owned distribution margin $ 11 $ 9 $ 13 $ 13 $ 14 $ 20 $ 21 Reconciliation of operating expenses US GAAP personnel costs $ (77) $ (60) $ (70) $ (79) $ (77) $ (137) $ (144) US GAAP other operating expenses (41) (33) (35) (38) (42) (74) (83) US GAAP line items subtotal (118) (93) (105) (117) (119) (211) (227) Adjustments Recognized (gains) losses, net 10 (3) 1 6 2 7 (3) Purchase price amortization 1 1 1 5 3 2 4 Transaction costs, other and non-recurring items 1 — 1 6 8 1 10 Reclass of acquisition expenses to cost of funds 9 3 2 — 5 12 10 Reclass of expenses to owned distribution margin 10 8 11 10 10 18 19 Total adjustments to arrive at operating expenses 31 9 16 27 28 40 40 Operating expenses $ (87) $ (84) $ (89) $ (90) $ (91) $ (171) $ (187) Reconciliation of interest expense US GAAP interest expense $ (41) $ (41) $ (41) $ (42) $ (41) $ (82) $ (81) US GAAP line items subtotal (41) (41) (41) (42) (41) (82) (81) Adjustments Transaction costs, other and non-recurring items — — — — — — (1) Total adjustments to arrive at interest expense — — — — — — (1) Interest expense $ (41) $ (41) $ (41) $ (42) $ (41) $ (82) $ (82) F&G Annuities & Life, Inc. Financial Supplement - June 30, 2026 19
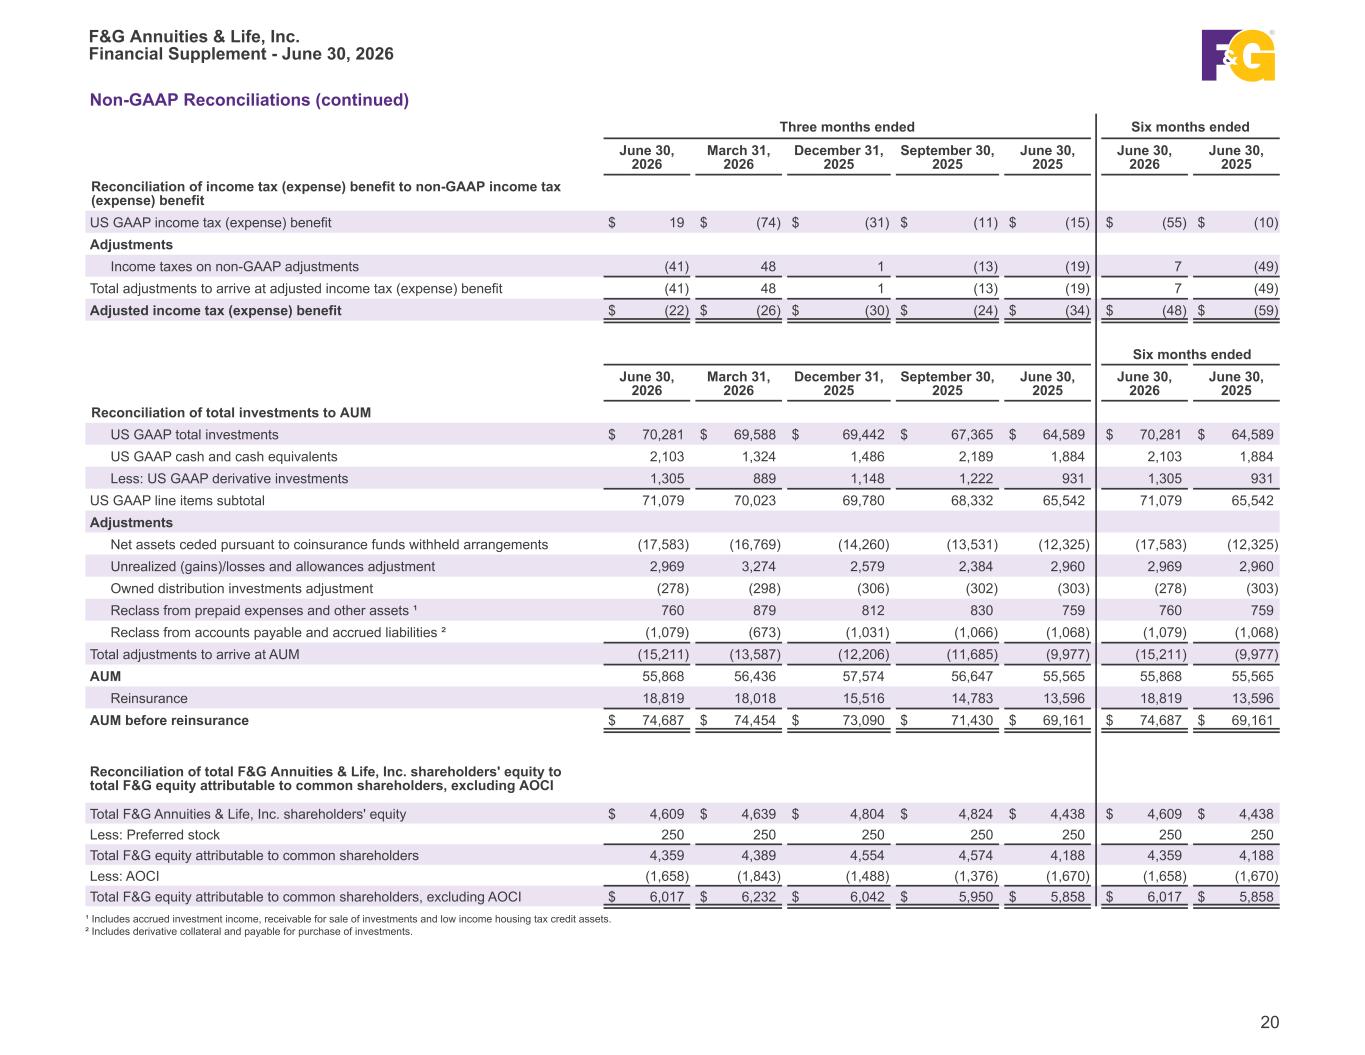

 
Non-GAAP Reconciliations (continued) Three months ended Six months ended June 30, 2026 March 31, 2026 December 31, 2025 September 30, 2025 June 30, 2025 June 30, 2026 June 30, 2025 Reconciliation of income tax (expense) benefit to non-GAAP income tax (expense) benefit US GAAP income tax (expense) benefit $ 19 $ (74) $ (31) $ (11) $ (15) $ (55) $ (10) Adjustments Income taxes on non-GAAP adjustments (41) 48 1 (13) (19) 7 (49) Total adjustments to arrive at adjusted income tax (expense) benefit (41) 48 1 (13) (19) 7 (49) Adjusted income tax (expense) benefit $ (22) $ (26) $ (30) $ (24) $ (34) $ (48) $ (59) Six months ended June 30, 2026 March 31, 2026 December 31, 2025 September 30, 2025 June 30, 2025 June 30, 2026 June 30, 2025 Reconciliation of total investments to AUM US GAAP total investments $ 70,281 $ 69,588 $ 69,442 $ 67,365 $ 64,589 $ 70,281 $ 64,589 US GAAP cash and cash equivalents 2,103 1,324 1,486 2,189 1,884 2,103 1,884 Less: US GAAP derivative investments 1,305 889 1,148 1,222 931 1,305 931 US GAAP line items subtotal 71,079 70,023 69,780 68,332 65,542 71,079 65,542 Adjustments Net assets ceded pursuant to coinsurance funds withheld arrangements (17,583) (16,769) (14,260) (13,531) (12,325) (17,583) (12,325) Unrealized (gains)/losses and allowances adjustment 2,969 3,274 2,579 2,384 2,960 2,969 2,960 Owned distribution investments adjustment (278) (298) (306) (302) (303) (278) (303) Reclass from prepaid expenses and other assets ¹ 760 879 812 830 759 760 759 Reclass from accounts payable and accrued liabilities ² (1,079) (673) (1,031) (1,066) (1,068) (1,079) (1,068) Total adjustments to arrive at AUM (15,211) (13,587) (12,206) (11,685) (9,977) (15,211) (9,977) AUM 55,868 56,436 57,574 56,647 55,565 55,868 55,565 Reinsurance 18,819 18,018 15,516 14,783 13,596 18,819 13,596 AUM before reinsurance $ 74,687 $ 74,454 $ 73,090 $ 71,430 $ 69,161 $ 74,687 $ 69,161 Reconciliation of total F&G Annuities & Life, Inc. shareholders' equity to total F&G equity attributable to common shareholders, excluding AOCI Total F&G Annuities & Life, Inc. shareholders' equity $ 4,609 $ 4,639 $ 4,804 $ 4,824 $ 4,438 $ 4,609 $ 4,438 Less: Preferred stock 250 250 250 250 250 250 250 Total F&G equity attributable to common shareholders 4,359 4,389 4,554 4,574 4,188 4,359 4,188 Less: AOCI (1,658) (1,843) (1,488) (1,376) (1,670) (1,658) (1,670) Total F&G equity attributable to common shareholders, excluding AOCI $ 6,017 $ 6,232 $ 6,042 $ 5,950 $ 5,858 $ 6,017 $ 5,858 ¹ Includes accrued investment income, receivable for sale of investments and low income housing tax credit assets. ² Includes derivative collateral and payable for purchase of investments. F&G Annuities & Life, Inc. Financial Supplement - June 30, 2026 20


Non-GAAP Measures Definitions Non-GAAP Measures Generally Accepted Accounting Principles ("GAAP") is the term used to refer to the standard framework of guidelines for financial accounting. GAAP includes the standards, conventions, and rules accountants follow in recording and summarizing transactions and in the preparation of financial statements. In addition to reporting financial results in accordance with GAAP, this document includes non-GAAP financial measures, which the Company believes are useful to help investors better understand its financial performance, competitive position and prospects for the future. Management believes these non-GAAP financial measures may be useful in certain instances to provide additional meaningful comparisons between current results and results in prior operating periods. Our non-GAAP measures may not be comparable to similarly titled measures of other organizations because other organizations may not calculate such non-GAAP measures in the same manner as we do. The presentation of this financial information is not intended to be considered in isolation of or as a substitute for, or superior to, the financial information prepared and presented in accordance with GAAP. By disclosing these non-GAAP financial measures, the Company believes it offers investors a greater understanding of, and an enhanced level of transparency into, the means by which the Company’s management operates the Company. Any non-GAAP measures should be considered in context with the GAAP financial presentation and should not be considered in isolation or as a substitute for GAAP net earnings, net earnings attributable to common shareholders, or any other measures derived in accordance with GAAP as measures of operating performance or liquidity. Reconciliations of these non-GAAP financial measures to the most directly comparable GAAP measures are provided within. The following represents the definitions of non-GAAP measures used by F&G: Adjusted Net Earnings Attributable to Common Shareholders Adjusted net earnings attributable to common shareholders (ANE) is a non-GAAP economic measure used to evaluate financial performance each period. ANE eliminates the impact of specific items that are not indicative of the underlying economics of our business, including certain market volatility, asymmetrical and noneconomic accounting, nonrecurring items and other income and expense adjustments. These items are volatile in our reported GAAP earnings and are not indicative of the underlying profitability drivers reflected in the design and pricing of our products and/or our investment and hedging strategy, as such items fluctuate from period to period in a manner inconsistent with these drivers. ANE provides information to enhance an investor’s understanding of our results and underlying profitability drivers by removing the impact of short-term market volatility (i.e. recognized gains and losses, market risk benefits remeasurement gains and losses, derivative gains and losses), asymmetrical and non-economic accounting (i.e. derivatives and investment hedges that do not qualify for hedge accounting, deferred pension risk transfer deferred profit liability losses), and other adjustments. ANE is calculated by adjusting net earnings or loss attributable to common shareholders to eliminate: (i) Recognized gains and losses, net: the impact of net investment gains/losses, including changes in allowance for expected credit losses and other than temporary impairment (“OTTI”) losses, recognized in operations; and the effects of changes in fair value of the reinsurance related embedded derivative and other derivatives, including interest rate swaps and forwards; (ii) Market related liability adjustments: the impacts related to changes in the fair value, including both realized and unrealized gains and losses, of index product related derivatives and embedded derivatives, net of hedging cost; the impact of initial pension risk transfer deferred profit liability losses, including amortization from previously deferred pension risk transfer deferred profit liability losses; and the changes in the fair value of market risk benefits by deferring current period changes and amortizing that amount over the life of the market risk benefit; (iii) Purchase price amortization: the impacts related to the amortization of certain intangibles (internally developed software, trademarks and value of distribution asset and the change in fair value of liabilities recognized as a result of acquisition activities); (iv) Transaction costs: the impacts related to acquisition, integration and merger related items; (v) Other and “non-recurring,” “infrequent” or “unusual items”: Other adjustments include removing any charges associated with U.S. guaranty fund assessments as these charges neither relate to the ordinary course of the Company’s business nor reflect the Company’s underlying business performance, but result from external situations not controlled by the Company. Further, Management excludes certain items determined to be “non-recurring,” “infrequent” or “unusual” from adjusted net earnings when incurred if it is determined these items are not a reflection of the core business and when the nature of the item is such that it is not reasonably likely to recur within two years and/or there was not a similar item in the preceding two years; (vi) Non-controlling interest on non-GAAP adjustments: the portion of the non-GAAP adjustments attributable to the equity interest of entities that F&G does not wholly own; and (vii) Income taxes: the income tax impact related to the above-mentioned adjustments is measured using an effective tax rate, as appropriate by tax jurisdiction. Recognized gains and losses are excluded from ANE as part of both adjustments (i) and (ii). As part of those two adjustments to ANE, all material recognized gains and losses are removed except for periodic settlements of interest rate swaps used to economically hedge our floating rate investments. While these adjustments are an integral part of the overall performance of F&G, market conditions and/or the non-operating nature of these items can overshadow the underlying performance of the core business. Accordingly, management considers this to be a useful measure internally and to investors and analysts in analyzing the trends of our operations. Adjusted net earnings should not be used as a substitute for net earnings (loss). However, we believe the adjustments made to net earnings (loss) in order to derive adjusted net earnings provide an understanding of our overall results of operations. F&G Annuities & Life, Inc. Financial Supplement - June 30, 2026 21

 
Non-GAAP Measures Definitions (continued) Adjusted Weighted Average Diluted Shares Outstanding Adjusted weighted average diluted shares outstanding is the same as weighted average diluted shares outstanding except for periods in which our preferred stocks are calculated to be dilutive to either net earnings attributable to common shareholders or adjusted net earnings attributable to common shareholders, but not both, or there is a net earnings loss attributable to common shareholders on a GAAP basis, but positive adjusted net earnings attributable to common shareholders using the non-GAAP measure. The above exceptions are made to include relevant diluted shares when dilution occurs and exclude relevant diluted shares when dilution does not occur for adjusted net earnings attributable to common shareholders. Management considers this non-GAAP financial measure to be useful internally and for investors and analysts to assess the level of return driven by the Company that is available to common shareholders. Adjusted Net Earnings attributable to common shareholders per Diluted Share Adjusted net earnings attributable to common shareholders per diluted share is calculated as adjusted net earnings plus preferred stock dividend (if the preferred stock has created dilution). This sum is then divided by the adjusted weighted-average diluted shares outstanding. Management considers this non-GAAP financial measure to be useful internally and for investors and analysts to assess the level of return driven by the Company that is available to common shareholders. Adjusted Return on Assets attributable to Common Shareholders Adjusted return on assets attributable to common shareholders is calculated by dividing year-to-date annualized adjusted net earnings attributable to common shareholders by year-to-date AAUM. Return on assets is comprised of net investment income, less cost of funds, flow reinsurance fee income, owned distribution margin and less expenses (including operating expenses, interest expense and income taxes) consistent with our adjusted net earnings definition and related adjustments. Cost of funds includes liability costs related to cost of crediting as well as other liability costs. Management considers this non-GAAP financial measure to be useful internally and to investors and analysts when assessing financial performance and profitability earned on AAUM. Adjusted Return on Average Common Shareholder Equity, excluding AOCI Adjusted return on average common shareholder equity is calculated by dividing the rolling four quarters adjusted net earnings attributable to common shareholders, by total average F&G equity attributable to common shareholders, excluding AOCI. Average equity attributable to common shareholders, excluding AOCI for the twelve month rolling period is the average of 5 points throughout the period. Since AOCI fluctuates from quarter to quarter due to unrealized changes in the fair value of available for sale investments, changes in instrument-specific credit risk for market risk benefits and discount rate assumption changes for the future policy benefits, management considers this non-GAAP financial measure to be a useful internally and for investors and analysts to assess the level return driven by the Company's adjusted earnings. Assets Under Management (AUM) AUM is comprised of the following components and is reported net of reinsurance assets ceded in accordance with GAAP: (i) total invested assets at amortized cost, excluding investments in unconsolidated affiliates, owned distribution and derivatives; (ii) investments in unconsolidated affiliates at carrying value; (iii) related party loans and investments; (iv) accrued investment income; (v) the net payable/receivable for the purchase/sale of investments; and (vi) cash and cash equivalents excluding derivative collateral at the end of the period. Management considers this non-GAAP financial measure to be useful internally and to investors and analysts when assessing the size of our investment portfolio that is retained. AUM before Reinsurance AUM before Reinsurance is comprised of AUM plus flow reinsured assets, including certain block reinsured assets. Management considers this non-GAAP financial measure to be useful internally and to investors and analysts when assessing the size of our investment portfolio including reinsured assets. F&G Annuities & Life, Inc. Financial Supplement - June 30, 2026 22


Non-GAAP Measures Definitions (continued) Average Assets Under Management (AAUM) (Quarterly and YTD) AAUM is calculated as AUM at the beginning of the period and the end of each month in the period, divided by the total number of months in the period plus one. Management considers this non-GAAP financial measure to be useful internally and to investors and analysts when assessing the rate of return on retained assets. Book Value per Common Share, excluding AOCI Book value per Common share, excluding AOCI is calculated as total F&G equity attributable to common shareholders divided by the total number of shares of common stock outstanding. Management considers this to be a useful measure internally and for investors and analysts to assess the capital position of the Company. Return on Average F&G common shareholder Equity, excluding AOCI Return on average F&G common shareholder equity, excluding AOCI is calculated by dividing the rolling four quarters net earnings (loss) attributable to common shareholders, by total average F&G equity attributable to common shareholders, excluding AOCI. Average F&G equity attributable to common shareholders, excluding AOCI for the twelve month rolling period is the average of 5 points throughout the period. Since AOCI fluctuates from quarter to quarter due to unrealized changes in the fair value of available for sale investments, changes in instrument-specific credit risk for market risk benefits and discount rate assumption changes for the future policy benefits, management considers this non-GAAP financial measure to be useful internally and for investors and analysts to assess the level of return driven by the Company that is available to common shareholders. Sales Annuity, IUL, funding agreement and non-life contingent PRT sales are not derived from any specific GAAP income statement accounts or line items and should not be viewed as a substitute for any financial measure determined in accordance with GAAP. Sales from these products are recorded as deposit liabilities (i.e., contractholder funds) within the Company's consolidated financial statements in accordance with GAAP. Life contingent PRT sales are recorded as premiums in revenues within the consolidated financial statements. Management believes that presentation of sales, as measured for management purposes, enhances the understanding of our business and helps depict longer term trends that may not be apparent in the results of operations due to the timing of sales and revenue recognition. Total Capitalization, excluding AOCI Total capitalization, excluding AOCI is based on total equity excluding the effect of AOCI and the total aggregate principal amount of debt. Since AOCI fluctuates from quarter to quarter due to unrealized changes in the fair value of available for sale investments, changes in instrument-specific credit risk for market risk benefits and discount rate assumption changes for the future policy benefits, management considers this non-GAAP financial measure to provide useful supplemental information internally and to investors and analysts to help assess the capital position of the Company. Debt-to-Capitalization Ratio, excluding AOCI Debt-to-capitalization ratio is computed by dividing total aggregate principal amount of debt by total capitalization (total debt plus total equity, excluding AOCI). Management considers this non-GAAP financial measure to be useful internally and to investors and analysts when assessing its capital position. Total Equity, excluding AOCI Total equity, excluding AOCI is based on total equity excluding the effect of AOCI. Since AOCI fluctuates from quarter to quarter due to unrealized changes in the fair value of available for sale investments, changes in instrument-specific credit risk for market risk benefits and discount rate assumption changes for the future policy benefits, management considers this non-GAAP financial measure to provide useful supplemental information internally and to investors and analysts assessing the level of earned equity on total equity. Total F&G Equity attributable to common shareholders, excluding AOCI Total F&G equity attributable to common shareholder, excluding AOCI is based on total F&G Annuities & Life, Inc. shareholders' equity excluding the effect of AOCI and preferred stocks, including additional paid-in-capital. Since AOCI fluctuates from quarter to quarter due to unrealized changes in the fair value of available for sale investments, changes in instrument-specific credit risk for market risk benefits and discount rate assumption changes for the future policy benefits, management considers this non-GAAP financial measure to be useful internally and for investors and analysts to assess the level of return driven by the Company that is available to common shareholders. Yield on AAUM Yield on AAUM is calculated by dividing annualized adjusted interest and investment income by AAUM. Management considers this non-GAAP financial measure to be useful internally and to investors and analysts when assessing the level of return earned on AAUM. F&G Annuities & Life, Inc. Financial Supplement - June 30, 2026 23


 
EX-99.3 4 fgsummer2026investorpres.htm EX-99.3 fgsummer2026investorpres
88 / 44 / 131 254 / 193 / 13 0 / 60 / 113132 / 189 / 0 255 / 152 / 0 130 / 70 / 175 87 / 88 / 90 Primary colors Secondary colors Default text color F&G Investor Update Summer 2026


88 / 44 / 131 254 / 193 / 13 0 / 60 / 113132 / 189 / 0 255 / 152 / 0 130 / 70 / 175 87 / 88 / 90 Primary colors Secondary colors Default text color Disclaimer & Forward-Looking Statements 2F&G Investor Update | Summer 2026 This presentation contains forward-looking statements that are subject to known and unknown risks and uncertainties, many of which are beyond our control. Some of the forward-looking statements can be identified by the use of terms such as “believes”, “expects”, “may”, “will”, “could”, “seeks”, “intends”, “plans”, “estimates”, “anticipates” or other comparable terms. Statements that are not historical facts, including statements regarding our expectations, hopes, intentions or strategies regarding the future are forward-looking statements. Forward-looking statements are based on management's beliefs, as well as assumptions made by, and information currently available to, management. Because such statements are based on expectations as to future financial and operating results and are not statements of fact, actual results may differ materially from those projected. We undertake no obligation to update any forward-looking statements, whether as a result of new information, future events or otherwise. The risks and uncertainties which forward-looking statements are subject to include, but are not limited to: general economic conditions and other factors, including prevailing interest and unemployment rate levels and stock and credit market performance; consumer spending; government spending; the volatility and strength of the capital markets; investor and consumer confidence; foreign currency exchange rates; commodity prices; inflation levels; changes in trade policy; tariffs and trade sanctions on goods; trade wars; supply chain disruptions; natural disasters, public health crises, international tensions and conflicts, geopolitical events, terrorist acts, labor strikes, political crisis, accidents and other events; concentration in certain states for distribution of our products; the impact of interest rate fluctuations; equity market volatility or disruption; the impact of credit risk of our counterparties; changes in our assumptions and estimates regarding amortization of our deferred acquisition costs, deferred sales inducements and value of business acquired balances; regulatory changes or actions, including those relating to regulation of financial services affecting (among other things) underwriting of insurance products and regulation of the sale, underwriting and pricing of products and minimum capitalization and statutory reserve requirements for insurance companies, or the ability of our insurance subsidiaries to make cash distributions to us; and other factors discussed in “Risk Factors” and other sections of F&G's Form 10-K and other filings with the Securities and Exchange Commission (SEC).


88 / 44 / 131 254 / 193 / 13 0 / 60 / 113132 / 189 / 0 255 / 152 / 0 130 / 70 / 175 87 / 88 / 90 Primary colors Secondary colors Default text color Non-GAAP Financial Measures 3F&G Investor Update | Summer 2026 Generally Accepted Accounting Principles in the U.S. ("GAAP") is the term used to refer to the standard framework of guidelines for financial accounting. GAAP includes the standards, conventions, and rules accountants follow in recording and summarizing transactions and in the preparation of financial statements. In addition to reporting financial results in accordance with GAAP, this document includes non-GAAP financial measures, which the Company believes are useful to help investors better understand its financial performance, competitive position and prospects for the future. Management believes these non-GAAP financial measures may be useful in certain instances to provide additional meaningful comparisons between current results and results in prior operating periods. Our non-GAAP financial measures may not be comparable to similarly titled measures of other organizations because other organizations may not calculate such non-GAAP financial measures in the same manner as we do. The presentation of this financial information is not intended to be considered in isolation of or as a substitute for, or superior to, the financial information prepared and presented in accordance with GAAP. By disclosing these non-GAAP financial measures, the Company believes it offers investors a greater understanding of, and an enhanced level of transparency into, the means by which the Company’s management operates the Company. Any non-GAAP financial measures should be considered in context with the Company’s GAAP financial presentation and should not be considered in isolation or as a substitute for GAAP net earnings, net earnings attributable to common shareholders, or any other measures derived in accordance with GAAP as measures of operating performance or liquidity. Reconciliations of these non-GAAP financial measures to the most directly comparable GAAP measures are provided within.


88 / 44 / 131 254 / 193 / 13 0 / 60 / 113132 / 189 / 0 255 / 152 / 0 130 / 70 / 175 87 / 88 / 90 Primary colors Secondary colors Default text color We are executing on our strategy toward a more fee-based, higher margin, and less capital intensive business model and remain focused on delivering long-term shareholder value $195M 1H26 Adjusted Net Earnings2 ↑ 1% vs. 1H25 2Q26 Highlights 4F&G Investor Update | Summer 2026 1As of 6/30/2026 2Attributable to common shareholders $2.7B 2Q26 Gross Sales: Total ↓ 34% vs. 2Q25 $1.5B 2Q26 Net Sales ↓ 44% vs. 2Q25 $55.9B Assets Under Management (AUM)1 ↑ 1% vs. 2Q25 $74.7B AUM before reinsurance1 ↑ 8% vs. 2Q25 $195M 1H26 Capital Return to Shareholders ↑ 200% vs. 1H25 $6.0B Total F&G Equity ex AOCI1, 2 ↑ 2% vs. 2Q25 $1.8B 2Q26 Gross Sales: Core Retail One of our strongest on record $85 2Q26 Adjusted Net Earnings2 ↓ 17% vs. 2Q25


88 / 44 / 131 254 / 193 / 13 0 / 60 / 113132 / 189 / 0 255 / 152 / 0 130 / 70 / 175 87 / 88 / 90 Primary colors Secondary colors Default text color Second Quarter Financial Trends 5F&G Investor Update | Summer 2026 Other Considerations – Year-to-Date Other Considerations – Quarterly Financial Trends – As Reported ($M) – except per share and percentages Quarterly Year-to-Date 2Q25 2Q26 1H25 1H26 Gross sales $4,106 $2,719 $7,008 $5,892 Net sales $2,744 $1,464 $4,925 $3,709 Assets under management (AUM) $55,565 $55,868 $55,565 $55,868 AUM before reinsurance $69,161 $74,687 $69,161 $74,687 Adjusted return on assets (ROA)1 0.71% 0.68% 0.71% 0.68% Adjusted return on equity (ROE)1 8.8% 8.0% 8.8% 8.0% Net earnings (loss)1 $35 ($81) $10 $163 Net earnings (loss) per diluted share1 $0.26 ($0.62) $0.08 $1.24 Adjusted net earnings (ANE)1 $103 $85 $194 $195 Adjusted net earnings per diluted share1 $0.77 $0.65 $1.48 $1.49 Adjusted weighted average diluted shares 134 130 131 131 ANE ($M) and Per Share 2Q25 2Q26 ($M) Per share ($M) Per share Investment income from alternative investments (above) below long-term return expectations 67 $0.50 49 $0.38 Significant (income) expense items - $0.00 - $0.00 ANE ($M) and Per Share 1H25 1H26 ($M) Per share ($M) Per share Investment income from alternative investments (above) below long-term return expectations 112 $0.86 93 $0.71 Significant (income) expense items (16) ($0.12) 5 $0.04 1Attributable to common shareholders


88 / 44 / 131 254 / 193 / 13 0 / 60 / 113132 / 189 / 0 255 / 152 / 0 130 / 70 / 175 87 / 88 / 90 Primary colors Secondary colors Default text color F&G Is At A Highly Attractive Valuation Progression of F&G Transaction Prices & Market Capitalization F&G’s strong dividend payout and our launch of share repurchases during the first half of 2026 reflect our confidence in the long-term prospects for the business as well as our strong capital position • FNF completed the distribution of ~12% of F&G common stock to FNF shareholders on December 31, 2025, increasing F&G’s public float from ~18% to ~30% after the distribution • We have grown our book value per share ex AOCI to $45.93, ↑ 68% since the 2020 acquisition and reported GAAP equity ex AOCI of $6.0B at QE 2Q26 1CF Corporation (CF Corp) was founded by Chinh Chu and William Foley as a U.S.-listed special purpose acquisition company (SPAC) 2Attributable to common shareholders F&G Investor Update | Summer 2026 6 $1.8B $2.7B $2.4B $4.2B $3.7B $6.0B Nov 30, 2017 Jun 1, 2020 Dec 1, 2022 Dec 31, 2025 July 31, 2026 Jun 30, 2026 Purchase price by CF Corp1 Purchase price by FNF F&G market cap at partial spinoff F&G market cap F&G GAAP Equity ex AOCI2 F&G market cap at partial spinoff


88 / 44 / 131 254 / 193 / 13 0 / 60 / 113132 / 189 / 0 255 / 152 / 0 130 / 70 / 175 87 / 88 / 90 Primary colors Secondary colors Default text color We Have Generated Sustainable Returns 7F&G Investor Update | Summer 2026 1Calculated as F&G equity attributable to common shareholders ex AOCI divided by common shares outstanding; effect of LDTI, actuarial system conversion and sale of F&G Life Re reflected in 1x items Book Value Per Share (BVPS) ex AOCI1 Cumulative period from YE 2020 to QE 2Q26 $27.40 $43.42 $45.93 19.02 (3.00) 2.51 YE 2020 Net Earnings Capital Actions BVPS Before MTM MTM & 1x Items QE 2Q26 Strong earnings generation combined with balanced capital allocation since 2020 acquisition by FNF have been driving steady BVPS growth, before mark-to-market (MTM) movements which are unrealized and point in time +68% BVPS Growth


88 / 44 / 131 254 / 193 / 13 0 / 60 / 113132 / 189 / 0 255 / 152 / 0 130 / 70 / 175 87 / 88 / 90 Primary colors Secondary colors Default text color We Are Driving Toward Our Investor Day Targets • Spread-based earnings • Driven by asset growth • Margin expansion through investment margin & scale benefit Retained Sales • Fee-based earnings • Lower marginal cost of capital • Enhances cash flow • Accretive to return on equity • Reinsurance sidecar Flow Reinsurance • Fee-based earnings • Lower marginal cost of capital • Accretive to return on equity • Solidifies relationships with key partners F&G is transitioning its business toward a more fee based, higher margin and less capital intensive business with strong cash flow generation and ROE expansion in future years Grow AUM by 50% Increase adjusted ROE ex AOCI and significant items to 13 to 14%1 Expand adjusted ROA ex significant items to 1.33% to 1.55%1; expect to maintain a corridor around the lower end of the range Expand our P/E multiple to 7-8x We continue to make strong progress toward the medium term financial targets laid out at our 2023 Investor Day: F&G Investor Update | Summer 2026 8 12023 Investor Day targets assumed alternative investments investment income based on management’s long-term expected return Middle Market Life & Owned Distribution


88 / 44 / 131 254 / 193 / 13 0 / 60 / 113132 / 189 / 0 255 / 152 / 0 130 / 70 / 175 87 / 88 / 90 Primary colors Secondary colors Default text color F&G Snapshot 9F&G Investor Update | Summer 2026 Retail Annuities • Fixed indexed annuity (FIA) • Registered index-linked annuities (RILA) • Multi-year guaranteed annuity (MYGA) Pension Risk Transfer (PRT) Life Insurance • Indexed universal life (IUL) Funding Agreements • Funding agreement backed notes (FABN) • Federal Home Loan Bank (FHLB) • Founded in 1959 as a life insurance company • Listed on the New York Stock Exchange (NYSE: FG) eff. 12/1/2022 • Fidelity National Financial (NYSE: FNF) retains ~72% ownership • Headquartered in Des Moines, IA; over 1,100 employees • Ranking as a Top Workplaces company for 7 consecutive years Retail Channels • Independent insurance agents (IMOs) • Broker Dealers • Banks Institutional Markets • Pension risk transfer • Funding agreements Our Product Lines Five Distinct Distribution Channels / Markets Background Financial Strength Ratings A Stable A.M. Best A- Stable S&P Global A- Stable Fitch Ratings A3 Stable Moody’s


88 / 44 / 131 254 / 193 / 13 0 / 60 / 113132 / 189 / 0 255 / 152 / 0 130 / 70 / 175 87 / 88 / 90 Primary colors Secondary colors Default text color A Compelling Investment Case For F&G 10F&G Investor Update | Summer 2026 v Proven Track Record: Steady Earnings Growth & Capital Flexibility F&G has successfully executed on our diversified growth strategy, maintained a strong capital position and made significant progress toward our 2023 Investor Day targets. We are positioned for steady long-term earnings growth through disciplined pricing, significant scale benefit and an increasing mix of more stable, predictable and less capital intensive fee-based sources of earnings v Targeting Large, Growing Markets For Continued AUM Growth F&G’s ecosystem has evolved and is built on our expanding relationships with key long-term distribution partners, a differentiated asset management approach powered by Blackstone’s best-in-class asset origination with a proven track record and complemented by other asset managers, and strategic relationships with reinsurers that provide efficient access to substantial external capital F&G is a nationwide leader strategically positioned within large, growing markets, benefiting from powerful demographic trends that are fueling sustainable demand for guaranteed income solutions. Our disciplined focus on our core products – including indexed annuities, middle market life insurance and pension risk transfer – will continue to drive AUM growth with attractive and stable liabilities Evolved Ecosystem Spans Distribution, Investments & Reinsurers Strategic Shift To Fee-Based, Less Capital Intensive For Enhanced Returns F&G is rapidly transforming into a more fee-based, higher margin and less capital intensive business. Increased earnings contributions from fee-based flow reinsurance, middle market life insurance and owned distribution strategies, coupled with disciplined growth in spread-based products, is set to generate higher returns and valuation over time


88 / 44 / 131 254 / 193 / 13 0 / 60 / 113132 / 189 / 0 255 / 152 / 0 130 / 70 / 175 87 / 88 / 90 Primary colors Secondary colors Default text color We Have A Clean & Profitable Inforce Book 11F&G Investor Update | Summer 2026 Our inforce liabilities are surrender charge protected and our asset and liability cash flows are well matched; our inforce book does not contain problematic legacy business • Our liability profile drives our investment strategy • Retail fixed annuities are 93% surrender protected1 • Non-surrenderable liabilities include funding agreements, pension risk transfer and immediate annuities • New business and inforce are actively managed to maintain pricing targets • Asset and liability cash flows are well matched 1As of 6/30/2026 GAAP Net Reserves1 53% Indexed annuities 15% Pension risk transfer 12% Funding agreements 11% Fixed rate annuities 6% Life 3% Immediate annuities $55B Retail Fixed Annuity Metrics QE 2Q26 Weighted average time remaining in surrender charge period 5.3 Years % Surrender protected 93% Average remaining surrender charge (% of account value) 7% % Subject to market value adjustment (MVA) 82% Distance to guaranteed minimum crediting rates 229 bps


88 / 44 / 131 254 / 193 / 13 0 / 60 / 113132 / 189 / 0 255 / 152 / 0 130 / 70 / 175 87 / 88 / 90 Primary colors Secondary colors Default text color We Compete In Very Large Markets 12F&G Investor Update | Summer 2026 The U.S. retirement and middle markets are growing and we are both well established and well positioned in our retail channels and institutional markets to grow our AUM 11Q26 Quarterly Retirement Market Data, Investment Company Institute. 2Personal savings in the U.S. per Federal Reserve Bank of St. Louis as of 5/1/2026. 3FY2025 U.S. retail life sales (annualized premium) and U.S. individual annuity sales per LIMRA. 41Q26 U.S. Pension Risk Transfer Single Premium Sales, Source LIMRA, 7/1/2026. 5Banner Life William Penn, Pension Risk Transfer Monitor, 2Q26, 6Board of Governors of the Federal Reserve System, Funding Agreement-Backed Securities (FABS) as of 3/31/2026 Indexed annuities provide alternative with upside potential and limited downside risk Consumers increasingly rely on personal savings for retirement income Transaction volume likely to continue5 Untapped demand for permanent life insurance, especially in the Middle Market Mutual Fund 401(k) Assets1 U.S. Consumer Savings2 Retail Life & Annuities3 Pension Risk Transfer4 Funding Agreements6 $5.7T $704B $341B $479B $291B


88 / 44 / 131 254 / 193 / 13 0 / 60 / 113132 / 189 / 0 255 / 152 / 0 130 / 70 / 175 87 / 88 / 90 Primary colors Secondary colors Default text color 58 63 71 76 78 80 82 2022 2025 2030 2035 2040 2045 2050 Secular Tailwinds Driving Industry Demand 13F&G Investor Update | Summer 2026 We continue to see sustainable demand for our retail fixed annuity products given current environment • We serve a growing retirement population, with more than 11,000 Americans turning 65 every day and a projected 30% increase in people aged 65-100 over the next 25 years • Attractive demographics support growing demand for our products, as both retirees and advisors turn to fixed annuities as an alternative to the traditional 60/40 investment portfolio • U.S. consumers are holding $3 trillion in retail money market fund assets; once money market rates decline, they are expected to lock in higher interest rates through attractive solutions like fixed annuities 1Source: U.S. Census Bureau, Population Division; Projected Population by Age Group and Sex for the United States, Main Series: 2022-2100 (Released Nov 2023) 2Source: Investment Company Institute (ICI); periods prior to 2024 reflect “total” all money market funds U.S. Money Market Fund Assets ($Trillions)2 Projected U.S. Population: Ages 65-100 (Millions)1 Number of people aged 65-100 is projected to increase 30% over the next 25 years 4.1 4.7 4.8 2.7 3.1 3.1 4.3 4.7 4.7 5.9 6.8 7.8 7.9 YE 2020 YE 2021 YE 2022 YE 2023 YE 2024 YE 2025 QE 2Q26 Combined Institutional only Retail only


88 / 44 / 131 254 / 193 / 13 0 / 60 / 113132 / 189 / 0 255 / 152 / 0 130 / 70 / 175 87 / 88 / 90 Primary colors Secondary colors Default text color 2019 2020 2021 2022 2023 2024 2025 2Q26 LTM FNF and F&G Merger (June 2020) $26.4B $28.6B $37.3B $46.4B $55.9B $65.3B $73.1B $74.7B Our Strong Sales Are Driving Record AUM 14F&G Investor Update | Summer 2026 1CAGR reflects 2019 to 2Q26 LTM AUM and Annual Gross Sales by Retail Channel and Institutional Market ($B) Funding Agreements Indexed Annuities Fixed Rate Annuities (MYGA) Indexed Universal Life Pension Risk Transfer $11.3B $9.6B $4.5B $3.9B $13.2B $15.3B $14.6B AUM before reinsurance +17% CAGR1 Gross Sales +21% CAGR1 $13.5B


88 / 44 / 131 254 / 193 / 13 0 / 60 / 113132 / 189 / 0 255 / 152 / 0 130 / 70 / 175 87 / 88 / 90 Primary colors Secondary colors Default text color Our Owned Distribution Track Record 15F&G Investor Update | Summer 2026 Our owned distribution strategy is a capital light, diversified source of fee-based earnings; we have launched a process to explore strategic alternatives for Peak Altitude Portfolio is performing well and creating value • Owned distribution margin driven by seasonality, timing of dividends, mix of business & affiliated vs. unaffiliated sales • Owned distribution margin of $20M in 1H26, including $11M in 2Q26 (ANE) • Adjusted ROA contribution of 7 bps in 2Q26 (ANE) • GAAP reporting items to note: • Owned distribution margin reflects dividend income from minority-owned interests, plus percent share of margin for majority-owned interests • Affiliated revenue from F&G products sold by owned distribution is reflected in our product margin1, not the owned distribution margin Life Network Marketing IMO Traditional Annuity IMO “B2B” Annuity IMO Life Brokerage IMO ~$700M Cumulative investment 1Amount of affiliated revenue from F&G products sold by owned distribution and reflected in product margin (not the owned distribution margin): $17M in 1H26, including $9M in 2Q26


88 / 44 / 131 254 / 193 / 13 0 / 60 / 113132 / 189 / 0 255 / 152 / 0 130 / 70 / 175 87 / 88 / 90 Primary colors Secondary colors Default text color 9.2 9.0 9.0 4.0 4.0 6.1 5.6 4.5 3.0 1.9 15.3 14.6 13.5 7.0 5.9 2024 2025 2Q26 LTM 1H25 1H26 Opportunistic (MYGA and Funding agreements) Core (Indexed annuities, IUL and PRT) 53.8 57.6 55.9 55.6 55.9 11.5 15.5 18.8 13.6 18.8 65.3 73.1 74.7 69.2 74.7 2024 2025 2Q26 LTM 1H25 1H26 Cumulative net reinsurance to third parties Retained AUM 546 482 483 194 195 2024 2025 2Q26 LTM 1H25 1H26 Net Sales 10.6 10.0 8.8 4.9 3.7 Disciplined Focus In Current Environment Gross Sales ($B) AUM Before Reinsurance ($B) Common Adjusted Net Earnings (ANE) ($M) F&G Investor Update | Summer 2026 16 2025 VPY: 12% AAUM 51.6 55.4 55.6 54.5 56.9 (16%) VPY2025 VPY: (5%) +8% VPY See Appendix for details of significant items impacting ANE


88 / 44 / 131 254 / 193 / 13 0 / 60 / 113132 / 189 / 0 255 / 152 / 0 130 / 70 / 175 87 / 88 / 90 Primary colors Secondary colors Default text color AUM Growth Aligned With Disciplined Sales F&G Investor Update | Summer 2026 1Retained AUM reduced by $1.8B with F&G Life Re sale in 1Q26 and $0.8B FABN maturity in 2Q26 2Opportunistic sales vary depending on economics and market opportunity Core retail 6.9 6.9 7.2 1.7 1.7 2.0 1.7 1.8 Core institutional 2.3 2.1 1.8 0.5 0.5 0.8 0.3 0.2 Opportunistic2 6.1 5.6 4.5 1.9 2.0 0.6 1.2 0.7 Gross Sales 15.3 14.6 13.5 4.1 4.2 3.4 3.2 2.7 Net Sales 10.6 10.0 8.8 2.7 2.8 2.3 2.2 1.5 17 53.8 57.6 55.9 55.6 56.6 57.6 56.4 55.9 11.5 15.5 18.8 13.6 14.8 15.5 18.1 18.8 65.3 73.1 74.7 69.2 71.4 73.1 74.5 74.7 2024 2025 2Q26 LTM 2Q25 3Q25 4Q25 1Q26 2Q26 Cumulative net reinsurance to third parties Retained AUM AUM Before Reinsurance1 ($B) 2025 VPY: 12% 2Q26 VPY: 8% Gross AUM growth aligned with disciplined sales and capital allocation to highest return opportunities • AUM before reinsurance of $74.7B, ↑ 8% vs. 2Q25 • Retained AUM1 of $55.9B, ↑ 1% vs. 2Q25 • Gross sales of $2.7B in 2Q26 comprised of $2.0B core sales and $0.7B opportunistic sales • Core retail sales (indexed annuities and IUL) of $1.8B in 2Q26, continued momentum vs. $1.7B in 1Q26 and 2Q25 • Core institutional sales (PRT) of $0.2B in 2Q26, solid and as expected vs. $0.3B in 1Q26 and $0.5B in 2Q25 • Opportunistic sales of $0.7B in 2Q26 comprised of $0.6B funding agreements and $0.1B MYGA sales de- emphasized due to returns currently below our threshold • Net sales of $1.5B in 2Q26 reflect flow reinsurance at varying ceded amounts in line with capital targets


88 / 44 / 131 254 / 193 / 13 0 / 60 / 113132 / 189 / 0 255 / 152 / 0 130 / 70 / 175 87 / 88 / 90 Primary colors Secondary colors Default text color 546 482 483 103 165 123 110 85 2024 2025 2Q26 LTM 2Q25 3Q25 4Q25 1Q26 2Q26 Net earnings (loss) 622 248 401 35 114 124 244 (81) Op Exp (bps)1 60 50 47 56 52 50 48 47 ANE per share $4.30 $3.64 NM $0.77 $1.22 $0.91 $0.82 $0.65 Adj. ROA2 1.06% 0.87% 0.85% 0.71% 0.87% 0.87% 0.76% 0.68% Adj. ROE2 10.3% 8.2% 8.0% 8.8% 8.8% 8.2% 8.4% 8.0% Higher Quality Core Earnings Remain Attractive 18F&G Investor Update | Summer 2026 Common Adjusted Net Earnings (ANE) ($M) Note: Last twelve months (LTM). Not meaningful (NM) 1Op Exp (bps): Reflects LTM operating expense to AUM before reinsurance (bps) 2Attributable to common shareholders; metrics refer to return on assets (ROA) and adjusted return on equity ex AOCI (ROE) based on reported adjusted net earnings • 2Q26 Reported ANE of $85M vs. $110M in 1Q26 largely consistent and in line with our expectation, reflecting: • lower alternative investments income (6% annualized return in 2Q26 vs. 8% in 1Q26), • effect of F&G Life Re (Bermuda) sale; partially offset by • consistent core margin, • growing fees from accretive flow reinsurance, • higher owned distribution margin, and • operating expense discipline driving scale benefit • Achieved cumulative 13 bps reduction in operating expense ratio1; 47 bps at QE 2Q26 vs. 60 bps at YE 2024 • 2Q26 QTD Adj. ROA ex significant items of 0.68% • 2Q26 Adj. ROE stable at 8% • See Appendix for details of significant items impacting ANE, Adj. ROA and Adj. ROE


88 / 44 / 131 254 / 193 / 13 0 / 60 / 113132 / 189 / 0 255 / 152 / 0 130 / 70 / 175 87 / 88 / 90 Primary colors Secondary colors Default text color Gaining Traction in Fee-Based Strategies 19F&G Investor Update | Summer 2026 2025 2028 Target ~85% ~15% Spread-based Fee-based ~75% ~25% F&G is quickly evolving toward a more fee-based, higher margin, and less capital intensive business model • We estimate our fee-based flow reinsurance fee income and owned distribution margin, together with steadily growing IUL product fees, contributed approximately 15% of F&G’s adjusted net earnings excluding significant items for full year 2025 • We expect to grow our share of fee-based earnings to approximately 25% by year-end 2028 as we continue to execute on our strategy ~95% ~5% 2022 Adjusted Net Earnings1 – Pro Forma Mix 1Attributable to common shareholders; pro forma prepared as of 12/31/2025 and assumes alternative investments investment income based on management’s current long-term expected return of approximately 12%


88 / 44 / 131 254 / 193 / 13 0 / 60 / 113132 / 189 / 0 255 / 152 / 0 130 / 70 / 175 87 / 88 / 90 Primary colors Secondary colors Default text color Our Stable and Strong Capital Profile 20F&G Investor Update | Summer 2026 1Excluding accumulated other comprehensive income (ex AOCI) Total Capitalization ex AOCI1 ($M) 5,093 5,749 6,155 6,102 250 250 250 1,760 2,195 2,270 2,270 6,853 8,194 8,675 8,622 YE 2023 YE 2024 YE 2025 QE 2Q26 Debt Preferred stock Total equity ex. AOCI Adj. Debt to Capital % 25.7% 26.8% 26.2% 26.3% Strong F&G capitalization; debt-to-capitalization ratio managed to long term target of 25% • Balance sheet expected to naturally delever as a result of growth in total equity, excluding AOCI


88 / 44 / 131 254 / 193 / 13 0 / 60 / 113132 / 189 / 0 255 / 152 / 0 130 / 70 / 175 87 / 88 / 90 Primary colors Secondary colors Default text color F&G Investor Update | Summer 2026 Book Value Per Share Growth – 1H26 21 BVPS ex. AOCI1 – 12/31/2025 to 6/30/2026 1Attributable to common shareholders and excluding accumulated other comprehensive income (ex AOCI) 2Outstanding shares of 135,610,292 as of 12/31/2025 and 130,940,695 as of 6/30/2026 QE 2Q26 BVPS ex AOCI of $45.93 ↑ $1.50, or ↑ 3%, over QE 4Q25 • $0.10 per share from 1x gain on F&G Life Re (Bermuda) sale • $1.05 per share from underlying business performance • $0.27 per share due to return of capital, including dividends and share repurchases • $0.08 per share due to mark-to- market movements which are unrealized and point in time $44.43 $44.53 $45.58 $45.85 $45.93 0.10 1.05 0.27 0.08 QE 4Q25 1x Item Post 1Q26 1x Item ANE & Other QE 2Q26 Before MTM & Return of Capital Return of Capital QE 2Q26 Before MTM MTM Movements QE 2Q26 F&G Equity ex. AOCI1 ($M) 6,042 14 6,056 138 6,194 (187) 6,007 10 6,017 Shares O/S2 (M) 136 (5) 131 131


88 / 44 / 131 254 / 193 / 13 0 / 60 / 113132 / 189 / 0 255 / 152 / 0 130 / 70 / 175 87 / 88 / 90 Primary colors Secondary colors Default text color Capital Targets 22F&G Investor Update | Summer 2026 Sources of Capital Capital Allocation F&G’s business is built around a diversified and self funding capital model, with multiple sources of capital and capital allocation priorities that support continued growth and return of capital to shareholders Our Capital Allocation Priorities Reinsurance sidecar Statutory excess capital Inforce capital generation Flow reinsurance Excess debt Capacity Reinvest in the business Common & preferred dividend Opportunistic share repurchase Opportunistic M&A (owned distribution) • Maintain efficient capital structure • Target debt-to-capital excluding AOCI of 25% • RBC target range approximately 400% in a normal environment1 • Maintain solvency and capital targets in line with ratings 1Reflects company action level risk-based capital for primary insurance operating subsidiary Interest Expense


88 / 44 / 131 254 / 193 / 13 0 / 60 / 113132 / 189 / 0 255 / 152 / 0 130 / 70 / 175 87 / 88 / 90 Primary colors Secondary colors Default text color Our Capitalization Supports Growth & Dividend 23F&G Investor Update | Summer 2026 F&G is quickly evolving toward a more fee based, higher margin and less capital intensive business with strong cash flow generation in future years • F&G has flexibility to adjust retained sales level, as a “lever” to support net cash from operations with sustained asset growth • F&G returned $195M of capital to shareholders in 1H26; $120M share repurchases and $75M dividends (common & preferred) Investing for Growth Reinvest in the Business Capital and other investments to support AUM growth and maintain adequate capital buffer Net Cash from Operations Return to Shareholders Common Dividend Payout Upon board approval, common dividend with potential targeted increases over time Opportunistic Share Repurchase Efficient means of returning cash to shareholders when shares trade at discount to intrinsic value Opportunistic M&A Expand value of Owned Distribution through additional investments in existing holdings or selectively adding new strategic partners


SECTION 88 / 44 / 131 254 / 193 / 13 0 / 60 / 113132 / 189 / 0 255 / 152 / 0 130 / 70 / 175 87 / 88 / 90 Primary colors Secondary colors Default text color 24F&G Investor Update | Summer 2026 Investments


88 / 44 / 131 254 / 193 / 13 0 / 60 / 113132 / 189 / 0 255 / 152 / 0 130 / 70 / 175 87 / 88 / 90 Primary colors Secondary colors Default text color 31% Core fixed income 22% Private origination 18% Public structured securities 12% Mortgage loans 9% Cash/other 8% Alts/equity Our High Quality & Well Diversified Portfolio1 25F&G Investor Update | Summer 2026 1GAAP Fair Values as of 6/30/2026 (net of funds withheld investments on US GAAP basis, that exclude Kubera FWH), Alts LP NAV as of 3/31/2026 2Reflects owned distribution investments, other equity interests, derivatives and certain company owned life insurance (COLI) 3Cash includes cash, cash equivalents and short-term investments Portfolio conservatively positioned & well-matched to liability profile • Fixed income is 97% investment grade • Credit-related impairments averaging 6 bps over the last 5 years; 1H26 remained below our pricing assumption • Net floating rate exposure $0.7B or ~1.3% Software exposure across the portfolio is < 5% • Most positions are protected by high switching costs, large competitive moats, regulatory barriers and/or embedded in workflows that are difficult to disrupt Real estate exposures are high quality, with moderate leverage and diversified across property types • Modest office exposure at only 1.7% of the total portfolio • Alternative LPs comprise 5% of total portfolio, with less than 1% of Alternative LPs portfolio in office $55B 59% NAIC 1 26% NAIC 2 7% Alts/equity 4% Other² 2% NAIC 3 1% Cash³ 1% NAIC 4/5/6 $55B Investment Portfolio by Asset Class Investment Portfolio by NAIC Designation


88 / 44 / 131 254 / 193 / 13 0 / 60 / 113132 / 189 / 0 255 / 152 / 0 130 / 70 / 175 87 / 88 / 90 Primary colors Secondary colors Default text color 39% CLOs 33% CMBS 16% RMBS 12% ABS 67% Residential 16% Multifamily 7% Industrial 4% Office 4% Retail 1% Student housing 1% Other² 56% Corporate lending 17% Infrastructure 13% Real estate 9% Consumer lending 3% Commercial 2% Other $10B Our Investment Portfolio Key Attributes1 Core Fixed Income 1GAAP Fair Values as of 6/30/2026 (net of funds withheld investments on US GAAP basis, that exclude Kubera FWH) 2Other consists of data center, hotel, self storage and mixed use properties Private Origination 29% Finance, insurance and real estate 23% Services, media and other 17% Utilities, energy and related sectors 16% Wholesale/retail trade 10% Government related 5% Manufacturing, construction and mining $17B $12B Public Structured Securities 26F&G Investor Update | Summer 2026 Mortgage Loans $7B Focus on high grade public securities with strong adjusted returns Provides access to wide spectrum of collateral types for diversification Well diversified, high quality assets across CLOs, CMBS and ABS Superior loss-adjusted performance vs. similar rated corporate


88 / 44 / 131 254 / 193 / 13 0 / 60 / 113132 / 189 / 0 255 / 152 / 0 130 / 70 / 175 87 / 88 / 90 Primary colors Secondary colors Default text color Portfolio Spotlight: Private Origination 27F&G Investor Update | Summer 2026 Private origination is a key component of our investment strategy • Provides enhanced yield while limiting additional credit risk • Offers diversification and strong covenant protection • Our private origination portfolio is approximately $12B, or 22%, of our total portfolio and is high quality and diversified • Focused on investment grade, directly originated assets backed by diversified pool of physical and financial collateral • Includes corporate & commercial lending, consumer loans, real estate and other real asset exposures • Below investment grade private origination middle market exposure is small and manageable Note: GAAP Fair Values as of 6/30/2026 (net of funds withheld investments on US GAAP basis, that exclude Kubera FWH) 1Middle market lending is a portion of corporate lending, within our private origination portfolio 22% 78% Private origination Non-private origination $55B Total Portfolio 56% Corporate lending 17% Infrastructure 13% Real estate 9% Consumer lending 3% Commercial 2% Other Private Origination $12B 90% 10% Investment grade Non-investment grade $5B Private Origination – Middle Market Lending1 $0.5B Private Origination – Middle Market Lending1 (Non-IG)


88 / 44 / 131 254 / 193 / 13 0 / 60 / 113132 / 189 / 0 255 / 152 / 0 130 / 70 / 175 87 / 88 / 90 Primary colors Secondary colors Default text color As of 12/31/20251 Ratings Data on Positions Held Collateral Characteristics Asset Type Amount Invested ($B) % Total Portfolio Investment Grade Below Investment Grade Upgrades Downgrades Credit Losses Subordination Nonaccruals First Lien LTV Ratio EBITDA ($M) Middle market lending 4.8 9% 89% 11% 0% 0% 0% 14% 0.1% 98% 42% 205 Corporate private placements 0.4 1% 100% 0% 4% 7% 0% NA 0.0% 100% 40% 1,500 BDC lending 0.4 1% 100% 0% 8% 0% 0% 54% 0.4% 92% 40% 235 Private credit fund financing 0.4 1% 100% 0% 0% 0% 0% 45% NA 94% 55% 200 Total Corporate Lending 6.0 12% 91% 9% 0.8% 0.5% 0% 18% 98% Private Origination – Corporate Lending 28 At YE 2025, our private origination portfolio was comprised of $6B or 58% in corporate lending • Private origination corporate lending of $6B, or 12% of the total retained portfolio, includes middle market lending of $4.8B, or 9%, of the total retained portfolio • 89% of our middle market lending is investment grade • Our upgrade-to-downgrade ratio is positive • Near 0% credit losses and small percentage of collateral on nonaccrual • Low loan-to-value ratios and strong structural subordination • We are lending to companies having strong quality and size, with average annual EBITDA of ~$200M F&G Investor Update | Summer 2026 Note: NA reflects not applicable 1Semi-annual update frequency 58% Corporate lending 16% Infrastructure 11% Real estate 9% Consumer lending 4% Commercial 2% Other Private Origination (YE 2025) $11B Private Origination – Corporate Lending


88 / 44 / 131 254 / 193 / 13 0 / 60 / 113132 / 189 / 0 255 / 152 / 0 130 / 70 / 175 87 / 88 / 90 Primary colors Secondary colors Default text color Private Origination – Ratings Perspective F&G Investor Update | Summer 2026 Our private origination portfolio is well diversified and high quality; in line with total portfolio Approximately 90% of the private origination debt portfolio is investment grade, and included within the 97% investment grade for our total retained fixed income portfolio We primarily use the top five nationally recognized statistical rating organizations (Moody’s, S&P, Fitch, Kroll and DBRS) • Nearly 90% of the private origination debt portfolio and 95% of the rated assets in our total retained fixed income portfolio are rated by at least one of the top five rating agencies • 65% of our total retained fixed income portfolio is dual rated by two rating agencies, with at least one being one of the Big 3 (Moody’s, S&P and Fitch) Egan Jones ratings are de minimis at less than 1% of our total retained portfolio Private letter ratings account for approximately 19% of our total retained portfolio and undergo the same analytical rigor as public ratings 29


88 / 44 / 131 254 / 193 / 13 0 / 60 / 113132 / 189 / 0 255 / 152 / 0 130 / 70 / 175 87 / 88 / 90 Primary colors Secondary colors Default text color 37% Multifamily 16% Office 15% Industrial 9% Hotel 6% Net lease 5% Data center 4% Retail 1% Mixed use 1% Self-storage 6% Other 9% Net ssset value lending 9% Data centers 7% Communication infrastructure 7% Home improvement 7% Liquified natural gas 6% Residential solar 5% Manufactured housing 5% Whole business 5% Lender finance 4% Aviation 36% All other (< top 10) Portfolio Spotlight: Structured Credit 30 Investment Rationale • Collateralized loan obligation (CLO) portfolio well diversified across industry, issuer and manager; focus on investment grade with ample par subordination • Commercial mortgage-backed securities (CMBS) allows for visibility into credit performance, built-in appreciation and contractual amortization which reduces risk exposure; target more stable property types, such as multi-family, to maintain a defensive portfolio • Asset Backed Securities (ABS) focus on high quality, directly originated specialty finance assets diversified by collateral type CMBS by Property Type CLO Top 10 Industries ABS Top 10 Collateral Type1 Note: GAAP Fair Values as of 6/30/2026 (net of funds withheld investments on US GAAP basis, that exclude Kubera FWH) 1Reflects ABS held in Public Structured and Private Origination categories on page 26 $3B F&G Investor Update | Summer 2026 13% Healthcare & pharmaceuticals 12% High tech 10% Banking, finance, insurance & real estate 9% Services: business 5% Hotels, gaming & leisure 4% Beverage, food & tobacco 4% Construction & building 4% Capital equipment 3% Chemicals, plastics & rubber 3% Aerospace & defense 33% Other (< top 10) $6B $4B


88 / 44 / 131 254 / 193 / 13 0 / 60 / 113132 / 189 / 0 255 / 152 / 0 130 / 70 / 175 87 / 88 / 90 Primary colors Secondary colors Default text color Portfolio Spotlight: CLO 31 Highly diversified portfolio with ample par subordination • Blackstone’s broad & deep understanding of the asset class, and ability to perform loan level underwriting, distinguishes F&G’s portfolio from its peers F&G CLO Portfolio Composition – % Fair Value Note: GAAP Fair Values as of 6/30/2026 (net of funds withheld investments on US GAAP basis, that exclude Kubera FWH) 1Reflects the weighted average par subordination of the public CLO portfolio 6% 17% 36% 41% 0% AAA AA A BBB BB and Below Investment Grade Par Subordination 40% 26% 19% 13% 9% Credit Quality 100% investment grade Structural Protection 19% par subordination1 Capital Efficiency 1.4 Average NAIC rating Market Value $4B CLO exposure F&G Investor Update | Summer 2026


88 / 44 / 131 254 / 193 / 13 0 / 60 / 113132 / 189 / 0 255 / 152 / 0 130 / 70 / 175 87 / 88 / 90 Primary colors Secondary colors Default text color Our CLO Portfolio Characteristics 32 Portfolio focused on high quality CLO securities backed by highly diversified pool of loans IndustriesCompaniesCLO Managers 89 CLO managers 2,285 Companies 33 Industries 7% 4% 4% 4% 3% 3% 3% 3% 3% 2% 64% 0% 20% 40% 60% 80% Manager 1 Manager 2 Manager 3 Manager 4 Manager 5 Manager 6 Manager 7 Manager 8 Manager 9 Manager 10 Other 70% 0.6% 0.4% 0.4% 0.4% 0.3% 0.3% 0.3% 0.3% 0.3% 0.3% 96.4% 0.0% 0.5% 1.0% 1.5% 2.0% Issuer 1 Issuer 2 Issuer 3 Issuer 4 Issuer 5 Issuer 6 Issuer 7 Issuer 8 Issuer 9 Issuer 10 Other 100.0% 13% 12% 10% 9% 5% 4% 4% 4% 3% 3% 33% 0% 5% 10% 15% 20% Industry 1 Industry 2 Industry 3 Industry 4 Industry 5 Industry 6 Industry 7 Industry 8 Industry 9 Industry 10 Other 40% F&G Investor Update | Summer 2026


88 / 44 / 131 254 / 193 / 13 0 / 60 / 113132 / 189 / 0 255 / 152 / 0 130 / 70 / 175 87 / 88 / 90 Primary colors Secondary colors Default text color U.S. CLO Impairment Frontier 33 CLO debt is well insulated from higher defaults and lower recovery rates • BBB CLOs can withstand an annualized default of 8.7% (that would have to occur every year) assuming a 61% average long- term loan recovery rate U.S. CLO Impairment Frontier (First-Loss Scenarios among CLO tranches) Note: Reflects Blackstone’s views and beliefs as of June 30, 2026. Source: US J.P. Morgan as of July 2, 2026 for average recovery rate and annual loan default rate; CLO impairment frontiers generated from Intex model and include key assumptions as follows: Interest rates based on current Intex curve, annual prepayment rate of 20%, Recovery lag = 12 months, CLO redeemed at AAA payoff date in standard CLO run, reinvestment price = 99.75, reinvestment rate = 3 month SOFR + 325 bps, no reinvestment post Reinvestment Period. Please note: the historical data point shown is calculated using annual default and recovery rates from J.P. Morgan Leveraged Loan Index and represents the average default rates and weighted average recovery rates from 1998-2026 for the long-term average time period. Average recovery rate is representative of first-lien loans as of July 2, 2026 0% 5% 10% 15% 20% 30%40%50%60%70% A n n u a l D e fa u lt R a te Average Senior Loan Recovery Rate A BBB BB Long-Term Average Annual Default Rate F&G Investor Update | Summer 2026


88 / 44 / 131 254 / 193 / 13 0 / 60 / 113132 / 189 / 0 255 / 152 / 0 130 / 70 / 175 87 / 88 / 90 Primary colors Secondary colors Default text color Portfolio Spotlight: Real Estate Debt1 34 Blackstone Real Estate Debt Strategies (BREDS) has assembled a high-quality portfolio with diversified exposure across asset classes and properties Note: GAAP Fair Values as of 6/30/2026 (net of funds withheld investments on US GAAP basis, that exclude Kubera FWH) 1Reflects real estate debt held in Public Structured, Private Origination and Mortgage Loans categories on page 26 and 27 35% RML 24% CMBS 18% CML 12% RMBS 11% Private origination $13B Duration 3.9 years Quality 1.2 Average NAIC rating Market Value $13B Real estate portfolio Weighted Average Life 5.9 years F&G Investor Update | Summer 2026


88 / 44 / 131 254 / 193 / 13 0 / 60 / 113132 / 189 / 0 255 / 152 / 0 130 / 70 / 175 87 / 88 / 90 Primary colors Secondary colors Default text color Portfolio Spotlight: CMBS & RMBS 35 Note: GAAP Fair Values as of 6/30/2026 (net of funds withheld investments on US GAAP basis, that exclude Kubera FWH) By Asset Type By Property Type By NAIC Rating F&G Investor Update | Summer 2026 40% SASB 32% RMBS 11% CRE CLOs 9% Conduit (below A) 4% Conduit (A or above) 4% Agency $5B 57% Multifamily 12% Office 12% Industrial 7% Hotel 5% Net lease 4% Data center 3% Retail $5B 85% NAIC 1 10% NAIC 2 2% NAIC 3 3% NAIC 4/5/6 $5B


88 / 44 / 131 254 / 193 / 13 0 / 60 / 113132 / 189 / 0 255 / 152 / 0 130 / 70 / 175 87 / 88 / 90 Primary colors Secondary colors Default text color Portfolio Spotlight: CMBS 36 Prudent asset selection has led to more multifamily exposure and less retail vs. Conduit CMBS market averages Portfolio Construction Comparison1 Note: GAAP Fair Values as of 6/30/2026 (net of funds withheld investments on US GAAP basis, that exclude Kubera FWH) 1BAML Conduit Data as of 6/30/2026 37% 4% 15% 23% Multifamily Retail F&G Post-Crisis Conduit CMBS Credit Quality 86% Investment grade (NRSRO) Quality 1.3 Average NAIC rating Market Value $3B CMBS portfolio Weighted Average Life 3.0 years F&G Investor Update | Summer 2026


88 / 44 / 131 254 / 193 / 13 0 / 60 / 113132 / 189 / 0 255 / 152 / 0 130 / 70 / 175 87 / 88 / 90 Primary colors Secondary colors Default text color Portfolio Spotlight: CMLs 37 Investment Rationale • Our Commercial Mortgage Loan (CML) portfolio is low risk, low leveraged and well diversified • All first mortgage loans, with average loan-to-value of ~60% • 327 holdings, with average loan size of $8M • <0.5% of CML portfolio loans have a DSCR <1x By State By Loan-To-Value % By Underlying Property Type Note: GAAP Fair Values as of 6/30/2026 (net of funds withheld investments on US GAAP basis, that exclude Kubera FWH) ¹Other consists of data center, hotel, self storage and mixed use properties 48% LTV 60% to 70% 34% LTV 50% to 60% 13% LTV < 50% 5% LTV > 70% $2B $2B 48% Multifamily 21% Industrial 12% Retail 11% Office 4% Student housing 4% Other¹ F&G Investor Update | Summer 2026 20% CA 14% FL 6% NY 6% TX 5% NJ 4% GA 4% CT 41% Other $2B


88 / 44 / 131 254 / 193 / 13 0 / 60 / 113132 / 189 / 0 255 / 152 / 0 130 / 70 / 175 87 / 88 / 90 Primary colors Secondary colors Default text color Spotlight: Alternative Investments Portfolio 38F&G Investor Update | Summer 2026 • Our alternative investments portfolio is highly diversified across 150 underlying funds • Our portfolio composition has evolved over time toward higher returning private equity strategies vs. private credit, which may support higher long-term potential returns than in prior periods • Alternative LPs funds historically generate a meaningful portion of their value creation during later stages of the fund life cycle • Nearly 85% of our Alternative LPs portfolio is ‘Early to Mid’ stage, providing potential for higher returns as the portfolio matures consistent with historical performance patterns • Since inception, our Alternative LPs portfolio has generated distributions to paid-in capital (DPI) of 0.62x, reflecting return of over 60% of the capital invested Note: GAAP Fair Values as of 6/30/2026 (net of funds withheld investments on US GAAP basis, that exclude Kubera FWH) 1Benchmark data for private equity funds sourced from Cambridge Associates for vintages from 1993 through 2011; vintages after 2011 were excluded as those funds have not yet completed a typical 15-year lifecycle Alternative LPs & Other Equity Interests – By Sector 57% LP private equity 11% LP real assets 3% LP credit 29% Other equity interests $4B Alternative LPs – By Vintage 73% Mid stage (6-10 years) 16% Late stage (11-15 years) 11% Early stage (< 5 years) $3B LP Private Equity Fund Life Cycle Historical Returns1 First 5 years (early stage) ~6% First 10 years (early + mid stage) ~10% First 15 years (lifetime) ~15%


88 / 44 / 131 254 / 193 / 13 0 / 60 / 113132 / 189 / 0 255 / 152 / 0 130 / 70 / 175 87 / 88 / 90 Primary colors Secondary colors Default text color Blackstone Related Important Disclosures 39 This document (together with any attachments, appendices, and related materials, the “Materials”) is provided for informational due diligence purposes only and is not, and may not be relied on in any manner as legal, tax, investment, accounting or other advice or as an offer to sell, or a solicitation of an offer to buy, any security or instrument in or to participate in any account, program, trading strategy with any Blackstone fund, account or other investment vehicle (each a “Client”) managed or advised by Blackstone Inc. or its affiliates (“Blackstone”), nor shall it or the fact of its distribution form the basis of, or be relied on in connection with, any contract or investment decision. None of Blackstone, its funds, nor any of their affiliates makes any representation or warranty, express or implied, as to the accuracy or completeness of the information contained herein and nothing contained herein should be relied upon as a promise or representation as to past or future performance of a Client or any other entity, transaction, or investment. All information is as of the date on the cover, unless otherwise indicated and may change materially in the future. Past Performance and Estimates / Targets. In considering any investment performance information contained in the Materials, please bear in mind that past or estimated performance is not necessarily indicative of future results and there can be no assurance that Blackstone or a Client will achieve comparable results, implement its investment strategy, achieve its objectives or avoid substantial losses or that any expected returns will be met. Any estimates and/or targets used herein are indicative of Blackstone’s analysis regarding outcome potentials and are not guarantees of future performance. They are presented solely to provide you with insight into the portfolio's anticipated risk and reward characteristics. They are based on Blackstone’s current view of future events and financial performance of potential investments and various estimations and “base case” assumptions (including about events that have not occurred) made at the time the estimates/targets are developed. While Blackstone believes that these assumptions are reasonable under the circumstances, there is no assurance that the results will be obtained, and unpredictable general economic conditions and other factors may cause actual results to vary materially from the estimates/targets. Any variations could be adverse to the actual results. Additional information regarding any estimations/targets, and relevant assumptions, is available upon request. Blackstone Proprietary Data. Certain information and data provided herein is based on Blackstone proprietary knowledge and data. Portfolio companies may provide proprietary market data to Blackstone, including about local market supply and demand conditions, current market rents and operating expenses, capital expenditures, and valuations for multiple assets. Such proprietary market data is used by Blackstone to evaluate market trends as well as to underwrite potential and existing investments. While Blackstone currently believes that such information is reliable for purposes used herein, it is subject to change, and reflects Blackstone’s opinion as to whether the amount, nature and quality of the data is sufficient for the applicable conclusion, and no representations are made as to the accuracy or completeness thereof. Third-Party Information. Certain information contained in the Materials has been obtained from sources outside Blackstone, which in certain cases have not been updated through the date hereof. While such information is believed to be reliable for purposes used herein, no representations are made as to the accuracy or completeness thereof and none of Blackstone, its funds, nor any of their affiliates takes any responsibility for, and has not independently verified, any such information. Forward-Looking Statements. Certain information contained in the Materials constitutes “forward-looking statements,” which can be identified by the use of forward-looking terminology or the negatives thereof. These may include financial estimates and their underlying assumptions, statements about plans, objectives and expectations with respect to future operations, and statements regarding future performance. Such forward‐looking statements are inherently uncertain and there are or may be important factors that could cause actual outcomes or results to differ materially from those indicated in such statements. Blackstone believes these factors include but are not limited to those described under the section entitled “Risk Factors” in its Annual Report on Form 10‐K for the most recent fiscal year ended December 31 of that year and any such updated factors included in its periodic filings with the Securities and Exchange Commission, which are accessible on the SEC’s website at www.sec.gov. These factors should not be construed as exhaustive and should be read in conjunction with the other cautionary statements that are included in the Materials and in the filings. Blackstone undertakes no obligation to publicly update or review any forward‐looking statement, whether as a result of new information, future developments or otherwise. F&G Investor Update | Summer 2026


APPENDIX 88 / 44 / 131 254 / 193 / 13 0 / 60 / 113132 / 189 / 0 255 / 152 / 0 130 / 70 / 175 87 / 88 / 90 Primary colors Secondary colors Default text color Appendix – Finance F&G Investor Update | Summer 2026 40


88 / 44 / 131 254 / 193 / 13 0 / 60 / 113132 / 189 / 0 255 / 152 / 0 130 / 70 / 175 87 / 88 / 90 Primary colors Secondary colors Default text color 2020 2021 2022 2023 2024 2025 We Are Achieving Higher Ratings Over Time 41F&G Investor Update | Summer 2026 Upgraded to ‘A-’ FNF Merger Completed F&G Partial Spinoff $2.4B Market Cap Launched Flow Reinsurance Launched Owned Distribution F&G Partial Spinoff $4.2B Market Cap Upgraded to ‘A-’ Upgraded to ‘Baa1’ Upgraded to ‘A3’ Upgraded to ‘A’ Launched Bank & Broker Dealer Channels Launched Institutional Markets (PRT & FABN) F&G has received multiple ratings upgrades over time, reflecting our upward trajectory • Scaling business to generate profitable growth • Diversifying sources of earnings • Actively positioning our high quality and diversified investment portfolio • Maintaining strong capitalization and financial flexibility • Conservatively managing to the most stringent capital requirements of our regulators & rating agencies, including our offshore entities Upgraded long-term issuer rating Note: Reflects financial strength rating of primary operating subsidiaries F&G’s Recent History Launched Reinsurance Sidecar


88 / 44 / 131 254 / 193 / 13 0 / 60 / 113132 / 189 / 0 255 / 152 / 0 130 / 70 / 175 87 / 88 / 90 Primary colors Secondary colors Default text color Non-GAAP Measure Reconciliations 42F&G Investor Update | Summer 2026 1Attributable to common shareholders; metrics refer to return on assets (ROA) and adjusted return on equity ex AOCI (ROE) based on reported adjusted net earnings ($M) Year ended Three months ended Six months ended 2024 2025 2Q25 3Q25 4Q25 1Q26 2Q26 1H25 1H26 Net earnings (loss) $622 $248 $35 $114 $124 $244 ($81) $10 $163 Recognized (gains) losses, net 27 180 79 68 4 (163) 190 108 27 Market related liability adjustments (214) 28 (16) (37) (22) (37) (10) 87 (47) Purchase price amortization 84 80 18 29 18 15 15 33 30 Transaction costs, other and non-recurring items 16 16 8 6 1 5 14 9 19 Non-controlling interest (10) (9) (2) (2) (3) (2) (2) (4) (4) Income taxes adjustment 21 (61) (19) (13) 1 48 (41) (49) 7 Adjusted net earnings (ANE) $546 $482 $103 $165 $123 $110 $85 $194 $195 Adjusted return on assets (ROA)1 1.06% 0.87% 0.71% 0.87% 0.87% 0.76% 0.68% 0.71% 0.68% Adjusted return on equity (ROE)1 10.3% 8.2% 8.8% 8.8% 8.2% 8.4% 8.0% 8.8% 8.0% Other Considerations Investment income from alternative investments (above) below long-term return expectations 145 216 67 53 51 44 49 112 93 Significant (income) expense items 10 (30) - (14) - 5 - (16) 5 Impact of other considerations to Adj. ROA1 0.30% 0.34% 0.35% 0.33% 0.34% 0.34% 0.35% 0.35% 0.35% Impact of other considerations to Adj. ROE1 2.9% 3.2% 2.9% 2.8% 3.2% 3.4% 3.1% 2.9% 3.1%


88 / 44 / 131 254 / 193 / 13 0 / 60 / 113132 / 189 / 0 255 / 152 / 0 130 / 70 / 175 87 / 88 / 90 Primary colors Secondary colors Default text color ANE – Significant Items1 43F&G Investor Update | Summer 2026 1Management’s current long-term expected return is approximately 12% ($ in millions) Three months ended June 30, 2026 Adjusted net earnings of $85 million for the three months ended June 30, 2026. Investment income from alternative investments was $49 million below management's long-term expected return. 1 March 31, 2026 Adjusted net earnings of $110 million for the three months ended March 31, 2026 included expense from $5 million of investment and other income true-up adjustments. Investment income from alternative investments was $44 million below management's long-term expected return. December 31, 2025 Adjusted net earnings of $123 million for the three months ended December 31, 2025. Investment income from alternative investments was $51 million below management's long-term expected return. September 30, 2025 Adjusted net earnings of $165 million for the three months ended September 30, 2025 included income from $10 million tax valuation allowance benefit and $4 million of actuarial reserve release. Investment income from alternative investments was $53 million below management's long-term expected return. June 30, 2025 Adjusted net earnings of $103 million for the three months ended June 30, 2025. Investment income from alternative investments was $67 million below management's long-term expected return. Six months ended June 30, 2026 Adjusted net earnings of $195 million for the six months ended June 30, 2026 included expense from $5 million of investment and other income true-up adjustments. Investment income from alternative investments was $93 million below management's long-term expected return. June 30, 2025 Adjusted net earnings of $194 million for the six months ended June 30, 2025 included income from a $16 million reinsurance true-up adjustment. Investment income from alternative investments was $112 million below management's long-term expected return.


88 / 44 / 131 254 / 193 / 13 0 / 60 / 113132 / 189 / 0 255 / 152 / 0 130 / 70 / 175 87 / 88 / 90 Primary colors Secondary colors Default text color Non-GAAP Financial Measures and Definitions 44F&G Investor Update | Summer 2026 The following represents the definitions of non-GAAP financial measures used by F&G Adjusted Net Earnings attributable to common shareholders Adjusted net earnings attributable to common shareholders (ANE) is a non-GAAP economic measure we use to evaluate financial performance each period. ANE eliminates the impact of specific items that are not indicative of the underlying economics of our business, including certain market volatility, asymmetrical and noneconomic accounting, nonrecurring items and other income and expense adjustments. These items are volatile in our reported GAAP earnings and are not indicative of the underlying profitability drivers reflected in the design and pricing of our products and/or our investment and hedging strategy, as such items fluctuate from period to period in a manner inconsistent with these drivers. ANE provides information to enhance an investor’s understanding of our results and underlying profitability drivers by removing the impact of short-term market volatility (i.e. recognized gains and losses, market risk benefits remeasurement gains and losses, derivative gains and losses), asymmetrical and non-economic accounting (i.e. derivatives and investment hedges that do not qualify for hedge accounting, deferred pension risk transfer deferred profit liability losses), and other adjustments. ANE is calculated by adjusting net earnings or loss attributable to common shareholders to eliminate: (i) Recognized gains and losses, net: the impact of net investment gains/losses, including changes in allowance for expected credit losses and other than temporary impairment (“OTTI”) losses, recognized in operations; and the effects of changes in fair value of the reinsurance related embedded derivative and other derivatives, including interest rate swaps and forwards; (ii) Market related liability adjustments: the impacts related to changes in the fair value, including both realized and unrealized gains and losses, of index product related derivatives and embedded derivatives, net of hedging cost; the impact of initial pension risk transfer deferred profit liability losses, including amortization from previously deferred pension risk transfer deferred profit liability losses; and the changes in the fair value of market risk benefits by deferring current period changes and amortizing that amount over the life of the market risk benefit; (iii) Purchase price amortization: the impacts related to the amortization of certain intangibles (internally developed software, trademarks and value of distribution asset and the change in fair value of liabilities recognized as a result of acquisition activities); (iv) Transaction costs: the impacts related to acquisition, integration and merger related items;


88 / 44 / 131 254 / 193 / 13 0 / 60 / 113132 / 189 / 0 255 / 152 / 0 130 / 70 / 175 87 / 88 / 90 Primary colors Secondary colors Default text color Non-GAAP Financial Measures and Definitions 45F&G Investor Update | Summer 2026 The following represents the definitions of non-GAAP financial measures used by F&G Adjusted Net Earnings attributable to common shareholders (continued) (v) Other and “non-recurring,” “infrequent” or “unusual items”: Other adjustments include removing any charges associated with U.S. guaranty fund assessments as these charges neither relate to the ordinary course of the Company’s business nor reflect the Company’s underlying business performance, but result from external situations not controlled by the Company. Further, Management excludes certain items determined to be “non-recurring,” “infrequent” or “unusual” from adjusted net earnings when incurred if it is determined these items are not a reflection of the core business and when the nature of the item is such that it is not reasonably likely to recur within two years and/or there was not a similar item in the preceding two years; (vi) Non-controlling interest on non-GAAP adjustments: the portion of the non-GAAP adjustments attributable to the equity interest of entities that F&G does not wholly own; and (vii) Income taxes: the income tax impact related to the above-mentioned adjustments is measured using an effective tax rate, as appropriate by tax jurisdiction. Recognized gains and losses are excluded from ANE as part of both adjustments (i) and (ii). As part of those two adjustments to ANE, all material recognized gains and losses are removed except for periodic settlements of interest rate swaps used to economically hedge our floating rate investments. While these adjustments are an integral part of the overall performance of F&G, market conditions and/or the non-operating nature of these items can overshadow the underlying performance of the core business. Accordingly, management considers this to be a useful measure internally and to investors and analysts in analyzing the trends of our operations. Adjusted net earnings should not be used as a substitute for net earnings (loss). However, we believe the adjustments made to net earnings (loss) in order to derive adjusted net earnings provide an understanding of our overall results of operations. Adjusted Net Earnings attributable to common shareholders per Diluted Share Adjusted net earnings attributable to common shareholders per diluted share is calculated as adjusted net earnings plus preferred stock dividend (if the preferred stock has created dilution). This sum is then divided by the adjusted weighted-average diluted shares outstanding. Management considers this non-GAAP financial measure to be useful internally and for investors and analysts to assess the level of return driven by the Company that is available to common shareholders.


88 / 44 / 131 254 / 193 / 13 0 / 60 / 113132 / 189 / 0 255 / 152 / 0 130 / 70 / 175 87 / 88 / 90 Primary colors Secondary colors Default text color Non-GAAP Financial Measures and Definitions 46F&G Investor Update | Summer 2026 Adjusted Return on Assets attributable to Common Shareholders Adjusted return on assets attributable to common shareholders is calculated by dividing year-to-date annualized adjusted net earnings attributable to common shareholders by year-to-date AAUM. Return on assets is comprised of net investment income, less cost of funds, flow reinsurance fee income, owned distribution margin and less expenses (including operating expenses, interest expense and income taxes) consistent with our adjusted net earnings definition and related adjustments. Cost of funds includes liability costs related to cost of crediting as well as other liability costs. Management considers this non-GAAP financial measure to be useful internally and to investors and analysts when assessing financial performance and profitability earned on AAUM. Adjusted Return on Average Common Shareholder Equity, excluding AOCI Adjusted return on average common shareholder equity is calculated by dividing the rolling four quarters adjusted net earnings attributable to common shareholders, by total average F&G equity attributable to common shareholders, excluding AOCI. Average equity attributable to common shareholders, excluding AOCI for the twelve month rolling period is the average of 5 points throughout the period. Since AOCI fluctuates from quarter to quarter due to unrealized changes in the fair value of available for sale investments, changes in instrument-specific credit risk for market risk benefits and discount rate assumption changes for the future policy benefits, management considers this non-GAAP financial measure to be a useful internally and for investors and analysts to assess the level return driven by the Company's adjusted earnings. Adjusted Weighted Average Diluted Shares Outstanding Adjusted weighted average diluted shares outstanding is the same as weighted average diluted shares outstanding except for periods in which our preferred stocks are calculated to be dilutive to either net earnings attributable to common shareholders or adjusted net earnings attributable to common shareholders, but not both, or there is a net earnings loss attributable to common shareholders on a GAAP basis, but positive adjusted net earnings attributable to common shareholders using the non-GAAP measure. The above exceptions are made to include relevant diluted shares when dilution occurs and exclude relevant diluted shares when dilution does not occur for adjusted net earnings attributable to common shareholders. Management considers this non-GAAP financial measure to be useful internally and for investors and analysts to assess the level of return driven by the Company that is available to common shareholders.


88 / 44 / 131 254 / 193 / 13 0 / 60 / 113132 / 189 / 0 255 / 152 / 0 130 / 70 / 175 87 / 88 / 90 Primary colors Secondary colors Default text color Non-GAAP Financial Measures and Definitions 47F&G Investor Update | Summer 2026 Assets Under Management (AUM) AUM is comprised of the following components and is reported net of reinsurance assets ceded in accordance with GAAP: (i) total invested assets at amortized cost, excluding investments in unconsolidated affiliates, owned distribution and derivatives; (ii) investments in unconsolidated affiliates at carrying value; (iii) related party loans and investments; (iv) accrued investment income; (v) the net payable/receivable for the purchase/sale of investments; and (vi) cash and cash equivalents excluding derivative collateral at the end of the period. Management considers this non-GAAP financial measure to be useful internally and to investors and analysts when assessing the size of our investment portfolio that is retained. AUM before Reinsurance AUM before Reinsurance is comprised of AUM plus flow reinsured assets, including certain block reinsured assets. Management considers this non-GAAP financial measure to be useful internally and to investors and analysts when assessing the size of our investment portfolio including reinsured assets. Average Assets Under Management (AAUM) (Quarterly and YTD) AAUM is calculated as AUM at the beginning of the period and the end of each month in the period, divided by the total number of months in the period plus one. Management considers this non-GAAP financial measure to be useful internally and to investors and analysts when assessing the rate of return on retained assets.


88 / 44 / 131 254 / 193 / 13 0 / 60 / 113132 / 189 / 0 255 / 152 / 0 130 / 70 / 175 87 / 88 / 90 Primary colors Secondary colors Default text color Non-GAAP Financial Measures and Definitions 48F&G Investor Update | Summer 2026 Book Value per Common Share, excluding AOCI Book value per Common share, excluding AOCI is calculated as total F&G equity attributable to common shareholders divided by the total number of shares of common stock outstanding. Management considers this to be a useful measure internally and for investors and analysts to assess the capital position of the Company. Debt-to-Capital Ratio, excluding AOCI Debt-to-capitalization ratio is computed by dividing total aggregate principal amount of debt by total capitalization (total debt plus total equity, excluding AOCI). Management considers this non-GAAP financial measure to be useful internally and to investors and analysts when assessing its capital position. Return on Average F&G common shareholder Equity, excluding AOCI Return on average F&G common shareholder equity, excluding AOCI is calculated by dividing the rolling four quarters net earnings (loss) attributable to common shareholders, by total average F&G equity attributable to common shareholders, excluding AOCI. Average F&G equity attributable to common shareholders, excluding AOCI for the twelve month rolling period is the average of 5 points throughout the period. Since AOCI fluctuates from quarter to quarter due to unrealized changes in the fair value of available for sale investments, changes in instrument-specific credit risk for market risk benefits and discount rate assumption changes for the future policy benefits, management considers this non-GAAP financial measure to be useful internally and for investors and analysts to assess the level of return driven by the Company that is available to common shareholders. Sales Annuity, IUL, funding agreement and non-life contingent PRT sales are not derived from any specific GAAP income statement accounts or line items and should not be viewed as a substitute for any financial measure determined in accordance with GAAP. Sales from these products are recorded as deposit liabilities (i.e., contractholder funds) within the Company's consolidated financial statements in accordance with GAAP. Life contingent PRT sales are recorded as premiums in revenues within the consolidated financial statements. Management believes that presentation of sales, as measured for management purposes, enhances the understanding of our business and helps depict longer term trends that may not be apparent in the results of operations due to the timing of sales and revenue recognition.


88 / 44 / 131 254 / 193 / 13 0 / 60 / 113132 / 189 / 0 255 / 152 / 0 130 / 70 / 175 87 / 88 / 90 Primary colors Secondary colors Default text color Non-GAAP Financial Measures and Definitions 49F&G Investor Update | Summer 2026 Total Capitalization, excluding AOCI Total capitalization, excluding AOCI is based on total equity excluding the effect of AOCI and the total aggregate principal amount of debt. Since AOCI fluctuates from quarter to quarter due to unrealized changes in the fair value of available for sale investments, changes in instrument-specific credit risk for market risk benefits and discount rate assumption changes for the future policy benefits, management considers this non-GAAP financial measure to provide useful supplemental information internally and to investors and analysts to help assess the capital position of the Company. Total Equity, excluding AOCI Total equity, excluding AOCI is based on total equity excluding the effect of AOCI. Since AOCI fluctuates from quarter to quarter due to unrealized changes in the fair value of available for sale investments, changes in instrument-specific credit risk for market risk benefits and discount rate assumption changes for the future policy benefits, management considers this non-GAAP financial measure to provide useful supplemental information internally and to investors and analysts assessing the level of earned equity on total equity. Total F&G Equity attributable to common shareholders, excluding AOCI Total F&G equity attributable to common shareholder, excluding AOCI is based on total F&G Annuities & Life, Inc. shareholders' equity excluding the effect of AOCI and preferred stocks, including additional paid-in-capital. Since AOCI fluctuates from quarter to quarter due to unrealized changes in the fair value of available for sale investments, changes in instrument-specific credit risk for market risk benefits and discount rate assumption changes for the future policy benefits, management considers this non-GAAP financial measure to be useful internally and for investors and analysts to assess the level of return driven by the Company that is available to common shareholders. Yield on AAUM Yield on AAUM is calculated by dividing annualized net investment income on an adjusted net earnings basis by AAUM. Management considers this non-GAAP financial measure to be useful internally and to investors and analysts when assessing the level of return earned on AAUM.