|
Delaware
(State or other jurisdiction of incorporation)
|
001-41042
(Commission File Number)
|
47-3544981
(IRS Employer Identification Number)
|
||||||||||||||||||||||||
|
14600 Myford Road
Irvine, California 92606
| ||||||||||||||||||||||||||
(Address of principal executive offices) (Zip code) | ||||||||||||||||||||||||||
(888) 748-4261 | ||||||||||||||||||||||||||
(Registrant's telephone number, including area code) | ||||||||||||||||||||||||||
| N/A | ||||||||||||||||||||||||||
(Former name or former address, if changed since last report) | ||||||||||||||||||||||||||
___________________________________ | ||||||||||||||||||||||||||
☐ |
Written communications pursuant to Rule 425 under the Securities Act (17 CFR 230.425) |
||||||||||||||||
☐ |
Soliciting material pursuant to Rule 14a-12 under the Exchange Act (17 CFR 240.14a-12) |
||||||||||||||||
☐ |
Pre-commencement communications pursuant to Rule 14d-2(b) under the Exchange Act (17 CFR 240.14d-2(b)) |
||||||||||||||||
☐ |
Pre-commencement communications pursuant to Rule 13e-4(c) under the Exchange Act (17 CFR 240.13e-4(c)) |
||||||||||||||||
Securities registered pursuant to Section 12(b) of the Act: | |||||||||||||||||||||||||||||
Title of each class |
Trading Symbol |
Name of each exchange on which registered |
|||||||||||||||||||||||||||
Class A common stock, $0.001 par value per share |
RIVN | The Nasdaq Stock Market |
|||||||||||||||||||||||||||
| Exhibit No. | Description | |||||||
| 104 | Cover Page Interactive Data File (embedded within the Inline XBRL document) | |||||||
| RIVIAN AUTOMOTIVE, INC. | ||||||||
Date: February 21, 2024 |
By: | /s/ Claire McDonough | ||||||
| Name: | Claire McDonough | |||||||
| Title: | Chief Financial Officer | |||||||
| Reconciliation of Non-GAAP | ||||||||||||||
| Financial Measures | ||||||||||||||
| (in millions) | ||||||||||||||
| Adjusted EBITDA | Three Months Ended December 31, | Twelve Months Ended December 31, | ||||||||||||||||||||||||
| 2022 | 2023 | 2022 | 2023 | |||||||||||||||||||||||
| Net loss | $ | (1,723) | $ | (1,521) | $ | (6,752) | $ | (5,432) | ||||||||||||||||||
| Interest income, net | (66) | (58) | (90) | (302) | ||||||||||||||||||||||
| Provision for income taxes | — | — | 4 | 1 | ||||||||||||||||||||||
| Depreciation and amortization | 199 | 270 | 652 | 937 | ||||||||||||||||||||||
| Stock-based compensation expense | 135 | 215 | 987 | 821 | ||||||||||||||||||||||
| Other income, net | (6) | (2) | (18) | (6) | ||||||||||||||||||||||
| Adjusted EBITDA (non-GAAP) | $ | (1,461) | $ | (1,096) | $ | (5,217) | $ | (3,981) | ||||||||||||||||||

| Key Highlights | ||
|
167% increase
in revenue in 2023
as compared to 2022
|
~$81k gross profit
per vehicle improvement
Q4’23 compared to Q4’22
|
|||||||
|
Launched leasing
on R1
|
Exceeded all aspects
of 2023 guidance
|
|||||||
|
Top selling electric vehicle
over $70k in
the United States
for 20231
|
Launched Standard
Range R1 variants
starting at $69,900
in early 2024
|
|||||||
| ¹Source: https://electrek.co/2024/01/10/best-selling-evs-2023/ | ||||||||
 |
Q4 2023 Shareholder Letter | © 2024 Rivian. All rights reserved. 2 |
||||||
 | |||||
|
We hold the deep conviction that the entire automotive industry will electrify over the long-term. Rivian has been built to help accelerate the transition. The opportunity ahead is substantial and we are focused on designing our organization, strategy, and products to capture this. We are unveiling our first global platform, the R2, in early March. We have made significant progress driving greater cost efficiency on R1 and RCV and have much more to come.
Our technology and approach to vertical integration has been designed to create structural cost advantages and product differentiation as the market goes through this massive transition to electric vehicles. We believe Rivian has demonstrated a unique ability to resonate with customers as evidenced by the R1S becoming the top selling EV in the U.S. priced over $70,000. With over 71,000 vehicles on the road and over 700 million miles driven by Rivian vehicles, brand awareness continues to grow.
We more than doubled production and deliveries for full-year 2023 versus 2022 and exceeded our initial production guidance by more than 7,000 vehicles. Importantly, the strong performance in deliveries was complemented by our continued investments in the customer experience with growth in service centers, spaces, demo drives, and charging accessibility. This was recognized recently by a leading consumer publication1 which ranks the Rivian brand number one in its owner satisfaction survey, with an 86% score on if ‘owners would buy again’, 900bps higher than the second brand on the list.
|
|||||
¹Source: https://www.consumerreports.org/cars/car-reliability-owner-satisfaction/most-and-least-liked-car-brands-a1291429338/ |
|||||
|
Q4 2023 Shareholder Letter | © 2024 Rivian. All rights reserved. 3 |
||||||
 | |||||
|
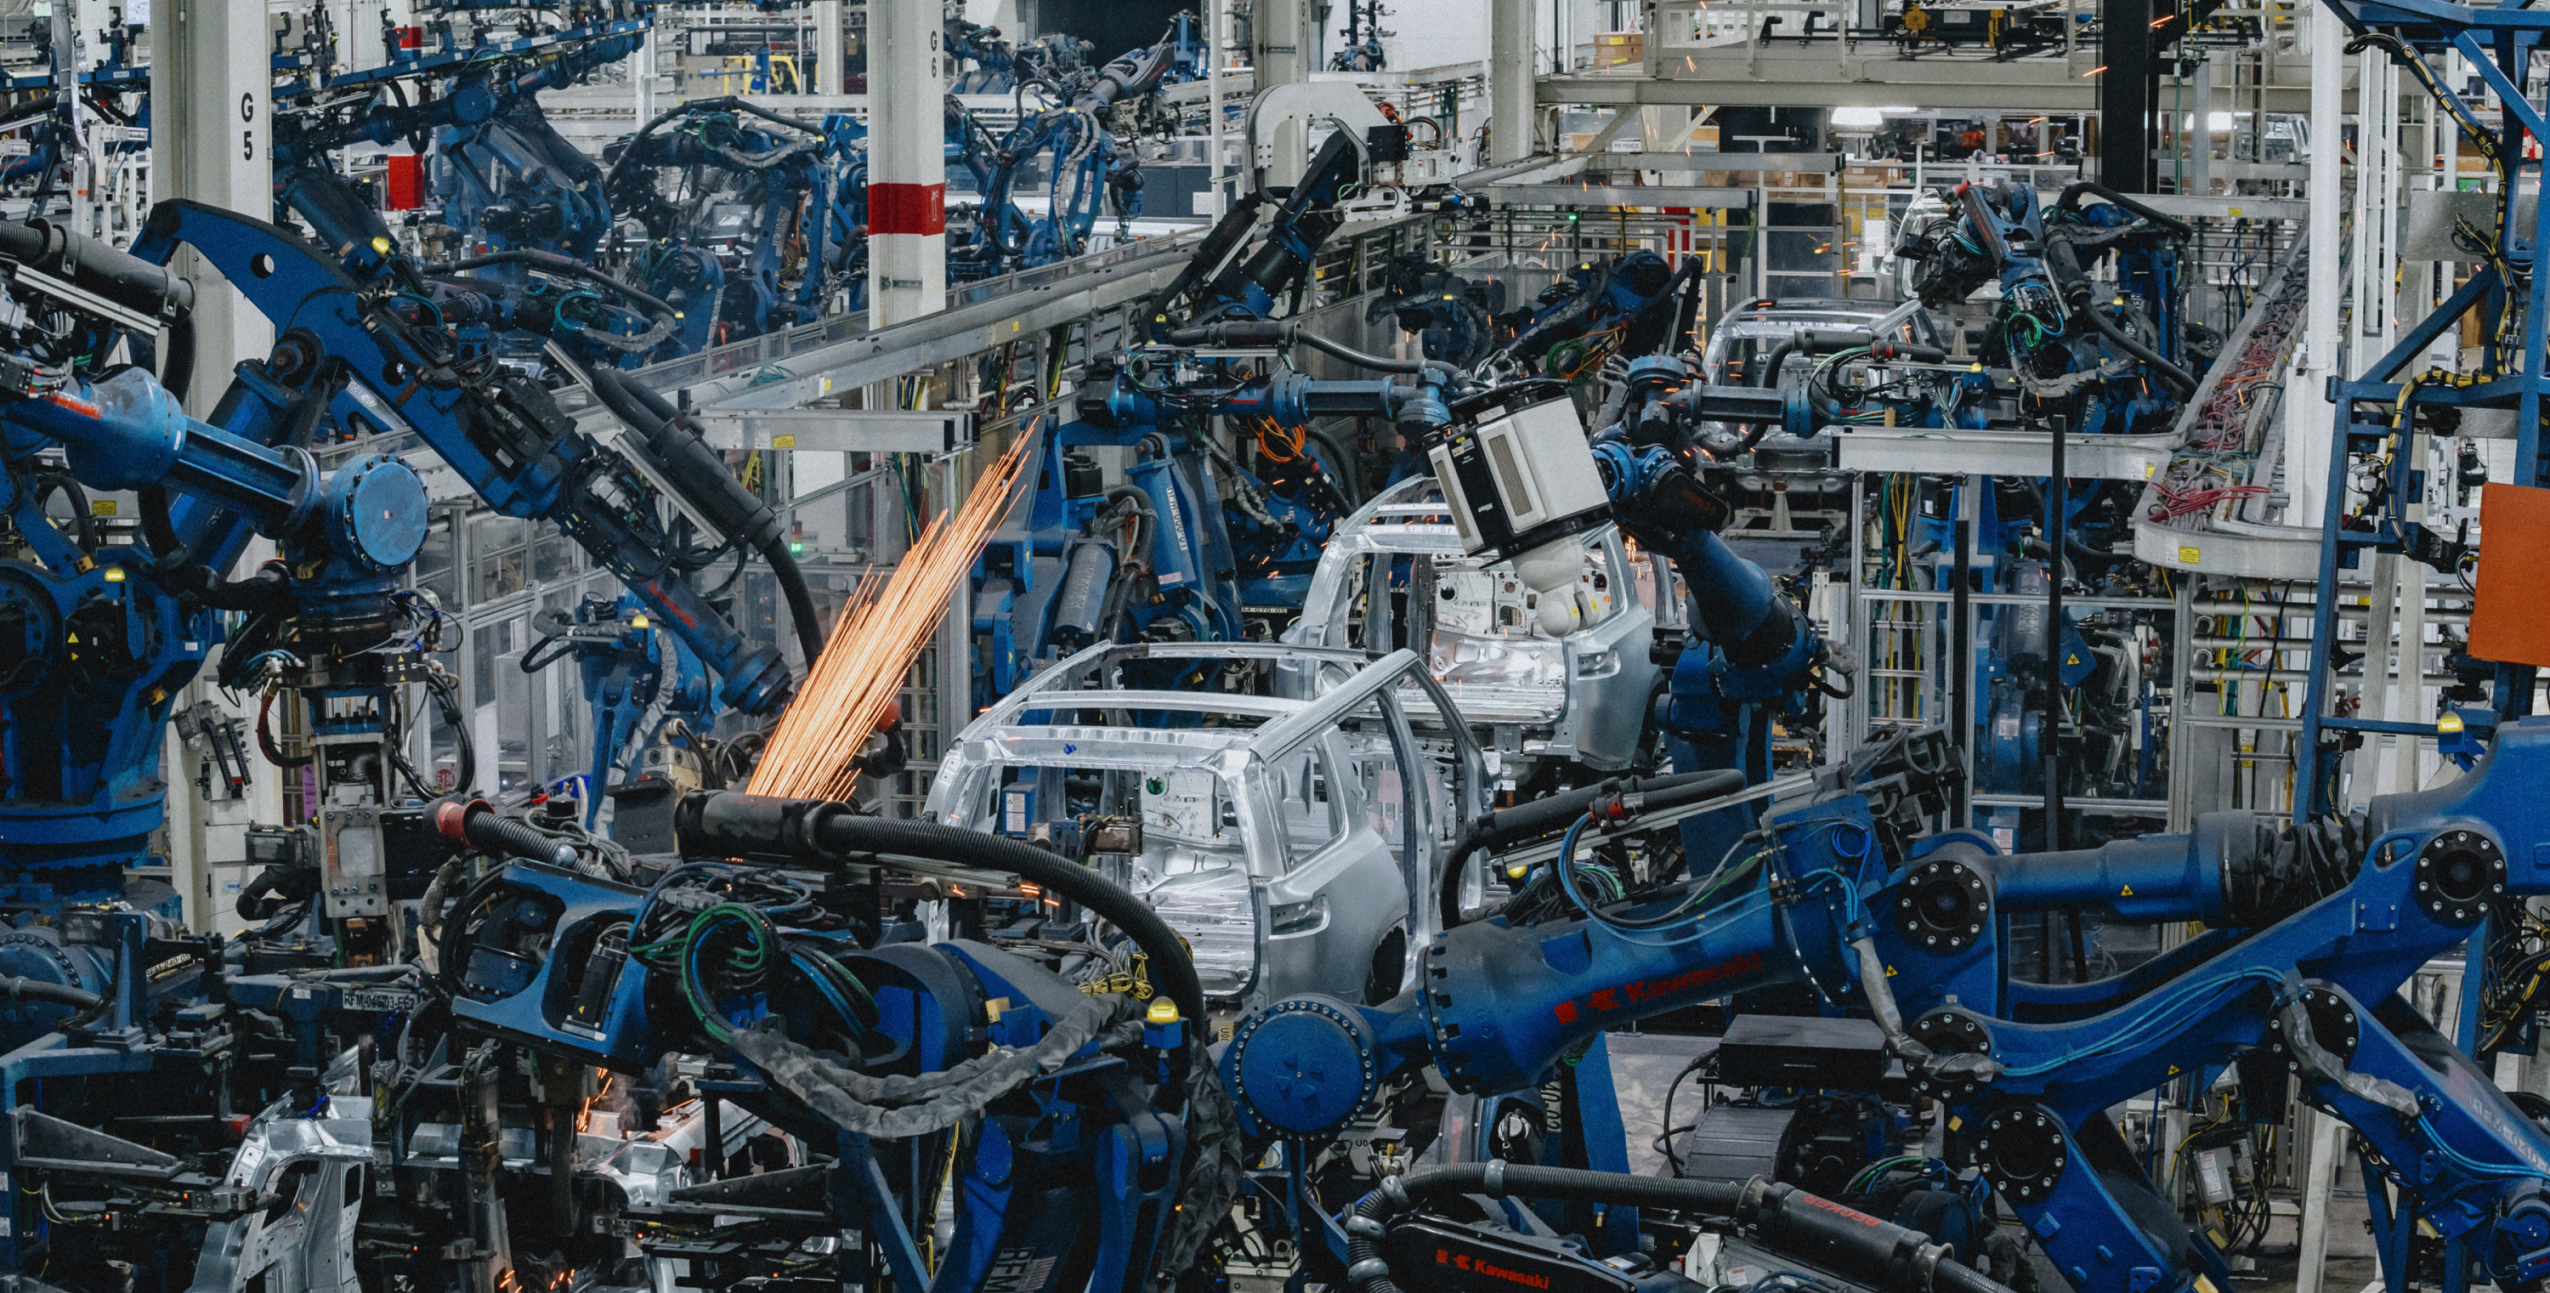
Production and manufacturing progress improved throughout 2023. Most notably,
Q4 production represented our strongest quarter to date with an annualized rate of over
70,000 units despite taking a week of downtime. During the year, our team managed the
crucial task of integrating new engineering design changes including our in-house drive units
for both the RCV and R1 platforms, our lithium iron phosphate (“LFP”) battery pack for the EDV, and new vehicle variants such as our Max Pack.
Rivian's production ramp and introduction of new technologies across multiple vehicle platforms have provided significant learnings in a compressed time frame. Our team will apply this experience to our 2024 operational plans to introduce a number of new technologies into the
R1 line which we expect to further lower costs. We have also applied these learnings into the product design, layout, and manufacturing principles for production at our greenfield facility in Georgia. We aim to start production in 2026 and look forward to unveiling our mid-size SUV, R2, to the world in just a few weeks. R2 is designed to achieve a considerably lower price point and cost structure while building on the brand position established with our flagship R1 adventure vehicles, R1T and R1S.
We remain focused on driving efficiency throughout Rivian. Our cost discipline has resulted in meaningful improvements in operating efficiency during 2023. Gross profit per delivered vehicle improved by $81k as compared to the fourth quarter of 2022. Additionally, Adjusted EBITDA1
for the full-year 2023 improved by $1,236 million compared to 2022, and capital expenditures reduced by $343 million during the same period. Our company-wide cost transformation program resulted in meaningful reductions in both R1 and EDV vehicle unit cost across
each major cost category, including material cost, manufacturing overhead, and logistics.
By incorporating new technologies and renegotiating supplier costs, we have reduced the material cost per unit. We expect to realize further cost reductions following our line shutdown
in the second quarter of 2024.
|
|||||
¹A reconciliation of non-GAAP financial measures to the most comparable GAAP measure is provided later in this letter. |
|||||
|
Q4 2023 Shareholder Letter | © 2024 Rivian. All rights reserved. 4 |
||||||
 | |||||
|
As we look back, we want to thank our employees, customers, suppliers, partners, communities, and shareholders who made our 2023 accomplishments possible and for their continued support of our vision.
Increase production and deliveries
◦Ramped production of all four of our vehicles, producing 57,232 vehicles, a 135% increase as compared to 2022
◦Scaled our delivery and go-to-market operations, delivering 50,122 vehicles to customers, a 147% increase as compared to 2022
Improve cost efficiency
◦~$81k improvement in gross profit per vehicle delivered from the fourth quarter of 2022 to the fourth quarter of 2023 driven by ramping production, material cost reductions, a decrease in LCNRV write-downs of inventory and firm purchase commitments, and increased revenue per vehicle
◦Held operating expenses flat as compared to 2022 while increasing revenue 167%
Develop future platforms and technologies
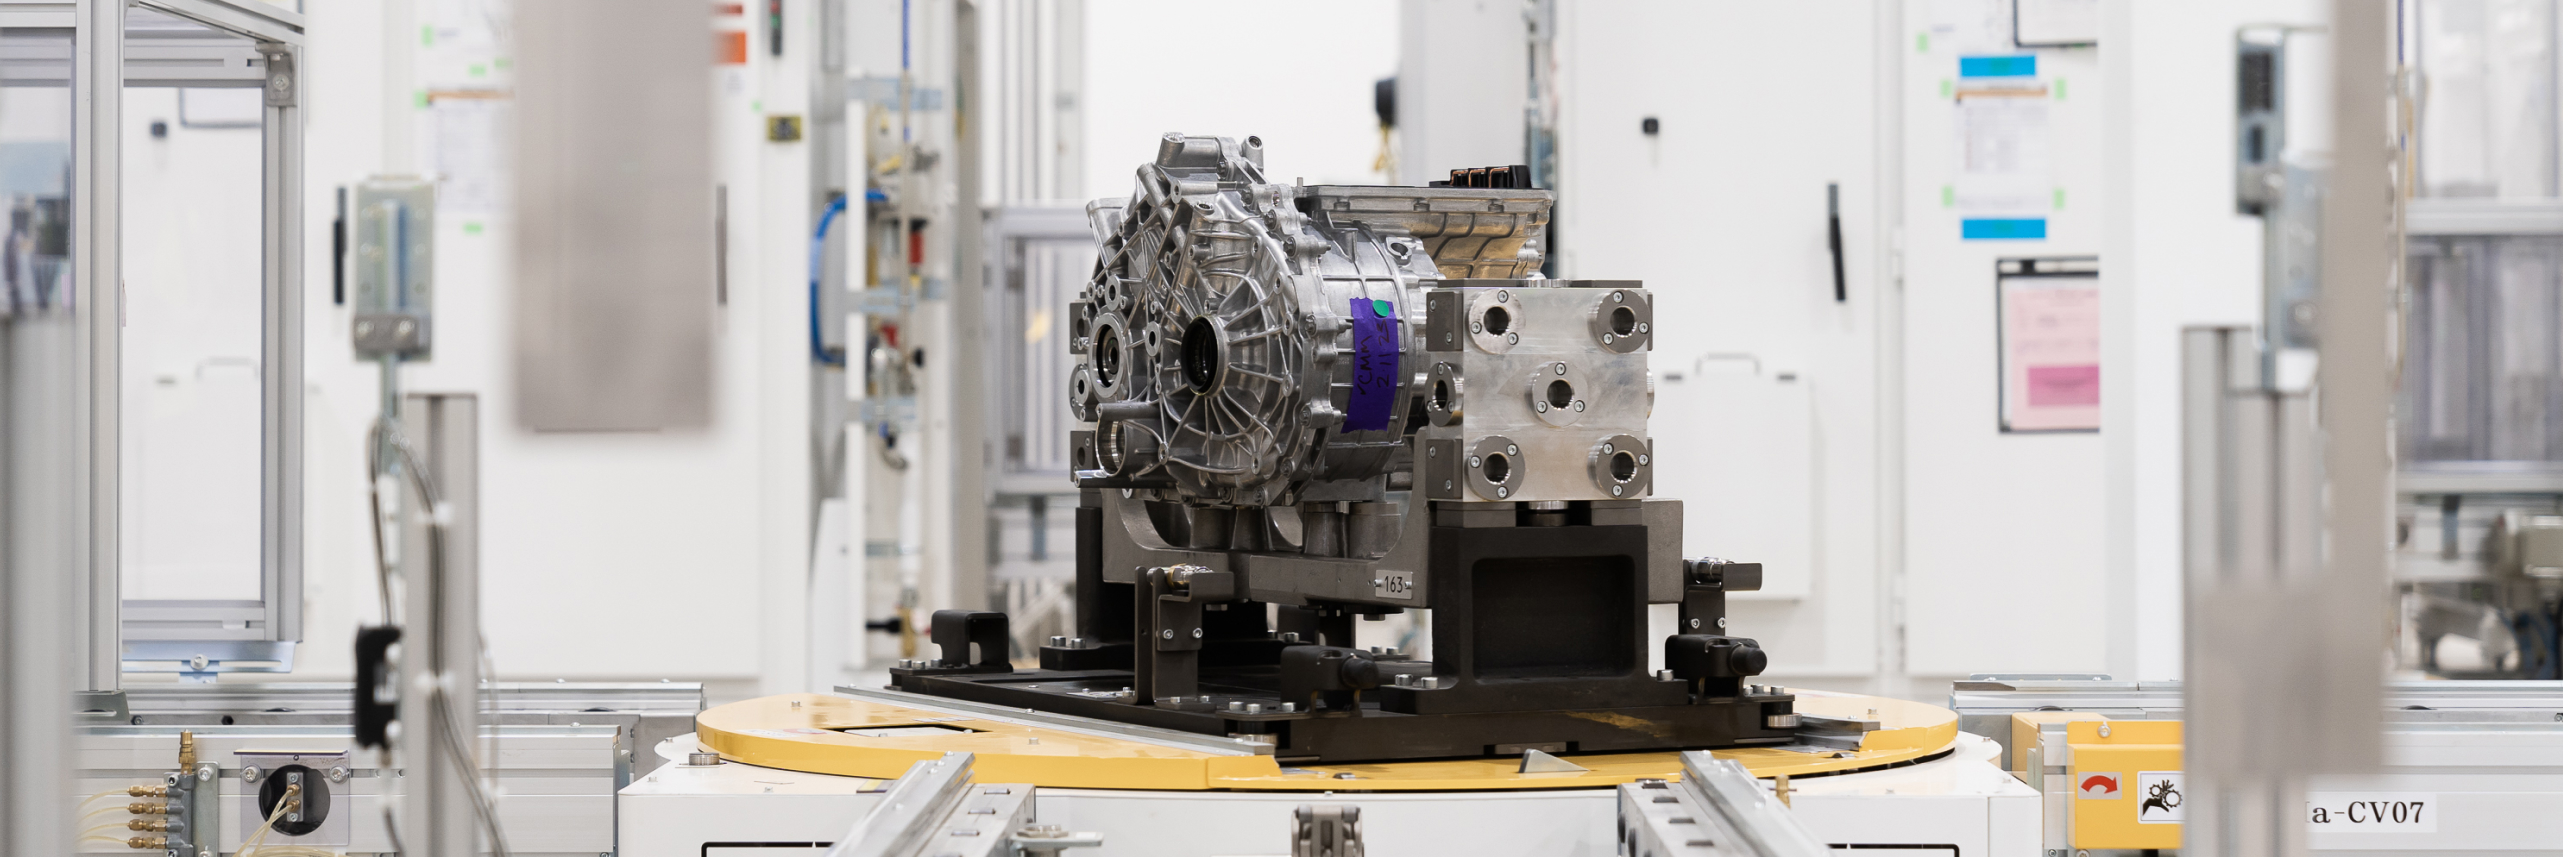
◦Released and ramped our in-house Enduro motor serving both the RCV and R1 platforms
◦Made significant progress on the design and development of our R2 platform which will be unveiled on March 7, 2024
Enhance customer experience
◦Grew our service footprint to 56 service centers and over 500 mobile service vehicles
◦Expanded the Rivian Adventure Network to over 400 chargers across 67 locations
◦Opened 10 new spaces and expanded our demo drive program and offering
|
|||||
|
Q4 2023 Shareholder Letter | © 2024 Rivian. All rights reserved. 5 |
||||||
 | |||||
|
We made meaningful progress during 2023 and in 2024 we are focused on the following
value drivers:
•Optimize operational efficiencies: We expect 2024 production to be flat year-over-year with total units of 57,000. The changes we plan to make in our R1 manufacturing line during the mid-year shut down are designed to deliver greater plant efficiency with production rates expected to improve by approximately 30%.
•Improve cost efficiency: The Rivian team is deeply focused on driving greater cost efficiency throughout the business, including operating expenses, capital expenditures, and cost of goods sold. Regarding our cost of goods sold, we have made continued progress lowering both our material costs as well as non-material costs. We anticipate the most significant set of cost reductions will happen in conjunction with the integration of new engineering design changes in the R1 platform, bringing on new suppliers and realizing effectivity dates for negotiated commercial savings with our suppliers. We expect to achieve modest gross profit in the fourth quarter of 2024.
•Develop future platforms and technologies: We believe 2024 will be foundational as we integrate new engineering design changes into the R1 platform that we expect will significantly reduce cost and position Rivian to achieve modest gross profit in the fourth quarter of 2024. Importantly, we believe our next generation R2 platform will benefit from the scalable technology being introduced in the R1 products and combines these technologies with a vehicle platform that is being developed to achieve a substantially lower cost structure through the learnings of launching R1. In addition, in 2024 we plan to introduce new variants and trims including the recently launched Standard Range R1 variant which expands our brand to a broader range of potential customers.
•Enhance the customer experience and demand generation: We believe that our direct-to-customer model provides our customers with a best-in-class purchase and ownership experience. Over the past year, we have been awarded both Best Ownership Experience among Premium Battery Electric Vehicles by a J.D. Power hosted survey and Most-Loved Car Brand of 2023 by a leading consumer publication. We remain focused on scaling our go-to-market infrastructure to enhance the customer experience and increase demand for our products. We currently have over 500 mobile service vehicles on the road which are handling the majority of our repair events. In addition, we have 56 service centers and 11 spaces, and expect to open 26 additional service centers and 17 spaces in 2024. Our service centers and spaces are designed to host demo drives for customers.
|
|||||
|
Q4 2023 Shareholder Letter | © 2024 Rivian. All rights reserved. 6 |
||||||
 | |||||
|
R2 Reveal
On March 7th, we plan to unveil R2 and are excited to share it with the world. The R2 platform will leverage the key vertically integrated technology we have and continue to develop for our R1 and RCV platforms. This includes our in-house software stack, propulsion technology, network architecture, and vehicle electronics.
|
|||||
 |
|||||
|
Q4 2023 Shareholder Letter | © 2024 Rivian. All rights reserved. 7 |
||||||
 | |||||
|
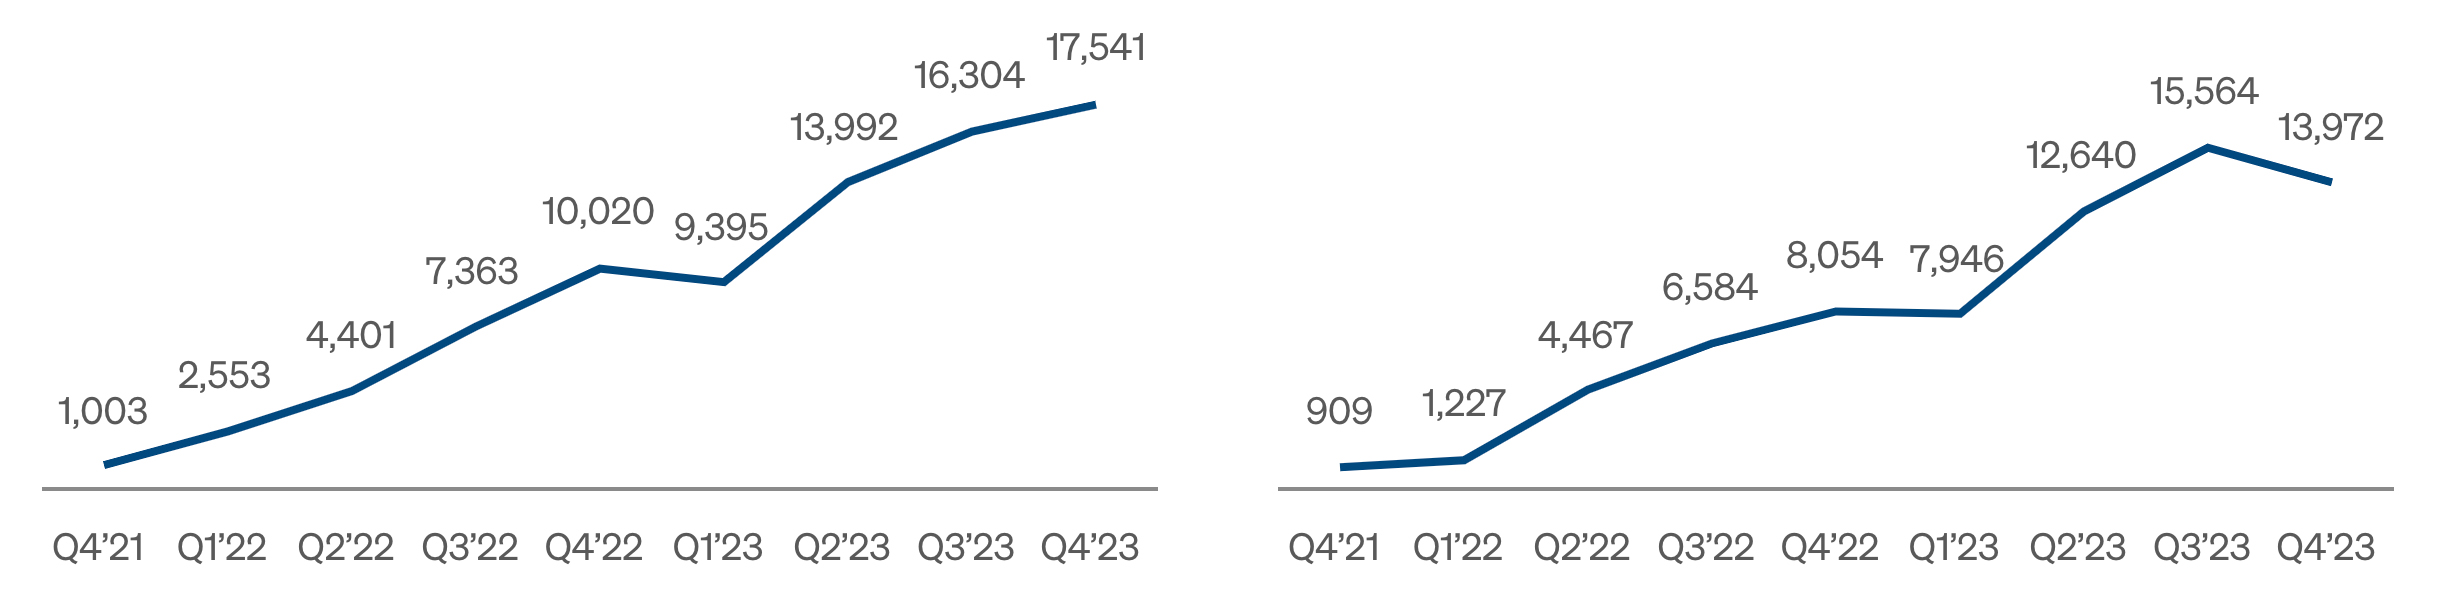
Production and deliveries
We produced 17,541 and delivered 13,972 vehicles in the fourth quarter of 2023.
As expected, the fourth quarter of 2023 reflected greater discrepancy between production and deliveries when compared to prior quarters. Seasonality of the commercial business was the primary contributor to the difference and accounted for the vast majority of the incremental finished goods inventory increase during the quarter. We expect EDV deliveries during the last quarter of each fiscal year to be lower than prior quarters; however, production is expected to remain continuous in order to maintain manufacturing efficiencies.
|
|||||
Quarterly Production Quarterly Deliveries |
|||||
 |
|||||
|
Q4 2023 Shareholder Letter | © 2024 Rivian. All rights reserved. 8 |
||||||
 | |||||
|
Scaling our go-to-market operations
As the number of Rivians on the road increases, we remain focused on scaling our
go-to-market infrastructure. Our relationship with our customers is deeply important to us;
it’s why we believe in owning nearly every interaction with them. We believe this will serve as
a long-term competitive differentiator by significantly enhancing the customer experience of owning a Rivian.
Spaces
We currently have 11 spaces open across the United States and Canada. Our spaces are an invitation to current and potential customers to get up close with our vehicles.
We hosted over 130,000 visitors in our spaces to experience Rivian since the start of 2024. We are encouraged by the traffic and brand awareness our spaces provide and plan to open over 17 incremental spaces in 2024.
Demo drives
Demo drives are offered at our spaces, service centers, and in some instances, at pop-up venues. Allowing potential customers the opportunity to experience our vehicles, their capabilities, safety features, and software has proven to be an effective demand generation strategy.
Leasing
We now offer leasing on both the R1T and R1S in 15 states across the United States.
Leasing has been one of our most requested financing options from our customers and
we are working to expand this offering more broadly.
|
|||||
|
Q4 2023 Shareholder Letter | © 2024 Rivian. All rights reserved. 9 |
||||||
 | |||||
|
Service centers
We remain focused on scaling our service network as the number of vehicles and miles driven continues to grow. We see the service network as a competitive differentiator significantly enhancing our customers’ experience of owning a Rivian. We currently have 56 service centers operational across North America and Germany (for our European EDV deliveries). These service centers also represent great customer facing spaces for hosting demo drives and
other brand engagement opportunities.
We are also committed to improving the vehicle service experience through the offering of mobile service. We have over 500 mobile service vehicles in operation handling the majority
of our service needs across all Rivian vehicles. Mobile service allows customers the opportunity to have their Rivian serviced from the comfort of their home or workplace.
Charging
Our goal remains to bring our customers the best charging experience possible. We have expanded our Rivian Adventure Network and now have over 400 fast chargers across
67 locations. During the fourth quarter of 2023, these chargers had an average uptime
of 97%, providing customers with a fast, reliable, and seamless charge when away from home.
We develop, design, and manufacture our chargers in-house and believe they offer a scalable solution to enable EV adoption.
In the second half of 2024, we anticipate opening up our Rivian Adventure Network to
non-Rivian owners. Opening our network will enable other customers to benefit from our reliable charging solution, allow Rivian to leverage the fixed costs associated with each charging site, and allow Rivian to apply for committed government grants associated with expanding domestically manufactured fast chargers across the country.
In addition to our Rivian Adventure Network, Rivian owners are expected to gain access to
over 12,000 Tesla Superchargers across the country through our collaboration with Tesla.
Our goal is to enable a seamless end-to-end NACS digital experience for our customers.
|
|||||
|
Q4 2023 Shareholder Letter | © 2024 Rivian. All rights reserved. 10 |
||||||
 | |||||
|
Enhancing the customer experience through software
We continue to demonstrate the value of our in-house software architecture and capabilities through over-the-air (“OTA”) updates which provide our customers seamless feature updates. The vertical integration of our hardware and software platforms enable our steady stream of updates. Through a combination of our customer feedback and diagnostic data, our OTA updates target vehicle improvements across vehicle dynamics, autonomy, battery management, digital experience, body control, and telematics.
Throughout 2023, we were able to significantly enhance our customers’ experience with their vehicles through OTA software updates including:
Vehicle performance
◦Enhanced our propulsion controls which has increased range on all R1 vehicles
◦Improved ride quality across all drive modes on our R1 vehicles
◦Improved towing experience including new trailer profiles, automatic weight sensing, adaptive range estimation, and a dedicated truck bed camera view
Safety
◦Improved our Driver+ functionality. Made our vehicles more capable of handling a variety of situations and weather conditions
◦Enhanced Driver+ usability by allowing the system to automatically reengage after changing lanes allowing for a more seamless experience
User experience
◦Enhanced gear guard system – security system with automatic video recording using vehicle’s external cameras
◦Integrated data from A Better Routeplanner into our in-vehicle navigation and trip planner
Our unique capabilities stem from the intentional decisions we made years ago to take a clean sheet approach to our software stack and electrical hardware in the vehicle. We are excited to continue to evolve our software capabilities as well as leverage our customer feedback to enhance our vehicles over time.
|
|||||
|
Q4 2023 Shareholder Letter | © 2024 Rivian. All rights reserved. 11 |
||||||
 | |||||
|
Focus on Gross Profit and Cost Efficiency
|
|||||
 |
|||||
|
We believe our success driving significant reduction in the costs of our vehicles during 2023 positions us to achieve modest gross profit in the fourth quarter of 2024. We improved gross profit per vehicle delivered by approximately $81,000 in the fourth quarter of 2023 as compared to the fourth quarter of 2022. This improvement was attributed to three main drivers:
•~45% - Fixed/semi-fixed cost per unit reduction: The improvement was mainly driven by ramping production in the fourth quarter over 75% year-over-year. We also saw a meaningful reduction in LCNRV write-downs and losses on firm purchase commitments during the year.
•~40% - Variable cost per unit: Our improvement in variable costs per vehicle was mainly attributed to our continued focus on driving material cost downs for the R1 and commercial vehicles. On the commercial vehicles, we realized over 35% savings in material costs after implementing our Enduro drive unit and LFP battery pack in the first quarter of 2023.
•~15% - Increase in average revenue per unit: We delivered a higher mix of new priced orders, new variants with higher average prices such as our Max pack, and an increase in regulatory credits revenue.
The key drivers to bridge the fourth quarter 2023 to the fourth quarter of 2024 are:
•~50% - Variable cost per unit: We anticipate the majority of these savings will be accomplished through the material cost reductions planned as part of our R1 engineering design changes, commercial supplier negotiations, and lower raw material costs.
•~35% - Fixed/semi-fixed cost efficiencies: As part of our planned shutdown and the associated design changes and optimization initiatives, we expect to significantly reduce our fixed costs per vehicle delivered by the end of 2024. These initiatives include increasing our production line rate by 30%. We also expect our LCNRV and firm purchase commitments balance to provide a benefit to gross profit during 2024.
•~15% - Non-vehicle revenue: With over 71,000 Rivians on the road, we have the opportunity for increased revenue in areas such as service, accessories, remarketing, finance, insurance, and other software enabled services. These revenue sources are core to our long-term margin targets, and we expect to continue to drive growth and efficiencies in these areas over the next few years.
|
|||||
|
Q4 2023 Shareholder Letter | © 2024 Rivian. All rights reserved. 12 |
||||||
 | |||||
|
2024 Outlook
Over the course of fiscal year 2024, we are focused on
•Driving towards profitability: Drive down cost and achieve modest gross profit in the fourth quarter
•Customer experience and demand generation: Build customer demand and a robust customer experience
•Operational excellence: Continuous improvement and quality
•Technology leadership: Integration of new technologies in R1 and progress towards R2 launch
Economic and geopolitical uncertainties and pressures, most notably the impact of historically high interest rates, have informed our expectations for 2024.
As previously discussed, we expect to shut down the consumer and commercial lines
during the second quarter of 2024 to introduce new cost saving in-vehicle technologies to the
R1 platform. We believe these changes will meaningfully reduce our material costs and position Rivian to exit 2024 with a much-improved margin profile.
For 2024, we expect our total deliveries to be derived from our existing order bank as well as new orders generated during the year. Our full year targets rely on an improvement in order rate driven by our planned go-to-market strategies. The conversion of our existing order bank to sales can be impacted by several factors including delivery timing, location of order, monthly payments, and customer readiness. Our order bank has notably reduced over time as deliveries more than doubled in 2023 versus 2022, and we have incurred cancellations due to macro and customer factors.
|
|||||
| 2024 Guidance | |||||
| Vehicles Produced | 57,000 | ||||
| Adj. EBITDA | $(2,700) million | ||||
| Capital Expenditures | $1,750 million | ||||
|
Q4 2023 Shareholder Letter | © 2024 Rivian. All rights reserved. 13 |
||||||
 | |||||
|
During 2024, we anticipate making further progress on commercial, engineering, and operational cost down efforts, and increasing non-vehicle revenue streams such as regulatory credits, service, remarketing, financing, insurance, and software. We expect to achieve a modest gross profit in the fourth quarter of 2024.
We have taken recent measures to reduce our operating and capital expenditures. For 2024, total adjusted operating expenses are expected to be approximately flat as compared to 2023. Adjusted EBITDA is expected to be $(2,700) million in 2024. Capital expenditures in 2024 are expected to be $1,750 million, driven by additional investment in our next generation technologies, our Georgia facility, and go-to-market operations.
|
|||||
|
Q4 2023 Shareholder Letter | © 2024 Rivian. All rights reserved. 14 |
||||||

| Revenue |
Total revenue for the fourth quarter of 2023 was $1,315 million, primarily driven by the delivery
of 13,972 vehicles. During the year ended December 31, 2023, total revenue was $4,434 million, supported by total vehicle deliveries of 50,122. Total revenues from the sale of regulatory credits were $39 million for the quarter and $73 million for the fiscal year 2023.
|
||||
| Gross Profit |
We generated negative gross profit of $(606) million for the fourth quarter of 2023, compared to $(1,000) million for the same quarter in 2022. For the year ended 2023, we generated negative gross profit of $(2,030) million, as compared to $(3,123) million in 2022.
Gross profit per vehicle delivered was approximately negative $(43,000). During the fourth quarter costs of goods sold were negatively impacted by $70 million, or approximately $5,000 per vehicle delivered. These costs include supplier related expenses, accelerated depreciation, and other expenses primarily related to the new technology and design changes going into the R1 platform. While we could incur additional costs associated with our planned shutdown and technology and design changes in the near-term, we do not anticipate these costs to be part of our normal course of business in the longer-term.
During the fourth quarter we also delivered a higher proportion of consumer vehicles due to Amazon’s expected seasonality. For context, the portion of our total revenue attributed to Amazon was 8% in the fourth quarter of 2023 as compared to 30% in the third quarter. Given our commercial vans have lower material costs driven by some of the technology changes made in the first quarter of 2023, the lower deliveries during the quarter negatively impacted our gross margin.
The fourth quarter of 2023 was impacted by a charge in LCNRV write-downs on inventory and losses on firm purchase commitments. Our ending inventory balance reflects LCNRV write-downs of $319 million, while liabilities for losses on firm purchase commitments were $126 million, for a total of $445 million at the end of the fourth quarter of 2023. We expect the amount of LCNRV write-downs and losses on firm purchase commitments to decrease over time, which we anticipate will have the effect of increasing inventory balances and decreasing cost of revenues per vehicle. We forecast reaching positive gross profit in the fourth quarter of 2024 and therefore expect that by the end of 2024, we will not have material LCNRV inventory write-offs associated with goods manufactured at our Normal facility.
|
||||
 |
Q4 2023 Shareholder Letter | © 2024 Rivian. All rights reserved. 15 |
||||||
| Operating Expenses and Operating Loss |
Total operating expenses in the fourth quarter of 2023 grew to $975 million, as compared to $795 million in the same period last year.
In the fourth quarter of 2023, we recognized a non-cash, stock-based compensation expense within operating expenses of $194 million as compared to $123 million in the fourth quarter of 2022 and depreciation and amortization expense within operating expenses of $75 million as compared to $53 million million in the fourth quarter of 2022.
Research and development (“R&D”) expense in the fourth quarter of 2023 was $526 million, as compared to $402 million in the same period last year. The increase was primarily due to a $68 million increase in stock-based compensation expense and a $28 million increase in engineering, design, and development costs and other related project costs.
Selling, general, and administrative (“SG&A”) expense in the fourth quarter of 2023 was $449 million, as compared to $393 million in the same period last year. The increase was primarily due to a $32 million increase in depreciation and amortization expense and $29 million increase in payroll and related expenses due to an increase in headcount to support commercial go-to-market operations.
Despite our production and deliveries more than doubling as compared 2022, our operating expenses in 2023 remained flat year-over-year; $3,709 million in 2023 as compared to $3,733 million for 2022.
We experienced a loss from operations in the fourth quarter of 2023 totaling $(1,581) million, as compared to $(1,795) million in the same period last year. For fiscal year 2023, we recorded a loss from operations of $(5,739) million as compared to $(6,856) million in 2022.
|
||||
| Adjusted Operating Expenses¹ |
Adjusted R&D¹ for the fourth quarter of 2023 was $388 million as compared to $322 million for the same period last year.
Adjusted SG&A¹ for the fourth quarter of 2023 was $318 million as compared to $297 million for the same period last year.
Total adjusted operating expenses¹ for the fourth quarter of 2023 was $706 million as compared to $619 million for the same period last year. For the fiscal year of 2023 total adjusted operating expenses¹ was $2,697 million compared to $2,629 million in 2022.
|
||||
| Net Loss | Our net loss for the fourth quarter of 2023 was $(1,521) million as compared to $(1,723) million for the same period last year. For fiscal year 2023, we recorded a net loss of $(5,432) million as compared to $(6,752) million in 2022. The decreased losses were due primarily to the improved gross profit per vehicle. |
||||
| Adjusted EBITDA¹ | Adjusted EBITDA¹ for the fourth quarter of 2023 was $(1,096) million as compared to $(1,461) million for the same period last year. The decreased Adjusted EBITDA¹ loss for the fourth quarter of 2023 as compared to the fourth quarter of 2022 was driven by lower gross profit losses. For fiscal year 2023, Adjusted EBITDA¹ was $(3,981) million as compared to $(5,217) million in 2022. |
||||
| Net Cash Used in Operating Activities | Net cash used in operating activities for the fourth quarter of 2023 was $(1,107) million as compared to $(1,446) million for the same period last year. Net cash used in operating activities for fiscal year 2023 was $(4,866) million as compared to $(5,052) million during fiscal year 2022. |
||||
| Capital Expenditures | Capital expenditures for the fourth quarter of 2023 were $(298) million, as compared to $(294) million for the same period last year. For fiscal year 2023, capital expenditures were $(1,026) million as compared to $(1,369) million in 2022. The prior year values were higher due to elevated equipment and construction spend in the early stages of our production ramp. |
||||
| ¹A reconciliation of non-GAAP financial measures to the most comparable GAAP measure is provided later in this letter. | |||||
|
Q4 2023 Shareholder Letter | © 2024 Rivian. All rights reserved. 16 |
||||||
| Liquidity and Free Cash Flow¹ |
We ended the fourth quarter of 2023 with $9,368 million in cash, cash equivalents, and short-term investments. Including the capacity under our asset-based revolving-credit facility, we ended the fourth quarter of 2023 with $10,468 million of total liquidity.
We define free cash flow¹ as net cash used in operating activities less capital expenditures. The reduction in year-over-year net cash used in operating activities discussed above resulted in negative free cash flow¹ of $(1,405) million for the fourth quarter of 2023 as compared to $(1,740) million for the same period last year. Additionally, free cash flow¹ was $(5,892) million for fiscal year 2023 as compared to $(6,421) million for 2022.
|
||||
| Webcast | We will host an audio webcast to discuss our results and provide a business update at 2:00pm PT / 5:00pm ET on Wednesday, February 21, 2024. The link to the webcast will be made available on our Investor Relations website at rivian.com/investors. After the call, a replay will be available at rivian.com/investors for four weeks. |
||||
| ¹A reconciliation of non-GAAP financial measures to the most comparable GAAP measure is provided later in this letter. | |||||
|
Q4 2023 Shareholder Letter | © 2024 Rivian. All rights reserved. 17 |
||||||
| Quarterly Financial Performance | ||||||||||||||
| (in millions, except production, delivery, gross margin, gross profit per unit delivered, and per share amounts) | ||||||||||||||
| Three Months Ended | ||||||||||||||||||||||||||||||||
| December 31, 2022 | March 31, 2023 | June 30, 2023 |
September 30, 2023 |
December 31, 2023 | ||||||||||||||||||||||||||||
| Production | 10,020 | 9,395 | 13,992 | 16,304 | 17,541 | |||||||||||||||||||||||||||
| Delivery | 8,054 | 7,946 | 12,640 | 15,564 | 13,972 | |||||||||||||||||||||||||||
| Revenues | $ | 663 | $ | 661 | $ | 1,121 | $ | 1,337 | $ | 1,315 | ||||||||||||||||||||||
| Gross profit | $ | (1,000) | $ | (535) | $ | (412) | $ | (477) | $ | (606) | ||||||||||||||||||||||
| Gross margin | (151) | % | (81) | % | (37) | % | (36) | % | (46) | % | ||||||||||||||||||||||
| Gross profit per unit delivered | $ | (124,162) | $ | (67,329) | $ | (32,595) | $ | (30,648) | $ | (43,372) | ||||||||||||||||||||||
| Research and development | $ | 402 | $ | 496 | $ | 444 | $ | 529 | $ | 526 | ||||||||||||||||||||||
| Selling, general, and administrative | 393 | 402 | 429 | 434 | 449 | |||||||||||||||||||||||||||
| Total operating expenses | $ | 795 | $ | 898 | $ | 873 | $ | 963 | $ | 975 | ||||||||||||||||||||||
| Loss from operations | $ | (1,795) | $ | (1,433) | $ | (1,285) | $ | (1,440) | $ | (1,581) | ||||||||||||||||||||||
| Net loss attributable to common stockholders, basic and diluted | $ | (1,723) | $ | (1,349) | $ | (1,195) | $ | (1,367) | $ | (1,521) | ||||||||||||||||||||||
| Net loss per share attributable to Class A and Class B common stockholders, basic and diluted | $ | (1.87) | $ | (1.45) | $ | (1.27) | $ | (1.44) | $ | (1.58) | ||||||||||||||||||||||
| Adjusted research and development (non-GAAP)¹ | $ | 322 | $ | 379 | $ | 336 | $ | 346 | $ | 388 | ||||||||||||||||||||||
| Adjusted selling, general, and administrative (non-GAAP)¹ | 297 | 296 | 316 | 318 | 318 | |||||||||||||||||||||||||||
| Total adjusted operating expenses (non-GAAP)¹ | $ | 619 | $ | 675 | $ | 652 | $ | 664 | $ | 706 | ||||||||||||||||||||||
| Adjusted EBITDA (non-GAAP)¹ | $ | (1,461) | $ | (1,062) | $ | (881) | $ | (942) | $ | (1,096) | ||||||||||||||||||||||
Cash, cash equivalents, short-term investments, and restricted cash 2 |
$ | 12,099 | $ | 11,780 | $ | 10,202 | $ | 9,133 | $ | 9,368 | ||||||||||||||||||||||
| Net cash used in operating activities | $ | (1,446) | $ | (1,521) | $ | (1,361) | $ | (877) | $ | (1,107) | ||||||||||||||||||||||
| Capital expenditures | (294) | (283) | (255) | (190) | (298) | |||||||||||||||||||||||||||
| Free cash flow (non-GAAP)¹ | $ | (1,740) | $ | (1,804) | $ | (1,616) | $ | (1,067) | $ | (1,405) | ||||||||||||||||||||||
| Depreciation and amortization expense | ||||||||||||||||||||||||||||||||
| Cost of revenues | $ | 146 | $ | 130 | $ | 160 | $ | 176 | $ | 195 | ||||||||||||||||||||||
| Research and development | 29 | 33 | 36 | 50 | 19 | |||||||||||||||||||||||||||
| Selling, general, and administrative | 24 | 25 | 27 | 30 | 56 | |||||||||||||||||||||||||||
| Total depreciation and amortization expense | $ | 199 | $ | 188 | $ | 223 | $ | 256 | $ | 270 | ||||||||||||||||||||||
| Stock-based compensation expense | ||||||||||||||||||||||||||||||||
| Cost of revenues | $ | 12 | $ | 18 | $ | 23 | $ | 23 | $ | 21 | ||||||||||||||||||||||
| Research and development | 51 | 84 | 72 | 133 | 119 | |||||||||||||||||||||||||||
| Selling, general, and administrative | 72 | 81 | 86 | 86 | 75 | |||||||||||||||||||||||||||
| Total stock-based compensation expense | $ | 135 | $ | 183 | $ | 181 | $ | 242 | $ | 215 | ||||||||||||||||||||||
| Inventory LCNRV write-downs | ||||||||||||||||||||||||||||||||
Inventory LCNRV write-downs2 |
$ | 582 | $ | 561 | $ | 379 | $ | 292 | $ | 319 | ||||||||||||||||||||||
Liabilities for losses on firm purchase commitments2 |
338 | 261 | 179 | 160 | 126 | |||||||||||||||||||||||||||
Total inventory write-downs and liabilities for losses on firm purchase commitments 2 |
$ | 920 | $ | 822 | $ | 558 | $ | 452 | $ | 445 | ||||||||||||||||||||||
| ¹ A reconciliation of non-GAAP financial measures to the most comparable GAAP measure is provided later in this letter. | ||||||||||||||||||||||||||||||||
2 Amount as of date shown. | ||||||||||||||||||||||||||||||||
|
Q4 2023 Shareholder Letter | © 2024 Rivian. All rights reserved. 18 |
||||||
| Consolidated Balance Sheets | ||||||||||||||
| (in millions, except per share amounts) | ||||||||||||||
| Assets | December 31, 2022 | December 31, 2023 | ||||||||||||
| Current assets: | ||||||||||||||
| Cash and cash equivalents | $ | 11,568 | $ | 7,857 | ||||||||||
| Short-term investments | — | 1,511 | ||||||||||||
| Accounts receivable, net | 102 | 161 | ||||||||||||
| Inventory | 1,348 | 2,620 | ||||||||||||
| Other current assets | 112 | 164 | ||||||||||||
| Total current assets | 13,130 | 12,313 | ||||||||||||
| Property, plant, and equipment, net | 3,758 | 3,874 | ||||||||||||
| Operating lease assets, net | 330 | 356 | ||||||||||||
| Other non-current assets | 658 | 235 | ||||||||||||
| Total assets | $ | 17,876 | $ | 16,778 | ||||||||||
| Liabilities and Stockholders’ Equity | ||||||||||||||
| Current liabilities: | ||||||||||||||
| Accounts payable | $ | 1,000 | $ | 981 | ||||||||||
| Accrued liabilities | 1,154 | 1,145 | ||||||||||||
| Current portion of lease liabilities and other current liabilities | 270 | 361 | ||||||||||||
| Total current liabilities | 2,424 | 2,487 | ||||||||||||
| Long-term debt | 1,231 | 4,431 | ||||||||||||
| Long-term lease liabilities | 311 | 324 | ||||||||||||
| Other non-current liabilities | 111 | 395 | ||||||||||||
| Total liabilities | 4,077 | 7,637 | ||||||||||||
| Commitments and contingencies | ||||||||||||||
| Stockholders' equity: | ||||||||||||||
Preferred stock, $0.001 par value; 10 shares authorized and 0 shares issued and outstanding as of December 31, 2022 and 2023 |
— | — | ||||||||||||
Common stock, $0.001 par value; 3,508 and 3,508 shares authorized and 926 and 968 shares issued and outstanding as of December 31, 2022 and 2023, respectively |
1 | 1 | ||||||||||||
| Additional paid-in capital | 26,926 | 27,695 | ||||||||||||
| Accumulated deficit | (13,126) | (18,558) | ||||||||||||
| Accumulated other comprehensive (loss) income | (2) | 3 | ||||||||||||
| Total stockholders' equity | 13,799 | 9,141 | ||||||||||||
| Total liabilities and stockholders' equity | $ | 17,876 | $ | 16,778 | ||||||||||
|
Q4 2023 Shareholder Letter | © 2024 Rivian. All rights reserved. 19 |
||||||
| Consolidated Statements of Operations | ||||||||||||||
| (in millions, except per share amounts) | ||||||||||||||
| Three Months Ended December 31, | Twelve Months Ended December 31, | |||||||||||||||||||||||||
| 2022 | 2023 | 2022 | 2023 | |||||||||||||||||||||||
| Revenues | $ | 663 | $ | 1,315 | $ | 1,658 | $ | 4,434 | ||||||||||||||||||
| Cost of revenues | 1,663 | 1,921 | 4,781 | 6,464 | ||||||||||||||||||||||
| Gross profit | (1,000) | (606) | (3,123) | (2,030) | ||||||||||||||||||||||
| Operating expenses | ||||||||||||||||||||||||||
| Research and development | 402 | 526 | 1,944 | 1,995 | ||||||||||||||||||||||
| Selling, general, and administrative | 393 | 449 | 1,789 | 1,714 | ||||||||||||||||||||||
| Total operating expenses | 795 | 975 | 3,733 | 3,709 | ||||||||||||||||||||||
| Loss from operations | (1,795) | (1,581) | (6,856) | (5,739) | ||||||||||||||||||||||
| Interest income | 99 | 131 | 193 | 522 | ||||||||||||||||||||||
| Interest expense | (33) | (73) | (103) | (220) | ||||||||||||||||||||||
| Other income, net | 6 | 2 | 18 | 6 | ||||||||||||||||||||||
| Loss before income taxes | (1,723) | (1,521) | (6,748) | (5,431) | ||||||||||||||||||||||
| Provision for income taxes | — | — | (4) | (1) | ||||||||||||||||||||||
| Net loss | $ | (1,723) | $ | (1,521) | $ | (6,752) | $ | (5,432) | ||||||||||||||||||
| Net loss attributable to common stockholders, basic and diluted | $ | (1,723) | $ | (1,521) | $ | (6,752) | $ | (5,432) | ||||||||||||||||||
| Net loss per share attributable to common stockholders, basic and diluted | $ | (1.87) | $ | (1.58) | $ | (7.40) | $ | (5.74) | ||||||||||||||||||
| Weighted-average common shares outstanding, basic and diluted | 923 | 963 | 913 | 947 | ||||||||||||||||||||||
|
Q4 2023 Shareholder Letter | © 2024 Rivian. All rights reserved. 20 |
||||||
| Consolidated Statements of Cash Flows | ||||||||||||||
| (in millions) | ||||||||||||||
| Years Ended December 31, | ||||||||||||||
| 2022 | 2023 | |||||||||||||
| Cash flows from operating activities: | ||||||||||||||
| Net loss | $ | (6,752) | $ | (5,432) | ||||||||||
| Depreciation and amortization | 652 | 937 | ||||||||||||
| Stock-based compensation expense | 987 | 821 | ||||||||||||
| Inventory LCNRV write-downs and losses on firm purchase commitments | 920 | 107 | ||||||||||||
| Other non-cash activities | 82 | 115 | ||||||||||||
| Changes in operating assets and liabilities: | ||||||||||||||
| Accounts receivable, net | (76) | (59) | ||||||||||||
| Inventory | (1,657) | (1,604) | ||||||||||||
| Other current assets | (14) | (62) | ||||||||||||
| Other non-current assets | (22) | (84) | ||||||||||||
| Accounts payable and accrued liabilities | 623 | 105 | ||||||||||||
| Other current liabilities | 104 | 73 | ||||||||||||
| Other non-current liabilities | 101 | 217 | ||||||||||||
| Net cash used in operating activities | (5,052) | (4,866) | ||||||||||||
| Cash flows from investing activities: | ||||||||||||||
| Purchases of short-term investments | — | (2,410) | ||||||||||||
| Maturities of short-term investments | — | 925 | ||||||||||||
| Capital expenditures | (1,369) | (1,026) | ||||||||||||
| Net cash used in investing activities | (1,369) | (2,511) | ||||||||||||
| Cash flows from financing activities: | ||||||||||||||
| Proceeds from issuance of capital stock including employee stock purchase plan | 102 | 61 | ||||||||||||
| Proceeds from issuance of convertible notes | — | 3,195 | ||||||||||||
| Purchase of capped call options | — | (108) | ||||||||||||
| Other financing activities | (3) | (18) | ||||||||||||
| Net cash provided by financing activities | 99 | 3,130 | ||||||||||||
| Effect of exchange rate changes on cash and cash equivalents | (2) | 5 | ||||||||||||
| Net change in cash | (6,324) | (4,242) | ||||||||||||
| Cash, cash equivalents, and restricted cash—Beginning of period | 18,423 | 12,099 | ||||||||||||
| Cash, cash equivalents, and restricted cash—End of period | $ | 12,099 | $ | 7,857 | ||||||||||
| Supplemental disclosure of cash flow information: | ||||||||||||||
| Cash paid for interest | $ | 88 | $ | 169 | ||||||||||
| Supplemental disclosure of non-cash investing and financing activities: | ||||||||||||||
| Capital expenditures included in liabilities | $ | 364 | $ | 374 | ||||||||||
| Capital stock issued to settle bonuses | $ | — | $ | 137 | ||||||||||
|
Q4 2023 Shareholder Letter | © 2024 Rivian. All rights reserved. 21 |
||||||
| Depreciation and Amortization | ||||||||||||||
| (in millions) | ||||||||||||||
| Three Months Ended December 31, | Twelve Months Ended December 31, | |||||||||||||||||||||||||
| 2022 | 2023 | 2022 | 2023 | |||||||||||||||||||||||
| Cost of revenues | $ | 146 | $ | 195 | $ | 475 | $ | 661 | ||||||||||||||||||
| Research and development | 29 | 19 | 95 | 138 | ||||||||||||||||||||||
| Selling, general, and administrative | 24 | 56 | 82 | 138 | ||||||||||||||||||||||
| Total depreciation and amortization expense | $ | 199 | $ | 270 | $ | 652 | $ | 937 | ||||||||||||||||||
| Stock-Based Compensation Expense | ||||||||||||||
| (in millions) | ||||||||||||||
| Three Months Ended December 31, | Twelve Months Ended December 31, | |||||||||||||||||||||||||
| 2022 | 2023 | 2022 | 2023 | |||||||||||||||||||||||
| Cost of revenues | $ | 12 | $ | 21 | $ | 60 | $ | 85 | ||||||||||||||||||
| Research and development | 51 | 119 | 437 | 408 | ||||||||||||||||||||||
| Selling, general, and administrative | 72 | 75 | 490 | 328 | ||||||||||||||||||||||
| Total stock-based compensation expense | $ | 135 | $ | 215 | $ | 987 | $ | 821 | ||||||||||||||||||
|
Q4 2023 Shareholder Letter | © 2024 Rivian. All rights reserved. 22 |
||||||
| Reconciliation of Non-GAAP | ||||||||||||||
| Financial Measures | ||||||||||||||
| (in millions, except per share amounts) | ||||||||||||||
| Adjusted Research and Development Expenses | Three Months Ended December 31, | Twelve Months Ended December 31, | ||||||||||||||||||||||||
| 2022 | 2023 | 2022 | 2023 | |||||||||||||||||||||||
| Total research and development expenses | $ | 402 | $ | 526 | $ | 1,944 | $ | 1,995 | ||||||||||||||||||
| R&D depreciation and amortization expenses | (29) | (19) | (95) | (138) | ||||||||||||||||||||||
| R&D stock-based compensation expenses | (51) | (119) | (437) | (408) | ||||||||||||||||||||||
| Adjusted research and development (non-GAAP) | $ | 322 | $ | 388 | $ | 1,412 | $ | 1,449 | ||||||||||||||||||
| Adjusted Selling, General, and Administrative Expenses | Three Months Ended December 31, | Twelve Months Ended December 31, | ||||||||||||||||||||||||
| 2022 | 2023 | 2022 | 2023 | |||||||||||||||||||||||
| Total selling, general, and administrative expenses | $ | 393 | $ | 449 | $ | 1,789 | $ | 1,714 | ||||||||||||||||||
| SG&A depreciation and amortization expenses | (24) | (56) | (82) | (138) | ||||||||||||||||||||||
| SG&A stock-based compensation expenses | (72) | (75) | (490) | (328) | ||||||||||||||||||||||
| Adjusted selling, general, and administrative (non-GAAP) | $ | 297 | $ | 318 | $ | 1,217 | $ | 1,248 | ||||||||||||||||||
| Adjusted Operating Expenses | Three Months Ended December 31, | Twelve Months Ended December 31, | ||||||||||||||||||||||||
| 2022 | 2023 | 2022 | 2023 | |||||||||||||||||||||||
| Total operating expenses | $ | 795 | $ | 975 | $ | 3,733 | $ | 3,709 | ||||||||||||||||||
| R&D depreciation and amortization expenses | (29) | (19) | (95) | (138) | ||||||||||||||||||||||
| R&D stock-based compensation expenses | (51) | (119) | (437) | (408) | ||||||||||||||||||||||
| SG&A depreciation and amortization expenses | (24) | (56) | (82) | (138) | ||||||||||||||||||||||
| SG&A stock-based compensation expenses | (72) | (75) | (490) | (328) | ||||||||||||||||||||||
| Total adjusted operating expenses (non-GAAP) | $ | 619 | $ | 706 | $ | 2,629 | $ | 2,697 | ||||||||||||||||||
| Adjusted EBITDA | Three Months Ended December 31, | Twelve Months Ended December 31, | ||||||||||||||||||||||||
| 2022 | 2023 | 2022 | 2023 | |||||||||||||||||||||||
| Net loss | $ | (1,723) | $ | (1,521) | $ | (6,752) | $ | (5,432) | ||||||||||||||||||
| Interest income, net | (66) | (58) | (90) | (302) | ||||||||||||||||||||||
| Provision for income taxes | — | — | 4 | 1 | ||||||||||||||||||||||
| Depreciation and amortization | 199 | 270 | 652 | 937 | ||||||||||||||||||||||
| Stock-based compensation expense | 135 | 215 | 987 | 821 | ||||||||||||||||||||||
| Other income, net | (6) | (2) | (18) | (6) | ||||||||||||||||||||||
| Adjusted EBITDA (non-GAAP) | $ | (1,461) | $ | (1,096) | $ | (5,217) | $ | (3,981) | ||||||||||||||||||
|
Q4 2023 Shareholder Letter | © 2024 Rivian. All rights reserved. 23 |
||||||
| Reconciliation of Non-GAAP | ||||||||||||||
| Financial Measures Continued | ||||||||||||||
| (in millions, except per share amounts) | ||||||||||||||
|
Adjusted Net Loss |
Three Months Ended December 31, | Twelve Months Ended December 31, | ||||||||||||||||||||||||
| 2022 | 2023 | 2022 | 2023 | |||||||||||||||||||||||
| Net loss attributable to common stockholders, basic and diluted | $ | (1,723) | $ | (1,521) | $ | (6,752) | $ | (5,432) | ||||||||||||||||||
| Stock-based compensation expense | 135 | 215 | 987 | 821 | ||||||||||||||||||||||
| Other income, net | (6) | (2) | (18) | (6) | ||||||||||||||||||||||
| Adjusted net loss attributable to common stockholders, basic and diluted (non-GAAP) | $ | (1,594) | $ | (1,308) | $ | (5,783) | $ | (4,617) | ||||||||||||||||||
| Adjusted Net Loss Per Share | Three Months Ended December 31, | Twelve Months Ended December 31, | ||||||||||||||||||||||||
| 2022 | 2023 | 2022 | 2023 | |||||||||||||||||||||||
| Net loss per share attributable to common stockholders, basic and diluted | $ | (1.87) | $ | (1.58) | $ | (7.40) | $ | (5.74) | ||||||||||||||||||
| Stock-based compensation expense per share | 0.15 | 0.22 | 1.08 | 0.87 | ||||||||||||||||||||||
| Other income, net per share | (0.01) | — | (0.02) | (0.01) | ||||||||||||||||||||||
| Adjusted net loss per share attributable to common stockholders, basic and diluted (non-GAAP) | $ | (1.73) | $ | (1.36) | $ | (6.34) | * | $ | (4.88) | |||||||||||||||||
| Weighted-average common shares outstanding, basic and diluted (GAAP) | 923 | 963 | 913 | 947 | ||||||||||||||||||||||
| *Does not calculate due to rounding. | ||||||||||||||||||||||||||
| Free Cash Flow | Three Months Ended December 31, | Twelve Months Ended December 31, | ||||||||||||||||||||||||
| 2022 | 2023 | 2022 | 2023 | |||||||||||||||||||||||
| Net cash used in operating activities | $ | (1,446) | $ | (1,107) | $ | (5,052) | $ | (4,866) | ||||||||||||||||||
| Capital expenditures | (294) | (298) | (1,369) | (1,026) | ||||||||||||||||||||||
| Free cash flow (non-GAAP) | $ | (1,740) | $ | (1,405) | $ | (6,421) | $ | (5,892) | ||||||||||||||||||
|
Q4 2023 Shareholder Letter | © 2024 Rivian. All rights reserved. 24 |
||||||
| Quarterly Financial Performance | ||||||||||||||
| Reconciliation of Non-GAAP | ||||||||||||||
| Financial Measures | ||||||||||||||
| (in millions, except per share amounts) | ||||||||||||||
| Three Months Ended | ||||||||||||||||||||||||||||||||
| December 31, 2022 |
March 31, 2023 |
June 30, 2023 |
September 30, 2023 |
December 31, 2023 |
||||||||||||||||||||||||||||
| Adjusted Research and Development Expenses | ||||||||||||||||||||||||||||||||
| Total research and development expenses | $ | 402 | $ | 496 | $ | 444 | $ | 529 | $ | 526 | ||||||||||||||||||||||
| R&D depreciation and amortization expenses | (29) | (33) | (36) | (50) | (19) | |||||||||||||||||||||||||||
| R&D stock-based compensation expenses | (51) | (84) | (72) | (133) | (119) | |||||||||||||||||||||||||||
| Adjusted research and development (non-GAAP) | $ | 322 | $ | 379 | $ | 336 | $ | 346 | $ | 388 | ||||||||||||||||||||||
| Adjusted Selling, General, and Administrative Expenses | ||||||||||||||||||||||||||||||||
| Total selling, general, and administrative expenses | $ | 393 | $ | 402 | $ | 429 | $ | 434 | $ | 449 | ||||||||||||||||||||||
| SG&A depreciation and amortization expenses | (24) | (25) | (27) | (30) | (56) | |||||||||||||||||||||||||||
| SG&A stock-based compensation expenses | (72) | (81) | (86) | (86) | (75) | |||||||||||||||||||||||||||
| Adjusted selling, general, and administrative (non-GAAP) | $ | 297 | $ | 296 | $ | 316 | $ | 318 | $ | 318 | ||||||||||||||||||||||
| Adjusted Operating Expenses | ||||||||||||||||||||||||||||||||
| Total operating expenses | $ | 795 | $ | 898 | $ | 873 | $ | 963 | $ | 975 | ||||||||||||||||||||||
| R&D depreciation and amortization expenses | (29) | (33) | (36) | (50) | (19) | |||||||||||||||||||||||||||
| R&D stock-based compensation expenses | (51) | (84) | (72) | (133) | (119) | |||||||||||||||||||||||||||
| SG&A depreciation and amortization expenses | (24) | (25) | (27) | (30) | (56) | |||||||||||||||||||||||||||
| SG&A stock-based compensation expenses | (72) | (81) | (86) | (86) | (75) | |||||||||||||||||||||||||||
| Total adjusted operating expenses (non-GAAP) | $ | 619 | $ | 675 | $ | 652 | $ | 664 | $ | 706 | ||||||||||||||||||||||
| Adjusted EBITDA | ||||||||||||||||||||||||||||||||
| Net loss | $ | (1,723) | $ | (1,349) | $ | (1,195) | $ | (1,367) | $ | (1,521) | ||||||||||||||||||||||
| Interest income, net | (66) | (86) | (87) | (71) | (58) | |||||||||||||||||||||||||||
| Provision for income taxes | — | 1 | — | — | — | |||||||||||||||||||||||||||
| Depreciation and amortization | 199 | 188 | 223 | 256 | 270 | |||||||||||||||||||||||||||
| Stock-based compensation expense | 135 | 183 | 181 | 242 | 215 | |||||||||||||||||||||||||||
| Other (income) expense, net | (6) | 1 | (3) | (2) | (2) | |||||||||||||||||||||||||||
| Adjusted EBITDA (non-GAAP) | $ | (1,461) | $ | (1,062) | $ | (881) | $ | (942) | $ | (1,096) | ||||||||||||||||||||||
|
Q4 2023 Shareholder Letter | © 2024 Rivian. All rights reserved. 25 |
||||||
| Quarterly Financial Performance | ||||||||||||||
| Reconciliation of Non-GAAP | ||||||||||||||
| Financial Measures Continued | ||||||||||||||
| (in millions, except per share amounts) | ||||||||||||||
| Three Months Ended | ||||||||||||||||||||||||||||||||
| December 31, 2022 |
March 31, 2023 |
June 30, 2023 |
September 30, 2023 |
December 31, 2023 |
||||||||||||||||||||||||||||
| Adjusted Net Loss | ||||||||||||||||||||||||||||||||
| Net loss attributable to common stockholders, basic and diluted | $ | (1,723) | $ | (1,349) | $ | (1,195) | $ | (1,367) | $ | (1,521) | ||||||||||||||||||||||
| Stock-based compensation expense | 135 | 183 | 181 | 242 | 215 | |||||||||||||||||||||||||||
| Other (income) expense, net | (6) | 1 | (3) | (2) | (2) | |||||||||||||||||||||||||||
| Adjusted net loss attributable to common stockholders, basic and diluted (non-GAAP) | $ | (1,594) | $ | (1,165) | $ | (1,017) | $ | (1,127) | $ | (1,308) | ||||||||||||||||||||||
| Adjusted Net Loss Per Share | ||||||||||||||||||||||||||||||||
| Net loss per share attributable to common stockholders, basic and diluted | $ | (1.87) | $ | (1.45) | $ | (1.27) | $ | (1.44) | $ | (1.58) | ||||||||||||||||||||||
| Stock-based compensation expense per share | 0.15 | 0.20 | 0.19 | 0.25 | 0.22 | |||||||||||||||||||||||||||
| Other income, net per share | (0.01) | — | — | — | — | |||||||||||||||||||||||||||
| Adjusted net loss per share attributable to common stockholders, basic and diluted (non-GAAP) | $ | (1.73) | $ | (1.25) | $ | (1.08) | $ | (1.19) | * | $ | (1.36) | |||||||||||||||||||||
| Weighted-average common shares outstanding, basic and diluted (GAAP) | 923 | 930 | 942 | 952 | 963 | |||||||||||||||||||||||||||
| Free Cash Flow | ||||||||||||||||||||||||||||||||
| Net cash used in operating activities | $ | (1,446) | $ | (1,521) | $ | (1,361) | $ | (877) | $ | (1,107) | ||||||||||||||||||||||
| Capital expenditures | (294) | (283) | (255) | (190) | (298) | |||||||||||||||||||||||||||
| Free cash flow (non-GAAP) | $ | (1,740) | $ | (1,804) | $ | (1,616) | $ | (1,067) | $ | (1,405) | ||||||||||||||||||||||
| *Does not calculate due to rounding. | ||||||||||||||||||||||||||||||||
|
Q4 2023 Shareholder Letter | © 2024 Rivian. All rights reserved. 26 |
||||||
| Forward-Looking Statements | This shareholder letter and statements that are made on our earnings call contain forward-looking statements within the meaning of the Private Securities Litigation Reform Act of 1995. All statements contained in this shareholder letter and made on our earnings call that do not relate to matters of historical fact should be considered forward-looking statements, including without limitation statements regarding our future operations, initiatives and business strategy, our cost reduction strategy and expectations regarding cost savings, our future financial results, vehicle profitability and future gross profits, our anticipated LCNRV charges, the planned use of our cash and cash equivalents, our future capital expenditures, the underlying trends in our business, our market opportunity, and our potential for growth, our planned shutdown of production lines in the second quarter of 2024, our production ramp and manufacturing capacity expansion and anticipated production levels, our expected future production and deliveries, our anticipated production and timing of R2 platform at our greenfield facility in Georgia, scaling our service infrastructure, our expected future products and technology and product enhancements (including R2), potential expansion of commercial van sales, including pilot programs for our commercial vans, and revenue opportunities. These statements are neither promises nor guarantees and involve known and unknown risks, uncertainties, and other important factors that may cause our actual results, performance, or achievements to be materially different from any future results, performance, or achievements expressed or implied by the forward-looking statements, including, but not limited to: our history of losses as a growth-stage company and our limited operating history; we may underestimate or not effectively manage our capital expenditures and costs; we will require additional financing and capital to support our business; our ability to maintain strong demand for our vehicles and attract and retain a large number of customers; risks relating to the highly competitive automotive market, including competitors that may take steps to compete more effectively against us, including with respect to pricing and features, and impact of competition and macroeconomic conditions on product demand; consumers’ willingness to adopt electric vehicles; we may experience significant delays in the manufacture and delivery of our vehicles; we have experienced and could continue to experience cost increases or disruptions in supply of raw materials or other components used in our vehicles; our dependence on suppliers and volatility in pricing of components and raw materials; our ability to accurately estimate the supply and demand for our vehicles and predict our manufacturing requirements; our ability to maintain our relationship with one customer that has generated a significant portion of our revenue; we are highly dependent on the services and reputation of our Founder and Chief Executive Officer; our inability to manage our future growth effectively; our long-term results depend on our ability to successfully introduce and market new products and services; we may not succeed in establishing, maintaining, and strengthening our brand; our focus on delivering a high-quality and engaging Rivian experience may not maximize short-term financial results; risks relating to our distribution model; we rely on complex machinery, and production involves a significant degree of risk and uncertainty; our vehicles rely on highly technical software and hardware that could contain errors or defects; we may not successfully develop the complex software and technology systems needed to produce our vehicles; inadequate access to charging stations and not being able to realize the benefits of our charging networks; risks related to our use of lithium-ion battery cells; we have limited experience servicing and repairing our vehicles; the automotive industry and its technology are rapidly evolving and may be subject to unforeseen changes, and upgrades and adaptations to our vehicles may increase our costs and capital expenditures and also require planned, temporary manufacturing shutdowns from time to time; risks associated with advanced driver assistance systems technology; the reduction or elimination of government and economic incentives for electric vehicles; we may not obtain government grants and other incentives for which we may apply; vehicle retail sales depend heavily on affordable interest rates and availability of credit; insufficient warranty reserves to cover warranty claims; future field actions, including product recalls, could harm our business; risks related to product liability claims; risks associated with international operations; our ability to attract and retain key employees and qualified personnel; our ability to maintain our culture; our business may be adversely affected by labor and union activities; risks associated with the ongoing military conflict between Russia and the Ukraine and in the Middle East; risks related to health epidemics, pandemics, and other outbreaks; our financial results may vary significantly from period to period; we have incurred a significant amount of debt and may incur additional indebtedness; our vehicles may not operate properly; risks related to third-party vendors for certain product and service offerings; potential conflicts of interest involving our principal stockholders or their affiliates; risks associated with exchange rate and interest rate fluctuations; breaches in data security, failure of information security systems, cyber-attacks or other security or privacy-related incidents could harm our business; risk of intellectual property infringement claims; our use of open source software in our applications could subject our proprietary software to general release; our ability to prevent unauthorized use of our intellectual property; risks related to governmental regulation and legal proceedings; delays, limitations and risks related to permits and approvals required to |
||||
|
Q4 2023 Shareholder Letter | © 2024 Rivian. All rights reserved. 27 |
||||||
| Forward-Looking Statements continued | operate or expand operations; our internal control over financial reporting; and the other factors described in our filings with the SEC. These factors could cause actual results to differ materially from those indicated by the forward-looking statements made in this shareholder letter. Any such forward-looking statements represent management’s estimates as of the date of this shareholder letter. While we may elect to update such forward-looking statements at some point in the future, except as may be required by law, we disclaim any obligation to do so, even if subsequent events cause our views to change. |
||||
|
Q4 2023 Shareholder Letter | © 2024 Rivian. All rights reserved. 28 |
||||||
| Non-GAAP Financial Measures |
In addition to our results determined in accordance with generally accepted accounting principles in the United States (“GAAP”), we review financial measures that are not calculated and presented in accordance with GAAP (“non-GAAP financial measures”). We believe our non-GAAP financial measures are useful in evaluating our operating and cash performance. We use the following non-GAAP financial information, collectively, to evaluate our ongoing operations and for internal planning and forecasting purposes. We believe that non-GAAP financial information, when taken collectively, may be helpful to investors, because it provides consistency and comparability with past financial performance and assists in comparisons with other companies, some of which use similar non-GAAP financial information to supplement their GAAP results. The non-GAAP financial information is presented for supplemental informational purposes only, should not be considered a substitute for financial information presented in accordance with GAAP, and may be different from similarly titled non-GAAP measures used by other companies. A reconciliation of each historical non-GAAP financial measure to the most directly comparable financial measure stated in accordance with GAAP is provided above. Reconciliations of forward- looking non-GAAP financial measures are not provided because we are unable to provide such reconciliations without unreasonable effort due to the uncertainty regarding, and potential variability of, certain items, such as stock-based compensation expense and other costs and expenses that may be incurred in the future. Investors are encouraged to review the related GAAP financial measures and the reconciliation of these non-GAAP financial measures to their most directly comparable GAAP financial measures.
Our non-GAAP financial measures include, adjusted research and development expenses, adjusted selling, general, and administrative expenses, total adjusted operating expenses, adjusted EBITDA, adjusted net loss, and adjusted net loss per share, and free cash flow. Adjusted research and development expenses is defined as total research and development expenses, less R&D depreciation and amortization expenses and R&D stock-based compensation expenses. Adjusted selling, general, and administrative expenses is defined as total selling, general, and administrative expenses, less SG&A depreciation and amortization expenses and SG&A stock-based compensation expenses. Adjusted operating expenses is defined as total operating expenses, less R&D depreciation and amortization expenses, R&D stock-based compensation expenses, SG&A depreciation and amortization expenses, and SG&A stock-based compensation expenses. Adjusted EBITDA is defined as net loss before interest expense (income), net, provision for income taxes, depreciation and amortization, stock-based compensation, and other (expense) income, net. Adjusted net loss is defined as net loss before stock-based compensation expense and other (expense) income. Adjusted net loss per share is defined as adjusted net loss divided by the weighted-average common shares outstanding. Free cash flow is defined as net cash used in operating activities less capital expenditures.
|
||||
|
Q4 2023 Shareholder Letter | © 2024 Rivian. All rights reserved. 29 |
||||||

 |
Q4 2023 Shareholder Letter | © 2024 Rivian. All rights reserved. | ||||||