|
Delaware
(State or other jurisdiction of incorporation)
|
001-41042
(Commission File Number)
|
47-3544981
(IRS Employer Identification Number)
|
||||||||||||||||||||||||
|
14600 Myford Road
Irvine, California 92606
| ||||||||||||||||||||||||||
(Address of principal executive offices) (Zip code) | ||||||||||||||||||||||||||
(888) 748-4261 | ||||||||||||||||||||||||||
(Registrant's telephone number, including area code) | ||||||||||||||||||||||||||
| N/A | ||||||||||||||||||||||||||
(Former name or former address, if changed since last report) | ||||||||||||||||||||||||||
___________________________________ | ||||||||||||||||||||||||||
☐ |
Written communications pursuant to Rule 425 under the Securities Act (17 CFR 230.425) |
||||||||||||||||
☐ |
Soliciting material pursuant to Rule 14a-12 under the Exchange Act (17 CFR 240.14a-12) |
||||||||||||||||
☐ |
Pre-commencement communications pursuant to Rule 14d-2(b) under the Exchange Act (17 CFR 240.14d-2(b)) |
||||||||||||||||
☐ |
Pre-commencement communications pursuant to Rule 13e-4(c) under the Exchange Act (17 CFR 240.13e-4(c)) |
||||||||||||||||
Securities registered pursuant to Section 12(b) of the Act: | |||||||||||||||||||||||||||||
Title of each class |
Trading Symbol |
Name of each exchange on which registered |
|||||||||||||||||||||||||||
Class A common stock, $0.001 par value per share |
RIVN | The Nasdaq Stock Market |
|||||||||||||||||||||||||||
| Exhibit No. | Description | |||||||
| 104 | Cover Page Interactive Data File (embedded within the Inline XBRL document) | |||||||
| RIVIAN AUTOMOTIVE, INC. | ||||||||
Date: August 8, 2023 |
By: | /s/ Claire McDonough | ||||||
| Name: | Claire McDonough | |||||||
| Title: | Chief Financial Officer | |||||||

| Key Highlights | ||
|
~50% increase
in production
vs. Q1’23
|
Dual-Motor added
to the R1 lineup
|
|||||||
~$35,000 gross profit per vehicle delivered improvement vs. Q1'23 driven by ramping production, material cost reduction, and increased revenue per vehicle |
2023 total production guidance increased
to 52,000
|
|||||||
|
2023 Adj. EBITDA
guidance improved
to $(4,200) million
|
2023 Capex
guidance reduced
to $1,700 million
|
|||||||
 |
Q2 2023 Shareholder Letter | © 2023 Rivian. All rights reserved. 2 |
||||||
 | |||||
|
Results for the second quarter of 2023 reflect strong financial and operational progress as
we continued to ramp production, improved cost efficiency, successfully introduced new technologies, and enhanced the customer experience. On a quarter-over-quarter basis, production and deliveries grew ~50% and ~60%, respectively while gross profit per vehicle delivered improved by ~$35,000. For the first time since our start of production, R1S production outpaced the R1T, with the R1S representing ~70% of our total R1 production. We also successfully introduced our in-house Enduro motor into the R1 platform.
Due to the progress we have seen to date on our production lines, the ramp of our in-house motor line, and the supply chain outlook, we are increasing our 2023 production guidance to 52,000 total units. Our progress on cost management has also continued and therefore we
are improving our Adj. EBITDA guidance to $(4,200) million. We are also lowering our capital expenditures guidance to $1,700 million with the reduction largely driven by a timing shift of some expenses to 2024.
We remain laser focused on earning the trust of the Rivian community. With over 300 million miles driven by Rivian vehicles, brand awareness continues to grow. The most vocal brand advocates are our customers; Rivian owners are forming communities across the country and creating experiences for current and future Rivian customers. These communities, often self-organized, are hosting beach clean ups, social events, and outdoor adventures, creating a
strong sense of community and providing invaluable feedback that forms the foundation
of future improvement in our vehicles. We want to thank all of the members of the growing
Rivian community.
For the remainder of 2023, we intend to maintain the momentum of the first half of the year by continuing to deliver against our value drivers: production ramp, cost efficiency, future platforms
and technologies, and customer experience.
|
|||||
|
Q2 2023 Shareholder Letter | © 2023 Rivian. All rights reserved. 3 |
||||||
 | |||||
|
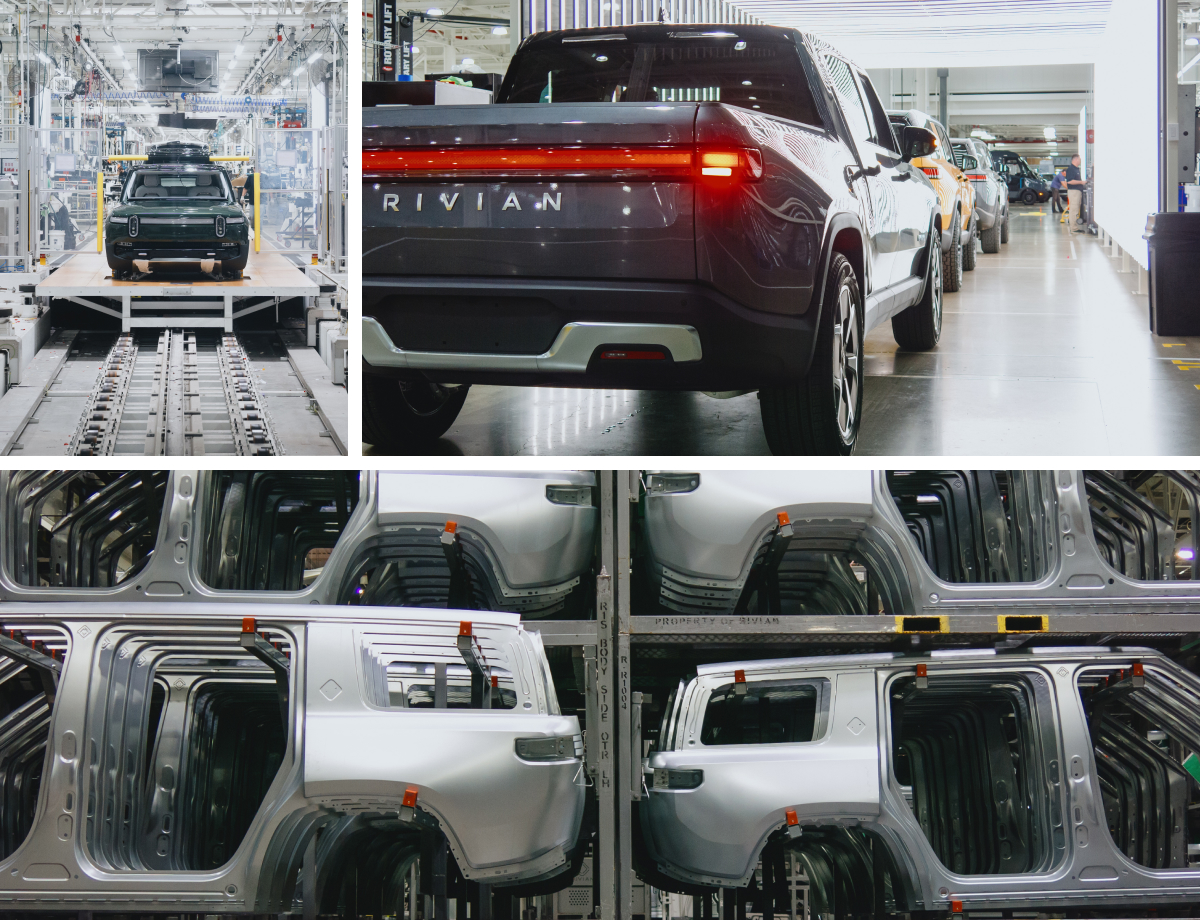
•Production: In the first half of 2023, we produced 23,387 vehicles which is in line with the production volumes we achieved for the full year 2022. Increasing our production is the primary lever in our path to profitability. The incorporation of our in-house drive units has played and will continue to play an instrumental role in improving our production ramp and cost structure. Following the successful integration of our in-house Enduro drive units as single motor variants into the EDV platform during the first quarter of 2023, we began integrating these motors as Dual-Motor variants in the R1 platform during the second quarter of 2023 further magnifying the cost benefits and supply chain flexibility this motor platform provides.
•Cost efficiency: We continue our strong focus on cost efficiency to accelerate the drive towards profitability and ensure we are appropriately positioned to support Rivian’s long-term sustained growth. During the second quarter of 2023, on a quarter-over-quarter basis, total delivered units grew ~60% while gross profit per unit delivered improved by ~$35,000. Leveraging our company wide cost transformation program to maximize impact, we have achieved meaningful reductions in both R1 and EDV vehicle unit cost across each major cost category, including material cost, manufacturing labor, overhead and logistics. Reductions in material cost per unit reflect the impact of the introduction of new technologies such as our in-house Enduro motor and the lithium iron phosphate (“LFP”) battery pack as well as negotiated supplier price reductions, including the elimination of short-term premiums. Other semi-fixed costs have improved per unit as production and delivery volumes have increased and we better leverage our plant overhead and manufacturing operations. Sustaining our cost reduction efforts through ongoing focus across all levels of the company is a core part of the culture and mindset we are building.
|
|||||
|
Q2 2023 Shareholder Letter | © 2023 Rivian. All rights reserved. 4 |
||||||
 | |||||
|
•Future platform and technologies: We believe vertically integrating our network architecture and associated electronics, full vehicle software stack, and propulsion platform affords a long-term competitive advantage in terms of both cost and product performance. The introduction of our in-house motor platform as well as current and future over-the-air (“OTA”) updates are examples of this. We believe the ability to fully control and continually enhance virtually every aspect of our vehicles' software, digital experience, and even driving dynamics is already seen by customers as a point of substantial differentiation. Importantly, our next generation R2 platform will benefit from the scalable technology being introduced in the R1 products and combines these technologies with a vehicle platform that is being developed to achieve a lower cost structure through the learnings of launching R1.
•Customer experience: As more Rivian vehicles are on the road, we’re equally focused on scaling our service infrastructure to enhance the customer experience. We currently have over 280 mobile service vehicles on the road, which are handling over 50% of our vehicle repairs. Our Rivian service vehicles allow us to continue to lead with a mobile-first strategy and deliver a sustainable, convenient service experience for our customers. In addition, we currently have 43 physical service centers opened with an additional 17 scheduled to open by the end of the year.
We want to thank our employees, customers, suppliers, partners, communities, and shareholders for their continued support of our vision.
|
|||||
|
Q2 2023 Shareholder Letter | © 2023 Rivian. All rights reserved. 5 |
||||||
 | |||||
|
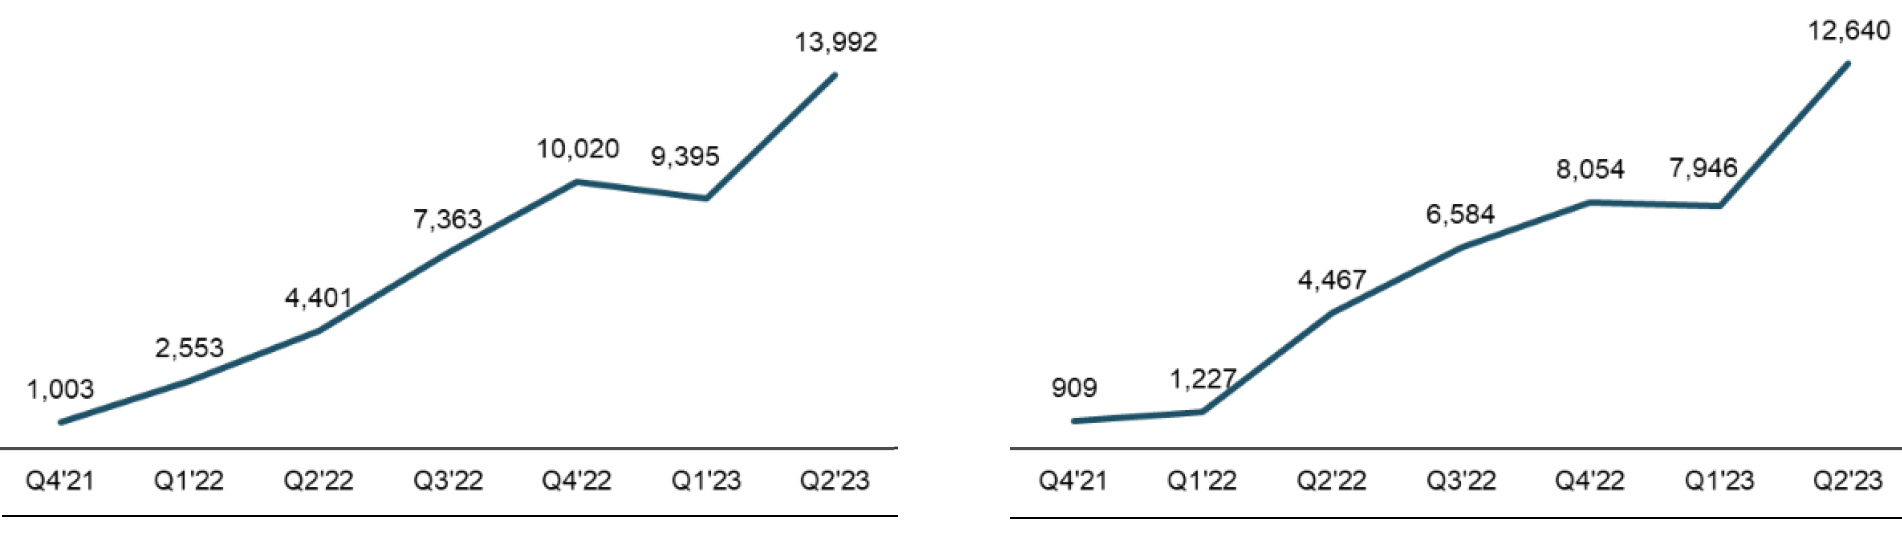
Production and deliveries
In the second quarter of 2023, we produced 13,992 and delivered 12,640 vehicles. This represents a nearly 50% increase in production as compared to the prior quarter. This
increase was supported by the continued ramp of our in-house Enduro motor line supporting 100% of our commercial vehicle line as single motor variants and our Dual-Motor R1 variants.
During the second quarter we also saw a meaningful increase in R1S production with R1S representing about 70% of our total R1 production in the quarter. This was the first quarter in which we produced more R1S vehicles than R1T vehicles. Over the long-term, we believe consumer mix will be more heavily weighted toward the R1S.
As was the case in the second quarter, during the ramp of our production line, we expect quarterly production will continue to outpace deliveries until we reach a steady state
of production volumes.
|
|||||
| Quarterly Production Quarterly Deliveries | |||||
 |
|||||
|
Q2 2023 Shareholder Letter | © 2023 Rivian. All rights reserved. 6 |
||||||
 | |||||
|
R1 Dual-Motor launch
Technology enhancements are an important step to providing a great customer experience at reduced material and production costs. As part of our technology roadmap, earlier this year we introduced our in-house Enduro motor system, which was first installed as a single motor, front wheel drive variant in our commercial vans. During the second quarter we introduced this motor platform as a Dual-Motor, all-wheel drive system into the R1 vehicle line. The R1 Dual-Motor system is engineered to deliver incredible on- and off-road performance offering torque up
to 800 ft-lbs and 0-60 mph acceleration in as quick as 3.5 seconds.
The Enduro motor platform will serve as the foundation for the motors we plan to build for our
R2 platform starting in 2026. We expect the investment in our in-house drivetrain and power electronics capabilities to provide manufacturing and product advantages when launching our R2 platform.
|
|||||
|
Q2 2023 Shareholder Letter | © 2023 Rivian. All rights reserved. 7 |
||||||
 | ||||||||
|
Technology as a differentiator
We believe a substantial long-term competitive advantage is our approach of vertically integrating our network architecture and associated in-vehicle computers, full vehicle software stack, and our propulsion platform. We believe structural cost advantages will be achieved as production continues to ramp. Additionally, product performance will benefit from the ability
to fully control and continually enhance virtually every aspect of our vehicle’s software, digital experience, and driving dynamics. We believe this capability is increasingly being recognized by customers; it has helped us earn some of the industry’s most coveted owner experience awards, including being named Best Ownership Experience among Premium Battery Electric Vehicles by J.D. Power.
Our software architecture was developed in-house as a complete end-to-end solution
providing significant flexibility as we continually optimize vehicle performance and the
customer experience. The vertical integration of our electronics and software platforms
enables us to seamlessly improve the customer experience through new features and enhancements. We can collect diagnostic data to support targeted OTA updates as well
as key feature improvements. Diagnostic data collection has allowed us to monitor vehicle health parameters and verify that vehicle performance meets our expectations while also contributing to reduced service costs. As our fleet grows, we expect to see significant cost savings and customer value through predictive service and repair operations. Our vehicle software architecture also supports our manufacturing operations where it provides in-line diagnostics for earlier and improved quality control.
In 2024, we intend to further build upon our vertical integration approach and differentiated software capabilities with the introduction of our next generation of network architecture that will be included in the R1 platform and serve as the foundation of the R2 platform. Our updated network architecture is expected to reduce 60% of the electronic control units (“ECUs”) and reduces the wire harness length by 25%. We expect these adjustments will result in lower cost, less vehicle mass, improved manufacturing efficiency and reduced electrical architecture complexity. We believe this next generation of network architecture will significantly contribute to steps we are taking to aggressively reduce material cost per vehicle.
|
||||||||
|
Q2 2023 Shareholder Letter | © 2023 Rivian. All rights reserved. 8 |
||||||
 | |||||
|
Expanding charging features and scope
During the second quarter of 2023 we announced two developments that represent meaningful steps to further accelerate the transition to electrification. We recently announced the acquisition of Iternio, developer of the ‘A Better Routeplanner’ (“ABRP”) app. ABRP gives electric vehicle drivers the ability to plan and compare routes and charging stop options. It also provides data to help with the site selection of our Rivian Adventure Fast Charging Network. Rivian and Iternio will continue to maintain and improve ABRP as a stand-alone app for drivers of any electric vehicle, as well as integrate ABRP’s technology into Rivian’s in-vehicle navigation system and newly available trip planning experience in the Rivian mobile app.
We also recently announced adoption of the North American Charging Standard (“NACS”) and the opportunity for Rivian customers to access Tesla’s Supercharger network which, in combination with our continued Rivian Adventure Network buildout, will provide existing and future customers greater charging accessibility across the United States and Canada and reinforces our mission to electrify and decarbonize transportation. Our goal is to bring our customers the best charging experience possible with an easy-to-use interface and access to as many chargers as possible. Through our collaboration with Tesla, Rivian drivers will have access to more than 12,000 Superchargers as early as spring 2024. In addition, our DC fast charging network continues to grow; we currently have 44 Rivian Adventure Network sites and 273 chargers. Importantly, we plan to continue to grow the network and also add NACS compatibility to the Rivian Adventure Network which we expect will drive greater utilization of our network when it is opened to all electric vehicle drivers.
|
|||||
|
Q2 2023 Shareholder Letter | © 2023 Rivian. All rights reserved. 9 |
||||||
 | |||||
|
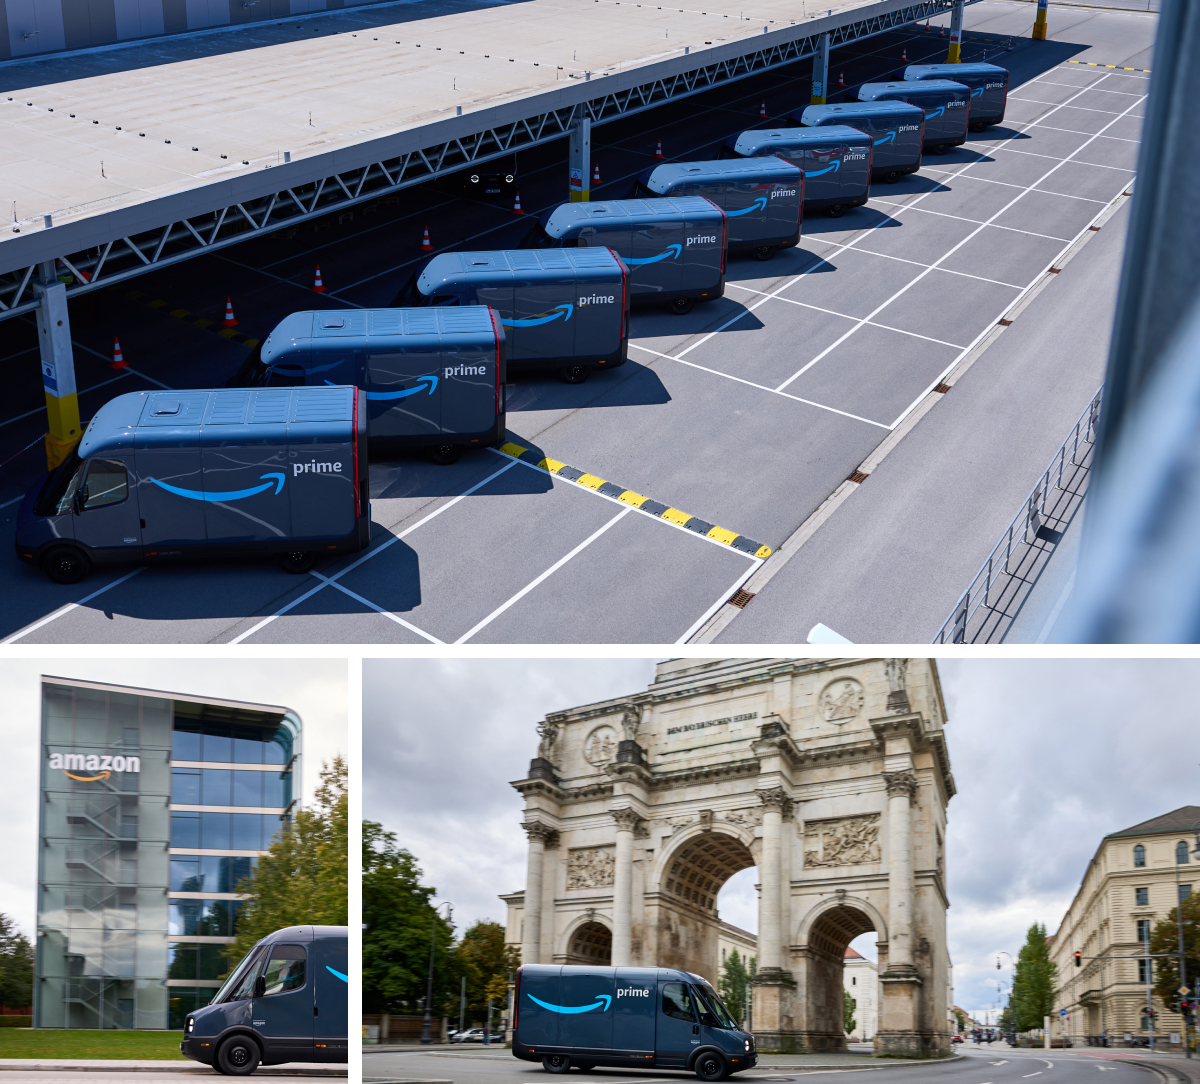
Expanding our impact with Amazon
As part of our agreement with Amazon to bring 100,000 electric delivery vehicles on the road we set out to develop a delivery van which offers a step change in safety, innovation, technology, and comfort. It has been rewarding to see the enthusiasm from the drivers around the EDV product.
As of early July, there were EDVs in operation across over 800 cities in the United States.
In addition, we recently initiated delivery of EDVs to Amazon in Europe.
|
|||||
|
Q2 2023 Shareholder Letter | © 2023 Rivian. All rights reserved. 10 |
||||||
| Financial Highlights | ||

| Revenue | Total revenues for the second quarter of 2023 were $1,121 million, primarily driven by the delivery of 12,640 vehicles. Total revenues included $34 million from the sale of regulatory credits. |
||||
| Gross Profit |
We generated negative gross profit of $(412) million for the second quarter of 2023 as compared to $(704) million for the second quarter of 2022. Gross profit improvement was primarily driven by ramping production and our continued efforts to drive material cost reductions through commercial negotiations and engineering design changes. The second quarter of 2023 was impacted by a net charge for lower of cost or net realizable value (“LCNRV”) write-downs on inventory and losses on firm purchase commitments. Our ending inventory balance includes LCNRV write-downs of $379 million, while net liabilities for losses on firm purchase commitments were $179 million, for a total of $558 million at the end of the second quarter of 2023. We expect the size of LCNRV write-downs and losses on firm purchase commitments to decrease over time, which we anticipate will have the effect of increasing net inventory balances, and decreasing cost of revenues per vehicle. Furthermore, we forecast reaching positive gross profit in 2024 and therefore expect that by the end of 2024, we will not have material LCNRV inventory charges and losses on firm purchase commitments associated with goods manufactured at our Normal facility.
We remain confident in our ability to continue to drive our cost per vehicle lower by ramping production and leveraging our fixed costs, as well as our commercial, engineering design changes, and operational cost reduction efforts.
|
||||
|
Q2 2023 Shareholder Letter | © 2023 Rivian. All rights reserved. 11 |
||||||
| Operating Expenses and Operating Loss |
Total operating expenses in the second quarter of 2023 fell to $873 million, as compared to $1,004 million in the same period last year.
In the second quarter of 2023, we recognized a non-cash, stock-based compensation expense within operating expenses of $158 million as compared to $229 million in the second quarter of 2022 and depreciation and amortization expense within operating expenses of $63 million as compared to $34 million in the second quarter of 2022.
Research and development (“R&D”) expense in the second quarter of 2023 was $444 million, as compared to $543 million in the same period last year. The decrease was primarily due to a $94 million decrease in payroll and related expenses, including stock-based compensation, resulting from decreases in headcount and expense for awards granted prior to the initial public offering (“IPO”) with accelerated expense recognition due to the IPO as a performance condition.
Selling, general, and administrative (“SG&A”) expense in the second quarter of 2023 was $429 million, as compared to $461 million in the same period last year. The decrease was primarily due to a $28 million decrease in stock-based compensation expense resulting from certain decreases in headcount and expense for awards granted prior to the IPO with accelerated expense recognition due to the IPO as a performance condition.
We experienced a loss from operations in the second quarter of 2023 totaling $(1,285) million, as compared to $(1,708) million in the same period last year.
|
||||
| Net Loss | Our net loss for the second quarter of 2023 was $(1,195) million as compared to $(1,712) million for the same period last year. |
||||
| Adjusted EBITDA¹ | Adjusted EBITDA¹ for the second quarter of 2023 was $(881) million as compared to $(1,305) million for the same period last year. |
||||
| Net Cash Used in Operating Activities | Net cash used in operating activities for the second quarter of 2023 was $(1,361) million as compared to $(1,204) million for the same period last year. The increase in net cash used for operating activities as compared to the second quarter of 2022 was primarily driven by the increase in our inventory balance. Our inventory balance for the quarter was impacted by increased inventory in raw materials and finished goods as we continue to ramp production. |
||||
| Capital Expenditures | Capital expenditures for the second quarter of 2023 were $(255) million, as compared to $(359) million for the same period last year. The prior year values were higher due to elevated equipment and construction spend in the early stages of our production ramp. |
||||
| ¹A reconciliation of non-GAAP financial measures to the most comparable GAAP measure is provided later in this letter | |||||
|
Q2 2023 Shareholder Letter | © 2023 Rivian. All rights reserved. 12 |
||||||
| Liquidity and Free Cash Flow¹ |
We ended the second quarter of 2023 with $10,202 million in cash, cash equivalents, and short-term investments. Including the capacity under our asset-based revolving-credit facility, we ended the second quarter of 2023 with $11,317 million of total liquidity.
We define free cash flow as net cash used in operating activities less capital expenditures. The larger year-over-year net cash used in operating activities discussed above resulted in negative free cash flow¹ of $(1,616) million for the second quarter of 2023 as compared to $(1,563) million for the same period last year.
|
||||
| 2023 Business Outlook | We remain focused on ramping production and implementing core technologies designed to reduce cost and improve the customer offering. Based on the progress of our production ramp, including the ramp of our in-house motor, along with our latest understanding of the supply chain, we are increasing our production guidance to 52,000. We have also seen strong progress in our cost reduction efforts, and are improving our Adj. EBITDA guidance to $(4,200) million. Finally, we have reduced our expected capital expenditures for the year driven by a shift in expense timing. We are lowering our capital expenditures guidance to $1,700 million. | ||||
| Webcast | We will host an audio webcast to discuss our results and provide a business update at 2:00pm PT / 5:00pm ET on Tuesday, August 8, 2023. The link to the webcast will be made available on our Investor Relations website at rivian.com/investors. After the call, a replay will be available at rivian.com/investors for four weeks. |
||||
| ¹A reconciliation of non-GAAP financial measures to the most comparable GAAP measure is provided later in this letter | |||||
|
Q2 2023 Shareholder Letter | © 2023 Rivian. All rights reserved. 13 |
||||||
| Quarterly Financial Performance | ||||||||||||||
| (in millions, except production, delivery, gross margin, gross profit per unit delivered, and per share amounts) | ||||||||||||||
| (unaudited) | ||||||||||||||
| Three Months Ended | ||||||||||||||||||||||||||||||||
| June 30, 2022 | September 30, 2022 | December 31, 2022 | March 31, 2023 | June 30, 2023 | ||||||||||||||||||||||||||||
| Production | 4,401 | 7,363 | 10,020 | 9,395 | 13,992 | |||||||||||||||||||||||||||
| Delivery | 4,467 | 6,584 | 8,054 | 7,946 | 12,640 | |||||||||||||||||||||||||||
| Revenues | $ | 364 | $ | 536 | $ | 663 | $ | 661 | $ | 1,121 | ||||||||||||||||||||||
| Gross profit | (704) | (917) | (1,000) | (535) | (412) | |||||||||||||||||||||||||||
| Gross margin | (193) | % | (171) | % | (151) | % | (81) | % | (37) | % | ||||||||||||||||||||||
| Gross profit per unit delivered (non-GAAP) | $ | (157,600) | $ | (139,277) | $ | (124,162) | $ | (67,329) | $ | (32,595) | ||||||||||||||||||||||
| Research and development | $ | 543 | $ | 452 | $ | 402 | $ | 496 | $ | 444 | ||||||||||||||||||||||
| Selling, general, and administrative | 461 | 405 | 393 | 402 | 429 | |||||||||||||||||||||||||||
| Total operating expenses | 1,004 | 857 | 795 | 898 | 873 | |||||||||||||||||||||||||||
| Loss from operations | (1,708) | (1,774) | (1,795) | (1,433) | (1,285) | |||||||||||||||||||||||||||
| Net loss attributable to common stockholders, basic and diluted | $ | (1,712) | $ | (1,724) | $ | (1,723) | $ | (1,349) | $ | (1,195) | ||||||||||||||||||||||
| Net loss per share attributable to Class A and Class B common stockholders, basic and diluted | $ | (1.89) | $ | (1.88) | $ | (1.87) | $ | (1.45) | $ | (1.27) | ||||||||||||||||||||||
| Net cash used in operating activities | $ | (1,204) | $ | (1,368) | $ | (1,446) | $ | (1,521) | $ | (1,361) | ||||||||||||||||||||||
| Capital expenditures | (359) | (298) | (294) | (283) | (255) | |||||||||||||||||||||||||||
| Free cash flow (non-GAAP) | (1,563) | (1,666) | (1,740) | (1,804) | (1,616) | |||||||||||||||||||||||||||
| Adjusted EBITDA (non-GAAP) | (1,305) | (1,307) | (1,461) | (1,062) | (881) | |||||||||||||||||||||||||||
| Adjusted net loss attributable to common stockholders, basic and diluted (non-GAAP) | (1,471) | (1,437) | (1,594) | (1,165) | (1,017) | |||||||||||||||||||||||||||
| Adjusted net loss per share attributable to common stockholders, basic and diluted (non-GAAP) | (1.62) | (1.57) | (1.73) | (1.25) | (1.08) | |||||||||||||||||||||||||||
| Cash, cash equivalents, short-term investments, and restricted cash* | 15,463 | 13,800 | 12,099 | 11,780 | 10,202 | |||||||||||||||||||||||||||
| Stock-based compensation expense | ||||||||||||||||||||||||||||||||
| Cost of revenues | $ | 13 | $ | 25 | $ | 12 | $ | 18 | $ | 23 | ||||||||||||||||||||||
| Research and development | 115 | 133 | 51 | 84 | 72 | |||||||||||||||||||||||||||
| Selling, general, and administrative | 114 | 135 | 72 | 81 | 86 | |||||||||||||||||||||||||||
| Total stock-based compensation expense | $ | 242 | $ | 293 | $ | 135 | $ | 183 | $ | 181 | ||||||||||||||||||||||
| Depreciation and amortization expense | ||||||||||||||||||||||||||||||||
| Cost of revenues | $ | 127 | $ | 122 | $ | 146 | $ | 130 | $ | 160 | ||||||||||||||||||||||
| Research and development | 15 | 31 | 29 | 33 | 36 | |||||||||||||||||||||||||||
| Selling, general, and administrative | 19 | 21 | 24 | 25 | 27 | |||||||||||||||||||||||||||
| Total depreciation and amortization expense | $ | 161 | $ | 174 | $ | 199 | $ | 188 | $ | 223 | ||||||||||||||||||||||
| Inventory write downs | ||||||||||||||||||||||||||||||||
| Inventory write downs * | $ | 240 | $ | 512 | $ | 582 | $ | 561 | $ | 379 | ||||||||||||||||||||||
| Liabilities for losses on firm purchase commitments* | 61 | 184 | 338 | 261 | 179 | |||||||||||||||||||||||||||
| Total inventory write downs and liabilities for losses on firm purchase commitments* | $ | 301 | $ | 696 | $ | 920 | $ | 822 | $ | 558 | ||||||||||||||||||||||
| *Amount as of date shown | ||||||||||||||||||||||||||||||||
|
Q2 2023 Shareholder Letter | © 2023 Rivian. All rights reserved. 14 |
||||||
| Condensed Consolidated Balance Sheets | ||||||||||||||
| (in millions, except per share amounts) | ||||||||||||||
| (unaudited) | ||||||||||||||
| Assets | December 31, 2022 | June 30, 2023 | ||||||||||||
| Current assets: | ||||||||||||||
| Cash and cash equivalents | $ | 11,568 | $ | 9,260 | ||||||||||
| Short-term investments | — | 942 | ||||||||||||
| Accounts receivable, net | 102 | 342 | ||||||||||||
| Inventory | 1,348 | 2,161 | ||||||||||||
| Other current assets | 112 | 156 | ||||||||||||
| Total current assets | 13,130 | 12,861 | ||||||||||||
| Property, plant, and equipment, net | 3,758 | 3,861 | ||||||||||||
| Operating lease assets, net | 330 | 325 | ||||||||||||
| Other non-current assets | 658 | 180 | ||||||||||||
| Total assets | $ | 17,876 | $ | 17,227 | ||||||||||
| Liabilities and Stockholders’ Equity | ||||||||||||||
| Current liabilities: | ||||||||||||||
| Accounts payable | $ | 1,000 | $ | 1,007 | ||||||||||
| Accrued liabilities | 1,154 | 943 | ||||||||||||
| Current portion of lease liabilities and other current liabilities | 270 | 324 | ||||||||||||
| Total current liabilities | 2,424 | 2,274 | ||||||||||||
| Non-current portion of long-term debt | 1,231 | 2,718 | ||||||||||||
| Non-current lease liabilities | 311 | 305 | ||||||||||||
| Other non-current liabilities | 111 | 216 | ||||||||||||
| Total liabilities | 4,077 | 5,513 | ||||||||||||
| Commitments and contingencies | ||||||||||||||
| Stockholders' equity: | ||||||||||||||
Preferred stock, $0.001 par value; 10 shares authorized and 0 shares issued and outstanding as of December 31, 2022 and June 30, 2023 |
— | — | ||||||||||||
Common stock, $0.001 par value; 3,508 and 3,508 shares authorized and 926 and 946 shares issued and outstanding as of December 31, 2022 and June 30, 2023, respectively |
1 | 1 | ||||||||||||
| Additional paid-in capital | 26,926 | 27,383 | ||||||||||||
| Accumulated deficit | (13,126) | (15,670) | ||||||||||||
| Accumulated other comprehensive loss | (2) | — | ||||||||||||
| Total stockholders' equity | 13,799 | 11,714 | ||||||||||||
| Total liabilities and stockholders' equity | $ | 17,876 | $ | 17,227 | ||||||||||
|
Q2 2023 Shareholder Letter | © 2023 Rivian. All rights reserved. 15 |
||||||
| Condensed Consolidated Statements of Operations | ||||||||||||||
| (in millions, except per share amounts) | ||||||||||||||
| (unaudited) | ||||||||||||||
| Three Months Ended June 30, | Six Months Ended June 30, | |||||||||||||||||||||||||
| 2022 | 2023 | 2022 | 2023 | |||||||||||||||||||||||
| Revenues | $ | 364 | $ | 1,121 | $ | 459 | $ | 1,782 | ||||||||||||||||||
| Cost of revenues | 1,068 | 1,533 | 1,665 | 2,729 | ||||||||||||||||||||||
| Gross profit | (704) | (412) | (1,206) | (947) | ||||||||||||||||||||||
| Operating expenses | ||||||||||||||||||||||||||
| Research and development | 543 | 444 | 1,090 | 940 | ||||||||||||||||||||||
| Selling, general, and administrative | 461 | 429 | 991 | 831 | ||||||||||||||||||||||
| Total operating expenses | 1,004 | 873 | 2,081 | 1,771 | ||||||||||||||||||||||
| Loss from operations | (1,708) | (1,285) | (3,287) | (2,718) | ||||||||||||||||||||||
| Interest income | 22 | 141 | 25 | 265 | ||||||||||||||||||||||
| Interest expense | (24) | (54) | (46) | (92) | ||||||||||||||||||||||
| Other income, net | 1 | 3 | 6 | 2 | ||||||||||||||||||||||
| Loss before income taxes | (1,709) | (1,195) | (3,302) | (2,543) | ||||||||||||||||||||||
| Provision for income taxes | (3) | — | (3) | (1) | ||||||||||||||||||||||
| Net loss | $ | (1,712) | $ | (1,195) | $ | (3,305) | $ | (2,544) | ||||||||||||||||||
| Net loss attributable to common stockholders, basic and diluted | $ | (1,712) | $ | (1,195) | $ | (3,305) | $ | (2,544) | ||||||||||||||||||
| Net loss per share attributable to Class A and Class B common stockholders, basic and diluted | $ | (1.89) | $ | (1.27) | $ | (3.66) | $ | (2.72) | ||||||||||||||||||
| Weighted-average common shares outstanding, basic and diluted | 908 | 942 | 904 | 937 | ||||||||||||||||||||||
|
Q2 2023 Shareholder Letter | © 2023 Rivian. All rights reserved. 16 |
||||||
| Consolidated Statements of Cash Flows | ||||||||||||||
| (in millions) | ||||||||||||||
| (unaudited) | ||||||||||||||
| Six Months Ended June 30, | ||||||||||||||
| 2022 | 2023 | |||||||||||||
| Cash flows from operating activities: | ||||||||||||||
| Net loss | $ | (3,305) | $ | (2,544) | ||||||||||
| Depreciation and amortization | 279 | 411 | ||||||||||||
| Stock-based compensation expense | 559 | 364 | ||||||||||||
| Inventory write-downs and losses on firm purchase commitments | 301 | 220 | ||||||||||||
| Other non-cash activities | 63 | 7 | ||||||||||||
| Changes in operating assets and liabilities: | ||||||||||||||
| Accounts receivable, net | (37) | (239) | ||||||||||||
| Inventory | (620) | (1,190) | ||||||||||||
| Other current assets | 18 | (44) | ||||||||||||
| Other non-current assets | (19) | (38) | ||||||||||||
| Accounts payable and accrued liabilities | 421 | 16 | ||||||||||||
| Other current liabilities | 70 | 53 | ||||||||||||
| Other non-current liabilities | 32 | 102 | ||||||||||||
| Net cash used in operating activities | (2,238) | (2,882) | ||||||||||||
| Cash flows from investing activities: | ||||||||||||||
| Purchase of short-term investments | — | (938) | ||||||||||||
| Capital expenditures | (777) | (538) | ||||||||||||
| Net cash used in investing activities | (777) | (1,476) | ||||||||||||
| Cash flows from financing activities: | ||||||||||||||
| Proceeds from issuance of capital stock including employee stock purchase plan | 58 | 37 | ||||||||||||
| Proceeds from issuance of convertible notes | — | 1,485 | ||||||||||||
| Other financing activities | (2) | (5) | ||||||||||||
| Net cash provided by financing activities | 56 | 1,517 | ||||||||||||
| Effect of exchange rate changes on cash and cash equivalents | (1) | 2 | ||||||||||||
| Net change in cash | (2,960) | (2,839) | ||||||||||||
| Cash, cash equivalents, and restricted cash—Beginning of period | 18,423 | 12,099 | ||||||||||||
| Cash, cash equivalents, and restricted cash—End of period | $ | 15,463 | $ | 9,260 | ||||||||||
| Supplemental disclosure of non-cash investing and financing activities: | ||||||||||||||
| Capital expenditures included in liabilities | $ | 358 | $ | 338 | ||||||||||
| Capital stock issued to settle bonuses | $ | — | $ | 137 | ||||||||||
| Right-of-use assets obtained in exchange for operating lease liabilities | $ | 84 | $ | 27 | ||||||||||
|
Q2 2023 Shareholder Letter | © 2023 Rivian. All rights reserved. 17 |
||||||
| Stock-Based Compensation Expense | ||||||||||||||
| (in millions) | ||||||||||||||
| (unaudited) | ||||||||||||||
| Three Months Ended June 30, | Six Months Ended June 30, | |||||||||||||||||||||||||
| 2022 | 2023 | 2022 | 2023 | |||||||||||||||||||||||
| Cost of revenues | $ | 13 | $ | 23 | $ | 23 | $ | 41 | ||||||||||||||||||
| Research and development | 115 | 72 | 253 | 156 | ||||||||||||||||||||||
| Selling, general, and administrative | 114 | 86 | 283 | 167 | ||||||||||||||||||||||
| Total stock-based compensation expense | $ | 242 | $ | 181 | $ | 559 | $ | 364 | ||||||||||||||||||
| Depreciation and Amortization | ||||||||||||||
| (in millions) | ||||||||||||||
| (unaudited) | ||||||||||||||
| Three Months Ended June 30, | Six Months Ended June 30, | |||||||||||||||||||||||||
| 2022 | 2023 | 2022 | 2023 | |||||||||||||||||||||||
| Cost of revenues | $ | 127 | $ | 160 | $ | 207 | $ | 290 | ||||||||||||||||||
| Research and development | 15 | 36 | 35 | 69 | ||||||||||||||||||||||
| Selling, general, and administrative | 19 | 27 | 37 | 52 | ||||||||||||||||||||||
| Total depreciation and amortization expense | $ | 161 | $ | 223 | $ | 279 | $ | 411 | ||||||||||||||||||
|
Q2 2023 Shareholder Letter | © 2023 Rivian. All rights reserved. 18 |
||||||
| Reconciliation of Non-GAAP | ||||||||||||||
| Financial Measures | ||||||||||||||
| (in millions, except units delivered, gross profit per unit delivered, and per share amounts) | ||||||||||||||
| (unaudited) | ||||||||||||||
|
Adjusted Net Loss and
Adjusted Net Loss Per Share
|
Three Months Ended June 30, | Six Months Ended June 30, | ||||||||||||||||||||||||
| 2022 | 2023 | 2022 | 2023 | |||||||||||||||||||||||
| Net loss attributable to common stockholders, basic and diluted | $ | (1,712) | $ | (1,195) | $ | (3,305) | $ | (2,544) | ||||||||||||||||||
| Stock-based compensation expense | 242 | 181 | 559 | 364 | ||||||||||||||||||||||
| Other income, net | (1) | (3) | (6) | (2) | ||||||||||||||||||||||
| Adjusted net loss attributable to common stockholders, basic and diluted (non-GAAP) | $ | (1,471) | $ | (1,017) | $ | (2,752) | $ | (2,182) | ||||||||||||||||||
| Net loss per share attributable to common stockholders, basic and diluted | $ | (1.89) | $ | (1.27) | $ | (3.66) | $ | (2.72) | ||||||||||||||||||
| Stock-based compensation expense per share | 0.27 | 0.19 | 0.62 | 0.39 | ||||||||||||||||||||||
| Other income, net per share | — | — | (0.01) | — | ||||||||||||||||||||||
| Adjusted net loss per share attributable to common stockholders, basic and diluted (non-GAAP) | $ | (1.62) | $ | (1.08) | $ (3.04)* | $ | (2.33) | |||||||||||||||||||
| Weighted-average common shares outstanding, basic and diluted (GAAP) | 908 | 942 | 904 | 937 | ||||||||||||||||||||||
| *Does not sum due to rounding | ||||||||||||||||||||||||||
| Adjusted EBITDA | Three Months Ended June 30, | Six Months Ended June 30, | ||||||||||||||||||||||||
| 2022 | 2023 | 2022 | 2023 | |||||||||||||||||||||||
| Net loss | $ | (1,712) | $ | (1,195) | $ | (3,305) | $ | (2,544) | ||||||||||||||||||
| Interest expense (income), net | 2 | (87) | 21 | (173) | ||||||||||||||||||||||
| Provision for income taxes | 3 | — | 3 | 1 | ||||||||||||||||||||||
| Depreciation and amortization | 161 | 223 | 279 | 411 | ||||||||||||||||||||||
| Stock-based compensation expense | 242 | 181 | 559 | 364 | ||||||||||||||||||||||
| Other income, net | (1) | (3) | (6) | (2) | ||||||||||||||||||||||
| Adjusted EBITDA (non-GAAP) | $ | (1,305) | $ | (881) | $ | (2,449) | $ | (1,943) | ||||||||||||||||||
| Free Cash Flow | Three Months Ended June 30, | Six Months Ended June 30, | ||||||||||||||||||||||||
| 2022 | 2023 | 2022 | 2023 | |||||||||||||||||||||||
| Net cash used in operating activities | $ | (1,204) | $ | (1,361) | $ | (2,238) | $ | (2,882) | ||||||||||||||||||
| Capital expenditures | (359) | (255) | (777) | (538) | ||||||||||||||||||||||
| Free cash flow (non-GAAP) | $ | (1,563) | $ | (1,616) | $ | (3,015) | $ | (3,420) | ||||||||||||||||||
| Gross profit per unit delivered | Three Months Ended June 30, | Six Months Ended June 30, | ||||||||||||||||||||||||
| 2022 | 2023 | 2022 | 2023 | |||||||||||||||||||||||
| Units delivered | 4,467 | 12,640 | 5,694 | 20,586 | ||||||||||||||||||||||
| Gross profit | $ | (704) | $ | (412) | $ | (1,206) | $ | (947) | ||||||||||||||||||
| Gross profit per unit delivered (non-GAAP) | $ | (157,600) | $ | (32,595) | $ | (211,802) | $ | (46,002) | ||||||||||||||||||
|
Q2 2023 Shareholder Letter | © 2023 Rivian. All rights reserved. 19 |
||||||
| Quarterly Financial Performance | ||||||||||||||
| Reconciliation of Non-GAAP | ||||||||||||||
| Financial Measures | ||||||||||||||
| (in millions, except units delivered, and gross profit per unit delivered, and per share amounts) | ||||||||||||||
| (unaudited) | ||||||||||||||
| Three Months Ended | ||||||||||||||||||||||||||||||||
| June 30, 2022 | September 30, 2022 | December 31, 2022 | March 31, 2023 | June 30, 2023 | ||||||||||||||||||||||||||||
| Net loss | $ | (1,712) | $ | (1,724) | $ | (1,723) | $ | (1,349) | $ | (1,195) | ||||||||||||||||||||||
| Interest expense (income), net | 2 | (45) | (66) | (86) | (87) | |||||||||||||||||||||||||||
| Provision for income taxes | 3 | 1 | — | 1 | — | |||||||||||||||||||||||||||
| Depreciation and amortization | 161 | 174 | 199 | 188 | 223 | |||||||||||||||||||||||||||
| Stock-based compensation expense | 242 | 293 | 135 | 183 | 181 | |||||||||||||||||||||||||||
| Other (income) expense, net | (1) | (6) | (6) | 1 | (3) | |||||||||||||||||||||||||||
| Adjusted EBITDA (non-GAAP) | $ | (1,305) | $ | (1,307) | $ | (1,461) | $ | (1,062) | $ | (881) | ||||||||||||||||||||||
| Net loss attributable to common stockholders, basic and diluted | $ | (1,712) | $ | (1,724) | $ | (1,723) | $ | (1,349) | $ | (1,195) | ||||||||||||||||||||||
| Stock-based compensation expense | 242 | 293 | 135 | 183 | 181 | |||||||||||||||||||||||||||
| Other (income) expense, net | (1) | (6) | (6) | 1 | (3) | |||||||||||||||||||||||||||
| Adjusted net loss attributable to common stockholders, basic and diluted (non-GAAP) | $ | (1,471) | $ | (1,437) | $ | (1,594) | $ | (1,165) | $ | (1,017) | ||||||||||||||||||||||
| Net loss per share attributable to common stockholders, basic and diluted | $ | (1.89) | $ | (1.88) | $ | (1.87) | $ | (1.45) | $ | (1.27) | ||||||||||||||||||||||
| Stock-based compensation expense per share | 0.27 | 0.32 | 0.15 | 0.20 | 0.19 | |||||||||||||||||||||||||||
| Other income, net per share | — | (0.01) | (0.01) | — | — | |||||||||||||||||||||||||||
| Adjusted net loss per share attributable to common stockholders, basic and diluted (non-GAAP) | $ | (1.62) | $ | (1.57) | $ | (1.73) | $ | (1.25) | $ | (1.08) | ||||||||||||||||||||||
| Weighted-average common shares outstanding, basic and diluted (GAAP) | 908 | 918 | 923 | 930 | 942 | |||||||||||||||||||||||||||
| Net cash used in operating activities | $ | (1,204) | $ | (1,368) | $ | (1,446) | $ | (1,521) | $ | (1,361) | ||||||||||||||||||||||
| Capital expenditures | (359) | (298) | (294) | (283) | (255) | |||||||||||||||||||||||||||
| Free cash flow (non-GAAP) | $ | (1,563) | $ | (1,666) | $ | (1,740) | $ | (1,804) | $ | (1,616) | ||||||||||||||||||||||
| Gross profit per unit delivered | ||||||||||||||||||||||||||||||||
| Units delivered | 4,467 | 6,584 | 8,054 | 7,946 | 12,640 | |||||||||||||||||||||||||||
| Gross profit | $ | (704) | $ | (917) | $ | (1,000) | $ | (535) | $ | (412) | ||||||||||||||||||||||
| Gross profit per unit delivered (non-GAAP) | $ | (157,600) | $ | (139,277) | $ | (124,162) | $ | (67,329) | $ | (32,595) | ||||||||||||||||||||||
|
Q2 2023 Shareholder Letter | © 2023 Rivian. All rights reserved. 20 |
||||||
| Forward-Looking Statements | This shareholder letter contains forward-looking statements within the meaning of the Private Securities Litigation Reform Act of 1995. All statements contained in this shareholder letter and discussed on our earnings call that do not relate to matters of historical fact should be considered forward-looking statements, including without limitation statements regarding our future operations, initiatives and business strategy, our cost reduction strategy, our future financial results, vehicle profitability and future gross profits, the planned use of our cash and cash equivalents, the underlying trends in our business, supply chain constraints and our plans to minimize the impact of such constraints, our market opportunity, and our potential for growth, our production ramp and manufacturing capacity expansion and anticipated production levels, our announced manufacturing facility in Georgia, scaling our service infrastructure, adoption of NACS and greater access to charging networks, our future products and technology and product enhancements (including R2), and revenue opportunities. These statements are neither promises nor guarantees and involve known and unknown risks, uncertainties, and other important factors that may cause our actual results, performance, or achievements to be materially different from any future results, performance, or achievements expressed or implied by the forward-looking statements, including, but not limited to: our history of losses as a growth-stage company and our limited operating history; we may be unable to adequately control capital expenditures and costs; we may require additional financing to support our business; our ability to develop and manufacture vehicles on a large scale is unproven and we may experience significant delays in the manufacture and delivery of our vehicles; we have experienced and could continue to experience cost increases or disruptions in supply of components used in our vehicles; our dependence on suppliers and volatility in pricing of components and raw materials; our dependence upon third parties for key semiconductor chip components; we expect a significant portion of our initial revenue to be from one customer; our inability to attract and retain a large number of customers; risks relating to the highly competitive automotive market, including competitors that may take steps to compete more effectively against us, including with respect to pricing and features, and impact of competition and macroeconomic conditions on product demand; we are highly dependent on the services and reputation of our Founder and Chief Executive Officer; our long-term results depend on our ability to successfully introduce and market new products and services; our inability to manage our future growth effectively; we may not succeed in establishing, maintaining, and strengthening our brand; our focus on delivering a high-quality and engaging Rivian experience may not maximize short-term financial results; risks relating to our distribution model; we rely on complex machinery, and production involves a significant degree of risk and uncertainty; our vehicles rely on highly technical software and hardware that could contain errors or defects; we may not successfully develop the complex software and technology systems needed to produce our vehicles; inadequate access to charging stations and not being able to realize the benefits of our charging networks; risks related to our use of lithium-ion battery cells; we have minimal experience servicing and repairing our vehicles; the automotive industry and its technology are rapidly evolving; risks associated with advanced driver assistance systems technology; our future growth is dependent on the demand for electric vehicles; the reduction or elimination of government and economic incentives for electric vehicles; we may not obtain government grants and other incentives for which we may apply; vehicle retail sales depend heavily on affordable interest rates and availability of credit; insufficient warranty reserves to cover warranty claims; future field actions, including product recalls, could harm our business; risks related to product liability claims; risks associated with international operations; our ability to attract and retain key employees and qualified personnel; our ability to maintain our culture; our business may be adversely affected by labor and union activities; risks associated with the ongoing military conflict between Russia and the Ukraine; risks related to health epidemics, pandemics, and other outbreaks; our financial results may vary significantly from period to period; we have incurred a significant amount of debt and may incur additional indebtedness; our vehicles may not operate properly; risks related to third-party vendors for certain product and service offerings; potential conflicts of interest involving our principal stockholders or their affiliates; risks associated with exchange rate and interest rate fluctuations; breaches in data security and failure of information security systems could harm our business; risk of intellectual property infringement claims; our ability to prevent unauthorized use of our intellectual property; risks related to governmental regulation and legal proceedings; delays, limitations and risks related to permits and approvals required to operate or expand operations; material weaknesses in our internal control over financial reporting; and the other factors described in our Quarterly Report on Form 10-Q for the quarter ended June 30, 2023, and any subsequent filings with the SEC. These factors could cause actual results to differ materially from those indicated by the forward-looking statements made in this shareholder letter. Any such forward-looking statements represent management’s estimates as of the date of this shareholder letter. While we may elect to update such forward-looking statements at some point in the future, except as may be required by law, we disclaim any obligation to do so, even if subsequent events cause our views to change. |
||||
|
Q2 2023 Shareholder Letter | © 2023 Rivian. All rights reserved. 21 |
||||||
| Non-GAAP Financial Measures |
In addition to our results determined in accordance with generally accepted accounting principles in the United States (“GAAP”), we review financial measures that are not calculated and presented in accordance with GAAP (“non-GAAP financial measures”). We believe our non-GAAP financial measures are useful in evaluating our operating performance. We use the following non-GAAP financial information, collectively, to evaluate our ongoing operations and for internal planning and forecasting purposes. We believe that non-GAAP financial information, when taken collectively, may be helpful to investors, because it provides consistency and comparability with past financial performance and assists in comparisons with other companies, some of which use similar non-GAAP financial information to supplement their GAAP results. The non-GAAP financial information is presented for supplemental informational purposes only, should not be considered a substitute for financial information presented in accordance with GAAP, and may be different from similarly titled non-GAAP measures used by other companies. A reconciliation of each historical non-GAAP financial measure to the most directly comparable financial measure stated in accordance with GAAP is provided above. Reconciliations of forward-looking non-GAAP financial measures are not provided because we are unable to provide such reconciliations without unreasonable effort due to the uncertainty regarding, and potential variability of, certain items, such as stock-based compensation expense and other costs and expenses that may be incurred in the future. Investors are encouraged to review the related GAAP financial measures and the reconciliation of these non-GAAP financial measures to their most directly comparable GAAP financial measures. Our non-GAAP financial measures include gross profit per unit delivered, adjusted net loss, adjusted net loss per share, adjusted EBITDA, and free cash flow. Adjusted net loss is defined as net loss before stock-based compensation, other (expense) income, net, (gain) loss on convertible notes, net, and the donation to Forever by Rivian, Inc. Adjusted net loss per share is defined as adjusted net loss divided by the weighted-average common shares outstanding. Adjusted EBITDA is defined as net loss before interest expense (income), net, provision for income taxes, depreciation and amortization, stock-based compensation, other (expense) income, net, (gain) loss on convertible notes, net, and the donation to Forever by Rivian, Inc. Free cash flow is defined as net cash used in operating activities less capital expenditures. |
||||
|
Q2 2023 Shareholder Letter | © 2023 Rivian. All rights reserved. 22 |
||||||

 |
Q2 2023 Shareholder Letter | © 2023 Rivian. All rights reserved. | ||||||