2Q26 Earnings Release August 2026
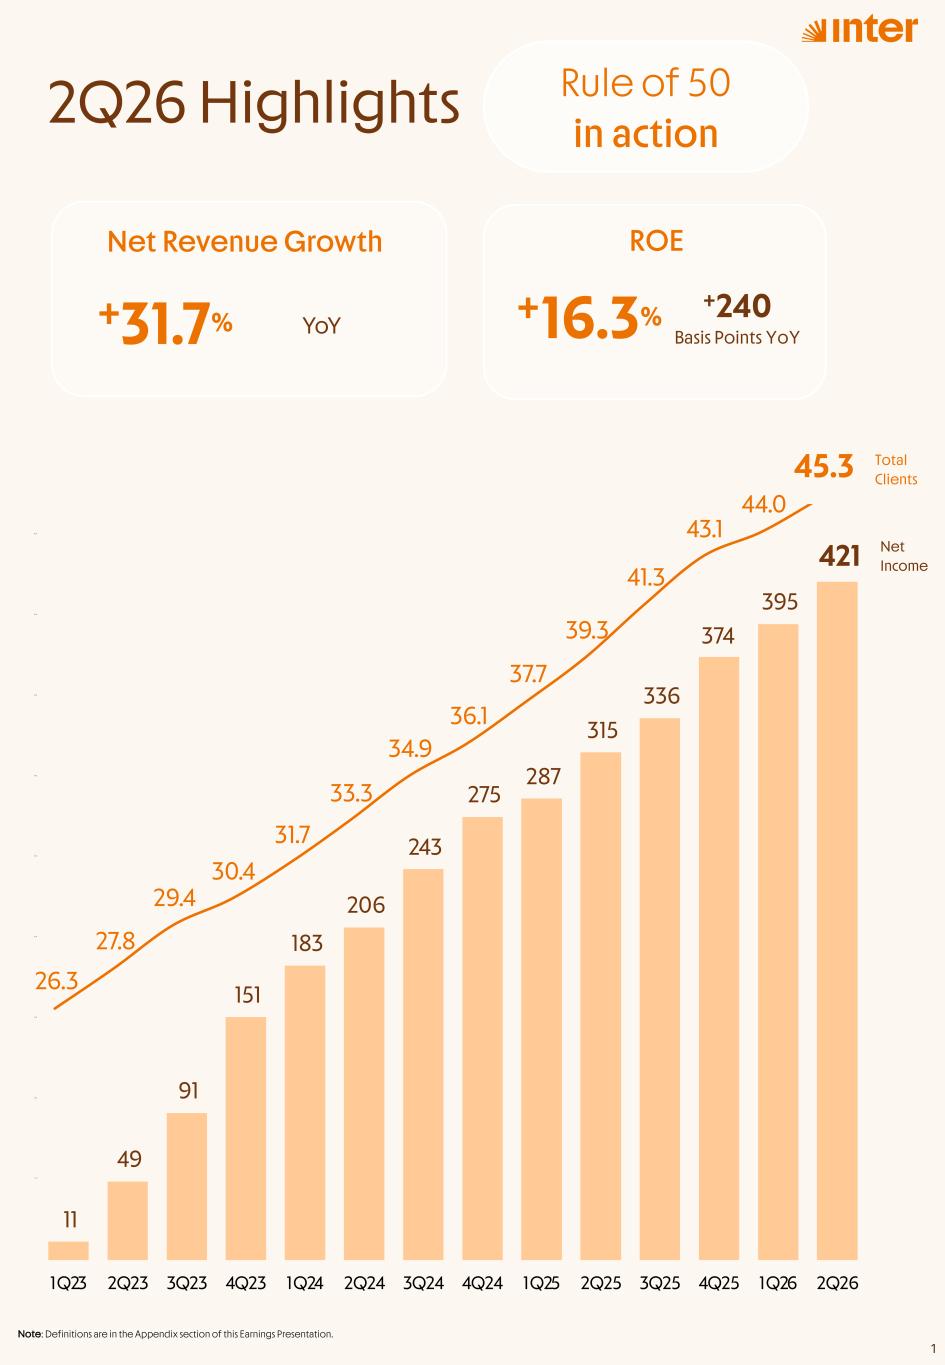
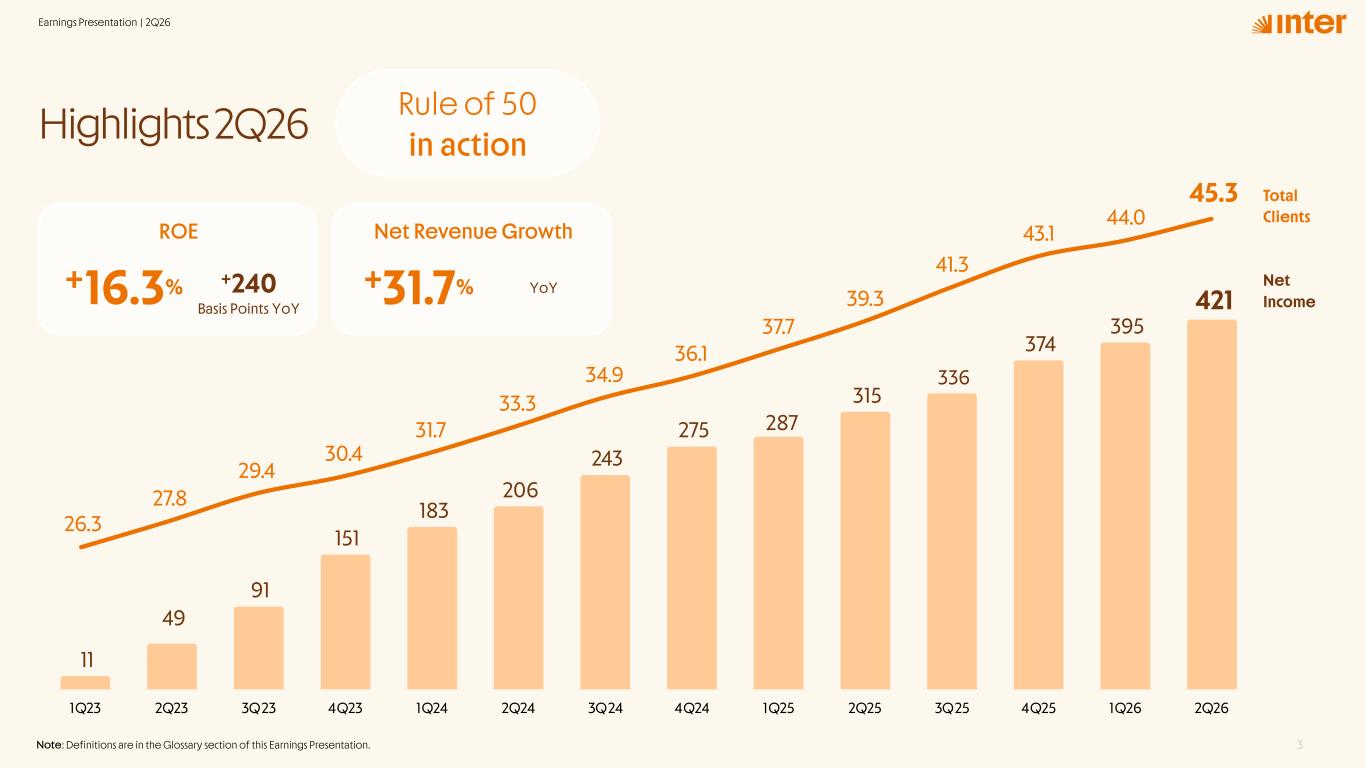
26.3 27.8 29.4 30.4 31.7 33.3 34.9 36.1 37.7 39.3 41.3 43.1 44.0 45.3 2Q26 Highlights Net Income Total Clients 11 49 91 151 183 206 243 275 287 315 336 374 395 421 - 5 0 1 0 1 50 2 0 2 50 3 0 3 50 4 0 4 50 1Q23 2Q23 3Q23 4Q23 1Q24 2Q24 3Q24 4Q24 1Q25 2Q25 3Q25 4Q25 1Q26 2Q26 +16.3%+31.7% YoY Net Revenue Growth ROE +240 Basis Points YoY Note: Definitions are in the Appendix section of this Earnings Presentation. 1 Rule of 50 in action
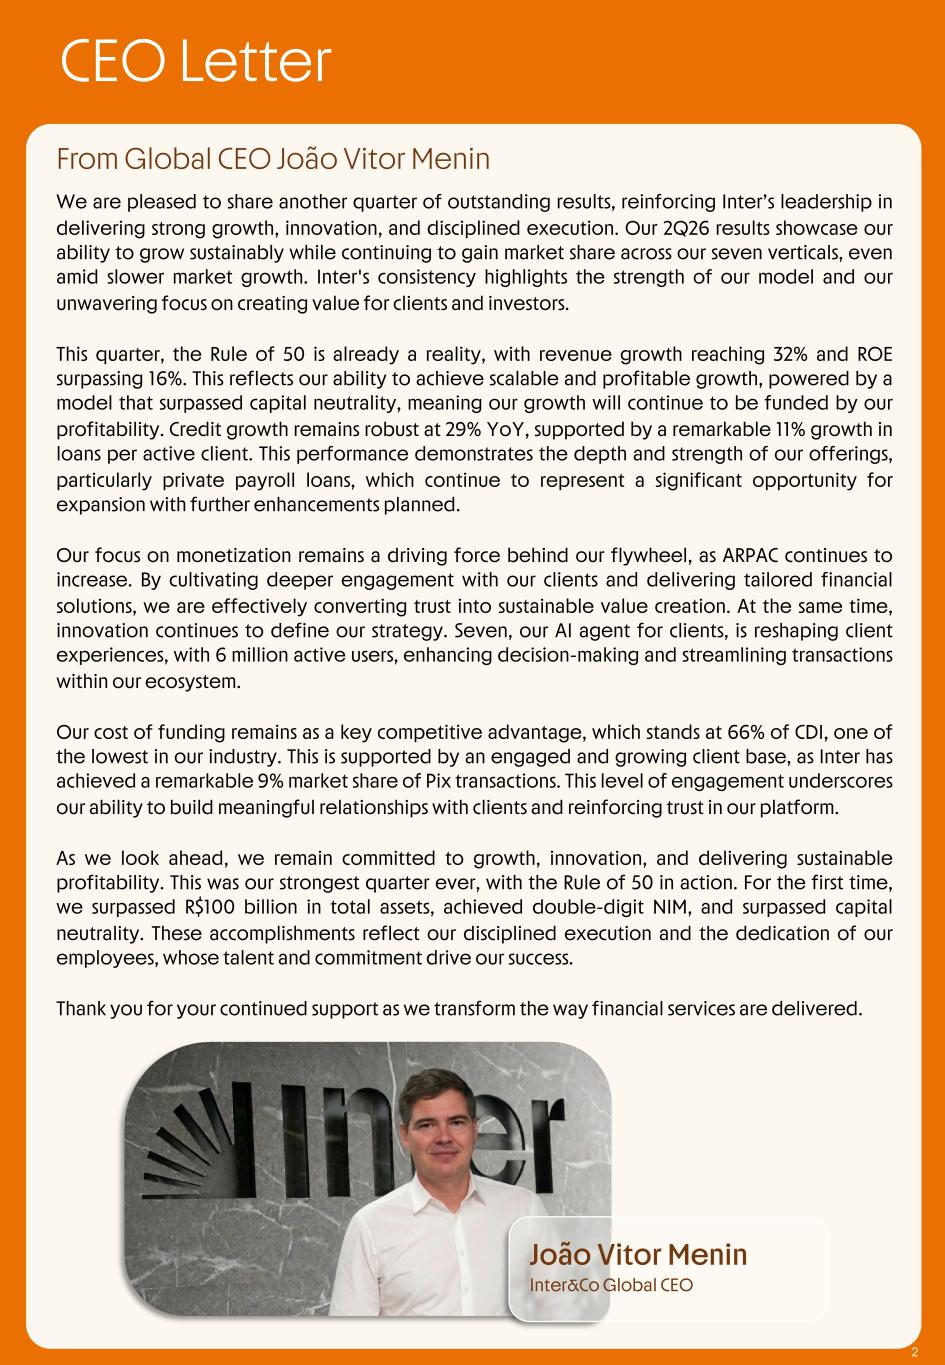
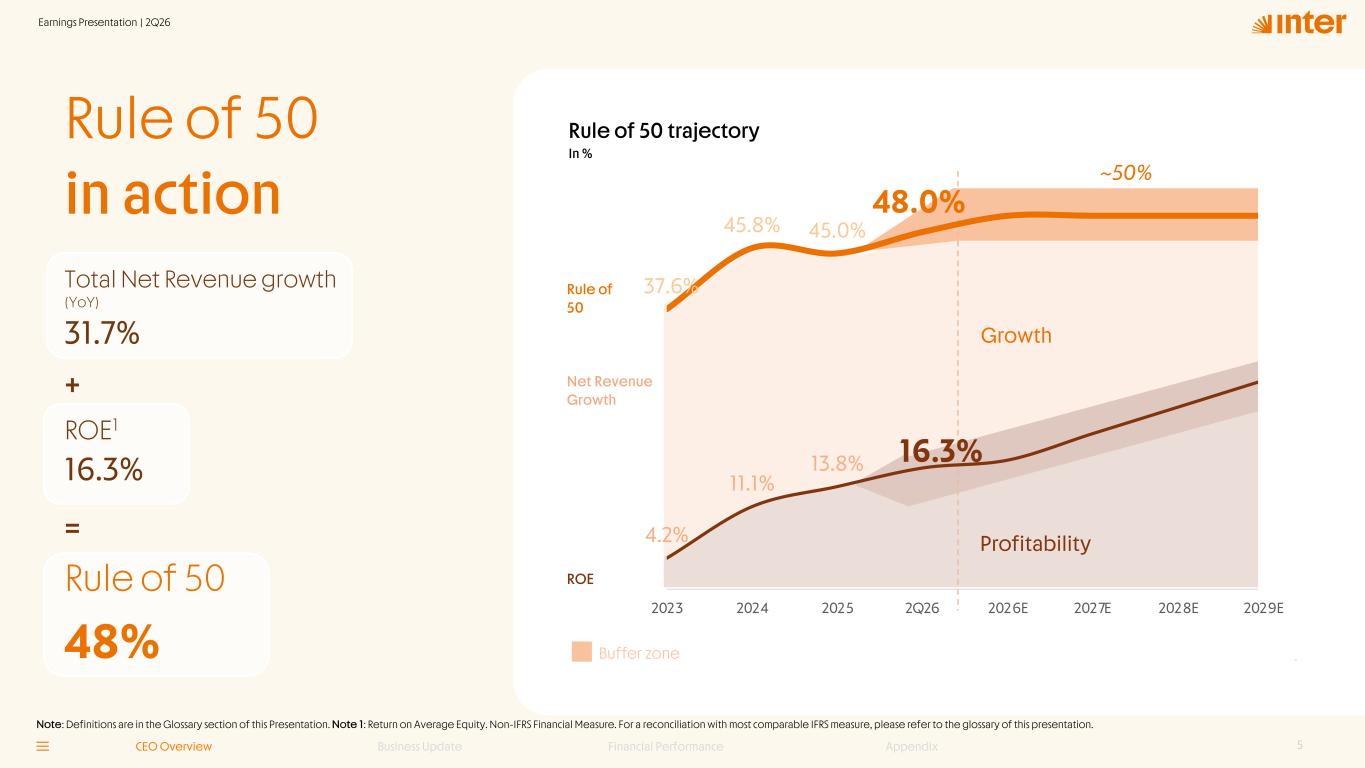
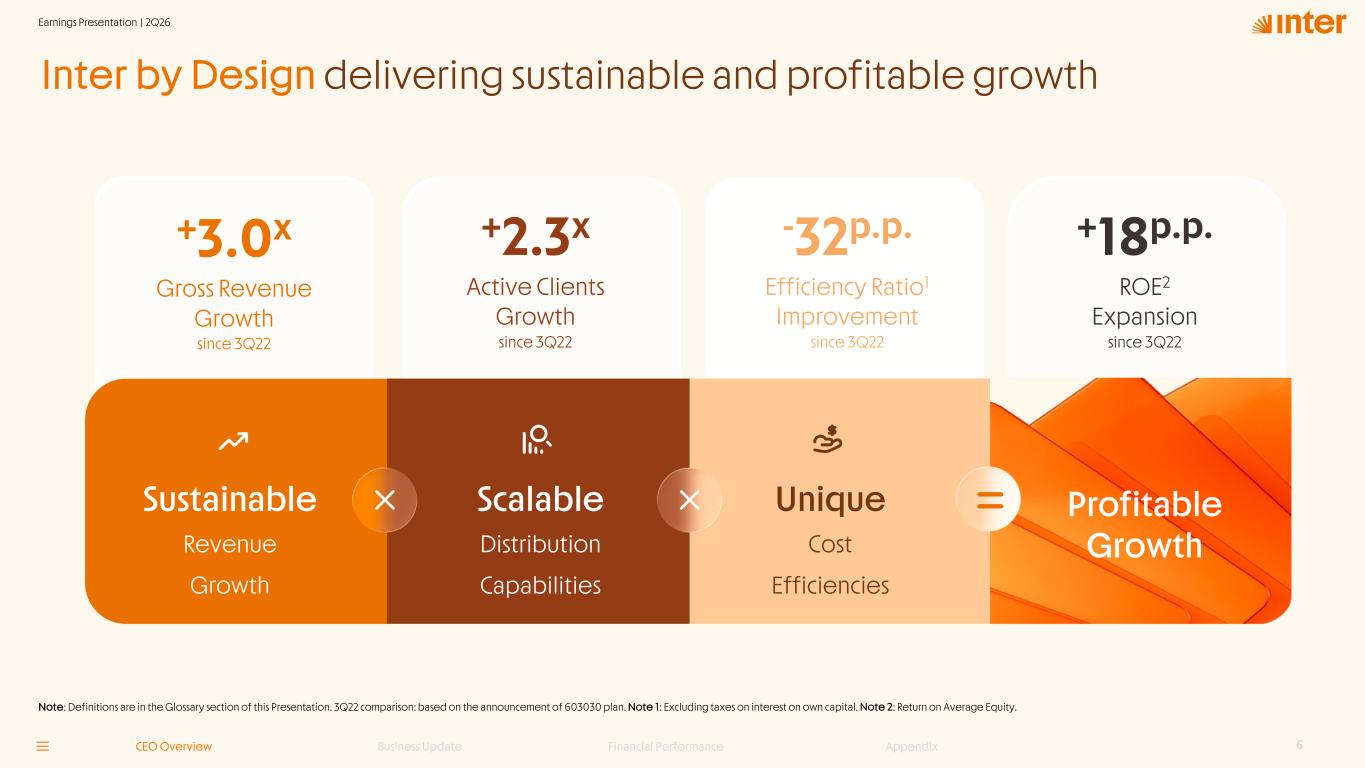
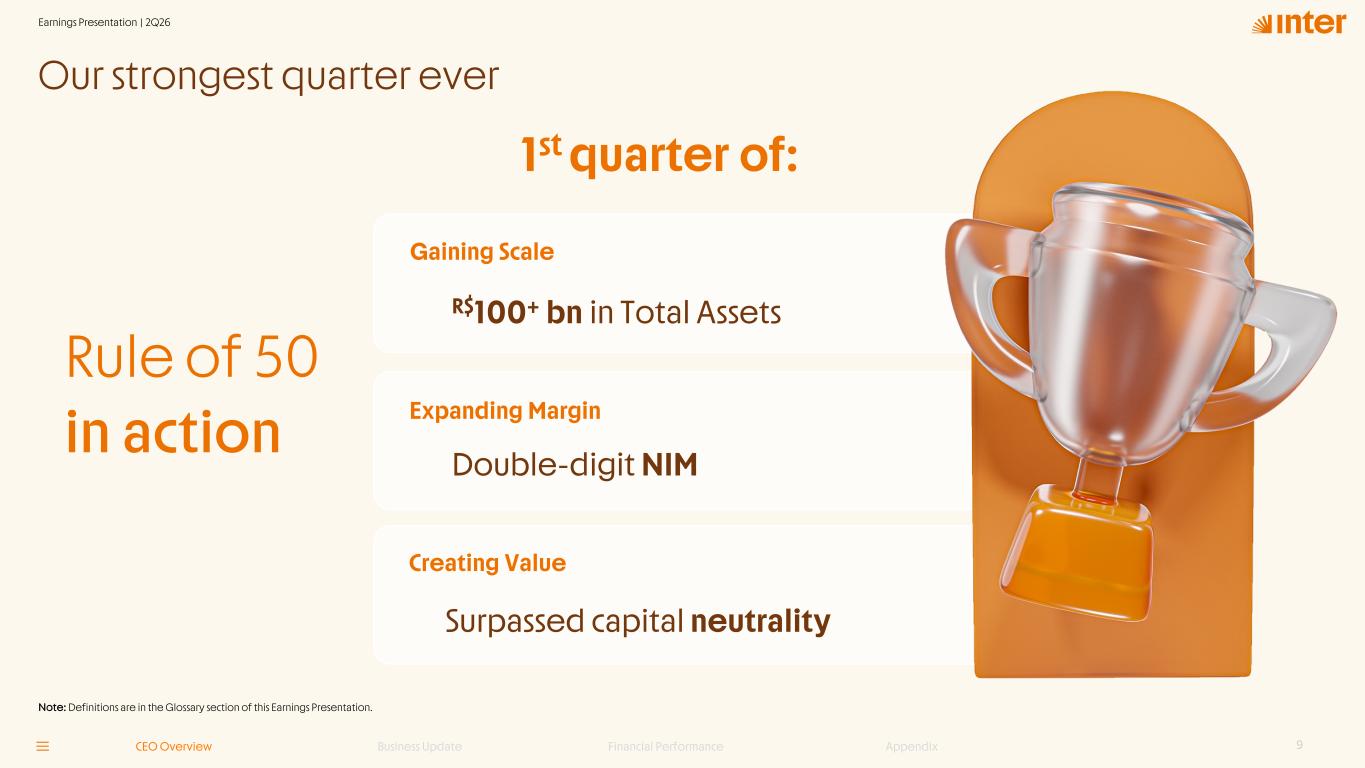
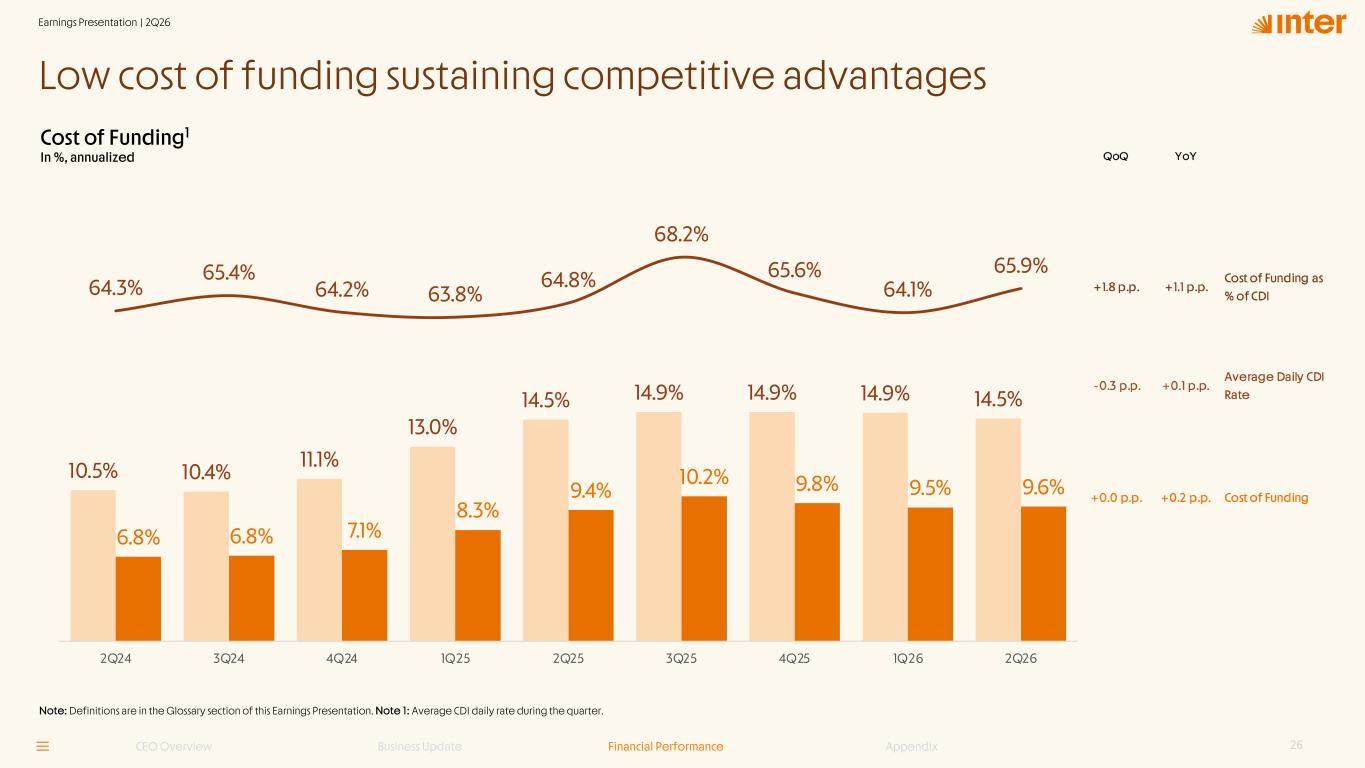
CEO Letter 2 We are pleased to share another quarter of outstanding results, reinforcing Inter’s leadership in delivering strong growth, innovation, and disciplined execution. Our 2Q26 results showcase our ability to grow sustainably while continuing to gain market share across our seven verticals, even amid slower market growth. Inter's consistency highlights the strength of our model and our unwavering focus on creating value for clients and investors. This quarter, the Rule of 50 is already a reality, with revenue growth reaching 32% and ROE surpassing 16%. This reflects our ability to achieve scalable and profitable growth, powered by a model that surpassed capital neutrality, meaning our growth will continue to be funded by our profitability. Credit growth remains robust at 29% YoY, supported by a remarkable 11% growth in loans per active client. This performance demonstrates the depth and strength of our offerings, particularly private payroll loans, which continue to represent a significant opportunity for expansion with further enhancements planned. Our focus on monetization remains a driving force behind our flywheel, as ARPAC continues to increase. By cultivating deeper engagement with our clients and delivering tailored financial solutions, we are effectively converting trust into sustainable value creation. At the same time, innovation continues to define our strategy. Seven, our AI agent for clients, is reshaping client experiences, with 6 million active users, enhancing decision-making and streamlining transactions within our ecosystem. Our cost of funding remains as a key competitive advantage, which stands at 66% of CDI, one of the lowest in our industry. This is supported by an engaged and growing client base, as Inter has achieved a remarkable 9% market share of Pix transactions. This level of engagement underscores our ability to build meaningful relationships with clients and reinforcing trust in our platform. As we look ahead, we remain committed to growth, innovation, and delivering sustainable profitability. This was our strongest quarter ever, with the Rule of 50 in action. For the first time, we surpassed R$100 billion in total assets, achieved double-digit NIM, and surpassed capital neutrality. These accomplishments reflect our disciplined execution and the dedication of our employees, whose talent and commitment drive our success. Thank you for your continued support as we transform the way financial services are delivered. From Global CEO João Vitor Menin Inter&Co Global CEO João Vitor Menin
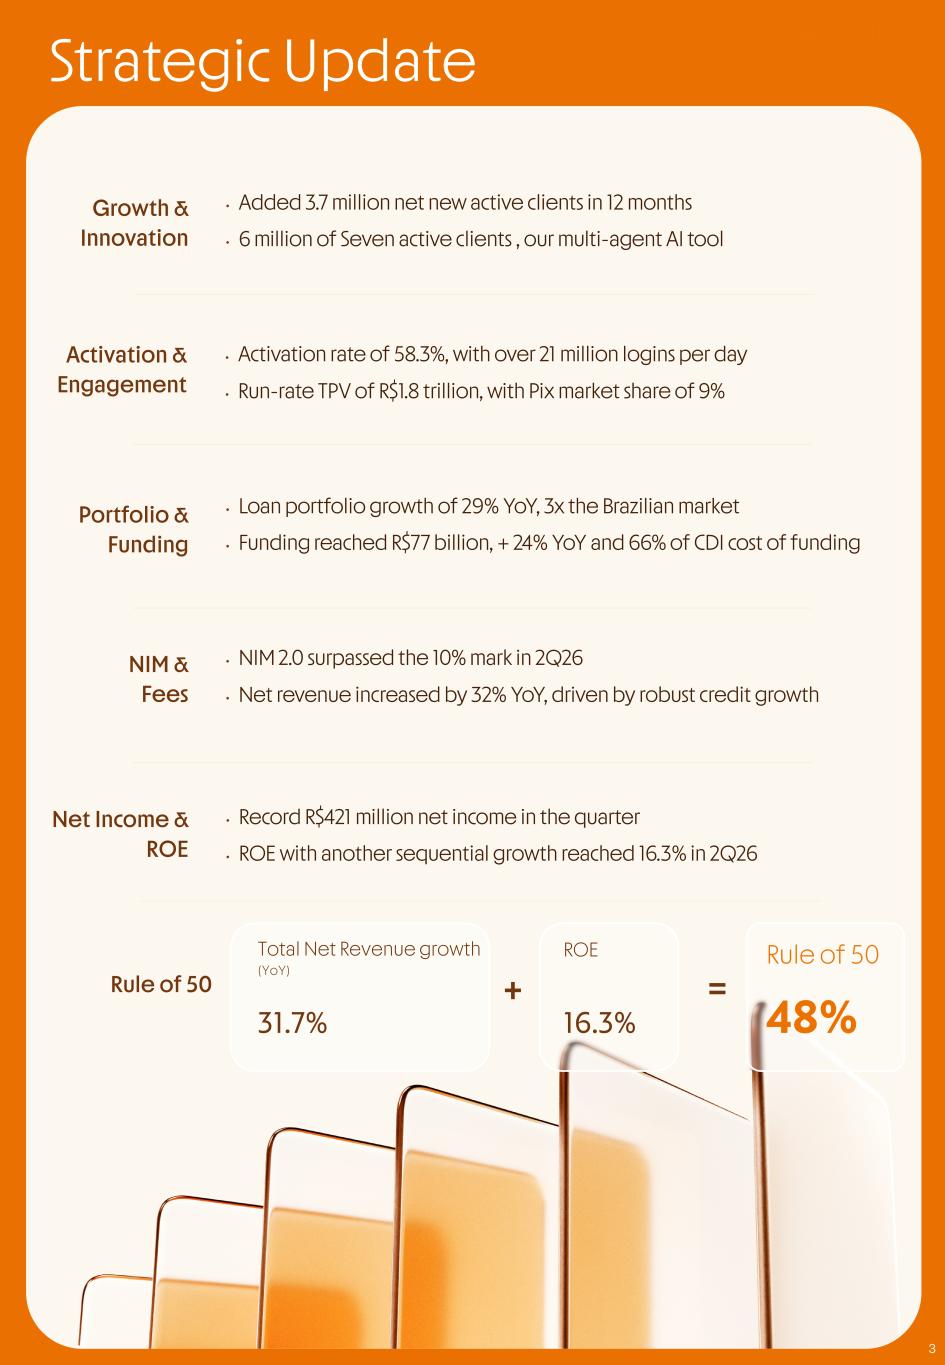
Strategic Update 3 Portfolio & Funding NIM & Fees Growth & Innovation Activation & Engagement Net Income & ROE • Loan portfolio growth of 29% YoY, 3x the Brazilian market • Funding reached R$77 billion, + 24% YoY and 66% of CDI cost of funding • NIM 2.0 surpassed the 10% mark in 2Q26 • Net revenue increased by 32% YoY, driven by robust credit growth • Added 3.7 million net new active clients in 12 months • 6 million of Seven active clients , our multi-agent AI tool • Activation rate of 58.3%, with over 21 million logins per day • Run-rate TPV of R$1.8 trillion, with Pix market share of 9% • Record R$421 million net income in the quarter • ROE with another sequential growth reached 16.3% in 2Q26 Rule of 50ROETotal Net Revenue growth (YoY) = 48%16.3% Rule of 50 31.7% +
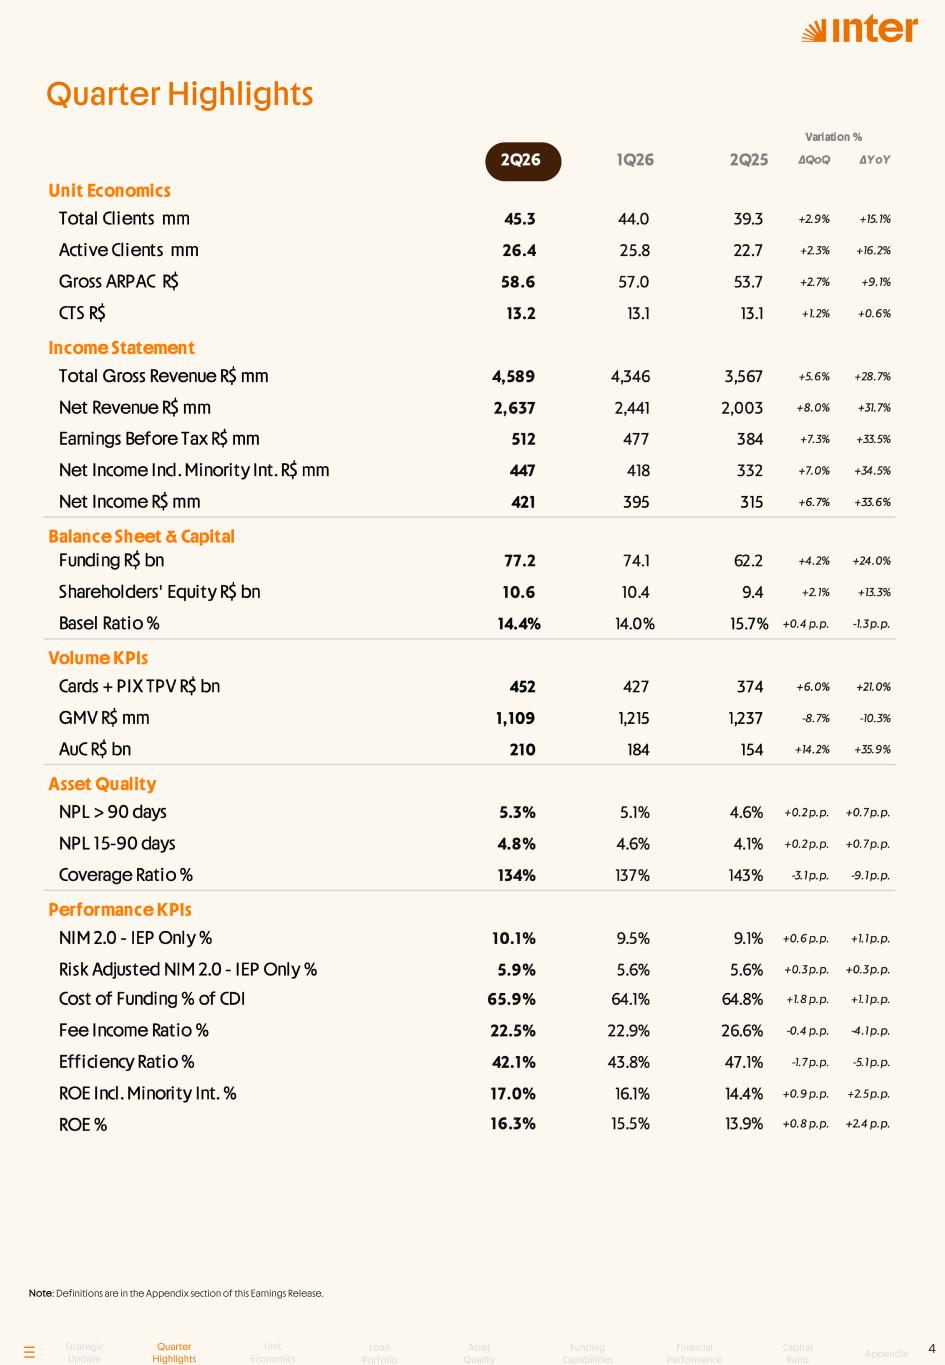
Note: Definitions are in the Appendix section of this Earnings Release. Quarter Highlights 4Strategic Update Quarter Highlights Unit Economics Loan Porfolio Asset Quality Funding Capabilities Financial Performance Capital Ratio Appendix
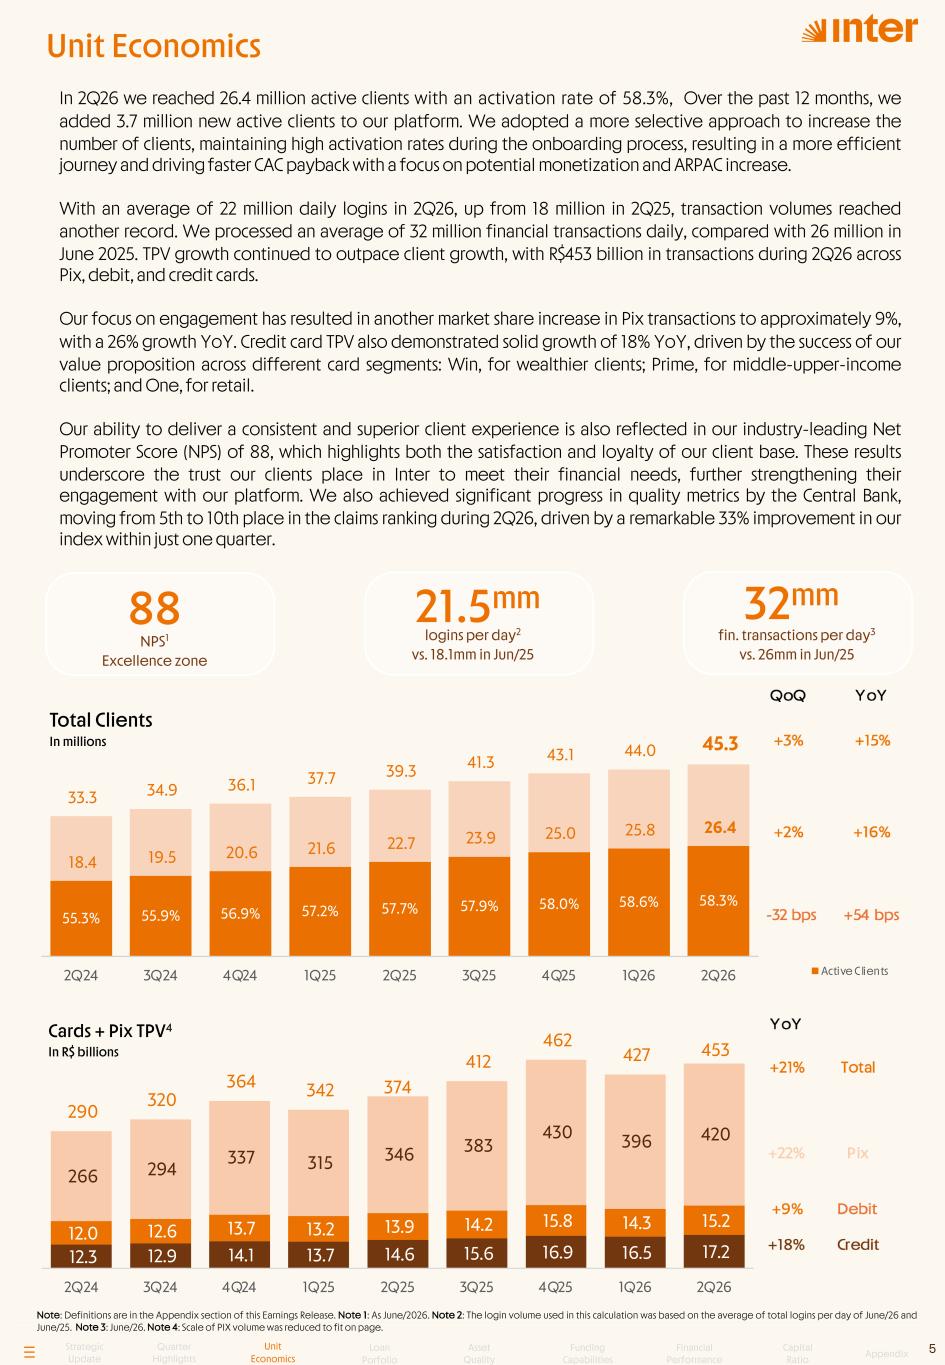
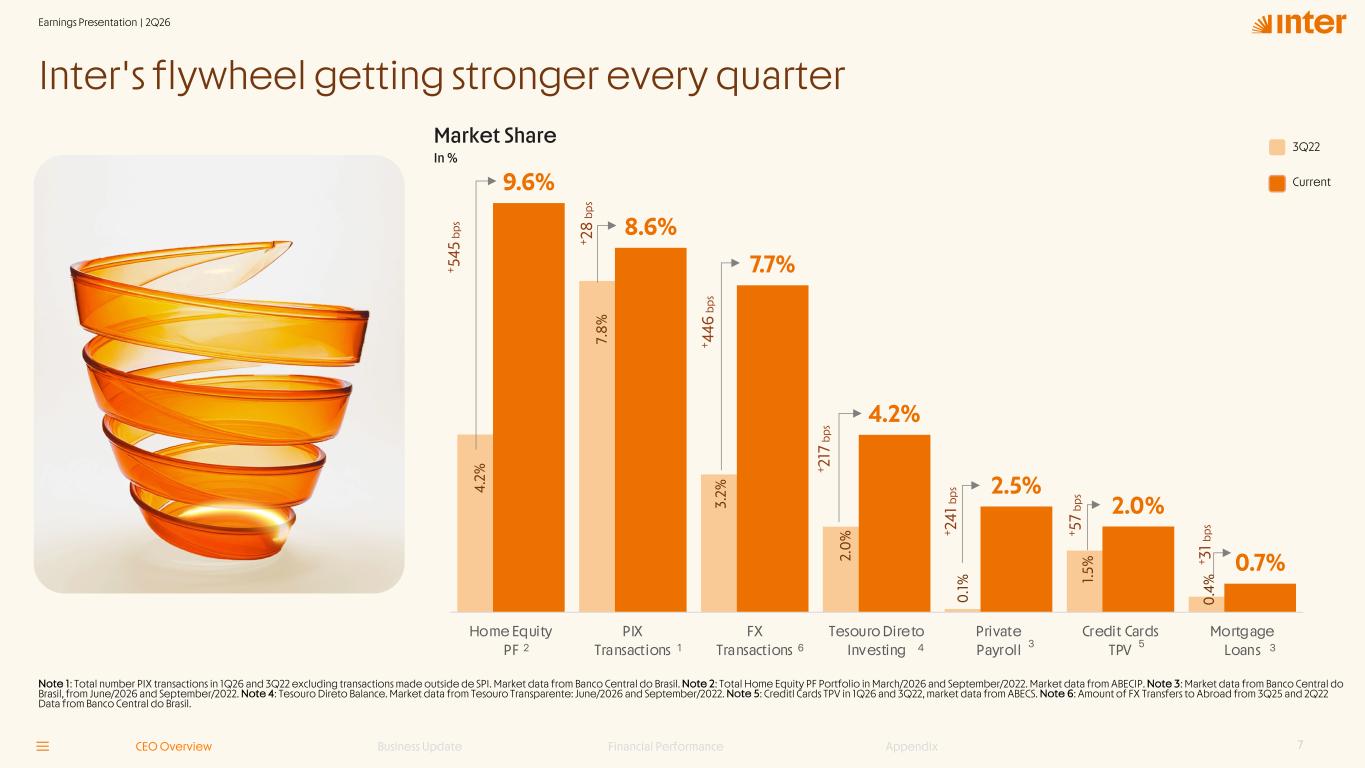
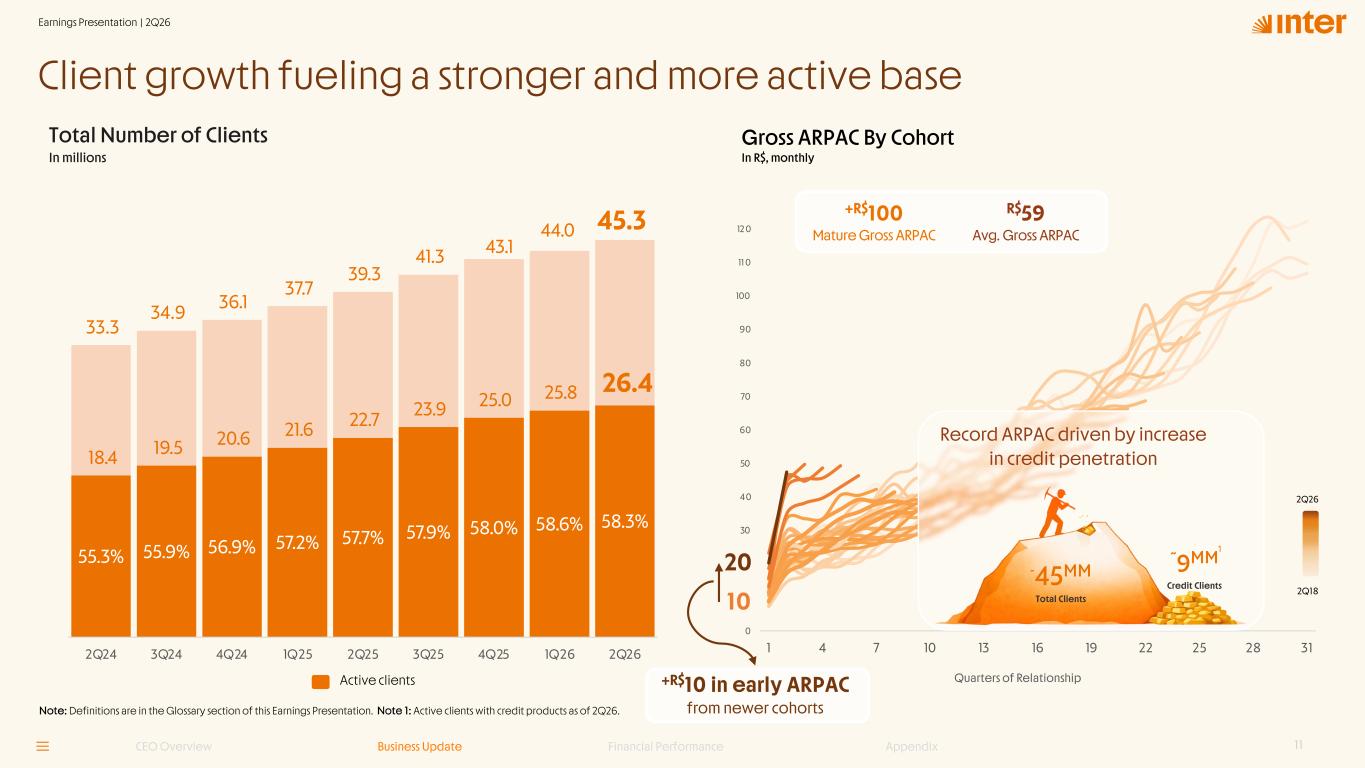
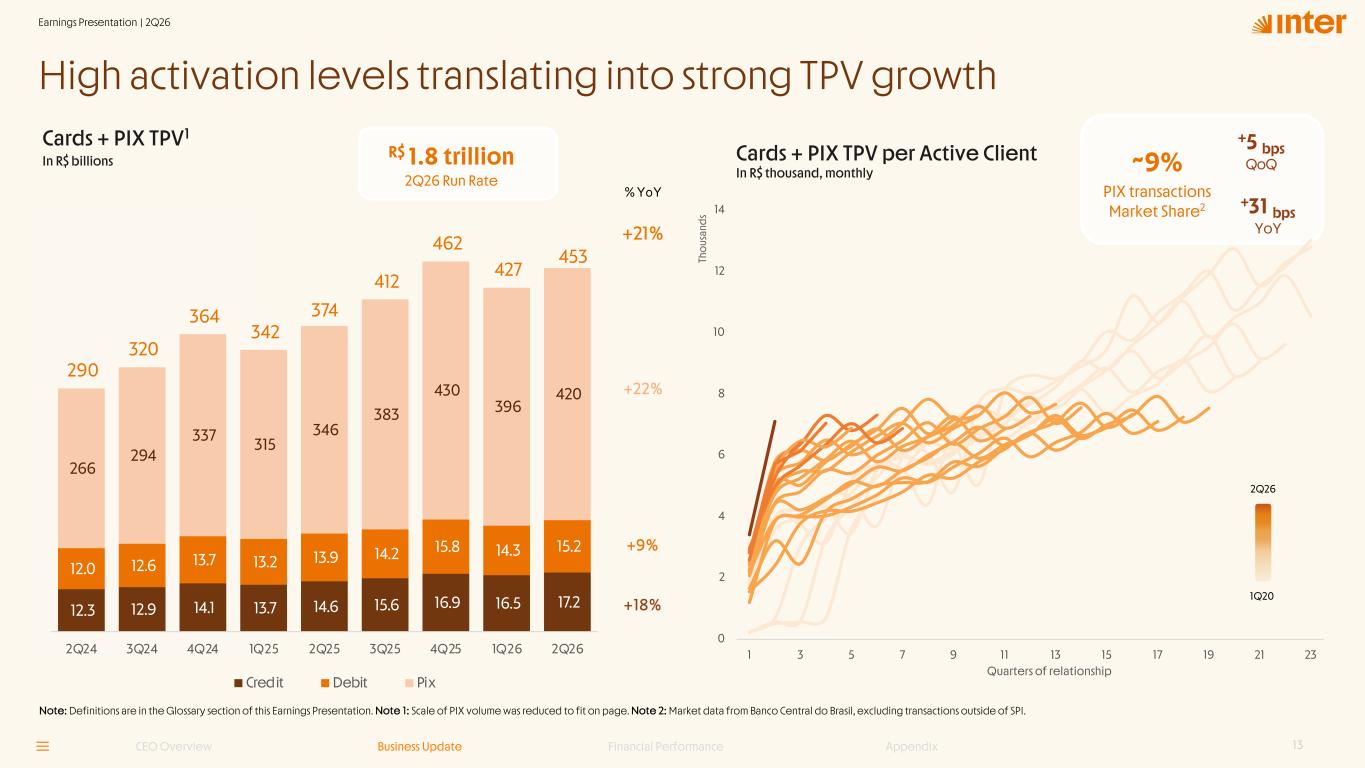
In 2Q26 we reached 26.4 million active clients with an activation rate of 58.3%, Over the past 12 months, we added 3.7 million new active clients to our platform. We adopted a more selective approach to increase the number of clients, maintaining high activation rates during the onboarding process, resulting in a more efficient journey and driving faster CAC payback with a focus on potential monetization and ARPAC increase. With an average of 22 million daily logins in 2Q26, up from 18 million in 2Q25, transaction volumes reached another record. We processed an average of 32 million financial transactions daily, compared with 26 million in June 2025. TPV growth continued to outpace client growth, with R$453 billion in transactions during 2Q26 across Pix, debit, and credit cards. Our focus on engagement has resulted in another market share increase in Pix transactions to approximately 9%, with a 26% growth YoY. Credit card TPV also demonstrated solid growth of 18% YoY, driven by the success of our value proposition across different card segments: Win, for wealthier clients; Prime, for middle-upper-income clients; and One, for retail. Our ability to deliver a consistent and superior client experience is also reflected in our industry-leading Net Promoter Score (NPS) of 88, which highlights both the satisfaction and loyalty of our client base. These results underscore the trust our clients place in Inter to meet their financial needs, further strengthening their engagement with our platform. We also achieved significant progress in quality metrics by the Central Bank, moving from 5th to 10th place in the claims ranking during 2Q26, driven by a remarkable 33% improvement in our index within just one quarter. Strategic Update Quarter Highlights Unit Economics Loan Porfolio Asset Quality Funding Capabilities Financial Performance Capital Ratio Appendix logins per day2 vs. 18.1mm in Jun/25 fin. transactions per day3 vs. 26mm in Jun/25 88 NPS1 Excellence zone 21.5mm 32mm 55.3% 55.9% 56.9% 57.2% 57.7% 57.9% 58.0% 58.6% 58.3% 18.4 19.5 20.6 21.6 22.7 23.9 25.0 25.8 26.4 33.3 34.9 36.1 37.7 39.3 41.3 43.1 44.0 45.3 1 .0 6 .0 1 1.0 1 6.0 2 1.0 2 6.0 3 1.0 3 6.0 4 1.0 2Q24 3Q24 4Q24 1Q25 2Q25 3Q25 4Q25 1Q26 2Q26 Active Clients Total Clients In millions Cards + Pix TPV4 In R$ billions Note: Definitions are in the Appendix section of this Earnings Release. Note 1: As June/2026. Note 2: The login volume used in this calculation was based on the average of total logins per day of June/26 and June/25. Note 3: June/26. Note 4: Scale of PIX volume was reduced to fit on page. 5 Unit Economics 12.3 12.9 14.1 13.7 14.6 15.6 16.9 16.5 17.2 12.0 12.6 13.7 13.2 13.9 14.2 15.8 14.3 15.2 266 294 337 315 346 383 430 396 420 290 320 364 342 374 412 462 427 453 - 2 0 .0 4 0 .0 6 0 .0 8 0 .0 1 0 .0 1 20 .0 2Q24 3Q24 4Q24 1Q25 2Q25 3Q25 4Q25 1Q26 2Q26
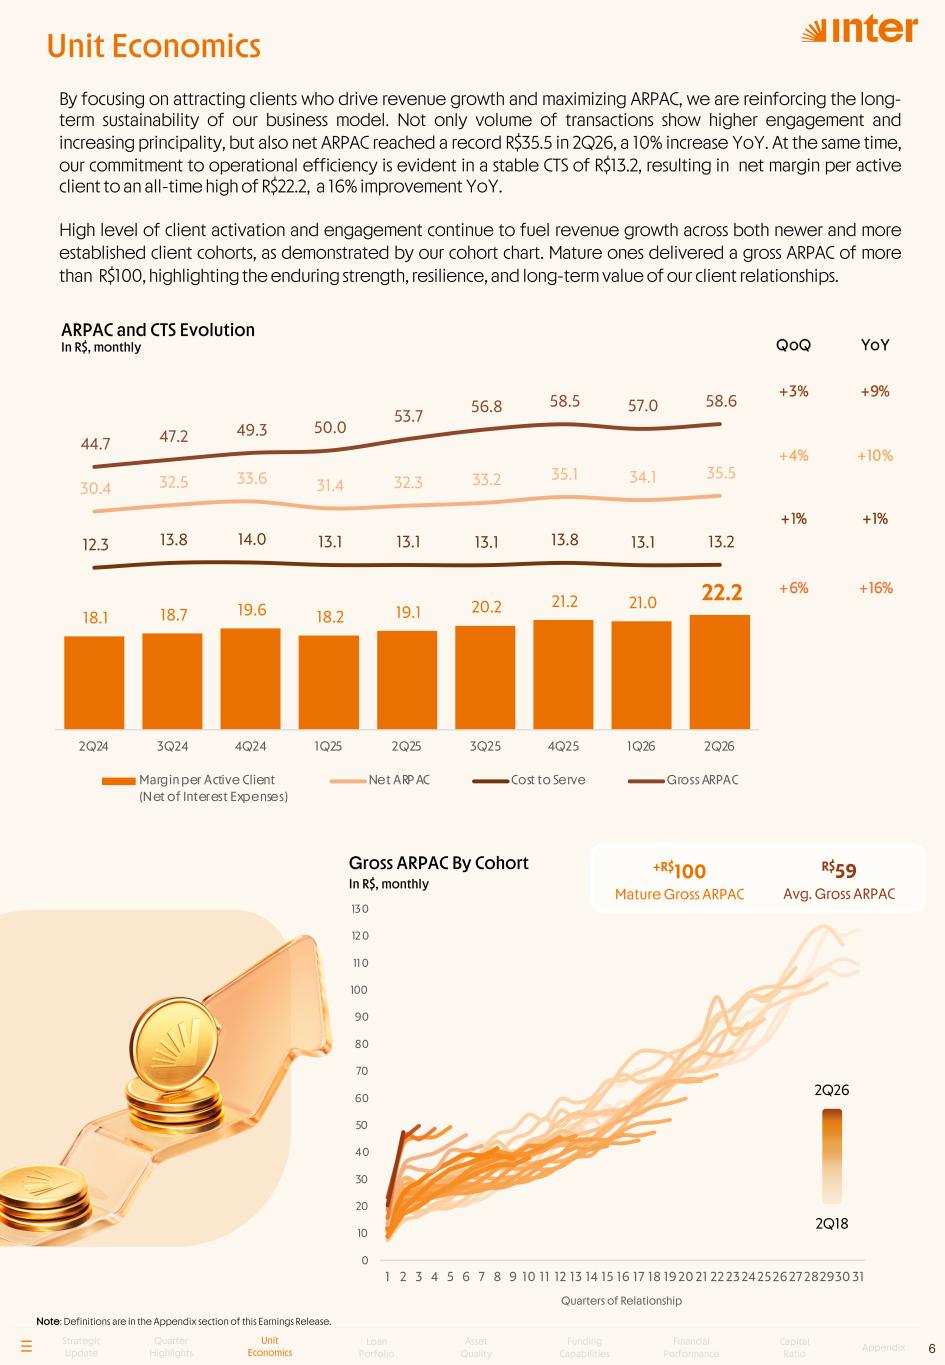
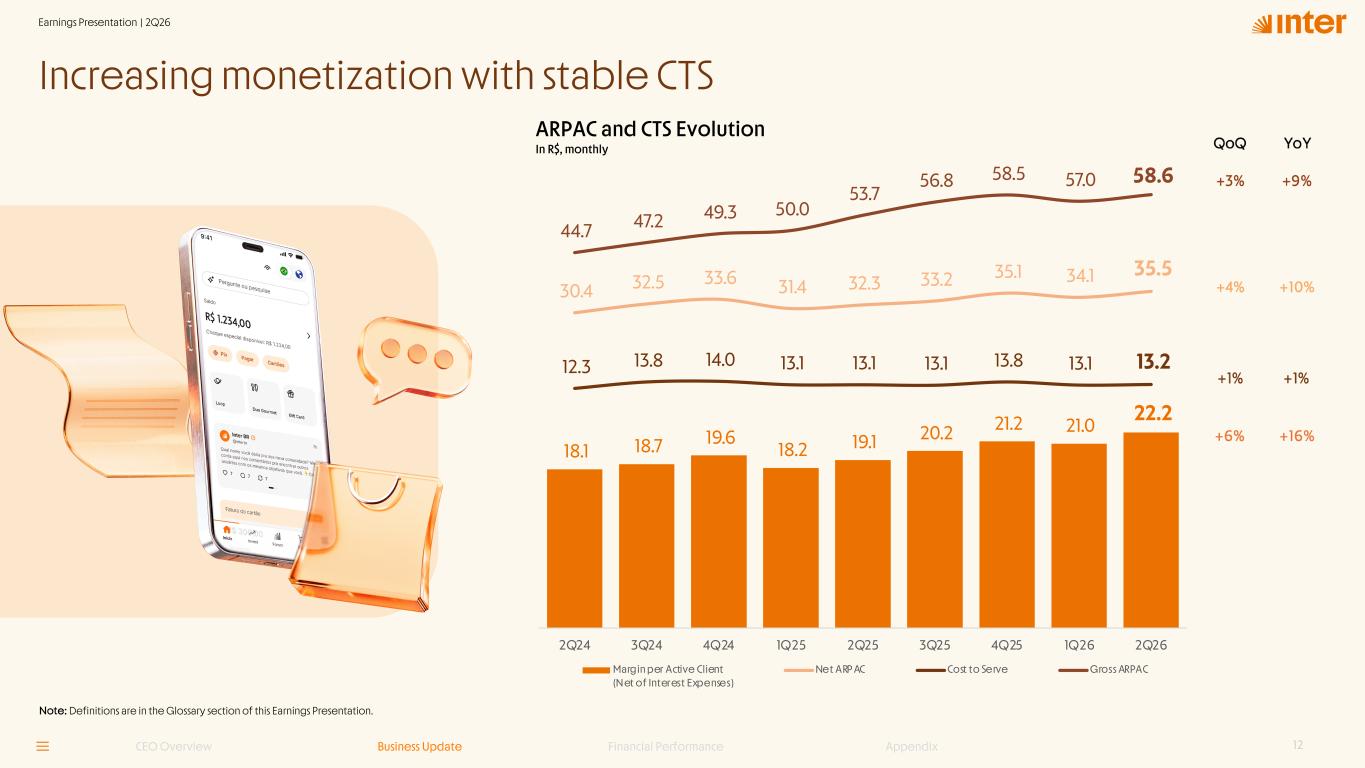
18.1 18.7 19.6 18.2 19.1 20.2 21.2 21.0 22.2 30.4 32.5 33.6 31.4 32.3 33.2 35.1 34.1 35.5 12.3 13.8 14.0 13.1 13.1 13.1 13.8 13.1 13.2 44.7 47.2 49.3 50.0 53.7 56.8 58.5 57.0 58.6 2Q24 3Q24 4Q24 1Q25 2Q25 3Q25 4Q25 1Q26 2Q26 Margin per Active Client (Net of Interest Expenses) Net ARP AC Cost to Serve Gross ARPAC ARPAC and CTS Evolution In R$, monthly Note: Definitions are in the Appendix section of this Earnings Release. Gross ARPAC By Cohort In R$, monthly Quarters of Relationship 6 By focusing on attracting clients who drive revenue growth and maximizing ARPAC, we are reinforcing the long- term sustainability of our business model. Not only volume of transactions show higher engagement and increasing principality, but also net ARPAC reached a record R$35.5 in 2Q26, a 10% increase YoY. At the same time, our commitment to operational efficiency is evident in a stable CTS of R$13.2, resulting in net margin per active client to an all-time high of R$22.2, a 16% improvement YoY. High level of client activation and engagement continue to fuel revenue growth across both newer and more established client cohorts, as demonstrated by our cohort chart. Mature ones delivered a gross ARPAC of more than R$100, highlighting the enduring strength, resilience, and long-term value of our client relationships. 2Q26 2Q18 Strategic Update Quarter Highlights Unit Economics Loan Porfolio Asset Quality Funding Capabilities Financial Performance Capital Ratio Appendix Unit Economics 0 10 20 30 40 50 60 70 80 90 100 110 12 0 13 0 1 2 3 4 5 6 7 8 9 10 11 12 13 14 15 16 17 18 19 20 21 22 23 24 25 26 27 282930 31 +R$100 Mature Gross ARPAC R$59 Avg. Gross ARPAC
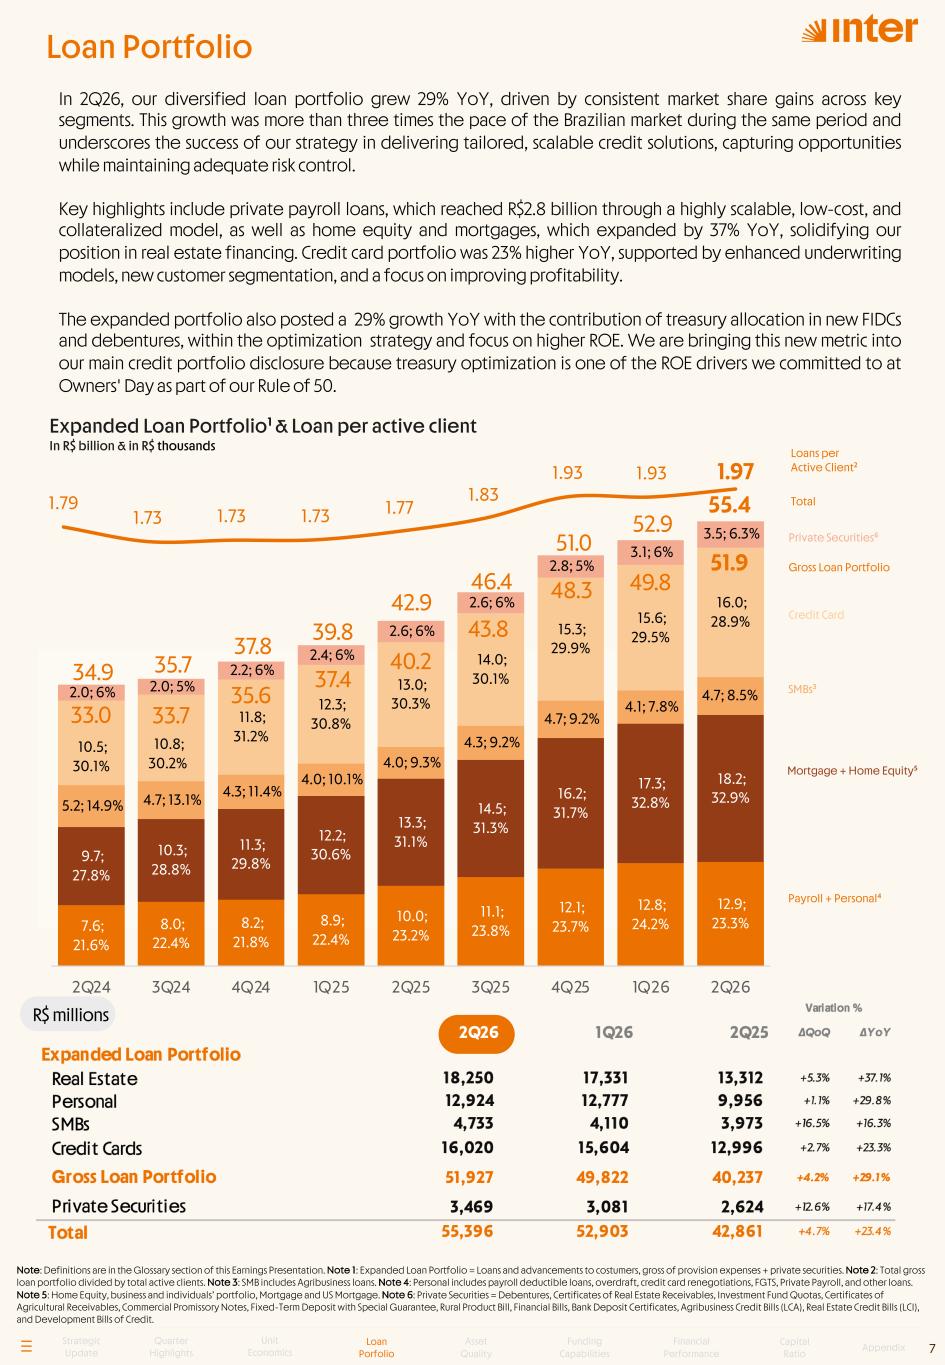
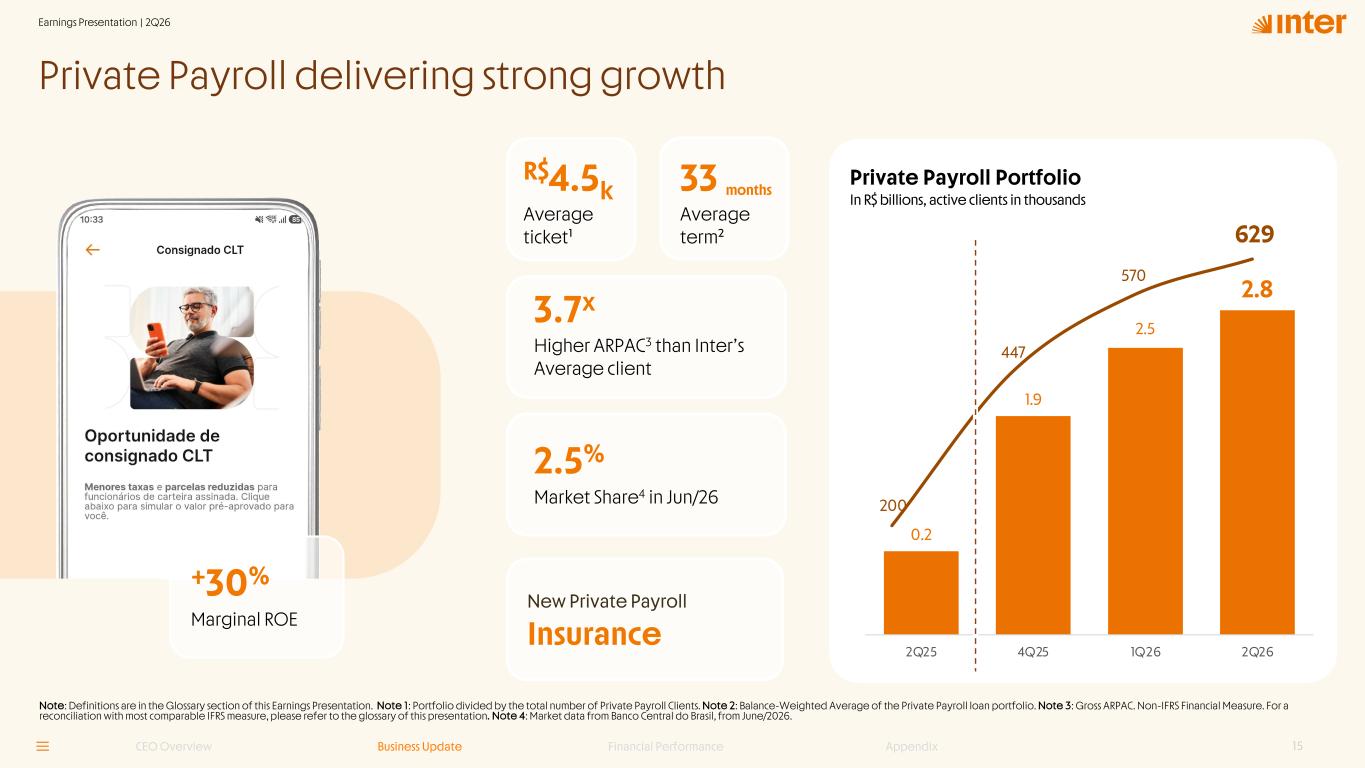
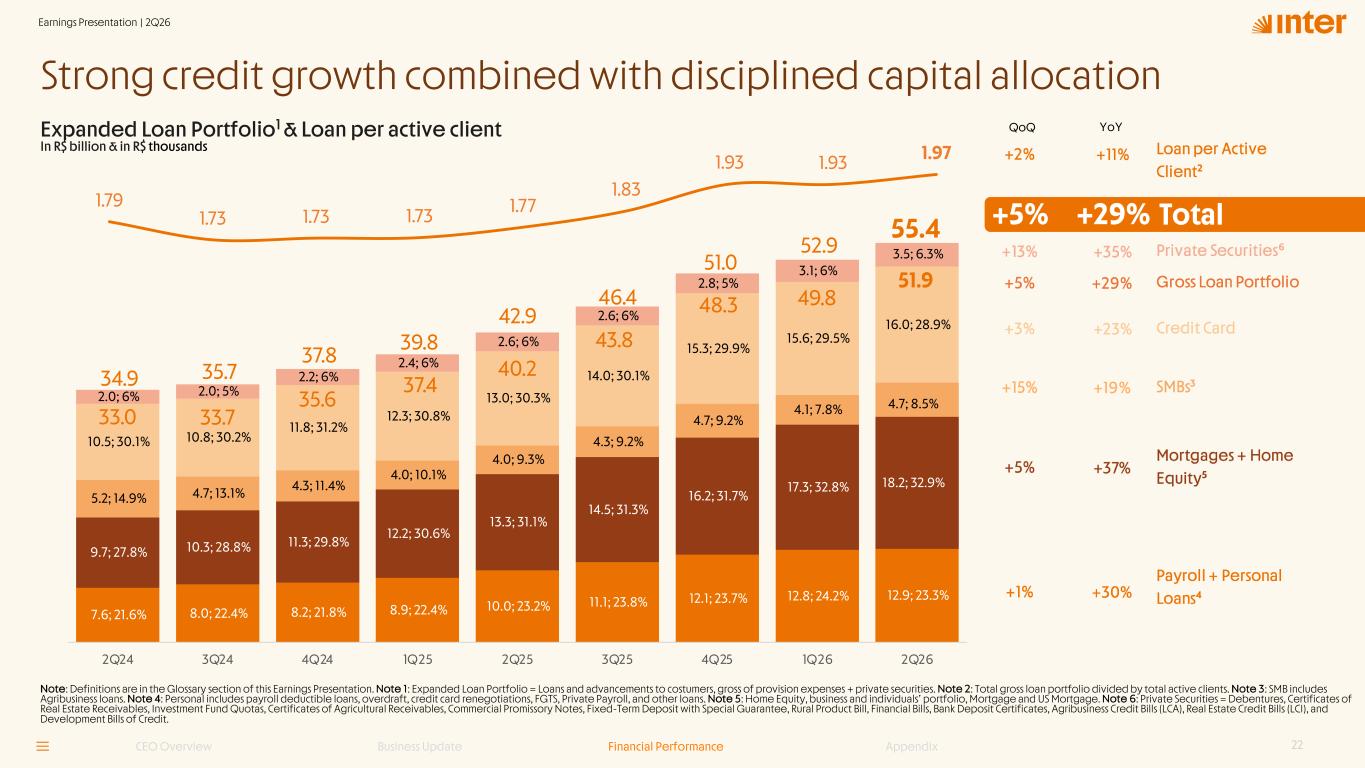
Payroll + Personal⁴ SMBs³ Credit Card Total R$ millions Loans per Active Client² 7 In 2Q26, our diversified loan portfolio grew 29% YoY, driven by consistent market share gains across key segments. This growth was more than three times the pace of the Brazilian market during the same period and underscores the success of our strategy in delivering tailored, scalable credit solutions, capturing opportunities while maintaining adequate risk control. Key highlights include private payroll loans, which reached R$2.8 billion through a highly scalable, low-cost, and collateralized model, as well as home equity and mortgages, which expanded by 37% YoY, solidifying our position in real estate financing. Credit card portfolio was 23% higher YoY, supported by enhanced underwriting models, new customer segmentation, and a focus on improving profitability. The expanded portfolio also posted a 29% growth YoY with the contribution of treasury allocation in new FIDCs and debentures, within the optimization strategy and focus on higher ROE. We are bringing this new metric into our main credit portfolio disclosure because treasury optimization is one of the ROE drivers we committed to at Owners' Day as part of our Rule of 50. Mortgage + Home Equity⁵ 1.79 1.73 1.73 1.73 1.77 1.83 1.93 1.93 1.97 1 .7 1 .7 1 .8 1 .8 1 .9 1 .9 2 .0 2 .0 Expanded Loan Portfolio¹ & Loan per active client In R$ billion & in R$ thousands Strategic Update Quarter Highlights Unit Economics Loan Porfolio Asset Quality Funding Capabilities Financial Performance Capital Ratio Appendix Loan Portfolio Gross Loan Portfolio Private Securities⁶ Note: Definitions are in the Glossary section of this Earnings Presentation. Note 1: Expanded Loan Portfolio = Loans and advancements to costumers, gross of provision expenses + private securities. Note 2: Total gross loan portfolio divided by total active clients. Note 3: SMB includes Agribusiness loans. Note 4: Personal includes payroll deductible loans, overdraft, credit card renegotiations, FGTS, Private Payroll, and other loans. Note 5: Home Equity, business and individuals’ portfolio, Mortgage and US Mortgage. Note 6: Private Securities = Debentures, Certificates of Real Estate Receivables, Investment Fund Quotas, Certificates of Agricultural Receivables, Commercial Promissory Notes, Fixed-Term Deposit with Special Guarantee, Rural Product Bill, Financial Bills, Bank Deposit Certificates, Agribusiness Credit Bills (LCA), Real Estate Credit Bills (LCI), and Development Bills of Credit. 7.6; 21.6% 8.0; 22.4% 8.2; 21.8% 8.9; 22.4% 10.0; 23.2% 11.1; 23.8% 12.1; 23.7% 12.8; 24.2% 12.9; 23.3% 9.7; 27.8% 10.3; 28.8% 11.3; 29.8% 12.2; 30.6% 13.3; 31.1% 14.5; 31.3% 16.2; 31.7% 17.3; 32.8% 18.2; 32.9% 5.2; 14.9% 4.7; 13.1% 4.3; 11.4% 4.0; 10.1% 4.0; 9.3% 4.3; 9.2% 4.7; 9.2% 4.1; 7.8% 4.7; 8.5% 10.5; 30.1% 10.8; 30.2% 11.8; 31.2% 12.3; 30.8% 13.0; 30.3% 14.0; 30.1% 15.3; 29.9% 15.6; 29.5% 16.0; 28.9% 33.0 33.7 35.6 37.4 40.2 43.8 48.3 49.8 51.9 34.9 35.7 37.8 39.8 42.9 46.4 51.0 52.9 55.4 2.0; 6% 2.0; 5% 2.2; 6% 2.4; 6% 2.6; 6% 2.6; 6% 2.8; 5% 3.1; 6% 3.5; 6.3% - 1 0. 0 2 0 .0 0 3 0 .0 0 4 0 .0 0 5 0 .0 0 2Q24 3Q24 4Q24 1Q25 2Q25 3Q25 4Q25 1Q26 2Q26
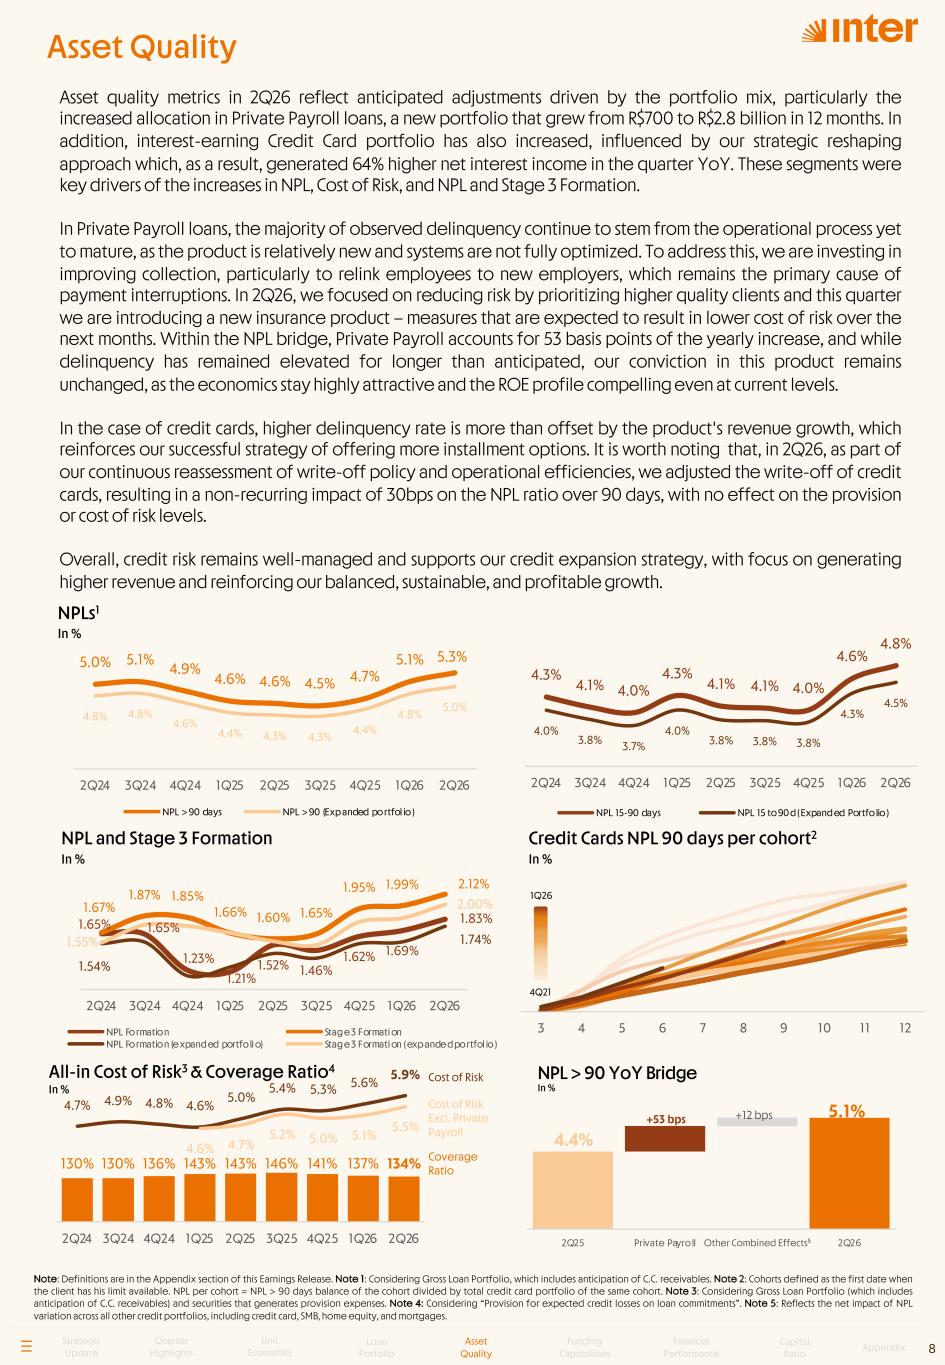
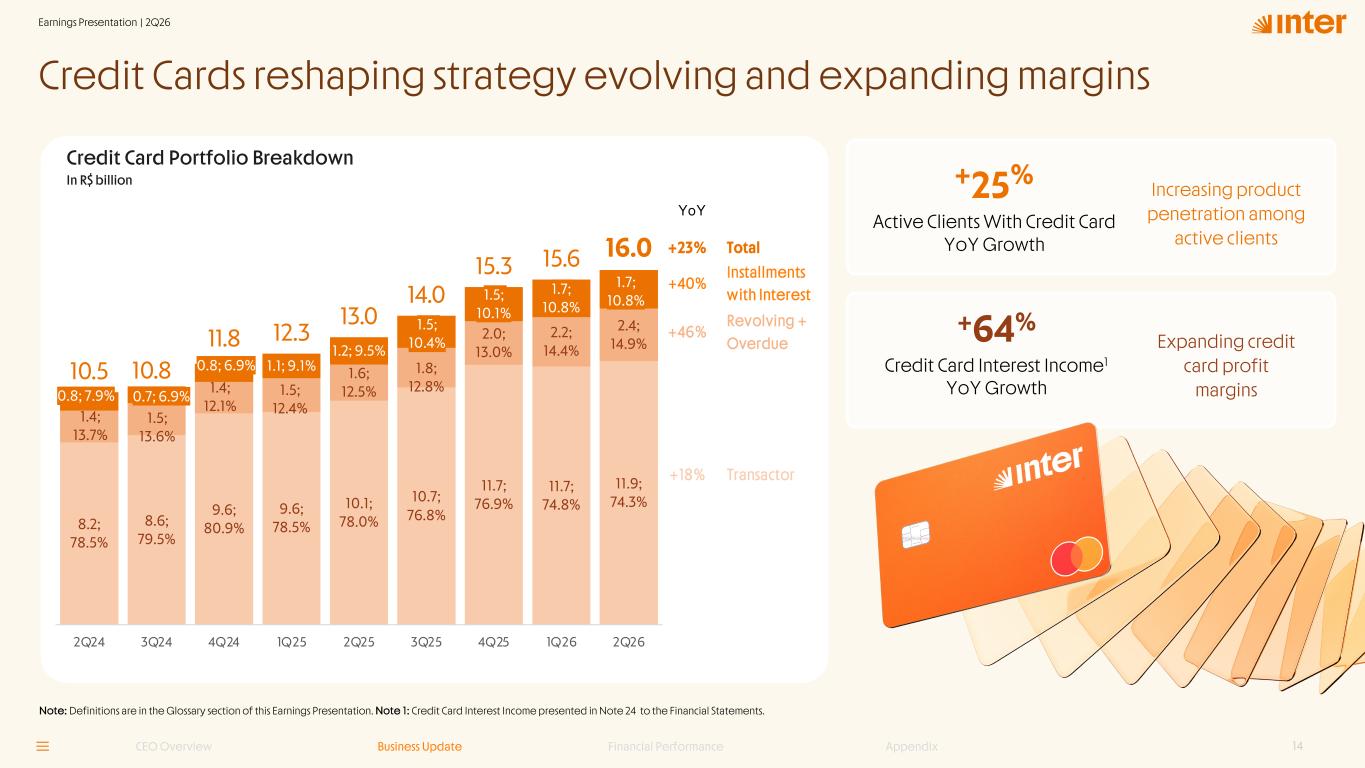
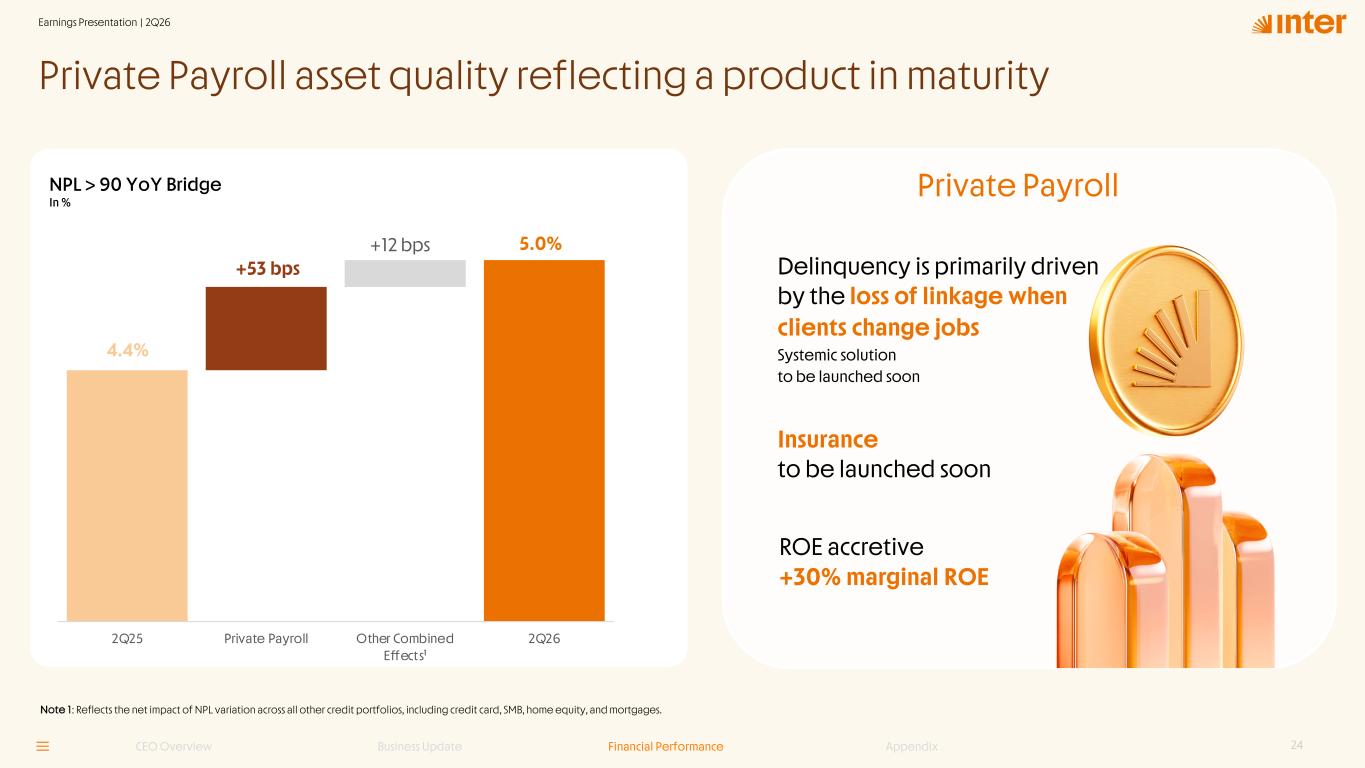
Asset quality metrics in 2Q26 reflect anticipated adjustments driven by the portfolio mix, particularly the increased allocation in Private Payroll loans, a new portfolio that grew from R$700 to R$2.8 billion in 12 months. In addition, interest-earning Credit Card portfolio has also increased, influenced by our strategic reshaping approach which, as a result, generated 64% higher net interest income in the quarter YoY. These segments were key drivers of the increases in NPL, Cost of Risk, and NPL and Stage 3 Formation. In Private Payroll loans, the majority of observed delinquency continue to stem from the operational process yet to mature, as the product is relatively new and systems are not fully optimized. To address this, we are investing in improving collection, particularly to relink employees to new employers, which remains the primary cause of payment interruptions. In 2Q26, we focused on reducing risk by prioritizing higher quality clients and this quarter we are introducing a new insurance product — measures that are expected to result in lower cost of risk over the next months. Within the NPL bridge, Private Payroll accounts for 53 basis points of the yearly increase, and while delinquency has remained elevated for longer than anticipated, our conviction in this product remains unchanged, as the economics stay highly attractive and the ROE profile compelling even at current levels. In the case of credit cards, higher delinquency rate is more than offset by the product's revenue growth, which reinforces our successful strategy of offering more installment options. It is worth noting that, in 2Q26, as part of our continuous reassessment of write-off policy and operational efficiencies, we adjusted the write-off of credit cards, resulting in a non-recurring impact of 30bps on the NPL ratio over 90 days, with no effect on the provision or cost of risk levels. Overall, credit risk remains well-managed and supports our credit expansion strategy, with focus on generating higher revenue and reinforcing our balanced, sustainable, and profitable growth. NPLs1 In % Note: Definitions are in the Appendix section of this Earnings Release. Note 1: Considering Gross Loan Portfolio, which includes anticipation of C.C. receivables. Note 2: Cohorts defined as the first date when the client has his limit available. NPL per cohort = NPL > 90 days balance of the cohort divided by total credit card portfolio of the same cohort. Note 3: Considering Gross Loan Portfolio (which includes anticipation of C.C. receivables) and securities that generates provision expenses. Note 4: Considering “Provision for expected credit losses on loan commitments”. Note 5: Reflects the net impact of NPL variation across all other credit portfolios, including credit card, SMB, home equity, and mortgages. Credit Cards NPL 90 days per cohort2 In % NPL and Stage 3 Formation In % 8 130% 130% 136% 143% 143% 146% 141% 137% 134% 0 .0 % 2 0. 0% 4 0. 0% 6 0. 0% 8 0. 0% 10 0 .0 % 12 0 .0 % 14 0 .0 % 16 0 .0 % 18 0 .0 % 2 0 .0 % 2Q24 3Q24 4Q24 1Q25 2Q25 3Q25 4Q25 1Q26 2Q26 All-in Cost of Risk3 & Coverage Ratio4 In % 1Q26 4Q21 Strategic Update Quarter Highlights Unit Economics Loan Porfolio Asset Quality Funding Capabilities Financial Performance Capital Ratio Appendix 4.7% 4.9% 4.8% 4.6% 5.0% 5.4% 5.3% 5.6% 5.9% 4.6% 4.7% 5.2% 5.0% 5.1% 5.5% 0 .0 % 1. 0% 2 .0 % 3 . 4 .0 % 5 .0 % 6 .0 % Cost of Risk Cost of Risk Excl. Private Payroll Coverage Ratio Asset Quality 3 4 5 6 7 8 9 10 11 12 1.65% 1.65% 1.23% 1.21% 1.52% 1.46% 1.62% 1.69% 1.83% 1.67% 1.87% 1.85% 1.66% 1.60% 1.65% 1.95% 1.99% 2.12% 1.54% 1.74%1.55% 2.00% 1. 0% 1. 2% 1. 4% 1. 6% 1. 8% 2 .0 % 2 .2 % 2 .4 % 2Q24 3Q24 4Q24 1Q25 2Q25 3Q25 4Q25 1Q26 2Q26 NPL Fo rmatio n Stag e 3 Formati on NPL Fo rmatio n (e xpanded portfo li o) Stag e 3 Formati on (exp ande d portfol io) 3 .0% 3 .5% 4 .0% 4 .5% 5 .0% 5 .5% 6 .0% 2Q25 Private Payro ll Other Combined Effects⁵ 2Q26 4.4% 5.1%+12 bps+53 bps NPL > 90 YoY Bridge In % 5.0% 5.1% 4.9% 4.6% 4.6% 4.5% 4.7% 5.1% 5.3% 4.8% 4.8% 4.6% 4.4% 4.3% 4.3% 4.4% 4.8% 5.0% 3 .0 % 3 .5 % 4 .0 % 4 .5 % 5 .0 % 5 .5 % 6 .0 % 6 .5 % 7 .0 % 2Q24 3Q24 4Q24 1Q25 2Q25 3Q25 4Q25 1Q26 2Q26 NPL > 90 days NPL > 90 (Exp anded po rtfol io ) 4.3% 4.1% 4.0% 4.3% 4.1% 4.1% 4.0% 4.6% 4.8% 4.0% 3.8% 3.7% 4.0% 3.8% 3.8% 3.8% 4.3% 4.5% 3 .0 % 3 .5 % 4 .0 % 4 .5 % 5 .0 % 5 .5 % 6 .0 % 6 .5 % 7 .0 % 2Q24 3Q24 4Q24 1Q25 2Q25 3Q25 4Q25 1Q26 2Q26 NPL 15-90 days NPL 15 to 90 d (Expanded Portfo lio )
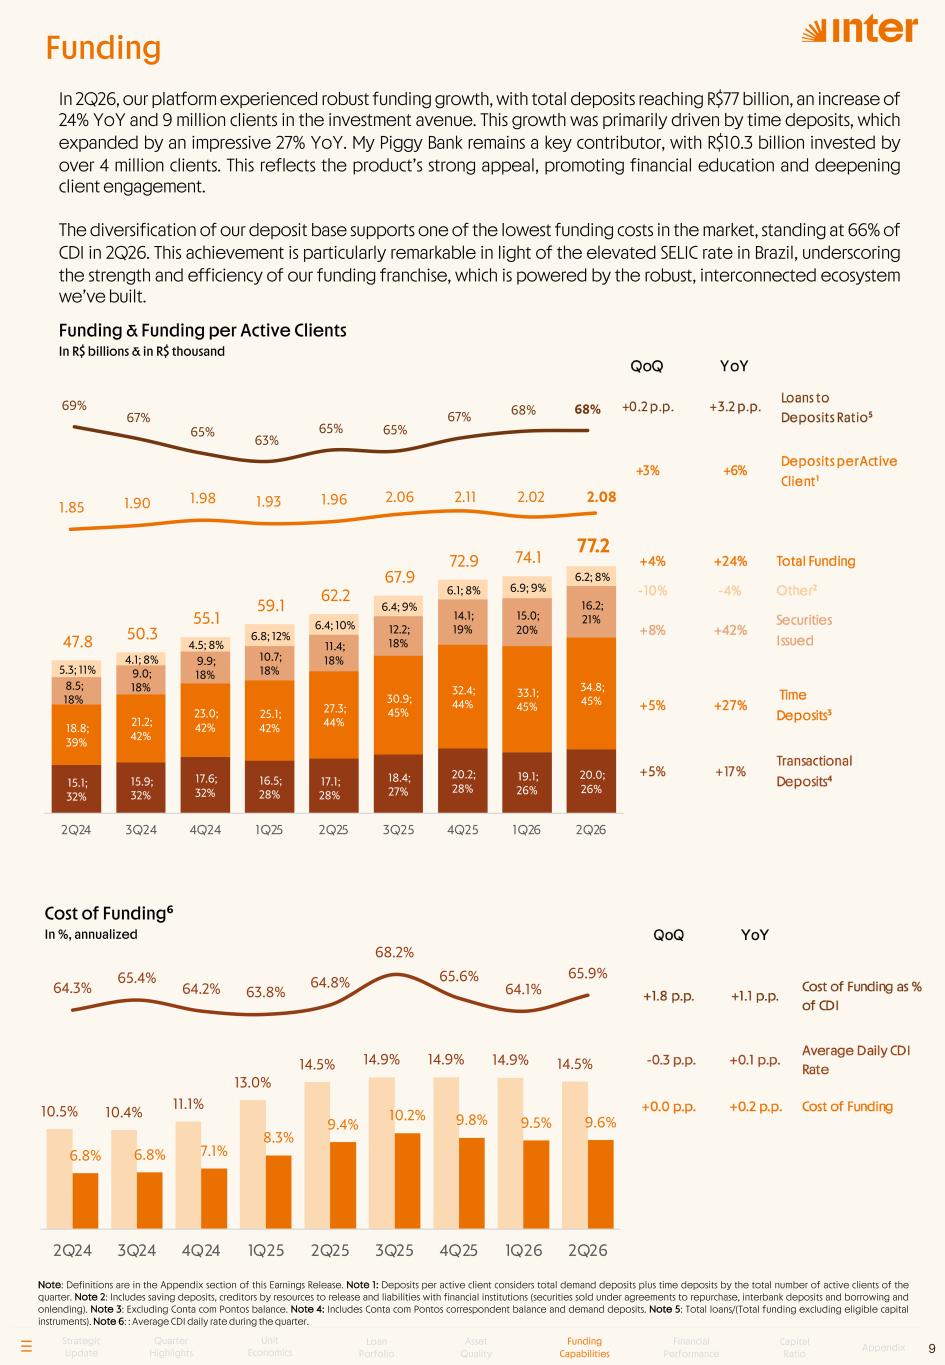
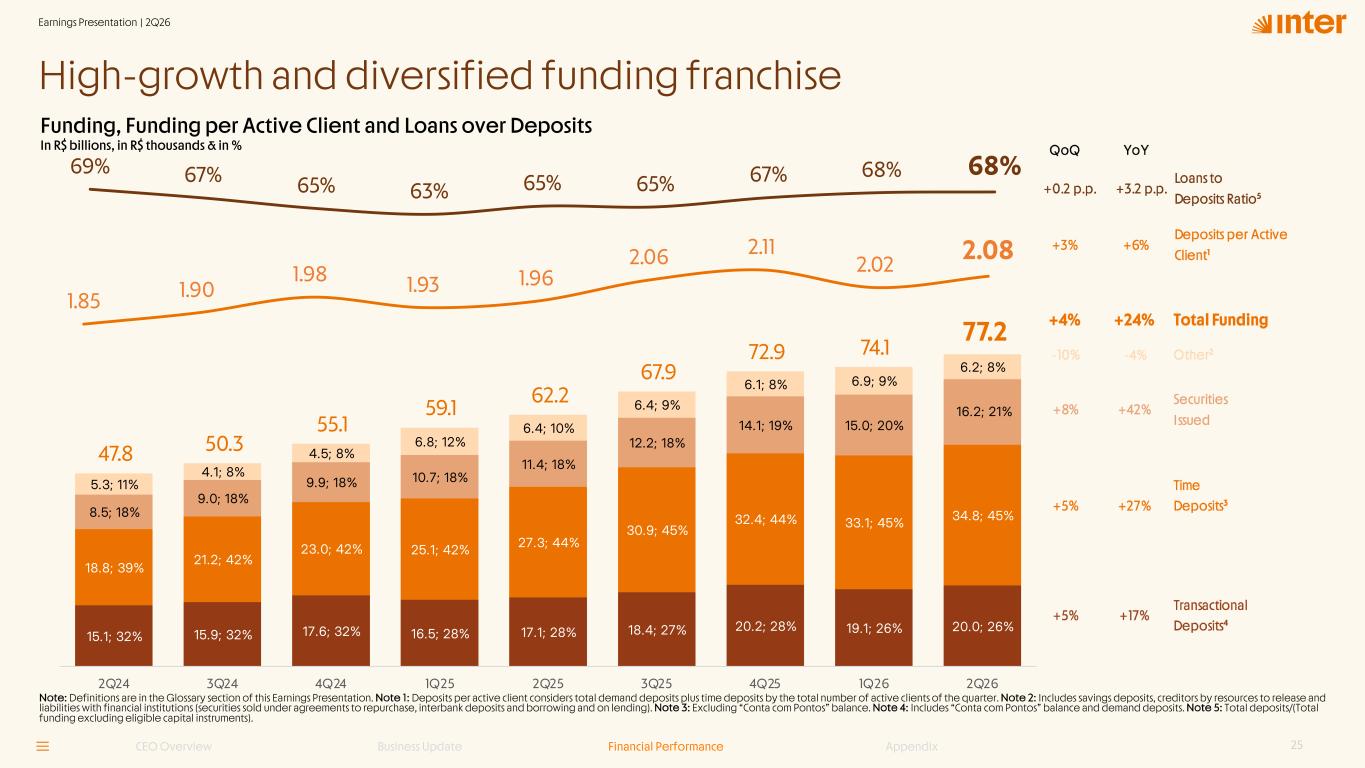
Note: Definitions are in the Appendix section of this Earnings Release. Note 1: Deposits per active client considers total demand deposits plus time deposits by the total number of active clients of the quarter. Note 2: Includes saving deposits, creditors by resources to release and liabilities with financial institutions (securities sold under agreements to repurchase, interbank deposits and borrowing and onlending). Note 3: Excluding Conta com Pontos balance. Note 4: Includes Conta com Pontos correspondent balance and demand deposits. Note 5: Total loans/(Total funding excluding eligible capital instruments). Note 6: : Average CDI daily rate during the quarter. Cost of Funding⁶ In %, annualized 9 15.1; 32% 15.9; 32% 17.6; 32% 16.5; 28% 17.1; 28% 18.4; 27% 20.2; 28% 19.1; 26% 20.0; 26% 18.8; 39% 21.2; 42% 23.0; 42% 25.1; 42% 27.3; 44% 30.9; 45% 32.4; 44% 33.1; 45% 34.8; 45% 8.5; 18% 9.0; 18% 9.9; 18% 10.7; 18% 11.4; 18% 12.2; 18% 14.1; 19% 15.0; 20% 16.2; 21% 5.3; 11% 4.1; 8% 4.5; 8% 6.8; 12% 6.4; 10% 6.4; 9% 6.1; 8% 6.9; 9% 6.2; 8% 47.8 50.3 55.1 59.1 62.2 67.9 72.9 74.1 77.2 2Q24 3Q24 4Q24 1Q25 2Q25 3Q25 4Q25 1Q26 2Q26 Funding & Funding per Active Clients In R$ billions & in R$ thousand In 2Q26, our platform experienced robust funding growth, with total deposits reaching R$77 billion, an increase of 24% YoY and 9 million clients in the investment avenue. This growth was primarily driven by time deposits, which expanded by an impressive 27% YoY. My Piggy Bank remains a key contributor, with R$10.3 billion invested by over 4 million clients. This reflects the product’s strong appeal, promoting financial education and deepening client engagement. The diversification of our deposit base supports one of the lowest funding costs in the market, standing at 66% of CDI in 2Q26. This achievement is particularly remarkable in light of the elevated SELIC rate in Brazil, underscoring the strength and efficiency of our funding franchise, which is powered by the robust, interconnected ecosystem we’ve built. 1.85 1.90 1.98 1.93 1.96 2.06 2.11 2.02 2.08 1 .70 1 .80 1 .90 2 .0 2 .10 2 .20 Strategic Update Quarter Highlights Unit Economics Loan Porfolio Asset Quality Funding Capabilities Financial Performance Capital Ratio Appendix Funding 10.5% 10.4% 11.1% 13.0% 14.5% 14.9% 14.9% 14.9% 14.5% 6.8% 6.8% 7.1% 8.3% 9.4% 10.2% 9.8% 9.5% 9.6% 64.3% 65.4% 64.2% 63.8% 64.8% 68.2% 65.6% 64.1% 65.9% 2.0% 7.0% 12.0% 17.0% 22.0 % 2Q24 3Q24 4Q24 1Q25 2Q25 3Q25 4Q25 1Q26 2Q26 LFs issued in the quarter and in July 69% 67% 65% 63% 65% 65% 67% 68% 68% 6 0% 6 5% 7 0% 7 5% 8 0%

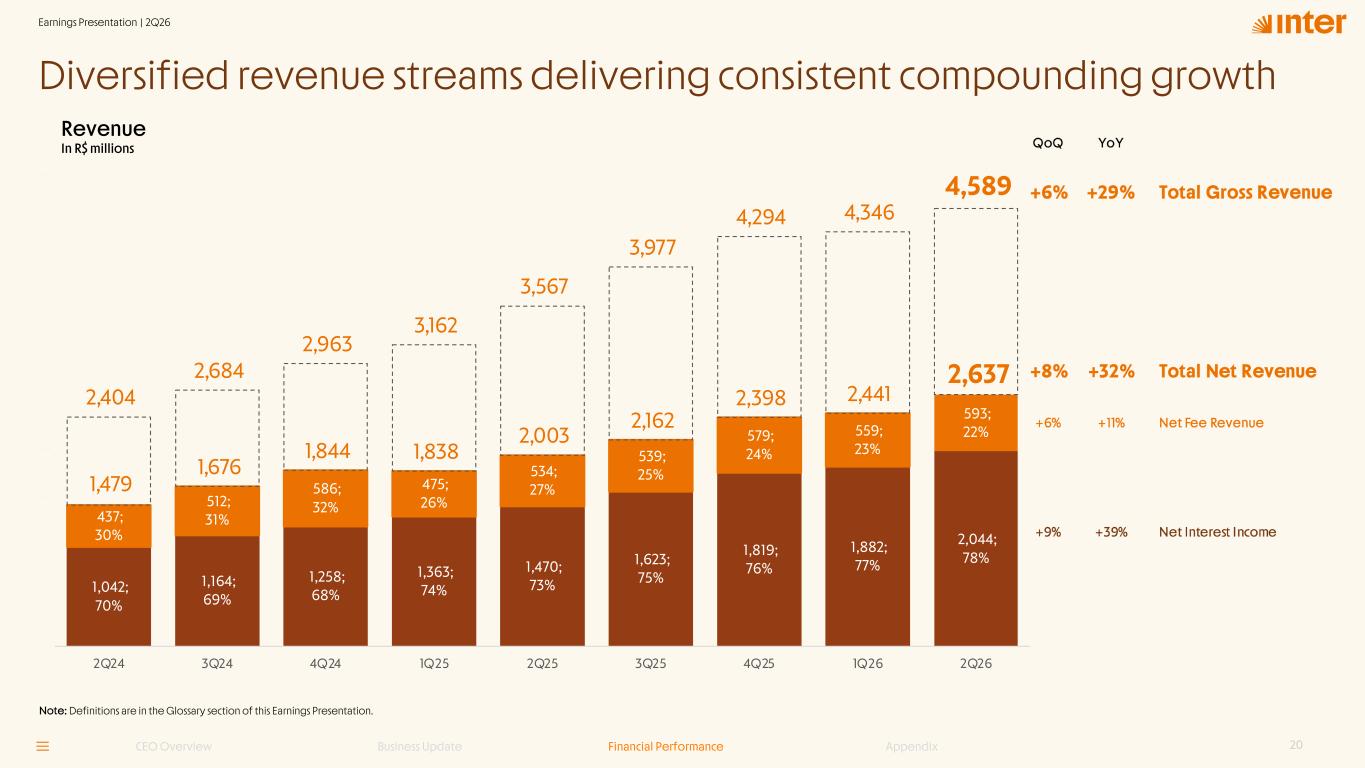
R$ millions Note: Definitions are in the Appendix section of this Earnings Release. 10 Our diversified revenue mix continues to drive solid growth. In 2Q26, we achieved gross revenues of R$4.6 billion and net revenues of R$2.6 billion, reflecting YoY growth of 29% and 32%, respectively. Net interest income 39% YoY growth was supported by the evolution of our credit portfolio and NIM. This was driven by the strong expansion of Private Payroll loans and higher Credit Card interest earnings, following our ongoing reshaping strategy. In addition, net fee income grew 11% YoY, led by interchange revenues, insurance fees, among other sources, which grew in line with the expansion of our client base. Revenue In R$ millions Strategic Update Quarter Highlights Unit Economics Loan Porfolio Asset Quality Funding Capabilities Financial Performance Capital Ratio Appendix Financial Performance 1,042; 70% 1,164; 69% 1,258; 68% 1,363; 74% 1,470; 73% 1,623; 75% 1,819; 76% 1,882; 77% 2,044; 78% 437; 30% 512; 31% 586; 32% 475; 26% 534; 27% 539; 25% 579; 24% 559; 23% 593; 22% 1,479 1,676 1,844 1,838 2,003 2,162 2,398 2,441 2,637 2,404 2,684 2,963 3,162 3,567 3,977 4,294 4,346 4,589 - 5 00 1, 00 0 1, 50 0 2 ,0 00 2 ,50 0 3 ,0 00 3 ,50 0 4 ,0 00 4 ,5 00 5 ,0 00 2Q24 3Q24 4Q24 1Q25 2Q25 3Q25 4Q25 1Q26 2Q26
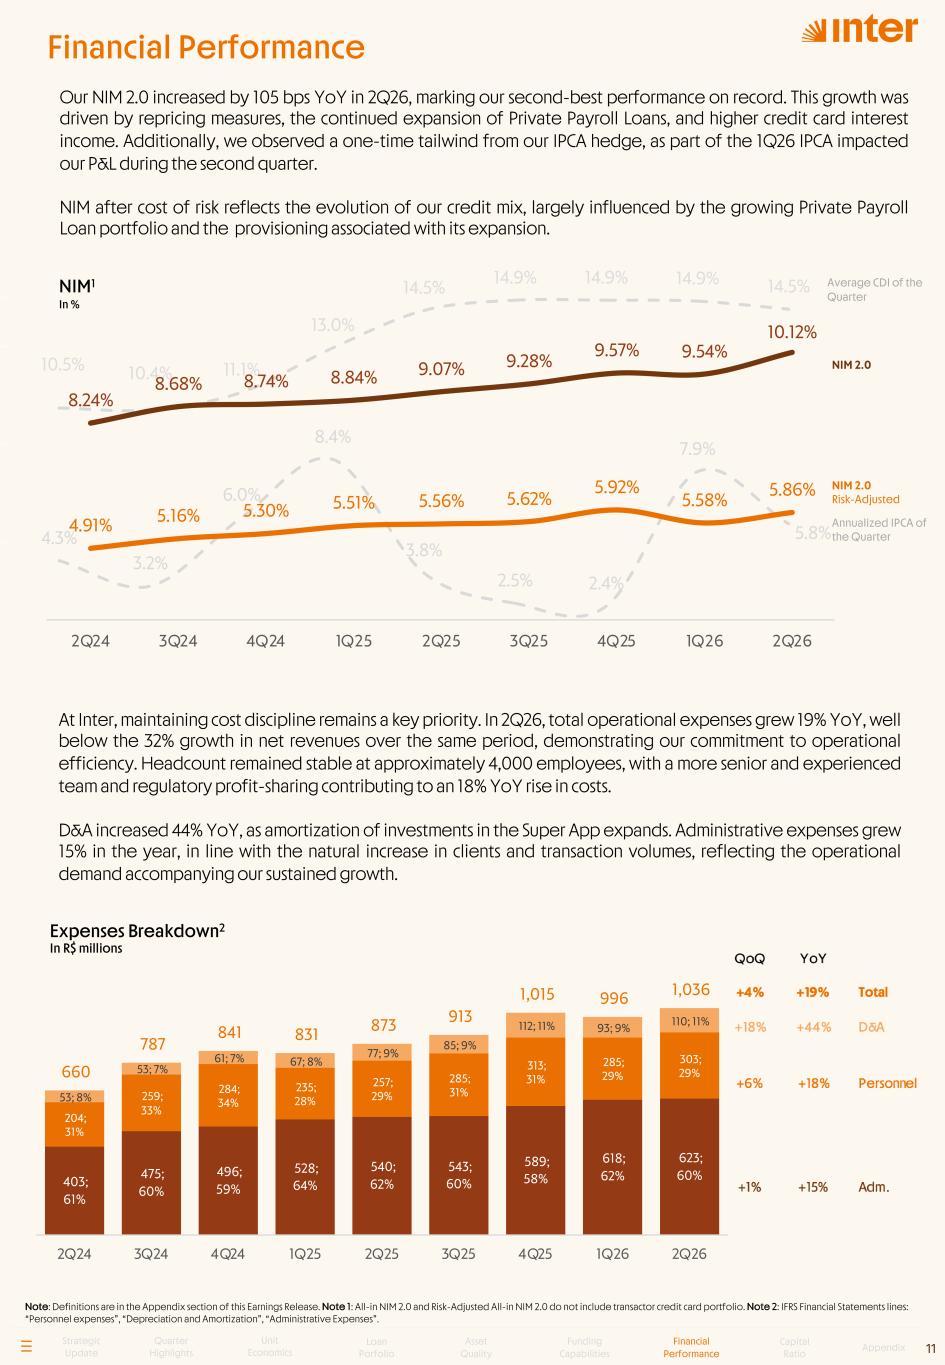
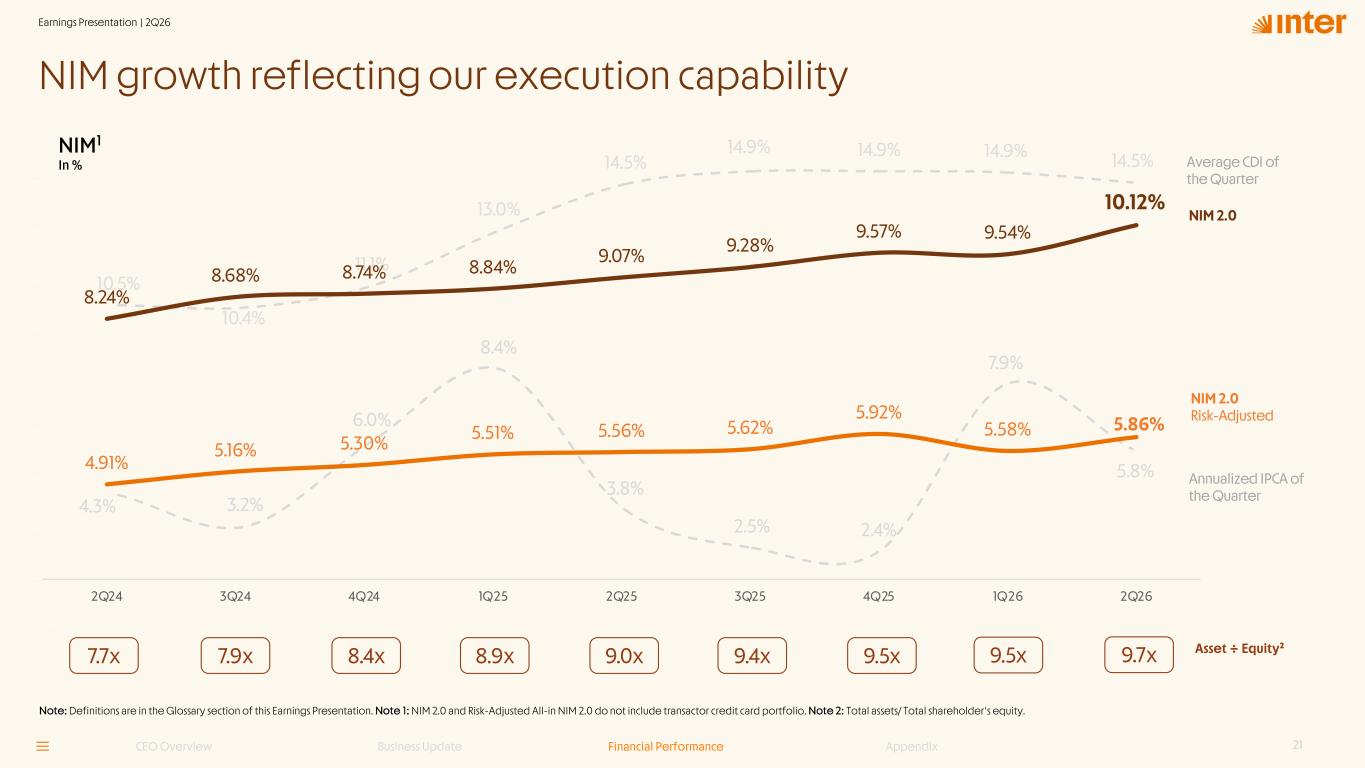
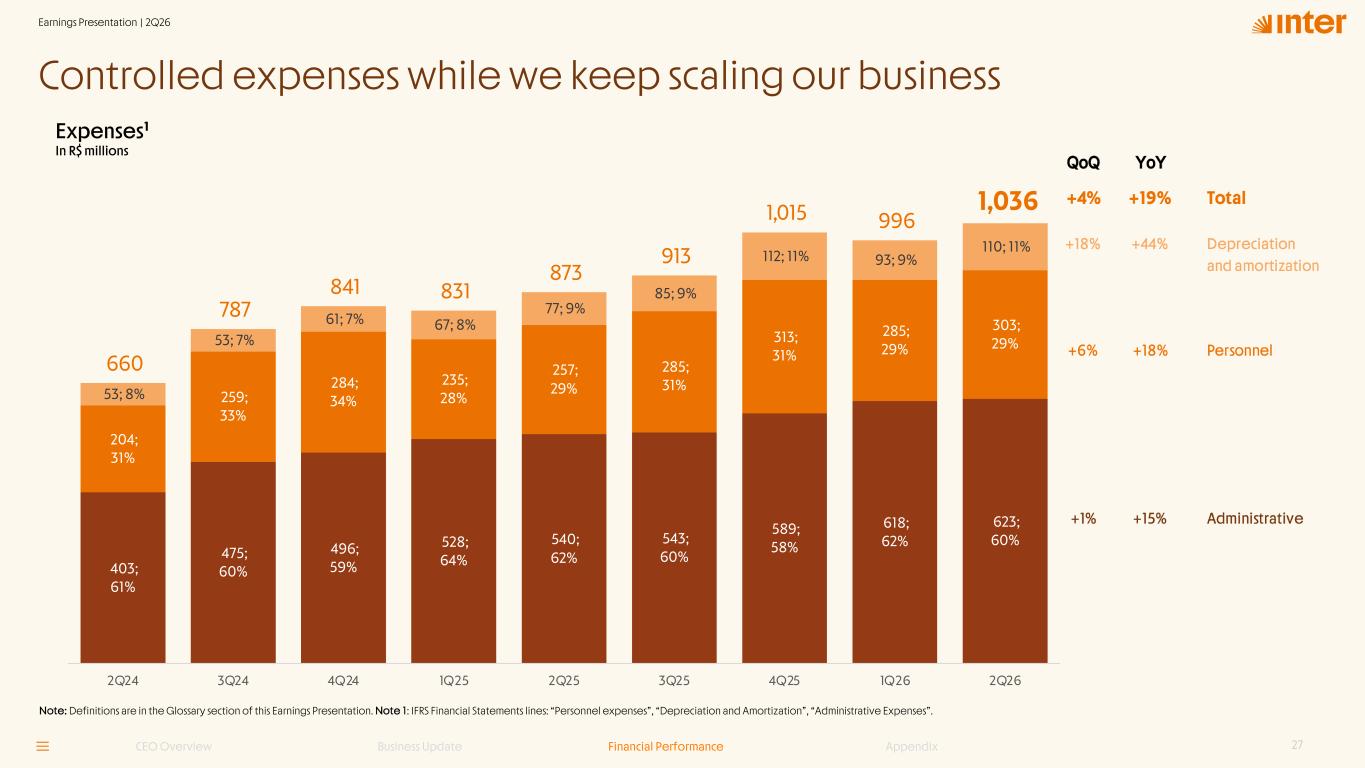
10.5% 10.4% 11.1% 13.0% 14.5% 14.9% 14.9% 14.9% 14.5% 4.3% 3.2% 6.0% 8.4% 3.8% 2.5% 2.4% 7.9% 5.8% 1.0 % 3. 0% 5. 0% 7. 0% 9. 0% 11.0 % 13. 0% 15. 0% Financial Performance Note: Definitions are in the Appendix section of this Earnings Release. Note 1: All-in NIM 2.0 and Risk-Adjusted All-in NIM 2.0 do not include transactor credit card portfolio. Note 2: IFRS Financial Statements lines: “Personnel expenses”, “Depreciation and Amortization”, “Administrative Expenses”. 11 Strategic Update Quarter Highlights Unit Economics Loan Porfolio Asset Quality Funding Capabilities Financial Performance Capital Ratio Appendix Our NIM 2.0 increased by 105 bps YoY in 2Q26, marking our second-best performance on record. This growth was driven by repricing measures, the continued expansion of Private Payroll Loans, and higher credit card interest income. Additionally, we observed a one-time tailwind from our IPCA hedge, as part of the 1Q26 IPCA impacted our P&L during the second quarter. NIM after cost of risk reflects the evolution of our credit mix, largely influenced by the growing Private Payroll Loan portfolio and the provisioning associated with its expansion. NIM1 In % 8.24% 8.68% 8.74% 8.84% 9.07% 9.28% 9.57% 9.54% 10.12% 4.91% 5.16% 5.30% 5.51% 5.56% 5.62% 5.92% 5.58% 5.86% 3 .0 0% 4 .0 0% 5 .0 0% 6 .0 0% 7 .0 0% 8 .0 0% 9 .0 0% 10 .0 0 % 1 .0 0 % 2Q24 3Q24 4Q24 1Q25 2Q25 3Q25 4Q25 1Q26 2Q26 NIM 2.0 NIM 2.0 Risk-Adjusted Average CDI of the Quarter Annualized IPCA of the Quarter At Inter, maintaining cost discipline remains a key priority. In 2Q26, total operational expenses grew 19% YoY, well below the 32% growth in net revenues over the same period, demonstrating our commitment to operational efficiency. Headcount remained stable at approximately 4,000 employees, with a more senior and experienced team and regulatory profit-sharing contributing to an 18% YoY rise in costs. D&A increased 44% YoY, as amortization of investments in the Super App expands. Administrative expenses grew 15% in the year, in line with the natural increase in clients and transaction volumes, reflecting the operational demand accompanying our sustained growth. 403; 61% 475; 60% 496; 59% 528; 64% 540; 62% 543; 60% 589; 58% 618; 62% 623; 60% 204; 31% 259; 33% 284; 34% 235; 28% 257; 29% 285; 31% 313; 31% 285; 29% 303; 29% 53; 8% 53; 7% 61; 7% 67; 8% 77; 9% 85; 9% 112; 11% 93; 9% 110; 11% 660 787 841 831 873 913 1,015 996 1,036 - 2 0 0 4 0 0 6 0 0 8 0 0 1 ,0 0 1 ,2 0 2Q24 3Q24 4Q24 1Q25 2Q25 3Q25 4Q25 1Q26 2Q26 Expenses Breakdown2 In R$ millions
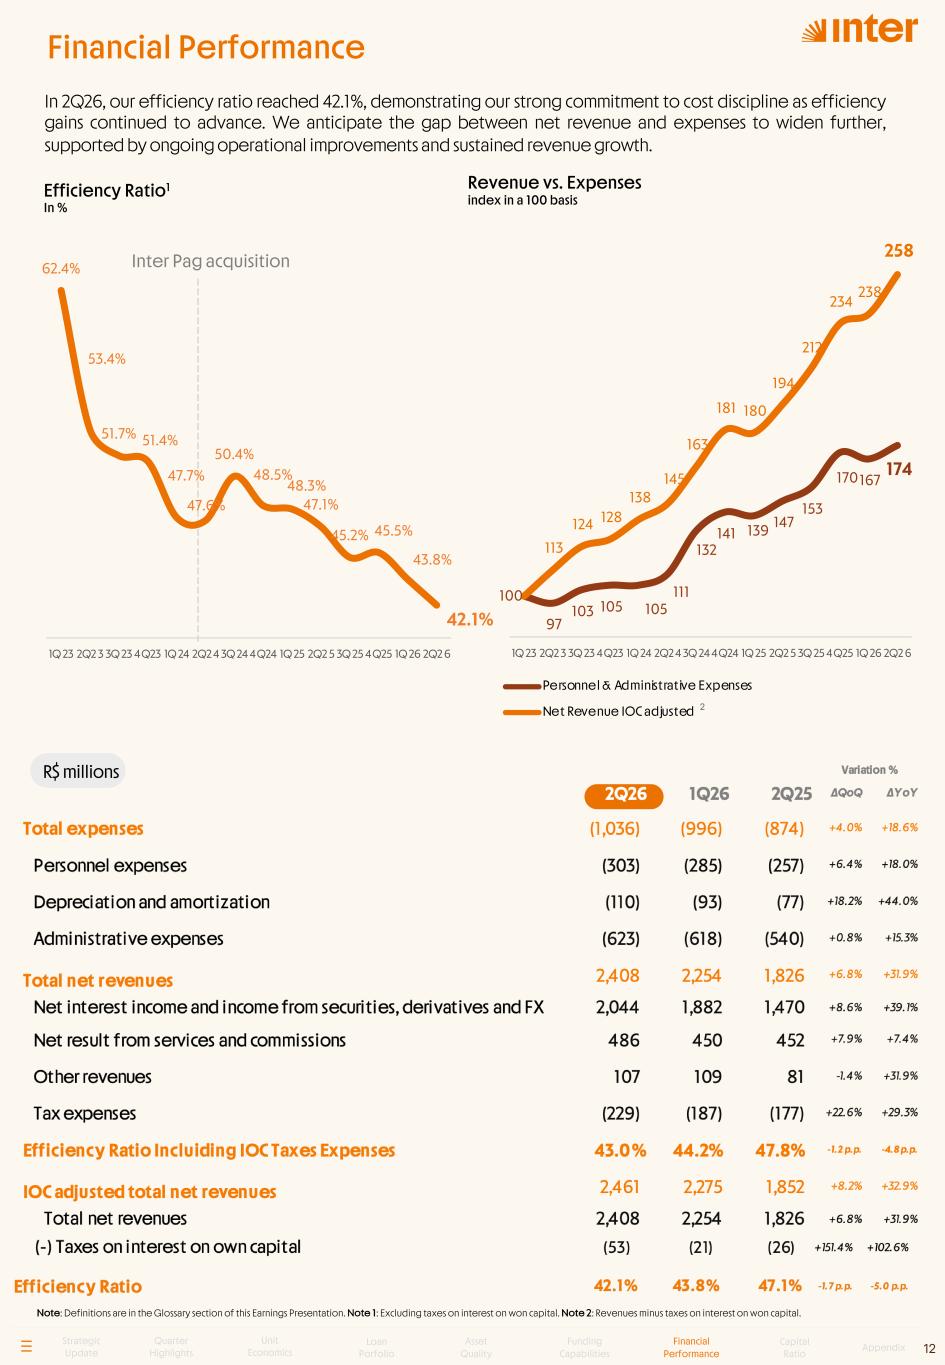
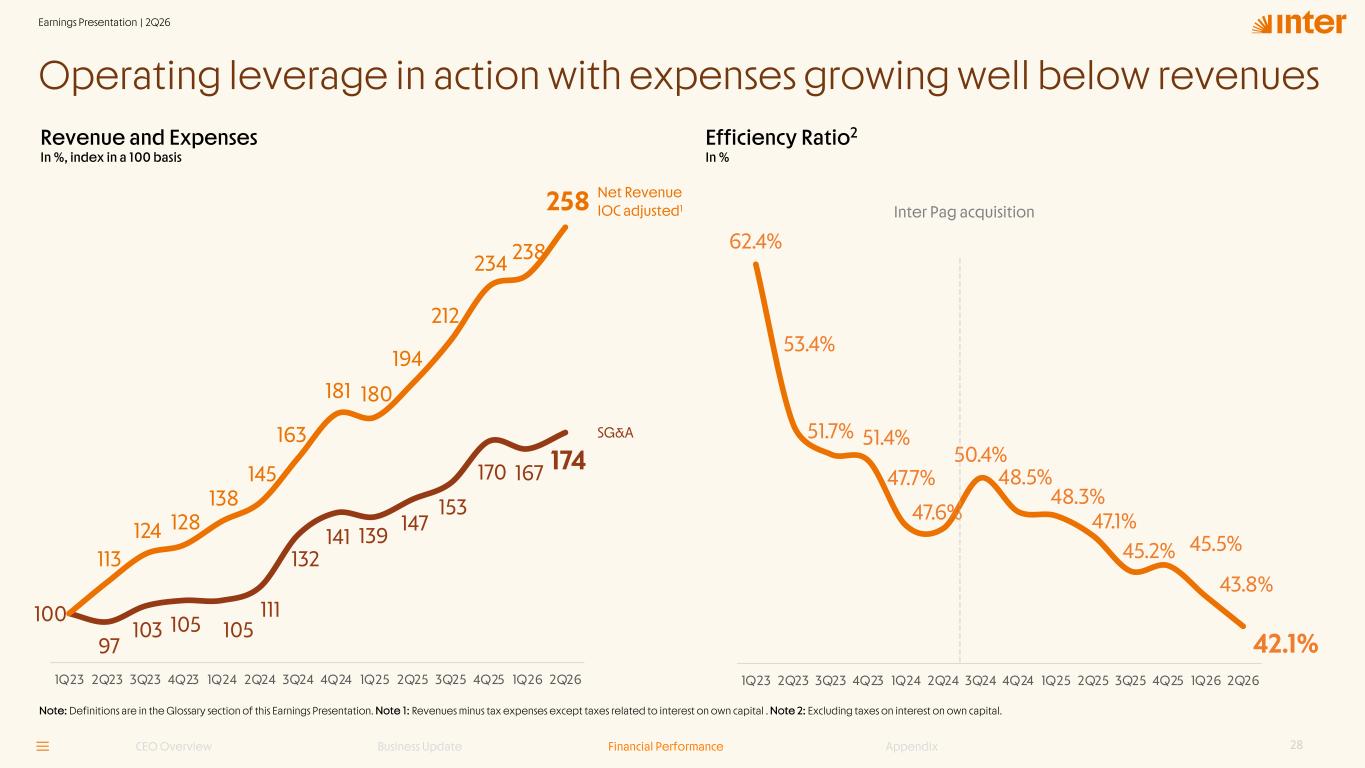
100 97 103 105 105 111 132 141 139 147 153 170 167 174 113 124 128 138 145 163 181 180 194 212 234 238 258 1Q 23 2Q2 3 3Q 23 4Q23 1Q 24 2Q2 4 3Q 24 4Q24 1Q 25 2Q2 5 3Q 25 4Q25 1Q 26 2Q2 6 Personnel & Administrative Expenses Net Revenue IOC adjusted Efficiency Ratio1 In % Note: Definitions are in the Glossary section of this Earnings Presentation. Note 1: Excluding taxes on interest on won capital. Note 2: Revenues minus taxes on interest on won capital. R$ millions Revenue vs. Expenses index in a 100 basis 12 Inter Pag acquisition Strategic Update Quarter Highlights Unit Economics Loan Porfolio Asset Quality Funding Capabilities Financial Performance Capital Ratio Appendix In 2Q26, our efficiency ratio reached 42.1%, demonstrating our strong commitment to cost discipline as efficiency gains continued to advance. We anticipate the gap between net revenue and expenses to widen further, supported by ongoing operational improvements and sustained revenue growth. 2 Financial Performance 62.4% 53.4% 51.7% 51.4% 47.7% 47.6% 50.4% 48.5% 48.3% 47.1% 45.2% 45.5% 43.8% 42.1% 4 0. 0% 4 5. 0% 5 0. 0% 5 5. 0% 6 0. 0% 6 5. 0% 1Q 23 2Q2 3 3Q 23 4Q23 1Q 24 2Q2 4 3Q 24 4Q24 1Q 25 2Q2 5 3Q 25 4Q25 1Q 26 2Q2 6
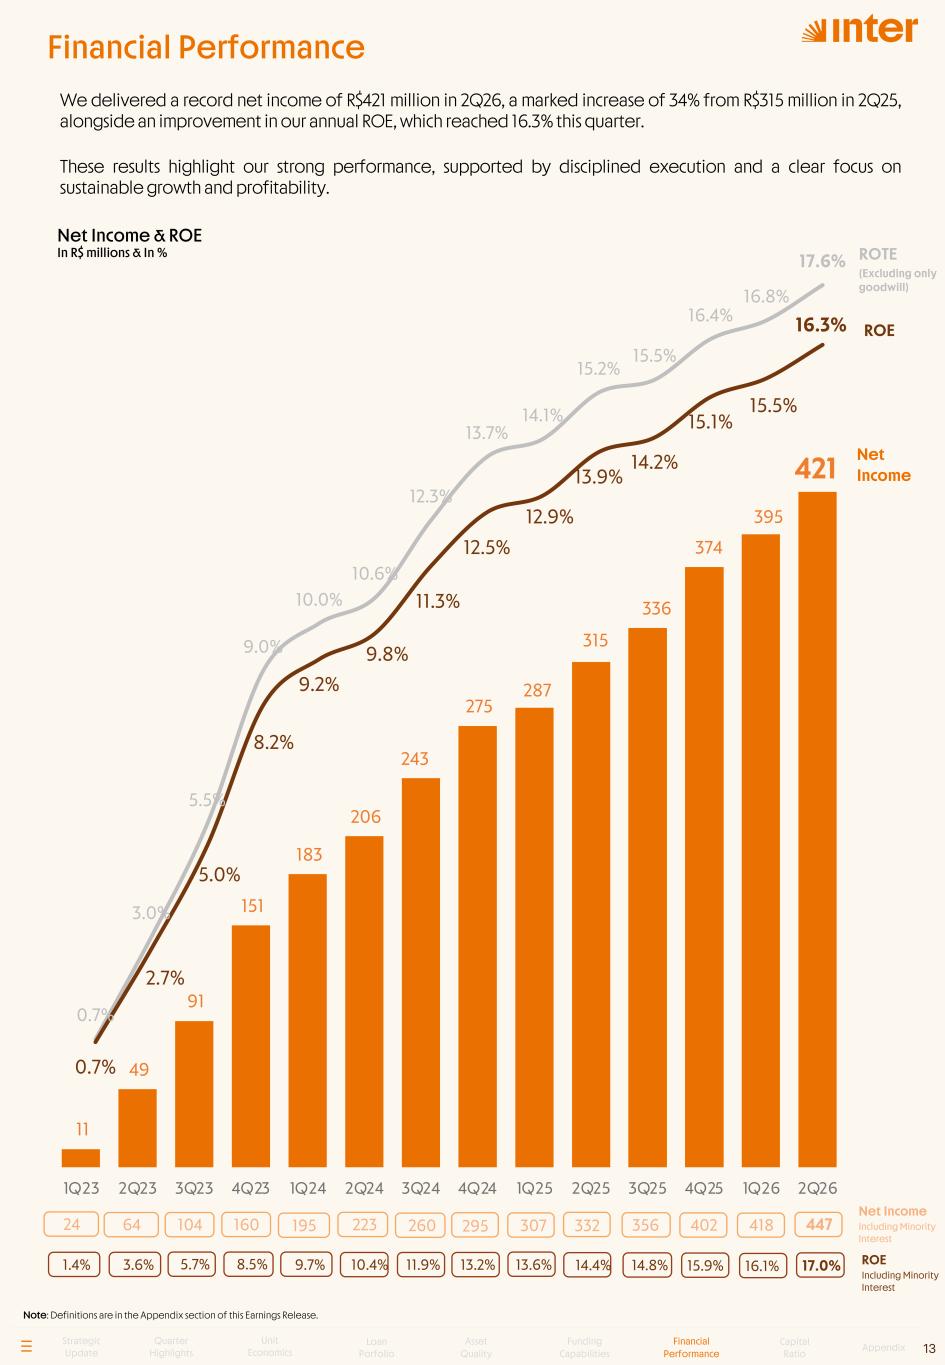
0.7% 3.0% 5.5% 9.0% 10.0% 10.6% 12.3% 13.7% 14.1% 15.2% 15.5% 16.4% 16.8% 17.6% 0.7% 2.7% 5.0% 8.2% 9.2% 9.8% 11.3% 12.5% 12.9% 13.9% 14.2% 15.1% 15.5% 16.3% 11 49 91 151 183 206 243 275 287 315 336 374 395 421 - 5 0 1 0 1 50 2 0 2 50 3 0 3 50 4 0 4 50 5 0 1Q23 2Q23 3Q23 4Q23 1Q24 2Q24 3Q24 4Q24 1Q25 2Q25 3Q25 4Q25 1Q26 2Q26 Note: Definitions are in the Appendix section of this Earnings Release. Net Income Including Minority Interest ROE Including Minority Interest Net Income 13 195 223 260 295 307 356 402 9.7% 10.4% 11.9% 13.2% 13.6% 14.4% 14.8% 15.9% ROE Strategic Update Quarter Highlights Unit Economics Loan Porfolio Asset Quality Funding Capabilities Financial Performance Capital Ratio Appendix 418 16.1% We delivered a record net income of R$421 million in 2Q26, a marked increase of 34% from R$315 million in 2Q25, alongside an improvement in our annual ROE, which reached 16.3% this quarter. These results highlight our strong performance, supported by disciplined execution and a clear focus on sustainable growth and profitability. 16010464 8.5%5.7%3.6% Net Income & ROE In R$ millions & In % Financial Performance 447 17.0% 33224 1.4% ROTE (Excluding only goodwill)

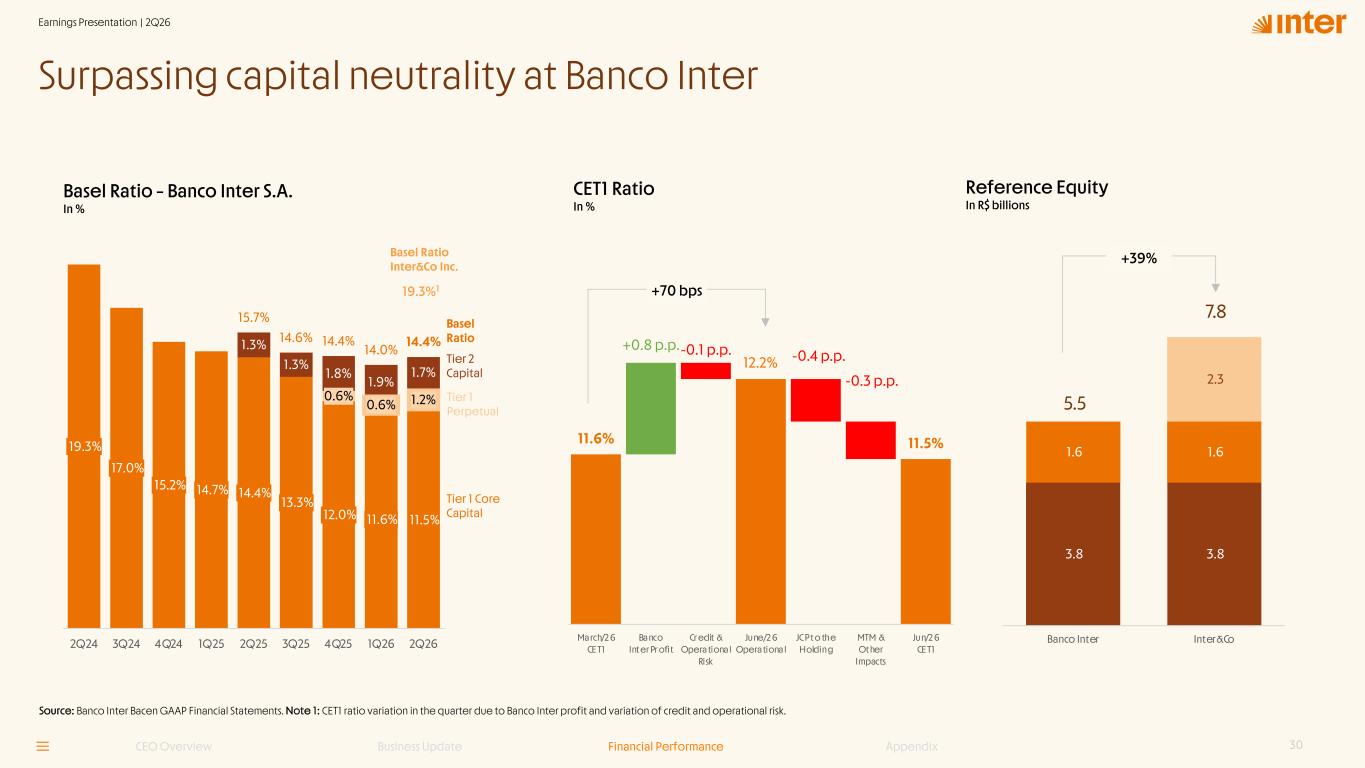
Our capital base remains solid, and, for the first time, surpassing capital neutrality, underpinned by an ROE-driven underwriting framework focused on optimizing returns on capital allocation. To further enhance our corporate structure, we have continued to strengthen our capital base at the holding level, which carries excess capital of R$2.3 billion as of 2Q26. At the banking level (Banco Inter S.A.), the Basel ratio stood at 14.4% as of June 2026. Loan Portfolio Growth QoQ RWA Growth QoQ RWA & Basel Ratio In R$ millions & In % Minimum Capital Requirement3 Banco Inter S.A. Excess Capital2 Banco Inter S.A. Source: Banco Inter Bacen GAAP Financial Statements. Note 1: Capital hold outside Conglomerado Prudencial Banco Inter S.A. level. Note 2: Excess capital within Conglomerado Prudencial Banco Inter S.A. Note 3: Additional and minimum tier 1 capital requirements. Note 4: Considering Basel Ratio of 14.0%. 2% 7% 8% 1% 1% 8% 9 10% 3% 4% -3% 2% 7% 12% 3.8 3.8 1.6 1.6 2.3 5.5 7.8 - 1 .0 2 .0 3 .0 4 .0 5 .0 6 .0 7 .0 8 .0 9 .0 Banco Inte r Inter&Co Excess Capital Inter&Co1 14 Tier 1 Core Capital Tier 2 Additional Capital Basel Ratio Tier I Capital In R$ billions 39% Variation % 2Q26 1Q26 2Q25 ∆QoQ ∆YoY Basel Ratio Reference Equity (RE) 6,606 6,327 6,035 +4.4% +9.5% Risk-Weighted Asset (RWA) 45,868 45,246 38,407 +1.4% +19.4% Basel Ratio (RE/RWA) 14.4% 14.0% 15.7% +0.4p.p. -1.3p.p. Tier I Capital (TI) 5,842 5,490 5,522 +6.4% +5.8% Risk-Weighted Asset (RWA) 45,868 45,246 38,407 +1.4% +19.4% Tier I Capital Ratio (TI/RWA) 12.7% 12.1% 14.4% +0.6 p.p. -1.7 p.p. Tier 1 Perpetual Basel Ratio - Banco Inter S.A. In % Strategic Update Quarter Highlights Unit Economics Loan Porfolio Asset Quality Funding Capabilities Financial Performance Capital Ratio Appendix Capital 14.4% 13.3% 12.0% 11.6% 11.5% 0.6% 0.6% 1.2% 1.3% 1.3% 1.8% 1.9% 1.7% 15.7% 14.6% 14.4% 14.0% 14.4% 0 .0 % 2 .0 % 4 .0 % 6 .0 % 8 .0 % 10 .0 % 12 .0 % 14 .0 % 16 .0 % 18 .0 % 2Q25 3Q25 4Q25 1Q26 2Q26
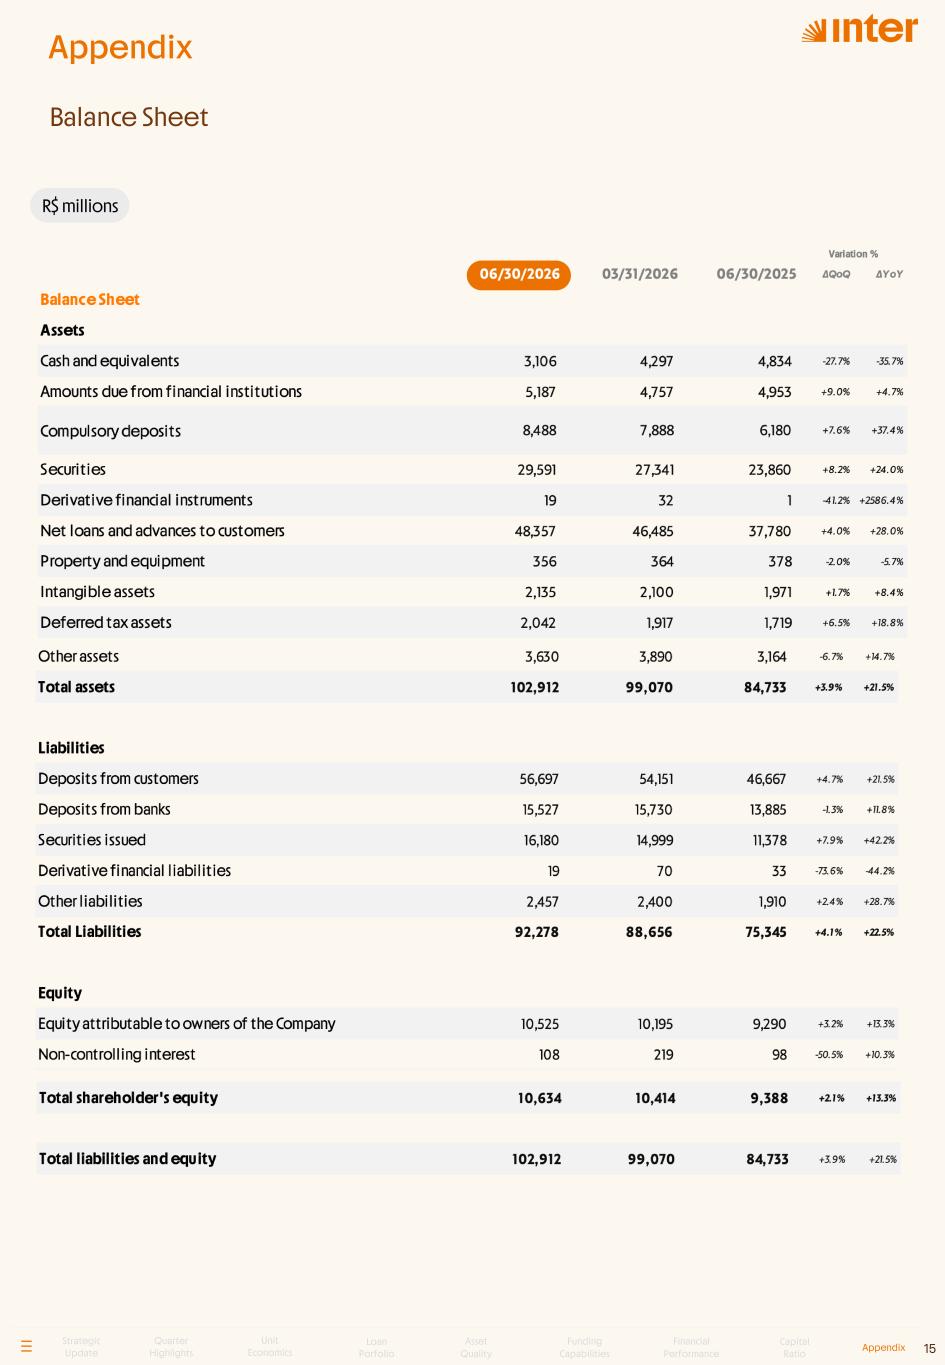
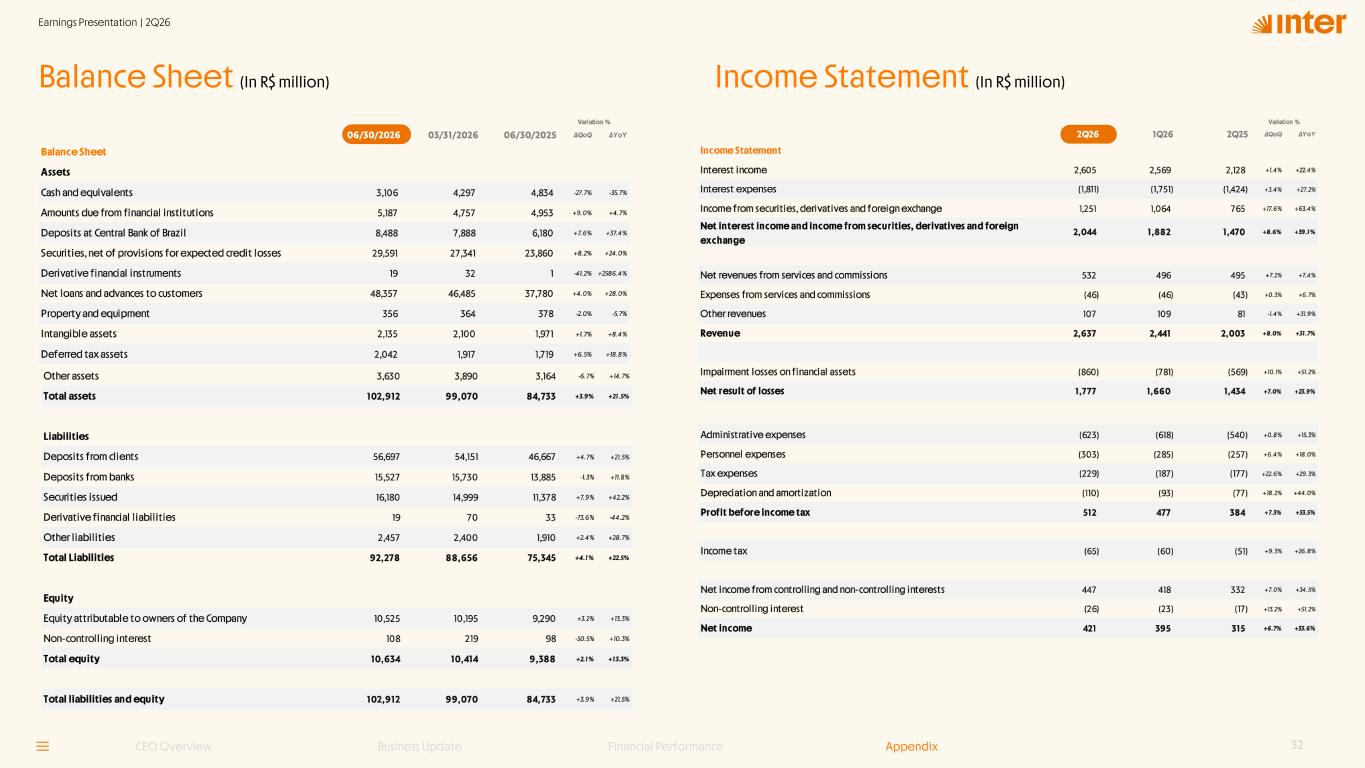
R$ millions 15 Balance Sheet Strategic Update Quarter Highlights Unit Economics Loan Porfolio Asset Quality Funding Capabilities Financial Performance Capital Ratio Appendix Appendix
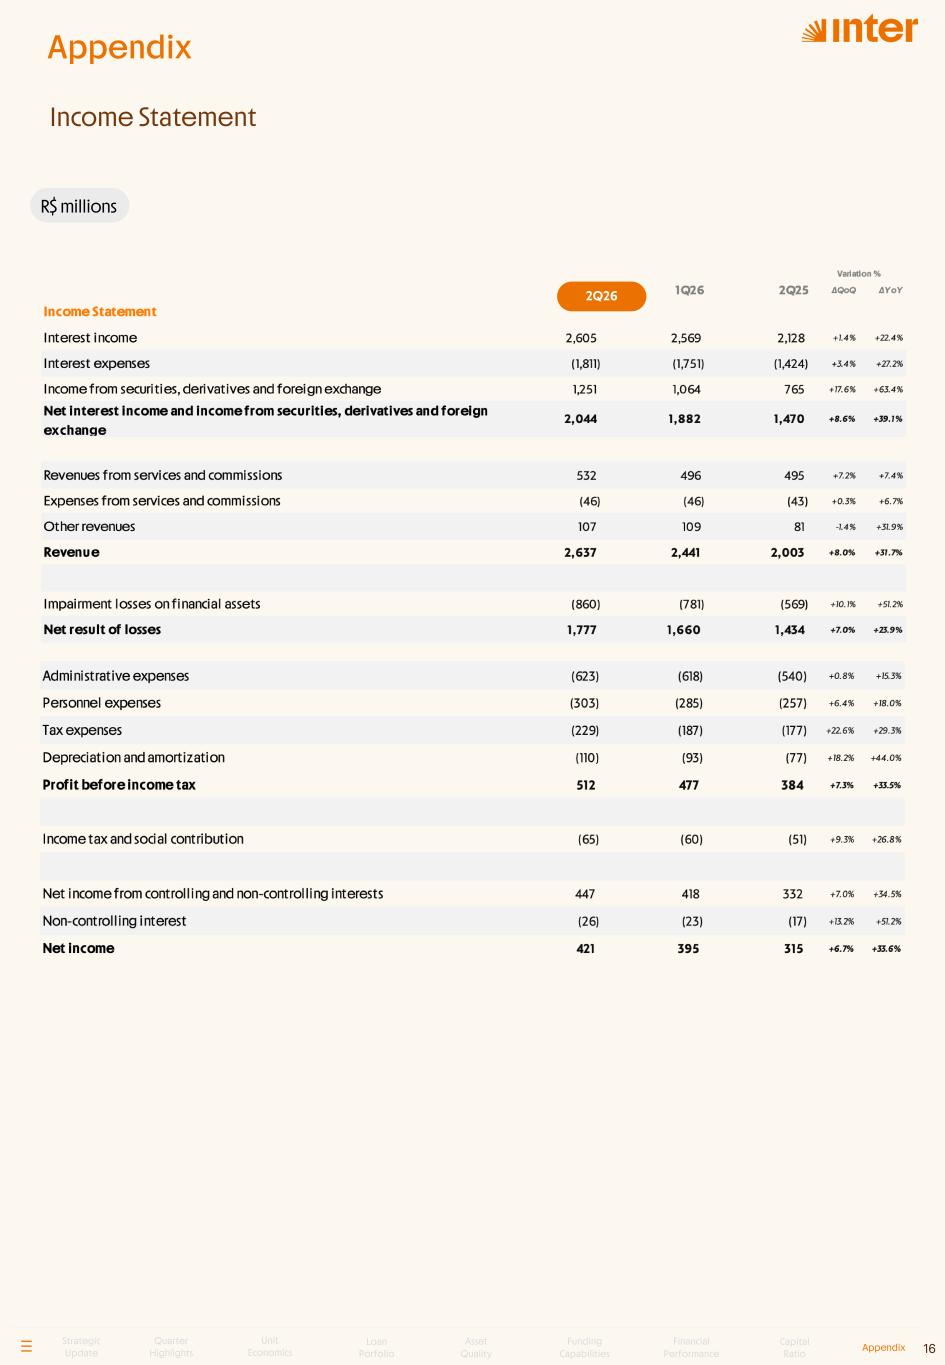
R$ millions 16 2Q26 Income Statement Strategic Update Quarter Highlights Unit Economics Loan Porfolio Asset Quality Funding Capabilities Financial Performance Capital Ratio Appendix Appendix
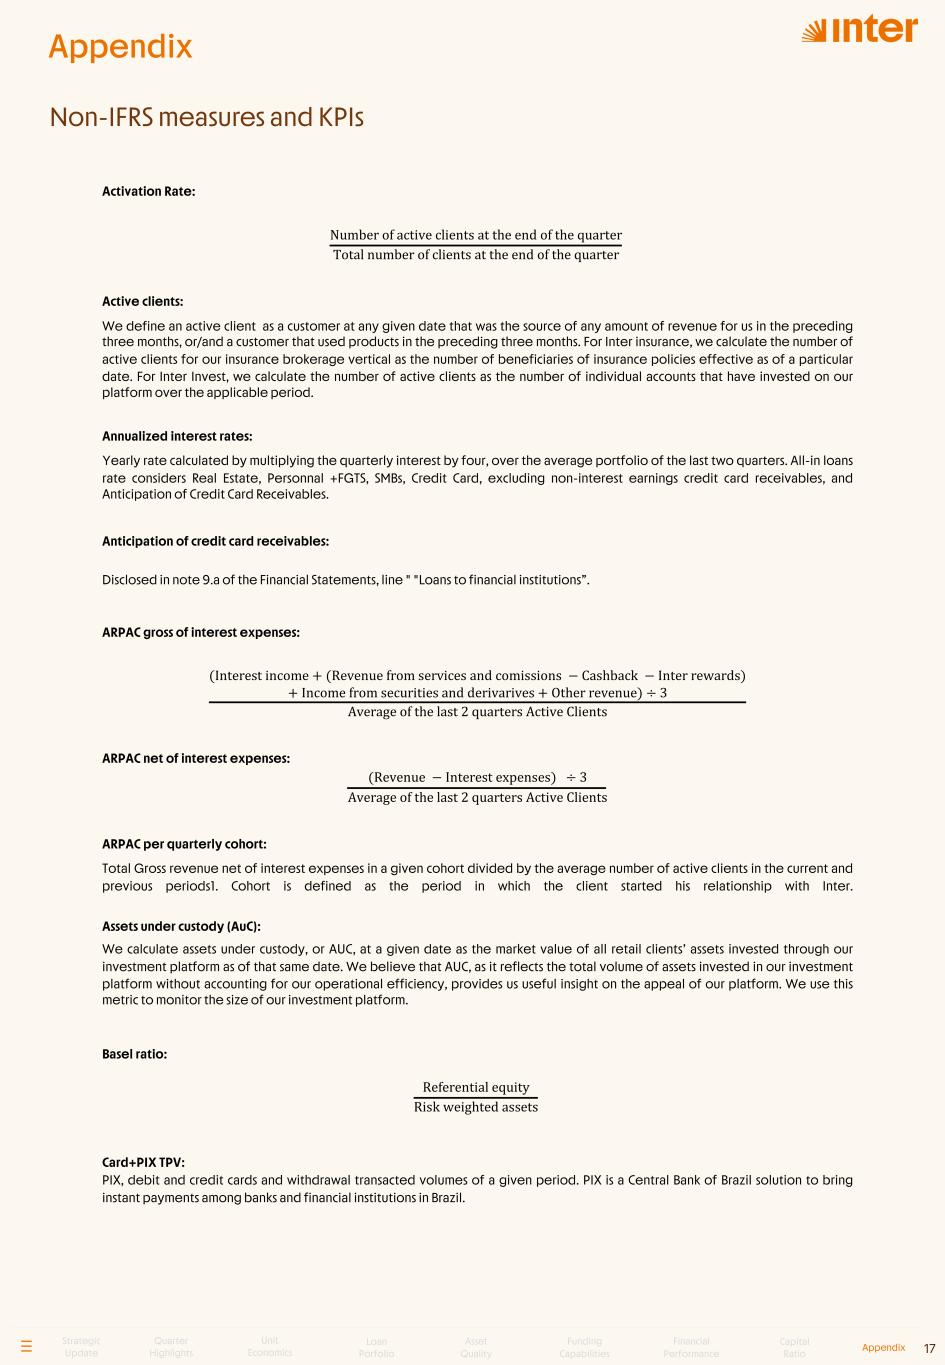
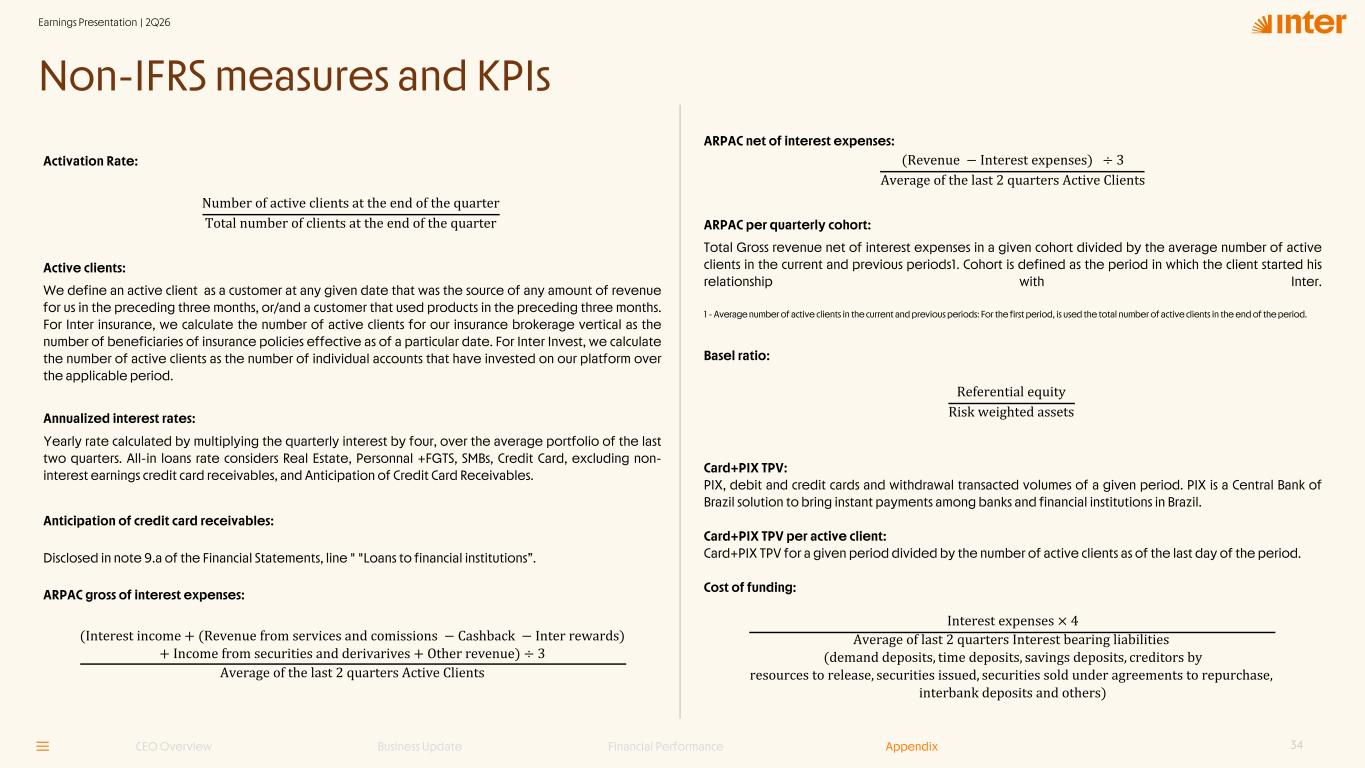
Activation Rate: Number of active clients at the end of the quarter Total number of clients at the end of the quarter Active clients: We define an active client as a customer at any given date that was the source of any amount of revenue for us in the preceding three months, or/and a customer that used products in the preceding three months. For Inter insurance, we calculate the number of active clients for our insurance brokerage vertical as the number of beneficiaries of insurance policies effective as of a particular date. For Inter Invest, we calculate the number of active clients as the number of individual accounts that have invested on our platform over the applicable period. Annualized interest rates: Yearly rate calculated by multiplying the quarterly interest by four, over the average portfolio of the last two quarters. All-in loans rate considers Real Estate, Personnal +FGTS, SMBs, Credit Card, excluding non-interest earnings credit card receivables, and Anticipation of Credit Card Receivables. Anticipation of credit card receivables: Disclosed in note 9.a of the Financial Statements, line " "Loans to financial institutions”. ARPAC gross of interest expenses: (Interest income + (Revenue from services and comissions − Cashback − Inter rewards) + Income from securities and derivarives + Other revenue) ÷ 3 Average of the last 2 quarters Active Clients ARPAC net of interest expenses: (Revenue − Interest expenses) ÷ 3 Average of the last 2 quarters Active Clients ARPAC per quarterly cohort: Total Gross revenue net of interest expenses in a given cohort divided by the average number of active clients in the current and previous periods1. Cohort is defined as the period in which the client started his relationship with Inter. Assets under custody (AuC): We calculate assets under custody, or AUC, at a given date as the market value of all retail clients’ assets invested through our investment platform as of that same date. We believe that AUC, as it reflects the total volume of assets invested in our investment platform without accounting for our operational efficiency, provides us useful insight on the appeal of our platform. We use this metric to monitor the size of our investment platform. Basel ratio: Referential equity Risk weighted assets Card+PIX TPV: PIX, debit and credit cards and withdrawal transacted volumes of a given period. PIX is a Central Bank of Brazil solution to bring instant payments among banks and financial institutions in Brazil. 17 Non-IFRS measures and KPIs Strategic Update Quarter Highlights Unit Economics Loan Porfolio Asset Quality Funding Capabilities Financial Performance Capital Ratio Appendix Appendix
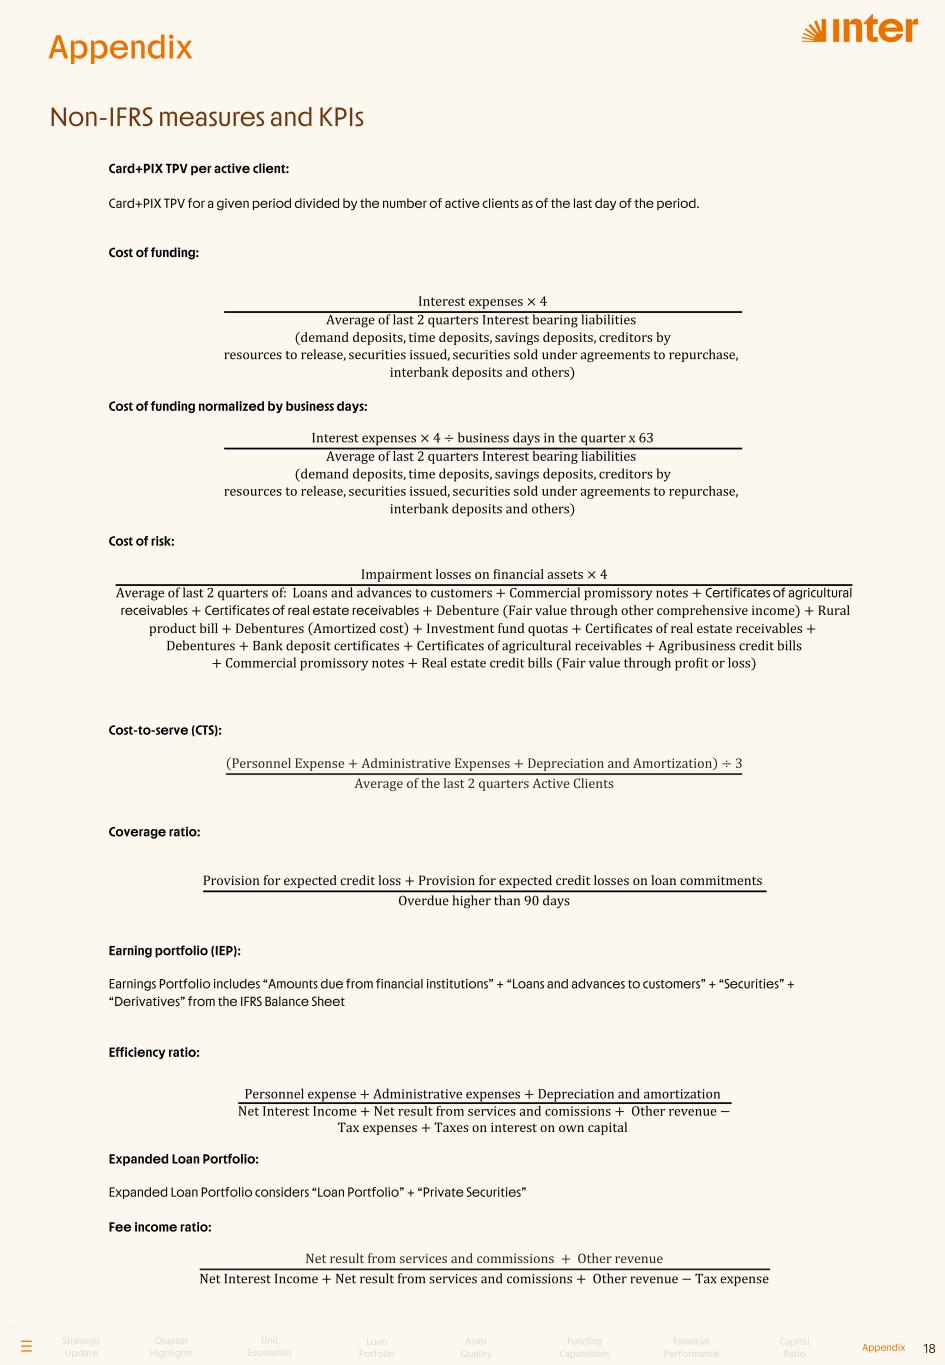
Card+PIX TPV per active client: Card+PIX TPV for a given period divided by the number of active clients as of the last day of the period. Cost of funding: Interest expenses × 4 Average of last 2 quarters Interest bearing liabilities (demand deposits, time deposits, savings deposits, creditors by resources to release, securities issued, securities sold under agreements to repurchase, interbank deposits and others) Cost of funding normalized by business days: Interest expenses × 4 ÷ business days in the quarter x 63 Average of last 2 quarters Interest bearing liabilities (demand deposits, time deposits, savings deposits, creditors by resources to release, securities issued, securities sold under agreements to repurchase, interbank deposits and others) Cost of risk: Impairment losses on Linancial assets × 4 Average of last 2 quarters of: Loans and advances to customers + Commercial promissory notes + Certificates of agricultural receivables + Certificates of real estate receivables + Debenture (Fair value through other comprehensive income) + Rural product bill + Debentures Amortized cost + Investment fund quotas + CertiLicates of real estate receivables + Debentures + Bank deposit certiLicates + CertiLicates of agricultural receivables + Agribusiness credit bills + Commercial promissory notes + Real estate credit bills (Fair value through proLit or loss) Cost-to-serve (CTS): Personnel Expense + Administrative Expenses + Depreciation and Amortization ÷ 3 Average of the last 2 quarters Active Clients Coverage ratio: Provision for expected credit loss + Provision for expected credit losses on loan commitments Overdue higher than 90 days Earning portfolio (IEP): Earnings Portfolio includes “Amounts due from financial institutions” + “Loans and advances to customers” + “Securities” + “Derivatives” from the IFRS Balance Sheet Efficiency ratio: Personnel expense + Administrative expenses + Depreciation and amortization Net Interest Income + Net result from services and comissions + Other revenue − Tax expenses + Taxes on interest on own capital Expanded Loan Portfolio: Expanded Loan Portfolio considers “Loan Portfolio” + “Private Securities” Fee income ratio: Net result from services and commissions + Other revenue Net Interest Income + Net result from services and comissions + Other revenue − Tax expense 18 Non-IFRS measures and KPIs Strategic Update Quarter Highlights Unit Economics Loan Porfolio Asset Quality Funding Capabilities Financial Performance Capital Ratio Appendix Appendix

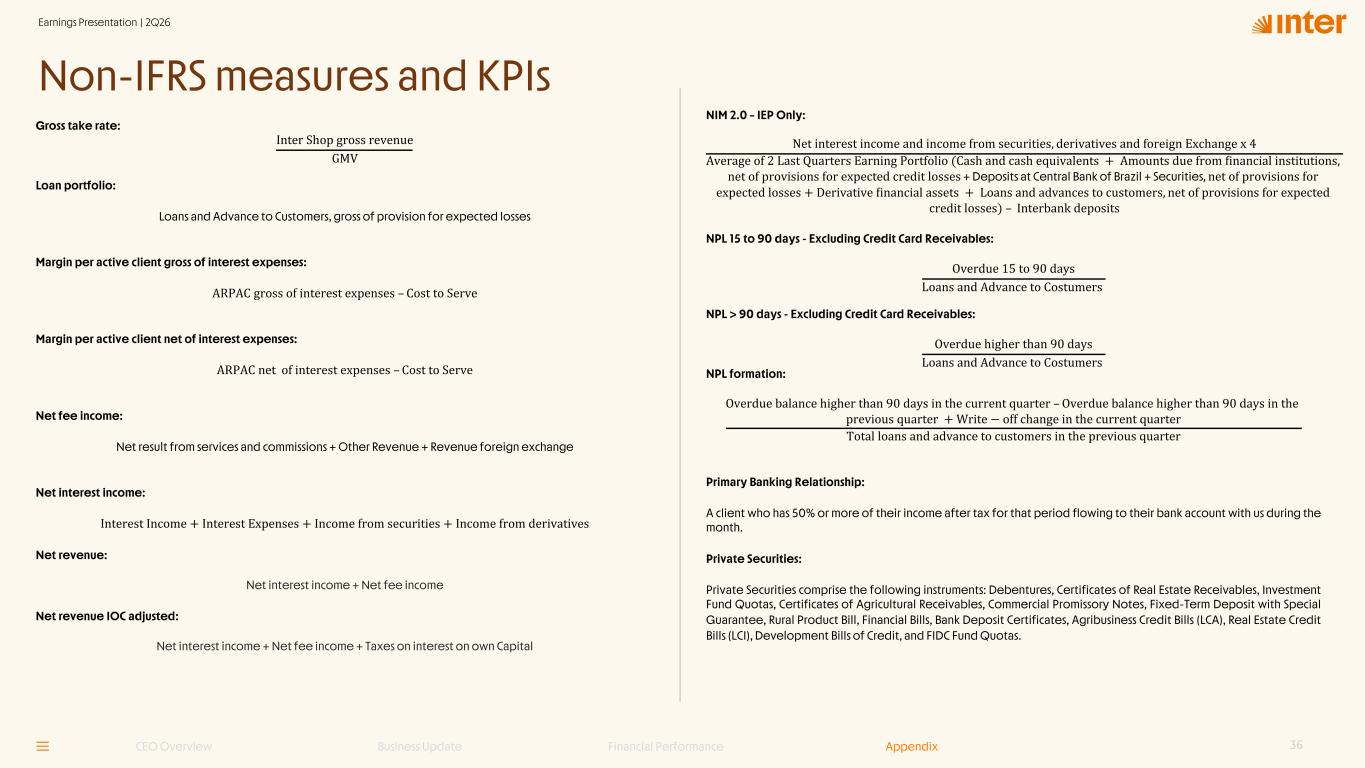
Funding: Demand Deposits + Time Deposits + Securities Issued + Savings Deposits + Creditors by Resources to Release + Securities sold under agreements to repurchase + Interbank deposits + Borrowing and onlending Global Clients: Includes Brazilian Global Account clients, US clients and international investors. Gross loan portfolio: Loans and Advance to Customers + Loans to financial institutions Gross merchandise volume (GMV): Gross merchandise value, or GMV, for a given period as the total value of all sales made or initiated through our Inter Shop & Commerce Plus platform managed by Inter Shop & Commerce Plus. Gross take rate: Inter Shop gross revenue GMV Loan portfolio: "Loans and Advance to Customers", gross of provision for expected losses Margin per active client gross of interest expenses: ARPAC gross of interest expenses – Cost to Serve Margin per active client net of interest expenses: ARPAC net of interest expenses – Cost to Serve Net fee income: Net result from services and commissions + Other Revenue + Revenue foreign Exchange Net interest income: Interest Income + Interest Expenses + Income from securities + Income from derivatives Net revenue: Net interest income + Net fee income Net take rate: Inter Shop net revenue GMV Net revenue IOC adjusted: Net interest income + Net fee income + Taxes on interest on own Capital 19 Non-IFRS measures and KPIs Strategic Update Quarter Highlights Unit Economics Loan Porfolio Asset Quality Funding Capabilities Financial Performance Capital Ratio Appendix Appendix

NIM 2.0 – IEP Only: Net interest income and income from securities, derivatives and foreign Exchange x 4 Average of 2 Last Quarters Earning Portfolio (Cash and cash equivalents + Amounts due from Linancial institutions, net of provisions for expected credit losses + Deposits at Central Bank of Brazil + Securities, net of provisions for expected losses + Derivative Linancial assets + Loans and advances to customers, net of provisions for expected credit losses – Interbank deposits) NPL 15 to 90 days - Excluding Credit Card Receivables: Overdue 15 to 90 days Loans and Advance to Costumers NPL > 90 days - Excluding Credit Card Receivables: Overdue higher than 90 days Loans and Advance to Costumers NPL formation: Overdue balance higher than 90 days in the current quarter – Overdue balance higher than 90 days inthe previous quarter + Write − off change in the current quarter Total loans and advance to customers in the previous quarter Primary Banking Relationship: A client who has 50% or more of their income after tax for that period flowing to their bank account with us during the month. Private Securities: Private Securities comprise the following instruments: Debentures, Certificates of Real Estate Receivables, Investment Fund Quotas, Certificates of Agricultural Receivables, Commercial Promissory Notes, Fixed-Term Deposit with Special Guarantee, Rural Product Bill, Financial Bills, Bank Deposit Certificates, Agribusiness Credit Bills (LCA), Real Estate Credit Bills (LCI), Development Bills of Credit, and FIDC Fund Quotas. Return on average equity (ROE): (ProLit / (loss) for the quarter)× 4 Average of last 2 quarters of total shareholder`s equity Return on Average Tangible Equity (ROTE): (ProLit (loss) for the quarter)× 4 Average of last 2 quarters of total shareholder`s equity − intangible asse𝑡𝑠 Risk-adjusted efficiency ratio: Personnel expense + Administrative expenses + Depreciation and amortization Net Interest Income + Net result from services and comissions + Other revenue − Tax expense − Impairment losses on Linancial assets 20 Non-IFRS measures and KPIs Strategic Update Quarter Highlights Unit Economics Loan Porfolio Asset Quality Funding Capabilities Financial Performance Capital Ratio Appendix Appendix
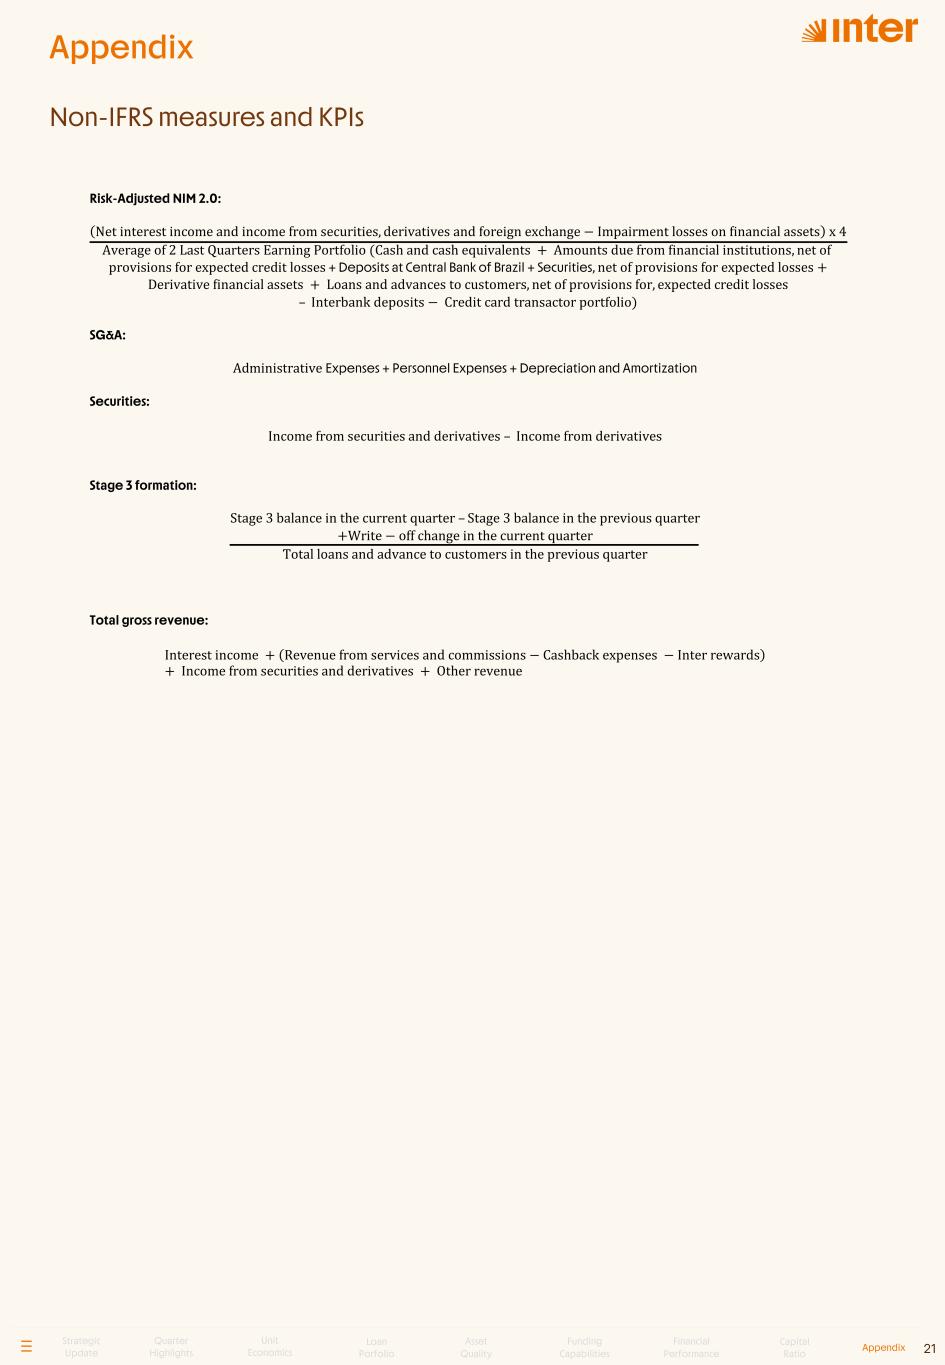
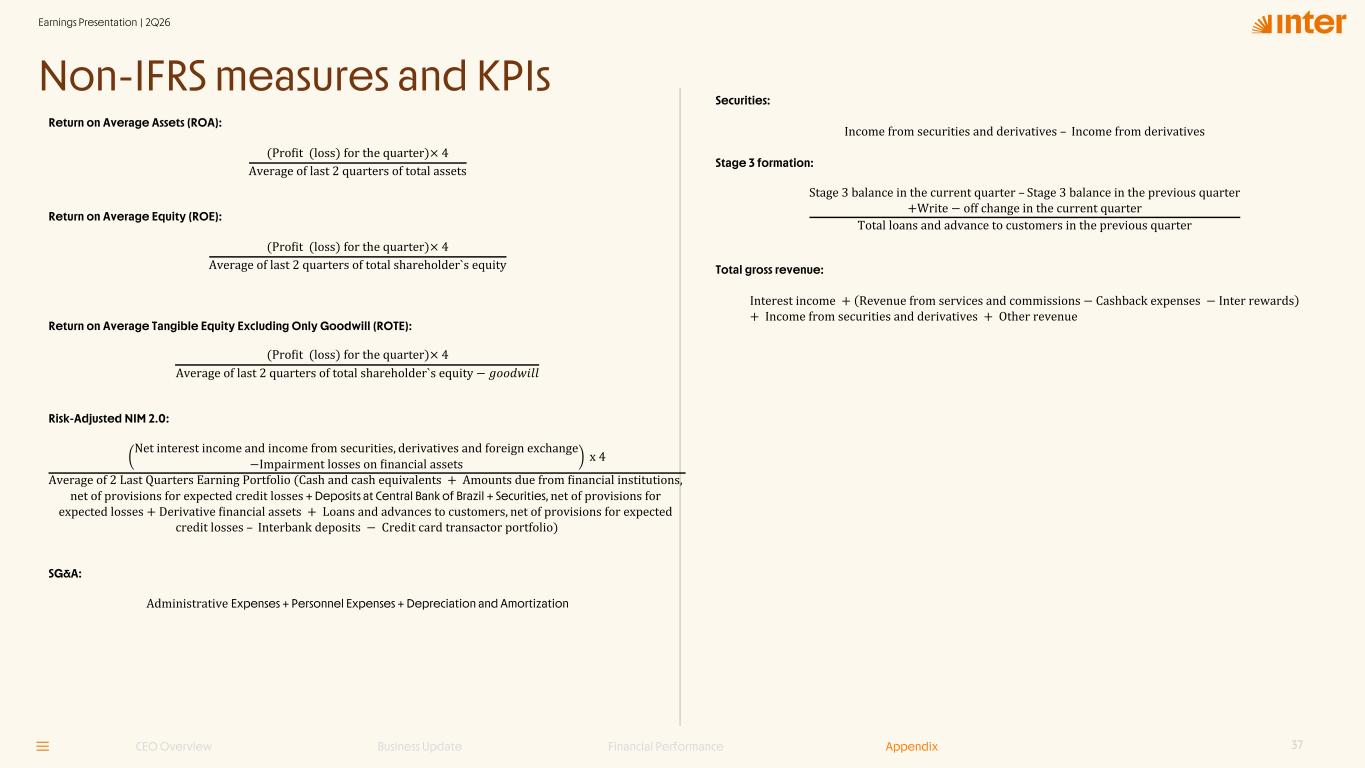
Risk-Adjusted NIM 2.0: Net interest income and income from securities, derivatives and foreign exchange − Impairment losses on Linancial assets x 4 Average of 2 Last Quarters Earning Portfolio (Cash and cash equivalents + Amounts due from Linancial institutions, net of provisions for expected credit losses + Deposits at Central Bank of Brazil + Securities, net of provisions for expected losses + Derivative Linancial assets + Loans and advances to customers, net of provisions for, expected credit losses – Interbank deposits − Credit card transactor portfolio) SG&A: Administrative Expenses + Personnel Expenses + Depreciation and Amortization Securities: Income from securities and derivatives – Income from derivatives Stage 3 formation: Stage 3 balance in the current quarter – Stage 3 balance in the previous quarter +Write − off change in the current quarter Total loans and advance to customers in the previous quarter Total gross revenue: Interest income + Revenue from services and commissions − Cashback expenses − Inter rewards + Income from securities and derivatives + Other revenue 21 Non-IFRS measures and KPIs Strategic Update Quarter Highlights Unit Economics Loan Porfolio Asset Quality Funding Capabilities Financial Performance Capital Ratio Appendix Appendix

This report may contain forward-looking statements regarding Inter, anticipated synergies, growth plans, projected results and future strategies. While these forward-looking statements reflect our Management’s good faith beliefs, they involve known and unknown risks and uncertainties that could cause the company’s results or accrued results to differ materially from those anticipated and discussed herein. These statements are not guarantees of future performance. These risks and uncertainties include, but are not limited to, our ability to realize the amount of projected synergies and the projected schedule, in addition to economic, competitive, governmental and technological factors affecting Inter, the markets, products and prices and other factors. In addition, this presentation contains managerial numbers that may differ from those presented in our financial statements. The calculation methodology for these managerial numbers is presented in Inter’s quarterly earnings release. Statements contained in this report that are not facts or historical information may be forward-looking statements under the terms of the Private Securities Litigation Reform Act of 1995. These forward-looking statements may, among other things, beliefs related to the creation of value and any other statements regarding Inter. In some cases, terms such as “estimate”, “project”, “predict”, “plan”, “believe”, “can”, “expectation”, “anticipate”, “intend”, “aimed”, “potential”, “may”, “will/shall” and similar terms, or the negative of these expressions, may identify forward looking statements. These forward-looking statements are based on Inter's expectations and beliefs about future events and involve risks and uncertainties that could cause actual results to differ materially from current ones. Any forward-looking statement made by us in this document is based only on information currently available to us and speaks only as of the date on which it is made. We undertake no obligation to publicly update any forward-looking statement, whether written or oral, that may be made from time to time, whether as a result of new information, future developments or otherwise. For additional information that about factors that may lead to results that are different from our estimates, please refer to sections “Cautionary Statement Concerning Forward-Looking Statements” and “Risk Factors” of Inter&Co Annual Report on Form 20-F. The numbers for our key metrics (Unit Economics), which include active users, as average revenue per active client (ARPAC), cost-to-serve (CTS), are calculated using Inter’s internal data. Although we believe these metrics are based on reasonable estimates, but there are challenges inherent in measuring the use of our business. In addition, we continually seek to improve our estimates, which may change due to improvements or changes in methodology, in processes for calculating these metrics and, from time to time, we may discover inaccuracies and make adjustments to improve accuracy, including adjustments that may result in recalculating our historical metrics. About Non-IFRS Financial Measures To supplement the financial measures presented in this press release and related conference call, presentation, or webcast in accordance with IFRS, Inter&Co also presents non-IFRS measures of financial performance, as highlighted throughout the documents. The non-IFRS Financial Measures include, among others: Adjusted Net Income, cost-to- serve, Cost of Funding, Efficiency Ratio, Underwriting, NPL > 90 days, NPL 15 to 90 days, NPL and Stage 3 Formation, Cost of Risk, Coverage Ratio, Funding, All-in Cost of Funding, Gross Merchandise Volume (GMV), Premiuns, Net Inflows, Global Services Deposits and Investments, Fee Income Ratio, Client Acquisition Cost, Cards+Pix TPV, Gross ARPAC, Net ARPAC, Marginal NIM 1.0, Marginal NIM 2.0, Net Interest Margin IEP + Non-int. CC Receivables (1.0), Net Interest Margin IEP (2.0), Cost-to-Serve. A “non-IFRS financial measure” refers to a numerical measure of Inter&Co’s historical or financial position that either excludes or includes amounts that are not normally excluded or included in the most directly comparable measure calculated and presented in accordance with IFRS in Inter&Co’s financial statements. Inter&Co provides certain non-IFRS measures as additional information relating to its operating results as a complement to results provided in accordance with IFRS. The non-IFRS financial information presented herein should be considered together with, and not as a substitute for or superior to, the financial information presented in accordance with IFRS. There are significant limitations associated with the use of non-IFRS financial measures. Further, these measures may differ from the non-IFRS information, even where similarly titled, used by other companies and therefore should not be used to compare Inter&Co’s performance to that of other companies. 22 Disclaimer Strategic Update Quarter Highlights Unit Economics Loan Porfolio Asset Quality Funding Capabilities Financial Performance Capital Ratio Appendix Appendix

 エドガーで原本を確認する