0001858681false00018586812023-11-012023-11-010001858681us-gaap:CommonStockMember2023-11-012023-11-010001858681us-gaap:SeriesAPreferredStockMember2023-11-012023-11-010001858681apo:SubordinatedNotesMember2023-11-012023-11-01
UNITED STATES
SECURITIES AND EXCHANGE COMMISSION
WASHINGTON, D.C. 20549
FORM 8-K
CURRENT REPORT
PURSUANT TO SECTION 13 OR 15(D)
OF THE SECURITIES EXCHANGE ACT OF 1934
Date of Report (Date of earliest event reported): November 1, 2023
Apollo Global Management, Inc.
(Exact name of registrant as specified in its charter)
|
|
|
|
|
|
|
|
|
|
|
|
|
|
|
|
|
|
|
|
|
|
Delaware |
|
001-41197 |
|
86-3155788 |
|
|
(State or other jurisdiction of incorporation) |
|
(Commission File Number) |
|
(IRS Employer Identification No.) |
|
9 West 57th Street, 42nd Floor
New York, New York 10019
(Address of principal executive offices) (Zip Code)
(212) 515-3200
(Registrant's telephone number, including area code)
N/A
(Former Name or Former Address, if Changed Since Last Report)
Check the appropriate box below if the Form 8-K filing is intended to simultaneously satisfy the filing obligation of the registrant under any of the following provisions (see General Instruction A.2. below):
☐ Written communications pursuant to Rule 425 under the Securities Act (17 CFR 230.425)
☐ Soliciting material pursuant to Rule 14a-12 under the Exchange Act (17 CFR 240.14a-12)
☐ Pre-commencement communications pursuant to Rule 14d-2(b) under the Exchange Act (17 CFR 240.14d-2(b))
☐ Pre-commencement communications pursuant to Rule 13e-4(c) under the Exchange Act (17 CFR 240.13e-4(c))
Securities registered pursuant to Section 12(b) of the Act:
|
|
|
|
|
|
|
|
|
|
|
|
|
|
|
| Title of each class |
|
Trading Symbol(s) |
|
Name of each exchange on which registered |
| Common Stock |
|
APO |
|
New York Stock Exchange |
| 6.75% Series A Mandatory Convertible Preferred Stock |
|
APO.PRA |
|
New York Stock Exchange |
| 7.625% Fixed-Rate Resettable Junior Subordinated Notes due 2053 |
|
APOS |
|
New York Stock Exchange |
Indicate by check mark whether the registrant is an emerging growth company as defined in Rule 405 of the Securities Act of 1933 (§230.405 of this chapter) or Rule 12b-2 of the Securities Exchange Act of 1934 (§240.12b-2 of this chapter).
Emerging growth company ☐
If an emerging growth company, indicate by check mark if the registrant has elected not to use the extended transition period for complying with any new or revised financial accounting standards provided pursuant to Section 13(a) of the Exchange Act. ☐
Item 7.01 Regulation FD Disclosure.
Apollo is a dynamic, high-performance culture and our “North Star” is to build the most talented and best investor-aligned partnership in financial services. We want to attract the most talented investors, business leaders, and future leaders in our industry to join Apollo and spend the entirety of their careers with us solving complex investment challenges for our clients. Over the past two years, we have made a series of changes to the design of our compensation programs to drive a compelling value proposition, long-term retention of our senior leadership, and strong alignment with our long-term business goals and shareholders, as discussed in our 2021 Investor Day.
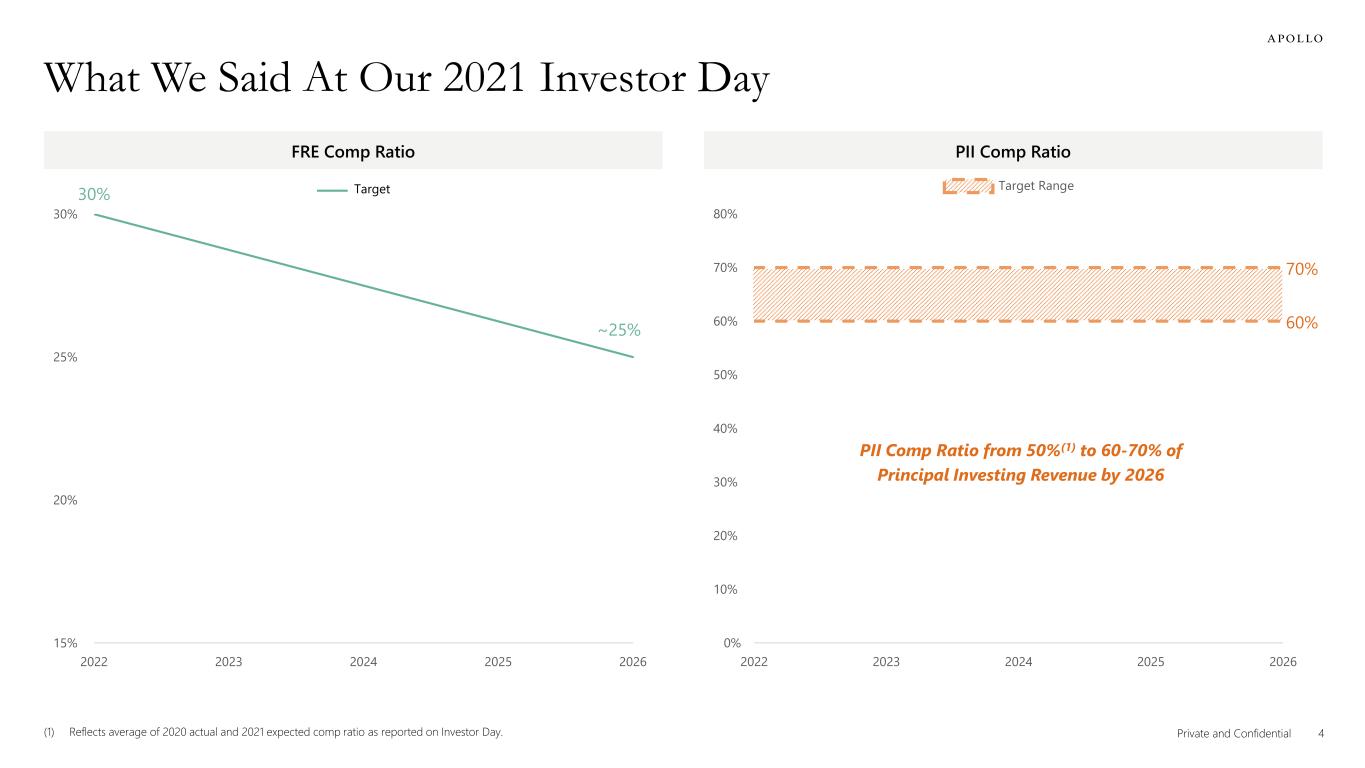
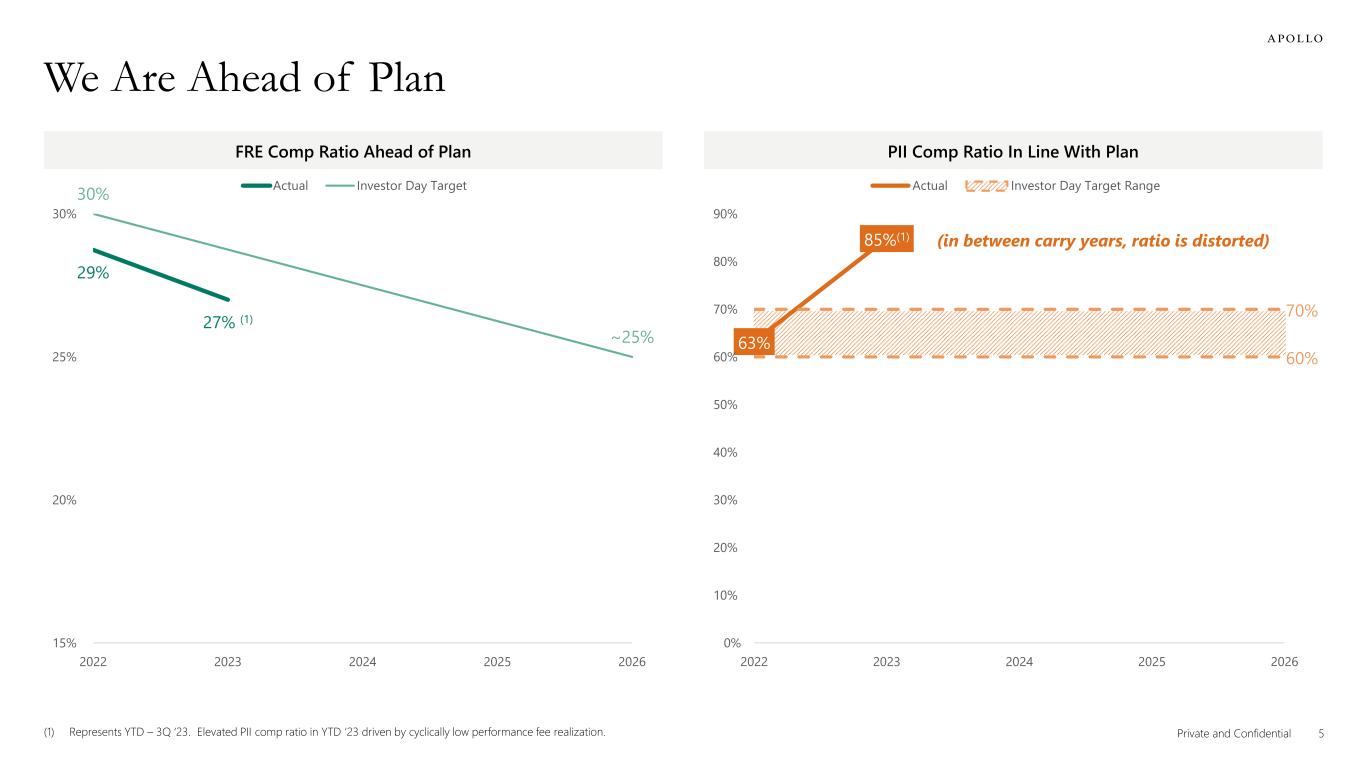
One of our principal objectives has been to reduce compensation related to fee-related earnings (“FRE”) and increase compensation related to principal investing income (“PII”) over a multi-year time horizon. This is demonstrated in our results which have shown a decrease in the FRE compensation ratio from ~30% in 2021 to 27% year to date through Q3’23, while at the same time making significant investments to capture our growth opportunities. PII compensation is inherently more volatile year to year, and, therefore, less valuable to shareholders, and should be viewed as an average across multiple years, evidenced by a PII compensation ratio of 85% year to date through Q3’23 relative to 43% in 2021.
We also remain focused on succession planning and the development of our next generation of talent to ensure that we have a strong and deep bench of talent across the firm for many years to come. As part of our talent strategy, two years ago we executed new compensation agreements for the Co-Presidents of our asset management business, Jim Zelter and Scott Kleinman, dramatically altering their mix of compensation to focus almost entirely on stock awards. We are now taking the next step of this process and executing new long-term compensation arrangements for four of our most senior business leaders, Matt Nord, David Sambur, John Zito, and Grant Kvalheim, each of whom has taken on broader enterprise responsibilities. The focus of these new compensation arrangements is to balance alignment with the businesses they directly oversee as well as alignment with their enterprise responsibilities by allocating to them significantly more stock as part of their compensation mix. As described below, these new arrangements enhance enterprise alignment by awarding new RSUs in exchange for other forms of compensation that would have been paid while providing some compensation growth to reflect their expanded responsibilities.
These four senior leaders each play a critical role in driving our next phase of growth. Matt Nord and David Sambur recently assumed newly created roles as Co-Heads of Equity, while maintaining their direct oversight for the global private equity business. John Zito has expanded his responsibilities to include the real estate credit business, while continuing to grow his role as our Deputy Chief Investment Officer and Head of Credit overseeing Apollo’s credit business that spans public and private markets. Grant Kvalheim, President, Athene and Chief Executive Officer and President, Athene USA, is responsible for Athene’s overall strategic direction and growth, and leads Athene’s operating companies focused on growing retail annuity, flow reinsurance, pension group annuity and funding agreements businesses. Last year, Mr. Kvalheim took on the broader President role at Athene, including additional responsibilities such as new product innovation and long-term business strategy.
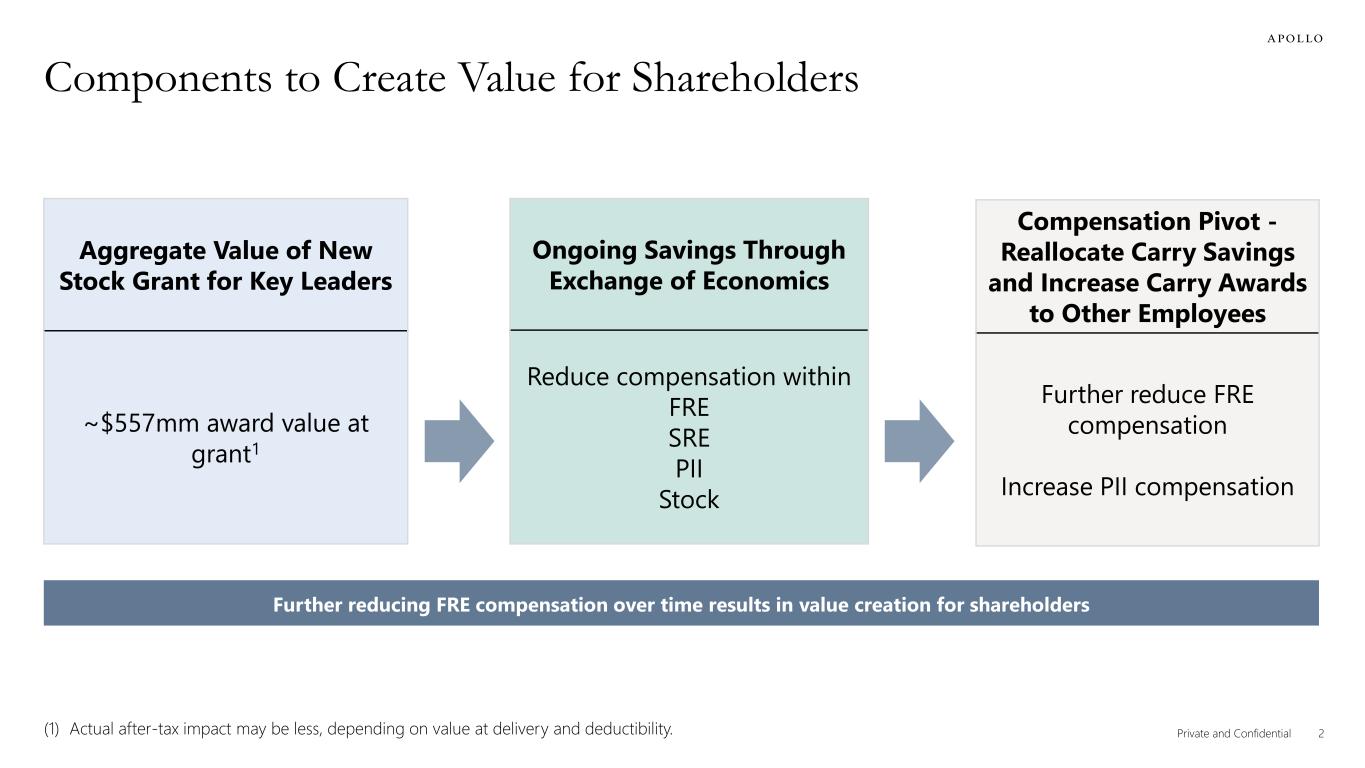
To further this alignment of our senior leaders as well as enhance alignment with shareholders, we are granting ~$557 million in special fully-vested restricted stock units (“RSUs”) with delayed delivery and subject to other restrictions and restrictive covenants including a non-compete. These RSUs are generally equivalent in value and were exchanged for current and future compensation that we expect would have been awarded over the next five years in the form of compensation based on FRE, PII, spread-related earnings (“SRE”) and stock. The RSUs are being granted to several employees, most of which are being awarded to the four key employees noted above. The RSUs will enable us to continue to pivot to further FRE compensation reductions and PII compensation increases. In exchange for these RSUs, we intend to reallocate existing and expected future PII compensation of the senior leaders to other employees, and we also expect to change the mix of compensation for other employees to increase PII compensation. These actions will accelerate our progress toward our goals to further reduce our FRE compensation ratio to below 25% by 2026 and increase our PII compensation ratio to 65% - 75% during a normal cycle.
We expect to offset the dilutive impact of the RSUs and the dilution from the mandatory convertible preferred stock we issued in August 2023 over the next few years as capital is available, targeting a share count of 600 million shares outstanding.
We are making progress against our 2021 Investor Day goals and these RSUs are an important step forward in this multi-year process. See the presentation furnished as Exhibit 99.1 to this Current Report on Form 8-K and incorporated herein by reference for additional information, including information regarding the compensation ratios referenced herein.
* * *
The information included under this Item 7.01, “Regulation FD Disclosure” and in Exhibit 99.1 of this Current Report on Form 8-K is being furnished. As such, the information herein and therein shall not be deemed to be “filed” for the purposes of Section 18 of the Securities Exchange Act of 1934, as amended (the “Exchange Act”), or otherwise subject to the liabilities of that Section, nor shall it be incorporated by reference into a filing under the Securities Act of 1933, as amended, or the Exchange Act, except as shall be expressly set forth by specific reference in such a filing.
The information in this Current Report on Form 8-K, including Exhibit 99.1, contains forward-looking statements that are within the meaning of Section 27A of the Securities Act of 1933, as amended, and Section 21E of the Securities Exchange Act of 1934, as amended. These statements include, but are not limited to, discussions related to Apollo’s expectations regarding the performance of its business, its liquidity and capital resources and other non-historical statements. These forward-looking statements are based on management’s beliefs, as well as assumptions made by, and information currently available to, management. When used in this presentation, the words “believe,” “anticipate,” “estimate,” “expect,” “intend,” “target” or future or conditional verbs, such as “will,” “should,” “could,” or “may” and similar expressions, including “forecasted”, are intended to identify forward-looking statements. Although management believes that the expectations reflected in these forward-looking statements are reasonable, it can give no assurance that these expectations will prove to have been correct. It is possible that actual results will differ, possibly materially, from the anticipated results indicated in these statements. These statements are subject to certain risks, uncertainties and assumptions, including risks relating to inflation, market conditions and interest rate fluctuations generally, the impact of COVID-19, the impact of energy market dislocation, our ability to manage our growth, our ability to operate in highly competitive environments, the performance of the funds we manage, our ability to raise new funds, the variability of our revenues, earnings and cash flow, the accuracy of management’s assumptions and estimates, our dependence on certain key personnel, our use of leverage to finance our businesses and investments by the funds we manage, Athene’s ability to maintain or improve financial strength ratings, the impact of Athene’s reinsurers failing to meet their assumed obligations, Athene’s ability to manage its business in a highly regulated industry, changes in our regulatory environment and tax status, and litigation risks, among others. We believe these factors include but are not limited to those described under the section entitled “Risk Factors” in the Company’s annual report on Form 10-K filed with the Securities and Exchange Commission (the “SEC”) on March 1, 2023, as such factors may be updated from time to time in our periodic filings with the SEC, which are accessible on the SEC’s website at www.sec.gov. These factors should not be construed as exhaustive and should be read in conjunction with the other cautionary statements that are included in this presentation and in our other filings with the SEC.
We undertake no obligation to publicly update or review any forward-looking statements, whether as a result of new information, future developments or otherwise, except as required by applicable law. This Current Report on Form 8-K does not constitute an offer of any Apollo fund.
Item 9.01 Financial Statements and Exhibits.
(d) Exhibits
|
|
|
|
|
|
| Exhibit No. |
Description |
|
Senior Leader Compensation Presentation, dated November 1, 2023 |
| 104 |
Cover Page Interactive Data File (embedded within the Inline XBRL document) |
SIGNATURES
Pursuant to the requirements of the Securities Exchange Act of 1934, as amended, the Registrant has duly caused this report to be signed on its behalf by the undersigned hereunto duly authorized.
|
|
|
|
|
|
|
|
|
|
APOLLO GLOBAL MANAGEMENT, INC. |
| Date: November 1, 2023 |
By: |
/s/ Martin Kelly |
|
|
Martin Kelly |
|
|
Chief Financial Officer |
EX-99.1
2
seniorleaderpresentation.htm
EX-99.1
seniorleaderpresentation

November 1, 2023 Senior Leader Compensation

1Private and Confidential Objectives of Senior Leadership Compensation Arrangements Enterprise Alignment As part of succession planning, align senior leaders with Apollo’s long-term performance, business objectives and strategic enterprise priorities 1 Shareholder Alignment Reallocate compensation by increasing stock ownership to further align senior leadership with shareholders Shift Compensation Mix Transition partner compensation over time to focus on variable principal investing income (“PII”), and not Fee-Related Earnings (“FRE”) 32
2Private and Confidential Components to Create Value for Shareholders Aggregate Value of New Stock Grant for Key Leaders ~$557mm award value at grant1 Ongoing Savings Through Exchange of Economics Reduce compensation within FRE SRE PII Stock Compensation Pivot - Reallocate Carry Savings and Increase Carry Awards to Other Employees Further reduce FRE compensation Increase PII compensation Further reducing FRE compensation over time results in value creation for shareholders (1) Actual after-tax impact may be less, depending on value at delivery and deductibility.

3Private and Confidential Value Accretive to Shareholders 1 1% on $3.1B FRE revenues for LTM 3Q ‘23 at 20x multiple and 20% tax rate. Valuation Positive Value-accretive at current multiples Each 1% reduction in FRE compensation ratio creates ~$500mm of enterprise value1 Share Count Neutral We have allocated capital to keep share count neutral for senior leadership awards over time
4Private and Confidential(1) Reflects average of 2020 actual and 2021 expected comp ratio as reported on Investor Day. What We Said At Our 2021 Investor Day FRE Comp Ratio PII Comp Ratio 60% 70% 0% 10% 20% 30% 40% 50% 60% 70% 80% 2022 2023 2024 2025 2026 Target Range 30% ~25% 15% 20% 25% 30% 2022 2023 2024 2025 2026 PII Comp Ratio from 50%(1) to 60-70% of Principal Investing Revenue by 2026 Target
5Private and Confidential(1) Represents YTD – 3Q ‘23. Elevated PII comp ratio in YTD ‘23 driven by cyclically low performance fee realization. We Are Ahead of Plan FRE Comp Ratio Ahead of Plan PII Comp Ratio In Line With Plan 29% 27% (1) 30% ~25% 15% 20% 25% 30% 2022 2023 2024 2025 2026 Actual Investor Day Target 63% 85%(1) 60% 70% 0% 10% 20% 30% 40% 50% 60% 70% 80% 90% 2022 2023 2024 2025 2026 Actual Investor Day Target Range (in between carry years, ratio is distorted)

6Private and Confidential (1) Represents YTD – 3Q ‘23. (2) 1% on $3.1B FRE revenues for LTM 3Q ‘23 at 20x multiple and 20% tax rate. New Arrangements Help Exceed Long-Term Targets Solidifies Current Trajectory to Drive Lower FRE Comp Ratio PII Comp Reallocated from Senior Leaders and Further Allocation to Other Employees 30% ~25% 29% 27% (1) 20% 22% 24% 26% 28% 30% 2022 2023 2024 2025 2026 Investor Day Target Pro Forma Trajectory Each 1% reduction in FRE compensation ratio creates ~$500mm of enterprise value(2) 65% 75% 0% 10% 20% 30% 40% 50% 60% 70% 80% 90% 2022 2023 2024 2025 2026 Target Range

7Private and Confidential Mar-21 Sep-21 Mar-22 Sep-22 Mar-23 Sep-23 Source: FactSet. S&P Capital IQ Pro, and Bloomberg Finance LP. Data as of October 26, 2023. 1. Represents CAGR over 2019 – 3Q’23 LTM. Aligning Incentives Helps Drive Long-Term Value Creation for Shareholders APO 75% S&P 500 12% XLF 0% Since the announcement of the Athene merger, Apollo has generated a total return that is significantly greater than the broader Financials sector and ~6x the S&P 500 Fee Related Earnings CAGR1 17% Spread Related Earnings CAGR1 23% Delivering substantial earnings growth while executing business plan:
8Private and Confidential Forward Looking Statements & Other Important Disclosures Forward Looking Statements. In this presentation, references to “Apollo,” “we,” “us,” “our” and the “Company” refer collectively to Apollo Global Management, Inc. and its subsidiaries, or as the context may otherwise require. This presentation may contain forward-looking statements that are within the meaning of Section 27A of the Securities Act of 1933, as amended, and Section 21E of the Securities Exchange Act of 1934, as amended. These statements include, but are not limited to, discussions related to Apollo’s expectations regarding the performance of its business, its liquidity and capital resources and other non-historical statements. These forward-looking statements are based on management’s beliefs, as well as assumptions made by, and information currently available to, management. When used in this presentation, the words “believe,” “anticipate,” “estimate,” “expect,” "intend," "target" or future or conditional verbs, such as "will," "should," "could," or "may" and similar expressions, including “forecast”, are intended to identify forward-looking statements. Although management believes that the expectations reflected in these forward-looking statements are reasonable, it can give no assurance that these expectations will prove to have been correct. These statements are subject to certain risks, uncertainties and assumptions, including risks relating to inflation, market conditions and interest rate fluctuations generally, the impact of COVID-19, the impact of energy market dislocation, our ability to manage our growth, our ability to operate in highly competitive environments, the performance of the funds we manage, our ability to raise new funds, the variability of our revenues, earnings and cash flow, the accuracy of management’s assumptions and estimates, our dependence on certain key personnel, our use of leverage to finance our businesses and investments by the funds we manage, Athene’s ability to maintain or improve financial strength ratings, the impact of Athene’s reinsurers failing to meet their assumed obligations, Athene’s ability to manage its business in a highly regulated industry, changes in our regulatory environment and tax status, and litigation risks, among others. We believe these factors include but are not limited to those described under the section entitled “Risk Factors” in the Company's annual report on Form 10-K filed with the Securities and Exchange Commission (the “SEC”) on March 1, 2023, as such factors may be updated from time to time in our periodic filings with the SEC, which are accessible on the SEC’s website at www.sec.gov. These factors should not be construed as exhaustive and should be read in conjunction with the other cautionary statements that are included in this presentation and in our other filings with the SEC. We undertake no obligation to publicly update or review any forward-looking statements, whether as a result of new information, future developments or otherwise, except as required by applicable law. Estimates and Assumptions. This presentation includes certain unaudited financial and business projections and goals on Apollo’s future outlook (the “Estimates”). Apollo does not regularly provide future guidance or publicly disclose forecasts or projections as to future performance, earnings or other results due to the inherent unpredictability of projections and their underlying assumptions and estimates. The Estimates were not prepared with a view toward public disclosure and, accordingly, do not necessarily comply with published guidelines of the SEC or the guidelines established by the American Institute of Certified Public Accountants for preparation and presentation of financial forecasts or GAAP. Neither Apollo’s independent registered public accounting firm, nor any other independent accountants, have audited, reviewed, compiled or performed any procedures with respect to the Estimates or expressed any opinion or any form of assurance related thereto. The Estimates reflect the internal financial model that Apollo uses in connection with its strategic planning. The Estimates are illustrative and are included in this presentation solely to give Apollo’s investors access to these financial projections. The Estimates were based on numerous variables and assumptions made by Apollo’s management with respect to industry performance, general business, economic, regulatory, market and financial conditions and other future events, as well as matters specific to Apollo’s businesses, all of which are difficult or impossible to predict accurately and many of which are beyond the control of Apollo’s management. Because the Estimates cover multiple years, by their nature, they also become subject to greater uncertainty and are less reliable with each successive year. The Estimates reflect subjective judgment in many respects and thus are susceptible to multiple interpretations and periodic revisions based on actual experience and business developments. As such, the Estimates constitute forward-looking information and are subject to many risks and uncertainties that could cause actual results to differ materially from the results forecasted in these projections. There can be no assurance that the Estimates will be realized or that actual results will not be significantly higher or lower than forecast. The Estimates may be affected by Apollo’s ability to achieve strategic goals, objectives and targets over the applicable period. Please consider carefully the section above titled “Forward Looking Statements”. Accordingly, there can be no assurance that the Estimates will be realized, and actual results may vary materially from those shown. The Estimates cannot, therefore, be considered a guarantee of future operating results, and this information should not be relied on as such. The inclusion of the Estimates in this presentation should not be regarded as an indication that Apollo or any of its affiliates, advisors, officers, directors or representatives considered or considers the Estimates to be necessarily predictive of actual future events, and the Estimates should not be relied upon as such. The inclusion of the Estimates herein should not be deemed an admission or representation by Apollo that its management views the Estimates as material information. Neither Apollo or any of its affiliates, advisors, officers, directors or representatives has made or makes any representation to any of Apollo’s stockholders or any other person regarding the ultimate performance of Apollo compared to the information contained in the Estimates or can give any assurance that actual results will not differ materially from the Estimates, and none of them undertakes any obligation to update or otherwise revise or reconcile the Estimates to reflect circumstances existing after the date the Estimates were generated or to reflect the occurrence of future events even in the event that any or all of the assumptions underlying the Estimates are shown to be in error. Certain of the projected financial information set forth herein may be considered non-GAAP financial measures. There are limitations inherent in non-GAAP financial measures, because they exclude charges and credits that are required to be included in a GAAP presentation. Non-GAAP financial measures should not be considered in isolation from, or as a substitute for, financial information presented in compliance with GAAP, and non-GAAP financial measures as used by Apollo may not be comparable to similarly titled amounts used by other companies. No reconciliation of non-GAAP financial measures in the Estimates to GAAP measures was created or used in connection with preparing the Estimates. In light of the foregoing factors and the uncertainties inherent in the Estimates, Apollo’s stockholders are cautioned not to place undue reliance on the Estimates.
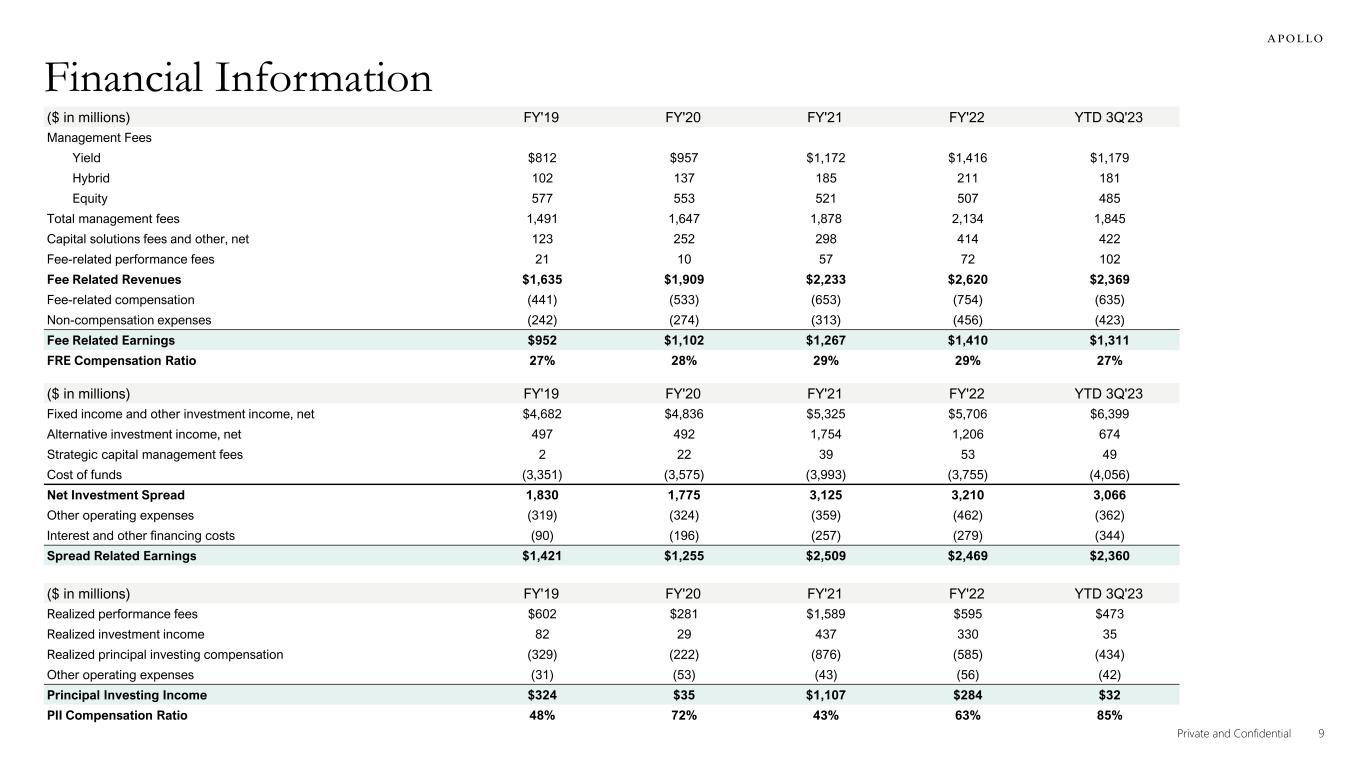
9Private and Confidential Financial Information ($ in millions) FY'19 FY'20 FY'21 FY'22 YTD 3Q'23 Management Fees Yield $812 $957 $1,172 $1,416 $1,179 Hybrid 102 137 185 211 181 Equity 577 553 521 507 485 Total management fees 1,491 1,647 1,878 2,134 1,845 Capital solutions fees and other, net 123 252 298 414 422 Fee-related performance fees 21 10 57 72 102 Fee Related Revenues $1,635 $1,909 $2,233 $2,620 $2,369 Fee-related compensation (441) (533) (653) (754) (635) Non-compensation expenses (242) (274) (313) (456) (423) Fee Related Earnings $952 $1,102 $1,267 $1,410 $1,311 FRE Compensation Ratio 27% 28% 29% 29% 27% ($ in millions) FY'19 FY'20 FY'21 FY'22 YTD 3Q'23 Realized performance fees $602 $281 $1,589 $595 $473 Realized investment income 82 29 437 330 35 Realized principal investing compensation (329) (222) (876) (585) (434) Other operating expenses (31) (53) (43) (56) (42) Principal Investing Income $324 $35 $1,107 $284 $32 PII Compensation Ratio 48% 72% 43% 63% 85% ($ in millions) FY'19 FY'20 FY'21 FY'22 YTD 3Q'23 Fixed income and other investment income, net $4,682 $4,836 $5,325 $5,706 $6,399 Alternative investment income, net 497 492 1,754 1,206 674 Strategic capital management fees 2 22 39 53 49 Cost of funds (3,351) (3,575) (3,993) (3,755) (4,056) Net Investment Spread 1,830 1,775 3,125 3,210 3,066 Other operating expenses (319) (324) (359) (462) (362) Interest and other financing costs (90) (196) (257) (279) (344) Spread Related Earnings $1,421 $1,255 $2,509 $2,469 $2,360

10Private and Confidential Reconciliation of GAAP to Non-GAAP Financial Measures 1. Equity-based profit sharing expense and other includes certain profit sharing arrangements in which a portion of performance fees distributed to the general partner are required to be used by employees of Apollo to purchase restricted shares of common stock or is delivered in the form of RSUs, which are granted under the Equity Plan. Equity-based profit sharing expense and other also includes performance grants which are tied to the Company’s receipt of performance fees, within prescribed periods, sufficient to cover the associated equity-based compensation expense. 2. Transaction-related charges include contingent consideration, equity-based compensation charges and the amortization of intangible assets and certain other charges associated with acquisitions, and restructuring charges. 3. Merger-related transaction and integration costs includes advisory services, technology integration, equity-based compensation charges and other costs associated with the Company’s merger with Athene. 4. Includes one-time equity-based compensation expense and associated taxes related to the Company’s compensation structure reset. 5. Includes change in fair values of derivatives and embedded derivatives, non-operating change in funding agreements, change in fair value of market risk benefits, and non-operating change in liability for future policy benefits. ($ in millions) FY'19 FY'20 FY'21 FY'22 YTD 3Q'23 GAAP Net income (loss) attributable to Apollo Global Management, Inc. Common Stockholders $807 $120 $1,802 $(1,961) $2,269 Preferred dividends 37 37 37 — 22 Net income (loss) attributable to non-controlling interests 693 310 2,428 (1,546) 637 GAAP Net income (loss) $1,537 $467 $4,267 $(3,507) $2,928 Income tax provision (benefit) (129) 86 594 (739) 697 GAAP Income (loss) before Income tax provision (benefit) $1,408 $553 $4,861 $(4,246) $3,625 Asset Management Adjustments: Equity-based profit sharing expense and other1 96 129 146 276 186 Equity-based compensation 71 68 80 185 167 Preferred dividends (37) (37) (37) — — Transaction-related charges2 49 39 35 (42) 18 Merger-related transaction and integration costs3 — — 67 70 17 Charges associated with corporate conversion 22 4 — — — (Gains) losses from changes in tax receivable agreement liability 50 (12) (10) 26 — Net (income) loss attributable to non-controlling interests in consolidated entities (31) (118) (418) 1,499 (687) Unrealized performance fees (435) (35) (1,465) (2) (244) Unrealized profit sharing expense 208 33 649 20 191 One-time equity-based compensation charges4 — — 949 — — HoldCo interest and other financing costs 98 154 170 122 77 Unrealized principal investment (income) loss (88) (62) (222) 176 (66) Unrealized net (gains) losses from investment activities and other (135) 421 (2,431) (144) 50 Retirement Services Adjustments: Investment (gains) losses, net of offsets — — — 7,467 829 Non-operating change in insurance liabilities and related derivatives5 — — — (1,433) (600) Integration, restructuring and other non-operating expenses — — — 133 98 Equity-based compensation expense — — — 56 42 Segment Income $1,276 $1,137 $2,374 $4,163 $3,703
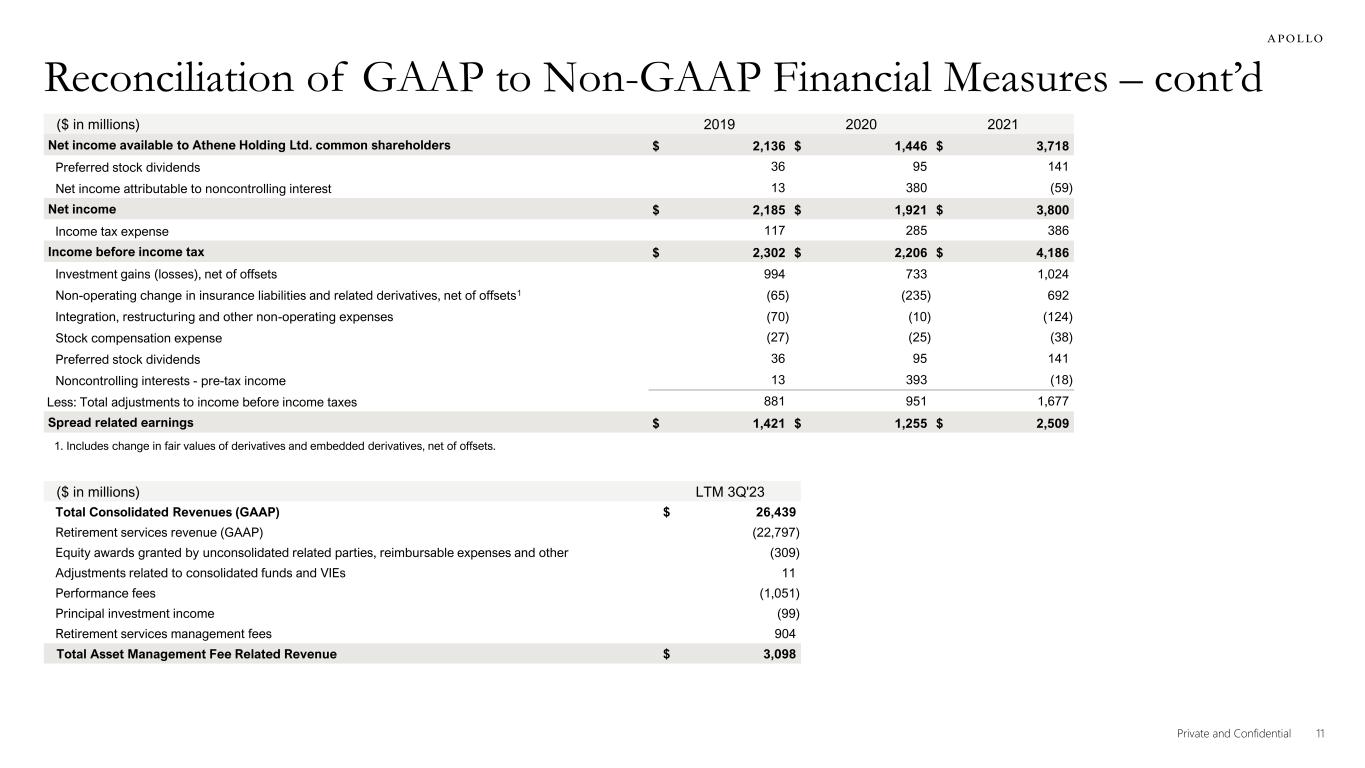
11Private and Confidential Reconciliation of GAAP to Non-GAAP Financial Measures – cont’d 1. Includes change in fair values of derivatives and embedded derivatives, net of offsets. ($ in millions) 2019 2020 2021 Net income available to Athene Holding Ltd. common shareholders $ 2,136 $ 1,446 $ 3,718 Preferred stock dividends 36 95 141 Net income attributable to noncontrolling interest 13 380 (59) Net income $ 2,185 $ 1,921 $ 3,800 Income tax expense 117 285 386 Income before income tax $ 2,302 $ 2,206 $ 4,186 Investment gains (losses), net of offsets 994 733 1,024 Non-operating change in insurance liabilities and related derivatives, net of offsets1 (65) (235) 692 Integration, restructuring and other non-operating expenses (70) (10) (124) Stock compensation expense (27) (25) (38) Preferred stock dividends 36 95 141 Noncontrolling interests - pre-tax income 13 393 (18) Less: Total adjustments to income before income taxes 881 951 1,677 Spread related earnings $ 1,421 $ 1,255 $ 2,509 ($ in millions) LTM 3Q'23 Total Consolidated Revenues (GAAP) $ 26,439 Retirement services revenue (GAAP) (22,797) Equity awards granted by unconsolidated related parties, reimbursable expenses and other (309) Adjustments related to consolidated funds and VIEs 11 Performance fees (1,051) Principal investment income (99) Retirement services management fees 904 Total Asset Management Fee Related Revenue $ 3,098
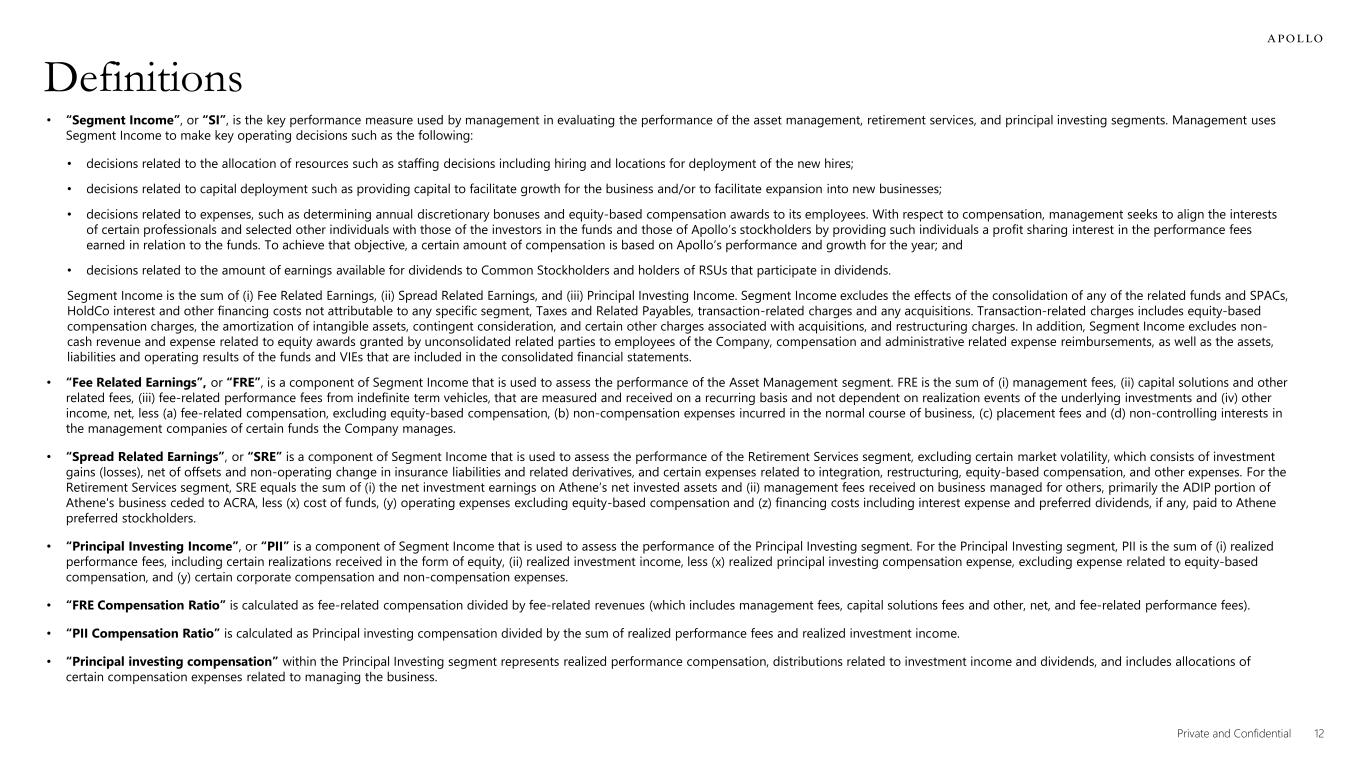
12Private and Confidential Definitions • “Segment Income”, or “SI”, is the key performance measure used by management in evaluating the performance of the asset management, retirement services, and principal investing segments. Management uses Segment Income to make key operating decisions such as the following: • decisions related to the allocation of resources such as staffing decisions including hiring and locations for deployment of the new hires; • decisions related to capital deployment such as providing capital to facilitate growth for the business and/or to facilitate expansion into new businesses; • decisions related to expenses, such as determining annual discretionary bonuses and equity-based compensation awards to its employees. With respect to compensation, management seeks to align the interests of certain professionals and selected other individuals with those of the investors in the funds and those of Apollo’s stockholders by providing such individuals a profit sharing interest in the performance fees earned in relation to the funds. To achieve that objective, a certain amount of compensation is based on Apollo’s performance and growth for the year; and • decisions related to the amount of earnings available for dividends to Common Stockholders and holders of RSUs that participate in dividends. Segment Income is the sum of (i) Fee Related Earnings, (ii) Spread Related Earnings, and (iii) Principal Investing Income. Segment Income excludes the effects of the consolidation of any of the related funds and SPACs, HoldCo interest and other financing costs not attributable to any specific segment, Taxes and Related Payables, transaction-related charges and any acquisitions. Transaction-related charges includes equity-based compensation charges, the amortization of intangible assets, contingent consideration, and certain other charges associated with acquisitions, and restructuring charges. In addition, Segment Income excludes non- cash revenue and expense related to equity awards granted by unconsolidated related parties to employees of the Company, compensation and administrative related expense reimbursements, as well as the assets, liabilities and operating results of the funds and VIEs that are included in the consolidated financial statements. • “Fee Related Earnings”, or “FRE”, is a component of Segment Income that is used to assess the performance of the Asset Management segment. FRE is the sum of (i) management fees, (ii) capital solutions and other related fees, (iii) fee-related performance fees from indefinite term vehicles, that are measured and received on a recurring basis and not dependent on realization events of the underlying investments and (iv) other income, net, less (a) fee-related compensation, excluding equity-based compensation, (b) non-compensation expenses incurred in the normal course of business, (c) placement fees and (d) non-controlling interests in the management companies of certain funds the Company manages. • “Spread Related Earnings”, or “SRE” is a component of Segment Income that is used to assess the performance of the Retirement Services segment, excluding certain market volatility, which consists of investment gains (losses), net of offsets and non-operating change in insurance liabilities and related derivatives, and certain expenses related to integration, restructuring, equity-based compensation, and other expenses. For the Retirement Services segment, SRE equals the sum of (i) the net investment earnings on Athene’s net invested assets and (ii) management fees received on business managed for others, primarily the ADIP portion of Athene's business ceded to ACRA, less (x) cost of funds, (y) operating expenses excluding equity-based compensation and (z) financing costs including interest expense and preferred dividends, if any, paid to Athene preferred stockholders. • “Principal Investing Income”, or “PII” is a component of Segment Income that is used to assess the performance of the Principal Investing segment. For the Principal Investing segment, PII is the sum of (i) realized performance fees, including certain realizations received in the form of equity, (ii) realized investment income, less (x) realized principal investing compensation expense, excluding expense related to equity-based compensation, and (y) certain corporate compensation and non-compensation expenses. • “FRE Compensation Ratio” is calculated as fee-related compensation divided by fee-related revenues (which includes management fees, capital solutions fees and other, net, and fee-related performance fees). • “PII Compensation Ratio” is calculated as Principal investing compensation divided by the sum of realized performance fees and realized investment income. • “Principal investing compensation” within the Principal Investing segment represents realized performance compensation, distributions related to investment income and dividends, and includes allocations of certain compensation expenses related to managing the business.


