株探米国株
エドガーで原本を確認する
0001841761FALSE00018417612025-11-132025-11-13


UNITED STATES
SECURITIES AND EXCHANGE COMMISSION
Washington, D.C. 20549
 
FORM 8-K
CURRENT REPORT
Pursuant to Section 13 or 15(d)
of the Securities Exchange Act of 1934
Date of Report (Date of earliest event reported): August 6, 2026
 
GROVE COLLABORATIVE HOLDINGS, INC.
(Exact name of registrant as specified in its charter)
 
Delaware 001-40263 88-2840659
(State or other jurisdiction
of incorporation)
(Commission
File Number)
(IRS Employer
Identification No.)
 
1301 Sansome Street
San Francisco, California
94111
(Address of principal executive offices) (Zip Code)
(800) 231-8527
(Registrant’s telephone number, including area code)
Not Applicable
(Former name or former address, if changed since last report)
 
Check the appropriate box below if the Form 8-K filing is intended to simultaneously satisfy the filing obligation of the registrant under any of the following provisions:
 
Written communications pursuant to Rule 425 under the Securities Act (17 CFR 230.425)
Soliciting material pursuant to Rule 14a-12 under the Exchange Act (17 CFR 240.14a-12)
Pre-commencement communications pursuant to Rule 14d-2(b) under the Exchange Act (17 CFR 240.14d-2(b))
Pre-commencement communications pursuant to Rule 13e-4(c) under the Exchange Act (17 CFR 240.13e- 4(c))
Securities registered pursuant to Section 12(b) of the Act:
Title of each class
Trading
Symbol(s)
Name of each exchange
on which registered
Class A common stock, par value $0.0001 GROV New York Stock Exchange
Indicate by check mark whether the registrant is an emerging growth company as defined in Rule 405 of the Securities Act of 1933 (§230.405 of this chapter) or Rule 12b-2 of the Securities Exchange Act of 1934 (§240.12b-2 of this chapter).
Emerging growth company  
If an emerging growth company, indicate by check mark if the registrant has elected not to use the extended transition period for complying with any new or revised financial accounting standards provided pursuant to Section 13(a) of the Exchange Act.  


Item 2.02. Results of Operations and Financial Condition

On August 6, 2026, Grove Collaborative Holdings, Inc. (the "Company") issued a press release announcing its earnings for the quarter ended June 30, 2026. A copy of such press release is furnished as Exhibit 99.1 to this Current Report on Form 8-K and incorporated herein by reference.

The information provided pursuant to this Item 2.02, including Exhibit 99.1 attached hereto, is being furnished to the Securities and Exchange Commission and shall not be deemed “filed” for purposes of Section 18 of the Securities Exchange Act of 1934, as amended (the “Exchange Act”), or otherwise subject to the liabilities of that section, nor shall it be deemed incorporated by reference into any filing under the Securities Act of 1933, as amended, or the Exchange Act, regardless of any general incorporation language within such filings except as expressly set forth by specific reference in such filing


Item 7.01 Regulation FD Disclosure

Investor Presentation

On August 6, 2026, the Company posted an investor presentation on its investor relations website at investors.grove.co, which may be used in presentations by the Company's management to investors, analysts and others from time to time. A copy of this presentation is furnished as Exhibit 99.2 and incorporated into this Item 7.01 by reference.

The foregoing (including Exhibit 99.2) is being furnished pursuant to Item 7.01 and will not be deemed to be filed for purposes of Section 18 of the Exchange Act or otherwise be subject to the liabilities of that section, nor shall it be deemed incorporated by reference into any filing under the Securities Act of 1933, as amended, or the Exchange Act, regardless of any general incorporation language in such filings, except as expressly set forth by specific reference in such filing. The submission of the information set forth in this Item 7.01 shall not be deemed an admission as to the materiality of any information in this Item 7.01, including the information presented in Exhibit 99.2 that is provided solely in connection with Regulation FD.


Item 8.01 Other Events

Where You Can Find More Information

Investors and others should note that we announce material financial and operational information to company investors using a variety of disclosure channels as a means of disclosing information about the company, our products and for complying with disclosure obligations under Regulation FD , including:

Our company website (grove.co)
Our investor relations website (investors.grove.co)
Our company social media channels including: x.com/grovecollab, instagram.com/grovecollaborative/, linkedin.com/company/grove-collaborative/, tiktok.com/@grovecollaborative, facebook.com/GroveCollab/, reddit.com/user/grovecollaborative/, reddit.com/user/GroveCO
Jeff Yurcisin's social media accounts, including: linkedin.com/in/yurcisin/, x.com/yurcisin, tiktok.com/@jeffyurcisin and facebook.com/profile.php?id=61550308894238
Press releases
SEC filings
Public conference calls and webcasts

The social media channels that we and our brands intend to use as a means of disclosing information described above may be updated from time to time as listed on our Investor Relations website.


Item 9.01 Financial Statements and Exhibits.
(d) Exhibits.
Exhibit
No.
Description
99.1
99.2
104 Cover Page Interactive Data File (formatted as Inline XBRL)


SIGNATURES
Pursuant to the requirements of the Securities Exchange Act of 1934, the registrant has duly caused this report to be signed on its behalf by the undersigned hereunto duly authorized.
 
GROVE COLLABORATIVE HOLDINGS, INC.

By:
/s/ Tom Siragusa
Name:  Tom Siragusa
Title:  Chief Financial Officer
Date: August 6, 2026


EX-99.1 2 exhibit991-2q2026earningsr.htm EX-99.1 Document
Exhibit 99.1

image_1a.jpg


Grove Announces Second Quarter 2026 Financial Results

SAN FRANCISCO, CA — August 6, 2026 Grove Collaborative Holdings, Inc. (NYSE: GROV) (“Grove” or the “Company”), the world’s first plastic neutral retailer and a leading sustainable consumer products company, certified B Corporation, and Public Benefit Corporation, today reported financial results for its fiscal second quarter ended June 30, 2026.

Key Second Quarter 2026 Financial Highlights:
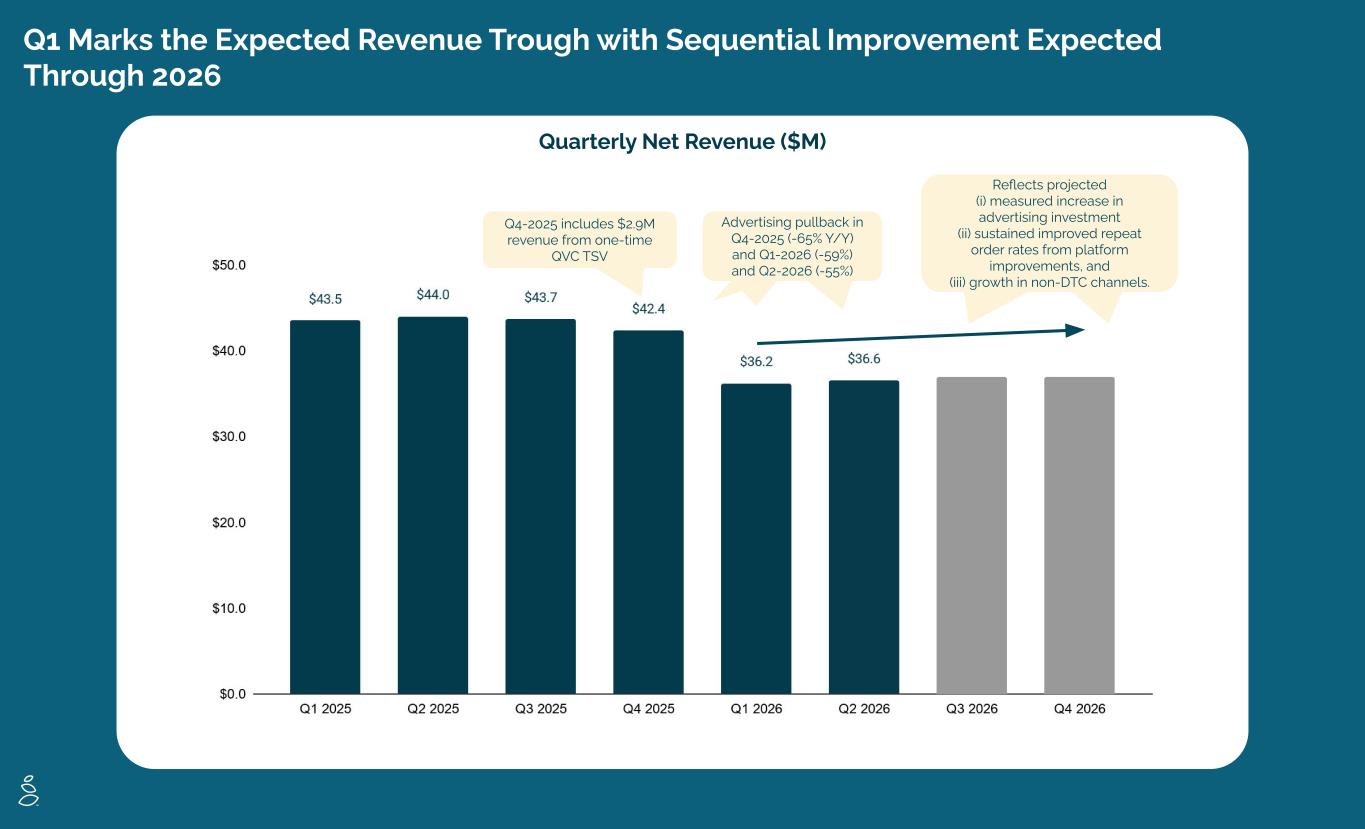
Total Net Revenue was $36.6 million, down 16.9% year-over-year, but up 1.0% sequentially
Adjusted EBITDA was positive $0.5 million, compared to negative $0.9 million in the same period last year - the third consecutive quarter of positive Adjusted EBITDA
Net Loss was $0.9 million, compared to a Net Loss of $3.6 million in the same period last year
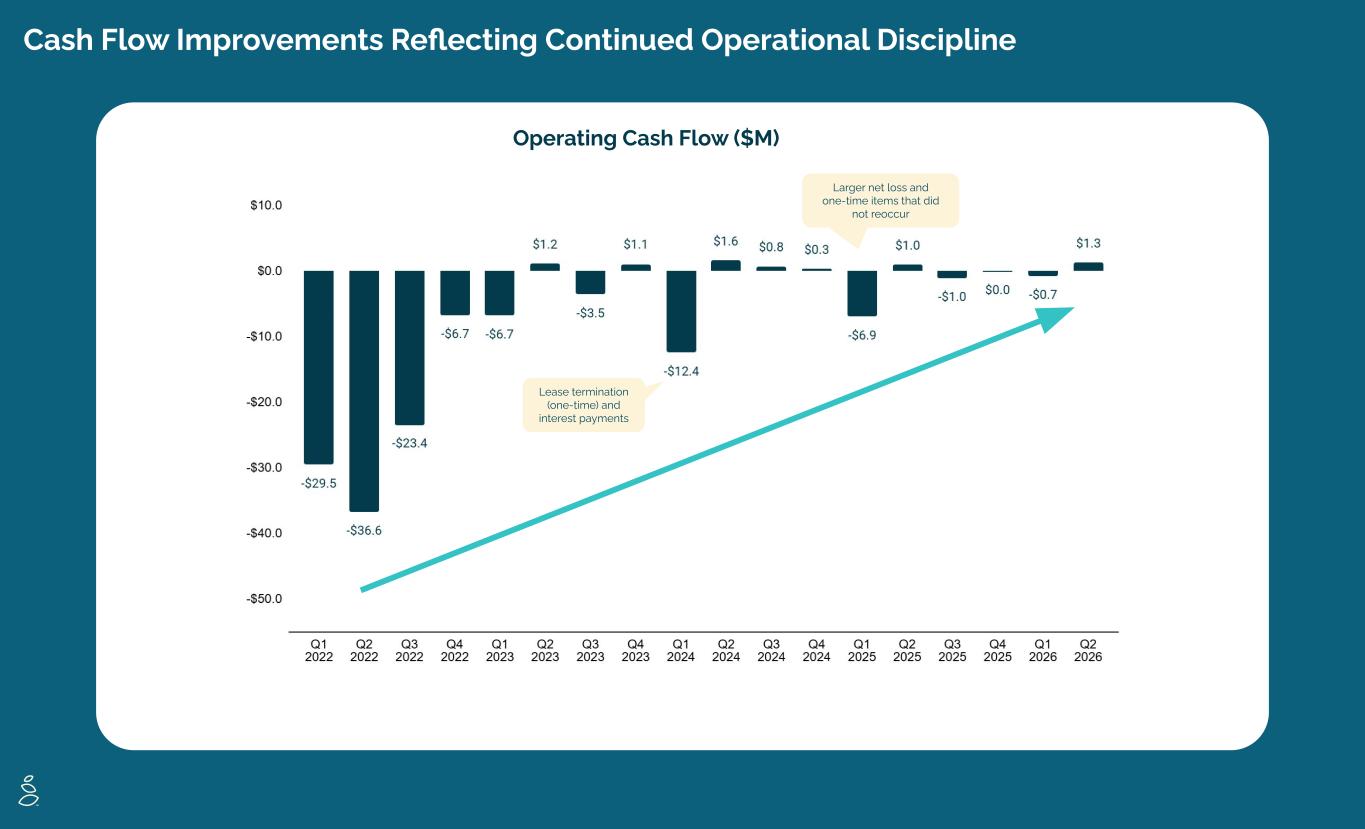
Operating Cash Flow was positive $1.3 million, compared to positive $1.0 million in the same period last year
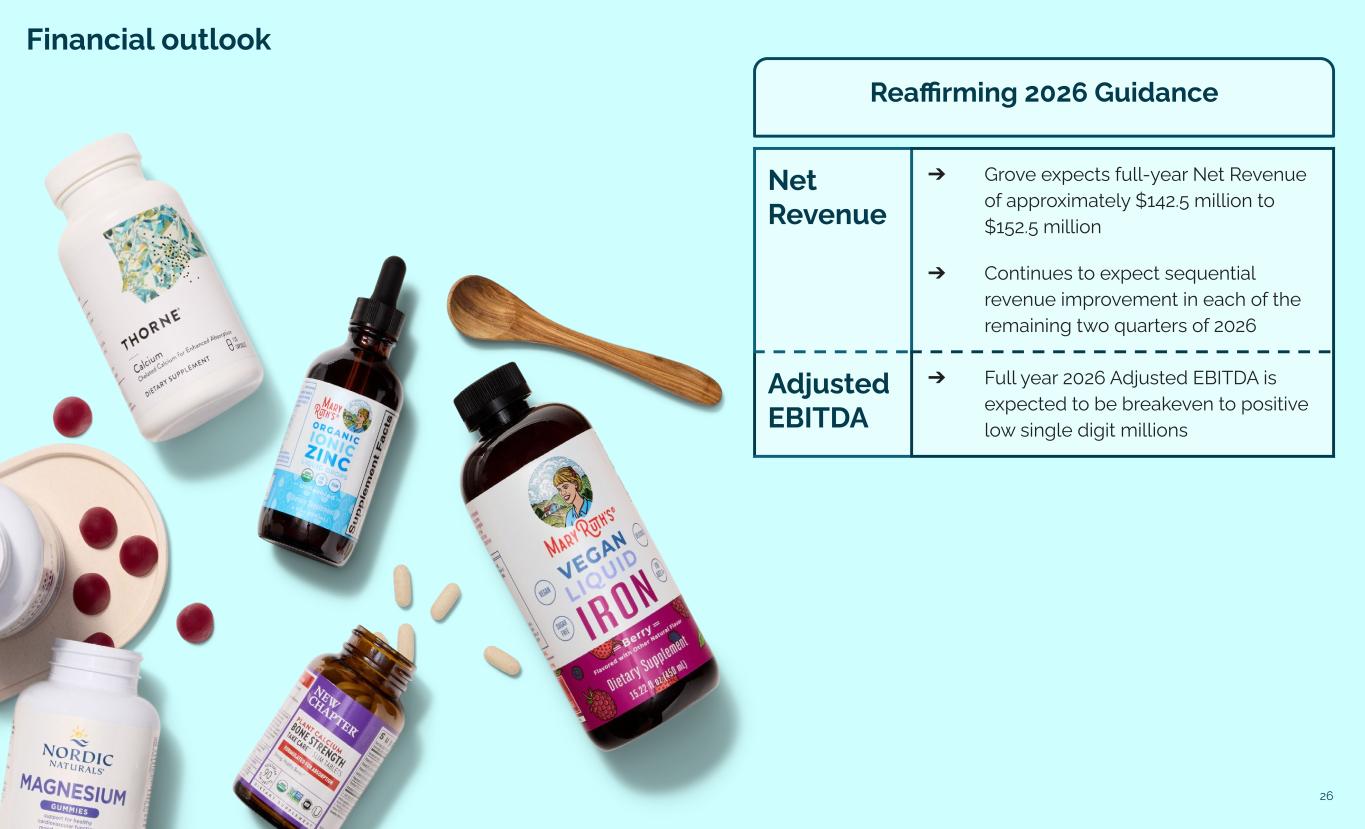
Reaffirming full-year Net Revenue guidance of $142.5 million to $152.5 million and Adjusted EBITDA guidance of breakeven to positive low single digit millions

“Second quarter results came in as we expected when we raised our full-year outlook last quarter. Net Revenue grew 1.0% sequentially to $36.6 million, and we delivered Adjusted EBITDA of $0.5 million, our third consecutive quarter of positive Adjusted EBITDA. This reflects the operating discipline we described in the first quarter continuing to play out and it’s now showing up clearly in our financial statements.

As our strategy continues to take hold, we are continuing to invest in the customer experience to drive long-term profitable growth. In the second quarter, we launched our new subscription experience, designed to give customers a seamless and customized experience that matches their ordering cadence, replacing the last major element of our technology migration from early 2025. While that foundational work is now complete, we will move towards customer-first innovation as we build a unique and defensible customer experience that enables them to build a healthier home for the people they love,” said Jeff Yurcisin, Chief Executive Officer of Grove Collaborative.
Second Quarter 2026 Financial Results
(All comparisons are versus the quarter ended June 30, 2025 except where otherwise noted)

Net Revenue was $36.6 million for the quarter ended June 30, 2026, a decline of 16.9% year-over-year, but an increase of 1.0% compared to the first quarter of 2026. The year-over-year decline was primarily driven by a smaller active customer base entering the year, reflecting the compounding effects of lower advertising investment – consistent with the strategy to prioritize profitability and customer experience improvements before re-accelerating growth – and customer attrition tied to the ecommerce platform disruptions experienced throughout 2025, partially offset by an increase in Direct to Consumer (“DTC”) Net Revenue per Order. The sequential increase was driven by growth from non-DTC channels, primarily QVC and Amazon, partially offset by a slight decline in DTC revenue.

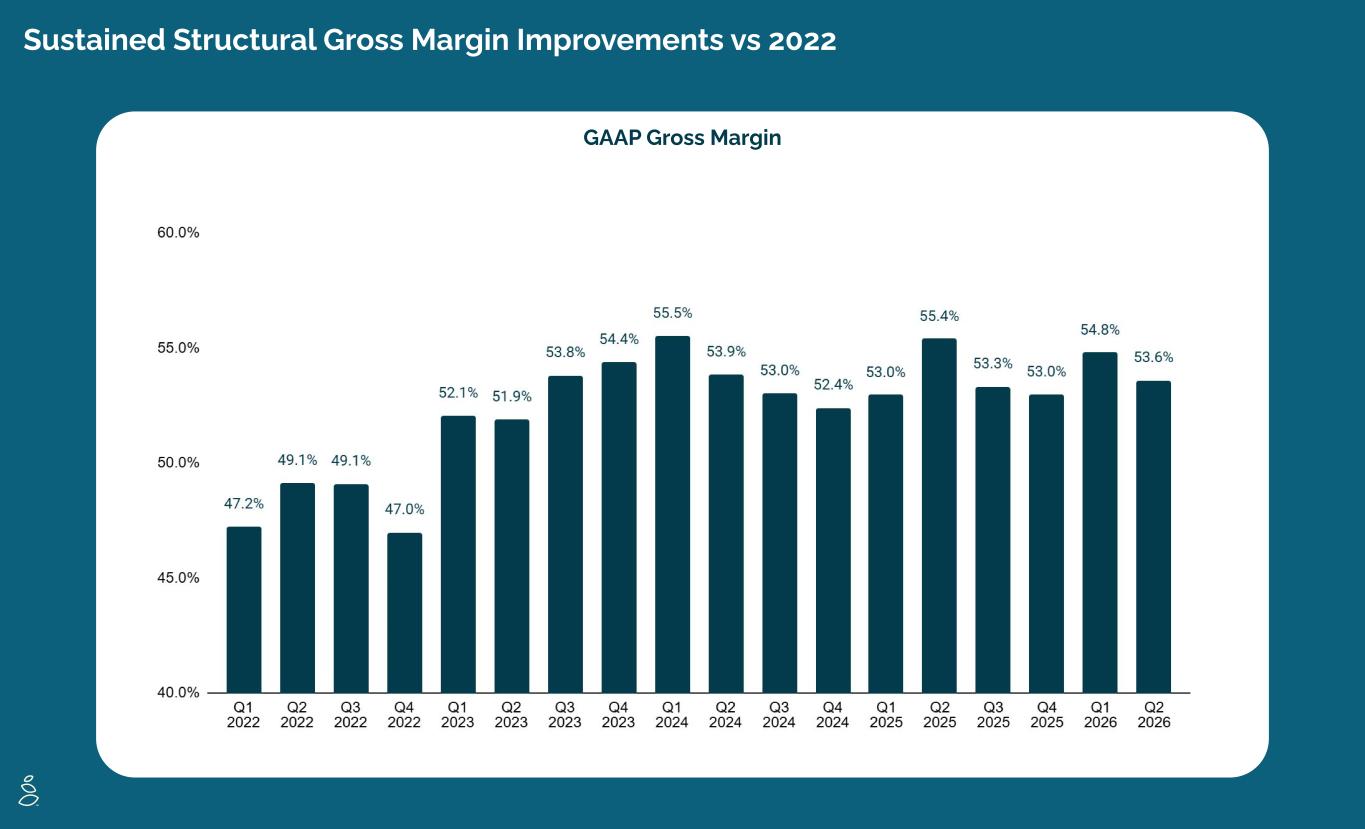
Gross Margin was 53.6%, a decrease of 190 basis points compared to 55.4% in the second quarter of 2025. The decrease was primarily driven by one-time disposals in the quarter, as well as a sell-through of previously reserved inventory in the prior year that did not reoccur. These decreases were partially offset by a more targeted promotional strategy, enabled in part by the Grove Green Rewards loyalty program launched in the fourth quarter of 2025.

Operating Expenses were $20.4 million, a decrease of 27.0% compared to $27.9 million in the prior-year period. The decline reflects lower personnel-related expenses from reduced headcount, lower fulfillment costs driven by lower order volume and lower outbound shipping rates, and lower advertising spend.

Net Loss was $0.9 million, or (2.5%) Net Loss margin, compared to a net loss of $3.6 million, or (8.2%) Net Loss margin, in the prior-year period. The year-over-year improvement reflects lower operating expenses, offset by the decline in revenue.

Adjusted EBITDA was positive $0.5 million, or 1.3% margin, compared to negative $0.9 million, or (2.1%) margin, in the prior-year period. This marks the third consecutive quarter of positive Adjusted EBITDA and reflects continued operating discipline as the Company invests in the customer experience.

Operating Cash Flow was positive $1.3 million for the quarter, reflecting favorable working capital movements, including a decrease in inventory, and the benefit of non-cash expenses added back to Net Loss. This compares to positive $1.0 million in the prior-year period.

Cash, Cash Equivalents, and Restricted Cash totaled $11.4 million as of June 30, 2026, up from $10.4 million as of March 31, 2026, primarily reflecting positive Operating Cash Flow, partially offset by higher capitalized expenditures as a result of continued investment in eCommerce platform enhancements.

Second Quarter 2026 Key Metrics:
Three Months Ended
June 30,
(in thousands, except DTC Net Revenue Per Order)
2026 2025
Financial and Operating Data
DTC Total Orders
489  640 
DTC Active Customers
509  664 
DTC Net Revenue Per Order
$ 69.19  $ 65.23 

Direct to Consumer (DTC) Total Orders were 489,000, a decline of 23.6% year-over-year. The decrease was primarily driven by a smaller active customer base entering the year, reflecting lower advertising investment relative to prior years and customer attrition associated with the 2025 ecommerce platform disruptions, both of which resulted in fewer new customers and, given the recurring nature of the business, fewer repeat orders.

DTC Active Customers – defined as the number of customers that have placed an order in the trailing twelve months – totaled 509,000 as of June 30, 2026, a decrease of 23.3% year-over-year. The decline is consistent with the factors described above.

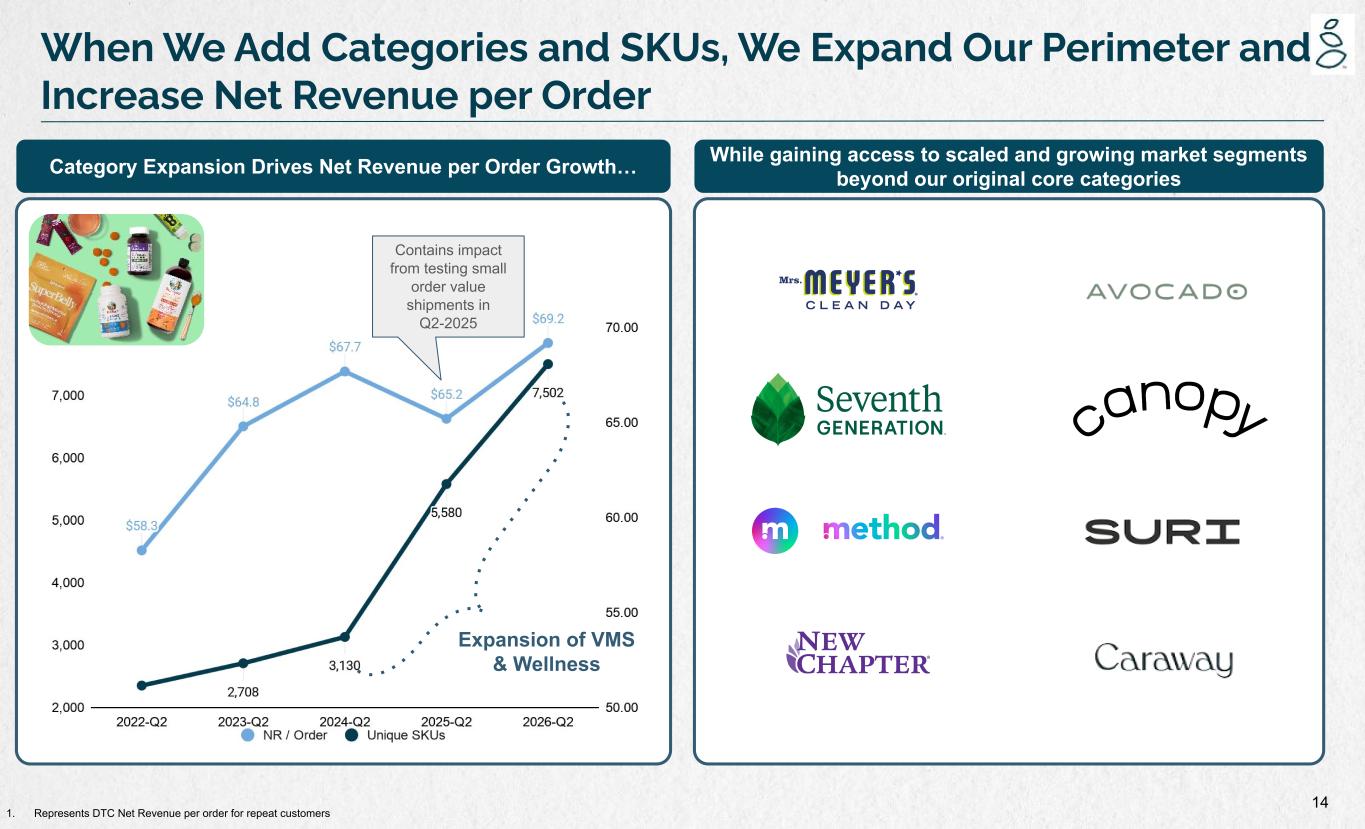
DTC Net Revenue Per Order was $69.19, an increase of 6.1% year-over-year. The improvement was driven primarily by a larger mix of higher-priced items in customer orders, reflecting the Company’s continued category expansion, as well as greater efficiency in promotional spend following the launch of the Company’s new loyalty program. The year-over-year comparison also benefited from a prior-year test that temporarily increased the volume of smaller value orders, which did not reoccur in the second quarter of 2026.

Plastic Intensity1measured as pounds of plastic per $100 in net revenue across all online and retail sales — was 0.84 pounds in the second quarter of 2026, improving from 0.93 pounds in the second quarter of 2025.

2026 Financial Outlook:
For the twelve-month period ending December 31, 2026, Grove is reaffirming its full-year guidance.
The Company continues to expect full-year net revenue of approximately $142.5 million to $152.5 million, and Adjusted EBITDA of breakeven to positive low single digit millions
The Company continues to expect sequential net revenue improvement in each of the remaining quarters of 2026.

Webcast and Conference Call Information:
The Company will host an investor conference call and webcast to review these financial results at 5:00pm ET / 2:00pm PT on the same day. The webcast can be accessed at https://investors.grove.co/. The conference call can be accessed by calling 877-413-7205. International callers may dial +1 201-689-8537. A replay of the call will be available until September 3, 2026 and can be accessed by dialing 877-660-6853 or 201-612-7415, access ID: 13761742. The webcast will remain available on the Company’s investor relations website for 30 days following the webcast.
About Grove Collaborative Holdings, Inc.
Grove Collaborative Holdings, Inc. (NYSE: GROV) is the one-stop online destination for everyday essentials that create a healthier home and planet. Explore thousands of thoughtfully vetted products for every room and everyone in your home, including household cleaning, personal care, health and wellness, laundry, clean beauty, kitchen, pantry, kids, baby, pet care, and beyond. Everything Grove sells meets a higher standard — from health to sustainability and performance — so you get a great value without compromising your values. As a B Corp and Public Benefit Corporation, Grove goes beyond selling products: every order is carbon neutral, supports plastic waste cleanup initiatives, and lets you see and track the positive impact of your choices. Shopping with purpose starts at Grove.com.

Forward-Looking Statements
This press release contains "forward-looking statements” within the meaning of the Private Securities Litigation Reform Act of 1995. Such statements include, but are not limited to, statements relating to the plan to move to customer-first innovation; the impact of customer experience changes; sequential net revenue improvement in each of the remaining quarters of 2026; and guidance for 2026, including full year 2026 net revenue and Adjusted EBITDA. The forward-looking statements contained in this press release are based on Grove’s current expectations and beliefs in light of the Company’s experience and perception of historical trends, current conditions and expected future developments and their potential effects on the Company as well as other factors believed to be appropriate under the circumstances. There can be no assurance that future developments affecting the Company will be those that have been anticipated. These forward-looking statements involve a number of risks, uncertainties (some of which are beyond the Company’s control) or other assumptions that may cause actual results or performance to be materially different from those expressed or implied by these forward-looking statements, including changes in business, market, financial, political and legal conditions; legal and regulatory matters and developments; risks relating to the uncertainty of the projected financial information; Grove’s ability to successfully expand its business; competition; risks relating to tariffs, inflation and interest rates; effectiveness of the Company’s ecommerce platform and selling and marketing efforts; demand for Grove products and other brands that it sells and those factors discussed in documents filed, or to be filed, with the U.S. Securities and Exchange Commission. Should one or more of these risks or uncertainties materialize, or should any assumptions prove incorrect, actual results may vary in material respects from those projected in these forward-looking statements. All forward-looking statements in this press release are made as of the date hereof, based on information available to Grove as of the date hereof, and Grove assumes no obligation to update any forward-looking statement, whether as a result of new information, future events or otherwise, except as may be required under applicable securities laws.

Non-GAAP Financial Measures
Some of the financial information and data contained in this press release, such as Adjusted EBITDA and Adjusted EBITDA margin, have not been prepared in accordance with United States generally accepted accounting principles (“GAAP”). These non-GAAP financial measures, and other measures that are calculated using such non-GAAP measures, are an addition to, and not a substitute for or superior to, measures of financial performance prepared in accordance with GAAP and should not be considered as an alternative to revenue, operating income, profit before tax, net income or any other performance measures derived in accordance with GAAP. Investors should not consider the non-GAAP financial
measures in isolation from, or as a substitute for, GAAP measures. A reconciliation of historical Adjusted EBITDA to Net Income is provided in the tables at the end of this press release. Reconciliations of projected Adjusted EBITDA and projected Adjusted EBITDA Margin to the closest corresponding GAAP measures are not available without unreasonable effort on a forward-looking basis due to the high variability, complexity, and low visibility with respect to the charges excluded from these non-GAAP measures, such as the impact of depreciation and amortization of fixed assets, amortization of internal use software, the effects of net interest expense (income), other expense (income), and non-cash stock based compensation expense. Grove believes these non-GAAP measures of financial results, including on a forward-looking basis, provide useful information to management and investors regarding certain financial and business trends relating to Grove’s financial condition and results of operations. Grove’s management uses these non-GAAP measures for trend analyses and for budgeting and planning purposes. Grove believes that the use of these non-GAAP financial measures provides an additional tool for investors to use in evaluating projected operating results and trends in and in comparing Grove’s financial measures with other similar companies, many of which present similar non-GAAP financial measures to investors. Management of Grove does not consider these non-GAAP measures in isolation or as an alternative to financial measures determined in accordance with GAAP. There are a number of limitations related to the use of these non-GAAP measures. Other companies may calculate non-GAAP measures differently, or may use other measures to calculate their financial performance, and therefore Grove’s non-GAAP measures may not be directly comparable to similarly titled measures of other companies.
Grove calculates Adjusted EBITDA as net loss, adjusted to exclude: stock-based compensation expense; depreciation and amortization; changes in fair values of derivative liabilities; interest income; interest expense; restructuring costs; transaction related costs related to certain strategic merger & acquisition projects; provision for income taxes and certain litigation and legal settlement expenses that the Company does not consider representative of its underlying operations. We define Adjusted EBITDA Margin as Adjusted EBITDA divided by net revenue. Because Adjusted EBITDA excludes these elements that are otherwise included in the Company’s GAAP financial results, this measure has limitations when compared to net loss determined in accordance with GAAP. Further, Adjusted EBITDA is not necessarily comparable to similarly titled measures used by other companies. For these reasons, investors should not consider Adjusted EBITDA in isolation from, or as a substitute for, net loss determined in accordance with GAAP.

Investor Relations Contact

ir@grove.co

Media Relations Contact

pr@grove.co

1 Grove defines plastic intensity as pounds of plastic used per $100 in revenue as a way to hold itself accountable for the pace at which it decouples revenue from the use of plastic. To calculate plastic intensity, Grove defines "plastic" as any of the following materials within both products and packaging: plastic resin codes #1-7 (from the ASTM International Resin Identification Coding System), inclusive of polyvinyl alcohol (PVA, PVOH, PVAl), silicone, bioplastics, and any plastic liners, coatings, and resins.
1


Grove Collaborative Holdings, Inc.
Condensed Consolidated Balance Sheets
(Unaudited)
(In thousands)

June 30,
2026
December 31,
2025
Assets
Current assets:
Cash and cash equivalents
$ 8,345  $ 8,490 
Restricted cash, current 2,065  2,300 
Inventory
19,458  18,421 
Prepaid expenses and other current assets
4,043  5,492 
Total current assets
33,911  34,703 
Restricted cash, noncurrent 1,002  1,002 
Property and equipment, net
3,469  3,653 
Intangible assets, net 2,098  2,302 
Operating lease right-of-use assets
8,613  9,535 
Other long-term assets
1,696  1,899 
Total assets
$ 50,789  $ 53,094 
Liabilities and Stockholders’ Deficit
Current liabilities:
Accounts payable
$ 6,390  $ 8,828 
Accrued expenses
9,434  9,476 
Deferred revenue
6,906  5,033 
Debt, current —  800 
Operating lease liabilities, current
3,171  2,895 
Other current liabilities
1,047  665 
Total current liabilities
26,948  27,697 
Debt, noncurrent 7,500  6,700 
Operating lease liabilities, noncurrent 8,400  10,053 
Derivative liabilities 700  871 
Total liabilities
43,548  45,321 
Redeemable convertible preferred stock 24,772  24,772 
Stockholders’ deficit:
Common stock
Additional paid-in capital
644,623  643,226 
Accumulated deficit
(662,158) (660,229)
Total stockholders’ deficit (17,531) (16,999)
Total liabilities, redeemable convertible preferred stock and stockholders’ deficit
$ 50,789  $ 53,094 
2


Grove Collaborative Holdings, Inc.
Condensed Consolidated Statements of Operations
(Unaudited)
(In thousands, except share and per share amounts)


Three Months Ended
June 30,
Six Months Ended
June 30,
2026 2025 2026 2025
Revenue, net
$ 36,569  $ 44,026  $ 72,793  $ 87,573 
Cost of goods sold
16,984  19,631  33,353  40,114 
Gross profit
19,585  24,395  39,440  47,459 


Operating expenses:


Advertising
1,235  2,722  2,397  5,529 
Product development
1,513  2,207  2,948  3,986 
Selling, general and administrative
17,620  22,956  35,779  44,942 
Operating loss
(783) (3,490) (1,684) (6,998)
Non-operating expenses (income):


Interest expense
272  305  546  651 
Changes in fair value of derivative liabilities (72) (70) (171) (214)
Other income, net
(71) (109) (146) (281)
Total non-operating expenses, net
129  126  229  156 
Loss before provision for income taxes
(912) (3,616) (1,913) (7,154)
Provision for income taxes
10  16  19 
Net loss
$ (920) $ (3,626) $ (1,929) $ (7,173)
Less: Accumulated dividends on redeemable convertible preferred stock (375) (375) (750) (750)
Net loss attributable to common stockholders, basic and diluted $ (1,295) $ (4,001) $ (2,679) $ (7,923)
Net loss per share attributable to common stockholders, basic and diluted
$ (0.03) $ (0.10) $ (0.07) $ (0.21)
Weighted-average shares used in computing net loss per share attributable to common stockholders, basic and diluted
40,553,480  38,813,480  40,314,583  38,513,390 
3


Grove Collaborative Holdings, Inc.
Condensed Consolidated Statements of Cash Flows
(Unaudited)
(In thousands)
Six Months Ended June 30,
2026 2025
Cash Flows from Operating Activities
Net loss
$ (1,929) $ (7,173)
Adjustments to reconcile net loss to net cash used in operating activities:
Stock-based compensation expense 1,651  2,347 
Depreciation and amortization 790  866 
Changes in fair value of derivative liabilities (171) (214)
Non-cash interest expense 107  219 
Inventory write-down —  (351)
Changes in operating assets and liabilities:
Inventory
(1,037) 1,013 
Prepaids and other assets
2,228  409 
Accounts payable
(2,520) (2,912)
Accrued expenses
89  (87)
Deferred revenue
1,873  (349)
Operating lease right-of-use assets and liabilities
(455) 625 
Other liabilities
(34) (278)
Net cash provided by (used in) operating activities
592  (5,885)
Cash Flows from Investing Activities
Cash paid for acquisitions —  (2,848)
Purchase of property and equipment (451) (972)
Net cash used in investing activities
(451) (3,820)
Cash Flows from Financing Activities
Payment of issuance costs related to preferred stock and SEPA —  (15)
Payment on finance agreement (267) — 
Payments related to stock-based award activities, net (371) (774)
Proceeds from issuance under employee stock purchase plan 117  141 
Net cash used in financing activities
(521) (648)
Net decrease in cash, cash equivalents and restricted cash
(380) (10,353)
Cash, cash equivalents and restricted cash at beginning of period
11,792  24,304 
Cash, cash equivalents and restricted cash at end of period
$ 11,412  $ 13,951 
4


Grove Collaborative Holdings, Inc.
Non-GAAP Financial Measures
(Unaudited)
(In thousands, except percentages)


Three Months Ended
June 30,
Six Months Ended
June 30,
2026 2025 2026 2025
Reconciliation of Net Loss to Adjusted EBITDA
(in thousands, except percentages)
Net loss $ (920) $ (3,626) $ (1,929) $ (7,173)
Stock-based compensation
845  1,378  1,651  2,347 
Depreciation and amortization
399  488  790  866 
Changes in fair value of derivative liabilities (72) (70) (171) (214)
Interest income (71) (109) (146) (281)
Interest expense
272  305  546  651 
Transaction related costs
—  712  —  1,275 
Provision for income taxes
10  16  19 
Total Adjusted EBITDA
$ 461  $ (912) $ 757  $ (2,510)
Net loss margin
(2.5) % (8.2) % (2.6) % (8.2) %
Adjusted EBITDA margin (loss)
1.3  % (2.1) % 1.0  % (2.9) %

Source: Grove Collaborative Holdings, Inc.

5
EX-99.2 3 q22026investorpresentati.htm EX-99.2 q22026investorpresentati
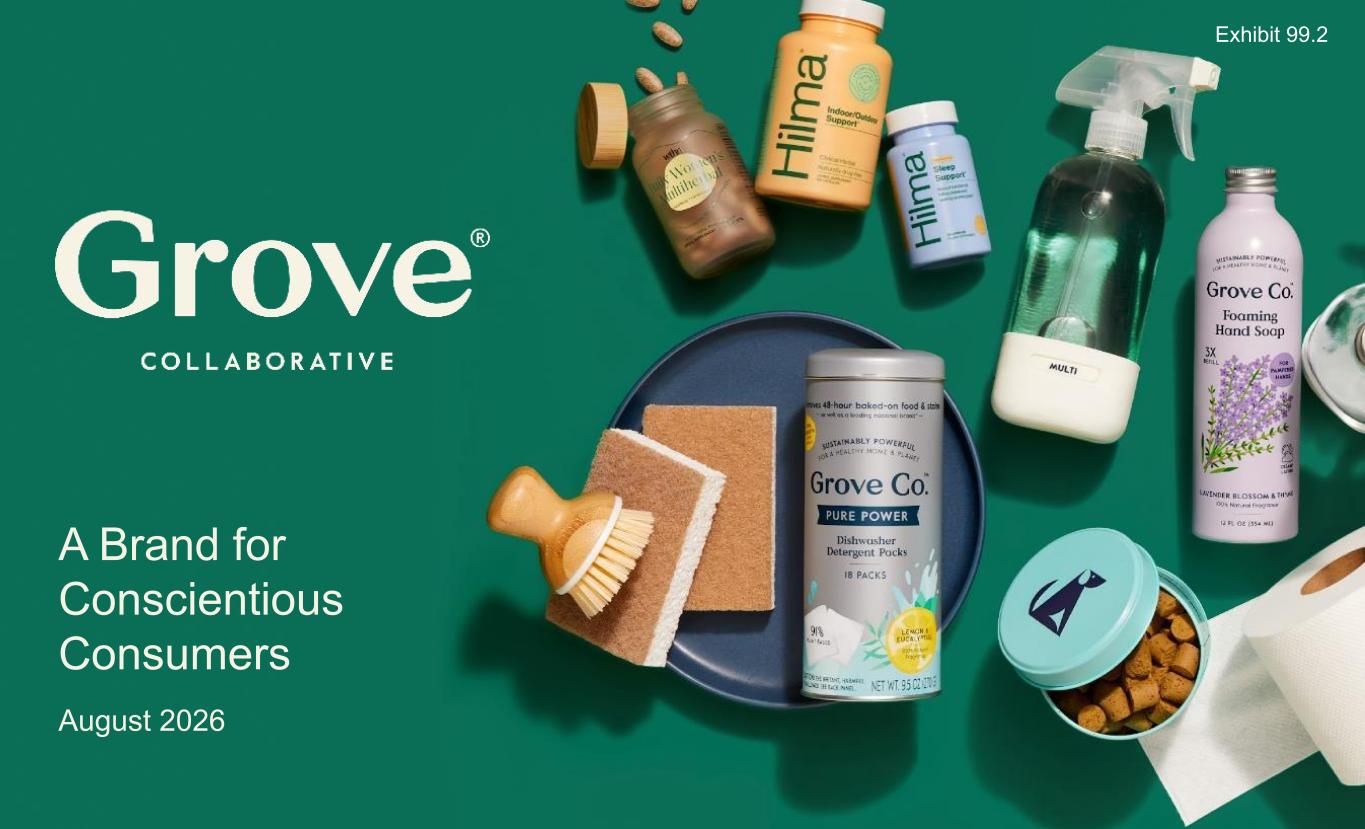
A Brand for Conscientious Consumers August 2026 Exhibit 99.2


All information in this presentation is as of August 6, 2026. Forward-Looking Statements Certain statements included in this presentation are forward-looking statements for purposes of the safe harbor provisions under the United States Private Securities Litigation Reform Act of 1996, as amended. Forward-looking statements are statements other than statements about historical fact. The forward looking statements in this presentation include, but are not limited to, statements regarding quarterly sequential revenue growth from the first quarter 2026, revenue and Adjusted EBITDA for 2026, projected measured increase in advertising investment, projected sustained improved repeat order rates from platform improvements, projected growth in non-DTC channels, guidance for 2026, including projected 2026 net revenue and Adjusted EBITDA and sequential revenue improvement in each of the remaining quarters of 2026. These forward-looking statements are subject to a number of risks and uncertainties, and you should not rely upon the forward-looking statements as predictions of future events. The future events and trends discussed in this presentation may not occur and actual results could differ materially and adversely from those anticipated or implied in the forward-looking statements. Grove cannot guarantee that future results, levels of activity, performance, achievements or events and circumstances reflected in the forward-looking statements will occur. Except as required by law, Grove disclaims any obligation to update these forward-looking statements to reflect future events or circumstances. The forward-looking statements are subject to a number of risks and uncertainties, including: potential disruptions relating to Grove’s technology platform transition, changes in business, market, financial, political and legal conditions, risks relating to the uncertainty of the projected financial information; Grove’s ability to successfully expand its business; competition; risks relating to inflation and interest rates; and those factors discussed in documents of Grove filed, or to be filed, with the U.S. Securities and Exchange Commission. If any of these risks materialize or our assumptions prove incorrect, actual results could differ materially from the results implied by these forward-looking statements. These forward-looking statements should not be relied upon as representing Grove’s assessments as of any date subsequent to the date of this presentation. See Risk Factors in our Form 10-Q filed August 6, 2026. Non-GAAP Information Grove uses certain non-GAAP measures in this presentation including Adjusted EBITDA. Grove believes the presentation of its non-GAAP financial measures enhances investors' overall understanding of the company's historical financial performance. The presentation of the company's non-GAAP financial measures is not meant to be considered in isolation or as a substitute for the company's financial results prepared in accordance with GAAP, and the company's non-GAAP measures may be different from non-GAAP measures used by other companies. Reconciliations of these non-GAAP financial measures to the most comparable GAAP measures, may be found in the Appendix at the end of this presentation. Safe Harbor Statement/Non-GAAP Measures


3 Creating and curating products for healthier homes and a healthy planet.


4 Healthier Homes for the People You Love Click to Watch Video


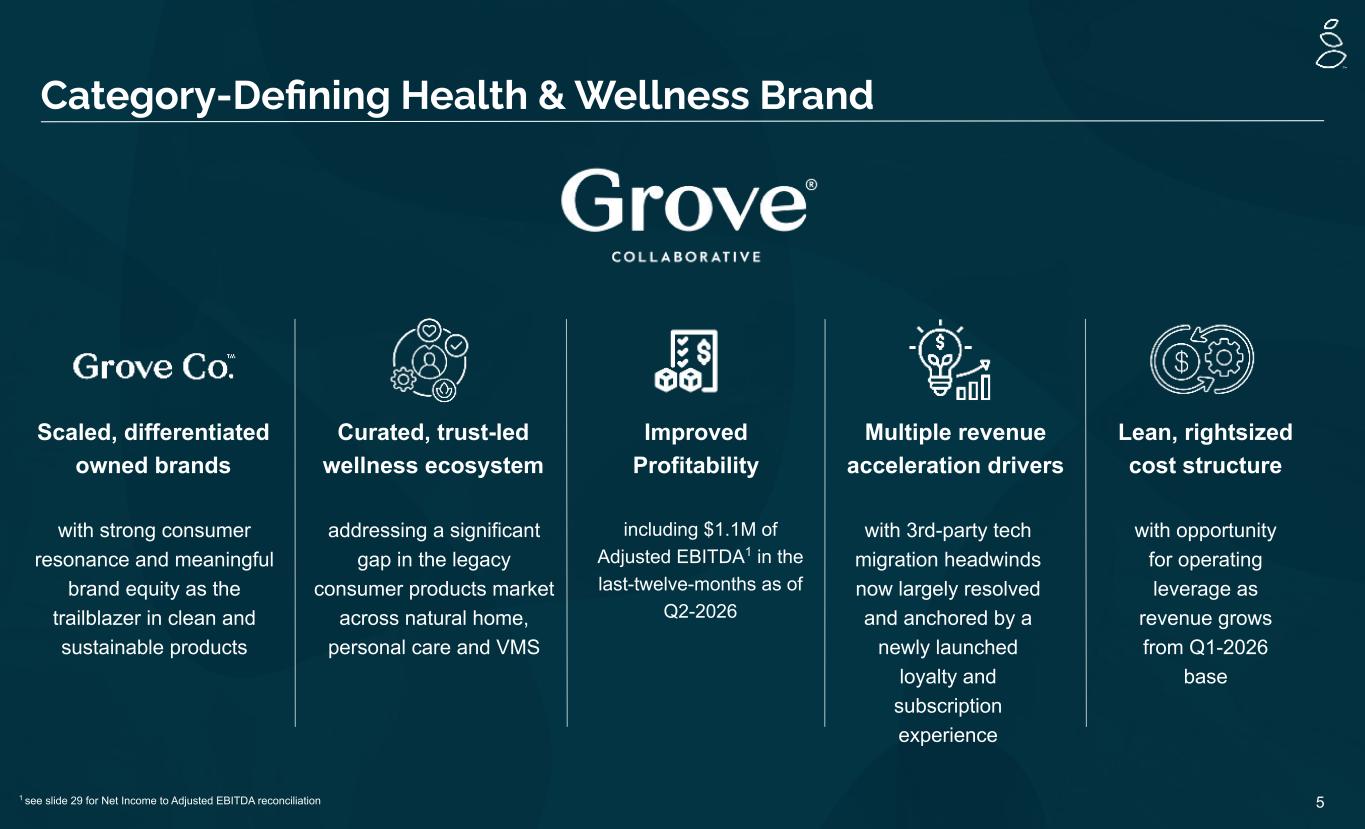
5 Category-Defining Health & Wellness Brand Scaled, differentiated owned brands Multiple revenue acceleration drivers Lean, rightsized cost structure Curated, trust-led wellness ecosystem with opportunity for operating leverage as revenue grows from Q1-2026 base with 3rd-party tech migration headwinds now largely resolved and anchored by a newly launched loyalty and subscription experience Improved Profitability with strong consumer resonance and meaningful brand equity as the trailblazer in clean and sustainable products addressing a significant gap in the legacy consumer products market across natural home, personal care and VMS including $1.1M of Adjusted EBITDA1 in the last-twelve-months as of Q2-2026 1 see slide 29 for Net Income to Adjusted EBITDA reconciliation


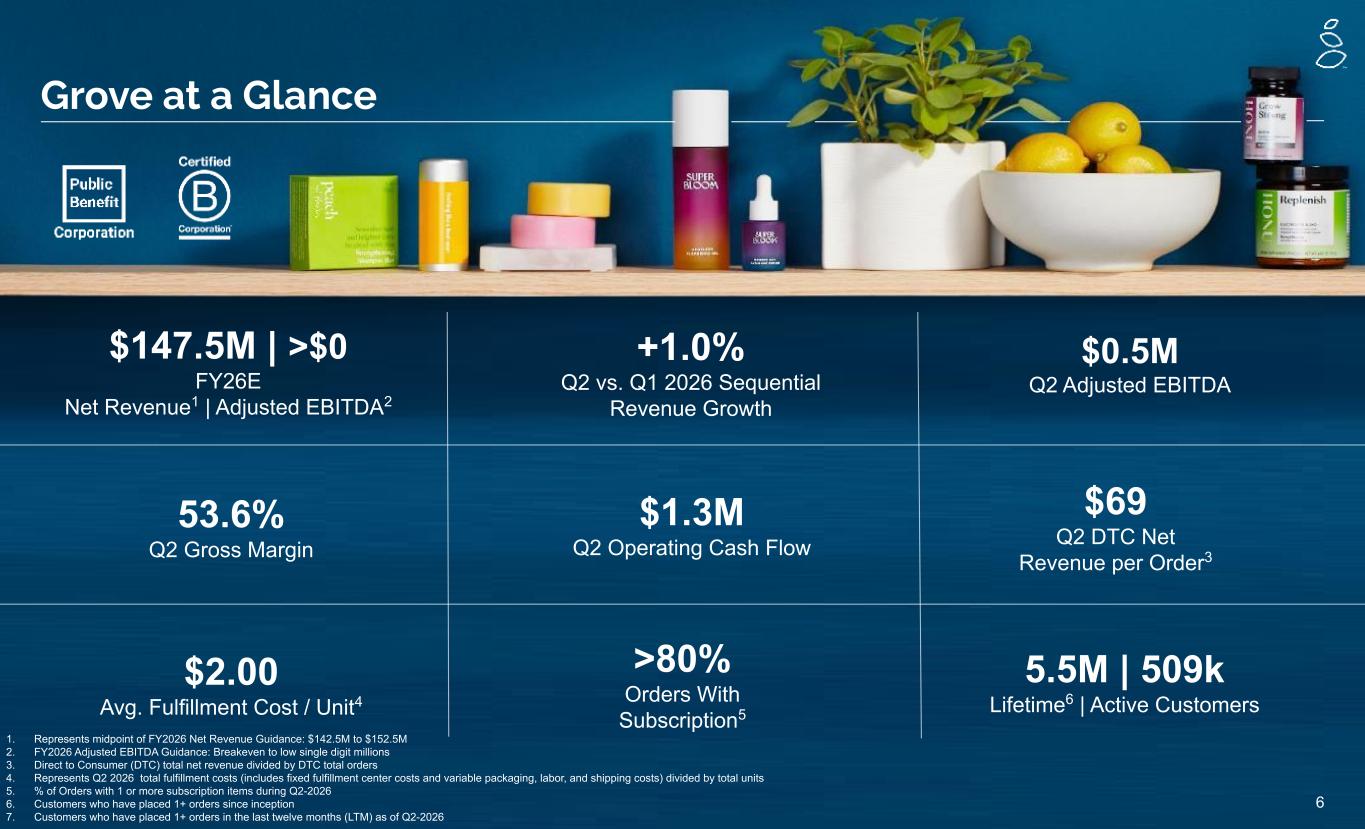
6 Grove at a Glance $147.5M | >$0 FY26E Net Revenue1 | Adjusted EBITDA2 $2.00 Avg. Fulfillment Cost / Unit4 $69 Q2 DTC Net Revenue per Order3 +1.0% Q2 vs. Q1 2026 Sequential Revenue Growth >80% Orders With Subscription5 $0.5M Q2 Adjusted EBITDA 53.6% Q2 Gross Margin 1. Represents midpoint of FY2026 Net Revenue Guidance: $142.5M to $152.5M 2. FY2026 Adjusted EBITDA Guidance: Breakeven to low single digit millions 3. Direct to Consumer (DTC) total net revenue divided by DTC total orders 4. Represents Q2 2026 total fulfillment costs (includes fixed fulfillment center costs and variable packaging, labor, and shipping costs) divided by total units 5. % of Orders with 1 or more subscription items during Q2-2026 6. Customers who have placed 1+ orders since inception 7. Customers who have placed 1+ orders in the last twelve months (LTM) as of Q2-2026 $1.3M Q2 Operating Cash Flow 5.5M | 509k Lifetime6 | Active Customers


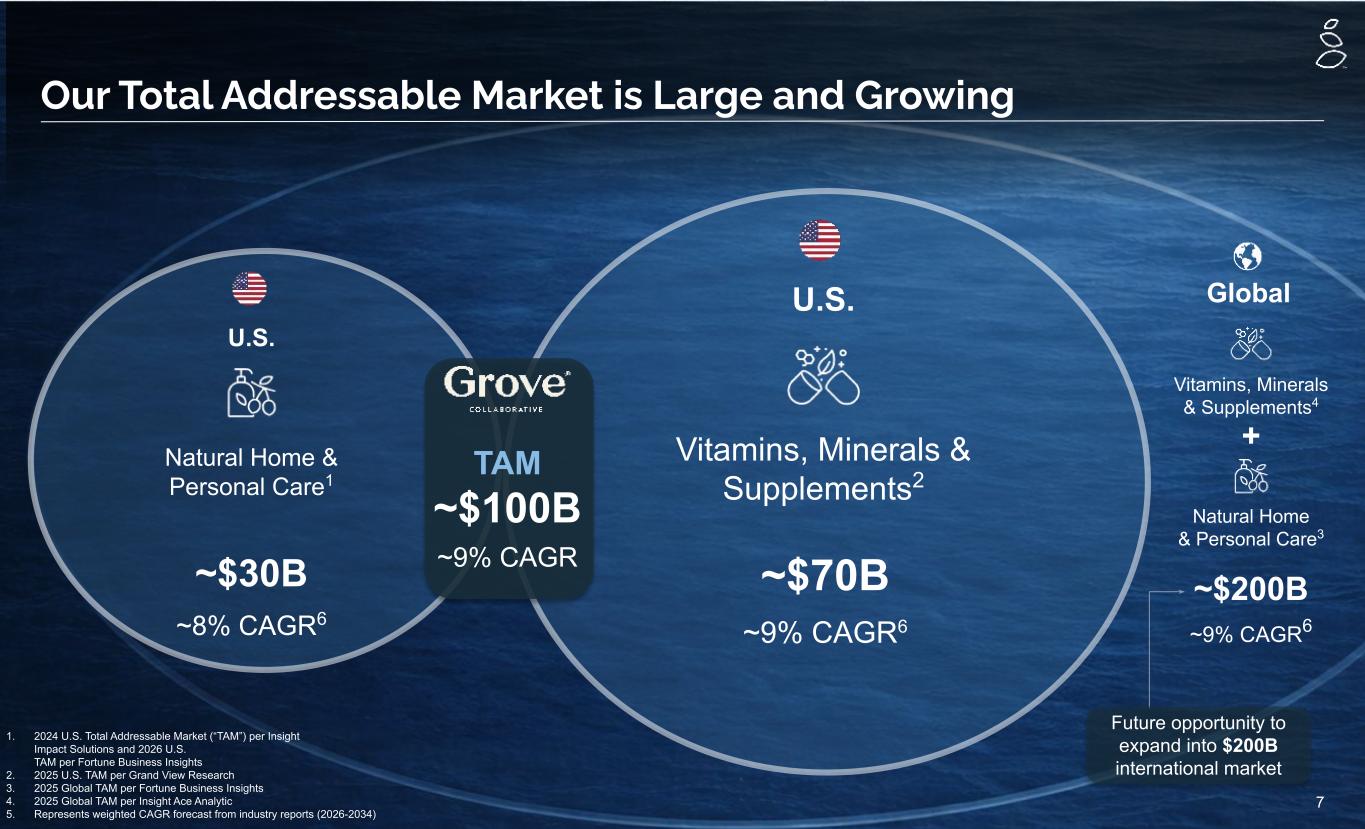
7 Our Total Addressable Market is Large and Growing Natural Home & Personal Care3 ~$200B ~9% CAGR6 +Vitamins, Minerals & Supplements2 ~$70B ~9% CAGR6 U.S. U.S. Natural Home & Personal Care1 ~$30B ~8% CAGR6 1. 2024 U.S. Total Addressable Market (“TAM”) per Insight Impact Solutions and 2026 U.S. TAM per Fortune Business Insights 2. 2025 U.S. TAM per Grand View Research 3. 2025 Global TAM per Fortune Business Insights 4. 2025 Global TAM per Insight Ace Analytic 5. Represents weighted CAGR forecast from industry reports (2026-2034) TAM ~$100B ~9% CAGR Vitamins, Minerals & Supplements4 Global Future opportunity to expand into $200B international market


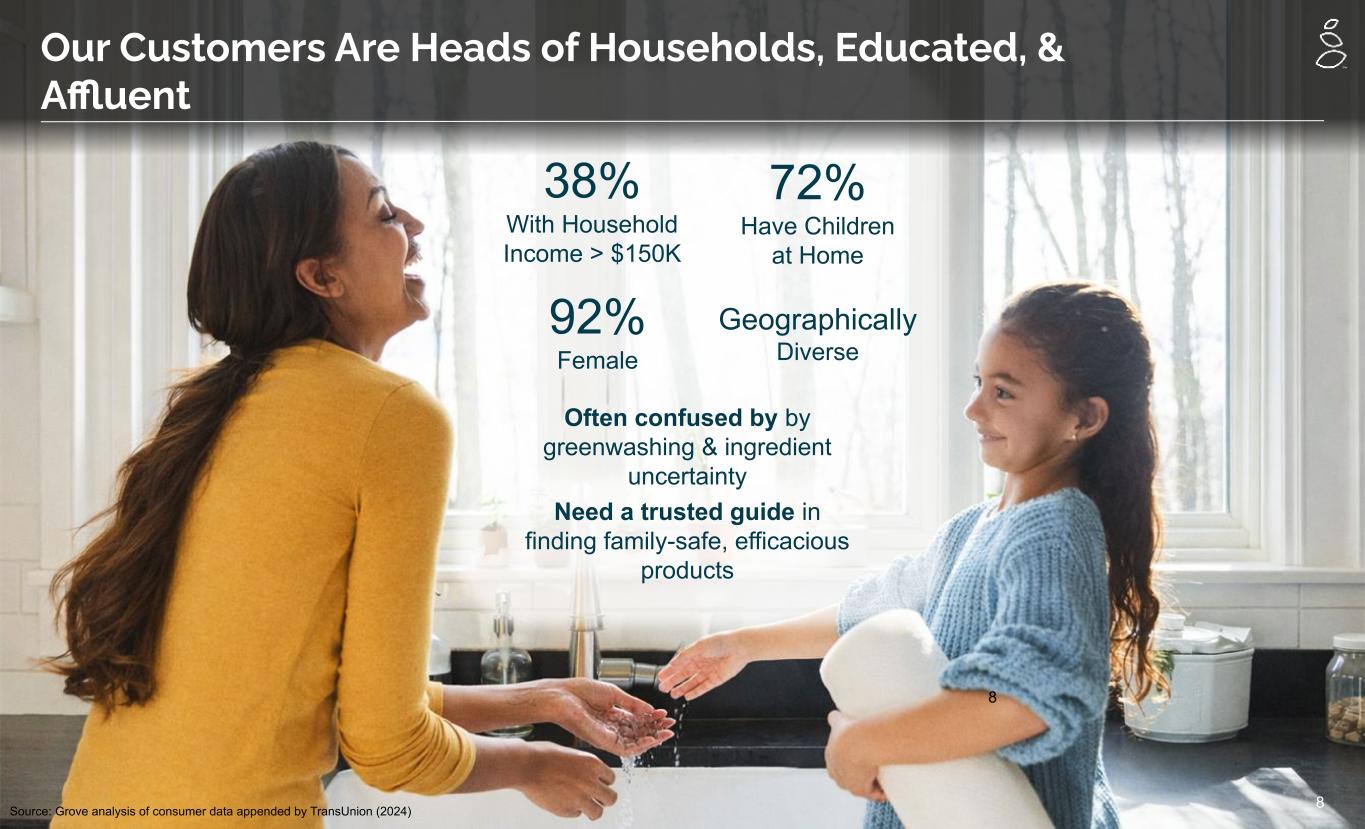
8 38% With Household Income > $150K Often confused by by greenwashing & ingredient uncertainty 72% Have Children at Home 92% Female Geographically Diverse Need a trusted guide in finding family-safe, efficacious products Our Customers Are Heads of Households, Educated, & Affluent Source: Grove analysis of consumer data appended by TransUnion (2024) 8


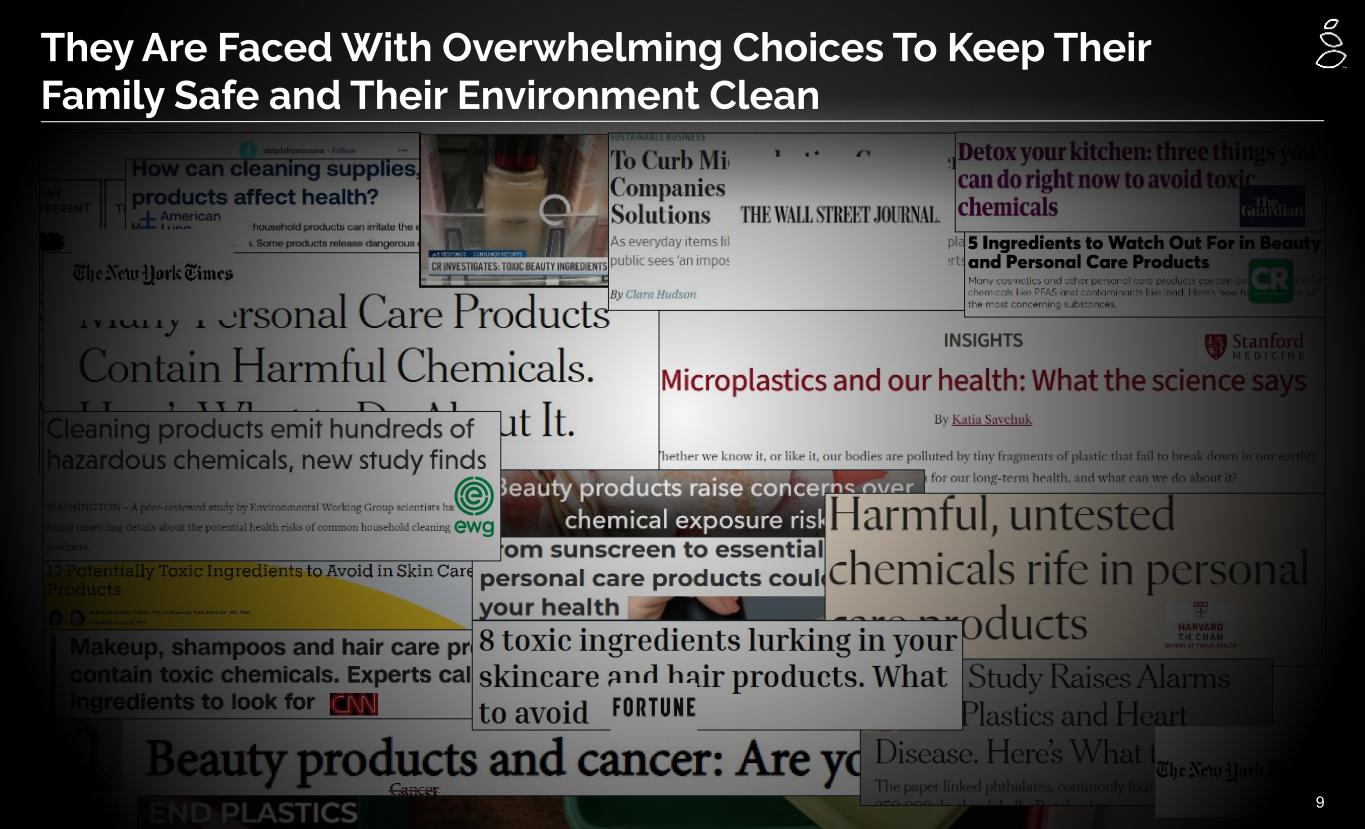
9 They Are Faced With Overwhelming Choices To Keep Their Family Safe and Their Environment Clean


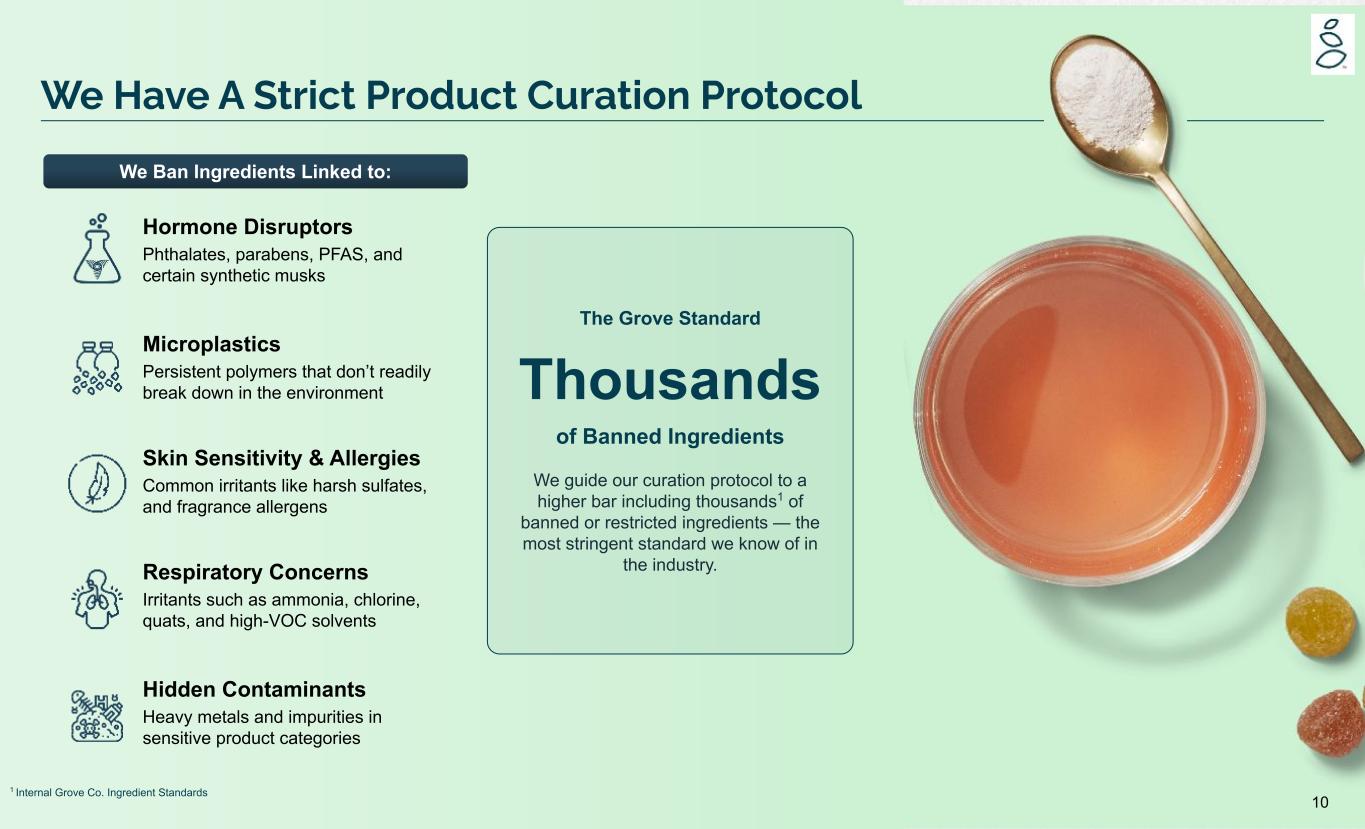
10 We Have A Strict Product Curation Protocol We Ban Ingredients Linked to: Hormone Disruptors Phthalates, parabens, PFAS, and certain synthetic musks Microplastics Persistent polymers that don’t readily break down in the environment Skin Sensitivity & Allergies Common irritants like harsh sulfates, and fragrance allergens Respiratory Concerns Irritants such as ammonia, chlorine, quats, and high-VOC solvents Hidden Contaminants Heavy metals and impurities in sensitive product categories 1 Internal Grove Co. Ingredient Standards The Grove Standard Thousands of Banned Ingredients We guide our curation protocol to a higher bar including thousands1 of banned or restricted ingredients — the most stringent standard we know of in the industry.


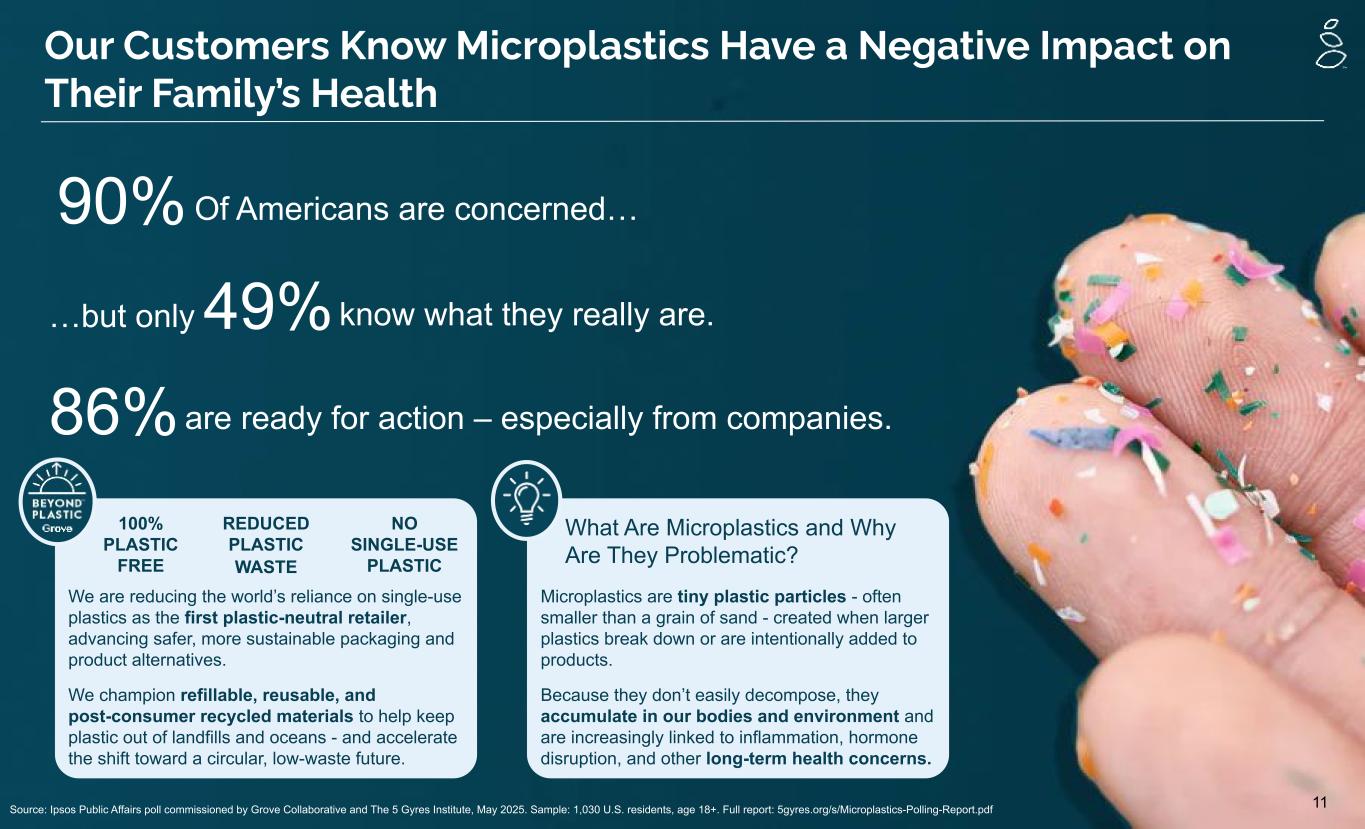
11 Our Customers Know Microplastics Have a Negative Impact on Their Family’s Health 90% Of Americans are concerned… 49%…but only know what they really are. 86% are ready for action – especially from companies. Microplastics are tiny plastic particles - often smaller than a grain of sand - created when larger plastics break down or are intentionally added to products. Because they don’t easily decompose, they accumulate in our bodies and environment and are increasingly linked to inflammation, hormone disruption, and other long-term health concerns. 100% PLASTIC FREE REDUCED PLASTIC WASTE NO SINGLE-USE PLASTIC We are reducing the world’s reliance on single-use plastics as the first plastic-neutral retailer, advancing safer, more sustainable packaging and product alternatives. We champion refillable, reusable, and post-consumer recycled materials to help keep plastic out of landfills and oceans - and accelerate the shift toward a circular, low-waste future. What Are Microplastics and Why Are They Problematic? Source: Ipsos Public Affairs poll commissioned by Grove Collaborative and The 5 Gyres Institute, May 2025. Sample: 1,030 U.S. residents, age 18+. Full report: 5gyres.org/s/Microplastics-Polling-Report.pdf


Direct-to-Consumer Experience


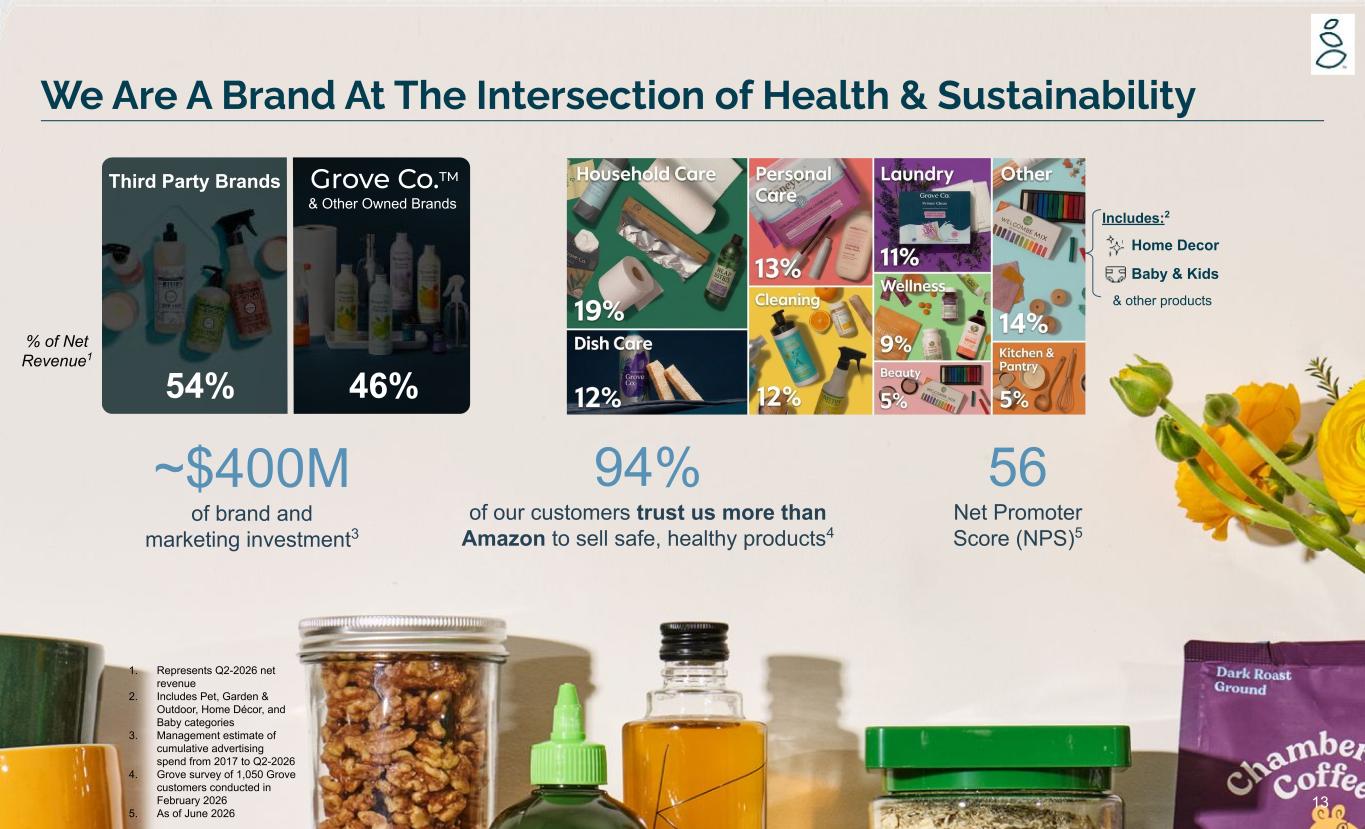
13 We Are A Brand At The Intersection of Health & Sustainability 94% of our customers trust us more than Amazon to sell safe, healthy products4 56 Net Promoter Score (NPS)5 46% Third Party Brands 54% % of Net Revenue1 Includes:2 Baby & Kids Home Decor & other products 1. Represents Q2-2026 net revenue 2. Includes Pet, Garden & Outdoor, Home Décor, and Baby categories 3. Management estimate of cumulative advertising spend from 2017 to Q2-2026 4. Grove survey of 1,050 Grove customers conducted in February 2026 5. As of June 2026 ~$400M of brand and marketing investment3 Grove Co.TM & Other Owned Brands


14 When We Add Categories and SKUs, We Expand Our Perimeter and Increase Net Revenue per Order Category Expansion Drives Net Revenue per Order Growth… 1. Represents DTC Net Revenue per order for repeat customers While gaining access to scaled and growing market segments beyond our original core categories Expansion of VMS & Wellness Contains impact from testing small order value shipments in Q2-2025


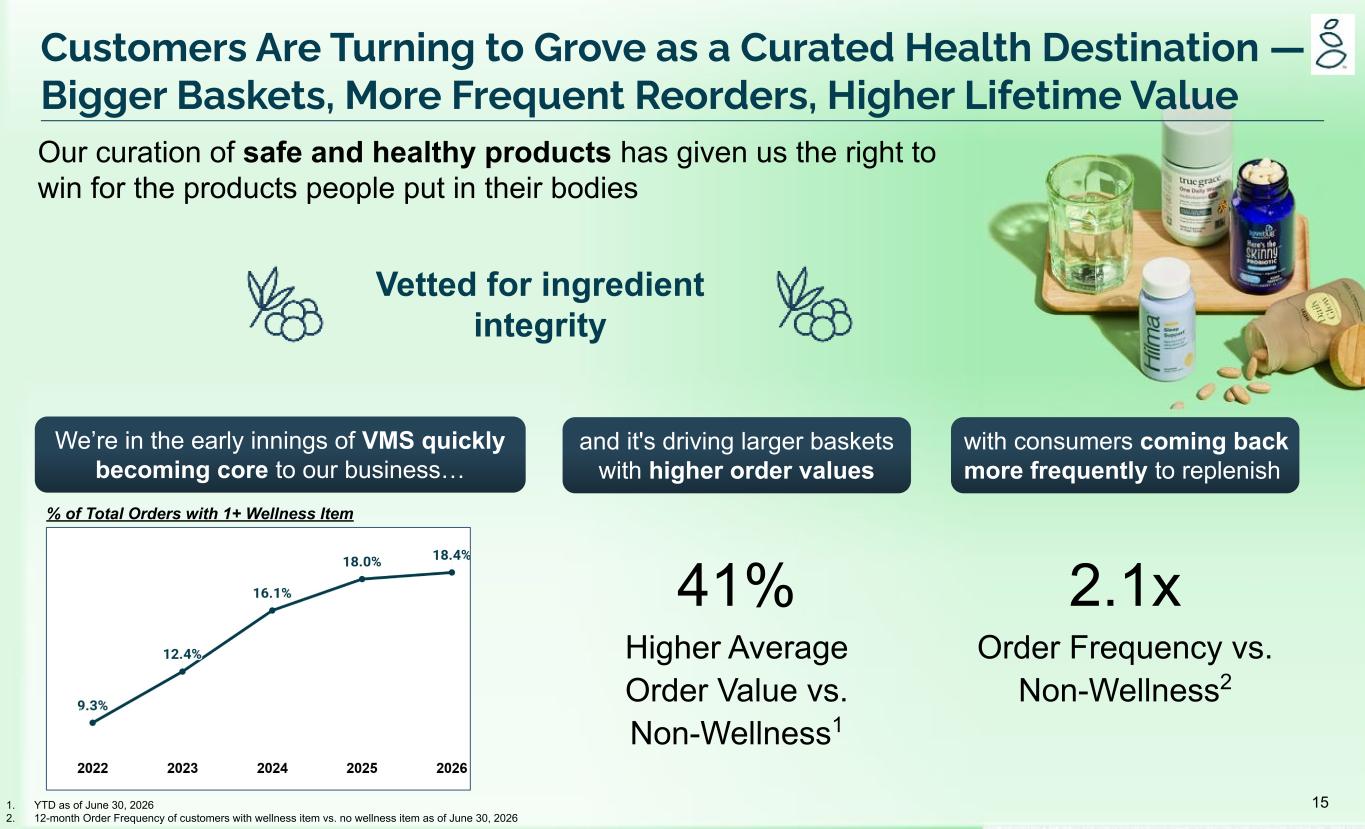
15 Vetted for ingredient integrity We’re in the early innings of VMS quickly becoming core to our business… % of Total Orders with 1+ Wellness Item and it's driving larger baskets with higher order values with consumers coming back more frequently to replenish 41% Higher Average Order Value vs. Non-Wellness1 2.1x Order Frequency vs. Non-Wellness2 1. YTD as of June 30, 2026 2. 12-month Order Frequency of customers with wellness item vs. no wellness item as of June 30, 2026 Customers Are Turning to Grove as a Curated Health Destination — Bigger Baskets, More Frequent Reorders, Higher Lifetime Value Our curation of safe and healthy products has given us the right to win for the products people put in their bodies


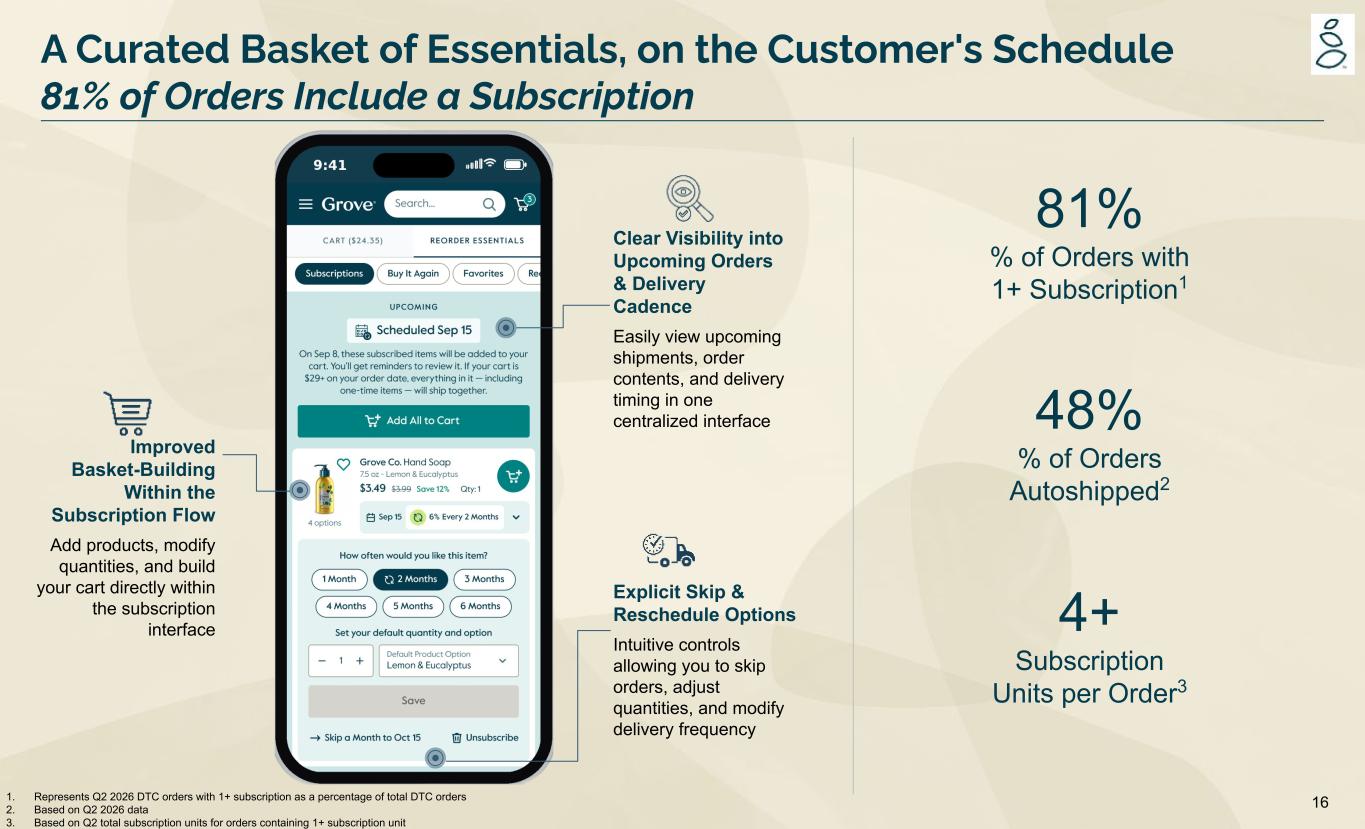
161. Represents Q2 2026 DTC orders with 1+ subscription as a percentage of total DTC orders 2. Based on Q2 2026 data 3. Based on Q2 total subscription units for orders containing 1+ subscription unit Clear Visibility into Upcoming Orders & Delivery Cadence Easily view upcoming shipments, order contents, and delivery timing in one centralized interface Improved Basket-Building Within the Subscription Flow Add products, modify quantities, and build your cart directly within the subscription interface Explicit Skip & Reschedule Options Intuitive controls allowing you to skip orders, adjust quantities, and modify delivery frequency 48% % of Orders Autoshipped2 4+ Subscription Units per Order3 81% % of Orders with 1+ Subscription1 A Curated Basket of Essentials, on the Customer's Schedule 81% of Orders Include a Subscription


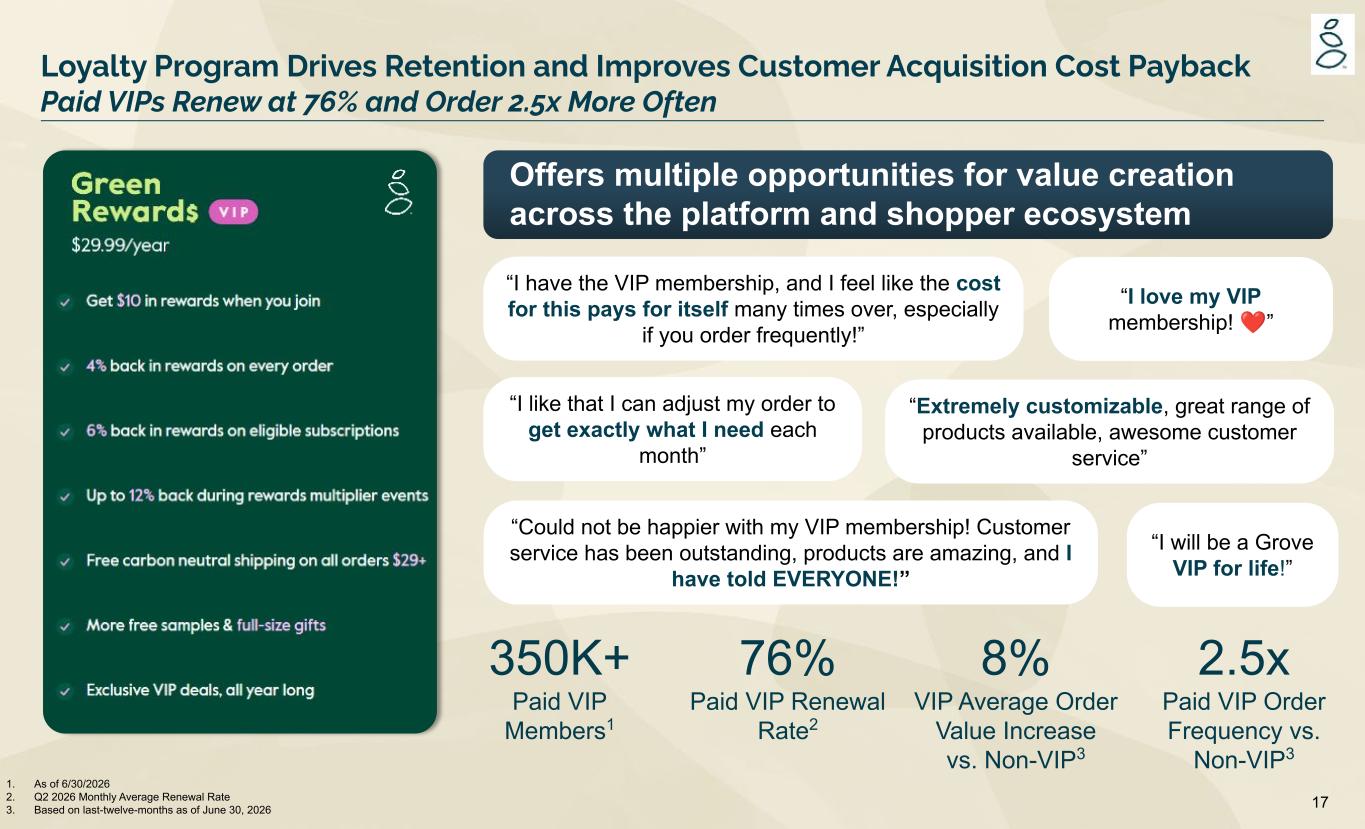
17 Loyalty Program Drives Retention and Improves Customer Acquisition Cost Payback Paid VIPs Renew at 76% and Order 2.5x More Often Notes: (1) Calculated as the percent of first order customers that convert to Paid VIP within 35 days 350K+ Paid VIP Members1 76% Paid VIP Renewal Rate2 8% VIP Average Order Value Increase vs. Non-VIP3 2.5x Paid VIP Order Frequency vs. Non-VIP3 “I have the VIP membership, and I feel like the cost for this pays for itself many times over, especially if you order frequently!” “Extremely customizable, great range of products available, awesome customer service” “I love my VIP membership! ❤” “I will be a Grove VIP for life!” “ “Could not be happier with my VIP membership! Customer service has been outstanding, products are amazing, and I have told EVERYONE!” “I like that I can adjust my order to get exactly what I need each month” 1. As of 6/30/2026 2. Q2 2026 Monthly Average Renewal Rate 3. Based on last-twelve-months as of June 30, 2026 Offers multiple opportunities for value creation across the platform and shopper ecosystem


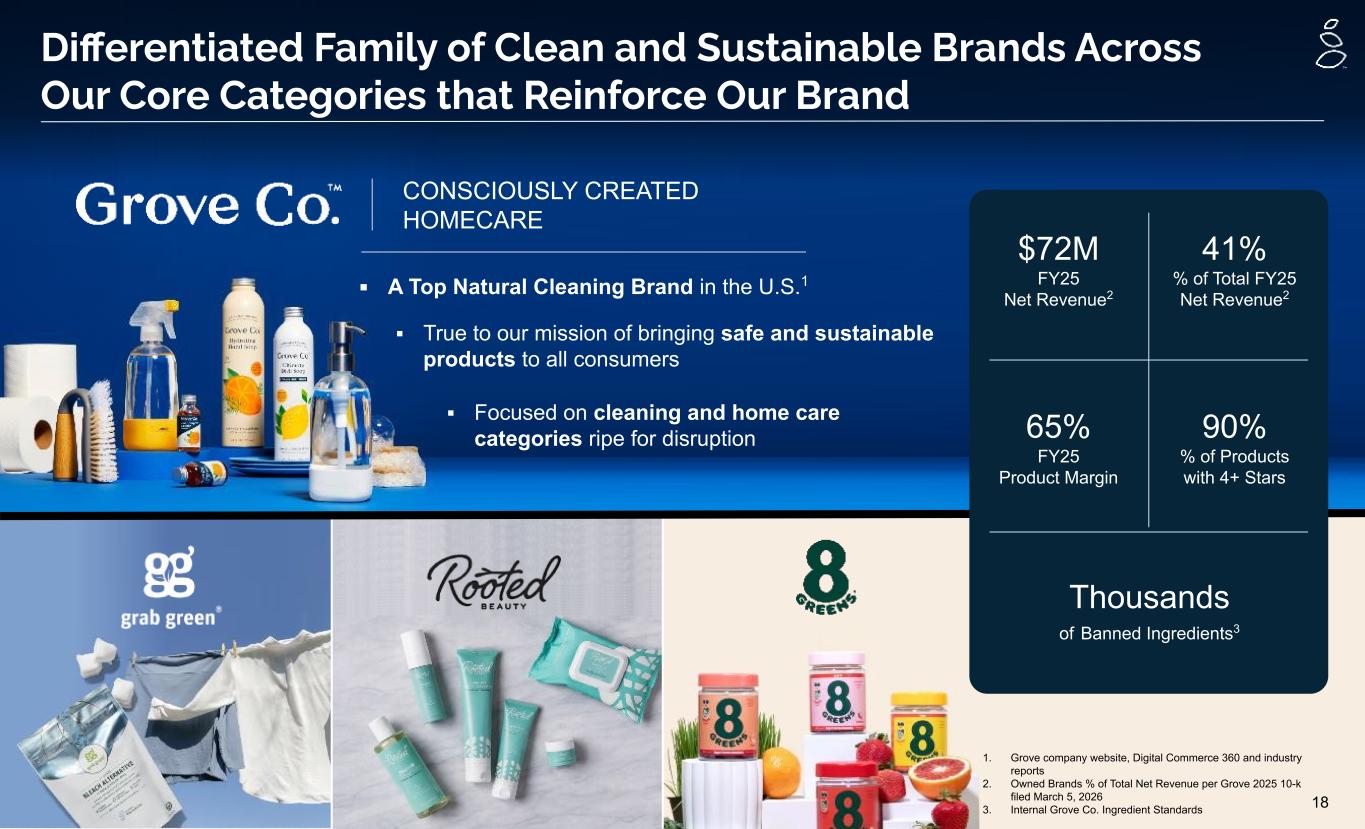
18 Differentiated Family of Clean and Sustainable Brands Across Our Core Categories that Reinforce Our Brand CONSCIOUSLY CREATED HOMECARE ▪ True to our mission of bringing safe and sustainable products to all consumers ▪ Focused on cleaning and home care categories ripe for disruption 1. Grove company website, Digital Commerce 360 and industry reports 2. Owned Brands % of Total Net Revenue per Grove 2025 10-k filed March 5, 2026 3. Internal Grove Co. Ingredient Standards Thousands of Banned Ingredients3 65% FY25 Product Margin 41% % of Total FY25 Net Revenue2 $72M FY25 Net Revenue2 90% % of Products with 4+ Stars ▪ A Top Natural Cleaning Brand in the U.S.1


MEASURING OUR IMPACT Q2 2026 Financial results


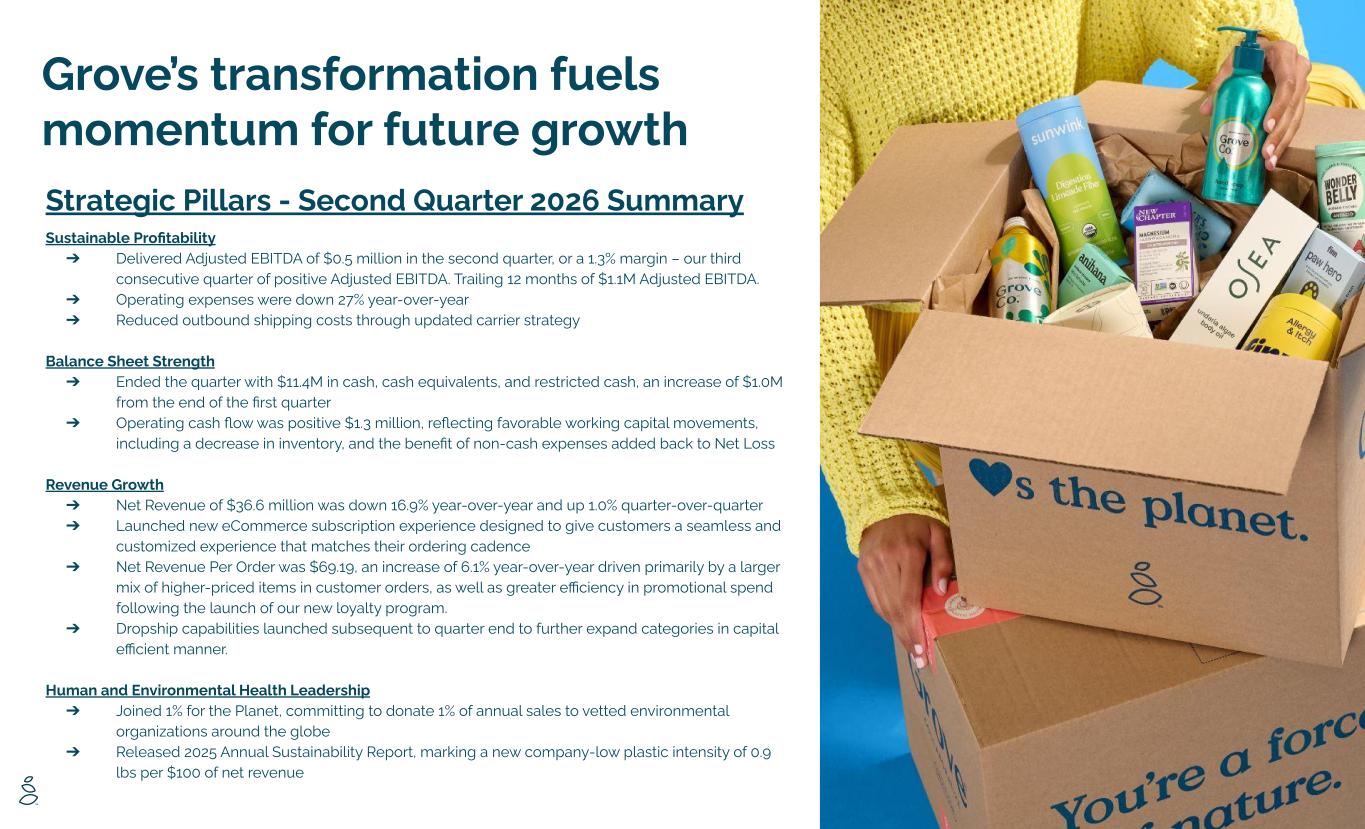
Strategic Pillars - Second Quarter 2026 Summary Sustainable Profitability ➔ Delivered Adjusted EBITDA of $0.5 million in the second quarter, or a 1.3% margin – our third consecutive quarter of positive Adjusted EBITDA. Trailing 12 months of $1.1M Adjusted EBITDA. ➔ Operating expenses were down 27% year-over-year ➔ Reduced outbound shipping costs through updated carrier strategy Balance Sheet Strength ➔ Ended the quarter with $11.4M in cash, cash equivalents, and restricted cash, an increase of $1.0M from the end of the first quarter ➔ Operating cash flow was positive $1.3 million, reflecting favorable working capital movements, including a decrease in inventory, and the benefit of non-cash expenses added back to Net Loss Revenue Growth ➔ Net Revenue of $36.6 million was down 16.9% year-over-year and up 1.0% quarter-over-quarter ➔ Launched new eCommerce subscription experience designed to give customers a seamless and customized experience that matches their ordering cadence ➔ Net Revenue Per Order was $69.19, an increase of 6.1% year-over-year driven primarily by a larger mix of higher-priced items in customer orders, as well as greater efficiency in promotional spend following the launch of our new loyalty program. ➔ Dropship capabilities launched subsequent to quarter end to further expand categories in capital efficient manner. Human and Environmental Health Leadership ➔ Joined 1% for the Planet, committing to donate 1% of annual sales to vetted environmental organizations around the globe ➔ Released 2025 Annual Sustainability Report, marking a new company-low plastic intensity of 0.9 lbs per $100 of net revenue Grove’s transformation fuels momentum for future growth


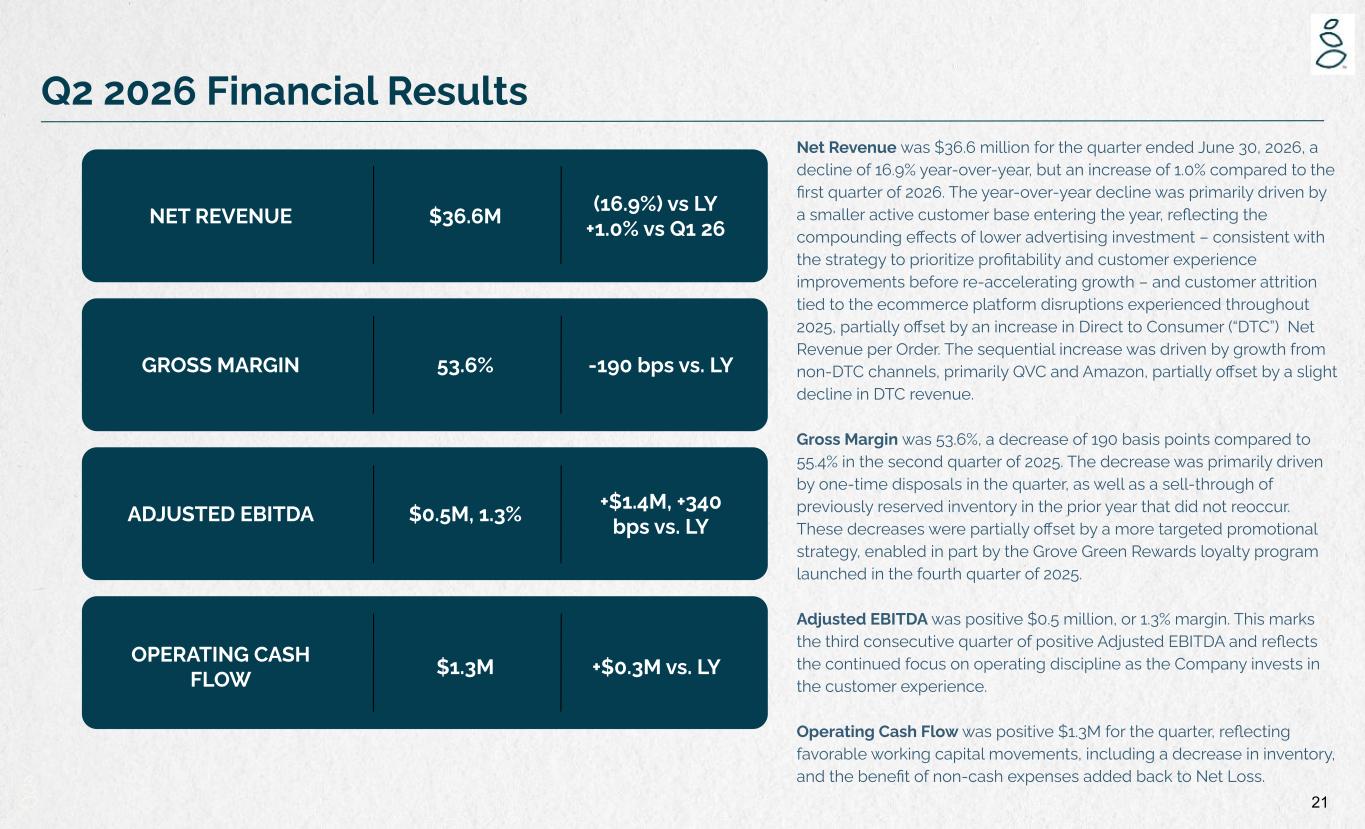
21 Q2 2026 Financial Results ADJUSTED EBITDA GROSS MARGIN NET REVENUE $36.6M (16.9%) vs LY +1.0% vs Q1 26 53.6% -190 bps vs. LY $0.5M, 1.3% +$1.4M, +340 bps vs. LY $1.3M +$0.3M vs. LYOPERATING CASH FLOW Net Revenue was $36.6 million for the quarter ended June 30, 2026, a decline of 16.9% year-over-year, but an increase of 1.0% compared to the first quarter of 2026. The year-over-year decline was primarily driven by a smaller active customer base entering the year, reflecting the compounding effects of lower advertising investment – consistent with the strategy to prioritize profitability and customer experience improvements before re-accelerating growth – and customer attrition tied to the ecommerce platform disruptions experienced throughout 2025, partially offset by an increase in Direct to Consumer (“DTC”) Net Revenue per Order. The sequential increase was driven by growth from non-DTC channels, primarily QVC and Amazon, partially offset by a slight decline in DTC revenue. Gross Margin was 53.6%, a decrease of 190 basis points compared to 55.4% in the second quarter of 2025. The decrease was primarily driven by one-time disposals in the quarter, as well as a sell-through of previously reserved inventory in the prior year that did not reoccur. These decreases were partially offset by a more targeted promotional strategy, enabled in part by the Grove Green Rewards loyalty program launched in the fourth quarter of 2025. Adjusted EBITDA was positive $0.5 million, or 1.3% margin. This marks the third consecutive quarter of positive Adjusted EBITDA and reflects the continued focus on operating discipline as the Company invests in the customer experience. Operating Cash Flow was positive $1.3M for the quarter, reflecting favorable working capital movements, including a decrease in inventory, and the benefit of non-cash expenses added back to Net Loss.


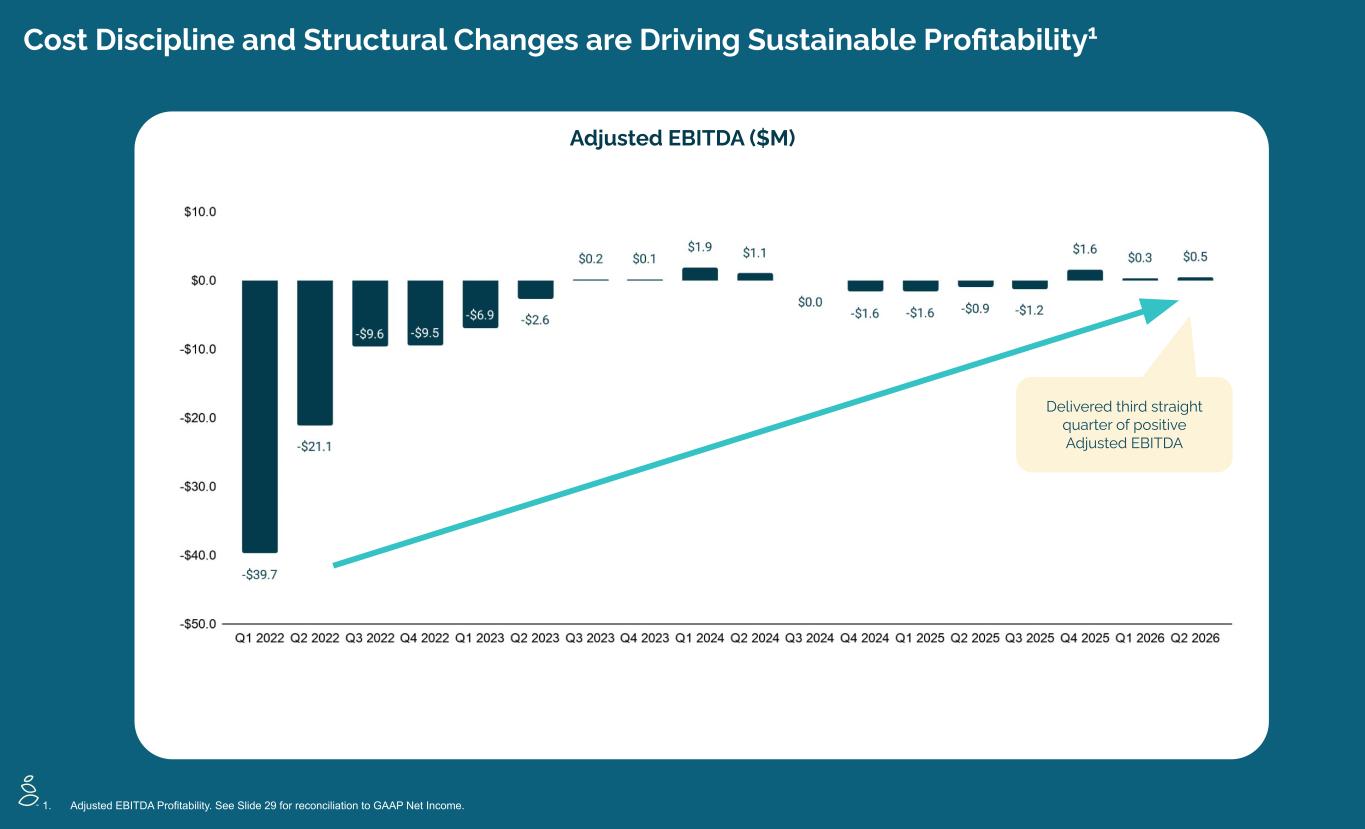
Cost Discipline and Structural Changes are Driving Sustainable Profitability1 Adjusted EBITDA ($M) Delivered third straight quarter of positive Adjusted EBITDA 1. Adjusted EBITDA Profitability. See Slide 29 for reconciliation to GAAP Net Income.


Cash Flow Improvements Reflecting Continued Operational Discipline Operating Cash Flow ($M) Larger net loss and one-time items that did not reoccur Lease termination (one-time) and interest payments


Sustained Structural Gross Margin Improvements vs 2022 GAAP Gross Margin


Q1 Marks the Expected Revenue Trough with Sequential Improvement Expected Through 2026 Quarterly Net Revenue ($M) Q4-2025 includes $2.9M revenue from one-time QVC TSV Advertising pullback in Q4-2025 (-65% Y/Y) and Q1-2026 (-59%) rti i ll in Q4-2025 (-65% Y/Y) and Q1-2026 (-59%) and Q2-2026 (-55%) Measured increase in advertising investment, and improved repeat order rates from platform improvements Reflects projected (i) measured increase in advertising investment (ii) sustained improved repeat order rates from platform improvements, and (iii) growth in non-DTC channels.


26 Financial outlook Net Revenue ➔ Grove expects full-year Net Revenue of approximately $142.5 million to $152.5 million ➔ Continues to expect sequential revenue improvement in each of the remaining two quarters of 2026 Adjusted EBITDA ➔ Full year 2026 Adjusted EBITDA is expected to be breakeven to positive low single digit millions Reaffirming 2026 Guidance


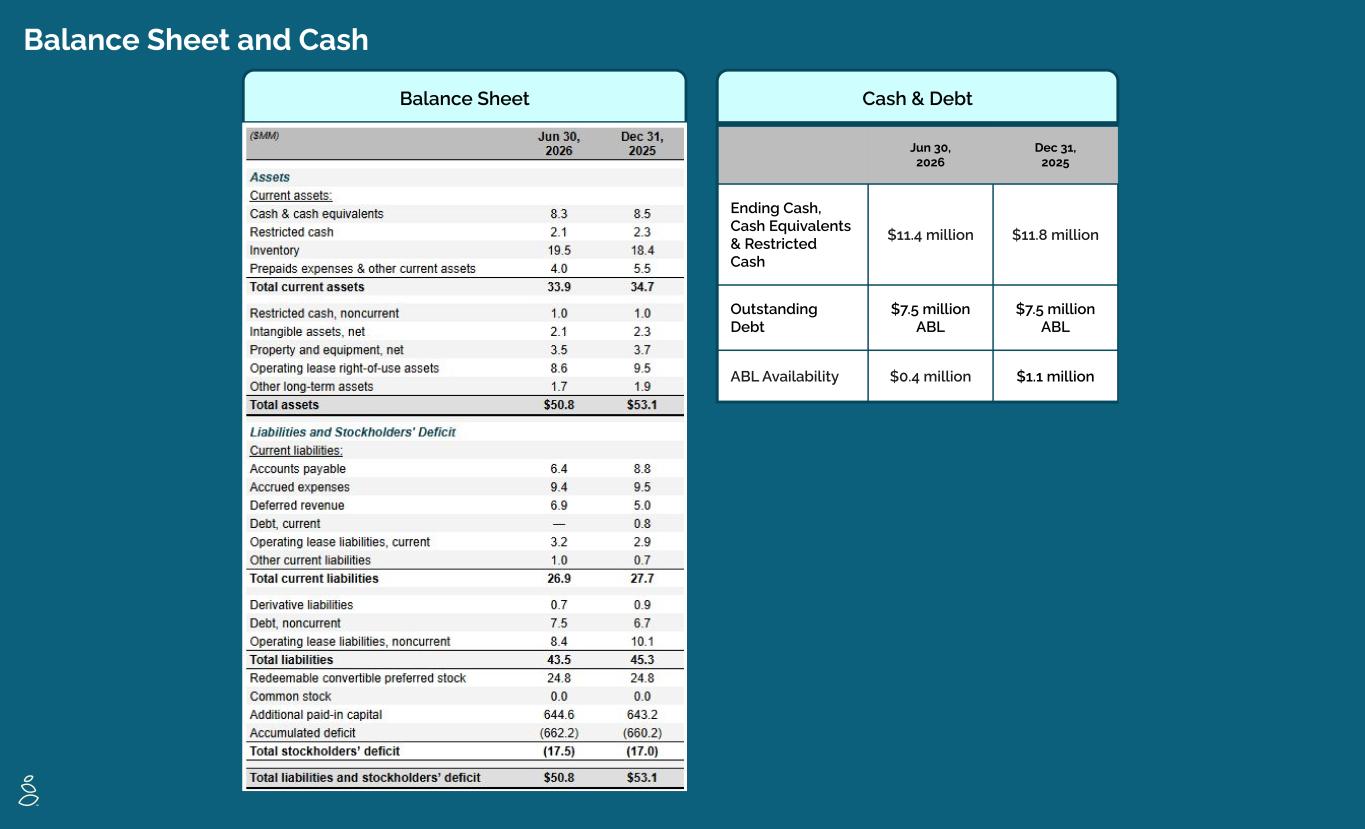
Balance Sheet and Cash Balance Sheet Cash & Debt Jun 30, 2026 Dec 31, 2025 Ending Cash, Cash Equivalents & Restricted Cash $11.4 million $11.8 million Outstanding Debt $7.5 million ABL $7.5 million ABL ABL Availability $0.4 million $1.1 million


Appendix


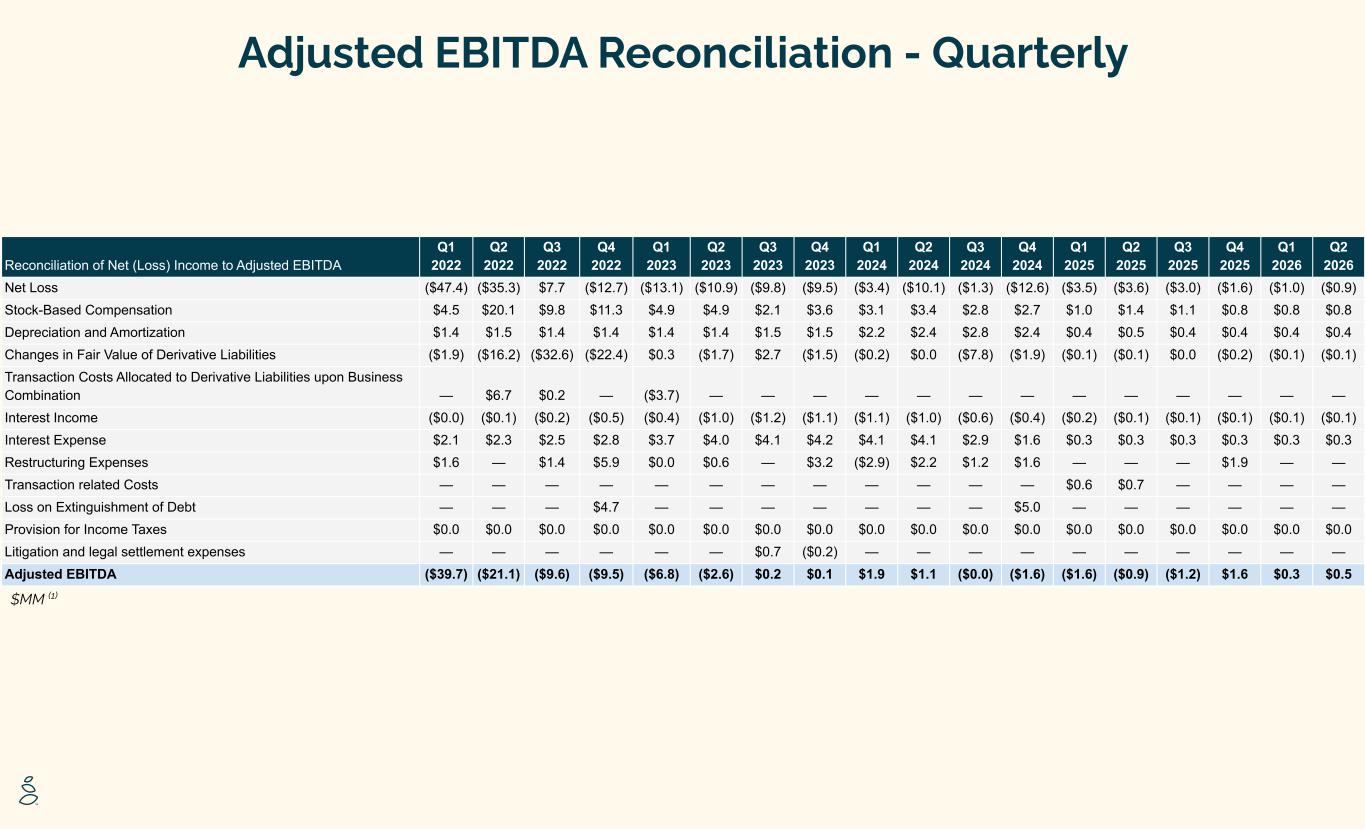
Adjusted EBITDA Reconciliation - Quarterly $MM (1) Reconciliation of Net (Loss) Income to Adjusted EBITDA Q1 2022 Q2 2022 Q3 2022 Q4 2022 Q1 2023 Q2 2023 Q3 2023 Q4 2023 Q1 2024 Q2 2024 Q3 2024 Q4 2024 Q1 2025 Q2 2025 Q3 2025 Q4 2025 Q1 2026 Q2 2026 Net Loss ($47.4) ($35.3) $7.7 ($12.7) ($13.1) ($10.9) ($9.8) ($9.5) ($3.4) ($10.1) ($1.3) ($12.6) ($3.5) ($3.6) ($3.0) ($1.6) ($1.0) ($0.9) Stock-Based Compensation $4.5 $20.1 $9.8 $11.3 $4.9 $4.9 $2.1 $3.6 $3.1 $3.4 $2.8 $2.7 $1.0 $1.4 $1.1 $0.8 $0.8 $0.8 Depreciation and Amortization $1.4 $1.5 $1.4 $1.4 $1.4 $1.4 $1.5 $1.5 $2.2 $2.4 $2.8 $2.4 $0.4 $0.5 $0.4 $0.4 $0.4 $0.4 Changes in Fair Value of Derivative Liabilities ($1.9) ($16.2) ($32.6) ($22.4) $0.3 ($1.7) $2.7 ($1.5) ($0.2) $0.0 ($7.8) ($1.9) ($0.1) ($0.1) $0.0 ($0.2) ($0.1) ($0.1) Transaction Costs Allocated to Derivative Liabilities upon Business Combination — $6.7 $0.2 — ($3.7) — — — — — — — — — — — — — Interest Income ($0.0) ($0.1) ($0.2) ($0.5) ($0.4) ($1.0) ($1.2) ($1.1) ($1.1) ($1.0) ($0.6) ($0.4) ($0.2) ($0.1) ($0.1) ($0.1) ($0.1) ($0.1) Interest Expense $2.1 $2.3 $2.5 $2.8 $3.7 $4.0 $4.1 $4.2 $4.1 $4.1 $2.9 $1.6 $0.3 $0.3 $0.3 $0.3 $0.3 $0.3 Restructuring Expenses $1.6 — $1.4 $5.9 $0.0 $0.6 — $3.2 ($2.9) $2.2 $1.2 $1.6 — — — $1.9 — — Transaction related Costs — — — — — — — — — — — — $0.6 $0.7 — — — — Loss on Extinguishment of Debt — — — $4.7 — — — — — — — $5.0 — — — — — — Provision for Income Taxes $0.0 $0.0 $0.0 $0.0 $0.0 $0.0 $0.0 $0.0 $0.0 $0.0 $0.0 $0.0 $0.0 $0.0 $0.0 $0.0 $0.0 $0.0 Litigation and legal settlement expenses — — — — — — $0.7 ($0.2) — — — — — — — — — — Adjusted EBITDA ($39.7) ($21.1) ($9.6) ($9.5) ($6.8) ($2.6) $0.2 $0.1 $1.9 $1.1 ($0.0) ($1.6) ($1.6) ($0.9) ($1.2) $1.6 $0.3 $0.5


30 home, family, planet, healthier. Your


31