UNITED STATES
SECURITIES AND EXCHANGE COMMISSION
Washington, D.C. 20549
FORM 8-K
CURRENT REPORT
Pursuant to Section 13 or 15(d) of
the Securities Exchange Act of 1934
Date of Report (Date of earliest event reported): August 2, 2023
EVgo Inc.
(Exact name of registrant as specified in its charter)
Delaware |
|
001-39572 |
|
85-2326098 |
(State or other jurisdiction of |
|
(Commission File Number) |
|
(I.R.S. Employer |
11835 West Olympic Boulevard, Suite 900E |
|
90064 |
(Address of principal executive offices) |
|
(Zip Code) |
Registrant’s telephone number, including area code: (877) 494-3833
Check the appropriate box below if the Form 8-K filing is intended to simultaneously satisfy the filing obligation of the registrant under any of the following provisions:
☐ |
Written communications pursuant to Rule 425 under the Securities Act (17 CFR 230.425) |
☐ |
Soliciting material pursuant to Rule 14a-12 under the Exchange Act (17 CFR 240.14a-12) |
☐ |
Pre-commencement communications pursuant to Rule 14d-2(b) under the Exchange Act (17 CFR 240.14d-2(b)) |
☐ |
Pre-commencement communications pursuant to Rule 13e-4(c) under the Exchange Act (17 CFR 240.13e-4(c)) |
Securities registered pursuant to Section 12(b) of the Act:
Title of each class |
Trading |
Name of each exchange |
Shares of Class A common stock, $0.0001 par value per share |
EVGO |
The Nasdaq Global Select Market |
Redeemable warrants, each whole warrant exercisable for one share of Class A common stock at an exercise price of $11.50 |
EVGOW |
The Nasdaq Global Select Market |
Indicate by check mark whether the registrant is an emerging growth company as defined in Rule 405 of the Securities Act of 1933 or Rule 12b-2 of the Securities Exchange Act of 1934.
Emerging growth company ☒
If an emerging growth company, indicate by check mark if the registrant has elected not to use the extended transition period for complying with any new or revised financial accounting standards provided pursuant to Section 13(a) of the Exchange Act. ☐
Item 2.02. Results of Operations and Financial Condition.
EVgo Inc. (the “Company”) issued a press release on August 2, 2023, announcing its financial results for the quarter ended June 30, 2023. A copy of the press release is furnished as Exhibit 99.1 to this Current Report on Form 8-K.
Item 7.01. Regulation FD Disclosure
On August 2, 2023, at 5:00 p.m. Eastern Time, the Company will host its second quarter 2023 earnings conference call and webcast. Via webcast, the Company will present portions of its second quarter 2023 earnings call presentation (the “Earnings Call Presentation”), which contains a summary of the Company’s financial results for the quarter ended June 30, 2023, financial estimates, and certain other financial and operating information regarding the Company. A copy of the Earnings Call Presentation is furnished as Exhibit 99.2 to this Current Report on Form 8-K.
The information furnished in this Current Report on Form 8-K (including exhibits 99.1 and 99.2) shall not be deemed “filed” for purposes of Section 18 of the Securities Exchange Act of 1934, as amended (the “Exchange Act”), or otherwise subject to the liabilities of such section, nor shall such information be deemed incorporated by reference in any filing under the Exchange Act or the Securities Act of 1933, as amended, except as shall be expressly set forth by specific reference in such a filing.
Item 9.01. Financial Statements and Exhibits.
(d) Exhibits.
Exhibit |
Description |
99.1 |
|
99.2 |
|
104 |
Cover Page Interactive Data File (embedded within the Inline XBRL document). |
2
SIGNATURES
Pursuant to the requirements of the Securities Exchange Act of 1934, the registrant has duly caused this report to be signed on its behalf by the undersigned, thereunto duly authorized.
|
EVgo Inc. |
|
|
|
|
Date: August 2, 2023 |
By: |
/s/ Stephanie Lee |
|
Name: |
Stephanie Lee |
|
Title: |
Interim Chief Financial Officer |
|
|
(Principal Financial Officer and Principal Accounting Officer) |
3
Exhibit 99.1

EVgo Inc. Reports Record Second Quarter 2023 Results
| ● | Revenue grew to a record $50.6 million in the second quarter, representing an increase of 457% year-over-year. |
| ● | Network throughput reached a record 24.9 gigawatt-hours (“GWh”) in the second quarter, an increase of 147% year-over-year. |
| ● | Total network utilization was in the double digits in the second quarter. |
| ● | Ended the second quarter with approximately 3,200 stalls in operation or under construction, with 210 new stalls added to the EVgo network during the quarter. |
| ● | Added more than 82,000 new customer accounts in the second quarter, reaching approximately 688,000 overall at the end of the quarter. |
| ● | Won $13.8 million of Ohio NEVI funding for EVgo owned and EVgo eXtend sites, representing 75% of awarded funds. |
Los Angeles – August 2, 2023 – EVgo Inc. (Nasdaq: EVGO) (“EVgo” or the “Company”) today announced results for the second quarter ended June 30, 2023. Management will host a conference call today at 5:00 p.m. ET / 2:00 p.m. PT to discuss EVgo’s results and other business highlights.
Revenue increased to $50.6 million in the second quarter of 2023, compared to $9.1 million in the second quarter of 2022, representing 457% year-over-year growth. Revenue growth was primarily driven by year-over-year increases in eXtend™ revenue and charging revenues.
Network throughput increased to 24.9 GWh in the second quarter of 2023, compared to 10.1 GWh in the second quarter of 2022, representing 147% year-over-year growth. The Company added approximately 82,000 new customer accounts during the second quarter, bringing the overall number of customer accounts to 688,000 at quarter-end, an increase of 55% year-over-year.
“EVgo had a phenomenal second quarter with significant growth in key areas including stalls, throughput, customer accounts, utilization, and revenue,” said Cathy Zoi, EVgo’s CEO. “We are pleased to report EVgo’s network throughput growth is accelerating, demonstrating the leverage in our business and financial model as the auto sector rapidly electrifies. We continue to energize new stalls across the network and surpassed the double-digit utilization threshold for the quarter network wide. In addition, EVgo won 75% of Ohio’s NEVI awards and will put $13.8 million to work in EVgo-owned and EVgo eXtend sites across the state. Our results demonstrate the depth of our team and experience in developing, constructing, and operating a leading fast charging network.”
1
Business Highlights
| ● | National Electric Vehicle Infrastructure Program (“NEVI”): EVgo and its eXtend™ partners were selected by DriveOhio, a division of the Ohio Department of Transportation, for proposed awards of $13.8 million in funding to deploy 20 fast charging stations in Ohio. |
| ● | GM Partnership: EVgo and General Motors opened the 1,000th stall under the program. |
| ● | EVgo eXtendTM: During the second quarter, the Company continued delivering charging equipment and began site mobilization for projects under the Pilot Flying J/GM program. The Company expects to have the first Pilot site operational in the third quarter of 2023. |
| ● | Fleet Charging: EVgo’s public fleet charging business continues to scale with growth in rideshare throughput from last quarter, largely driven by collaborative partnerships with Uber and Lyft. EVgo also launched a partnership with a major car sharing company to support their pilot of electric vehicles in San Francisco. In the Hubs sector, the Company operationalized a new dedicated charging hub site and broke ground on another dedicated hub in San Francisco with an existing AV partner. |
| ● | North American Charging Standard (“NACS”) Connectors: Announced plans to add NACS connectors to EVgo chargers. |
| ● | EVgo Autocharge+: Autocharge+ exceeded 13% of total charging sessions initiated. |
| ● | PlugShare: PlugShare reached nearly 3.7 million registered users and achieved 6.9 million check-ins since inception. Signed a PlugShare deal with GM to provide comprehensive POI data for GM’s applications for its EV customers in several geographic regions, including North America, and South America for the next three years. |
| ● | Equity Issuance: The Company issued approximately 890,000 shares of Class A common stock with $5.7 million raised in net proceeds through its “at-the-market” equity offering program followed by the issuance of approximately 30.1 million shares of Class A common stock with $123.4 million raised in net proceeds through a primary equity offering. |
Financial & Operational Highlights
The below represent summary financial and operational figures for the second quarter of 2023.
| ● | Revenue of $50.6 million |
| ● | Network Throughput of 24.9 gigawatt-hours |
| ● | Customer Account Additions of approximately 82,000 accounts |
| ● | Gross Profit of $5.5 million |
| ● | Net Loss of $21.5 million |
| ● | Adjusted Gross Profit of $12.9 million1 |
| ● | Adjusted EBITDA of ($10.6) million1 |
| ● | Cash Flows Used in Operating Activities of $3.2 million |
| ● | Gross Capital Expenditures of $34.8 million |
1Adjusted Gross Profit and Adjusted EBITDA are non-GAAP measures and have not been prepared in accordance with Generally Accepted Accounting Principles in the United States of America (“GAAP”). For a definition of these non-GAAP measures and a reconciliation to the most directly comparable GAAP measure, please see “Definitions of Non-GAAP Financial Measures” and “Reconciliations of Non-GAAP Measures” included elsewhere in this release.
2
(unaudited, dollars in thousands) |
Q2'23 |
|
Q2'22 |
Change |
|
Q2'23 YTD |
|
Q2'22 YTD |
Change |
|||||
Charging revenue, retail |
|
$ |
9,085 |
|
$ |
4,389 |
107% |
|
$ |
15,700 |
|
$ |
7,891 |
99% |
Charging revenue, commercial |
|
|
2,418 |
|
|
654 |
270% |
|
|
4,133 |
|
|
1,363 |
203% |
Charging revenue, OEM |
|
|
986 |
|
|
189 |
422% |
|
|
1,538 |
|
|
340 |
352% |
Regulatory credit sales |
|
|
1,613 |
|
|
2,128 |
(24)% |
|
|
2,828 |
|
|
3,506 |
(19)% |
Network revenue, OEM |
|
|
742 |
|
|
887 |
(16)% |
|
|
3,441 |
|
|
1,377 |
150% |
eXtend revenue |
|
|
33,281 |
|
|
131 |
* % |
|
|
43,573 |
|
|
211 |
* % |
Ancillary revenue |
|
|
2,427 |
|
|
698 |
248% |
|
|
4,639 |
|
|
2,088 |
122% |
Total revenue |
|
$ |
50,552 |
|
$ |
9,076 |
457% |
|
$ |
75,852 |
|
$ |
16,776 |
352% |
|
|
|
|
|
|
|
|
|
|
|
|
|
|
|
* Percentage greater than 999%. |
|
|
|
|
|
|
|
|
|
|
|
|
|
|
(unaudited, dollars in thousands) |
Q2'23 |
|
Q2'22 |
Better (Worse) |
|
Q2'23 YTD |
|
Q2'22 YTD |
Better (Worse) |
|||||
Network Throughput (GWh) |
|
|
24.9 |
|
|
10.1 |
147% |
|
|
42.8 |
|
|
18.1 |
136% |
GAAP revenue |
|
$ |
50,552 |
|
$ |
9,076 |
457% |
|
$ |
75,852 |
|
$ |
16,776 |
352% |
GAAP gross profit (loss) |
|
$ |
5,529 |
|
$ |
(744) |
843% |
|
$ |
5,570 |
|
$ |
(1,344) |
514% |
GAAP gross margin |
|
|
10.9% |
|
|
(8.2)% |
1,910 bps |
|
|
7.3% |
|
|
(8.0)% |
1,530 bps |
GAAP net (loss) income |
|
$ |
(21,539) |
|
$ |
16,997 |
(227)% |
|
$ |
(70,620) |
|
$ |
(38,269) |
(85)% |
Adjusted Gross Profit¹ |
|
$ |
12,853 |
|
$ |
3,383 |
280% |
|
$ |
19,258 |
|
$ |
6,248 |
208% |
Adjusted Gross Margin1 |
|
|
25.4% |
|
|
37.3% |
(1,190) bps |
|
|
25.4% |
|
|
37.2% |
(1,180) bps |
Adjusted EBITDA1 |
|
$ |
(10,553) |
|
$ |
(19,837) |
47% |
|
$ |
(30,620) |
|
$ |
(38,013) |
19% |
|
|
|
|
|
|
|
|
|
|
|
|
|
|
|
(unaudited, dollars in thousands) |
Q2'23 |
|
Q2'22 |
|
|
Q2'23 YTD |
|
Q2'22 YTD |
|
|||||
Cash flows used in operating activities |
|
$ |
(3,182) |
|
$ |
(18,539) |
|
|
$ |
(22,525) |
|
$ |
(38,370) |
|
Capital expenditures |
|
$ |
34,811 |
|
$ |
44,017 |
|
|
$ |
100,057 |
|
$ |
72,291 |
|
|
|
|
|
|
|
|
|
|
|
|
|
|
|
|
1 Adjusted Gross Profit, Adjusted Gross Margin, and Adjusted EBITDA are non-GAAP measures and have not been prepared in accordance with GAAP. For a definition of these non-GAAP measures and a reconciliation to the most directly comparable GAAP measure, please see “Definitions of Non-GAAP Financial Measures” and “Reconciliations of Non-GAAP Measures” included elsewhere in these materials. | ||||||||||||||
2023 Financial & Operating Guidance
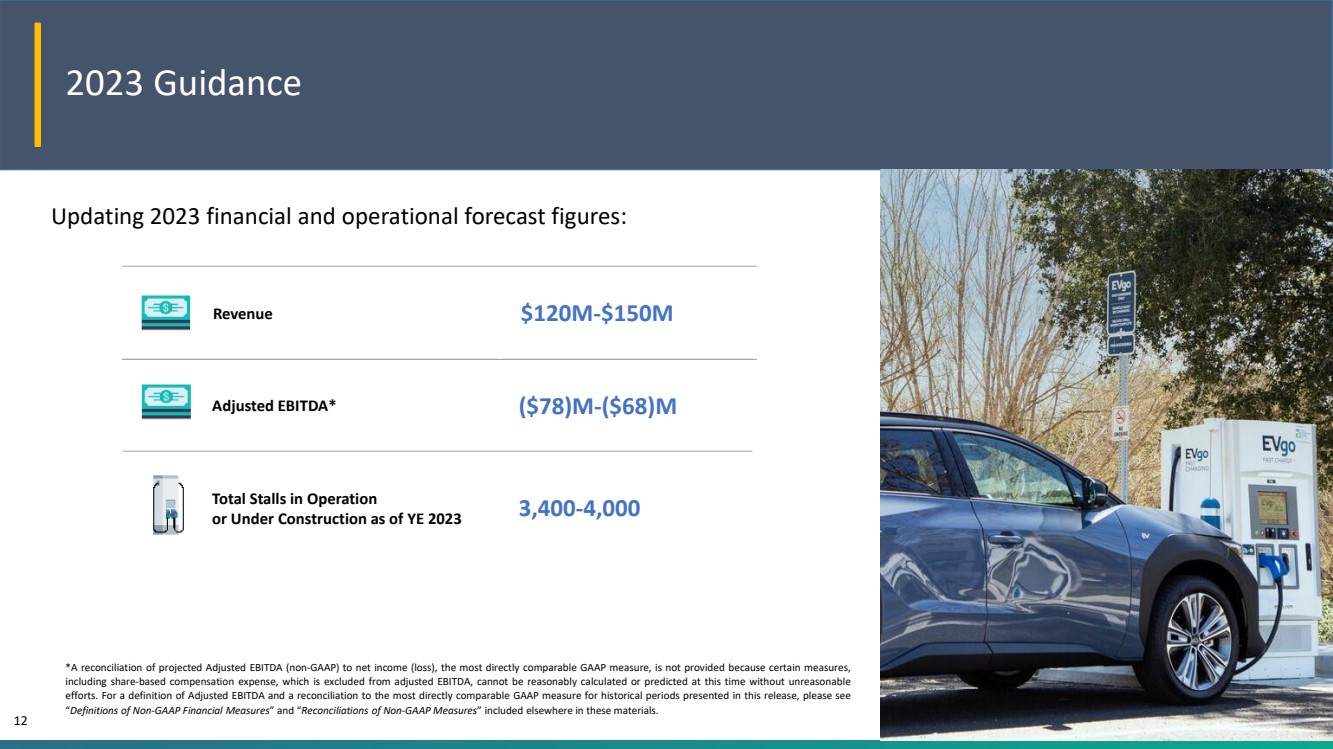
EVgo is updating full year 2023 guidance as follows:
| ● | Total revenue of $120 – $150 million |
| ● | Adjusted EBITDA of ($78) – ($68) million* |
Additionally, at year-end 2023, EVgo continues to expect to have a total of 3,400 – 4,000 DC fast charging stalls in operation or under construction.
*A reconciliation of projected Adjusted EBITDA (non-GAAP) to net income (loss), the most directly comparable GAAP measure, is not provided because certain measures, including share-based compensation expense, which is excluded from Adjusted EBITDA, cannot be reasonably calculated or predicted at this time without unreasonable efforts. For a definition of Adjusted EBITDA and a reconciliation to the most directly comparable GAAP measure for historical periods presented in this release, please see “Definitions of Non-GAAP Financial Measures” and “Reconciliations of Non-GAAP Measures” included elsewhere in this release.
3
Conference Call Information
A live audio webcast and conference call for EVgo’s second quarter 2023 earnings release will be held today at 5:00 p.m. ET / 2:00 p.m. PT. The webcast will be available at investors.evgo.com, and the dial-in information for those wishing to access via phone is:
Toll Free: (888) 340-5044 (for U.S. callers)
Toll/International: (646) 960-0363 (for callers outside the U.S.)
Conference ID: 6304708
This press release, along with other investor materials, including a slide presentation and reconciliations of certain non-GAAP measures to their nearest GAAP measures, will also be available on that site.
About EVgo
EVgo (Nasdaq: EVGO) is a leader in charging solutions, building and operating the infrastructure and tools needed to expedite the mass adoption of electric vehicles for individual drivers, rideshare and commercial fleets, and businesses. Since 2019, EVgo has purchased renewable energy certificates to match the electricity that powers its network. As one of the nation’s largest public fast charging networks, EVgo’s owned and operated charging network includes around 900 fast charging locations, 60 metropolitan areas and 30 states. EVgo continues to add more DC fast charging locations across the U.S., including stations built through EVgo eXtend™, its white label service offering. EVgo is accelerating transportation electrification through partnerships with automakers, fleet and rideshare operators, retail hosts such as grocery stores, shopping centers, and gas stations, policy leaders, and other organizations. With a rapidly growing network, robust software products and unique service offerings for drivers and partners including EVgo Optima™, EVgo Inside™, EVgo Rewards™, and Autocharge+, EVgo enables a world-class charging experience where drivers live, work, travel and play.
Forward-Looking Statements
This press release contains “forward-looking statements” within the meaning of the "safe harbor" provisions of the United States Private Securities Litigation Reform Act of 1995. Forward-looking statements may be identified by the use of words such as "estimate," "plan," "project," "forecast," "intend," "will," "expect," "anticipate," "believe," "seek," "target," “assume” or other similar expressions that predict or indicate future events or trends or that are not statements of historical matters. These forward-looking statements are based on management’s current expectations or beliefs and are subject to numerous assumptions, risks and uncertainties that could cause actual results to differ materially from those described in the forward-looking statements. These forward-looking statements include, but are not limited to, express or implied statements regarding EVgo’s future financial and operating performance, revenues, capital expenditures, chargers in operation or under construction and network throughput; EVgo’s expectation of market position and acceleration in its business due to factors including increased EV adoption; the Company’s collaboration with partners enabling effective deployment of chargers, including under its contract with Pilot Flying J and GM; and anticipated awards of funding in connection with the NEVI program and associated state programs. These statements are based on various assumptions, whether or not identified in this press release, and on the current expectations of EVgo’s management and are not predictions of actual performance.
4
There are a significant number of factors that could cause actual results to differ materially from the statements made in this press release, including changes or developments in the broader general market; macro political, economic, and business conditions, including inflation and geopolitical conflicts that could impact EVgo’s supply chains; increased competition, including from new and existing entrants in the EV charging market; unfavorable conditions or further disruptions in the capital and credit markets and EVgo's ability to obtain additional capital on commercially reasonable terms; EVgo’s limited operating history as a public company; EVgo’s dependence on widespread adoption of EVs and increased installation of charging stations; mechanisms surrounding energy and non-energy costs for EVgo’s charging stations; the impact of governmental support and mandates that could reduce, modify, or eliminate financial incentives, rebates, tax credits, and other support available to EVgo; supply chain disruptions; EVgo’s ability to expand into new service markets, grow its customer base, and manage its operations; EVgo’s ability to adapt its assets and infrastructure to changes in industry and regulatory standards for EV charging; impediments to EVgo’s expansion plans, including permitting delays; the need to attract additional fleet operators as customers; potential adverse effects on EVgo’s revenue and gross margins if customers increasingly claim clean energy credits and, as a result, they are no longer available to be claimed by EVgo; risks related to EVgo’s dependence on its intellectual property; and risks that EVgo’s technology could have undetected defects or errors. Additional risks and uncertainties that could affect the Company’s financial results are included under the captions “Risk Factors” and “Management’s Discussion and Analysis of Financial Condition and Results of Operations of EVgo” in EVgo’s most recent Annual Report on Form 10-K, filed with the Securities and Exchange Commission (the “SEC”), as well as its other SEC filings, copies of which are available on EVgo’s website at investors.evgo.com, and on the SEC’s website at www.sec.gov. All forward-looking statements in this press release are based on information available to EVgo as of the date hereof, and EVgo does not assume any obligation to update the forward-looking statements provided to reflect events that occur or circumstances that exist after the date on which they were made, except as required by applicable law.
5
Financial Statements
EVgo Inc. and Subsidiaries
Condensed Consolidated Balance Sheets
|
|
June 30, |
|
December 31, |
||
|
|
2023 |
|
2022 |
||
(in thousands) |
|
(unaudited) |
|
|
|
|
Assets |
|
|
|
|
|
|
Current assets |
|
|
|
|
|
|
Cash, cash equivalents and restricted cash |
|
$ |
257,126 |
|
$ |
246,193 |
Accounts receivable, net of allowance of $831 and $687 as of June 30, 2023 and December 31, 2022, respectively |
|
|
22,497 |
|
|
11,075 |
Accounts receivable, capital-build |
|
|
11,203 |
|
|
8,011 |
Prepaid expenses |
|
|
2,783 |
|
|
4,953 |
Other current assets |
|
|
3,537 |
|
|
5,252 |
Total current assets |
|
|
297,146 |
|
|
275,484 |
Property, equipment and software, net |
|
|
383,822 |
|
|
308,112 |
Operating lease right-of-use assets |
|
|
53,895 |
|
|
51,856 |
Restricted cash |
|
|
300 |
|
|
300 |
Other assets |
|
|
2,115 |
|
|
2,308 |
Intangible assets, net |
|
|
54,805 |
|
|
60,612 |
Goodwill |
|
|
31,052 |
|
|
31,052 |
Total assets |
|
$ |
823,135 |
|
$ |
729,724 |
|
|
|
|
|
|
|
Liabilities, redeemable noncontrolling interest and stockholders’ deficit |
|
|
|
|
|
|
Current liabilities |
|
|
|
|
|
|
Accounts payable |
|
$ |
6,445 |
|
$ |
9,128 |
Accrued liabilities |
|
|
40,831 |
|
|
39,233 |
Operating lease liabilities, current |
|
|
5,575 |
|
|
4,958 |
Deferred revenue, current |
|
|
16,701 |
|
|
16,023 |
Customer deposits |
|
|
11,386 |
|
|
17,867 |
Other current liabilities |
|
|
280 |
|
|
136 |
Total current liabilities |
|
|
81,218 |
|
|
87,345 |
Operating lease liabilities, noncurrent |
|
|
47,753 |
|
|
45,689 |
Earnout liability, at fair value |
|
|
1,297 |
|
|
1,730 |
Asset retirement obligations |
|
|
18,477 |
|
|
15,473 |
Capital-build liability |
|
|
30,345 |
|
|
26,157 |
Deferred revenue, noncurrent |
|
|
42,162 |
|
|
23,900 |
Warrant liabilities, at fair value |
|
|
11,293 |
|
|
12,304 |
Total liabilities |
|
|
232,545 |
|
|
212,598 |
Commitments and contingencies |
|
|
|
|
|
|
Redeemable noncontrolling interest |
|
|
783,200 |
|
|
875,226 |
Stockholders' deficit |
|
|
(192,610) |
|
|
(358,100) |
Total liabilities, redeemable noncontrolling interest and stockholders’ deficit |
|
$ |
823,135 |
|
$ |
729,724 |
|
|
|
|
|
|
|
6
EVgo Inc. and Subsidiaries
Condensed Consolidated Statements of Operations
|
|
Three Months Ended |
|
Six Months Ended |
||||||||||||
|
|
June 30, |
|
June 30, |
||||||||||||
(unaudited, dollars in thousands, except per share data) |
|
2023 |
|
2022 |
|
Change % |
|
2023 |
|
2022 |
|
Change % |
||||
Revenue |
|
$ |
50,552 |
|
$ |
9,076 |
|
457% |
|
$ |
75,852 |
|
$ |
16,776 |
|
352% |
|
|
|
|
|
|
|
|
|
|
|
|
|
|
|
|
|
Cost of revenue |
|
|
37,740 |
|
|
5,719 |
|
560% |
|
|
56,657 |
|
|
10,565 |
|
436% |
Depreciation, net of capital-build amortization |
|
|
7,283 |
|
|
4,101 |
|
78% |
|
|
13,625 |
|
|
7,555 |
|
80% |
Cost of sales |
|
|
45,023 |
|
|
9,820 |
|
358% |
|
|
70,282 |
|
|
18,120 |
|
288% |
Gross profit (loss) |
|
|
5,529 |
|
|
(744) |
|
843% |
|
|
5,570 |
|
|
(1,344) |
|
514% |
|
|
|
|
|
|
|
|
|
|
|
|
|
|
|
|
|
General and administrative expenses |
|
|
34,333 |
|
|
32,178 |
|
7% |
|
|
72,222 |
|
|
57,606 |
|
25% |
Depreciation, amortization and accretion |
|
|
4,783 |
|
|
4,132 |
|
16% |
|
|
9,567 |
|
|
8,019 |
|
19% |
Total operating expenses |
|
|
39,116 |
|
|
36,310 |
|
8% |
|
|
81,789 |
|
|
65,625 |
|
25% |
Operating loss |
|
|
(33,587) |
|
|
(37,054) |
|
9% |
|
|
(76,219) |
|
|
(66,969) |
|
(14)% |
|
|
|
|
|
|
|
|
|
|
|
|
|
|
|
|
|
Interest expense |
|
|
— |
|
|
(13) |
|
100% |
|
|
— |
|
|
(13) |
|
100% |
Interest income |
|
|
2,199 |
|
|
636 |
|
246% |
|
|
4,197 |
|
|
691 |
|
507% |
Other expense, net |
|
|
(1) |
|
|
(158) |
|
99% |
|
|
— |
|
|
(422) |
|
100% |
Change in fair value of earnout liability |
|
|
2,496 |
|
|
4,891 |
|
(49)% |
|
|
433 |
|
|
2,627 |
|
(84)% |
Change in fair value of warrant liabilities |
|
|
7,391 |
|
|
48,712 |
|
(85)% |
|
|
1,011 |
|
|
25,839 |
|
(96)% |
Total other income, net |
|
|
12,085 |
|
|
54,068 |
|
(78)% |
|
|
5,641 |
|
|
28,722 |
|
(80)% |
(Loss) income before income tax expense |
|
|
(21,502) |
|
|
17,014 |
|
(226)% |
|
|
(70,578) |
|
|
(38,247) |
|
(85)% |
Income tax expense |
|
|
(37) |
|
|
(17) |
|
(118)% |
|
|
(42) |
|
|
(22) |
|
(91)% |
Net (loss) income |
|
|
(21,539) |
|
|
16,997 |
|
(227)% |
|
|
(70,620) |
|
|
(38,269) |
|
(85)% |
Less: net (loss) income attributable to redeemable noncontrolling interest |
|
|
(14,513) |
|
|
12,518 |
|
(216)% |
|
|
(50,518) |
|
|
(28,349) |
|
(78)% |
Net (loss) income attributable to Class A common stockholders |
|
$ |
(7,026) |
|
$ |
4,479 |
|
(257)% |
|
$ |
(20,102) |
|
$ |
(9,920) |
|
(103)% |
|
|
|
|
|
|
|
|
|
|
|
|
|
|
|
|
|
Net (loss) income per share to Class A common stockholders, basic |
|
$ |
(0.08) |
|
$ |
0.06 |
|
(233)% |
|
$ |
(0.25) |
|
$ |
(0.14) |
|
(79)% |
Net (loss) income per share to Class A common stockholders, diluted |
|
$ |
(0.08) |
|
$ |
0.06 |
|
(233)% |
|
$ |
(0.25) |
|
$ |
(0.14) |
|
(79)% |
|
|
|
|
|
|
|
|
|
|
|
|
|
|
|
|
|
Weighted average common stock outstanding, basic |
|
|
85,320 |
|
|
68,545 |
|
|
|
|
78,196 |
|
|
68,449 |
|
|
Weighted average common stock outstanding, diluted |
|
|
85,320 |
|
|
69,322 |
|
|
|
|
78,196 |
|
|
68,449 |
|
|
|
|
|
|
|
|
|
|
|
|
|
|
|
|
|
|
|
7
EVgo Inc. and Subsidiaries
Condensed Consolidated Statements of Cash Flows
|
|
Six Months Ended |
||||
|
|
June 30, |
||||
(unaudited, in thousands) |
|
2023 |
|
2022 |
||
Cash flows from operating activities |
|
|
|
|
|
|
Net loss |
|
$ |
(70,620) |
|
$ |
(38,269) |
Adjustments to reconcile net loss to net cash used in operating activities |
|
|
|
|
|
|
Depreciation, amortization and accretion |
|
|
23,192 |
|
|
15,574 |
Net loss on disposal of property and equipment and impairment expense |
|
|
6,008 |
|
|
2,889 |
Share-based compensation |
|
|
14,922 |
|
|
10,548 |
Change in fair value of earnout liability |
|
|
(433) |
|
|
(2,627) |
Change in fair value of warrant liabilities |
|
|
(1,011) |
|
|
(25,839) |
Other |
|
|
(155) |
|
|
474 |
Changes in operating assets and liabilities |
|
|
|
|
|
|
Accounts receivable, net |
|
|
(11,422) |
|
|
(2,302) |
Receivables from related parties |
|
|
— |
|
|
1,499 |
Prepaid expenses and other current and noncurrent assets |
|
|
3,779 |
|
|
3,735 |
Operating lease assets and liabilities, net |
|
|
642 |
|
|
(808) |
Accounts payable |
|
|
(2,872) |
|
|
(76) |
Accrued liabilities |
|
|
2,925 |
|
|
358 |
Deferred revenue |
|
|
18,939 |
|
|
(572) |
Customer deposits |
|
|
(6,481) |
|
|
(2,110) |
Other current and noncurrent liabilities |
|
|
62 |
|
|
(844) |
Net cash used in operating activities |
|
|
(22,525) |
|
|
(38,370) |
Cash flows from investing activities |
|
|
|
|
|
|
Purchases of property, equipment and software |
|
|
(100,057) |
|
|
(72,291) |
Proceeds from insurance for property losses |
|
|
159 |
|
|
202 |
Purchases of investments |
|
|
— |
|
|
(34,747) |
Net cash used in investing activities |
|
|
(99,898) |
|
|
(106,836) |
Cash flows from financing activities |
|
|
|
|
|
|
Proceeds from issuance of Class A common stock under the ATM |
|
|
5,828 |
|
|
— |
Proceeds from issuance of Class A common stock under the equity offering |
|
|
128,023 |
|
|
— |
Proceeds from capital-build funding |
|
|
4,256 |
|
|
5,029 |
Proceeds from exercise of warrants |
|
|
— |
|
|
3 |
Payments of issuance costs |
|
|
(4,751) |
|
|
— |
Net cash provided by financing activities |
|
|
133,356 |
|
|
5,032 |
Net increase (decrease) in cash, cash equivalents and restricted cash |
|
|
10,933 |
|
|
(140,174) |
Cash, cash equivalents and restricted cash, beginning of period |
|
|
246,493 |
|
|
485,181 |
Cash, cash equivalents and restricted cash, end of period |
|
$ |
257,426 |
|
$ |
345,007 |
|
|
|
|
|
|
|
8
Use of Non-GAAP Financial Measures
To supplement EVgo’s financial information, which is prepared and presented in accordance with GAAP, EVgo uses certain non-GAAP financial measures. The presentation of non-GAAP financial measures is not intended to be considered in isolation or as a substitute for, or superior to, the financial information prepared and presented in accordance with GAAP. EVgo uses these non-GAAP financial measures for financial and operational decision-making and as a means to evaluate period-to-period comparisons. EVgo believes that these non-GAAP financial measures provide meaningful supplemental information regarding the Company’s performance by excluding certain items that may not be indicative of EVgo’s recurring core business operating results.
EVgo believes that both management and investors benefit from referring to these non-GAAP financial measures in assessing EVgo’s performance. These non-GAAP financial measures also facilitate management’s internal comparisons to the Company’s historical performance. EVgo believes these non-GAAP financial measures are useful to investors both because (1) they allow for greater transparency with respect to key metrics used by management in its financial and operational decision-making and (2) they are used by EVgo’s institutional investors and the analyst community to help them analyze the health of EVgo’s business.
For more information on these non-GAAP financial measures, including reconciliations to the most comparable GAAP measures, please see the sections titled “Definitions of Non-GAAP Financial Measures” and “Reconciliations of Non-GAAP Measures” included at the end of this release.
Definitions of Non-GAAP Financial Measures
This release includes the following non-GAAP financial measures, in each case as defined below: “Adjusted Cost of Sales,” “Adjusted Cost of Sales as a Percentage of Revenue,” “Adjusted Gross Profit (Loss),” “Adjusted Gross Margin,” “Adjusted General and Administrative Expenses,” “Adjusted General and Administrative Expenses as a Percentage of Revenue,” “EBITDA,” “EBITDA Margin,” “Adjusted EBITDA,” and “Adjusted EBITDA Margin.” EVgo believes these measures are useful to investors in evaluating EVgo’s performance. In addition, EVgo management uses these measures internally to establish forecasts, budgets, and operational goals to manage and monitor its business. EVgo believes that these measures help to depict a more meaningful representation of the performance of the underlying business, enabling EVgo to evaluate and plan more effectively for the future.
Adjusted Cost of Sales, Adjusted Cost of Sales as a Percentage of Revenue, Adjusted Gross Profit (Loss), Adjusted Gross Margin, Adjusted General and Administrative Expenses, Adjusted General and Administrative Expenses as a Percentage of Revenue, EBITDA, EBITDA Margin, Adjusted EBITDA and Adjusted EBITDA Margin are not prepared in accordance with GAAP and may be different from non-GAAP financial measures used by other companies. These measures should not be considered as measures of financial performance under GAAP and the items excluded from or included in these metrics are significant components in understanding and assessing EVgo’s financial performance. These metrics should not be considered as alternatives to net income (loss) or any other performance measures derived in accordance with GAAP.
EVgo defines Adjusted Cost of Sales as cost of sales before (i) depreciation, net of capital-build amortization, and (ii) share-based compensation. EVgo defines Adjusted Cost of Sales as a Percentage of Revenue as Adjusted Cost of Sales as a percentage of revenue. EVgo defines Adjusted Gross Profit (Loss) as revenue less Adjusted Cost of Sales. EVgo defines Adjusted Gross Margin as Adjusted Gross Profit (Loss) as a percentage of revenue. EVgo defines Adjusted General and Administrative Expenses as general and administrative expenses before (i) share-based compensation, (ii) loss on disposal of property and equipment, net of recoveries, and impairment expense, (iii) bad debt expense, and (iv) certain other items that management believes are not
9
indicative of EVgo’s ongoing performance. EVgo defines Adjusted General and Administrative Expenses as a Percentage of Revenue as Adjusted General and Administrative Expenses as a percentage of revenue. EVgo defines EBITDA as net income (loss) before (i) depreciation, net of capital-build amortization, (ii) amortization, (iii) accretion, (iv) interest income, (v) interest expense, and (vi) income tax expense. EVgo defines EBITDA Margin as EBITDA as a percentage of revenue. EVgo defines Adjusted EBITDA as EBITDA plus (i) share-based compensation, (ii) loss on disposal of property and equipment, net of recoveries, and impairment expense, (iii) (gain) loss on investments, (iv) bad debt expense, (v) change in fair value of earnout liability, (vi) change in fair value of warrant liabilities, and (vii) certain other items that management believes are not indicative of EVgo’s ongoing performance. EVgo defines Adjusted EBITDA Margin as Adjusted EBITDA as a percentage of revenue.
Reconciliations of Non-GAAP Measures
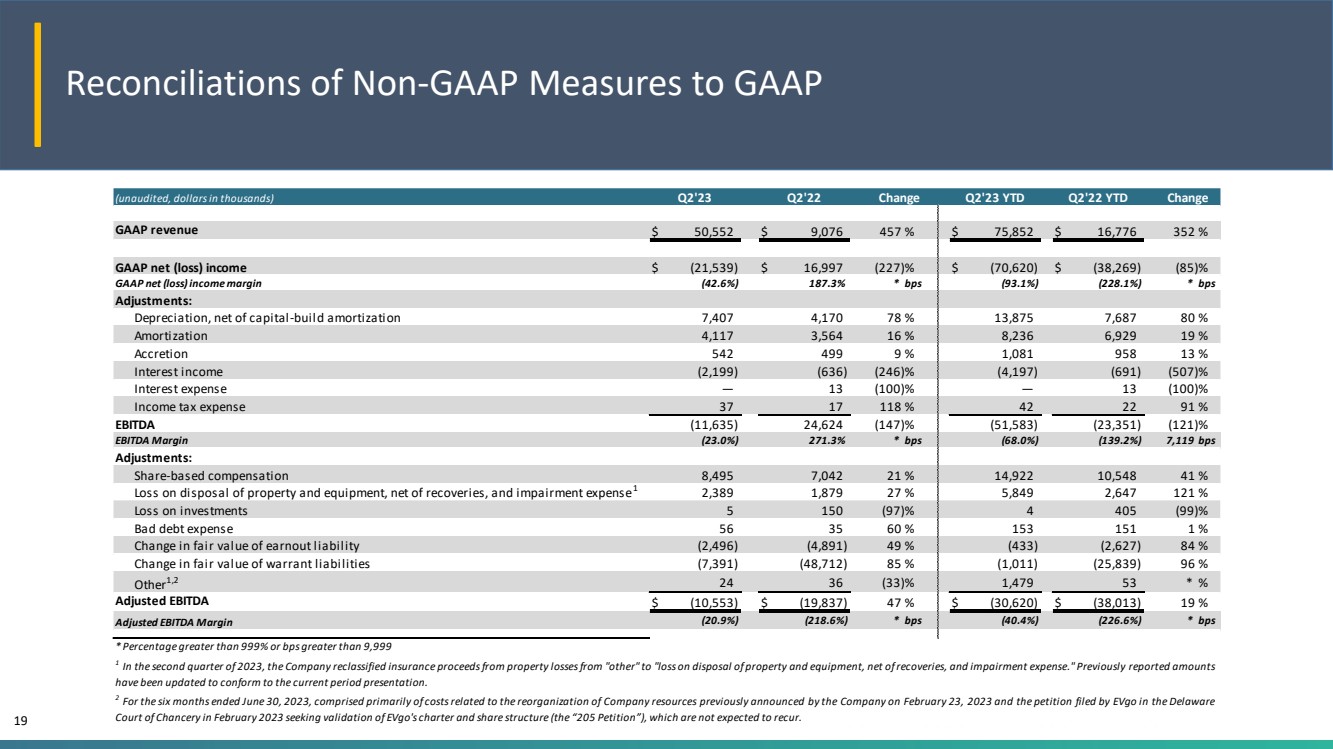
The following unaudited table presents a reconciliation of EBITDA, EBITDA Margin, Adjusted EBITDA, and Adjusted EBITDA Margin to the most directly comparable GAAP measure:
(unaudited, dollars in thousands) |
Q2'23 |
|
Q2'22 |
|
Change |
|
Q2'23 YTD |
|
Q2'22 YTD |
|
Change |
|||||
|
|
|
|
|
|
|
|
|
|
|
|
|
|
|
|
|
GAAP revenue |
$ |
50,552 |
|
$ |
9,076 |
|
457% |
|
|
$ |
75,852 |
|
$ |
16,776 |
|
352% |
|
|
|
|
|
|
|
|
|
|
|
|
|
|
|
|
|
GAAP net (loss) income |
$ |
(21,539) |
|
$ |
16,997 |
|
(227)% |
|
|
$ |
(70,620) |
|
$ |
(38,269) |
|
(85)% |
GAAP net (loss) income margin |
|
(42.6%) |
|
|
187.3% |
|
* bps |
|
|
|
(93.1%) |
|
|
(228.1%) |
|
* bps |
Adjustments: |
|
|
|
|
|
|
|
|
|
|
|
|
|
|
|
|
Depreciation, net of capital-build amortization |
|
7,407 |
|
|
4,170 |
|
78% |
|
|
|
13,875 |
|
|
7,687 |
|
80% |
Amortization |
|
4,117 |
|
|
3,564 |
|
16% |
|
|
|
8,236 |
|
|
6,929 |
|
19% |
Accretion |
|
542 |
|
|
499 |
|
9% |
|
|
|
1,081 |
|
|
958 |
|
13% |
Interest income |
|
(2,199) |
|
|
(636) |
|
(246)% |
|
|
|
(4,197) |
|
|
(691) |
|
(507)% |
Interest expense |
|
— |
|
|
13 |
|
(100)% |
|
|
|
— |
|
|
13 |
|
(100)% |
Income tax expense |
|
37 |
|
|
17 |
|
118% |
|
|
|
42 |
|
|
22 |
|
91% |
EBITDA |
|
(11,635) |
|
|
24,624 |
|
(147)% |
|
|
|
(51,583) |
|
|
(23,351) |
|
(121)% |
EBITDA Margin |
|
(23.0%) |
|
|
271.3% |
|
* bps |
|
|
|
(68.0%) |
|
|
(139.2%) |
|
7,119 bps |
Adjustments: |
|
|
|
|
|
|
|
|
|
|
|
|
|
|
|
|
Share-based compensation |
|
8,495 |
|
|
7,042 |
|
21% |
|
|
|
14,922 |
|
|
10,548 |
|
41% |
Loss on disposal of property and equipment, net of recoveries, and impairment expense1 |
|
2,389 |
|
|
1,879 |
|
27% |
|
|
|
5,849 |
|
|
2,647 |
|
121% |
Loss on investments |
|
5 |
|
|
150 |
|
(97)% |
|
|
|
4 |
|
|
405 |
|
(99)% |
Bad debt expense |
|
56 |
|
|
35 |
|
60% |
|
|
|
153 |
|
|
151 |
|
1% |
Change in fair value of earnout liability |
|
(2,496) |
|
|
(4,891) |
|
49% |
|
|
|
(433) |
|
|
(2,627) |
|
84% |
Change in fair value of warrant liabilities |
|
(7,391) |
|
|
(48,712) |
|
85% |
|
|
|
(1,011) |
|
|
(25,839) |
|
96% |
Other1,2 |
|
24 |
|
|
36 |
|
(33)% |
|
|
|
1,479 |
|
|
53 |
|
* % |
Adjusted EBITDA |
$ |
(10,553) |
|
$ |
(19,837) |
|
47% |
|
|
$ |
(30,620) |
|
$ |
(38,013) |
|
19% |
Adjusted EBITDA Margin |
|
(20.9%) |
|
|
(218.6%) |
|
* bps |
|
|
|
(40.4%) |
|
|
(226.6%) |
|
* bps |
|
|
|
|
|
|
|
|
|
|
|
|
|
|
|
|
|
* Percentage greater than 999% or bps greater than 9,999 | ||||||||||||||||
1 In the second quarter of 2023, the Company reclassified insurance proceeds from property losses from "other" to "loss on disposal of property and equipment, net of recoveries, and impairment expense." Previously reported amounts have been updated to conform to the current period presentation. | ||||||||||||||||
2 For the six months ended June 30, 2023, comprised primarily of costs related to the reorganization of Company resources previously announced by the Company on February 23, 2023 and the petition filed by EVgo in the Delaware Court of Chancery in February 2023 seeking validation of EVgo's charter and share structure (the “205 Petition”), which are not expected to recur. | ||||||||||||||||
10
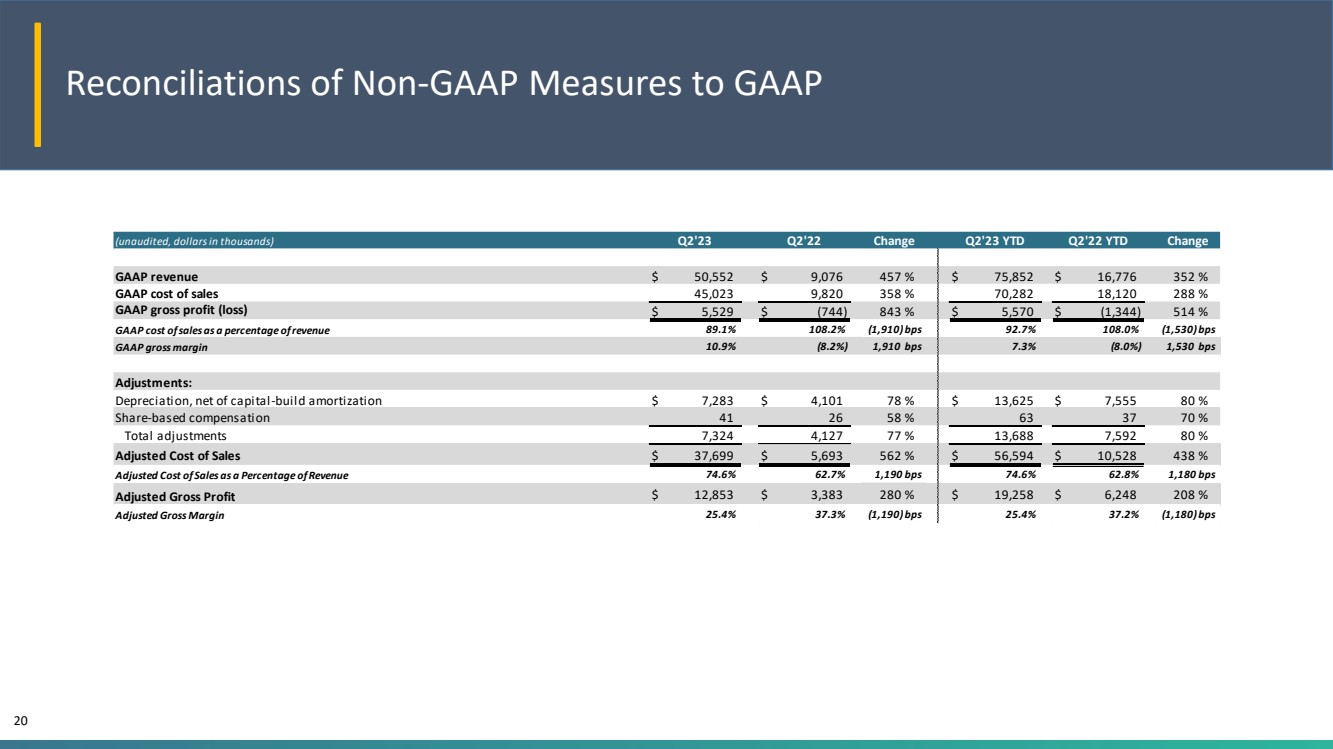
The following unaudited table presents a reconciliation of Adjusted Cost of Sales, Adjusted Cost of Sales as a Percentage of Revenue, Adjusted Gross Profit (Loss) and Adjusted Gross Margin to the most directly comparable GAAP measures:
(unaudited, dollars in thousands) |
Q2'23 |
|
Q2'22 |
|
Change |
|
|
Q2'23 YTD |
|
Q2'22 YTD |
|
Change |
||||
|
|
|
|
|
|
|
|
|
|
|
|
|
|
|
|
|
GAAP revenue |
$ |
50,552 |
|
$ |
9,076 |
|
457% |
|
|
$ |
75,852 |
|
$ |
16,776 |
|
352% |
GAAP cost of sales |
|
45,023 |
|
|
9,820 |
|
358% |
|
|
|
70,282 |
|
|
18,120 |
|
288% |
GAAP gross profit (loss) |
$ |
5,529 |
|
$ |
(744) |
|
843% |
|
|
$ |
5,570 |
|
$ |
(1,344) |
|
514% |
GAAP cost of sales as a percentage of revenue |
|
89.1% |
|
|
108.2% |
|
(1,910) bps |
|
|
|
92.7% |
|
|
108.0% |
|
(1,530) bps |
GAAP gross margin |
|
10.9% |
|
|
(8.2%) |
|
1,910 bps |
|
|
|
7.3% |
|
|
(8.0%) |
|
1,530 bps |
|
|
|
|
|
|
|
|
|
|
|
|
|
|
|
|
|
Adjustments: |
|
|
|
|
|
|
|
|
|
|
|
|
|
|
||
Depreciation, net of capital-build amortization |
$ |
7,283 |
|
$ |
4,101 |
|
78% |
|
|
$ |
13,625 |
|
$ |
7,555 |
|
80% |
Share-based compensation |
|
41 |
|
|
26 |
|
58% |
|
|
|
63 |
|
|
37 |
|
70% |
Total adjustments |
|
7,324 |
|
|
4,127 |
|
77% |
|
|
|
13,688 |
|
|
7,592 |
|
80% |
Adjusted Cost of Sales |
$ |
37,699 |
|
$ |
5,693 |
|
562% |
|
|
$ |
56,594 |
|
$ |
10,528 |
|
438% |
Adjusted Cost of Sales as a Percentage of Revenue |
|
74.6% |
|
|
62.7% |
|
1,190 bps |
|
|
|
74.6% |
|
|
62.8% |
|
1,180 bps |
Adjusted Gross Profit |
$ |
12,853 |
|
$ |
3,383 |
|
280% |
|
|
$ |
19,258 |
|
$ |
6,248 |
|
208% |
Adjusted Gross Margin |
|
25.4% |
|
|
37.3% |
|
(1,190) bps |
|
|
|
25.4% |
|
|
37.2% |
|
(1,180) bps |
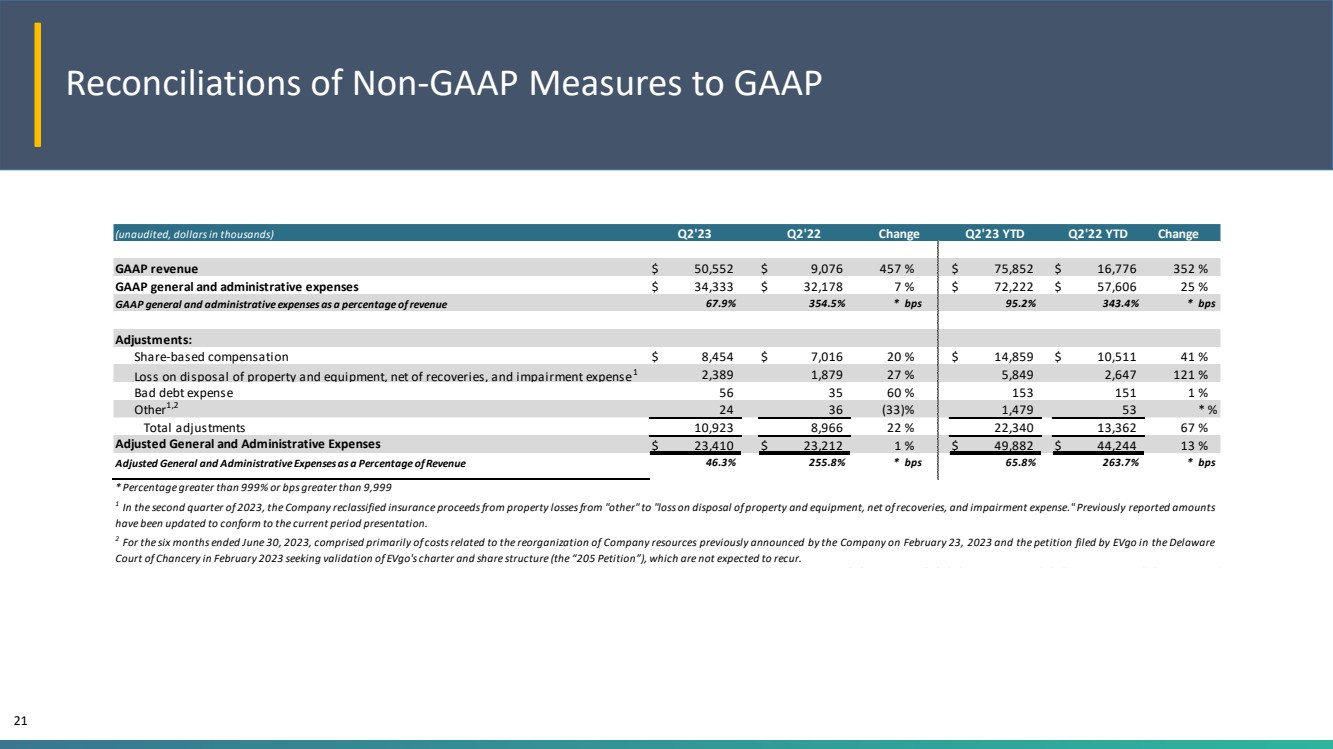
The following unaudited table presents a reconciliation of Adjusted General and Administrative Expenses and Adjusted General and Administrative Expenses as a Percentage of Revenue to the most directly comparable GAAP measures:
(unaudited, dollars in thousands) |
Q2'23 |
|
Q2'22 |
|
Change |
|
Q2'23 YTD |
|
Q2'22 YTD |
|
Change |
|||||
|
|
|
|
|
|
|
|
|
|
|
|
|
|
|
|
|
GAAP revenue |
$ |
50,552 |
|
$ |
9,076 |
|
457% |
|
|
$ |
75,852 |
|
$ |
16,776 |
|
352% |
GAAP general and administrative expenses |
$ |
34,333 |
|
$ |
32,178 |
|
7% |
|
|
$ |
72,222 |
|
$ |
57,606 |
|
25% |
GAAP general and administrative expenses as a percentage of revenue |
|
67.9% |
|
|
354.5% |
|
* bps |
|
|
|
95.2% |
|
|
343.4% |
|
* bps |
|
|
|
|
|
|
|
|
|
|
|
|
|
|
|
|
|
Adjustments: |
|
|
|
|
|
|
|
|
|
|
|
|
|
|
|
|
Share-based compensation |
$ |
8,454 |
|
$ |
7,016 |
|
20% |
|
|
$ |
14,859 |
|
$ |
10,511 |
|
41% |
Loss on disposal of property and equipment, net of recoveries, and impairment expense1 |
|
2,389 |
|
|
1,879 |
|
27% |
|
|
|
5,849 |
|
|
2,647 |
|
121% |
Bad debt expense |
|
56 |
|
|
35 |
|
60% |
|
|
|
153 |
|
|
151 |
|
1% |
Other1,2 |
|
24 |
|
|
36 |
|
(33)% |
|
|
|
1,479 |
|
|
53 |
|
* % |
Total adjustments |
|
10,923 |
|
|
8,966 |
|
22% |
|
|
|
22,340 |
|
|
13,362 |
|
67% |
Adjusted General and Administrative Expenses |
$ |
23,410 |
|
$ |
23,212 |
|
1% |
|
|
$ |
49,882 |
|
$ |
44,244 |
|
13% |
Adjusted General and Administrative Expenses as a Percentage of Revenue |
|
46.3% |
|
|
255.8% |
|
* bps |
|
|
|
65.8% |
|
|
263.7% |
|
* bps |
|
|
|
|
|
|
|
|
|
|
|
|
|
|
|
|
|
* Percentage greater than 999% or bps greater than 9,999 | ||||||||||||||||
1 In the second quarter of 2023, the Company reclassified insurance proceeds from property losses from "other" to "loss on disposal of property and equipment, net of recoveries, and impairment expense." Previously reported amounts have been updated to conform to the current period presentation. | ||||||||||||||||
2 For the six months ended June 30, 2023, comprised primarily of costs related to the reorganization of Company resources previously announced by the Company on February 23, 2023 and the petition filed by EVgo in the Delaware Court of Chancery in February 2023 seeking validation of EVgo's charter and share structure (the “205 Petition”), which are not expected to recur. | ||||||||||||||||
11
For investors:
investors@evgo.com
For Media:
press@evgo.com
Source: EVgo Inc.
12
|
EVgo Q2 2023 Earnings Call August 2, 2023 Nasdaq: EVGO – investors.evgo.com |
|
Forward-Looking Statements This presentation contains “forward-looking statements” within the meaning of the "safe harbor" provisions of the United States Private Securities Litigation Reform Act of 1995. Forward-looking statements may be identified by the use of words such as "estimate," "plan," "project," "forecast," "intend," "will," "expect," "anticipate," "believe," "seek," "target," "assume" or other similar expressions that predict or indicate future events or trends or that are not statements of historical matters. These forward-looking statements are based on current expectations or beliefs of the management of EVgo Inc. (“EVgo” or the “Company”) and are subject to numerous assumptions, risks and uncertainties that could cause actual results to differ materially from those described in the forward-looking statements. These forward-looking statements include, but are not limited to, express or implied statements regarding EVgo’s future financial and operating performance, revenues, capital expenditures, chargers in operation or under construction and network throughput; EVgo’s expectation of market position and acceleration in its business due to factors including increased EV adoption; EVgo’s collaboration with partners enabling effective deployment of chargers, including under its contract with Pilot Flying J and GM; and anticipated awards of funding in connection with the NEVI program and associated state programs. These statements are based on various assumptions, whether or not identified in this presentation, and on the current expectations of EVgo’s management and are not predictions of actual performance. There are a significant number of factors that could cause actual results to differ materially from the statements made in this presentation, including changes or developments in the broader general market; macro political, economic, and business conditions, including inflation and geopolitical conflicts that could impact EVgo’s supply chains; increased competition, including from new and existing entrants in the EV charging market; unfavorable conditions or further disruptions in the capital and credit markets and EVgo's ability to obtain additional capital on commercially reasonable terms; EVgo’s limited operating history as a public company; EVgo’s dependence on widespread adoption of EVs and increased installation of charging stations; mechanisms surrounding energy and non-energy costs for EVgo’s charging stations; the impact of governmental support and mandates that could reduce, modify, or eliminate financial incentives, rebates, tax credits, and other support available to EVgo; supply chain disruptions; EVgo’s ability to expand into new service markets, grow its customer base, and manage its operations; EVgo's ability to adapt its assets and infrastructure to changes in industry and regulatory standards for EV charging; impediments to EVgo’s expansion plans, including permitting delays; the need to attract additional fleet operators as customers; potential adverse effects on EVgo’s revenue and gross margins if customers increasingly claim clean energy credits and, as a result, they are no longer available to be claimed by EVgo; risks related to EVgo’s dependence on its intellectual property; and risks that EVgo’s technology could have undetected defects or errors. Additional risks and uncertainties that could affect the Company’s financial results are included under the captions “Risk Factors” and “Management’s Discussion and Analysis of Financial Condition and Results of Operations of EVgo” in EVgo’s most recent Annual Report on Form 10-K, filed with the Securities and Exchange Commission (the “SEC”), as well as its other SEC filings, copies of which are available on EVgo’s website at investors.evgo.com, and on the SEC’s website at www.sec.gov. All forward-looking statements in this presentation are based on information available to EVgo as of the date hereof, and EVgo does not assume any obligation to update the forward-looking statements provided to reflect events that occur or circumstances that exist after the date on which they were made, except as required by applicable law. Use of Non-GAAP Financial Measures To supplement EVgo’s financial information, which is prepared and presented in accordance with generally accepted accounting principles in the United States of America (“GAAP”), EVgo uses certain non-GAAP financial measures. The presentation of non-GAAP financial measures is not intended to be considered in isolation or as a substitute for, or superior to, the financial information prepared and presented in accordance with GAAP. EVgo uses these non-GAAP financial measures for financial and operational decision-making and as a means to evaluate period-to-period comparisons. EVgo believes that these non-GAAP financial measures provide meaningful supplemental information regarding the Company’s performance by excluding certain items that may not be indicative of EVgo’s recurring core business operating results. EVgo believes that both management and investors benefit from referring to these non-GAAP financial measures in assessing EVgo’s performance. These non-GAAP financial measures also facilitate management’s internal comparisons to the Company’s historical performance. EVgo believes these non-GAAP financial measures are useful to investors both because (1) they allow for greater transparency with respect to key metrics used by management in its financial and operational decision-making and (2) they are used by EVgo’s institutional investors and the analyst community to help them analyze the health of EVgo’s business. Reconciliations of these non-GAAP financial measures to the most comparable GAAP measures can be found in the tables included at the end of this presentation. Safe Harbor & Forward-Looking Statements 2 |
|
1 Cathy Zoi, CEO Strategic Overview 3 |
|
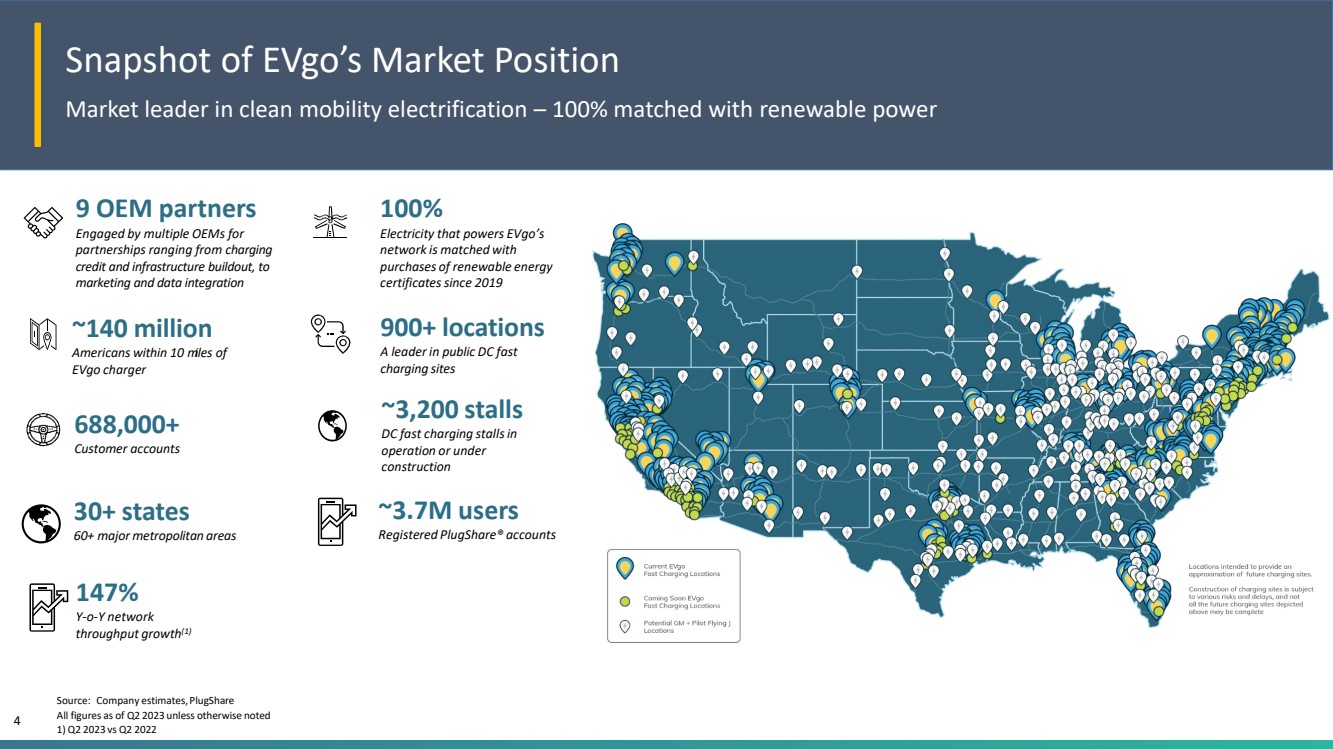
~3,200 stalls DC fast charging stalls in operation or under construction 900+ locations A leader in public DC fast charging sites 9 OEM partners Engaged by multiple OEMs for partnerships ranging from charging credit and infrastructure buildout, to marketing and data integration 100% Electricity that powers EVgo’s network is matched with purchases of renewable energy certificates since 2019 688,000+ Customer accounts ~140 million Americans within 10 miles of EVgo charger Snapshot of EVgo’s Market Position Market leader in clean mobility electrification – 100% matched with renewable power 147% Y-o-Y network throughput growth(1) 30+ states 60+ major metropolitan areas ~3.7M users Registered PlugShare® accounts 4 Source: Company estimates,PlugShare All figures as of Q2 2023 unless otherwise noted 1) Q2 2023 vs Q2 2022 |
|
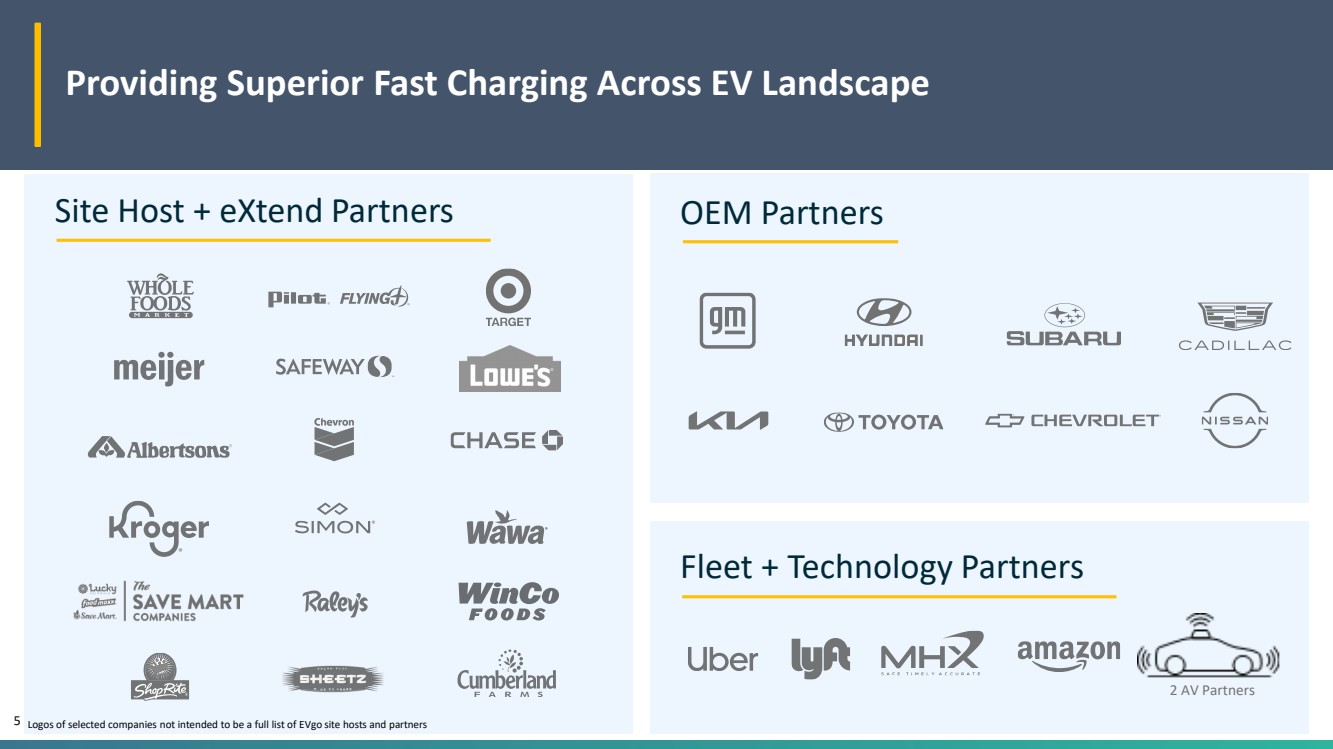
5 Providing Superior Fast Charging Across EV Landscape Site Host + eXtend Partners OEM Partners Fleet + Technology Partners 2 AV Partners Logos of selected companies not intended to be a full list of EVgo site hosts and partners |
|
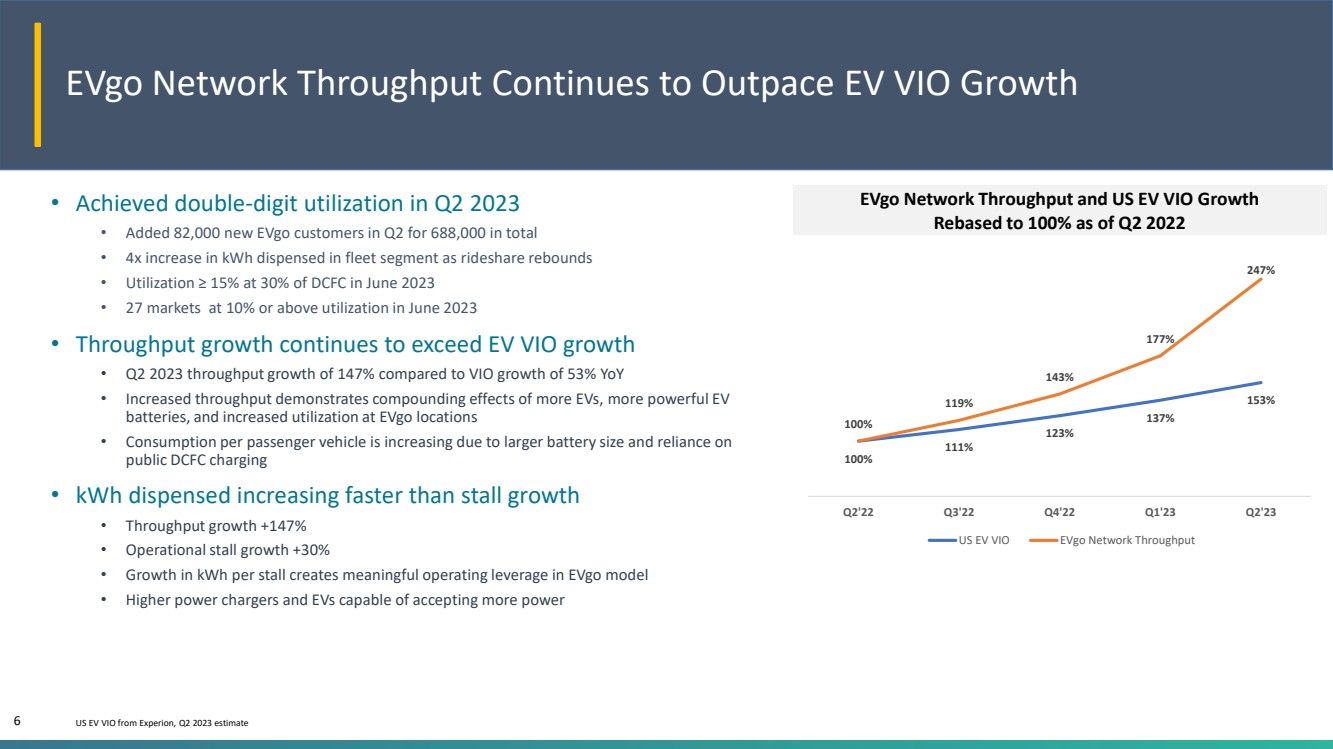
• Achieved double-digit utilization in Q2 2023 • Added 82,000 new EVgo customers in Q2 for 688,000 in total • 4x increase in kWh dispensed in fleet segment as rideshare rebounds • Utilization ≥ 15% at 30% of DCFC in June 2023 • 27 markets at 10% or above utilization in June 2023 • Throughput growth continues to exceed EV VIO growth • Q2 2023 throughput growth of 147% compared to VIO growth of 53% YoY • Increased throughput demonstrates compounding effects of more EVs, more powerful EV batteries, and increased utilization at EVgo locations • Consumption per passenger vehicle is increasing due to larger battery size and reliance on public DCFC charging • kWh dispensed increasing faster than stall growth • Throughput growth +147% • Operational stall growth +30% • Growth in kWh per stall creates meaningful operating leverage in EVgo model • Higher power chargers and EVs capable of accepting more power EVgo Network Throughput Continues to Outpace EV VIO Growth 6 EVgo Network Throughput and US EV VIO Growth Rebased to 100% as of Q2 2022 US EV VIO from Experion, Q2 2023 estimate 100% 111% 123% 137% 153% 100% 119% 143% 177% 247% Q2'22 Q3'22 Q4'22 Q1'23 Q2'23 US EV VIO EVgo Network Throughput |
|
Delivering Value for EVgo Partners and EV Drivers 7 • Operationalized 1,000th GM/EVgo stall - GM remains key OEM partner aiding stall development • Delivered charging equipment, constructed, and began commissioning first locations for Pilot Flying J and GM • Announced plans to add NACS connectors to EVgo chargers • Won $13.8 million for 20 sites in Ohio NEVI funding for EVgo owned and EVgo eXtend™ sites, or 75% of awarded funding • ReNew – replaced 10 stalls and removed 48 during Q2 2023 • “One & Done” charging up to 91% from 85% at the beginning of 2023 • Continually improving driver experience: Autocharge+ used to initiate 13% of charging sessions, expanding EVgo AdvantageTM, and rolling out reservations and time-of-use pricing to more stalls EVgo eXtend™ at Pilot Flying J EVgo and GM 1,000th stall |
|
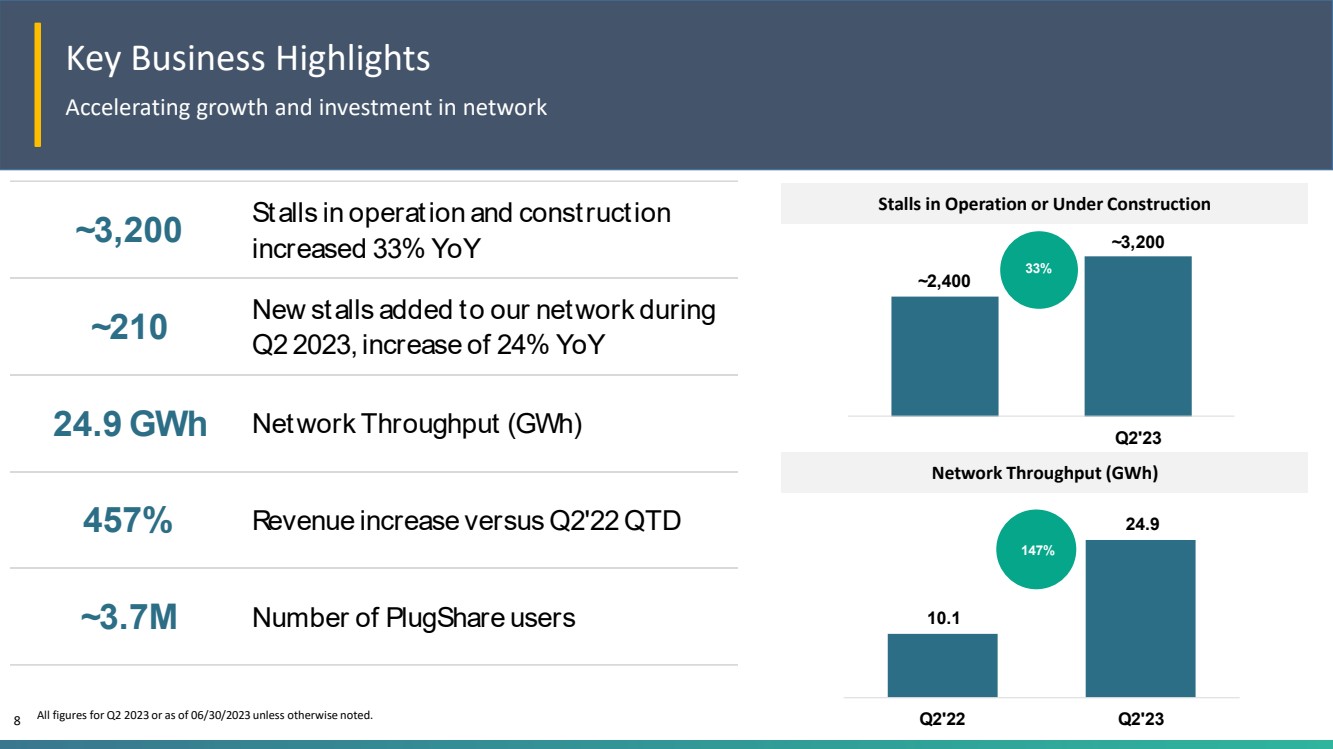
Key Business Highlights Accelerating growth and investment in network Stalls in Operation or Under Construction Network Throughput (GWh) 8 All figures for Q2 2023 or as of 06/30/2023 unless otherwise noted. Stalls in operation and construction increased 33% YoY New stalls added to our network during Q2 2023, increase of 24% YoY Network Throughput (GWh) Revenue increase versus Q2'22 QTD ~3.7M Number of PlugShare users ~3,200 ~210 24.9 GWh 457% ~2,400 ~3,200 Q2'23 33% 10.1 24.9 Q2'22 Q2'23 147% |
|
2 Stephanie Lee, Interim CFO Financial and Operational Overview |
|
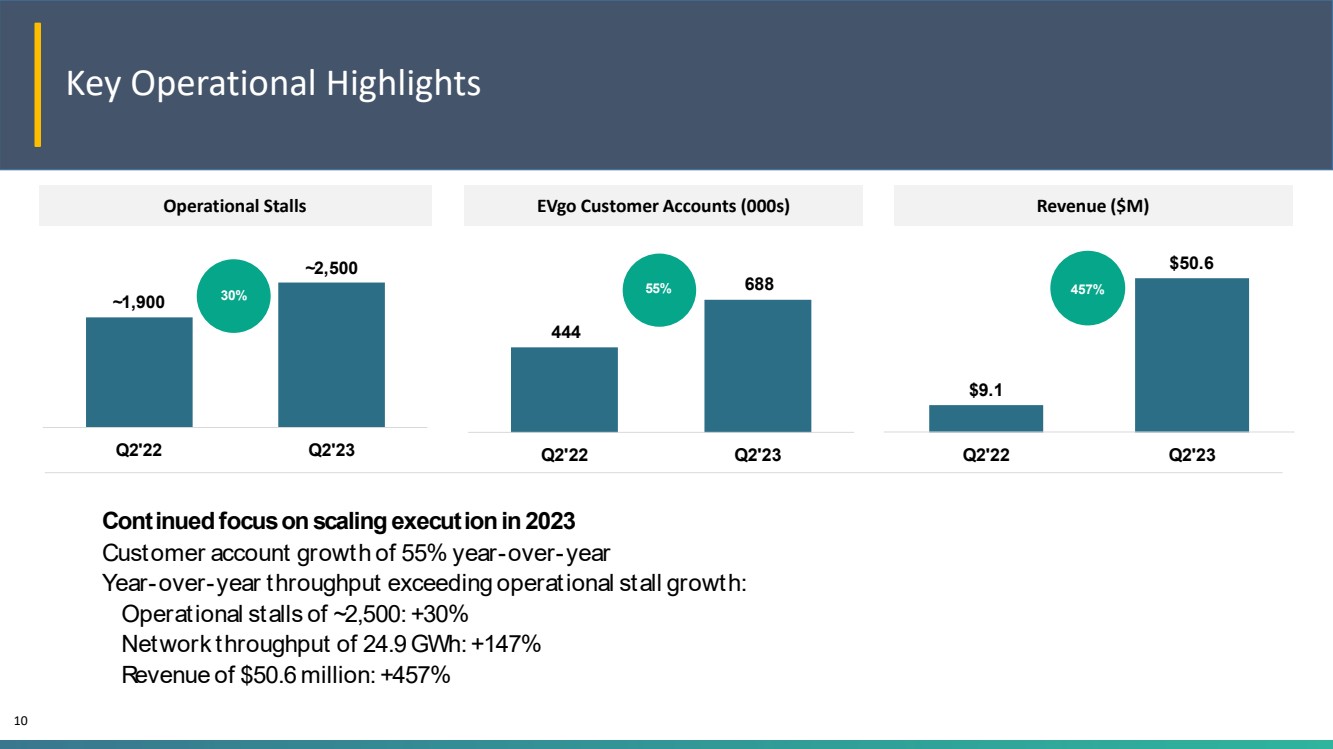
Key Operational Highlights Operational Stalls EVgo Customer Accounts (000s) Revenue ($M) 10 444 688 Q2'22 Q2'23 55% $9.1 $50.6 Q2'22 Q2'23 Operational stalls of ~2,500: +30% Network throughput of 24.9 GWh: +147% Revenue of $50.6 million: +457% Continued focus on scaling execution in 2023 Customer account growth of 55% year-over-year Year-over-year throughput exceeding operational stall growth: 457% ~1,900 ~2,500 Q2'22 Q2'23 30% |
|
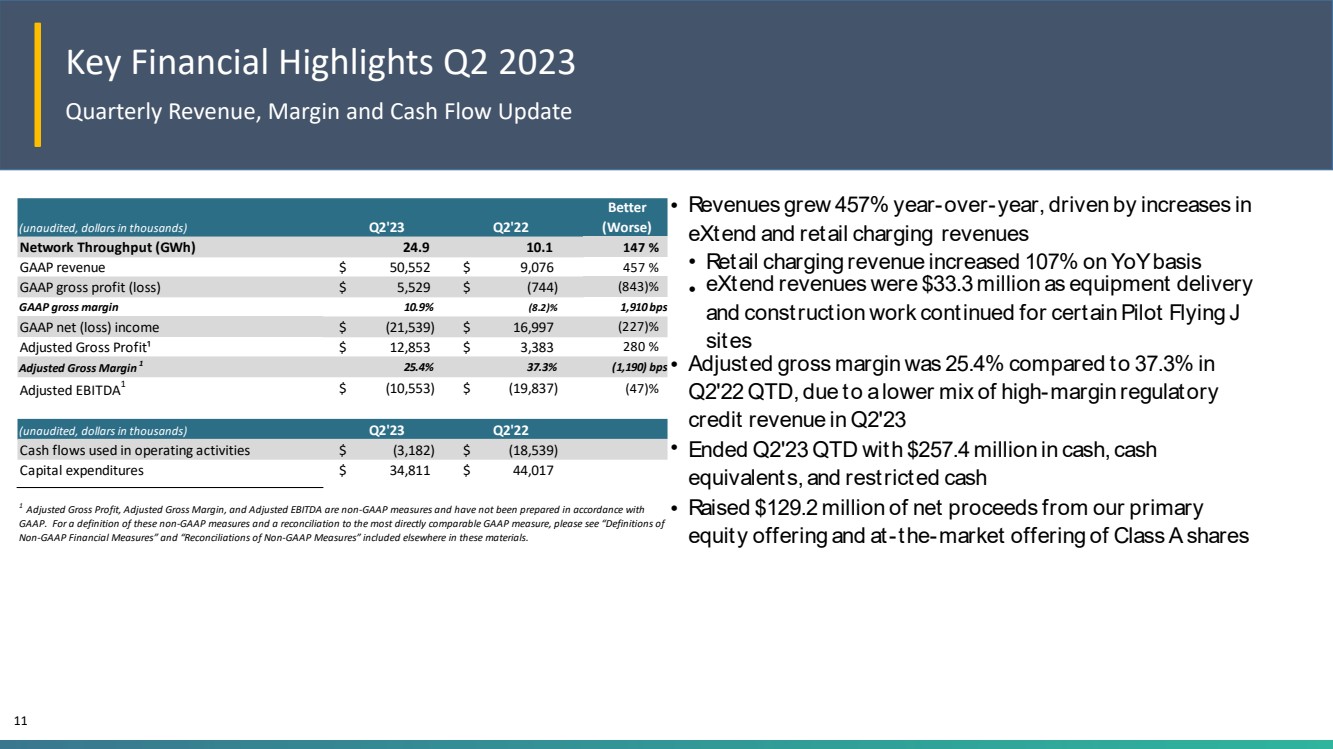
Key Financial Highlights Q2 2023 Quarterly Revenue, Margin and Cash Flow Update 11 Better (Worse) Network Throughput (GWh) 24.9 10.1 147 % GAAP revenue $ 50,552 $ 9,076 457 % GAAP gross profit (loss) $ 5,529 $ (744) (843)% GAAP gross margin 10.9% (8.2)% 1,910 bps GAAP net (loss) income $ (21,539) $ 16,997 (227)% Adjusted Gross Profit¹ $ 12,853 $ 3,383 280 % Adjusted Gross Margin 1 25.4% 37.3% (1,190) bps Adjusted EBITDA1 $ (10,553) $ (19,837) (47)% Cash flows used in operating activities $ (3,182) $ (18,539) Capital expenditures $ 34,811 $ 44,017 1 Adjusted Gross Profit, Adjusted Gross Margin, and Adjusted EBITDA are non-GAAP measures and have not been prepared in accordance with GAAP. For a definition of these non-GAAP measures and a reconciliation to the most directly comparable GAAP measure, please see “Definitions of Non-GAAP Financial Measures” and “Reconciliations of Non-GAAP Measures” included elsewhere in these materials. (unaudited, dollars in thousands) (unaudited, dollars in thousands) Q2'23 Q2'22 Q2'23 Q2'22 • • • • • • Raised $129.2 million of net proceeds from our primary equity offering and at-the-market offering of Class A shares Ended Q2'23 QTD with $257.4 million in cash, cash equivalents, and restricted cash Revenues grew 457% year-over-year, driven by increases in eXtend and retail charging revenues Retail charging revenue increased 107% on YoY basis eXtend revenues were $33.3 million as equipment delivery and construction work continued for certain Pilot Flying J sites Adjusted gross margin was 25.4% compared to 37.3% in Q2'22 QTD, due to a lower mix of high-margin regulatory credit revenue in Q2'23 |
|
Adjusted EBITDA** ($78)M-($68)M Total Stalls in Operation or Under Construction as of YE 2023 3,400-4,000 Updating 2023 financial and operational forecast figures: 2023 Guidance 12 *A reconciliation of projected Adjusted EBITDA (non-GAAP) to net income (loss), the most directly comparable GAAP measure, is not provided because certain measures, including share-based compensation expense, which is excluded from adjusted EBITDA, cannot be reasonably calculated or predicted at this time without unreasonable efforts. For a definition of Adjusted EBITDA and a reconciliation to the most directly comparable GAAP measure for historical periods presented in this release, please see “Definitions of Non-GAAP Financial Measures” and “Reconciliations of Non-GAAP Measures” included elsewhere in these materials. Revenue $120M-$150M |
|
3 Appendix Reconciliation of Non-GAAP Measures to GAAP, Summary Financials |
|
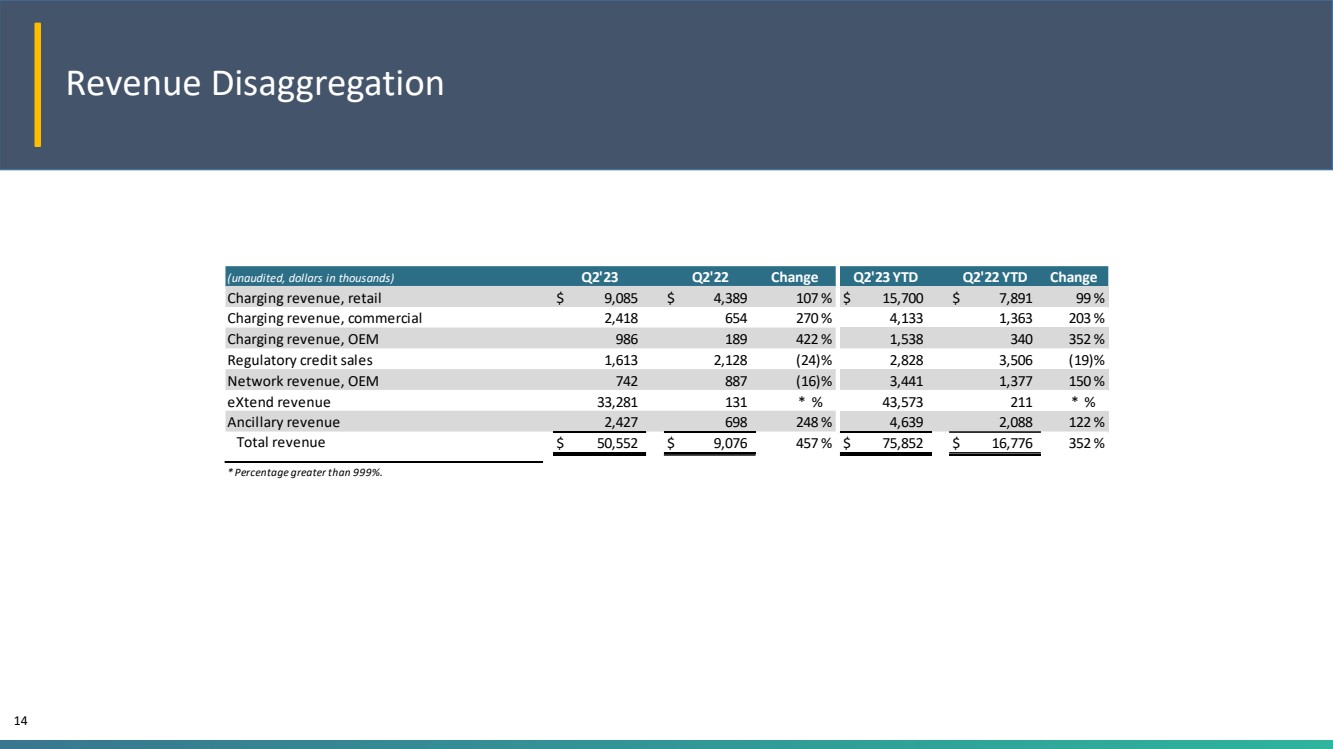
Revenue Disaggregation 14 Change Change Charging revenue, retail $ 9,085 $ 4,389 107 % $ 15,700 $ 7,891 99 % Charging revenue, commercial 2,418 654 270 % 4,133 1,363 203 % Charging revenue, OEM 986 189 422 % 1,538 340 352 % Regulatory credit sales 1,613 2,128 (24)% 2,828 3,506 (19)% Network revenue, OEM 742 887 (16)% 3,441 1,377 150 % eXtend revenue 33,281 131 * % 43,573 211 * % Ancillary revenue 2,427 698 248 % 4,639 2,088 122 % Total revenue $ 50,552 $ 9,076 457 % $ 75,852 $ 16,776 352 % * Percentage greater than 999%. (unaudited, dollars in thousands) Q2'23 Q2'22 Q2'23 YTD Q2'22 YTD |
|
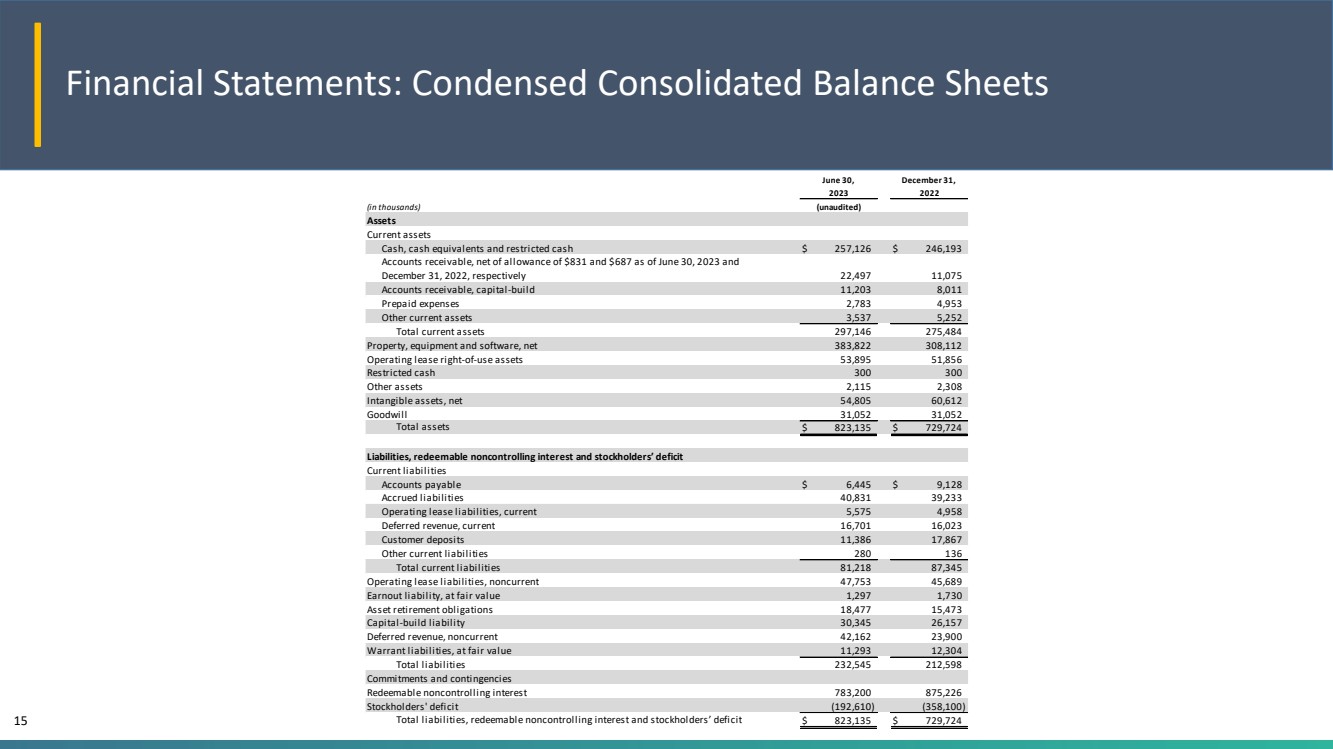
Financial Statements: Condensed Consolidated Balance Sheets 15 (in thousands) Assets Current assets Cash, cash equivalents and restricted cash $ 257,126 $ 246,193 Accounts receivable, net of allowance of $831 and $687 as of June 30, 2023 and December 31, 2022, respectively 22,497 11,075 Accounts receivable, capital-build 11,203 8,011 Prepaid expenses 2,783 4,953 Other current assets 3,537 5,252 Total current assets 297,146 275,484 Property, equipment and software, net 383,822 308,112 Operating lease right-of-use assets 53,895 51,856 Restricted cash 300 300 Other assets 2,115 2,308 Intangible assets, net 54,805 60,612 Goodwill 31,052 31,052 Total assets $ 823,135 $ 729,724 Liabilities, redeemable noncontrolling interest and stockholders’ deficit Current liabilities Accounts payable $ 6,445 $ 9,128 Accrued liabilities 40,831 39,233 Operating lease liabilities, current 5,575 4,958 Deferred revenue, current 16,701 16,023 Customer deposits 11,386 17,867 Other current liabilities 280 136 Total current liabilities 81,218 87,345 Operating lease liabilities, noncurrent 47,753 45,689 Earnout liability, at fair value 1,297 1,730 Asset retirement obligations 18,477 15,473 Capital-build liability 30,345 26,157 Deferred revenue, noncurrent 42,162 23,900 Warrant liabilities, at fair value 11,293 12,304 Total liabilities 232,545 212,598 Commitments and contingencies Redeemable noncontrolling interest 783,200 875,226 Stockholders' deficit (192,610) (358,100) Total liabilities, redeemable noncontrolling interest and stockholders’ deficit $ 823,135 $ 729,724 (unaudited) 2023 2022 June 30, December 31, |
|
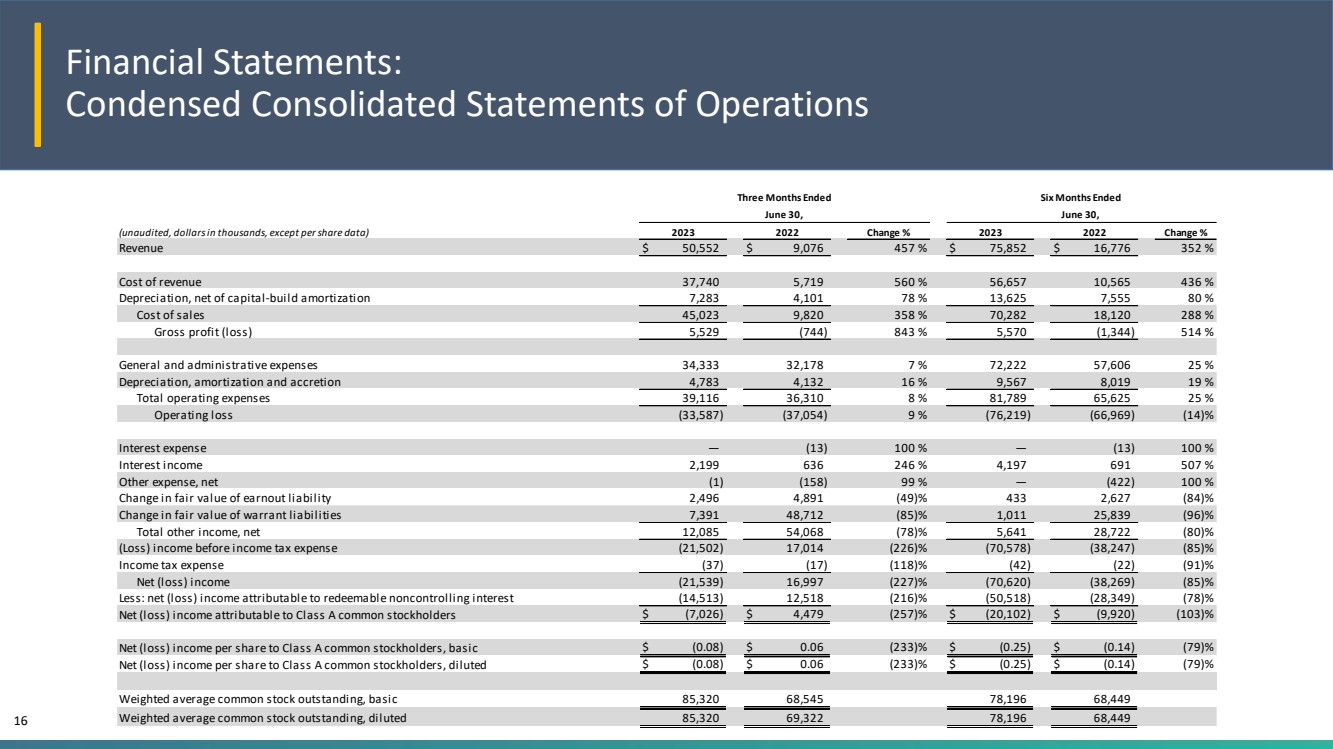
Financial Statements: Condensed Consolidated Statements of Operations 16 (unaudited, dollars in thousands, except per share data) Change % Change % Revenue $ 50,552 $ 9,076 457 % $ 75,852 $ 16,776 352 % Cost of revenue 37,740 5,719 560 % 56,657 10,565 436 % Depreciation, net of capital-build amortization 7,283 4,101 78 % 13,625 7,555 80 % Cost of sales 45,023 9,820 358 % 70,282 18,120 288 % Gross profit (loss) 5,529 (744) 843 % 5,570 (1,344) 514 % General and administrative expenses 34,333 32,178 7 % 72,222 57,606 25 % Depreciation, amortization and accretion 4,783 4,132 16 % 9,567 8,019 19 % Total operating expenses 39,116 36,310 8 % 81,789 65,625 25 % Operating loss (33,587) (37,054) 9 % (76,219) (66,969) (14)% Interest expense — (13) 100 % — (13) 100 % Interest income 2,199 636 246 % 4,197 691 507 % Other expense, net (1) (158) 99 % — (422) 100 % Change in fair value of earnout liability 2,496 4,891 (49)% 433 2,627 (84)% Change in fair value of warrant liabilities 7,391 48,712 (85)% 1,011 25,839 (96)% Total other income, net 12,085 54,068 (78)% 5,641 28,722 (80)% (Loss) income before income tax expense (21,502) 17,014 (226)% (70,578) (38,247) (85)% Income tax expense (37) (17) (118)% (42) (22) (91)% Net (loss) income (21,539) 16,997 (227)% (70,620) (38,269) (85)% Less: net (loss) income attributable to redeemable noncontrolling interest (14,513) 12,518 (216)% (50,518) (28,349) (78)% Net (loss) income attributable to Class A common stockholders $ (7,026) $ 4,479 (257)% $ (20,102) $ (9,920) (103)% Net (loss) income per share to Class A common stockholders, basic $ (0.08) $ 0.06 (233)% $ (0.25) $ (0.14) (79)% Net (loss) income per share to Class A common stockholders, diluted $ (0.08) $ 0.06 (233)% $ (0.25) $ (0.14) (79)% Weighted average common stock outstanding, basic 85,320 68,545 78,196 68,449 Weighted average common stock outstanding, diluted 85,320 69,322 78,196 68,449 Three Months Ended June 30, Six Months Ended 2023 2022 2023 2022 June 30, |
|
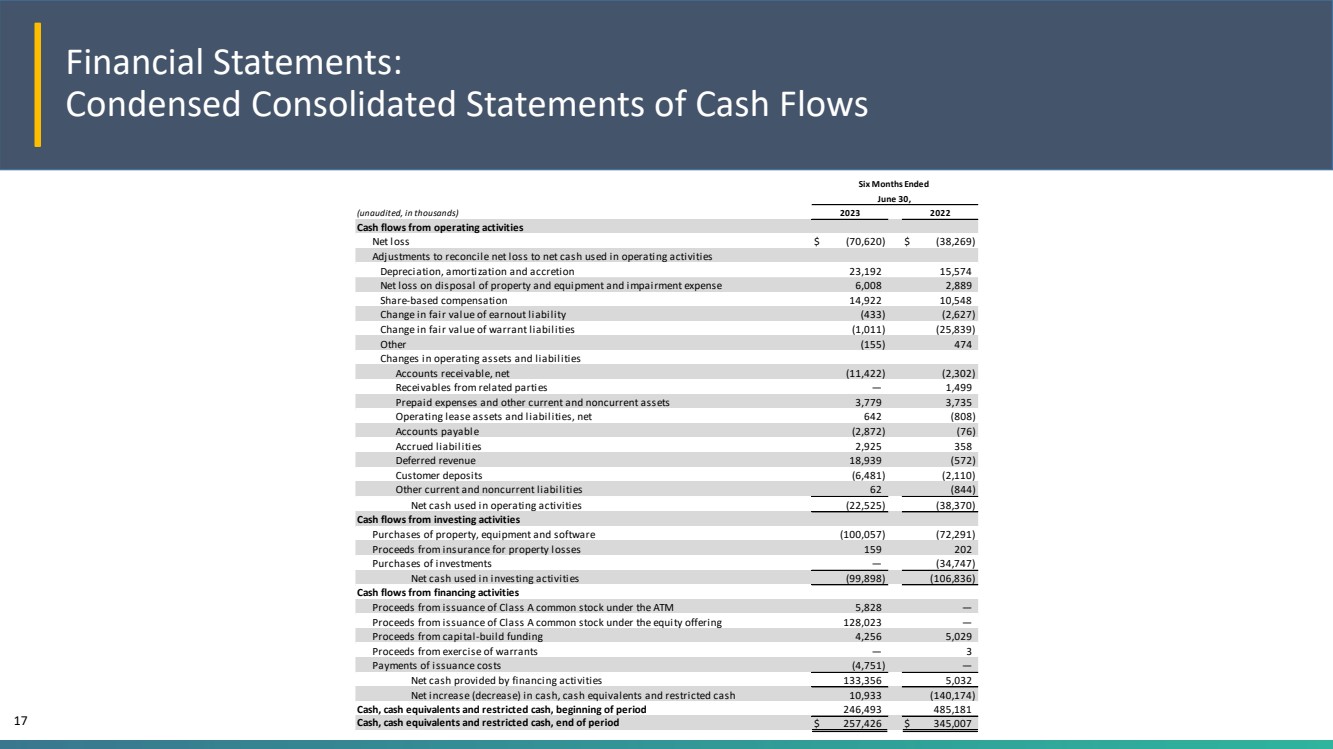
Financial Statements: Condensed Consolidated Statements of Cash Flows 17 (unaudited, in thousands) Cash flows from operating activities Net loss $ (70,620) $ (38,269) Adjustments to reconcile net loss to net cash used in operating activities Depreciation, amortization and accretion 23,192 15,574 Net loss on disposal of property and equipment and impairment expense 6,008 2,889 Share-based compensation 14,922 10,548 Change in fair value of earnout liability (433) (2,627) Change in fair value of warrant liabilities (1,011) (25,839) Other (155) 474 Changes in operating assets and liabilities Accounts receivable, net (11,422) (2,302) Receivables from related parties — 1,499 Prepaid expenses and other current and noncurrent assets 3,779 3,735 Operating lease assets and liabilities, net 642 (808) Accounts payable (2,872) (76) Accrued liabilities 2,925 358 Deferred revenue 18,939 (572) Customer deposits (6,481) (2,110) Other current and noncurrent liabilities 6 2 (844) Net cash used in operating activities (22,525) (38,370) Cash flows from investing activities Purchases of property, equipment and software (100,057) (72,291) Proceeds from insurance for property losses 159 202 Purchases of investments — (34,747) Net cash used in investing activities (99,898) (106,836) Cash flows from financing activities Proceeds from issuance of Class A common stock under the ATM 5,828 — Proceeds from issuance of Class A common stock under the equity offering 128,023 — Proceeds from capital-build funding 4,256 5,029 Proceeds from exercise of warrants — 3 Payments of issuance costs (4,751) — Net cash provided by financing activities 133,356 5,032 Net increase (decrease) in cash, cash equivalents and restricted cash 10,933 (140,174) Cash, cash equivalents and restricted cash, beginning of period 246,493 485,181 Cash, cash equivalents and restricted cash, end of period $ 257,426 $ 345,007 Six Months Ended June 30, 2023 2022 |
|
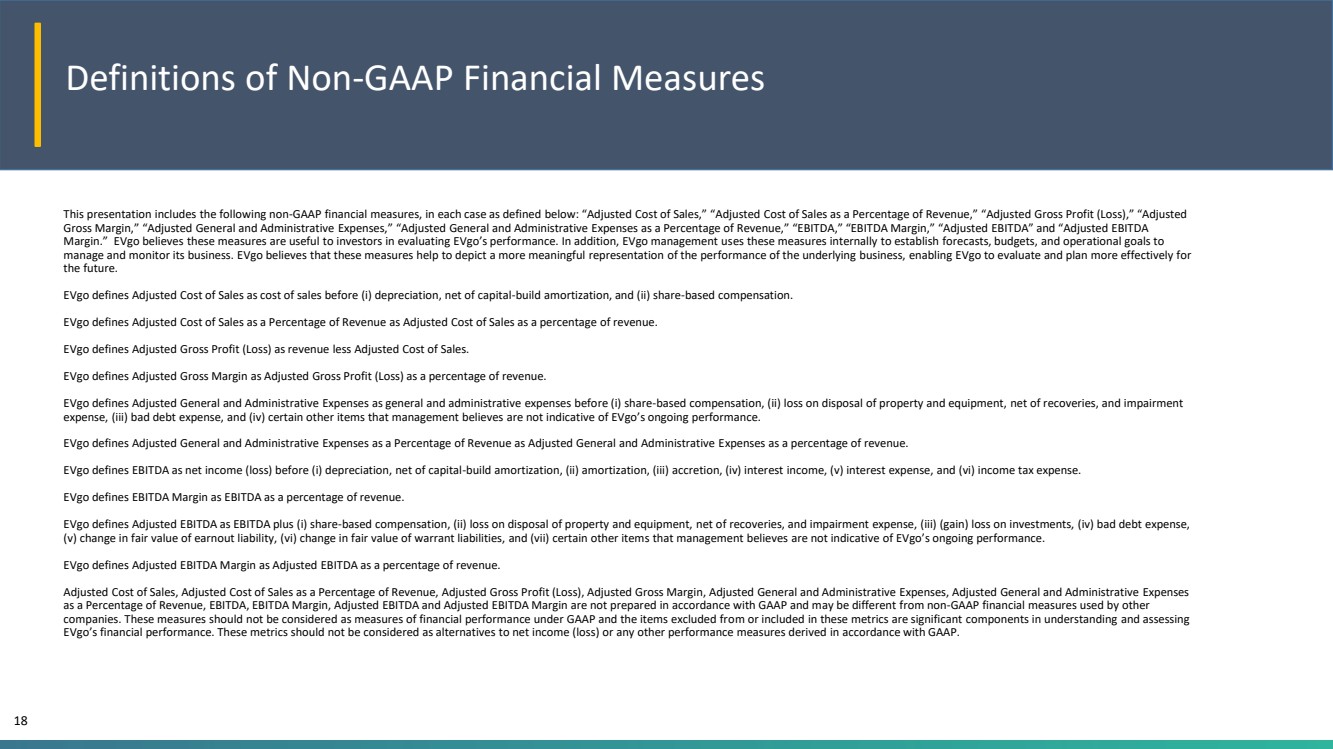
This presentation includes the following non-GAAP financial measures, in each case as defined below: “Adjusted Cost of Sales,” “Adjusted Cost of Sales as a Percentage of Revenue,” “Adjusted Gross Profit (Loss),” “Adjusted Gross Margin,” “Adjusted General and Administrative Expenses,” “Adjusted General and Administrative Expenses as a Percentage of Revenue,” “EBITDA,” “EBITDA Margin,” “Adjusted EBITDA” and “Adjusted EBITDA Margin.” EVgo believes these measures are useful to investors in evaluating EVgo’s performance. In addition, EVgo management uses these measures internally to establish forecasts, budgets, and operational goals to manage and monitor its business. EVgo believes that these measures help to depict a more meaningful representation of the performance of the underlying business, enabling EVgo to evaluate and plan more effectively for the future. EVgo defines Adjusted Cost of Sales as cost of sales before (i) depreciation, net of capital-build amortization, and (ii) share-based compensation. EVgo defines Adjusted Cost of Sales as a Percentage of Revenue as Adjusted Cost of Sales as a percentage of revenue. EVgo defines Adjusted Gross Profit (Loss) as revenue less Adjusted Cost of Sales. EVgo defines Adjusted Gross Margin as Adjusted Gross Profit (Loss) as a percentage of revenue. EVgo defines Adjusted General and Administrative Expenses as general and administrative expenses before (i) share-based compensation, (ii) loss on disposal of property and equipment, net of recoveries, and impairment expense, (iii) bad debt expense, and (iv) certain other items that management believes are not indicative of EVgo’s ongoing performance. EVgo defines Adjusted General and Administrative Expenses as a Percentage of Revenue as Adjusted General and Administrative Expenses as a percentage of revenue. EVgo defines EBITDA as net income (loss) before (i) depreciation, net of capital-build amortization, (ii) amortization, (iii) accretion, (iv) interest income, (v) interest expense, and (vi) income tax expense. EVgo defines EBITDA Margin as EBITDA as a percentage of revenue. EVgo defines Adjusted EBITDA as EBITDA plus (i) share-based compensation, (ii) loss on disposal of property and equipment, net of recoveries, and impairment expense, (iii) (gain) loss on investments, (iv) bad debt expense, (v) change in fair value of earnout liability, (vi) change in fair value of warrant liabilities, and (vii) certain other items that management believes are not indicative of EVgo’s ongoing performance. EVgo defines Adjusted EBITDA Margin as Adjusted EBITDA as a percentage of revenue. Adjusted Cost of Sales, Adjusted Cost of Sales as a Percentage of Revenue, Adjusted Gross Profit (Loss), Adjusted Gross Margin, Adjusted General and Administrative Expenses, Adjusted General and Administrative Expenses as a Percentage of Revenue, EBITDA, EBITDA Margin, Adjusted EBITDA and Adjusted EBITDA Margin are not prepared in accordance with GAAP and may be different from non-GAAP financial measures used by other companies. These measures should not be considered as measures of financial performance under GAAP and the items excluded from or included in these metrics are significant components in understanding and assessing EVgo’s financial performance. These metrics should not be considered as alternatives to net income (loss) or any other performance measures derived in accordance with GAAP. Definitions of Non-GAAP Financial Measures 18 |
|
Reconciliations of Non-GAAP Measures to GAAP 19 (unaudited, dollars in thousands) Change GAAP revenue $ 50,552 $ 9,076 457 % $ 75,852 $ 16,776 352 % GAAP net (loss) income $ (21,539) $ 16,997 (227)% $ (70,620) $ (38,269) (85)% GAAP net (loss) income margin (42.6%) 187.3% * bps (93.1%) (228.1%) * bps Adjustments: Depreciation, net of capital-build amortization 7,407 4,170 78 % 13,875 7,687 80 % Amortization 4,117 3,564 16 % 8,236 6,929 19 % Accretion 542 499 9 % 1,081 958 13 % Interest income (2,199) (636) (246)% (4,197) (691) (507)% Interest expense — 1 3 (100)% — 1 3 (100)% Income tax expense 3 7 1 7 118 % 4 2 2 2 91 % EBITDA (11,635) 24,624 (147)% (51,583) (23,351) (121)% EBITDA Margin (23.0%) 271.3% * bps (68.0%) (139.2%) 7,119 bps Adjustments: Share-based compensation 8,495 7,042 21 % 14,922 10,548 41 % Loss on disposal of property and equipment, net of recoveries, and impairment expense1 2,389 1,879 27 % 5,849 2,647 121 % Loss on investments 5 150 (97)% 4 405 (99)% Bad debt expense 5 6 3 5 60 % 153 151 1 % Change in fair value of earnout liability (2,496) (4,891) 49 % (433) (2,627) 84 % Change in fair value of warrant liabilities (7,391) (48,712) 85 % (1,011) (25,839) 96 % Other1,2 2 4 3 6 (33)% 1,479 5 3 * % Adjusted EBITDA $ (10,553) $ (19,837) 47 % $ (30,620) $ (38,013) 19 % Adjusted EBITDA Margin (20.9%) (218.6%) * bps (40.4%) (226.6%) * bps Q2'23 Q2'22 Change Q2'23 YTD Q2'22 YTD * Percentage greater than 999% or bps greater than 9,999 2 For the six months ended June 30, 2023, comprised primarily o f costsrelated t o the reorganization o f Company resources previously announced b y the Company o n February 23, 2023 and the petition filed b y EVgo i n the Delaware Court of Chancery in February 2023 seeking validation of EVgo's charter and share structure (the “205 Petition”), which are not expected to recur. 1 I n the second quarter o f 2023, the Company reclassified insurance proceedsfrom property lossesfrom "other" t o "loss o n disposal o f property and equipment, net o frecoveries, and impairment expense." Previously reported amounts have been updated to conform to the current period presentation. |
|
Reconciliations of Non-GAAP Measures to GAAP 20 (unaudited, dollars in thousands) Change Change GAAP revenue $ 50,552 $ 9,076 457 % $ 75,852 $ 16,776 352 % GAAP cost of sales 45,023 9,820 358 % 70,282 18,120 288 % GAAP gross profit (loss) $ 5,529 $ (744) 843 % $ 5,570 $ (1,344) 514 % GAAP cost of sales as a percentage of revenue 89.1% 108.2% (1,910) bps 92.7% 108.0% (1,530) bps GAAP gross margin 10.9% (8.2%) 1,910 bps 7.3% (8.0%) 1,530 bps Depreciation, net of capital-build amortization $ 7,283 $ 4,101 78 % $ 13,625 $ 7,555 80 % Share-based compensation 4 1 2 6 58 % 6 3 3 7 70 % Total adjustments 7,324 4,127 77 % 13,688 7,592 80 % Adjusted Cost of Sales $ 37,699 $ 5,693 562 % $ 56,594 $ 10,528 438 % Adjusted Cost of Sales as a Percentage of Revenue 74.6% 62.7% 1,190 bps 74.6% 62.8% 1,180 bps Adjusted Gross Profit $ 12,853 $ 3,383 280 % $ 19,258 $ 6,248 208 % Adjusted Gross Margin 25.4% 37.3% (1,190) bps 25.4% 37.2% (1,180) bps Adjustments: Q2'23 Q2'22 Q2'23 YTD Q2'22 YTD |
|
Reconciliations of Non-GAAP Measures to GAAP 21 (unaudited, dollars in thousands) Change GAAP revenue $ 50,552 $ 9,076 457 % $ 75,852 $ 16,776 352 % GAAP general and administrative expenses $ 34,333 $ 32,178 7 % $ 72,222 $ 57,606 25 % GAAP general and administrative expenses as a percentage of revenue 67.9% 354.5% * bps 95.2% 343.4% * bps Adjustments: Share-based compensation $ 8,454 $ 7,016 20 % $ 14,859 $ 10,511 41 % Loss on disposal of property and equipment, net of recoveries, and impairment expense1 2,389 1,879 27 % 5,849 2,647 121 % Bad debt expense 5 6 3 5 60 % 153 151 1 % Other1,2 2 4 3 6 (33)% 1,479 5 3 * % Total adjustments 10,923 8,966 22 % 22,340 13,362 67 % Adjusted General and Administrative Expenses $ 23,410 $ 23,212 1 % $ 49,882 $ 44,244 13 % Adjusted General and Administrative Expenses as a Percentage of Revenue 46.3% 255.8% * bps 65.8% 263.7% * bps 2 For the six months ended June 30, 2023, comprised primarily o f costsrelated t o the reorganization o f Company resources previously announced b y the Company o n February 23, 2023 and the petition filed b y EVgo i n the Delaware Court of Chancery in February 2023 seeking validation of EVgo's charter and share structure (the “205 Petition”), which are not expected to recur. * Percentage greater than 999% or bps greater than 9,999 1 I n the second quarter o f 2023, the Company reclassified insurance proceedsfrom property lossesfrom "other" t o "loss o n disposal o f property and equipment, net o frecoveries, and impairment expense." Previously reported amounts have been updated to conform to the current period presentation. Q2'23 Q2'22 Change Q2'23 YTD Q2'22 YTD |