
2023 Third Quarter Results Earnings Presentation
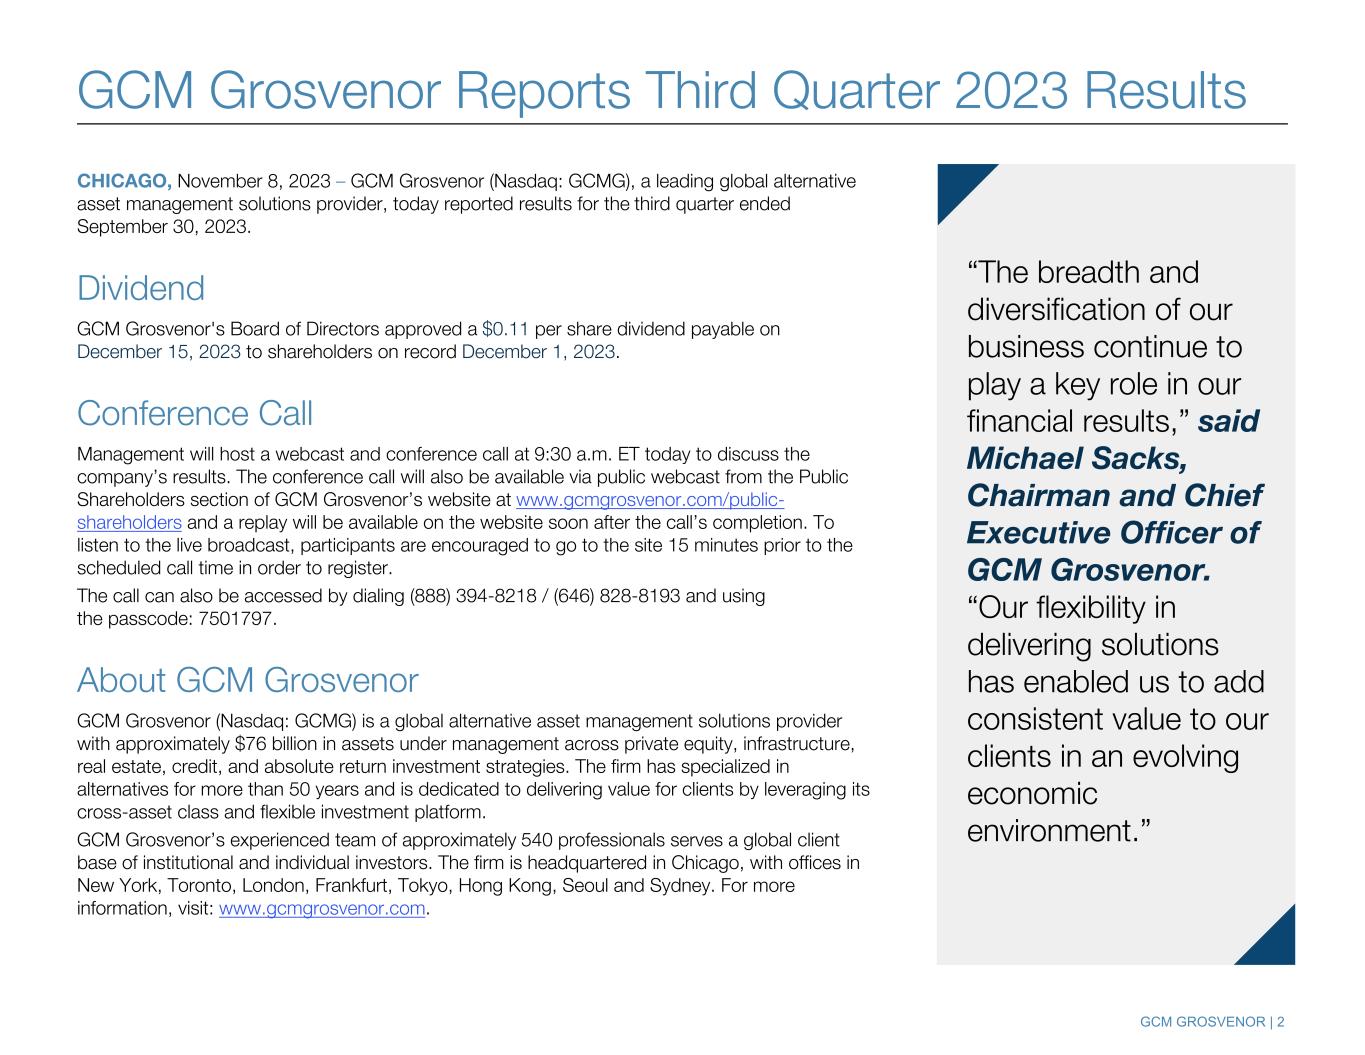
GCM GROSVENOR | 2 GCM Grosvenor Reports Third Quarter 2023 Results CHICAGO, November 8, 2023 – GCM Grosvenor (Nasdaq: GCMG), a leading global alternative asset management solutions provider, today reported results for the third quarter ended September 30, 2023. Dividend GCM Grosvenor's Board of Directors approved a $0.11 per share dividend payable on December 15, 2023 to shareholders on record December 1, 2023. Conference Call Management will host a webcast and conference call at 9:30 a.m. ET today to discuss the company’s results. The conference call will also be available via public webcast from the Public Shareholders section of GCM Grosvenor’s website at www.gcmgrosvenor.com/public- shareholders and a replay will be available on the website soon after the call’s completion. To listen to the live broadcast, participants are encouraged to go to the site 15 minutes prior to the scheduled call time in order to register. The call can also be accessed by dialing (888) 394-8218 / (646) 828-8193 and using the passcode: 7501797. About GCM Grosvenor GCM Grosvenor (Nasdaq: GCMG) is a global alternative asset management solutions provider with approximately $76 billion in assets under management across private equity, infrastructure, real estate, credit, and absolute return investment strategies. The firm has specialized in alternatives for more than 50 years and is dedicated to delivering value for clients by leveraging its cross-asset class and flexible investment platform. GCM Grosvenor’s experienced team of approximately 540 professionals serves a global client base of institutional and individual investors. The firm is headquartered in Chicago, with offices in New York, Toronto, London, Frankfurt, Tokyo, Hong Kong, Seoul and Sydney. For more information, visit: www.gcmgrosvenor.com. “The breadth and diversification of our business continue to play a key role in our financial results,” said Michael Sacks, Chairman and Chief Executive Officer of GCM Grosvenor. “Our flexibility in delivering solutions has enabled us to add consistent value to our clients in an evolving economic environment.”
GCM GROSVENOR | 3 THIS PRESENTATION CONTAINS CERTAIN FORWARD- LOOKING STATEMENTS within the meaning of the Private Securities Litigation Reform Act of 1995, including statements regarding the expected future performance of GCM Grosvenor’s business. These forward-looking statements generally are identified by the words “believe,” “project,” “expect,” “anticipate,” “estimate,” “intend,” “strategy,” “future,” “opportunity,” “plan,” “may,” “should,” “will,” “would” and similar expressions. Forward-looking statements are predictions, projections and other statements about future events that are based on current expectations and assumptions and, as a result, are subject to risks and uncertainties. Many factors could cause actual future events to differ materially from the forward- looking statements in this presentation, including without limitation, the historical performance of GCM Grosvenor's funds may not be indicative of GCM Grosvenor's future results; risks related to redemptions and termination of engagements; effect of the COVID-19 pandemic on GCM Grosvenor's business; the variable nature of GCM Grosvenor's revenues; competition in GCM Grosvenor's industry; effects of government regulation or compliance failures; market, geopolitical and economic conditions; identification and availability of suitable investment opportunities; risks relating to our internal control over financial reporting; and risks related to the performance of GCM Grosvenor's investments. You should carefully consider the foregoing factors and the other risks and uncertainties described in the “Risk Factors” sections of the Annual Report on Form 10-K filed by GCM Grosvenor Inc. on February 23, 2023 and its other filings with the U.S. Securities and Exchange Commission. These filings identify and address other important risks and uncertainties that could cause actual events and results to differ materially from those contained in the forward- looking statements. Forward-looking statements speak only as of the date they are made. Readers are cautioned not to put undue reliance on forward-looking statements, and GCM Grosvenor assumes no obligation and does not intend to update or revise these forward-looking statements, whether as a result of new information, future events, or otherwise, except as required by law. Forward Looking Statements Media Contacts Tom Johnson and Abigail Ruck H/Advisors Abernathy tom.johnson@h-advisors.global/ abigail.ruck@h-advisors.global 212-371-5999 Public Shareholders Contact Stacie Selinger Head of Investor Relations sselinger@gcmlp.com 312-506-6583
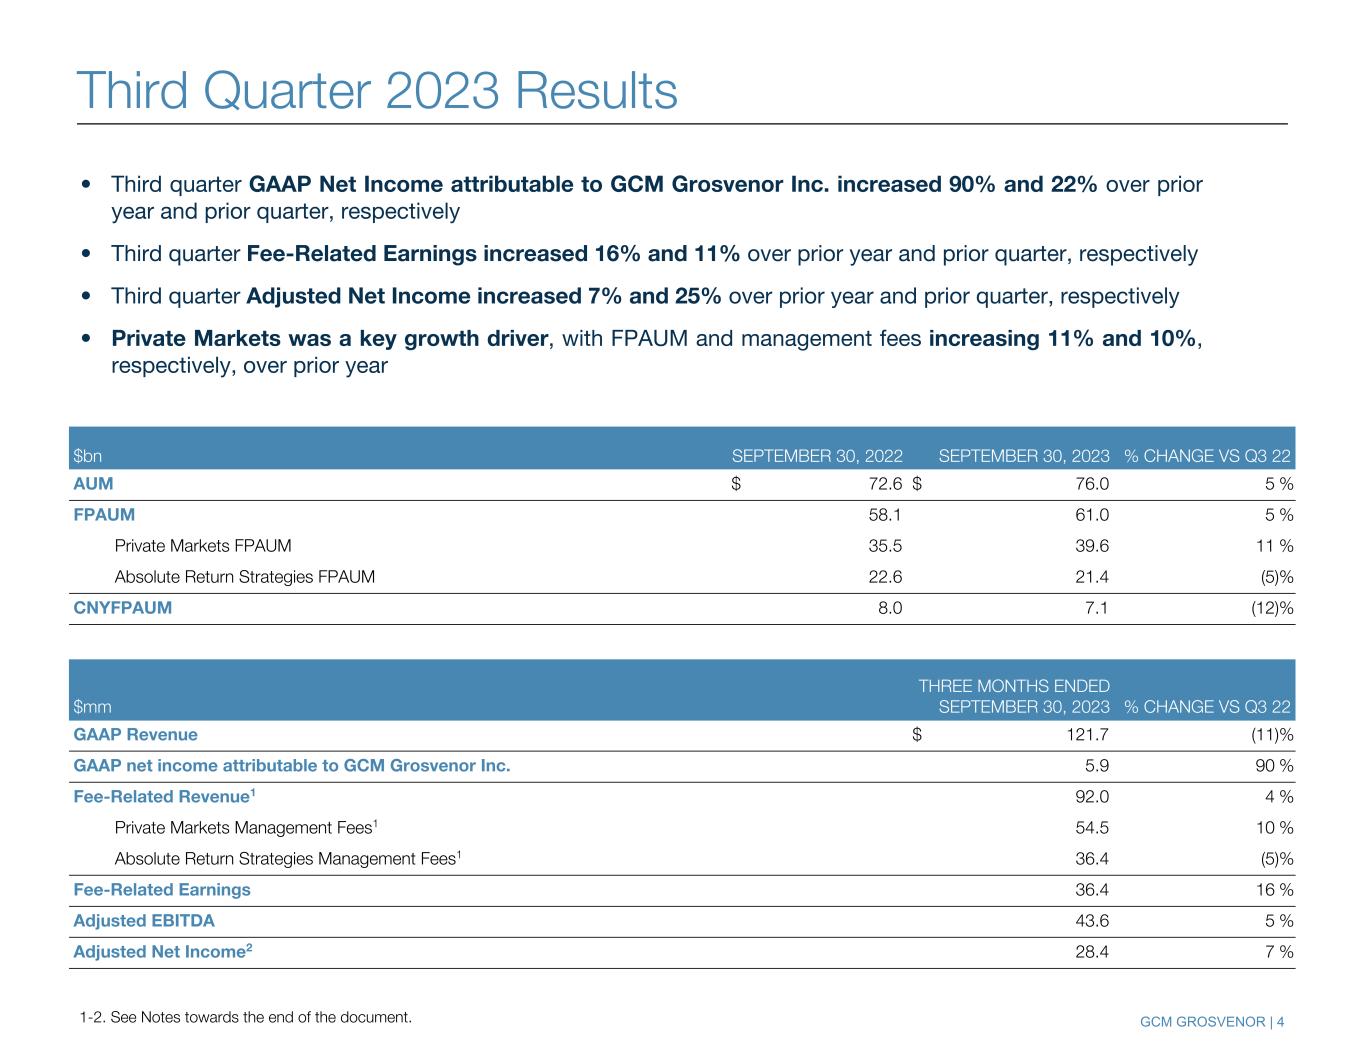
GCM GROSVENOR | 4 Third Quarter 2023 Results $bn SEPTEMBER 30, 2022 SEPTEMBER 30, 2023 % CHANGE VS Q3 22 AUM $ 72.6 $ 76.0 5 % FPAUM 58.1 61.0 5 % Private Markets FPAUM 35.5 39.6 11 % Absolute Return Strategies FPAUM 22.6 21.4 (5) % CNYFPAUM 8.0 7.1 (12) % $mm THREE MONTHS ENDED SEPTEMBER 30, 2023 % CHANGE VS Q3 22 GAAP Revenue $ 121.7 (11) % GAAP net income attributable to GCM Grosvenor Inc. 5.9 90 % Fee-Related Revenue1 92.0 4 % Private Markets Management Fees1 54.5 10 % Absolute Return Strategies Management Fees1 36.4 (5) % Fee-Related Earnings 36.4 16 % Adjusted EBITDA 43.6 5 % Adjusted Net Income2 28.4 7 % • Third quarter GAAP Net Income attributable to GCM Grosvenor Inc. increased 90% and 22% over prior year and prior quarter, respectively • Third quarter Fee-Related Earnings increased 16% and 11% over prior year and prior quarter, respectively • Third quarter Adjusted Net Income increased 7% and 25% over prior year and prior quarter, respectively • Private Markets was a key growth driver, with FPAUM and management fees increasing 11% and 10%, respectively, over prior year 1-2. See Notes towards the end of the document. Third Quarter 2023 Results

GCM GROSVENOR | 5 52 Years of Alternative Asset Management Investing Real Estate $5.8bn Absolute Return $22.4bn Private Equity $29.4bn ESG / Impact $25.3bn Alternative Credit $12.5bn Infrastructure $13.3bn 3-4. See Notes towards the end of the document. $76bn AUM4 1971 73% 538 179 First year in business of AUM in customized separate accounts Employees3 Investment professionals SEEDING/ STAKES DIRECT PRIMARY SECONDARY CO-INVEST

GCM GROSVENOR | 6 Growth in Key Business Drivers Since Going Public December 31, 2020 September 30, 2023 Growing Earnings Power $62bn $76bn AUM Private Markets Growing as a Percentage 54% 65% Private Markets % of FPAUM Shifting Towards Direct- Oriented Strategies 39% 49% Direct-Oriented Strategies % of Private Markets AUM Operating Leverage in Business 31% 37% LTM FRE Margin Carried Interest Earnings Potential Increasing $133mm $365mm Firm Share of Carried Interest Balance

GCM GROSVENOR | 7 The Majority of Investors Plan to Maintain or Increase Target Allocation to Alternative Investments Over the Longer Term Investors Continue to Grow Their Alternative Allocations Source: Preqin Investor Outlook: Alternative Assets, H2 2023. 93% 76% 93% 84% 94% Private Equity Hedge Funds Infrastructure Real Estate Private Debt $10.1 $16.3 $24.5 2019 2023F 2028F Alternative Investments AUM ($T) +10% CAGR Source: Preqin, Future of Alternatives 2028.

GCM GROSVENOR | 8 Growing and Diversifying AUM and Earnings Power $61.9 $72.1 $73.7 $76.0 $4.7 $6.2 $5.1 $5.1 $25.2 $26.6 $22.9 $22.4 $3.2 $4.0 $5.5 $5.8 $6.0 $9.1 $11.1 $13.3 $22.8 $26.2 $29.1 $29.4 Private Equity Infrastructure Real Estate Absolute Return Strategies Other Q4 2020 Q4 2021 Q4 2022 Q3 2023 10% Private Equity CAGR (4)% Absolute Return Strategies CAGR 33% Infrastructure CAGR 24% Real Estate CAGR AUM by Strategy (bn) 5. Other includes alternative credit and opportunistic strategies. 8% CAGR 15% Private Markets CAGR 5
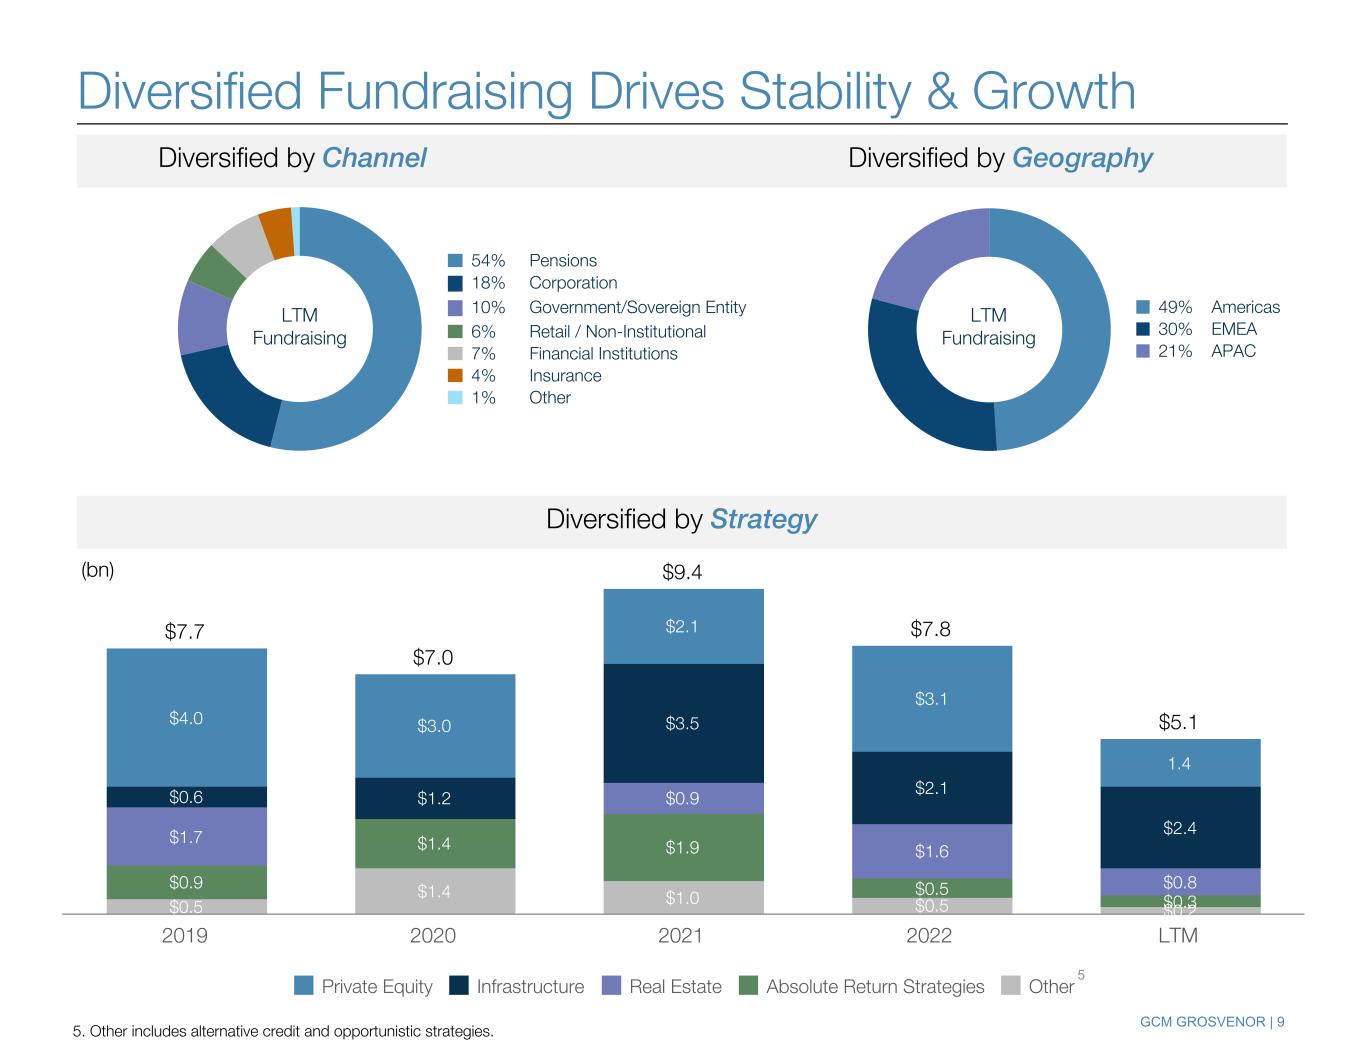
GCM GROSVENOR | 9 Diversified Fundraising Drives Stability & Growth $7.7 $7.0 $9.4 $7.8 $5.1 $0.5 $1.4 $1.0 $0.5 $0.2 $0.9 $1.4 $1.9 $0.5 $0.3 $1.7 $0.9 $1.6 $0.8 $0.6 $1.2 $3.5 $2.1 $2.4 $4.0 $3.0 $2.1 $3.1 1.4 Private Equity Infrastructure Real Estate Absolute Return Strategies Other 2019 2020 2021 2022 LTM 5. Other includes alternative credit and opportunistic strategies. 54% Pensions 18% Corporation 10% Government/Sovereign Entity 6% Retail / Non-Institutional 7% Financial Institutions 4% Insurance 1% Other 49% Americas 30% EMEA 21% APAC LTM Fundraising LTM Fundraising 5 Diversified by Strategy Diversified by Channel Diversified by Geography (bn)
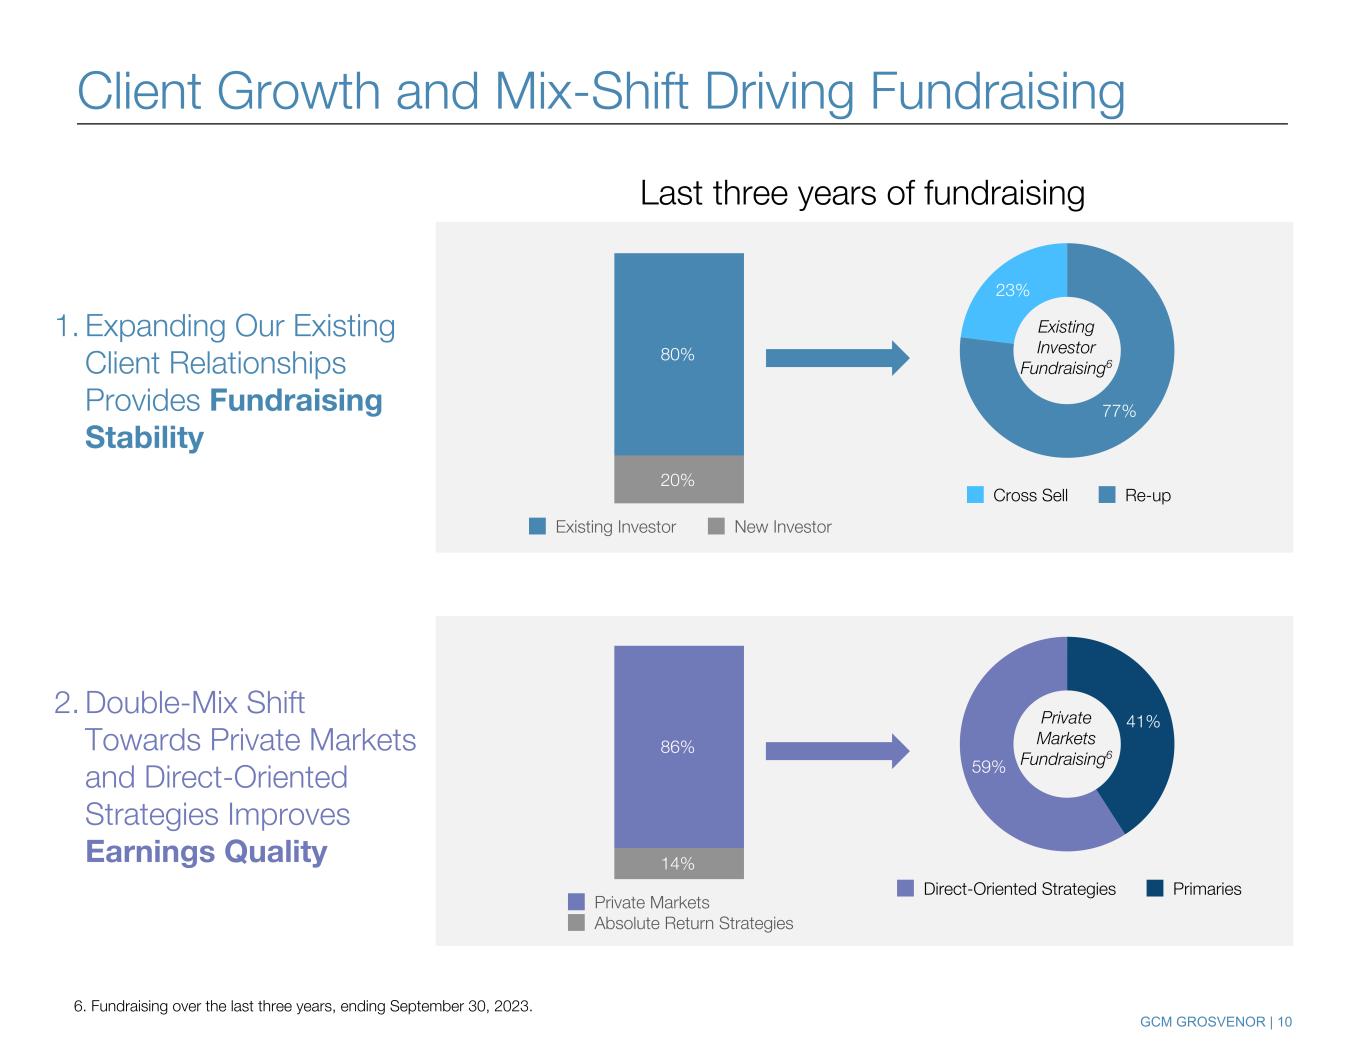
GCM GROSVENOR | 10 2. Double-Mix Shift Towards Private Markets and Direct-Oriented Strategies Improves Earnings Quality Client Growth and Mix-Shift Driving Fundraising 1. Expanding Our Existing Client Relationships Provides Fundraising Stability 6. Fundraising over the last three years, ending September 30, 2023. 77% 23% Cross Sell Re-up 20% 80% Existing Investor New Investor Last three years of fundraising Existing Investor Fundraising6 14% 86% Private Markets Absolute Return Strategies 41% 59% Direct-Oriented Strategies Primaries Private Markets Fundraising6
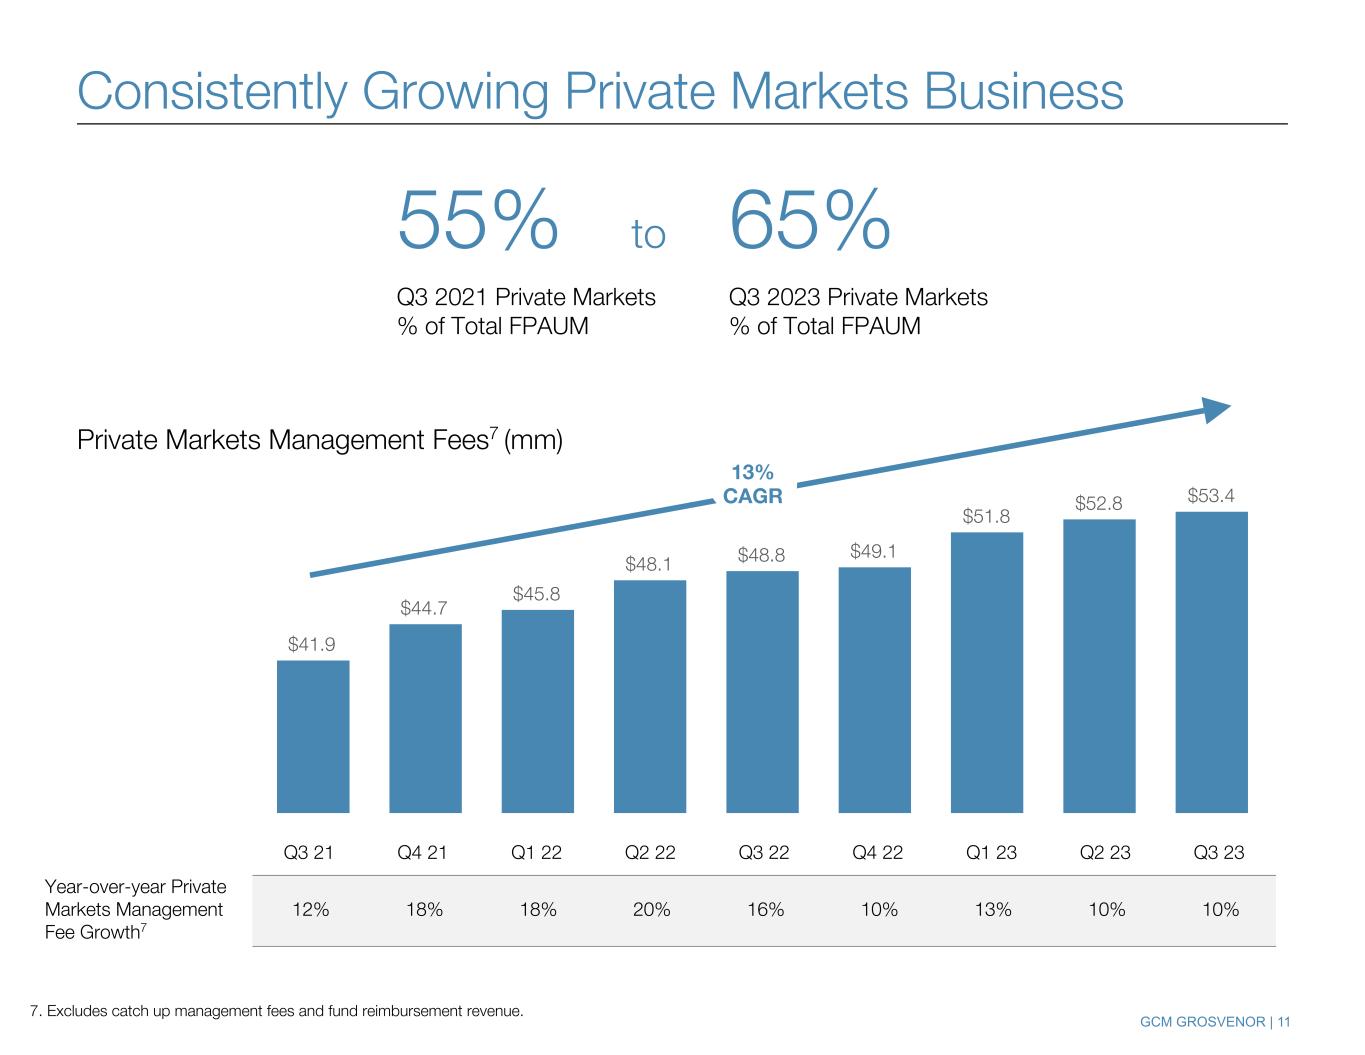
GCM GROSVENOR | 11 $41.9 $44.7 $45.8 $48.1 $48.8 $49.1 $51.8 $52.8 $53.4 7. Excludes catch up management fees and fund reimbursement revenue. Q3 21 Q4 21 Q1 22 Q2 22 Q3 22 Q4 22 Q1 23 Q2 23 Q3 23 Year-over-year Private Markets Management Fee Growth7 12% 18% 18% 20% 16% 10% 13% 10% 10% 13% CAGR Consistently Growing Private Markets Business Private Markets Management Fees7 (mm) 55% to Q3 2021 Private Markets % of Total FPAUM 65% Q3 2023 Private Markets % of Total FPAUM
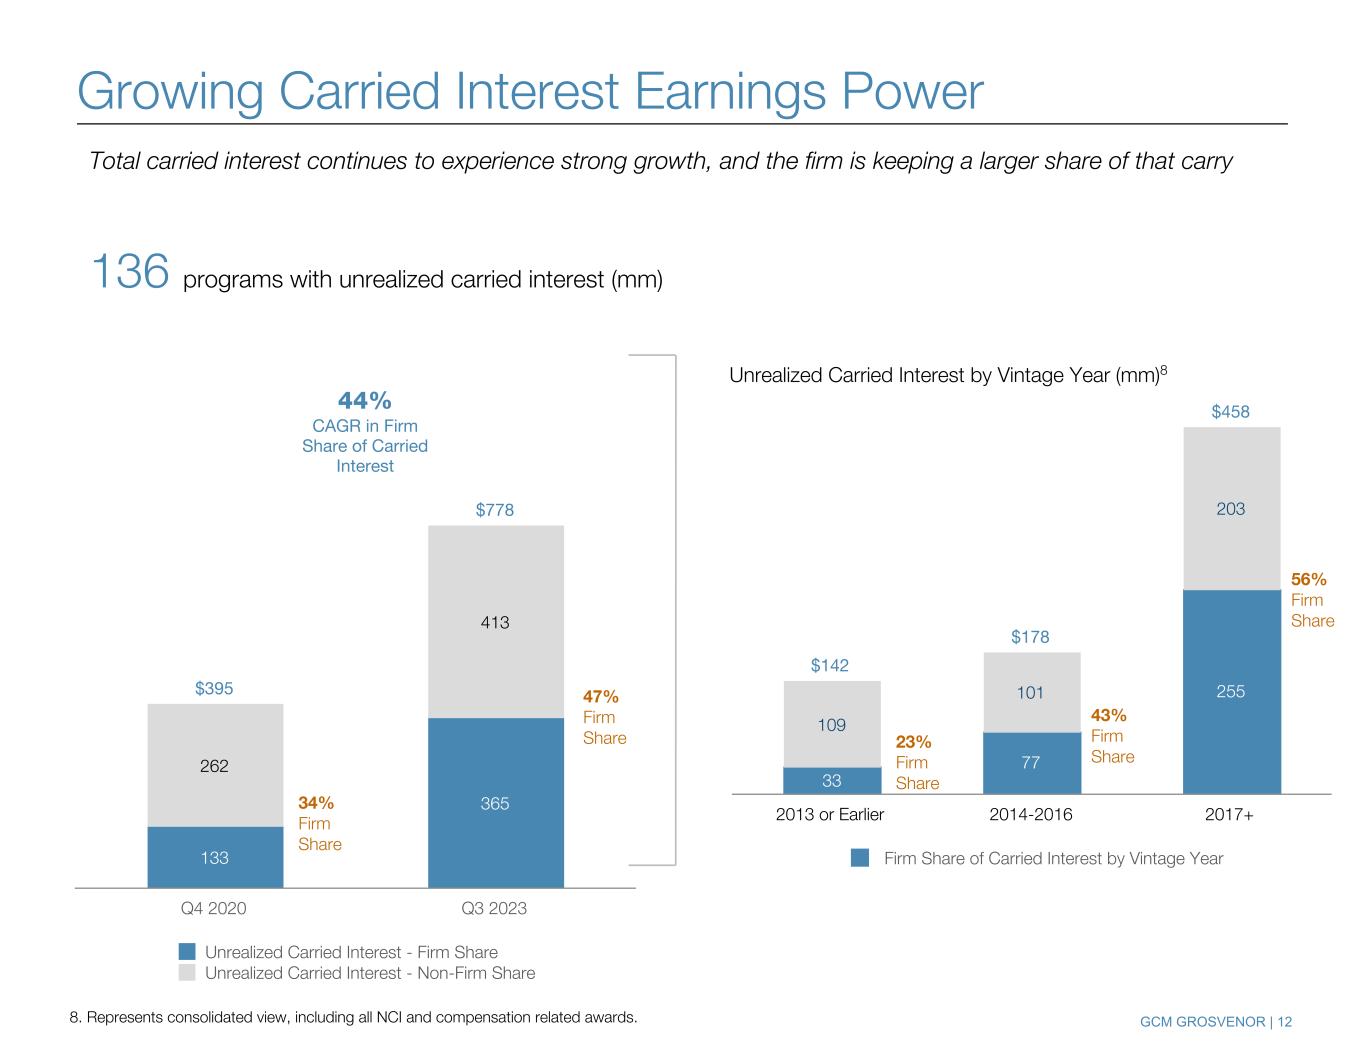
GCM GROSVENOR | 12 $395 $778 133 365 262 413 Unrealized Carried Interest - Firm Share Unrealized Carried Interest - Non-Firm Share Q4 2020 Q3 2023 $142 $178 $458 33 77 255 109 101 203 Firm Share of Carried Interest by Vintage Year 2013 or Earlier 2014-2016 2017+ Unrealized Carried Interest by Vintage Year (mm)8 8. Represents consolidated view, including all NCI and compensation related awards. 136 programs with unrealized carried interest (mm) $ million 47% Firm Share 34% Firm Share 43% Firm Share 56% Firm Share 23% Firm Share 44% CAGR in Firm Share of Carried Interest Gr wing Carried Interest Earnings Power Total carried interest continues to experience strong growth, and the firm is keeping a larger share of that carry

GCM GROSVENOR | 13 $24mm Run-Rate Annual Performance Fees9 Significant Value From Absolute Return Strategies Significant Revenue Generation Broad Strategic Benefits Sourcing and Data Engine 1750+ Managers Tracked11 140+ Managers Invested12 Investment Sourcing Also Empowers $5bn+ Strategic Investments Group AUM Loyal Client Base With Private Markets Cross Sell Opportunities 13 yrs Average Tenure of Top 25 ARS Clients 30% Of Top Clients Invested in Absolute Return Strategies and Private Markets10 $148mm LTM Absolute Return Strategies Management Fees 9-12. See Notes towards the end of the document.
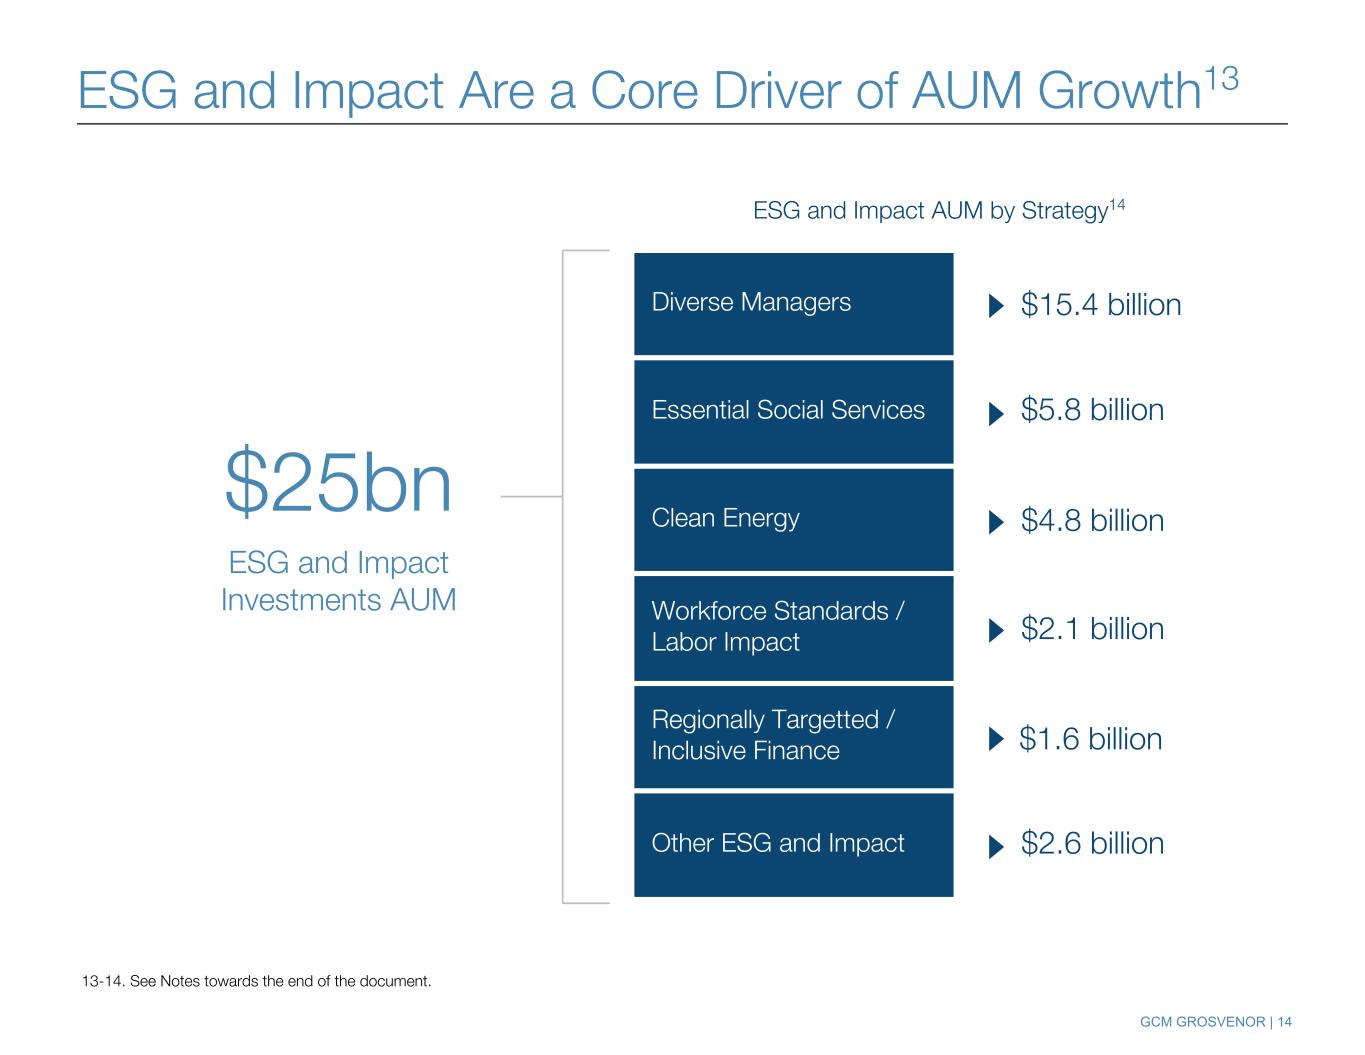
GCM GROSVENOR | 14 Diverse Managers Essential Social Services Clean Energy Workforce Standards / Labor Impact Regionally Targetted / Inclusive Finance Other ESG and Impact $15.4 billion $1.6 billion $4.8 billion $2.1 billion $2.6 billion ESG and Impact AUM by Strategy14 $5.8 billion ESG and Impact Are a Core Driver of AUM Growth13 13-14. See Notes towards the end of the document. $25bn ESG and Impact Investments AUM
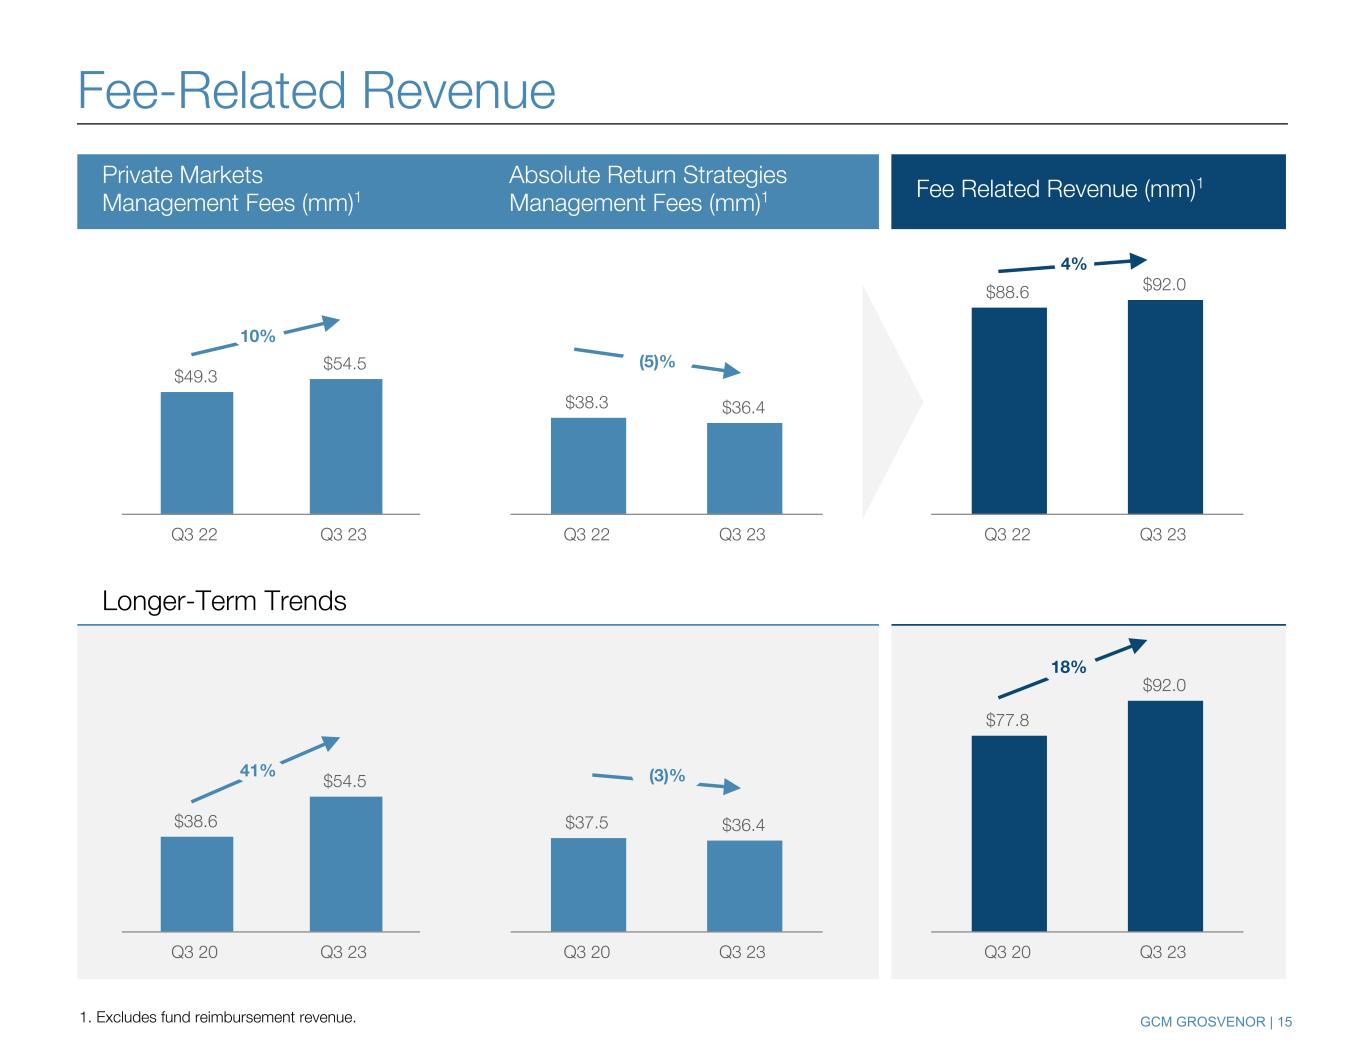
GCM GROSVENOR | 15 $37.5 $36.4 Q3 20 Q3 23 $77.8 $92.0 Q3 20 Q3 23 4% $88.6 $92.0 Q3 22 Q3 23 18% $38.6 $54.5 Q3 20 Q3 23 $38.3 $36.4 Q3 22 Q3 23 $49.3 $54.5 Q3 22 Q3 23 (5)% 10% 1. Excludes fund reimbursement revenue. Fee-Related Revenue Private Markets Management Fees (mm)1 Absolute Return Strategies Management Fees (mm)1 Fee Related Revenue (mm)1 Longer-Term Trends (3)%41%

GCM GROSVENOR | 16 Adjusted Earnings Fee-Related Earnings (mm) Adjusted EBITDA (mm) Adjusted Net Income (mm) Longer-Term Trends $20.5 $28.4 20.5 28.4 Q3 20 Q3 23 $25.6 $36.4 Q3 20 Q3 23 $33.6 $43.6 Q3 20 Q3 23 30% 39% 42% $26.6 $28.4 26.6 28.4 Q3 22 Q3 23 $31.4 $36.4 Q3 22 Q3 23 $41.4 $43.6 Q3 22 Q3 23 5% 7%16%
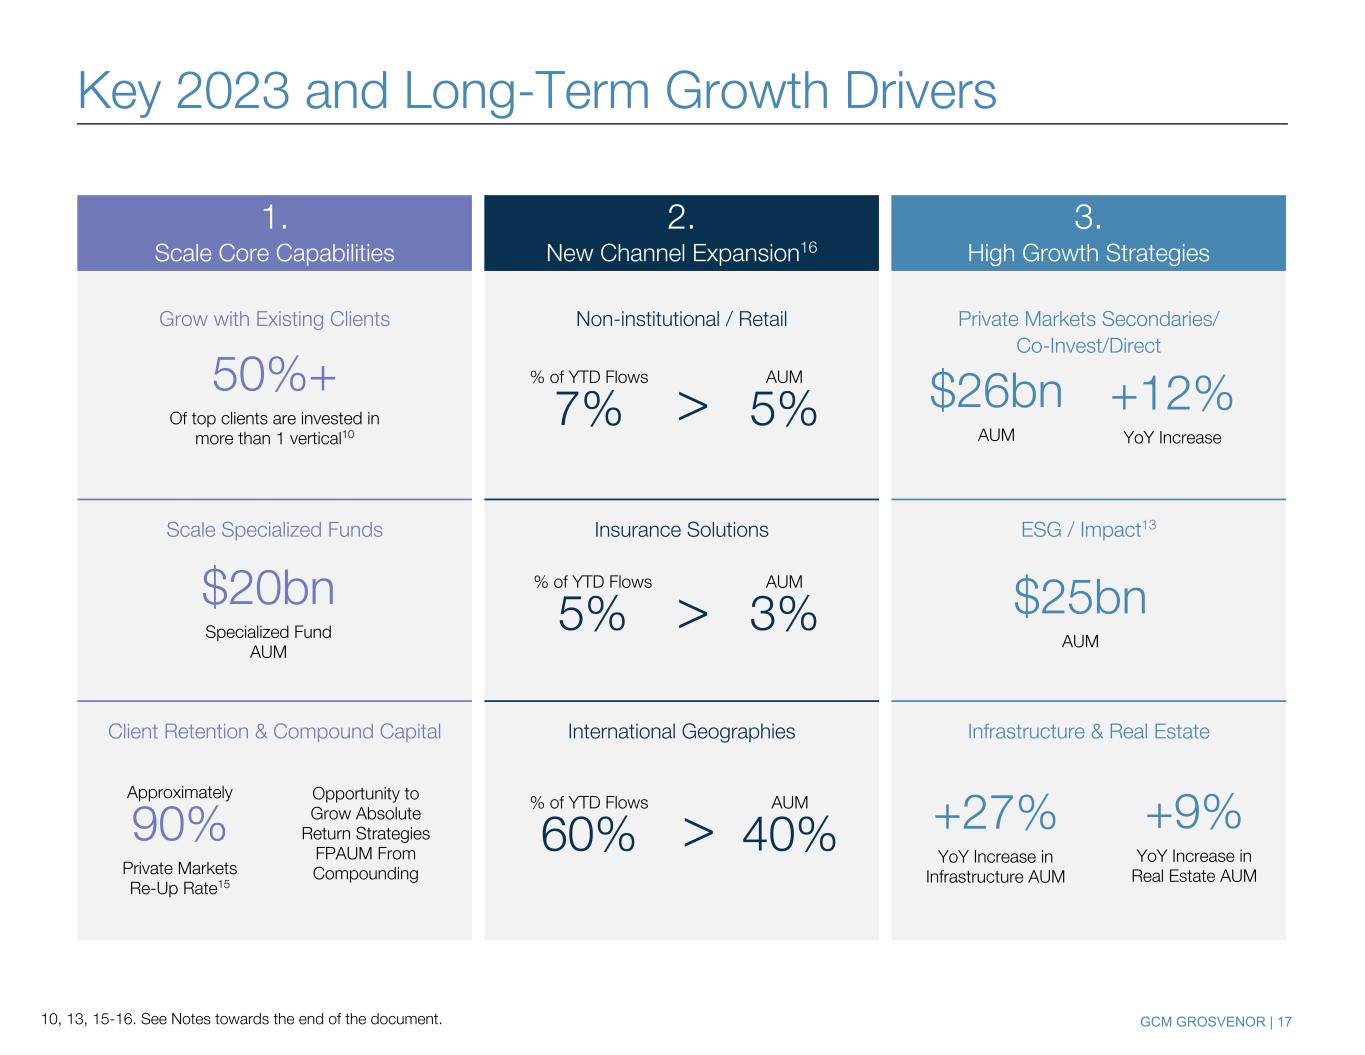
GCM GROSVENOR | 17 Key 2023 and Long-Term Growth Drivers 10, 13, 15-16. See Notes towards the end of the document. Non-institutional / Retail Private Markets Secondaries/ Co-Invest/Direct Grow with Existing Clients 1. Scale Core Capabilities % of YTD Flows 7% AUM 5% % of YTD Flows 5% AUM 3% % of YTD Flows 60% $20bn Specialized Fund AUM >50%+ Of top clients are invested in more than 1 vertical10 +12% YoY Increase $26bn AUM Approximately 90% Private Markets Re-Up Rate15 Opportunity to Grow Absolute Return Strategies FPAUM From Compounding $25bn AUM +27% YoY Increase in Infrastructure AUM +9% YoY Increase in Real Estate AUM Key 2023 and Long-Term Growth Drivers 2. New Channel Expansion16 3. High Growth Strategies Insurance Solutions ESG / Impact13Scale Specialized Funds > International Geographies Infrastructure & Real EstateClient Retention & Compound Capital AUM 40%>

GCM GROSVENOR | 18 Supplemental Information
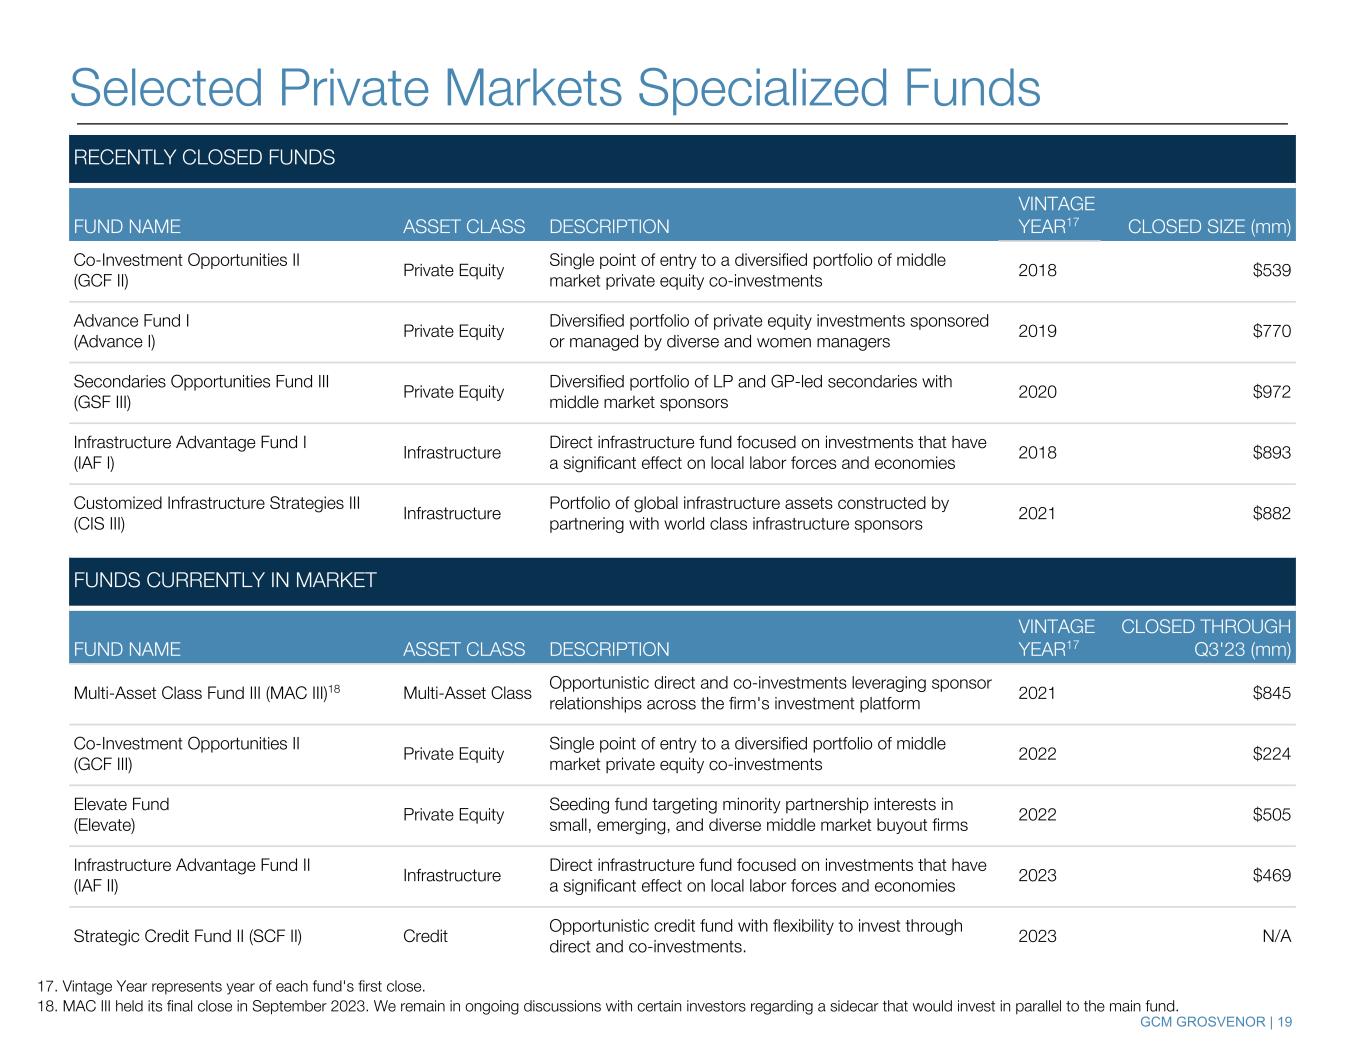
GCM GROSVENOR | 19 Selected Private Markets Specialized Funds RECENTLY CLOSED FUNDS FUND NAME ASSET CLASS DESCRIPTION VINTAGE YEAR17 CLOSED SIZE (mm) Co-Investment Opportunities II (GCF II) Private Equity Single point of entry to a diversified portfolio of middle market private equity co-investments 2018 $539 Advance Fund I (Advance I) Private Equity Diversified portfolio of private equity investments sponsored or managed by diverse and women managers 2019 $770 Secondaries Opportunities Fund III (GSF III) Private Equity Diversified portfolio of LP and GP-led secondaries with middle market sponsors 2020 $972 Infrastructure Advantage Fund I (IAF I) Infrastructure Direct infrastructure fund focused on investments that have a significant effect on local labor forces and economies 2018 $893 Customized Infrastructure Strategies III (CIS III) Infrastructure Portfolio of global infrastructure assets constructed by partnering with world class infrastructure sponsors 2021 $882 FUNDS CURRENTLY IN MARKET FUND NAME ASSET CLASS DESCRIPTION VINTAGE YEAR17 CLOSED THROUGH Q3'23 (mm) Multi-Asset Class Fund III (MAC III)18 Multi-Asset Class Opportunistic direct and co-investments leveraging sponsor relationships across the firm's investment platform 2021 $845 Co-Investment Opportunities II (GCF III) Private Equity Single point of entry to a diversified portfolio of middle market private equity co-investments 2022 $224 Elevate Fund (Elevate) Private Equity Seeding fund targeting minority partnership interests in small, emerging, and diverse middle market buyout firms 2022 $505 Infrastructure Advantage Fund II (IAF II) Infrastructure Direct infrastructure fund focused on investments that have a significant effect on local labor forces and economies 2023 $469 Strategic Credit Fund II (SCF II) Credit Opportunistic credit fund with flexibility to invest through direct and co-investments. 2023 N/A 17. Vintage Year represents year of each fund's first close. 18. MAC III held its final close in September 2023. We remain in ongoing discussions with certain investors regarding a sidecar that would invest in parallel to the main fund.
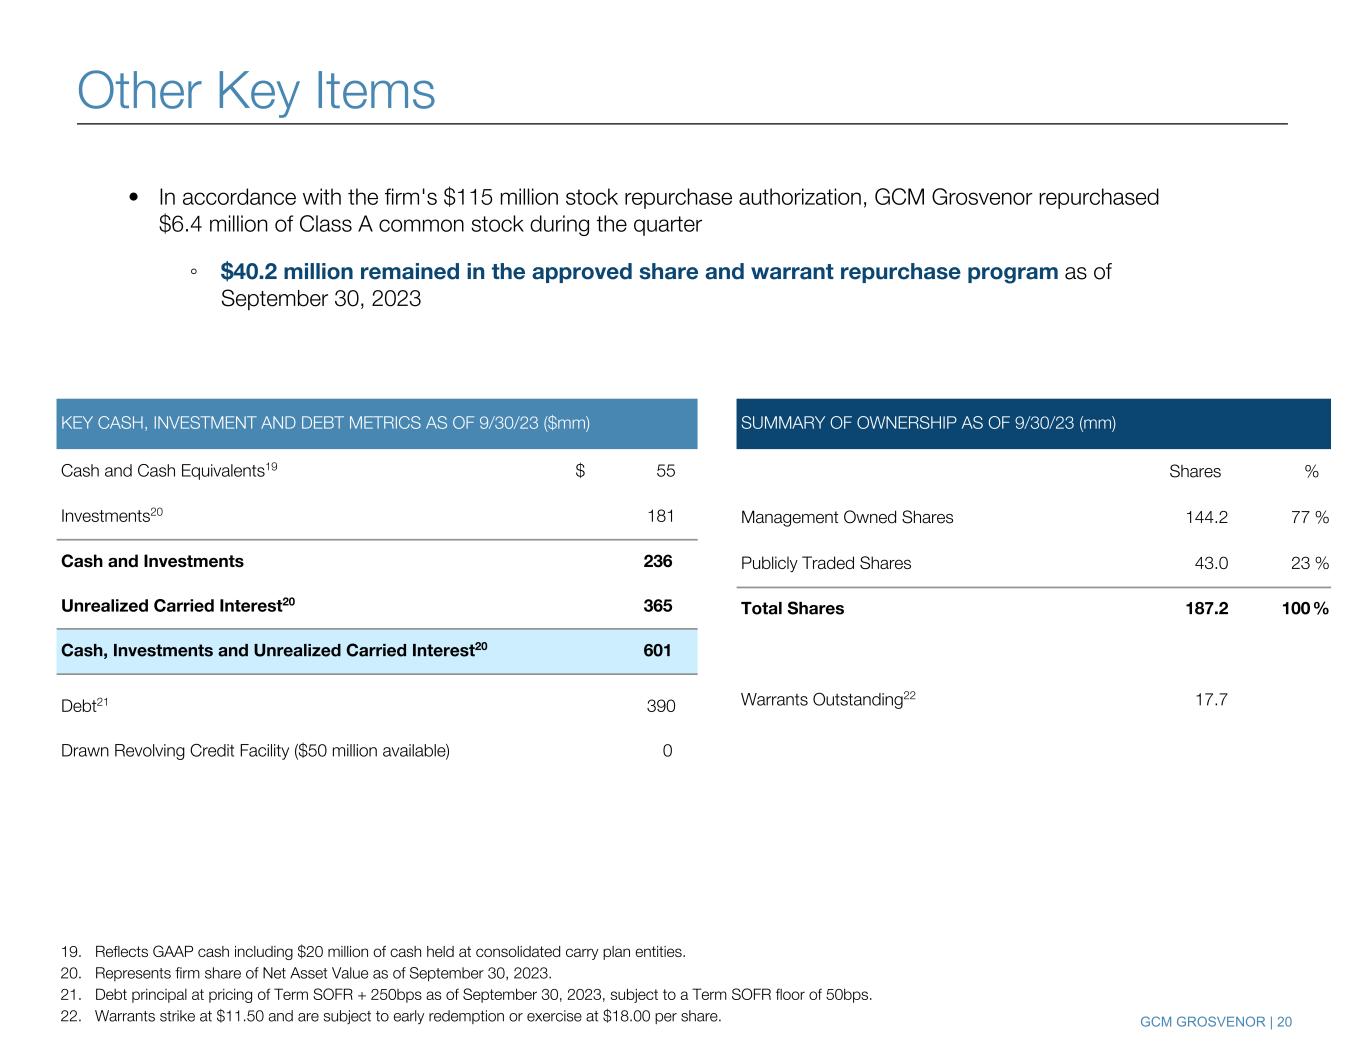
GCM GROSVENOR | 20 19. Reflects GAAP cash including $20 million of cash held at consolidated carry plan entities. 20. Represents firm share of Net Asset Value as of September 30, 2023. 21. Debt principal at pricing of Term SOFR + 250bps as of September 30, 2023, subject to a Term SOFR floor of 50bps. 22. Warrants strike at $11.50 and are subject to early redemption or exercise at $18.00 per share. • In accordance with the firm's $115 million stock repurchase authorization, GCM Grosvenor repurchased $6.4 million of Class A common stock during the quarter ◦ $40.2 million remained in the approved share and warrant repurchase program as of September 30, 2023 SUMMARY OF OWNERSHIP AS OF 9/30/23 (mm) Shares % Management Owned Shares 144.2 77 % Publicly Traded Shares 43.0 23 % Total Shares 187.2 100 % Warrants Outstanding22 17.7 Other Key Items KEY CASH, INVESTMENT AND DEBT METRICS AS OF 9/30/23 ($mm) Cash and Cash Equivalents19 $ 55 Investments20 181 Cash and Investments 236 Unrealized Carried Interest20 365 Cash, Investments and Unrealized Carried Interest20 601 Debt21 390 Drawn Revolving Credit Facility ($50 million available) 0
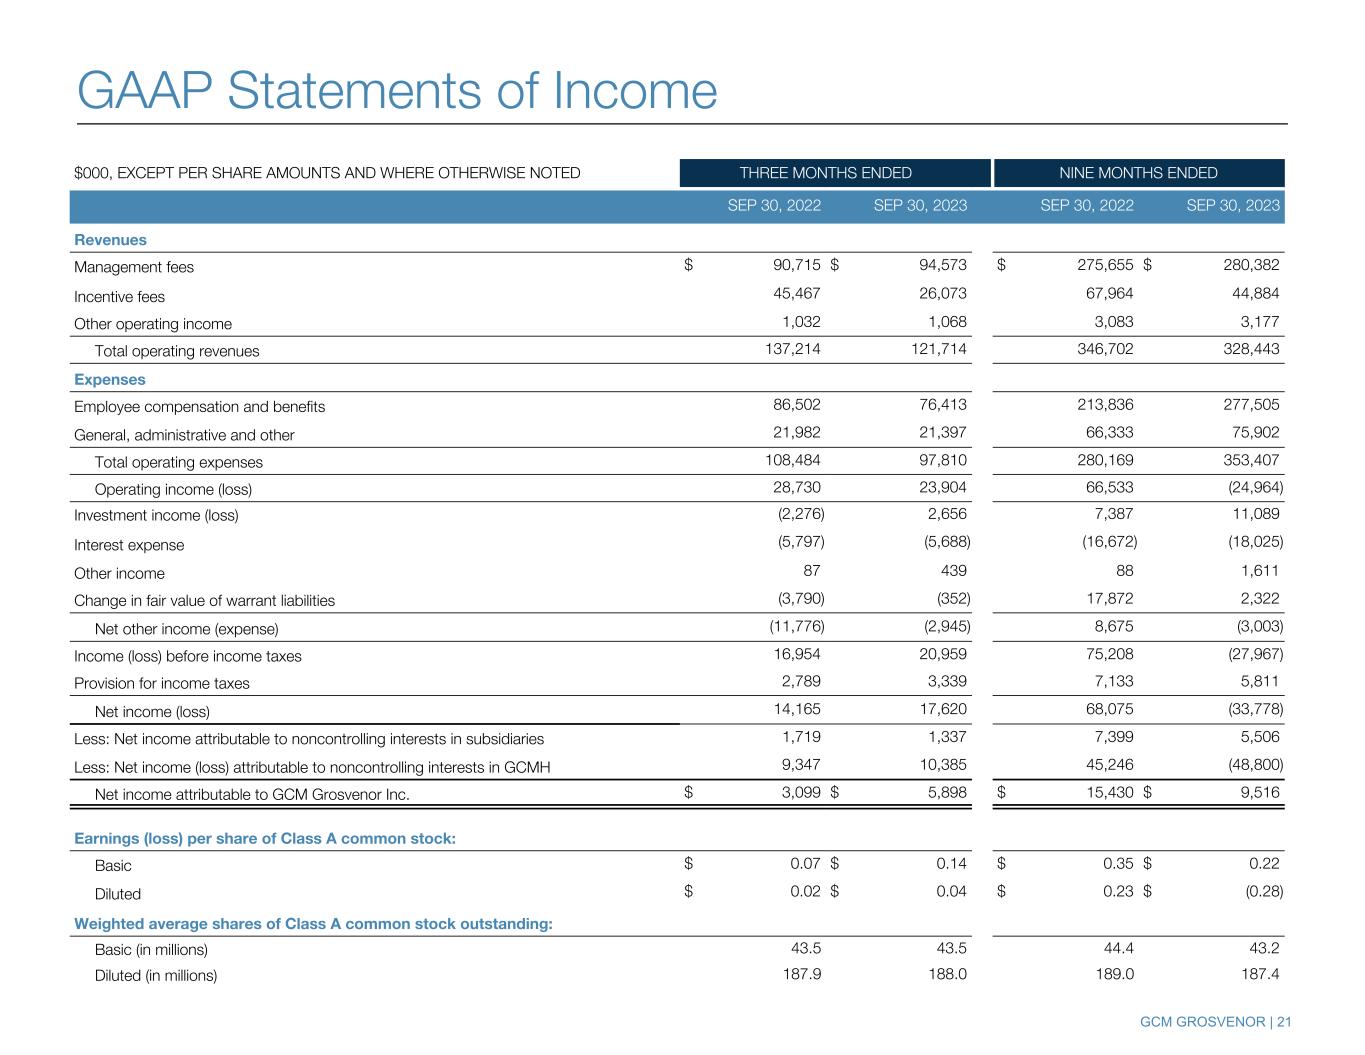
GCM GROSVENOR | 21 $000, EXCEPT PER SHARE AMOUNTS AND WHERE OTHERWISE NOTED THREE MONTHS ENDED NINE MONTHS ENDED SEP 30, 2022 SEP 30, 2023 SEP 30, 2022 SEP 30, 2023 Revenues Management fees $ 90,715 $ 94,573 $ 275,655 $ 280,382 Incentive fees 45,467 26,073 67,964 44,884 Other operating income 1,032 1,068 3,083 3,177 Total operating revenues 137,214 121,714 346,702 328,443 Expenses Employee compensation and benefits 86,502 76,413 213,836 277,505 General, administrative and other 21,982 21,397 66,333 75,902 Total operating expenses 108,484 97,810 280,169 353,407 Operating income (loss) 28,730 23,904 66,533 (24,964) Investment income (loss) (2,276) 2,656 7,387 11,089 Interest expense (5,797) (5,688) (16,672) (18,025) Other income 87 439 88 1,611 Change in fair value of warrant liabilities (3,790) (352) 17,872 2,322 Net other income (expense) (11,776) (2,945) 8,675 (3,003) Income (loss) before income taxes 16,954 20,959 75,208 (27,967) Provision for income taxes 2,789 3,339 7,133 5,811 Net income (loss) 14,165 17,620 68,075 (33,778) Less: Net income attributable to noncontrolling interests in subsidiaries 1,719 1,337 7,399 5,506 Less: Net income (loss) attributable to noncontrolling interests in GCMH 9,347 10,385 45,246 (48,800) Net income attributable to GCM Grosvenor Inc. $ 3,099 $ 5,898 $ 15,430 $ 9,516 Earnings (loss) per share of Class A common stock: Basic $ 0.07 $ 0.14 $ 0.35 $ 0.22 Diluted $ 0.02 $ 0.04 $ 0.23 $ (0.28) Weighted average shares of Class A common stock outstanding: Basic (in millions) 43.5 43.5 44.4 43.2 Diluted (in millions) 187.9 188.0 189.0 187.4 GAAP Statements of Income
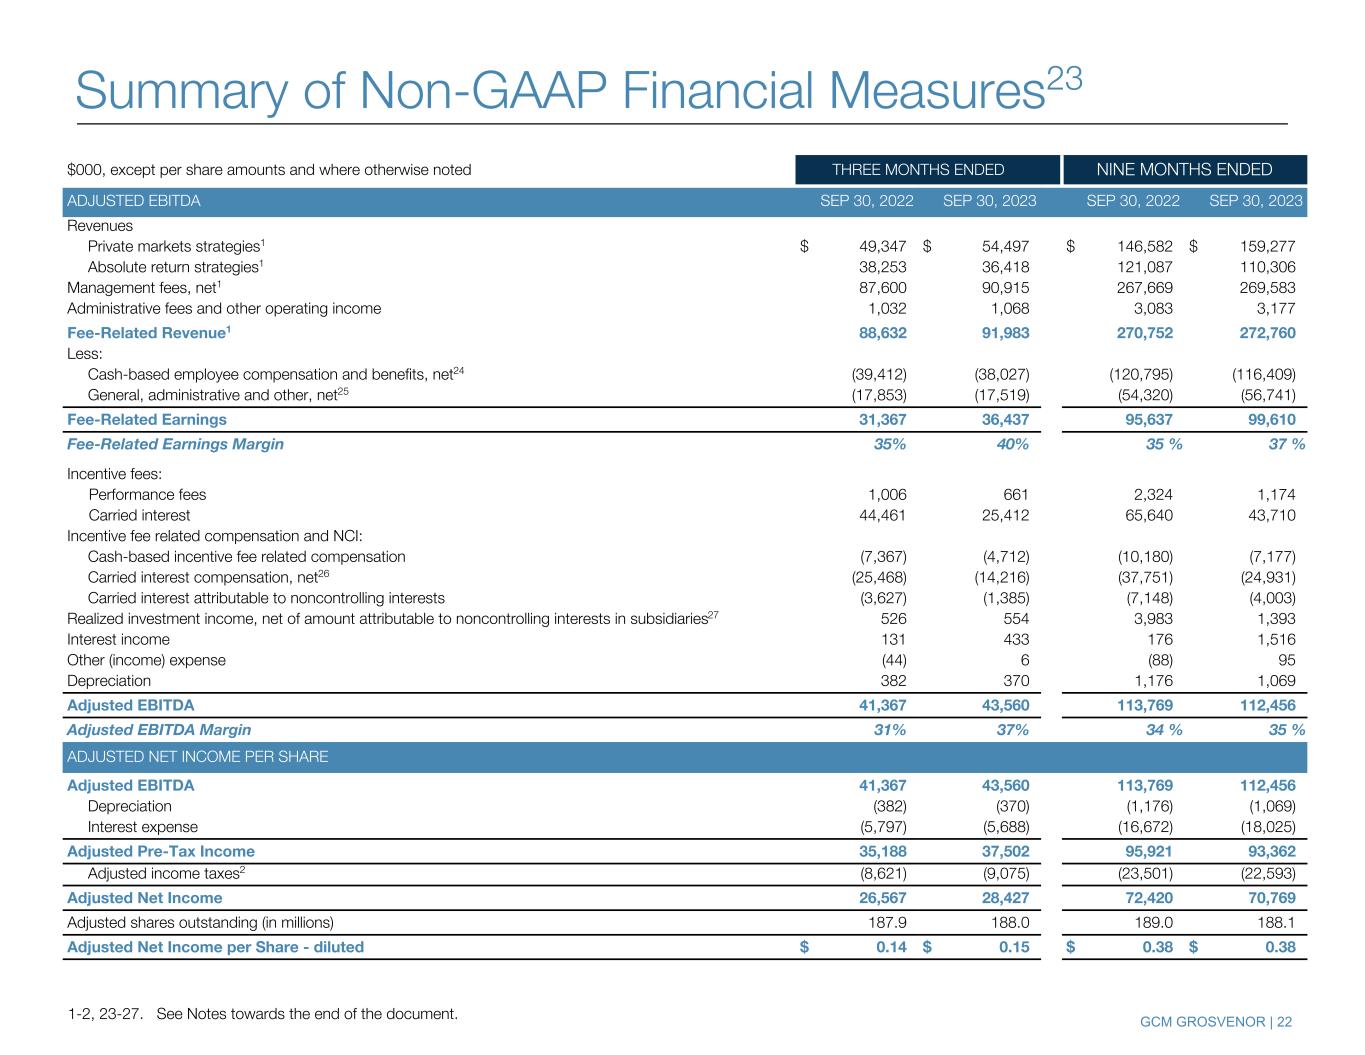
GCM GROSVENOR | 221-2, 23-27. See Notes towards the end of the document. $000, except per share amounts and where otherwise noted THREE MONTHS ENDED NINE MONTHS ENDED ADJUSTED EBITDA SEP 30, 2022 SEP 30, 2023 SEP 30, 2022 SEP 30, 2023 Revenues Private markets strategies1 $ 49,347 $ 54,497 $ 146,582 $ 159,277 Absolute return strategies1 38,253 36,418 121,087 110,306 Management fees, net1 87,600 90,915 267,669 269,583 Administrative fees and other operating income 1,032 1,068 3,083 3,177 Fee-Related Revenue1 88,632 91,983 270,752 272,760 Less: Cash-based employee compensation and benefits, net24 (39,412) (38,027) (120,795) (116,409) General, administrative and other, net25 (17,853) (17,519) (54,320) (56,741) Fee-Related Earnings 31,367 36,437 95,637 99,610 Fee-Related Earnings Margin 35 % 40 % 35 % 37 % Incentive fees: Performance fees 1,006 661 2,324 1,174 Carried interest 44,461 25,412 65,640 43,710 Incentive fee related compensation and NCI: Cash-based incentive fee related compensation (7,367) (4,712) (10,180) (7,177) Carried interest compensation, net26 (25,468) (14,216) (37,751) (24,931) Carried interest attributable to noncontrolling interests (3,627) (1,385) (7,148) (4,003) Realized investment income, net of amount attributable to noncontrolling interests in subsidiaries27 526 554 3,983 1,393 Interest income 131 433 176 1,516 Other (income) expense (44) 6 (88) 95 Depreciation 382 370 1,176 1,069 Adjusted EBITDA 41,367 43,560 113,769 112,456 Adjusted EBITDA Margin 31 % 37 % 34 % 35 % ADJUSTED NET INCOME PER SHARE Adjusted EBITDA 41,367 43,560 113,769 112,456 Depreciation (382) (370) (1,176) (1,069) Interest expense (5,797) (5,688) (16,672) (18,025) Adjusted Pre-Tax Income 35,188 37,502 95,921 93,362 Adjusted income taxes2 (8,621) (9,075) (23,501) (22,593) Adjusted Net Income 26,567 28,427 72,420 70,769 Adjusted shares outstanding (in millions) 187.9 188.0 189.0 188.1 Adjusted Net Income per Share - diluted $ 0.14 $ 0.15 $ 0.38 $ 0.38 Summary of Non-GAAP Financial Measures23

GCM GROSVENOR | 23 $000, except per share amounts and where otherwise noted DEC 31, 2022 SEP 30, 2023 Assets Cash and cash equivalents $ 85,163 $ 55,354 Management fees receivable 18,720 22,267 Incentive fees receivable 16,478 20,837 Due from related parties 13,119 12,536 Investments 223,970 239,883 Premises and equipment, net 4,620 4,548 Lease right-of-use assets 12,479 40,622 Intangible assets, net 3,940 2,955 Goodwill 28,959 28,959 Deferred tax assets, net 60,320 57,533 Other assets 21,165 19,227 Total assets 488,933 504,721 Liabilities and Equity (Deficit) Accrued compensation and benefits 52,997 52,021 Employee related obligations 36,328 30,520 Debt 387,627 385,451 Payable to related parties pursuant to the tax receivable agreement 55,366 55,395 Lease liabilities 15,520 42,776 Warrant liabilities 7,861 5,538 Accrued expenses and other liabilities 27,240 26,708 Total liabilities 582,939 598,409 Commitments and contingencies Preferred stock, $0.0001 par value, 100,000,000 shares authorized, none issued — — Class A common stock, $0.0001 par value, 700,000,000 authorized; 41,806,215 and 42,980,641 issued and outstanding as of December 31, 2022 and September 30, 2023, respectively 4 4 Class B common stock, $0.0001 par value, 500,000,000 authorized, none issued — — Class C common stock, $0.0001 par value, 300,000,000 authorized; 144,235,246 issued and outstanding as of December 31, 2022 and September 30, 2023 14 14 Additional paid-in capital — 1,081 Accumulated other comprehensive income 4,096 4,710 Retained earnings (23,934) (30,527) Total GCM Grosvenor Inc. deficit (19,820) (24,718) Noncontrolling interests in subsidiaries 67,900 64,764 Noncontrolling interests in GCMH (142,086) (133,734) Total deficit (94,006) (93,688) Total liabilities and equity (deficit) $ 488,933 $ 504,721 GAAP Balance Sheets

GCM GROSVENOR | 24 $000 THREE MONTHS ENDED NINE MONTHS ENDED SEP 30, 2022 JUN 30, 2023 SEP 30, 2023 SEP 30, 2022 SEP 30, 2023 Components of GAAP Employee Compensation and Benefits Cash-based employee compensation and benefits, net24 $ 39,412 $ 38,492 $ 38,027 $ 120,795 $ 116,409 Cash-based incentive fee related compensation 7,367 1,728 4,712 10,180 7,177 Carried interest compensation, net26 25,468 7,498 14,216 37,751 24,931 Partnership interest-based compensation 7,329 63,127 14,958 21,471 89,182 Equity-based compensation 5,706 3,815 3,437 21,191 33,045 Severance 421 199 1,121 1,202 5,883 Other non-cash compensation 321 (50) 381 1,157 915 Non-cash carried interest compensation 478 59 (439) 89 (37) GAAP employee compensation and benefits $ 86,502 $ 114,868 $ 76,413 $ 213,836 $ 277,505 24, 26. See Notes towards the end of the document. Components of GAAP Expenses
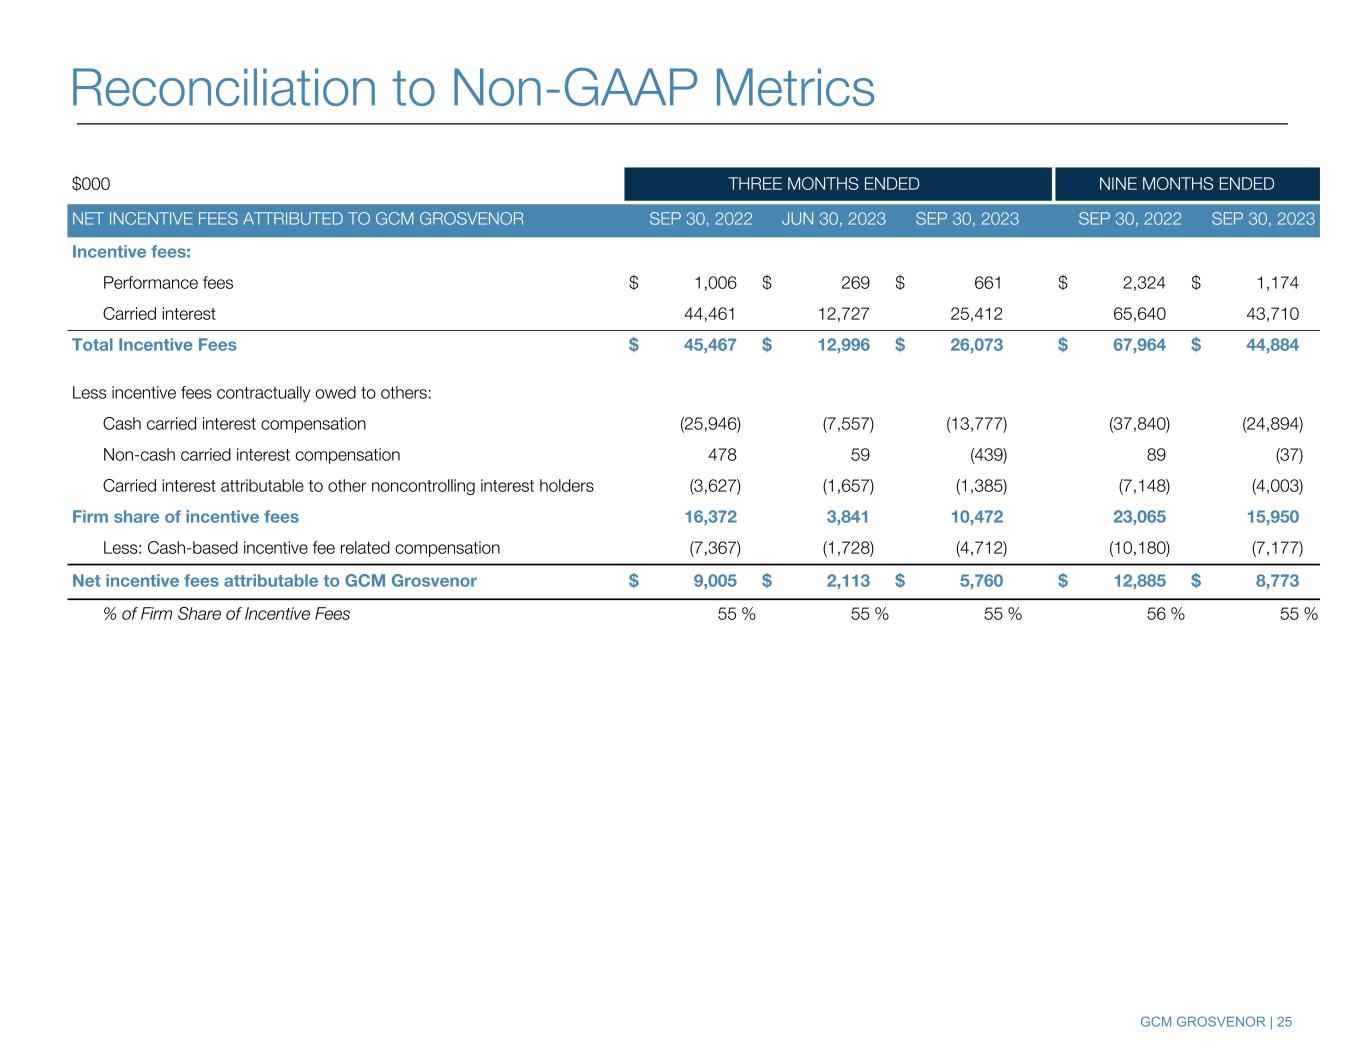
GCM GROSVENOR | 25 $000 THREE MONTHS ENDED NINE MONTHS ENDED NET INCENTIVE FEES ATTRIBUTED TO GCM GROSVENOR SEP 30, 2022 JUN 30, 2023 SEP 30, 2023 SEP 30, 2022 SEP 30, 2023 Incentive fees: Performance fees $ 1,006 $ 269 $ 661 $ 2,324 $ 1,174 Carried interest 44,461 12,727 25,412 65,640 43,710 Total Incentive Fees $ 45,467 $ 12,996 $ 26,073 $ 67,964 $ 44,884 Less incentive fees contractually owed to others: Cash carried interest compensation (25,946) (7,557) (13,777) (37,840) (24,894) Non-cash carried interest compensation 478 59 (439) 89 (37) Carried interest attributable to other noncontrolling interest holders (3,627) (1,657) (1,385) (7,148) (4,003) Firm share of incentive fees 16,372 3,841 10,472 23,065 15,950 Less: Cash-based incentive fee related compensation (7,367) (1,728) (4,712) (10,180) (7,177) Net incentive fees attributable to GCM Grosvenor $ 9,005 $ 2,113 $ 5,760 $ 12,885 $ 8,773 % of Firm Share of Incentive Fees 55 % 55 % 55 % 56 % 55 % Reconciliation to Non-GAAP Metrics

GCM GROSVENOR | 26 $000 THREE MONTHS ENDED NINE MONTHS ENDED ADJUSTED PRE-TAX INCOME & ADJUSTED NET INCOME SEP 30, 2022 JUN 30, 2023 SEP 30, 2023 SEP 30, 2022 SEP 30, 2023 Net income attributable to GCM Grosvenor Inc. $ 3,099 $ 4,848 $ 5,898 $ 15,430 $ 9,516 Plus: Net income (loss) attributable to noncontrolling interests in GCMH 9,347 (42,495) 10,385 45,246 (48,800) Provision for income taxes 2,789 2,050 3,339 7,133 5,811 Change in fair value of warrant liabilities 3,790 (4,895) 352 (17,872) (2,322) Amortization expense 579 329 328 1,737 985 Severance 421 199 1,121 1,202 5,883 Transaction expenses28 346 4,400 (441) 2,050 6,318 Changes in tax receivable agreement liability and other29 168 468 335 295 803 Partnership interest-based compensation 7,329 63,127 14,958 21,471 89,182 Equity-based compensation 5,706 3,815 3,437 21,191 33,045 Other non-cash compensation 321 (50) 381 1,157 915 Less: Unrealized investment (income) loss, net of noncontrolling interests 815 (1,884) (2,152) (3,208) (7,937) Non-cash carried interest compensation 478 59 (439) 89 (37) Adjusted Pre-Tax Income 35,188 29,971 37,502 95,921 93,362 Less: Adjusted income taxes2 (8,621) (7,252) (9,075) (23,501) (22,593) Adjusted Net Income $ 26,567 $ 22,719 $ 28,427 $ 72,420 $ 70,769 2, 28-29. See Notes towards the end of the document. Reconciliation to Non-GAAP Metrics

GCM GROSVENOR | 27 $000 THREE MONTHS ENDED NINE MONTHS ENDED ADJUSTED EBITDA SEP 30, 2022 JUN 30, 2023 SEP 30, 2023 SEP 30, 2022 SEP 30, 2023 Adjusted Net Income $ 26,567 $ 22,719 $ 28,427 $ 72,420 $ 70,769 Plus: Adjusted income taxes2 8,621 7,252 9,075 23,501 22,593 Depreciation expense 382 352 370 1,176 1,069 Interest expense 5,797 5,682 5,688 16,672 18,025 Adjusted EBITDA $ 41,367 $ 36,005 $ 43,560 $ 113,769 $ 112,456 FEE-RELATED EARNINGS Adjusted EBITDA 41,367 36,005 43,560 113,769 112,456 Less: Incentive fees (45,467) (12,996) (26,073) (67,964) (44,884) Depreciation expense (382) (352) (370) (1,176) (1,069) Other non-operating income (87) (460) (439) (88) (1,611) Realized investment income, net of amount attributable to noncontrolling interests in subsidiaries27 (526) (284) (554) (3,983) (1,393) Plus: Incentive fee-related compensation 32,835 9,226 18,928 47,931 32,108 Carried interest attributable to other noncontrolling interest holders 3,627 1,657 1,385 7,148 4,003 Fee-Related Earnings $ 31,367 $ 32,796 $ 36,437 $ 95,637 $ 99,610 FEE-RELATED REVENUE Total Operating Revenues $ 137,214 $ 107,613 $ 121,714 $ 346,702 $ 328,443 Less: Incentive fees (45,467) (12,996) (26,073) (67,964) (44,884) Fund reimbursement revenue (3,115) (3,834) (3,658) (7,986) (10,799) Fee-Related Revenue $ 88,632 $ 90,783 $ 91,983 $ 270,752 $ 272,760 2, 27. See Notes towards the end of the document. Reconciliation to Non-GAAP Metrics
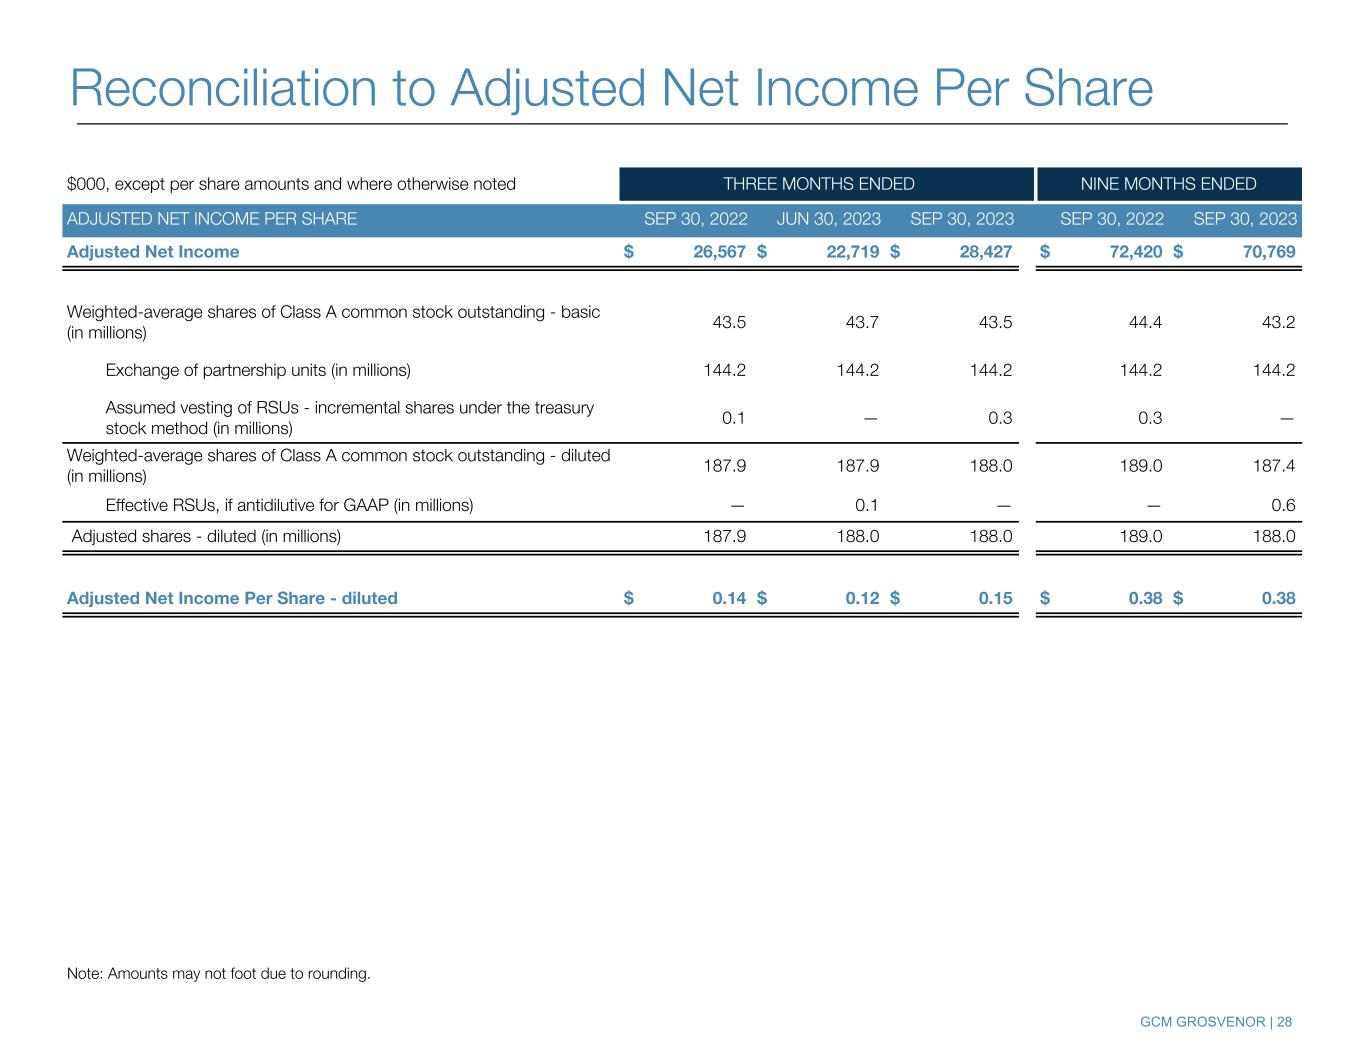
GCM GROSVENOR | 28 $000, except per share amounts and where otherwise noted THREE MONTHS ENDED NINE MONTHS ENDED ADJUSTED NET INCOME PER SHARE SEP 30, 2022 JUN 30, 2023 SEP 30, 2023 SEP 30, 2022 SEP 30, 2023 Adjusted Net Income $ 26,567 $ 22,719 $ 28,427 $ 72,420 $ 70,769 Weighted-average shares of Class A common stock outstanding - basic (in millions) 43.5 43.7 43.5 44.4 43.2 Exchange of partnership units (in millions) 144.2 144.2 144.2 144.2 144.2 Assumed vesting of RSUs - incremental shares under the treasury stock method (in millions) 0.1 — 0.3 0.3 — Weighted-average shares of Class A common stock outstanding - diluted (in millions) 187.9 187.9 188.0 189.0 187.4 Effective RSUs, if antidilutive for GAAP (in millions) — 0.1 — — 0.6 Adjusted shares - diluted (in millions) 187.9 188.0 188.0 189.0 188.0 Adjusted Net Income Per Share - diluted $ 0.14 $ 0.12 $ 0.15 $ 0.38 $ 0.38 Note: Amounts may not foot due to rounding. Reconciliation to Adjusted Net Income Per Share

GCM GROSVENOR | 29 $mm PRIVATE MARKET STRATEGIES ABSOLUTE RETURN STRATEGIES TOTAL FPAUM CONTRACTED NOT YET FPAUM TOTAL AUM Fee-Paying AUM Beginning of Period (July 1, 2023) $ 39,051 $ 21,510 $ 60,561 $ 6,700 $ 75,967 Contributions from CNYFPAUM 414 31 445 Contributions from New Capital Raised 348 127 475 Withdrawals (40) (513) (553) Distributions (249) (9) (258) Change in Market Value 45 295 340 Foreign Exchange and Other (15) (27) (42) End of Period Balance (September 30, 2023) $ 39,554 $ 21,414 $ 60,968 $ 7,056 $ 75,974 % Change 1 % 0 % 1% 5 % 0 % Three Months Ended September 30, 2023 Nine Months Ended September 30, 2023 Change in FPAUM and AUM $mm PRIVATE MARKET STRATEGIES ABSOLUTE RETURN STRATEGIES TOTAL FPAUM CONTRACTED NOT YET FPAUM TOTAL AUM Fee-Paying AUM Beginning of Period (January 1, 2023) $ 36,876 $ 21,980 $ 58,856 $ 7,603 $ 73,667 Contributions from CNYFPAUM 1,868 34 1,902 Contributions from New Capital Raised 1,746 282 2,028 Withdrawals (68) (1,714) (1,782) Distributions (752) (58) (810) Change in Market Value 163 1,048 1,211 Foreign Exchange and Other (279) (158) (437) End of Period Balance (September 30, 2023) $ 39,554 $ 21,414 $ 60,968 $ 7,056 $ 75,974 % Change 7 % -3 % 4 % -7 % 3 %

GCM GROSVENOR | 30 $000 THREE MONTHS ENDED NINE MONTHS ENDED MANAGEMENT FEES SEP 30, 2022 JUN 30, 2023 SEP 30, 2023 SEP 30, 2022 SEP 30, 2023 Private Markets Specialized Funds $ 17,670 $ 19,922 $ 21,117 $ 54,040 $ 60,489 Average Fee Rate30 0.78 % 0.79 % 0.79 % 0.78 % 0.79 % Customized Separate Accounts 31,677 33,056 33,380 92,542 98,788 Average Fee Rate 0.48 % 0.46 % 0.46 % 0.48 % 0.46 % Private Markets Management Fees 49,347 52,978 54,497 146,582 159,277 Average Fee Rate - Private Markets30 0.56 % 0.55 % 0.54 % 0.55 % 0.55 % Absolute Return Strategies Management Fees 38,253 36,752 36,418 121,087 110,306 Average Fee Rate - Absolute Return Strategies (Management Fee Only) 0.68 % 0.68 % 0.68 % 0.68 % 0.68 % Average Fee Rate - Absolute Return Strategies (Actual Management Fee + Run Rate Performance Fee at End of Period)31 0.79 % 0.79 % 0.77 % 0.79 % 0.77 % 1. Excludes fund reimbursement revenue. 30. Average fee rate excludes effect of catch-up management fees. 31. The run rate on annual performance fees reflects potential annual performance fees generated by performance fee-eligible AUM before any loss carryforwards, if applicable, at an 8% gross return for both multi-strategy and credit strategies, and a 10% gross return for specialized opportunity strategies, and before cash-based incentive fee related compensation. The metric is calculated as the actual management fees during the period, plus the run rate performance fee from the end of the period, divided by the average fee- paying AUM over the period. Management Fee Detail1
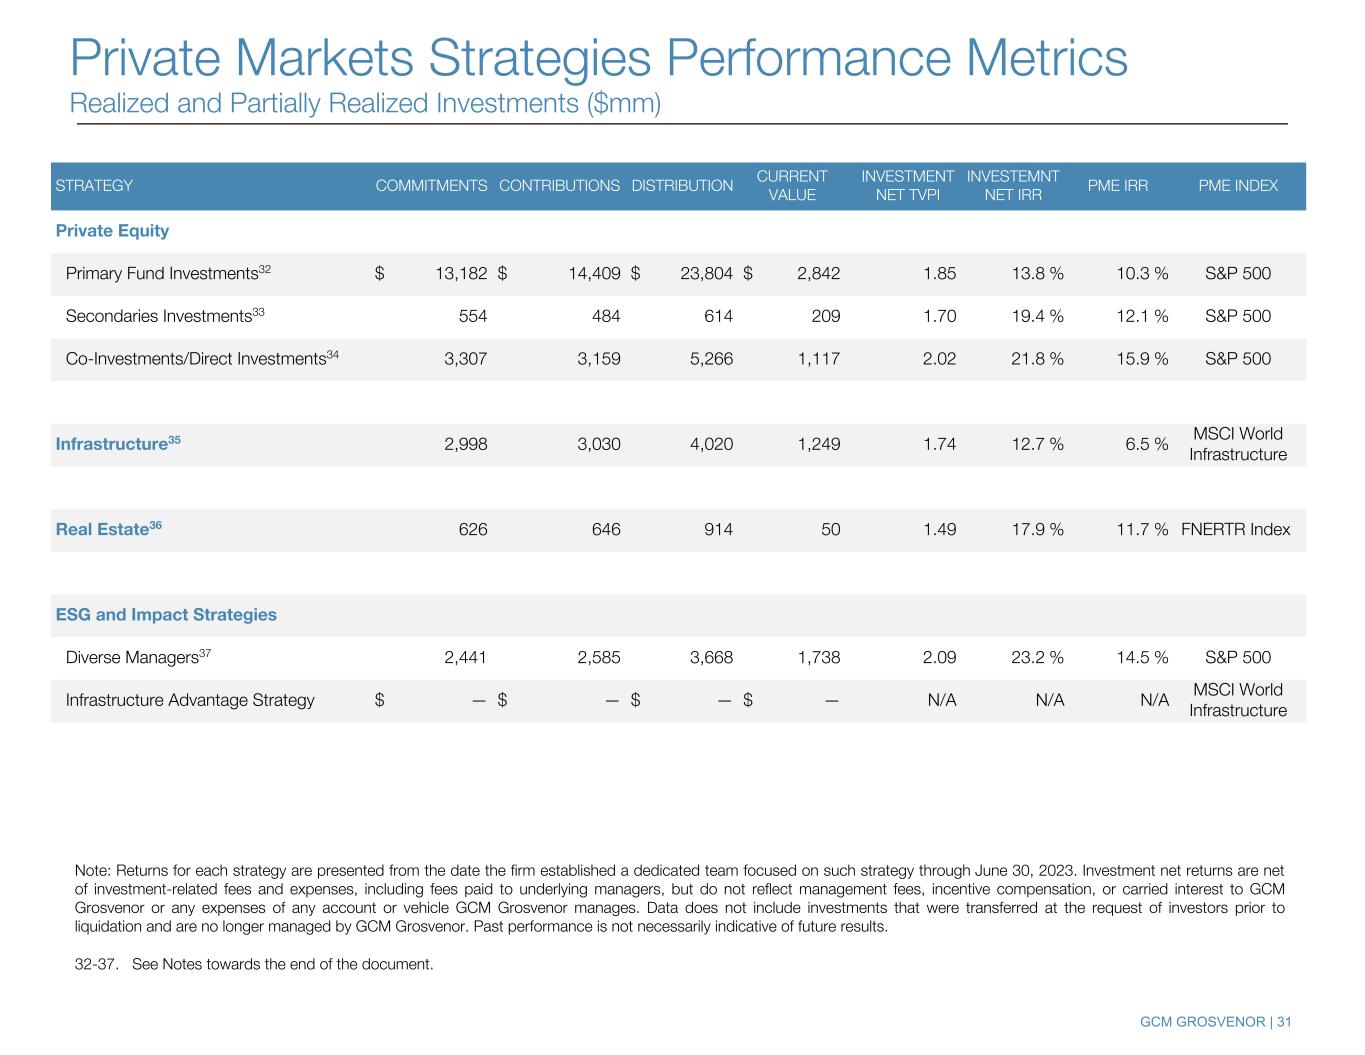
GCM GROSVENOR | 31 STRATEGY COMMITMENTS CONTRIBUTIONS DISTRIBUTION CURRENT VALUE INVESTMENT NET TVPI INVESTEMNT NET IRR PME IRR PME INDEX Private Equity Primary Fund Investments32 $ 13,182 $ 14,409 $ 23,804 $ 2,842 1.85 13.8 % 10.3 % S&P 500 Secondaries Investments33 554 484 614 209 1.70 19.4 % 12.1 % S&P 500 Co-Investments/Direct Investments34 3,307 3,159 5,266 1,117 2.02 21.8 % 15.9 % S&P 500 Infrastructure35 2,998 3,030 4,020 1,249 1.74 12.7 % 6.5 % MSCI World Infrastructure Real Estate36 626 646 914 50 1.49 17.9 % 11.7 % FNERTR Index ESG and Impact Strategies Diverse Managers37 2,441 2,585 3,668 1,738 2.09 23.2 % 14.5 % S&P 500 Infrastructure Advantage Strategy $ — $ — $ — $ — N/A N/A N/A MSCI World Infrastructure Note: Returns for each strategy are presented from the date the firm established a dedicated team focused on such strategy through June 30, 2023. Investment net returns are net of investment-related fees and expenses, including fees paid to underlying managers, but do not reflect management fees, incentive compensation, or carried interest to GCM Grosvenor or any expenses of any account or vehicle GCM Grosvenor manages. Data does not include investments that were transferred at the request of investors prior to liquidation and are no longer managed by GCM Grosvenor. Past performance is not necessarily indicative of future results. 32-37. See Notes towards the end of the document. Private Markets Strategies Performance Metrics Realized and Partially Realized Investments ($mm)
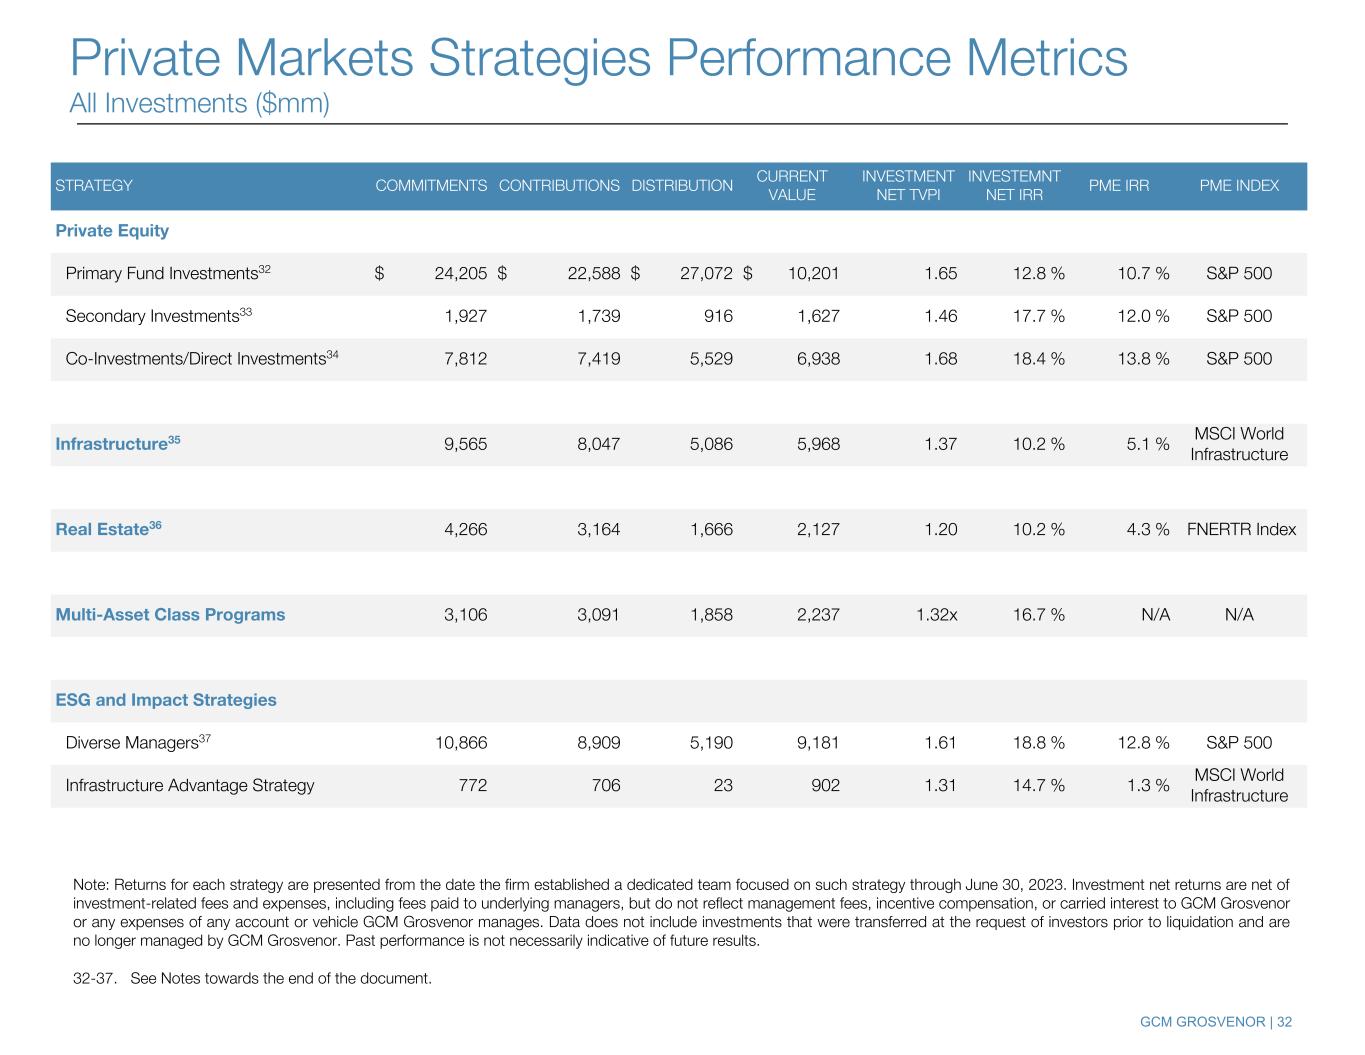
GCM GROSVENOR | 32 STRATEGY COMMITMENTS CONTRIBUTIONS DISTRIBUTION CURRENT VALUE INVESTMENT NET TVPI INVESTEMNT NET IRR PME IRR PME INDEX Private Equity Primary Fund Investments32 $ 24,205 $ 22,588 $ 27,072 $ 10,201 1.65 12.8 % 10.7 % S&P 500 Secondary Investments33 1,927 1,739 916 1,627 1.46 17.7 % 12.0 % S&P 500 Co-Investments/Direct Investments34 7,812 7,419 5,529 6,938 1.68 18.4 % 13.8 % S&P 500 Infrastructure35 9,565 8,047 5,086 5,968 1.37 10.2 % 5.1 % MSCI World Infrastructure Real Estate36 4,266 3,164 1,666 2,127 1.20 10.2 % 4.3 % FNERTR Index Multi-Asset Class Programs 3,106 3,091 1,858 2,237 1.32x 16.7 % N/A N/A ESG and Impact Strategies Diverse Managers37 10,866 8,909 5,190 9,181 1.61 18.8 % 12.8 % S&P 500 Infrastructure Advantage Strategy 772 706 23 902 1.31 14.7 % 1.3 % MSCI World Infrastructure Note: Returns for each strategy are presented from the date the firm established a dedicated team focused on such strategy through June 30, 2023. Investment net returns are net of investment-related fees and expenses, including fees paid to underlying managers, but do not reflect management fees, incentive compensation, or carried interest to GCM Grosvenor or any expenses of any account or vehicle GCM Grosvenor manages. Data does not include investments that were transferred at the request of investors prior to liquidation and are no longer managed by GCM Grosvenor. Past performance is not necessarily indicative of future results. 32-37. See Notes towards the end of the document. All Investments ($ million) Private Markets Strategies Performance Metrics All Invest ents ($mm)
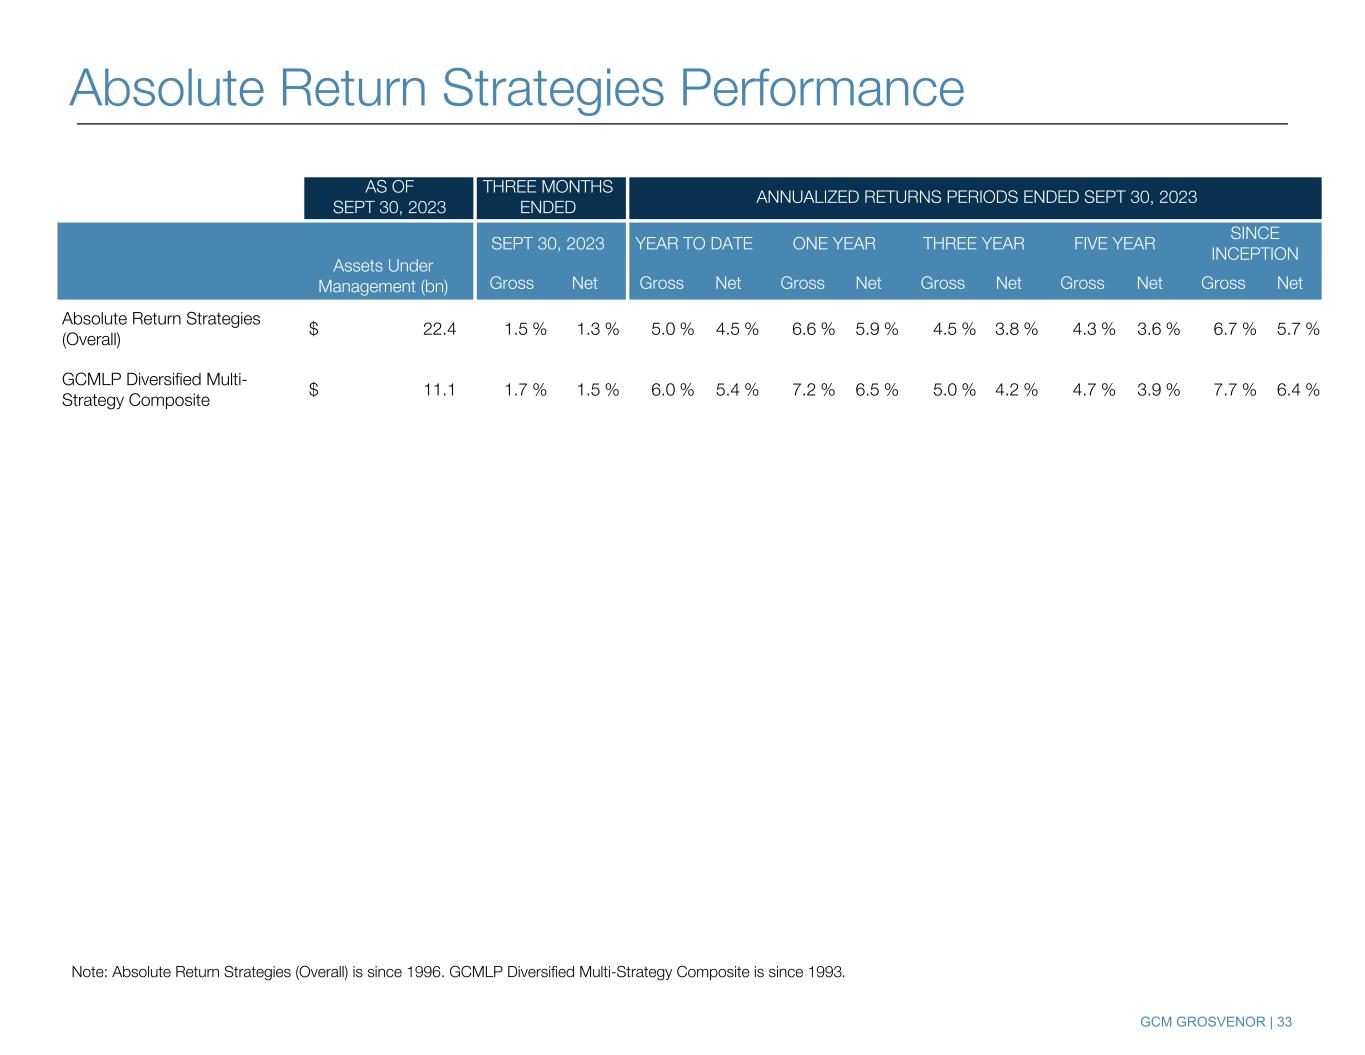
GCM GROSVENOR | 33 AS OF SEPT 30, 2023 THREE MONTHS ENDED ANNUALIZED RETURNS PERIODS ENDED SEPT 30, 2023 Assets Under Management (bn) SEPT 30, 2023 YEAR TO DATE ONE YEAR THREE YEAR FIVE YEAR SINCE INCEPTION Gross Net Gross Net Gross Net Gross Net Gross Net Gross Net Absolute Return Strategies (Overall) $ 22.4 1.5 % 1.3 % 5.0 % 4.5 % 6.6 % 5.9 % 4.5 % 3.8 % 4.3 % 3.6 % 6.7 % 5.7 % GCMLP Diversified Multi- Strategy Composite $ 11.1 1.7 % 1.5 % 6.0 % 5.4 % 7.2 % 6.5 % 5.0 % 4.2 % 4.7 % 3.9 % 7.7 % 6.4 % Note: Absolute Return Strategies (Overall) is since 1996. GCMLP Diversified Multi-Strategy Composite is since 1993. Absolute Return Strategies Performance

GCM GROSVENOR | 34 $000 THREE MONTHS ENDED NINE MONTHS ENDED COMPONENTS OF GENERAL, ADMINISTRATIVE AND OTHER, NET SEP 30, 2022 SEP 30, 2023 SEP 30, 2022 SEP 30, 2023 General, administrative and other $ (21,982) $ (21,397) $ (66,333) $ (75,902) Plus: Transaction expenses 346 (441) 2,050 6,318 Fund reimbursement revenue 3,115 3,658 7,986 10,799 Amortization expense 579 328 1,737 985 Non-core items 89 333 240 1,059 Total general, administrative and other, net $ (17,853) $ (17,519) $ (54,320) $ (56,741) 1. Excludes fund reimbursement revenue. 2. Reflects a corporate and blended statutory tax rate of 24.5% for the three and nine months ended September 30, 2022 and of 24.2% for the three and nine months ended September 30, 2023 applied to Adjusted Pre-Tax Income. The 24.5% and 24.2% are based on a federal statutory rate of 21.0% and a combined state, local and foreign rate net of federal benefits of 3.5% and 3.2%, respectively. 3. Employee data as of October 1, 2023. Individuals with dual responsibilities are counted only once. 4. AUM as of September 30, 2023. 9. Run-Rate Annual Performance Fees reflect the potential annual performance fees generated by performance fee-eligible AUM before any loss carryforwards, if applicable, at an 8% gross return for both multi-strategy and credit strategies, and a 10% gross return for specialized opportunity strategies, and before cash-based incentive fee related compensation. The majority of run-rate annual performance fees relate to ARS. 10. Based on 50 largest clients by AUM as of September 30, 2023. 11. Absolute return strategies managers tracked as of December 31, 2022. 12. Absolute return strategies managers invested as of September 30, 2023. 13. ESG and Impact Investments AUM as of September 30, 2023. AUM related to certain ESG and Impact investments includes mark-to-market changes for funds that charge management fees based on commitments. Such increases in AUM do not increase FPAUM or revenue. The data regarding ESG themes presented above and otherwise contained herein is based on the assessment of each such investment by GCM Grosvenor investment team members. The relevant investments are placed into categories that are generally consistent with the categories presented in the UN PRI Impact Investing Market Map. Primary fund assessments are based on whether a significant part of the expected strategy of the primary fund falls into an ESG category. Co-investment categorizations are based either on categories represented by the co-investment sponsor or the underlying portfolio company. Diverse Manager investments include investments managed by or sponsored by a diverse manager, based on GCM Grosvenor’s definition of a diverse manager, which is determined by thresholds of manager economic ownership by diverse parties (race, gender, sexual orientation, veterans, disabled persons). There is significant subjectivity in placing an investment in a particular category, and conventions and methodologies used by GCM Grosvenor in categorizing investments and calculating the data presented may differ from those used by other investment managers. Additional information regarding these conventions and methodologies is available upon request. 14. Some investments are counted in more than one ESG category. 15. For Private Markets customized separate accounts from January 1, 2018 through September 30, 2023. 16. AUM as of September 30, 2023; YTD Fundraising through September 30, 2023. 23. Adjusted EBITDA and Adjusted Net Income per share are non-GAAP financial measures. See Appendix for the reconciliations of our non-GAAP financial measures to the most comparable GAAP metric. 24. Excludes severance expenses of $0.4 million, $0.2 million and $1.1 million for the three months ended September 30, 2022, June 30, 2023 and September 30, 2023, respectively, and $1.2 million and $5.9 million for the nine months ended September 30, 2022 and 2023, respectively. 25. General, administrative and other, net is comprised of the following: Notes
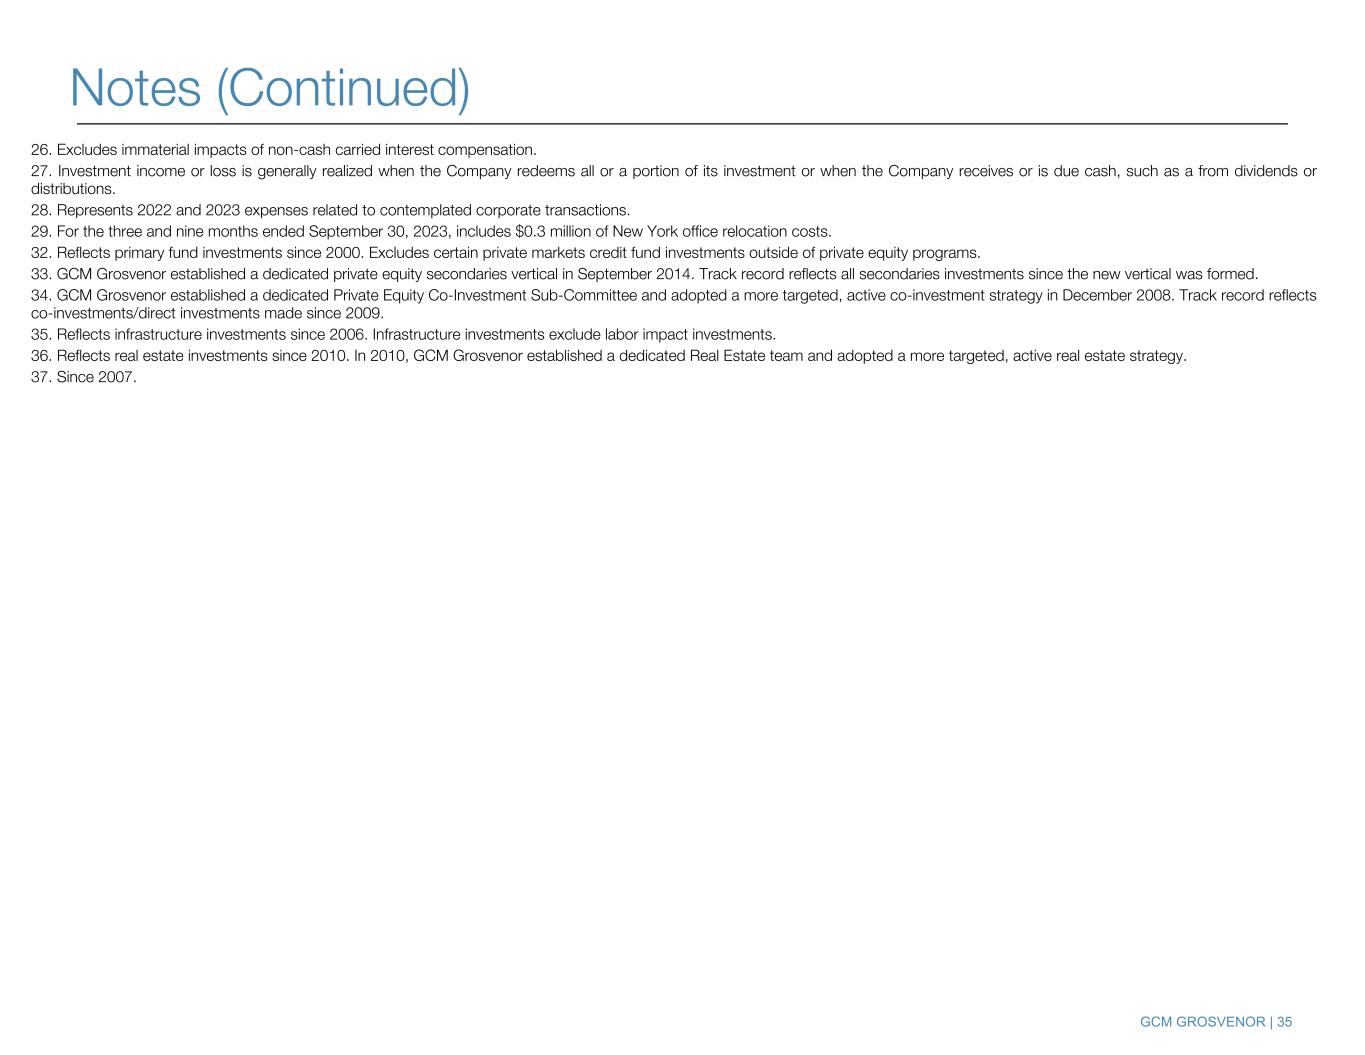
GCM GROSVENOR | 35 26. Excludes immaterial impacts of non-cash carried interest compensation. s immaterial. 27. Investment income or loss is generally realized when the Company redeems all or a portion of its investment or when the Company receives or is due cash, such as a from dividends or distributions. 28. Represents 2022 and 2023 expenses related to contemplated corporate transactions. 29. For the three and nine months ended September 30, 2023, includes $0.3 million of New York office relocation costs. 32. Reflects primary fund investments since 2000. Excludes certain private markets credit fund investments outside of private equity programs. 33. GCM Grosvenor established a dedicated private equity secondaries vertical in September 2014. Track record reflects all secondaries investments since the new vertical was formed. 34. GCM Grosvenor established a dedicated Private Equity Co-Investment Sub-Committee and adopted a more targeted, active co-investment strategy in December 2008. Track record reflects co-investments/direct investments made since 2009. 35. Reflects infrastructure investments since 2006. Infrastructure investments exclude labor impact investments. 36. Reflects real estate investments since 2010. In 2010, GCM Grosvenor established a dedicated Real Estate team and adopted a more targeted, active real estate strategy. 37. Since 2007. Notes (Continued)
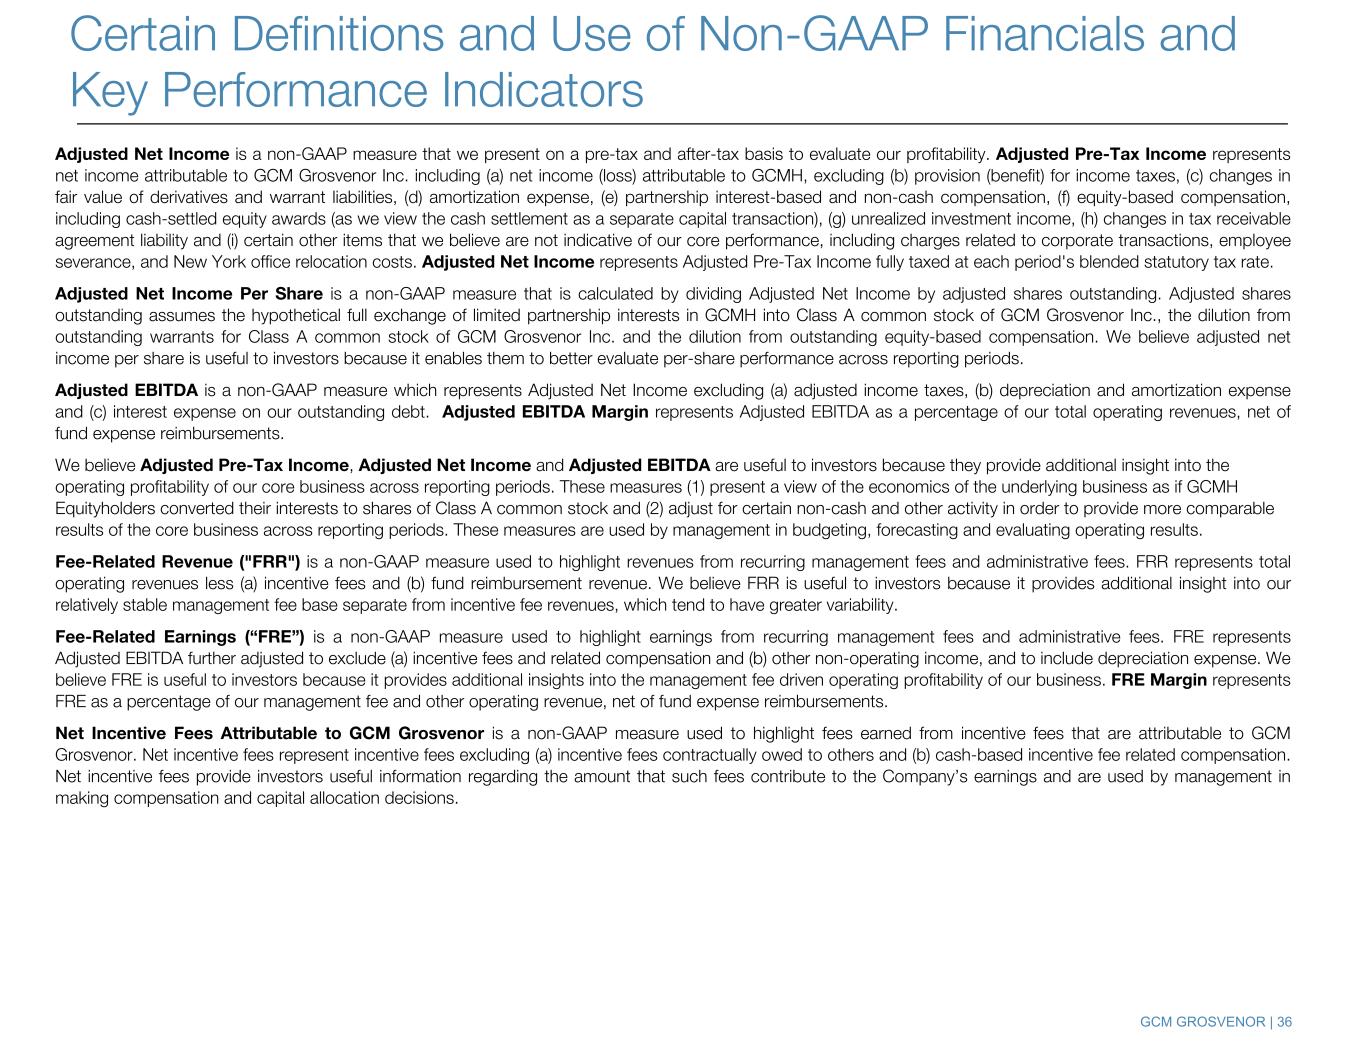
GCM GROSVENOR | 36 Adjusted Net Income is a non-GAAP measure that we present on a pre-tax and after-tax basis to evaluate our profitability. Adjusted Pre-Tax Income represents net income attributable to GCM Grosvenor Inc. including (a) net income (loss) attributable to GCMH, excluding (b) provision (benefit) for income taxes, (c) changes in fair value of derivatives and warrant liabilities, (d) amortization expense, (e) partnership interest-based and non-cash compensation, (f) equity-based compensation, including cash-settled equity awards (as we view the cash settlement as a separate capital transaction), (g) unrealized investment income, (h) changes in tax receivable agreement liability and (i) certain other items that we believe are not indicative of our core performance, including charges related to corporate transactions, employee severance, and New York office relocation costs. Adjusted Net Income represents Adjusted Pre-Tax Income fully taxed at each period's blended statutory tax rate. Adjusted Net Income Per Share is a non-GAAP measure that is calculated by dividing Adjusted Net Income by adjusted shares outstanding. Adjusted shares outstanding assumes the hypothetical full exchange of limited partnership interests in GCMH into Class A common stock of GCM Grosvenor Inc., the dilution from outstanding warrants for Class A common stock of GCM Grosvenor Inc. and the dilution from outstanding equity-based compensation. We believe adjusted net income per share is useful to investors because it enables them to better evaluate per-share performance across reporting periods. Adjusted EBITDA is a non-GAAP measure which represents Adjusted Net Income excluding (a) adjusted income taxes, (b) depreciation and amortization expense and (c) interest expense on our outstanding debt. Adjusted EBITDA Margin represents Adjusted EBITDA as a percentage of our total operating revenues, net of fund expense reimbursements. We believe Adjusted Pre-Tax Income, Adjusted Net Income and Adjusted EBITDA are useful to investors because they provide additional insight into the operating profitability of our core business across reporting periods. These measures (1) present a view of the economics of the underlying business as if GCMH Equityholders converted their interests to shares of Class A common stock and (2) adjust for certain non-cash and other activity in order to provide more comparable results of the core business across reporting periods. These measures are used by management in budgeting, forecasting and evaluating operating results. Fee-Related Revenue ("FRR") is a non-GAAP measure used to highlight revenues from recurring management fees and administrative fees. FRR represents total operating revenues less (a) incentive fees and (b) fund reimbursement revenue. We believe FRR is useful to investors because it provides additional insight into our relatively stable management fee base separate from incentive fee revenues, which tend to have greater variability. Fee-Related Earnings (“FRE”) is a non-GAAP measure used to highlight earnings from recurring management fees and administrative fees. FRE represents Adjusted EBITDA further adjusted to exclude (a) incentive fees and related compensation and (b) other non-operating income, and to include depreciation expense. We believe FRE is useful to investors because it provides additional insights into the management fee driven operating profitability of our business. FRE Margin represents FRE as a percentage of our management fee and other operating revenue, net of fund expense reimbursements. Net Incentive Fees Attributable to GCM Grosvenor is a non-GAAP measure used to highlight fees earned from incentive fees that are attributable to GCM Grosvenor. Net incentive fees represent incentive fees excluding (a) incentive fees contractually owed to others and (b) cash-based incentive fee related compensation. Net incentive fees provide investors useful information regarding the amount that such fees contribute to the Company’s earnings and are used by management in making compensation and capital allocation decisions. Certain Definitions and Use of Non-GAAP Financials and Key Performance Indicators
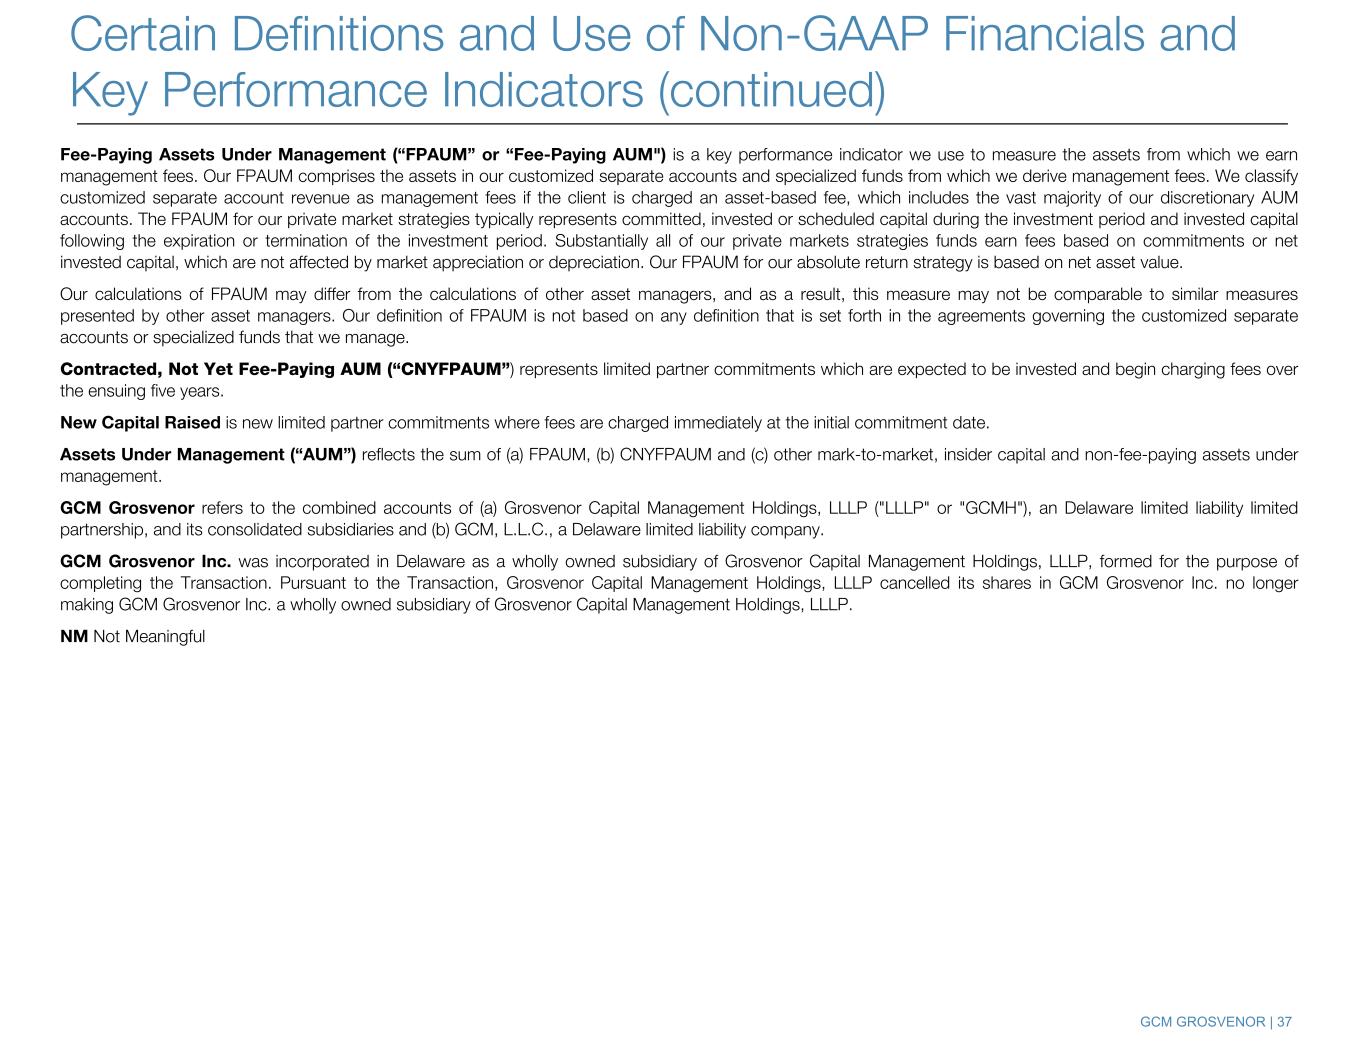
GCM GROSVENOR | 37 Fee-Paying Assets Under Management (“FPAUM” or “Fee-Paying AUM") is a key performance indicator we use to measure the assets from which we earn management fees. Our FPAUM comprises the assets in our customized separate accounts and specialized funds from which we derive management fees. We classify customized separate account revenue as management fees if the client is charged an asset-based fee, which includes the vast majority of our discretionary AUM accounts. The FPAUM for our private market strategies typically represents committed, invested or scheduled capital during the investment period and invested capital following the expiration or termination of the investment period. Substantially all of our private markets strategies funds earn fees based on commitments or net invested capital, which are not affected by market appreciation or depreciation. Our FPAUM for our absolute return strategy is based on net asset value. Our calculations of FPAUM may differ from the calculations of other asset managers, and as a result, this measure may not be comparable to similar measures presented by other asset managers. Our definition of FPAUM is not based on any definition that is set forth in the agreements governing the customized separate accounts or specialized funds that we manage. Contracted, Not Yet Fee-Paying AUM (“CNYFPAUM”) represents limited partner commitments which are expected to be invested and begin charging fees over the ensuing five years. New Capital Raised is new limited partner commitments where fees are charged immediately at the initial commitment date. Assets Under Management (“AUM”) reflects the sum of (a) FPAUM, (b) CNYFPAUM and (c) other mark-to-market, insider capital and non-fee-paying assets under management. GCM Grosvenor refers to the combined accounts of (a) Grosvenor Capital Management Holdings, LLLP ("LLLP" or "GCMH"), an Delaware limited liability limited partnership, and its consolidated subsidiaries and (b) GCM, L.L.C., a Delaware limited liability company. GCM Grosvenor Inc. was incorporated in Delaware as a wholly owned subsidiary of Grosvenor Capital Management Holdings, LLLP, formed for the purpose of completing the Transaction. Pursuant to the Transaction, Grosvenor Capital Management Holdings, LLLP cancelled its shares in GCM Grosvenor Inc. no longer making GCM Grosvenor Inc. a wholly owned subsidiary of Grosvenor Capital Management Holdings, LLLP. NM Not Meaningful Certain Definitions and Use of Non-GAAP Financials and Key Performance Indicators (continued)
GCM GROSVENOR | 38 Non-GAAP Financial Measures The non-GAAP financial measures contained in this presentation are not GAAP measures of GCM Grosvenor’s financial performance or liquidity and should not be considered as alternatives to net income (loss) as a measure of financial performance or cash flows from operations as measures of liquidity, or any other performance measure derived in accordance with GAAP. A reconciliation of such non-GAAP measures to their most directly comparable GAAP measure is included elsewhere in this presentation. You are encouraged to evaluate each adjustment to non-GAAP financial measures and the reasons management considers it appropriate for supplemental analysis. Our presentation of these measures should not be construed as an inference that our future results will be unaffected by unusual or non- recurring items. In addition, these measures may not be comparable to similarly titled measures used by other companies in our industry or across different industries. This presentation includes certain projections of non-GAAP financial measures including fee-related earnings. Due to the high variability and difficulty in making accurate forecasts and projections of some of the information excluded from these projected measures, together with some of the excluded information not being ascertainable or accessible, GCM Grosvenor is unable to quantify certain amounts that would be required to be included in the most directly comparable GAAP financial measures without unreasonable effort. Consequently, no disclosure of estimated comparable GAAP measures is included and no reconciliation of the forward looking non GAAP financial measures is included. Disclaimer


