Document
|
|
|
|
|
|
|
|
|
|
|
SHAREHOLDER LETTER
Q2 2022
|
|
|
|
|
|
|
|
|
|
|
|
|
|
|
|
|
|
|
Q2 |
|
| (in millions, except percentages) |
2021 |
2022 |
YoY Change |
|
|
|
|
| Revenue |
$157.4 |
$103.4 |
(34)% |
Transaction Value 1 |
$256.5 |
$182.9 |
(29)% |
| |
|
|
|
| |
|
|
|
| Gross Profit |
$25.0 |
$15.5 |
(38)% |
Contribution 1 |
$26.7 |
$18.8 |
(30)% |
|
|
|
|
| |
|
|
|
| Net (Loss) |
$(0.4) |
$(13.0) |
n/m |
Adjusted EBITDA 1 |
$14.7 |
$4.5 |
(69)% |
|
|
|
|
| n/m - Not Meaningful |
|
|
|
__________________
1.See “Key Business and Operating Metrics and Non-GAAP Financial Measures” for additional information regarding non-GAAP metrics used in this shareholder letter.
Our property & casualty (P&C) vertical continued to feel the impact of the ongoing hard market in the second quarter, as carriers sought premium increases to restore targeted profitability levels. While P&C click volume continued to grow at a double-digit rate year over year, lower pricing caused P&C Transaction Value to decline 37% year over year.
This hard market affecting the auto insurance industry has been unprecedented—it has taken longer to resolve than almost anyone expected as inflation in claims costs has persisted at levels unseen in nearly 50 years and approval of rate increases has come in slowly in a number of states. As a result, carrier profitability has remained under significant pressure, which has forced many to further reduce variable marketing costs. This has caused our current P&C click prices to be down nearly 50% year over year. For context, at the trough of the last cycle, pricing was down 15% year over year.
With the uncertainty around both the persistence of inflationary pressures and the timing of rate approvals, it remains difficult to predict the duration of this hard market cycle. Although we believe the level of spend on our platform during the second quarter was unsustainably low for the vast majority of our P&C carrier partners, we have seen this trend worsen in July as many carriers experienced a weaker second quarter than expected. We do, however, remain steadfast in our conviction that the insurance industry’s secular shift to more direct, digital customer acquisition will continue. In the near term, we know that as carrier profitability improves, spend on our marketplace can increase quickly. For example, during the last recovery cycle, within six months of our largest demand partner ramping investment on our platform, the majority of our remaining P&C demand partners followed. This drove year-over-year Transaction Value growth in excess of 80% in our P&C insurance vertical in 2018. We remain confident that the inevitable resumption of customer acquisition spending by carriers will lead to a steep and significant recovery in our P&C vertical.
Moving to Health, our Under 65 business continues to perform well despite a challenging year-over-year comparison during the second quarter due to last year’s extended special Open Enrollment Period (OEP) for the Affordable Care Act (ACA), which ran from February 15th to August 15th in 2021. Having said that, we continue to expect a strong OEP during the fourth quarter. Within Medicare, second quarter Transaction Value was flat year over year as strong click growth was offset by lower demand for leads and calls. As a reminder, the second quarter is seasonally slow as demand is heavily weighted to the Annual Enrollment Period (AEP) in the fourth quarter.
The integration of Customer Helper Team (CHT), which we acquired on April 1st, proceeded according to plan during the quarter. We successfully migrated the company onto the MediaAlpha platform and have been encouraged by the initial results as we have begun to leverage CHT’s social marketing capabilities for our Under 65 Health partners. While we have moderately reduced our outlook for CHT for the remainder of the year due to lowered revenue expectations for Medicare calls, we are as optimistic as ever about both the long-term growth potential in our Medicare vertical and the potential to extend CHT’s social media and call expertise beyond Medicare.
Despite the challenging environment, we continue to generate cash from operations and maintain our focus on expense discipline. During the second quarter, we decided to exit the education vertical and have reallocated related resources to our insurance verticals, where we see the largest long-term growth opportunity. For comparison purposes, in the third quarter of 2021 we generated $10.5 million of Transaction Value and $0.5 million of revenue from our education vertical.
Second quarter expenses were favorable to our outlook, as we benefited from lower professional fees and a slight decline in headcount, excluding the addition of the CHT team. We expect that third quarter headcount and operating expenses, excluding non-cash items, will be similar to second quarter levels.
Pivoting to capital deployment, we have nearly completed the $5 million share repurchase plan we announced in March. Under that plan, through yesterday we have spent $4.93 million and have repurchased approximately 450,000 shares at an average price of $10.97. Our ability to continue generating cash and opportunistically repurchasing shares in the midst of a challenging P&C market speaks to the resiliency of our financial model.
While our financial results have been negatively impacted by the challenges P&C insurers have faced over the past year, our unwavering focus on the success of our partners has positioned us for ongoing wallet share gains. In recent months, we have accelerated discussions with a number of P&C carrier partners who are actively considering new supply partner relationships with us, and we continue to deepen our partnerships across our 1,000+ partner ecosystem through enhanced conversion tracking and data passing integrations. Coming out of past P&C hard market cycles, digital customer acquisition spending growth has been extremely robust, with strong volume and pricing growth, and we expect to increase market share coming out of this cycle by working closely with our P&C partners to help them focus on profitable customer acquisition. In our Health vertical, we expect strong growth during AEP and OEP in the fourth quarter. The secular shift to online customer acquisition in the insurance industry is still at an early stage, and we look forward to growing alongside our partners in the years ahead.
|
|
|
| Financial Discussion - Transaction Value and Revenue Metrics |
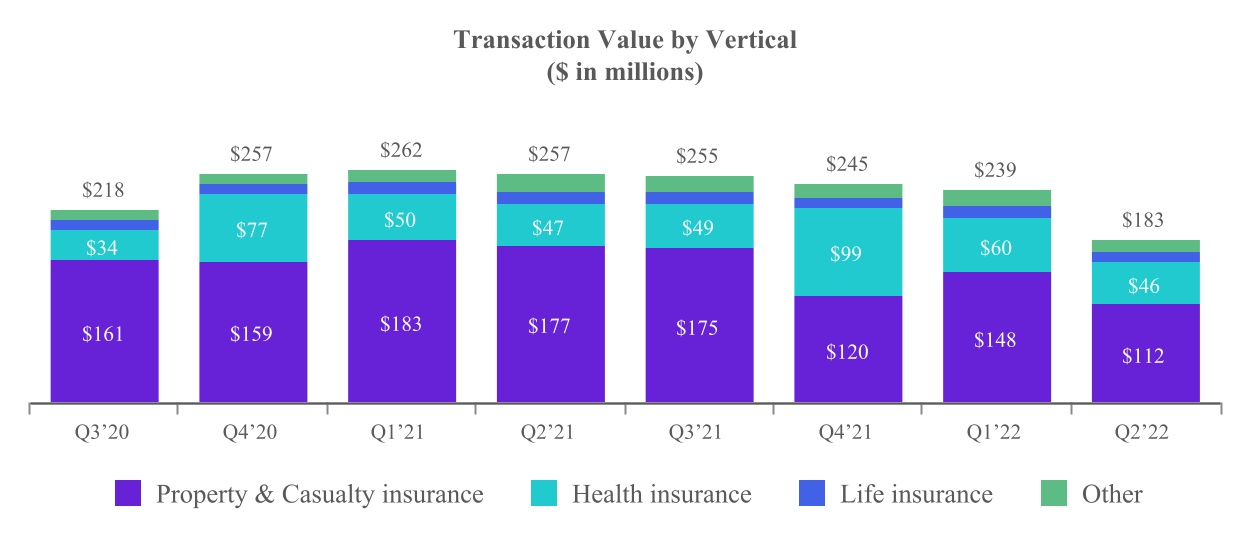
Transaction Value declined 29% year over year to $182.9 million, driven primarily by declines in the P&C vertical as carriers continue to limit their marketing investments due to underwriting profitability concerns. Transaction Value represents the total gross investment in customer acquisition executed by our partners on our platform and is one of the key metrics that reflects our ability to drive value for our partners and increase our share of wallet as budgets increasingly migrate online.
Transaction Value generated from our insurance verticals was $170.8 million in Q2 2022, down 28% year over year.
Transaction Value from our P&C insurance vertical declined 37% year over year to $111.9 million, driven by underwriting profitability concerns of carriers due to higher-than-expected loss severity caused by elevated vehicle repair and replacement costs and overall inflationary pressures. In response, many of our carrier partners have continued to significantly reduce their customer acquisition spending year over year to protect their profitability.
Transaction Value from our Health insurance vertical declined 2% year over year to $46.4 million, due to a tough comp from the prior year driven by an extended OEP and weak demand for Medicare leads and calls.
Transaction Value from our Life insurance vertical declined 11% year over year to $12.5 million, as mortality concerns related to COVID continued to ease and shopping activity decreased.
Transaction Value from our Other vertical, which includes travel, education, and consumer finance, declined 35% year over year to $12.1 million, driven by the wind down of our education vertical. Transaction Value decreased 47% year over year in the education vertical, which we expect to fully exit in Q3 2022. Additionally, our consumer finance vertical faced headwinds as mortgage and refinance activity declined due to rising interest rates, with Transaction Value down 50% year over year.
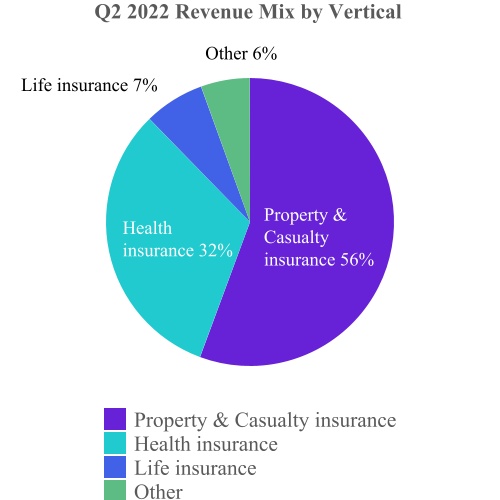
We generated $103.4 million of total revenue in the second quarter of 2022, down 34% year over year, driven by lower revenue from our P&C insurance vertical.
Revenue from our P&C insurance vertical declined 47% year over year to $57.6 million in Q2 2022, driven by lower marketing budgets from the largest carriers due to the aforementioned profitability concerns, as well as a higher mix of transactions via our Private Marketplaces. This was driven by higher-than-expected demand from our largest P&C demand partner, which utilizes our Private Marketplace option more extensively than average. While we recognize the full amount of Transaction Value from Open Marketplace transactions as revenue, in Private Marketplace transactions we recognize only our platform fee as revenue. As a result, the higher-than-expected mix of Private Marketplace transactions during the quarter resulted in our revenue being lower than expected.
Revenue from our Health insurance vertical declined 2% year over year to $33.2 million in Q2 2022, driven by reduced demand from carriers and brokers for under 65 Health and Medicare customers, due to the aforementioned tough comps and weakened demand for Medicare leads and calls.
Revenue from our Life insurance vertical declined 6% year over year to $7.0 million in Q2 2022, as mortality concerns related to COVID continued to ease and shopping activity decreased.
Revenue from our Other vertical, which consists of travel, education, and consumer finance, declined 17% year over year to $5.7 million in Q2 2022, driven by the aforementioned declines in our education and consumer finance verticals.
|
|
|
Financial Discussion - Profitability |
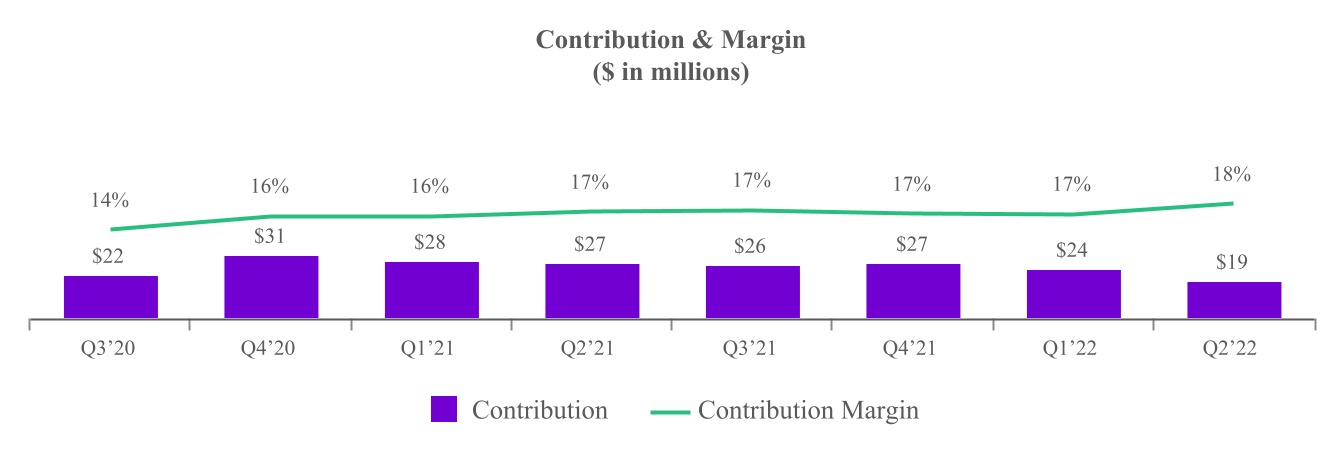
Gross profit was $15.5 million in Q2 2022, a year-over-year decline of 38%. Contribution, which generally represents revenue less revenue share payments and online advertising costs, was $18.8 million in Q2 2022, a year-over-year decrease of 30%. Contribution Margin was 18.1% in Q2 2022, compared with 16.9% in Q2 2021. The increase in margin was driven primarily by growth in Transaction Value from certain Supply and Demand Partners who transact via Private Marketplace deployments.
Net loss was $13.0 million in Q2 2022, compared with $0.4 million in Q2 2021, driven primarily by the $7.9 million year-over-year decrease in Contribution, year-over-year increases in non-cash equity-based compensation expense, and personnel expenses of $4.3 million and $1.9 million, respectively, which increases were offset in part by a $2.8 million gain on the remeasurement of contingent consideration.
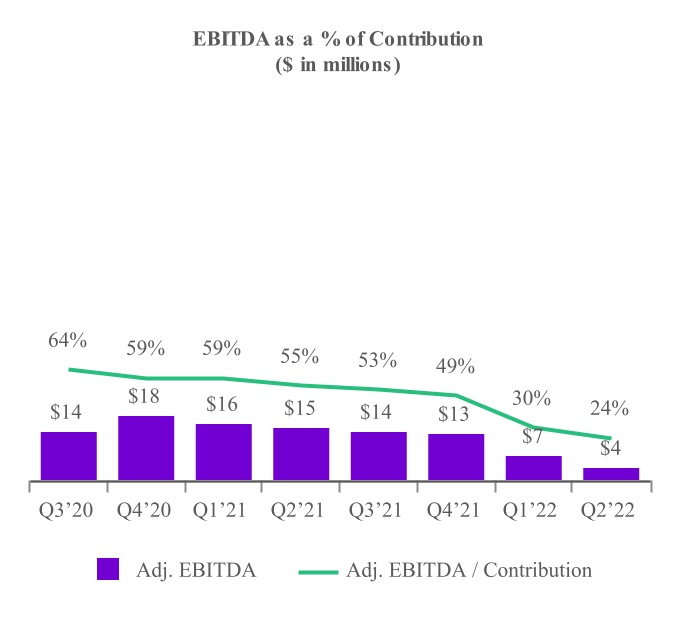
Adjusted EBITDA was $4.5 million in Q2 2022, a year-over-year decrease of 69%. Adjusted EBITDA margin was 4.3%, compared with 9.3% in Q2 2021. The decrease was due primarily to the the year-over-year decreases in revenue and Contribution as well as higher personnel related costs and higher accounting and professional fees.
Financial Discussion - Q3 2022 Outlook 1
Our guidance for Q3 2022 reflects a worsening year-over-year trend in customer acquisition spending by our P&C insurance carrier partners as we cross the first anniversary of the start of this hard market cycle. In our Health insurance vertical, we expect Transaction Value in Q3 to be similar to Q2.
|
|
|
|
|
|
|
|
|
|
|
|
|
|
|
|
|
Q3 2022 |
Transaction Value 2 |
|
$130 million |
- |
$145 million |
| Y/Y Growth |
|
(49)% |
|
(43)% |
|
|
|
|
|
|
|
|
|
|
| Revenue |
|
$77 million |
- |
$87 million |
| Y/Y Growth |
|
(50)% |
|
(43)% |
|
|
|
|
|
|
|
|
|
|
Adjusted EBITDA 2 |
|
$0.0 million |
- |
$1.5 million |
| Y/Y Growth |
|
n/m |
|
(89)% |
Transaction Value: For Q3 2022, we expect Transaction Value to be in the range of $130 million - $145 million, a year-over-year decrease of 46% at the midpoint. We expect Transaction Value in our P&C insurance vertical to decline sequentially due to continued carrier pullbacks in customer acquisition spending.
Revenue: For Q3 2022, we expect revenue to be in the range of $77 million - $87 million, a year-over-year decrease of 46% at the midpoint.
Adjusted EBITDA: For Q3 2022, we expect Adjusted EBITDA to be between breakeven and $1.5 million, a year-over-year decrease of 95% at the midpoint. We expect Adjusted EBITDA to decline year over year in Q3 2022 at a greater rate than Transaction Value, Revenue, and Contribution due to the increases in our headcount and operating expenses over the last year. We are projecting our headcount and operating expenses excluding non-cash items to be approximately equal to the Q2 2022 levels.
Thank you,
|
|
|
|
|
|
|
|
|
| Steve Yi |
|
Patrick Thompson |
| Chief Executive Officer, President and Co-Founder |
|
Chief Financial Officer & Treasurer |
1 With respect to the Company’s projection of Adjusted EBITDA under “Financial Discussion – Q3 2022 Outlook”, MediaAlpha is not providing a reconciliation of Adjusted EBITDA to net income (loss) because the Company is unable to predict with reasonable certainty the reconciling items that may affect net income (loss) without unreasonable effort, including equity-based compensation, transaction expenses and income tax expense. These reconciling items are uncertain, depend on various factors and could significantly impact, either individually or in the aggregate, the GAAP measures for the applicable period.
2 See “Key Business and Operating Metrics and Non-GAAP Financial Measures” for additional information regarding non-GAAP metrics used in this shareholder letter.
|
|
|
Key Business and Operating Metrics and Non-GAAP Financial Measures |
In addition to traditional financial metrics, we rely upon certain business and operating metrics that are not presented in accordance with GAAP to estimate the volume of spending on our platform, estimate and recognize revenue, evaluate our business performance and facilitate our operations. Such business and operating metrics should not be considered in isolation from, or as an alternative to, measures presented in accordance with GAAP and should be considered together with other operating and financial performance measures presented in accordance with GAAP. Also, such business and operating metrics may not necessarily be comparable to similarly titled measures presented by other companies.
Transaction Value
We define “Transaction Value” as the total gross dollars transacted by our partners on our platform. Transaction Value is a driver of revenue, with differing revenue recognition based on the economic relationship we have with our partners. Our partners use our platform to transact via Open and Private Marketplace transactions. In our Open Marketplace model, Transaction Value is equal to revenue recognized and revenue share payments to our supply partners represent costs of revenue. In our Private Marketplace model, revenue recognized represents a platform fee billed to the demand partner or supply partner based on an agreed-upon percentage of the Transaction Value for the Consumer Referrals transacted, and accordingly there are no associated costs of revenue. We utilize Transaction Value to assess revenue and to assess the overall level of transaction activity through our platform. We believe it is useful to investors to assess the overall level of activity on our platform and to better understand the sources of our revenue across our different transaction models and verticals.
The following table presents Transaction Value by platform model for the three months ended June 30, 2022 and 2021:
|
|
|
|
|
|
|
|
|
|
|
|
|
Three Months Ended June 30, |
| (in thousands) |
2022 |
|
2021 |
| Open Marketplace transactions |
$ |
99,633 |
|
|
$ |
152,522 |
|
| Percentage of total Transaction Value |
54.5 |
% |
|
59.5 |
% |
| Private Marketplace transactions |
83,237 |
|
|
104,005 |
|
| Percentage of total Transaction Value |
45.5 |
% |
|
40.5 |
% |
| Total Transaction Value |
$ |
182,870 |
|
|
$ |
256,527 |
|
The following table presents Transaction Value by platform model for the six months ended June 30, 2022 and 2021:
|
|
|
|
|
|
|
|
|
|
|
|
|
Six Months Ended June 30, |
| (in thousands) |
2022 |
|
2021 |
| Open Marketplace transactions |
$ |
237,729 |
|
|
$ |
321,870 |
|
| Percentage of total Transaction Value |
56.3 |
% |
|
62.0 |
% |
| Private Marketplace transactions |
184,154 |
|
|
197,119 |
|
| Percentage of total Transaction Value |
43.7 |
% |
|
38.0 |
% |
| Total Transaction Value |
$ |
421,883 |
|
|
$ |
518,989 |
|
The following table presents Transaction Value by vertical for the three months ended June 30, 2022 and 2021:
|
|
|
|
|
|
|
|
|
|
|
|
|
Three Months Ended June 30, |
| (in thousands) |
2022 |
|
2021 |
| Property & Casualty insurance |
$ |
111,930 |
|
|
$ |
176,646 |
|
| Percentage of total Transaction Value |
61.2 |
% |
|
68.9 |
% |
| Health insurance |
46,394 |
|
|
47,240 |
|
| Percentage of total Transaction Value |
25.4 |
% |
|
18.4 |
% |
| Life insurance |
12,467 |
|
|
13,933 |
|
| Percentage of total Transaction Value |
6.8 |
% |
|
5.4 |
% |
| Other |
12,079 |
|
|
18,708 |
|
| Percentage of total Transaction Value |
6.6 |
% |
|
7.3 |
% |
| Total Transaction Value |
$ |
182,870 |
|
|
$ |
256,527 |
|
The following table presents Transaction Value by vertical for the six months ended June 30, 2022 and 2021:
|
|
|
|
|
|
|
|
|
|
|
|
|
Six Months Ended June 30, |
| (in thousands) |
2022 |
|
2021 |
| Property & Casualty insurance |
$ |
260,014 |
|
|
$ |
360,073 |
|
| Percentage of total Transaction Value |
61.6 |
% |
|
69.4 |
% |
| Health insurance |
106,649 |
|
|
97,583 |
|
| Percentage of total Transaction Value |
25.3 |
% |
|
18.8 |
% |
| Life insurance |
24,858 |
|
|
28,374 |
|
| Percentage of total Transaction Value |
5.9 |
% |
|
5.5 |
% |
| Other |
30,362 |
|
|
32,959 |
|
| Percentage of total Transaction Value |
7.2 |
% |
|
6.4 |
% |
| Total Transaction Value |
$ |
421,883 |
|
|
$ |
518,989 |
|
Contribution and Contribution Margin
We define “Contribution” as revenue less revenue share payments and online advertising costs, or, as reported in our consolidated statements of operations, revenue less cost of revenue (i.e., gross profit), as adjusted to exclude the following items from cost of revenue: equity-based compensation; salaries, wages, and related costs; internet and hosting costs; amortization; depreciation; other services; and merchant-related fees. We define “Contribution Margin” as Contribution expressed as a percentage of revenue for the same period. Contribution and Contribution Margin are non-GAAP financial measures that we present to supplement the financial information we present on a GAAP basis. We use Contribution and Contribution Margin to measure the return on our relationships with our supply partners (excluding certain fixed costs), the financial return on and efficacy of our online advertising costs to drive consumers to our proprietary websites, and our operating leverage. We do not use Contribution and Contribution Margin as measures of overall profitability. We present Contribution and Contribution Margin because they are used by our management and board of directors to manage our operating performance, including evaluating our operational performance against budget and assessing our overall operating efficiency and operating leverage. For example, if Contribution increases and our headcount costs and other operating expenses remain steady, our Adjusted EBITDA and operating leverage increase. If Contribution Margin decreases, we may choose to re-evaluate and re-negotiate our revenue share agreements with our supply partners, to make optimization and pricing changes with respect to our bids for keywords from primary traffic acquisition sources, or to change our overall cost structure with respect to headcount, fixed costs and other costs. Other companies may calculate Contribution and Contribution Margin differently than we do. Contribution and Contribution Margin have their limitations as analytical tools, and you should not consider them in isolation or as substitutes for analysis of our results presented in accordance with GAAP.
The following table reconciles Contribution with gross profit, the most directly comparable financial measure calculated and presented in accordance with GAAP, for the three months ended June 30, 2022 and 2021:
|
|
|
|
|
|
|
|
|
|
|
|
|
Three Months Ended June 30, |
| (in thousands) |
2022 |
|
2021 |
| Revenue |
$ |
103,449 |
|
|
$ |
157,353 |
|
| Less cost of revenue |
(87,925) |
|
|
(132,305) |
|
| Gross profit |
$ |
15,524 |
|
|
$ |
25,048 |
|
| Adjusted to exclude the following (as related to cost of revenue): |
|
|
|
| Equity-based compensation |
1,240 |
|
|
442 |
|
| Salaries, wages, and related |
1,034 |
|
|
558 |
|
| Internet and hosting |
119 |
|
|
108 |
|
| Other expenses |
215 |
|
|
112 |
|
| Depreciation |
12 |
|
|
8 |
|
| Other services |
576 |
|
|
256 |
|
| Merchant-related fees |
44 |
|
|
139 |
|
| Contribution |
$ |
18,764 |
|
|
$ |
26,671 |
|
| Gross margin |
15.0 |
% |
|
15.9 |
% |
| Contribution Margin |
18.1 |
% |
|
16.9 |
% |
The following table reconciles Contribution with gross profit, the most directly comparable financial measure calculated and presented in accordance with GAAP, for the six months ended June 30, 2022 and 2021:
|
|
|
|
|
|
|
|
|
|
|
|
|
Six Months Ended June 30, |
| (in thousands) |
2022 |
|
2021 |
| Revenue |
$ |
246,048 |
|
|
$ |
330,941 |
|
| Less cost of revenue |
(208,806) |
|
|
(279,485) |
|
| Gross profit |
$ |
37,242 |
|
|
$ |
51,456 |
|
| Adjusted to exclude the following (as related to cost of revenue): |
|
|
|
| Equity-based compensation |
1,638 |
|
|
842 |
|
| Salaries, wages, and related |
1,690 |
|
|
1,022 |
|
| Internet and hosting |
223 |
|
|
210 |
|
| Other expenses |
342 |
|
|
219 |
|
| Depreciation |
18 |
|
|
15 |
|
| Other services |
1,106 |
|
|
547 |
|
| Merchant-related fees |
59 |
|
|
230 |
|
| Contribution |
$ |
42,318 |
|
|
$ |
54,541 |
|
| Gross margin |
15.1 |
% |
|
15.5 |
% |
| Contribution Margin |
17.2 |
% |
|
16.5 |
% |
Consumer Referrals
We define “Consumer Referral” as any consumer click, call or lead purchased by a buyer on our platform. Click revenue is recognized on a pay-per-click basis and revenue is earned and recognized when a consumer clicks on a listed buyer’s advertisement that is presented subsequent to the consumer’s search (e.g., auto insurance quote search or health insurance quote search). Call revenue is earned and recognized when a consumer transfers to a buyer and remains engaged for a requisite duration of time, as specified by each buyer. Lead revenue is recognized when we deliver data leads to buyers. Data leads are generated either through insurance carriers, insurance-focused research destination websites or other financial websites that make the data leads available for purchase through our platform, or when consumers complete a full quote request on our proprietary websites. Delivery occurs at the time of lead transfer. The data we generate from each Consumer Referral feeds into our analytics model to generate conversion probabilities for each unique consumer, enabling discovery of predicted return and cost per sale across the platform and helping us to improve our platform technology. We monitor the number of Consumer Referrals on our platform in order to measure Transaction Value, revenue and overall business performance across our verticals and platform models. For the three and six months ended June 30, 2022, Transaction Value generated from clicks, calls and leads was 79.1%, 12.0% and 8.9%, and 78.3%, 11.8%, and 9.9%, respectively. For the three and six months ended June 30, 2021, Transaction Value generated from clicks, calls and leads was 81.5%, 7.4% and 11.1% and 82.1%, 7.3% and 10.6%, respectively.
Adjusted EBITDA
We define “Adjusted EBITDA” as net income excluding interest expense, income tax benefit (expense), depreciation expense on property and equipment, amortization of intangible assets, as well as equity-based compensation expense and certain other adjustments as listed in the table below. We define “Adjusted EBITDA Margin” as Adjusted EBITDA as a percentage of revenue. Adjusted EBITDA is a non-GAAP financial measure that we present to supplement the financial information we present on a GAAP basis. We monitor and present Adjusted EBITDA because it is a key measure used by our management to understand and evaluate our operating performance, to establish budgets and to develop operational goals for managing our business. We believe that Adjusted EBITDA helps identify underlying trends in our business that could otherwise be masked by the effect of the expenses that we exclude in the calculations of Adjusted EBITDA. Accordingly, we believe that Adjusted EBITDA provides useful information to investors and others in understanding and evaluating our operating results, enhancing the overall understanding of our past performance and future prospects. In addition, presenting Adjusted EBITDA provides investors with a metric to evaluate the capital efficiency of our business.
Adjusted EBITDA is not presented in accordance with GAAP and should not be considered in isolation of, or as an alternative to, measures presented in accordance with GAAP. There are a number of limitations related to the use of Adjusted EBITDA rather than net income, which is the most directly comparable financial measure calculated and presented in accordance with GAAP. These limitations include the fact that Adjusted EBITDA excludes interest expense on debt, income tax benefit (expense), equity-based compensation expense, depreciation and amortization, and certain other adjustments that we consider useful information to investors and others in understanding and evaluating our operating results. In addition, other companies may use other measures to evaluate their performance, including different definitions of “Adjusted EBITDA,” which could reduce the usefulness of our Adjusted EBITDA as a tool for comparison.
The following table reconciles Adjusted EBITDA with net (loss) income, the most directly comparable financial measure calculated and presented in accordance with GAAP, for the three months ended June 30, 2022 and 2021.
|
|
|
|
|
|
|
|
|
|
|
|
|
Three Months Ended June 30, |
| (in thousands) |
2022 |
|
2021 |
| Net (loss) |
$ |
(13,022) |
|
|
$ |
(384) |
|
| Equity-based compensation expense |
15,843 |
|
|
11,521 |
|
| Interest expense |
1,956 |
|
|
2,237 |
|
| Income tax expense (benefit) |
611 |
|
|
(125) |
|
| Depreciation expense on property and equipment |
99 |
|
|
91 |
|
| Amortization of intangible assets |
1,677 |
|
|
746 |
|
| Transaction expenses(1) |
150 |
|
|
66 |
|
| Employee-related costs(2) |
— |
|
|
99 |
|
| SOX implementation costs(3) |
— |
|
|
297 |
|
| Fair value adjustment to contingent consideration(4) |
(2,845) |
|
|
— |
|
| Changes in TRA related liability(5) |
40 |
|
|
— |
|
| Changes in Tax Indemnification Receivable(6) |
(15) |
|
|
147 |
|
| Settlement of federal and state income tax refunds(7) |
4 |
|
|
— |
|
| Adjusted EBITDA |
$ |
4,498 |
|
|
$ |
14,695 |
|
The following table reconciles Adjusted EBITDA with net (loss) income, the most directly comparable financial measure calculated and presented in accordance with GAAP, for the six months ended June 30, 2022 and 2021.
|
|
|
|
|
|
|
|
|
|
|
|
|
Six Months Ended June 30, |
| (in thousands) |
2022 |
|
2021 |
| Net (loss) |
$ |
(22,870) |
|
|
$ |
(223) |
|
| Equity-based compensation expense |
29,616 |
|
|
22,123 |
|
| Interest expense |
3,315 |
|
|
4,538 |
|
| Income tax expense (benefit) |
1,754 |
|
|
(489) |
|
| Depreciation expense on property and equipment |
197 |
|
|
173 |
|
| Amortization of intangible assets |
2,360 |
|
|
1,492 |
|
| Transaction expenses(1) |
530 |
|
|
2,731 |
|
| Employee-related costs(2) |
— |
|
|
349 |
|
| SOX implementation costs(3) |
110 |
|
|
449 |
|
| Fair value adjustment to contingent consideration(4) |
(2,845) |
|
|
— |
|
| Changes in TRA related liability(5) |
(590) |
|
|
(156) |
|
| Changes in Tax Indemnification Receivable(6) |
(29) |
|
|
147 |
|
| Settlement of federal and state income tax refunds(7) |
92 |
|
|
— |
|
| Adjusted EBITDA |
$ |
11,640 |
|
|
$ |
31,134 |
|
(1)Transaction expenses consist of $0.2 million and $0.5 million of legal, accounting and other consulting fees incurred by us for the three and six months ended June 30, 2022, respectively, in connection with the acquisition of CHT. For the three and six months ended June 30, 2021, transaction expenses consist of $0.1 million and $2.7 million for legal, accounting, and other consulting fees in connection with the Secondary Offering, respectively.
(2)Employee-related costs include $0.1 million and $0.3 million of expenses incurred by us for the three and six months ended June 30, 2021, respectively, for amounts payable to recruiting firms in connection with the hiring of certain executive officers to support our operation as a publicly-reporting company.
(3)SOX implementation costs consist of $0.1 million of expenses incurred by us for the six months ended June 30, 2022, and $0.3 million and $0.4 million of expenses for the three and six months ended June 30, 2021, respectively, for third-party consultants to assist us with the development, implementation, and documentation of new and enhanced internal controls and processes for compliance with SOX Section 404(b) for 2021.
(4)Fair value adjustment to contingent consideration consists of $2.8 million of gain for the three and six months ended June 30, 2022, in connection with the remeasurement of the contingent consideration for the acquisition of CHT as of June 30, 2022.
(5)Changes in TRA related liability consist of immaterial expenses for the three months ended June 30, 2022, and $0.6 million and $0.2 million of income for the six months ended June 30, 2022 and 2021, respectively, due to a change in the estimated future state tax benefits and other changes in the estimate resulting in reductions of the TRA liability.
(6)Changes in Tax Indemnification Receivable consists of immaterial income incurred by us for the three and six months ended June 30, 2022, and $0.1 million of expenses incurred by us for the three and six months ended June 30, 2021, related to a reduction in the tax indemnification receivable recorded in connection with the Reorganization Transactions. The reduction also resulted in a benefit of the same amount which has been recorded within income tax (benefit).
(7)Settlement of federal and state tax refunds consist of immaterial expenses and $0.1 million of expense incurred by us for the three and six months ended June 30, 2022, respectively, related to reimbursement to White Mountains for state tax refunds for the period prior to the Reorganization Transaction related to 2020 tax returns. The settlement also resulted in a benefit of the same amount which has been recorded within income tax expense (benefit).
Forward-Looking Statements
This shareholder letter contains forward-looking statements within the meaning of the Private Securities Litigation Reform Act of 1995, including without limitation statements regarding our expectation that the insurance industry’s secular shift to more direct, digital customer acquisition activity will continue; our expectation that a resumption of customer acquisition spending by carriers is inevitable and will lead to a steep and significant recovery in our P&C vertical; our expectation of a strong OEP for the Affordable Care Act (ACA) in the fourth quarter of 2022; our belief in the long-term growth potential in our Medicare vertical as well as the potential to extend CHT’s social media and call expertise beyond Medicare; our expectation that we will gain market share coming out of the current hard market cycle, and will achieve strong year-over-year growth in our Health vertical in the fourth quarter of 2022; and our financial outlook for the third quarter of 2022. These forward-looking statements reflect our current views with respect to, among other things, future events and our financial performance. These statements are often, but not always, made through the use of words or phrases such as “may,” “should,” “could,” “predict,” “potential,” “believe,” “will likely result,” “expect,” “continue,” “will,” “anticipate,” “seek,” “estimate,” “intend,” “plan,” “projection,” “would,” and “outlook,” or the negative version of those words or other comparable words or phrases of a future or forward-looking nature. These forward-looking statements are not historical facts, and are based on current expectations, estimates and projections about our industry, management’s beliefs and certain assumptions made by management, many of which, by their nature, are inherently uncertain and beyond our control. Accordingly, we caution you that any such forward-looking statements are not guarantees of future performance and are subject to risks, assumptions and uncertainties that are difficult to predict. Although we believe that the expectations reflected in these forward-looking statements are reasonable as of the date made, actual results may prove to be materially different from the results expressed or implied by the forward-looking statements.
There are or will be important factors that could cause our actual results to differ materially from those indicated in these forward-looking statements, including those more fully described in MediaAlpha’s filings with the Securities and Exchange Commission (“SEC”), including the Form 10-K filed on February 28, 2022. These factors should not be construed as exhaustive. MediaAlpha disclaims any obligation to update any forward-looking statements to reflect events or circumstances that occur after the date of this shareholder letter.