| Delaware | 001-41406 | 47-2409192 | ||||||
| (State or other jurisdiction | (Commission | (IRS Employer | ||||||
| of incorporation) | File Number) | Identification No.) | ||||||
| ☐ | Written communication pursuant to Rule 425 under the Securities Act (17 CFR 230.425) | ||||
| ☐ | Soliciting material pursuant to Rule 14a-12 under the Exchange Act (17 CFR 240.14a-12) | ||||
| ☐ | Pre-commencement communications pursuant to Rule 14d-2(b) under the Exchange Act (17 CFR 240.14d-2(b)) |
||||
| ☐ | Pre-commencement communications pursuant to Rule 13e-4(c) under the Exchange Act (17 CFR 240.13e-4(c)) |
||||
| Title of each class | Trading Symbol(s) | Name of each exchange on which registered | ||||||
| Common Stock, par value $0.01 per share | EHAB | New York Stock Exchange | ||||||
Exhibit Number |
Description | |||||||
| 104 | Cover Page Interactive Data File - the cover page iXBRL tags are embedded within the Inline XBRL document | |||||||
| ENHABIT, INC. | ||||||||
| By: | /s/ Dylan C. Black | |||||||
| Name: | Dylan C. Black | |||||||
| Title: | General Counsel | |||||||

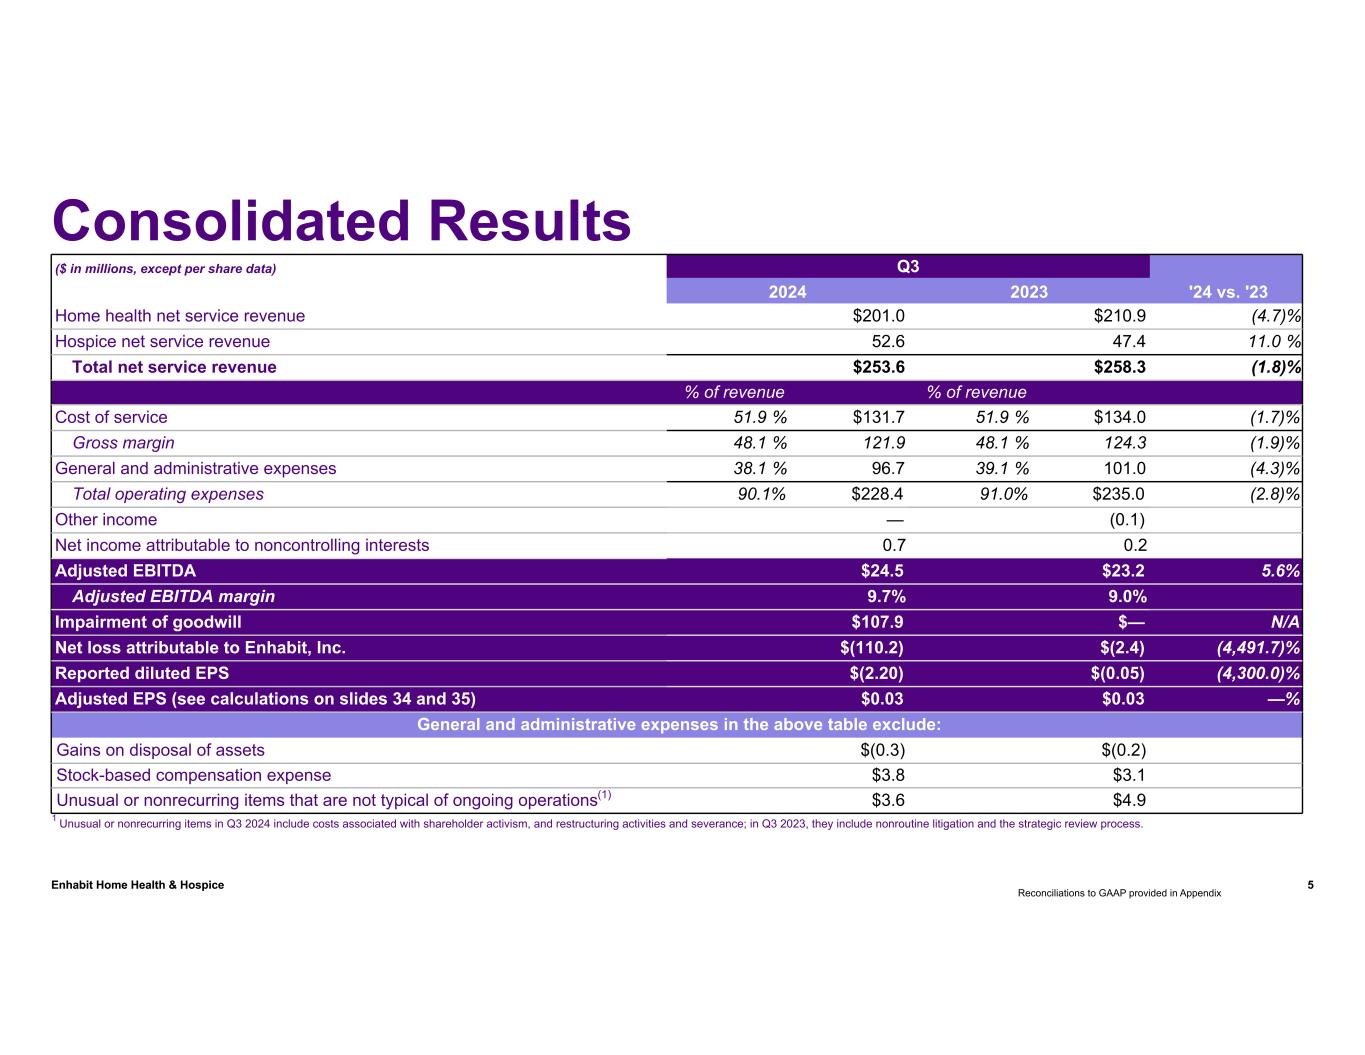
| ($ in millions, except per share data) | Q3 | '24 vs. '23 | ||||||||||||||||||
| 2024 | 2023 | |||||||||||||||||||
| Home health net service revenue | $ | 201.0 | $ | 210.9 | (4.7)% | |||||||||||||||
| Hospice net service revenue | 52.6 | 47.4 | 11.0% | |||||||||||||||||
| Total net service revenue | $ | 253.6 | $ | 258.3 | (1.8)% | |||||||||||||||
| % of revenue | % of revenue | |||||||||||||||||||
| Cost of service | 51.9% | $ | 131.7 | 51.9% | $ | 134.0 | (1.7)% | |||||||||||||
| Gross margin | 48.1% | 121.9 | 48.1% | 124.3 | (1.9)% | |||||||||||||||
| General and administrative expenses | 38.1% | 96.7 | 39.1% | 101.0 | (4.3)% | |||||||||||||||
| Total operating expenses | 90.1% | $ | 228.4 | 91.0% | $ | 235.0 | (2.8)% | |||||||||||||
| Other income | — | (0.1) | ||||||||||||||||||
| Net income attributable to noncontrolling interests | 0.7 | 0.2 | ||||||||||||||||||
| Adjusted EBITDA | $ | 24.5 | $ | 23.2 | 5.6% | |||||||||||||||
| Adjusted EBITDA margin | 9.7% | 9.0% | ||||||||||||||||||
| Impairment of goodwill | $ | 107.9 | $ | — | N/A | |||||||||||||||
| Net loss attributable to Enhabit, Inc. | $ | (110.2) | $ | (2.4) | (4,491.7)% | |||||||||||||||
| Reported diluted EPS | $ | (2.20) | $ | (0.05) | (4,300.0)% | |||||||||||||||
Adjusted EPS |
$ | 0.03 | $ | 0.03 | —% | |||||||||||||||
| ($ in millions) | Q3 | '24 vs. '23 | ||||||||||||
| 2024 | 2023 | |||||||||||||
| Net service revenue: | ||||||||||||||
| Medicare | $ | 117.3 | $ | 141.0 | (16.8)% | |||||||||
| Non-Medicare | 81.5 | 67.4 | 20.9% | |||||||||||
Private duty(1) |
2.2 | 2.5 | (12.0)% | |||||||||||
| Home health net service revenue | 201.0 | 210.9 | (4.7)% | |||||||||||
| Cost of service | 105.9 | 110.0 | (3.7)% | |||||||||||
| Gross margin | 47.3% | 47.8% | ||||||||||||
| General and administrative expenses | 58.2 | 59.0 | (1.4)% | |||||||||||
| Other income | — | (0.1) | (100.0)% | |||||||||||
| Net income attributable to noncontrolling interests | 0.4 | 0.2 | 100.0% | |||||||||||
| Adjusted EBITDA | $ | 36.5 | $ | 41.8 | (12.7)% | |||||||||
| % Adj. EBITDA margin | 18.2% | 19.8% | ||||||||||||
Operational metrics (actual amounts) |
||||||||||||||
| Medicare: | ||||||||||||||
| Admissions | 23,422 | 25,585 | (8.5)% | |||||||||||
| Recertifications | 16,101 | 19,321 | (16.7)% | |||||||||||
| Completed episodes | 38,866 | 44,350 | (12.4)% | |||||||||||
| Visits | 561,525 | 660,380 | (15.0)% | |||||||||||
| Visits per episode | 14.4 | 14.9 | (3.4)% | |||||||||||
| Revenue per episode | $ | 3,018 | $ | 3,179 | (5.1)% | |||||||||
| Non-Medicare: | ||||||||||||||
| Admissions | 29,950 | 24,938 | 20.1% | |||||||||||
| Recertifications | 14,112 | 13,411 | 5.2% | |||||||||||
| Visits | 552,815 | 501,764 | 10.2% | |||||||||||
| Total: | ||||||||||||||
| Admissions | 53,372 | 50,523 | 5.6% | |||||||||||
Same-store total admissions growth |
5.5% | |||||||||||||
| Recertifications | 30,213 | 32,732 | (7.7)% | |||||||||||
Same-store total recertifications growth |
(7.8)% | |||||||||||||
| Visits | 1,114,340 | 1,162,144 | (4.1)% | |||||||||||
| Visits per episode | 14.1 | 14.9 | (5.4)% | |||||||||||
| Cost per visit | $ | 94 | $ | 93 | 1.1% | |||||||||
(1) Private duty represents long-term comprehensive hourly nursing medical care. | ||||||||||||||
| ($ in millions) | Q3 | '24 vs. '23 | ||||||||||||
| 2024 | 2023 | |||||||||||||
| Net service revenue | $ | 52.6 | $ | 47.4 | 11.0% | |||||||||
| Cost of service | 25.8 | 24.0 | 7.5% | |||||||||||
| Gross margin | 51.0% | 49.4% | ||||||||||||
| General and administrative expenses | 16.5 | 15.7 | 5.1% | |||||||||||
| Net income attributable to noncontrolling interests | 0.3 | — | N/A | |||||||||||
| Adjusted EBITDA | $ | 10.0 | $ | 7.7 | 29.9% | |||||||||
| % Adj. EBITDA margin | 19.0% | 16.2% | ||||||||||||
Operational metrics (actual amounts) |
||||||||||||||
| Total admissions | 3,046 | 2,882 | 5.7% | |||||||||||
| Same-store total admissions growth | 4.1% | |||||||||||||
| Patient days | 333,247 | 311,719 | 6.9% | |||||||||||
| Discharged average length of stay | 100 | 107 | (6.5)% | |||||||||||
| Average daily census | 3,622 | 3,388 | 6.9% | |||||||||||
| Revenue per patient day | $ | 158 | $ | 152 | 3.9% | |||||||||
| Cost per patient day | $ | 77 | $ | 77 | —% | |||||||||
($ in millions, except per share data) |
2024 Previous Guidance | 2024 Updated Guidance | ||||||
Net service revenue |
$1,050 to $1,063 | $1,031 to $1,046 | ||||||
Adjusted EBITDA |
$100 to $106 | $98 to $102 | ||||||
Adjusted EPS |
$0.19 to $0.37 | $0.19 to $0.29 | ||||||
| Three Months Ended September 30, | Nine Months Ended September 30, | ||||||||||||||||||||||
| 2024 | 2023 | 2024 | 2023 | ||||||||||||||||||||
| ($ in millions, except per share data) | |||||||||||||||||||||||
| Net service revenue | $ | 253.6 | $ | 258.3 | $ | 776.6 | $ | 785.7 | |||||||||||||||
| Cost of service, excluding depreciation and amortization | 131.7 | 134.0 | 397.7 | 402.1 | |||||||||||||||||||
| General and administrative expenses | 103.8 | 108.8 | 321.3 | 327.1 | |||||||||||||||||||
| Depreciation and amortization | 8.2 | 7.7 | 23.6 | 23.2 | |||||||||||||||||||
| Impairment of goodwill | 107.9 | — | 107.9 | 85.8 | |||||||||||||||||||
| Operating (loss) income | (98.0) | 7.8 | (73.9) | (52.5) | |||||||||||||||||||
| Interest expense and amortization of debt discounts and fees | 10.8 | 10.9 | 32.8 | 30.7 | |||||||||||||||||||
| Other income | — | (0.1) | — | (0.2) | |||||||||||||||||||
| Loss before income taxes and noncontrolling interests | (108.8) | (3.0) | (106.7) | (83.0) | |||||||||||||||||||
| Income tax (benefit) expense | 0.7 | (0.8) | 1.5 | (9.9) | |||||||||||||||||||
| Net loss | (109.5) | (2.2) | (108.2) | (73.1) | |||||||||||||||||||
| Less: Net income attributable to noncontrolling interests | 0.7 | 0.2 | 2.0 | 1.0 | |||||||||||||||||||
| Net loss attributable to Enhabit, Inc. | $ | (110.2) | $ | (2.4) | $ | (110.2) | $ | (74.1) | |||||||||||||||
| Weighted average common shares outstanding: | |||||||||||||||||||||||
| Basic | 50.2 | 49.9 | 50.2 | 49.8 | |||||||||||||||||||
| Diluted | 50.2 | 49.9 | 50.2 | 49.8 | |||||||||||||||||||
| Loss per common share: | |||||||||||||||||||||||
| Basic loss per share attributable to Enhabit, Inc. common stockholders | $ | (2.20) | $ | (0.05) | $ | (2.20) | $ | (1.48) | |||||||||||||||
| Diluted loss per share attributable to Enhabit, Inc. common stockholders | $ | (2.20) | $ | (0.05) | $ | (2.20) | $ | (1.48) | |||||||||||||||
| September 30, 2024 |
December 31, 2023 |
||||||||||
| ($ in millions) | |||||||||||
| Assets | |||||||||||
| Current assets: | |||||||||||
| Cash and cash equivalents | $ | 45.7 | $ | 27.4 | |||||||
| Restricted cash | 1.7 | 2.4 | |||||||||
| Accounts receivable, net of allowances | 150.9 | 164.7 | |||||||||
| Prepaid expenses and other current assets | 9.9 | 15.6 | |||||||||
| Total current assets | 208.2 | 210.1 | |||||||||
| Property and equipment, net | 19.4 | 19.0 | |||||||||
| Operating lease right-of-use assets | 54.3 | 57.5 | |||||||||
| Goodwill | 953.8 | 1,061.7 | |||||||||
| Intangible assets, net | 63.9 | 80.0 | |||||||||
| Other long-term assets | 4.7 | 5.3 | |||||||||
| Total assets | $ | 1,304.3 | $ | 1,433.6 | |||||||
| Liabilities and stockholders’ equity | |||||||||||
| Current liabilities: | |||||||||||
| Current portion of long-term debt | $ | 23.0 | $ | 22.5 | |||||||
| Current operating lease liabilities | 11.7 | 11.8 | |||||||||
| Accounts payable | 9.9 | 7.6 | |||||||||
| Accrued payroll | 47.1 | 38.5 | |||||||||
| Refunds due patients and other third-party payors | 4.1 | 8.2 | |||||||||
| Accrued medical insurance | 8.5 | 8.4 | |||||||||
| Other current liabilities | 38.6 | 40.7 | |||||||||
| Total current liabilities | 142.9 | 137.7 | |||||||||
| Long-term debt, net of current portion | 502.9 | 530.1 | |||||||||
| Long-term operating lease liabilities, net of current portion | 43.4 | 45.7 | |||||||||
| Deferred income tax liabilities | 17.1 | 17.1 | |||||||||
| Other long-term liabilities | 0.1 | 1.3 | |||||||||
| Total liabilities | 706.4 | 731.9 | |||||||||
| Redeemable noncontrolling interests | 5.0 | 5.0 | |||||||||
| Stockholders’ equity: | |||||||||||
| Total Enhabit, Inc. stockholders’ equity | 566.1 | 669.7 | |||||||||
| Noncontrolling interests | 26.8 | 27.0 | |||||||||
| Total stockholders’ equity | 592.9 | 696.7 | |||||||||
| Total liabilities and stockholders’ equity | $ | 1,304.3 | $ | 1,433.6 | |||||||
| Nine Months Ended September 30, | |||||||||||
| 2024 | 2023 | ||||||||||
| ($ in millions) | |||||||||||
| Cash flows from operating activities: | |||||||||||
| Net loss | $ | (108.2) | $ | (73.1) | |||||||
| Adjustments to reconcile net loss to net cash provided by operating activities— | |||||||||||
| Depreciation and amortization | 23.6 | 23.2 | |||||||||
| Amortization of debt related costs | 1.1 | 1.0 | |||||||||
| Impairment of goodwill | 107.9 | 85.8 | |||||||||
| Stock-based compensation | 7.8 | 7.2 | |||||||||
Deferred income taxes |
0.1 | (13.1) | |||||||||
Other |
(0.7) | 0.7 | |||||||||
| Changes in assets and liabilities, net of acquisitions— | |||||||||||
| Accounts receivable, net of allowances | 13.8 | (17.8) | |||||||||
| Prepaid expenses and other assets | 5.9 | 19.9 | |||||||||
| Accounts payable | 2.3 | 2.2 | |||||||||
| Accrued payroll | 8.6 | 13.1 | |||||||||
| Other liabilities | (6.9) | (3.6) | |||||||||
| Net cash provided by operating activities | 55.3 | 45.5 | |||||||||
| Cash flows from investing activities: | |||||||||||
| Acquisition of businesses, net of cash acquired | — | (2.8) | |||||||||
| Purchases of property and equipment, including capitalized software costs | (3.2) | (3.6) | |||||||||
| Other | 1.1 | 0.6 | |||||||||
| Net cash used in investing activities | (2.1) | (5.8) | |||||||||
| Cash flows from financing activities: | |||||||||||
| Principal payments on term loan facility | (15.0) | (15.0) | |||||||||
| Principal payments on revolving credit facility | (15.0) | (10.0) | |||||||||
| Principal payments under finance lease obligations | — | — | |||||||||
| Debt issuance costs | — | (1.1) | |||||||||
| Distributions paid to noncontrolling interests of consolidated affiliates | (2.2) | (2.5) | |||||||||
| Other | (3.4) | (3.1) | |||||||||
| Net cash used in financing activities | (35.6) | (31.7) | |||||||||
| Increase in cash, cash equivalents, and restricted cash | 17.6 | 8.0 | |||||||||
| Cash, cash equivalents, and restricted cash at beginning of period | 29.8 | 27.2 | |||||||||
| Cash, cash equivalents, and restricted cash at end of period | $ | 47.4 | $ | 35.2 | |||||||
| Reconciliation of Diluted Earnings Per Share to Adjusted Earnings Per Share | |||||||||||||||||||||||
| Three Months Ended September 30, | Nine Months Ended September 30, |
||||||||||||||||||||||
| 2024 | 2023 | 2024 | 2023 | ||||||||||||||||||||
| Diluted earnings per share, as reported | $ | (2.20) | $ | (0.05) | $ | (2.20) | $ | (1.48) | |||||||||||||||
| Adjustments, net of tax: | |||||||||||||||||||||||
| Impairment of goodwill | 1.93 | — | 1.93 | 1.50 | |||||||||||||||||||
Unusual or nonrecurring items that are not typical of ongoing operations(1) |
0.05 | 0.07 | 0.18 | 0.14 | |||||||||||||||||||
Income tax adjustments(2) |
0.24 | — | 0.25 | 0.01 | |||||||||||||||||||
| Adjusted earnings per share | $ | 0.03 | $ | 0.03 | $ | 0.17 | $ | 0.16 | |||||||||||||||
| Reconciliation of Adjusted EBITDA to Adjusted Earnings Per Share | |||||||||||||||||||||||||||||
| Three Months Ended September 30, | |||||||||||||||||||||||||||||
| 2024 | |||||||||||||||||||||||||||||
| Adjustments | |||||||||||||||||||||||||||||
| As Reported | Impairment of Goodwill | Unusual or Nonrecurring Items That are Not Typical of Ongoing Operations | Income tax Adjustments(3) |
As Adjusted | |||||||||||||||||||||||||
| ($ in millions, except per share data) | |||||||||||||||||||||||||||||
Adjusted EBITDA(1) |
$ | 24.5 | $ | — | $ | — | $ | — | $ | 24.5 | |||||||||||||||||||
| Interest expense and amortization of debt discounts and fees | (10.8) | — | — | — | (10.8) | ||||||||||||||||||||||||
| Depreciation and amortization | (8.2) | — | — | — | (8.2) | ||||||||||||||||||||||||
| Gain on disposal of assets | 0.3 | — | — | — | 0.3 | ||||||||||||||||||||||||
| Impairment of goodwill | (107.9) | 107.9 | — | — | — | ||||||||||||||||||||||||
| Stock-based compensation | (3.8) | — | — | — | (3.8) | ||||||||||||||||||||||||
Unusual or nonrecurring items that are not typical of ongoing operations(2) |
(3.6) | — | 3.6 | — | — | ||||||||||||||||||||||||
| (Loss) income before income taxes | (109.5) | 107.9 | 3.6 | — | 2.0 | ||||||||||||||||||||||||
| Income tax benefit (expense) | (0.7) | (11.0) | (1.0) | 12.2 | (0.5) | ||||||||||||||||||||||||
| Net (loss) income attributable to Enhabit, Inc. | $ | (110.2) | $ | 96.9 | $ | 2.6 | $ | 12.2 | $ | 1.5 | |||||||||||||||||||
Diluted EPS |
$ | (2.20) | $ | 1.93 | $ | 0.05 | $ | 0.24 | $ | 0.03 | |||||||||||||||||||
| Diluted shares | 50.2 | 50.8 | |||||||||||||||||||||||||||
| Reconciliation of Adjusted EBITDA to Adjusted Earnings Per Share | |||||||||||||||||||||||||||||
| Three Months Ended September 30, | |||||||||||||||||||||||||||||
| 2023 | |||||||||||||||||||||||||||||
| Adjustments | |||||||||||||||||||||||||||||
| As Reported | Impairment of Goodwill | Unusual or Nonrecurring Items That are Not Typical of Ongoing Operations | Income Tax Adjustments(3) |
As Adjusted | |||||||||||||||||||||||||
| ($ in millions, except per share data) | |||||||||||||||||||||||||||||
Adjusted EBITDA(1) |
$ | 23.2 | $ | — | $ | — | $ | — | $ | 23.2 | |||||||||||||||||||
| Interest expense and amortization of debt discounts and fees | (10.9) | — | — | — | (10.9) | ||||||||||||||||||||||||
| Depreciation and amortization | (7.7) | — | — | — | (7.7) | ||||||||||||||||||||||||
| Gain on disposal of assets | 0.2 | — | — | — | 0.2 | ||||||||||||||||||||||||
| Stock-based compensation | (3.1) | — | — | — | (3.1) | ||||||||||||||||||||||||
Unusual or nonrecurring items that are not typical of ongoing operations(2) |
(4.9) | — | 4.9 | — | — | ||||||||||||||||||||||||
| (Loss) income before income taxes | (3.2) | — | 4.9 | — | 1.7 | ||||||||||||||||||||||||
| Income tax benefit (expense) | 0.8 | — | (1.3) | 0.1 | (0.4) | ||||||||||||||||||||||||
| Net (loss) income attributable to Enhabit, Inc. | $ | (2.4) | $ | — | $ | 3.6 | $ | 0.1 | $ | 1.3 | |||||||||||||||||||
Diluted EPS |
$ | (0.05) | $ | — | $ | 0.07 | $ | — | $ | 0.03 | |||||||||||||||||||
| Diluted shares | 50.1 | 50.1 | |||||||||||||||||||||||||||
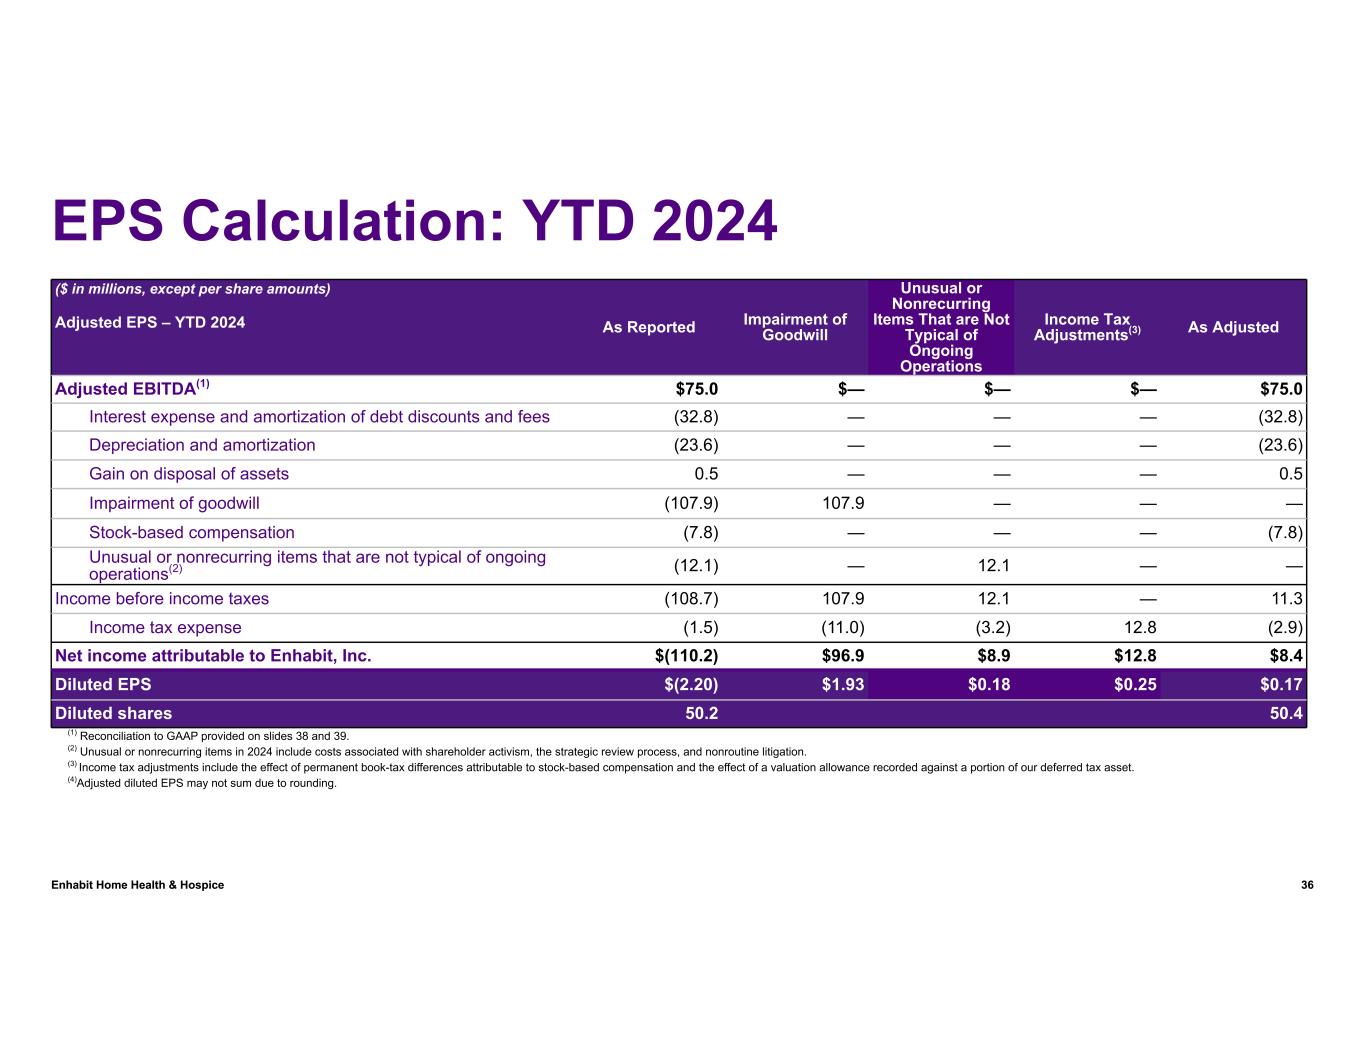
| Reconciliation of Adjusted EBITDA to Adjusted Earnings Per Share | |||||||||||||||||||||||||||||
| Nine Months Ended September 30, | |||||||||||||||||||||||||||||
| 2024 | |||||||||||||||||||||||||||||
| Adjustments | |||||||||||||||||||||||||||||
| As Reported | Impairment of Goodwill | Unusual or Nonrecurring Items That are Not Typical of Ongoing Operations | Income Tax Adjustments(3) |
As Adjusted | |||||||||||||||||||||||||
| ($ in millions, except per share data) | |||||||||||||||||||||||||||||
Adjusted EBITDA(1) |
$ | 75.0 | $ | — | $ | — | $ | — | $ | 75.0 | |||||||||||||||||||
| Interest expense and amortization of debt discounts and fees | (32.8) | — | — | — | (32.8) | ||||||||||||||||||||||||
| Depreciation and amortization | (23.6) | — | — | — | (23.6) | ||||||||||||||||||||||||
| Gain on disposal of assets | 0.5 | — | — | — | 0.5 | ||||||||||||||||||||||||
| Impairment of goodwill | (107.9) | 107.9 | — | — | — | ||||||||||||||||||||||||
| Stock-based compensation | (7.8) | — | — | — | (7.8) | ||||||||||||||||||||||||
Unusual or nonrecurring items that are not typical of ongoing operations(2) |
(12.1) | — | 12.1 | — | — | ||||||||||||||||||||||||
| Income before income taxes | (108.7) | 107.9 | 12.1 | — | 11.3 | ||||||||||||||||||||||||
| Income tax expense | (1.5) | (11.0) | (3.2) | 12.8 | (2.9) | ||||||||||||||||||||||||
| Net income attributable to Enhabit, Inc. | $ | (110.2) | $ | 96.9 | $ | 8.9 | $ | 12.8 | $ | 8.4 | |||||||||||||||||||
Diluted EPS |
$ | (2.20) | $ | 1.93 | $ | 0.18 | $ | 0.25 | $ | 0.17 | |||||||||||||||||||
| Diluted shares | 50.2 | 50.4 | |||||||||||||||||||||||||||
| Reconciliation of Adjusted EBITDA to Adjusted Earnings Per Share | |||||||||||||||||||||||||||||
| Nine Months Ended September 30, | |||||||||||||||||||||||||||||
| 2023 | |||||||||||||||||||||||||||||
| Adjustments | |||||||||||||||||||||||||||||
| As Reported | Impairment of Goodwill | Unusual or Nonrecurring Items That are Not Typical of Ongoing Operations | Income Tax Adjustments(3) |
As Adjusted | |||||||||||||||||||||||||
| ($ in millions, except per share data) | |||||||||||||||||||||||||||||
Adjusted EBITDA(1) |
$ | 72.5 | $ | — | $ | — | $ | — | $ | 72.5 | |||||||||||||||||||
| Interest expense and amortization of debt discounts and fees | (30.7) | — | — | — | (30.7) | ||||||||||||||||||||||||
| Depreciation and amortization | (23.2) | — | — | — | (23.2) | ||||||||||||||||||||||||
| Gain on disposal of assets | 0.2 | — | — | — | 0.2 | ||||||||||||||||||||||||
| Impairment of goodwill | (85.8) | 85.8 | — | — | — | ||||||||||||||||||||||||
| Stock-based compensation | (7.2) | — | — | — | (7.2) | ||||||||||||||||||||||||
Unusual or nonrecurring items that are not typical of ongoing operations(2) |
(9.8) | — | 9.8 | — | — | ||||||||||||||||||||||||
| (Loss) income before income taxes | (84.0) | 85.8 | 9.8 | — | 11.6 | ||||||||||||||||||||||||
| Income tax benefit (expense) | 9.9 | (11.1) | (2.9) | 0.6 | (3.5) | ||||||||||||||||||||||||
| Net (loss) income attributable to Enhabit, Inc. | $ | (74.1) | $ | 74.7 | $ | 6.9 | $ | 0.6 | $ | 8.1 | |||||||||||||||||||
Diluted EPS |
$ | (1.48) | $ | 1.50 | $ | 0.14 | $ | 0.01 | $ | 0.16 | |||||||||||||||||||
| Diluted shares | 49.9 | 49.9 | |||||||||||||||||||||||||||
| Reconciliation of Net Loss to Adjusted EBITDA | |||||||||||||||||||||||
| Three Months Ended September 30, |
Nine Months Ended September 30, |
||||||||||||||||||||||
| 2024 | 2023 | 2024 | 2023 | ||||||||||||||||||||
| ($ in millions) | |||||||||||||||||||||||
| Net loss | $ | (109.5) | $ | (2.2) | $ | (108.2) | $ | (73.1) | |||||||||||||||
| Interest expense and amortization of debt discounts and fees | 10.8 | 10.9 | 32.8 | 30.7 | |||||||||||||||||||
| Income tax (benefit) expense | 0.7 | (0.8) | 1.5 | (9.9) | |||||||||||||||||||
| Depreciation and amortization | 8.2 | 7.7 | 23.6 | 23.2 | |||||||||||||||||||
| Gains on disposal of assets | (0.3) | (0.2) | (0.5) | (0.2) | |||||||||||||||||||
| Impairment of goodwill | 107.9 | — | 107.9 | 85.8 | |||||||||||||||||||
| Stock-based compensation | 3.8 | 3.1 | 7.8 | 7.2 | |||||||||||||||||||
| Net income attributable to noncontrolling interests | (0.7) | (0.2) | (2.0) | (1.0) | |||||||||||||||||||
Unusual or nonrecurring items that are not typical of ongoing operations(1) |
3.6 | 4.9 | 12.1 | 9.8 | |||||||||||||||||||
| Adjusted EBITDA | $ | 24.5 | $ | 23.2 | $ | 75.0 | $ | 72.5 | |||||||||||||||
Reconciliation of Net Cash Provided by Operating Activities to Adjusted EBITDA | |||||||||||||||||||||||
| Three Months Ended September 30, |
Nine Months Ended September 30, |
||||||||||||||||||||||
| 2024 | 2023 | 2024 | 2023 | ||||||||||||||||||||
| ($ in millions) | |||||||||||||||||||||||
| Net cash provided by operating activities | $ | 28.4 | $ | 6.3 | $ | 55.3 | $ | 45.5 | |||||||||||||||
| Interest expense, excluding amortization of debt discounts and fees | 10.4 | 10.7 | 31.7 | 30.3 | |||||||||||||||||||
| Current portion of income tax expense | (0.5) | 1.3 | 1.4 | 3.2 | |||||||||||||||||||
| Change in assets and liabilities, excluding derivative instrument | (16.7) | — | (23.6) | (15.0) | |||||||||||||||||||
| Net income attributable to noncontrolling interests | (0.7) | (0.2) | (2.0) | (1.0) | |||||||||||||||||||
Unusual or nonrecurring items that are not typical of ongoing operations(1) |
3.6 | 4.9 | 12.1 | 9.8 | |||||||||||||||||||
| Other | — | 0.2 | 0.1 | (0.3) | |||||||||||||||||||
| Adjusted EBITDA | $ | 24.5 | $ | 23.2 | $ | 75.0 | $ | 72.5 | |||||||||||||||
| Reconciliation of Net Cash Provided by Operating Activities to Adjusted Free Cash Flow | |||||||||||||||||||||||
| Three Months Ended September 30, |
Nine Months Ended September 30, |
||||||||||||||||||||||
| 2024 | 2023 | 2024 | 2023 | ||||||||||||||||||||
| ($ in millions) | |||||||||||||||||||||||
| Net cash provided by operating activities | $ | 28.4 | $ | 6.3 | $ | 55.3 | $ | 45.5 | |||||||||||||||
Unusual or nonrecurring items that are not typical of ongoing operations(1) |
3.6 | 4.9 | 12.1 | 9.8 | |||||||||||||||||||
| Capital expenditures for maintenance | (0.7) | (1.9) | (3.2) | (3.6) | |||||||||||||||||||
| Other working capital adjustments | (1.0) | (0.7) | (2.7) | (1.7) | |||||||||||||||||||
| Distributions paid to noncontrolling interests of consolidated affiliates | — | — | (2.2) | (2.5) | |||||||||||||||||||
| Adjusted free cash flow | $ | 30.3 | $ | 8.6 | $ | 59.3 | $ | 47.5 | |||||||||||||||
| Reconciliation of Gross Margin to Adjusted EBITDA Margin | |||||||||||||||||||||||
| Three Months Ended September 30, |
Nine Months Ended September 30, |
||||||||||||||||||||||
| 2024 | 2023 | 2024 | 2023 | ||||||||||||||||||||
| Gross margin as a percentage of revenue | 48.1 | % | 48.1 | % | 48.8 | % | 48.8 | % | |||||||||||||||
| General and administrative expenses | (40.9) | % | (42.1) | % | (41.4) | % | (41.6) | % | |||||||||||||||
| Stock-based compensation | 1.5 | % | 1.2 | % | 1.0 | % | 0.9 | % | |||||||||||||||
| Noncontrolling interests | (0.3) | % | (0.1) | % | (0.3) | % | (0.1) | % | |||||||||||||||
Unusual or nonrecurring items that are not typical of ongoing operations(1) |
1.4 | % | 1.9 | % | 1.6 | % | 1.2 | % | |||||||||||||||
| Adjusted EBITDA margin | 9.7 | % | 9.0 | % | 9.6 | % | 9.2 | % | |||||||||||||||


