0001798100FALSEFY2023http://fasb.org/us-gaap/2023#AccountsPayableAndAccruedLiabilitiesCurrentAndNoncurrenthttp://fasb.org/us-gaap/2023#AccountsPayableAndAccruedLiabilitiesCurrentAndNoncurrent—————http://fasb.org/us-gaap/2023#OtherAssetshttp://fasb.org/us-gaap/2023#OtherAssetshttp://fasb.org/us-gaap/2023#AccountsPayableAndAccruedLiabilitiesCurrentAndNoncurrentP1YP1Y00017981002023-01-012023-12-3100017981002023-06-30iso4217:USD00017981002024-02-12xbrli:shares00017981002023-12-3100017981002022-12-31iso4217:USDxbrli:shares00017981002022-01-012022-12-3100017981002021-01-012021-12-310001798100us-gaap:CommonStockMember2020-12-310001798100us-gaap:AdditionalPaidInCapitalMember2020-12-310001798100us-gaap:RetainedEarningsMember2020-12-310001798100us-gaap:AociIncludingPortionAttributableToNoncontrollingInterestMember2020-12-310001798100us-gaap:ParentMember2020-12-310001798100us-gaap:NoncontrollingInterestMember2020-12-3100017981002020-12-310001798100us-gaap:CommonStockMember2021-01-012021-12-310001798100us-gaap:AdditionalPaidInCapitalMember2021-01-012021-12-310001798100us-gaap:ParentMember2021-01-012021-12-310001798100us-gaap:NoncontrollingInterestMember2021-01-012021-12-310001798100us-gaap:RetainedEarningsMember2021-01-012021-12-310001798100us-gaap:AociIncludingPortionAttributableToNoncontrollingInterestMember2021-01-012021-12-310001798100us-gaap:CommonStockMember2021-12-310001798100us-gaap:AdditionalPaidInCapitalMember2021-12-310001798100us-gaap:RetainedEarningsMember2021-12-310001798100us-gaap:AociIncludingPortionAttributableToNoncontrollingInterestMember2021-12-310001798100us-gaap:ParentMember2021-12-310001798100us-gaap:NoncontrollingInterestMember2021-12-3100017981002021-12-310001798100us-gaap:CommonStockMember2022-01-012022-12-310001798100us-gaap:AdditionalPaidInCapitalMember2022-01-012022-12-310001798100us-gaap:ParentMember2022-01-012022-12-310001798100us-gaap:NoncontrollingInterestMember2022-01-012022-12-310001798100us-gaap:RetainedEarningsMember2022-01-012022-12-310001798100us-gaap:AociIncludingPortionAttributableToNoncontrollingInterestMember2022-01-012022-12-310001798100us-gaap:CommonStockMember2022-12-310001798100us-gaap:AdditionalPaidInCapitalMember2022-12-310001798100us-gaap:RetainedEarningsMember2022-12-310001798100us-gaap:AociIncludingPortionAttributableToNoncontrollingInterestMember2022-12-310001798100us-gaap:ParentMember2022-12-310001798100us-gaap:NoncontrollingInterestMember2022-12-310001798100us-gaap:CommonStockMember2023-01-012023-12-310001798100us-gaap:AdditionalPaidInCapitalMember2023-01-012023-12-310001798100us-gaap:ParentMember2023-01-012023-12-310001798100us-gaap:NoncontrollingInterestMember2023-01-012023-12-310001798100us-gaap:RetainedEarningsMember2023-01-012023-12-310001798100us-gaap:AociIncludingPortionAttributableToNoncontrollingInterestMember2023-01-012023-12-310001798100us-gaap:CommonStockMember2023-12-310001798100us-gaap:AdditionalPaidInCapitalMember2023-12-310001798100us-gaap:RetainedEarningsMember2023-12-310001798100us-gaap:AociIncludingPortionAttributableToNoncontrollingInterestMember2023-12-310001798100us-gaap:ParentMember2023-12-310001798100us-gaap:NoncontrollingInterestMember2023-12-31ntst:propertyntst:statexbrli:pure0001798100srt:MinimumMemberus-gaap:BuildingMember2023-12-310001798100srt:MaximumMemberus-gaap:BuildingMember2023-12-310001798100us-gaap:BuildingImprovementsMember2023-12-310001798100us-gaap:EmploymentContractsMember2023-12-310001798100srt:MinimumMemberus-gaap:ComputerEquipmentMember2023-12-310001798100srt:MaximumMemberus-gaap:ComputerEquipmentMember2023-12-3100017981002019-12-232019-12-310001798100us-gaap:DiscontinuedOperationsHeldforsaleMemberntst:TwoPropertiesMember2023-01-012023-12-310001798100us-gaap:DiscontinuedOperationsHeldforsaleMember2023-01-012023-12-310001798100us-gaap:DiscontinuedOperationsHeldforsaleMemberntst:ThreePropertiesMember2023-01-012023-12-31ntst:loan0001798100us-gaap:RealEstateMemberus-gaap:FairValueInputsLevel3Member2023-12-310001798100us-gaap:MeasurementInputCapRateMemberus-gaap:ValuationTechniqueDiscountedCashFlowMember2023-12-310001798100us-gaap:LineOfCreditMemberntst:PriorCreditAgreementMemberus-gaap:UnsecuredDebtMember2023-12-310001798100us-gaap:LineOfCreditMemberntst:PriorCreditAgreementMemberus-gaap:UnsecuredDebtMember2022-12-310001798100us-gaap:LineOfCreditMemberntst:A2027TermLoanMemberus-gaap:UnsecuredDebtMember2023-12-310001798100us-gaap:LineOfCreditMemberntst:A2027TermLoanMemberus-gaap:UnsecuredDebtMember2022-12-310001798100us-gaap:LineOfCreditMemberntst:NewCreditFacilityMemberus-gaap:UnsecuredDebtMember2023-12-310001798100us-gaap:LineOfCreditMemberntst:NewCreditFacilityMemberus-gaap:UnsecuredDebtMember2022-12-310001798100us-gaap:LineOfCreditMemberus-gaap:UnsecuredDebtMemberntst:A2029TermLoanAgreementMember2023-12-310001798100us-gaap:LineOfCreditMemberus-gaap:UnsecuredDebtMemberntst:A2029TermLoanAgreementMember2022-12-31ntst:segment0001798100ntst:CorporateOfficeSpaceMember2021-08-3100017981002021-08-31ntst:terminationOption0001798100ntst:CorporateOfficeSpaceMember2021-08-012021-08-31ntst:renewalOption0001798100ntst:CorporateOfficeSpaceMember2023-12-310001798100stpr:TX2023-12-310001798100stpr:IL2023-12-310001798100us-gaap:LandMember2023-01-012023-12-310001798100us-gaap:LandMember2022-01-012022-12-310001798100us-gaap:BuildingMember2023-01-012023-12-310001798100us-gaap:BuildingMember2022-01-012022-12-310001798100us-gaap:BuildingImprovementsMember2023-01-012023-12-310001798100us-gaap:BuildingImprovementsMember2022-01-012022-12-310001798100us-gaap:LandImprovementsMember2023-01-012023-12-310001798100us-gaap:LandImprovementsMember2022-01-012022-12-310001798100us-gaap:LeasesAcquiredInPlaceMember2023-01-012023-12-310001798100us-gaap:LeasesAcquiredInPlaceMember2022-01-012022-12-310001798100us-gaap:AboveMarketLeasesMember2023-01-012023-12-310001798100us-gaap:AboveMarketLeasesMember2022-01-012022-12-310001798100ntst:FivePropertiesMember2023-01-012023-12-310001798100ntst:TwoPropertiesMember2023-01-012023-12-310001798100ntst:SixPropertiesMember2023-12-310001798100ntst:FivePropertiesMember2022-01-012022-12-310001798100ntst:TwoPropertiesMember2022-01-012022-12-310001798100ntst:SixPropertiesMember2022-01-012022-12-310001798100ntst:SixPropertiesMember2022-12-310001798100ntst:SevenPropertiesMember2023-01-012023-12-310001798100ntst:NinePropertiesMember2022-01-012022-12-310001798100ntst:FifteenPropertiesMember2021-01-012021-12-310001798100ntst:MortgageReceivableDueJuly262023Member2023-01-012023-12-31ntst:tenant0001798100ntst:MortgageReceivableDueJuly262023Member2023-12-310001798100ntst:MortgageReceivableDueJuly262023Member2022-12-310001798100ntst:MortgageReceivableDueJune302023Member2023-01-012023-12-310001798100ntst:MortgageReceivableDueJune302023Member2023-12-310001798100ntst:MortgageReceivableDueJune302023Member2022-12-310001798100ntst:MortgageReceivableDueMarch102026Member2023-01-012023-12-310001798100ntst:MortgageReceivableDueMarch102026Member2023-12-310001798100ntst:MortgageReceivableDueMarch102026Member2022-12-310001798100ntst:MortgageReceivableDueApril102026Member2023-01-012023-12-310001798100ntst:MortgageReceivableDueApril102026Member2023-12-310001798100ntst:MortgageReceivableDueApril102026Member2022-12-310001798100ntst:MortgageReceivableDueJune102025Member2023-01-012023-12-310001798100ntst:MortgageReceivableDueJune102025Member2023-12-310001798100ntst:MortgageReceivableDueJune102025Member2022-12-310001798100ntst:MortgageReceivableDueMarch212024Member2023-01-012023-12-310001798100ntst:MortgageReceivableDueMarch212024Member2023-12-310001798100ntst:MortgageReceivableDueMarch212024Member2022-12-310001798100ntst:MortgageReceivableDueMarch82024Member2023-01-012023-12-310001798100ntst:MortgageReceivableDueMarch82024Member2023-12-310001798100ntst:MortgageReceivableDueMarch82024Member2022-12-310001798100ntst:MortgageReceivableDueDecember52024Member2023-01-012023-12-310001798100ntst:MortgageReceivableDueDecember52024Member2023-12-310001798100ntst:MortgageReceivableDueDecember52024Member2022-12-310001798100ntst:MortgageReceivableDueDecember222024Member2023-01-012023-12-310001798100ntst:MortgageReceivableDueDecember222024Member2023-12-310001798100ntst:MortgageReceivableDueDecember222024Member2022-12-310001798100ntst:MortgageReceivableDueApril102026Membersrt:MaximumMember2023-01-012023-12-310001798100us-gaap:LeasesAcquiredInPlaceMember2023-12-310001798100us-gaap:LeasesAcquiredInPlaceMember2022-12-310001798100us-gaap:AboveMarketLeasesMember2023-12-310001798100us-gaap:AboveMarketLeasesMember2022-12-310001798100us-gaap:EmploymentContractsMember2023-12-310001798100us-gaap:EmploymentContractsMember2022-12-310001798100ntst:LeaseIncentivesMember2023-12-310001798100ntst:LeaseIncentivesMember2022-12-310001798100us-gaap:LeasesAcquiredInPlaceMembersrt:WeightedAverageMember2023-12-310001798100us-gaap:LeasesAcquiredInPlaceMembersrt:WeightedAverageMember2022-12-310001798100us-gaap:AboveMarketLeasesMembersrt:WeightedAverageMember2023-12-310001798100us-gaap:AboveMarketLeasesMembersrt:WeightedAverageMember2022-12-310001798100srt:WeightedAverageMember2023-12-310001798100srt:WeightedAverageMember2022-12-310001798100ntst:LeaseIncentivesMembersrt:WeightedAverageMember2023-12-310001798100ntst:LeaseIncentivesMembersrt:WeightedAverageMember2022-12-310001798100us-gaap:LeasesAcquiredInPlaceMember2021-01-012021-12-310001798100us-gaap:EmploymentContractsMember2023-01-012023-12-310001798100us-gaap:EmploymentContractsMember2022-01-012022-12-310001798100us-gaap:EmploymentContractsMember2021-01-012021-12-310001798100us-gaap:AboveMarketLeasesMember2021-01-012021-12-310001798100ntst:LeaseIncentivesMember2023-01-012023-12-310001798100ntst:LeaseIncentivesMember2022-01-012022-12-310001798100ntst:LeaseIncentivesMember2021-01-012021-12-310001798100us-gaap:RevolvingCreditFacilityMemberus-gaap:LineOfCreditMemberntst:NewCreditFacilityMember2023-12-310001798100us-gaap:RevolvingCreditFacilityMemberus-gaap:LineOfCreditMemberntst:NewCreditFacilityMember2022-12-310001798100us-gaap:MortgagesMemberntst:MortgageNotePayableMember2023-12-310001798100us-gaap:MortgagesMemberntst:MortgageNotePayableMember2022-12-310001798100us-gaap:LineOfCreditMemberntst:PriorCreditAgreementMemberntst:SecuredOvernightFinancingRateSOFRAdjustmentMemberus-gaap:UnsecuredDebtMember2023-01-012023-12-310001798100us-gaap:InterestRateSwapMemberus-gaap:LineOfCreditMemberntst:PriorCreditAgreementMemberus-gaap:UnsecuredDebtMember2023-12-31ntst:derivative0001798100us-gaap:InterestRateSwapMemberus-gaap:LineOfCreditMemberntst:PriorCreditAgreementMemberus-gaap:UnsecuredDebtMemberntst:PeriodOneMember2023-12-310001798100us-gaap:InterestRateSwapMemberus-gaap:LineOfCreditMemberntst:PriorCreditAgreementMemberntst:PeriodTwoMemberus-gaap:UnsecuredDebtMember2023-12-310001798100us-gaap:RevolvingCreditFacilityMemberntst:OneMonthSecuredOvernightFinancingRateSOFROvernightIndexSwapRateMemberus-gaap:LineOfCreditMemberntst:NewCreditFacilityMember2023-01-012023-12-310001798100us-gaap:RevolvingCreditFacilityMemberus-gaap:LineOfCreditMemberntst:NewCreditFacilityMemberntst:SecuredOvernightFinancingRateSOFROvernightIndexSwapAdjustmentRateMember2023-01-012023-12-310001798100us-gaap:RevolvingCreditFacilityMemberus-gaap:LineOfCreditMemberus-gaap:SecuredOvernightFinancingRateSofrOvernightIndexSwapRateMemberntst:NewCreditFacilityMember2023-01-012023-12-310001798100us-gaap:LineOfCreditMemberntst:NewCreditFacilityMemberus-gaap:UnsecuredDebtMemberntst:SecuredOvernightFinancingRateSOFROvernightIndexSwapAdjustmentRateMember2023-01-012023-12-310001798100us-gaap:LineOfCreditMemberus-gaap:SecuredOvernightFinancingRateSofrOvernightIndexSwapRateMemberntst:NewCreditFacilityMemberus-gaap:UnsecuredDebtMember2023-01-012023-12-310001798100us-gaap:InterestRateSwapMemberus-gaap:LineOfCreditMemberntst:NewCreditFacilityMemberus-gaap:UnsecuredDebtMember2023-12-310001798100us-gaap:LineOfCreditMemberntst:NewCreditFacilityMemberntst:SecuredOvernightFinancingRateSOFRAdjustmentMemberus-gaap:UnsecuredDebtMember2023-01-012023-12-310001798100ntst:SecuredOvernightFinancingRateSOFRAdjustmentMarginMemberus-gaap:LineOfCreditMemberntst:NewCreditFacilityMemberus-gaap:UnsecuredDebtMember2023-01-012023-12-310001798100us-gaap:LineOfCreditMemberntst:NewCreditFacilityMemberntst:SecuredOvernightFinancingRateSOFRAdjustmentMemberus-gaap:UnsecuredDebtMember2023-12-310001798100us-gaap:LineOfCreditMemberus-gaap:UnsecuredDebtMemberntst:A2029TermLoanAgreementMember2023-07-030001798100us-gaap:LineOfCreditMemberus-gaap:UnsecuredDebtMemberntst:A2029TermLoanAgreementMember2023-07-032023-07-030001798100us-gaap:LineOfCreditMembersrt:MinimumMemberntst:SecuredOvernightFinancingRateSOFRMemberntst:A2029TermLoanAgreementMemberntst:PriorToInvestmentGradeMember2023-07-032023-07-030001798100us-gaap:LineOfCreditMembersrt:MaximumMemberntst:SecuredOvernightFinancingRateSOFRMemberntst:A2029TermLoanAgreementMemberntst:PriorToInvestmentGradeMember2023-07-032023-07-030001798100ntst:SecuredOvernightFinancingRateSOFRMarginRateMemberus-gaap:LineOfCreditMembersrt:MinimumMemberntst:A2029TermLoanAgreementMemberntst:PriorToInvestmentGradeMember2023-07-032023-07-030001798100ntst:SecuredOvernightFinancingRateSOFRMarginRateMemberus-gaap:LineOfCreditMembersrt:MaximumMemberntst:A2029TermLoanAgreementMemberntst:PriorToInvestmentGradeMember2023-07-032023-07-030001798100ntst:AfterInvestmentGradeMemberus-gaap:LineOfCreditMembersrt:MinimumMemberntst:SecuredOvernightFinancingRateSOFRMemberntst:A2029TermLoanAgreementMember2023-07-032023-07-030001798100ntst:AfterInvestmentGradeMemberus-gaap:LineOfCreditMembersrt:MaximumMemberntst:SecuredOvernightFinancingRateSOFRMemberntst:A2029TermLoanAgreementMember2023-07-032023-07-030001798100ntst:AfterInvestmentGradeMemberus-gaap:LineOfCreditMembersrt:MaximumMemberntst:SecuredOvernightFinancingRateSOFRBaseRateMemberntst:A2029TermLoanAgreementMember2023-07-032023-07-030001798100us-gaap:LineOfCreditMemberntst:A2029TermLoanAgreementMember2023-07-030001798100us-gaap:LineOfCreditMemberntst:A2029TermLoanAgreementMember2023-12-310001798100us-gaap:LineOfCreditMemberntst:A2029TermLoanAgreementMember2023-01-012023-12-310001798100us-gaap:LineOfCreditMemberntst:NewCreditFacilityMemberus-gaap:UnsecuredDebtMember2022-08-110001798100us-gaap:RevolvingCreditFacilityMemberus-gaap:LineOfCreditMemberntst:NewCreditFacilityMember2022-08-110001798100us-gaap:RevolvingCreditFacilityMemberus-gaap:LineOfCreditMemberntst:NewCreditFacilityMember2022-08-112022-08-110001798100us-gaap:LineOfCreditMemberntst:NewCreditFacilityMemberus-gaap:UnsecuredDebtMember2022-08-112022-08-110001798100us-gaap:LineOfCreditMemberntst:NewCreditFacilityMemberus-gaap:UnsecuredDebtMemberntst:PriorToInvestmentGradeMemberntst:SecuredOvernightFinancingRateSOFROvernightIndexSwapAdjustmentRateMember2022-08-112022-08-110001798100us-gaap:LineOfCreditMemberus-gaap:SecuredOvernightFinancingRateSofrOvernightIndexSwapRateMemberntst:NewCreditFacilityMembersrt:MinimumMemberus-gaap:UnsecuredDebtMemberntst:PriorToInvestmentGradeMember2022-08-112022-08-110001798100us-gaap:LineOfCreditMemberus-gaap:SecuredOvernightFinancingRateSofrOvernightIndexSwapRateMemberntst:NewCreditFacilityMembersrt:MaximumMemberus-gaap:UnsecuredDebtMemberntst:PriorToInvestmentGradeMember2022-08-112022-08-110001798100us-gaap:LineOfCreditMemberntst:NewCreditFacilityMembersrt:MinimumMemberus-gaap:UnsecuredDebtMemberntst:PriorToInvestmentGradeMemberus-gaap:BaseRateMember2022-08-112022-08-110001798100us-gaap:LineOfCreditMemberntst:NewCreditFacilityMembersrt:MaximumMemberus-gaap:UnsecuredDebtMemberntst:PriorToInvestmentGradeMemberus-gaap:BaseRateMember2022-08-112022-08-110001798100us-gaap:RevolvingCreditFacilityMemberus-gaap:LineOfCreditMemberntst:NewCreditFacilityMemberntst:PriorToInvestmentGradeMemberntst:SecuredOvernightFinancingRateSOFROvernightIndexSwapAdjustmentRateMember2022-08-112022-08-110001798100us-gaap:RevolvingCreditFacilityMemberus-gaap:LineOfCreditMemberus-gaap:SecuredOvernightFinancingRateSofrOvernightIndexSwapRateMemberntst:NewCreditFacilityMembersrt:MinimumMemberntst:PriorToInvestmentGradeMember2022-08-112022-08-110001798100us-gaap:RevolvingCreditFacilityMemberus-gaap:LineOfCreditMemberus-gaap:SecuredOvernightFinancingRateSofrOvernightIndexSwapRateMemberntst:NewCreditFacilityMembersrt:MaximumMemberntst:PriorToInvestmentGradeMember2022-08-112022-08-110001798100us-gaap:RevolvingCreditFacilityMemberus-gaap:LineOfCreditMemberntst:NewCreditFacilityMembersrt:MaximumMemberntst:PriorToInvestmentGradeMemberus-gaap:BaseRateMember2022-08-112022-08-110001798100ntst:AfterInvestmentGradeMemberus-gaap:LineOfCreditMemberntst:NewCreditFacilityMemberus-gaap:UnsecuredDebtMemberntst:SecuredOvernightFinancingRateSOFROvernightIndexSwapAdjustmentRateMember2022-08-112022-08-110001798100ntst:AfterInvestmentGradeMemberus-gaap:LineOfCreditMemberus-gaap:SecuredOvernightFinancingRateSofrOvernightIndexSwapRateMemberntst:NewCreditFacilityMembersrt:MinimumMemberus-gaap:UnsecuredDebtMember2022-08-112022-08-110001798100ntst:AfterInvestmentGradeMemberus-gaap:LineOfCreditMemberus-gaap:SecuredOvernightFinancingRateSofrOvernightIndexSwapRateMemberntst:NewCreditFacilityMembersrt:MaximumMemberus-gaap:UnsecuredDebtMember2022-08-112022-08-110001798100ntst:AfterInvestmentGradeMemberus-gaap:LineOfCreditMemberntst:NewCreditFacilityMembersrt:MaximumMemberus-gaap:UnsecuredDebtMemberus-gaap:BaseRateMember2022-08-112022-08-110001798100ntst:AfterInvestmentGradeMemberus-gaap:RevolvingCreditFacilityMemberus-gaap:LineOfCreditMemberntst:NewCreditFacilityMemberntst:SecuredOvernightFinancingRateSOFROvernightIndexSwapAdjustmentRateMember2022-08-112022-08-110001798100ntst:AfterInvestmentGradeMemberus-gaap:RevolvingCreditFacilityMemberus-gaap:LineOfCreditMemberus-gaap:SecuredOvernightFinancingRateSofrOvernightIndexSwapRateMemberntst:NewCreditFacilityMembersrt:MinimumMember2022-08-112022-08-110001798100ntst:AfterInvestmentGradeMemberus-gaap:RevolvingCreditFacilityMemberus-gaap:LineOfCreditMemberus-gaap:SecuredOvernightFinancingRateSofrOvernightIndexSwapRateMemberntst:NewCreditFacilityMembersrt:MaximumMember2022-08-112022-08-110001798100ntst:AfterInvestmentGradeMemberus-gaap:RevolvingCreditFacilityMemberus-gaap:LineOfCreditMemberntst:NewCreditFacilityMembersrt:MaximumMemberus-gaap:BaseRateMember2022-08-112022-08-110001798100us-gaap:RevolvingCreditFacilityMemberus-gaap:LineOfCreditMemberntst:NewCreditFacilityMembersrt:MinimumMemberntst:PriorToInvestmentGradeMember2022-08-112022-08-110001798100us-gaap:RevolvingCreditFacilityMemberus-gaap:LineOfCreditMemberntst:NewCreditFacilityMembersrt:MaximumMemberntst:PriorToInvestmentGradeMember2022-08-112022-08-110001798100ntst:AfterInvestmentGradeMemberus-gaap:RevolvingCreditFacilityMemberus-gaap:LineOfCreditMemberntst:NewCreditFacilityMembersrt:MinimumMember2022-08-112022-08-110001798100ntst:AfterInvestmentGradeMemberus-gaap:RevolvingCreditFacilityMemberus-gaap:LineOfCreditMemberntst:NewCreditFacilityMembersrt:MaximumMember2022-08-112022-08-110001798100us-gaap:LineOfCreditMemberntst:NewCreditFacilityMember2023-12-310001798100us-gaap:LineOfCreditMemberntst:PriorCreditAgreementMember2023-12-310001798100us-gaap:LineOfCreditMemberntst:PriorCreditAgreementMemberus-gaap:UnsecuredDebtMember2019-12-310001798100us-gaap:LineOfCreditMemberntst:A2026TermLoanMemberus-gaap:UnsecuredDebtMember2023-06-150001798100us-gaap:LineOfCreditMemberntst:A2026TermLoanMemberus-gaap:UnsecuredDebtMember2023-06-152023-06-150001798100us-gaap:LineOfCreditMemberntst:A2026TermLoanMemberntst:SecuredOvernightFinancingRateSOFRInterestRateMembersrt:MinimumMemberus-gaap:UnsecuredDebtMemberntst:PriorToInvestmentGradeMember2023-06-152023-06-150001798100us-gaap:LineOfCreditMemberntst:A2026TermLoanMemberntst:SecuredOvernightFinancingRateSOFRInterestRateMembersrt:MaximumMemberus-gaap:UnsecuredDebtMemberntst:PriorToInvestmentGradeMember2023-06-152023-06-150001798100us-gaap:LineOfCreditMemberntst:A2026TermLoanMembersrt:MinimumMemberus-gaap:UnsecuredDebtMemberntst:PriorToInvestmentGradeMemberus-gaap:BaseRateMember2023-06-152023-06-150001798100us-gaap:LineOfCreditMemberntst:A2026TermLoanMembersrt:MaximumMemberus-gaap:UnsecuredDebtMemberntst:PriorToInvestmentGradeMemberus-gaap:BaseRateMember2023-06-152023-06-150001798100ntst:AfterInvestmentGradeMemberus-gaap:LineOfCreditMemberntst:A2026TermLoanMemberntst:SecuredOvernightFinancingRateSOFRInterestRateMembersrt:MinimumMemberus-gaap:UnsecuredDebtMember2023-06-152023-06-150001798100ntst:AfterInvestmentGradeMemberus-gaap:LineOfCreditMemberntst:A2026TermLoanMemberntst:SecuredOvernightFinancingRateSOFRInterestRateMembersrt:MaximumMemberus-gaap:UnsecuredDebtMember2023-06-152023-06-150001798100ntst:AfterInvestmentGradeMemberus-gaap:LineOfCreditMemberntst:A2026TermLoanMembersrt:MaximumMemberus-gaap:UnsecuredDebtMemberus-gaap:BaseRateMember2023-06-152023-06-150001798100ntst:ScheduledPrincipalMemberus-gaap:UnsecuredDebtMember2023-12-310001798100us-gaap:UnsecuredDebtMemberntst:BalloonPaymentMember2023-12-310001798100us-gaap:UnsecuredDebtMember2023-12-310001798100us-gaap:RevolvingCreditFacilityMemberus-gaap:LineOfCreditMember2023-01-012023-12-310001798100us-gaap:RevolvingCreditFacilityMemberus-gaap:LineOfCreditMember2022-01-012022-12-310001798100us-gaap:RevolvingCreditFacilityMemberus-gaap:LineOfCreditMember2021-01-012021-12-310001798100us-gaap:LineOfCreditMemberus-gaap:UnsecuredDebtMember2023-01-012023-12-310001798100us-gaap:LineOfCreditMemberus-gaap:UnsecuredDebtMember2022-01-012022-12-310001798100us-gaap:LineOfCreditMemberus-gaap:UnsecuredDebtMember2021-01-012021-12-310001798100us-gaap:MortgagesMember2023-01-012023-12-310001798100us-gaap:MortgagesMember2022-01-012022-12-310001798100us-gaap:MortgagesMember2021-01-012021-12-310001798100ntst:AfterInvestmentGradeMemberus-gaap:LineOfCreditMembersrt:MinimumMemberntst:SecuredOvernightFinancingRateSOFRBaseRateMemberntst:A2029TermLoanAgreementMember2023-07-032023-07-030001798100us-gaap:RevolvingCreditFacilityMemberus-gaap:LineOfCreditMemberntst:NewCreditFacilityMembersrt:MinimumMemberntst:PriorToInvestmentGradeMemberus-gaap:BaseRateMember2022-08-112022-08-110001798100ntst:AfterInvestmentGradeMemberus-gaap:LineOfCreditMemberntst:NewCreditFacilityMembersrt:MinimumMemberus-gaap:UnsecuredDebtMemberus-gaap:BaseRateMember2022-08-112022-08-110001798100ntst:AfterInvestmentGradeMemberus-gaap:RevolvingCreditFacilityMemberus-gaap:LineOfCreditMemberntst:NewCreditFacilityMembersrt:MinimumMemberus-gaap:BaseRateMember2022-08-112022-08-110001798100ntst:AfterInvestmentGradeMemberus-gaap:LineOfCreditMemberntst:A2026TermLoanMembersrt:MinimumMemberus-gaap:UnsecuredDebtMemberus-gaap:BaseRateMember2023-06-152023-06-150001798100ntst:LondonInterbankOfferedRateMemberus-gaap:LineOfCreditMemberntst:PriorCreditAgreementMemberus-gaap:UnsecuredDebtMember2023-12-310001798100us-gaap:LineOfCreditMemberus-gaap:UnsecuredDebtMemberntst:A2029TermLoanAgreementMember2023-01-012023-12-310001798100us-gaap:LineOfCreditMemberntst:SecuredOvernightFinancingRateSOFRAdjustmentMemberus-gaap:UnsecuredDebtMemberntst:A2029TermLoanAgreementMember2023-01-012023-12-310001798100ntst:LondonInterbankOfferedRateLIBORAdjustmentRateMemberus-gaap:LineOfCreditMemberntst:PriorCreditAgreementMemberus-gaap:UnsecuredDebtMember2023-01-012023-12-310001798100us-gaap:LineOfCreditMemberntst:NewCreditFacilityMemberus-gaap:UnsecuredDebtMember2022-09-010001798100us-gaap:LineOfCreditMemberntst:PriorCreditAgreementMemberus-gaap:UnsecuredDebtMember2023-01-012023-12-3100017981002023-01-2600017981002023-01-270001798100us-gaap:LineOfCreditMemberntst:A2027TermLoanMemberus-gaap:UnsecuredDebtMember2023-01-270001798100us-gaap:LineOfCreditMemberntst:A2027TermLoanMemberus-gaap:UnsecuredDebtMember2023-11-280001798100srt:ScenarioForecastMemberus-gaap:LineOfCreditMemberntst:A2027TermLoanMemberus-gaap:UnsecuredDebtMember2024-12-240001798100us-gaap:LineOfCreditMemberntst:A2027TermLoanMemberus-gaap:UnsecuredDebtMember2023-01-012023-12-310001798100us-gaap:LineOfCreditMemberntst:SecuredOvernightFinancingRateSOFRAdjustmentMemberntst:A2027TermLoanMemberus-gaap:UnsecuredDebtMember2023-01-012023-12-310001798100us-gaap:LineOfCreditMemberntst:A2027TermLoanMemberus-gaap:UnsecuredDebtMemberntst:SecuredOvernightFinancingRateSOFRMarginRateMember2023-01-012023-12-310001798100us-gaap:InterestRateSwapMember2023-12-31ntst:instrument0001798100us-gaap:InterestRateSwapMember2022-12-310001798100us-gaap:InterestRateSwapMemberus-gaap:DesignatedAsHedgingInstrumentMember2023-12-310001798100us-gaap:InterestRateSwapMemberus-gaap:DesignatedAsHedgingInstrumentMember2022-12-310001798100us-gaap:InterestRateSwapMember2023-01-012023-12-310001798100us-gaap:InterestRateSwapMember2022-01-012022-12-310001798100us-gaap:InterestRateSwapMember2021-01-012021-12-310001798100us-gaap:InterestRateSwapMemberus-gaap:InterestExpenseMember2023-01-012023-12-310001798100us-gaap:InterestRateSwapMemberus-gaap:InterestExpenseMember2022-01-012022-12-310001798100us-gaap:InterestRateSwapMemberus-gaap:InterestExpenseMember2021-01-012021-12-310001798100us-gaap:InterestRateSwapMemberus-gaap:InterestExpenseMember2023-12-310001798100us-gaap:FairValueMeasurementsRecurringMemberus-gaap:FairValueInputsLevel1Member2023-12-310001798100us-gaap:FairValueMeasurementsRecurringMemberus-gaap:FairValueInputsLevel2Member2023-12-310001798100us-gaap:FairValueMeasurementsRecurringMemberus-gaap:FairValueInputsLevel3Member2023-12-310001798100us-gaap:FairValueMeasurementsRecurringMember2023-12-310001798100us-gaap:FairValueMeasurementsRecurringMemberus-gaap:FairValueInputsLevel1Member2022-12-310001798100us-gaap:FairValueMeasurementsRecurringMemberus-gaap:FairValueInputsLevel2Member2022-12-310001798100us-gaap:FairValueMeasurementsRecurringMemberus-gaap:FairValueInputsLevel3Member2022-12-310001798100us-gaap:FairValueMeasurementsRecurringMember2022-12-310001798100us-gaap:CommonStockMemberntst:A2021ATMProgramMember2021-09-010001798100ntst:ForwardSaleAgreementMemberus-gaap:CommonStockMember2023-09-140001798100ntst:ForwardSaleAgreementMemberus-gaap:CommonStockMember2023-09-282023-09-280001798100ntst:ForwardSaleAgreementMemberus-gaap:CommonStockMember2023-09-280001798100ntst:ForwardSaleAgreementMemberus-gaap:CommonStockMember2023-12-310001798100ntst:A2023ATMProgramMemberus-gaap:CommonStockMember2023-10-250001798100us-gaap:CommonStockMemberntst:A2021ATMProgramMember2023-12-310001798100us-gaap:CommonStockMemberntst:A2021ATMProgramMember2021-09-012023-12-310001798100ntst:A2023ATMProgramMemberus-gaap:CommonStockMember2023-12-310001798100ntst:A2023ATMProgramMemberus-gaap:CommonStockMember2023-01-012023-12-310001798100us-gaap:CommonStockMember2023-01-012023-12-310001798100us-gaap:CommonStockMember2022-01-012022-12-310001798100us-gaap:CommonStockMember2021-01-012021-12-310001798100us-gaap:CommonStockMember2023-12-310001798100us-gaap:CommonStockMember2022-12-310001798100us-gaap:CommonStockMember2021-12-310001798100ntst:August2022FollowOnOfferingMember2022-08-082022-08-080001798100ntst:August2022FollowOnOfferingMember2022-08-080001798100us-gaap:OverAllotmentOptionMember2022-08-082022-08-080001798100ntst:August2022FollowOnOfferingMember2022-08-082022-08-100001798100ntst:PublicOfferingMember2022-01-132022-01-130001798100ntst:PublicOfferingMember2022-01-130001798100ntst:PublicOfferingMember2021-04-122021-04-120001798100us-gaap:OverAllotmentOptionMember2021-04-122021-04-120001798100us-gaap:RestrictedStockUnitsRSUMember2023-01-012023-12-310001798100us-gaap:RestrictedStockUnitsRSUMember2022-01-012022-12-3100017981002022-02-022022-02-0200017981002022-03-152022-03-1500017981002022-03-302022-03-3000017981002022-04-262022-04-2600017981002022-06-012022-06-0100017981002022-06-152022-06-1500017981002022-07-262022-07-2600017981002022-09-012022-09-0100017981002022-09-152022-09-1500017981002022-12-012022-12-0100017981002022-10-252022-10-2500017981002022-12-152022-12-1500017981002021-03-032021-03-0300017981002021-03-152021-03-1500017981002021-03-302021-03-3000017981002021-06-012021-06-0100017981002021-04-272021-04-2700017981002021-06-152021-06-1500017981002021-09-012021-09-0100017981002021-07-272021-07-2700017981002021-09-152021-09-1500017981002021-10-262021-10-2600017981002021-12-012021-12-0100017981002021-12-152021-12-150001798100ntst:NetstreitLPTheOperatingPartnershipMember2023-12-310001798100ntst:NetstreitLPTheOperatingPartnershipMember2022-12-3100017981002019-12-230001798100us-gaap:RestrictedStockUnitsRSUMembersrt:MinimumMember2023-01-012023-12-310001798100us-gaap:RestrictedStockUnitsRSUMembersrt:MaximumMember2023-01-012023-12-3100017981002020-08-012020-08-310001798100ntst:PerformanceBasedRestrictedStockUnitsRSUsMember2022-12-310001798100ntst:PerformanceBasedRestrictedStockUnitsRSUsMember2021-12-310001798100ntst:PerformanceBasedRestrictedStockUnitsRSUsMember2020-12-310001798100ntst:PerformanceBasedRestrictedStockUnitsRSUsMember2023-01-012023-12-310001798100ntst:PerformanceBasedRestrictedStockUnitsRSUsMember2022-01-012022-12-310001798100ntst:PerformanceBasedRestrictedStockUnitsRSUsMember2021-01-012021-12-310001798100ntst:PerformanceBasedRestrictedStockUnitsRSUsMember2023-12-310001798100srt:MinimumMemberntst:ServiceBasedRestrictedStockUnitsRSUsMember2023-01-012023-12-310001798100srt:MaximumMemberntst:ServiceBasedRestrictedStockUnitsRSUsMember2023-01-012023-12-310001798100ntst:ServiceBasedRestrictedStockUnitsRSUsMember2022-12-310001798100ntst:ServiceBasedRestrictedStockUnitsRSUsMember2021-12-310001798100ntst:ServiceBasedRestrictedStockUnitsRSUsMember2020-12-310001798100ntst:ServiceBasedRestrictedStockUnitsRSUsMember2023-01-012023-12-310001798100ntst:ServiceBasedRestrictedStockUnitsRSUsMember2022-01-012022-12-310001798100ntst:ServiceBasedRestrictedStockUnitsRSUsMember2021-01-012021-12-310001798100ntst:ServiceBasedRestrictedStockUnitsRSUsMember2023-12-310001798100ntst:MarketBasedRestrictedStockUnitsRSUsMember2023-01-012023-12-310001798100ntst:MarketBasedRestrictedStockUnitsRSUsMemberus-gaap:ShareBasedCompensationAwardTrancheOneMember2023-01-012023-12-310001798100ntst:MarketBasedRestrictedStockUnitsRSUsMemberus-gaap:ShareBasedCompensationAwardTrancheTwoMember2023-01-012023-12-310001798100ntst:MarketBasedRestrictedStockUnitsRSUsMember2022-12-310001798100ntst:MarketBasedRestrictedStockUnitsRSUsMember2021-12-310001798100ntst:MarketBasedRestrictedStockUnitsRSUsMember2020-12-310001798100ntst:MarketBasedRestrictedStockUnitsRSUsMember2022-01-012022-12-310001798100ntst:MarketBasedRestrictedStockUnitsRSUsMember2021-01-012021-12-310001798100ntst:MarketBasedRestrictedStockUnitsRSUsMember2023-12-310001798100us-gaap:RestrictedStockUnitsRSUMemberntst:TheProgramMember2021-03-012021-03-310001798100us-gaap:RestrictedStockUnitsRSUMemberntst:TheProgramMember2023-12-310001798100us-gaap:RestrictedStockUnitsRSUMemberntst:TheProgramMember2022-01-012022-12-310001798100us-gaap:RestrictedStockUnitsRSUMemberntst:TheProgramMember2023-01-012023-12-310001798100us-gaap:RestrictedStockUnitsRSUMemberntst:TheProgramMember2021-01-012021-12-310001798100ntst:NetstreitLPTheOperatingPartnershipMemberntst:OPUnitsMember2023-12-310001798100ntst:NetstreitLPTheOperatingPartnershipMemberntst:OPUnitsMember2022-12-310001798100srt:AffiliatedEntityMemberntst:EBArrowMember2023-01-012023-12-310001798100srt:AffiliatedEntityMemberntst:EBArrowMember2021-01-012021-12-310001798100us-gaap:SubsequentEventMember2024-02-132024-02-130001798100us-gaap:SubsequentEventMemberntst:PublicStockOfferingMember2024-01-012024-01-310001798100us-gaap:SubsequentEventMemberntst:PublicStockOfferingMember2024-01-310001798100ntst:ApparelIndianolaIAMember2023-12-310001798100ntst:ApparelIndianolaIAMembersrt:MinimumMember2023-12-310001798100ntst:ApparelIndianolaIAMembersrt:MaximumMember2023-12-310001798100ntst:ApparelRioGrandeCityTXMember2023-12-310001798100srt:MinimumMemberntst:ApparelRioGrandeCityTXMember2023-12-310001798100srt:MaximumMemberntst:ApparelRioGrandeCityTXMember2023-12-310001798100ntst:ApparelLaredoTXMember2023-12-310001798100ntst:ApparelLaredoTXMembersrt:MinimumMember2023-12-310001798100ntst:ApparelLaredoTXMembersrt:MaximumMember2023-12-310001798100ntst:ApparelOdessaTXMember2023-12-310001798100srt:MinimumMemberntst:ApparelOdessaTXMember2023-12-310001798100srt:MaximumMemberntst:ApparelOdessaTXMember2023-12-310001798100ntst:AutoPartsNewRichmondWIMember2023-12-310001798100ntst:AutoPartsNewRichmondWIMembersrt:MinimumMember2023-12-310001798100ntst:AutoPartsNewRichmondWIMembersrt:MaximumMember2023-12-310001798100ntst:AutomotiveServiceColoradoSpringsCOMember2023-12-310001798100ntst:AutomotiveServiceColoradoSpringsCOMembersrt:MinimumMember2023-12-310001798100ntst:AutomotiveServiceColoradoSpringsCOMembersrt:MaximumMember2023-12-310001798100ntst:BankingElizabethtownPAMember2023-12-310001798100ntst:BankingElizabethtownPAMembersrt:MinimumMember2023-12-310001798100ntst:BankingElizabethtownPAMembersrt:MaximumMember2023-12-310001798100ntst:BankingAtcoNJMember2023-12-310001798100srt:MinimumMemberntst:BankingAtcoNJMember2023-12-310001798100srt:MaximumMemberntst:BankingAtcoNJMember2023-12-310001798100ntst:BankingVinelandNJMember2023-12-310001798100ntst:BankingVinelandNJMembersrt:MinimumMember2023-12-310001798100ntst:BankingVinelandNJMembersrt:MaximumMember2023-12-310001798100ntst:CasualDiningGreensburgINMember2023-12-310001798100ntst:CasualDiningGreensburgINMembersrt:MinimumMember2023-12-310001798100ntst:CasualDiningGreensburgINMembersrt:MaximumMember2023-12-310001798100ntst:DiscountRetailHollandMIMember2023-12-310001798100srt:MinimumMemberntst:DiscountRetailHollandMIMember2023-12-310001798100srt:MaximumMemberntst:DiscountRetailHollandMIMember2023-12-310001798100ntst:DollarStoresNormanOKMember2023-12-310001798100ntst:DollarStoresNormanOKMembersrt:MinimumMember2023-12-310001798100ntst:DollarStoresNormanOKMembersrt:MaximumMember2023-12-310001798100ntst:DollarStoresWindhamOHMember2023-12-310001798100ntst:DollarStoresWindhamOHMembersrt:MinimumMember2023-12-310001798100ntst:DollarStoresWindhamOHMembersrt:MaximumMember2023-12-310001798100ntst:DollarStoresMcCombOHMember2023-12-310001798100ntst:DollarStoresMcCombOHMembersrt:MinimumMember2023-12-310001798100ntst:DollarStoresMcCombOHMembersrt:MaximumMember2023-12-310001798100ntst:DollarStoresBirminghamOHMember2023-12-310001798100ntst:DollarStoresBirminghamOHMembersrt:MinimumMember2023-12-310001798100ntst:DollarStoresBirminghamOHMembersrt:MaximumMember2023-12-310001798100ntst:DollarStoresBrookfieldMAMember2023-12-310001798100ntst:DollarStoresBrookfieldMAMembersrt:MinimumMember2023-12-310001798100ntst:DollarStoresBrookfieldMAMembersrt:MaximumMember2023-12-310001798100ntst:DollarStoresFriedensPAMember2023-12-310001798100ntst:DollarStoresFriedensPAMembersrt:MinimumMember2023-12-310001798100ntst:DollarStoresFriedensPAMembersrt:MaximumMember2023-12-310001798100ntst:DollarStoresStrawberryPointIAMember2023-12-310001798100ntst:DollarStoresStrawberryPointIAMembersrt:MinimumMember2023-12-310001798100ntst:DollarStoresStrawberryPointIAMembersrt:MaximumMember2023-12-310001798100ntst:DollarStoresBelgradeMNMember2023-12-310001798100ntst:DollarStoresBelgradeMNMembersrt:MinimumMember2023-12-310001798100ntst:DollarStoresBelgradeMNMembersrt:MaximumMember2023-12-310001798100ntst:DollarStoresLakeCityIAMember2023-12-310001798100ntst:DollarStoresLakeCityIAMembersrt:MinimumMember2023-12-310001798100ntst:DollarStoresLakeCityIAMembersrt:MaximumMember2023-12-310001798100ntst:DollarStoresBogueChittoMSMember2023-12-310001798100ntst:DollarStoresBogueChittoMSMembersrt:MinimumMember2023-12-310001798100ntst:DollarStoresBogueChittoMSMembersrt:MaximumMember2023-12-310001798100ntst:DollarStoresHurleyMSMember2023-12-310001798100ntst:DollarStoresHurleyMSMembersrt:MinimumMember2023-12-310001798100ntst:DollarStoresHurleyMSMembersrt:MaximumMember2023-12-310001798100ntst:DollarStoresMeridianMSMember2023-12-310001798100ntst:DollarStoresMeridianMSMembersrt:MinimumMember2023-12-310001798100ntst:DollarStoresMeridianMSMembersrt:MaximumMember2023-12-310001798100ntst:DollarStoresBuckatunnaMSMember2023-12-310001798100srt:MinimumMemberntst:DollarStoresBuckatunnaMSMember2023-12-310001798100srt:MaximumMemberntst:DollarStoresBuckatunnaMSMember2023-12-310001798100ntst:DollarStoresClevelandTXMember2023-12-310001798100ntst:DollarStoresClevelandTXMembersrt:MinimumMember2023-12-310001798100ntst:DollarStoresClevelandTXMembersrt:MaximumMember2023-12-310001798100ntst:DollarStoresFoxLakeWIMember2023-12-310001798100ntst:DollarStoresFoxLakeWIMembersrt:MinimumMember2023-12-310001798100ntst:DollarStoresFoxLakeWIMembersrt:MaximumMember2023-12-310001798100ntst:DrugStoresPharmaciesFredericksburgVAMember2023-12-310001798100srt:MinimumMemberntst:DrugStoresPharmaciesFredericksburgVAMember2023-12-310001798100srt:MaximumMemberntst:DrugStoresPharmaciesFredericksburgVAMember2023-12-310001798100ntst:DrugStoresPharmaciesIndianapolisIN1Member2023-12-310001798100srt:MinimumMemberntst:DrugStoresPharmaciesIndianapolisIN1Member2023-12-310001798100srt:MaximumMemberntst:DrugStoresPharmaciesIndianapolisIN1Member2023-12-310001798100ntst:DrugStoresPharmaciesAmeliaOHMember2023-12-310001798100ntst:DrugStoresPharmaciesAmeliaOHMembersrt:MinimumMember2023-12-310001798100ntst:DrugStoresPharmaciesAmeliaOHMembersrt:MaximumMember2023-12-310001798100ntst:DrugStoresPharmaciesClantonALMember2023-12-310001798100ntst:DrugStoresPharmaciesClantonALMembersrt:MinimumMember2023-12-310001798100ntst:DrugStoresPharmaciesClantonALMembersrt:MaximumMember2023-12-310001798100ntst:DrugStoresPharmaciesFranklinTNMember2023-12-310001798100srt:MinimumMemberntst:DrugStoresPharmaciesFranklinTNMember2023-12-310001798100srt:MaximumMemberntst:DrugStoresPharmaciesFranklinTNMember2023-12-310001798100ntst:DrugStoresPharmaciesHanoverINMember2023-12-310001798100ntst:DrugStoresPharmaciesHanoverINMembersrt:MinimumMember2023-12-310001798100ntst:DrugStoresPharmaciesHanoverINMembersrt:MaximumMember2023-12-310001798100ntst:DrugStoresPharmaciesHurricaneWVMember2023-12-310001798100ntst:DrugStoresPharmaciesHurricaneWVMembersrt:MinimumMember2023-12-310001798100ntst:DrugStoresPharmaciesHurricaneWVMembersrt:MaximumMember2023-12-310001798100ntst:DrugStoresPharmaciesMontgomeryALMember2023-12-310001798100ntst:DrugStoresPharmaciesMontgomeryALMembersrt:MinimumMember2023-12-310001798100ntst:DrugStoresPharmaciesMontgomeryALMembersrt:MaximumMember2023-12-310001798100ntst:DrugStoresPharmaciesWarriorALMember2023-12-310001798100srt:MinimumMemberntst:DrugStoresPharmaciesWarriorALMember2023-12-310001798100srt:MaximumMemberntst:DrugStoresPharmaciesWarriorALMember2023-12-310001798100ntst:DrugStoresPharmaciesWaterfordCharterTownshipMIMember2023-12-310001798100ntst:DrugStoresPharmaciesWaterfordCharterTownshipMIMembersrt:MinimumMember2023-12-310001798100ntst:DrugStoresPharmaciesWaterfordCharterTownshipMIMembersrt:MaximumMember2023-12-310001798100ntst:DrugStoresPharmaciesCantonGAMember2023-12-310001798100srt:MinimumMemberntst:DrugStoresPharmaciesCantonGAMember2023-12-310001798100srt:MaximumMemberntst:DrugStoresPharmaciesCantonGAMember2023-12-310001798100ntst:DrugStoresPharmaciesAustinMNMember2023-12-310001798100srt:MinimumMemberntst:DrugStoresPharmaciesAustinMNMember2023-12-310001798100srt:MaximumMemberntst:DrugStoresPharmaciesAustinMNMember2023-12-310001798100ntst:DrugStoresPharmaciesAlbuquerqueNMMember2023-12-310001798100srt:MinimumMemberntst:DrugStoresPharmaciesAlbuquerqueNMMember2023-12-310001798100srt:MaximumMemberntst:DrugStoresPharmaciesAlbuquerqueNMMember2023-12-310001798100ntst:DrugStoresPharmaciesSavannahGAMember2023-12-310001798100ntst:DrugStoresPharmaciesSavannahGAMembersrt:MinimumMember2023-12-310001798100ntst:DrugStoresPharmaciesSavannahGAMembersrt:MaximumMember2023-12-310001798100ntst:EquipmentRentalAndLeasingIdahoFallsIDMember2023-12-310001798100srt:MinimumMemberntst:EquipmentRentalAndLeasingIdahoFallsIDMember2023-12-310001798100srt:MaximumMemberntst:EquipmentRentalAndLeasingIdahoFallsIDMember2023-12-310001798100ntst:FarmSuppliesLlanoTXMember2023-12-310001798100ntst:FarmSuppliesLlanoTXMembersrt:MinimumMember2023-12-310001798100ntst:FarmSuppliesLlanoTXMembersrt:MaximumMember2023-12-310001798100ntst:FarmSuppliesBallardUTMember2023-12-310001798100ntst:FarmSuppliesBallardUTMembersrt:MinimumMember2023-12-310001798100ntst:FarmSuppliesBallardUTMembersrt:MaximumMember2023-12-310001798100ntst:FarmSuppliesWellingtonOHMember2023-12-310001798100srt:MinimumMemberntst:FarmSuppliesWellingtonOHMember2023-12-310001798100srt:MaximumMemberntst:FarmSuppliesWellingtonOHMember2023-12-310001798100ntst:FarmSuppliesOttawaOHMember2023-12-310001798100ntst:FarmSuppliesOttawaOHMembersrt:MinimumMember2023-12-310001798100ntst:FarmSuppliesOttawaOHMembersrt:MaximumMember2023-12-310001798100ntst:FurnitureStoresCollegeStationTXMember2023-12-310001798100ntst:FurnitureStoresCollegeStationTXMembersrt:MinimumMember2023-12-310001798100ntst:FurnitureStoresCollegeStationTXMembersrt:MaximumMember2023-12-310001798100ntst:FurnitureStoresJacksonvilleFLMember2023-12-310001798100ntst:FurnitureStoresJacksonvilleFLMembersrt:MinimumMember2023-12-310001798100ntst:FurnitureStoresJacksonvilleFLMembersrt:MaximumMember2023-12-310001798100ntst:GiftNoveltyAndSouvenirShopsLittleRockARMember2023-12-310001798100ntst:GiftNoveltyAndSouvenirShopsLittleRockARMembersrt:MinimumMember2023-12-310001798100ntst:GiftNoveltyAndSouvenirShopsLittleRockARMembersrt:MaximumMember2023-12-310001798100ntst:GroceryMemphisTNMember2023-12-310001798100ntst:GroceryMemphisTNMembersrt:MinimumMember2023-12-310001798100ntst:GroceryMemphisTNMembersrt:MaximumMember2023-12-310001798100ntst:HomeFurnishingsSmyrnaTNMember2023-12-310001798100ntst:HomeFurnishingsSmyrnaTNMembersrt:MinimumMember2023-12-310001798100ntst:HomeFurnishingsSmyrnaTNMembersrt:MaximumMember2023-12-310001798100ntst:HomeImprovementPagosaSpringsCOMember2023-12-310001798100ntst:HomeImprovementPagosaSpringsCOMembersrt:MinimumMember2023-12-310001798100ntst:HomeImprovementPagosaSpringsCOMembersrt:MaximumMember2023-12-310001798100ntst:HomeImprovementChattanoogaTNMember2023-12-310001798100ntst:HomeImprovementChattanoogaTNMembersrt:MinimumMember2023-12-310001798100ntst:HomeImprovementChattanoogaTNMembersrt:MaximumMember2023-12-310001798100ntst:HomeImprovementSpartanburgSCMember2023-12-310001798100srt:MinimumMemberntst:HomeImprovementSpartanburgSCMember2023-12-310001798100srt:MaximumMemberntst:HomeImprovementSpartanburgSCMember2023-12-310001798100ntst:HomeImprovementIndianLandSCMember2023-12-310001798100ntst:HomeImprovementIndianLandSCMembersrt:MinimumMember2023-12-310001798100ntst:HomeImprovementIndianLandSCMembersrt:MaximumMember2023-12-310001798100ntst:HomeImprovementLexingtonNCMember2023-12-310001798100srt:MinimumMemberntst:HomeImprovementLexingtonNCMember2023-12-310001798100srt:MaximumMemberntst:HomeImprovementLexingtonNCMember2023-12-310001798100ntst:HomeImprovementMaconGAMember2023-12-310001798100srt:MinimumMemberntst:HomeImprovementMaconGAMember2023-12-310001798100srt:MaximumMemberntst:HomeImprovementMaconGAMember2023-12-310001798100ntst:QuickServiceRestaurantsJunctionCityKSMember2023-12-310001798100ntst:QuickServiceRestaurantsJunctionCityKSMembersrt:MinimumMember2023-12-310001798100ntst:QuickServiceRestaurantsJunctionCityKSMembersrt:MaximumMember2023-12-310001798100ntst:QuickServiceRestaurantsJacksonMSMember2023-12-310001798100ntst:QuickServiceRestaurantsJacksonMSMembersrt:MinimumMember2023-12-310001798100ntst:QuickServiceRestaurantsJacksonMSMembersrt:MaximumMember2023-12-310001798100ntst:QuickServiceRestaurantsPhenixCityALMember2023-12-310001798100ntst:QuickServiceRestaurantsPhenixCityALMembersrt:MinimumMember2023-12-310001798100ntst:QuickServiceRestaurantsPhenixCityALMembersrt:MaximumMember2023-12-310001798100ntst:QuickServiceRestaurantsGrovetownGAMember2023-12-310001798100ntst:QuickServiceRestaurantsGrovetownGAMembersrt:MinimumMember2023-12-310001798100ntst:QuickServiceRestaurantsGrovetownGAMembersrt:MaximumMember2023-12-310001798100ntst:QuickServiceRestaurantsSneadALMember2023-12-310001798100ntst:QuickServiceRestaurantsSneadALMembersrt:MinimumMember2023-12-310001798100ntst:QuickServiceRestaurantsSneadALMembersrt:MaximumMember2023-12-310001798100ntst:QuickServiceRestaurantsRedBayALMember2023-12-310001798100ntst:QuickServiceRestaurantsRedBayALMembersrt:MinimumMember2023-12-310001798100ntst:QuickServiceRestaurantsRedBayALMembersrt:MaximumMember2023-12-310001798100ntst:QuickServiceRestaurantsHueytownALMember2023-12-310001798100srt:MinimumMemberntst:QuickServiceRestaurantsHueytownALMember2023-12-310001798100srt:MaximumMemberntst:QuickServiceRestaurantsHueytownALMember2023-12-310001798100ntst:QuickServiceRestaurantsSedaliaMOMember2023-12-310001798100srt:MinimumMemberntst:QuickServiceRestaurantsSedaliaMOMember2023-12-310001798100srt:MaximumMemberntst:QuickServiceRestaurantsSedaliaMOMember2023-12-310001798100ntst:QuickServiceRestaurantsShawneeOKMember2023-12-310001798100ntst:QuickServiceRestaurantsShawneeOKMembersrt:MinimumMember2023-12-310001798100ntst:QuickServiceRestaurantsShawneeOKMembersrt:MaximumMember2023-12-310001798100ntst:HomeImprovementSiouxCityIAMember2023-12-310001798100ntst:HomeImprovementSiouxCityIAMembersrt:MinimumMember2023-12-310001798100ntst:HomeImprovementSiouxCityIAMembersrt:MaximumMember2023-12-310001798100ntst:DiscountRetailFlintMIMember2023-12-310001798100srt:MinimumMemberntst:DiscountRetailFlintMIMember2023-12-310001798100srt:MaximumMemberntst:DiscountRetailFlintMIMember2023-12-310001798100ntst:ConvenienceStoresNorthLittleRockAR1Member2023-12-310001798100ntst:ConvenienceStoresNorthLittleRockAR1Membersrt:MinimumMember2023-12-310001798100ntst:ConvenienceStoresNorthLittleRockAR1Membersrt:MaximumMember2023-12-310001798100ntst:QuickServiceRestaurantsWoodRiverILMember2023-12-310001798100ntst:ArtsCraftsFairfieldOHMember2023-12-310001798100ntst:ArtsCraftsFairfieldOHMembersrt:MinimumMember2023-12-310001798100ntst:ArtsCraftsFairfieldOHMembersrt:MaximumMember2023-12-310001798100ntst:QuickServiceRestaurantsFortSmithARMember2023-12-310001798100ntst:QuickServiceRestaurantsFortSmithARMembersrt:MinimumMember2023-12-310001798100ntst:QuickServiceRestaurantsFortSmithARMembersrt:MaximumMember2023-12-310001798100ntst:AutomotiveServiceOswegoILMember2023-12-310001798100ntst:AutomotiveServiceOswegoILMembersrt:MinimumMember2023-12-310001798100ntst:AutomotiveServiceOswegoILMembersrt:MaximumMember2023-12-310001798100ntst:GroceryMeyersdalePAMember2023-12-310001798100ntst:GroceryMeyersdalePAMembersrt:MinimumMember2023-12-310001798100ntst:GroceryMeyersdalePAMembersrt:MaximumMember2023-12-310001798100ntst:HomeImprovementPaintsvilleKYMember2023-12-310001798100ntst:CasualDiningBrandonMSMember2023-12-310001798100ntst:CasualDiningBrandonMSMembersrt:MinimumMember2023-12-310001798100ntst:CasualDiningBrandonMSMembersrt:MaximumMember2023-12-310001798100ntst:AutomotiveServiceMerrillWIMember2023-12-310001798100ntst:AutomotiveServiceMerrillWIMembersrt:MinimumMember2023-12-310001798100ntst:AutomotiveServiceMerrillWIMembersrt:MaximumMember2023-12-310001798100ntst:AutomotiveServicePrattvilleALMember2023-12-310001798100ntst:AutomotiveServicePrattvilleALMembersrt:MinimumMember2023-12-310001798100ntst:AutomotiveServicePrattvilleALMembersrt:MaximumMember2023-12-310001798100ntst:AutomotiveServiceNewLondonWIMember2023-12-310001798100ntst:AutomotiveServiceNewLondonWIMembersrt:MinimumMember2023-12-310001798100ntst:AutomotiveServiceNewLondonWIMembersrt:MaximumMember2023-12-310001798100ntst:AutomotiveServiceCrawfordvilleFLMember2023-12-310001798100ntst:AutomotiveServiceCrawfordvilleFLMembersrt:MinimumMember2023-12-310001798100ntst:AutomotiveServiceCrawfordvilleFLMembersrt:MaximumMember2023-12-310001798100ntst:AutomotiveServiceQuincyFLMember2023-12-310001798100ntst:AutomotiveServiceQuincyFLMembersrt:MinimumMember2023-12-310001798100ntst:AutomotiveServiceQuincyFLMembersrt:MaximumMember2023-12-310001798100ntst:AutomotiveServiceLiveOakFLMember2023-12-310001798100ntst:AutomotiveServiceLiveOakFLMembersrt:MinimumMember2023-12-310001798100ntst:AutomotiveServiceLiveOakFLMembersrt:MaximumMember2023-12-310001798100ntst:AutomotiveServiceWisconsinRapidsWIMember2023-12-310001798100srt:MinimumMemberntst:AutomotiveServiceWisconsinRapidsWIMember2023-12-310001798100srt:MaximumMemberntst:AutomotiveServiceWisconsinRapidsWIMember2023-12-310001798100ntst:DiscountRetailLongviewTXMember2023-12-310001798100ntst:DiscountRetailLongviewTXMembersrt:MinimumMember2023-12-310001798100ntst:DiscountRetailLongviewTXMembersrt:MaximumMember2023-12-310001798100ntst:DiscountRetailMishawakaINMember2023-12-310001798100srt:MinimumMemberntst:DiscountRetailMishawakaINMember2023-12-310001798100srt:MaximumMemberntst:DiscountRetailMishawakaINMember2023-12-310001798100ntst:DiscountRetailAugustaGAMember2023-12-310001798100srt:MinimumMemberntst:DiscountRetailAugustaGAMember2023-12-310001798100srt:MaximumMemberntst:DiscountRetailAugustaGAMember2023-12-310001798100ntst:ConvenienceStoresNorthLittleRockAR2Member2023-12-310001798100ntst:ConvenienceStoresNorthLittleRockAR2Membersrt:MinimumMember2023-12-310001798100ntst:ConvenienceStoresNorthLittleRockAR2Membersrt:MaximumMember2023-12-310001798100ntst:DiscountRetailTupeloMSMember2023-12-310001798100ntst:DiscountRetailTupeloMSMembersrt:MinimumMember2023-12-310001798100ntst:DiscountRetailTupeloMSMembersrt:MaximumMember2023-12-310001798100ntst:AutoPartsRoswellNMMember2023-12-310001798100srt:MinimumMemberntst:AutoPartsRoswellNMMember2023-12-310001798100srt:MaximumMemberntst:AutoPartsRoswellNMMember2023-12-310001798100ntst:DiscountRetailWacoTXMember2023-12-310001798100ntst:DiscountRetailWacoTXMembersrt:MinimumMember2023-12-310001798100ntst:DiscountRetailWacoTXMembersrt:MaximumMember2023-12-310001798100ntst:DollarStoresBaltimoreMDMember2023-12-310001798100ntst:DollarStoresBaltimoreMDMembersrt:MinimumMember2023-12-310001798100ntst:DollarStoresBaltimoreMDMembersrt:MaximumMember2023-12-310001798100ntst:GeneralRetailNewarkNYMember2023-12-310001798100srt:MinimumMemberntst:GeneralRetailNewarkNYMember2023-12-310001798100srt:MaximumMemberntst:GeneralRetailNewarkNYMember2023-12-310001798100ntst:GeneralRetailRiverdaleGAMember2023-12-310001798100ntst:GeneralRetailRiverdaleGAMembersrt:MinimumMember2023-12-310001798100ntst:GeneralRetailRiverdaleGAMembersrt:MaximumMember2023-12-310001798100ntst:DollarStoresChicagoILMember2023-12-310001798100ntst:DollarStoresChicagoILMembersrt:MinimumMember2023-12-310001798100ntst:DollarStoresChicagoILMembersrt:MaximumMember2023-12-310001798100ntst:DiscountRetailCollegeStationTXMember2023-12-310001798100ntst:DiscountRetailCollegeStationTXMembersrt:MinimumMember2023-12-310001798100ntst:DiscountRetailCollegeStationTXMembersrt:MaximumMember2023-12-310001798100ntst:ConvenienceStoresLindaleTX1Member2023-12-310001798100srt:MinimumMemberntst:ConvenienceStoresLindaleTX1Member2023-12-310001798100srt:MaximumMemberntst:ConvenienceStoresLindaleTX1Member2023-12-310001798100ntst:ConvenienceStoresLindaleTX2Member2023-12-310001798100srt:MinimumMemberntst:ConvenienceStoresLindaleTX2Member2023-12-310001798100srt:MaximumMemberntst:ConvenienceStoresLindaleTX2Member2023-12-310001798100ntst:ConvenienceStoresTylerTX1Member2023-12-310001798100ntst:ConvenienceStoresTylerTX1Membersrt:MinimumMember2023-12-310001798100ntst:ConvenienceStoresTylerTX1Membersrt:MaximumMember2023-12-310001798100ntst:ConvenienceStoresTylerTX2Member2023-12-310001798100ntst:ConvenienceStoresTylerTX2Membersrt:MinimumMember2023-12-310001798100ntst:ConvenienceStoresTylerTX2Membersrt:MaximumMember2023-12-310001798100ntst:ConvenienceStoresTylerTX3Member2023-12-310001798100srt:MinimumMemberntst:ConvenienceStoresTylerTX3Member2023-12-310001798100srt:MaximumMemberntst:ConvenienceStoresTylerTX3Member2023-12-310001798100ntst:ConvenienceStoresTylerTX4Member2023-12-310001798100ntst:ConvenienceStoresTylerTX4Membersrt:MinimumMember2023-12-310001798100ntst:ConvenienceStoresTylerTX4Membersrt:MaximumMember2023-12-310001798100ntst:ConvenienceStoresBrownsboroTXMember2023-12-310001798100ntst:ConvenienceStoresBrownsboroTXMembersrt:MinimumMember2023-12-310001798100ntst:ConvenienceStoresBrownsboroTXMembersrt:MaximumMember2023-12-310001798100ntst:ConvenienceStoresChandlerTX1Member2023-12-310001798100ntst:ConvenienceStoresChandlerTX1Membersrt:MinimumMember2023-12-310001798100ntst:ConvenienceStoresChandlerTX1Membersrt:MaximumMember2023-12-310001798100ntst:ConvenienceStoresChandlerTX2Member2023-12-310001798100ntst:ConvenienceStoresChandlerTX2Membersrt:MinimumMember2023-12-310001798100ntst:ConvenienceStoresChandlerTX2Membersrt:MaximumMember2023-12-310001798100ntst:ConvenienceStoresChandlerTX3Member2023-12-310001798100srt:MinimumMemberntst:ConvenienceStoresChandlerTX3Member2023-12-310001798100srt:MaximumMemberntst:ConvenienceStoresChandlerTX3Member2023-12-310001798100ntst:HealthcareJacksonvilleFL1Member2023-12-310001798100srt:MinimumMemberntst:HealthcareJacksonvilleFL1Member2023-12-310001798100srt:MaximumMemberntst:HealthcareJacksonvilleFL1Member2023-12-310001798100ntst:HealthcareJacksonvilleFL2Member2023-12-310001798100srt:MinimumMemberntst:HealthcareJacksonvilleFL2Member2023-12-310001798100srt:MaximumMemberntst:HealthcareJacksonvilleFL2Member2023-12-310001798100ntst:HomeImprovementLaQuintaCAMember2023-12-310001798100srt:MinimumMemberntst:HomeImprovementLaQuintaCAMember2023-12-310001798100srt:MaximumMemberntst:HomeImprovementLaQuintaCAMember2023-12-310001798100ntst:AutoPartsWestPeoriaILMember2023-12-310001798100ntst:AutoPartsWestPeoriaILMembersrt:MinimumMember2023-12-310001798100ntst:AutoPartsWestPeoriaILMembersrt:MaximumMember2023-12-310001798100ntst:AutoPartsPennHillsPAMember2023-12-310001798100ntst:AutoPartsPennHillsPAMembersrt:MinimumMember2023-12-310001798100ntst:AutoPartsPennHillsPAMembersrt:MaximumMember2023-12-310001798100ntst:AutoPartsSt.LouisMOMember2023-12-310001798100ntst:AutoPartsSt.LouisMOMembersrt:MinimumMember2023-12-310001798100ntst:AutoPartsSt.LouisMOMembersrt:MaximumMember2023-12-310001798100ntst:AutoPartsBreckenridgeHillsMOMember2023-12-310001798100ntst:AutoPartsBreckenridgeHillsMOMembersrt:MinimumMember2023-12-310001798100ntst:AutoPartsBreckenridgeHillsMOMembersrt:MaximumMember2023-12-310001798100ntst:AutoPartsBrunswickGAMember2023-12-310001798100ntst:AutoPartsBrunswickGAMembersrt:MinimumMember2023-12-310001798100ntst:AutoPartsBrunswickGAMembersrt:MaximumMember2023-12-310001798100ntst:AutoPartsFortPierceFLMember2023-12-310001798100ntst:AutoPartsFortPierceFLMembersrt:MinimumMember2023-12-310001798100ntst:AutoPartsFortPierceFLMembersrt:MaximumMember2023-12-310001798100ntst:AutoPartsLakelandFLMember2023-12-310001798100srt:MinimumMemberntst:AutoPartsLakelandFLMember2023-12-310001798100srt:MaximumMemberntst:AutoPartsLakelandFLMember2023-12-310001798100ntst:AutoPartsOrlandoFLMember2023-12-310001798100srt:MinimumMemberntst:AutoPartsOrlandoFLMember2023-12-310001798100srt:MaximumMemberntst:AutoPartsOrlandoFLMember2023-12-310001798100ntst:AutoPartsTitusvilleFLMember2023-12-310001798100ntst:AutoPartsTitusvilleFLMembersrt:MinimumMember2023-12-310001798100ntst:AutoPartsTitusvilleFLMembersrt:MaximumMember2023-12-310001798100ntst:AutoPartsClaxtonGAMember2023-12-310001798100srt:MinimumMemberntst:AutoPartsClaxtonGAMember2023-12-310001798100srt:MaximumMemberntst:AutoPartsClaxtonGAMember2023-12-310001798100ntst:AutoPartsGriffinGAMember2023-12-310001798100ntst:AutoPartsGriffinGAMembersrt:MinimumMember2023-12-310001798100ntst:AutoPartsGriffinGAMembersrt:MaximumMember2023-12-310001798100ntst:AutoPartsGonzalesLAMember2023-12-310001798100ntst:AutoPartsGonzalesLAMembersrt:MinimumMember2023-12-310001798100ntst:AutoPartsGonzalesLAMembersrt:MaximumMember2023-12-310001798100ntst:AutoPartsBaySt.LouisMSMember2023-12-310001798100ntst:AutoPartsBaySt.LouisMSMembersrt:MinimumMember2023-12-310001798100ntst:AutoPartsBaySt.LouisMSMembersrt:MaximumMember2023-12-310001798100ntst:AutoPartsBrookhavenMSMember2023-12-310001798100ntst:AutoPartsBrookhavenMSMembersrt:MinimumMember2023-12-310001798100ntst:AutoPartsBrookhavenMSMembersrt:MaximumMember2023-12-310001798100ntst:AutoPartsLaurelMSMember2023-12-310001798100ntst:AutoPartsLaurelMSMembersrt:MinimumMember2023-12-310001798100ntst:AutoPartsLaurelMSMembersrt:MaximumMember2023-12-310001798100ntst:GeneralRetailTupeloMSMember2023-12-310001798100ntst:GeneralRetailTupeloMSMembersrt:MinimumMember2023-12-310001798100ntst:GeneralRetailTupeloMSMembersrt:MaximumMember2023-12-310001798100ntst:HomeImprovementOrlandParkILMember2023-12-310001798100ntst:HomeImprovementOrlandParkILMembersrt:MinimumMember2023-12-310001798100ntst:HomeImprovementOrlandParkILMembersrt:MaximumMember2023-12-310001798100ntst:WholesaleWarehouseClubTupeloMSMember2023-12-310001798100srt:MinimumMemberntst:WholesaleWarehouseClubTupeloMSMember2023-12-310001798100srt:MaximumMemberntst:WholesaleWarehouseClubTupeloMSMember2023-12-310001798100ntst:AutoPartsBartonVTMember2023-12-310001798100ntst:AutoPartsBartonVTMembersrt:MinimumMember2023-12-310001798100ntst:AutoPartsBartonVTMembersrt:MaximumMember2023-12-310001798100ntst:AutoPartsNewportNHMember2023-12-310001798100srt:MinimumMemberntst:AutoPartsNewportNHMember2023-12-310001798100srt:MaximumMemberntst:AutoPartsNewportNHMember2023-12-310001798100ntst:AutoPartsSt.AlbansVTMember2023-12-310001798100ntst:AutoPartsSt.AlbansVTMembersrt:MinimumMember2023-12-310001798100ntst:AutoPartsSt.AlbansVTMembersrt:MaximumMember2023-12-310001798100ntst:AutoPartsColebrookNHMember2023-12-310001798100srt:MinimumMemberntst:AutoPartsColebrookNHMember2023-12-310001798100srt:MaximumMemberntst:AutoPartsColebrookNHMember2023-12-310001798100ntst:AutoPartsLancasterNHMember2023-12-310001798100ntst:AutoPartsLancasterNHMembersrt:MinimumMember2023-12-310001798100ntst:AutoPartsLancasterNHMembersrt:MaximumMember2023-12-310001798100ntst:AutoPartsMorristownVTMember2023-12-310001798100ntst:AutoPartsMorristownVTMembersrt:MinimumMember2023-12-310001798100ntst:AutoPartsMorristownVTMembersrt:MaximumMember2023-12-310001798100ntst:AutoPartsBradfordVTMember2023-12-310001798100ntst:AutoPartsBradfordVTMembersrt:MinimumMember2023-12-310001798100ntst:AutoPartsBradfordVTMembersrt:MaximumMember2023-12-310001798100ntst:HomeImprovementSalemVAMember2023-12-310001798100srt:MinimumMemberntst:HomeImprovementSalemVAMember2023-12-310001798100srt:MaximumMemberntst:HomeImprovementSalemVAMember2023-12-310001798100ntst:DollarStoresLittleRockARMember2023-12-310001798100ntst:DollarStoresLittleRockARMembersrt:MinimumMember2023-12-310001798100ntst:DollarStoresLittleRockARMembersrt:MaximumMember2023-12-310001798100ntst:AutoPartsBelpreOHMember2023-12-310001798100ntst:AutoPartsBelpreOHMembersrt:MinimumMember2023-12-310001798100ntst:AutoPartsBelpreOHMembersrt:MaximumMember2023-12-310001798100ntst:AutoPartsSpringfieldOHMember2023-12-310001798100srt:MinimumMemberntst:AutoPartsSpringfieldOHMember2023-12-310001798100srt:MaximumMemberntst:AutoPartsSpringfieldOHMember2023-12-310001798100ntst:AutoPartsMilwaukeeFondDuLacAveWIMember2023-12-310001798100srt:MinimumMemberntst:AutoPartsMilwaukeeFondDuLacAveWIMember2023-12-310001798100srt:MaximumMemberntst:AutoPartsMilwaukeeFondDuLacAveWIMember2023-12-310001798100ntst:AutoPartsWisconsinRapidsWIMember2023-12-310001798100ntst:AutoPartsWisconsinRapidsWIMembersrt:MinimumMember2023-12-310001798100ntst:AutoPartsWisconsinRapidsWIMembersrt:MaximumMember2023-12-310001798100ntst:AutoPartsEbensburgPAMember2023-12-310001798100srt:MinimumMemberntst:AutoPartsEbensburgPAMember2023-12-310001798100srt:MaximumMemberntst:AutoPartsEbensburgPAMember2023-12-310001798100ntst:AutoPartsLewistownPAMember2023-12-310001798100ntst:AutoPartsLewistownPAMembersrt:MinimumMember2023-12-310001798100ntst:AutoPartsLewistownPAMembersrt:MaximumMember2023-12-310001798100ntst:AutoPartsLedgewoodNJMember2023-12-310001798100ntst:AutoPartsLedgewoodNJMembersrt:MinimumMember2023-12-310001798100ntst:AutoPartsLedgewoodNJMembersrt:MaximumMember2023-12-310001798100ntst:AutoPartsEggHarborTownshipNJMember2023-12-310001798100srt:MinimumMemberntst:AutoPartsEggHarborTownshipNJMember2023-12-310001798100srt:MaximumMemberntst:AutoPartsEggHarborTownshipNJMember2023-12-310001798100ntst:AutoPartsQuarryvillePAMember2023-12-310001798100ntst:AutoPartsQuarryvillePAMembersrt:MinimumMember2023-12-310001798100ntst:AutoPartsQuarryvillePAMembersrt:MaximumMember2023-12-310001798100ntst:AutoPartsBallstonSpaNYMember2023-12-310001798100ntst:AutoPartsBallstonSpaNYMembersrt:MinimumMember2023-12-310001798100ntst:AutoPartsBallstonSpaNYMembersrt:MaximumMember2023-12-310001798100ntst:AutoPartsManchesterPAMember2023-12-310001798100srt:MinimumMemberntst:AutoPartsManchesterPAMember2023-12-310001798100srt:MaximumMemberntst:AutoPartsManchesterPAMember2023-12-310001798100ntst:AutoPartsMyerstownPAMember2023-12-310001798100ntst:AutoPartsMyerstownPAMembersrt:MinimumMember2023-12-310001798100ntst:AutoPartsMyerstownPAMembersrt:MaximumMember2023-12-310001798100ntst:AutoPartsGettysburgPAMember2023-12-310001798100srt:MinimumMemberntst:AutoPartsGettysburgPAMember2023-12-310001798100srt:MaximumMemberntst:AutoPartsGettysburgPAMember2023-12-310001798100ntst:AutoPartsMiddleRiverMDMember2023-12-310001798100ntst:AutoPartsMiddleRiverMDMembersrt:MinimumMember2023-12-310001798100ntst:AutoPartsMiddleRiverMDMembersrt:MaximumMember2023-12-310001798100ntst:DollarStoresPetersburgVAMember2023-12-310001798100srt:MinimumMemberntst:DollarStoresPetersburgVAMember2023-12-310001798100srt:MaximumMemberntst:DollarStoresPetersburgVAMember2023-12-310001798100ntst:DollarStoresQueensburyNYMember2023-12-310001798100ntst:DollarStoresQueensburyNYMembersrt:MinimumMember2023-12-310001798100ntst:DollarStoresQueensburyNYMembersrt:MaximumMember2023-12-310001798100ntst:HomeImprovementFargoNDMember2023-12-310001798100srt:MinimumMemberntst:HomeImprovementFargoNDMember2023-12-310001798100srt:MaximumMemberntst:HomeImprovementFargoNDMember2023-12-310001798100ntst:AutoPartsOdessaTXMember2023-12-310001798100ntst:AutoPartsOdessaTXMembersrt:MinimumMember2023-12-310001798100ntst:AutoPartsOdessaTXMembersrt:MaximumMember2023-12-310001798100ntst:AutoPartsDemooteINMember2023-12-310001798100ntst:AutoPartsDemooteINMembersrt:MinimumMember2023-12-310001798100ntst:AutoPartsDemooteINMembersrt:MaximumMember2023-12-310001798100ntst:AutoPartsGreenwoodSCMember2023-12-310001798100srt:MinimumMemberntst:AutoPartsGreenwoodSCMember2023-12-310001798100srt:MaximumMemberntst:AutoPartsGreenwoodSCMember2023-12-310001798100ntst:FarmSuppliesWeatherfordOKMember2023-12-310001798100srt:MinimumMemberntst:FarmSuppliesWeatherfordOKMember2023-12-310001798100srt:MaximumMemberntst:FarmSuppliesWeatherfordOKMember2023-12-310001798100ntst:AutoPartsMariannaFLMember2023-12-310001798100ntst:AutoPartsMariannaFLMembersrt:MinimumMember2023-12-310001798100ntst:AutoPartsMariannaFLMembersrt:MaximumMember2023-12-310001798100ntst:AutoPartsWarnerRobinsGAMember2023-12-310001798100ntst:AutoPartsWarnerRobinsGAMembersrt:MinimumMember2023-12-310001798100ntst:AutoPartsWarnerRobinsGAMembersrt:MaximumMember2023-12-310001798100ntst:DollarStoresPittsburghPAMember2023-12-310001798100ntst:DollarStoresPittsburghPAMembersrt:MinimumMember2023-12-310001798100ntst:DollarStoresPittsburghPAMembersrt:MaximumMember2023-12-310001798100ntst:ConsumerElectronicsReynoldsburgOHMember2023-12-310001798100srt:MinimumMemberntst:ConsumerElectronicsReynoldsburgOHMember2023-12-310001798100srt:MaximumMemberntst:ConsumerElectronicsReynoldsburgOHMember2023-12-310001798100ntst:HealthcareAllenTXMember2023-12-310001798100ntst:HealthcareAllenTXMembersrt:MinimumMember2023-12-310001798100ntst:HealthcareAllenTXMembersrt:MaximumMember2023-12-310001798100ntst:DiscountRetailSpokaneValleyWAMember2023-12-310001798100ntst:DiscountRetailSpokaneValleyWAMembersrt:MinimumMember2023-12-310001798100ntst:DiscountRetailSpokaneValleyWAMembersrt:MaximumMember2023-12-310001798100ntst:EquipmentRentalAndLeasingLeGrangeGAMember2023-12-310001798100ntst:EquipmentRentalAndLeasingLeGrangeGAMembersrt:MinimumMember2023-12-310001798100ntst:EquipmentRentalAndLeasingLeGrangeGAMembersrt:MaximumMember2023-12-310001798100ntst:AutoPartsLittleRockARMember2023-12-310001798100ntst:AutoPartsLittleRockARMembersrt:MinimumMember2023-12-310001798100ntst:AutoPartsLittleRockARMembersrt:MaximumMember2023-12-310001798100ntst:DrugStoresPharmaciesSemmesALMember2023-12-310001798100ntst:DrugStoresPharmaciesSemmesALMembersrt:MinimumMember2023-12-310001798100ntst:DrugStoresPharmaciesSemmesALMembersrt:MaximumMember2023-12-310001798100ntst:GroceryBeekmanNYMember2023-12-310001798100ntst:GroceryBeekmanNYMembersrt:MinimumMember2023-12-310001798100ntst:GroceryBeekmanNYMembersrt:MaximumMember2023-12-310001798100ntst:DollarStoresJohnstownPAMember2023-12-310001798100srt:MinimumMemberntst:DollarStoresJohnstownPAMember2023-12-310001798100srt:MaximumMemberntst:DollarStoresJohnstownPAMember2023-12-310001798100ntst:AutoPartsBellowsFallsVTMember2023-12-310001798100ntst:AutoPartsBellowsFallsVTMembersrt:MinimumMember2023-12-310001798100ntst:AutoPartsBellowsFallsVTMembersrt:MaximumMember2023-12-310001798100ntst:AutoPartsEnosburgFallsVTMember2023-12-310001798100ntst:AutoPartsEnosburgFallsVTMembersrt:MinimumMember2023-12-310001798100ntst:AutoPartsEnosburgFallsVTMembersrt:MaximumMember2023-12-310001798100ntst:AutoPartsSouthBarreVTMember2023-12-310001798100ntst:AutoPartsSouthBarreVTMembersrt:MinimumMember2023-12-310001798100ntst:AutoPartsSouthBarreVTMembersrt:MaximumMember2023-12-310001798100ntst:ConsumerElectronicsHeathOHMember2023-12-310001798100srt:MinimumMemberntst:ConsumerElectronicsHeathOHMember2023-12-310001798100srt:MaximumMemberntst:ConsumerElectronicsHeathOHMember2023-12-310001798100ntst:GeneralRetailKingstonMAMember2023-12-310001798100ntst:DiscountRetailTerreHauteINMember2023-12-310001798100srt:MinimumMemberntst:DiscountRetailTerreHauteINMember2023-12-310001798100srt:MaximumMemberntst:DiscountRetailTerreHauteINMember2023-12-310001798100ntst:GroceryRowlettTXMember2023-12-310001798100ntst:GroceryRowlettTXMembersrt:MinimumMember2023-12-310001798100ntst:GroceryRowlettTXMembersrt:MaximumMember2023-12-310001798100ntst:GroceryDallasTXMember2023-12-310001798100srt:MinimumMemberntst:GroceryDallasTXMember2023-12-310001798100srt:MaximumMemberntst:GroceryDallasTXMember2023-12-310001798100ntst:QuickServiceRestaurantsWarnerRobinsGAMember2023-12-310001798100ntst:DollarStoresChesterPAMember2023-12-310001798100ntst:DollarStoresChesterPAMembersrt:MinimumMember2023-12-310001798100ntst:DollarStoresChesterPAMembersrt:MaximumMember2023-12-310001798100ntst:HomeImprovementBentonHarborMIMember2023-12-310001798100ntst:HomeImprovementBentonHarborMIMembersrt:MinimumMember2023-12-310001798100ntst:HomeImprovementBentonHarborMIMembersrt:MaximumMember2023-12-310001798100ntst:HealthcareSchnecksvillePAMember2023-12-310001798100srt:MinimumMemberntst:HealthcareSchnecksvillePAMember2023-12-310001798100srt:MaximumMemberntst:HealthcareSchnecksvillePAMember2023-12-310001798100ntst:DiscountRetailYumaAZMember2023-12-310001798100ntst:DiscountRetailYumaAZMembersrt:MinimumMember2023-12-310001798100ntst:DiscountRetailYumaAZMembersrt:MaximumMember2023-12-310001798100ntst:ConvenienceStoresPalmCoastFLMember2023-12-310001798100srt:MinimumMemberntst:ConvenienceStoresPalmCoastFLMember2023-12-310001798100srt:MaximumMemberntst:ConvenienceStoresPalmCoastFLMember2023-12-310001798100ntst:DollarStoresBirminghamALMember2023-12-310001798100ntst:DollarStoresBirminghamALMembersrt:MinimumMember2023-12-310001798100ntst:DollarStoresBirminghamALMembersrt:MaximumMember2023-12-310001798100ntst:DollarStoresWaycrossGAMember2023-12-310001798100ntst:DollarStoresWaycrossGAMembersrt:MinimumMember2023-12-310001798100ntst:DollarStoresWaycrossGAMembersrt:MaximumMember2023-12-310001798100ntst:DollarStoresOcoeeFLMember2023-12-310001798100srt:MinimumMemberntst:DollarStoresOcoeeFLMember2023-12-310001798100srt:MaximumMemberntst:DollarStoresOcoeeFLMember2023-12-310001798100ntst:AutoPartsBridgeportCTMember2023-12-310001798100ntst:AutoPartsBridgeportCTMembersrt:MinimumMember2023-12-310001798100ntst:AutoPartsBridgeportCTMembersrt:MaximumMember2023-12-310001798100ntst:DollarStoresThomasvilleNCMember2023-12-310001798100srt:MinimumMemberntst:DollarStoresThomasvilleNCMember2023-12-310001798100srt:MaximumMemberntst:DollarStoresThomasvilleNCMember2023-12-310001798100ntst:DollarStoresPertersburgVAMember2023-12-310001798100ntst:DollarStoresPertersburgVAMembersrt:MinimumMember2023-12-310001798100ntst:DollarStoresPertersburgVAMembersrt:MaximumMember2023-12-310001798100ntst:EquipmentRentalAndLeasingHilliardOHMember2023-12-310001798100srt:MinimumMemberntst:EquipmentRentalAndLeasingHilliardOHMember2023-12-310001798100srt:MaximumMemberntst:EquipmentRentalAndLeasingHilliardOHMember2023-12-310001798100ntst:AutoPartsUticaNYMember2023-12-310001798100srt:MinimumMemberntst:AutoPartsUticaNYMember2023-12-310001798100srt:MaximumMemberntst:AutoPartsUticaNYMember2023-12-310001798100ntst:AutomotiveServiceWichitaKSMember2023-12-310001798100ntst:AutomotiveServiceWichitaKSMembersrt:MinimumMember2023-12-310001798100ntst:AutomotiveServiceWichitaKSMembersrt:MaximumMember2023-12-310001798100ntst:AutoPartsBellinghamMAMember2023-12-310001798100srt:MinimumMemberntst:AutoPartsBellinghamMAMember2023-12-310001798100srt:MaximumMemberntst:AutoPartsBellinghamMAMember2023-12-310001798100ntst:GeneralRetailGreeceNYMember2023-12-310001798100srt:MinimumMemberntst:GeneralRetailGreeceNYMember2023-12-310001798100srt:MaximumMemberntst:GeneralRetailGreeceNYMember2023-12-310001798100ntst:ArtsCraftsOlympiaWAMember2023-12-310001798100srt:MinimumMemberntst:ArtsCraftsOlympiaWAMember2023-12-310001798100srt:MaximumMemberntst:ArtsCraftsOlympiaWAMember2023-12-310001798100ntst:ArtsCraftsSpringfieldILMember2023-12-310001798100ntst:ArtsCraftsSpringfieldILMembersrt:MinimumMember2023-12-310001798100ntst:ArtsCraftsSpringfieldILMembersrt:MaximumMember2023-12-310001798100ntst:ArtsCraftsFortDodgeIAMember2023-12-310001798100ntst:ArtsCraftsFortDodgeIAMembersrt:MinimumMember2023-12-310001798100ntst:ArtsCraftsFortDodgeIAMembersrt:MaximumMember2023-12-310001798100ntst:AutoPartsBethelVTMember2023-12-310001798100ntst:AutoPartsBethelVTMembersrt:MinimumMember2023-12-310001798100ntst:AutoPartsBethelVTMembersrt:MaximumMember2023-12-310001798100ntst:AutoPartsSpringfieldVTMember2023-12-310001798100ntst:AutoPartsSpringfieldVTMembersrt:MinimumMember2023-12-310001798100ntst:AutoPartsSpringfieldVTMembersrt:MaximumMember2023-12-310001798100ntst:DiscountRetailFortDodgeIAMember2023-12-310001798100srt:MinimumMemberntst:DiscountRetailFortDodgeIAMember2023-12-310001798100srt:MaximumMemberntst:DiscountRetailFortDodgeIAMember2023-12-310001798100ntst:DollarStoresToledoOHMember2023-12-310001798100srt:MinimumMemberntst:DollarStoresToledoOHMember2023-12-310001798100srt:MaximumMemberntst:DollarStoresToledoOHMember2023-12-310001798100ntst:DollarStoresFranklinOHMember2023-12-310001798100srt:MinimumMemberntst:DollarStoresFranklinOHMember2023-12-310001798100srt:MaximumMemberntst:DollarStoresFranklinOHMember2023-12-310001798100ntst:DrugStoresPharmaciesSpencerINMember2023-12-310001798100ntst:DrugStoresPharmaciesSpencerINMembersrt:MinimumMember2023-12-310001798100ntst:DrugStoresPharmaciesSpencerINMembersrt:MaximumMember2023-12-310001798100ntst:DrugStoresPharmaciesIndianapolisIN2Member2023-12-310001798100ntst:DrugStoresPharmaciesIndianapolisIN2Membersrt:MinimumMember2023-12-310001798100ntst:DrugStoresPharmaciesIndianapolisIN2Membersrt:MaximumMember2023-12-310001798100ntst:FarmSuppliesOlympiaWAMember2023-12-310001798100ntst:FarmSuppliesOlympiaWAMembersrt:MinimumMember2023-12-310001798100ntst:FarmSuppliesOlympiaWAMembersrt:MaximumMember2023-12-310001798100ntst:GroceryMt.GileadOHMember2023-12-310001798100ntst:GroceryMt.GileadOHMembersrt:MinimumMember2023-12-310001798100ntst:GroceryMt.GileadOHMembersrt:MaximumMember2023-12-310001798100ntst:GroceryRioRanchoNMMember2023-12-310001798100ntst:GroceryRioRanchoNMMembersrt:MinimumMember2023-12-310001798100ntst:GroceryRioRanchoNMMembersrt:MaximumMember2023-12-310001798100ntst:HomeImprovementMerrillvilleINMember2023-12-310001798100ntst:HomeImprovementMerrillvilleINMembersrt:MinimumMember2023-12-310001798100ntst:HomeImprovementMerrillvilleINMembersrt:MaximumMember2023-12-310001798100ntst:DrugStoresPharmaciesHemingwaySCMember2023-12-310001798100ntst:DrugStoresPharmaciesHemingwaySCMembersrt:MinimumMember2023-12-310001798100ntst:DrugStoresPharmaciesHemingwaySCMembersrt:MaximumMember2023-12-310001798100ntst:AutoPartsRockyMountNCMember2023-12-310001798100ntst:DrugStoresPharmaciesKenoshaWIMember2023-12-310001798100ntst:DrugStoresPharmaciesKenoshaWIMembersrt:MinimumMember2023-12-310001798100ntst:DrugStoresPharmaciesKenoshaWIMembersrt:MaximumMember2023-12-310001798100ntst:ConvenienceStoresGeorgetownSCMember2023-12-310001798100ntst:ConvenienceStoresGeorgetownSCMembersrt:MinimumMember2023-12-310001798100ntst:ConvenienceStoresGeorgetownSCMembersrt:MaximumMember2023-12-310001798100ntst:ConvenienceStoresPortolaCAMember2023-12-310001798100ntst:ConvenienceStoresPortolaCAMembersrt:MinimumMember2023-12-310001798100ntst:ConvenienceStoresPortolaCAMembersrt:MaximumMember2023-12-310001798100ntst:ConvenienceStoresJamestownCAMember2023-12-310001798100ntst:ConvenienceStoresJamestownCAMembersrt:MinimumMember2023-12-310001798100ntst:ConvenienceStoresJamestownCAMembersrt:MaximumMember2023-12-310001798100ntst:ConvenienceStoresAuburnCAMember2023-12-310001798100ntst:ConvenienceStoresAuburnCAMembersrt:MinimumMember2023-12-310001798100ntst:ConvenienceStoresAuburnCAMembersrt:MaximumMember2023-12-310001798100ntst:ConvenienceStoresWallaceCAMember2023-12-310001798100ntst:ConvenienceStoresWallaceCAMembersrt:MinimumMember2023-12-310001798100ntst:ConvenienceStoresWallaceCAMembersrt:MaximumMember2023-12-310001798100ntst:ConvenienceStoresColfaxCAMember2023-12-310001798100srt:MinimumMemberntst:ConvenienceStoresColfaxCAMember2023-12-310001798100srt:MaximumMemberntst:ConvenienceStoresColfaxCAMember2023-12-310001798100ntst:ArtsCraftsFondDuLacWIMember2023-12-310001798100srt:MinimumMemberntst:ArtsCraftsFondDuLacWIMember2023-12-310001798100srt:MaximumMemberntst:ArtsCraftsFondDuLacWIMember2023-12-310001798100ntst:DiscountRetailFondDuLacWI1Member2023-12-310001798100ntst:DiscountRetailFondDuLacWI1Membersrt:MinimumMember2023-12-310001798100ntst:DiscountRetailFondDuLacWI1Membersrt:MaximumMember2023-12-310001798100ntst:ArtsCraftsHeathOHMember2023-12-310001798100ntst:ArtsCraftsHeathOHMembersrt:MinimumMember2023-12-310001798100ntst:ArtsCraftsHeathOHMembersrt:MaximumMember2023-12-310001798100ntst:GroceryMonroeWIMember2023-12-310001798100srt:MinimumMemberntst:GroceryMonroeWIMember2023-12-310001798100srt:MaximumMemberntst:GroceryMonroeWIMember2023-12-310001798100ntst:QuickServiceRestaurantsBardstownKYMember2023-12-310001798100srt:MinimumMemberntst:QuickServiceRestaurantsBardstownKYMember2023-12-310001798100srt:MaximumMemberntst:QuickServiceRestaurantsBardstownKYMember2023-12-310001798100ntst:ConsumerElectronicsBrownsvilleTXMember2023-12-310001798100ntst:ConsumerElectronicsBrownsvilleTXMembersrt:MinimumMember2023-12-310001798100ntst:ConsumerElectronicsBrownsvilleTXMembersrt:MaximumMember2023-12-310001798100ntst:ConsumerElectronicsToledoOHMember2023-12-310001798100ntst:ConsumerElectronicsToledoOHMembersrt:MinimumMember2023-12-310001798100ntst:ConsumerElectronicsToledoOHMembersrt:MaximumMember2023-12-310001798100ntst:DollarStoresDaytonOHMember2023-12-310001798100srt:MinimumMemberntst:DollarStoresDaytonOHMember2023-12-310001798100srt:MaximumMemberntst:DollarStoresDaytonOHMember2023-12-310001798100ntst:DollarStoresSchenectadyNYMember2023-12-310001798100ntst:DollarStoresSchenectadyNYMembersrt:MinimumMember2023-12-310001798100ntst:DollarStoresSchenectadyNYMembersrt:MaximumMember2023-12-310001798100ntst:DollarStoresDrydenNYMember2023-12-310001798100ntst:DollarStoresDrydenNYMembersrt:MinimumMember2023-12-310001798100ntst:DollarStoresDrydenNYMembersrt:MaximumMember2023-12-310001798100ntst:DollarStoresPrattsburghNYMember2023-12-310001798100srt:MinimumMemberntst:DollarStoresPrattsburghNYMember2023-12-310001798100srt:MaximumMemberntst:DollarStoresPrattsburghNYMember2023-12-310001798100ntst:DollarStoresGermantownNYMember2023-12-310001798100srt:MinimumMemberntst:DollarStoresGermantownNYMember2023-12-310001798100srt:MaximumMemberntst:DollarStoresGermantownNYMember2023-12-310001798100ntst:DollarStoresLanesboroughMAMember2023-12-310001798100ntst:DollarStoresLanesboroughMAMembersrt:MinimumMember2023-12-310001798100ntst:DollarStoresLanesboroughMAMembersrt:MaximumMember2023-12-310001798100ntst:DollarStoresMayfieldNYMember2023-12-310001798100ntst:DollarStoresMayfieldNYMembersrt:MinimumMember2023-12-310001798100ntst:DollarStoresMayfieldNYMembersrt:MaximumMember2023-12-310001798100ntst:DollarStoresBallstonSpaNYMember2023-12-310001798100ntst:DollarStoresBallstonSpaNYMembersrt:MinimumMember2023-12-310001798100ntst:DollarStoresBallstonSpaNYMembersrt:MaximumMember2023-12-310001798100ntst:DollarStoresTrotwoodOHMember2023-12-310001798100srt:MinimumMemberntst:DollarStoresTrotwoodOHMember2023-12-310001798100srt:MaximumMemberntst:DollarStoresTrotwoodOHMember2023-12-310001798100ntst:ConsumerElectronicsBurbankILMember2023-12-310001798100ntst:ConsumerElectronicsBurbankILMembersrt:MinimumMember2023-12-310001798100ntst:ConsumerElectronicsBurbankILMembersrt:MaximumMember2023-12-310001798100ntst:DollarStoresOklahomaCityOK1Member2023-12-310001798100ntst:DollarStoresOklahomaCityOK1Membersrt:MinimumMember2023-12-310001798100ntst:DollarStoresOklahomaCityOK1Membersrt:MaximumMember2023-12-310001798100ntst:HomeImprovementAlsipILMember2023-12-310001798100srt:MinimumMemberntst:HomeImprovementAlsipILMember2023-12-310001798100srt:MaximumMemberntst:HomeImprovementAlsipILMember2023-12-310001798100ntst:QuickServiceRestaurantsOklahomaCityOKMember2023-12-310001798100ntst:ArtsCraftsWashingtonPAMember2023-12-310001798100ntst:ArtsCraftsWashingtonPAMembersrt:MinimumMember2023-12-310001798100ntst:ArtsCraftsWashingtonPAMembersrt:MaximumMember2023-12-310001798100ntst:HomeImprovementSiouxFallsSDMember2023-12-310001798100ntst:HomeImprovementSiouxFallsSDMembersrt:MinimumMember2023-12-310001798100ntst:HomeImprovementSiouxFallsSDMembersrt:MaximumMember2023-12-310001798100ntst:AutoPartsHoumaLAMember2023-12-310001798100ntst:AutoPartsHoumaLAMembersrt:MinimumMember2023-12-310001798100ntst:AutoPartsHoumaLAMembersrt:MaximumMember2023-12-310001798100ntst:ArtsCraftsSumterSCMember2023-12-310001798100srt:MinimumMemberntst:ArtsCraftsSumterSCMember2023-12-310001798100srt:MaximumMemberntst:ArtsCraftsSumterSCMember2023-12-310001798100ntst:DiscountRetailSumterSCMember2023-12-310001798100ntst:DiscountRetailSumterSCMembersrt:MinimumMember2023-12-310001798100ntst:DiscountRetailSumterSCMembersrt:MaximumMember2023-12-310001798100ntst:DiscountRetailCaliforniaMDMember2023-12-310001798100srt:MinimumMemberntst:DiscountRetailCaliforniaMDMember2023-12-310001798100srt:MaximumMemberntst:DiscountRetailCaliforniaMDMember2023-12-310001798100ntst:QuickServiceRestaurantsDanvilleINMember2023-12-310001798100srt:MinimumMemberntst:QuickServiceRestaurantsDanvilleINMember2023-12-310001798100srt:MaximumMemberntst:QuickServiceRestaurantsDanvilleINMember2023-12-310001798100ntst:HealthcareHoustonTX1Member2023-12-310001798100ntst:HealthcareHoustonTX1Membersrt:MinimumMember2023-12-310001798100ntst:HealthcareHoustonTX1Membersrt:MaximumMember2023-12-310001798100ntst:DollarStoresIvaSCMember2023-12-310001798100srt:MinimumMemberntst:DollarStoresIvaSCMember2023-12-310001798100srt:MaximumMemberntst:DollarStoresIvaSCMember2023-12-310001798100ntst:DiscountRetailDunbarWVMember2023-12-310001798100ntst:DiscountRetailDunbarWVMembersrt:MinimumMember2023-12-310001798100ntst:DiscountRetailDunbarWVMembersrt:MaximumMember2023-12-310001798100ntst:DollarStoresAkronOHMember2023-12-310001798100ntst:DollarStoresAkronOHMembersrt:MinimumMember2023-12-310001798100ntst:DollarStoresAkronOHMembersrt:MaximumMember2023-12-310001798100ntst:DrugStoresPharmaciesCottonwoodAZMember2023-12-310001798100ntst:DrugStoresPharmaciesCottonwoodAZMembersrt:MinimumMember2023-12-310001798100ntst:DrugStoresPharmaciesCottonwoodAZMembersrt:MaximumMember2023-12-310001798100ntst:DrugStoresPharmaciesLouisvilleKYMember2023-12-310001798100ntst:DrugStoresPharmaciesLouisvilleKYMembersrt:MinimumMember2023-12-310001798100ntst:DrugStoresPharmaciesLouisvilleKYMembersrt:MaximumMember2023-12-310001798100ntst:DrugStoresPharmaciesRioRanchoNMMember2023-12-310001798100srt:MinimumMemberntst:DrugStoresPharmaciesRioRanchoNMMember2023-12-310001798100srt:MaximumMemberntst:DrugStoresPharmaciesRioRanchoNMMember2023-12-310001798100ntst:DrugStoresPharmaciesMentorOHMember2023-12-310001798100ntst:DrugStoresPharmaciesMentorOHMembersrt:MinimumMember2023-12-310001798100ntst:DrugStoresPharmaciesMentorOHMembersrt:MaximumMember2023-12-310001798100ntst:DrugStoresPharmaciesMolineILMember2023-12-310001798100ntst:DrugStoresPharmaciesMolineILMembersrt:MinimumMember2023-12-310001798100ntst:DrugStoresPharmaciesMolineILMembersrt:MaximumMember2023-12-310001798100ntst:DrugStoresPharmaciesDecaturILMember2023-12-310001798100srt:MinimumMemberntst:DrugStoresPharmaciesDecaturILMember2023-12-310001798100srt:MaximumMemberntst:DrugStoresPharmaciesDecaturILMember2023-12-310001798100ntst:DrugStoresPharmaciesHammondINMember2023-12-310001798100ntst:DrugStoresPharmaciesHammondINMembersrt:MinimumMember2023-12-310001798100ntst:DrugStoresPharmaciesHammondINMembersrt:MaximumMember2023-12-310001798100ntst:DrugStoresPharmaciesEdinburgTXMember2023-12-310001798100ntst:DrugStoresPharmaciesEdinburgTXMembersrt:MinimumMember2023-12-310001798100ntst:DrugStoresPharmaciesEdinburgTXMembersrt:MaximumMember2023-12-310001798100ntst:DrugStoresPharmaciesRockfordIL1Member2023-12-310001798100ntst:DrugStoresPharmaciesRockfordIL1Membersrt:MinimumMember2023-12-310001798100ntst:DrugStoresPharmaciesRockfordIL1Membersrt:MaximumMember2023-12-310001798100ntst:DrugStoresPharmaciesChicagoILMember2023-12-310001798100ntst:DrugStoresPharmaciesChicagoILMembersrt:MinimumMember2023-12-310001798100ntst:DrugStoresPharmaciesChicagoILMembersrt:MaximumMember2023-12-310001798100ntst:DrugStoresPharmaciesJerseyvilleILMember2023-12-310001798100ntst:DrugStoresPharmaciesJerseyvilleILMembersrt:MinimumMember2023-12-310001798100ntst:DrugStoresPharmaciesJerseyvilleILMembersrt:MaximumMember2023-12-310001798100ntst:HealthcareRantoulILMember2023-12-310001798100ntst:HealthcareRantoulILMembersrt:MinimumMember2023-12-310001798100ntst:HealthcareRantoulILMembersrt:MaximumMember2023-12-310001798100ntst:HealthcareDanvilleILMember2023-12-310001798100ntst:HealthcareDanvilleILMembersrt:MinimumMember2023-12-310001798100ntst:HealthcareDanvilleILMembersrt:MaximumMember2023-12-310001798100ntst:HealthcareUrbanaILMember2023-12-310001798100ntst:HealthcareUrbanaILMembersrt:MinimumMember2023-12-310001798100ntst:HealthcareUrbanaILMembersrt:MaximumMember2023-12-310001798100ntst:GrocerySlidellLA1Member2023-12-310001798100ntst:GrocerySlidellLA1Membersrt:MinimumMember2023-12-310001798100ntst:GrocerySlidellLA1Membersrt:MaximumMember2023-12-310001798100ntst:GrocerySlidellLA2Member2023-12-310001798100ntst:GrocerySlidellLA2Membersrt:MinimumMember2023-12-310001798100ntst:GrocerySlidellLA2Membersrt:MaximumMember2023-12-310001798100ntst:DiscountRetailOakwoodOHMember2023-12-310001798100ntst:DiscountRetailOakwoodOHMembersrt:MinimumMember2023-12-310001798100ntst:DiscountRetailOakwoodOHMembersrt:MaximumMember2023-12-310001798100ntst:CasualDiningAvondaleILMember2023-12-310001798100ntst:HealthAndFitnessAvondaleILMember2023-12-310001798100ntst:HealthAndFitnessAvondaleILMembersrt:MinimumMember2023-12-310001798100ntst:HealthAndFitnessAvondaleILMembersrt:MaximumMember2023-12-310001798100ntst:HomeImprovementAvondaleILMember2023-12-310001798100srt:MinimumMemberntst:HomeImprovementAvondaleILMember2023-12-310001798100srt:MaximumMemberntst:HomeImprovementAvondaleILMember2023-12-310001798100ntst:HomeImprovementRacineWIMember2023-12-310001798100srt:MinimumMemberntst:HomeImprovementRacineWIMember2023-12-310001798100srt:MaximumMemberntst:HomeImprovementRacineWIMember2023-12-310001798100ntst:ArtsCraftsFlagstaffAZMember2023-12-310001798100ntst:ArtsCraftsFlagstaffAZMembersrt:MinimumMember2023-12-310001798100ntst:ArtsCraftsFlagstaffAZMembersrt:MaximumMember2023-12-310001798100ntst:DiscountRetailOrovilleCAMember2023-12-310001798100ntst:DiscountRetailOrovilleCAMembersrt:MinimumMember2023-12-310001798100ntst:DiscountRetailOrovilleCAMembersrt:MaximumMember2023-12-310001798100ntst:EquipmentRentalAndLeasingWarnerRobinsGAMember2023-12-310001798100ntst:EquipmentRentalAndLeasingWarnerRobinsGAMembersrt:MinimumMember2023-12-310001798100ntst:EquipmentRentalAndLeasingWarnerRobinsGAMembersrt:MaximumMember2023-12-310001798100ntst:HomeImprovementGreenBayWIMember2023-12-310001798100srt:MinimumMemberntst:HomeImprovementGreenBayWIMember2023-12-310001798100srt:MaximumMemberntst:HomeImprovementGreenBayWIMember2023-12-310001798100ntst:DollarStoresWoodlandALMember2023-12-310001798100srt:MinimumMemberntst:DollarStoresWoodlandALMember2023-12-310001798100srt:MaximumMemberntst:DollarStoresWoodlandALMember2023-12-310001798100ntst:EquipmentRentalAndLeasingCortlandOHMember2023-12-310001798100ntst:EquipmentRentalAndLeasingCortlandOHMembersrt:MinimumMember2023-12-310001798100ntst:EquipmentRentalAndLeasingCortlandOHMembersrt:MaximumMember2023-12-310001798100ntst:ConsumerElectronicsBatonRougeLAMember2023-12-310001798100ntst:ConsumerElectronicsBatonRougeLAMembersrt:MinimumMember2023-12-310001798100ntst:ConsumerElectronicsBatonRougeLAMembersrt:MaximumMember2023-12-310001798100ntst:DollarStoresSpringfieldOHMember2023-12-310001798100srt:MinimumMemberntst:DollarStoresSpringfieldOHMember2023-12-310001798100srt:MaximumMemberntst:DollarStoresSpringfieldOHMember2023-12-310001798100ntst:ArtsCraftsSheboyganWIMember2023-12-310001798100srt:MinimumMemberntst:ArtsCraftsSheboyganWIMember2023-12-310001798100srt:MaximumMemberntst:ArtsCraftsSheboyganWIMember2023-12-310001798100ntst:DiscountRetailSheboyganWIMember2023-12-310001798100srt:MinimumMemberntst:DiscountRetailSheboyganWIMember2023-12-310001798100srt:MaximumMemberntst:DiscountRetailSheboyganWIMember2023-12-310001798100ntst:DollarStoresOklahomaCityOK2Member2023-12-310001798100ntst:DollarStoresOklahomaCityOK2Membersrt:MinimumMember2023-12-310001798100ntst:DollarStoresOklahomaCityOK2Membersrt:MaximumMember2023-12-310001798100ntst:DollarStoresHarperWoodsMIMember2023-12-310001798100ntst:DollarStoresHarperWoodsMIMembersrt:MinimumMember2023-12-310001798100ntst:DollarStoresHarperWoodsMIMembersrt:MaximumMember2023-12-310001798100ntst:AutomotiveServiceMiddletownOHMember2023-12-310001798100srt:MinimumMemberntst:AutomotiveServiceMiddletownOHMember2023-12-310001798100srt:MaximumMemberntst:AutomotiveServiceMiddletownOHMember2023-12-310001798100ntst:AutomotiveServiceHamiltonOH1Member2023-12-310001798100ntst:AutomotiveServiceHamiltonOH1Membersrt:MinimumMember2023-12-310001798100ntst:AutomotiveServiceHamiltonOH1Membersrt:MaximumMember2023-12-310001798100ntst:AutomotiveServiceHamiltonOH2Member2023-12-310001798100srt:MinimumMemberntst:AutomotiveServiceHamiltonOH2Member2023-12-310001798100srt:MaximumMemberntst:AutomotiveServiceHamiltonOH2Member2023-12-310001798100ntst:DollarStoresColumbusGAMember2023-12-310001798100ntst:DollarStoresColumbusGAMembersrt:MinimumMember2023-12-310001798100ntst:DollarStoresColumbusGAMembersrt:MaximumMember2023-12-310001798100ntst:DollarStoresPhenixCityAL1Member2023-12-310001798100ntst:DollarStoresPhenixCityAL1Membersrt:MinimumMember2023-12-310001798100ntst:DollarStoresPhenixCityAL1Membersrt:MaximumMember2023-12-310001798100ntst:DrugStoresPharmaciesGalesFerryCTMember2023-12-310001798100ntst:DrugStoresPharmaciesGalesFerryCTMembersrt:MinimumMember2023-12-310001798100ntst:DrugStoresPharmaciesGalesFerryCTMembersrt:MaximumMember2023-12-310001798100ntst:DrugStoresPharmaciesSt.JosephMIMember2023-12-310001798100ntst:DrugStoresPharmaciesSt.JosephMIMembersrt:MinimumMember2023-12-310001798100ntst:DrugStoresPharmaciesSt.JosephMIMembersrt:MaximumMember2023-12-310001798100ntst:DrugStoresPharmaciesElCentroCAMember2023-12-310001798100srt:MinimumMemberntst:DrugStoresPharmaciesElCentroCAMember2023-12-310001798100srt:MaximumMemberntst:DrugStoresPharmaciesElCentroCAMember2023-12-310001798100ntst:DrugStoresPharmaciesGrotonCTMember2023-12-310001798100ntst:DrugStoresPharmaciesGrotonCTMembersrt:MinimumMember2023-12-310001798100ntst:DrugStoresPharmaciesGrotonCTMembersrt:MaximumMember2023-12-310001798100ntst:DiscountRetailGrandIslandNEMember2023-12-310001798100ntst:DiscountRetailGrandIslandNEMembersrt:MinimumMember2023-12-310001798100ntst:DiscountRetailGrandIslandNEMembersrt:MaximumMember2023-12-310001798100ntst:ArtsCraftsDIbervilleMSMember2023-12-310001798100ntst:ArtsCraftsDIbervilleMSMembersrt:MinimumMember2023-12-310001798100ntst:ArtsCraftsDIbervilleMSMembersrt:MaximumMember2023-12-310001798100ntst:AutoPartsSyracuseNYMember2023-12-310001798100ntst:AutoPartsSyracuseNYMembersrt:MinimumMember2023-12-310001798100ntst:AutoPartsSyracuseNYMembersrt:MaximumMember2023-12-310001798100ntst:ArtsCraftsWinderGAMember2023-12-310001798100ntst:ArtsCraftsWinderGAMembersrt:MinimumMember2023-12-310001798100ntst:ArtsCraftsWinderGAMembersrt:MaximumMember2023-12-310001798100ntst:AutoPartsGoldenCOMember2023-12-310001798100ntst:AutoPartsGoldenCOMembersrt:MinimumMember2023-12-310001798100ntst:AutoPartsGoldenCOMembersrt:MaximumMember2023-12-310001798100ntst:AutoPartsLithoniaGAMember2023-12-310001798100srt:MinimumMemberntst:AutoPartsLithoniaGAMember2023-12-310001798100srt:MaximumMemberntst:AutoPartsLithoniaGAMember2023-12-310001798100ntst:GroceryOmahaNEMember2023-12-310001798100ntst:GroceryOmahaNEMembersrt:MinimumMember2023-12-310001798100ntst:GroceryOmahaNEMembersrt:MaximumMember2023-12-310001798100ntst:ArtsCraftsDouglasGAMember2023-12-310001798100ntst:ArtsCraftsDouglasGAMembersrt:MinimumMember2023-12-310001798100ntst:ArtsCraftsDouglasGAMembersrt:MaximumMember2023-12-310001798100ntst:HealthcareDentonTXMember2023-12-310001798100ntst:HealthcareDentonTXMembersrt:MinimumMember2023-12-310001798100ntst:HealthcareDentonTXMembersrt:MaximumMember2023-12-310001798100ntst:AutoPartsDecaturGAMember2023-12-310001798100srt:MinimumMemberntst:AutoPartsDecaturGAMember2023-12-310001798100srt:MaximumMemberntst:AutoPartsDecaturGAMember2023-12-310001798100ntst:DollarStoresFairHavenVTMember2023-12-310001798100ntst:DollarStoresFairHavenVTMembersrt:MinimumMember2023-12-310001798100ntst:DollarStoresFairHavenVTMembersrt:MaximumMember2023-12-310001798100ntst:DollarStoresMoreheadCityNCMember2023-12-310001798100ntst:DollarStoresMoreheadCityNCMembersrt:MinimumMember2023-12-310001798100ntst:DollarStoresMoreheadCityNCMembersrt:MaximumMember2023-12-310001798100ntst:HomeImprovementLitchfieldILMember2023-12-310001798100ntst:HomeImprovementLitchfieldILMembersrt:MinimumMember2023-12-310001798100ntst:HomeImprovementLitchfieldILMembersrt:MaximumMember2023-12-310001798100ntst:DrugStoresPharmaciesMobileALMember2023-12-310001798100ntst:DrugStoresPharmaciesMobileALMembersrt:MinimumMember2023-12-310001798100ntst:DrugStoresPharmaciesMobileALMembersrt:MaximumMember2023-12-310001798100ntst:DollarStoresMonticelloGAMember2023-12-310001798100srt:MinimumMemberntst:DollarStoresMonticelloGAMember2023-12-310001798100srt:MaximumMemberntst:DollarStoresMonticelloGAMember2023-12-310001798100ntst:DollarStoresOvertonNVMember2023-12-310001798100srt:MinimumMemberntst:DollarStoresOvertonNVMember2023-12-310001798100srt:MaximumMemberntst:DollarStoresOvertonNVMember2023-12-310001798100ntst:DollarStoresNaturitaCOMember2023-12-310001798100srt:MinimumMemberntst:DollarStoresNaturitaCOMember2023-12-310001798100srt:MaximumMemberntst:DollarStoresNaturitaCOMember2023-12-310001798100ntst:DollarStoresMilfordUTMember2023-12-310001798100srt:MinimumMemberntst:DollarStoresMilfordUTMember2023-12-310001798100srt:MaximumMemberntst:DollarStoresMilfordUTMember2023-12-310001798100ntst:HomeImprovementEdgewoodNMMember2023-12-310001798100ntst:HomeImprovementEdgewoodNMMembersrt:MinimumMember2023-12-310001798100ntst:HomeImprovementEdgewoodNMMembersrt:MaximumMember2023-12-310001798100ntst:HomeImprovementHermitagePAMember2023-12-310001798100ntst:HomeImprovementHermitagePAMembersrt:MinimumMember2023-12-310001798100ntst:HomeImprovementHermitagePAMembersrt:MaximumMember2023-12-310001798100ntst:HealthcareHoustonTX2Member2023-12-310001798100srt:MinimumMemberntst:HealthcareHoustonTX2Member2023-12-310001798100srt:MaximumMemberntst:HealthcareHoustonTX2Member2023-12-310001798100ntst:HealthcareAmarilloTXMember2023-12-310001798100ntst:HealthcareAmarilloTXMembersrt:MinimumMember2023-12-310001798100ntst:HealthcareAmarilloTXMembersrt:MaximumMember2023-12-310001798100ntst:HealthcareKaufmanTXMember2023-12-310001798100ntst:HealthcareKaufmanTXMembersrt:MinimumMember2023-12-310001798100ntst:HealthcareKaufmanTXMembersrt:MaximumMember2023-12-310001798100ntst:DollarStoresElyNVMember2023-12-310001798100srt:MinimumMemberntst:DollarStoresElyNVMember2023-12-310001798100srt:MaximumMemberntst:DollarStoresElyNVMember2023-12-310001798100ntst:ArtsCraftsDothanALMember2023-12-310001798100ntst:ArtsCraftsDothanALMembersrt:MinimumMember2023-12-310001798100ntst:ArtsCraftsDothanALMembersrt:MaximumMember2023-12-310001798100ntst:CasualDiningDothanALMember2023-12-310001798100ntst:CasualDiningDothanALMembersrt:MinimumMember2023-12-310001798100ntst:CasualDiningDothanALMembersrt:MaximumMember2023-12-310001798100ntst:DiscountRetailAlpenaMIMember2023-12-310001798100ntst:DiscountRetailAlpenaMIMembersrt:MinimumMember2023-12-310001798100ntst:DiscountRetailAlpenaMIMembersrt:MaximumMember2023-12-310001798100ntst:GroceryDothanALMember2023-12-310001798100ntst:GroceryDothanALMembersrt:MinimumMember2023-12-310001798100ntst:GroceryDothanALMembersrt:MaximumMember2023-12-310001798100ntst:QuickServiceRestaurantsDothanALMember2023-12-310001798100srt:MinimumMemberntst:QuickServiceRestaurantsDothanALMember2023-12-310001798100srt:MaximumMemberntst:QuickServiceRestaurantsDothanALMember2023-12-310001798100ntst:DollarStoresLivoniaMIMember2023-12-310001798100srt:MinimumMemberntst:DollarStoresLivoniaMIMember2023-12-310001798100srt:MaximumMemberntst:DollarStoresLivoniaMIMember2023-12-310001798100ntst:DollarStoresLewistownPAMember2023-12-310001798100srt:MinimumMemberntst:DollarStoresLewistownPAMember2023-12-310001798100srt:MaximumMemberntst:DollarStoresLewistownPAMember2023-12-310001798100ntst:DollarStoresOrrstownPAMember2023-12-310001798100srt:MinimumMemberntst:DollarStoresOrrstownPAMember2023-12-310001798100srt:MaximumMemberntst:DollarStoresOrrstownPAMember2023-12-310001798100ntst:GeneralRetailKansasCityKSMember2023-12-310001798100ntst:GeneralRetailKansasCityKSMembersrt:MinimumMember2023-12-310001798100ntst:GeneralRetailKansasCityKSMembersrt:MaximumMember2023-12-310001798100ntst:DrugStoresPharmaciesWestAllisWIMember2023-12-310001798100ntst:DrugStoresPharmaciesWestAllisWIMembersrt:MinimumMember2023-12-310001798100ntst:DrugStoresPharmaciesWestAllisWIMembersrt:MaximumMember2023-12-310001798100ntst:DollarStoresMagdelenaNMMember2023-12-310001798100ntst:DollarStoresMagdelenaNMMembersrt:MinimumMember2023-12-310001798100ntst:DollarStoresMagdelenaNMMembersrt:MaximumMember2023-12-310001798100ntst:GroceryTonawandaNY1Member2023-12-310001798100ntst:GroceryTonawandaNY1Membersrt:MinimumMember2023-12-310001798100ntst:GroceryTonawandaNY1Membersrt:MaximumMember2023-12-310001798100ntst:DollarStoresPenascoNMMember2023-12-310001798100srt:MinimumMemberntst:DollarStoresPenascoNMMember2023-12-310001798100srt:MaximumMemberntst:DollarStoresPenascoNMMember2023-12-310001798100ntst:AutomotiveServiceMayfieldOHMember2023-12-310001798100ntst:AutomotiveServiceMayfieldOHMembersrt:MinimumMember2023-12-310001798100ntst:AutomotiveServiceMayfieldOHMembersrt:MaximumMember2023-12-310001798100ntst:CasualDiningMayfieldOHMember2023-12-310001798100ntst:CasualDiningMayfieldOHMembersrt:MinimumMember2023-12-310001798100ntst:CasualDiningMayfieldOHMembersrt:MaximumMember2023-12-310001798100ntst:GroceryLaPlaceLAMember2023-12-310001798100srt:MinimumMemberntst:GroceryLaPlaceLAMember2023-12-310001798100srt:MaximumMemberntst:GroceryLaPlaceLAMember2023-12-310001798100ntst:GroceryTonawandaNY2Member2023-12-310001798100ntst:GroceryTonawandaNY2Membersrt:MinimumMember2023-12-310001798100ntst:GroceryTonawandaNY2Membersrt:MaximumMember2023-12-310001798100ntst:AutoPartsSparksNVMember2023-12-310001798100ntst:AutoPartsSparksNVMembersrt:MinimumMember2023-12-310001798100ntst:AutoPartsSparksNVMembersrt:MaximumMember2023-12-310001798100ntst:FarmSuppliesSparksNVMember2023-12-310001798100ntst:FarmSuppliesSparksNVMembersrt:MinimumMember2023-12-310001798100ntst:FarmSuppliesSparksNVMembersrt:MaximumMember2023-12-310001798100ntst:HomeImprovementSparksNVMember2023-12-310001798100ntst:HomeImprovementSparksNVMembersrt:MinimumMember2023-12-310001798100ntst:HomeImprovementSparksNVMembersrt:MaximumMember2023-12-310001798100ntst:DrugStoresPharmaciesTulareCAMember2023-12-310001798100srt:MinimumMemberntst:DrugStoresPharmaciesTulareCAMember2023-12-310001798100srt:MaximumMemberntst:DrugStoresPharmaciesTulareCAMember2023-12-310001798100ntst:DrugStoresPharmaciesFortWayneIN1Member2023-12-310001798100ntst:DrugStoresPharmaciesFortWayneIN1Membersrt:MinimumMember2023-12-310001798100ntst:DrugStoresPharmaciesFortWayneIN1Membersrt:MaximumMember2023-12-310001798100ntst:DrugStoresPharmaciesNoblesvilleINMember2023-12-310001798100ntst:DrugStoresPharmaciesNoblesvilleINMembersrt:MinimumMember2023-12-310001798100ntst:DrugStoresPharmaciesNoblesvilleINMembersrt:MaximumMember2023-12-310001798100ntst:DrugStoresPharmaciesJacksonMSMember2023-12-310001798100ntst:DrugStoresPharmaciesJacksonMSMembersrt:MinimumMember2023-12-310001798100ntst:DrugStoresPharmaciesJacksonMSMembersrt:MaximumMember2023-12-310001798100ntst:DrugStoresPharmaciesNewportNewsVAMember2023-12-310001798100ntst:DrugStoresPharmaciesNewportNewsVAMembersrt:MinimumMember2023-12-310001798100ntst:DrugStoresPharmaciesNewportNewsVAMembersrt:MaximumMember2023-12-310001798100ntst:DrugStoresPharmaciesYorktownVAMember2023-12-310001798100ntst:DrugStoresPharmaciesYorktownVAMembersrt:MinimumMember2023-12-310001798100ntst:DrugStoresPharmaciesYorktownVAMembersrt:MaximumMember2023-12-310001798100ntst:GroceryPalmdaleCAMember2023-12-310001798100ntst:GroceryPalmdaleCAMembersrt:MinimumMember2023-12-310001798100ntst:GroceryPalmdaleCAMembersrt:MaximumMember2023-12-310001798100ntst:SpecialtyPalmdaleCAMember2023-12-310001798100ntst:SpecialtyPalmdaleCAMembersrt:MinimumMember2023-12-310001798100ntst:SpecialtyPalmdaleCAMembersrt:MaximumMember2023-12-310001798100ntst:DollarStoresSpringfieldILMember2023-12-310001798100ntst:DollarStoresSpringfieldILMembersrt:MinimumMember2023-12-310001798100ntst:DollarStoresSpringfieldILMembersrt:MaximumMember2023-12-310001798100ntst:DollarStoresBuffaloNYMember2023-12-310001798100ntst:DollarStoresBuffaloNYMembersrt:MinimumMember2023-12-310001798100ntst:DollarStoresBuffaloNYMembersrt:MaximumMember2023-12-310001798100ntst:DrugStoresPharmaciesAthensGAMember2023-12-310001798100ntst:DrugStoresPharmaciesAthensGAMembersrt:MinimumMember2023-12-310001798100ntst:DrugStoresPharmaciesAthensGAMembersrt:MaximumMember2023-12-310001798100ntst:DrugStoresPharmaciesRockfordIL2Member2023-12-310001798100srt:MinimumMemberntst:DrugStoresPharmaciesRockfordIL2Member2023-12-310001798100srt:MaximumMemberntst:DrugStoresPharmaciesRockfordIL2Member2023-12-310001798100ntst:DrugStoresPharmaciesNewOrleansLAMember2023-12-310001798100ntst:DrugStoresPharmaciesNewOrleansLAMembersrt:MinimumMember2023-12-310001798100ntst:DrugStoresPharmaciesNewOrleansLAMembersrt:MaximumMember2023-12-310001798100ntst:DrugStoresPharmaciesBismarckNDMember2023-12-310001798100ntst:DrugStoresPharmaciesBismarckNDMembersrt:MinimumMember2023-12-310001798100ntst:DrugStoresPharmaciesBismarckNDMembersrt:MaximumMember2023-12-310001798100ntst:DrugStoresPharmaciesLasVegasNVMember2023-12-310001798100srt:MinimumMemberntst:DrugStoresPharmaciesLasVegasNVMember2023-12-310001798100srt:MaximumMemberntst:DrugStoresPharmaciesLasVegasNVMember2023-12-310001798100ntst:GroceryHarrisonMIMember2023-12-310001798100srt:MinimumMemberntst:GroceryHarrisonMIMember2023-12-310001798100srt:MaximumMemberntst:GroceryHarrisonMIMember2023-12-310001798100ntst:DollarStoresOglethorpeGAMember2023-12-310001798100ntst:DollarStoresOglethorpeGAMembersrt:MinimumMember2023-12-310001798100ntst:DollarStoresOglethorpeGAMembersrt:MaximumMember2023-12-310001798100ntst:GroceryJanesvilleWIMember2023-12-310001798100ntst:GroceryJanesvilleWIMembersrt:MinimumMember2023-12-310001798100ntst:GroceryJanesvilleWIMembersrt:MaximumMember2023-12-310001798100ntst:AutoPartsMarionINMember2023-12-310001798100srt:MinimumMemberntst:AutoPartsMarionINMember2023-12-310001798100srt:MaximumMemberntst:AutoPartsMarionINMember2023-12-310001798100ntst:DollarStoresMarionINMember2023-12-310001798100ntst:DollarStoresMarionINMembersrt:MinimumMember2023-12-310001798100ntst:DollarStoresMarionINMembersrt:MaximumMember2023-12-310001798100ntst:AutoPartsBluefieldWVMember2023-12-310001798100ntst:AutoPartsBluefieldWVMembersrt:MinimumMember2023-12-310001798100ntst:AutoPartsBluefieldWVMembersrt:MaximumMember2023-12-310001798100ntst:DiscountRetailForestCityNCMember2023-12-310001798100ntst:DiscountRetailForestCityNCMembersrt:MinimumMember2023-12-310001798100ntst:DiscountRetailForestCityNCMembersrt:MaximumMember2023-12-310001798100ntst:DollarStoresBluefieldWVMember2023-12-310001798100ntst:DollarStoresBluefieldWVMembersrt:MinimumMember2023-12-310001798100ntst:DollarStoresBluefieldWVMembersrt:MaximumMember2023-12-310001798100ntst:DrugStoresPharmaciesPhiladelphiaPAMember2023-12-310001798100ntst:DollarStoresLithiaSpringsGAMember2023-12-310001798100ntst:DollarStoresLithiaSpringsGAMembersrt:MinimumMember2023-12-310001798100ntst:DollarStoresLithiaSpringsGAMembersrt:MaximumMember2023-12-310001798100ntst:GroceryOrangeCityIAMember2023-12-310001798100srt:MinimumMemberntst:GroceryOrangeCityIAMember2023-12-310001798100srt:MaximumMemberntst:GroceryOrangeCityIAMember2023-12-310001798100ntst:DrugStoresPharmaciesSwanseaILMember2023-12-310001798100srt:MinimumMemberntst:DrugStoresPharmaciesSwanseaILMember2023-12-310001798100srt:MaximumMemberntst:DrugStoresPharmaciesSwanseaILMember2023-12-310001798100ntst:DiscountRetailElizabethCityNCMember2023-12-310001798100srt:MinimumMemberntst:DiscountRetailElizabethCityNCMember2023-12-310001798100srt:MaximumMemberntst:DiscountRetailElizabethCityNCMember2023-12-310001798100ntst:DrugStoresPharmaciesSalisburyNCMember2023-12-310001798100srt:MinimumMemberntst:DrugStoresPharmaciesSalisburyNCMember2023-12-310001798100srt:MaximumMemberntst:DrugStoresPharmaciesSalisburyNCMember2023-12-310001798100ntst:DrugStoresPharmaciesStatesvilleNCMember2023-12-310001798100ntst:DrugStoresPharmaciesStatesvilleNCMembersrt:MinimumMember2023-12-310001798100ntst:DrugStoresPharmaciesStatesvilleNCMembersrt:MaximumMember2023-12-310001798100ntst:DrugStoresPharmaciesFarmvilleVAMember2023-12-310001798100srt:MinimumMemberntst:DrugStoresPharmaciesFarmvilleVAMember2023-12-310001798100srt:MaximumMemberntst:DrugStoresPharmaciesFarmvilleVAMember2023-12-310001798100ntst:GroceryElizabethCityNCMember2023-12-310001798100srt:MinimumMemberntst:GroceryElizabethCityNCMember2023-12-310001798100srt:MaximumMemberntst:GroceryElizabethCityNCMember2023-12-310001798100ntst:DiscountRetailFondDuLacWIMember2023-12-310001798100ntst:DiscountRetailFondDuLacWIMembersrt:MinimumMember2023-12-310001798100ntst:DiscountRetailFondDuLacWIMembersrt:MaximumMember2023-12-310001798100ntst:DollarStoresDetroitMIMember2023-12-310001798100srt:MinimumMemberntst:DollarStoresDetroitMIMember2023-12-310001798100srt:MaximumMemberntst:DollarStoresDetroitMIMember2023-12-310001798100ntst:GroceryCovingtonLAMember2023-12-310001798100ntst:GroceryCovingtonLAMembersrt:MinimumMember2023-12-310001798100ntst:GroceryCovingtonLAMembersrt:MaximumMember2023-12-310001798100ntst:GroceryNewHavenINMember2023-12-310001798100srt:MinimumMemberntst:GroceryNewHavenINMember2023-12-310001798100srt:MaximumMemberntst:GroceryNewHavenINMember2023-12-310001798100ntst:HomeImprovementBossierCityLAMember2023-12-310001798100ntst:HomeImprovementBossierCityLAMembersrt:MinimumMember2023-12-310001798100ntst:HomeImprovementBossierCityLAMembersrt:MaximumMember2023-12-310001798100ntst:DollarStoresSouthParkPAMember2023-12-310001798100ntst:DollarStoresSouthParkPAMembersrt:MinimumMember2023-12-310001798100ntst:DollarStoresSouthParkPAMembersrt:MaximumMember2023-12-310001798100ntst:DollarStoresProvidenceRIMember2023-12-310001798100srt:MinimumMemberntst:DollarStoresProvidenceRIMember2023-12-310001798100srt:MaximumMemberntst:DollarStoresProvidenceRIMember2023-12-310001798100ntst:AutomotiveServiceDouglasGAMember2023-12-310001798100ntst:AutomotiveServiceDouglasGAMembersrt:MinimumMember2023-12-310001798100ntst:AutomotiveServiceDouglasGAMembersrt:MaximumMember2023-12-310001798100ntst:SportingGoodsCranberryTownshipPAMember2023-12-310001798100srt:MinimumMemberntst:SportingGoodsCranberryTownshipPAMember2023-12-310001798100srt:MaximumMemberntst:SportingGoodsCranberryTownshipPAMember2023-12-310001798100ntst:DollarStoresBaldwinMIMember2023-12-310001798100srt:MinimumMemberntst:DollarStoresBaldwinMIMember2023-12-310001798100srt:MaximumMemberntst:DollarStoresBaldwinMIMember2023-12-310001798100ntst:DollarStoresBemidjiMNMember2023-12-310001798100ntst:DollarStoresBemidjiMNMembersrt:MinimumMember2023-12-310001798100ntst:DollarStoresBemidjiMNMembersrt:MaximumMember2023-12-310001798100ntst:DollarStoresBlanchardMIMember2023-12-310001798100ntst:DollarStoresBlanchardMIMembersrt:MinimumMember2023-12-310001798100ntst:DollarStoresBlanchardMIMembersrt:MaximumMember2023-12-310001798100ntst:DollarStoresCrystalMIMember2023-12-310001798100ntst:DollarStoresCrystalMIMembersrt:MinimumMember2023-12-310001798100ntst:DollarStoresCrystalMIMembersrt:MaximumMember2023-12-310001798100ntst:DollarStoresSouthHavenMIMember2023-12-310001798100srt:MinimumMemberntst:DollarStoresSouthHavenMIMember2023-12-310001798100srt:MaximumMemberntst:DollarStoresSouthHavenMIMember2023-12-310001798100ntst:DollarStoresThreeRiversMIMember2023-12-310001798100ntst:DollarStoresThreeRiversMIMembersrt:MinimumMember2023-12-310001798100ntst:DollarStoresThreeRiversMIMembersrt:MaximumMember2023-12-310001798100ntst:DollarStoresWabenoWIMember2023-12-310001798100srt:MinimumMemberntst:DollarStoresWabenoWIMember2023-12-310001798100srt:MaximumMemberntst:DollarStoresWabenoWIMember2023-12-310001798100ntst:DollarStoresWalkervilleMIMember2023-12-310001798100ntst:DollarStoresWalkervilleMIMembersrt:MinimumMember2023-12-310001798100ntst:DollarStoresWalkervilleMIMembersrt:MaximumMember2023-12-310001798100ntst:SpecialtyTysonsVAMember2023-12-310001798100ntst:SpecialtyTysonsVAMembersrt:MinimumMember2023-12-310001798100ntst:SpecialtyTysonsVAMembersrt:MaximumMember2023-12-310001798100ntst:DollarStoresChipleyFLMember2023-12-310001798100srt:MinimumMemberntst:DollarStoresChipleyFLMember2023-12-310001798100srt:MaximumMemberntst:DollarStoresChipleyFLMember2023-12-310001798100ntst:DollarStoresAlfordFLMember2023-12-310001798100srt:MinimumMemberntst:DollarStoresAlfordFLMember2023-12-310001798100srt:MaximumMemberntst:DollarStoresAlfordFLMember2023-12-310001798100ntst:DollarStoresEnniceNCMember2023-12-310001798100srt:MinimumMemberntst:DollarStoresEnniceNCMember2023-12-310001798100srt:MaximumMemberntst:DollarStoresEnniceNCMember2023-12-310001798100ntst:DollarStoresDonalsonvilleGAMember2023-12-310001798100ntst:DollarStoresDonalsonvilleGAMembersrt:MinimumMember2023-12-310001798100ntst:DollarStoresDonalsonvilleGAMembersrt:MaximumMember2023-12-310001798100ntst:GroceryGreenfieldWIMember2023-12-310001798100srt:MinimumMemberntst:GroceryGreenfieldWIMember2023-12-310001798100srt:MaximumMemberntst:GroceryGreenfieldWIMember2023-12-310001798100ntst:DollarStoresAltonNHMember2023-12-310001798100ntst:DollarStoresAltonNHMembersrt:MinimumMember2023-12-310001798100ntst:DollarStoresAltonNHMembersrt:MaximumMember2023-12-310001798100ntst:DrugStoresPharmaciesFortWayneIN2Member2023-12-310001798100srt:MinimumMemberntst:DrugStoresPharmaciesFortWayneIN2Member2023-12-310001798100srt:MaximumMemberntst:DrugStoresPharmaciesFortWayneIN2Member2023-12-310001798100ntst:DollarStoresShelbyOHMember2023-12-310001798100ntst:DollarStoresShelbyOHMembersrt:MinimumMember2023-12-310001798100ntst:DollarStoresShelbyOHMembersrt:MaximumMember2023-12-310001798100ntst:DrugStoresPharmaciesWarsawINMember2023-12-310001798100srt:MinimumMemberntst:DrugStoresPharmaciesWarsawINMember2023-12-310001798100srt:MaximumMemberntst:DrugStoresPharmaciesWarsawINMember2023-12-310001798100ntst:DrugStoresPharmaciesCanalWinchesterOHMember2023-12-310001798100srt:MinimumMemberntst:DrugStoresPharmaciesCanalWinchesterOHMember2023-12-310001798100srt:MaximumMemberntst:DrugStoresPharmaciesCanalWinchesterOHMember2023-12-310001798100ntst:DrugStoresPharmaciesIrondequoitNYMember2023-12-310001798100srt:MinimumMemberntst:DrugStoresPharmaciesIrondequoitNYMember2023-12-310001798100srt:MaximumMemberntst:DrugStoresPharmaciesIrondequoitNYMember2023-12-310001798100ntst:DollarStoresAhoskieNCMember2023-12-310001798100ntst:DollarStoresAhoskieNCMembersrt:MinimumMember2023-12-310001798100ntst:DollarStoresAhoskieNCMembersrt:MaximumMember2023-12-310001798100ntst:DrugStoresPharmaciesAlbertvilleALMember2023-12-310001798100ntst:DrugStoresPharmaciesAlbertvilleALMembersrt:MinimumMember2023-12-310001798100ntst:DrugStoresPharmaciesAlbertvilleALMembersrt:MaximumMember2023-12-310001798100ntst:DrugStoresPharmaciesSt.PaulMNMember2023-12-310001798100ntst:DrugStoresPharmaciesSt.PaulMNMembersrt:MinimumMember2023-12-310001798100ntst:DrugStoresPharmaciesSt.PaulMNMembersrt:MaximumMember2023-12-310001798100ntst:SportingGoodsHelenaMTMember2023-12-310001798100srt:MinimumMemberntst:SportingGoodsHelenaMTMember2023-12-310001798100srt:MaximumMemberntst:SportingGoodsHelenaMTMember2023-12-310001798100ntst:AutomotiveServiceCharlotteNCMember2023-12-310001798100ntst:AutomotiveServiceCharlotteNCMembersrt:MinimumMember2023-12-310001798100ntst:AutomotiveServiceCharlotteNCMembersrt:MaximumMember2023-12-310001798100ntst:DollarStoresTamaIAMember2023-12-310001798100srt:MinimumMemberntst:DollarStoresTamaIAMember2023-12-310001798100srt:MaximumMemberntst:DollarStoresTamaIAMember2023-12-310001798100ntst:QuickServiceRestaurantsIndianolaMSMember2023-12-310001798100ntst:QuickServiceRestaurantsIndianolaMSMembersrt:MinimumMember2023-12-310001798100ntst:QuickServiceRestaurantsIndianolaMSMembersrt:MaximumMember2023-12-310001798100ntst:QuickServiceRestaurantsCitronelleALMember2023-12-310001798100srt:MinimumMemberntst:QuickServiceRestaurantsCitronelleALMember2023-12-310001798100srt:MaximumMemberntst:QuickServiceRestaurantsCitronelleALMember2023-12-310001798100ntst:QuickServiceRestaurantsVinemontALMember2023-12-310001798100ntst:QuickServiceRestaurantsVinemontALMembersrt:MinimumMember2023-12-310001798100ntst:QuickServiceRestaurantsVinemontALMembersrt:MaximumMember2023-12-310001798100ntst:QuickServiceRestaurantsTunicaMSMember2023-12-310001798100ntst:QuickServiceRestaurantsTunicaMSMembersrt:MinimumMember2023-12-310001798100ntst:QuickServiceRestaurantsTunicaMSMembersrt:MaximumMember2023-12-310001798100ntst:QuickServiceRestaurantsClevelandMSMember2023-12-310001798100ntst:QuickServiceRestaurantsClevelandMSMembersrt:MinimumMember2023-12-310001798100ntst:QuickServiceRestaurantsClevelandMSMembersrt:MaximumMember2023-12-310001798100ntst:DollarStoresEnfieldNCMember2023-12-310001798100srt:MinimumMemberntst:DollarStoresEnfieldNCMember2023-12-310001798100srt:MaximumMemberntst:DollarStoresEnfieldNCMember2023-12-310001798100ntst:DollarStoresHeathSpringsSCMember2023-12-310001798100ntst:DollarStoresHeathSpringsSCMembersrt:MinimumMember2023-12-310001798100ntst:DollarStoresHeathSpringsSCMembersrt:MaximumMember2023-12-310001798100ntst:GroceryNorthFortMyersFLMember2023-12-310001798100ntst:GroceryNorthFortMyersFLMembersrt:MinimumMember2023-12-310001798100ntst:GroceryNorthFortMyersFLMembersrt:MaximumMember2023-12-310001798100ntst:DollarStoresCherokeeIAMember2023-12-310001798100ntst:DollarStoresCherokeeIAMembersrt:MinimumMember2023-12-310001798100ntst:DollarStoresCherokeeIAMembersrt:MaximumMember2023-12-310001798100ntst:DollarStoresRamerALMember2023-12-310001798100ntst:DollarStoresRamerALMembersrt:MinimumMember2023-12-310001798100ntst:DollarStoresRamerALMembersrt:MaximumMember2023-12-310001798100ntst:DollarStoresRussellvilleALMember2023-12-310001798100ntst:DollarStoresRussellvilleALMembersrt:MinimumMember2023-12-310001798100ntst:DollarStoresRussellvilleALMembersrt:MaximumMember2023-12-310001798100ntst:DollarStoresTallasseeALMember2023-12-310001798100ntst:DollarStoresTallasseeALMembersrt:MinimumMember2023-12-310001798100ntst:DollarStoresTallasseeALMembersrt:MaximumMember2023-12-310001798100ntst:DollarStoresRainbowCityALMember2023-12-310001798100srt:MinimumMemberntst:DollarStoresRainbowCityALMember2023-12-310001798100srt:MaximumMemberntst:DollarStoresRainbowCityALMember2023-12-310001798100ntst:DollarStoresHeadlandALMember2023-12-310001798100ntst:DollarStoresHeadlandALMembersrt:MinimumMember2023-12-310001798100ntst:DollarStoresHeadlandALMembersrt:MaximumMember2023-12-310001798100ntst:DollarStoresKillenALMember2023-12-310001798100ntst:DollarStoresKillenALMembersrt:MinimumMember2023-12-310001798100ntst:DollarStoresKillenALMembersrt:MaximumMember2023-12-310001798100ntst:DollarStoresOzarkALMember2023-12-310001798100ntst:DollarStoresOzarkALMembersrt:MinimumMember2023-12-310001798100ntst:DollarStoresOzarkALMembersrt:MaximumMember2023-12-310001798100ntst:DollarStoresFalkvilleALMember2023-12-310001798100ntst:DollarStoresFalkvilleALMembersrt:MinimumMember2023-12-310001798100ntst:DollarStoresFalkvilleALMembersrt:MaximumMember2023-12-310001798100ntst:DrugStoresPharmaciesChelmsfordMAMember2023-12-310001798100ntst:DrugStoresPharmaciesHoustonTXMember2023-12-310001798100ntst:DrugStoresPharmaciesHoustonTXMembersrt:MinimumMember2023-12-310001798100ntst:DrugStoresPharmaciesHoustonTXMembersrt:MaximumMember2023-12-310001798100ntst:DrugStoresPharmaciesWestamptonNJMember2023-12-310001798100srt:MinimumMemberntst:DrugStoresPharmaciesWestamptonNJMember2023-12-310001798100srt:MaximumMemberntst:DrugStoresPharmaciesWestamptonNJMember2023-12-310001798100ntst:GroceryParkRidgeILMember2023-12-310001798100ntst:GroceryParkRidgeILMembersrt:MinimumMember2023-12-310001798100ntst:GroceryParkRidgeILMembersrt:MaximumMember2023-12-310001798100ntst:GroceryOFallonILMember2023-12-310001798100ntst:GroceryOFallonILMembersrt:MinimumMember2023-12-310001798100ntst:GroceryOFallonILMembersrt:MaximumMember2023-12-310001798100ntst:SportingGoodsFriscoTXMember2023-12-310001798100srt:MinimumMemberntst:SportingGoodsFriscoTXMember2023-12-310001798100srt:MaximumMemberntst:SportingGoodsFriscoTXMember2023-12-310001798100ntst:DollarStoresWarrenOHMember2023-12-310001798100ntst:DollarStoresWarrenOHMembersrt:MinimumMember2023-12-310001798100ntst:DollarStoresWarrenOHMembersrt:MaximumMember2023-12-310001798100ntst:DollarStoresAlamogordoNMMember2023-12-310001798100srt:MinimumMemberntst:DollarStoresAlamogordoNMMember2023-12-310001798100srt:MaximumMemberntst:DollarStoresAlamogordoNMMember2023-12-310001798100ntst:DollarStoresWiseVAMember2023-12-310001798100ntst:DollarStoresWiseVAMembersrt:MinimumMember2023-12-310001798100ntst:DollarStoresWiseVAMembersrt:MaximumMember2023-12-310001798100ntst:DollarStoresLodiNYMember2023-12-310001798100ntst:DollarStoresLodiNYMembersrt:MinimumMember2023-12-310001798100ntst:DollarStoresLodiNYMembersrt:MaximumMember2023-12-310001798100ntst:DollarStoresMarionLAMember2023-12-310001798100srt:MinimumMemberntst:DollarStoresMarionLAMember2023-12-310001798100srt:MaximumMemberntst:DollarStoresMarionLAMember2023-12-310001798100ntst:DollarStoresErosLAMember2023-12-310001798100ntst:DollarStoresErosLAMembersrt:MinimumMember2023-12-310001798100ntst:DollarStoresErosLAMembersrt:MaximumMember2023-12-310001798100ntst:DollarStoresHackberryLAMember2023-12-310001798100ntst:DollarStoresHackberryLAMembersrt:MinimumMember2023-12-310001798100ntst:DollarStoresHackberryLAMembersrt:MaximumMember2023-12-310001798100ntst:DollarStoresSummitMSMember2023-12-310001798100ntst:DollarStoresSummitMSMembersrt:MinimumMember2023-12-310001798100ntst:DollarStoresSummitMSMembersrt:MaximumMember2023-12-310001798100ntst:DollarStoresBlossomTXMember2023-12-310001798100srt:MinimumMemberntst:DollarStoresBlossomTXMember2023-12-310001798100srt:MaximumMemberntst:DollarStoresBlossomTXMember2023-12-310001798100ntst:DollarStoresBellefontePAMember2023-12-310001798100ntst:DollarStoresBellefontePAMembersrt:MinimumMember2023-12-310001798100ntst:DollarStoresBellefontePAMembersrt:MaximumMember2023-12-310001798100ntst:DollarStoresEndicottNYMember2023-12-310001798100srt:MinimumMemberntst:DollarStoresEndicottNYMember2023-12-310001798100srt:MaximumMemberntst:DollarStoresEndicottNYMember2023-12-310001798100ntst:DollarStoresTaftTXMember2023-12-310001798100ntst:DollarStoresTaftTXMembersrt:MinimumMember2023-12-310001798100ntst:DollarStoresTaftTXMembersrt:MaximumMember2023-12-310001798100ntst:DollarStoresLawndaleNCMember2023-12-310001798100ntst:DollarStoresLawndaleNCMembersrt:MinimumMember2023-12-310001798100ntst:DollarStoresLawndaleNCMembersrt:MaximumMember2023-12-310001798100ntst:DollarStoresHaleyvilleALMember2023-12-310001798100srt:MinimumMemberntst:DollarStoresHaleyvilleALMember2023-12-310001798100srt:MaximumMemberntst:DollarStoresHaleyvilleALMember2023-12-310001798100ntst:DollarStoresDemopolisALMember2023-12-310001798100srt:MinimumMemberntst:DollarStoresDemopolisALMember2023-12-310001798100srt:MaximumMemberntst:DollarStoresDemopolisALMember2023-12-310001798100ntst:DollarStoresMoundvilleALMember2023-12-310001798100srt:MinimumMemberntst:DollarStoresMoundvilleALMember2023-12-310001798100srt:MaximumMemberntst:DollarStoresMoundvilleALMember2023-12-310001798100ntst:DollarStoresWestColumbiaTXMember2023-12-310001798100ntst:DollarStoresWestColumbiaTXMembersrt:MinimumMember2023-12-310001798100ntst:DollarStoresWestColumbiaTXMembersrt:MaximumMember2023-12-310001798100ntst:DollarStoresValleyViewTXMember2023-12-310001798100srt:MinimumMemberntst:DollarStoresValleyViewTXMember2023-12-310001798100srt:MaximumMemberntst:DollarStoresValleyViewTXMember2023-12-310001798100ntst:GroceryElkhartINMember2023-12-310001798100srt:MinimumMemberntst:GroceryElkhartINMember2023-12-310001798100srt:MaximumMemberntst:GroceryElkhartINMember2023-12-310001798100ntst:DollarStoresDefuniakSpringsFLMember2023-12-310001798100srt:MinimumMemberntst:DollarStoresDefuniakSpringsFLMember2023-12-310001798100srt:MaximumMemberntst:DollarStoresDefuniakSpringsFLMember2023-12-310001798100ntst:DollarStoresKenmareNDMember2023-12-310001798100ntst:DollarStoresKenmareNDMembersrt:MinimumMember2023-12-310001798100ntst:DollarStoresKenmareNDMembersrt:MaximumMember2023-12-310001798100ntst:DollarStoresBoyceLAMember2023-12-310001798100ntst:DollarStoresBoyceLAMembersrt:MinimumMember2023-12-310001798100ntst:DollarStoresBoyceLAMembersrt:MaximumMember2023-12-310001798100ntst:DollarStoresGainesvilleTXMember2023-12-310001798100ntst:DollarStoresGainesvilleTXMembersrt:MinimumMember2023-12-310001798100ntst:DollarStoresGainesvilleTXMembersrt:MaximumMember2023-12-310001798100ntst:DollarStoresLonokeARMember2023-12-310001798100ntst:DollarStoresLonokeARMembersrt:MinimumMember2023-12-310001798100ntst:DollarStoresLonokeARMembersrt:MaximumMember2023-12-310001798100ntst:DollarStoresEdenNCMember2023-12-310001798100srt:MinimumMemberntst:DollarStoresEdenNCMember2023-12-310001798100srt:MaximumMemberntst:DollarStoresEdenNCMember2023-12-310001798100ntst:DollarStoresHomervilleGAMember2023-12-310001798100ntst:DollarStoresHomervilleGAMembersrt:MinimumMember2023-12-310001798100ntst:DollarStoresHomervilleGAMembersrt:MaximumMember2023-12-310001798100ntst:DollarStoresLouisvilleGAMember2023-12-310001798100ntst:DollarStoresLouisvilleGAMembersrt:MinimumMember2023-12-310001798100ntst:DollarStoresLouisvilleGAMembersrt:MaximumMember2023-12-310001798100ntst:DollarStoresReidsvilleNCMember2023-12-310001798100srt:MinimumMemberntst:DollarStoresReidsvilleNCMember2023-12-310001798100srt:MaximumMemberntst:DollarStoresReidsvilleNCMember2023-12-310001798100ntst:DollarStoresChristovalTXMember2023-12-310001798100ntst:DollarStoresChristovalTXMembersrt:MinimumMember2023-12-310001798100ntst:DollarStoresChristovalTXMembersrt:MaximumMember2023-12-310001798100ntst:DollarStoresWilkesboroNCMember2023-12-310001798100srt:MinimumMemberntst:DollarStoresWilkesboroNCMember2023-12-310001798100srt:MaximumMemberntst:DollarStoresWilkesboroNCMember2023-12-310001798100ntst:AutomotiveServiceDaltonGAMember2023-12-310001798100ntst:AutomotiveServiceDaltonGAMembersrt:MinimumMember2023-12-310001798100ntst:AutomotiveServiceDaltonGAMembersrt:MaximumMember2023-12-310001798100ntst:DollarStoresMountOrabOHMember2023-12-310001798100srt:MinimumMemberntst:DollarStoresMountOrabOHMember2023-12-310001798100srt:MaximumMemberntst:DollarStoresMountOrabOHMember2023-12-310001798100ntst:DollarStoresAlgonaIAMember2023-12-310001798100ntst:DollarStoresAlgonaIAMembersrt:MinimumMember2023-12-310001798100ntst:DollarStoresAlgonaIAMembersrt:MaximumMember2023-12-310001798100ntst:DollarStoresIdaGroveIAMember2023-12-310001798100srt:MinimumMemberntst:DollarStoresIdaGroveIAMember2023-12-310001798100srt:MaximumMemberntst:DollarStoresIdaGroveIAMember2023-12-310001798100ntst:SportingGoodsHorseheadsNYMember2023-12-310001798100ntst:SportingGoodsHorseheadsNYMembersrt:MinimumMember2023-12-310001798100ntst:SportingGoodsHorseheadsNYMembersrt:MaximumMember2023-12-310001798100ntst:DollarStoresBethuneSCMember2023-12-310001798100ntst:DollarStoresBethuneSCMembersrt:MinimumMember2023-12-310001798100ntst:DollarStoresBethuneSCMembersrt:MaximumMember2023-12-310001798100ntst:DollarStoresMocksvilleNCMember2023-12-310001798100srt:MinimumMemberntst:DollarStoresMocksvilleNCMember2023-12-310001798100srt:MaximumMemberntst:DollarStoresMocksvilleNCMember2023-12-310001798100ntst:DollarStoresNewLebanonOHMember2023-12-310001798100srt:MinimumMemberntst:DollarStoresNewLebanonOHMember2023-12-310001798100srt:MaximumMemberntst:DollarStoresNewLebanonOHMember2023-12-310001798100ntst:DollarStoresDarienNYMember2023-12-310001798100ntst:DollarStoresDarienNYMembersrt:MinimumMember2023-12-310001798100ntst:DollarStoresDarienNYMembersrt:MaximumMember2023-12-310001798100ntst:DollarStoresAshvilleALMember2023-12-310001798100ntst:DollarStoresAshvilleALMembersrt:MinimumMember2023-12-310001798100ntst:DollarStoresAshvilleALMembersrt:MaximumMember2023-12-310001798100ntst:DollarStoresHobbsNMMember2023-12-310001798100ntst:DollarStoresHobbsNMMembersrt:MinimumMember2023-12-310001798100ntst:DollarStoresHobbsNMMembersrt:MaximumMember2023-12-310001798100ntst:GroceryMadisonWIMember2023-12-310001798100srt:MinimumMemberntst:GroceryMadisonWIMember2023-12-310001798100srt:MaximumMemberntst:GroceryMadisonWIMember2023-12-310001798100ntst:DollarStoresGeorgeWAMember2023-12-310001798100ntst:DollarStoresGeorgeWAMembersrt:MinimumMember2023-12-310001798100ntst:DollarStoresGeorgeWAMembersrt:MaximumMember2023-12-310001798100ntst:DollarStoresOakwoodVAMember2023-12-310001798100ntst:DollarStoresOakwoodVAMembersrt:MinimumMember2023-12-310001798100ntst:DollarStoresOakwoodVAMembersrt:MaximumMember2023-12-310001798100ntst:DollarStoresMosesLakeWAMember2023-12-310001798100ntst:DollarStoresMosesLakeWAMembersrt:MinimumMember2023-12-310001798100ntst:DollarStoresMosesLakeWAMembersrt:MaximumMember2023-12-310001798100ntst:GrocerySomersNYMember2023-12-310001798100ntst:GrocerySomersNYMembersrt:MinimumMember2023-12-310001798100ntst:GrocerySomersNYMembersrt:MaximumMember2023-12-310001798100ntst:DollarStoresCanaseragaNYMember2023-12-310001798100srt:MinimumMemberntst:DollarStoresCanaseragaNYMember2023-12-310001798100srt:MaximumMemberntst:DollarStoresCanaseragaNYMember2023-12-310001798100ntst:TelecommunicationsCoshoctonOHMember2023-12-310001798100ntst:TelecommunicationsCoshoctonOHMembersrt:MinimumMember2023-12-310001798100ntst:TelecommunicationsCoshoctonOHMembersrt:MaximumMember2023-12-310001798100ntst:CasualDiningPortlandOR1Member2023-12-310001798100ntst:CasualDiningPortlandOR2Member2023-12-310001798100ntst:HomeImprovementGreatBendKSMember2023-12-310001798100ntst:HomeImprovementGreatBendKSMembersrt:MinimumMember2023-12-310001798100ntst:HomeImprovementGreatBendKSMembersrt:MaximumMember2023-12-310001798100ntst:DollarStoresMarionALMember2023-12-310001798100srt:MinimumMemberntst:DollarStoresMarionALMember2023-12-310001798100srt:MaximumMemberntst:DollarStoresMarionALMember2023-12-310001798100ntst:DollarStoresFoleyALMember2023-12-310001798100ntst:DollarStoresFoleyALMembersrt:MinimumMember2023-12-310001798100ntst:DollarStoresFoleyALMembersrt:MaximumMember2023-12-310001798100ntst:DollarStoresBakerFL1Member2023-12-310001798100ntst:DollarStoresBakerFL1Membersrt:MinimumMember2023-12-310001798100ntst:DollarStoresBakerFL1Membersrt:MaximumMember2023-12-310001798100ntst:DollarStoresGerryNYMember2023-12-310001798100ntst:DollarStoresGerryNYMembersrt:MinimumMember2023-12-310001798100ntst:DollarStoresGerryNYMembersrt:MaximumMember2023-12-310001798100ntst:GroceryVeronaWIMember2023-12-310001798100ntst:GroceryVeronaWIMembersrt:MinimumMember2023-12-310001798100ntst:GroceryVeronaWIMembersrt:MaximumMember2023-12-310001798100ntst:HomeImprovementElkGroveVillageILMember2023-12-310001798100ntst:HomeImprovementElkGroveVillageILMembersrt:MinimumMember2023-12-310001798100ntst:HomeImprovementElkGroveVillageILMembersrt:MaximumMember2023-12-310001798100ntst:DollarStoresLakeParkGAMember2023-12-310001798100srt:MinimumMemberntst:DollarStoresLakeParkGAMember2023-12-310001798100srt:MaximumMemberntst:DollarStoresLakeParkGAMember2023-12-310001798100ntst:DollarStoresMaconGAMember2023-12-310001798100srt:MinimumMemberntst:DollarStoresMaconGAMember2023-12-310001798100srt:MaximumMemberntst:DollarStoresMaconGAMember2023-12-310001798100ntst:DollarStoresPerryGAMember2023-12-310001798100srt:MinimumMemberntst:DollarStoresPerryGAMember2023-12-310001798100srt:MaximumMemberntst:DollarStoresPerryGAMember2023-12-310001798100ntst:DollarStoresSalisburyNCMember2023-12-310001798100ntst:DollarStoresSalisburyNCMembersrt:MinimumMember2023-12-310001798100ntst:DollarStoresSalisburyNCMembersrt:MaximumMember2023-12-310001798100ntst:DollarStoresSylvaniaGAMember2023-12-310001798100ntst:DollarStoresSylvaniaGAMembersrt:MinimumMember2023-12-310001798100ntst:DollarStoresSylvaniaGAMembersrt:MaximumMember2023-12-310001798100ntst:DollarStoresGracevilleFLMember2023-12-310001798100srt:MinimumMemberntst:DollarStoresGracevilleFLMember2023-12-310001798100srt:MaximumMemberntst:DollarStoresGracevilleFLMember2023-12-310001798100ntst:DollarStoresCentreALMember2023-12-310001798100ntst:DollarStoresCentreALMembersrt:MinimumMember2023-12-310001798100ntst:DollarStoresCentreALMembersrt:MaximumMember2023-12-310001798100ntst:DollarStoresVernonALMember2023-12-310001798100srt:MinimumMemberntst:DollarStoresVernonALMember2023-12-310001798100srt:MaximumMemberntst:DollarStoresVernonALMember2023-12-310001798100ntst:DollarStoresAddisonALMember2023-12-310001798100ntst:DollarStoresAddisonALMembersrt:MinimumMember2023-12-310001798100ntst:DollarStoresAddisonALMembersrt:MaximumMember2023-12-310001798100ntst:DollarStoresHighlandHomeLapineALMember2023-12-310001798100srt:MinimumMemberntst:DollarStoresHighlandHomeLapineALMember2023-12-310001798100srt:MaximumMemberntst:DollarStoresHighlandHomeLapineALMember2023-12-310001798100ntst:DollarStoresJasperALMember2023-12-310001798100ntst:DollarStoresJasperALMembersrt:MinimumMember2023-12-310001798100ntst:DollarStoresJasperALMembersrt:MaximumMember2023-12-310001798100ntst:TelecommunicationsMeadvillePAMember2023-12-310001798100ntst:TelecommunicationsMeadvillePAMembersrt:MinimumMember2023-12-310001798100ntst:TelecommunicationsMeadvillePAMembersrt:MaximumMember2023-12-310001798100ntst:DollarStoresPulaskiNYMember2023-12-310001798100ntst:DollarStoresPulaskiNYMembersrt:MinimumMember2023-12-310001798100ntst:DollarStoresPulaskiNYMembersrt:MaximumMember2023-12-310001798100ntst:DollarStoresHarlanIAMember2023-12-310001798100srt:MinimumMemberntst:DollarStoresHarlanIAMember2023-12-310001798100srt:MaximumMemberntst:DollarStoresHarlanIAMember2023-12-310001798100ntst:DollarStoresPhenixCityAL2Member2023-12-310001798100srt:MinimumMemberntst:DollarStoresPhenixCityAL2Member2023-12-310001798100srt:MaximumMemberntst:DollarStoresPhenixCityAL2Member2023-12-310001798100ntst:GroceryManitowocWIMember2023-12-310001798100ntst:GroceryManitowocWIMembersrt:MinimumMember2023-12-310001798100ntst:GroceryManitowocWIMembersrt:MaximumMember2023-12-310001798100ntst:DollarStoresBakerFL2Member2023-12-310001798100ntst:DollarStoresBakerFL2Membersrt:MinimumMember2023-12-310001798100ntst:DollarStoresBakerFL2Membersrt:MaximumMember2023-12-310001798100ntst:DollarStoresLehightonPAMember2023-12-310001798100ntst:DollarStoresLehightonPAMembersrt:MinimumMember2023-12-310001798100ntst:DollarStoresLehightonPAMembersrt:MaximumMember2023-12-310001798100ntst:DollarStoresShoholaPAMember2023-12-310001798100ntst:DollarStoresShoholaPAMembersrt:MinimumMember2023-12-310001798100ntst:DollarStoresShoholaPAMembersrt:MaximumMember2023-12-310001798100ntst:DollarStoresFentonLAMember2023-12-310001798100ntst:DollarStoresFentonLAMembersrt:MinimumMember2023-12-310001798100ntst:DollarStoresFentonLAMembersrt:MaximumMember2023-12-310001798100ntst:DollarStoresSalemOHMember2023-12-310001798100ntst:DollarStoresSalemOHMembersrt:MinimumMember2023-12-310001798100ntst:DollarStoresSalemOHMembersrt:MaximumMember2023-12-310001798100ntst:DollarStoresMedinaOHMember2023-12-310001798100ntst:DollarStoresMedinaOHMembersrt:MinimumMember2023-12-310001798100ntst:DollarStoresMedinaOHMembersrt:MaximumMember2023-12-310001798100ntst:DollarStoresMansfieldOHMember2023-12-310001798100srt:MinimumMemberntst:DollarStoresMansfieldOHMember2023-12-310001798100srt:MaximumMemberntst:DollarStoresMansfieldOHMember2023-12-310001798100ntst:DollarStoresKonowaOKMember2023-12-310001798100ntst:DollarStoresKonowaOKMembersrt:MinimumMember2023-12-310001798100ntst:DollarStoresKonowaOKMembersrt:MaximumMember2023-12-310001798100ntst:DollarStoresCookvilleTXMember2023-12-310001798100ntst:DollarStoresCookvilleTXMembersrt:MinimumMember2023-12-310001798100ntst:DollarStoresCookvilleTXMembersrt:MaximumMember2023-12-310001798100ntst:DollarStoresCordeleGAMember2023-12-310001798100ntst:DollarStoresCordeleGAMembersrt:MinimumMember2023-12-310001798100ntst:DollarStoresCordeleGAMembersrt:MaximumMember2023-12-310001798100ntst:DollarStoresDeBerryTXMember2023-12-310001798100ntst:DollarStoresDeBerryTXMembersrt:MinimumMember2023-12-310001798100ntst:DollarStoresDeBerryTXMembersrt:MaximumMember2023-12-310001798100ntst:DollarStoresLavacaARMember2023-12-310001798100srt:MinimumMemberntst:DollarStoresLavacaARMember2023-12-310001798100srt:MaximumMemberntst:DollarStoresLavacaARMember2023-12-310001798100ntst:DollarStoresWetumpkaALMember2023-12-310001798100ntst:DollarStoresWetumpkaALMembersrt:MinimumMember2023-12-310001798100ntst:DollarStoresWetumpkaALMembersrt:MaximumMember2023-12-310001798100ntst:DollarStoresLivingstonALMember2023-12-310001798100ntst:DollarStoresLivingstonALMembersrt:MinimumMember2023-12-310001798100ntst:DollarStoresLivingstonALMembersrt:MaximumMember2023-12-310001798100ntst:DollarStoresWarriorALMember2023-12-310001798100ntst:DollarStoresWarriorALMembersrt:MinimumMember2023-12-310001798100ntst:DollarStoresWarriorALMembersrt:MaximumMember2023-12-310001798100ntst:DollarStoresAndrewsNCMember2023-12-310001798100ntst:DollarStoresAndrewsNCMembersrt:MinimumMember2023-12-310001798100ntst:DollarStoresAndrewsNCMembersrt:MaximumMember2023-12-310001798100ntst:DollarStoresBlakesleePAMember2023-12-310001798100ntst:DollarStoresBlakesleePAMembersrt:MinimumMember2023-12-310001798100ntst:DollarStoresBlakesleePAMembersrt:MaximumMember2023-12-310001798100ntst:FirstMortgageMaturingApril82024Member2023-01-012023-12-310001798100ntst:FirstMortgageMaturingApril82024Member2023-12-310001798100ntst:FirstMortgageMaturingMarch102026Member2023-01-012023-12-310001798100ntst:FirstMortgageMaturingMarch102026Member2023-12-310001798100ntst:FirstMortgageMaturingApril102026Member2023-01-012023-12-310001798100ntst:FirstMortgageMaturingApril102026Member2023-12-310001798100ntst:FirstMortgageMaturingJune102025Member2023-01-012023-12-310001798100ntst:FirstMortgageMaturingJune102025Member2023-12-310001798100ntst:FirstMortgageMaturingDecember292024Member2023-01-012023-12-310001798100ntst:FirstMortgageMaturingDecember292024Member2023-12-310001798100ntst:FirstMortgageMaturingMarch82024Member2023-01-012023-12-310001798100ntst:FirstMortgageMaturingMarch82024Member2023-12-310001798100ntst:FirstMortgageMaturingDecember52024Member2023-01-012023-12-310001798100ntst:FirstMortgageMaturingDecember52024Member2023-12-310001798100ntst:FirstMortgageMaturingDecember222024Member2023-01-012023-12-310001798100ntst:FirstMortgageMaturingDecember222024Member2023-12-31
UNITED STATES
SECURITIES AND EXCHANGE COMMISSION
Washington, D.C. 20549
☒ ANNUAL REPORT PURSUANT TO SECTION 13 OR 15(d) OF THE SECURITIES EXCHANGE ACT OF 1934
For the fiscal year ended December 31, 2023
OR
☐ TRANSITION REPORT PURSUANT TO SECTION 13 OR 15(d) OF THE SECURITIES EXCHANGE ACT OF 1934
For the transition period from _____ to _____
Commission File Number 001-39443
|
|
|
|
|
|
|
|
|
|
|
|
NETSTREIT Corp. |
(Exact name of registrant as specified in its charter) |
|
|
|
|
|
|
|
|
|
|
|
|
|
|
|
|
|
|
| Maryland |
|
84-3356606 |
| (State or other jurisdiction of |
|
(I.R.S. Employer |
| incorporation or organization) |
|
Identification No.) |
|
2021 McKinney Avenue
Suite 1150
|
|
|
|
Dallas, Texas |
|
75201 |
| (Address of principal executive offices) |
|
(Zip Code) |
|
(972) 200-7100 |
|
|
(Registrant’s telephone number, including area code) |
|
|
|
|
|
|
|
Securities registered pursuant to Section 12(b) of the Act: |
|
| Title of Each Class |
Trading Symbol(s) |
Name of Each Exchange on Which Registered |
| Common stock, par value $0.01 per share |
NTST |
The New York Stock Exchange |
|
Securities registered pursuant to Section 12(g) of the Act: None |
|
Indicate by check mark if the registrant is a well-known seasoned issuer, as defined in Rule 405 of the Securities Act. Yes ☑ No ☐
Indicate by check mark if the registrant is not required to file reports pursuant to Section 13 or Section 15(d) of the Act. Yes ☐ No ☑
Indicate by check mark whether the registrant (1) has filed all reports required to be filed by Section 13 or 15(d) of the Securities Exchange Act of 1934 during the preceding 12 months (or for such shorter period that the registrant was required to file such reports), and (2) has been subject to such filing requirements for the past 90 days. Yes ☑ No ☐
Indicate by check mark whether the registrant has submitted electronically every Interactive Data File required to be submitted pursuant to Rule 405 of Regulation S-T (Section 232.405 of this chapter) during the preceding 12 months (or for such shorter period that the registrant was required to submit such files). Yes ☑ No ☐
Indicate by check mark whether the registrant is a large accelerated filer, an accelerated filer, a non-accelerated filer, a smaller reporting company, or an emerging growth company. See the definitions of “large accelerated filer,” “accelerated filer,” “smaller reporting company,” and “emerging growth company” in Rule 12b-2 of the Exchange Act.
|
|
|
|
|
|
|
|
|
|
|
|
|
|
|
| Large accelerated filer |
☑ |
|
Accelerated filer |
☐ |
| Non-accelerated filer |
☐ |
|
Smaller reporting company |
☐ |
|
|
|
Emerging growth company |
☐ |
If an emerging growth company, indicate by check mark if the registrant has elected not to use the extended transition period for complying with any new or revised financial accounting standards provided pursuant to Section 13(a) of the Exchange Act. ☐
Indicate by check mark whether the registrant has filed a report on and attestation to its management’s assessment of the effectiveness of its internal control over financial reporting under Section 404(b) of the Sarbanes-Oxley Act (15 U.S.C. 7262(b)) by the registered public accounting firm that prepared or issued its audit report. ☑
If securities are registered pursuant to Section 12(b) of the Act, indicate by check mark whether the financial statements of the registrant included in the filing reflect the correction of an error to previously issued financial statements. ☐
Indicate by check mark whether any of those error corrections are restatements that required a recovery analysis of incentive-based compensation received
by any of the registrant’s executive officers during the relevant recovery period pursuant to §240.10D-1(b). ☐
Indicate by check mark whether the registrant is a shell company (as defined by Rule 12b-2 of the Exchange Act). Yes ☐ No ☑
The aggregate market value of voting and non-voting common stock held by non-affiliates of the registrant as of June 30, 2023 was approximately $1.2 billion based on the closing sale price of the registrant’s common stock on that day as reported by the New York Stock Exchange. Excludes shares of the registrant’s common stock held as of such date by officers and directors that the registrant has concluded are or were affiliates of the registrant. Exclusion of such shares should not be construed to indicate that the holder of any such shares possesses the power, direct or indirect, to direct or cause the direction of the management or policies of the registrant or that such person is controlled by or under common control with the registrant.
As of February 12, 2024, we had 73,221,810 shares of common stock, par value $0.01, outstanding.
DOCUMENTS INCORPORATED BY REFERENCE
We intend to file with the Securities and Exchange Commission, not later than 120 days after the close of our fiscal year ended December 31, 2023, a definitive proxy statement or an amendment to this report filed under cover of Form 10-K/A containing the information required to be disclosed under Part III of Form 10-K.
NETSTREIT CORP. AND SUBSIDIARIES
TABLE OF CONTENTS
PART I — FINANCIAL INFORMATION
Unless the context otherwise requires, references in this Annual Report on Form 10-K to the terms “registrant,” the “Company,” “NETSTREIT,” “we,” “our” or “us” refer to NETSTREIT Corp. and all of its consolidated subsidiaries, including NETSTREIT L.P. (the “operating partnership”).
Forward-Looking Statements
This report contains certain forward-looking statements within the meaning of Section 27A of the Securities Act of 1933, as amended (the “Securities Act”), and Section 21E of the Securities Exchange Act of 1934, as amended (the “Exchange Act”). NETSTREIT intends such forward-looking statements to be covered by the safe harbor provisions for forward-looking statements contained in the Private Securities Litigation Reform Act of 1995 and includes this statement for purposes of complying with these safe harbor provisions. Forward-looking statements, which are based on certain assumptions and describe our future plans, strategies and expectations, are generally identifiable by use of the words “anticipate,” “estimate,” “should,” “expect,” “believe,” “intend,” “may,” “will,” “seek,” “could,” “project,” or similar expressions. Forward-looking statements in this report include information about possible or assumed future events, including, among other things, discussion and analysis of our future financial condition, results of operations, our strategic plans and objectives, occupancy and leasing rates and trends, liquidity and ability to refinance our indebtedness as it matures, anticipated expenditures of capital, and other matters. You should not rely on forward-looking statements since they involve known and unknown risks, uncertainties and other factors, which are, in some cases, beyond our control and which could materially adversely affect actual results, performances or achievements. Factors which may cause actual results to differ materially from current expectations, include, but are not limited to:
•global market and economic conditions;
•risks inherent in the real estate business, including tenant defaults, illiquidity of real estate investments, potential liability relating to environmental matters and potential damages from natural disasters;
•our ability to successfully execute our property acquisition or development strategies;
•the accuracy of our assessment that certain businesses are e‑commerce resistant and recession‑resilient;
•the accuracy of the tools we use to determine the creditworthiness of our tenants;
•concentration of our business within certain geographic markets, tenant categories and with certain tenants;
•demand for retail space;
•ability to renew leases, lease vacant space or re‑lease space as existing leases expire or are terminated;
•the degree and nature of our competition;
•our ability to retain our key management personnel;
•failure, weakness, interruption or breach in security of our information systems;
•business interruptions and increased liabilities associated with evolving data privacy laws, regulations, and other obligations and compliance efforts;
•access to capital markets;
•our failure to generate sufficient cash flows to service our outstanding indebtedness;
•inflation and interest rate fluctuations;
•failure to qualify or remain qualified for taxation as a REIT;
•changes in, or the failure or inability to comply with, applicable law or regulation; and
•the other risks identified in this Annual Report on Form 10-K, including, without limitation, those under the headings “Risk Factors,” and “Management’s Discussion and Analysis of Financial Condition and Results of Operations.”
The factors included in this report, including the documents incorporated by reference, and documents the Company subsequently files or furnishes with the Securities and Exchange Commission (“SEC”) are not exhaustive and additional factors could cause actual results to differ materially from those described in our forward-looking statements. For a discussion of additional risk factors, see the factors included under the caption “Risk Factors” within this report. All forward-looking statements are based on information that was available, and speak only, as of the date on which they were made. Except as required by law, the Company disclaims any obligation to review or update these forward-looking statements to reflect events or circumstances as they occur.
Summary of Selected Risk Factors
Our business is subject to numerous risks and uncertainties, including the risks described in the section titled “Risk Factors” included under Part I, Item 1A of this Annual Report. The following is only a summary of the principal risks associated with an investment in our Class A common stock. Material risks that may adversely affect our business, financial condition or results of operations included, but are not limited to, the following:
•global market and economic conditions, which may materially and adversely affect us and our tenants;
•risks related to the ownership of commercial real estate;
•our ability to successfully execute our acquisition or development strategies;
•the ability of our tenants to successfully operate their businesses;
•our assessment that certain businesses are e-commerce resistant and recession-resilient;
•the availability of external sources of capital on commercially reasonable terms or at all;
•our level of indebtedness, which could materially affect our financial position, and restrictions and covenants contained in our debt agreements;
•risks associated with geographic and tenant concentrations in our portfolio;
•our ability to renew leases, lease vacant space or re-lease space as leases expire on favorable terms or at all;
•defaults on our mortgage loans receivable;
•competition for tenants;
•the loss of key management personnel;
•failures, weakness, interruptions or breaches in the security of our information systems or those of our vendors;
•business interruptions and increased liabilities associated with evolving data privacy laws, regulations, and other obligations and compliance efforts;
•liabilities arising under environmental laws;
•failure to qualify or maintain qualification as a REIT for U.S. federal income tax purposes;
•the ability of our board of directors to revoke our REIT qualification without stockholder approval; and
•the designation of the Circuit Court for Baltimore City, Maryland as the sole and exclusive forum for certain actions and proceedings that may be initiated by our stockholders.
Item 1. Business
Business Overview
We are an internally managed real estate company that acquires, owns, invests in and manages a diversified portfolio of single-tenant, retail commercial real estate subject to long-term net leases with high credit quality tenants across the United States. As of December 31, 2023, we owned or had investments in 598 single-tenant retail net leased properties that were diversified by tenant, industry and geography, including 85 different tenants, across 26 retail sectors in 45 states. We focus on tenants in industries where a physical location is critical to the generation of sales and profits, with a focus on necessity goods and essential services in the retail sector, including home improvement, auto parts, drug stores and pharmacies, general retail, grocers, convenience stores, discount stores, and quick-service restaurants, all of which we refer to as defensive retail industries. As of December 31, 2023, our investments generated ABR1 of $131.9 million. Approximately 71% of our ABR is from investment grade2 credit rated tenants and an additional 14% of our ABR is derived from tenants with an investment grade profile3. Exclusive of mortgage loans receivable, our portfolio was 100% occupied with a weighted average remaining lease term (“WALT”) of 9.5 years, which we believe provides us with a strong, stable source of recurring cash flow from our portfolio.
We were formed as a Maryland corporation on October 11, 2019 and our common stock began trading on the New York Stock Exchange (“NYSE”) under the symbol “NTST” on August 13, 2020. We are structured as an umbrella partnership real estate investment trust (a “REIT”), meaning that we own our properties and conduct our business through our operating partnership, directly or through limited partnerships, limited liability companies or other subsidiaries. NETSTREIT GP, LLC, a wholly-owned subsidiary of the Company, is the sole general partner of our operating partnership. As of December 31, 2023, we owned 99.3% of the limited partnership interests in our operating partnership. Beginning with our short taxable year ended December 31, 2019, we elected to be treated and qualify as a REIT for U.S. federal income tax purposes.
2023 Financing Activities
Debt Transactions
2029 Term Loan
On July 3, 2023, we entered into an agreement (the “2029 Term Loan Agreement”) related to a $250.0 million sustainability-linked senior unsecured term loan (the “2029 Term Loan”) which may, subject to the terms of the 2029 Term Loan Agreement, be increased to an amount of up to $400.0 million at our request. The 2029 Term Loan contains a 12-month delayed draw feature and $150.0 million was drawn on July 3, 2023. The 2029 Term Loan is prepayable at our option in whole or in part without premium or penalty. The 2029 Term Loan matures on July 3, 2026, subject to extension options at our election on two occasions, by one year and, on one occasion, by six months (subject to certain conditions). We have hedged the entire $250.0 million of the 2029 Term Loan at an all-in fixed interest rate of 4.99%, through January 2029, which consists of the fixed rate SOFR swap of 3.74%, plus a credit spread adjustment of 0.10% and, at current leverage levels, a borrowing spread of 1.15%. Interest is payable monthly or at the end of the applicable interest period in arrears on any outstanding borrowings.
2027 Term Loan
In December 2019, we entered into an agreement governing a $175.0 million senior unsecured term loan that was scheduled to mature in December 2024 (the “2024 Term Loan”). On June 15, 2023, we amended and restated the agreement governing the 2024 Term Loan to provide for a $175.0 million senior unsecured term loan with a maturity date of January 15, 2026 that is subject to a one year extension option at our election (subject to certain conditions) (the “2027 Term Loan”). The 2027 Term Loan is repayable at our option in whole or in part without premium or penalty. The Company has fully hedged the 2027 Term Loan.
For additional information regarding our debt facilities, see “Note 6 – Debt” in “Item 8 – Financial Statements and Supplementary Data.”
1 Annualized base rent (“ABR”) is annualized base rent as of December 31, 2023, for all leases that commenced, and annualized cash interest on mortgage loans receivable in place as of that date.
2 We define “investment grade” tenants as tenants, or tenants that are subsidiaries of a parent entity, with a credit rating of BBB- (S&P/Fitch), Baa3 (Moody's) or NAIC2 (National Association of Insurance Commissioners) or higher.
3 We define “investment grade profile” tenants as tenants with metrics of more than $1.0 billion in annual sales and a debt to adjusted EBITDA ratio of less than 2.0x but do not carry a published rating from S&P, Moody’s or NAIC.
January Follow-On Offering
In January 2024, we completed a registered public offering of 11,040,000 shares of our common stock at a public offering price of $18.00 per share. In connection with the offering, we entered into forward sale agreements for 11,040,000 shares of our common stock. We did not initially receive any proceeds from the sale of shares of common stock by the forward purchasers. We expect to physically settle the forward sale agreements (by the delivery of shares of common stock) and receive proceeds from the sale of those shares upon one or more forward settlement dates, which shall occur no later than January 9, 2025.
ATM Program
On October 25, 2023, we entered into a $300.0 million at-the-market equity program (the “2023 ATM Program”) through which, from time to time, we may sell shares of our common stock in registered transactions. From October 25, 2023 through December 31, 2023, we sold 4,478,539 shares of our common stock at a weighted average price of $17.27 per share, from which we received net proceeds of approximately $76.5 million. As of December 31, 2023, we had $222.7 million in remaining gross proceeds available for future issuances of shares of our common stock under the 2023 ATM Program.
Effective October 24, 2023, in connection with the establishment of the 2023 ATM Program, we terminated our prior $250.0 million at-the-market equity program (the “2021 ATM Program”). As a result of such termination, we will not offer or sell any additional shares of common stock under the 2021 ATM Program. We have entered into a forward confirmation with respect to 5,983,711 shares of common stock under the 2021 ATM Program that remains unsettled. We may physically settle this forward confirmation (by the delivery of shares of common stock) and receive proceeds from the sale of those shares on one or more forward settlement dates, which shall occur no later than September 13, 2024.
General Investment Criteria
Our objective is to maximize stockholder value by generating attractive risk-adjusted returns through owning, managing and growing a diversified portfolio of commercially desirable properties. As we continue to grow our portfolio, we seek to acquire single-tenant, retail commercial real estate net leased on a long-term basis (at least ten years) to high credit quality tenants in industries where a physical location is critical to the generation of sales and profits, with a focus on necessity goods and essential services in the retail sector, including home improvement, auto parts, drug stores and pharmacies, general retail, grocers, convenient stores, discount stores, and quick-service restaurants. We believe these characteristics make our tenants' businesses e-commerce resistant and resilient through all economic cycles. Our current strategy targets a portfolio that, over time, will:
•derive no more than (i) 5% of its ABR from any single tenant or property, (ii) 15% of its ABR from any single retail sector, (iii) 15% of its ABR from any single state and (iv) 50% of its ABR from its top 10 tenants;
•be primarily leased to tenants operating in businesses we believe to be e-commerce resistant and resilient through all economic cycles;
•have at least 60% of its tenants with an investment grade rating; and
•have a WALT that approximates 10 years.
While we consider the foregoing when making investments, we will be opportunistic in managing our business and make investments that do not meet one or more of these criteria if we believe the opportunity presents an attractive risk-adjusted return. In addition, we may purchase assets for long-term investment, expand and improve the properties we presently own or other acquired properties, or sell such properties, in whole or in part, when circumstances warrant. We intend to engage in investment activities in a manner that is consistent with the maintenance of our status as a REIT for U.S. federal income tax purposes.
Our Target Properties
We seek to acquire, own, invest in and manage a diversified portfolio of single-tenant, retail commercial real estate subject to long-term net leases with high credit quality tenants across the United States. Our growth and diversification strategy focuses on tenants in industries where a physical location is critical to the generation of sales and profits, with a focus on necessity goods and essential services in the retail sector, including home improvement, auto parts, drug stores and pharmacies, general retail, grocers, convenient stores, discount stores, and quick-service restaurants. We believe these characteristics make our tenants' businesses e-commerce resistant and resilient through all economic cycles. Our management team focuses primarily on securing long-term leases with investment grade credit rated tenants and creditworthy tenants without an investment grade rating.
The current market for retail net leased properties is fragmented and decentralized. The relatively small transaction size of retail net lease properties, combined with the locations of many of these properties outside of primary markets, can be a deterrent for larger, institutional buyers that seek to deploy greater amounts of capital in larger markets and in assets that generate greater ABR per property. We generally target properties with a purchase price between $1 million and $10 million, a segment of the market that we believe is undercapitalized and where we can maintain a consistent pipeline of relatively small assets to acquire on attractive terms without the threat of broad competition while increasing our revenue diversification. We also selectively review larger properties with a purchase price in excess of $10 million, which are typically leased to investment grade tenants like Walmart and Home Depot, when we believe the acquisition will be accretive to the quality of our portfolio. The average purchase price of a property in our portfolio as of December 31, 2023 was $3.4 million, our ABR per property is approximately $232 thousand, and our leases typically have initial lease terms of approximately 10 years and contain two or more options for the tenant to extend the lease term, most often for additional five-year periods.
We seek to invest in properties that have strong unit-level economics to reduce the risk of default on a particular property. We also seek to acquire commercially desirable properties by reviewing the underlying key real estate metrics of each property, including location and demographics that will support both tenant financial health, including market rents, and a market for alternative use, re-leasing or redevelopment, when necessary, which we believe maximizes both investment residual value and recovery default value.
Investment Strategy
In addition to acquiring single-tenant net leased retail properties subject to an existing stabilized long-term lease, we will continue to grow our portfolio through a multi-faceted investment strategy, which includes “blend and extend” acquisitions, investments in fully collateralized mortgage loans receivable, property developments which include build-to-suit and reverse build-to-suit transactions and sale-leaseback transactions. Each of these types of transactions or acquisitions offers unique benefits to our business:
•Existing stabilized leases: In existing stabilized lease transactions, we acquire single-tenant net leased operating assets subject to an existing long-term lease through our relationships with current owners, our extensive brokerage network or our developer relationships.
•Blend-and-extend: In blend-and-extend acquisitions, we acquire a single-tenant commercial property with an existing short-term lease, then extend the lease term to at least ten years. Blend-and-extend acquisitions allow us to acquire properties at a lower basis and get long-term site commitments from tenants.
•Mortgage loans receivable: Investments are made by issuing fully collateralized mortgage loans to the owner of a property, with the property serving as collateral for the loans. These mortgage loans allow us to receive a fixed rate of return and may provide us an option to acquire the property under certain circumstances.
•Build-to-suit: In build-to-suit transactions, we secure development financing for a single-tenant commercial property pursuant to executing a long-term lease. Build-to-suit transactions allow us to leverage our extensive developer relationships to partner on opportunities.
•Reverse build-to-suit: In reverse build-to-suit transactions, the tenant acts as the developer and constructs the property with the project financed by the landlord. Both build-to-suit and reverse build-to-suit transactions allow us to acquire the property at lower cost in exchange for long lease terms and higher entry capitalization rates.
•Sale-leaseback: Sale-leaseback transactions allow us to acquire a single-tenant commercial property used by the seller with a simultaneous long-term lease of the property back to the seller. In sale-leaseback transactions, we strive to set rents at sustainable levels and get long-term site commitments from tenants.
We believe this multi-faceted investment strategy will provide us with greater flexibility to opportunistically build our portfolio and differentiate us from other public REITs pursuing a more limited investment strategy.
Investment Origination Process
Our current investment pipeline has been, and our investments going forward will be, identified by our senior management team, led by our Chief Executive Officer, Mark Manheimer, supplemented by our entire acquisitions team. Our acquisition team has developed a broad network of long-standing relationships. Our ability to efficiently deploy capital is a direct result of our management team's extensive network of industry relationships with retailers, brokers, intermediaries, private equity firms and others in the net lease industry, which we utilize to source a robust pipeline of attractive marketed and off-market investment opportunities through which we have deployed capital, acquiring 457 single-tenant retail net leased properties with an aggregate purchase price of $1.6 billion since our formation in December 2019 (excluding our property development acquisitions). We believe our relationship-based sourcing strategy will continue to generate a sustainable pipeline of opportunities to drive growth and achieve scale through the efficient deployment of capital raised in our capital markets offerings. In addition, we plan to continue to leverage our developer relationships to partner on build-to-suit opportunities with triple-net leases and desirable tenants. We believe our developer partnerships on build-to-suit projects, which provide higher yields than acquisitions, will differentiate us from our competitors without development expertise.
Underwriting and Portfolio Management
The Company assesses its investments and actively manages its existing portfolio using a three-part underwriting and risk management strategy with an emphasis on credit and real estate that includes:
•Tenant Credit Underwriting: We review corporate level financial information, assess business risks, including barriers to entry and technology risks. As part of this analysis, we look for tenants that operate in industries where a physical location is critical to the generation of sales and profits, with a focus on necessity goods and essential services in the retail sector, including home improvement, auto parts, drug stores and pharmacies, general retail, grocers, convenient stores, discount stores, and quick-service restaurants. We believe these characteristics make our tenants' businesses e-commerce resistant and resilient through all economic cycles. We then review the tenant's investment rating or establish a “shadow rating” using our proprietary credit modeling process for unrated tenants. and review investment rating or establish a “shadow rating” using our proprietary credit modeling process for unrated tenants.
•Real Estate Valuation: We assess the underlying key real estate metrics of each property, including location and demographics that will support both tenant financial health, including market rents, and a market for alternative use, re-leasing or redevelopment, when necessary. We believe implementation of this underwriting and risk management criteria will continue to build a portfolio that provides a strong, stable source of recurring cash flow.
•Unit-Level Profitability: We analyze and/or estimate unit-level profitability and cost variability to determine the likelihood of each location sustainably operating as a profit center.
Finally, we use our active portfolio management strategy to (i) regularly review each of our properties for changes in unit performance, tenant credit and local real estate conditions, (ii) identify properties that do not meet our disciplined underwriting strategy, diversification objectives or risk management criteria, including rent coverage ratios below 2.0x or likelihood of non-renewal upon lease expiration, and (iii) opportunistically dispose of those properties and reinvest the proceeds in tax-deferred exchanges under Section 1031 (“1031 Exchange”) of the Internal Revenue Code of 1986, as amended, (the “Code”), that will generate higher returns, enhance the credit quality of our real estate portfolio or extend our average remaining lease term. During 2023, we disposed of 19 properties totaling $40.3 million in aggregate sales price and improved portfolio performance by diversifying tenant concentration and improving key metrics such as tenant credit quality, WALT and geographic diversity.
Capital Allocation Strategy
We seek to maintain a capital structure that provides us with flexibility to manage our business and scale our platform through targeted acquisitions, while allowing us to service our debt requirements and generate appropriate risk-adjusted returns. As of December 31, 2023, we had $80.0 million of borrowings outstanding under our $400.0 million senior unsecured revolving credit facility (the “Revolver”) as well as $175.0 million outstanding under the 2027 Term Loan, $200.0 million outstanding under the $200 million senior unsecured term loan (the “2028 Term Loan”), and $150.0 million outstanding under the 2029 Term Loan. We intend to target a conservative net debt to EBITDAre leverage ratio of 4.5x to 5.5x, including the impact of any forward unsettled equity, to best position the Company for growth, and we intend to capitalize on our leading origination, underwriting, financing, documentation and property processes to improve our efficiency. As we grow, we anticipate having access to the investment grade debt and equity capital markets to maintain a prudent balance between debt and equity financing.
In addition, we seek to make investments that generate strong current income as a result of the difference, or spread, between the rate we earn on our assets and the rate we pay on our liabilities (primarily our long-term debt). We intend to augment that income with internal growth through a target dividend payout ratio that will permit some free cash flow reinvestment. We believe this will enable strong dividend growth without relying exclusively on future common stock issuances to fund new portfolio investments. Additionally, our WALT of 9.5 years as of December 31, 2023 and superior underwriting and portfolio monitoring capabilities, which reduce default losses, are intended to make our cash flows highly stable.
Tax Status
We are organized and have operated in a manner that has enabled us to qualify to be taxed as a REIT commencing with our short taxable year ended December 31, 2019, and we intend to continue to operate so as to satisfy the requirements for qualification as a REIT for U.S. federal income tax purposes. To qualify as a REIT, we must meet a number of organizational and operational requirements, including a requirement that we annually distribute at least 90% of our taxable income to our stockholders, computed without regard to the dividends paid deduction and excluding our net capital gain, plus 90% of our net income after tax from foreclosure property (if any), minus the sum of various items of excess non-cash income.
Regulation
General
Our properties are subject to various laws, ordinances and regulations, including those relating to fire and safety requirements, and affirmative and negative covenants and, in some instances, common area obligations. Our tenants have primary responsibility for compliance with these requirements pursuant to our leases. We believe that each of our properties has the necessary permits and approvals.
Environmental and Related Matters
Federal, state and local environmental laws and regulations regulate, and impose liability for, releases of hazardous or toxic substances into the environment. Under various of these laws and regulations, a current or previous owner, operator or tenant of real estate may be required to investigate and clean up hazardous or toxic substances, hazardous wastes or petroleum product releases or threats of releases at the property, and may be held liable to a government entity or to third parties for property damage and for investigation, clean-up and monitoring costs incurred by those parties in connection with the actual or threatened contamination. These laws may impose clean-up responsibility and liability without regard to fault, or whether or not the owner, operator or tenant knew of or caused the presence of the contamination. The liability under these laws may be joint and several for the full amount of the investigation, clean-up and monitoring costs incurred or to be incurred or actions to be undertaken, although a party held jointly and severally liable may seek to obtain contributions from other identified, solvent, responsible parties of their fair share toward these costs. These costs may be substantial, and can exceed the value of the property. In addition, some environmental laws may create a lien on the contaminated site in favor of the government for damages and costs it incurs in connection with the contamination. As the owner or operator of real estate, we also may be liable under common law to third parties for damages and injuries resulting from environmental contamination emanating from the real estate. The presence of contamination, or the failure to properly remediate contamination, on a property may adversely affect the ability of the owner, operator or tenant to sell or rent that property or to borrow using the property as collateral, and may adversely impact our investment in that property.
Environmental laws regulate a variety of activities that can occur on a property, including the storage of petroleum products or other hazardous or toxic substances, air emissions, water discharges and exposure to lead-based paint. Such laws may impose fines or penalties for violations, and may require permits or other governmental approvals to be obtained for the operation of a business involving such activities. As a result of the foregoing, we could be materially and adversely affected.
Environmental laws also govern the presence, maintenance and removal of asbestos-containing materials (“ACM”) and impose various requirements, including operation and maintenance plans for the presence of any suspect ACM. Significant fines can be assessed for violation of these regulations. As a result of these regulations, building owners and those exercising control over a building's management may be subject to an increased risk of personal injury lawsuits by workers and others exposed to ACM. The regulations may affect the value of a building containing ACM in which we have invested. Federal, state and local laws and regulations also govern the removal, encapsulation, disturbance, handling and/or disposal of ACM when those materials are in poor condition or in the event of construction, remodeling, renovation or demolition of a building. These laws may impose liability for improper handling or a release into the environment of ACM and may provide for fines to, and for third parties to seek recovery from, owners or operators of real properties for personal injury or improper work exposure associated with ACM.
When excessive moisture accumulates in buildings or on building materials or moisture is otherwise present, mold growth may occur, particularly if the moisture problem remains undiscovered or is not addressed over a period of time. Some molds may be toxic and produce airborne toxins or irritants. Indoor air quality issues can also stem from inadequate ventilation, chemical contamination from indoor or outdoor sources, and other biological contaminants such as pollen, viruses and bacteria. Indoor exposure to airborne toxins or irritants above certain levels can be alleged to cause a variety of adverse health effects and symptoms, including allergic or other reactions. As a result, the presence of significant mold or other airborne contaminants at any of our properties could require us to undertake a costly remediation program to contain or remove the mold or other airborne contaminants from the affected property or increase indoor ventilation. In addition, the presence of significant mold or other airborne contaminants could expose us to liability from our tenants, employees of our tenants or others if property damage or personal injury occurs.
Generally, our leases require the lessee to comply with environmental law and provide that the lessee will indemnify us for any loss or expense we incur as a result of lessee's violation of environmental law or the presence, use or release of hazardous materials on our property attributable to the lessee. If our lessees do not comply with environmental law, or we are unable to enforce the indemnification obligations of our lessees, our results of operations would be adversely affected.
We cannot predict what other environmental legislation or regulations will be enacted in the future, how existing or future laws or regulations will be administered or interpreted or what environmental conditions may be found to exist on the properties in the future. Compliance with existing and new laws and regulations may require us or our tenants to spend funds to remedy environmental noncompliance or investigate and cleanup contamination. If we or our tenants were to become subject to significant environmental liabilities, we could be materially and adversely affected.
Americans with Disabilities Act and Similar Laws
Under Title III of the Americans with Disabilities Act (the “ADA”), and rules promulgated thereunder, in order to protect individuals with disabilities, public accommodations must remove architectural and communication barriers that are structural in nature from existing places of public accommodation to the extent “readily achievable.” In addition, under the ADA, alterations to a place of public accommodation or a commercial facility are to be made so that, to the maximum extent feasible, such altered portions are readily accessible to and usable by disabled individuals. The “readily achievable” standard takes into account, among other factors, the financial resources of the affected site and the owner, lessor or other applicable person.
Compliance with the ADA, as well as other federal, state and local laws, may require modifications to properties we currently own or may purchase, or may restrict renovations of those properties. Failure to comply with these laws or regulations could result in the imposition of fines or an award of damages to private litigants, as well as the incurrence of the costs of making modifications to attain compliance, and future legislation could impose additional obligations or restrictions on our properties. Although our tenants are generally responsible for all maintenance and repairs of the property pursuant to our leases, including compliance with the ADA and other similar laws or regulations, we could be held liable as the owner of the property for a failure of one of our tenants to comply with these laws or regulations.
Insurance
Our tenants are generally required to maintain liability and property insurance coverage for the properties they lease from us pursuant to triple or double-net leases. These leases generally require our tenants to name us (and any of our lenders that have a mortgage on the property leased by the tenant) as additional insureds on their liability policies and additional named insured and/or loss payee (or mortgagee, in the case of our lenders) on their property policies. Depending on the location of the property, losses of a catastrophic nature, such as those caused by earthquakes and floods, may be covered by insurance policies that are held by our tenant with limitations such as large deductibles or co-payments that a tenant may not be able to meet. In addition, losses of a catastrophic nature, such as those caused by wind, hail, hurricanes, terrorism or acts of war, may be uninsurable or not economically insurable. In the event there is damage to our properties that is not covered by insurance and such properties are subject to recourse indebtedness, we will continue to be liable for the indebtedness, even if these properties are irreparably damaged.
In addition to being a named insured on our tenants' liability policies, we separately maintain commercial general liability coverage. We also maintain full property coverage on all untenanted properties and other property coverage as may be required by our lenders, which are not required to be carried by our tenants under our leases.
Competition
We face competition for acquisitions of real property from investors, including traded and non-traded public REITs, private equity investors and institutional investment funds, some of which have greater financial resources than we do, a greater ability to borrow funds to acquire properties and the ability to accept more risk. We also believe that competition for real estate financing comes from middle-market business owners themselves, many of whom have had a historic preference to own, rather than lease, the real estate they use in their businesses. This competition may increase the demand for the types of properties in which we typically invest and, therefore, reduce the number of suitable investment opportunities available to us and increase the prices paid for such acquisition properties. This competition will increase if investments in real estate become more attractive relative to other forms of investment.
As a landlord, we compete in the multi-billion dollar commercial real estate market with numerous developers and owners of properties, many of which own properties similar to ours in the same markets in which our properties are located. Some of our competitors have greater economies of scale, lower costs of capital, access to more resources and greater name recognition than we do. If our competitors offer space at rental rates below current market rates or below the rental rates we currently charge our tenants, we may lose our tenants or prospective tenants and we may be pressured to reduce our rental rates or to offer substantial rent abatements, tenant improvement allowances, early termination rights or below-market renewal options in order to retain tenants when our leases expire.
Human Capital Management
As of December 31, 2023, we had 28 full-time employees. Our staff is mostly comprised of professional employees engaged in origination, underwriting, closing, accounting and financial reporting, portfolio management and capital markets activities essential to our business.
We are committed to creating a strong internal culture that promotes inclusion and employee well-being. Our past and continued success relies on our ability to attract, develop, engage, and retain a team of highly motivated and talented employees. In order to meet this objective, we are committed to the following:
◦Talent acquisition and development. To ensure we attract and retain top talent, we provide competitive compensation and benefits, including equity compensation for all employees. We aim to develop our employees by providing internal training and reimbursement for certifications, tuition, courses and seminars for continuing professional education. We encourage regular informal feedback directly from the leadership team and complete formal evaluations of each employee annually.
◦Diversity, equity, and inclusion. We provide equal employment opportunities to all individuals and seek to cultivate an inclusive culture that respects and appreciates diversity of experience, ideas and opinions. We have adopted a Diversity, Equity and Inclusion Policy to outline our diversity, equity and inclusion goals, commitment, initiatives and monitoring practices. As of December 31, 2023, our workforce was approximately 64% male and 36% female; females represented approximately 14% of our senior management team; and 29% of our workforce was ethnically diverse. As part of our effort to attract a more diverse candidate base, we partner with local universities and organizations in our recruiting efforts with a focus on recruitment of candidates that are underserved in our industry.
◦Workplace culture and empowerment. We ensure that employees have a clear voice in sharing and upholding our cultural value and expectations through the Employee Experience Committee (EEC). The EEC allows the leadership team to engage with, and obtain feedback from, our employees on their workplace experiences. The EEC is comprised of non-management members of the organization and rotate annually. Members meet periodically to discuss recommendations to present to the leadership team, which may include additional substantive training, personal growth and professional development programs, company social and team-building events, employee benefits, and health and wellness programs. In addition, we established an Employee Recognition Program designed to recognize exemplary performance. Employees have an opportunity to nominate their teammates who have made significant contributions and two nominees per quarter are chosen to win an award.
◦Employee wellness. We are committed to providing a safe and healthy working environment for our employees. We offer competitive healthcare insurance and generous paid time off, as well as paid medical and parental leave. We also provide employees with standing desks, ergonomic desk chairs and fitness center memberships.
Available Information
Our principal executive office is located at 2021 McKinney Avenue, Suite 1150, Dallas, Texas, 75201 and our telephone number is 972-200-7100. Our website address is www.NETSTREIT.com. Our reports are electronically filed with or furnished to the SEC pursuant to Section 13 or 15(d) of the Exchange Act and can be accessed through the SEC's website at www.sec.gov. These filings can also be accessed through our site, free of charge, as soon as reasonably practicable after we electronically file or furnish such reports. These reports include our Annual Report on Form 10-K, Quarterly Reports on Form 10-Q, and current reports on Form 8-K, as well as any amendments to those reports. Our website also contains copies of our corporate governance guidelines and code of business conduct and ethics, as well as the charters of our audit, compensation and nominating and governance committees. The information on, or otherwise accessible through, our website does not constitute a part of this report.
Item 1A. Risk Factors
Our operations and financial results are subject to various risks and uncertainties, including those described below. You should
consider and read carefully all of the risks and uncertainties described below, together with all of the other information contained in this Annual Report on Form 10-K, including the section titled “Management’s Discussion and Analysis of Financial Condition and Results of Operations” and our consolidated financial statements and the related notes as well as other information filed with the SEC from time to time. The risks described below are those which we believe are the material risks we face. The occurrence of any of the following risks or additional risks and uncertainties not presently known to us or that we currently believe to be immaterial could materially and adversely affect our business, financial condition, or results of operations. In such case, the trading price of our common stock could decline.
Risks Related to Our Business and Properties
Global market and economic conditions may materially and adversely affect us and our tenants.
Changes in global or national market and economic conditions, such as global economic and financial market volatility and global geopolitical conflict, may continue to cause, among other things, tightening in the credit markets, lower levels of liquidity, higher interest rates, increased inflation, increases in the rate of default and bankruptcy and lower consumer and business spending, which could materially and adversely affect us. For example, the current and continued macro-economic conditions of high inflation and high interest rates have increased the costs associated with acquiring new properties and decreased the availability of financing on terms that we find attractive, which has reduced our ability to acquire properties at our historical rate with attractive terms. Other potential consequences of changes in economic and financial conditions include: changes in the performance of our tenants, which may result in lower rent and lower recoverable expenses than the tenant can afford to pay and tenant defaults under the lease; current or potential tenants may delay or postpone entering into long-term leases with us; continuing increased costs of acquiring new properties on attractive terms; inability to borrow on terms and conditions that we find to be acceptable, which could continue to reduce our ability to pursue acquisition opportunities or increase future interest expense; and the recognition of impairment charges on or reduced values of our properties, which may adversely affect our results of operations or limit our ability to dispose of assets at attractive prices and may reduce the availability of buyer financing. We are also limited in our ability to reduce costs to offset the results of a prolonged or severe economic downturn given certain fixed costs and commitments associated with our operations. Accordingly, a decline in economic conditions could materially and adversely affect us.
We are subject to risks related to commercial real estate ownership that could reduce the value of our properties.
Our core business is the ownership of single-tenant, retail commercial real estate subject to long-term net leases. Accordingly, our performance is subject to risks incident to the ownership of commercial real estate, which include the inability to collect rents from tenants due to financial hardship, including bankruptcy; changes in local real estate conditions in the markets in which we operate, including the availability and demand for single-tenant, retail commercial real estate space; changes in consumer trends and preferences that affect the demand for products and services offered by our tenants; inability to lease or sell properties upon expiration or termination of existing leases; environmental risks, including the presence of hazardous or toxic substances or materials on our properties; the subjectivity of real estate valuations and changes in such valuations over time; the illiquid nature of real estate compared to most other financial assets; changes in laws and governmental regulations, including those governing real estate usage and zoning; changes in interest rates and the availability of financing; and changes in the general economic and business climate. The occurrence of any of these may cause the value of our real estate to decline, which could materially and adversely affect us.
We may not be able to successfully execute our acquisition or development strategies.
Our ability to expand our portfolio through property acquisitions requires us to identify and complete acquisitions or investment opportunities on attractive terms that are compatible with our growth strategy and to successfully integrate newly acquired properties into our portfolio.The current and continued macro-economic conditions of high inflation and high interest rates have increased the costs associated with acquiring new properties and decreased the availability of financing on terms that we find acceptable, which has reduced our ability to acquire properties at our historical rate with attractive terms. Additionally, our ability to successfully operate acquired properties may be constrained by risks associated with the ownership of real estate. As a result, we may not be able to implement our investment and acquisition strategies successfully. We cannot assure you that our portfolio of properties will expand at all, or if it will expand at any specified rate or to any specified size. Because we may invest in markets other than the ones in which our current properties are located or properties which may be leased to tenants other than those to which we have historically leased properties, we may also be subject to the risks associated with investment in new markets or with new tenants that may be relatively unfamiliar to our management team.
Our development activities related to our build-to-suit projects are subject to, without limitation, risks relating to the availability and timely receipt of zoning and other regulatory approvals and the cost and timely completion of construction (including risks from factors beyond our control, such as weather or labor conditions or material shortages). Additionally, new development may involve risks related to construction delays or costs overruns that may increase anticipated project costs. These risks could result in substantial unanticipated delays or expenses and, under certain circumstances, could prevent completion of development activities once undertaken or provide a tenant the opportunity to reduce rent or terminate a lease. Any of these situations may delay or eliminate proceeds or cash flows we expect from build-to-suit projects, which could have an adverse effect on our financial condition.
Our business is dependent upon our tenants successfully operating their businesses and their failure to do so could materially and adversely affect us.
Each of our properties is leased by a single tenant. Therefore, we believe that the success of our investments is materially dependent on the financial stability of our tenants. The success of any one of our tenants is dependent on its individual business and its industry, which could be adversely affected by poor management, global market and economic conditions in general, changes in consumer trends and preferences that decrease demand for a tenant's products or services or other factors over which neither they nor we have control. Our portfolio includes properties leased to single tenants that operate in multiple locations, which means that, as of December 31, 2023, we owned numerous properties leased by the same entity (or related group of entities), including Dollar General, CVS, Walgreens, Dollar Tree / Family Dollar, Food Lion / Stop & Shop, Hobby Lobby, 7-Eleven, Festival Foods, Advance Auto Parts and Sam’s / Walmart. To the extent we own numerous properties leased and/or operated by one entity (or related group of entities), the general failure of that single entity (or related group of entities) or a loss or significant decline in its business could materially and adversely affect us.
At any given time, any tenant may experience a downturn in its business that may weaken its operating results or the overall financial condition of individual properties or its business as a whole. As a result, a tenant may delay lease commencement, fail to make rental payments when due, decline to extend a lease upon its expiration, become insolvent or declare bankruptcy. We depend on our tenants to operate the properties we own in a manner that generates revenues sufficient to allow them to meet their obligations to us, including their obligations to pay rent, maintain certain insurance coverage and pay real estate taxes. The ability of our tenants to fulfill their obligations under our leases may depend, in part, upon the overall profitability of their operations. Cash flow generated by certain tenant businesses may not be sufficient for a tenant to meet its obligations to us. We could be materially and adversely affected if a number of our tenants were unable to meet their obligations to us.
Single-tenant leases involve significant risks of tenant default.
Our strategy focuses primarily on investing in single-tenant, retail commercial real estate subject to long-term net leases across the United States. The financial failure of, or default in payment by, a single tenant under its lease is likely to cause a significant or complete reduction in our rental revenue from that property and a reduction in the value of the property. We may also experience difficulty or a significant delay in re-leasing or selling such property. This risk will be magnified if we decide to lease multiple properties to a single tenant under a master lease. A tenant failure or default under a master lease could reduce or eliminate rental revenue from multiple properties and reduce the value of such properties. In addition, we would be responsible for all of the operating costs of a property following a vacancy at a single-tenant building. Because our properties have generally been built to suit a particular tenant's specific needs, we may also incur significant costs to make the leased premises ready for another tenant.
Our assessment that certain businesses are e-commerce resistant and recession-resilient may prove to be incorrect.
We primarily invest in properties leased to tenants in industries where a physical location is critical to the generation of sales and profits with a focus on necessity goods and essential services in the retail sector such as home improvement, auto parts, drug stores and pharmacies, general retail, grocers, convenient stores, discount stores and quick-service restaurants. We believe these characteristics make our tenants' businesses e-commerce resistant and resilient through all economic cycles. While we believe this to be the case, businesses previously thought to be internet resistant, such as the retail grocery industry, have proven to be susceptible to competition from e-commerce. Technology and business conditions, particularly in the retail industry, are rapidly changing, and our tenants may be adversely affected by technological innovation, changing consumer preferences and competition from non-traditional sources. To the extent our tenants face increased competition from non-traditional competitors, such as internet vendors, some of which may have different business models and larger profit margins, their businesses could suffer. There can be no assurance that our tenants will be successful in the face of any new competition, and a deterioration in our tenants' businesses could impair their ability to meet their lease obligations to us and materially and adversely affect us.
A substantial number of our properties are leased to unrated tenants and the tools we use to determine the creditworthiness of our tenants may not be accurate.
As of December 31, 2023, 29.5% of our properties are leased to unrated or sub-investment grade tenants that we determine, through our disciplined underwriting and risk management strategy, to be creditworthy. This strategy includes reviewing corporate level financial information, assessing business risks and reviewing investment ratings or establishing a “shadow rating” using our proprietary credit modeling process for unrated tenants. A shadow rating does not constitute a published credit rating and lacks the extensive company participation that is typically involved when a rating agency publishes a rating; accordingly, a shadow rating may not be as indicative of creditworthiness as a rating published by Moody's Investor Services, S&P Global Ratings, or another nationally recognized statistical rating organization. Our calculations of shadow ratings and rent coverage ratios are based on financial information provided to us by our tenants and prospective tenants without independent verification on our part, and we must assume the appropriateness of estimates and judgments that were made by the party preparing the financial information. If our measurement of credit quality proves to be inaccurate, we may be subject to defaults, and investors may view our cash flows as less stable.
Our portfolio has geographic market concentrations that make us especially susceptible to adverse developments in those geographic markets.
As of December 31, 2023, our portfolio included substantial holdings in Illinois (8.6%), Texas (7.6%), Wisconsin (7.2%), New York (6.5%), North Carolina (5.9%), Georgia (5.4%), Alabama (5.1%), and Ohio (5.1%) based on ABR as of December 31, 2023. In addition, a significant portion of our portfolio holdings (based on ABR as of December 31, 2023) were located in the South (43.4%) and Midwest (31.3%) regions of the United States (as defined by the U.S. Census Bureau). This geographic concentration could adversely affect our operating performance if conditions become less favorable in any of the regions, states or markets within such states in which we have a concentration of properties. An economic downturn or other adverse events or conditions such as natural disasters in any of these areas, or any other area where we may have significant concentration in the future, could materially and adversely affect us.
We are subject to risks related to tenant concentration, and an adverse development with respect to a large tenant could materially and adversely affect us.
The top five tenants in our portfolio — Dollar General, CVS, Walgreens, Dollar Tree and Home Depot — contributed 10.9%, 7.8%, 6.9%, 5.0%, and 4.7%, respectively, of our ABR as of December 31, 2023. As a result, our financial performance depends significantly on the revenues generated from these tenants and, in turn, their financial condition. In the future, we may experience additional tenant and industry concentrations. In the event that one of these tenants, or another tenant that occupies a significant portion of our properties or whose lease payments represent a significant portion of our rental revenue, were to experience financial weakness or file for bankruptcy, it could have a material adverse effect on us.
We may be unable to renew leases, lease vacant space or re-lease space as leases expire on favorable terms or at all.
Our results of operations depend on our ability to continue to strategically lease our properties, including renewing expiring leases, leasing vacant space and re-leasing space in properties where leases are expiring, optimizing our tenant mix or leasing properties on more economically favorable terms. Current tenants may decline, or may not have the financial resources available, to renew current leases and we cannot assure you that leases that are renewed will have terms that are as economically favorable to us as the expiring lease terms. If tenants do not renew the leases as they expire, we will have to find new tenants to lease our properties and there is no guarantee that we will be able to find new tenants, that our properties will be re-leased at rental rates equal to or above the current average rental rates or that substantial rent abatements, tenant improvement allowances, early termination rights or below-market renewal options or other tenant inducements will not be offered to attract new tenants. In addition, the loss of a tenant, either through lease expiration or tenant bankruptcy or insolvency, may require us to spend significant amounts of capital to renovate the property before it is suitable for a new tenant and cause us to incur significant costs. Many of the leases we enter into or acquire are for properties that are specially suited to the particular business of our tenants. Because these properties have been designed or physically modified for a particular tenant, if the current lease is terminated or not renewed, we may be subject to an uncertain period of downtime without rental income, be required to renovate the property at substantial costs, decrease the rent we charge or provide other concessions in order to lease the property to another tenant. In addition, in the event we are required or desire to sell the property, we may have difficulty selling it to a party other than the tenant due to the special purpose for which the property may have been designed or modified. If we are unable to renew leases, lease vacant space or re-lease space as leases expire, it could have a material adverse effect on us.
Defaults by borrowers on loans we originate could lead to losses.
Mortgage loans receivable are investments made by issuing first-lien mortgage loans to the owner of a property, with the property serving as collateral for the loans. These mortgage loans allow us to receive a fixed rate of return and generally provide us an option to acquire the property at predetermined pricing and dates. A default by a borrower on its loan payments to us that would prevent us from earning interest or receiving a return of the principal of our loan could materially and adversely affect us. In the event of a default, we may also experience delays in enforcing our rights as lender and may incur substantial costs in collecting the amounts owed to us and in liquidating the property that serves as collateral for the loan. Foreclosure and other similar proceedings used to enforce payment of real estate loans are generally subject to principles of equity, which are designed to relieve the indebted party from the legal effect of that party's default. In the event we have to foreclose on a property, the amount we receive from the foreclosure sale of the property may be inadequate to fully pay the amounts owed to us by the borrower and our costs incurred to foreclose, repossess and sell the property.
Some of our tenants operate under franchise or license agreements, which, if terminated or not renewed prior to the expiration of their leases with us, would likely impair their ability to pay us rent.
Of the ABR of our portfolio as of December 31, 2023, 4.6% is operated by tenants under franchise or license agreements. Generally, franchise agreements have terms that end earlier than the respective expiration dates of the related leases. In addition, a tenant's rights as a franchisee or licensee typically may be terminated and the tenant may be precluded from competing with the franchiser or licensor upon termination. Usually, we have no notice or cure rights with respect to such a termination and have no rights to assignment of any such franchise agreement. This may have an adverse effect on our ability to mitigate losses arising from a default on any of our leases. A franchiser's or licensor's termination or refusal to renew a franchise or license agreement would likely have a material adverse effect on the ability of the tenant to make payments under its lease, which could materially and adversely affect us.
The bankruptcy or insolvency of any of our tenants could result in the termination of such tenant's lease and material losses to us.
The occurrence of a tenant bankruptcy or insolvency could diminish the income we receive from that tenant's lease or leases or force us to “take back” a property as a result of a default or a rejection of a lease by a tenant in bankruptcy. If a tenant becomes bankrupt or insolvent, federal law may prohibit us from evicting such tenant based solely upon such bankruptcy or insolvency. In addition, a bankrupt or insolvent tenant may be authorized to reject and terminate its lease or leases with us. Any claims against such bankrupt tenant for unpaid future rent would be subject to statutory limitations that would likely result in our receipt of rental revenues that are substantially less than the contractually specified rent we are owed under the lease or leases. In addition, any claim we have for unpaid past rent, if any, may not be paid in full. We may also be unable to re-lease a terminated or rejected space or to re-lease it on comparable or more favorable terms. As a result, tenant bankruptcies may materially and adversely affect us.
Illiquidity of real estate investments could significantly impede our ability to respond to adverse changes in the performance of our properties and harm our financial condition.
Our real estate investments are relatively difficult to sell quickly. As a result, our ability to promptly sell one or more properties in our portfolio in response to changing economic, financial or investment conditions is limited. We may be unable to realize our investment objective by sale, other disposition or refinancing at attractive prices within any given period of time or may otherwise be unable to complete any exit strategy. In particular, these risks could arise from weakness in or even the lack of an established market for a property, changes in the financial condition or prospects of prospective purchasers, changes in national or international economic conditions and changes in laws, regulations or fiscal policies of the jurisdiction in which the property is located.
In addition, the Code imposes restrictions on a REIT's ability to dispose of properties that are not applicable to other types of real estate companies. In particular, the tax laws applicable to REITs effectively require that we hold our properties for investment, rather than primarily for sale in the ordinary course of business, which may cause us to forgo or defer sales of properties that otherwise would be in our best interest. Therefore, we may not be able to alter our portfolio in response to economic or other conditions promptly or on favorable terms, which may materially and adversely affect us.
We face significant competition for tenants, which may decrease or prevent increases of the occupancy and rental rates of our properties, and competition for acquisitions may reduce the number of acquisitions we are able to complete and increase the costs of these acquisitions.
We compete with numerous developers, owners and operators of properties, many of which own properties similar to ours in the same markets in which our properties are located, some of which may have greater financial resources than we do. If our competitors offer space at rental rates below current market rates, or below the rental rates we currently charge our tenants, we may lose existing or potential tenants and we may be pressured to reduce our rental rates or to offer more substantial rent abatements, tenant improvements, early termination rights or below-market renewal options in order to retain tenants when our leases expire. This competition also may increase the demand for the types of properties in which we typically invest and, therefore, reduce the number of suitable investment opportunities available to us and increase the prices paid for such acquisition properties. Accordingly, competition for the acquisition of real property and tenants could materially and adversely affect us.
A loss of key management personnel could adversely affect our performance.
We are dependent on the efforts and performance of our key management, including Mark Manheimer, our Chief Executive Officer, and Daniel Donlan, our Chief Financial Officer. We cannot guarantee we will retain any of our executive leadership team and they could be difficult to replace. The loss of their services until suitable replacements are found could adversely affect our business, diminish our investment opportunities and weaken our relationships with lenders, business partners, existing and prospective tenants and industry personnel, all of which could materially and adversely affect us.
Any material failure, weakness, interruption or breach in security of our information systems or data, or those of our third party vendors, could prevent us from effectively operating our business.
We rely on information systems across our operations and corporate functions, including finance and accounting, and depend on such systems to ensure payment of obligations, collection of cash, data warehousing to support analytics, and other various processes and procedures. Our ability to manage our business depends significantly on the reliability and capacity of these systems. The failure of these systems to operate effectively, maintenance problems, failures or delays in upgrading or transitioning to new platforms, or a breach in security of these systems, such as in the event of cyber-attacks, malicious internet-based activity, online and offline fraud, and administrative or technical failures and other similar activities that threaten the confidentiality, integrity, and availability of our information technology systems, including those of the third parties upon which we rely, could result in the theft of intellectual property, personal information or personal property, damage to our reputation and third-party claims, as well as reduced efficiency in our operations and in the accuracy of our internal and external financial reporting. A failure or weakness in our information systems (or those of the third parties upon which we rely) could materially and adversely affect us, and the remediation of any such problems could result in significant unplanned expenditures.
Our reliance on vendors could introduce new cybersecurity risks and vulnerabilities, and other threats to our business operations. We engage a variety of vendors to process and store data, some of which may be private or include personally identifiable information. We also depend on vendors to host certain of our systems and infrastructure. Our ability to monitor these vendors’ information security practices is limited, and these vendors may not have adequate information security measures in place. If our vendors experience a security incident or other interruption, we could experience adverse consequences, including harm to our business, results of operations and financial condition.
We and the third parties upon which we rely may be subject to a variety of evolving threats, including but not limited to social-engineering attacks (including through phishing attacks), malicious code (such as viruses and worms), malware (including as a result of advanced persistent threat intrusions), denial-of-service attacks (such as credential stuffing), credential harvesting, personnel misconduct or error, ransomware attacks, software bugs, server malfunctions, software or hardware failures, loss of data or other information technology assets, adware, telecommunications failures, earthquakes, fires, floods, and other similar threats. In particular, severe ransomware attacks are becoming increasingly prevalent and can lead to significant interruptions in our operations, loss of sensitive data and income, reputational harm, and diversion of funds. Extortion payments may alleviate the negative impact of a ransomware attack, but we may be unwilling or unable to make such payments due to, for example, applicable laws or regulations prohibiting such payments. While we have implemented security measures designed to protect against security incidents, there can be no assurance that these measures will be effective. We take steps designed to detect, mitigate, and remediate vulnerabilities in our information systems. We may not, however, detect and remediate all such vulnerabilities including on a timely basis. Further, we may experience delays in developing and deploying remedial measures designed to address any such identified vulnerabilities. Vulnerabilities could be exploited and result in a security incident.
Applicable data privacy and security obligations may require us to notify relevant stakeholders of security incidents. Such disclosures are costly, and the disclosure or the failure to comply with such requirements could lead to adverse consequences. If we (or a third party upon whom we rely) experience a security incident or are perceived to have experienced a security incident, we may experience adverse consequences. These consequences may include: government enforcement actions (for example, investigations, fines, penalties, audits, and inspections); additional reporting requirements and/or oversight; restrictions on processing sensitive data (including personal data); litigation (including class claims); indemnification obligations; negative publicity; reputational harm; monetary fund diversions; interruptions in our operations (including availability of data); financial loss; and other similar harms. Security incidents and attendant consequences may prevent or cause customers to stop using our services, deter new customers from using our services, and negatively impact our ability to grow and operate our business.
Data privacy risks, including evolving laws, regulations, and other obligations and compliance efforts, may result in business interruption and increased costs and liabilities.
Laws, regulations and other obligations (including applicable guidance, industry standards, external and internal privacy and security policies and contractual requirements) relating to personal data are constantly evolving, as federal, state, local and foreign governments continue to adopt new measures addressing data privacy, data security, and processing personal data. Existing privacy and data protection laws and regulations in the United States (including the California Consumer Privacy Act, as amended (“CCPA”)), Europe (including the E.U.’s General Data Protection Regulation) and other jurisdictions impose stringent obligations on such activities. For example, the CCPA, which applies to business representative and other types of personal data of California residents, provides for fines of up to $7,500 per intentional violation and allows private litigants affected by certain data breaches to recover significant statutory damages. Such laws and regulations may be interpreted or applied in a manner that is inconsistent with each other and may complicate our existing data management practices. Evolving compliance and operational requirements under the privacy laws of the jurisdictions in which we operate, regulations, and other obligations have become increasingly burdensome and complex. Privacy-related claims or lawsuits initiated by governmental bodies, customers or other third parties, irrespective of the merits, could be time consuming, result in costly enforcement actions (including regulatory proceedings, investigations, fines,penalties, audits, and inspections), litigation (including class action claims) or mass arbitration demands, penalties and fines, require us to change our business practices or cause business interruptions and may lead to administrative, civil, or criminal liability.
Insurance on our properties may not adequately cover all losses and uninsured losses could materially and adversely affect us.
Our tenants generally are required to maintain liability and property insurance coverage for the properties they lease from us pursuant to triple or double-net leases. These leases generally require our tenants to name us (and any of our lenders that have a mortgage on the property leased by the tenant) as additional insureds on their liability policies and additional named insured and/or loss payee (or mortgagee, in the case of our lenders) on their property policies. Depending on the location of the property, losses of a catastrophic nature, such as those caused by earthquakes and floods, may be covered by insurance policies that are held by our tenant with limitations such as large deductibles or co-payments that a tenant may not be able to meet. In addition, losses of a catastrophic nature, such as those caused by wind/hail, hurricanes, terrorism, acts of war or pandemics or endemics, may be uninsurable or not economically insurable. In addition, changes in building codes and ordinances, environmental considerations, and other factors, including terrorism or acts of war, may make any insurance proceeds we receive insufficient to repair or replace a property if it is damaged or destroyed. In the event there is damage to our properties that is not covered by insurance, we may be materially and adversely affected.
We may acquire properties or portfolios of properties through tax deferred contribution transactions, which could result in stockholder dilution and limit our ability to sell such assets.
In the future we may acquire properties or portfolios of properties through tax deferred contribution transactions in exchange for OP units, which may result in stockholder dilution. This acquisition structure may have the effect of, among other things, reducing the amount of tax depreciation we could deduct over the tax life of the acquired properties, and may require that we agree to protect the contributors’ ability to defer recognition of taxable gain through restrictions on our ability to dispose of the acquired properties and/or the allocation of partnership debt to the contributors to maintain their tax bases. These restrictions could limit our ability to sell an asset at a time, or on terms, that would be favorable absent such restrictions. In addition, as part of the formation transactions, our predecessor made limited representations, warranties and covenants to us regarding the contributed assets. Because many liabilities, including tax liabilities, may not have been identified, we may have no recourse for such liabilities. Any unknown or unquantifiable liabilities to which the properties and assets previously owned by our predecessor are subject could adversely affect the value of those properties and as a result adversely affect us.
We may experience a decline in the fair value of our assets, which may have a material impact on our financial condition, liquidity and results of operations and adversely impact the market value of our common stock.
A decline in the fair market value of our assets may require us to recognize an other-than-temporary impairment against such assets under Generally Accepted Accounting Principles (“GAAP”) if we were to determine that we do not have the ability and intent to hold any assets in unrealized loss positions to maturity or for a period of time sufficient to allow for recovery to the amortized cost of such assets. In such event, we would recognize unrealized losses through earnings and write down the amortized cost of such assets to a new cost basis, based on the fair value of such assets on the date they are considered to be other-than-temporarily impaired. Such impairment charges reflect non-cash losses at the time of recognition; subsequent disposition or sale of such assets could further affect our future losses or gains, as they are based on the difference between the sale price received and adjusted amortized cost of such assets at the time of sale, which may adversely affect our financial condition, liquidity and results of operations.
The form, timing and/or amount of dividend distributions in future periods may vary and be affected by economic and other considerations.
The form, timing and/or amount of dividend distributions will be authorized at the discretion of our board of directors and will depend on actual cash from operations, our financial condition, capital requirements, the annual distribution requirements applicable to REITs under the Code, Maryland law and other factors as our board of directors may consider relevant.
Risks Related to Financing our Business
Our growth depends on external sources of capital that are outside of our control and may not be available to us on commercially reasonable terms or at all.
In order to qualify as a REIT, we are required under the Code, among other things, to distribute annually at least 90% of our REIT taxable income (which does not equal net income as calculated in accordance with GAAP), determined without regard to the dividends paid deduction and excluding any net capital gain. In addition, we will be subject to U.S. federal income tax at the corporate rate to the extent that we distribute less than 100% of our REIT taxable income, determined without regard to the dividends paid deduction and including any net capital gain. Because of these distribution requirements, we may not be able to fund future capital needs, including any necessary acquisition financing, from operating cash flow. Consequently, we may rely on third-party sources to fund our capital needs, and we may not be able to obtain financing on favorable terms or at all. Any additional debt we incur may increase our leverage and likelihood of default. Our access to third-party sources of capital depends, in part, on: general market conditions; the market's perception of our growth potential; our current debt levels; our current and expected future earnings; our cash flow and cash distributions; and the price per share of our common stock. If we cannot obtain capital from third-party sources, we may not be able to acquire properties when strategic opportunities exist, meet the capital and operating needs of our existing properties, satisfy our debt service obligations or make the cash distributions to our stockholders necessary to qualify as a REIT. Under certain circumstances, covenants and provisions in our existing and future debt instruments may prevent us from making distributions that we deem necessary to comply with REIT requirements. In addition, if we are unable to obtain financing in order to make distributions required to maintain our qualification as a REIT, we may make taxable in-kind distributions of our own stock, which may cause our stockholders to be required to pay income taxes with respect to such distributions in excess of any cash they receive, or we may be required to withhold taxes with respect to such distributions in excess of any cash our stockholders receive.
Our level of indebtedness could materially and adversely affect our financial position, including reducing funds available for other business purposes and reducing our operational flexibility.
As of December 31, 2023, we had a $200.0 million 2028 Term Loan, a $175.0 million 2027 Term Loan, a $150.0 million 2029 Term Loan and $80.0 million of borrowings outstanding under our $400.0 million Revolver. Our level of debt and the limitations imposed on us by our debt agreements could have significant adverse consequences, including the following: our cash flow may be insufficient to meet our required principal and interest payments; cash interest expense and financial covenants relating to our indebtedness may limit or eliminate our ability to make distributions to our common stockholders; we may be unable to borrow additional funds as needed or on favorable terms, which could, among other things, adversely affect our ability to capitalize upon investment opportunities or meet operational needs; we may be unable to refinance our indebtedness at maturity or the refinancing terms may be less favorable than the terms of our original indebtedness; counterparties may fail to honor their obligations under any hedge agreements we enter into, such agreements may not effectively hedge interest rate fluctuation risk, and, upon the expiration of any hedge agreements we enter into, we would be exposed to then-existing market rates of interest and future interest rate volatility; we may be forced to dispose of properties, possibly on unfavorable terms or in violation of certain covenants to which we may be subject; we may be restricted from accessing some of our excess cash flow after debt service if certain of our tenants fail to meet certain financial performance metric thresholds; we may violate restrictive covenants in our loan documents, which would entitle the lenders to accelerate our debt obligations; and our default under any loan with cross default provisions could result in a default on other indebtedness. In the future, we may enter into secured lending arrangements whereby lenders or mortgagees may foreclose on our properties or our interests in entities that our properties that secure their loans and receive an assignment of rents and leases if we were to default under such arrangements. The occurrence of any of these events could materially and adversely affect us. Furthermore, foreclosures could create taxable income without accompanying cash proceeds, which could hinder our ability to meet the REIT distribution requirements imposed by the Code.
Failure to hedge effectively against interest rate changes may materially and adversely affect us.
We currently hedge a portion of our interest rate volatility through interest rate swaps. These arrangements involve risks and may not be effective in reducing our exposure to interest rate changes. In addition, the counterparties to any hedging arrangements we enter into in the future may not honor their obligations. Failure to hedge effectively against changes in interest rates relating to the interest expense of our future floating-rate borrowings may materially and adversely affect us.
Our debt financing agreements contain or may contain restrictions and covenants which may limit our ability to enter into or obtain funding for certain transactions, operate our business or make distributions to our common stockholders.
Our current debt agreements and other debt agreements we may enter into in the future contain or may contain financial and other covenants with which we are or will be required to comply and that limit or will limit our ability to operate our business. These covenants, as well as any additional covenants to which we may be subject in the future because of additional borrowings, could cause us to have to forego investment opportunities, reduce or eliminate distributions to our common stockholders or obtain financing that is more expensive than financing we could obtain if we were not subject to the covenants. In addition, the agreements governing our borrowings may have cross default provisions, which provide that a default under one of our debt financing agreements would lead to a default on all of our debt financing agreements.
The covenants and other restrictions under our debt agreements may affect, among other things, our ability to: incur indebtedness; create liens on assets; cause our subsidiaries to distribute cash to us to fund distributions to stockholders or to otherwise use in our business; sell or substitute assets; modify certain terms of our leases; manage our cash flows; and make distributions to equity holders, including our common stockholders. Additionally, these restrictions may adversely affect our operating and financial flexibility and may limit our ability to respond to changes in our business or competitive environment, all of which may materially and adversely affect us.
Risks Related to Government Regulation and Tax Matters
Our failure to qualify or maintain our qualification as a REIT for U.S. federal income tax purposes would reduce the amount of funds we have available for distribution and limit our ability to make distributions to our stockholders.
We believe that our organization and current proposed method of operation has enabled us to meet the requirements for qualification and taxation as a REIT commencing with our short taxable year ended December 31, 2019, and we intend to continue to operate in such a manner. However, we cannot assure you that we will qualify and remain qualified as a REIT. Meeting some of these requirements may involve the determination of various factual matters and circumstances not entirely within our control. The REIT qualification requirements are extremely complex and interpretation of the U.S. federal income tax laws governing qualification as a REIT is limited. Furthermore, future legislative, judicial or administrative changes to the U.S. federal income tax laws could be applied retroactively, which could result in our disqualification as a REIT. If we fail to qualify as a REIT in any taxable year, we will face serious tax consequences that will substantially reduce the funds available for distributions to our stockholders because: we would not be allowed a deduction for dividends paid to stockholders in computing our taxable income and would be subject to U.S. federal income tax at the corporate rate; we could be subject to increased state and local taxes; and unless we are entitled to relief under certain U.S. federal income tax laws, we could not re-elect REIT status until the fifth calendar year after the year in which we failed to qualify as a REIT. In addition, if we fail to qualify as a REIT, we will no longer be required to make distributions. As a result of all these factors, our failure to qualify as a REIT could impair our ability to expand our business and raise capital, and it would adversely affect the value of our common stock.
If our operating partnership failed to qualify as a partnership or is not otherwise disregarded for U.S. federal income tax
purposes, we would cease to qualify as a REIT.
Our operating partnership intends to qualify as a partnership for U.S. federal income tax purposes, and intends to take that position for all income tax reporting purposes. We cannot assure you, however, that the Internal Revenue Service (“IRS”) will not challenge the status of our operating partnership or any other subsidiary partnership in which we own an interest as a partnership for U.S. federal income tax purposes, or that a court would not sustain such a challenge. If classified as a partnership, our operating partnership generally will not be a taxable entity and will not incur any U.S. federal income tax liability. However, our operating partnership would be treated as a corporation for U.S. federal income tax purposes if it was a “publicly traded partnership,” unless at least 90% of its income was qualifying income as defined in the Code. A “publicly traded partnership” is a partnership whose partnership interests are traded on an established securities market or are readily tradable on a secondary market (or the substantial equivalent thereof). Although our operating partnership’s partnership units are not traded on an established securities market, the operating partnership’s units could be viewed as readily tradable on a secondary market (or the substantial equivalent thereof), and our operating partnership may not qualify for one of the “safe harbors” under the applicable tax regulations. Qualifying income for the 90% test generally includes passive income, such as real property rents, dividends and interest. The income requirements applicable to REITs and the definition of qualifying income for purposes of this 90% test are similar in most respects. Our operating partnership may not meet this qualifying income test. If our operating partnership were to be taxed as a corporation, it would incur substantial tax liabilities, and we would then fail to qualify as a REIT for U.S. federal income tax purposes, unless we qualified for relief under certain statutory savings provisions, and our ability to raise additional capital and pay distributions to our stockholders would be impaired.
Even if we qualify as a REIT for U.S. federal income tax purposes, we may be subject to other tax liabilities that reduce our cash flow and our ability to make distributions to stockholders.
In order to qualify as a REIT, we generally are required to distribute at least 90% of our REIT taxable income, determined without regard to the dividends paid deduction and excluding any net capital gain, each year to our stockholders. To the extent that we satisfy this distribution requirement, but distribute less than 100% of our REIT taxable income, we will be subject to U.S. federal corporate income tax on our undistributed taxable income. In addition, we will be subject to a 4% nondeductible excise tax if the actual amount that we pay out to our stockholders in a calendar year is less than the minimum amount specified under the Code. Moreover, if we have net income from “prohibited transactions,” that income will be subject to a 100% tax. In general, prohibited transactions are sales or other dispositions of property that we own or hold an interest in, directly or indirectly through any subsidiary entity, including our operating partnership, but generally excluding taxable REIT subsidiaries (“TRSs”), that is deemed to be held primarily for sale to customers in the ordinary course of business. The determination as to whether a particular sale is a prohibited transaction depends on the facts and circumstances related to that sale. While we will undertake sales of assets if those assets become inconsistent with our long-term strategic or return objectives, we do not believe that those sales should be considered prohibited transactions, but there can be no assurance that the IRS would not contend otherwise. The need to avoid prohibited transactions could cause us to forego or defer sales of properties that might otherwise be in our best interest to sell. For example, if circumstances make it not profitable or otherwise uneconomical for us to remain in certain states or geographical markets, the 100% tax could delay our ability to exit those states or markets by selling our assets in those states or markets other than through a TRS, which could harm our operating profits.
Furthermore, even if we qualify for taxation as a REIT, we may be subject to certain U.S. federal, state and local income, property and excise taxes on our income or property. In addition, our TRSs will be subject to U.S. federal income tax and applicable state and local taxes on their net income. Any of these taxes would reduce our cash available for distribution to stockholders.
Dividends payable by REITs generally do not qualify for the reduced tax rates available for some dividends.
Income from “qualified dividends” payable to U.S. stockholders that are individuals, trusts and estates is generally subject to tax at reduced rates. Currently, the maximum tax rate applicable to qualified dividend income payable to U.S. stockholders that are individuals, trusts and estates is 20%. Dividends payable by REITs, however, generally are not eligible for this reduced rate. Distributions from REITs that are treated as dividends but are not designated as qualified dividends or capital gain dividends are treated as ordinary income. For taxable years beginning before January 1, 2026, distributions from REITs that are treated as dividends but are not designated as qualified dividends or capital gain dividends are taxed as ordinary income after deducting 20% of the amount of the dividend in the case of non-corporate stockholders. To qualify for this deduction, the U.S. stockholder receiving such dividends must hold the dividend-paying REIT stock for at least 46 days taking into account certain special holding period rules) of the 91-day period beginning 45 days before the stock becomes ex-dividend and cannot be under an obligation to make related payments with respect to a position in substantially similar or related property. At the current maximum ordinary income tax rate of 37% applicable for taxable years beginning before January 1, 2026, the maximum tax rate on ordinary REIT dividends for non-corporate stockholders is 29.6%. Although this does not adversely affect the taxation of REITs or dividends payable by REITs, the more favorable rates applicable to regular corporate qualified dividends could cause investors who are individuals, trusts and estates to perceive investments in REITs to be relatively less attractive than investments in the stocks of non-REIT corporations that pay dividends, which could adversely affect the value of the shares of REITs, including our common stock. In addition, certain U.S. stockholders may be subject to a 3.8% Medicare tax on dividends payable by REITs. Tax rates could be changed in future legislation.
The share ownership restrictions of the Code for REITs and the 9.8% share ownership limit in our charter may inhibit market activity in shares of our stock and restrict our business combination opportunities.
In order to qualify as a REIT, five or fewer individuals, as defined in the Code, may not own, actually or constructively, more than 50% in value of our issued and outstanding shares of stock at any time during the last half of each taxable year, other than the first year for which a REIT election is made. Attribution rules in the Code determine if any individual or entity actually or constructively owns shares of our common stock under this requirement. Additionally, at least 100 persons must beneficially own shares of our common stock during at least 335 days of a taxable year for each taxable year, other than the first year for which a REIT election is made. To help ensure that we meet these tests, among other purposes, our charter restricts certain acquisition and ownership levels of shares of our common stock.
Our charter, with certain exceptions, authorizes our directors to take such actions as are necessary or advisable to preserve our qualification as a REIT. Unless exempted by our board of directors (prospectively or retroactively), for so long as we qualify as a REIT, our charter prohibits, among other limitations on ownership and transfer of shares of our stock, any person from beneficially or constructively owning (applying certain attribution rules under the Code) more than 9.8% in value or number of shares, whichever is more restrictive, of our outstanding common stock or of any class or series of our preferred stock, or more than 9.8% of the aggregate value of all of our outstanding stock. Our board of directors may grant exemptions from these limits to stockholders but may not grant an exemption that would result in our failing to qualify as a REIT. These waivers may be subject to initial and ongoing conditions intended to protect our status as a REIT. These restrictions on transferability and ownership will not apply, however, if our board of directors determines that it is no longer in our best interest to qualify as a REIT or that compliance with such restriction is no longer required in order for us to so qualify as a REIT.
These restrictions on ownership and transfer of our stock may, among other things: discourage a tender offer or other transactions or a change in management or of control that might involve a premium price for our common stock or that our stockholders otherwise believe to be in their best interests; or result in the transfer of shares acquired in excess of the restrictions to a trust for the benefit of one or more charitable beneficiaries and, as a result, the forfeiture by the acquirer of the benefits of owning the additional shares.
The ability of our board of directors to revoke our REIT qualification without stockholder approval may cause adverse consequences to our stockholders.
Our charter provides that our board of directors may revoke or otherwise terminate our REIT election, without the approval of our stockholders, if it determines that it is no longer in our best interest to continue to qualify as a REIT. If we cease to be a REIT, we will not be allowed a deduction for dividends paid to stockholders in computing our taxable income and will be subject to U.S. federal income tax at corporate rates and state and local taxes, which may have adverse consequences on our total return to our stockholders.
If a transaction intended to qualify as a 1031 Exchange is later determined to be taxable, we may face adverse consequences, and if the laws applicable to such transactions are amended or repealed, we may not be able to dispose of properties on a tax-deferred basis.
In order to avoid potentially significant taxable gains upon the sale of properties that no longer meet our investment criteria, we intend to dispose of properties in 1031 Exchanges. The ability to complete a 1031 Exchange depends on many factors, including, among others, identifying and acquiring suitable replacement property within limited time periods, and the ownership structure of the properties being sold and acquired. Therefore, we are not always able to sell an asset as part of a 1031 Exchange. When successful, a 1031 Exchange enables us to defer the taxable gain on the asset sold. It is possible that the qualification of a transaction as a 1031 Exchange could be successfully challenged and determined to be currently taxable. In such case, our taxable income and earnings and profits would increase. This could increase the dividend income to our stockholders by reducing any return of capital they received. In some circumstances, we may be required to pay additional dividends or, in lieu of that, U.S. federal corporate income tax, possibly including interest and penalties. In addition, such recharacterization could result in such property sale, and potentially other property sales, being subject to the 100% penalty tax on net income from prohibited transactions. As a result, we may be required to borrow funds in order to pay additional dividends or taxes, and the payment of such taxes could cause us to have less cash available to distribute to our stockholders. In addition, if a 1031 Exchange were later to be determined to be taxable, we may be required to amend our tax returns for the applicable year in question, including any information reports we sent our stockholders. Moreover, it is possible that legislation could be enacted that could modify or repeal the laws with respect to 1031 Exchanges, which could make it more difficult or impossible for us to dispose of properties on a tax deferred basis.
Complying with REIT requirements may limit our ability to hedge our liabilities effectively and may cause us to incur tax liabilities.
The REIT provisions of the Code substantially limit our ability to hedge our assets and liabilities. Any income from a hedging transaction we enter into to manage the risk of interest rate changes, price changes or currency fluctuations with respect to borrowings made or to be made to acquire or carry real estate assets, or from certain terminations of such hedging positions, if properly identified under applicable Treasury Regulations, does not constitute “gross income” for purposes of both income tests that apply to REITs. To the extent that we enter into other types of hedging transactions, the income from those transactions will likely be treated as non-qualifying income for purposes of both of the gross income tests. As a result of these rules, we may need to limit our use of advantageous hedging techniques or implement those hedges through a TRS. This could increase the cost of our hedging activities because our TRSs would be subject to tax on gains or expose us to greater risks associated with changes in interest rates than we would otherwise want to bear. In addition, losses in any TRS in which we own an interest will generally not provide any tax benefit, except that such losses could theoretically be carried forward against future taxable income in such TRS.
The U.S. federal income tax treatment of the cash that we might receive from cash settlement of the forward sale agreement is unclear and could jeopardize our ability to meet the REIT qualification requirements.
In the event that we elect to settle a forward sale agreement for cash and the settlement price is below the applicable forward sale price, we would be entitled to receive a cash payment from the applicable forward purchaser. Under Section 1032 of the Code, generally, no gain or loss is recognized by a corporation when it deals in its own shares, including pursuant to a “securities futures contract,” as defined in the Code by reference to the Exchange Act. Although we believe that any amount received by us in exchange for our stock would qualify for the exemption under Section 1032 of the Code, because it is not entirely clear whether each forward sale agreement qualifies as a “securities futures contract,” the U.S. federal income tax treatment of any cash settlement payment we receive is uncertain. In the event that we recognize a significant gain from the cash settlement of a forward sale agreement, we might not be able to satisfy the gross income requirements applicable to REITs under the Code. In that case, we may be able to rely upon the relief provisions under the Code in order to avoid the loss of our REIT status. Even if the relief provisions apply, we will be subject to a 100% tax on the greater of (i) the excess of 75% of our gross income (excluding gross income from prohibited transactions) over the amount of such income attributable to sources that qualify under the 75% test or (ii) the excess of 95% of our gross income (excluding gross income from prohibited transactions) over the amount of such gross income attributable to sources that qualify under the 95% test, multiplied in either case by a fraction intended to reflect our profitability. In the event that these relief provisions were not available, we could lose our REIT status under the Code.
Complying with REIT requirements may cause us to forego otherwise attractive opportunities or liquidate otherwise attractive investments.
To qualify as a REIT, we must continually satisfy tests concerning, among other things, the nature and diversification of our assets, the sources of our income and the amounts we distribute to our stockholders. In particular, we must ensure that at the end of each calendar quarter, at least 75% of the value of our assets consists of cash, cash items, government securities and qualified REIT real estate assets, including certain mortgage loans and mortgage-backed securities. The remainder of our investment in securities (other than government securities, securities of TRSs and qualified real estate assets) generally cannot include more than 10% of the outstanding voting securities of any one issuer or more than 10% of the total value of the outstanding securities of any one issuer. In addition, in general, no more than 5% of the value of our assets (other than government securities, securities of TRSs and qualified real estate assets) can consist of the securities of any one issuer, and no more than 20% of the value of our total assets can be represented by securities of one or more TRSs. If we fail to comply with these requirements at the end of any calendar quarter, we must correct the failure within 30 days after the end of the calendar quarter or qualify for certain statutory relief provisions to avoid losing our REIT qualification and suffering adverse tax consequences. We may be required to liquidate or forgo otherwise attractive investments in order to satisfy the asset and income tests or to qualify under the statutory relief provisions. We also may be required to make distributions to stockholders at disadvantageous times or when we do not have funds readily available for distribution. As a result, having to comply with the distribution requirement could cause us to: (i) sell assets in adverse market conditions; (ii) borrow on unfavorable terms; or (iii) distribute amounts that would otherwise be invested in future acquisitions, capital expenditures or repayment of debt. Accordingly, satisfying the REIT requirements could materially and adversely affect us. Moreover, if we are compelled to liquidate our investments to meet any of these asset, income or distribution tests, or to repay obligations to our lenders, we may be unable to comply with one or more of the requirements applicable to REITs or may be subject to a 100% tax on any resulting gain if such sales constitute prohibited transactions.
Our ownership of and relationship with our TRSs will be limited, and a failure to comply with the limits would jeopardize our REIT status and may result in the application of a 100% excise tax.
A REIT may own up to 100% of the stock of one or more TRSs. A TRS is a corporation other than a REIT in which a REIT directly or indirectly holds stock, and that has made a joint election with such REIT to be treated as a TRS. A TRS also includes any corporation other than a REIT with respect to which a TRS owns securities possessing more than 35% of the total voting power or value of the outstanding securities of such corporation. Other than some activities relating to lodging and health care facilities, a TRS may generally engage in any business, including the provision of customary or non-customary services to tenants of its parent REIT. A TRS is subject to income tax as a regular C corporation.
A TRS may hold assets and earn income that would not be qualifying assets or income if held or earned directly by a REIT. Overall, no more than 20% of the value of a REIT's assets may consist of securities of one or more TRSs. If the IRS were to determine that the value of our interests in all of our TRSs exceeded this limit at the end of any calendar quarter, then we may fail to qualify as a REIT if relief provisions do not apply. If we determine it to be in our best interest to own a substantial number of our properties through one or more TRSs, then it is possible that the IRS may conclude that the value of our interests in our TRSs exceeds 20% of the value of our total assets at the end of any calendar quarter and therefore cause us to fail to qualify as a REIT. Additionally, as a REIT, no more than 25% of our gross income with respect to any year may, in general, be from sources other than certain real estate-related assets. Dividends paid to us from a TRS are typically considered to be non-real estate income. Therefore, we may fail to qualify as a REIT if dividends from all of our TRSs, when aggregated with all other non-real estate income with respect to any one year, are more than 25% of our gross income with respect to such year.
A TRS will typically pay federal, state and local income tax at corporate rates on any income that it earns. This tax obligation, if material, would diminish the amount of the proceeds from the sale or operation of such property, or other income earned through the TRS that would be distributable to our stockholders. U.S. federal, state and local corporate income tax rates may be increased in the future, and any such increase would reduce the amount of the net proceeds available for distribution by us to our stockholders from the sale of property or other income earned through a TRS after the effective date of any increase in such tax rates. We do not anticipate material income tax obligations in connection with our ownership of interests in TRSs.
In addition, the Code imposes a 100% excise tax on certain transactions between a TRS and its parent REIT that are treated as not being conducted on an arm's-length basis. Our TRSs will pay U.S. federal, state and local income tax on their taxable income, and their after-tax net income will be available for distribution to us but is not required to be distributed to us. There can be no assurance that we will be able to comply with the 20% limitation discussed above or to avoid application of the 100% excise tax discussed above.
New legislation or administrative or judicial action, in each instance potentially with retroactive effect, could make it more difficult or impossible for us to qualify or remain qualified as a REIT.
The U.S. federal income tax treatment of REITs may be modified, possibly with retroactive effect, by legislative, judicial or administrative action at any time, which could affect the U.S. federal income tax treatment of an investment in us. The U.S. federal income tax rules dealing with REITs are constantly under review by persons involved in the legislative process, the IRS and the U.S. Department of the Treasury, which could result in statutory changes as well as frequent revisions to regulations and interpretations.
There can be no assurance that future changes to the U.S. federal income tax laws or regulatory changes will not be proposed or enacted that could impact our business and financial results. If enacted, certain of such changes could have an adverse impact on our business and financial results.
We cannot predict whether, when or to what extent any new U.S. federal tax laws, regulations, interpretations or rulings will impact the real estate investment industry or REITs. Prospective investors are urged to consult their tax advisors regarding potential future changes to the U.S. federal tax laws on an investment in our stock.
Foreign investors may be subject to U.S. federal withholding tax and may be subject to U.S. federal income tax on distributions received from us and upon disposition of shares of our common stock.
Subject to certain exceptions, distributions received from us will be treated as dividends of ordinary income to the extent of our current or accumulated earnings and profits. Such dividends paid to a non-U.S. stockholder ordinarily will be subject to U.S. withholding tax at a 30% rate, or such lower rate as may be specified by an applicable income tax treaty, unless the distributions are treated as “effectively connected” with the conduct by the non-U.S. stockholder of a U.S. trade or business. Pursuant to the Foreign Investment in Real Property Tax Act of 1980 (“FIRPTA”), capital gain distributions attributable to sales or exchanges of “U.S. real property interests” (“USRPIs”), generally will be taxed to a non-U.S. stockholder as if such gain were effectively connected with a U.S. trade or business. However, a capital gain dividend will not be treated as effectively connected income if (i) the distribution is received with respect to a class of stock that is regularly traded on an established securities market located in the United States and (ii) the non-U.S. stockholder does not own more than 10% of the class of our stock at any time during the one-year period ending on the date the distribution is received.
Gain recognized by a non-U.S. stockholder upon the sale or exchange of our common stock generally will not be subject to U.S. federal income taxation unless such stock constitutes a USRPI under FIRPTA. Our common stock will not constitute a USRPI so long as we are a “domestically-controlled” REIT. A REIT is “domestically controlled” if less than 50% of the REIT’s stock, by value, has been owned directly or indirectly by persons who are not qualifying U.S. persons during a continuous five-year period ending on the date of disposition or, if shorter, during the entire period of the REIT’s existence. We cannot assure you that we will qualify as a “domestically controlled” REIT. If we were to fail to so qualify, gain realized by foreign investors on a sale of shares of our stock would be subject to FIRPTA tax, unless the shares of our stock were traded on an established securities market and the foreign investor did not at any time during a specified testing period directly or indirectly own more than 10% of the value of our outstanding common stock.
We and our subsidiaries and stockholders may be subject to state, local or foreign tax filing and payment obligations taxation in various jurisdictions including those in which we or they transact business, own property or reside.
We may own assets located in, or transact business in, numerous jurisdictions, and may be required to file tax returns in some or all of those jurisdictions. Our state, local or foreign tax treatment and that of our stockholders may not conform to the U.S. federal income tax treatment discussed above. Prospective investors should consult their tax advisors regarding the application and effect of state and local income and other tax laws on an investment in our stock.
Liabilities arising under environmental laws may materially and adversely affect us.
The properties we own or have owned in the past may subject us to known and unknown environmental liabilities. We typically obtain Phase I environmental site assessments on all properties we finance or acquire. However, the Phase I environmental site assessments are limited in scope and therefore may not reveal all environmental conditions affecting a property. Under various federal, state and local laws and regulations relating to the environment, as a current or former owner or operator of real property, we may be liable for costs and damages resulting from environmental matters, including the presence or discharge of hazardous or toxic substances, waste or petroleum products at, on, in, under or migrating from such property, including costs to investigate or clean up such contamination and liability for personal injury, property damage or harm to natural resources. If environmental contamination exists on our properties, we could be subject to strict, joint and/or several liability for the contamination by virtue of our ownership interest; we may face liability regardless of our knowledge of the contamination, the timing of the contamination, the cause of the contamination, or the party responsible for the contamination of the property.
If our environmental liability insurance is inadequate, we may become subject to material losses for environmental liabilities. Although our leases generally require our tenants to operate in compliance with all applicable laws and to indemnify us against any environmental liabilities arising from a tenant's activities on the property, we could be subject to strict liability by virtue of our ownership interest. We cannot be sure that our tenants will, or will be able to, satisfy their indemnification obligations, if any, under our leases. Furthermore, the discovery of environmental liabilities on any of our properties could lead to significant remediation costs or to other liabilities or obligations attributable to the tenant of that property or could result in material interference with the ability of our tenants to operate their businesses as currently operated. Noncompliance with environmental laws or discovery of environmental liabilities could each individually or collectively affect such tenant's ability to make payments to us, including rental payments and, where applicable, indemnification payments. Additionally, the known or potential presence of hazardous substances on a property may adversely affect our ability to sell, lease or improve the property or to borrow using the property as collateral. Environmental laws may also create liens on contaminated properties in favor of the government for damages and costs it incurs to address such contamination. Moreover, if contamination is discovered on our properties, environmental laws may impose restrictions on the manner in which they may be used or businesses may be operated, and these restrictions may require substantial expenditures.
We are subject to various environmental laws that regulate the presence of asbestos containing materials (ACM), vapor intrusion, lead-based paint and other hazardous materials. Such laws may impose fines, penalties, or other obligations for failure to comply with these requirements or expose us to third-party liability.
Our properties may contain or develop harmful mold, which could lead to liability for adverse health effects and costs of remediation.
When excessive moisture accumulates in buildings or on building materials, or moisture otherwise occurs within a building or building materials, mold growth may occur, particularly if the moisture problem remains undiscovered or is not addressed over a period of time. Some molds may be toxic and produce airborne toxins or irritants. Concern about indoor exposure to mold has been increasing, as exposure to mold may cause a variety of adverse health effects and symptoms, including allergic or other reactions. As a result, should our tenants or their employees or customers be exposed to mold at any of our properties we could be required to undertake a costly remediation program to contain or remove the mold from the affected property. In addition, exposure to mold by our tenants or others could subject us to liability if property damage or health concerns arise. If we were to become subject to significant mold-related liabilities, we could be materially and adversely affected.
Compliance with the Americans with Disabilities Act and fire, safety and other regulations may require us to make unanticipated expenditures that materially and adversely affect us.
Our properties are subject to the Americans with Disabilities Act, or ADA, fire and safety regulations, building codes and other regulations. Failure to comply with these laws and regulations could result in imposition of fines by the government or an award of damages to private litigants, or both. While our tenants are obligated by law to comply with the ADA and typically obligated under our leases to cover costs associated with compliance with the ADA and other property regulations, if required changes involve greater expenditures than anticipated or if the changes must be made on a more accelerated basis than anticipated, the ability of our tenants to cover costs could be adversely affected, and we could be required to expend our own funds to comply with applicable law and regulation.
Risks Related to Our Organizational Structure and Ownership of Our Common Stock
Our bylaws designate the Circuit Court for Baltimore City, Maryland as the sole and exclusive forum for certain types of actions and proceedings that may be initiated by our stockholders and provide that claims relating to causes of action under the Securities Act may only be brought in federal district courts, which could limit stockholders' ability to obtain a favorable judicial forum for disputes with us or our directors, officers or employees and could discourage lawsuits against us and our directors, officers and employees.
Our bylaws provide that, unless we consent in writing to the selection of an alternative forum, the Circuit Court for Baltimore City, Maryland, or, if that court does not have jurisdiction, the United States District Court for the District of Maryland, Northern Division, will be the sole and exclusive forum for (a) any Internal Corporate Claim, as such term is defined in the Maryland General Corporation Law (“MGCL”), (b) any derivative action or proceeding brought on our behalf (other than actions arising under federal securities laws), (c) any action asserting a claim of breach of any duty owed by any of our directors, officers or other employees to us or to our stockholders, (d) any action asserting a claim against us or any of our directors, officers or other employees arising pursuant to any provision of the MGCL or our charter or bylaws or (e) any other action asserting a claim against us or any of our directors, officers or other employees that is governed by the internal affairs doctrine. These choice of forum provisions will not apply to suits brought to enforce a duty or liability created by the Securities Act, the Exchange Act, or any other claim for which federal courts have exclusive jurisdiction. Furthermore, our bylaws provide that, unless we consent in writing to the selection of an alternative forum, the federal district courts of the United States of America shall, to the fullest extent permitted by law, be the sole and exclusive forum for the resolution of any claim arising under the Securities Act.
These exclusive forum provisions may limit the ability of our stockholders to bring a claim in a judicial forum that such stockholders find favorable for disputes with us or our directors, officers, or employees, which may discourage such lawsuits against us and our directors, officers, and employees. Alternatively, if a court were to find the choice of forum provisions contained in our bylaws to be inapplicable or unenforceable in an action, we may incur additional costs associated with resolving such action in other jurisdictions, which could materially adversely affect our business, financial condition, and operating results. For example, under the Securities Act, federal courts have concurrent jurisdiction over all suits brought to enforce any duty or liability created by the Securities Act, and investors cannot waive compliance with the federal securities laws and the rules and regulations thereunder. In addition, the exclusive forum provisions described above do not apply to any actions brought under the Exchange Act.
Our rights and the rights of our stockholders to take action against our directors and officers are limited.
As permitted by Maryland law, our charter eliminates the liability of our directors and officers to us and our stockholders for money damages to the maximum extent permitted by Maryland law. Therefore, our directors and officers will be subject to monetary liability resulting only from: actual receipt of an improper benefit or profit in money, property or services; or active and deliberate dishonesty by the director or officer that is established by a final judgment and is being material to the cause of action adjudicated.
As a result, we and our stockholders have rights against our directors and officers that are more limited than might otherwise exist. Accordingly, in the event that actions taken by any of our directors or officers impede the performance of our company, stockholders’ and our ability to recover damages from such director or officer will be limited. In addition, our charter requires us to indemnify and advance expenses to our directors and officers for actions taken by them in those and certain other capacities to the maximum extent permitted by Maryland law.
We are a holding company with no direct operations and we rely on funds received from our operating partnership to pay liabilities.
We are a holding company and we conduct substantially all of our operations through our operating partnership. We do not have, apart from an interest in our operating partnership, any independent operations. As a result, we rely on distributions from our operating partnership to pay any dividends and other distributions we might declare on shares of our common stock. We also rely on distributions from our operating partnership to meet any of our obligations, including any tax liability on taxable income allocated to us from our operating partnership. In addition, because we are a holding company, your claims as stockholders will be structurally subordinated to all existing and future liabilities and obligations (whether or not for borrowed money) of our operating partnership and its subsidiaries. Therefore, in the event of our bankruptcy, liquidation or reorganization, our assets and those of our operating partnership and its subsidiaries will be able to satisfy the claims of our stockholders only after all of our and our operating partnership's and its subsidiaries' liabilities and obligations have been paid in full.
In connection with the acquisition of properties or otherwise, we may issue units of our operating partnership to third parties. Such issuances would reduce our ownership in our operating partnership. Because you will not directly own units of our operating partnership, you will not have any voting rights with respect to any such issuances or other partnership level activities of our operating partnership.
Conflicts of interest could arise in the future between the interests of our stockholders and the interests of holders of OP units, which may impede business decisions that could benefit our stockholders.
Conflicts of interest could arise in the future as a result of the relationships between us and our affiliates, on the one hand, and our operating partnership or any future partner thereof, on the other. Our directors and officers have duties to our company under applicable Maryland law in connection with the management of our company. At the same time, one of our wholly-owned subsidiaries, NETSTREIT GP, LLC, as the general partner of our operating partnership, has fiduciary duties and obligations to our operating partnership and its limited partners under Delaware law and the partnership agreement of our operating partnership in connection with the management of our operating partnership. The fiduciary duties and obligations of NETSTREIT GP, LLC, as the general partner of our operating partnership, and its limited partners may come into conflict with the duties of our directors and officers to our company.
Under the terms of the partnership agreement of our operating partnership, if there is a conflict between the interests of our stockholders on one hand and any limited partners on the other, we will endeavor in good faith to resolve the conflict in a manner not adverse to either our stockholders or any limited partners; provided, however, that any conflict that cannot be resolved in a manner not adverse to either our stockholders or any limited partners must be resolved in favor of our stockholders.
The partnership agreement of our operating partnership also provides that the general partner will not be liable to our operating partnership, its partners or any other person bound by the partnership agreement for monetary damages for losses sustained, liabilities incurred or benefits not derived by our operating partnership or any limited partner, except for liability for the general partner's intentional harm or gross negligence. Moreover, the partnership agreement of our operating partnership provides that our operating partnership is required to indemnify the general partner and its members, managers, managing members, officers, employees, agents and designees from and against any and all claims that relate to the operations of our operating partnership, except (i) if the act or omission of the person was material to the matter giving rise to the action and either was committed in bad faith or was the result of active or deliberate dishonesty, (ii) for any transaction for which the indemnified party received an improper personal benefit, in money, property or services or otherwise in violation or breach of any provision of the partnership agreement or (iii) in the case of a criminal proceeding, if the indemnified person had reasonable cause to believe that the act or omission was unlawful.
If we fail to maintain an effective system of internal controls, we may not be able to accurately determine our financial results or prevent fraud. As a result, our investors could lose confidence in our reported financial information, which could harm our business and the value of our shares.
Effective internal controls are necessary for us to provide reliable financial reports and effectively prevent fraud. We may in the future discover areas of our internal controls that need improvement. Section 404 of the Sarbanes-Oxley Act of 2002 requires us to evaluate and report on our internal controls over financial reporting and have our independent auditors annually issue their opinion on our internal control over financial reporting. As we grow our business, our internal controls will become more complex, and we will require additional resources to ensure our internal controls remain effective. If we or our independent auditors discover a material weakness, the disclosure of that fact, even if quickly remedied, could reduce the market value of our common stock. The existence of any material weakness or significant deficiency could require management to devote significant time and incur significant expense to remediate any such material weaknesses or significant deficiencies and management may not be able to remediate any such material weaknesses or significant deficiencies in a timely manner. Any such failure could cause investors to lose confidence in our reported financial information and adversely affect the market value of our common shares or limit our access to the capital markets and other sources of liquidity.
Item 1B. Unresolved Staff Comments
There are no unresolved staff comments.
Item 1C. Cybersecurity
Risk management and strategy
Cyber Security Plan
We have implemented various information security processes designed to identify, assess and manage material risks from cybersecurity threats to our critical computer networks, third party hosted services, communications systems, hardware and software, and our critical data, including intellectual property and confidential information that is proprietary, strategic or competitive in nature (including without limitation tenant and property related data) (“Information Systems and Data”).
Our information security processes are overseen by our IT Manager and our Chief Accounting Officer, and supported by a cybersecurity monitoring service provider, who work to help identify, assess and manage the Company’s cybersecurity threats and risks. Our IT Manager, as well as our service provider, work to identify and assess risks from cybersecurity threats by monitoring and evaluating our threat environment using various methods, including, for example subscribing to reports and services that identify certain cybersecurity threats, evaluating certain threats reported to us, engaging a third-party vendor to audit our security protocols in certain systems, and deploying automated monitoring tools across certain systems. Depending on the environment and system, we implement and maintain various technical, physical, and organizational measures, processes, standards and policies designed to manage and mitigate material risks from cybersecurity threats to our Information Systems and Data, including, for example: an incident response policy, risk assessments, network security controls for certain environments, periodic back-ups of certain data, access controls for certain environments, employee training addressing awareness of cyber risks and how to detect certain cyberattacks, and cybersecurity insurance.
Risk Assessment
Our assessment and management of material risks from cybersecurity threats are integrated into the Company’s overall risk management processes. For example, cybersecurity risk is integrated into the Company’s overall risk management processes, which includes an assessment of risks posed to data that is critical to our business operations (e.g., to support financial reporting, process payroll, and collect and maintain property and lease information).
Third Party Risk Management
The Company uses third-party service providers to assist us from time to time to identify, assess, and manage material risks from cybersecurity threats, including for example a managed service security provider that monitors certain of the Company’s computer networks and third-party hosted services.
We use third-party service providers to perform a variety of functions throughout our business, including application providers and hosting companies. The Company has implemented certain measures designed to help identify and mitigate cybersecurity threats associated with the use of third-party service providers, such as assessing the security protocols of certain service providers and obtaining security reports from certain vendors. Depending on the nature of the services provided, the sensitivity of the Information Systems and Data at issue, and the identity of the provider, our vendor management process may involve different levels of assessment designed to help identify cybersecurity risks associated with a provider and impose contractual obligations related to cybersecurity on the provider.
For a description of the risks from cybersecurity threats that may materially affect the Company and how they may do so, see our risk factors under Part 1. Item 1A. Risk Factors in this Annual Report on Form 10-K. Any material failure, weakness, interruption or breach in security of our information systems or data, or those of our third party vendors, could prevent us from effectively operating our business.
Governance
Our board of directors addresses the Company’s cybersecurity risk management as part of its general oversight function. The board of directors’ audit committee is responsible for overseeing the Company’s cybersecurity risk management processes, including oversight and mitigation of risks from cybersecurity threats.
Our cybersecurity risk assessment and management processes are implemented and maintained by certain Company management, including our IT Manager, who has worked in various roles responsible for securing networks, hardware and other application systems, Chief Financial Officer, and Chief Accounting Officer.
Our Chief Financial Officer is responsible for hiring appropriate personnel, helping to integrate cybersecurity risk considerations into the Company’s overall risk management strategy, and communicating key priorities to relevant personnel. Our Chief Financial Officer is responsible for approving budgets, helping prepare for cybersecurity incidents, approving cybersecurity processes, and reviewing security assessments and other security-related reports.
Our cybersecurity incident response policy is designed to escalate certain cybersecurity incidents to members of management depending on the circumstances, including senior management. The Company has identified and designated certain Company employees as members of a cybersecurity incident response team, including the Chief Accounting Officer and the IT Manager. This team helps the Company mitigate and remediate cybersecurity incidents of which they are notified. In addition, the Company’s incident response policy includes reporting to the audit committee of the board of directors for certain cybersecurity incidents.
The audit committee of the board of directors receives quarterly reports concerning the Company’s significant cybersecurity threats and risk and the processes the Company has implemented to address them. These quarterly reports include summaries or presentations related to cybersecurity threats, risk, and mitigation.
Item 2. Properties
During the year ended December 31, 2023, we acquired 103 single-tenant retail net lease properties with an aggregate purchase price of $345.1 million. As of December 31, 2023, our diversified portfolio consisted of 598 single-tenant retail net leased properties spanning 45 states, with 85 different tenants represented across 26 retail sectors. As of December 31, 2023, our portfolio consisted of 10.6 million square feet and was 100% occupied.
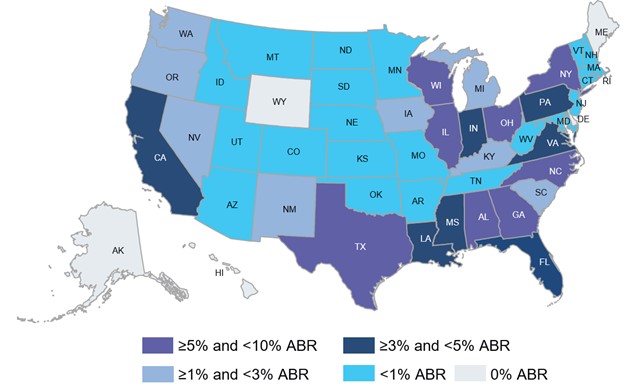
As of December 31, 2023, our portfolio generated ABR of $131.9 million. As of December 31, 2023, our portfolio consisted of approximately 71% and 14% of investment grade tenants and investment grade profile tenants, respectively, by ABR, and had a WALT of 9.5 years (exclusive of mortgage loans receivable). As of December 31, 2023, none of our tenants represented more than 10.9% of our portfolio by ABR, and our top 10 largest tenants represented in aggregate 53.7% of our ABR. Eight of our top 10 tenants are publicly traded companies, or are subsidiaries of publicly traded companies, that have investment grade credit ratings, in addition to Hobby Lobby and Festival Foods, investment grade profile tenants.
Tenant Diversification
As of December 31, 2023, our 598 properties were operated by 85 different tenants, each representing a distinct brand or concept, with no one tenant representing more than 10.9% of our portfolio by ABR. The following table details information about our tenants as of December 31, 2023 (dollars in thousands):
|
|
|
|
|
|
|
|
|
|
|
|
|
|
|
|
|
|
|
|
|
|
|
|
|
|
|
|
|
|
|
|
|
Tenant(1) |
|
Number of Properties |
|
Square Feet |
|
ABR |
|
% of ABR |
|
ABR per Square Foot |
| Dollar General Corporation |
|
134 |
|
|
1,386,713 |
|
|
$ |
14,350 |
|
|
10.9 |
% |
|
$ |
10.35 |
|
| CVS Health Corporation |
|
33 |
|
|
403,949 |
|
|
10,246 |
|
|
7.8 |
% |
|
25.36 |
|
| Walgreen Co. |
|
28 |
|
|
413,227 |
|
|
9,047 |
|
|
6.9 |
% |
|
21.89 |
|
| Dollar Tree Stores, Inc. / Family Dollar Stores, Inc. |
|
59 |
|
|
633,308 |
|
|
6,540 |
|
|
5.0 |
% |
|
10.33 |
|
| Home Depot U.S.A, Inc. |
|
4 |
|
|
483,134 |
|
|
6,197 |
|
|
4.7 |
% |
|
12.83 |
|
| Koninklijke Ahold Delhaize N.V. (Food Lion / Stop & Shop) |
|
7 |
|
|
362,103 |
|
|
5,808 |
|
|
4.4 |
% |
|
16.04 |
|
| Hobby Lobby Stores, Inc. |
|
15 |
|
|
825,816 |
|
|
5,531 |
|
|
4.2 |
% |
|
6.70 |
|
| 7-Eleven, Inc. |
|
20 |
|
|
69,968 |
|
|
4,611 |
|
|
3.5 |
% |
|
65.90 |
|
| Speedway, LLC |
|
49 |
|
|
106,627 |
|
|
4,288 |
|
|
3.3 |
% |
|
40.21 |
|
| MDSFEST, Inc. (Festival Foods) |
|
3 |
|
|
268,787 |
|
|
3,955 |
|
|
3.0 |
% |
|
14.71 |
|
| Advance Stores Company, Inc. (Advance Auto Parts) |
|
40 |
|
|
286,706 |
|
|
3,900 |
|
|
3.0 |
% |
|
13.60 |
|
| Wal-Mart Stores, Inc. |
|
6 |
|
|
813,688 |
|
|
3,770 |
|
|
2.9 |
% |
|
4.63 |
|
| Lowe's Companies, Inc. |
|
4 |
|
|
501,771 |
|
|
3,578 |
|
|
2.7 |
% |
|
7.13 |
|
| The Kroger Co. |
|
7 |
|
|
396,089 |
|
|
3,407 |
|
|
2.6 |
% |
|
8.60 |
|
| Best Buy Stores, L.P. |
|
6 |
|
|
285,495 |
|
|
3,188 |
|
|
2.4 |
% |
|
11.17 |
|
| Floor & Décor Outlets of America, Inc. |
|
2 |
|
|
164,770 |
|
|
2,615 |
|
|
2.0 |
% |
|
15.87 |
|
| Ollie's Bargain Outlet, Inc. |
|
10 |
|
|
373,976 |
|
|
2,435 |
|
|
1.8 |
% |
|
6.51 |
|
| Winn-Dixie Stores, Inc. |
|
4 |
|
|
213,830 |
|
|
2,356 |
|
|
1.8 |
% |
|
11.02 |
|
| Dick's Sporting Goods, Inc. |
|
2 |
|
|
133,247 |
|
|
2,186 |
|
|
1.7 |
% |
|
16.41 |
|
| Big Lots Stores, Inc. / PNS Stores, Inc. (Big Lots) |
|
8 |
|
|
302,587 |
|
|
2,011 |
|
|
1.5 |
% |
|
6.65 |
|
| Top 20 Subtotal |
|
441 |
|
|
8,425,791 |
|
|
100,019 |
|
|
75.9 |
% |
|
11.87 |
|
| Other |
|
157 |
|
|
2,198,392 |
|
|
31,842 |
|
|
24.1 |
% |
|
14.48 |
|
| Total / Weighted Average |
|
598 |
|
|
10,624,183 |
|
|
$ |
131,861 |
|
|
100.0 |
% |
|
$ |
12.41 |
|
(1) Represents tenant or guarantor.
Tenant Industry Diversification
The majority of our portfolio is comprised of properties leased to tenants operating in defensive retail industries, with 87.7% of our ABR as of December 31, 2023 coming from necessity, service-oriented, and/or discount industries. Necessity-based industries are those that are considered essential by consumers and include sectors such as home improvement, auto parts, drug stores, general retail, and grocers. Service-oriented industries consist of retailers that provide services rather than goods, including, for example, convenience stores, quick service and casual dining restaurants, and tire and auto services. Discount retailers offer a low price point and consist of off-price and dollar stores.
The breakdown of our necessity-based retail, service-oriented, discount-focused, and other, non-defensive retail industries by sector and by percentage of ABR as of December 31, 2023 is set forth below (dollars in thousands):
|
|
|
|
|
|
|
|
|
|
|
|
|
|
|
|
|
|
|
|
|
|
|
|
|
|
|
|
|
|
|
|
|
|
|
|
|
ABR(1) |
|
Gross Leasable Area |
| Tenant Industry and Sector |
|
Number of Leases |
|
Dollars |
|
% of Total |
|
Square Feet |
|
% of Total |
| Necessity-Based Retail |
|
|
|
|
|
|
|
|
|
|
| Grocery |
|
31 |
|
|
$ |
20,261 |
|
|
15.4 |
% |
|
1,589,648 |
|
|
15.0 |
% |
Drug Stores & Pharmacies (2) |
|
61 |
|
|
19,294 |
|
|
14.6 |
% |
|
817,176 |
|
|
7.7 |
% |
| Home Improvement |
|
29 |
|
|
15,269 |
|
|
11.6 |
% |
|
1,424,030 |
|
|
13.4 |
% |
| Auto Parts |
|
61 |
|
|
5,526 |
|
|
4.2 |
% |
|
481,156 |
|
|
4.5 |
% |
| General Retail |
|
6 |
|
|
3,753 |
|
|
2.8 |
% |
|
829,233 |
|
|
7.8 |
% |
| Healthcare |
|
12 |
|
|
2,366 |
|
|
1.8 |
% |
|
87,126 |
|
|
0.8 |
% |
| Farm Supplies |
|
7 |
|
|
1,615 |
|
|
1.2 |
% |
|
172,446 |
|
|
1.6 |
% |
| Banking |
|
3 |
|
|
467 |
|
|
0.4 |
% |
|
9,668 |
|
|
0.1 |
% |
| Wholesale Warehouse Club |
|
1 |
|
|
417 |
|
|
0.3 |
% |
|
110,858 |
|
|
1.0 |
% |
| Total Necessity-Based Retail |
|
211 |
|
|
68,968 |
|
|
52.3 |
% |
|
5,521,341 |
|
|
52.0 |
% |
| Service-Oriented Industry |
|
|
|
|
|
|
|
|
|
|
| Convenience Stores |
|
73 |
|
|
9,641 |
|
|
7.3 |
% |
|
201,697 |
|
|
1.9 |
% |
| Quick Service Restaurants |
|
22 |
|
|
3,170 |
|
|
2.4 |
% |
|
64,215 |
|
|
0.6 |
% |
| Automotive Service |
|
18 |
|
|
2,038 |
|
|
1.5 |
% |
|
117,803 |
|
|
1.1 |
% |
| Casual Dining |
|
7 |
|
|
1,066 |
|
|
0.8 |
% |
|
39,490 |
|
|
0.4 |
% |
| Health and Fitness |
|
1 |
|
|
985 |
|
|
0.7 |
% |
|
33,616 |
|
|
0.3 |
% |
| Equipment Rental and Leasing |
|
5 |
|
|
687 |
|
|
0.5 |
% |
|
49,275 |
|
|
0.5 |
% |
| Total Service-Oriented Industry |
|
126 |
|
|
17,587 |
|
|
13.3 |
% |
|
506,096 |
|
|
4.8 |
% |
| Discount-Focused Industry |
|
|
|
|
|
|
|
|
|
|
| Dollar Stores |
|
193 |
|
|
20,890 |
|
|
15.8 |
% |
|
2,020,021 |
|
|
19.0 |
% |
| Discount Retail |
|
32 |
|
|
8,134 |
|
|
6.2 |
% |
|
1,113,096 |
|
|
10.5 |
% |
| Total Discount-Focused Industry |
|
225 |
|
|
29,024 |
|
|
22.0 |
% |
|
3,133,116 |
|
|
29.5 |
% |
| Defensive Retail Industries |
|
562 |
|
|
115,579 |
|
|
87.7 |
% |
|
9,160,553 |
|
|
86.2 |
% |
| Other, Non-Defensive Industries |
|
|
|
|
|
|
|
|
|
|
| Arts & Crafts |
|
14 |
|
|
5,475 |
|
|
4.2 |
% |
|
767,816 |
|
|
7.2 |
% |
| Sporting Goods |
|
4 |
|
|
3,841 |
|
|
2.9 |
% |
|
251,669 |
|
|
2.4 |
% |
| Consumer Electronics |
|
6 |
|
|
3,188 |
|
|
2.4 |
% |
|
285,495 |
|
|
2.7 |
% |
| Specialty |
|
2 |
|
|
1,719 |
|
|
1.3 |
% |
|
46,593 |
|
|
0.4 |
% |
| Furniture Stores |
|
2 |
|
|
932 |
|
|
0.7 |
% |
|
47,101 |
|
|
0.4 |
% |
| Apparel |
|
4 |
|
|
481 |
|
|
0.4 |
% |
|
39,126 |
|
|
0.4 |
% |
| Telecommunications |
|
2 |
|
|
314 |
|
|
0.2 |
% |
|
13,635 |
|
|
0.1 |
% |
| Gift, Novelty, and Souvenir Shops |
|
1 |
|
|
200 |
|
|
0.2 |
% |
|
8,081 |
|
|
0.1 |
% |
| Home Furnishings |
|
1 |
|
|
132 |
|
|
0.1 |
% |
|
4,114 |
|
|
— |
% |
| Total Other, Non-Defensive |
|
36 |
|
|
16,282 |
|
|
12.3 |
% |
|
1,463,629 |
|
|
13.8 |
% |
| Total, All Industries |
|
598 |
|
|
$ |
131,861 |
|
|
100.0 |
% |
|
10,624,183 |
|
|
100.0 |
% |
(1) Certain figures in this table may not foot due to rounding.
(2) The Drug Stores & Pharmacies industry has one property that resides in NETSTREIT Management TRS, LLC (“NETSTREIT TRS”), representing approximately 0.3% of ABR.
Geographic Diversification
The following table presents ABR by state for our portfolio as of December 31, 2023 (dollars in thousands):
|
|
|
|
|
|
|
|
|
|
|
|
|
|
|
|
|
|
|
|
|
|
|
|
|
|
|
|
|
|
|
|
|
|
|
|
|
ABR |
|
Gross Leasable Area |
| Tenant State |
|
Number of Leases |
|
Dollars |
|
% of Total |
|
Square Feet |
|
% of Total |
| Illinois |
|
26 |
|
|
$ |
11,391 |
|
|
8.6 |
% |
|
752,941 |
|
|
7.1 |
% |
| Texas |
|
43 |
|
|
10,063 |
|
|
7.6 |
% |
|
591,104 |
|
|
5.6 |
% |
| Wisconsin |
|
24 |
|
|
9,507 |
|
|
7.2 |
% |
|
920,831 |
|
|
8.7 |
% |
| New York |
|
25 |
|
|
8,609 |
|
|
6.5 |
% |
|
728,008 |
|
|
6.9 |
% |
| North Carolina |
|
70 |
|
|
7,721 |
|
|
5.9 |
% |
|
531,814 |
|
|
5.0 |
% |
| Georgia |
|
36 |
|
|
7,056 |
|
|
5.4 |
% |
|
815,324 |
|
|
7.7 |
% |
| Alabama |
|
45 |
|
|
6,698 |
|
|
5.1 |
% |
|
536,199 |
|
|
5.0 |
% |
| Ohio |
|
42 |
|
|
6,685 |
|
|
5.1 |
% |
|
690,087 |
|
|
6.5 |
% |
| Virginia |
|
11 |
|
|
5,892 |
|
|
4.5 |
% |
|
281,363 |
|
|
2.6 |
% |
| Pennsylvania |
|
28 |
|
|
5,697 |
|
|
4.3 |
% |
|
405,328 |
|
|
3.8 |
% |
| Indiana |
|
20 |
|
|
5,184 |
|
|
3.9 |
% |
|
407,252 |
|
|
3.8 |
% |
| Louisiana |
|
13 |
|
|
4,447 |
|
|
3.4 |
% |
|
347,985 |
|
|
3.3 |
% |
| Mississippi |
|
23 |
|
|
4,186 |
|
|
3.2 |
% |
|
516,243 |
|
|
4.9 |
% |
| California |
|
13 |
|
|
4,174 |
|
|
3.2 |
% |
|
190,390 |
|
|
1.8 |
% |
| Florida |
|
29 |
|
|
3,965 |
|
|
3.0 |
% |
|
280,914 |
|
|
2.6 |
% |
| Michigan |
|
19 |
|
|
3,616 |
|
|
2.7 |
% |
|
376,373 |
|
|
3.5 |
% |
| Oregon |
|
3 |
|
|
3,343 |
|
|
2.5 |
% |
|
148,422 |
|
|
1.4 |
% |
| New Mexico |
|
8 |
|
|
1,658 |
|
|
1.3 |
% |
|
97,292 |
|
|
0.9 |
% |
| Iowa |
|
12 |
|
|
1,488 |
|
|
1.1 |
% |
|
239,596 |
|
|
2.3 |
% |
| Kentucky |
|
5 |
|
|
1,479 |
|
|
1.1 |
% |
|
167,479 |
|
|
1.6 |
% |
Other(1) |
|
103 |
|
|
19,002 |
|
|
14.4 |
% |
|
1,599,238 |
|
|
15.1 |
% |
| Total |
|
598 |
|
|
$ |
131,861 |
|
|
100.0 |
% |
|
10,624,183 |
|
|
100.0 |
% |
(1) Includes 25 states.
Lease Terms and Expirations
Our leases typically have initial lease terms of approximately 10 years and contain two or more options for the tenant to extend the lease term, most often for additional five-year periods. As of December 31, 2023, the leases in our portfolio had a WALT of 9.5 years (exclusive of mortgage loans receivable). The following table illustrates contractual lease expirations within the Company's portfolio as of December 31, 2023, assuming no exercise of contractual extension options (dollars in thousands):
|
|
|
|
|
|
|
|
|
|
|
|
|
|
|
|
|
|
|
|
|
|
|
|
|
|
|
|
|
|
|
|
|
|
|
|
|
ABR |
|
Gross Leasable Area |
| Year |
|
Number of Leases |
|
Dollars |
|
% of Total |
|
Square Feet |
|
% of Total |
| 2024 |
|
13 |
|
|
$ |
4,056 |
|
|
3.1 |
% |
|
329,292 |
|
|
3.1 |
% |
| 2025 |
|
65 |
|
|
7,653 |
|
|
5.8 |
% |
|
491,842 |
|
|
4.6 |
% |
| 2026 |
|
10 |
|
|
2,563 |
|
|
1.9 |
% |
|
282,727 |
|
|
2.7 |
% |
| 2027 |
|
17 |
|
|
4,602 |
|
|
3.5 |
% |
|
429,665 |
|
|
4.0 |
% |
| 2028 |
|
26 |
|
|
10,128 |
|
|
7.7 |
% |
|
817,615 |
|
|
7.7 |
% |
| 2029 |
|
43 |
|
|
9,759 |
|
|
7.4 |
% |
|
760,148 |
|
|
7.2 |
% |
| 2030 |
|
39 |
|
|
9,896 |
|
|
7.5 |
% |
|
1,052,878 |
|
|
9.9 |
% |
| 2031 |
|
64 |
|
|
12,187 |
|
|
9.2 |
% |
|
1,150,824 |
|
|
10.8 |
% |
| 2032 |
|
34 |
|
|
9,085 |
|
|
6.9 |
% |
|
1,236,792 |
|
|
11.6 |
% |
| 2033 |
|
61 |
|
|
12,590 |
|
|
9.5 |
% |
|
1,015,117 |
|
|
9.6 |
% |
| 2034 |
|
39 |
|
|
11,095 |
|
|
8.4 |
% |
|
441,606 |
|
|
4.2 |
% |
| 2035 |
|
28 |
|
|
8,861 |
|
|
6.7 |
% |
|
499,310 |
|
|
4.7 |
% |
| 2036 |
|
21 |
|
|
4,977 |
|
|
3.8 |
% |
|
269,010 |
|
|
2.5 |
% |
| 2037 |
|
23 |
|
|
6,666 |
|
|
5.1 |
% |
|
533,383 |
|
|
5.0 |
% |
| 2038 |
|
91 |
|
|
11,441 |
|
|
8.7 |
% |
|
1,048,698 |
|
|
9.9 |
% |
| Thereafter |
|
24 |
|
|
6,302 |
|
|
4.8 |
% |
|
265,276 |
|
|
2.5 |
% |
| Total |
|
598 |
|
|
$ |
131,861 |
|
|
100.0 |
% |
|
10,624,183 |
|
|
100.0 |
% |
Developments
During 2023, rent commenced on 22 completed property developments. As of December 31, 2023, we had 24 property developments with rent expected to commence at various dates throughout 2024. The following table illustrates actual and anticipated rent commencement of those developments.
|
|
|
|
|
|
|
|
|
|
|
|
|
|
|
|
|
|
|
|
|
| Tenant Industry |
|
Location |
|
Lease Term (Years) |
|
Actual/ Anticipated Rent Commencement |
| Arts & Craft |
|
D'Iberville |
|
15 |
|
Commenced 1Q'23 |
| Arts & Craft |
|
Winder, GA |
|
15 |
|
Commenced 1Q'23 |
| Arts & Craft |
|
Sheboygan, WI |
|
10 |
|
Commenced 2Q'23 |
| Home Improvement |
|
Bossier City, LA |
|
12 |
|
Commenced 3Q'23 |
| Discount Retail |
|
Alpena, MI |
|
10 |
|
Commenced 3Q'23 |
| Dollar Stores (multiple programs) |
|
Various (3 completed) |
|
10 |
|
Commenced 3Q'23 |
| Dollar Stores (multiple programs) |
|
Various (13 completed) |
|
10 to 15 |
|
Commenced 4Q'23 |
| Automotive Service (multiple programs) |
|
Various (1 completed) |
|
15 |
|
Commenced 4Q'23 |
| Dollar Stores (multiple programs) |
|
Various (15 in progress) |
|
10 to 15 |
|
1Q'24 to 3Q'24 |
| Automotive Service (multiple programs) |
|
Various (6 in progress) |
|
15 |
|
1Q'24 to 3Q'24 |
| Farm Supplies |
|
Malakoff, TX |
|
20 years |
|
1Q'24 |
| Home Improvement |
|
Butte, MT |
|
15 years |
|
3Q'24 |
| Pet Supplies |
|
Sumter, SC |
|
10 years |
|
4Q'24 |
Item 3. Legal Proceedings
From time to time, we may be party to various lawsuits, claims and other legal proceedings that arise in the ordinary course of our business. We are not currently subject to any lawsuits, claims, or other legal proceedings.
Item 4. Mine Safety Disclosures
Not applicable.
PART II — OTHER INFORMATION
Item 5. Market for Registrant's Common Equity, Related Stockholder Matters and Issuer Purchases of Equity Securities
Market Information for Common Stock, Holders of Record, and Distribution Policy
Our common stock is traded on the NYSE under the symbol “NTST.” As of February 12, 2024 there were 73,221,810 shares of our common stock issued and outstanding which were held by approximately 53 stockholders of record. In addition, as of February 12, 2024 there were 479,298 outstanding Class A units of limited partnership of the operating partnership (“Class A OP Units”) which are convertible into shares of our common stock on a one-for-one basis. In addition, there are no remaining Class B units of limited partnership of the operating partnership (“Class B OP Units”), which have all been converted into shares of our common stock prior to 2022.
We intend to pay regular quarterly dividends to our stockholders, although all future distributions will be declared and paid at the discretion of our board of directors, and their form, timing and amount, if any, will depend upon a number of factors, including our actual and projected results of operations, liquidity, cash flows and financial condition, our REIT taxable income, the annual REIT distribution requirements, applicable law, including restrictions on distributions under Maryland law, and such other factors as our board of directors deems relevant.
During the years ended December 31, 2023 and 2022, we declared and paid the following common stock dividends (in thousands, except per share data):
|
|
|
|
|
|
|
|
|
|
|
|
|
|
|
|
|
|
|
|
|
|
|
|
|
|
|
| Year Ended December 31, 2023 |
| Declaration Date |
|
Dividend Per Share |
|
Record Date |
|
Total Amount |
|
Payment Date |
| February 21, 2023 |
|
$ |
0.200 |
|
|
March 15, 2023 |
|
$ |
11,650 |
|
|
March 30, 2023 |
| April 25, 2023 |
|
0.200 |
|
|
June 1, 2023 |
|
12,173 |
|
|
June 15, 2023 |
| July 24, 2023 |
|
0.205 |
|
|
September 1, 2023 |
|
13,768 |
|
|
September 15, 2023 |
| October 24, 2023 |
|
0.205 |
|
|
December 1, 2023 |
|
14,084 |
|
|
December 15, 2023 |
|
|
$ |
0.810 |
|
|
|
|
$ |
51,675 |
|
|
|
|
|
|
|
|
|
|
|
|
|
|
|
|
|
|
|
|
|
|
|
|
|
|
|
|
|
|
| Year Ended December 31, 2022 |
| Declaration Date |
|
Dividend Per Share |
|
Record Date |
|
Total Amount |
|
Payment Date |
| February 22, 2022 |
|
$ |
0.200 |
|
|
March 15, 2022 |
|
$ |
8,888 |
|
|
March 30, 2022 |
| April 26, 2022 |
|
0.200 |
|
|
June 1, 2022 |
|
9,588 |
|
|
June 15, 2022 |
| July 26, 2022 |
|
0.200 |
|
|
September 1, 2022 |
|
10,073 |
|
|
September 15, 2022 |
| October 25, 2022 |
|
0.200 |
|
|
December 1, 2022 |
|
10,984 |
|
|
December 15, 2022 |
|
|
$ |
0.800 |
|
|
|
|
$ |
39,533 |
|
|
|
The holders of OP Units are entitled to an equal distribution per each OP Unit held as of each record date.
Recent Sales of Unregistered Securities
None.
Performance Graph
The following graph compares our cumulative total stockholder return based on the market price of our common stock, assuming dividends are reinvested, with the Standard & Poor’s 500 Composite Stock Index (“S&P 500”) and the NAREIT US Equity REIT Index for the period beginning August 13, 2020 (the date our common stock began trading on the NYSE exchange) and ending December 31, 2023. The graph assumes an investment of $100 on August 13, 2020.
|
|
|
|
|
|
|
|
|
|
|
|
|
|
|
|
|
|
|
|
|
|
|
|
|
|
|
|
|
|
|
|
|
|
|
Period Ending |
| Index |
|
8/13/2020 |
|
12/31/2020 |
|
12/31/2021 |
|
12/31/2022 |
|
12/31/2023 |
| NETSTREIT Corp. |
|
$ |
100.00 |
|
|
$ |
111.58 |
|
|
$ |
136.05 |
|
|
$ |
113.24 |
|
|
$ |
115.61 |
|
| S&P 500 |
|
$ |
100.00 |
|
|
$ |
112.05 |
|
|
$ |
144.21 |
|
|
$ |
118.08 |
|
|
$ |
149.14 |
|
| NAREIT US EQUITY REIT Index |
|
$ |
100.00 |
|
|
$ |
106.04 |
|
|
$ |
149.84 |
|
|
$ |
112.46 |
|
|
$ |
125.23 |
|
The information above shall not be deemed to be “soliciting material” or to be “filed” with the SEC or subject to Regulation 14A or 14C, other than as provided in Item 201 of Regulation S-K, or to the liabilities of Section 18 of the Exchange Act, except to the extent we specifically request that such information be treated as soliciting material or specifically incorporate it by reference into a filing under the Securities Act or the Exchange Act.
Item 6. Reserved
Item 7. Management’s Discussion and Analysis of Financial Condition and Results of Operations
The following discussion and analysis of our financial condition and results of operations should be read together with the “Business” section as well as the consolidated financial statements and related notes in Part II, Item 8 in this Annual Report on Form 10-K. Some of the information contained in this discussion and analysis or set forth elsewhere in this report, including information with respect to our plans and strategies for our business, includes forward-looking statements that involve risks and uncertainties. You should read “Item 1A. Risk Factors” and the “Forward-Looking Statements” section of this Annual Report on Form 10-K for a discussion of important factors that could cause actual results to differ materially from the results described in or implied by these forward-looking statements. Also refer to “Item 7 – Management’s Discussion and Analysis of Financial Condition and Results of Operations” in the Company’s previously filed Annual Report on Form 10-K for the year ended December 31, 2022 filed with the SEC on February 23, 2023, for additional discussion of our financial condition and results of operations, including a comparison of our results of operations for the year ended December 31, 2022 and the year ended December 31, 2021, which is incorporated herein by reference.
Business Overview
We are an internally managed real estate company that acquires, owns, invests in and manages a diversified portfolio of single-tenant, retail commercial real estate subject to long-term net leases with high credit quality tenants across the United States. As of December 31, 2023, we owned or had investments in 598 single-tenant retail net leased properties that were diversified by tenant, industry and geography, including 85 different tenants, across 26 retail sectors in 45 states. This excludes 24 property developments where rent has yet to commence. We focus on tenants in industries where a physical location is critical to the generation of sales and profits, with a focus on necessity goods and essential services in the retail sector, including home improvement, auto parts, drug stores and pharmacies, general retail, grocers, convenience stores, discount stores, and quick-service restaurants, all of which we refer to as defensive retail industries. As of December 31, 2023, our investments generated ABR1 of $131.9 million. Approximately 71% of our ABR is from investment grade2 credit rated tenants and an additional 14% of our ABR is derived from tenants with an investment grade profile3. Exclusive of mortgage loans receivable, our portfolio was 100% occupied with a weighted average remaining lease term (“WALT”) of 9.5 years, which we believe provides us with a strong stable source of recurring cash flow from our portfolio.
ATM Program
On October 25, 2023, we entered into a $300.0 million at-the-market equity program (the “2023 ATM Program”) through which, from time to time, we may sell shares of our common stock in registered transactions. From October 25, 2023 through December 31, 2023, we sold 4,478,539 shares of our common stock at a weighted average price of $17.27 per share, from which we received net proceeds of $76.5 million. As of December 31, 2023, we had $222.7 million in remaining gross proceeds available for future issuances of shares of our common stock under the 2023 ATM Program.
Effective October 24, 2023, in connection with the establishment of the 2023 ATM Program, we terminated our prior $250.0 million at-the-market equity program (the “2021 ATM Program”). As a result of such termination, we will not offer or sell any additional shares of common stock under the 2021 ATM Program. We have entered into a forward confirmation with respect to 5,983,711 shares of common stock under the 2021 ATM Program that remains unsettled. We may physically settle this forward confirmation (by the delivery of shares of common stock) and receive proceeds from the sale of those shares on one or more forward settlement dates, which shall occur no later than September 13, 2024.
The following table details information related to activity under the 2021 ATM Program and the 2023 ATM Program for the year ended December 31, 2023 (in thousands, except share and per share data):
|
|
|
|
|
|
|
|
|
|
|
Year Ended December 31, 2023(1) |
| Shares of common stock issued |
|
7,662,341 |
|
| Weighted average price per share |
|
$ |
17.22 |
|
| Gross proceeds |
|
$ |
131,911 |
|
| Sales commissions and offering costs |
|
$ |
1,638 |
|
| Net proceeds |
|
$ |
130,274 |
|
(1) Includes 1,516,289 shares of common stock partially physically settled at a price of $16.49 per share under the forward confirmation with respect to the 2021 ATM Program. 5,983,711 shares remain unsettled under the forward confirmation as of December 31, 2023.
2027 Term Loan
In December 2019, we entered into an agreement governing a $175.0 million senior unsecured term loan that was scheduled to mature in December 2024 (the “2024 Term Loan”). On June 15, 2023, we amended and restated the agreement governing the 2024 Term Loan to provide for a $175.0 million senior unsecured term loan with a maturity date of January 15, 2026 that is subject to a one year extension option at our election (subject to certain conditions) (the “2027 Term Loan”). The 2027 Term Loan is repayable at our option in whole or in part without premium or penalty. The Company has fully hedged the 2027 Term Loan.
1 Annualized base rent (“ABR”) is annualized base rent as of December 31, 2023, for all leases that commenced, and annualized cash interest on mortgage loans receivable in place as of that date.
2 We define “investment grade” tenants as tenants, or tenants that are subsidiaries of a parent entity, with a credit rating of BBB- (S&P/Fitch), Baa3 (Moody's) or NAIC2 (National Association of Insurance Commissioners) or higher.
3 We define “investment grade profile” tenants as tenants with metrics of more than $1.0 billion in annual sales and a debt to adjusted EBITDA ratio of less than 2.0x but do not carry a published rating from S&P, Moody’s or NAIC.
2029 Term Loan
On July 3, 2023, we entered into an agreement (the “2029 Term Loan Agreement”) related to a $250.0 million sustainability-linked senior unsecured term loan (the “2029 Term Loan”) which may, subject to the terms of the 2029 Term Loan Agreement, be increased to an amount of up to $400.0 million at our request. The 2029 Term Loan contains a 12-month delayed draw feature and $150.0 million was drawn on July 3, 2023. The 2029 Term Loan is prepayable at our option in whole or in part without premium or penalty. The 2029 Term Loan matures on July 3, 2026, subject to extension options at our election on two occasions, by one year and, on one occasion, by six months (subject to certain conditions).
We have hedged the entire $250.0 million of the 2029 Term Loan at an all-in fixed interest rate of 4.99%, through January 2029, which consists of the fixed rate SOFR swap of 3.74%, plus a credit spread adjustment of 0.10% and, at current leverage levels, a borrowing spread of 1.15%. Interest is payable monthly or at the end of the applicable interest period in arrears on any outstanding borrowings. See further discussion of our debt, interest rate, and interest rate hedges included in “Note 6 - Debt.”
Results of Operations
Overall
We continued to grow our assets held for investment during the year ended December 31, 2023 through the acquisition of properties, property developments, and investment in mortgage loans receivable. This growth was financed through the settlement of shares of common stock through our forward sale agreements in an amount of $141.1 million, the issuance of common stock under the 2023 ATM Program and the 2021 ATM Program in an amount of $76.5 million and $53.7 million, respectively, the execution of the 2029 Term Loan Agreement and receipt of proceeds of $150.0 million under the 2029 Term Loan, net borrowings on our $400.0 million senior unsecured revolving credit facility (the “Revolver”), and cash flows from operations during the year ended December 31, 2023.
Acquisitions
During 2023, we acquired 103 properties for a total purchase price of $345.1 million, inclusive of $3.5 million of capitalized acquisition costs. The acquisitions were all accounted for as asset acquisitions. These properties are located in 25 states with a WALT of approximately 10.4 years. The underwritten weighted-average capitalization rate on our year to date acquisitions was approximately 6.9%.
Development
As of December 31, 2023, we had 18 property developments under construction. During 2023, we invested $81.0 million in our property developments, including the land acquisition of 40 new developments with a combined initial purchase price of $27.3 million. During the year, we completed development on 27 projects and reclassified approximately $68.6 million from property under development to land, building, and improvements in the accompanying consolidated balance sheets. The remaining 18 developments are expected to be substantially completed with rent commencing at various points throughout 2024. The purchase price, including acquisitions costs, and subsequent development are included in property under development in the accompanying consolidated balance sheets as of December 31, 2023.
Dispositions
During 2023, we sold 19 properties for a total sales price, net of disposal costs, of $40.3 million, recognizing a net gain of $1.2 million.
Investment in Mortgage Loans Receivable
During the year ended December 31, 2023, we invested $72.3 million, in fully collateralized mortgage loans receivable with stated interest rates ranging from 6.89% to 10.25%. The mortgage loans receivable are collateralized by real estate, primarily leased by investment grade credit rated tenants. The funds provided under the loans, in addition to discount and loan origination costs of $0.1 million and $0.1 million, respectively, are included in mortgage loans receivable, net in the accompanying consolidated balance sheets as of December 31, 2023. See “Note 4 - Real Estate Investments” for further discussion on our mortgage loans receivable portfolio.
Economic and Financial Environment
The annual inflation rate for the twelve months ended December 31, 2023 was 3.4% as compared to 6.5% for the prior year. While the Federal Reserve had been raising interest rates in an effort to lower inflation throughout 2022 and the first half of 2023, there continues to be uncertainty entering into 2024 as to whether rates will be kept steady or potentially cut, leading to uncertainties in the financing market and a volatile economy.
In the commercial real estate market, property prices generally continue to fluctuate which may impact our investment capitalization rates and operating costs. Likewise, during certain periods, including the current market, the credit markets have experienced significant price volatility, dislocations, and liquidity disruptions, which may impact our access to and cost of capital. We continually monitor the commercial real estate and credit markets carefully and, if required, will make decisions to adjust our business strategy accordingly.
Year Ended December 31, 2023 Compared with the Year Ended December 31, 2022
The following table sets forth our operating results for the periods indicated (in thousands):
|
|
|
|
|
|
|
|
|
|
|
|
|
|
|
|
|
Year Ended December 31, |
|
|
2023 |
|
2022 |
| Revenues |
|
|
|
|
| Rental revenue (including reimbursable) |
|
$ |
123,967 |
|
|
$ |
93,934 |
|
| Interest income on loans receivable |
|
7,388 |
|
|
2,345 |
|
| Other revenue |
|
550 |
|
|
— |
|
| Total revenues |
|
131,905 |
|
|
96,279 |
|
| Operating expenses |
|
|
|
|
| Property |
|
16,413 |
|
|
11,695 |
|
| General and administrative |
|
20,176 |
|
|
19,053 |
|
| Depreciation and amortization |
|
63,677 |
|
|
50,075 |
|
| Provisions for impairment |
|
7,083 |
|
|
1,114 |
|
| Transaction costs |
|
456 |
|
|
839 |
|
| Total operating expenses |
|
107,805 |
|
|
82,776 |
|
| Other income (expense) |
|
|
|
|
| Interest expense, net |
|
(19,058) |
|
|
(9,181) |
|
| Gain on sales of real estate, net |
|
1,175 |
|
|
4,148 |
|
| Loss on debt extinguishment |
|
(128) |
|
|
— |
|
| Other income, net |
|
752 |
|
|
131 |
|
| Total other income (expense), net |
|
(17,259) |
|
|
(4,902) |
|
| Net income before income taxes |
|
6,841 |
|
|
8,601 |
|
| Income tax benefit (expense) |
|
49 |
|
|
(396) |
|
| Net income |
|
$ |
6,890 |
|
|
$ |
8,205 |
|
Revenue. Revenue for the year ended December 31, 2023 increased by $35.6 million to $131.9 million from $96.3 million for the year ended December 31, 2022, which is attributed to an increase in the number of our operating leases and properties securing our mortgage loans. The increase includes additional cash rental receipts of $27.7 million, combined with net increases of property expense reimbursements of $4.4 million, an increase of $5.0 million related to interest income on mortgage loans receivable, and an increase of $0.6 million in other revenue related to the receipt of legal settlement proceeds associated with a lease termination. The increase in revenue is offset by a $0.5 million decrease in straight-line rental revenue, $0.8 million decrease related to prior year recoveries, a $0.4 million increase in reserves for uncollectible amounts, and a $0.2 million decrease in lease incentive adjustments.
Total Operating Expenses. Total expenses increased by $25.0 million to $107.8 million for the year ended December 31, 2023 as compared to $82.8 million for the year ended December 31, 2022. The increase is primarily attributed to an increase in the number of operating properties, with the most significant increases being depreciation and amortization expense, provisions for impairment, property-specific reimbursable expenses, and payroll costs. Total operating expenses include the following:
•Property Expenses. Property expenses increased $4.7 million to $16.4 million for the year ended December 31, 2023 from $11.7 million for the year ended December 31, 2022. The increase is primarily attributed to an increase in the number of operating properties, including combined net increases of reimbursable property expenses of $4.4 million, of which $2.8 million, $1.3 million, and $0.3 million were related to reimbursable property taxes, reimbursable common area maintenance costs, and reimbursable insurance costs, respectively. Non-reimbursable property expenses increased by approximately $0.2 million.
•General and Administrative Expenses. General and administrative expenses increased $1.1 million to $20.2 million for the year ended December 31, 2023 from $19.1 million for the year ended December 31, 2022. The increase is primarily due to increased bonus expenses of $1.3 million, payroll expenses of $0.7 million, and corporate office lease expenses of $0.2 million. This is offset by decreased executive severance and transition costs of $0.6 million, corporate insurance of $0.4 million and accounting service and consulting fees of $0.3 million. While our general and administrative expenses will continue to rise in some measure as our portfolio grows, we expect that such expenses as a percentage of our portfolio will decrease over time due to efficiencies and economies of scale.
•Depreciation and Amortization. Depreciation and amortization expense increased by $13.6 million to $63.7 million for the year ended December 31, 2023 from $50.1 million for the year ended December 31, 2022. The increase in depreciation and amortization is proportionate to the increase in the size of the portfolio over the comparable period with associated increases in building depreciation expense of $7.7 million, in-place lease amortization expense of $3.3 million, building improvements depreciation expense of $2.6 million, and leasehold improvements depreciation expense of $0.3 million. This is offset by a decrease in assembled workforce amortization expense of $0.3 million.
•Provisions for impairment. For the year ended December 31, 2023, we recorded provisions for impairment of $7.1 million on 22 properties, the majority of which were either previously classified as held-for-sale, newly classified as held-for-sale or disposed of during the year ended December 31, 2023. Two of the properties are held for investment as of the year ended December 31, 2023, but were approved for sale subsequent to year-end. For the year ended December 31, 2022, we recorded a provision for impairment of $1.1 million on one property. For the year ended December 31, 2023, we sold four properties that were impaired. These disposals relate to management’s continuous assessment of the Company’s portfolio in an effort to improve returns and manage risk exposure.
•Transaction costs. Transaction costs decreased by $0.3 million to $0.5 million for the year ended December 31, 2023 from $0.8 million for the year ended December 31, 2022, which primarily relates to a decrease in costs incurred for abandoned acquisitions.
Interest Expense. Interest expense increased by $9.9 million to $19.1 million for the year ended December 31, 2023 from $9.2 million for the year ended December 31, 2022. The increase is primarily attributed to an increase of $4.5 million of interest incurred under the 2028 Term Loan, an increase of $4.4 million of interest incurred under the 2029 Term Loan, a net increase of $2.1 million under the Revolver as a result of higher interest rates, offset by a decrease in average borrowings outstanding during the respective periods, and an increase of $0.3 million of interest incurred under the mortgage note payable. Additional increases of $1.0 million and $0.4 million are attributed to increased loan fee amortization and increased facility fees, respectively. This is offset by $2.1 million in amortization of deferred gains on interest rate swaps and $0.6 million of increased capitalized interest on our property developments.
Gain on sales of real estate, net. Net gain on sales of real estate decreased by $2.9 million to $1.2 million for the year ended December 31, 2023 from $4.1 million for the year ended December 31, 2022. The table below summarizes the properties sold for the periods indicated (in thousands):
|
|
|
|
|
|
|
|
|
|
|
|
|
Year Ended December 31, |
|
2023 |
|
2022 |
| Number of properties sold |
19 |
|
|
7 |
|
| Sales price, net of disposal costs |
$ |
40,259 |
|
|
$ |
25,515 |
|
| Gain on sales of real estate, net |
$ |
1,175 |
|
|
$ |
4,148 |
|
Other income, net. Other income increased by $0.7 million for the year ended December 31, 2023. The increase relates to $0.7 million of interest income earned on the Company’s cash, cash equivalents and restricted cash balances as presented in the consolidated balance sheets.
Income tax (benefit) expense. Income tax expense decreased by $0.4 million to an income tax benefit of less than $0.1 million for the year ended December 31, 2023. The decrease relates to lower provisions for federal and state income taxes on the financial results of our TRS, including certain losses on sales of real estate in 2023.
Net Income. Net income decreased $1.3 million to $6.9 million for the year ended December 31, 2023 from $8.2 million for the year ended December 31, 2022. Net income decreased primarily due to increases in interest expense, depreciation and amortization expenses, provisions for impairment, bonus and payroll expense, as well as a decrease in net gains on sales of real estate, as set forth above. This is offset primarily by increases in rental revenues due to the growth in the size of our real estate investment portfolio, including interest income associated with our mortgage loans receivable.
Liquidity and Capital Resources
Our primary capital requirements are to fund property acquisitions and developments, fund investments in mortgage loans receivable and required interest payments, and fund working capital needs, operating expenses, and capital expenditures. Our capital resources primarily consist of cash from operations, sales of equity securities and available borrowing facilities. As of December 31, 2023, we had $175.0 million outstanding principal amount under the senior unsecured term loan (the “2027 Term Loan”), $200.0 million outstanding principal amount under the 2028 Term Loan, $150.0 million outstanding principal amount under the 2029 Term Loan, and $80.0 million of borrowings outstanding under our Revolver. Additionally, as of December 31, 2023, we had $99.6 million and $300.0 million of remaining gross proceeds available for future issuances of shares of our common stock under the 2021 ATM Program and 2023 ATM Programs, respectively, inclusive of 5,983,711 shares remaining unsettled under the outstanding forward confirmation under the 2021 ATM Program.
We believe that the availability of proceeds from future issuances of shares of our common stock under the 2023 ATM Program or subsequent at-the-market sale programs, coupled with our cash flows from operations and available borrowing capacity under the Revolver and 2029 Term Loan, will be adequate to support our ongoing operations and to fund our debt service requirements, capital expenditures and working capital requirements for at least the next 12 months. We anticipate funding our long-term capital needs through cash provided from operations, borrowings under our Revolver, 2029 Term Loan and issuances of common stock.
Contractual Obligations and Commitments
As of December 31, 2023, our contractual debt obligations primarily include the maturity of our 2027 Term Loan with the scheduled principal payment due on January 15, 2026, the maturity of our 2028 Term Loan with the scheduled principal payment due on February 11, 2028, the maturity of our 2029 Term Loan with the scheduled principal payment due on July 3, 2026, and repayment of borrowings on our Revolver with a maturity of August 11, 2026. During the year ended December 31, 2023, we borrowed $361.0 million at a weighted average interest rate of 5.92% and also repaid $394.0 million on our revolving credit facilities.
The following table provides information with respect to our commitments as of December 31, 2023 (in thousands):
|
|
|
|
|
|
|
|
|
|
|
|
|
|
|
|
|
|
|
|
|
|
|
|
|
|
|
|
|
|
|
|
|
|
|
Payment Due by Period |
|
|
Total |
|
2024 |
|
2025 - 2026 |
|
2027 - 2028 |
|
Thereafter |
| Contractual Obligations |
|
|
|
|
|
|
|
|
|
|
| 2027 Term Loan – Principal |
|
$ |
175,000 |
|
$ |
— |
|
$ |
175,000 |
|
$ |
— |
|
$ |
— |
2027 Term Loan – Variable interest (1) |
|
12,135 |
|
5,492 |
|
6,643 |
|
— |
|
— |
| Revolver – Borrowings |
|
80,000 |
|
— |
|
80,000 |
|
— |
|
— |
| Revolver – Variable interest |
|
13,556 |
|
5,192 |
|
8,364 |
|
— |
|
— |
Facility Fee (2) |
|
1,567 |
|
600 |
|
967 |
|
— |
|
— |
| 2028 Term Loan – Principal |
|
200,000 |
|
— |
|
— |
|
200,000 |
|
— |
2028 Term Loan – Variable interest (3) |
|
31,932 |
|
7,760 |
|
15,521 |
|
8,651 |
|
— |
| 2029 Term Loan – Principal |
|
150,000 |
|
— |
|
150,000 |
|
— |
|
|
2029 Term Loan – Variable interest (4) |
|
18,358 |
|
7,331 |
|
11,027 |
|
— |
|
|
| Mortgage Note – Principal |
|
8,361 |
|
162 |
|
348 |
|
7,851 |
|
— |
| Mortgage Note – Interest |
|
1,423 |
|
375 |
|
726 |
|
322 |
|
— |
| Property developments under contract |
|
35,690 |
|
35,690 |
|
— |
|
— |
|
— |
| Additional principal under mortgage notes receivable |
|
13,737 |
|
13,737 |
|
— |
|
— |
|
— |
| Tenant Improvement Allowances |
|
4,089 |
|
4,089 |
|
— |
|
— |
|
— |
| Corporate office lease obligations |
|
5,888 |
|
617 |
|
1,289 |
|
1,359 |
|
2,623 |
| Total |
|
$ |
751,736 |
|
$ |
81,045 |
|
$ |
449,885 |
|
$ |
218,183 |
|
$ |
2,623 |
(1) We entered into five interest rate hedges to fix the base interest rate (daily SOFR) on our 2027 Term Loan. The hedged fixed rate reset effective November 27, 2023 to 1.87% and December 23, 2024 to 2.40%. Accordingly, the projected interest rate obligations for the variable rate 2027 Term Loan are based on the hedged fixed rate of 1.87% through December 23, 2024, and 2.40% thereafter, compared to the variable 2027 Term Loan daily SOFR rate as of December 31, 2023 of 5.31%, plus a SOFR adjustment of 0.10% and applicable margin of 1.15% based on the $175.0 million 2027 Term Loan outstanding through the contractual maturity date of January 15, 2026.
(2) We are subject to a facility fee of 0.15% on our Revolver.
(3) We entered into three interest rate hedges to fix the base interest rate (one-month SOFR) on our 2028 Term Loan. Accordingly, the projected interest rate obligations for the variable rate 2028 Term Loan are based on the hedged fixed rate of 2.63% compared to the variable 2028 Term Loan one-month SOFR rate as of December 31, 2023 of 5.34%, plus a SOFR adjustment of 0.10% and applicable margin of 1.15% based on the $200.0 million 2028 Term Loan outstanding through the maturity date of February 11, 2028.
(4) We entered into four interest rate hedges to fix the base interest rate (daily SOFR) on our 2029 Term Loan. Accordingly, the projected interest rate obligations for the variable rate 2029 Term Loan are based on the hedged fixed rate of 3.64% compared to the variable 2029 Term Loan daily SOFR rate as of December 31, 2023 of 5.32%, plus a SOFR adjustment of 0.10% and applicable margin of 1.15% based on the $150.0 million of the 2029 Term Loan outstanding through the contractual maturity date of July 3, 2026.
In August 2021, we entered into a lease agreement on a new corporate office space, which is classified as an operating lease. We began operating out of the new office in February 2022. The lease has a remaining noncancellable term of 8.6 years that expires on July 31, 2032 and is renewable at our option for two additional periods of five years. Future minimum base rental payments under the lease are outlined in “Note 3 – Leases.” Annual rent expense, excluding operating expenses, is approximately $0.5 million during the initial term.
Additionally, in the normal course of business, we enter into various types of commitments to purchase real estate properties, fund development projects, or extend funds under mortgage notes receivable. These commitments are generally subject to our customary due diligence process and, accordingly, a number of specific conditions must be met before we are obligated to purchase or extend funding. As of December 31, 2023, we had commitments to fund properties under development and extend funds under mortgage notes receivable totaling $35.7 million and $13.7 million, respectively, all of which is expected to be funded over the next 12 months.
Debt
See discussion of our debt and interest rate hedges included in “Note 6 - Debt” and “Note 7 - Derivative Financial Instruments” of our consolidated financial statements, included in Part II, Item 8 of this Annual Report on Form 10-K.
Historical Cash Flow Information
Year Ended December 31, 2023 Compared with the Year Ended December 31, 2022
|
|
|
|
|
|
|
|
|
|
|
|
|
Year Ended December 31, |
| (in thousands) |
2023 |
|
2022 |
| Net cash provided by (used in): |
|
| Operating activities |
$ |
80,155 |
|
|
$ |
50,647 |
|
| Investing activities |
(451,953) |
|
|
(468,361) |
|
| Financing activities |
331,184 |
|
|
480,654 |
|
Cash Flows Provided By Operating Activities. Net cash provided by operating activities increased by $29.6 million for the year ended December 31, 2023 compared to the year ended December 31, 2022. The increase was largely attributed to the increase in the size of our real estate investment portfolio with an increase in rental receipts of $27.7 million and an increase in mortgage loan receivable interest of $5.0 million, offset primarily by increases in operating and general and administrative expenses paid associated with our larger portfolio.
Cash Flows Used In Investing Activities. Net cash used in investing activities decreased by $16.4 million for the year ended December 31, 2023 compared to the year ended December 31, 2022. The decrease was primarily due to a decrease in cash spent on acquisitions of real estate of $84.3 million, offset by increases in cash spent on real estate development and improvements of $56.4 million and cash spent on investments in mortgage loans receivable of $25.9 million. The remaining decrease is primarily related to proceeds from the sale of real estate, which increased $13.0 million compared to the prior period, and principal collections on mortgage loans receivable, which increased $1.5 million compared to the prior period.
Cash Flows Provided By Financing Activities. Net cash provided by financing activities decreased by $149.5 million for the year ended December 31, 2023 compared to the year ended December 31, 2022. The decrease was primarily attributed to a reduction in net borrowings of $82.0 million under our revolving credit facilities, a reduction in term loan proceeds of $50.0 million, an increase in payments of common stock dividends of $12.2 million, a decrease of proceeds from issuances of common stock in connection with our ATM Program of $6.3 million, and a decrease in proceeds under property development incentives of $0.8 million during the year ended December 31, 2023. The decrease was offset by decreases in the repurchase of common stock for tax withholding obligations, deferred financing costs and deferred offering costs of $0.8 million, $0.5 million, and $0.3 million, respectively, during the year ended December 31, 2023.
Income Taxes
The Company elected to be treated and qualify as a REIT for U.S. federal income tax purposes beginning with its short taxable year ended December 31, 2019. To qualify as a REIT, the Company must meet certain organizational, income, asset and distribution tests. Accordingly, the Company will generally not be subject to corporate U.S. federal or state income tax to the extent that it makes qualifying distributions of all of its taxable income to its stockholders and provided it satisfies on a continuing basis, through actual investment and operating results, the REIT requirements, including certain asset, income, distribution and share ownership tests. The Company expects the distributions made during 2023 are sufficient to receive a full dividends paid deduction.
We maintain a taxable REIT subsidiary (“TRS”) which may be subject to U.S. federal, state, and local income taxes on its taxable income. In general, our TRS may perform services for tenants of the Company, hold assets that the Company cannot hold directly and may engage in any real estate or non-real estate-related business.
During the years ended 2023 and 2022, we recognized franchise and other state and local tax expenses in general and administrative and federal income tax in income tax benefit (expense) in the accompanying consolidated statements of operations and comprehensive income (loss).
Recent Accounting Pronouncements
A discussion of new accounting standards and the possible effects of these standards on our consolidated financial statements is included in “Note 2 - Summary of Significant Accounting Policies” of our consolidated financial statements, included in Part II, “Item 8 - Financial Statements and Supplementary Data” of this Annual Report on Form 10-K.
Critical Accounting Policies and Estimates
Our accounting policies have been established to conform with U.S. GAAP. The preparation of financial statements in conformity with U.S. GAAP requires us to use judgment in the application of accounting policies, including making estimates and assumptions. These judgments affect the reported amounts of assets and liabilities and disclosure of contingent assets and liabilities at the dates of the financial statements and the reported amounts of revenue and expenses during the reporting periods. Management believes that we have made these estimates and assumptions in an appropriate manner and in a way that accurately reflects our financial condition. We continually test and evaluate these estimates and assumptions using our historical knowledge of the business, as well as other factors, to ensure that they are reasonable for reporting purposes. However, actual results may differ from these estimates and assumptions. If our judgment or interpretation of the facts and circumstances relating to the various transactions had been different, it is possible that different accounting policies would have been applied, thus resulting in a different presentation of the financial statements. Additionally, other companies may utilize different estimates that may impact comparability of our results of operations to those of companies in similar businesses. This summary should be read in conjunction with the more complete discussion of our accounting policies and procedures included in “Note 2 - Summary of Significant Accounting Policies” of our consolidated financial statements.
Purchase Price Allocation of Acquired Properties
We evaluate each acquisition transaction to determine whether the acquired asset meets the definition of a business and therefore accounted for as a business combination or if the acquisition transaction should be accounted for as an asset acquisition. Under Accounting Standards Update (“ASU”) 2017-01, “Business Combinations (Topic 805): Clarifying the Definition of a Business” (“ASU 2017-01”), an acquisition does not qualify as a business when substantially all of the fair value is concentrated in a single identifiable asset or group of similar identifiable assets or the acquisition does not include a substantive process in the form of an acquired workforce or an acquired contract that cannot be replaced without significant cost, effort or delay.
Transaction costs related to acquisitions that qualify as asset acquisitions are capitalized as part of the cost basis of the acquired assets, while transaction costs for acquisitions that are deemed to be acquisitions of a business are expensed as incurred.
We allocate the purchase price of acquired properties accounted for as asset acquisitions to tangible and identifiable intangible assets or liabilities based on their relative fair values. Tangible assets may include land, buildings, site improvements and tenant improvements. Intangible assets include the value of in-place leases and above-market leases and intangible liabilities include below-market leases.
The fair value of the tangible assets of an acquired property with an in-place operating lease is determined by valuing the property as if it were vacant, and the “as-if-vacant” value is then allocated to the tangible assets based on the fair value of the tangible assets. The fair value of in-place leases is determined by considering estimates of carrying costs during the expected lease-up periods, current market conditions, as well as costs to execute similar leases based on the specific characteristics of each tenant’s lease. We estimate the cost to execute leases with terms similar to the remaining lease terms of the in-place leases, including leasing commissions, legal and other related expenses. The fair value of above-market or below-market leases is recorded based on the net present value (using a discount rate that reflects the risks associated with the leases acquired) of the difference between the contractual amount to be paid pursuant to the in-place lease and our estimate of the fair market lease rate for the corresponding in-place lease, measured over the remaining non-cancelable term of the lease including any below-market fixed rate renewal options for below-market leases. In making estimates of fair values for purposes of allocating purchase price, we utilize a number of sources, including real estate valuations prepared by an independent valuation firm. We also consider information and other factors including market conditions, the industry that the tenant operates in, characteristics of the real estate; e.g., location, size, demographics, value and comparative rental rates; tenant credit profile and the importance of the location of the real estate to the operations of the tenant’s business. Additionally, we consider information obtained about each property as a result of its pre-acquisition due diligence, marketing and leasing activities in estimating the fair value of the tangible and intangible assets and liabilities acquired.
Impairment of Long-Lived Assets
Fair value measurement of an asset group occurs when events or changes in circumstances related to an asset indicate that the carrying amount of the asset group is no longer recoverable. Examples of events or changed circumstances may include, but are not limited to, significant changes in real estate market conditions, estimated residual values, our ability or expectation to re-lease properties that are vacant or become vacant or a reduction in the expected holding period of a property. If indicators are present, we will prepare a projection of the undiscounted future cash flows of the property, excluding interest charges, and determine if the carrying amount of the asset group is recoverable. When a carrying amount is not recoverable, an impairment loss is recognized to the extent that the carrying amount of the asset group exceeds its fair market value. We estimate fair value using data such as operating income, estimated capitalization rates or multiples, leasing prospects, local market information, and with regard to assets held for sale, based on the estimated or negotiated selling price, less estimated costs of disposal.
Non-GAAP Financial Measures
Our reported results are presented in accordance with GAAP. We also disclose the following non-GAAP financial measures: Funds From Operations (“FFO”), Core FFO, Adjusted FFO (“AFFO”), earnings before interest expense, income tax expense, and depreciation and amortization (“EBITDA”), EBITDA further adjusted to exclude gains (or losses) from the sales of depreciable property and real estate impairment losses (“EBITDAre”), Adjusted EBITDAre, Annualized Adjusted EBITDAre, Net Debt, Adjusted Net Debt, property-level net operating income (“Property-Level NOI”), property-level cash net operating income (“Property-Level Cash NOI”), property-level cash net operating income estimated run rate (“Property-Level Cash NOI Estimated Run Rate”), and total property-level cash net operating income estimated run rate (“Total Property-Level Cash NOI Estimated Run Rate”), all of which are detailed below. We believe these non-GAAP financial measures are industry measures used by analysts and investors to compare the operating performance of REITs.
FFO, Core FFO and AFFO
The National Association of Real Estate Investment Trusts ("NAREIT"), an industry trade group, has promulgated a widely accepted non-GAAP financial measure of operating performance known as FFO. Our FFO is net income in accordance with GAAP, excluding gains (or losses) resulting from dispositions of properties, plus depreciation and amortization and impairment charges on depreciable real property.
Core FFO is a non-GAAP financial measure defined as FFO adjusted to remove the effect of unusual and non-recurring items that are not expected to impact our operating performance or operations on an ongoing basis. These include non-recurring executive transition costs, severance and related charges, gain on insurance proceeds, and loss on debt extinguishments and other related costs.
AFFO is a non-GAAP financial measure defined as Core FFO adjusted for GAAP net income related to non-cash revenues and expenses, such as straight-line rent, amortization of above- and below-market lease-related intangibles, amortization of lease incentives, capitalized interest expense and earned development interest, non-cash interest expense, non-cash compensation expense, amortization of deferred financing costs, amortization of above/below-market assumed debt, and amortization of loan origination costs.
Historical cost accounting for real estate assets implicitly assumes that the value of real estate assets diminishes predictably over time. In fact, real estate values historically have risen or fallen with market conditions. FFO is intended to be a standard supplemental measure of operating performance that excludes historical cost depreciation and valuation adjustments from net income. We consider FFO to be useful in evaluating potential property acquisitions and measuring operating performance.
We further consider FFO, Core FFO and AFFO to be useful in determining funds available for payment of distributions. FFO, Core FFO and AFFO do not represent net income or cash flows from operations as defined by GAAP. You should not consider FFO, Core FFO and AFFO to be alternatives to net income as a reliable measure of our operating performance nor should you consider FFO, Core FFO and AFFO to be alternatives to cash flows from operating, investing or financing activities (as defined by GAAP) as measures of liquidity.
FFO, Core FFO and AFFO do not measure whether cash flow is sufficient to fund our cash needs, including principal amortization, capital improvements and distributions to stockholders. FFO, Core FFO and AFFO do not represent cash flows from operating, investing or financing activities as defined by GAAP. Further, FFO, Core FFO and AFFO as disclosed by other REITs might not be comparable to our calculations of FFO, Core FFO and AFFO.
The following table sets forth a reconciliation of FFO, Core FFO and AFFO for the periods presented to net income before allocation to noncontrolling interests, as computed in accordance with GAAP (in thousands):
|
|
|
|
|
|
|
|
|
|
|
|
|
Year Ended December 31, |
|
2023 |
|
2022 |
| Net income |
$ |
6,890 |
|
|
$ |
8,205 |
|
| Depreciation and amortization of real estate |
63,379 |
|
|
49,498 |
|
| Provisions for impairment |
7,083 |
|
|
1,114 |
|
| Gain on sales of real estate, net |
(1,175) |
|
|
(4,148) |
|
| FFO |
76,177 |
|
|
54,669 |
|
| Adjustments: |
|
|
|
| Non-recurring executive transition costs, severance and related charges |
362 |
|
|
848 |
|
| Loss on debt extinguishment and other related costs |
223 |
|
|
— |
|
| Gain on insurance proceeds |
(78) |
|
|
(126) |
|
| Core FFO |
76,684 |
|
|
55,391 |
|
| Adjustments: |
|
|
|
| Straight-line rent adjustments |
(1,163) |
|
|
(1,286) |
|
| Amortization of deferred financing costs |
1,730 |
|
|
862 |
|
| Amortization of above/below-market assumed debt |
114 |
|
|
29 |
|
| Amortization of loan origination costs |
163 |
|
|
88 |
|
| Amortization of lease-related intangibles |
(611) |
|
|
(889) |
|
| Earned development interest |
515 |
|
|
— |
|
| Capitalized interest expense |
(1,060) |
|
|
(452) |
|
| Non-cash interest expense |
(2,124) |
|
|
— |
|
| Non-cash compensation expense |
4,822 |
|
|
4,774 |
|
| AFFO |
$ |
79,070 |
|
|
$ |
58,517 |
|
EBITDA, EBITDAre, Adjusted EBITDAre and Annualized Adjusted EBITDAre
We compute EBITDA as earnings before interest expense, income tax expense, and depreciation and amortization. In 2017, NAREIT issued a white paper recommending that companies that report EBITDA also report EBITDAre. We compute EBITDAre in accordance with the definition adopted by NAREIT. NAREIT defines EBITDAre as EBITDA (as defined above) excluding gains (or losses) from the sales of depreciable property and impairment charges on depreciable real property.
Adjusted EBITDAre is a non-GAAP financial measure defined as EBITDAre further adjusted to exclude straight-line rent, non-cash compensation expense, non-recurring executive transition costs, severance and related charges, loss on debt extinguishment and other related costs, gain on insurance proceeds, other non-recurring expenses (income), lease termination fees, adjustment for construction in process, and adjustment for intraquarter activities. Annualized Adjusted EBITDAre is Adjusted EBITDAre multiplied by four.
We present EBITDA, EBITDAre, Adjusted EBITDAre and Annualized Adjusted EBITDAre as they are measures commonly used in our industry. We believe that these measures are useful to investors and analysts because they provide supplemental information concerning our operating performance, exclusive of certain non-cash items and other costs. We use EBITDA, EBITDAre, Adjusted EBITDAre and Annualized Adjusted EBITDAre as measures of our operating performance and not as measures of liquidity.
EBITDA, EBITDAre, Adjusted EBITDAre and Annualized Adjusted EBITDAre do not include all items of revenue and expense included in net income, they do not represent cash generated from operating activities and they are not necessarily indicative of cash available to fund cash requirements; accordingly, they should not be considered alternatives to net income as a performance measure or cash flows from operations as a liquidity measure and should be considered in addition to, and not in lieu of, GAAP financial measures. Additionally, our computation of EBITDA, EBITDAre, Adjusted EBITDAre and Annualized Adjusted EBITDAre may differ from the methodology for calculating these metrics used by other equity REITs and, therefore, may not be comparable to similarly titled measures reported by other equity REITs.
The following table sets forth a reconciliation of EBITDA and EBITDAre for the periods presented to net income before allocation to noncontrolling interests, as computed in accordance with GAAP (in thousands):
|
|
|
|
|
|
|
|
|
|
|
|
|
Year Ended December 31, |
|
2023 |
|
2022 |
| Net income |
$ |
6,890 |
|
|
$ |
8,205 |
|
| Depreciation and amortization of real estate |
63,379 |
|
|
49,498 |
|
| Amortization of lease-related intangibles |
(611) |
|
|
(889) |
|
| Non-real estate depreciation and amortization |
298 |
|
|
577 |
|
| Interest expense, net |
19,058 |
|
|
9,181 |
|
| Income tax (benefit) expense |
(49) |
|
|
396 |
|
| Amortization of loan origination costs |
163 |
|
|
88 |
|
| EBITDA |
89,128 |
|
|
67,056 |
|
| Adjustments: |
|
|
|
| Provisions for impairment |
7,083 |
|
|
1,114 |
|
| Gain on sales of real estate, net |
(1,175) |
|
|
(4,148) |
|
EBITDAre |
$ |
95,036 |
|
|
$ |
64,022 |
|
The following table sets forth a reconciliation of EBITDA, EBITDAre, Adjusted EBITDAre and Annualized Adjusted EBITDAre for the period presented to net income before allocation to noncontrolling interests, as computed in accordance with GAAP (in thousands):
|
|
|
|
|
|
|
Three Months Ended December 31, 2023 |
| Net income |
$ |
1,962 |
|
| Depreciation and amortization of real estate |
17,000 |
|
| Amortization of lease-related intangibles |
(93) |
|
| Non-real estate depreciation and amortization |
78 |
|
| Interest expense, net |
5,646 |
|
| Income tax expense |
10 |
|
| Amortization of loan origination costs |
80 |
|
| EBITDA |
24,683 |
|
| Adjustments: |
|
| Provisions for impairment |
2,709 |
|
| Gain on sales of real estate, net |
(506) |
|
EBITDAre |
26,886 |
|
| Adjustments: |
|
| Straight-line rent adjustments |
(456) |
|
| Non-recurring executive transition costs, severance and related charges |
86 |
|
| Gain on insurance proceeds |
(31) |
|
| Non-cash compensation expense |
1,264 |
|
Adjustment for construction in process (1) |
719 |
|
Adjustment for intraquarter investment activities (2) |
820 |
|
Adjusted EBITDAre |
$ |
29,288 |
|
|
|
Annualized Adjusted EBITDAre (3) |
$ |
117,152 |
|
Adjusted Net Debt / Annualized Adjusted EBITDAre |
4.1 |
|
(1) Adjustment reflects the estimated cash yield on developments in process as of December 31, 2023.
(2) Adjustment assumes all re-leasing activity, investments in and dispositions of real estate, including developments and interest earning loan activity completed during the year ended December 31, 2023 had occurred on January 1, 2023.
(3) We calculate Annualized Adjusted EBITDAre by multiplying Adjusted EBITDAre by four.
Net Debt and Adjusted Net Debt
We calculate our Net Debt as our principal amount of total debt outstanding excluding deferred financing costs, net discounts and debt issuance costs less cash, cash equivalents and restricted cash available for future investment.
We further adjust Net Debt by the net value of unsettled forward equity as of period end to derive Adjusted Net Debt. We believe excluding cash, cash equivalents and restricted cash available for future investment from our principal amount in addition to excluding the net value of unsettled forward equity, all of which could be used to repay debt, provides an estimate of the net contractual amount of borrowed capital to be repaid. We believe these adjustments are additional beneficial disclosures to investors and analysts.
The following table reconciles the principal amount of total debt to Net Debt and Adjusted Net Debt:
|
|
|
|
|
|
|
As of |
|
December 31, 2023 |
| Principal amount of total debt |
$ |
613,361 |
|
| Less: Cash, cash equivalents and restricted cash |
(29,929) |
|
| Net Debt |
583,432 |
|
Less: Net value of unsettled forward equity (1) |
(98,594) |
|
| Adjusted Net Debt |
$ |
484,838 |
|
(1) There were 5,983,711 unsettled shares under forward equity contracts under the ATM Program as of December 31, 2023 at the available net settlement price of $16.48.
Property-Level NOI, Property-Level Cash NOI, Property-Level Cash NOI - Estimated Run Rate, and Total Cash NOI - Estimated Run Rate
Property-Level NOI, Property-Level Cash NOI, Property-Level Cash NOI - Estimated Run Rate, and Total Cash NOI - Estimated Run Rate are non-GAAP financial measures which we use to assess our operating results. We compute Property-Level NOI as net income (computed in accordance with GAAP), excluding general and administrative expenses, interest expense (or income), income tax expense, transaction costs, depreciation and amortization, gains (or losses) on sales of depreciable property, real estate impairment losses, interest income on mortgage loans receivable, loss on debt extinguishment, lease termination fees and other income (or expense). We further adjust Property-Level NOI for non-cash revenue components of straight-line rent and amortization of lease-intangibles to derive Property-Level Cash NOI. We further adjust Property-Level Cash NOI for intraquarter acquisitions, dispositions and completed development to derive Property-Level Cash NOI - Estimated Run Rate. We further adjust Property-Level Cash NOI - Estimated Run Rate for interest income on mortgage loans receivable and intraquarter mortgage loan activity to derive Total Cash NOI - Estimated Run Rate. We believe Property-Level NOI, Property-Level Cash NOI, Property-Level Cash NOI - Estimated Run Rate, and Total Cash NOI - Estimated Run Rate provide useful and relevant information because they reflect only those income and expense items that are incurred at the property level and present such items on an unlevered basis.
Property-Level NOI, Property-Level Cash NOI, Property-Level Cash NOI - Estimated Run Rate, and Total Cash NOI - Estimated Run Rate are not measurements of financial performance under GAAP, and may not be comparable to similarly titled measures of other companies. You should not consider our measures as alternatives to net income or cash flows from operating activities determined in accordance with GAAP.
The following table sets forth a reconciliation of Property-Level NOI and Property-Level Cash NOI for the periods presented (in thousands):
|
|
|
|
|
|
|
|
|
|
|
|
|
Year Ended December 31, |
|
2023 |
|
2022 |
| Net income |
$ |
6,890 |
|
|
$ |
8,205 |
|
| General and administrative |
20,176 |
|
|
19,053 |
|
| Depreciation and amortization |
63,677 |
|
|
50,075 |
|
| Provisions for impairment |
7,083 |
|
|
1,114 |
|
| Transaction costs |
456 |
|
|
839 |
|
| Interest expense, net |
19,058 |
|
|
9,181 |
|
| Gain on sales of real estate, net |
(1,175) |
|
|
(4,148) |
|
| Income tax (benefit) expense |
(49) |
|
|
396 |
|
| Loss on debt extinguishment |
128 |
|
|
— |
|
| Interest income on mortgage loans receivable |
(7,388) |
|
|
(2,345) |
|
| Lease termination fees |
(550) |
|
|
— |
|
| Other income, net |
(752) |
|
|
(131) |
|
| Property-Level NOI |
107,554 |
|
|
82,239 |
|
| Straight-line rent adjustments |
(1,163) |
|
|
(1,286) |
|
| Amortization of lease-related intangibles |
(611) |
|
|
(889) |
|
| Property-Level Cash NOI |
$ |
105,780 |
|
|
$ |
80,064 |
|
The following table sets forth a reconciliation of Property-Level NOI, Property-Level Cash NOI, Property-Level Cash NOI - Estimated Run Rate, and Total Cash NOI - Estimated Run Rate for the period presented (in thousands):
|
|
|
|
|
|
|
Three Months Ended December 31, 2023 |
| Net income |
$ |
1,962 |
|
| General and administrative |
4,876 |
|
| Depreciation and amortization |
17,078 |
|
| Provisions for impairment |
2,709 |
|
| Transaction costs |
189 |
|
| Interest expense, net |
5,646 |
|
| Gain on sales of real estate, net |
(506) |
|
| Gain on forfeited earnest money deposit |
— |
|
| Income tax expense |
10 |
|
| Loss on debt extinguishment |
— |
|
| Interest income on mortgage loans receivable |
(2,243) |
|
| Lease termination fees |
— |
|
| Other income, net |
(166) |
|
| Property-Level NOI |
29,555 |
|
| Straight-line rent adjustments |
(456) |
|
| Amortization of lease-related intangibles |
(93) |
|
| Property-Level Cash NOI |
$ |
29,006 |
|
Adjustment for intraquarter acquisitions, dispositions and completed development (1) |
705 |
|
| Property-Level Cash NOI Estimated Run Rate |
$ |
29,711 |
|
| Interest income on mortgage loans receivable |
2,243 |
|
Adjustments for intraquarter mortgage loan activity (2) |
115 |
|
| Total Cash NOI - Estimated Run Rate |
$ |
32,069 |
|
(1) Adjustment assumes all re-leasing activity, investments in and dispositions of real estate, including developments completed during the year ended December 31, 2023 had occurred on January 1, 2023.
(2) Adjustment assumes all loan activity completed during the year ended December 31, 2023 had occurred on January 1, 2023.
Item 7A. Quantitative and Qualitative Disclosures About Market Risk
Our future income, cash flows and fair value relevant to our financial instruments depend upon prevailing market interest rates. Market risk refers to the risk of loss from adverse changes in market prices and interest rates. Based upon the nature of our operations, the principal market risk to which we are exposed is the risk related to interest rate fluctuations. As of December 31, 2023, we had total indebtedness of approximately $175.0 million under the 2027 Term Loan, $200.0 million under the 2028 Term Loan, $150.0 million under the 2029 Term Loan, and $80.0 million of borrowings under the Revolver, all of which are floating rate debt with a variable interest rate. For the years ended December 31, 2023 and 2022, we had average daily outstanding borrowings on our revolving credit facilities of $82.5 million and $109.5 million, respectively.
Effective through the maturity dates of January 15, 2027, February 11, 2028, and January 3, 2029, we entered into interest rate derivative contracts in order to hedge our market interest risk associated with the 2027 Term Loan, 2028 Term Loan, and 2029 Term Loan, respectively. The interest rate derivative contracts convert the variable rate debt on the term loans to a fixed interest rate (as further described in “Note 6 - Debt” in our consolidated financial statements).
Additionally, we will occasionally fund acquisitions through the use of our Revolver which bears an interest rate determined by either (i) SOFR, plus a SOFR adjustment of 0.10%, plus a margin ranging from 1.00% to 1.45%, based on our consolidated total leverage ratio, or (ii) a Base Rate (as defined in the New Credit Facility), plus a margin ranging from 0.00% to 0.45%, based on our consolidated total leverage ratio. Many factors, including governmental monetary and tax policies, domestic and international economic and political considerations, and other factors that are beyond our control contribute to our interest rate risk. Based on the results of our sensitivity analysis and daily outstanding borrowings on the Revolver during 2023, which assumes a 1% adverse change in the interest rate as of December 31, 2023, the estimated market risk exposure was approximately $0.8 million.
Item 8. Financial Statements and Supplementary Data
Report of Independent Registered Public Accounting Firm
To the Stockholders and the Board of Directors
NETSTREIT Corp.:
Opinion on Internal Control Over Financial Reporting
We have audited NETSTREIT Corp. and subsidiaries' (the Company) internal control over financial reporting as of December 31, 2023, based on criteria established in Internal Control – Integrated Framework (2013) issued by the Committee of Sponsoring Organizations of the Treadway Commission. In our opinion, the Company maintained, in all material respects, effective internal control over financial reporting as of December 31, 2023, based on criteria established in Internal Control – Integrated Framework (2013) issued by the Committee of Sponsoring Organizations of the Treadway Commission.
We also have audited, in accordance with the standards of the Public Company Accounting Oversight Board (United States) (PCAOB), the consolidated balance sheets of the Company as of December 31, 2023 and 2022, the related consolidated statements of operations and comprehensive income (loss), changes in equity, and cash flows for each of the years in the three-year period ended December 31, 2023, and the related notes and financial statement schedules III and IV (collectively, the consolidated financial statements), and our report dated February 14, 2024 expressed an unqualified opinion on those consolidated financial statements.
Basis for Opinion
The Company’s management is responsible for maintaining effective internal control over financial reporting and for its assessment of the effectiveness of internal control over financial reporting, included in the accompanying Management's Annual Report on Internal Control Over Financial Reporting. Our responsibility is to express an opinion on the Company’s internal control over financial reporting based on our audit. We are a public accounting firm registered with the PCAOB and are required to be independent with respect to the Company in accordance with the U.S. federal securities laws and the applicable rules and regulations of the Securities and Exchange Commission and the PCAOB.
We conducted our audit in accordance with the standards of the PCAOB. Those standards require that we plan and perform the audit to obtain reasonable assurance about whether effective internal control over financial reporting was maintained in all material respects. Our audit of internal control over financial reporting included obtaining an understanding of internal control over financial reporting, assessing the risk that a material weakness exists, and testing and evaluating the design and operating effectiveness of internal control based on the assessed risk. Our audit also included performing such other procedures as we considered necessary in the circumstances. We believe that our audit provides a reasonable basis for our opinion.
Definition and Limitations of Internal Control Over Financial Reporting
A company’s internal control over financial reporting is a process designed to provide reasonable assurance regarding the reliability of financial reporting and the preparation of financial statements for external purposes in accordance with generally accepted accounting principles. A company’s internal control over financial reporting includes those policies and procedures that (1) pertain to the maintenance of records that, in reasonable detail, accurately and fairly reflect the transactions and dispositions of the assets of the company; (2) provide reasonable assurance that transactions are recorded as necessary to permit preparation of financial statements in accordance with generally accepted accounting principles, and that receipts and expenditures of the company are being made only in accordance with authorizations of management and directors of the company; and (3) provide reasonable assurance regarding prevention or timely detection of unauthorized acquisition, use, or disposition of the company’s assets that could have a material effect on the financial statements.
Because of its inherent limitations, internal control over financial reporting may not prevent or detect misstatements. Also, projections of any evaluation of effectiveness to future periods are subject to the risk that controls may become inadequate because of changes in conditions, or that the degree of compliance with the policies or procedures may deteriorate.
/s/ KPMG LLP
Chicago, Illinois
February 14, 2024
Report of Independent Registered Public Accounting Firm
To the Stockholders and the Board of Directors
NETSTREIT Corp.:
Opinion on the Consolidated Financial Statements
We have audited the accompanying consolidated balance sheets of NETSTREIT Corp. and subsidiaries (the Company) as of December 31, 2023 and 2022, the related consolidated statements of operations and comprehensive income (loss), changes in equity, and cash flows for each of the years in the three-year period ended December 31, 2023, and the related notes and financial statement schedules III and IV (collectively, the consolidated financial statements). In our opinion, the consolidated financial statements present fairly, in all material respects, the financial position of the Company as of December 31, 2023 and 2022, and the results of its operations and its cash flows for each of the years in the three-year period ended December 31, 2023 in conformity with U.S. generally accepted accounting principles.
We also have audited, in accordance with the standards of the Public Company Accounting Oversight Board (United States) (PCAOB), the Company’s internal control over financial reporting as of December 31, 2023, based on criteria established in Internal Control – Integrated Framework (2013) issued by the Committee of Sponsoring Organizations of the Treadway Commission, and our report dated February 14, 2024 expressed an unqualified opinion on the effectiveness of the Company’s internal control over financial reporting.
Basis for Opinion
These consolidated financial statements are the responsibility of the Company’s management. Our responsibility is to express an opinion on these consolidated financial statements based on our audits. We are a public accounting firm registered with the PCAOB and are required to be independent with respect to the Company in accordance with the U.S. federal securities laws and the applicable rules and regulations of the Securities and Exchange Commission and the PCAOB.
We conducted our audits in accordance with the standards of the PCAOB. Those standards require that we plan and perform the audit to obtain reasonable assurance about whether the consolidated financial statements are free of material misstatement, whether due to error or fraud. Our audits included performing procedures to assess the risks of material misstatement of the consolidated financial statements, whether due to error or fraud, and performing procedures that respond to those risks. Such procedures included examining, on a test basis, evidence regarding the amounts and disclosures in the consolidated financial statements. Our audits also included evaluating the accounting principles used and significant estimates made by management, as well as evaluating the overall presentation of the consolidated financial statements. We believe that our audits provide a reasonable basis for our opinion.
Critical Audit Matters
The critical audit matters communicated below are matters arising from the current period audit of the consolidated financial statements that were communicated or required to be communicated to the audit committee and that: (1) relate to accounts or disclosures that are material to the consolidated financial statements and (2) involved our especially challenging, subjective, or complex judgments. The communication of critical audit matters does not alter in any way our opinion on the consolidated financial statements, taken as a whole, and we are not, by communicating the critical audit matters below, providing separate opinions on the critical audit matters or on the accounts or disclosures to which they relate.
Evaluation of indicators for potential impairment of long-lived asset groups
As discussed in Note 2 to the consolidated financial statements, the Company evaluates its long-lived asset groups for potential impairment whenever events or changes in circumstances indicate that the carrying amount of the asset group is no longer recoverable. As of December 31, 2023 the Company has $1,538.7 million of real estate held for investment, net. The evaluation of the indicators of potential impairment relies upon certain management assumptions, including the anticipated holding period for a real estate investment property.
We identified the evaluation of indicators for potential impairment of long-lived asset groups as a critical audit matter. Subjective and challenging auditor judgment was required to evaluate the reasonableness of the Company’s intent and ability to hold long-lived asset groups for particular periods of time. A shortening of the anticipated holding period could indicate a potential impairment.
The following are primary procedures we performed to address this critical audit matter. We evaluated the design and tested the operating effectiveness of certain internal control related the Company’s long-lived asset impairment process, including a control related to the identification of indicators of potential impairment. We inquired of and obtained representations from Company officials and inspected documents, such as meeting minutes of the investment committee and the board of trustees and its sub-committees, to evaluate the Company’s intent and ability to hold long-lived asset groups for particular periods of time. We read external communications with investors to identify information regarding potential sales of the Company’s long-lived asset groups.
Evaluation of the fair value of land and building in certain real estate asset acquisitions
As discussed in Notes 2 and 4 to the consolidated financial statements, the Company acquired real estate properties in asset acquisitions during 2023 for a total purchase price of $345.1 million, of which $71.6 million and $213.0 million were allocated to land and buildings, respectively. The purchase price of an asset acquisition is allocated to tangible and identifiable intangible assets or liabilities based on their relative fair values. In estimating fair values of land and building, the Company utilizes a number of sources, including real estate valuations prepared by an independent valuation firm.
We identified the evaluation of the fair value of land and building in certain real estate asset acquisitions as a critical audit matter. Subjective auditor judgment was required to evaluate the assumptions used in the Company’s estimates of fair value of land and building, including comparable land sales and estimated replacement cost of the building for certain real estate asset acquisitions.
The following are the primary procedures we performed to address this critical audit matter. We evaluated the design and tested the operating effectiveness of certain internal controls related to the Company’s asset acquisition valuation process, including controls related to the assumptions noted above. We involved valuation professionals with specialized skills and knowledge, who assisted in evaluating the relevance of the comparable land sales and replacement cost of the building used by the Company to estimate fair values, by comparing them to our independently developed ranges of comparable land sales and estimated replacement cost of the building for a selection of real estate asset acquisitions.
/s/ KPMG LLP
We have served as the Company’s auditor since 2019.
Chicago, Illinois
February 14, 2024
NETSTREIT CORP. AND SUBSIDIARIES
CONSOLIDATED BALANCE SHEETS
(in thousands, except share and per share data)
|
|
|
|
|
|
|
|
|
|
|
|
|
December 31, |
|
2023 |
|
2022 |
| Assets |
|
|
|
| Real estate, at cost: |
|
|
|
| Land |
$ |
460,896 |
|
|
$ |
401,146 |
|
| Buildings and improvements |
1,149,809 |
|
|
907,084 |
|
| Total real estate, at cost |
1,610,705 |
|
|
1,308,230 |
|
| Less accumulated depreciation |
(101,210) |
|
|
(62,526) |
|
| Property under development |
29,198 |
|
|
16,796 |
|
| Real estate held for investment, net |
1,538,693 |
|
|
1,262,500 |
|
| Assets held for sale |
52,451 |
|
|
23,208 |
|
| Mortgage loans receivable, net |
114,472 |
|
|
46,378 |
|
| Cash, cash equivalents and restricted cash |
29,929 |
|
|
70,543 |
|
| Lease intangible assets, net |
161,354 |
|
|
151,006 |
|
| Other assets, net |
49,337 |
|
|
52,057 |
|
| Total assets |
$ |
1,946,236 |
|
|
$ |
1,605,692 |
|
| Liabilities and equity |
|
|
|
| Liabilities: |
|
|
|
| Term loans, net |
$ |
521,912 |
|
|
$ |
373,296 |
|
| Revolving credit facility |
80,000 |
|
|
113,000 |
|
| Mortgage note payable, net |
7,883 |
|
|
7,896 |
|
| Lease intangible liabilities, net |
25,353 |
|
|
30,131 |
|
| Liabilities related to assets held for sale |
1,158 |
|
|
406 |
|
| Accounts payable, accrued expenses and other liabilities |
36,498 |
|
|
22,540 |
|
| Total liabilities |
672,804 |
|
|
547,269 |
|
| Commitments and contingencies |
|
|
|
| Equity: |
|
|
|
| Stockholders’ equity |
|
|
|
Common stock, $0.01 par value, 400,000,000 shares authorized; 73,207,080 and 58,031,879 shares issued and outstanding as of December 31, 2023 and 2022, respectively |
732 |
|
|
580 |
|
| Additional paid-in capital |
1,367,505 |
|
|
1,091,514 |
|
| Distributions in excess of retained earnings |
(112,276) |
|
|
(66,937) |
|
| Accumulated other comprehensive income |
8,943 |
|
|
23,673 |
|
| Total stockholders’ equity |
1,264,904 |
|
|
1,048,830 |
|
| Noncontrolling interests |
8,528 |
|
|
9,593 |
|
| Total equity |
1,273,432 |
|
|
1,058,423 |
|
| Total liabilities and equity |
$ |
1,946,236 |
|
|
$ |
1,605,692 |
|
The accompanying notes are an integral part of these consolidated financial statements.
NETSTREIT CORP. AND SUBSIDIARIES
CONSOLIDATED STATEMENTS OF OPERATIONS AND COMPREHENSIVE INCOME (LOSS)
(in thousands, except share and per share data)
|
|
|
|
|
|
|
|
|
|
|
|
|
|
|
Year Ended December 31, |
|
2023 |
|
2022 |
|
2021 |
| Revenues |
|
|
|
|
|
| Rental revenue (including reimbursable) |
$ |
123,967 |
|
|
$ |
93,934 |
|
|
$ |
59,140 |
|
| Interest income on loans receivable |
7,388 |
|
|
2,345 |
|
|
— |
|
| Other revenue |
550 |
|
|
— |
|
|
— |
|
| Total revenues |
131,905 |
|
|
96,279 |
|
|
59,140 |
|
| Operating expenses |
|
|
|
|
|
| Property |
16,413 |
|
|
11,695 |
|
|
5,803 |
|
| General and administrative |
20,176 |
|
|
19,053 |
|
|
14,810 |
|
| Depreciation and amortization |
63,677 |
|
|
50,075 |
|
|
30,807 |
|
| Provisions for impairment |
7,083 |
|
|
1,114 |
|
|
3,539 |
|
| Transaction costs |
456 |
|
|
839 |
|
|
700 |
|
| Total operating expenses |
107,805 |
|
|
82,776 |
|
|
55,659 |
|
| Other income (expense) |
|
|
|
|
|
| Interest expense, net |
(19,058) |
|
|
(9,181) |
|
|
(3,700) |
|
| Gain on sales of real estate, net |
1,175 |
|
|
4,148 |
|
|
2,997 |
|
|
|
|
|
|
|
| Loss on debt extinguishment |
(128) |
|
|
— |
|
|
— |
|
| Other income, net |
752 |
|
|
131 |
|
|
431 |
|
| Total other income (expense), net |
(17,259) |
|
|
(4,902) |
|
|
(272) |
|
| Net income before income taxes |
6,841 |
|
|
8,601 |
|
|
3,209 |
|
| Income tax benefit (expense) |
49 |
|
|
(396) |
|
|
(59) |
|
| Net income |
6,890 |
|
|
8,205 |
|
|
3,150 |
|
| Net income attributable to noncontrolling interests |
53 |
|
|
88 |
|
|
104 |
|
|
|
|
|
|
|
| Net income attributable to common stockholders |
$ |
6,837 |
|
|
$ |
8,117 |
|
|
$ |
3,046 |
|
| Amounts available to common stockholders per common share: |
|
|
|
|
|
| Basic |
$ |
0.11 |
|
|
$ |
0.16 |
|
|
$ |
0.08 |
|
| Diluted |
$ |
0.11 |
|
|
$ |
0.16 |
|
|
$ |
0.08 |
|
| Weighted average common shares: |
|
|
|
|
|
| Basic |
63,922,973 |
|
|
49,517,977 |
|
|
36,999,459 |
|
| Diluted |
64,665,439 |
|
|
50,431,822 |
|
|
38,672,565 |
|
| Other comprehensive income: |
|
|
|
|
|
| Net income |
$ |
6,890 |
|
|
$ |
8,205 |
|
|
$ |
3,150 |
|
| Change in value on derivatives, net |
(14,822) |
|
|
19,758 |
|
|
4,057 |
|
| Total comprehensive income (loss) |
$ |
(7,932) |
|
|
$ |
27,963 |
|
|
$ |
7,207 |
|
| Comprehensive income (loss) attributable to noncontrolling interests |
(39) |
|
|
296 |
|
|
273 |
|
| Comprehensive income (loss) attributable to common stockholders |
$ |
(7,893) |
|
|
$ |
27,667 |
|
|
$ |
6,934 |
|
The accompanying notes are an integral part of these consolidated financial statements.
NETSTREIT CORP. AND SUBSIDIARIES
CONSOLIDATED STATEMENTS OF CHANGES IN EQUITY
(in thousands, except share data)
|
|
|
|
|
|
|
|
|
|
|
|
|
|
|
|
|
|
|
|
|
|
|
|
|
|
|
|
|
|
|
|
|
|
|
|
|
|
|
|
|
|
|
|
|
|
|
|
|
|
|
|
|
Common stock |
|
|
|
|
|
|
|
|
|
|
|
|
|
|
Shares |
|
Par Value |
|
Additional
Paid-in Capital |
|
Distributions in Excess of Retained Earnings |
|
Accumulated Other Comprehensive Income |
|
Total Stockholders’ Equity |
|
Noncontrolling Interests |
|
Total Equity |
|
|
|
|
|
|
|
|
|
|
|
|
|
|
|
|
|
|
|
|
|
|
|
|
|
|
|
|
|
|
|
|
|
|
|
|
|
|
|
|
|
|
|
|
|
|
|
|
|
|
|
|
|
|
|
|
|
|
|
|
|
|
|
|
|
|
|
|
|
|
|
|
|
|
|
|
|
|
|
|
|
|
|
|
|
|
|
|
|
|
|
|
|
|
|
|
|
|
|
|
|
|
|
|
|
|
|
|
|
|
|
|
|
|
|
|
|
|
|
|
|
|
|
|
|
|
|
|
|
|
|
|
|
|
|
|
|
|
|
|
|
|
|
|
|
|
|
|
|
|
|
|
|
|
|
|
|
|
|
|
|
|
|
|
|
|
|
|
|
|
|
|
|
|
|
|
|
|
|
|
|
|
|
|
|
|
|
|
|
|
|
|
|
|
|
|
|
|
|
|
|
|
|
|
|
|
|
|
|
|
|
|
|
|
|
|
|
|
|
|
|
|
|
|
|
|
|
|
|
|
|
|
|
|
|
|
|
|
|
|
|
|
|
|
|
|
|
|
|
|
|
|
|
|
|
| Balance at December 31, 2020 |
|
28,203,545 |
|
|
$ |
282 |
|
|
$ |
501,045 |
|
|
$ |
(7,464) |
|
|
$ |
235 |
|
|
$ |
494,098 |
|
|
$ |
33,975 |
|
|
$ |
528,073 |
|
| Issuance of common stock in public offerings, net of issuance costs |
|
14,768,124 |
|
|
148 |
|
|
282,997 |
|
|
— |
|
|
— |
|
|
283,145 |
|
|
— |
|
|
283,145 |
|
| OP Units converted to common stock |
|
1,189,098 |
|
|
12 |
|
|
22,482 |
|
|
— |
|
|
— |
|
|
22,494 |
|
|
(22,494) |
|
|
— |
|
| Dividends and distributions declared on common stock and OP Units |
|
— |
|
|
— |
|
|
— |
|
|
(30,195) |
|
|
— |
|
|
(30,195) |
|
|
(1,109) |
|
|
(31,304) |
|
| Dividends declared on restricted stock |
|
— |
|
|
— |
|
|
— |
|
|
(513) |
|
|
— |
|
|
(513) |
|
|
— |
|
|
(513) |
|
| Vesting of restricted stock units |
|
84,790 |
|
|
— |
|
|
— |
|
|
— |
|
|
— |
|
|
— |
|
|
— |
|
|
— |
|
| Repurchase of common stock for tax withholding obligations |
|
(22,507) |
|
|
— |
|
|
(504) |
|
|
— |
|
|
— |
|
|
(504) |
|
|
— |
|
|
(504) |
|
| Stock-based compensation, net |
|
— |
|
|
— |
|
|
3,704 |
|
|
7 |
|
|
— |
|
|
3,711 |
|
|
— |
|
|
3,711 |
|
| Other comprehensive income |
|
— |
|
|
— |
|
|
— |
|
|
— |
|
|
3,888 |
|
|
3,888 |
|
|
169 |
|
|
4,057 |
|
| Net income |
|
— |
|
|
— |
|
|
— |
|
|
3,046 |
|
|
— |
|
|
3,046 |
|
|
104 |
|
|
3,150 |
|
| Balance at December 31, 2021 |
|
44,223,050 |
|
|
$ |
442 |
|
|
$ |
809,724 |
|
|
$ |
(35,119) |
|
|
$ |
4,123 |
|
|
$ |
779,170 |
|
|
$ |
10,645 |
|
|
$ |
789,815 |
|
| Issuance of common stock in public offerings, net of issuance costs |
|
13,600,004 |
|
|
135 |
|
|
296,027 |
|
|
— |
|
|
— |
|
|
296,162 |
|
|
— |
|
|
296,162 |
|
| Offering and related costs of common stock |
|
— |
|
|
— |
|
|
(18,444) |
|
|
— |
|
|
— |
|
|
(18,444) |
|
|
— |
|
|
(18,444) |
|
| OP Units converted to common stock |
|
49,317 |
|
|
— |
|
|
929 |
|
|
— |
|
|
— |
|
|
929 |
|
|
(929) |
|
|
— |
|
| Dividends and distributions declared on common stock and OP Units |
|
— |
|
|
— |
|
|
— |
|
|
(39,533) |
|
|
— |
|
|
(39,533) |
|
|
(419) |
|
|
(39,952) |
|
| Dividends declared on restricted stock |
|
— |
|
|
— |
|
|
— |
|
|
(522) |
|
|
— |
|
|
(522) |
|
|
— |
|
|
(522) |
|
| Vesting of restricted stock units |
|
234,108 |
|
|
3 |
|
|
(3) |
|
|
— |
|
|
— |
|
|
— |
|
|
— |
|
|
— |
|
| Repurchase of common stock for tax withholding obligations |
|
(74,600) |
|
|
— |
|
|
(1,477) |
|
|
— |
|
|
— |
|
|
(1,477) |
|
|
— |
|
|
(1,477) |
|
| Stock-based compensation, net |
|
— |
|
|
— |
|
|
4,758 |
|
|
120 |
|
|
— |
|
|
4,878 |
|
|
— |
|
|
4,878 |
|
| Other comprehensive income |
|
— |
|
|
— |
|
|
— |
|
|
— |
|
|
19,550 |
|
|
19,550 |
|
|
208 |
|
|
19,758 |
|
| Net income |
|
— |
|
|
— |
|
|
— |
|
|
8,117 |
|
|
— |
|
|
8,117 |
|
|
88 |
|
|
8,205 |
|
| Balance at December 31, 2022 |
|
58,031,879 |
|
|
$ |
580 |
|
|
$ |
1,091,514 |
|
|
$ |
(66,937) |
|
|
$ |
23,673 |
|
|
$ |
1,048,830 |
|
|
$ |
9,593 |
|
|
$ |
1,058,423 |
|
| Issuance of common stock in public offerings, net of issuance costs |
|
15,038,397 |
|
|
151 |
|
|
280,757 |
|
|
— |
|
|
— |
|
|
280,908 |
|
|
— |
|
|
280,908 |
|
| Offering and related costs of common stock |
|
— |
|
|
— |
|
|
(9,519) |
|
|
— |
|
|
— |
|
|
(9,519) |
|
|
— |
|
|
(9,519) |
|
| OP Units converted to common stock |
|
34,169 |
|
|
— |
|
|
619 |
|
|
— |
|
|
— |
|
|
619 |
|
|
(619) |
|
|
— |
|
| Dividends and distributions declared on common stock and OP Units |
|
— |
|
|
— |
|
|
— |
|
|
(51,675) |
|
|
— |
|
|
(51,675) |
|
|
(407) |
|
|
(52,082) |
|
| Dividends declared on restricted stock |
|
— |
|
|
— |
|
|
— |
|
|
(503) |
|
|
— |
|
|
(503) |
|
|
— |
|
|
(503) |
|
| Vesting of restricted stock units |
|
139,527 |
|
|
1 |
|
|
(1) |
|
|
— |
|
|
— |
|
|
— |
|
|
— |
|
|
— |
|
| Repurchase of common stock for tax withholding obligations |
|
(36,892) |
|
|
— |
|
|
(688) |
|
|
— |
|
|
— |
|
|
(688) |
|
|
— |
|
|
(688) |
|
| Stock-based compensation, net |
|
— |
|
|
— |
|
|
4,823 |
|
|
2 |
|
|
— |
|
|
4,825 |
|
|
— |
|
|
4,825 |
|
| Other comprehensive loss |
|
— |
|
|
— |
|
|
— |
|
|
— |
|
|
(14,730) |
|
|
(14,730) |
|
|
(92) |
|
|
(14,822) |
|
| Net income |
|
— |
|
|
— |
|
|
— |
|
|
6,837 |
|
|
— |
|
|
6,837 |
|
|
53 |
|
|
6,890 |
|
| Balance at December 31, 2023 |
|
73,207,080 |
|
|
$ |
732 |
|
|
$ |
1,367,505 |
|
|
$ |
(112,276) |
|
|
$ |
8,943 |
|
|
$ |
1,264,904 |
|
|
$ |
8,528 |
|
|
$ |
1,273,432 |
|
The accompanying notes are an integral part of these consolidated financial statements.
NETSTREIT CORP. AND SUBSIDIARIES
CONSOLIDATED STATEMENTS OF CASH FLOWS
(in thousands)
|
|
|
|
|
|
|
|
|
|
|
|
|
|
|
|
|
|
|
|
|
|
|
Year Ended December 31, |
|
|
2023 |
|
2022 |
|
2021 |
| Cash flows from operating activities |
|
|
|
|
|
|
| Net income |
|
$ |
6,890 |
|
|
$ |
8,205 |
|
|
$ |
3,150 |
|
| Adjustments to reconcile net income to net cash provided by operating activities: |
|
|
|
|
|
|
| Depreciation and amortization |
|
63,677 |
|
|
50,075 |
|
|
30,807 |
|
| Amortization of deferred financing costs |
|
1,730 |
|
|
862 |
|
|
627 |
|
| Amortization of above/below-market assumed debt |
|
114 |
|
|
29 |
|
|
— |
|
| Noncash revenue adjustments |
|
(1,632) |
|
|
(2,466) |
|
|
(1,769) |
|
| Amortization of deferred gains on interest rate swaps |
|
(2,124) |
|
|
— |
|
|
— |
|
| Stock-based compensation expense |
|
4,823 |
|
|
4,758 |
|
|
3,704 |
|
| Gain on sales of real estate, net |
|
(1,175) |
|
|
(4,148) |
|
|
(2,997) |
|
| Provisions for impairment |
|
7,083 |
|
|
1,114 |
|
|
3,539 |
|
| Loss on debt extinguishment |
|
128 |
|
|
— |
|
|
— |
|
| Gain on involuntary conversion of building and improvements |
|
(78) |
|
|
(126) |
|
|
(438) |
|
| Changes in assets and liabilities, net of assets acquired and liabilities assumed: |
|
|
|
|
|
|
| Other assets, net |
|
(1,237) |
|
|
(6,193) |
|
|
(1,061) |
|
| Accounts payable, accrued expenses and other liabilities |
|
3,696 |
|
|
1,215 |
|
|
1,737 |
|
|
|
|
|
|
|
|
| Lease incentive payments |
|
(1,740) |
|
|
(2,678) |
|
|
(5,821) |
|
| Net cash provided by operating activities |
|
80,155 |
|
|
50,647 |
|
|
31,478 |
|
| Cash flows from investing activities |
|
|
|
|
|
|
| Acquisitions of real estate |
|
(340,451) |
|
|
(424,794) |
|
|
(441,328) |
|
| Real estate development and improvements |
|
(78,798) |
|
|
(22,402) |
|
|
(19,896) |
|
| Investment in mortgage loans receivable |
|
(72,429) |
|
|
(46,466) |
|
|
— |
|
| Principal collections on mortgage loans receivable |
|
1,482 |
|
|
— |
|
|
— |
|
| Earnest money deposits |
|
(265) |
|
|
868 |
|
|
(219) |
|
| Purchase of computer equipment and other corporate assets |
|
(35) |
|
|
(1,208) |
|
|
(732) |
|
| Proceeds from sale of real estate |
|
38,465 |
|
|
25,515 |
|
|
31,119 |
|
| Proceeds from the settlement of property-related insurance claims |
|
78 |
|
|
126 |
|
|
928 |
|
| Net cash used in investing activities |
|
(451,953) |
|
|
(468,361) |
|
|
(430,128) |
|
| Cash flows from financing activities |
|
|
|
|
|
|
| Issuance of common stock in public offerings, net |
|
271,389 |
|
|
277,718 |
|
|
283,145 |
|
| Payment of common stock dividends |
|
(51,675) |
|
|
(39,533) |
|
|
(30,195) |
|
| Payment of OP unit distributions |
|
(407) |
|
|
(419) |
|
|
(1,109) |
|
| Payment of restricted stock dividends |
|
(148) |
|
|
(339) |
|
|
(34) |
|
| Principal payments on mortgages payable |
|
(138) |
|
|
(48) |
|
|
— |
|
| Proceeds under revolving credit facilities |
|
361,000 |
|
|
515,000 |
|
|
150,000 |
|
| Repayments under revolving credit facilities |
|
(394,000) |
|
|
(466,000) |
|
|
(86,000) |
|
| Proceeds from term loans |
|
150,000 |
|
|
200,000 |
|
|
— |
|
| Proceeds under property development incentives |
|
— |
|
|
755 |
|
|
— |
|
| Repurchase of common stock for tax withholding obligations |
|
(688) |
|
|
(1,478) |
|
|
(504) |
|
| Payment of deferred offering costs |
|
(878) |
|
|
(1,220) |
|
|
(1,693) |
|
| Payment of deferred financing costs |
|
(3,271) |
|
|
(3,782) |
|
|
— |
|
| Net cash provided by financing activities |
|
331,184 |
|
|
480,654 |
|
|
313,610 |
|
| Net change in cash, cash equivalents and restricted cash |
|
(40,614) |
|
|
62,940 |
|
|
(85,040) |
|
| Cash, cash equivalents and restricted cash at beginning of the period |
|
70,543 |
|
|
7,603 |
|
|
92,643 |
|
| Cash, cash equivalents and restricted cash at end of the period |
|
$ |
29,929 |
|
|
$ |
70,543 |
|
|
$ |
7,603 |
|
|
|
|
|
|
|
|
| Supplemental disclosures of cash flow information: |
|
|
|
|
|
|
| Cash paid for interest, net of amounts capitalized |
|
$ |
18,336 |
|
|
$ |
7,218 |
|
|
$ |
2,993 |
|
| Cash paid for income taxes |
|
$ |
628 |
|
|
$ |
129 |
|
|
$ |
— |
|
| Supplemental disclosures of non-cash investing and financing activities: |
|
|
|
|
|
|
| Dividends declared and unpaid on restricted stock |
|
$ |
501 |
|
|
$ |
403 |
|
|
$ |
506 |
|
| Deferred offering costs included in accounts payable, accrued expenses and other liabilities |
|
$ |
7 |
|
|
$ |
— |
|
|
$ |
— |
|
| Cash flow hedge change in fair value |
|
$ |
12,698 |
|
|
$ |
19,758 |
|
|
$ |
4,057 |
|
| Mortgage loan receivable settled in exchange for acquisition of real estate |
|
$ |
4,673 |
|
|
$ |
— |
|
|
$ |
— |
|
| Increase in mortgage loan receivable in exchange for disposition of real estate |
|
$ |
1,837 |
|
|
$ |
— |
|
|
$ |
— |
|
| Refinancing of mortgage loan receivable |
|
$ |
1,327 |
|
|
$ |
— |
|
|
$ |
— |
|
| Accrued capital expenditures and real estate development and improvement costs |
|
$ |
5,686 |
|
|
$ |
2,473 |
|
|
$ |
2,962 |
|
|
|
|
|
|
|
|
| Mortgage note assumed at fair value |
|
$ |
— |
|
|
$ |
7,913 |
|
|
$ |
— |
|
| Involuntary conversion of building and improvements and change in related insurance proceeds receivable |
|
$ |
— |
|
|
$ |
— |
|
|
$ |
490 |
|
Operating lease right-of-use asset and liability added for corporate office, excluding $0.9 million non-cash lease incentive received |
|
$ |
— |
|
|
$ |
— |
|
|
$ |
4,493 |
|
The accompanying notes are an integral part of these consolidated financial statements.
NETSTREIT CORP. AND SUBSIDIARIES
NOTES TO CONSOLIDATED FINANCIAL STATEMENTS
Note 1 – Organization and Description of Business
NETSTREIT Corp. (the “Company”) was incorporated on October 11, 2019 as a Maryland corporation and commenced operations on December 23, 2019. The Company conducts its operations through NETSTREIT, L.P., a Delaware limited partnership (the “Operating Partnership”). NETSTREIT GP, LLC, a Delaware limited liability company and a wholly owned subsidiary of the Company, is the sole general partner of the Operating Partnership.
The Company elected to be treated and to qualify as a real estate investment trust (“REIT”) for U.S. federal income tax purposes beginning with its short taxable year ended December 31, 2019. Additionally, the Operating Partnership formed NETSTREIT Management TRS, LLC (“NETSTREIT TRS”), which together with the Company jointly elected to be treated as a taxable REIT subsidiary under Section 856(a) of the Internal Revenue Code of 1986, as amended, (the “Code”) for U.S. federal income tax purposes.
The Company is structured as an umbrella partnership real estate investment trust (commonly referred to as an “UPREIT”) and is an internally managed real estate company that acquires, owns, invests in and manages a diversified portfolio of single-tenant, retail commercial real estate leased on a long-term basis to high credit quality tenants across the United States. As of December 31, 2023, the Company owned or had investments in 598 properties, located in 45 states, excluding 24 property developments where rent has yet to commence.
Note 2 – Summary of Significant Accounting Policies
Basis of Presentation
The consolidated financial statements have been prepared in accordance with U.S. generally accepted accounting principles (“GAAP”) and the rules and regulations of the U.S. Securities and Exchange Commission (“SEC”). The consolidated financial statements include the accounts of the Company and subsidiaries in which the Company has a controlling financial interest. All intercompany accounts and transactions have been eliminated in consolidation and the Company’s net income is reduced by the portion of net income attributable to noncontrolling interests.
Noncontrolling Interests
The Company presents noncontrolling interests, which represent limited partnership units in the Operating Partnership (the “OP Units”) not owned by the Company, as a component of permanent equity, separate from the Company's stockholders’ equity. Noncontrolling interests were created as part of an asset acquisition and recognized at fair value as of the date of the transaction. Effective with the Company’s initial public offering, each limited partner of the Operating Partnership has the right to require the Operating Partnership to redeem part or all of its OP Units for cash, based upon the value of an equivalent number of shares of the Company’s common stock at the time of the redemption, or, at the Company’s election, shares of the Company’s common stock on a one-for-one basis, subject to certain adjustments and the restrictions on ownership and transfer of the Company’s common stock. The election to pay cash or issue common stock is solely within the control of the Company to satisfy a noncontrolling interest holder's redemption request.
Net income of the Operating Partnership is allocated to its noncontrolling interests based on the noncontrolling interests’ ownership percentages in the Operating Partnership throughout the period. Ownership percentage is calculated by dividing the number of OP Units held by the noncontrolling interests by the total OP Units outstanding.
Use of Estimates
The preparation of the consolidated financial statements in conformity with GAAP requires management to make estimates and assumptions that affect the reported amounts of assets and liabilities and disclosure of contingent assets and liabilities at the date of the consolidated financial statements and the reported amounts of revenues and expenses during the reporting period. Actual results could differ from those estimates. The Company’s most significant assumptions and estimates relate to the useful lives of real estate assets, lease accounting, real estate impairment assessments, and allocation of fair value of purchase consideration. These estimates are based on historical experience and other assumptions which management believes are reasonable under the circumstances. The Company evaluates its estimates on an ongoing basis and makes revisions to these estimates and related disclosures as experience develops or new information becomes known. Actual results could differ from those estimates.
Real Estate Held for Investment
Real estate is recorded and stated at cost less any provision for impairment. At acquisition date, the purchase price of an acquired property is allocated to tangible and identifiable intangible assets or liabilities based on their relative fair values. For properties developed by the Company, all direct and indirect costs related to planning, development and construction, including interest, real estate taxes and other miscellaneous costs incurred during the construction period, are capitalized for financial reporting purposes and recorded as property under development until construction has been completed.
The Company evaluates each acquisition transaction to determine whether the acquired asset meets the definition of a business and therefore accounted for as a business combination or if the acquisition transaction should be accounted for as an asset acquisition. Under Accounting Standards Update (“ASU”) 2017-01, “Business Combinations (Topic 805): Clarifying the Definition of a Business” (“ASU 2017-01”), an acquisition does not qualify as a business when substantially all of the fair value is concentrated in a single identifiable asset or group of similar identifiable assets or the acquisition does not include a substantive process in the form of an acquired workforce or an acquired contract that cannot be replaced without significant cost, effort or delay. Transaction costs related to acquisitions that qualify as asset acquisitions are capitalized as part of the cost basis of the acquired assets, while transaction costs for acquisitions that are deemed to be acquisitions of a business are expensed as incurred.
The Company allocates the purchase price of acquired properties accounted for as asset acquisitions to tangible and identifiable intangible assets or liabilities based on their relative fair values. Tangible assets may include land, buildings, site improvements and tenant improvements. Intangible assets include the value of in-place leases and above-market leases and intangible liabilities include below-market leases. The fair value of the tangible assets of an acquired property with an in-place operating lease is determined by valuing the property as if it were vacant, and the “as-if-vacant” value is then allocated to the tangible assets based on the fair value of the tangible assets. The fair value of in-place leases is determined by considering estimates of carrying costs during the expected lease-up periods, current market conditions, as well as costs to execute similar leases based on the specific characteristics of each tenant’s lease. The Company estimates the cost to execute leases with terms similar to the remaining lease terms of the in-place leases, including leasing commissions, legal and other related expenses. The fair value of above-market or below-market leases is recorded based on the net present value (using a discount rate that reflects the risks associated with the leases acquired) of the difference between the contractual amount to be paid pursuant to the in-place lease and the Company’s estimate of the fair market lease rate for the corresponding in-place lease, measured over the remaining non-cancelable term of the lease including any below-market fixed rate renewal options for below-market leases. In making estimates of fair values for purposes of allocating purchase price, the Company utilizes a number of sources, including real estate valuations prepared by an independent valuation firm. The Company also considers information and other factors including market conditions, the industry that the tenant operates in, characteristics of the real estate; e.g., location, size, demographics, value and comparative rental rates; tenant credit profile and the importance of the location of the real estate to the operations of the tenant’s business. Additionally, the Company considers information obtained about each property as a result of its pre-acquisition due diligence, marketing and leasing activities in estimating the fair value of the tangible and intangible assets and liabilities acquired. Based on these inputs for measuring and allocating the fair value of real estate acquisitions, the Company utilizes both observable market data (categorized as level 2 on the three-level valuation hierarchy of Accounting Standards Codification (“ASC”) Topic 820, Fair Value Measurement), and unobservable inputs that reflect the Company’s own internal assumptions (categorized as level 3 under ASC Topic 820).
Depreciation and Amortization
Depreciation and amortization are computed using the straight-line method over the estimated useful lives of the assets:
|
|
|
|
|
|
| Buildings |
13 – 35 years |
| Building improvements |
15 years |
| Tenant improvements |
Shorter of the term of the related lease or useful life |
| Acquired in-place leases or leasing commissions |
Remaining terms of the respective leases |
| Assembled workforce |
3 years |
| Computer equipment and other corporate assets |
3 – 5 years |
Depreciation and amortization amounts for the years ended December 31, 2023, 2022, and 2021 are as follows (in thousands):
|
|
|
|
|
|
|
|
|
|
|
|
|
|
|
|
|
|
|
|
|
|
|
Year Ended December 31, |
|
|
2023 |
|
2022 |
|
2021 |
| Depreciation on real estate held for investment and computer equipment and other corporate assets |
|
$ |
44,402 |
|
|
$ |
33,883 |
|
|
$ |
21,073 |
|
| Amortization on acquired in-place lease and assembled workforce intangible assets and leasing commission costs |
|
19,275 |
|
|
16,192 |
|
|
9,734 |
|
| Total depreciation and amortization expense |
|
$ |
63,677 |
|
|
$ |
50,075 |
|
|
$ |
30,807 |
|
Repairs and maintenance are charged to operations as incurred; major renewals and betterments that extend the useful life or improve the operating capacity of the asset are capitalized. Upon the sale or disposition of a property, the asset and the related accumulated depreciation and amortization are removed from the consolidated balance sheets with the difference between the proceeds received, net of sales costs, and the carrying value of the asset group recorded as a gain or loss on sale, subject to impairment considerations.
Assets Held for Sale
The Company is continually evaluating the portfolio of real estate assets and may elect to dispose of assets considering criteria including, but not limited to, tenant concentration, tenant credit quality, unit financial performance, local market conditions and lease rates, asset location and tenant operation type (e.g., tenant or retail sector). Real estate assets held for sale are expected to be sold within twelve months. Properties classified as held for sale, including the related intangibles, in the consolidated balance sheets include only those properties available for immediate sale in their present condition, which are actively being marketed, and for which management believes that it is probable that a sale of the property will be completed within one year. Properties held for sale are carried at the lower of cost or fair value, less estimated selling costs. No depreciation expense or amortization expense is recognized on properties held for sale and the related intangible assets or liabilities once they have been classified as such. Only disposals representing a strategic shift in operations are presented as discontinued operations. Accordingly, the Company has not reclassified results of operations for properties disposed during the years ended December 31, 2023, 2022, and 2021 or held for sale as discontinued operations as of December 31, 2023 or December 31, 2022, as these events are a normal part of the Company’s operations and do not represent strategic shifts in the Company’s operations. As of December 31, 2023 and December 31, 2022, there were 23 and 11 properties, respectively, classified as held for sale.
Impairment of Long-Lived Assets
Fair value measurement of an asset group occurs when events or changes in circumstances related to an asset indicate that the carrying amount of the asset is no longer recoverable. An example of an event or changed circumstance is a reduction in the expected holding period of a property. If indicators are present, the Company will prepare a projection of the undiscounted future cash flows of the property, excluding interest charges, and determine if the carrying amount of the asset group is recoverable. When a carrying amount is not recoverable, an impairment loss is recognized to the extent that the carrying amount of the asset group exceeds its fair market value. The Company estimates fair value using data such as operating income, estimated capitalization rates or multiples, leasing prospects, local market information, and with regard to assets held for sale, based on the estimated or negotiated selling price, less estimated costs of disposal. Based on these unobservable inputs, the Company determined that its valuations of impaired real estate and intangible assets fall within Level 2 and Level 3 of the fair value hierarchy under ASC Topic 820.
The following table summarizes the provision for impairment during the periods indicated below (in thousands):
|
|
|
|
|
|
|
|
|
|
|
|
|
|
|
|
|
|
|
|
|
|
|
Year Ended December 31, |
|
|
2023 |
|
2022 |
|
2021 |
| Total provision for impairment |
|
$ |
7,083 |
|
|
$ |
1,114 |
|
|
$ |
3,539 |
|
Number of properties: (1) |
|
|
|
|
|
|
| Classified as held for sale |
|
14 |
|
|
— |
|
|
— |
|
| Disposed within the period |
|
4 |
|
1 |
|
3 |
|
(1) Includes the number of properties that were either (i) impaired during the period on the held for sale classification date and remained as held for sale as of period-end or (ii) impaired and disposed of during the respective period. Excludes properties that did not have impairment recorded during the year. Of the total provision for impairment during the year ended December 31, 2023, the Company recorded $0.2 million of additional impairment expense on two properties that were classified as held for sale in prior periods and $1.9 million of impairment expense on three properties held for investment.
Cash, Cash Equivalents and Restricted Cash
The Company considers all cash balances, money market accounts and highly liquid investments with original maturities of three months or less to be cash and cash equivalents. Restricted cash includes cash restricted for property tenant improvements and cash proceeds from the sale of assets held by qualified intermediaries in anticipation of the acquisition of replacement properties in tax-free exchanges under Section 1031 of the Code. Restricted cash is included in cash, cash equivalents, and restricted cash in the consolidated balance sheets. The Company had $11.5 million of restricted cash as of December 31, 2023, and $4.7 million of restricted cash as of December 31, 2022.
The Company’s bank balances as of December 31, 2023 and 2022 included certain amounts over the Federal Deposit Insurance Corporation limits.
Revenue Recognition and Related Matters
The Company’s rental revenue is primarily related to rent received from tenants under leases accounted for as operating leases. Rent from leases that have fixed and determinable rent increases is recognized on a straight-line basis over the non-cancellable initial term of the lease and reasonably certain renewal periods, from the later of the date of the commencement of the lease or the date of acquisition of the property subject to the lease. The difference between rental revenue recognized and the cash rent due under the provisions of the lease is recorded as deferred rent receivable and included as a component of other assets in the consolidated balance sheets.
Variable lease revenues include tenant reimbursements, lease termination fees, changes in the index or market-based indices after the inception of the lease or percentage rents. Variable lease revenues are not recognized until the specific events that trigger the variable payments have occurred. The Company recognized variable lease revenue related to tenant reimbursements and lease termination fees for the periods presented.
Capitalized above-market and below-market lease values are amortized on a straight-line basis as a reduction or increase of rental revenue as appropriate over the remaining non-cancellable terms of the respective leases.
Reserves for uncollectible amounts are provided against the portion of accounts receivable, net including straight-line rents, which is estimated to be uncollectible, which includes a portfolio-based reserve and reserves for specifically disputed amounts. Such reserves are reviewed each period based upon recovery experience and the specific facts of each outstanding amount. As of December 31, 2023 and December 31, 2022, the Company had an immaterial reserve for uncollectible amounts specific to uncharged reimbursable expenses.
Mortgage Loans Receivable
The Company holds loans receivable, which are mortgage loans secured by real estate, for short and long-term investment. Loans receivable are carried at amortized cost. As of the year ended December 31, 2023, the Company held eight senior secured first-lien mortgage loans receivable.
The Company recognizes interest income on loans receivable using the effective-interest method. Direct costs associated with originating loans, along with any premium or discount, is deferred and amortized as an adjustment to interest income over the term of the related loan receivable using the effective interest method. The Company evaluates its loan receivable balances, including accrued interest, for potential credit losses by analyzing the credit of the borrower, the remaining time to maturity of the loan, collateral value and quality (if any), and other relevant factors. A loan receivable is placed on nonaccrual status when management determines that full recovery of the contractually specified payments of principal and interest is doubtful.
Stock-Based Compensation
The Company has a share-based compensation award program for its employees and directors. Stock-based compensation expense associated with these awards is recognized in general and administrative expenses in the consolidated statements of operations and comprehensive income (loss). The Company classifies stock-based payment awards either as equity awards or liability awards based upon an analysis of ASC 718 and ASC 480. Equity classified awards are measured based on the fair value on the date of grant. Liability classified awards are remeasured to fair value each reporting period. Stock-based compensation expense is recognized over the requisite service or performance period. The Company recognizes forfeitures as they occur.
Forward Equity Sales
The Company sells shares of common stock through forward sale agreements from time to time to enable the Company to set the price of such shares upon pricing the offering (subject to certain adjustments), while delaying the issuance of such shares and the receipt of the net proceeds by the Company.
To account for the forward sale agreements, the Company considers the accounting guidance governing financial instruments and derivatives. To date, the Company has concluded that its forward sale agreements are not liabilities as they do not embody obligations to repurchase its shares nor do they embody obligations to issue a variable number of shares for which the monetary value are predominantly fixed, varying with something other than the fair value of the shares, or varying inversely in relation to its shares. The Company then evaluates whether the agreements meet the derivatives and hedging guidance scope exception to be accounted for as equity instruments. The Company has concluded that the agreements are classifiable as equity contracts based on the following assessments: (i) none of the agreements’ exercise contingencies are based on observable markets or indices besides those related to the market for the Company’s own stock price and operations; and (ii) none of the settlement provisions precluded the agreements from being indexed to its own stock.
The Company also considers the potential dilution resulting from the forward sale agreements on the earnings per share calculations. Prior to settlement, a forward sale agreement will be reflected in the diluted earnings per share calculations using the treasury stock method. Under this method, the number of shares of the Company’s common stock used in diluted earnings per share is deemed to be increased by the excess, if any, of the number of shares of the Company’s common stock that would be issued upon full physical settlement of such forward sale agreement over the number of shares of the Company’s common stock that could be purchased by the Company in the market (based on the average market price during the period) using the proceeds receivable upon full physical settlement (based on the adjusted forward sale price at the end of the reporting period). Consequently, prior to settlement of a forward sale agreement, there will be no dilutive effect on the Company’s earnings per share except during periods when the average market price of the Company’s common stock is above the adjusted forward sale price. However, upon settlement of a forward sales agreement, if the Company’s elects to physically settle or net share settle such forward sale agreement, delivery of the Company’s shares will result in dilution to the Company’s earnings per share.
Transaction Costs
Transaction costs represent non-capitalizable acquisition related expenses and costs associated with abandoned acquisitions. Acquisition and dead deal related expenses were $0.5 million, $0.8 million, and $0.7 million for the years ended December 31, 2023, 2022, and 2021, respectively.
Income Taxes
The Company elected to be treated and qualify as a REIT for U.S. federal income tax purposes beginning with its short taxable year ended December 31, 2019. To qualify as a REIT, the Company must meet certain organizational, income, asset and distribution tests. Accordingly, the Company will generally not be subject to corporate U.S. federal or state income tax to the extent that it makes qualifying distributions of all of its taxable income to its stockholders and provided it satisfies on a continuing basis, through actual investment and operating results, the REIT requirements, including certain asset, income, distribution and share ownership tests. The Company expects the distributions made during 2023 are sufficient to receive a full dividends paid deduction.
NETSTREIT TRS is treated as a taxable REIT subsidiary which may be subject to U.S. federal, state, and local income taxes on its taxable income. In general, NETSTREIT TRS may perform services for tenants of the Company, hold assets that the Company cannot hold directly and may engage in any real estate or non-real estate-related business.
The Company recognizes franchise and other state and local tax expenses in general and administrative and recognizes state and federal income tax in income tax benefit (expense) in the accompanying consolidated statements of operations and comprehensive income (loss).
All provisions for federal income taxes in the accompanying consolidated financial statements are attributable to NETSTREIT TRS. Deferred income tax expense and its related deferred tax assets and liabilities were immaterial for the years presented.
The Company has elected to record related interest and penalties, if any, as general and administrative expense or as income tax expense based on the nature of the tax in the consolidated statements of operations and comprehensive income (loss). The Company had no material interest or penalties relating to income, franchise, and other state and local taxes for the years presented. Additionally, there were no material accruals for interest or penalties as of December 31, 2023 and 2022.
The Company files federal, state and local income tax returns. The Company regularly analyzes its various federal and state filing positions and only recognizes the income tax effect in its financial statements when certain criteria regarding uncertain income tax positions have been met. The Company believes that its income tax positions would more likely than not be sustained upon examination by all relevant taxing authorities. Therefore, no provisions for uncertain income tax positions have been recorded in the consolidated financial statements.
All federal tax returns for years prior to 2020 are no longer subject to examination. Additionally, state tax returns for years prior to 2018 are generally no longer subject to examination.
Earnings Per Share
Earnings per common share has been computed pursuant to the guidance in FASB ASC Topic 260, Earnings per Share. Basic earnings per share (“EPS”) is computed by dividing net income allocated to common stockholders by the weighted-average number of common shares outstanding for the reporting period. Diluted EPS reflects the potential dilution that could occur if securities or other contracts to issue common stock were exercised or converted into common stock. No effect is shown for any securities that are anti-dilutive. Net income allocated to common stockholders represents net income less income allocated to participating securities and noncontrolling interests. None of the Company’s equity awards are participating securities.
Fair Value Measurement
Fair value measurements are utilized in the accounting of the Company’s assets acquired and liabilities assumed in an asset acquisition and also affect the Company’s accounting for certain of its financial assets and liabilities. Fair value is defined as the price that would be received to sell an asset or paid to transfer a liability in an orderly transaction between market participants at the measurement date (an exit price). The hierarchy described below prioritizes inputs to the valuation techniques used in measuring the fair value of assets and liabilities. This hierarchy maximizes the use of observable inputs and minimizes the use of unobservable inputs by requiring the most observable inputs to be used when available. The hierarchy is broken down into three levels based on the reliability of inputs as follows: Level 1 inputs, such as quoted prices in an active market; Level 2 inputs, which are observable inputs for similar assets; or Level 3 inputs, which are unobservable inputs.
The Company uses the following inputs in its fair value measurements:
– Level 2 and Level 3 inputs for its debt and derivative financial instrument fair value disclosures. See “Note 6 - Debt” and “Note 7 - Derivative Financial Instruments,” respectively; and
– Level 2 and Level 3 inputs when assessing the fair value of assets and liabilities in connection with real estate acquisitions and impairment. See “Note 4 - Real Estate Investments.”
Additionally, companies are required to disclose the estimated fair values of all financial instruments, even if they are not carried at their fair value. The fair values of financial instruments are estimates based on market conditions and perceived risks as of December 31, 2023 and December 31, 2022. These estimates require management’s judgement and may not be indicative of the future fair values of the assets and liabilities.
The fair value of the Company’s cash, cash equivalents and restricted cash (including money market accounts), other assets and accounts payable, accrued expenses and other liabilities approximate their carrying value because of the short-term nature of these instruments. Additionally, the Company believes the following financial instruments have carrying values that approximate their fair values as of December 31, 2023:
•Borrowings under the Company’s Revolver (as defined in “Note 6 - Debt”) approximate fair value based on their nature, terms and variable interest rates.
•Carrying values of the Company’s mortgage loans receivable approximate fair values based on a number of factors, including either their short-term nature, the availability of market quotes for comparable instruments, and a discounted cash flow analysis using estimates of the amount and timing of future cash flows, market rates, and credit spreads.
•Carrying value of the Company’s mortgage note payable approximates fair value based on a discounted cash flow analysis using estimates of the amount and timing of future cash flows, market rates, and credit spreads.
Provisions for impairment recognized during the years ended December 31, 2023, 2022, and 2021 primarily related to assets held for sale and the impairment was determined based on the estimated or negotiated selling price, less costs of disposal, compared to the carrying value of the property. Of the total provision for impairment during the year ended December 31, 2023, the Company recorded $1.9 million of impairment expense on three properties held for investment. Of these properties, one was accounted for at fair value on a nonrecurring basis using a cash flow model (Level 3 inputs) with an adjusted carrying value of $1.5 million. The Company estimated fair value using a capitalization rate of 10.0% which it believes is reasonable based on current market rates. As of December 31, 2022, there were no real estate assets accounted for at fair value.
The following table discloses recurring estimated fair value information for the Company’s 2024 Term Loan, 2027 Term Loan, 2028 Term Loan, and 2029 Term Loan (each as defined in “Note 6 - Debt”) which is derived based primarily on unobservable market inputs such as interest rates and discounted cash flow analysis using estimates of the amount and timing of future cash flows, market rates and credit spreads (in thousands):
|
|
|
|
|
|
|
|
|
|
|
|
|
|
|
|
|
|
|
|
|
|
|
|
|
December 31, 2023 |
|
December 31, 2022 |
|
Carrying Value (1) |
|
Estimated Fair Value |
|
Carrying Value (1) |
|
Estimated Fair Value |
2024 Term Loan (2) |
$ |
— |
|
|
$ |
— |
|
|
$ |
174,532 |
|
|
$ |
175,382 |
|
| 2027 Term Loan |
174,037 |
|
|
175,641 |
|
|
— |
|
|
— |
|
| 2028 Term Loan |
199,006 |
|
|
201,396 |
|
|
198,764 |
|
|
201,108 |
|
| 2029 Term Loan |
148,869 |
|
|
150,666 |
|
|
— |
|
|
— |
|
(1) The carrying value of the debt instruments are net of unamortized debt issuance and discount costs.
(2) On June 15, 2023, the Company amended and restated its 2024 Term Loan, providing for a $175.0 million senior unsecured term loan (the “2027 Term Loan”).
Concentrations of Credit Risk
Financial instruments that potentially subject the Company to significant concentrations of credit risk consist principally of cash and cash equivalents. The Company is exposed to credit risk with respect to cash held at various financial institutions, access to its credit facilities, amounts due under mortgage loans receivable, and amounts due or payable under derivative contracts. The credit risk exposure with regard to the Company’s cash, credit facilities, and derivative instruments is spread among a diversified group of investment grade financial institutions.
During the years ended 2023, 2022, and 2021 there were no tenants or borrowers with rental revenue or interest income on loans receivable, respectively, that exceeded 10% of total rental revenue.
Segment Reporting
ASC Topic 280, Segment Reporting, establishes standards for the manner in which companies report information about operating segments. Substantially all of the Company’s investments, at acquisition, are comprised of real estate owned that is leased to tenants on a long-term basis or real estate that secures the Company's investment in mortgage loans receivable. The Company allocates resources and assesses operating performance based on individual investment and property needs. Therefore, the Company aggregates these investments for reporting purposes and operates in one reportable segment.
Recent Accounting Pronouncements Issued But Not Yet Adopted
In November 2023, the FASB issued ASU 2023-07, Segment Reporting (Topic 280): Improvements to Reportable Segment Disclosures (“ASU 2023-07”). ASU 2023-07 is intended to improve reportable segment disclosures by requiring disclosure of incremental segment information on an annual and interim basis such as, annual and interim disclosure of significant segment expenses that are regularly provided to the chief operating decision maker, interim disclosure of a reportable segment’s profit or loss and assets, and the requirement that a public entity that has a single reportable segment provide all the disclosures required by ASU 2023-07 and all existing segment disclosures in Topic 280. The amendments in ASU 2023-07 do not change how a public entity identifies its operating segments, aggregates those operating segments, or applies the quantitative thresholds to determine its reportable segments. The amendments in ASU 2023-07 are effective for fiscal years beginning after December 15, 2023, and interim periods within fiscal years beginning after December 15, 2024. The disclosures are applied retrospectively to all periods presented and early adoption is permitted. The Company has one reportable segment and continues to evaluate additional disclosures that may be required for entities with a single reportable segment.
In December 2023, the FASB issued ASU 2023-09, Income Taxes (Topic 740): Improvements to Income Tax Disclosures (“ASU 2023-09”). ASU 2023-09 requires annual disclosure of specific categories in the rate reconciliation and provide additional information for reconciling items that meet a quantitative threshold within the rate reconciliation. In addition, the amendments require annual disclosure of income taxes paid disaggregated by federal, state and foreign jurisdictions as well as individual jurisdictions in which income taxes paid is equal to or greater than 5 percent of total income taxes paid. ASU 2023-09 is effective for annual periods beginning after December 15, 2024 on a prospective basis, however early adoption and retrospective application is permitted. The Company continues to evaluate the potential impact of the guidance and potential additional disclosures required.
Note 3 – Leases
Tenant Leases
The Company acquires, owns and manages commercial single-tenant lease properties, with the majority being long-term triple-net leases where the tenant is generally responsible for all improvements and contractually obligated to pay all operating costs (such as real estate taxes, utilities and repairs and maintenance costs). As of December 31, 2023, exclusive of mortgage loans receivable, the Company’s weighted average remaining lease term was 9.5 years.
The Company’s property leases have been classified as operating leases and some have scheduled rent increases throughout the lease term. The Company’s leases typically provide the tenant one or more multi-year renewal options to extend their leases, subject to generally the same terms and conditions, including rent increases, consistent with the initial lease term.
All lease-related income is reported as a single line item, rental revenue (including reimbursable), in the consolidated statements of operations and comprehensive income (loss) and is presented net of any reserves, write-offs, or recoveries for uncollectible amounts.
Fixed lease income includes stated amounts per the lease contract, which include base rent, fixed common area maintenance charges, and straight-line lease adjustments.
Variable lease income primarily includes recoveries from tenants, which represent amounts that tenants are contractually obligated to reimburse the Company for, specific to their portion of actual recoverable costs incurred. Variable lease income also includes percentage rent, which represents amounts billable to tenants based on their actual sales volume in excess of levels specified in the lease contract.
The following table provides a disaggregation of lease income recognized under ASC 842 (in thousands):
|
|
|
|
|
|
|
|
|
|
|
|
|
|
|
|
|
|
|
|
|
|
|
|
|
|
Year Ended December 31, |
|
|
2023 |
|
2022 |
|
2021 |
| Rental revenue |
|
|
|
|
|
|
Fixed lease income (1) |
|
$ |
110,177 |
|
|
$ |
82,836 |
|
|
$ |
53,734 |
|
Variable lease income (2) |
|
13,179 |
|
|
10,209 |
|
|
4,743 |
|
| Other rental revenue: |
|
|
|
|
|
|
| Above/below market lease amortization, net |
|
1,400 |
|
|
1,430 |
|
|
785 |
|
| Lease incentives |
|
(789) |
|
|
(541) |
|
|
(122) |
|
| Rental revenue (including reimbursable) |
|
$ |
123,967 |
|
|
$ |
93,934 |
|
|
$ |
59,140 |
|
(1) Fixed lease income includes contractual rents under lease agreements with tenants recognized on a straight-line basis over the lease term.
(2) Variable lease income primarily includes tenant reimbursements for real estate taxes, insurance, common area maintenance, and lease termination fees, and the write-off of uncollectible amounts. There were no material reserves, write-offs, or recoveries of uncollectible amounts during the years ended December 31, 2023, 2022, and 2021.
Scheduled future minimum base rental payments (excluding base rental payments from properties classified as held for sale and straight-line rent adjustments for all properties) due to be received under the remaining non-cancelable term of the operating leases in place as of December 31, 2023 are as follows (in thousands):
|
|
|
|
|
|
|
Future Minimum Base
Rental Receipts |
| 2024 |
$ |
119,627 |
|
| 2025 |
119,673 |
|
| 2026 |
117,107 |
|
| 2027 |
113,188 |
|
| 2028 |
106,720 |
|
| Thereafter |
547,052 |
|
| Total |
$ |
1,123,367 |
|
Future minimum rentals exclude amounts that may be received from tenants for reimbursements of operating costs and property taxes. In addition, the future minimum rents do not include any contingent rents based on a percentage of the lessees' gross sales or lease escalations based on future changes in the Consumer Price Index (“CPI”) or other stipulated reference rate.
Corporate Office Lease
In August 2021, the Company entered into a lease agreement on a new corporate office space, which commenced in October 2021 and is classified as an operating lease. The Company began operating out of the new office in February 2022. The lease has a remaining noncancellable lease term of 8.6 years that expires on July 31, 2032, with a one-time option to terminate in 2029 exercisable by the Company. The lease is also renewable at the Company’s option for two additional periods of five years. No renewals were incorporated in the calculation of the corporate lease right-of-use asset and liability as it is not reasonably certain that the Company will exercise the options. Further, the lease agreement does not contain any material residual value guarantees or material restrictive covenants. The corporate office lease contains variable lease costs related to the lease of parking spaces and non-lease components related to the reimbursement of property operating expenses and certain common area maintenance expenses, all of which are recognized as incurred. The Company elected to use the component practical expedient, which permits the Company to not separate non-lease components from lease components if timing and pattern of transfer is the same.
The following table presents the lease expense components for the years ended December 31, 2023 and 2022 (in thousands):
|
|
|
|
|
|
|
|
|
|
|
|
|
Year Ended December 31, |
|
2023 |
|
2022 |
| Operating lease cost |
$ |
542 |
|
|
$ |
542 |
|
| Variable lease cost |
$ |
306 |
|
|
$ |
110 |
|
The Company recorded a right-of-use asset and operating lease liability of approximately $4.5 million at lease commencement. As of December 31, 2023, the right-of-use asset and operating lease liability was $3.9 million and $5.1 million, respectively.
The right-of-use asset is included in other assets, net and the operating lease liability is included in accounts payable, accrued expenses and other liabilities in the accompanying consolidated balance sheets.
The following table reflects the maturity analysis of payments due from the Company over the next five years and thereafter for the corporate office lease obligation as of December 31, 2023 (in thousands):
|
|
|
|
|
|
|
Future Minimum Lease Payments |
| 2024 |
$ |
617 |
|
| 2025 |
636 |
|
| 2026 |
653 |
|
| 2027 |
670 |
|
| 2028 |
689 |
|
| Thereafter |
2,623 |
|
| Total lease payments |
5,888 |
|
Less: amount representing interest (1) |
(784) |
|
| Present value of operating lease liabilities |
$ |
5,104 |
|
(1) Imputed interest was calculated using a discount rate of 3.25%. The discount rate is based on the estimated incremental borrowing rate, calculated as the treasury rate for the same period as the underlying lease term, plus a spread determined using factors including REIT industry performance.
Note 4 – Real Estate Investments
As of December 31, 2023, the Company owned or had investments in 598 properties, excluding 24 property developments where rent has yet to commence. The gross real estate investment portfolio, including properties under development, totaled approximately $1.9 billion and consisted of the gross acquisition cost of land, buildings, improvements, lease intangible assets and liabilities, and property development costs. The investment portfolio is geographically dispersed throughout 45 states with gross real estate investments in Illinois and Texas representing 9.4% and 8.5%, respectively, of the total gross real estate investment of the Company’s investment portfolio.
Acquisitions
During the year ended December 31, 2023, the Company acquired 103 properties for a total purchase price of $345.1 million, inclusive of $3.5 million of capitalized acquisition costs.
During the year ended December 31, 2022, the Company acquired 105 properties for a total purchase price of $424.8 million, inclusive of $4.2 million of capitalized acquisition costs.
The acquisitions were all accounted for as asset acquisitions. An allocation of the purchase price and acquisition costs paid for the completed acquisitions is as follows (in thousands):
|
|
|
|
|
|
|
|
|
|
|
|
|
|
|
|
|
Year Ended December 31, |
|
|
2023 |
|
2022 |
| Land |
|
$ |
71,574 |
|
|
$ |
104,661 |
|
| Buildings |
|
212,971 |
|
|
268,621 |
|
| Site improvements |
|
18,613 |
|
|
21,627 |
|
| Tenant improvements |
|
3,396 |
|
|
3,747 |
|
| In-place lease intangible assets |
|
36,548 |
|
|
42,189 |
|
| Above-market lease intangible assets |
|
2,022 |
|
|
2,744 |
|
|
|
|
|
|
|
|
|
|
|
|
|
345,124 |
|
|
443,589 |
|
| Liabilities assumed |
|
|
|
|
| Below-market lease intangible liabilities |
|
— |
|
|
(10,842) |
|
| Mortgage note payable |
|
— |
|
|
(7,913) |
|
| Accounts payable, accrued expense and other liabilities |
|
— |
|
|
(40) |
|
| Purchase price (including acquisition costs) |
|
$ |
345,124 |
|
|
$ |
424,794 |
|
Development
As of December 31, 2023, the Company had 18 property developments under construction. During 2023, the Company invested $81.0 million in property developments, including the acquisition of 40 new developments with a combined initial purchase price of $27.3 million. During 2023, the Company completed development on 27 projects and reclassified approximately $68.6 million from property under development to land, building, and improvements in the accompanying consolidated balance sheets. Rent commenced for 21 of the 27 completed developments in 2023, while rent is expected to commence for the other six completed developments in the first quarter of 2024. The remaining 18 developments in progress are expected to be substantially completed with rent commencing at various points throughout the next twelve months. The purchase price, including acquisition costs, and subsequent development are included in property under development in the accompanying consolidated balance sheets as of December 31, 2023.
During 2022, the Company invested $22.0 million in property developments, including the land acquisition of two new developments with a combined initial purchase price of $1.8 million. During 2022, the Company completed development on six projects and reclassified approximately $23.1 million from property under development to land, building, and improvements in the accompanying consolidated balance sheets. Rent commenced for five of the six completed developments in 2022, while rent on the sixth completed development commenced in the second quarter of 2023. The purchase price, including acquisitions costs, and subsequent development are included in property under development in the accompanying consolidated balance sheets as of December 31, 2022.
Additionally, during 2023 and 2022, the Company capitalized approximately $1.1 million and $0.5 million, respectively, of interest expense associated with properties under development.
Dispositions
During 2023, the Company sold 19 properties for a total sales price, net of disposal costs, of $40.3 million, recognizing a net gain of $1.2 million.
During 2022, the Company sold seven properties for a total sales price, net of disposal costs, of $25.5 million, recognizing a net gain of $4.1 million.
During 2021, the Company sold nine properties for a total sales price, net of disposal costs, of $31.1 million, recognizing a net gain of $3.0 million.
Investment in Mortgage Loans Receivable
The Company’s mortgage loans receivable portfolio as of December 31, 2023 and December 31, 2022 is summarized below (in thousands):
|
|
|
|
|
|
|
|
|
|
|
|
|
|
|
|
|
|
|
|
|
|
|
|
|
|
|
|
|
|
|
|
|
|
|
|
|
|
|
|
|
|
|
|
|
| Loan Type |
|
Monthly Payment (5) |
|
Number of Secured Properties |
|
Effective Interest Rate (6) |
|
Stated Interest Rate |
|
Maturity Date |
|
December 31, 2023 |
|
December 31, 2022 |
Mortgage (1) (4) |
|
I/O |
|
1 |
|
6.74% |
|
7.00% |
|
4/8/2024 |
|
$ |
43,612 |
|
|
$ |
40,316 |
|
Mortgage (4) |
|
I/O |
|
2 |
|
6.57% |
|
7.00% |
|
6/30/2023 |
|
— |
|
|
6,000 |
|
Mortgage (4) |
|
I/O |
|
46 |
|
9.55% |
|
9.55% |
|
3/10/2026 |
|
41,940 |
|
|
— |
|
Mortgage (2) (4) |
|
I/O |
|
3 |
|
8.10% |
|
6.89% |
|
4/10/2026 |
|
4,132 |
|
|
— |
|
Mortgage (1) (2) (4) |
|
I/O |
|
9 |
|
7.59% |
|
7.59% |
|
6/10/2025 |
|
14,024 |
|
|
— |
|
| Mortgage |
|
None (3) |
|
1 |
|
8.50% |
|
8.50% |
|
12/29/2024 |
|
660 |
|
|
— |
|
Mortgage (1) |
|
P+I |
|
1 |
|
7.50% |
|
7.50% |
|
3/8/2024 |
|
3,246 |
|
|
— |
|
Mortgage (1) (4) |
|
I/O |
|
7 |
|
10.25% |
|
10.25% |
|
12/5/2024 |
|
5,007 |
|
|
— |
|
Mortgage (1) (4) |
|
I/O |
|
2 |
|
10.25% |
|
10.25% |
|
12/22/2024 |
|
1,909 |
|
|
— |
|
| Total |
|
|
|
|
|
|
|
|
|
|
|
114,530 |
|
|
46,316 |
|
| Unamortized loan origination costs |
|
|
|
|
|
|
|
|
58 |
|
|
62 |
|
| Unamortized discount |
|
|
|
|
|
|
|
|
|
(116) |
|
|
$ |
— |
|
| Total mortgage loans receivable, net |
|
|
|
|
|
|
|
$ |
114,472 |
|
|
$ |
46,378 |
|
(1) The Company has the right, subject to certain terms and conditions, to acquire all or a portion of the underlying collateralized properties.
(2) The stated interest rate is variable up to 15.0% and is calculated based on contractual rent for existing collateralized properties subject to the loan agreement.
(3) Payments of both interest and principal are due at maturity.
(4) Loans require monthly payments of interest only with principal payments occurring as borrower disposes of underlying properties, limited to the Company’s allocated investment by property. Any remaining principal balance will be repaid at or before the maturity date.
(5) I/O: Interest Only; P+I: Principal and Interest.
(6) Includes amortization of discount and loan origination costs, as applicable.
Note 5 – Intangible Assets and Liabilities
Intangible assets and liabilities consisted of the following (in thousands):
|
|
|
|
|
|
|
|
|
|
|
|
|
|
|
|
|
|
|
|
|
|
|
|
|
|
|
|
|
|
|
|
|
|
|
|
|
December 31, 2023 |
|
December 31, 2022 |
|
Gross
Carrying
Amount |
|
Accumulated Amortization |
|
Net Carrying Amount |
|
Gross
Carrying
Amount |
|
Accumulated Amortization |
|
Net Carrying Amount |
| Assets: |
|
|
|
|
|
|
|
|
|
|
|
| In-place leases |
$ |
181,564 |
|
|
$ |
(45,210) |
|
|
$ |
136,354 |
|
|
$ |
154,876 |
|
|
$ |
(28,472) |
|
|
$ |
126,404 |
|
| Above-market leases |
21,661 |
|
|
(4,361) |
|
|
17,300 |
|
|
20,091 |
|
|
(2,892) |
|
|
17,199 |
|
| Assembled workforce |
873 |
|
|
(873) |
|
|
— |
|
|
873 |
|
|
(873) |
|
|
— |
|
| Lease incentives |
8,996 |
|
|
(1,296) |
|
|
7,700 |
|
|
8,021 |
|
|
(618) |
|
|
7,403 |
|
| Total intangible assets |
$ |
213,094 |
|
|
$ |
(51,740) |
|
|
$ |
161,354 |
|
|
$ |
183,861 |
|
|
$ |
(32,855) |
|
|
$ |
151,006 |
|
|
|
|
|
|
|
|
|
|
|
|
|
| Liabilities: |
|
|
|
|
|
|
|
|
|
|
|
| Below-market leases |
$ |
33,196 |
|
|
$ |
(7,843) |
|
|
$ |
25,353 |
|
|
$ |
35,596 |
|
|
$ |
(5,465) |
|
|
$ |
30,131 |
|
The remaining weighted average amortization period for the Company’s intangible assets and liabilities as of December 31, 2023 and 2022 by category were as follows:
|
|
|
|
|
|
|
|
|
|
|
|
|
Years Remaining |
|
December 31, |
|
2023 |
|
2022 |
| In-place leases |
8.8 |
|
9.4 |
| Above-market leases |
12.2 |
|
13.0 |
| Below-market leases |
10.9 |
|
11.6 |
|
|
|
|
| Lease incentives |
11.1 |
|
11.8 |
The Company records amortization of in-place lease assets and assembled workforce intangible assets to amortization expense, and records net amortization of above-market and below-market lease intangibles as well as amortization of lease incentives to rental revenue. The following amounts in the accompanying consolidated statements of operations and comprehensive income (loss) related to the amortization of intangible assets and liabilities for all property and ground leases (in thousands):
|
|
|
|
|
|
|
|
|
|
|
|
|
|
|
|
|
|
|
Year Ended December 31, |
|
2023 |
|
2022 |
|
2021 |
| Amortization: |
|
|
|
|
|
| Amortization of in-place leases |
$ |
19,203 |
|
|
$ |
15,872 |
|
|
$ |
9,411 |
|
| Amortization of assembled workforce |
— |
|
|
281 |
|
|
293 |
|
|
$ |
19,203 |
|
|
$ |
16,153 |
|
|
$ |
9,704 |
|
|
|
|
|
|
|
| Net adjustment to rental revenue: |
|
|
|
|
|
| Above-market lease assets |
(1,575) |
|
|
(1,376) |
|
|
(1,050) |
|
| Below-market lease liabilities |
2,975 |
|
|
2,806 |
|
|
1,858 |
|
| Lease incentives |
(789) |
|
|
(541) |
|
|
(122) |
|
|
$ |
611 |
|
|
$ |
889 |
|
|
$ |
686 |
|
The following table provides the projected amortization of in-place lease assets to amortization expense and the net amortization of above-market, below-market, and lease incentive lease intangible assets and liabilities to rental revenue as of December 31, 2023, for the next five years and thereafter (in thousands):
|
|
|
|
|
|
|
|
|
|
|
|
|
|
|
|
|
|
|
|
|
|
|
|
|
|
|
|
|
|
|
|
|
|
|
|
|
|
|
|
|
|
|
2024 |
|
2025 |
|
2026 |
|
2027 |
|
2028 |
|
Thereafter |
|
Total |
| In-place leases |
$ |
19,965 |
|
|
$ |
19,391 |
|
|
$ |
18,149 |
|
|
$ |
15,956 |
|
|
$ |
13,279 |
|
|
$ |
49,614 |
|
|
$ |
136,354 |
|
|
|
|
|
|
|
|
|
|
|
|
|
|
|
| Above-market lease assets |
(1,656) |
|
|
(1,655) |
|
|
(1,632) |
|
|
(1,568) |
|
|
(1,523) |
|
|
(9,266) |
|
|
(17,300) |
|
| Below-market lease liabilities |
2,802 |
|
|
2,780 |
|
|
2,688 |
|
|
2,616 |
|
|
2,484 |
|
|
11,983 |
|
|
25,353 |
|
| Lease incentives |
(785) |
|
|
(785) |
|
|
(785) |
|
|
(730) |
|
|
(700) |
|
|
(3,915) |
|
|
(7,700) |
|
| Net adjustment to rental revenue |
$ |
361 |
|
|
$ |
340 |
|
|
$ |
271 |
|
|
$ |
318 |
|
|
$ |
261 |
|
|
$ |
(1,198) |
|
|
$ |
353 |
|
Note 6 – Debt
Debt consists of the following (in thousands):
|
|
|
|
|
|
|
|
|
|
|
|
|
|
|
|
|
|
|
|
|
|
|
|
|
|
|
|
|
|
|
|
|
|
|
|
|
Amounts Outstanding as of |
|
Contractual
Maturity Date |
|
Fully Extended
Maturity Date (1)
|
|
Interest Rate |
|
December 31, 2023 |
|
December 31, 2022 |
| Debt: |
|
|
|
|
|
|
|
|
|
2024 Term Loan (2) |
December 23, 2024 |
|
— |
|
1.37% |
|
$ |
— |
|
|
$ |
175,000 |
|
2027 Term Loan (3) |
January 15, 2026 |
|
January 15, 2027 |
|
3.12% |
|
175,000 |
|
|
— |
|
Revolver (4) |
August 11, 2026 |
|
August 11, 2027 |
|
6.49% |
|
80,000 |
|
|
113,000 |
|
2028 Term Loan (5) |
February 11, 2028 |
|
— |
|
3.88% |
|
200,000 |
|
|
200,000 |
|
| Mortgage Note |
November 1, 2027 |
|
— |
|
4.53% |
|
8,361 |
|
|
8,498 |
|
2029 Term Loan (6) |
July 3, 2026 |
|
January 3, 2029 |
|
4.89% |
|
150,000 |
|
|
— |
|
| Total debt |
|
|
|
|
|
|
613,361 |
|
|
496,498 |
|
| Unamortized discount and debt issuance costs |
|
|
|
|
|
|
(3,566) |
|
|
(2,306) |
|
Unamortized deferred financing costs, net (7) |
|
|
|
|
|
|
(1,942) |
|
|
(2,684) |
|
| Total debt, net |
|
|
|
|
|
|
$ |
607,853 |
|
|
$ |
491,508 |
|
(1) Date represents the fully extended maturity date available to the Company under each related debt instrument.
(2) On June 15, 2023, the Company amended and restated its 2024 Term Loan, providing for a $175.0 million senior unsecured term loan (the “2027 Term Loan”).
(3) Loan is a floating-rate loan which resets daily at daily SOFR plus a SOFR adjustment of 0.10% plus the applicable margin which was 1.15% as of December 31, 2023. The Company has entered into five interest rate swap agreements that effectively convert the floating rate to a fixed rate. The hedged fixed rate reset effective November 27, 2023 to 1.87% and will reset again effective December 23, 2024 to 2.40%.
(4) The annual interest rate of the Revolver assumes daily SOFR as of December 31, 2023 of 5.39% plus a SOFR adjustment of 0.10% plus the applicable margin which was 1.00% as of December 31, 2023.
(5) Loan is a floating-rate loan which resets monthly at one-month term SOFR plus a SOFR adjustment of 0.10% plus the applicable margin which was 1.15% as of December 31, 2023. The Company has entered into three interest rate swap agreements that effectively convert the floating rate to a fixed rate.
(6) Loan is a floating-rate loan which resets daily at daily SOFR plus a SOFR adjustment of 0.10% plus the applicable margin which was 1.15% as of December 31, 2023. The Company has entered into four interest rate swap agreements that effectively convert the floating rate to a fixed rate.
(7) The Company records deferred financing costs associated with the Revolver and loan commitment fees associated with the 2029 Term Loan in other assets, net on its consolidated balance sheets.
2029 Term Loan
On July 3, 2023, the Company entered into an agreement (the “2029 Term Loan Agreement”) related to a $250.0 million sustainability-linked senior unsecured term loan (the “2029 Term Loan”) which may, subject to the terms of the 2029 Term Loan Agreement, be increased to an amount of up to $400.0 million at the Company’s request. The 2029 Term Loan contains a 12-month delayed draw feature and $150.0 million was drawn on July 3, 2023. The 2029 Term Loan is prepayable at the Company’s option in whole or in part without premium or penalty. The 2029 Term Loan matures on July 3, 2026, subject to extension options at the Company’s election on two occasions, by one year and, on one occasion, by six months (subject to certain conditions).
The interest rate applicable to the 2029 Term Loan is determined by the Company’s Investment Grade Rating (as defined in the 2029 Term Loan Agreement). Prior to the date the Company obtains an Investment Grade Rating, interest shall accrue at either (i) SOFR, plus a margin ranging from 1.15% to 1.60% or (ii) Base Rate (as defined in the 2029 Term Loan Agreement), plus a margin ranging from 0.15% to 0.60%, in each case based on the Company’s consolidated total leverage ratio. After the date the Company obtains an Investment Grade Rating, interest shall accrue at either (i) SOFR, plus a margin ranging from 0.80% to 1.60% or (ii) Base Rate, plus a margin ranging from 0.00% to 0.60%, in each case based on the Company’s Investment Grade Rating.
The Company has hedged the entire $250.0 million of the 2029 Term Loan at an all-in fixed interest rate of 4.99%, through January 2029, which consists of the fixed rate SOFR swap of 3.74%, plus a credit spread adjustment of 0.10% and, at current leverage levels, a borrowing spread of 1.15%. Interest is payable monthly or at the end of the applicable interest period in arrears on any outstanding borrowings.
The 2029 Term Loan also contains sustainability-linked pricing component pursuant to which the Company will receive interest rate reductions up to 0.025% based on its performance against a sustainability performance target focused on the portion of the Company’s annualized based rent attributable to tenants with commitments or quantifiable targets for reduced GHG emission is accordance with the standards of the Science Based Targets initiative (“SBTi”).
In connection with the 2029 Term Loan, the Company incurred $1.4 million of deferred financing costs. Additionally, the Company incurred $0.9 million of loan commitment fees which have been capitalized to other assets, net on the consolidated balance sheets. The deferred financing costs and capitalized loan commitment fees are both amortized over the term of the loan and are included in interest expense, net on the Company’s consolidated statements of operations and comprehensive income (loss).
Credit Facility
On August 11, 2022, the Company entered into a sustainability-linked senior unsecured credit facility consisting of (i) a $200.0 million senior unsecured term loan (the “2028 Term Loan”) and (ii) a $400.0 million senior unsecured revolving credit facility (the “Revolver”, and together with the 2028 Term Loan, the “Credit Facility”). The Credit Facility may be increased by $400.0 million in the aggregate for total availability of up to $800.0 million.
The 2028 Term Loan matures on February 11, 2028. The Revolver matures on August 11, 2026, subject to a one year extension option at the Company’s election (subject to certain conditions) to August 11, 2027. Borrowings under the Credit Facility are repayable at the Company’s option in whole or in part without premium or penalty. Borrowings under the Revolver may be repaid and reborrowed from time to time prior to the maturity date.
Prior to the date the Company obtains an Investment Grade Rating (as defined in the credit agreement governing the Credit Facility (the “Credit Agreement”)), interest rates are based on the Company’s consolidated total leverage ratio, and are determined by (A) in the case of the 2028 Term Loan either (i) SOFR, plus a SOFR adjustment of 0.10%, plus a margin ranging from 1.15% to 1.60%, based on the Company’s consolidated total leverage ratio, or (ii) a Base Rate (as defined in the Credit Agreement), plus a margin ranging from 0.15% to 0.60%, based on the Company’s consolidated total leverage ratio and (B) in the case of the Revolver either (i) SOFR, plus a SOFR adjustment of 0.10%, plus a margin ranging from 1.00% to 1.45%, based on the Company’s consolidated total leverage ratio, or (ii) a Base Rate (as defined in the Credit Agreement), plus a margin ranging from 0.00% to 0.45%, based on the Company’s consolidated total leverage ratio.
After the date the Company obtains an Investment Grade Rating, interest rates are based on the Company’s Investment Grade Rating, and are determined by (A) in the case of the 2028 Term Loan either (i) SOFR, plus a SOFR adjustment of 0.10%, plus a margin ranging from 0.80% to 1.60%, based on the Company’s Investment Grade Rating, or (ii) a Base Rate (as defined in the Credit Agreement), plus a margin ranging from 0.00% to 0.60%, based on the Company’s Investment Grade Rating and (B) in the case of the Revolver either (i) SOFR, plus a SOFR adjustment of 0.10%, plus a margin ranging from 0.725% to 1.40%, based on the Company’s Investment Grade Rating, or (ii) a Base Rate (as defined in the Credit Agreement), plus a margin ranging from 0.00% to 0.40%, based on the Company’s Investment Grade Rating.
Additionally, the Company will incur a facility fee based on the total commitment amount of $400.0 million under the Revolver. Prior to the date the Company obtains an Investment Grade Rating, the applicable facility fee will range from 0.15% to 0.30% based on the Company’s consolidated total leverage ratio. After the date the Company obtains an Investment Grade Rating, the applicable facility fee will range from 0.125% to 0.30% based on the Company’s Investment Grade Rating.
The Credit Facility also contains a sustainability-linked pricing component pursuant to which the Company will receive interest rate reductions up to 0.025% based on its performance against a sustainability performance target focused on the portion of the Company’s annualized base rent attributable to tenants with commitments or quantifiable targets for reduced greenhouse gas emission in accordance with the standards of the SBTi.
The Company has fully hedged the 2028 Term Loan with an all-in interest rate of 3.88%. Interest is payable monthly or at the end of the applicable interest period in arrears on any outstanding borrowings. The interest rate hedge is further described in “Note 7 – Derivative Financial Instruments.”
In connection with the Credit Facility, the Company incurred $3.8 million of deferred financing costs which were allocated between the Revolver and 2028 Term Loan in the amounts of $2.4 million and $1.3 million, respectively. Additionally, $0.5 million of unamortized deferred financing costs associated with the Company’s previous revolving credit facility were reclassed to the Revolver. Deferred financing costs are amortized over the remaining terms of each respective borrowing and are included in interest expense, net in the Company’s consolidated statements of operations and comprehensive income (loss).
2027 Term Loan
In December 2019, the Company entered into an agreement governing a $175.0 million senior unsecured term loan that was scheduled to mature in December 2024 (the “2024 Term Loan”). On June 15, 2023, the Company amended and restated the agreement governing the 2024 Term Loan to provide for a $175.0 million senior unsecured term loan with a maturity date of January 15, 2026 that is subject to a one year extension option at the Company’s election (subject to certain conditions) (the “2027 Term Loan”). The 2027 Term Loan is repayable at the Company’s option in whole or in part without premium or penalty.
The interest rate applicable to the 2027 Term Loan is determined by the Company’s Investment Grade Rating (as defined in the 2027 Term Loan). Prior to the date the Company obtains an Investment Grade Rating, interest shall accrue at either (i) SOFR, plus a margin ranging from 1.15% to 1.60% or (ii) Base Rate (as defined in the 2027 Term Loan), plus a margin ranging from 0.15% to 0.60%, in each case based on the Company’s consolidated total leverage ratio. After the date the Company obtains an Investment Grade Rating, interest shall accrue at either (i) SOFR, plus a margin ranging from 0.80% to 1.60% or (ii) Base Rate, plus a margin ranging from 0.00% to 0.60%, in each case based on the Company’s Investment Grade Rating.
Interest is payable monthly or at the end of the applicable interest period in arrears. The Company has fully hedged the 2027 Term Loan. The interest rate hedges are described in “Note 7 – Derivative Financial Instruments.”
Mortgage Note Payable
As of December 31, 2023, the Company had total gross mortgage indebtedness of $8.4 million, which was collateralized by related real estate and a tenant’s lease with an aggregate net book value of $12.6 million. The Company incurred debt issuance costs of less than $0.1 million and recorded a debt discount of $0.6 million, both of which are recorded as a reduction of the principal balance in mortgage note payable, net in the Company’s consolidated balance sheets. The mortgage note matures on November 1, 2027, but may be repaid in full beginning August 2027.
Debt Maturities
Payments on the 2027 Term Loan, 2028 Term Loan, and 2029 Term Loan are interest only through maturity. As of December 31, 2023, scheduled debt maturities, including balloon payments, are as follows (in thousands):
|
|
|
|
|
|
|
|
|
|
|
|
|
|
|
|
|
|
|
|
|
|
|
Scheduled Principal |
|
Balloon Payment (1) |
|
Total |
| 2024 |
|
$ |
162 |
|
|
$ |
— |
|
|
$ |
162 |
|
| 2025 |
|
170 |
|
|
— |
|
|
170 |
|
| 2026 |
|
178 |
|
|
405,000 |
|
|
405,178 |
|
| 2027 |
|
170 |
|
|
7,681 |
|
|
7,851 |
|
| 2028 |
|
— |
|
|
200,000 |
|
|
200,000 |
|
|
|
|
|
|
|
|
| Total |
|
$ |
680 |
|
|
$ |
612,681 |
|
|
$ |
613,361 |
|
(1) Does not assume the exercise of any extension options available to the Company.
Interest Expense
The following table is a summary of the components of interest expense related to the Company’s borrowings (in thousands):
|
|
|
|
|
|
|
|
|
|
|
|
|
|
|
|
|
|
|
|
|
|
|
Year Ended December 31, |
|
|
2023 |
|
2022 |
|
2021 |
Revolving credit facilities (1) |
|
$ |
5,492 |
|
|
$ |
3,187 |
|
|
$ |
743 |
|
Term loans (2) |
|
14,518 |
|
|
5,455 |
|
|
2,408 |
|
| Mortgage note payable |
|
387 |
|
|
100 |
|
|
— |
|
| Non-cash: |
|
|
|
|
|
|
| Amortization of deferred financing costs |
|
898 |
|
|
541 |
|
|
402 |
|
| Amortization of debt discount and debt issuance costs, net |
|
947 |
|
|
350 |
|
|
225 |
|
| Amortization of deferred gains on interest rate swaps |
|
(2,124) |
|
|
— |
|
|
— |
|
| Capitalized interest |
|
(1,060) |
|
|
(452) |
|
|
(78) |
|
| Total interest expense, net |
|
$ |
19,058 |
|
|
$ |
9,181 |
|
|
$ |
3,700 |
|
(1) Includes facility fees and non-utilization fees of approximately $0.6 million, $0.4 million, and $0.6 million for the years ended December 31, 2023, 2022, and 2021, respectively.
(2) Includes the effects of interest rate hedges in place as of such date.
Deferred financing, discount, and debt issuance costs are amortized over the remaining terms of each respective borrowing and are included in interest expense, net in the Company’s consolidated statements of operations and comprehensive income (loss).
During the years ended December 31, 2023, 2022, and 2021, the term loans had a weighted average interest rate, exclusive of amortization of deferred financing costs and the effects of interest rate hedges, of 5.51%, 3.39%, and 1.27%, respectively.
During the years ended December 31, 2023, 2022, and 2021, the Company incurred interest expense on revolving credit facilities with a weighted average interest rate, exclusive of amortization of deferred financing costs and facility fees, of 5.92%, 2.59%, and 1.31%, respectively.
The estimated fair values of the Company’s term loans have been derived based on market observable inputs such as interest rates and discounted cash flow analysis using estimates of the amount and timing of future cash flows. These measurements are classified as Level 2 within the fair value hierarchy. Refer to “Note 2 - Summary of Significant Accounting Policies” for additional detail on fair value measurements.
The Company was in compliance with all of its debt covenants as of December 31, 2023 and expects to be in compliance for the twelve-month period ending December 31, 2024.
Note 7 – Derivative Financial Instruments
The Company uses interest rate derivative contracts to manage its exposure to changes in interest rates on its variable rate debt. These derivatives are considered cash flow hedges and are recorded on a gross basis at fair value. Assessments of hedge effectiveness are performed quarterly using either a qualitative or quantitative approach. The Company recognizes the entire change in the fair value in Accumulated Other Comprehensive Income (“AOCI”) and the change is reflected as cash flow hedge changes in fair value in the supplemental disclosures of non-cash investing and financing activities in the consolidated statements of cash flows.
Effective July 3, 2023, such derivatives were initiated to hedge the variable cash flows associated with the 2029 Term Loan. The interest rate for the variable rate 2029 Term Loan is based on the hedged fixed rate of 3.64% compared to the variable 2029 Term Loan daily SOFR rate as of December 31, 2023 of 5.32%, plus a SOFR adjustment of 0.10% and applicable margin of 1.15%. The maturity dates of the interest rate swaps coincide with the fully extended maturity date of the 2029 Term Loan.
Effective September 1, 2022, such derivatives were initiated to hedge the variable cash flows associated with the 2028 Term Loan. The interest rate for the variable rate 2028 Term Loan is based on the hedged fixed rate of 2.63% compared to the variable 2028 Term Loan one-month SOFR rate as of December 31, 2023 of 5.34%, plus a SOFR adjustment of 0.10% and applicable margin of 1.15%. The maturity dates of the interest rate swaps coincide with the maturity date of the 2028 Term Loan.
Effective January 27, 2023, the Company converted its four existing LIBOR swap agreements associated with the 2024 Term Loan into four new SOFR swaps that convert the SOFR variable rate to a fixed rate of 0.12% and on June 15, 2023, the Company amended and restated its 2024 Term Loan, providing for a $175.0 million senior unsecured term loan (the “2027 Term Loan”). In anticipation of the amendment and restatement of the 2024 Term Loan, additional derivatives, effective November 27, 2023 and December 23, 2024 at hedged fixed rates of 1.87% and 2.40%, respectively, were initiated to hedge the variable cash flows associated with the 2027 Term Loan through the fully extended maturity date. The interest rate on the variable 2027 Term Loan includes a daily SOFR rate as of December 31, 2023 of 5.31%, plus a SOFR adjustment of 0.10% and applicable margin of 1.15%.
Amounts will subsequently be reclassified to earnings when the hedged item affects earnings. The Company does not enter into derivative contracts for speculative or trading purposes and does not have derivative netting arrangements.
The Company is exposed to credit risk in the event of non-performance by its derivative counterparties. The Company evaluates counterparty credit risk through monitoring the creditworthiness of counterparties, which includes review of debt ratings and financial performance. To mitigate credit risk, the Company enters into agreements with counterparties it considers credit-worthy, such as large financial institutions with favorable credit ratings.
The Company had the following outstanding interest rate derivatives that were designated as cash flow hedges of interest rate risk (in thousands, except number of instruments):
|
|
|
|
|
|
|
|
|
|
|
|
|
|
|
|
|
|
|
|
|
|
|
|
|
|
|
|
|
Number of Instruments |
|
Notional |
| Interest Rate Derivatives |
|
December 31, 2023 |
|
December 31, 2022 |
|
December 31, 2023 |
|
December 31, 2022 |
| Interest rate swaps |
|
12 |
|
|
7 |
|
|
$ |
650,000 |
|
|
$ |
375,000 |
|
The following table presents the fair value of the Company's derivative financial instruments as well as their classification in the consolidated balance sheets as of December 31, 2023 and December 31, 2022 (in thousands):
|
|
|
|
|
|
|
|
|
|
|
|
|
|
|
|
|
|
|
|
|
|
|
Derivative Assets |
|
|
|
|
Fair Value as of December 31, |
| Derivatives Designated as Hedging Instruments: |
|
Balance Sheet Location |
|
2023 |
|
2022 |
| Interest rate swaps |
|
Other assets, net |
|
$ |
14,442 |
|
|
$ |
24,067 |
|
|
|
|
|
|
|
|
|
|
Derivative Liabilities |
|
|
|
|
Fair Value as of December 31, |
| Derivatives Designated as Hedging Instruments: |
|
Balance Sheet Location |
|
2023 |
|
2022 |
| Interest rate swaps |
|
Accounts payable, accrued expenses and other liabilities |
|
$ |
3,073 |
|
|
$ |
— |
|
The following table presents the effect of the Company's interest rate swaps in the consolidated statements of operations and comprehensive income (loss) for the years ended December 31, 2023, 2022, and 2021 (in thousands):
|
|
|
|
|
|
|
|
|
|
|
|
|
|
|
|
|
|
|
|
|
|
|
|
|
|
|
|
|
|
|
|
|
|
|
|
|
|
|
|
|
|
|
Amount of Gain (Loss) Recognized in OCI on Derivative (Effective Portion) |
|
Location of Gain (Loss) Reclassified from Accumulated OCI into Income (Effective Portion) |
|
Amount of Gain (Loss) Reclassified from Accumulated OCI into Income (Effective Portion) |
|
|
|
|
|
|
| Derivatives in Cash Flow Hedging Relationships |
2023 |
|
2022 |
|
2021 |
|
|
|
2023 |
|
2022 |
|
2021 |
| Interest Rate Products |
$ |
1,729 |
|
|
$ |
22,898 |
|
|
$ |
3,873 |
|
|
Interest expense, net |
|
$ |
16,551 |
|
|
$ |
3,140 |
|
|
$ |
(184) |
|
The Company did not exclude any amounts from the assessment of hedge effectiveness for the years ended December 31, 2023, 2022, and 2021. During the next twelve months, the Company estimates that an additional $14.6 million will be reclassified as a decrease to interest expense.
The valuation of these instruments is determined using widely accepted valuation techniques including discounted cash flow analysis on the expected cash flows of each derivative. This analysis reflects the contractual terms of the derivatives, including the period to maturity, and uses observable market-based inputs, including interest rate curves.
To comply with the provisions of ASC 820, the Company incorporates credit valuation adjustments to appropriately reflect both its own nonperformance risk and the respective counterparty’s nonperformance risk in the fair value measurements. In adjusting the fair value of its derivative contracts for the effect of nonperformance risk, the Company has considered the impact of netting and any applicable credit enhancements, such as collateral postings, thresholds, mutual puts, and guarantees.
Although the Company has determined that the majority of the inputs used to value its derivatives fall within Level 2 of the fair value hierarchy, the credit valuation adjustments associated with its derivatives utilize Level 3 inputs, such as estimates of current credit spreads to evaluate the likelihood of default by itself and its counterparties. However, as of December 31, 2023, the Company has assessed the significance of the impact of the credit valuation adjustments on the overall valuation of its derivative positions and has determined that the credit valuation adjustments are not significant to the overall valuation of its derivatives. As a result, the Company has determined that its derivative valuations in their entirety are classified in Level 2 of the fair value hierarchy.
The table below presents the Company’s derivative assets and liabilities measured at fair value on a recurring basis as of December 31, 2023 and 2022, aggregated by the level in the fair value hierarchy within which those measurements fall (in thousands):
|
|
|
|
|
|
|
|
|
|
|
|
|
|
|
|
|
|
|
|
|
|
|
|
|
|
|
|
|
Fair Value Hierarchy Level |
|
|
| Description |
|
Level 1 |
|
Level 2 |
|
Level 3 |
|
Total Fair Value |
| December 31, 2023 |
|
|
|
|
|
|
|
|
| Derivative assets |
|
$ |
— |
|
|
$ |
14,442 |
|
|
$ |
— |
|
|
$ |
14,442 |
|
| Derivative liabilities |
|
$ |
— |
|
|
$ |
3,073 |
|
|
$ |
— |
|
|
$ |
3,073 |
|
|
|
|
|
|
|
|
|
|
| December 31, 2022 |
|
|
|
|
|
|
|
|
| Derivative assets |
|
$ |
— |
|
|
$ |
24,067 |
|
|
$ |
— |
|
|
$ |
24,067 |
|
Note 8 – Supplemental Detail for Certain Components of the Consolidated Balance Sheets
Other assets, net consist of the following (in thousands):
|
|
|
|
|
|
|
|
|
|
|
|
|
December 31, |
|
2023 |
|
2022 |
| Accounts receivable, net |
$ |
10,074 |
|
|
$ |
7,167 |
|
| Deferred rent receivable |
7,744 |
|
|
5,629 |
|
| Prepaid assets |
1,387 |
|
|
3,864 |
|
| Earnest money deposits |
450 |
|
|
185 |
|
| Fair value of interest rate swaps |
14,442 |
|
|
24,067 |
|
| Deferred offering costs |
1,031 |
|
|
796 |
|
| Deferred financing costs, net |
2,724 |
|
|
2,685 |
|
| Right-of-use asset |
3,866 |
|
|
4,235 |
|
| Leasehold improvements and other corporate assets, net |
1,723 |
|
|
1,969 |
|
| Interest receivable |
1,397 |
|
|
256 |
|
| Other assets, net |
4,499 |
|
|
1,204 |
|
|
$ |
49,337 |
|
|
$ |
52,057 |
|
Accounts payable, accrued expenses and other liabilities consists of the following (in thousands):
|
|
|
|
|
|
|
|
|
|
|
|
|
December 31, |
|
2023 |
|
2022 |
| Accrued expenses |
$ |
8,826 |
|
|
$ |
5,745 |
|
| Accrued bonus |
2,575 |
|
|
1,305 |
|
| Prepaid rent |
3,896 |
|
|
2,937 |
|
| Operating lease liability |
5,104 |
|
|
5,464 |
|
| Accrued interest |
2,921 |
|
|
1,782 |
|
| Deferred rent |
3,257 |
|
|
1,756 |
|
| Accounts payable |
4,691 |
|
|
1,394 |
|
| Fair value of interest rate swaps |
3,073 |
|
|
— |
|
| Other liabilities |
2,155 |
|
|
2,157 |
|
|
$ |
36,498 |
|
|
$ |
22,540 |
|
Note 9 – Shareholders’ Equity
ATM Program
On September 1, 2021, the Company entered into a $250.0 million at-the-market equity program (the “2021 ATM Program”) through which, from time to time, it may sell shares of its common stock in registered transactions. On September 14, 2023, the Company entered into a forward confirmation with respect to 7,500,000 shares of its common stock under the 2021 ATM Program. On September 28, 2023, the Company partially physically settled 1,516,289 shares of common stock at a price of $16.49 per share under such forward confirmation for net proceeds of approximately $24.8 million, net of sales commissions and offering costs of $0.2 million. The Company contributed the net proceeds to the Operating Partnership in exchange for 1,516,289 Class A OP Units. 5,983,711 shares remain unsettled under the forward confirmation as of December 31, 2023. The Company may physically settle this forward confirmation (by the delivery of shares of common stock) and receive proceeds from the sale of those shares on one or more forward settlement dates, which shall occur no later than September 13, 2024.
On October 25, 2023, the Company entered into a $300.0 million at-the-market equity program (the “2023 ATM Program”) through which, from time to time, it may sell shares of its common stock in registered transactions. Effective October 24, 2023, in connection with the establishment of the new at-the-market offering program, the 2021 ATM Program was terminated.
The following table presents information about the 2023 ATM Program and the 2021 ATM Program (in thousands):
|
|
|
|
|
|
|
|
|
|
|
|
|
|
|
|
|
|
|
|
|
|
|
|
|
|
|
|
|
|
|
|
|
Maximum Sales Authorization |
|
Gross Sales through December 31, 2023 |
| Program Name |
|
Date Established |
|
Date Terminated |
|
|
2021 ATM Program (1) |
|
September 2021 |
|
October 2023 |
|
$ |
250,000 |
|
|
$ |
150,391 |
|
| 2023 ATM Program |
|
October 2023 |
|
|
|
$ |
300,000 |
|
|
$ |
77,323 |
|
The following table details information related to activity under the ATM Program for each period presented (in thousands, except share and per share data):
|
|
|
|
|
|
|
|
|
|
|
|
|
|
|
|
|
|
|
|
|
|
|
Year Ended December 31, |
|
|
2023 (1) |
|
2022 |
|
2021 |
| Shares of common stock issued |
|
7,662,341 |
|
|
276,060 |
|
|
3,852,436 |
|
| Weighted average price per share |
|
$ |
17.22 |
|
|
$ |
21.02 |
|
|
$ |
23.36 |
|
| Gross proceeds |
|
$ |
131,911 |
|
|
$ |
5,802 |
|
|
$ |
90,000 |
|
| Sales commissions and offering costs |
|
$ |
1,638 |
|
|
$ |
269 |
|
|
$ |
1,017 |
|
Net proceeds (2) |
|
$ |
130,274 |
|
|
$ |
5,533 |
|
|
$ |
88,983 |
|
(1) Includes 1,516,289 shares of common stock partially physically settled at a price of $16.49 per share under the forward confirmation with respect to the 2021 ATM Program. 5,983,711 shares remain unsettled under the forward confirmation as of December 31, 2023 at the available net settlement price of $16.48.
(2) The net proceeds were contributed to the Operating Partnership in exchange for an equivalent number of Class A OP Units.
As of December 31, 2023, the Company has $222.7 million remaining gross proceeds available for future issuances of shares of common stock under the 2023 ATM Program.
August 2022 Follow-On Offering
On August 8, 2022, the Company completed a registered public offering of 9,000,000 shares of its common stock at a public offering price of $20.20 per share, which excluded an over-allotment option to the underwriters to purchase up to an additional 1,350,000 shares, which was exercised in full on August 10, 2022. In connection with the offering, the Company entered into forward sale agreements for 10,350,000 shares of its common stock. As of June 30, 2023, the Company had fully physically settled the forward sale agreements (by the delivery of shares of common stock).
January 2022 Follow-On Offering
On January 13, 2022, the Company completed a registered public offering of 10,350,000 shares of its common stock at a public offering price of $22.25 per share. In connection with the offering, the Company entered into forward sale agreements for 10,350,000 shares of its common stock. As of September 30, 2022, the Company had fully physically settled the forward sale agreements (by the delivery of shares of common stock).
April 2021 Follow-On Offering
On April 12, 2021, the Company completed a public offering of 10,915,688 shares of common stock, which included the full exercise of the underwriters’ option to purchase an additional 1,423,785 shares of common stock. The Company received net proceeds of $194.2 million, net of underwriting discounts and transaction costs of $9.4 million. The Company contributed the net proceeds to the Operating Partnership in exchange for 10,915,688 Class A OP Units.
Surrendered Shares on Vested Stock Unit Awards
During the years presented, portions of restricted stock unit awards (“RSUs”) granted to certain of the Company’s officers, directors, and employees vested. The vesting of these awards, granted pursuant to the NETSTREIT Corp. 2019 Omnibus Incentive Plan (the “Omnibus Incentive Plan”), resulted in federal and state income tax liabilities for the recipients. During 2023 and 2022, as permitted by the terms of the Omnibus Incentive Plan and the award grants, certain executive officers and employees elected to surrender a total of 37 thousand and 75 thousand RSUs, respectively, valued at approximately $0.7 million and $1.5 million, respectively, solely to pay the associated statutory tax withholding. The surrendered RSUs are included in the row entitled “repurchase of common stock for tax withholding obligations” in the consolidated statements of cash flows.
Dividends
During the year ended December 31, 2023, the Company declared and paid the following common stock dividends (in thousands, except per share data):
|
|
|
|
|
|
|
|
|
|
|
|
|
|
|
|
|
|
|
|
|
|
|
|
|
|
|
| Year Ended December 31, 2023 |
| Declaration Date |
|
Dividend Per Share |
|
Record Date |
|
Total Amount |
|
Payment Date |
| February 21, 2023 |
|
$ |
0.200 |
|
|
March 15, 2023 |
|
$ |
11,650 |
|
|
March 30, 2023 |
| April 25, 2023 |
|
0.200 |
|
|
June 1, 2023 |
|
12,173 |
|
|
June 15, 2023 |
| July 24, 2023 |
|
0.205 |
|
|
September 1, 2023 |
|
13,768 |
|
|
September 15, 2023 |
| October 24, 2023 |
|
0.205 |
|
|
December 1, 2023 |
|
14,084 |
|
|
December 15, 2023 |
|
|
$ |
0.810 |
|
|
|
|
$ |
51,675 |
|
|
|
During the year ended December 31, 2022, the Company declared and paid the following common stock dividends (in thousands, except per share data):
|
|
|
|
|
|
|
|
|
|
|
|
|
|
|
|
|
|
|
|
|
|
|
|
|
|
|
| Year Ended December 31, 2022 |
| Declaration Date |
|
Dividend Per Share |
|
Record Date |
|
Total Amount |
|
Payment Date |
| February 22, 2022 |
|
$ |
0.200 |
|
|
March 15, 2022 |
|
$ |
8,888 |
|
|
March 30, 2022 |
| April 26, 2022 |
|
0.200 |
|
|
June 1, 2022 |
|
9,588 |
|
|
June 15, 2022 |
| July 26, 2022 |
|
0.200 |
|
|
September 1, 2022 |
|
10,073 |
|
|
September 15, 2022 |
| October 25, 2022 |
|
0.200 |
|
|
December 1, 2022 |
|
10,984 |
|
|
December 15, 2022 |
|
|
$ |
0.800 |
|
|
|
|
$ |
39,533 |
|
|
|
The holders of OP Units are entitled to an equal distribution per each OP Unit held as of each record date. Accordingly, during each of the years ended December 31, 2023 and 2022, the Operating Partnership paid distributions of $0.4 million to holders of OP Units.
For federal income tax purposes, distributions to stockholders are characterized as ordinary income dividends, capital gain distributions, or non-dividend distributions. Non-dividend distributions will reduce U.S. stockholders’ basis (but not below zero) in their shares. The following table shows the character of the Company’s common stock distributions paid per share for the years ended December 31, 2023, 2022, and 2021:
|
|
|
|
|
|
|
|
|
|
|
|
|
|
|
|
|
|
|
|
|
|
|
Year Ended December 31, |
|
|
2023 |
|
2022 |
|
2021 |
| Ordinary income dividends |
|
$ |
0.7488 |
|
|
$ |
0.6768 |
|
|
$ |
0.3099 |
|
| Non-dividend distributions |
|
0.0502 |
|
|
0.0856 |
|
|
0.4901 |
|
| Capital gain distributions |
|
0.0110 |
|
|
0.0376 |
|
|
— |
|
| Total |
|
$ |
0.8100 |
|
|
$ |
0.8000 |
|
|
$ |
0.8000 |
|
Noncontrolling Interests
Noncontrolling interests represent noncontrolling holders of OP Units in the Operating Partnership. OP Units are convertible into common stock as the OP Units may be redeemed for cash or, at the Company’s election, exchanged for shares of the Company’s common stock on a one-for-one basis. As of December 31, 2023 and 2022, noncontrolling interests represented 0.7% and 0.9%, respectively, of OP Units. During the years ended December 31, 2023 and 2022, OP Unit holders redeemed 34,169 and 49,317 OP units, respectively, into shares of common stock on a one-for-one basis.
Note 10 – Stock-Based Compensation
Under the Omnibus Incentive Plan, 2,094,976 shares of common stock are reserved for issuance. The Omnibus Incentive Plan provides for the grant of stock options, stock appreciation rights, restricted shares, RSUs, long-term incentive plan units, dividend equivalent rights, and other share-based, share-related or cash-based awards, including performance-based awards, to employees, directors and consultants, with each grant evidenced by an award agreement providing the terms of the award. The Omnibus Incentive Plan is administered by the Compensation Committee of the Board of Directors.
As of December 31, 2023, the only stock-based compensation granted by the Company were RSUs. The total amount of stock-based compensation costs recognized in general and administrative expense in the accompanying consolidated statements of operations and comprehensive income (loss) was $4.8 million for the years ended 2023 and 2022 and $3.7 million for the year ended 2021. All awards of unvested restricted stock units are expected to fully vest over the next one to five years.
Performance-Based RSUs (effectiveness of Initial Public Offering)
Pursuant to the Omnibus Incentive Plan, the Company made performance-based RSUs to certain employees and non-employee directors. The performance condition required the Company to effectively file a shelf registration statement. Up until the point of filing the registration statement, performance was not deemed probable and accordingly, no RSUs had the capability of vesting and no stock-based compensation expense was recorded. As a result of the Company's initial public offering in August 2020, the performance condition was satisfied and the Company recorded a stock-based compensation expense catch-up adjustment of $1.4 million. The vesting terms of these grants are specific to the individual grant and vest in equal annual installments over the next year.
The following table summarizes performance-based RSU activity for the years ended December 31, 2023, 2022, and 2021:
|
|
|
|
|
|
|
|
|
|
|
|
|
|
|
|
|
|
|
|
|
|
|
|
|
|
|
|
|
|
|
|
|
|
|
|
|
|
|
|
|
2023 |
|
2022 |
|
2021 |
|
|
Shares |
|
Weighted Average Grant Date Fair Value per Share |
|
Shares |
|
Weighted Average Grant Date Fair Value per Share |
|
Shares |
|
Weighted Average Grant Date Fair Value per Share |
| Unvested RSU grants outstanding as of December 31, 2022 |
|
61,391 |
|
|
$ |
19.75 |
|
|
157,380 |
|
|
$ |
19.75 |
|
|
207,803 |
|
|
$ |
19.75 |
|
|
|
|
|
|
|
|
|
|
|
|
|
|
|
|
|
|
|
|
|
|
|
|
|
|
|
| Vested during the period |
|
(31,012) |
|
|
19.75 |
|
|
(95,989) |
|
|
19.75 |
|
|
(50,423) |
|
|
19.75 |
|
| Unvested RSU grants outstanding as of December 31, 2023 |
|
30,379 |
|
|
$ |
19.75 |
|
|
61,391 |
|
|
$ |
19.75 |
|
|
157,380 |
|
|
$ |
19.75 |
|
For the years ended 2023, 2022, and 2021, the Company recognized $0.3 million, $0.9 million, and $1.2 million, respectively, in stock-based compensation expense associated with performance-based RSUs. As of December 31, 2023 and December 31, 2022, the remaining unamortized stock-based compensation expense totaled $0.1 million and $0.4 million, respectively, and as of December 31, 2023, these awards are expected to be recognized over a remaining weighted average period of one year. These units are subject to graded vesting and stock-based compensation expense is recognized ratably over the requisite service period for each vesting tranche in the award.
The grant date fair value of unvested RSUs is calculated as the per share price in the private offering that closed on December 23, 2019.
Service-Based RSUs
Pursuant to the Omnibus Incentive Plan, the Company has made service-based RSU grants to certain employees and non-employee directors. The vesting terms of these grants are specific to the individual grant and vest in equal annual installments over the next one to five years.
The following table summarizes service-based RSU activity for the years ended December 31, 2023, 2022, and 2021:
|
|
|
|
|
|
|
|
|
|
|
|
|
|
|
|
|
|
|
|
|
|
|
|
|
|
|
|
|
|
|
|
|
|
|
|
|
|
|
|
|
2023 |
|
2022 |
|
2021 |
|
|
Shares |
|
Weighted Average Grant Date Fair Value per Share |
|
Shares |
|
Weighted Average Grant Date Fair Value per Share |
|
Shares |
|
Weighted Average Grant Date Fair Value per Share |
| Unvested RSU grants outstanding as of December 31, 2022 |
|
247,079 |
|
|
$ |
19.86 |
|
|
295,207 |
|
|
$ |
17.84 |
|
|
169,793 |
|
|
$ |
18.00 |
|
| Granted during the period |
|
161,757 |
|
|
19.79 |
|
|
148,913 |
|
|
22.09 |
|
|
167,454 |
|
|
17.71 |
|
| Forfeited during the period |
|
(2,213) |
|
|
20.18 |
|
|
(58,922) |
|
|
19.29 |
|
|
(7,673) |
|
|
17.93 |
|
| Vested during the period |
|
(108,515) |
|
|
19.93 |
|
|
(138,119) |
|
|
18.20 |
|
|
(34,367) |
|
|
18.00 |
|
| Unvested RSU grants outstanding as of December 31, 2023 |
|
298,108 |
|
|
$ |
19.79 |
|
|
247,079 |
|
|
$ |
19.86 |
|
|
295,207 |
|
|
$ |
17.84 |
|
For the years ended 2023 and 2022, the Company recognized $2.8 million and for the year ended 2021 recognized $1.6 million in stock-based compensation expense associated with service-based RSUs. As of December 31, 2023 and December 31, 2022, the remaining unamortized stock-based compensation expense totaled $3.4 million and $3.0 million, respectively, and as of December 31, 2023, these awards are expected to be recognized over a remaining weighted average period of 1.8 years. Stock-based compensation expense is recognized on a straight-line basis over the total requisite service period for the entire award.
The grant date fair value of service-based unvested RSUs is calculated as the per share price determined in the initial public offering for awards granted in 2020, and as the per share price of the Company’s stock on the date of grant for those granted in years subsequent to 2020.
Performance-Based RSUs (total shareholder return)
Pursuant to the Omnibus Incentive Plan, the Company has made market-based RSU grants to certain employees. These grants are subject to the participant’s continued service over a three year period with 40% of the award based on the Company’s total shareholder return (“TSR”) as compared to the TSR of identified peer companies and 60% of the award based on total absolute TSR over the cumulative three year period. The performance period of these grants runs through March 8, 2024, February 28, 2025, and February 28, 2026. Grant date fair value of the market-based share awards was calculated using the Monte Carlo simulation model, which incorporated stock price volatility of the Company and each of the Company’s peers and other variables over the performance period. Significant inputs for the current period calculation were expected volatility of the Company of 29.0% and expected volatility of the Company's peers, ranging from 32.2% to 102.8%, with an average volatility of 46.7% and a risk-free interest rate of 4.46%. The fair value per share on the grant date specific to the target TSR relative to the Company’s peers was $24.13 and the target absolute TSR was $20.15 for a weighted average grant date fair value of $21.57 per share. Stock-based compensation expense associated with unvested market-based share awards is recognized on a straight-line basis over the minimum required service period, which is three years.
The following table summarizes market-based RSU activity for the years ended December 31, 2023, 2022, and 2021:
|
|
|
|
|
|
|
|
|
|
|
|
|
|
|
|
|
|
|
|
|
|
|
|
|
|
|
|
|
|
|
|
|
|
|
|
|
|
|
|
|
2023 |
|
2022 |
|
2021 |
|
|
Shares |
|
Weighted Average Grant Date Fair Value per Share |
|
Shares |
|
Weighted Average Grant Date Fair Value per Share |
|
Shares |
|
Weighted Average Grant Date Fair Value per Share |
| Unvested RSU grants outstanding as of December 31, 2022 |
|
177,350 |
|
|
$ |
19.83 |
|
|
134,467 |
|
|
$ |
17.77 |
|
|
— |
|
|
$ |
— |
|
| Granted during the period |
|
81,751 |
|
|
21.57 |
|
|
106,645 |
|
|
22.38 |
|
|
135,766 |
|
|
17.77 |
|
| Forfeited during the period |
|
(543) |
|
|
19.36 |
|
|
(63,762) |
|
|
19.76 |
|
|
(1,299) |
|
|
17.77 |
|
| Unvested RSU grants outstanding as of December 31, 2023 |
|
258,558 |
|
|
$ |
20.38 |
|
|
177,350 |
|
|
$ |
19.83 |
|
|
134,467 |
|
|
$ |
17.77 |
|
|
|
|
|
|
|
|
|
|
|
|
|
|
For the years ended 2023, 2022, and 2021, the Company recognized $1.7 million, $0.9 million, and $0.6 million, respectively, in stock-based compensation expense associated with market-based RSUs. As of December 31, 2023 and December 31, 2022, the remaining unamortized stock-based compensation expense totaled $2.1 million and $2.0 million, respectively, and as of December 31, 2023, these awards are expected to be recognized over a remaining weighted average period of 1.7 years.
Alignment of Interest Program
During March 2021, the Company adopted the Alignment of Interest Program (the “Program”), which allows employees to elect to receive a portion of their annual bonus in unvested RSUs in the first quarter of the following year that would then vest over a four-year service period beginning in the period that the bonus relates. The Program is deemed to be a liability-classified award (accounted for as an equity-classified award as the service date precedes the grant date and the award would otherwise be classified as equity on grant date), which will be fair-valued and accrued over the applicable service period. The total estimated fair value of the elections made for 2023 under the Program was approximately $0.5 million. The award will be remeasured to fair value each reporting period until the unvested RSUs are granted. For the years ended December 31, 2023 and 2022, the Company recognized approximately $0.1 million and for the year ended 2021, recognized $0.2 million in stock-based compensation expense associated with these awards. Previous awards under the Program that have been granted are included within service-based RSUs above.
Note 11 – Earnings Per Share
Net income per common share has been computed pursuant to the guidance in the FASB ASC Topic 260, Earnings per Share. Basic earnings per share is computed by dividing net income attributable to common stockholders by the weighted-average number of common shares outstanding for the period. Diluted earnings per share is similarly calculated except that the denominator is increased by using the treasury stock method to determine the potential dilutive effect of the Company’s outstanding unvested RSUs and unsettled shares under open forward equity contracts and using the if-converted method to determine the potential dilutive effect of the OP Units. The Company has noncontrolling interests in the form of OP Units which are convertible into common stock and represent potentially dilutive securities, as the OP Units may be redeemed for cash or, at the Company’s election, exchanged for shares of the Company’s common stock on a one-for-one basis.
The following table is a reconciliation of the numerator and denominator used in the computation of basic and diluted net income per common share for the years ended December 31, 2023, 2022, and 2021.
|
|
|
|
|
|
|
|
|
|
|
|
|
|
|
|
|
|
|
|
|
|
|
Year Ended December 31, |
| (in thousands, except share and per share data) |
|
2023 |
|
2022 |
|
2021 |
| Numerator: |
|
|
|
|
|
|
| Net income |
|
$ |
6,890 |
|
|
$ |
8,205 |
|
|
$ |
3,150 |
|
| Net income attributable to noncontrolling interest |
|
(53) |
|
|
(88) |
|
|
(104) |
|
| Net income attributable to common shares, basic |
|
6,837 |
|
|
8,117 |
|
|
3,046 |
|
| Net income attributable to noncontrolling interest |
|
53 |
|
|
88 |
|
|
104 |
|
| Net income attributable to common shares, diluted |
|
$ |
6,890 |
|
|
$ |
8,205 |
|
|
$ |
3,150 |
|
|
|
|
|
|
|
|
| Denominator: |
|
|
|
|
|
|
| Weighted average common shares outstanding, basic |
|
63,922,973 |
|
|
49,517,977 |
|
|
36,999,459 |
|
| Effect of dilutive shares for diluted net income per common share: |
|
|
|
|
|
|
| OP Units |
|
501,751 |
|
|
526,859 |
|
|
1,377,335 |
|
| Unvested RSUs |
|
165,420 |
|
|
248,602 |
|
|
295,771 |
|
| Unsettled shares under open forward equity contracts |
|
75,295 |
|
|
138,384 |
|
|
— |
|
| Weighted average common shares outstanding, diluted |
|
64,665,439 |
|
|
50,431,822 |
|
|
38,672,565 |
|
|
|
|
|
|
|
|
| Net income available to common stockholders per common share, basic |
|
$ |
0.11 |
|
|
$ |
0.16 |
|
|
$ |
0.08 |
|
| Net income available to common stockholders per common share, diluted |
|
$ |
0.11 |
|
|
$ |
0.16 |
|
|
$ |
0.08 |
|
As of December 31, 2023 and 2022, there were 479,298 and 513,467 of OP Units outstanding, respectively.
Note 12 – Commitments and Contingencies
Litigation and Regulatory Matters
In the ordinary course of business, from time to time, the Company may be subject to litigation, claims and regulatory matters, none of which are currently outstanding, which the Company believes could have, individually or in the aggregate, a material adverse effect on its business, financial condition or results of operations, liquidity or cash flows.
Environmental Matters
The Company is subject to environmental regulations related to the ownership of real estate. The cost of complying with the environmental regulations was not material to the Company’s results of operations for any of the periods presented. The Company is not aware of any environmental condition on any of its properties that is likely to have a material adverse effect on the consolidated financial statements when the fair value of such liability can be reasonably estimated and is required to be recognized.
Commitments
In the normal course of business, the Company enters into various types of commitments to purchase real estate properties, fund development projects, or extend funds under mortgage notes receivable. These commitments are generally subject to the Company’s customary due diligence process and, accordingly, a number of specific conditions must be met before the Company is obligated to purchase or extend funding. As of December 31, 2023, the Company had tenant improvement allowance commitments totaling approximately $4.1 million, which is expected to be funded over the next two years. Additionally, as of December 31, 2023, the Company had commitments to fund 18 properties under development totaling $35.7 million, all of which is expected to be funded over the next 12 months. The Company also had commitments to extend funds under mortgage notes receivable of $13.7 million which is expected to occur throughout 2024.
In August 2021, the Company entered into a lease agreement on a new corporate office space, which is classified as an operating lease. The Company began operating out of the new office in February 2022. The lease has a remaining noncancellable term of 8.6 years that expires on July 31, 2032 and is renewable at the Company’s option for two additional periods of five years. Future minimum base rental payments under the lease are outlined in “Note 3 – Leases.” Annual rent expense, excluding operating expenses, is approximately $0.5 million during the initial term.
As of December 31, 2023, the Company did not have any other material commitments for re-leasing costs, recurring capital expenditures, non-recurring building improvements, or similar types of costs.
Note 13 – Related-Party Transactions
Effective with the commencement of the Company’s operations on December 23, 2019, the Company executed a facilities agreement with a subsidiary of EB Arrow Holdings, LLC, which was subsequently amended in April 2021 and ultimately terminated in July 2021. Under the facilities agreement, the Company shared in office rent by paying a fixed monthly rate and office related expenses based on employee headcount. No expenses were incurred during the years ended 2023 and 2022. For the year ended 2021, the Company incurred approximately $0.1 million in related expenses.
Note 14 – Subsequent Events
The Company has evaluated all events that occurred subsequent to December 31, 2023 through the date on which these consolidated financial statements were issued to determine whether any of these events required disclosure in the financial statements.
Common Stock Dividend
On February 13, 2024, the Company's Board of Directors declared a cash dividend of $0.205 per share for the first quarter of 2024. The dividend will be paid on March 28, 2024 to stockholders of record on March 15, 2024.
January Follow-On Offering
In January 2024, the Company completed a public offering of 11,040,000 shares of its common stock at the public offering price of $18.00 per share. In connection with the offering, the Company entered into forward sale agreements for 11,040,000 shares of its common stock. The Company did not initially receive any proceeds from the sale of shares of common stock by the forward purchasers. The Company expects to physically settle the forward sale agreements (by delivery of shares of common stock) and receive proceeds from the sale of those shares upon one or more forward settlement dates, which shall occur no later than January 9, 2025. The Company may also elect to cash settle or net share settle all or a portion of its obligations under a forward sale agreement if it concludes it is in its best interest to do so. If the Company elects to cash settle a forward sale agreement, it may not receive any proceeds and it may owe cash to the relevant counterparty in certain circumstances. No physical settlement has occurred through the date on which these consolidated financial statements were issued.
Item 9. Changes in and Disagreements With Accountants on Accounting and Financial Disclosure
None.
Item 9A. Controls and Procedures
Disclosure Controls and Procedures.
At the end of the period covered by this report, the Company conducted an evaluation, under the supervision and with the participation of its principal executive officer and principal financial officer, of its disclosure controls and procedures (as defined in Rules 13a-15(e) and 15d-15(e) under the Exchange Act). Based on this evaluation, the Company’s principal executive officer and principal financial officer concluded that its disclosure controls and procedures are effective to ensure that information required to be disclosed by us in reports that the Company files or submits under the Exchange Act is recorded, processed, summarized and reported within the time periods specified in SEC rules and forms.
Management’s Annual Report on Internal Control Over Financial Reporting.
The management of the Company is responsible for establishing and maintaining adequate internal control over financial reporting, as such term is defined in Rules 13a-15(f) and 15d-15(f) under the Exchange Act. Internal control over financial reporting is a process to provide reasonable assurance regarding the reliability of the Company’s financial reporting and the preparation of financial statements for external purposes in accordance with U.S. GAAP. Because of its inherent limitations, internal control over financial reporting is not intended to provide absolute assurance that a misstatement of our financial statements would be prevented or detected.
Under the supervision and with the participation of management, including the principal executive officer and principal financial officer, the Company conducted an evaluation of the effectiveness of internal control over financial reporting based on the framework in Internal Control — Integrated Framework (2013) issued by the Committee of Sponsoring Organizations of the Treadway Commission.
Based on this evaluation, management has concluded that the Company’s internal control over financial reporting was effective as of December 31, 2023.
The effectiveness of the Company’s internal control over financial reporting as of December 31, 2023 has been audited by KPMG LLP, an independent registered public accounting firm, as stated in its report, which is included under Item 8 of this Annual Report on Form 10-K.
Changes in Internal Control over Financial Reporting.
During the period covered by this report, there have been no changes in the Company’s internal control over financial reporting identified in connection with the evaluation described above that have materially affected, or are reasonably likely to materially affect, our internal control over financial reporting.
Item 9B. Other Information
Not applicable.
Item 9C. Disclosure Regarding Foreign Jurisdictions that Prevent Inspections
Not applicable.
PART III
Item 10. Directors. Executive Officers and Corporate Governance
The information required by this item will be included in the sections entitled “Directors and Management” and “Corporate Governance” of our definitive Proxy Statement for the 2024 Annual Meeting of Stockholders, to be filed pursuant to Regulation 14A, and is incorporated herein by reference.
Our written code of business conduct and ethics, the Code of Business Conduct and Ethics, applies to all of our employees, officers and directors, including our principal executive officer, principal financial officer, principal accounting officer or controller or persons performing similar functions. The Code of Business Conduct and Ethics is available on our corporate website at https://www.netstreit.com/ in the Investor Relations section under “Governance – Corporate Policies and Governance Documents.” We intend to promptly disclose on our website or in a Current Report on Form 8-K in the future (i) the date and nature of any amendment (other than technical, administrative or other non-substantive amendments) to the Code of Business Conduct and Ethics that applies to our principal executive officer, principal financial officer, principal accounting officer or controller or persons performing similar functions and relates to any element of the code of ethics definition enumerated in Item 406(b) of Regulation S-K and (ii) the nature of any waiver, including an implicit waiver, from a provision of the Code of Business Conduct and Ethics that is granted to one of these specified individuals that relates to one or more of the elements of the code of ethics definition enumerated in Item 406(b) of Regulation S-K, the name of such person who is granted the waiver and the date of the waiver.
Item 11. Executive Compensation
The information required by this item will be included in the sections entitled “Compensation Discussion and Analysis,” “Executive Compensation,” “Pay Ratio,” “Corporate Governance - Director Compensation,” “Corporate Governance - Other Board Information - Compensation Committee Interlocks and Insider Participation” and “Compensation Committee Report” of our definitive Proxy Statement for the 2024 Annual Meeting of Stockholders, to be filed pursuant to Regulation 14A, and is incorporated herein by reference.
Item 12. Security Ownership of Certain Beneficial Owners and Management and Related Stockholder Matters
Except as set forth herein, the information required by this item will be included in the section entitled “Corporate Governance - Security Ownership of Certain Beneficial Owners, Directors and Management” of our definitive Proxy Statement for the 2024 Annual Meeting of Stockholders, to be filed pursuant to Regulation 14A, and is incorporated herein by reference.
Equity Compensation Plan Information
The following table summarizes the equity compensation plan under which our common stock may be issued as of December 31, 2023:
|
|
|
|
|
|
|
|
|
|
|
|
|
|
|
|
|
|
|
|
|
| Plan Category |
|
Number of Securities to be Issued Upon Exercise of Outstanding Options, Warrants and Rights
(a)(2)
|
|
Weighted-Average Exercise Price of Outstanding Options, Warrants and Rights
(b) |
|
Number of Securities Remaining Available for Future Issuance Under Equity Compensation Plans (excluding securities reflected in column (a))
(c) |
Equity compensation plans approved by security holders (1) |
|
587,045 |
|
|
$ |
— |
|
|
1,014,906 |
|
| Equity compensation plans not approved by security holders |
|
— |
|
|
— |
|
|
— |
|
| Total |
|
587,045 |
|
|
$ |
— |
|
|
1,014,906 |
|
(1) Relates to restricted stock units (“RSUs”) available for issuance under our 2019 Omnibus Incentive Compensation Plan.
(2) Includes 587,045 shares that employees and non-employee directors have the right to acquire upon the vesting of the equivalent RSUs that they have been awarded under our 2019 Omnibus Incentive Compensation Plan.
Item 13. Certain Relationships and Related Transactions, and Director Independence
The information required by this item will be included in the sections entitled “Certain Relationships and Related Party Transactions” and “Corporate Governance - Independence of Directors” of our definitive Proxy Statement for the 2024 Annual Meeting of Stockholders, to be filed pursuant to Regulation 14A, and is incorporated herein by reference.
Item 14. Principal Accountant Fees and Services
Our independent registered public accounting firm is KPMG LLP, Chicago, Illinois Auditor Firm ID: 185.
The information required by this item will be included in the section entitled “Fees of Independent Accountants” of our definitive Proxy Statement for the 2024 Annual Meeting of Stockholders, to be filed pursuant to Regulation 14A, and is incorporated herein by reference.
PART IV
Item 15. Exhibit and Financial Statement Schedules
|
|
|
|
|
|
| 15(a)(1) |
The following documents are filed as a part of this Annual Report on Form 10-K: |
|
|
|
|
|
|
|
|
|
|
|
|
| 15(a)(2) |
The following is a list of the financial statement schedules required by Item 8: |
|
|
|
|
| 15(a)(3) |
Exhibits |
|
|
|
|
|
|
|
|
|
| Exhibit No. |
|
Description |
| 3.1 |
|
|
|
|
|
|
|
|
|
|
|
|
|
|
| 3.2 |
|
|
|
|
|
| 4.1 |
|
|
|
|
|
| 4.2 |
|
|
|
|
|
| 10.1 |
|
|
|
|
|
| 10.2† |
|
|
|
|
|
| 10.3† |
|
|
|
|
|
| 10.4† |
|
|
|
|
|
10.5† |
|
|
10.6† |
|
|
|
|
|
10.7† |
|
|
|
|
|
10.8† |
|
|
|
|
|
10.9† |
|
|
|
|
|
10.10† |
|
|
|
|
|
10.11† |
|
|
|
|
|
10.12† |
|
|
|
|
|
10.13† |
|
|
|
|
|
10.14† |
|
|
|
|
|
10.15† |
|
|
|
|
|
| 10.16 |
|
|
|
|
|
|
|
|
|
|
|
|
|
|
10.17# |
|
Credit Agreement, dated as of August 11, 2022, by and between NETSTREIT Corp., NETSTREIT, L.P., the several financial institutions party thereto, PNC Bank, National Association, Wells Fargo Bank, National Association and U.S. Bank, National Association, Capital One, National Association, The Huntington National Bank, Regions Bank, The Bank of Nova Scotia, TD Bank, N.A., and Truist Bank, PNC Capital Markets LLC, U.S. Bank, National Association and Wells Fargo Securities, LLC, and PNC Capital Markets LLC (incorporated by reference to Exhibit 10.1 to the Registrant’s Current Report on Form 8-K filed with the SEC on August 16, 2022). |
|
|
|
10.18*# |
|
Amended and Restated Credit Agreement, dated as of June 15, 2023, between NETSTREIT, L.P., NETSTREIT Corp., the several institutions party thereto, as lenders, and Wells Fargo Bank, National Association, as Administrative Agent (incorporated by reference to Exhibit 10.1 to the Registrant's Current Report on Form 8-K filed with the SEC on June 20, 2023). |
|
|
|
| 10.19 |
|
|
|
|
|
| 21.1 |
|
|
|
|
|
| 23.1* |
|
|
|
|
|
| 24.1* |
|
|
|
|
|
| 31.1* |
|
|
|
|
|
| 31.2* |
|
|
|
|
|
| 32.1*, *** |
|
|
|
|
|
| 32.2*, *** |
|
|
|
|
|
97*† |
|
|
|
|
|
| 101.INS** |
|
XBRL Instance Document. |
|
|
|
| 101.SCH** |
|
XBRL Taxonomy Extension Schema Document. |
|
|
|
| 101.CAL** |
|
XBRL Taxonomy Extension Calculation Linkbase Document. |
|
|
|
| 101.LAB** |
|
XBRL Taxonomy Extension Label Linkbase Document. |
|
|
|
| 101.PRE** |
|
XBRL Taxonomy Extension Presentation Linkbase Document. |
|
|
|
| 101.DEF** |
|
XBRL Taxonomy Extension Definition Linkbase Document. |
|
|
|
|
|
|
|
|
|
| * |
|
Filed herewith. |
| ** |
|
Submitted electronically with the report. |
| *** |
|
Furnished, not filed. |
† |
|
Management contract or compensatory plan or arrangement. |
| # |
|
Certain of the exhibits and schedules to this exhibit have been omitted in accordance with Regulation S-K Item 601(a)(5). The Registrant agrees to furnish a copy of all omitted exhibits and schedules to the SEC upon its request. |
The agreements and other documents filed as exhibits to this Annual Report on Form 10-K are not intended to provide factual information or other disclosure other than with respect to the terms of the agreements or other documents themselves, and you should not rely on them for that purpose. In particular, any representations and warranties made by us in these agreements or other documents were made solely within the specific context of the relevant agreement or document and may not describe the actual state of affairs as of the date they were made or at any other time.
Item 16. Form 10-K Summary Pursuant to the requirements of Section 13 or 15(d) of the Securities Exchange Act of 1934, the registrant has duly caused this report to be signed on its behalf by the undersigned, thereunto duly authorized.
None.
SIGNATURES
|
|
|
|
|
|
|
|
|
|
|
|
|
NETSTREIT Corp. |
|
|
|
|
|
|
|
Signature and Title |
|
Date |
|
|
|
|
|
/s/ MARK MANHEIMER |
|
Date: February 14, 2024 |
|
Mark Manheimer |
|
|
|
President, Chief Executive Officer, Secretary and Director |
|
|
|
(Principal Executive Officer) |
|
|
POWER OF ATTORNEY
Each person whose signature appears below constitutes and appoints each of Mark Manheimer and Daniel Donlan, acting alone or together with another attorney-in-fact, as his or her true and lawful attorney-in- fact and agent, with full power of substitution and resubstitution, for such person and in his or her name, place and stead, in any and all capacities, to sign any or all amendments to this Annual Report on Form 10-K, and to file the same, with all exhibits thereto, and other documents in connection therewith, with the Securities and Exchange Commission, granting unto said attorneys-in-fact and agents, and each of them, full power and authority to do and perform each and every act and thing requisite and necessary to be done in and about the premises, as fully to all intents and purposes as he might or could do in person, hereby ratifying and confirming all that said attorney-in-fact and agent, or his or her substitute or substitutes, may lawfully do or cause to be done by virtue hereof.
Pursuant to the requirements of the Securities Exchange Act of 1934, this report has been signed below by the following persons on behalf of the registrant and in the capacities and on the dates indicated.
|
|
|
|
|
|
|
|
|
|
|
|
|
/s/ MARK MANHEIMER |
|
Date: February 14, 2024 |
|
Mark Manheimer |
|
|
|
President, Chief Executive Officer, Secretary and Director |
|
|
|
(Principal Executive Officer) |
|
|
|
|
|
|
|
/s/ DANIEL DONLAN |
|
Date: February 14, 2024 |
|
Daniel Donlan |
|
|
|
Chief Financial Officer and Treasurer |
|
|
|
(Principal Financial Officer) |
|
|
|
|
|
|
|
/s/ PATRICIA GIBBS |
|
Date: February 14, 2024 |
|
Patricia Gibbs |
|
|
|
Senior Vice President and Chief Accounting Officer |
|
|
|
(Principal Accounting Officer) |
|
|
|
|
|
|
|
/s/ TODD MINNIS |
|
Date: February 14, 2024 |
|
Todd Minnis |
|
|
|
Chairman of the Board of Directors |
|
|
|
|
|
|
|
/s/ MATTHEW TROXELL |
|
Date: February 14, 2024 |
|
Matthew Troxell |
|
|
|
Director |
|
|
|
|
|
|
|
/s/ LORI WITTMAN |
|
Date: February 14, 2024 |
|
Lori Wittman |
|
|
|
Director |
|
|
|
|
|
|
|
/s/ ROBIN ZEIGLER |
|
Date: February 14, 2024 |
|
Robin Zeigler |
|
|
|
Director |
|
|
|
|
|
|
|
/s/ HEIDI EVERETT |
|
Date: February 14, 2024 |
|
Heidi Everett |
|
|
|
Director |
|
|
|
|
|
|
|
/s/ MICHAEL CHRISTODOLOU |
|
Date: February 14, 2024 |
|
Michael Christodolou |
|
|
|
Director |
|
|
|
|
|
|
|
|
|
|
|
|
|
|
|
|
|
|
|
|
|
|
|
|
|
|
|
|
|
|
|
|
|
|
|
|
|
|
|
|
|
|
|
|
|
|
|
|
|
|
|
|
|
|
|
|
|
|
|
|
|
|
|
|
|
|
|
|
|
|
|
|
|
|
|
|
|
|
|
|
|
|
|
|
|
|
|
|
|
|
|
|
|
|
|
|
|
|
| NETSTREIT Corp. |
| Schedule III - Real Estate and Accumulated Depreciation |
| December 31, 2023 |
| (Dollars in thousands) |
| Description |
|
|
|
Initial Cost to Company |
|
Cost Capitalized Subsequent to Acquisition(1) |
|
Gross Amount as of December 31, 2023(2), (3) |
|
|
|
|
|
|
|
|
|
|
|
| Industry |
|
City |
|
State |
|
Encumbrances |
|
Land |
|
Building and Improvements |
|
Land |
|
Building and Improvements |
|
Land |
|
Building and Improvements |
|
Total |
|
Accumulated Depreciation(3), (4) |
|
Date of Construction |
|
Date Acquired(5) |
|
Life on Which Depreciation in Statements of Operations and Comprehensive Income is Computed |
| Apparel |
|
Indianola |
|
IA |
|
$ |
— |
|
|
$ |
312 |
|
|
$ |
686 |
|
|
$ |
— |
|
|
$ |
— |
|
|
$ |
312 |
|
|
$ |
686 |
|
|
$ |
998 |
|
|
$ |
(124) |
|
|
2013 |
|
12/23/2019 |
|
6 |
to |
31 |
Years |
| Apparel |
|
Rio Grande City |
|
TX |
|
— |
|
|
640 |
|
|
831 |
|
|
— |
|
|
— |
|
|
640 |
|
|
831 |
|
|
1,471 |
|
|
(154) |
|
|
2005 |
|
12/23/2019 |
|
6 |
to |
28 |
Years |
| Apparel |
|
Laredo |
|
TX |
|
— |
|
|
590 |
|
|
1,207 |
|
|
— |
|
|
— |
|
|
590 |
|
|
1,207 |
|
|
1,797 |
|
|
(202) |
|
|
2010 |
|
12/23/2019 |
|
6 |
to |
32 |
Years |
| Apparel |
|
Odessa |
|
TX |
|
— |
|
|
599 |
|
|
1,086 |
|
|
— |
|
|
— |
|
|
599 |
|
|
1,086 |
|
|
1,685 |
|
|
(177) |
|
|
2012 |
|
12/23/2019 |
|
6 |
to |
32 |
Years |
| Auto Parts |
|
New Richmond |
|
WI |
|
— |
|
|
67 |
|
|
1,191 |
|
|
— |
|
|
— |
|
|
67 |
|
|
1,191 |
|
|
1,258 |
|
|
(169) |
|
|
2013 |
|
12/23/2019 |
|
9 |
to |
32 |
Years |
| Automotive Service |
|
Colorado Springs |
|
CO |
|
— |
|
|
429 |
|
|
1,056 |
|
|
— |
|
|
196 |
|
|
429 |
|
|
1,252 |
|
|
1,681 |
|
|
(253) |
|
|
1978 |
|
12/23/2019 |
|
10 |
to |
19 |
Years |
| Banking |
|
Elizabethtown |
|
PA |
|
— |
|
|
1,264 |
|
|
1,486 |
|
|
— |
|
|
— |
|
|
1,264 |
|
|
1,486 |
|
|
2,750 |
|
|
(280) |
|
|
1916 |
|
12/23/2019 |
|
9 |
to |
22 |
Years |
| Banking |
|
Atco |
|
NJ |
|
— |
|
|
686 |
|
|
1,941 |
|
|
— |
|
|
— |
|
|
686 |
|
|
1,941 |
|
|
2,627 |
|
|
(362) |
|
|
1920 |
|
12/23/2019 |
|
9 |
to |
22 |
Years |
| Banking |
|
Vineland |
|
NJ |
|
— |
|
|
620 |
|
|
270 |
|
|
— |
|
|
— |
|
|
620 |
|
|
270 |
|
|
890 |
|
|
(85) |
|
|
1973 |
|
12/23/2019 |
|
9 |
to |
15 |
Years |
| Casual Dining |
|
Greensburg |
|
IN |
|
— |
|
|
924 |
|
|
1,521 |
|
|
— |
|
|
— |
|
|
924 |
|
|
1,521 |
|
|
2,445 |
|
|
(223) |
|
|
2007 |
|
12/23/2019 |
|
8 |
to |
32 |
Years |
| Discount Retail |
|
Holland |
|
MI |
|
— |
|
|
1,865 |
|
|
4,833 |
|
|
— |
|
|
— |
|
|
1,865 |
|
|
4,833 |
|
|
6,698 |
|
|
(878) |
|
|
1994 |
|
12/23/2019 |
|
6 |
to |
26 |
Years |
| Dollar Stores |
|
Norman |
|
OK |
|
— |
|
|
417 |
|
|
836 |
|
|
— |
|
|
— |
|
|
417 |
|
|
836 |
|
|
1,253 |
|
|
(129) |
|
|
2013 |
|
12/23/2019 |
|
9 |
to |
33 |
Years |
| Dollar Stores |
|
Windham |
|
OH |
|
— |
|
|
332 |
|
|
834 |
|
|
— |
|
|
— |
|
|
332 |
|
|
834 |
|
|
1,166 |
|
|
(132) |
|
|
2013 |
|
12/23/2019 |
|
9 |
to |
31 |
Years |
| Dollar Stores |
|
McComb |
|
OH |
|
— |
|
|
209 |
|
|
868 |
|
|
— |
|
|
— |
|
|
209 |
|
|
868 |
|
|
1,077 |
|
|
(134) |
|
|
2013 |
|
12/23/2019 |
|
9 |
to |
32 |
Years |
| Dollar Stores |
|
Birmingham |
|
OH |
|
— |
|
|
210 |
|
|
939 |
|
|
— |
|
|
— |
|
|
210 |
|
|
939 |
|
|
1,149 |
|
|
(144) |
|
|
2013 |
|
12/23/2019 |
|
9 |
to |
32 |
Years |
| Dollar Stores |
|
Brookfield |
|
MA |
|
— |
|
|
468 |
|
|
1,149 |
|
|
— |
|
|
— |
|
|
468 |
|
|
1,149 |
|
|
1,617 |
|
|
(168) |
|
|
2014 |
|
12/23/2019 |
|
9 |
to |
33 |
Years |
| Dollar Stores |
|
Friedens |
|
PA |
|
— |
|
|
311 |
|
|
931 |
|
|
— |
|
|
— |
|
|
311 |
|
|
931 |
|
|
1,242 |
|
|
(148) |
|
|
2014 |
|
12/23/2019 |
|
10 |
to |
30 |
Years |
| Dollar Stores |
|
Strawberry Point |
|
IA |
|
— |
|
|
304 |
|
|
852 |
|
|
— |
|
|
— |
|
|
304 |
|
|
852 |
|
|
1,156 |
|
|
(129) |
|
|
2016 |
|
12/23/2019 |
|
12 |
to |
32 |
Years |
| Dollar Stores |
|
Belgrade |
|
MN |
|
— |
|
|
414 |
|
|
746 |
|
|
— |
|
|
— |
|
|
414 |
|
|
746 |
|
|
1,160 |
|
|
(134) |
|
|
2016 |
|
12/23/2019 |
|
12 |
to |
27 |
Years |
| Dollar Stores |
|
Lake City |
|
IA |
|
— |
|
|
250 |
|
|
848 |
|
|
— |
|
|
— |
|
|
250 |
|
|
848 |
|
|
1,098 |
|
|
(129) |
|
|
2016 |
|
12/23/2019 |
|
12 |
to |
32 |
Years |
| Dollar Stores |
|
Bogue Chitto |
|
MS |
|
— |
|
|
105 |
|
|
963 |
|
|
— |
|
|
— |
|
|
105 |
|
|
963 |
|
|
1,068 |
|
|
(143) |
|
|
2013 |
|
12/23/2019 |
|
9 |
to |
33 |
Years |
| Dollar Stores |
|
Hurley |
|
MS |
|
— |
|
|
246 |
|
|
1,249 |
|
|
— |
|
|
— |
|
|
246 |
|
|
1,249 |
|
|
1,495 |
|
|
(187) |
|
|
2013 |
|
12/23/2019 |
|
9 |
to |
33 |
Years |
| Dollar Stores |
|
Meridian |
|
MS |
|
— |
|
|
287 |
|
|
940 |
|
|
— |
|
|
— |
|
|
287 |
|
|
940 |
|
|
1,227 |
|
|
(138) |
|
|
2014 |
|
12/23/2019 |
|
10 |
to |
33 |
Years |
| Dollar Stores |
|
Buckatunna |
|
MS |
|
— |
|
|
136 |
|
|
938 |
|
|
— |
|
|
— |
|
|
136 |
|
|
938 |
|
|
1,074 |
|
|
(138) |
|
|
2014 |
|
12/23/2019 |
|
10 |
to |
33 |
Years |
| Dollar Stores |
|
Cleveland |
|
TX |
|
— |
|
|
209 |
|
|
809 |
|
|
— |
|
|
— |
|
|
209 |
|
|
809 |
|
|
1,018 |
|
|
(123) |
|
|
2014 |
|
12/23/2019 |
|
10 |
to |
33 |
Years |
| Dollar Stores |
|
Fox Lake |
|
WI |
|
— |
|
|
212 |
|
|
882 |
|
|
— |
|
|
— |
|
|
212 |
|
|
882 |
|
|
1,094 |
|
|
(126) |
|
|
2018 |
|
12/23/2019 |
|
14 |
to |
34 |
Years |
| Drug Stores & Pharmacies |
|
Fredericksburg |
|
VA |
|
— |
|
|
3,551 |
|
|
2,951 |
|
|
— |
|
|
— |
|
|
3,551 |
|
|
2,951 |
|
|
6,502 |
|
|
(384) |
|
|
2008 |
|
12/23/2019 |
|
14 |
to |
33 |
Years |
| Drug Stores & Pharmacies |
|
Indianapolis |
|
IN |
|
— |
|
|
2,410 |
|
|
2,377 |
|
|
— |
|
|
— |
|
|
2,410 |
|
|
2,377 |
|
|
4,787 |
|
|
(359) |
|
|
2003 |
|
12/23/2019 |
|
9 |
to |
29 |
Years |
| Drug Stores & Pharmacies |
|
Amelia |
|
OH |
|
— |
|
|
1,170 |
|
|
1,517 |
|
|
— |
|
|
— |
|
|
1,170 |
|
|
1,517 |
|
|
2,687 |
|
|
(278) |
|
|
1999 |
|
12/23/2019 |
|
10 |
to |
23 |
Years |
| Drug Stores & Pharmacies |
|
Clanton |
|
AL |
|
— |
|
|
630 |
|
|
1,604 |
|
|
— |
|
|
— |
|
|
630 |
|
|
1,604 |
|
|
2,234 |
|
|
(231) |
|
|
2004 |
|
12/23/2019 |
|
10 |
to |
31 |
Years |
| Drug Stores & Pharmacies |
|
Franklin |
|
TN |
|
— |
|
|
2,164 |
|
|
1,848 |
|
|
— |
|
|
— |
|
|
2,164 |
|
|
1,848 |
|
|
4,012 |
|
|
(261) |
|
|
2004 |
|
12/23/2019 |
|
10 |
to |
31 |
Years |
| Drug Stores & Pharmacies |
|
Hanover |
|
IN |
|
— |
|
|
727 |
|
|
1,076 |
|
|
— |
|
|
— |
|
|
727 |
|
|
1,076 |
|
|
1,803 |
|
|
(206) |
|
|
2004 |
|
12/23/2019 |
|
15 |
to |
22 |
Years |
| Drug Stores & Pharmacies |
|
Hurricane |
|
WV |
|
— |
|
|
956 |
|
|
1,139 |
|
|
— |
|
|
— |
|
|
956 |
|
|
1,139 |
|
|
2,095 |
|
|
(215) |
|
|
2004 |
|
12/23/2019 |
|
15 |
to |
22 |
Years |
| Drug Stores & Pharmacies |
|
Montgomery |
|
AL |
|
— |
|
|
1,150 |
|
|
1,932 |
|
|
— |
|
|
— |
|
|
1,150 |
|
|
1,932 |
|
|
3,082 |
|
|
(270) |
|
|
2004 |
|
12/23/2019 |
|
15 |
to |
31 |
Years |
| Drug Stores & Pharmacies |
|
Warrior |
|
AL |
|
— |
|
|
369 |
|
|
1,640 |
|
|
— |
|
|
— |
|
|
369 |
|
|
1,640 |
|
|
2,009 |
|
|
(231) |
|
|
2004 |
|
12/23/2019 |
|
15 |
to |
31 |
Years |
| Drug Stores & Pharmacies |
|
Waterford Charter Township |
|
MI |
|
— |
|
|
3,256 |
|
|
2,152 |
|
|
— |
|
|
— |
|
|
3,256 |
|
|
2,152 |
|
|
5,408 |
|
|
(334) |
|
|
2004 |
|
12/23/2019 |
|
15 |
to |
27 |
Years |
| Drug Stores & Pharmacies |
|
Canton |
|
GA |
|
— |
|
|
658 |
|
|
1,789 |
|
|
— |
|
|
— |
|
|
658 |
|
|
1,789 |
|
|
2,447 |
|
|
(277) |
|
|
2004 |
|
12/23/2019 |
|
15 |
to |
27 |
Years |
| Drug Stores & Pharmacies |
|
Austin |
|
MN |
|
— |
|
|
1,121 |
|
|
2,451 |
|
|
— |
|
|
— |
|
|
1,121 |
|
|
2,451 |
|
|
3,572 |
|
|
(388) |
|
|
1989 |
|
12/23/2019 |
|
10 |
to |
27 |
Years |
| Drug Stores & Pharmacies |
|
Albuquerque |
|
NM |
|
— |
|
|
3,744 |
|
|
3,019 |
|
|
— |
|
|
— |
|
|
3,744 |
|
|
3,019 |
|
|
6,763 |
|
|
(397) |
|
|
2010 |
|
12/23/2019 |
|
15 |
to |
33 |
Years |
| Drug Stores & Pharmacies |
|
Savannah |
|
GA |
|
— |
|
|
1,746 |
|
|
1,651 |
|
|
— |
|
|
— |
|
|
1,746 |
|
|
1,651 |
|
|
3,397 |
|
|
(229) |
|
|
1998 |
|
12/23/2019 |
|
14 |
to |
31 |
Years |
| Equipment Rental and Leasing |
|
Idaho Falls |
|
ID |
|
— |
|
|
177 |
|
|
856 |
|
|
— |
|
|
— |
|
|
177 |
|
|
856 |
|
|
1,033 |
|
|
(164) |
|
|
2007 |
|
12/23/2019 |
|
6 |
to |
26 |
Years |
| Farm Supplies |
|
Llano |
|
TX |
|
— |
|
|
634 |
|
|
1,389 |
|
|
— |
|
|
— |
|
|
634 |
|
|
1,389 |
|
|
2,023 |
|
|
(287) |
|
|
2012 |
|
12/23/2019 |
|
6 |
to |
28 |
Years |
| Farm Supplies |
|
Ballard |
|
UT |
|
— |
|
|
519 |
|
|
2,609 |
|
|
— |
|
|
— |
|
|
519 |
|
|
2,609 |
|
|
3,128 |
|
|
(395) |
|
|
2015 |
|
12/23/2019 |
|
10 |
to |
32 |
Years |
| Farm Supplies |
|
Wellington |
|
OH |
|
— |
|
|
308 |
|
|
1,986 |
|
|
— |
|
|
10 |
|
|
308 |
|
|
1,996 |
|
|
2,304 |
|
|
(299) |
|
|
2017 |
|
12/23/2019 |
|
13 |
to |
34 |
Years |
| Farm Supplies |
|
Ottawa |
|
OH |
|
— |
|
|
409 |
|
|
2,031 |
|
|
— |
|
|
— |
|
|
409 |
|
|
2,031 |
|
|
2,440 |
|
|
(302) |
|
|
2017 |
|
12/23/2019 |
|
13 |
to |
34 |
Years |
| Furniture Stores |
|
College Station |
|
TX |
|
— |
|
|
1,561 |
|
|
4,626 |
|
|
— |
|
|
— |
|
|
1,561 |
|
|
4,626 |
|
|
6,187 |
|
|
(675) |
|
|
2006 |
|
12/23/2019 |
|
9 |
to |
31 |
Years |
| Furniture Stores |
|
Jacksonville |
|
FL |
|
— |
|
|
1,087 |
|
|
2,723 |
|
|
— |
|
|
— |
|
|
1,087 |
|
|
2,723 |
|
|
3,810 |
|
|
(382) |
|
|
1995 |
|
12/23/2019 |
|
9 |
to |
32 |
Years |
| Gift, Novelty, and Souvenir Shops |
|
Little Rock |
|
AR |
|
— |
|
|
560 |
|
|
1,788 |
|
|
— |
|
|
— |
|
|
560 |
|
|
1,788 |
|
|
2,348 |
|
|
(232) |
|
|
2012 |
|
12/23/2019 |
|
11 |
to |
34 |
Years |
|
|
|
|
|
|
|
|
|
|
|
|
|
|
|
|
|
|
|
|
|
|
|
|
|
|
|
|
|
|
|
|
|
|
|
|
|
|
|
|
|
|
|
|
|
|
|
|
|
|
|
|
|
|
|
|
|
|
|
|
|
|
|
|
|
|
|
|
|
|
|
|
|
|
|
|
|
|
|
|
|
|
|
|
|
|
|
|
|
|
|
|
|
|
|
|
| Description |
|
|
|
Initial Cost to Company |
|
Cost Capitalized Subsequent to Acquisition(1) |
|
Gross Amount as of December 31, 2023(2), (3) |
|
|
|
|
|
|
|
|
|
|
|
| Industry |
|
City |
|
State |
|
Encumbrances |
|
Land |
|
Building and Improvements |
|
Land |
|
Building and Improvements |
|
Land |
|
Building and Improvements |
|
Total |
|
Accumulated Depreciation(3), (4) |
|
Date of Construction |
|
Date Acquired(5) |
|
Life on Which Depreciation in Statements of Operations and Comprehensive Income is Computed |
| Grocery |
|
Memphis |
|
TN |
|
— |
|
|
1,864 |
|
|
2,958 |
|
|
— |
|
|
— |
|
|
1,864 |
|
|
2,958 |
|
|
4,822 |
|
|
(712) |
|
|
1987 |
|
12/23/2019 |
|
8 |
to |
18 |
Years |
| Home Furnishings |
|
Smyrna |
|
TN |
|
— |
|
|
454 |
|
|
1,029 |
|
|
— |
|
|
— |
|
|
454 |
|
|
1,029 |
|
|
1,483 |
|
|
(140) |
|
|
2011 |
|
12/23/2019 |
|
9 |
to |
34 |
Years |
| Home Improvement |
|
Pagosa Springs |
|
CO |
|
— |
|
|
324 |
|
|
1,364 |
|
|
— |
|
|
— |
|
|
324 |
|
|
1,364 |
|
|
1,688 |
|
|
(183) |
|
|
2009 |
|
12/23/2019 |
|
4 |
to |
33 |
Years |
| Home Improvement |
|
Chattanooga |
|
TN |
|
— |
|
|
1,789 |
|
|
2,007 |
|
|
— |
|
|
— |
|
|
1,789 |
|
|
2,007 |
|
|
3,796 |
|
|
(356) |
|
|
2000 |
|
12/23/2019 |
|
7 |
to |
28 |
Years |
| Home Improvement |
|
Spartanburg |
|
SC |
|
— |
|
|
329 |
|
|
464 |
|
|
— |
|
|
34 |
|
|
329 |
|
|
498 |
|
|
827 |
|
|
(83) |
|
|
1994 |
|
12/23/2019 |
|
6 |
to |
26 |
Years |
| Home Improvement |
|
Indian Land |
|
SC |
|
— |
|
|
468 |
|
|
705 |
|
|
— |
|
|
16 |
|
|
468 |
|
|
721 |
|
|
1,189 |
|
|
(110) |
|
|
2007 |
|
12/23/2019 |
|
6 |
to |
31 |
Years |
| Home Improvement |
|
Lexington |
|
NC |
|
— |
|
|
2,991 |
|
|
4,172 |
|
|
— |
|
|
— |
|
|
2,991 |
|
|
4,172 |
|
|
7,163 |
|
|
(1,215) |
|
|
1997 |
|
12/23/2019 |
|
6 |
to |
15 |
Years |
| Home Improvement |
|
Macon |
|
GA |
|
— |
|
|
1,861 |
|
|
8,377 |
|
|
— |
|
|
16 |
|
|
1,861 |
|
|
8,393 |
|
|
10,254 |
|
|
(1,528) |
|
|
1997 |
|
12/23/2019 |
|
7 |
to |
25 |
Years |
| Quick Service Restaurants |
|
Junction City |
|
KS |
|
— |
|
|
473 |
|
|
840 |
|
|
— |
|
|
— |
|
|
473 |
|
|
840 |
|
|
1,313 |
|
|
(140) |
|
|
1986 |
|
12/23/2019 |
|
15 |
to |
25 |
Years |
| Quick Service Restaurants |
|
Jackson |
|
MS |
|
— |
|
|
728 |
|
|
577 |
|
|
— |
|
|
— |
|
|
728 |
|
|
577 |
|
|
1,305 |
|
|
(98) |
|
|
1978 |
|
12/23/2019 |
|
15 |
to |
25 |
Years |
| Quick Service Restaurants |
|
Phenix City |
|
AL |
|
— |
|
|
727 |
|
|
800 |
|
|
— |
|
|
— |
|
|
727 |
|
|
800 |
|
|
1,527 |
|
|
(105) |
|
|
2017 |
|
12/23/2019 |
|
15 |
to |
34 |
Years |
| Quick Service Restaurants |
|
Grovetown |
|
GA |
|
— |
|
|
1,005 |
|
|
1,232 |
|
|
— |
|
|
— |
|
|
1,005 |
|
|
1,232 |
|
|
2,237 |
|
|
(166) |
|
|
2013 |
|
12/23/2019 |
|
14 |
to |
32 |
Years |
| Quick Service Restaurants |
|
Snead |
|
AL |
|
— |
|
|
1,271 |
|
|
781 |
|
|
— |
|
|
— |
|
|
1,271 |
|
|
781 |
|
|
2,052 |
|
|
(126) |
|
|
1997 |
|
12/23/2019 |
|
15 |
to |
26 |
Years |
| Quick Service Restaurants |
|
Red Bay |
|
AL |
|
— |
|
|
931 |
|
|
1,154 |
|
|
— |
|
|
— |
|
|
931 |
|
|
1,154 |
|
|
2,085 |
|
|
(158) |
|
|
2012 |
|
12/23/2019 |
|
15 |
to |
33 |
Years |
| Quick Service Restaurants |
|
Hueytown |
|
AL |
|
— |
|
|
1,019 |
|
|
1,011 |
|
|
— |
|
|
— |
|
|
1,019 |
|
|
1,011 |
|
|
2,030 |
|
|
(147) |
|
|
2007 |
|
12/23/2019 |
|
15 |
to |
30 |
Years |
| Quick Service Restaurants |
|
Sedalia |
|
MO |
|
— |
|
|
750 |
|
|
774 |
|
|
— |
|
|
16 |
|
|
750 |
|
|
790 |
|
|
1,540 |
|
|
(113) |
|
|
2007 |
|
12/23/2019 |
|
7 |
to |
30 |
Years |
| Quick Service Restaurants |
|
Shawnee |
|
OK |
|
— |
|
|
712 |
|
|
684 |
|
|
— |
|
|
122 |
|
|
712 |
|
|
806 |
|
|
1,518 |
|
|
(102) |
|
|
2006 |
|
12/23/2019 |
|
7 |
to |
30 |
Years |
| Home Improvement |
|
Sioux City |
|
IA |
|
— |
|
|
253 |
|
|
796 |
|
|
— |
|
|
— |
|
|
253 |
|
|
796 |
|
|
1,049 |
|
|
(135) |
|
|
2000 |
|
12/31/2019 |
|
15 |
to |
24 |
Years |
| Discount Retail |
|
Flint |
|
MI |
|
— |
|
|
554 |
|
|
4,982 |
|
|
— |
|
|
— |
|
|
554 |
|
|
4,982 |
|
|
5,536 |
|
|
(586) |
|
|
1996 |
|
1/7/2020 |
|
8 |
to |
35 |
Years |
| Convenience Stores |
|
North Little Rock |
|
AR |
|
— |
|
|
705 |
|
|
174 |
|
|
— |
|
|
1,590 |
|
|
705 |
|
|
1,764 |
|
|
2,469 |
|
|
(193) |
|
|
1962 |
|
1/14/2020 |
|
4 |
to |
35 |
Years |
| Quick Service Restaurants |
|
Wood River |
|
IL |
|
— |
|
|
1,707 |
|
|
— |
|
|
— |
|
|
— |
|
|
1,707 |
|
|
— |
|
|
1,707 |
|
|
— |
|
|
2006 |
|
1/24/2020 |
|
|
|
|
|
| Arts & Crafts |
|
Fairfield |
|
OH |
|
— |
|
|
1,571 |
|
|
5,005 |
|
|
— |
|
|
— |
|
|
1,571 |
|
|
5,005 |
|
|
6,576 |
|
|
(592) |
|
|
2015 |
|
1/27/2020 |
|
11 |
to |
35 |
Years |
| Quick Service Restaurants |
|
Fort Smith |
|
AR |
|
— |
|
|
1,989 |
|
|
2,345 |
|
|
— |
|
|
— |
|
|
1,989 |
|
|
2,345 |
|
|
4,334 |
|
|
(325) |
|
|
2019 |
|
1/31/2020 |
|
14 |
to |
34 |
Years |
| Automotive Service |
|
Oswego |
|
IL |
|
— |
|
|
2,417 |
|
|
1,209 |
|
|
— |
|
|
— |
|
|
2,417 |
|
|
1,209 |
|
|
3,626 |
|
|
(205) |
|
|
2008 |
|
2/3/2020 |
|
7 |
to |
35 |
Years |
| Grocery |
|
Meyersdale |
|
PA |
|
— |
|
|
1,449 |
|
|
3,348 |
|
|
— |
|
|
41 |
|
|
1,449 |
|
|
3,389 |
|
|
4,838 |
|
|
(535) |
|
|
2010 |
|
2/4/2020 |
|
10 |
to |
30 |
Years |
| Home Improvement |
|
Paintsville |
|
KY |
|
— |
|
|
7,712 |
|
|
— |
|
|
— |
|
|
— |
|
|
7,712 |
|
|
— |
|
|
7,712 |
|
|
— |
|
|
1992 |
|
2/4/2020 |
|
|
|
|
|
| Casual Dining |
|
Brandon |
|
MS |
|
— |
|
|
903 |
|
|
1,793 |
|
|
— |
|
|
— |
|
|
903 |
|
|
1,793 |
|
|
2,696 |
|
|
(283) |
|
|
1997 |
|
2/5/2020 |
|
9 |
to |
35 |
Years |
| Automotive Service |
|
Merrill |
|
WI |
|
— |
|
|
189 |
|
|
307 |
|
|
— |
|
|
— |
|
|
189 |
|
|
307 |
|
|
496 |
|
|
(61) |
|
|
1992 |
|
2/10/2020 |
|
9 |
to |
22 |
Years |
| Automotive Service |
|
Prattville |
|
AL |
|
— |
|
|
305 |
|
|
352 |
|
|
— |
|
|
— |
|
|
305 |
|
|
352 |
|
|
657 |
|
|
(70) |
|
|
1998 |
|
2/10/2020 |
|
6 |
to |
25 |
Years |
| Automotive Service |
|
New London |
|
WI |
|
— |
|
|
301 |
|
|
448 |
|
|
— |
|
|
— |
|
|
301 |
|
|
448 |
|
|
749 |
|
|
(98) |
|
|
1998 |
|
2/10/2020 |
|
6 |
to |
20 |
Years |
| Automotive Service |
|
Crawfordville |
|
FL |
|
— |
|
|
322 |
|
|
537 |
|
|
— |
|
|
— |
|
|
322 |
|
|
537 |
|
|
859 |
|
|
(78) |
|
|
1998 |
|
2/10/2020 |
|
10 |
to |
34 |
Years |
| Automotive Service |
|
Quincy |
|
FL |
|
— |
|
|
419 |
|
|
587 |
|
|
— |
|
|
— |
|
|
419 |
|
|
587 |
|
|
1,006 |
|
|
(83) |
|
|
1989 |
|
2/10/2020 |
|
11 |
to |
34 |
Years |
| Automotive Service |
|
Live Oak |
|
FL |
|
— |
|
|
474 |
|
|
589 |
|
|
— |
|
|
— |
|
|
474 |
|
|
589 |
|
|
1,063 |
|
|
(82) |
|
|
2000 |
|
2/10/2020 |
|
14 |
to |
35 |
Years |
| Automotive Service |
|
Wisconsin Rapids |
|
WI |
|
— |
|
|
488 |
|
|
488 |
|
|
— |
|
|
— |
|
|
488 |
|
|
488 |
|
|
976 |
|
|
(62) |
|
|
1985 |
|
2/10/2020 |
|
13 |
to |
35 |
Years |
| Discount Retail |
|
Longview |
|
TX |
|
— |
|
|
703 |
|
|
2,490 |
|
|
— |
|
|
— |
|
|
703 |
|
|
2,490 |
|
|
3,193 |
|
|
(376) |
|
|
1994 |
|
3/26/2020 |
|
10 |
to |
30 |
Years |
| Discount Retail |
|
Mishawaka |
|
IN |
|
— |
|
|
382 |
|
|
4,697 |
|
|
— |
|
|
— |
|
|
382 |
|
|
4,697 |
|
|
5,079 |
|
|
(527) |
|
|
1985 |
|
3/26/2020 |
|
10 |
to |
35 |
Years |
| Discount Retail |
|
Augusta |
|
GA |
|
— |
|
|
1,569 |
|
|
2,202 |
|
|
— |
|
|
211 |
|
|
1,569 |
|
|
2,413 |
|
|
3,982 |
|
|
(469) |
|
|
1985 |
|
3/26/2020 |
|
10 |
to |
20 |
Years |
| Convenience Stores |
|
North Little Rock |
|
AR |
|
— |
|
|
1,283 |
|
|
1,043 |
|
|
— |
|
|
835 |
|
|
1,283 |
|
|
1,878 |
|
|
3,161 |
|
|
(303) |
|
|
1989 |
|
4/3/2020 |
|
20 |
to |
35 |
Years |
| Discount Retail |
|
Tupelo |
|
MS |
|
— |
|
|
992 |
|
|
1,986 |
|
|
— |
|
|
— |
|
|
992 |
|
|
1,986 |
|
|
2,978 |
|
|
(381) |
|
|
1994 |
|
4/3/2020 |
|
4 |
to |
30 |
Years |
| Auto Parts |
|
Roswell |
|
NM |
|
— |
|
|
151 |
|
|
1,136 |
|
|
— |
|
|
— |
|
|
151 |
|
|
1,136 |
|
|
1,287 |
|
|
(143) |
|
|
1960 |
|
4/13/2020 |
|
8 |
to |
35 |
Years |
| Discount Retail |
|
Waco |
|
TX |
|
— |
|
|
1,403 |
|
|
2,613 |
|
|
— |
|
|
— |
|
|
1,403 |
|
|
2,613 |
|
|
4,016 |
|
|
(440) |
|
|
1986 |
|
4/17/2020 |
|
4 |
to |
30 |
Years |
| Dollar Stores |
|
Baltimore |
|
MD |
|
— |
|
|
380 |
|
|
1,746 |
|
|
— |
|
|
— |
|
|
380 |
|
|
1,746 |
|
|
2,126 |
|
|
(212) |
|
|
1945 |
|
5/6/2020 |
|
10 |
to |
35 |
Years |
| General Retail |
|
Newark |
|
NY |
|
— |
|
|
593 |
|
|
7,635 |
|
|
— |
|
|
134 |
|
|
593 |
|
|
7,769 |
|
|
8,362 |
|
|
(2,065) |
|
|
1991 |
|
5/6/2020 |
|
10 |
to |
20 |
Years |
| General Retail |
|
Riverdale |
|
GA |
|
— |
|
|
2,564 |
|
|
10,179 |
|
|
— |
|
|
— |
|
|
2,564 |
|
|
10,179 |
|
|
12,743 |
|
|
(2,111) |
|
|
1995 |
|
5/8/2020 |
|
6 |
to |
21 |
Years |
| Dollar Stores |
|
Chicago |
|
IL |
|
— |
|
|
424 |
|
|
982 |
|
|
— |
|
|
— |
|
|
424 |
|
|
982 |
|
|
1,406 |
|
|
(130) |
|
|
1944 |
|
5/20/2020 |
|
7 |
to |
30 |
Years |
| Discount Retail |
|
College Station |
|
TX |
|
— |
|
|
819 |
|
|
1,756 |
|
|
— |
|
|
— |
|
|
819 |
|
|
1,756 |
|
|
2,575 |
|
|
(397) |
|
|
1993 |
|
6/8/2020 |
|
8 |
to |
23 |
Years |
| Convenience Stores |
|
Lindale |
|
TX |
|
— |
|
|
1,343 |
|
|
3,018 |
|
|
— |
|
|
— |
|
|
1,343 |
|
|
3,018 |
|
|
4,361 |
|
|
(378) |
|
|
2011 |
|
6/15/2020 |
|
15 |
to |
35 |
Years |
| Convenience Stores |
|
Lindale |
|
TX |
|
— |
|
|
1,875 |
|
|
3,176 |
|
|
— |
|
|
— |
|
|
1,875 |
|
|
3,176 |
|
|
5,051 |
|
|
(400) |
|
|
2005 |
|
6/15/2020 |
|
15 |
to |
35 |
Years |
| Convenience Stores |
|
Tyler |
|
TX |
|
— |
|
|
2,646 |
|
|
3,218 |
|
|
— |
|
|
— |
|
|
2,646 |
|
|
3,218 |
|
|
5,864 |
|
|
(413) |
|
|
2009 |
|
6/15/2020 |
|
15 |
to |
35 |
Years |
| Convenience Stores |
|
Tyler |
|
TX |
|
— |
|
|
798 |
|
|
1,283 |
|
|
— |
|
|
— |
|
|
798 |
|
|
1,283 |
|
|
2,081 |
|
|
(165) |
|
|
1990 |
|
6/15/2020 |
|
15 |
to |
35 |
Years |
| Convenience Stores |
|
Tyler |
|
TX |
|
— |
|
|
550 |
|
|
1,186 |
|
|
— |
|
|
— |
|
|
550 |
|
|
1,186 |
|
|
1,736 |
|
|
(147) |
|
|
1994 |
|
6/15/2020 |
|
15 |
to |
35 |
Years |
| Convenience Stores |
|
Tyler |
|
TX |
|
— |
|
|
3,415 |
|
|
1,647 |
|
|
— |
|
|
— |
|
|
3,415 |
|
|
1,647 |
|
|
5,062 |
|
|
(219) |
|
|
1984 |
|
6/15/2020 |
|
15 |
to |
35 |
Years |
|
|
|
|
|
|
|
|
|
|
|
|
|
|
|
|
|
|
|
|
|
|
|
|
|
|
|
|
|
|
|
|
|
|
|
|
|
|
|
|
|
|
|
|
|
|
|
|
|
|
|
|
|
|
|
|
|
|
|
|
|
|
|
|
|
|
|
|
|
|
|
|
|
|
|
|
|
|
|
|
|
|
|
|
|
|
|
|
|
|
|
|
|
|
|
|
| Description |
|
|
|
Initial Cost to Company |
|
Cost Capitalized Subsequent to Acquisition(1) |
|
Gross Amount as of December 31, 2023(2), (3) |
|
|
|
|
|
|
|
|
|
|
|
| Industry |
|
City |
|
State |
|
Encumbrances |
|
Land |
|
Building and Improvements |
|
Land |
|
Building and Improvements |
|
Land |
|
Building and Improvements |
|
Total |
|
Accumulated Depreciation(3), (4) |
|
Date of Construction |
|
Date Acquired(5) |
|
Life on Which Depreciation in Statements of Operations and Comprehensive Income is Computed |
| Convenience Stores |
|
Brownsboro |
|
TX |
|
— |
|
|
1,170 |
|
|
2,020 |
|
|
— |
|
|
— |
|
|
1,170 |
|
|
2,020 |
|
|
3,190 |
|
|
(253) |
|
|
1999 |
|
6/15/2020 |
|
15 |
to |
35 |
Years |
| Convenience Stores |
|
Chandler |
|
TX |
|
— |
|
|
1,732 |
|
|
4,813 |
|
|
— |
|
|
— |
|
|
1,732 |
|
|
4,813 |
|
|
6,545 |
|
|
(648) |
|
|
2013 |
|
6/15/2020 |
|
8 |
to |
35 |
Years |
| Convenience Stores |
|
Chandler |
|
TX |
|
— |
|
|
1,176 |
|
|
2,216 |
|
|
— |
|
|
— |
|
|
1,176 |
|
|
2,216 |
|
|
3,392 |
|
|
(339) |
|
|
1993 |
|
6/15/2020 |
|
6 |
to |
35 |
Years |
| Convenience Stores |
|
Chandler |
|
TX |
|
— |
|
|
1,839 |
|
|
1,771 |
|
|
— |
|
|
— |
|
|
1,839 |
|
|
1,771 |
|
|
3,610 |
|
|
(262) |
|
|
1987 |
|
6/15/2020 |
|
7 |
to |
35 |
Years |
| Healthcare |
|
Jacksonville |
|
FL |
|
— |
|
|
1,175 |
|
|
2,666 |
|
|
— |
|
|
34 |
|
|
1,175 |
|
|
2,700 |
|
|
3,875 |
|
|
(375) |
|
|
2016 |
|
6/19/2020 |
|
10 |
to |
35 |
Years |
| Healthcare |
|
Jacksonville |
|
FL |
|
— |
|
|
1,427 |
|
|
3,504 |
|
|
— |
|
|
— |
|
|
1,427 |
|
|
3,504 |
|
|
4,931 |
|
|
(469) |
|
|
2016 |
|
6/19/2020 |
|
10 |
to |
35 |
Years |
| Home Improvement |
|
La Quinta |
|
CA |
|
— |
|
|
2,616 |
|
|
5,785 |
|
|
— |
|
|
27 |
|
|
2,616 |
|
|
5,812 |
|
|
8,428 |
|
|
(1,273) |
|
|
2005 |
|
6/19/2020 |
|
10 |
to |
20 |
Years |
| Auto Parts |
|
West Peoria |
|
IL |
|
— |
|
|
179 |
|
|
711 |
|
|
— |
|
|
— |
|
|
179 |
|
|
711 |
|
|
890 |
|
|
(123) |
|
|
1995 |
|
6/29/2020 |
|
6 |
to |
31 |
Years |
| Auto Parts |
|
Penn Hills |
|
PA |
|
— |
|
|
297 |
|
|
631 |
|
|
— |
|
|
— |
|
|
297 |
|
|
631 |
|
|
928 |
|
|
(123) |
|
|
1995 |
|
6/29/2020 |
|
8 |
to |
29 |
Years |
| Auto Parts |
|
St. Louis |
|
MO |
|
— |
|
|
271 |
|
|
970 |
|
|
— |
|
|
— |
|
|
271 |
|
|
970 |
|
|
1,241 |
|
|
(152) |
|
|
1998 |
|
6/29/2020 |
|
9 |
to |
35 |
Years |
| Auto Parts |
|
Breckenridge Hills |
|
MO |
|
— |
|
|
94 |
|
|
878 |
|
|
— |
|
|
— |
|
|
94 |
|
|
878 |
|
|
972 |
|
|
(107) |
|
|
1999 |
|
6/29/2020 |
|
9 |
to |
35 |
Years |
| Auto Parts |
|
Brunswick |
|
GA |
|
— |
|
|
540 |
|
|
848 |
|
|
— |
|
|
— |
|
|
540 |
|
|
848 |
|
|
1,388 |
|
|
(133) |
|
|
2000 |
|
6/29/2020 |
|
9 |
to |
35 |
Years |
| Auto Parts |
|
Fort Pierce |
|
FL |
|
— |
|
|
217 |
|
|
934 |
|
|
— |
|
|
— |
|
|
217 |
|
|
934 |
|
|
1,151 |
|
|
(140) |
|
|
1997 |
|
6/29/2020 |
|
10 |
to |
35 |
Years |
| Auto Parts |
|
Lakeland |
|
FL |
|
— |
|
|
408 |
|
|
1,005 |
|
|
— |
|
|
— |
|
|
408 |
|
|
1,005 |
|
|
1,413 |
|
|
(144) |
|
|
1999 |
|
6/29/2020 |
|
10 |
to |
35 |
Years |
| Auto Parts |
|
Orlando |
|
FL |
|
— |
|
|
746 |
|
|
672 |
|
|
— |
|
|
— |
|
|
746 |
|
|
672 |
|
|
1,418 |
|
|
(115) |
|
|
1999 |
|
6/29/2020 |
|
9 |
to |
33 |
Years |
| Auto Parts |
|
Titusville |
|
FL |
|
— |
|
|
990 |
|
|
586 |
|
|
— |
|
|
— |
|
|
990 |
|
|
586 |
|
|
1,576 |
|
|
(102) |
|
|
1998 |
|
6/29/2020 |
|
9 |
to |
35 |
Years |
| Auto Parts |
|
Claxton |
|
GA |
|
— |
|
|
95 |
|
|
877 |
|
|
— |
|
|
— |
|
|
95 |
|
|
877 |
|
|
972 |
|
|
(110) |
|
|
1999 |
|
6/29/2020 |
|
10 |
to |
35 |
Years |
| Auto Parts |
|
Griffin |
|
GA |
|
— |
|
|
255 |
|
|
851 |
|
|
— |
|
|
— |
|
|
255 |
|
|
851 |
|
|
1,106 |
|
|
(123) |
|
|
1999 |
|
6/29/2020 |
|
9 |
to |
35 |
Years |
| Auto Parts |
|
Gonzales |
|
LA |
|
— |
|
|
557 |
|
|
698 |
|
|
— |
|
|
— |
|
|
557 |
|
|
698 |
|
|
1,255 |
|
|
(96) |
|
|
2000 |
|
6/29/2020 |
|
7 |
to |
35 |
Years |
| Auto Parts |
|
Bay St. Louis |
|
MS |
|
— |
|
|
376 |
|
|
684 |
|
|
— |
|
|
— |
|
|
376 |
|
|
684 |
|
|
1,060 |
|
|
(107) |
|
|
1999 |
|
6/29/2020 |
|
8 |
to |
35 |
Years |
| Auto Parts |
|
Brookhaven |
|
MS |
|
— |
|
|
143 |
|
|
893 |
|
|
— |
|
|
— |
|
|
143 |
|
|
893 |
|
|
1,036 |
|
|
(109) |
|
|
1998 |
|
6/29/2020 |
|
9 |
to |
35 |
Years |
| Auto Parts |
|
Laurel |
|
MS |
|
— |
|
|
147 |
|
|
1,026 |
|
|
— |
|
|
— |
|
|
147 |
|
|
1,026 |
|
|
1,173 |
|
|
(127) |
|
|
1998 |
|
6/29/2020 |
|
9 |
to |
35 |
Years |
| General Retail |
|
Tupelo |
|
MS |
|
— |
|
|
2,817 |
|
|
7,341 |
|
|
— |
|
|
— |
|
|
2,817 |
|
|
7,341 |
|
|
10,158 |
|
|
(1,770) |
|
|
1992 |
|
7/2/2020 |
|
6 |
to |
20 |
Years |
| Home Improvement |
|
Orland Park |
|
IL |
|
— |
|
|
6,155 |
|
|
8,729 |
|
|
— |
|
|
15 |
|
|
6,155 |
|
|
8,744 |
|
|
14,899 |
|
|
(1,690) |
|
|
1993 |
|
7/2/2020 |
|
7 |
to |
21 |
Years |
| Wholesale Warehouse Club |
|
Tupelo |
|
MS |
|
— |
|
|
2,233 |
|
|
4,460 |
|
|
— |
|
|
342 |
|
|
2,233 |
|
|
4,802 |
|
|
7,035 |
|
|
(1,088) |
|
|
1992 |
|
7/2/2020 |
|
6 |
to |
20 |
Years |
| Auto Parts |
|
Barton |
|
VT |
|
— |
|
|
111 |
|
|
395 |
|
|
— |
|
|
11 |
|
|
111 |
|
|
406 |
|
|
517 |
|
|
(86) |
|
|
1890 |
|
8/28/2020 |
|
6 |
to |
20 |
Years |
| Auto Parts |
|
Newport |
|
NH |
|
— |
|
|
141 |
|
|
431 |
|
|
— |
|
|
39 |
|
|
141 |
|
|
470 |
|
|
611 |
|
|
(121) |
|
|
1979 |
|
8/28/2020 |
|
5 |
to |
17 |
Years |
| Auto Parts |
|
St. Albans |
|
VT |
|
— |
|
|
161 |
|
|
459 |
|
|
— |
|
|
— |
|
|
161 |
|
|
459 |
|
|
620 |
|
|
(90) |
|
|
1999 |
|
8/28/2020 |
|
7 |
to |
24 |
Years |
| Auto Parts |
|
Colebrook |
|
NH |
|
— |
|
|
193 |
|
|
524 |
|
|
— |
|
|
— |
|
|
193 |
|
|
524 |
|
|
717 |
|
|
(107) |
|
|
1984 |
|
8/28/2020 |
|
7 |
to |
21 |
Years |
| Auto Parts |
|
Lancaster |
|
NH |
|
— |
|
|
159 |
|
|
334 |
|
|
— |
|
|
— |
|
|
159 |
|
|
334 |
|
|
493 |
|
|
(73) |
|
|
1970 |
|
8/28/2020 |
|
6 |
to |
20 |
Years |
| Auto Parts |
|
Morristown |
|
VT |
|
— |
|
|
187 |
|
|
661 |
|
|
— |
|
|
— |
|
|
187 |
|
|
661 |
|
|
848 |
|
|
(112) |
|
|
1962 |
|
8/28/2020 |
|
6 |
to |
25 |
Years |
| Auto Parts |
|
Bradford |
|
VT |
|
— |
|
|
114 |
|
|
373 |
|
|
— |
|
|
35 |
|
|
114 |
|
|
408 |
|
|
522 |
|
|
(84) |
|
|
1973 |
|
8/28/2020 |
|
8 |
to |
20 |
Years |
| Home Improvement |
|
Salem |
|
VA |
|
— |
|
|
4,615 |
|
|
16,885 |
|
|
— |
|
|
— |
|
|
4,615 |
|
|
16,885 |
|
|
21,500 |
|
|
(2,225) |
|
|
2010 |
|
9/14/2020 |
|
10 |
to |
33 |
Years |
| Dollar Stores |
|
Little Rock |
|
AR |
|
— |
|
|
269 |
|
|
775 |
|
|
— |
|
|
43 |
|
|
269 |
|
|
818 |
|
|
1,087 |
|
|
(113) |
|
|
2009 |
|
9/28/2020 |
|
9 |
to |
35 |
Years |
| Auto Parts |
|
Belpre |
|
OH |
|
— |
|
|
375 |
|
|
924 |
|
|
— |
|
|
— |
|
|
375 |
|
|
924 |
|
|
1,299 |
|
|
(127) |
|
|
2014 |
|
9/30/2020 |
|
8 |
to |
35 |
Years |
| Auto Parts |
|
Springfield |
|
OH |
|
— |
|
|
241 |
|
|
751 |
|
|
— |
|
|
— |
|
|
241 |
|
|
751 |
|
|
992 |
|
|
(118) |
|
|
1997 |
|
9/30/2020 |
|
5 |
to |
32 |
Years |
| Auto Parts |
|
Milwaukee (Fond du Lac Ave) |
|
WI |
|
— |
|
|
485 |
|
|
1,101 |
|
|
— |
|
|
— |
|
|
485 |
|
|
1,101 |
|
|
1,586 |
|
|
(136) |
|
|
2004 |
|
9/30/2020 |
|
6 |
to |
35 |
Years |
| Auto Parts |
|
Wisconsin Rapids |
|
WI |
|
— |
|
|
400 |
|
|
988 |
|
|
— |
|
|
— |
|
|
400 |
|
|
988 |
|
|
1,388 |
|
|
(130) |
|
|
2004 |
|
9/30/2020 |
|
6 |
to |
35 |
Years |
| Auto Parts |
|
Ebensburg |
|
PA |
|
— |
|
|
281 |
|
|
615 |
|
|
— |
|
|
57 |
|
|
281 |
|
|
672 |
|
|
953 |
|
|
(119) |
|
|
1997 |
|
9/30/2020 |
|
6 |
to |
27 |
Years |
| Auto Parts |
|
Lewistown |
|
PA |
|
— |
|
|
182 |
|
|
835 |
|
|
— |
|
|
— |
|
|
182 |
|
|
835 |
|
|
1,017 |
|
|
(112) |
|
|
1997 |
|
9/30/2020 |
|
8 |
to |
35 |
Years |
| Auto Parts |
|
Ledgewood |
|
NJ |
|
— |
|
|
703 |
|
|
1,433 |
|
|
— |
|
|
— |
|
|
703 |
|
|
1,433 |
|
|
2,136 |
|
|
(178) |
|
|
2016 |
|
9/30/2020 |
|
11 |
to |
35 |
Years |
| Auto Parts |
|
Egg Harbor Township |
|
NJ |
|
— |
|
|
514 |
|
|
1,970 |
|
|
— |
|
|
— |
|
|
514 |
|
|
1,970 |
|
|
2,484 |
|
|
(244) |
|
|
2014 |
|
9/30/2020 |
|
9 |
to |
35 |
Years |
| Auto Parts |
|
Quarryville |
|
PA |
|
— |
|
|
613 |
|
|
1,561 |
|
|
— |
|
|
— |
|
|
613 |
|
|
1,561 |
|
|
2,174 |
|
|
(184) |
|
|
2017 |
|
9/30/2020 |
|
10 |
to |
35 |
Years |
| Auto Parts |
|
Ballston Spa |
|
NY |
|
— |
|
|
207 |
|
|
1,272 |
|
|
— |
|
|
— |
|
|
207 |
|
|
1,272 |
|
|
1,479 |
|
|
(163) |
|
|
2014 |
|
9/30/2020 |
|
9 |
to |
35 |
Years |
| Auto Parts |
|
Manchester |
|
PA |
|
— |
|
|
558 |
|
|
1,047 |
|
|
— |
|
|
— |
|
|
558 |
|
|
1,047 |
|
|
1,605 |
|
|
(152) |
|
|
2014 |
|
9/30/2020 |
|
9 |
to |
35 |
Years |
| Auto Parts |
|
Myerstown |
|
PA |
|
— |
|
|
392 |
|
|
1,219 |
|
|
— |
|
|
9 |
|
|
392 |
|
|
1,228 |
|
|
1,620 |
|
|
(161) |
|
|
2015 |
|
9/30/2020 |
|
9 |
to |
35 |
Years |
| Auto Parts |
|
Gettysburg |
|
PA |
|
— |
|
|
492 |
|
|
1,353 |
|
|
— |
|
|
— |
|
|
492 |
|
|
1,353 |
|
|
1,845 |
|
|
(178) |
|
|
2016 |
|
9/30/2020 |
|
10 |
to |
35 |
Years |
| Auto Parts |
|
Middle River |
|
MD |
|
— |
|
|
608 |
|
|
1,430 |
|
|
— |
|
|
— |
|
|
608 |
|
|
1,430 |
|
|
2,038 |
|
|
(182) |
|
|
2016 |
|
9/30/2020 |
|
9 |
to |
35 |
Years |
| Dollar Stores |
|
Petersburg |
|
VA |
|
— |
|
|
349 |
|
|
1,311 |
|
|
— |
|
|
— |
|
|
349 |
|
|
1,311 |
|
|
1,660 |
|
|
(163) |
|
|
2019 |
|
9/30/2020 |
|
10 |
to |
35 |
Years |
| Dollar Stores |
|
Queensbury |
|
NY |
|
— |
|
|
234 |
|
|
1,381 |
|
|
— |
|
|
— |
|
|
234 |
|
|
1,381 |
|
|
1,615 |
|
|
(177) |
|
|
2015 |
|
9/30/2020 |
|
10 |
to |
35 |
Years |
| Home Improvement |
|
Fargo |
|
ND |
|
— |
|
|
524 |
|
|
787 |
|
|
— |
|
|
— |
|
|
524 |
|
|
787 |
|
|
1,311 |
|
|
(113) |
|
|
2014 |
|
9/30/2020 |
|
4 |
to |
35 |
Years |
| Auto Parts |
|
Odessa |
|
TX |
|
— |
|
|
219 |
|
|
732 |
|
|
— |
|
|
— |
|
|
219 |
|
|
732 |
|
|
951 |
|
|
(95) |
|
|
2005 |
|
10/1/2020 |
|
10 |
to |
35 |
Years |
|
|
|
|
|
|
|
|
|
|
|
|
|
|
|
|
|
|
|
|
|
|
|
|
|
|
|
|
|
|
|
|
|
|
|
|
|
|
|
|
|
|
|
|
|
|
|
|
|
|
|
|
|
|
|
|
|
|
|
|
|
|
|
|
|
|
|
|
|
|
|
|
|
|
|
|
|
|
|
|
|
|
|
|
|
|
|
|
|
|
|
|
|
|
|
|
| Description |
|
|
|
Initial Cost to Company |
|
Cost Capitalized Subsequent to Acquisition(1) |
|
Gross Amount as of December 31, 2023(2), (3) |
|
|
|
|
|
|
|
|
|
|
|
| Industry |
|
City |
|
State |
|
Encumbrances |
|
Land |
|
Building and Improvements |
|
Land |
|
Building and Improvements |
|
Land |
|
Building and Improvements |
|
Total |
|
Accumulated Depreciation(3), (4) |
|
Date of Construction |
|
Date Acquired(5) |
|
Life on Which Depreciation in Statements of Operations and Comprehensive Income is Computed |
| Auto Parts |
|
Demoote |
|
IN |
|
— |
|
|
391 |
|
|
942 |
|
|
— |
|
|
— |
|
|
391 |
|
|
942 |
|
|
1,333 |
|
|
(121) |
|
|
2008 |
|
10/1/2020 |
|
11 |
to |
35 |
Years |
| Auto Parts |
|
Greenwood |
|
SC |
|
— |
|
|
189 |
|
|
405 |
|
|
— |
|
|
191 |
|
|
189 |
|
|
596 |
|
|
785 |
|
|
(110) |
|
|
1967 |
|
10/1/2020 |
|
6 |
to |
20 |
Years |
| Farm Supplies |
|
Weatherford |
|
OK |
|
— |
|
|
1,198 |
|
|
2,033 |
|
|
— |
|
|
— |
|
|
1,198 |
|
|
2,033 |
|
|
3,231 |
|
|
(362) |
|
|
2008 |
|
10/13/2020 |
|
10 |
to |
29 |
Years |
| Auto Parts |
|
Marianna |
|
FL |
|
— |
|
|
302 |
|
|
1,677 |
|
|
— |
|
|
— |
|
|
302 |
|
|
1,677 |
|
|
1,979 |
|
|
(193) |
|
|
2020 |
|
10/14/2020 |
|
10 |
to |
35 |
Years |
| Auto Parts |
|
Warner Robins |
|
GA |
|
— |
|
|
500 |
|
|
1,247 |
|
|
— |
|
|
— |
|
|
500 |
|
|
1,247 |
|
|
1,747 |
|
|
(149) |
|
|
2006 |
|
10/30/2020 |
|
10 |
to |
35 |
Years |
| Dollar Stores |
|
Pittsburgh |
|
PA |
|
— |
|
|
729 |
|
|
1,291 |
|
|
— |
|
|
— |
|
|
729 |
|
|
1,291 |
|
|
2,020 |
|
|
(172) |
|
|
2017 |
|
10/30/2020 |
|
10 |
to |
35 |
Years |
| Consumer Electronics |
|
Reynoldsburg |
|
OH |
|
— |
|
|
1,683 |
|
|
4,873 |
|
|
— |
|
|
14 |
|
|
1,683 |
|
|
4,887 |
|
|
6,570 |
|
|
(654) |
|
|
2004 |
|
11/9/2020 |
|
7 |
to |
35 |
Years |
| Healthcare |
|
Allen |
|
TX |
|
— |
|
|
453 |
|
|
1,525 |
|
|
— |
|
|
15 |
|
|
453 |
|
|
1,540 |
|
|
1,993 |
|
|
(214) |
|
|
2008 |
|
11/24/2020 |
|
10 |
to |
33 |
Years |
| Discount Retail |
|
Spokane Valley |
|
WA |
|
— |
|
|
1,494 |
|
|
4,067 |
|
|
— |
|
|
— |
|
|
1,494 |
|
|
4,067 |
|
|
5,561 |
|
|
(525) |
|
|
1997 |
|
12/1/2020 |
|
6 |
to |
30 |
Years |
| Equipment Rental and Leasing |
|
LeGrange |
|
GA |
|
— |
|
|
669 |
|
|
970 |
|
|
— |
|
|
— |
|
|
669 |
|
|
970 |
|
|
1,639 |
|
|
(126) |
|
|
2018 |
|
12/3/2020 |
|
8 |
to |
33 |
Years |
| Auto Parts |
|
Little Rock |
|
AR |
|
— |
|
|
286 |
|
|
873 |
|
|
— |
|
|
— |
|
|
286 |
|
|
873 |
|
|
1,159 |
|
|
(96) |
|
|
2002 |
|
12/9/2020 |
|
9 |
to |
35 |
Years |
| Drug Stores & Pharmacies |
|
Semmes |
|
AL |
|
— |
|
|
737 |
|
|
818 |
|
|
— |
|
|
— |
|
|
737 |
|
|
818 |
|
|
1,555 |
|
|
(125) |
|
|
1999 |
|
12/11/2020 |
|
7 |
to |
25 |
Years |
| Grocery |
|
Beekman |
|
NY |
|
— |
|
|
3,785 |
|
|
7,139 |
|
|
— |
|
|
— |
|
|
3,785 |
|
|
7,139 |
|
|
10,924 |
|
|
(821) |
|
|
1996 |
|
12/16/2020 |
|
5 |
to |
33 |
Years |
| Dollar Stores |
|
Johnstown |
|
PA |
|
— |
|
|
153 |
|
|
1,234 |
|
|
— |
|
|
— |
|
|
153 |
|
|
1,234 |
|
|
1,387 |
|
|
(139) |
|
|
2016 |
|
12/18/2020 |
|
9 |
to |
35 |
Years |
| Auto Parts |
|
Bellows Falls |
|
VT |
|
— |
|
|
55 |
|
|
817 |
|
|
— |
|
|
27 |
|
|
55 |
|
|
844 |
|
|
899 |
|
|
(99) |
|
|
1949 |
|
12/21/2020 |
|
8 |
to |
30 |
Years |
| Auto Parts |
|
Enosburg Falls |
|
VT |
|
— |
|
|
138 |
|
|
802 |
|
|
— |
|
|
— |
|
|
138 |
|
|
802 |
|
|
940 |
|
|
(116) |
|
|
1895 |
|
12/21/2020 |
|
11 |
to |
24 |
Years |
| Auto Parts |
|
South Barre |
|
VT |
|
— |
|
|
295 |
|
|
566 |
|
|
— |
|
|
— |
|
|
295 |
|
|
566 |
|
|
861 |
|
|
(87) |
|
|
1965 |
|
12/21/2020 |
|
8 |
to |
31 |
Years |
| Consumer Electronics |
|
Heath |
|
OH |
|
— |
|
|
1,205 |
|
|
2,348 |
|
|
— |
|
|
53 |
|
|
1,205 |
|
|
2,401 |
|
|
3,606 |
|
|
(360) |
|
|
1998 |
|
12/21/2020 |
|
4 |
to |
30 |
Years |
| General Retail |
|
Kingston |
|
MA |
|
— |
|
|
3,950 |
|
|
— |
|
|
— |
|
|
— |
|
|
3,950 |
|
|
— |
|
|
3,950 |
|
|
— |
|
|
2002 |
|
12/23/2020 |
|
|
|
|
|
| Discount Retail |
|
Terre Haute |
|
IN |
|
— |
|
|
940 |
|
|
2,525 |
|
|
— |
|
|
— |
|
|
940 |
|
|
2,525 |
|
|
3,465 |
|
|
(428) |
|
|
1989 |
|
12/28/2020 |
|
6 |
to |
22 |
Years |
| Grocery |
|
Rowlett |
|
TX |
|
— |
|
|
1,654 |
|
|
2,882 |
|
|
— |
|
|
— |
|
|
1,654 |
|
|
2,882 |
|
|
4,536 |
|
|
(344) |
|
|
1997 |
|
12/28/2020 |
|
8 |
to |
35 |
Years |
| Grocery |
|
Dallas |
|
TX |
|
— |
|
|
1,611 |
|
|
2,123 |
|
|
— |
|
|
— |
|
|
1,611 |
|
|
2,123 |
|
|
3,734 |
|
|
(225) |
|
|
1987 |
|
12/29/2020 |
|
10 |
to |
35 |
Years |
| Quick Service Restaurants |
|
Warner Robins |
|
GA |
|
— |
|
|
2,279 |
|
|
— |
|
|
— |
|
|
— |
|
|
2,279 |
|
|
— |
|
|
2,279 |
|
|
— |
|
|
2020 |
|
12/29/2020 |
|
|
|
|
|
| Dollar Stores |
|
Chester |
|
PA |
|
— |
|
|
697 |
|
|
876 |
|
|
— |
|
|
— |
|
|
697 |
|
|
876 |
|
|
1,573 |
|
|
(188) |
|
|
1996 |
|
12/31/2020 |
|
5 |
to |
22 |
Years |
| Home Improvement |
|
Benton Harbor |
|
MI |
|
— |
|
|
170 |
|
|
1,338 |
|
|
— |
|
|
— |
|
|
170 |
|
|
1,338 |
|
|
1,508 |
|
|
(163) |
|
|
2020 |
|
1/13/2021 |
|
10 |
to |
35 |
Years |
| Healthcare |
|
Schnecksville |
|
PA |
|
— |
|
|
195 |
|
|
3,111 |
|
|
— |
|
|
27 |
|
|
195 |
|
|
3,138 |
|
|
3,333 |
|
|
(295) |
|
|
2018 |
|
1/29/2021 |
|
9 |
to |
35 |
Years |
| Discount Retail |
|
Yuma |
|
AZ |
|
— |
|
|
1,032 |
|
|
2,983 |
|
|
— |
|
|
17 |
|
|
1,032 |
|
|
3,000 |
|
|
4,032 |
|
|
(198) |
|
|
2022 |
|
2/8/2021 |
|
6 |
to |
33 |
Years |
| Convenience Stores |
|
Palm Coast |
|
FL |
|
— |
|
|
1,485 |
|
|
2,356 |
|
|
— |
|
|
— |
|
|
1,485 |
|
|
2,356 |
|
|
3,841 |
|
|
(253) |
|
|
2020 |
|
2/12/2021 |
|
11 |
to |
35 |
Years |
| Dollar Stores |
|
Birmingham |
|
AL |
|
— |
|
|
189 |
|
|
1,031 |
|
|
— |
|
|
— |
|
|
189 |
|
|
1,031 |
|
|
1,220 |
|
|
(125) |
|
|
2013 |
|
2/12/2021 |
|
7 |
to |
35 |
Years |
| Dollar Stores |
|
Waycross |
|
GA |
|
— |
|
|
170 |
|
|
1,172 |
|
|
— |
|
|
— |
|
|
170 |
|
|
1,172 |
|
|
1,342 |
|
|
(143) |
|
|
2013 |
|
2/12/2021 |
|
6 |
to |
35 |
Years |
| Dollar Stores |
|
Ocoee |
|
FL |
|
— |
|
|
336 |
|
|
1,145 |
|
|
— |
|
|
— |
|
|
336 |
|
|
1,145 |
|
|
1,481 |
|
|
(135) |
|
|
2013 |
|
2/12/2021 |
|
7 |
to |
35 |
Years |
| Auto Parts |
|
Bridgeport |
|
CT |
|
— |
|
|
291 |
|
|
1,080 |
|
|
— |
|
|
— |
|
|
291 |
|
|
1,080 |
|
|
1,371 |
|
|
(102) |
|
|
1972 |
|
2/22/2021 |
|
6 |
to |
35 |
Years |
| Dollar Stores |
|
Thomasville |
|
NC |
|
— |
|
|
381 |
|
|
795 |
|
|
— |
|
|
— |
|
|
381 |
|
|
795 |
|
|
1,176 |
|
|
(138) |
|
|
1956 |
|
3/24/2021 |
|
8 |
to |
24 |
Years |
| Dollar Stores |
|
Pertersburg |
|
VA |
|
— |
|
|
235 |
|
|
1,137 |
|
|
— |
|
|
— |
|
|
235 |
|
|
1,137 |
|
|
1,372 |
|
|
(127) |
|
|
1997 |
|
3/24/2021 |
|
8 |
to |
35 |
Years |
| Equipment Rental and Leasing |
|
Hilliard |
|
OH |
|
— |
|
|
839 |
|
|
1,148 |
|
|
— |
|
|
— |
|
|
839 |
|
|
1,148 |
|
|
1,987 |
|
|
(153) |
|
|
2014 |
|
3/25/2021 |
|
9 |
to |
35 |
Years |
| Auto Parts |
|
Utica |
|
NY |
|
— |
|
|
372 |
|
|
1,177 |
|
|
— |
|
|
— |
|
|
372 |
|
|
1,177 |
|
|
1,549 |
|
|
(130) |
|
|
1996 |
|
3/26/2021 |
|
8 |
to |
34 |
Years |
| Automotive Service |
|
Wichita |
|
KS |
|
— |
|
|
990 |
|
|
959 |
|
|
— |
|
|
— |
|
|
990 |
|
|
959 |
|
|
1,949 |
|
|
(101) |
|
|
2000 |
|
3/26/2021 |
|
6 |
to |
33 |
Years |
| Auto Parts |
|
Bellingham |
|
MA |
|
— |
|
|
1,457 |
|
|
970 |
|
|
— |
|
|
— |
|
|
1,457 |
|
|
970 |
|
|
2,427 |
|
|
(107) |
|
|
2008 |
|
3/30/2021 |
|
7 |
to |
35 |
Years |
| General Retail |
|
Greece |
|
NY |
|
— |
|
|
1,751 |
|
|
6,212 |
|
|
— |
|
|
73 |
|
|
1,751 |
|
|
6,285 |
|
|
8,036 |
|
|
(1,249) |
|
|
1991 |
|
3/30/2021 |
|
9 |
to |
17 |
Years |
| Arts & Crafts |
|
Olympia |
|
WA |
|
— |
|
|
2,025 |
|
|
4,763 |
|
|
— |
|
|
— |
|
|
2,025 |
|
|
4,763 |
|
|
6,788 |
|
|
(628) |
|
|
1978 |
|
3/31/2021 |
|
6 |
to |
26 |
Years |
| Arts & Crafts |
|
Springfield |
|
IL |
|
— |
|
|
886 |
|
|
3,685 |
|
|
— |
|
|
34 |
|
|
886 |
|
|
3,719 |
|
|
4,605 |
|
|
(747) |
|
|
1989 |
|
3/31/2021 |
|
10 |
to |
20 |
Years |
| Arts & Crafts |
|
Fort Dodge |
|
IA |
|
— |
|
|
532 |
|
|
2,062 |
|
|
— |
|
|
304 |
|
|
532 |
|
|
2,366 |
|
|
2,898 |
|
|
(493) |
|
|
1985 |
|
3/31/2021 |
|
8 |
to |
15 |
Years |
| Auto Parts |
|
Bethel |
|
VT |
|
— |
|
|
67 |
|
|
278 |
|
|
— |
|
|
17 |
|
|
67 |
|
|
295 |
|
|
362 |
|
|
(48) |
|
|
1948 |
|
3/31/2021 |
|
5 |
to |
20 |
Years |
| Auto Parts |
|
Springfield |
|
VT |
|
— |
|
|
193 |
|
|
779 |
|
|
— |
|
|
151 |
|
|
193 |
|
|
930 |
|
|
1,123 |
|
|
(112) |
|
|
1975 |
|
3/31/2021 |
|
8 |
to |
29 |
Years |
| Discount Retail |
|
Fort Dodge |
|
IA |
|
— |
|
|
224 |
|
|
857 |
|
|
— |
|
|
81 |
|
|
224 |
|
|
938 |
|
|
1,162 |
|
|
(219) |
|
|
1985 |
|
3/31/2021 |
|
4 |
to |
15 |
Years |
| Dollar Stores |
|
Toledo |
|
OH |
|
— |
|
|
174 |
|
|
961 |
|
|
— |
|
|
— |
|
|
174 |
|
|
961 |
|
|
1,135 |
|
|
(144) |
|
|
1972 |
|
3/31/2021 |
|
6 |
to |
30 |
Years |
| Dollar Stores |
|
Franklin |
|
OH |
|
— |
|
|
159 |
|
|
535 |
|
|
— |
|
|
— |
|
|
159 |
|
|
535 |
|
|
694 |
|
|
(107) |
|
|
2005 |
|
3/31/2021 |
|
3 |
to |
25 |
Years |
| Drug Stores & Pharmacies |
|
Spencer |
|
IN |
|
— |
|
|
1,648 |
|
|
2,433 |
|
|
— |
|
|
— |
|
|
1,648 |
|
|
2,433 |
|
|
4,081 |
|
|
(263) |
|
|
2010 |
|
3/31/2021 |
|
8 |
to |
35 |
Years |
| Drug Stores & Pharmacies |
|
Indianapolis |
|
IN |
|
— |
|
|
371 |
|
|
2,056 |
|
|
— |
|
|
— |
|
|
371 |
|
|
2,056 |
|
|
2,427 |
|
|
(195) |
|
|
1997 |
|
3/31/2021 |
|
6 |
to |
35 |
Years |
| Farm Supplies |
|
Olympia |
|
WA |
|
— |
|
|
2,140 |
|
|
3,491 |
|
|
— |
|
|
— |
|
|
2,140 |
|
|
3,491 |
|
|
5,631 |
|
|
(489) |
|
|
1978 |
|
3/31/2021 |
|
5 |
to |
30 |
Years |
| Grocery |
|
Mt. Gilead |
|
OH |
|
— |
|
|
688 |
|
|
2,316 |
|
|
— |
|
|
— |
|
|
688 |
|
|
2,316 |
|
|
3,004 |
|
|
(536) |
|
|
1988 |
|
3/31/2021 |
|
6 |
to |
16 |
Years |
| Grocery |
|
Rio Rancho |
|
NM |
|
— |
|
|
1,759 |
|
|
3,055 |
|
|
— |
|
|
— |
|
|
1,759 |
|
|
3,055 |
|
|
4,814 |
|
|
(314) |
|
|
2020 |
|
3/31/2021 |
|
11 |
to |
35 |
Years |
|
|
|
|
|
|
|
|
|
|
|
|
|
|
|
|
|
|
|
|
|
|
|
|
|
|
|
|
|
|
|
|
|
|
|
|
|
|
|
|
|
|
|
|
|
|
|
|
|
|
|
|
|
|
|
|
|
|
|
|
|
|
|
|
|
|
|
|
|
|
|
|
|
|
|
|
|
|
|
|
|
|
|
|
|
|
|
|
|
|
|
|
|
|
|
|
| Description |
|
|
|
Initial Cost to Company |
|
Cost Capitalized Subsequent to Acquisition(1) |
|
Gross Amount as of December 31, 2023(2), (3) |
|
|
|
|
|
|
|
|
|
|
|
| Industry |
|
City |
|
State |
|
Encumbrances |
|
Land |
|
Building and Improvements |
|
Land |
|
Building and Improvements |
|
Land |
|
Building and Improvements |
|
Total |
|
Accumulated Depreciation(3), (4) |
|
Date of Construction |
|
Date Acquired(5) |
|
Life on Which Depreciation in Statements of Operations and Comprehensive Income is Computed |
| Home Improvement |
|
Merrillville |
|
IN |
|
— |
|
|
378 |
|
|
2,743 |
|
|
— |
|
|
— |
|
|
378 |
|
|
2,743 |
|
|
3,121 |
|
|
(283) |
|
|
2007 |
|
3/31/2021 |
|
9 |
to |
35 |
Years |
| Drug Stores & Pharmacies |
|
Hemingway |
|
SC |
|
— |
|
|
97 |
|
|
1,337 |
|
|
— |
|
|
22 |
|
|
97 |
|
|
1,359 |
|
|
1,456 |
|
|
(155) |
|
|
1985 |
|
4/16/2021 |
|
8 |
to |
30 |
Years |
| Auto Parts |
|
Rocky Mount |
|
NC |
|
— |
|
|
711 |
|
|
— |
|
|
— |
|
|
— |
|
|
711 |
|
|
— |
|
|
711 |
|
|
— |
|
|
2009 |
|
4/23/2021 |
|
|
|
|
|
| Drug Stores & Pharmacies |
|
Kenosha |
|
WI |
|
— |
|
|
1,159 |
|
|
3,231 |
|
|
— |
|
|
42 |
|
|
1,159 |
|
|
3,273 |
|
|
4,432 |
|
|
(357) |
|
|
1985 |
|
4/30/2021 |
|
7 |
to |
28 |
Years |
| Convenience Stores |
|
Georgetown |
|
SC |
|
— |
|
|
294 |
|
|
1,485 |
|
|
— |
|
|
— |
|
|
294 |
|
|
1,485 |
|
|
1,779 |
|
|
(166) |
|
|
1996 |
|
5/6/2021 |
|
7 |
to |
30 |
Years |
| Convenience Stores |
|
Portola |
|
CA |
|
— |
|
|
1,897 |
|
|
2,199 |
|
|
— |
|
|
— |
|
|
1,897 |
|
|
2,199 |
|
|
4,096 |
|
|
(230) |
|
|
1993 |
|
5/7/2021 |
|
10 |
to |
33 |
Years |
| Convenience Stores |
|
Jamestown |
|
CA |
|
— |
|
|
1,373 |
|
|
1,753 |
|
|
— |
|
|
— |
|
|
1,373 |
|
|
1,753 |
|
|
3,126 |
|
|
(212) |
|
|
1977 |
|
5/11/2021 |
|
12 |
to |
27 |
Years |
| Convenience Stores |
|
Auburn |
|
CA |
|
— |
|
|
415 |
|
|
785 |
|
|
— |
|
|
— |
|
|
415 |
|
|
785 |
|
|
1,200 |
|
|
(91) |
|
|
1962 |
|
5/12/2021 |
|
15 |
to |
27 |
Years |
| Convenience Stores |
|
Wallace |
|
CA |
|
— |
|
|
1,412 |
|
|
1,729 |
|
|
— |
|
|
— |
|
|
1,412 |
|
|
1,729 |
|
|
3,141 |
|
|
(212) |
|
|
1979 |
|
5/13/2021 |
|
10 |
to |
27 |
Years |
| Convenience Stores |
|
Colfax |
|
CA |
|
— |
|
|
896 |
|
|
1,527 |
|
|
— |
|
|
— |
|
|
896 |
|
|
1,527 |
|
|
2,423 |
|
|
(183) |
|
|
1968 |
|
5/14/2021 |
|
12 |
to |
27 |
Years |
| Arts & Crafts |
|
Fond Du Lac |
|
WI |
|
— |
|
|
1,600 |
|
|
1,860 |
|
|
— |
|
|
15 |
|
|
1,600 |
|
|
1,875 |
|
|
3,475 |
|
|
(104) |
|
|
2022 |
|
5/18/2021 |
|
10 |
to |
35 |
Years |
| Discount Retail |
|
Fond Du Lac |
|
WI |
|
— |
|
|
1,400 |
|
|
1,457 |
|
|
— |
|
|
11 |
|
|
1,400 |
|
|
1,468 |
|
|
2,868 |
|
|
(104) |
|
|
2021 |
|
5/18/2021 |
|
10 |
to |
35 |
Years |
| Arts & Crafts |
|
Heath |
|
OH |
|
— |
|
|
383 |
|
|
3,603 |
|
|
— |
|
|
53 |
|
|
383 |
|
|
3,656 |
|
|
4,039 |
|
|
(427) |
|
|
1998 |
|
6/17/2021 |
|
7 |
to |
29 |
Years |
| Grocery |
|
Monroe |
|
WI |
|
— |
|
|
848 |
|
|
7,535 |
|
|
— |
|
|
21 |
|
|
848 |
|
|
7,556 |
|
|
8,404 |
|
|
(757) |
|
|
2004 |
|
6/22/2021 |
|
8 |
to |
30 |
Years |
| Quick Service Restaurants |
|
Bardstown |
|
KY |
|
— |
|
|
926 |
|
|
1,291 |
|
|
— |
|
|
— |
|
|
926 |
|
|
1,291 |
|
|
2,217 |
|
|
(140) |
|
|
1985 |
|
6/23/2021 |
|
9 |
to |
30 |
Years |
| Consumer Electronics |
|
Brownsville |
|
TX |
|
— |
|
|
1,596 |
|
|
5,146 |
|
|
— |
|
|
— |
|
|
1,596 |
|
|
5,146 |
|
|
6,742 |
|
|
(492) |
|
|
2001 |
|
6/25/2021 |
|
5 |
to |
35 |
Years |
| Consumer Electronics |
|
Toledo |
|
OH |
|
— |
|
|
766 |
|
|
3,535 |
|
|
— |
|
|
24 |
|
|
766 |
|
|
3,559 |
|
|
4,325 |
|
|
(427) |
|
|
1992 |
|
6/25/2021 |
|
5 |
to |
27 |
Years |
| Dollar Stores |
|
Dayton |
|
OH |
|
— |
|
|
285 |
|
|
1,154 |
|
|
— |
|
|
— |
|
|
285 |
|
|
1,154 |
|
|
1,439 |
|
|
(116) |
|
|
2000 |
|
6/28/2021 |
|
8 |
to |
35 |
Years |
| Dollar Stores |
|
Schenectady |
|
NY |
|
— |
|
|
249 |
|
|
1,451 |
|
|
— |
|
|
— |
|
|
249 |
|
|
1,451 |
|
|
1,700 |
|
|
(130) |
|
|
1997 |
|
6/28/2021 |
|
9 |
to |
35 |
Years |
| Dollar Stores |
|
Dryden |
|
NY |
|
— |
|
|
286 |
|
|
1,109 |
|
|
— |
|
|
— |
|
|
286 |
|
|
1,109 |
|
|
1,395 |
|
|
(127) |
|
|
2013 |
|
6/28/2021 |
|
7 |
to |
35 |
Years |
| Dollar Stores |
|
Prattsburgh |
|
NY |
|
— |
|
|
124 |
|
|
1,364 |
|
|
— |
|
|
— |
|
|
124 |
|
|
1,364 |
|
|
1,488 |
|
|
(160) |
|
|
2014 |
|
6/28/2021 |
|
8 |
to |
35 |
Years |
| Dollar Stores |
|
Germantown |
|
NY |
|
— |
|
|
241 |
|
|
1,620 |
|
|
— |
|
|
— |
|
|
241 |
|
|
1,620 |
|
|
1,861 |
|
|
(157) |
|
|
2020 |
|
6/28/2021 |
|
10 |
to |
35 |
Years |
| Dollar Stores |
|
Lanesborough |
|
MA |
|
— |
|
|
373 |
|
|
1,188 |
|
|
— |
|
|
— |
|
|
373 |
|
|
1,188 |
|
|
1,561 |
|
|
(141) |
|
|
2013 |
|
6/28/2021 |
|
8 |
to |
35 |
Years |
| Dollar Stores |
|
Mayfield |
|
NY |
|
— |
|
|
260 |
|
|
1,206 |
|
|
— |
|
|
— |
|
|
260 |
|
|
1,206 |
|
|
1,466 |
|
|
(134) |
|
|
2015 |
|
6/28/2021 |
|
9 |
to |
35 |
Years |
| Dollar Stores |
|
Ballston Spa |
|
NY |
|
— |
|
|
231 |
|
|
1,242 |
|
|
— |
|
|
— |
|
|
231 |
|
|
1,242 |
|
|
1,473 |
|
|
(128) |
|
|
2015 |
|
6/28/2021 |
|
9 |
to |
35 |
Years |
| Dollar Stores |
|
Trotwood |
|
OH |
|
— |
|
|
361 |
|
|
768 |
|
|
— |
|
|
— |
|
|
361 |
|
|
768 |
|
|
1,129 |
|
|
(105) |
|
|
2012 |
|
6/28/2021 |
|
6 |
to |
35 |
Years |
| Consumer Electronics |
|
Burbank |
|
IL |
|
— |
|
|
3,116 |
|
|
6,171 |
|
|
— |
|
|
— |
|
|
3,116 |
|
|
6,171 |
|
|
9,287 |
|
|
(804) |
|
|
1997 |
|
6/29/2021 |
|
6 |
to |
30 |
Years |
| Dollar Stores |
|
Oklahoma City |
|
OK |
|
— |
|
|
531 |
|
|
1,158 |
|
|
— |
|
|
— |
|
|
531 |
|
|
1,158 |
|
|
1,689 |
|
|
(128) |
|
|
1981 |
|
6/29/2021 |
|
8 |
to |
29 |
Years |
| Home Improvement |
|
Alsip |
|
IL |
|
— |
|
|
353 |
|
|
1,092 |
|
|
— |
|
|
— |
|
|
353 |
|
|
1,092 |
|
|
1,445 |
|
|
(103) |
|
|
2015 |
|
6/29/2021 |
|
4 |
to |
35 |
Years |
| Quick Service Restaurants |
|
Oklahoma City |
|
OK |
|
— |
|
|
740 |
|
|
— |
|
|
— |
|
|
— |
|
|
740 |
|
|
— |
|
|
740 |
|
|
— |
|
|
2008 |
|
6/29/2021 |
|
|
|
|
|
| Arts & Crafts |
|
Washington |
|
PA |
|
— |
|
|
875 |
|
|
4,924 |
|
|
— |
|
|
— |
|
|
875 |
|
|
4,924 |
|
|
5,799 |
|
|
(453) |
|
|
2014 |
|
6/30/2021 |
|
6 |
to |
34 |
Years |
| Home Improvement |
|
Sioux Falls |
|
SD |
|
— |
|
|
848 |
|
|
4,083 |
|
|
— |
|
|
— |
|
|
848 |
|
|
4,083 |
|
|
4,931 |
|
|
(270) |
|
|
2022 |
|
7/8/2021 |
|
12 |
to |
35 |
Years |
| Auto Parts |
|
Houma |
|
LA |
|
— |
|
|
181 |
|
|
1,257 |
|
|
— |
|
|
— |
|
|
181 |
|
|
1,257 |
|
|
1,438 |
|
|
(103) |
|
|
2009 |
|
8/10/2021 |
|
10 |
to |
35 |
Years |
| Arts & Crafts |
|
Sumter |
|
SC |
|
— |
|
|
1,614 |
|
|
2,576 |
|
|
— |
|
|
67 |
|
|
1,614 |
|
|
2,643 |
|
|
4,257 |
|
|
(416) |
|
|
1975 |
|
8/23/2021 |
|
6 |
to |
22 |
Years |
| Discount Retail |
|
Sumter |
|
SC |
|
— |
|
|
959 |
|
|
1,519 |
|
|
— |
|
|
24 |
|
|
959 |
|
|
1,543 |
|
|
2,502 |
|
|
(249) |
|
|
1975 |
|
8/23/2021 |
|
7 |
to |
22 |
Years |
| Discount Retail |
|
California |
|
MD |
|
— |
|
|
241 |
|
|
1,984 |
|
|
— |
|
|
— |
|
|
241 |
|
|
1,984 |
|
|
2,225 |
|
|
(146) |
|
|
2001 |
|
9/8/2021 |
|
5 |
to |
35 |
Years |
| Quick Service Restaurants |
|
Danville |
|
IN |
|
— |
|
|
830 |
|
|
1,132 |
|
|
— |
|
|
— |
|
|
830 |
|
|
1,132 |
|
|
1,962 |
|
|
(127) |
|
|
2021 |
|
9/13/2021 |
|
10 |
to |
30 |
Years |
| Healthcare |
|
Houston |
|
TX |
|
— |
|
|
798 |
|
|
3,318 |
|
|
— |
|
|
— |
|
|
798 |
|
|
3,318 |
|
|
4,116 |
|
|
(269) |
|
|
1993 |
|
9/14/2021 |
|
8 |
to |
35 |
Years |
| Dollar Stores |
|
Iva |
|
SC |
|
— |
|
|
105 |
|
|
880 |
|
|
— |
|
|
— |
|
|
105 |
|
|
880 |
|
|
985 |
|
|
(81) |
|
|
2005 |
|
9/20/2021 |
|
5 |
to |
35 |
Years |
| Discount Retail |
|
Dunbar |
|
WV |
|
— |
|
|
318 |
|
|
1,982 |
|
|
— |
|
|
24 |
|
|
318 |
|
|
2,006 |
|
|
2,324 |
|
|
(210) |
|
|
2017 |
|
9/30/2021 |
|
6 |
to |
26 |
Years |
| Dollar Stores |
|
Akron |
|
OH |
|
— |
|
|
130 |
|
|
691 |
|
|
— |
|
|
12 |
|
|
130 |
|
|
703 |
|
|
833 |
|
|
(75) |
|
|
1946 |
|
9/30/2021 |
|
7 |
to |
28 |
Years |
| Drug Stores & Pharmacies |
|
Cottonwood |
|
AZ |
|
— |
|
|
2,158 |
|
|
2,681 |
|
|
— |
|
|
— |
|
|
2,158 |
|
|
2,681 |
|
|
4,839 |
|
|
(219) |
|
|
1999 |
|
9/30/2021 |
|
5 |
to |
35 |
Years |
| Drug Stores & Pharmacies |
|
Louisville |
|
KY |
|
— |
|
|
904 |
|
|
2,489 |
|
|
— |
|
|
— |
|
|
904 |
|
|
2,489 |
|
|
3,393 |
|
|
(209) |
|
|
1998 |
|
9/30/2021 |
|
5 |
to |
35 |
Years |
| Drug Stores & Pharmacies |
|
Rio Rancho |
|
NM |
|
— |
|
|
2,278 |
|
|
2,377 |
|
|
— |
|
|
— |
|
|
2,278 |
|
|
2,377 |
|
|
4,655 |
|
|
(208) |
|
|
2000 |
|
9/30/2021 |
|
5 |
to |
33 |
Years |
| Drug Stores & Pharmacies |
|
Mentor |
|
OH |
|
— |
|
|
1,348 |
|
|
2,647 |
|
|
(200) |
|
|
(394) |
|
|
1,148 |
|
|
2,253 |
|
|
3,401 |
|
|
(197) |
|
|
1997 |
|
9/30/2021 |
|
5 |
to |
35 |
Years |
| Drug Stores & Pharmacies |
|
Moline |
|
IL |
|
— |
|
|
1,915 |
|
|
2,860 |
|
|
— |
|
|
— |
|
|
1,915 |
|
|
2,860 |
|
|
4,775 |
|
|
(233) |
|
|
2000 |
|
9/30/2021 |
|
5 |
to |
35 |
Years |
| Drug Stores & Pharmacies |
|
Decatur |
|
IL |
|
— |
|
|
702 |
|
|
2,878 |
|
|
— |
|
|
— |
|
|
702 |
|
|
2,878 |
|
|
3,580 |
|
|
(226) |
|
|
1999 |
|
9/30/2021 |
|
5 |
to |
35 |
Years |
| Drug Stores & Pharmacies |
|
Hammond |
|
IN |
|
— |
|
|
1,073 |
|
|
3,207 |
|
|
— |
|
|
— |
|
|
1,073 |
|
|
3,207 |
|
|
4,280 |
|
|
(260) |
|
|
2000 |
|
9/30/2021 |
|
5 |
to |
35 |
Years |
| Drug Stores & Pharmacies |
|
Edinburg |
|
TX |
|
— |
|
|
1,544 |
|
|
2,108 |
|
|
— |
|
|
— |
|
|
1,544 |
|
|
2,108 |
|
|
3,652 |
|
|
(172) |
|
|
2000 |
|
9/30/2021 |
|
5 |
to |
35 |
Years |
| Drug Stores & Pharmacies |
|
Rockford |
|
IL |
|
— |
|
|
295 |
|
|
1,735 |
|
|
— |
|
|
— |
|
|
295 |
|
|
1,735 |
|
|
2,030 |
|
|
(179) |
|
|
1991 |
|
9/30/2021 |
|
8 |
to |
28 |
Years |
| Drug Stores & Pharmacies |
|
Chicago |
|
IL |
|
— |
|
|
1,788 |
|
|
2,720 |
|
|
— |
|
|
— |
|
|
1,788 |
|
|
2,720 |
|
|
4,508 |
|
|
(259) |
|
|
1997 |
|
9/30/2021 |
|
7 |
to |
30 |
Years |
| Drug Stores & Pharmacies |
|
Jerseyville |
|
IL |
|
— |
|
|
1,981 |
|
|
3,282 |
|
|
— |
|
|
— |
|
|
1,981 |
|
|
3,282 |
|
|
5,263 |
|
|
(267) |
|
|
2014 |
|
9/30/2021 |
|
10 |
to |
35 |
Years |
|
|
|
|
|
|
|
|
|
|
|
|
|
|
|
|
|
|
|
|
|
|
|
|
|
|
|
|
|
|
|
|
|
|
|
|
|
|
|
|
|
|
|
|
|
|
|
|
|
|
|
|
|
|
|
|
|
|
|
|
|
|
|
|
|
|
|
|
|
|
|
|
|
|
|
|
|
|
|
|
|
|
|
|
|
|
|
|
|
|
|
|
|
|
|
|
| Description |
|
|
|
Initial Cost to Company |
|
Cost Capitalized Subsequent to Acquisition(1) |
|
Gross Amount as of December 31, 2023(2), (3) |
|
|
|
|
|
|
|
|
|
|
|
| Industry |
|
City |
|
State |
|
Encumbrances |
|
Land |
|
Building and Improvements |
|
Land |
|
Building and Improvements |
|
Land |
|
Building and Improvements |
|
Total |
|
Accumulated Depreciation(3), (4) |
|
Date of Construction |
|
Date Acquired(5) |
|
Life on Which Depreciation in Statements of Operations and Comprehensive Income is Computed |
| Healthcare |
|
Rantoul |
|
IL |
|
— |
|
|
92 |
|
|
1,671 |
|
|
— |
|
|
— |
|
|
92 |
|
|
1,671 |
|
|
1,763 |
|
|
(162) |
|
|
2011 |
|
9/30/2021 |
|
10 |
to |
35 |
Years |
| Healthcare |
|
Danville |
|
IL |
|
— |
|
|
130 |
|
|
1,584 |
|
|
— |
|
|
— |
|
|
130 |
|
|
1,584 |
|
|
1,714 |
|
|
(133) |
|
|
2020 |
|
9/30/2021 |
|
10 |
to |
35 |
Years |
| Healthcare |
|
Urbana |
|
IL |
|
— |
|
|
674 |
|
|
1,294 |
|
|
(169) |
|
|
(324) |
|
|
505 |
|
|
970 |
|
|
1,475 |
|
|
(85) |
|
|
2018 |
|
9/30/2021 |
|
8 |
to |
35 |
Years |
| Grocery |
|
Slidell |
|
LA |
|
— |
|
|
1,159 |
|
|
3,444 |
|
|
— |
|
|
— |
|
|
1,159 |
|
|
3,444 |
|
|
4,603 |
|
|
(469) |
|
|
1995 |
|
10/13/2021 |
|
6 |
to |
22 |
Years |
| Grocery |
|
Slidell |
|
LA |
|
— |
|
|
1,723 |
|
|
3,305 |
|
|
— |
|
|
— |
|
|
1,723 |
|
|
3,305 |
|
|
5,028 |
|
|
(506) |
|
|
1999 |
|
10/13/2021 |
|
6 |
to |
20 |
Years |
| Discount Retail |
|
Oakwood |
|
OH |
|
— |
|
|
283 |
|
|
2,035 |
|
|
— |
|
|
32 |
|
|
283 |
|
|
2,067 |
|
|
2,350 |
|
|
(291) |
|
|
1991 |
|
10/20/2021 |
|
7 |
to |
17 |
Years |
| Casual Dining |
|
Avondale |
|
IL |
|
— |
|
|
3,073 |
|
|
— |
|
|
— |
|
|
— |
|
|
3,073 |
|
|
— |
|
|
3,073 |
|
|
— |
|
|
2014 |
|
10/25/2021 |
|
|
|
|
|
| Health and Fitness |
|
Avondale |
|
IL |
|
— |
|
|
3,947 |
|
|
10,398 |
|
|
— |
|
|
29 |
|
|
3,947 |
|
|
10,427 |
|
|
14,374 |
|
|
(715) |
|
|
1984 |
|
10/25/2021 |
|
12 |
to |
35 |
Years |
| Home Improvement |
|
Avondale |
|
IL |
|
— |
|
|
9,146 |
|
|
13,194 |
|
|
— |
|
|
72 |
|
|
9,146 |
|
|
13,266 |
|
|
22,412 |
|
|
(983) |
|
|
1984 |
|
10/25/2021 |
|
12 |
to |
35 |
Years |
| Home Improvement |
|
Racine |
|
WI |
|
— |
|
|
1,898 |
|
|
7,247 |
|
|
— |
|
|
21 |
|
|
1,898 |
|
|
7,268 |
|
|
9,166 |
|
|
(1,114) |
|
|
1991 |
|
10/27/2021 |
|
15 |
to |
18 |
Years |
| Arts & Crafts |
|
Flagstaff |
|
AZ |
|
— |
|
|
988 |
|
|
7,797 |
|
|
— |
|
|
15 |
|
|
988 |
|
|
7,812 |
|
|
8,800 |
|
|
(609) |
|
|
1979 |
|
10/28/2021 |
|
7 |
to |
35 |
Years |
| Discount Retail |
|
Oroville |
|
CA |
|
— |
|
|
405 |
|
|
3,123 |
|
|
— |
|
|
8 |
|
|
405 |
|
|
3,131 |
|
|
3,536 |
|
|
(294) |
|
|
1999 |
|
10/28/2021 |
|
7 |
to |
33 |
Years |
| Equipment Rental and Leasing |
|
Warner Robins |
|
GA |
|
— |
|
|
425 |
|
|
1,820 |
|
|
— |
|
|
— |
|
|
425 |
|
|
1,820 |
|
|
2,245 |
|
|
(193) |
|
|
2021 |
|
10/28/2021 |
|
10 |
to |
35 |
Years |
| Home Improvement |
|
Green Bay |
|
WI |
|
— |
|
|
292 |
|
|
1,070 |
|
|
— |
|
|
— |
|
|
292 |
|
|
1,070 |
|
|
1,362 |
|
|
(160) |
|
|
1992 |
|
10/28/2021 |
|
7 |
to |
20 |
Years |
| Dollar Stores |
|
Woodland |
|
AL |
|
— |
|
|
345 |
|
|
1,230 |
|
|
— |
|
|
— |
|
|
345 |
|
|
1,230 |
|
|
1,575 |
|
|
(72) |
|
|
2022 |
|
11/12/2021 |
|
15 |
to |
35 |
Years |
| Equipment Rental and Leasing |
|
Cortland |
|
OH |
|
— |
|
|
199 |
|
|
1,913 |
|
|
— |
|
|
— |
|
|
199 |
|
|
1,913 |
|
|
2,112 |
|
|
(157) |
|
|
2015 |
|
11/15/2021 |
|
8 |
to |
35 |
Years |
| Consumer Electronics |
|
Baton Rouge |
|
LA |
|
— |
|
|
5,057 |
|
|
3,647 |
|
|
— |
|
|
15 |
|
|
5,057 |
|
|
3,662 |
|
|
8,719 |
|
|
(446) |
|
|
1997 |
|
11/24/2021 |
|
6 |
to |
26 |
Years |
| Dollar Stores |
|
Springfield |
|
OH |
|
— |
|
|
435 |
|
|
154 |
|
|
— |
|
|
105 |
|
|
435 |
|
|
259 |
|
|
694 |
|
|
(63) |
|
|
1950 |
|
11/24/2021 |
|
2 |
to |
15 |
Years |
| Arts & Crafts |
|
Sheboygan |
|
WI |
|
— |
|
|
1,893 |
|
|
2,030 |
|
|
— |
|
|
— |
|
|
1,893 |
|
|
2,030 |
|
|
3,923 |
|
|
(70) |
|
|
2022 |
|
12/3/2021 |
|
9 |
to |
35 |
Years |
| Discount Retail |
|
Sheboygan |
|
WI |
|
— |
|
|
2,049 |
|
|
2,056 |
|
|
— |
|
|
— |
|
|
2,049 |
|
|
2,056 |
|
|
4,105 |
|
|
(74) |
|
|
2022 |
|
12/3/2021 |
|
10 |
to |
35 |
Years |
| Dollar Stores |
|
Oklahoma City |
|
OK |
|
— |
|
|
295 |
|
|
664 |
|
|
— |
|
|
53 |
|
|
295 |
|
|
717 |
|
|
1,012 |
|
|
(78) |
|
|
2006 |
|
12/8/2021 |
|
5 |
to |
23 |
Years |
| Dollar Stores |
|
Harper Woods |
|
MI |
|
— |
|
|
627 |
|
|
1,165 |
|
|
— |
|
|
10 |
|
|
627 |
|
|
1,175 |
|
|
1,802 |
|
|
(100) |
|
|
1972 |
|
12/9/2021 |
|
10 |
to |
30 |
Years |
| Automotive Service |
|
Middletown |
|
OH |
|
— |
|
|
342 |
|
|
632 |
|
|
— |
|
|
— |
|
|
342 |
|
|
632 |
|
|
974 |
|
|
(69) |
|
|
1974 |
|
12/10/2021 |
|
6 |
to |
25 |
Years |
| Automotive Service |
|
Hamilton |
|
OH |
|
— |
|
|
321 |
|
|
1,122 |
|
|
— |
|
|
201 |
|
|
321 |
|
|
1,323 |
|
|
1,644 |
|
|
(101) |
|
|
1922 |
|
12/10/2021 |
|
7 |
to |
25 |
Years |
| Automotive Service |
|
Hamilton |
|
OH |
|
— |
|
|
393 |
|
|
1,003 |
|
|
— |
|
|
— |
|
|
393 |
|
|
1,003 |
|
|
1,396 |
|
|
(106) |
|
|
1964 |
|
12/10/2021 |
|
7 |
to |
23 |
Years |
| Dollar Stores |
|
Columbus |
|
GA |
|
— |
|
|
173 |
|
|
967 |
|
|
— |
|
|
— |
|
|
173 |
|
|
967 |
|
|
1,140 |
|
|
(82) |
|
|
2003 |
|
12/13/2021 |
|
6 |
to |
31 |
Years |
| Dollar Stores |
|
Phenix City |
|
AL |
|
— |
|
|
176 |
|
|
980 |
|
|
— |
|
|
— |
|
|
176 |
|
|
980 |
|
|
1,156 |
|
|
(82) |
|
|
2005 |
|
12/13/2021 |
|
4 |
to |
35 |
Years |
| Drug Stores & Pharmacies |
|
Gales Ferry |
|
CT |
|
— |
|
|
1,687 |
|
|
2,326 |
|
|
— |
|
|
— |
|
|
1,687 |
|
|
2,326 |
|
|
4,013 |
|
|
(232) |
|
|
2012 |
|
12/21/2021 |
|
6 |
to |
31 |
Years |
| Drug Stores & Pharmacies |
|
St. Joseph |
|
MI |
|
— |
|
|
2,494 |
|
|
2,671 |
|
|
— |
|
|
— |
|
|
2,494 |
|
|
2,671 |
|
|
5,165 |
|
|
(219) |
|
|
2015 |
|
12/21/2021 |
|
6 |
to |
35 |
Years |
| Drug Stores & Pharmacies |
|
El Centro |
|
CA |
|
— |
|
|
890 |
|
|
4,656 |
|
|
— |
|
|
— |
|
|
890 |
|
|
4,656 |
|
|
5,546 |
|
|
(325) |
|
|
2002 |
|
12/21/2021 |
|
6 |
to |
35 |
Years |
| Drug Stores & Pharmacies |
|
Groton |
|
CT |
|
— |
|
|
1,195 |
|
|
3,833 |
|
|
— |
|
|
— |
|
|
1,195 |
|
|
3,833 |
|
|
5,028 |
|
|
(271) |
|
|
2004 |
|
12/21/2021 |
|
6 |
to |
35 |
Years |
| Discount Retail |
|
Grand Island |
|
NE |
|
— |
|
|
337 |
|
|
2,333 |
|
|
— |
|
|
— |
|
|
337 |
|
|
2,333 |
|
|
2,670 |
|
|
(156) |
|
|
1990 |
|
12/23/2021 |
|
6 |
to |
35 |
Years |
| Arts & Crafts |
|
D'Iberville |
|
MS |
|
— |
|
|
1,036 |
|
|
5,970 |
|
|
— |
|
|
— |
|
|
1,036 |
|
|
5,970 |
|
|
7,006 |
|
|
(181) |
|
|
2023 |
|
12/29/2021 |
|
12 |
to |
35 |
Years |
| Auto Parts |
|
Syracuse |
|
NY |
|
— |
|
|
486 |
|
|
1,316 |
|
|
— |
|
|
— |
|
|
486 |
|
|
1,316 |
|
|
1,802 |
|
|
(114) |
|
|
2004 |
|
12/29/2021 |
|
7 |
to |
35 |
Years |
| Arts & Crafts |
|
Winder |
|
GA |
|
— |
|
|
1,217 |
|
|
5,919 |
|
|
— |
|
|
— |
|
|
1,217 |
|
|
5,919 |
|
|
7,136 |
|
|
(173) |
|
|
2023 |
|
12/30/2021 |
|
9 |
to |
35 |
Years |
| Auto Parts |
|
Golden |
|
CO |
|
— |
|
|
594 |
|
|
974 |
|
|
— |
|
|
10 |
|
|
594 |
|
|
984 |
|
|
1,578 |
|
|
(78) |
|
|
2009 |
|
12/30/2021 |
|
3 |
to |
35 |
Years |
| Auto Parts |
|
Lithonia |
|
GA |
|
— |
|
|
605 |
|
|
1,422 |
|
|
— |
|
|
— |
|
|
605 |
|
|
1,422 |
|
|
2,027 |
|
|
(109) |
|
|
1996 |
|
12/30/2021 |
|
3 |
to |
35 |
Years |
| Grocery |
|
Omaha |
|
NE |
|
— |
|
|
1,559 |
|
|
4,866 |
|
|
— |
|
|
260 |
|
|
1,559 |
|
|
5,126 |
|
|
6,685 |
|
|
(556) |
|
|
2010 |
|
1/19/2022 |
|
8 |
to |
25 |
Years |
| Arts & Crafts |
|
Douglas |
|
GA |
|
— |
|
|
465 |
|
|
4,317 |
|
|
— |
|
|
18 |
|
|
465 |
|
|
4,335 |
|
|
4,800 |
|
|
(325) |
|
|
2021 |
|
1/21/2022 |
|
10 |
to |
35 |
Years |
| Healthcare |
|
Denton |
|
TX |
|
— |
|
|
554 |
|
|
2,623 |
|
|
— |
|
|
— |
|
|
554 |
|
|
2,623 |
|
|
3,177 |
|
|
(212) |
|
|
1982 |
|
1/28/2022 |
|
6 |
to |
29 |
Years |
| Auto Parts |
|
Decatur |
|
GA |
|
— |
|
|
257 |
|
|
840 |
|
|
— |
|
|
15 |
|
|
257 |
|
|
855 |
|
|
1,112 |
|
|
(65) |
|
|
1999 |
|
2/11/2022 |
|
5 |
to |
35 |
Years |
| Dollar Stores |
|
Fair Haven |
|
VT |
|
— |
|
|
151 |
|
|
1,051 |
|
|
— |
|
|
— |
|
|
151 |
|
|
1,051 |
|
|
1,202 |
|
|
(95) |
|
|
1960 |
|
2/17/2022 |
|
4 |
to |
28 |
Years |
| Dollar Stores |
|
Morehead City |
|
NC |
|
— |
|
|
563 |
|
|
1,131 |
|
|
— |
|
|
— |
|
|
563 |
|
|
1,131 |
|
|
1,694 |
|
|
(92) |
|
|
2002 |
|
2/18/2022 |
|
4 |
to |
35 |
Years |
| Home Improvement |
|
Litchfield |
|
IL |
|
— |
|
|
138 |
|
|
1,328 |
|
|
— |
|
|
104 |
|
|
138 |
|
|
1,432 |
|
|
1,570 |
|
|
(144) |
|
|
2022 |
|
3/4/2022 |
|
10 |
to |
25 |
Years |
| Drug Stores & Pharmacies |
|
Mobile |
|
AL |
|
— |
|
|
954 |
|
|
2,570 |
|
|
— |
|
|
— |
|
|
954 |
|
|
2,570 |
|
|
3,524 |
|
|
(173) |
|
|
2003 |
|
3/10/2022 |
|
7 |
to |
35 |
Years |
| Dollar Stores |
|
Monticello |
|
GA |
|
— |
|
|
346 |
|
|
1,323 |
|
|
— |
|
|
— |
|
|
346 |
|
|
1,323 |
|
|
1,669 |
|
|
(118) |
|
|
2016 |
|
3/14/2022 |
|
8 |
to |
35 |
Years |
| Dollar Stores |
|
Overton |
|
NV |
|
— |
|
|
85 |
|
|
1,228 |
|
|
— |
|
|
— |
|
|
85 |
|
|
1,228 |
|
|
1,313 |
|
|
(83) |
|
|
2012 |
|
3/15/2022 |
|
5 |
to |
35 |
Years |
| Dollar Stores |
|
Naturita |
|
CO |
|
— |
|
|
100 |
|
|
935 |
|
|
— |
|
|
— |
|
|
100 |
|
|
935 |
|
|
1,035 |
|
|
(69) |
|
|
2014 |
|
3/15/2022 |
|
7 |
to |
34 |
Years |
| Dollar Stores |
|
Milford |
|
UT |
|
— |
|
|
62 |
|
|
1,075 |
|
|
— |
|
|
— |
|
|
62 |
|
|
1,075 |
|
|
1,137 |
|
|
(68) |
|
|
2015 |
|
3/15/2022 |
|
8 |
to |
35 |
Years |
|
|
|
|
|
|
|
|
|
|
|
|
|
|
|
|
|
|
|
|
|
|
|
|
|
|
|
|
|
|
|
|
|
|
|
|
|
|
|
|
|
|
|
|
|
|
|
|
|
|
|
|
|
|
|
|
|
|
|
|
|
|
|
|
|
|
|
|
|
|
|
|
|
|
|
|
|
|
|
|
|
|
|
|
|
|
|
|
|
|
|
|
|
|
|
|
| Description |
|
|
|
Initial Cost to Company |
|
Cost Capitalized Subsequent to Acquisition(1) |
|
Gross Amount as of December 31, 2023(2), (3) |
|
|
|
|
|
|
|
|
|
|
|
| Industry |
|
City |
|
State |
|
Encumbrances |
|
Land |
|
Building and Improvements |
|
Land |
|
Building and Improvements |
|
Land |
|
Building and Improvements |
|
Total |
|
Accumulated Depreciation(3), (4) |
|
Date of Construction |
|
Date Acquired(5) |
|
Life on Which Depreciation in Statements of Operations and Comprehensive Income is Computed |
| Home Improvement |
|
Edgewood |
|
NM |
|
— |
|
|
426 |
|
|
1,066 |
|
|
— |
|
|
177 |
|
|
426 |
|
|
1,243 |
|
|
1,669 |
|
|
(124) |
|
|
2022 |
|
3/15/2022 |
|
6 |
to |
25 |
Years |
| Home Improvement |
|
Hermitage |
|
PA |
|
— |
|
|
585 |
|
|
2,420 |
|
|
— |
|
|
— |
|
|
585 |
|
|
2,420 |
|
|
3,005 |
|
|
(257) |
|
|
2000 |
|
3/15/2022 |
|
7 |
to |
23 |
Years |
| Healthcare |
|
Houston |
|
TX |
|
— |
|
|
455 |
|
|
2,092 |
|
|
— |
|
|
— |
|
|
455 |
|
|
2,092 |
|
|
2,547 |
|
|
(133) |
|
|
2014 |
|
3/24/2022 |
|
7 |
to |
35 |
Years |
| Healthcare |
|
Amarillo |
|
TX |
|
— |
|
|
413 |
|
|
1,815 |
|
|
— |
|
|
— |
|
|
413 |
|
|
1,815 |
|
|
2,228 |
|
|
(138) |
|
|
2012 |
|
3/24/2022 |
|
6 |
to |
30 |
Years |
| Healthcare |
|
Kaufman |
|
TX |
|
— |
|
|
268 |
|
|
1,677 |
|
|
— |
|
|
15 |
|
|
268 |
|
|
1,692 |
|
|
1,960 |
|
|
(101) |
|
|
2008 |
|
3/24/2022 |
|
7 |
to |
35 |
Years |
| Dollar Stores |
|
Ely |
|
NV |
|
— |
|
|
134 |
|
|
1,136 |
|
|
— |
|
|
— |
|
|
134 |
|
|
1,136 |
|
|
1,270 |
|
|
(76) |
|
|
2014 |
|
3/25/2022 |
|
8 |
to |
35 |
Years |
| Arts & Crafts |
|
Dothan |
|
AL |
|
— |
|
|
1,410 |
|
|
5,101 |
|
|
— |
|
|
28 |
|
|
1,410 |
|
|
5,129 |
|
|
6,539 |
|
|
(521) |
|
|
1970 |
|
3/30/2022 |
|
4 |
to |
20 |
Years |
| Casual Dining |
|
Dothan |
|
AL |
|
— |
|
|
564 |
|
|
586 |
|
|
— |
|
|
— |
|
|
564 |
|
|
586 |
|
|
1,150 |
|
|
(84) |
|
|
2003 |
|
3/30/2022 |
|
6 |
to |
16 |
Years |
| Discount Retail |
|
Alpena |
|
MI |
|
— |
|
|
697 |
|
|
3,825 |
|
|
— |
|
|
— |
|
|
697 |
|
|
3,825 |
|
|
4,522 |
|
|
(46) |
|
|
2023 |
|
3/30/2022 |
|
9 |
to |
35 |
Years |
| Grocery |
|
Dothan |
|
AL |
|
— |
|
|
1,155 |
|
|
5,178 |
|
|
— |
|
|
64 |
|
|
1,155 |
|
|
5,242 |
|
|
6,397 |
|
|
(340) |
|
|
1968 |
|
3/30/2022 |
|
7 |
to |
32 |
Years |
| Quick Service Restaurants |
|
Dothan |
|
AL |
|
— |
|
|
427 |
|
|
1,275 |
|
|
— |
|
|
— |
|
|
427 |
|
|
1,275 |
|
|
1,702 |
|
|
(95) |
|
|
2011 |
|
3/30/2022 |
|
4 |
to |
29 |
Years |
| Dollar Stores |
|
Livonia |
|
MI |
|
— |
|
|
96 |
|
|
1,292 |
|
|
— |
|
|
534 |
|
|
96 |
|
|
1,826 |
|
|
1,922 |
|
|
(102) |
|
|
1956 |
|
3/31/2022 |
|
4 |
to |
28 |
Years |
| Dollar Stores |
|
Lewistown |
|
PA |
|
— |
|
|
220 |
|
|
1,795 |
|
|
— |
|
|
— |
|
|
220 |
|
|
1,795 |
|
|
2,015 |
|
|
(124) |
|
|
2019 |
|
3/31/2022 |
|
7 |
to |
35 |
Years |
| Dollar Stores |
|
Orrstown |
|
PA |
|
— |
|
|
193 |
|
|
1,377 |
|
|
— |
|
|
— |
|
|
193 |
|
|
1,377 |
|
|
1,570 |
|
|
(137) |
|
|
2019 |
|
3/31/2022 |
|
7 |
to |
35 |
Years |
| General Retail |
|
Kansas City |
|
KS |
|
— |
|
|
600 |
|
|
7,312 |
|
|
— |
|
|
— |
|
|
600 |
|
|
7,312 |
|
|
7,912 |
|
|
(497) |
|
|
2014 |
|
3/31/2022 |
|
7 |
to |
33 |
Years |
| Drug Stores & Pharmacies |
|
West Allis |
|
WI |
|
— |
|
|
2,690 |
|
|
3,410 |
|
|
— |
|
|
— |
|
|
2,690 |
|
|
3,410 |
|
|
6,100 |
|
|
(199) |
|
|
2008 |
|
4/18/2022 |
|
7 |
to |
35 |
Years |
| Dollar Stores |
|
Magdelena |
|
NM |
|
— |
|
|
65 |
|
|
892 |
|
|
— |
|
|
— |
|
|
65 |
|
|
892 |
|
|
957 |
|
|
(73) |
|
|
2009 |
|
4/19/2022 |
|
3 |
to |
30 |
Years |
| Grocery |
|
Tonawanda |
|
NY |
|
— |
|
|
784 |
|
|
6,998 |
|
|
— |
|
|
— |
|
|
784 |
|
|
6,998 |
|
|
7,782 |
|
|
(515) |
|
|
2001 |
|
4/21/2022 |
|
5 |
to |
28 |
Years |
| Dollar Stores |
|
Penasco |
|
NM |
|
— |
|
|
181 |
|
|
1,030 |
|
|
— |
|
|
— |
|
|
181 |
|
|
1,030 |
|
|
1,211 |
|
|
(81) |
|
|
2009 |
|
5/2/2022 |
|
3 |
to |
28 |
Years |
| Automotive Service |
|
Mayfield |
|
OH |
|
— |
|
|
1,434 |
|
|
1,566 |
|
|
— |
|
|
19 |
|
|
1,434 |
|
|
1,585 |
|
|
3,019 |
|
|
(110) |
|
|
1968 |
|
5/13/2022 |
|
6 |
to |
25 |
Years |
| Casual Dining |
|
Mayfield |
|
OH |
|
— |
|
|
424 |
|
|
338 |
|
|
— |
|
|
19 |
|
|
424 |
|
|
357 |
|
|
781 |
|
|
(39) |
|
|
1968 |
|
5/13/2022 |
|
5 |
to |
16 |
Years |
| Grocery |
|
La Place |
|
LA |
|
— |
|
|
4,359 |
|
|
4,751 |
|
|
— |
|
|
— |
|
|
4,359 |
|
|
4,751 |
|
|
9,110 |
|
|
(447) |
|
|
1997 |
|
5/13/2022 |
|
6 |
to |
22 |
Years |
| Grocery |
|
Tonawanda |
|
NY |
|
— |
|
|
1,207 |
|
|
10,122 |
|
|
— |
|
|
— |
|
|
1,207 |
|
|
10,122 |
|
|
11,329 |
|
|
(637) |
|
|
2001 |
|
6/13/2022 |
|
4 |
to |
31 |
Years |
| Auto Parts |
|
Sparks |
|
NV |
|
— |
|
|
903 |
|
|
2,584 |
|
|
— |
|
|
— |
|
|
903 |
|
|
2,584 |
|
|
3,487 |
|
|
(265) |
|
|
1980 |
|
6/24/2022 |
|
5 |
to |
22 |
Years |
| Farm Supplies |
|
Sparks |
|
NV |
|
— |
|
|
765 |
|
|
1,944 |
|
|
— |
|
|
— |
|
|
765 |
|
|
1,944 |
|
|
2,709 |
|
|
(225) |
|
|
1980 |
|
6/24/2022 |
|
5 |
to |
19 |
Years |
| Home Improvement |
|
Sparks |
|
NV |
|
— |
|
|
355 |
|
|
1,287 |
|
|
— |
|
|
— |
|
|
355 |
|
|
1,287 |
|
|
1,642 |
|
|
(132) |
|
|
1980 |
|
6/24/2022 |
|
6 |
to |
19 |
Years |
| Drug Stores & Pharmacies |
|
Tulare |
|
CA |
|
— |
|
|
1,550 |
|
|
4,156 |
|
|
— |
|
|
— |
|
|
1,550 |
|
|
4,156 |
|
|
5,706 |
|
|
(230) |
|
|
2009 |
|
6/28/2022 |
|
9 |
to |
35 |
Years |
| Drug Stores & Pharmacies |
|
Fort Wayne |
|
IN |
|
— |
|
|
2,751 |
|
|
3,796 |
|
|
— |
|
|
— |
|
|
2,751 |
|
|
3,796 |
|
|
6,547 |
|
|
(203) |
|
|
2010 |
|
6/28/2022 |
|
9 |
to |
35 |
Years |
| Drug Stores & Pharmacies |
|
Noblesville |
|
IN |
|
— |
|
|
2,623 |
|
|
3,915 |
|
|
— |
|
|
— |
|
|
2,623 |
|
|
3,915 |
|
|
6,538 |
|
|
(223) |
|
|
2009 |
|
6/28/2022 |
|
9 |
to |
35 |
Years |
| Drug Stores & Pharmacies |
|
Jackson |
|
MS |
|
— |
|
|
2,286 |
|
|
3,036 |
|
|
— |
|
|
— |
|
|
2,286 |
|
|
3,036 |
|
|
5,322 |
|
|
(165) |
|
|
2009 |
|
6/28/2022 |
|
9 |
to |
35 |
Years |
| Drug Stores & Pharmacies |
|
Newport News |
|
VA |
|
— |
|
|
4,408 |
|
|
3,802 |
|
|
— |
|
|
— |
|
|
4,408 |
|
|
3,802 |
|
|
8,210 |
|
|
(226) |
|
|
2009 |
|
6/28/2022 |
|
9 |
to |
35 |
Years |
| Drug Stores & Pharmacies |
|
Yorktown |
|
VA |
|
— |
|
|
3,996 |
|
|
3,749 |
|
|
— |
|
|
— |
|
|
3,996 |
|
|
3,749 |
|
|
7,745 |
|
|
(211) |
|
|
2009 |
|
6/28/2022 |
|
8 |
to |
35 |
Years |
| Grocery |
|
Palmdale |
|
CA |
|
— |
|
|
2,046 |
|
|
7,504 |
|
|
— |
|
|
200 |
|
|
2,046 |
|
|
7,704 |
|
|
9,750 |
|
|
(386) |
|
|
2000 |
|
6/28/2022 |
|
6 |
to |
35 |
Years |
| Specialty |
|
Palmdale |
|
CA |
|
— |
|
|
1,019 |
|
|
3,935 |
|
|
— |
|
|
— |
|
|
1,019 |
|
|
3,935 |
|
|
4,954 |
|
|
(203) |
|
|
2000 |
|
6/28/2022 |
|
5 |
to |
35 |
Years |
| Dollar Stores |
|
Springfield |
|
IL |
|
— |
|
|
142 |
|
|
990 |
|
|
— |
|
|
— |
|
|
142 |
|
|
990 |
|
|
1,132 |
|
|
(92) |
|
|
1980 |
|
6/30/2022 |
|
2 |
to |
20 |
Years |
| Dollar Stores |
|
Buffalo |
|
NY |
|
— |
|
|
170 |
|
|
1,813 |
|
|
— |
|
|
— |
|
|
170 |
|
|
1,813 |
|
|
1,983 |
|
|
(94) |
|
|
2019 |
|
6/30/2022 |
|
7 |
to |
35 |
Years |
| Drug Stores & Pharmacies |
|
Athens |
|
GA |
|
— |
|
|
2,272 |
|
|
3,919 |
|
|
— |
|
|
— |
|
|
2,272 |
|
|
3,919 |
|
|
6,191 |
|
|
(206) |
|
|
2009 |
|
7/1/2022 |
|
10 |
to |
35 |
Years |
| Drug Stores & Pharmacies |
|
Rockford |
|
IL |
|
— |
|
|
2,285 |
|
|
4,649 |
|
|
— |
|
|
— |
|
|
2,285 |
|
|
4,649 |
|
|
6,934 |
|
|
(238) |
|
|
2009 |
|
7/1/2022 |
|
9 |
to |
35 |
Years |
| Drug Stores & Pharmacies |
|
New Orleans |
|
LA |
|
— |
|
|
2,228 |
|
|
3,699 |
|
|
— |
|
|
— |
|
|
2,228 |
|
|
3,699 |
|
|
5,927 |
|
|
(200) |
|
|
2009 |
|
7/1/2022 |
|
11 |
to |
35 |
Years |
| Drug Stores & Pharmacies |
|
Bismarck |
|
ND |
|
— |
|
|
2,143 |
|
|
3,913 |
|
|
— |
|
|
— |
|
|
2,143 |
|
|
3,913 |
|
|
6,056 |
|
|
(206) |
|
|
2009 |
|
7/1/2022 |
|
9 |
to |
35 |
Years |
| Drug Stores & Pharmacies |
|
Las Vegas |
|
NV |
|
— |
|
|
3,129 |
|
|
4,847 |
|
|
— |
|
|
— |
|
|
3,129 |
|
|
4,847 |
|
|
7,976 |
|
|
(260) |
|
|
2009 |
|
7/1/2022 |
|
9 |
to |
35 |
Years |
| Grocery |
|
Harrison |
|
MI |
|
— |
|
|
564 |
|
|
4,579 |
|
|
— |
|
|
29 |
|
|
564 |
|
|
4,608 |
|
|
5,172 |
|
|
(364) |
|
|
2001 |
|
7/26/2022 |
|
5 |
to |
29 |
Years |
| Dollar Stores |
|
Oglethorpe |
|
GA |
|
— |
|
|
112 |
|
|
802 |
|
|
— |
|
|
— |
|
|
112 |
|
|
802 |
|
|
914 |
|
|
(58) |
|
|
2009 |
|
8/3/2022 |
|
5 |
to |
27 |
Years |
| Grocery |
|
Janesville |
|
WI |
|
— |
|
|
2,039 |
|
|
15,748 |
|
|
— |
|
|
— |
|
|
2,039 |
|
|
15,748 |
|
|
17,787 |
|
|
(751) |
|
|
2015 |
|
8/17/2022 |
|
7 |
to |
35 |
Years |
| Auto Parts |
|
Marion |
|
IN |
|
— |
|
|
469 |
|
|
495 |
|
|
— |
|
|
33 |
|
|
469 |
|
|
528 |
|
|
997 |
|
|
(85) |
|
|
1961 |
|
9/8/2022 |
|
5 |
to |
9 |
Years |
| Dollar Stores |
|
Marion |
|
IN |
|
— |
|
|
469 |
|
|
676 |
|
|
— |
|
|
94 |
|
|
469 |
|
|
770 |
|
|
1,239 |
|
|
(80) |
|
|
1961 |
|
9/8/2022 |
|
3 |
to |
16 |
Years |
| Auto Parts |
|
Bluefiled |
|
WV |
|
— |
|
|
55 |
|
|
673 |
|
|
— |
|
|
45 |
|
|
55 |
|
|
718 |
|
|
773 |
|
|
(52) |
|
|
1996 |
|
9/20/2022 |
|
6 |
to |
22 |
Years |
| Discount Retail |
|
Forest City |
|
NC |
|
— |
|
|
544 |
|
|
968 |
|
|
— |
|
|
— |
|
|
544 |
|
|
968 |
|
|
1,512 |
|
|
(173) |
|
|
1989 |
|
9/20/2022 |
|
4 |
to |
13 |
Years |
| Dollar Stores |
|
Bluefiled |
|
WV |
|
— |
|
|
55 |
|
|
608 |
|
|
— |
|
|
— |
|
|
55 |
|
|
608 |
|
|
663 |
|
|
(50) |
|
|
1996 |
|
9/20/2022 |
|
4 |
to |
19 |
Years |
| Drug Stores & Pharmacies |
|
Philadelphia |
|
PA |
|
— |
|
|
2,888 |
|
|
— |
|
|
— |
|
|
— |
|
|
2,888 |
|
|
— |
|
|
2,888 |
|
|
— |
|
|
1997 |
|
9/21/2022 |
|
|
|
|
|
| Dollar Stores |
|
Lithia Springs |
|
GA |
|
— |
|
|
213 |
|
|
1,722 |
|
|
— |
|
|
— |
|
|
213 |
|
|
1,722 |
|
|
1,935 |
|
|
(82) |
|
|
2011 |
|
9/23/2022 |
|
4 |
to |
35 |
Years |
| Grocery |
|
Orange City |
|
IA |
|
— |
|
|
358 |
|
|
4,950 |
|
|
— |
|
|
— |
|
|
358 |
|
|
4,950 |
|
|
5,308 |
|
|
(222) |
|
|
2017 |
|
9/23/2022 |
|
8 |
to |
35 |
Years |
|
|
|
|
|
|
|
|
|
|
|
|
|
|
|
|
|
|
|
|
|
|
|
|
|
|
|
|
|
|
|
|
|
|
|
|
|
|
|
|
|
|
|
|
|
|
|
|
|
|
|
|
|
|
|
|
|
|
|
|
|
|
|
|
|
|
|
|
|
|
|
|
|
|
|
|
|
|
|
|
|
|
|
|
|
|
|
|
|
|
|
|
|
|
|
|
| Description |
|
|
|
Initial Cost to Company |
|
Cost Capitalized Subsequent to Acquisition(1) |
|
Gross Amount as of December 31, 2023(2), (3) |
|
|
|
|
|
|
|
|
|
|
|
| Industry |
|
City |
|
State |
|
Encumbrances |
|
Land |
|
Building and Improvements |
|
Land |
|
Building and Improvements |
|
Land |
|
Building and Improvements |
|
Total |
|
Accumulated Depreciation(3), (4) |
|
Date of Construction |
|
Date Acquired(5) |
|
Life on Which Depreciation in Statements of Operations and Comprehensive Income is Computed |
| Drug Stores & Pharmacies |
|
Swansea |
|
IL |
|
— |
|
|
1,172 |
|
|
1,876 |
|
|
— |
|
|
— |
|
|
1,172 |
|
|
1,876 |
|
|
3,048 |
|
|
(161) |
|
|
1997 |
|
9/28/2022 |
|
4 |
to |
20 |
Years |
| Discount Retail |
|
Elizabeth City |
|
NC |
|
— |
|
|
639 |
|
|
2,226 |
|
|
— |
|
|
— |
|
|
639 |
|
|
2,226 |
|
|
2,865 |
|
|
(180) |
|
|
1993 |
|
9/29/2022 |
|
3 |
to |
24 |
Years |
| Drug Stores & Pharmacies |
|
Salisbury |
|
NC |
|
— |
|
|
2,218 |
|
|
2,953 |
|
|
— |
|
|
— |
|
|
2,218 |
|
|
2,953 |
|
|
5,171 |
|
|
(146) |
|
|
2006 |
|
9/29/2022 |
|
6 |
to |
33 |
Years |
| Drug Stores & Pharmacies |
|
Statesville |
|
NC |
|
— |
|
|
986 |
|
|
2,751 |
|
|
— |
|
|
— |
|
|
986 |
|
|
2,751 |
|
|
3,737 |
|
|
(134) |
|
|
2005 |
|
9/29/2022 |
|
7 |
to |
32 |
Years |
| Drug Stores & Pharmacies |
|
Farmville |
|
VA |
|
— |
|
|
4,155 |
|
|
3,459 |
|
|
— |
|
|
— |
|
|
4,155 |
|
|
3,459 |
|
|
7,614 |
|
|
(145) |
|
|
2015 |
|
9/29/2022 |
|
9 |
to |
35 |
Years |
| Grocery |
|
Elizabeth City |
|
NC |
|
— |
|
|
1,246 |
|
|
1,492 |
|
|
— |
|
|
— |
|
|
1,246 |
|
|
1,492 |
|
|
2,738 |
|
|
(422) |
|
|
1993 |
|
9/29/2022 |
|
2 |
to |
6 |
Years |
| Discount Retail |
|
Fond du Lac |
|
WI |
|
— |
|
|
267 |
|
|
2,775 |
|
|
— |
|
|
— |
|
|
267 |
|
|
2,775 |
|
|
3,042 |
|
|
(133) |
|
|
1973 |
|
9/30/2022 |
|
8 |
to |
31 |
Years |
| Dollar Stores |
|
Detroit |
|
MI |
|
— |
|
|
235 |
|
|
1,132 |
|
|
— |
|
|
— |
|
|
235 |
|
|
1,132 |
|
|
1,367 |
|
|
(54) |
|
|
1960 |
|
9/30/2022 |
|
2 |
to |
31 |
Years |
| Grocery |
|
Covington |
|
LA |
|
8,361 |
|
|
1,989 |
|
|
9,693 |
|
|
— |
|
|
57 |
|
|
1,989 |
|
|
9,750 |
|
|
11,739 |
|
|
(439) |
|
|
2008 |
|
9/30/2022 |
|
8 |
to |
35 |
Years |
| Grocery |
|
New Haven |
|
IN |
|
— |
|
|
987 |
|
|
2,356 |
|
|
— |
|
|
20 |
|
|
987 |
|
|
2,376 |
|
|
3,363 |
|
|
(309) |
|
|
1977 |
|
10/3/2022 |
|
4 |
to |
12 |
Years |
| Home Improvement |
|
Bossier City |
|
LA |
|
— |
|
|
757 |
|
|
5,392 |
|
|
— |
|
|
— |
|
|
757 |
|
|
5,392 |
|
|
6,149 |
|
|
(52) |
|
|
2023 |
|
10/24/2022 |
|
10 |
to |
35 |
Years |
| Dollar Stores |
|
South Park |
|
PA |
|
— |
|
|
188 |
|
|
1,290 |
|
|
— |
|
|
— |
|
|
188 |
|
|
1,290 |
|
|
1,478 |
|
|
(59) |
|
|
2015 |
|
10/25/2022 |
|
6 |
to |
35 |
Years |
| Dollar Stores |
|
Providence |
|
RI |
|
— |
|
|
1,404 |
|
|
664 |
|
|
— |
|
|
195 |
|
|
1,404 |
|
|
859 |
|
|
2,263 |
|
|
(58) |
|
|
1995 |
|
11/8/2022 |
|
4 |
to |
16 |
Years |
| Automotive Service |
|
Douglas |
|
GA |
|
— |
|
|
786 |
|
|
1,793 |
|
|
— |
|
|
— |
|
|
786 |
|
|
1,793 |
|
|
2,579 |
|
|
(69) |
|
|
2022 |
|
11/10/2022 |
|
9 |
to |
35 |
Years |
| Sporting Goods |
|
Cranberry Township |
|
PA |
|
— |
|
|
3,211 |
|
|
13,224 |
|
|
— |
|
|
6 |
|
|
3,211 |
|
|
13,230 |
|
|
16,441 |
|
|
(472) |
|
|
2012 |
|
12/15/2022 |
|
5 |
to |
35 |
Years |
| Dollar Stores |
|
Baldwin |
|
MI |
|
— |
|
|
53 |
|
|
1,198 |
|
|
— |
|
|
— |
|
|
53 |
|
|
1,198 |
|
|
1,251 |
|
|
(43) |
|
|
2022 |
|
12/21/2022 |
|
12 |
to |
35 |
Years |
| Dollar Stores |
|
Bemidji |
|
MN |
|
— |
|
|
71 |
|
|
1,307 |
|
|
— |
|
|
— |
|
|
71 |
|
|
1,307 |
|
|
1,378 |
|
|
(48) |
|
|
2022 |
|
12/21/2022 |
|
7 |
to |
35 |
Years |
| Dollar Stores |
|
Blanchard |
|
MI |
|
— |
|
|
197 |
|
|
1,190 |
|
|
— |
|
|
— |
|
|
197 |
|
|
1,190 |
|
|
1,387 |
|
|
(43) |
|
|
2022 |
|
12/21/2022 |
|
11 |
to |
35 |
Years |
| Dollar Stores |
|
Crystal |
|
MI |
|
— |
|
|
125 |
|
|
1,176 |
|
|
— |
|
|
— |
|
|
125 |
|
|
1,176 |
|
|
1,301 |
|
|
(41) |
|
|
2021 |
|
12/21/2022 |
|
10 |
to |
35 |
Years |
| Dollar Stores |
|
South Haven |
|
MI |
|
— |
|
|
59 |
|
|
1,137 |
|
|
— |
|
|
— |
|
|
59 |
|
|
1,137 |
|
|
1,196 |
|
|
(42) |
|
|
2022 |
|
12/21/2022 |
|
12 |
to |
35 |
Years |
| Dollar Stores |
|
Three Rivers |
|
MI |
|
— |
|
|
106 |
|
|
1,316 |
|
|
— |
|
|
— |
|
|
106 |
|
|
1,316 |
|
|
1,422 |
|
|
(47) |
|
|
2022 |
|
12/21/2022 |
|
7 |
to |
35 |
Years |
| Dollar Stores |
|
Wabeno |
|
WI |
|
— |
|
|
193 |
|
|
1,084 |
|
|
— |
|
|
— |
|
|
193 |
|
|
1,084 |
|
|
1,277 |
|
|
(39) |
|
|
2022 |
|
12/21/2022 |
|
12 |
to |
35 |
Years |
| Dollar Stores |
|
Walkerville |
|
MI |
|
— |
|
|
80 |
|
|
1,195 |
|
|
— |
|
|
— |
|
|
80 |
|
|
1,195 |
|
|
1,275 |
|
|
(42) |
|
|
2022 |
|
12/21/2022 |
|
12 |
to |
35 |
Years |
| Specialty |
|
Tysons |
|
VA |
|
— |
|
|
9,822 |
|
|
9,487 |
|
|
— |
|
|
384 |
|
|
9,822 |
|
|
9,871 |
|
|
19,693 |
|
|
(306) |
|
|
1978 |
|
12/28/2022 |
|
6 |
to |
35 |
Years |
| Dollar Stores |
|
Chipley |
|
FL |
|
— |
|
|
240 |
|
|
1,251 |
|
|
— |
|
|
— |
|
|
240 |
|
|
1,251 |
|
|
1,491 |
|
|
(45) |
|
|
2022 |
|
12/29/2022 |
|
7 |
to |
35 |
Years |
| Dollar Stores |
|
Alford |
|
FL |
|
— |
|
|
138 |
|
|
1,220 |
|
|
— |
|
|
— |
|
|
138 |
|
|
1,220 |
|
|
1,358 |
|
|
(44) |
|
|
2022 |
|
12/29/2022 |
|
7 |
to |
35 |
Years |
| Dollar Stores |
|
Ennice |
|
NC |
|
— |
|
|
89 |
|
|
1,257 |
|
|
— |
|
|
— |
|
|
89 |
|
|
1,257 |
|
|
1,346 |
|
|
(47) |
|
|
2022 |
|
12/29/2022 |
|
7 |
to |
35 |
Years |
| Dollar Stores |
|
Donalsonville |
|
GA |
|
— |
|
|
122 |
|
|
1,224 |
|
|
— |
|
|
— |
|
|
122 |
|
|
1,224 |
|
|
1,346 |
|
|
(44) |
|
|
2022 |
|
12/29/2022 |
|
7 |
to |
35 |
Years |
| Grocery |
|
Greenfield |
|
WI |
|
— |
|
|
2,064 |
|
|
20,089 |
|
|
— |
|
|
— |
|
|
2,064 |
|
|
20,089 |
|
|
22,153 |
|
|
(882) |
|
|
1970 |
|
12/29/2022 |
|
6 |
to |
29 |
Years |
| Dollar Stores |
|
Alton |
|
NH |
|
— |
|
|
183 |
|
|
1,346 |
|
|
— |
|
|
— |
|
|
183 |
|
|
1,346 |
|
|
1,529 |
|
|
(41) |
|
|
2016 |
|
2/13/2023 |
|
9 |
to |
35 |
Years |
| Drug Stores & Pharmacies |
|
Fort Wayne |
|
IN |
|
— |
|
|
1,041 |
|
|
3,562 |
|
|
— |
|
|
— |
|
|
1,041 |
|
|
3,562 |
|
|
4,603 |
|
|
(100) |
|
|
2002 |
|
3/14/2023 |
|
5 |
to |
35 |
Years |
| Dollar Stores |
|
Shelby |
|
OH |
|
— |
|
|
41 |
|
|
1,259 |
|
|
— |
|
|
— |
|
|
41 |
|
|
1,259 |
|
|
1,300 |
|
|
(37) |
|
|
2009 |
|
3/17/2023 |
|
5 |
to |
34 |
Years |
| Drug Stores & Pharmacies |
|
Warsaw |
|
IN |
|
— |
|
|
1,227 |
|
|
2,939 |
|
|
— |
|
|
— |
|
|
1,227 |
|
|
2,939 |
|
|
4,166 |
|
|
(91) |
|
|
2003 |
|
3/17/2023 |
|
6 |
to |
32 |
Years |
| Drug Stores & Pharmacies |
|
Canal Winchester |
|
OH |
|
— |
|
|
1,532 |
|
|
3,330 |
|
|
— |
|
|
— |
|
|
1,532 |
|
|
3,330 |
|
|
4,862 |
|
|
(93) |
|
|
2004 |
|
3/17/2023 |
|
6 |
to |
35 |
Years |
| Drug Stores & Pharmacies |
|
Irondequoit |
|
NY |
|
— |
|
|
2,179 |
|
|
3,037 |
|
|
— |
|
|
— |
|
|
2,179 |
|
|
3,037 |
|
|
5,216 |
|
|
(85) |
|
|
2005 |
|
3/21/2023 |
|
8 |
to |
35 |
Years |
| Dollar Stores |
|
Ahoskie |
|
NC |
|
— |
|
|
70 |
|
|
1,489 |
|
|
— |
|
|
— |
|
|
70 |
|
|
1,489 |
|
|
1,559 |
|
|
(41) |
|
|
2014 |
|
3/22/2023 |
|
7 |
to |
35 |
Years |
| Drug Stores & Pharmacies |
|
Albertville |
|
AL |
|
— |
|
|
1,635 |
|
|
3,536 |
|
|
— |
|
|
— |
|
|
1,635 |
|
|
3,536 |
|
|
5,171 |
|
|
(98) |
|
|
2008 |
|
3/22/2023 |
|
8 |
to |
35 |
Years |
| Drug Stores & Pharmacies |
|
St. Paul |
|
MN |
|
— |
|
|
1,095 |
|
|
3,968 |
|
|
— |
|
|
— |
|
|
1,095 |
|
|
3,968 |
|
|
5,063 |
|
|
(105) |
|
|
2003 |
|
3/24/2023 |
|
5 |
to |
35 |
Years |
| Sporting Goods |
|
Helena |
|
MT |
|
— |
|
|
1,730 |
|
|
6,063 |
|
|
— |
|
|
— |
|
|
1,730 |
|
|
6,063 |
|
|
7,793 |
|
|
(183) |
|
|
2007 |
|
3/27/2023 |
|
5 |
to |
35 |
Years |
| Automotive Service |
|
Charlotte |
|
NC |
|
— |
|
|
604 |
|
|
460 |
|
|
— |
|
|
— |
|
|
604 |
|
|
460 |
|
|
1,064 |
|
|
(29) |
|
|
1994 |
|
3/29/2023 |
|
5 |
to |
15 |
Years |
| Dollar Stores |
|
Tama |
|
IA |
|
— |
|
|
119 |
|
|
1,388 |
|
|
— |
|
|
— |
|
|
119 |
|
|
1,388 |
|
|
1,507 |
|
|
(38) |
|
|
2023 |
|
3/30/2023 |
|
9 |
to |
35 |
Years |
| Quick Service Restaurants |
|
Indianola |
|
MS |
|
— |
|
|
350 |
|
|
1,180 |
|
|
— |
|
|
— |
|
|
350 |
|
|
1,180 |
|
|
1,530 |
|
|
(41) |
|
|
2022 |
|
3/30/2023 |
|
8 |
to |
29 |
Years |
| Quick Service Restaurants |
|
Citonelle |
|
AL |
|
— |
|
|
364 |
|
|
1,172 |
|
|
— |
|
|
— |
|
|
364 |
|
|
1,172 |
|
|
1,536 |
|
|
(45) |
|
|
2022 |
|
3/30/2023 |
|
8 |
to |
29 |
Years |
| Quick Service Restaurants |
|
Vinemont |
|
AL |
|
— |
|
|
409 |
|
|
1,125 |
|
|
— |
|
|
— |
|
|
409 |
|
|
1,125 |
|
|
1,534 |
|
|
(41) |
|
|
2022 |
|
3/30/2023 |
|
8 |
to |
29 |
Years |
| Quick Service Restaurants |
|
Tunica |
|
MS |
|
— |
|
|
244 |
|
|
1,295 |
|
|
— |
|
|
— |
|
|
244 |
|
|
1,295 |
|
|
1,539 |
|
|
(49) |
|
|
2022 |
|
3/30/2023 |
|
8 |
to |
29 |
Years |
| Quick Service Restaurants |
|
Cleveland |
|
MS |
|
— |
|
|
248 |
|
|
1,284 |
|
|
— |
|
|
— |
|
|
248 |
|
|
1,284 |
|
|
1,532 |
|
|
(44) |
|
|
2023 |
|
3/30/2023 |
|
13 |
to |
30 |
Years |
| Dollar Stores |
|
Enfield |
|
NC |
|
— |
|
|
64 |
|
|
1,409 |
|
|
— |
|
|
— |
|
|
64 |
|
|
1,409 |
|
|
1,473 |
|
|
(39) |
|
|
2021 |
|
3/31/2023 |
|
7 |
to |
35 |
Years |
| Dollar Stores |
|
Heath Springs |
|
SC |
|
— |
|
|
126 |
|
|
1,438 |
|
|
— |
|
|
— |
|
|
126 |
|
|
1,438 |
|
|
1,564 |
|
|
(37) |
|
|
2023 |
|
3/31/2023 |
|
9 |
to |
35 |
Years |
| Grocery |
|
North Fort Myers |
|
FL |
|
— |
|
|
1,043 |
|
|
5,728 |
|
|
— |
|
|
— |
|
|
1,043 |
|
|
5,728 |
|
|
6,771 |
|
|
(215) |
|
|
1999 |
|
3/31/2023 |
|
7 |
to |
29 |
Years |
| Dollar Stores |
|
Cherokee |
|
IA |
|
— |
|
|
206 |
|
|
1,422 |
|
|
— |
|
|
— |
|
|
206 |
|
|
1,422 |
|
|
1,628 |
|
|
(58) |
|
|
2015 |
|
4/26/2023 |
|
4 |
to |
22 |
Years |
| Dollar Stores |
|
Ramer |
|
AL |
|
— |
|
|
175 |
|
|
1,213 |
|
|
— |
|
|
— |
|
|
175 |
|
|
1,213 |
|
|
1,388 |
|
|
(32) |
|
|
2022 |
|
4/26/2023 |
|
7 |
to |
35 |
Years |
| Dollar Stores |
|
Russellville |
|
AL |
|
— |
|
|
126 |
|
|
1,212 |
|
|
— |
|
|
— |
|
|
126 |
|
|
1,212 |
|
|
1,338 |
|
|
(32) |
|
|
2022 |
|
4/26/2023 |
|
8 |
to |
35 |
Years |
|
|
|
|
|
|
|
|
|
|
|
|
|
|
|
|
|
|
|
|
|
|
|
|
|
|
|
|
|
|
|
|
|
|
|
|
|
|
|
|
|
|
|
|
|
|
|
|
|
|
|
|
|
|
|
|
|
|
|
|
|
|
|
|
|
|
|
|
|
|
|
|
|
|
|
|
|
|
|
|
|
|
|
|
|
|
|
|
|
|
|
|
|
|
|
|
| Description |
|
|
|
Initial Cost to Company |
|
Cost Capitalized Subsequent to Acquisition(1) |
|
Gross Amount as of December 31, 2023(2), (3) |
|
|
|
|
|
|
|
|
|
|
|
| Industry |
|
City |
|
State |
|
Encumbrances |
|
Land |
|
Building and Improvements |
|
Land |
|
Building and Improvements |
|
Land |
|
Building and Improvements |
|
Total |
|
Accumulated Depreciation(3), (4) |
|
Date of Construction |
|
Date Acquired(5) |
|
Life on Which Depreciation in Statements of Operations and Comprehensive Income is Computed |
| Dollar Stores |
|
Tallassee |
|
AL |
|
— |
|
|
228 |
|
|
1,278 |
|
|
— |
|
|
— |
|
|
228 |
|
|
1,278 |
|
|
1,506 |
|
|
(31) |
|
|
2022 |
|
4/26/2023 |
|
12 |
to |
35 |
Years |
| Dollar Stores |
|
Rainbow City |
|
AL |
|
— |
|
|
79 |
|
|
1,361 |
|
|
— |
|
|
— |
|
|
79 |
|
|
1,361 |
|
|
1,440 |
|
|
(37) |
|
|
2022 |
|
4/26/2023 |
|
9 |
to |
35 |
Years |
| Dollar Stores |
|
Headland |
|
AL |
|
— |
|
|
199 |
|
|
1,571 |
|
|
— |
|
|
— |
|
|
199 |
|
|
1,571 |
|
|
1,770 |
|
|
(39) |
|
|
2023 |
|
4/26/2023 |
|
8 |
to |
35 |
Years |
| Dollar Stores |
|
Killen |
|
AL |
|
— |
|
|
131 |
|
|
1,534 |
|
|
— |
|
|
— |
|
|
131 |
|
|
1,534 |
|
|
1,665 |
|
|
(37) |
|
|
2023 |
|
4/26/2023 |
|
13 |
to |
35 |
Years |
| Dollar Stores |
|
Ozark |
|
AL |
|
— |
|
|
296 |
|
|
1,334 |
|
|
— |
|
|
— |
|
|
296 |
|
|
1,334 |
|
|
1,630 |
|
|
(36) |
|
|
2023 |
|
4/26/2023 |
|
8 |
to |
35 |
Years |
| Dollar Stores |
|
Falkville |
|
AL |
|
— |
|
|
327 |
|
|
1,434 |
|
|
— |
|
|
— |
|
|
327 |
|
|
1,434 |
|
|
1,761 |
|
|
(38) |
|
|
2023 |
|
4/26/2023 |
|
13 |
to |
35 |
Years |
| Drug Stores & Pharmacies |
|
Chelmsford |
|
MA |
|
— |
|
|
2,729 |
|
|
— |
|
|
— |
|
|
— |
|
|
2,729 |
|
|
— |
|
|
2,729 |
|
|
— |
|
|
2012 |
|
4/26/2023 |
|
|
|
|
|
| Drug Stores & Pharmacies |
|
Houston |
|
TX |
|
— |
|
|
1,209 |
|
|
3,058 |
|
|
— |
|
|
— |
|
|
1,209 |
|
|
3,058 |
|
|
4,267 |
|
|
(75) |
|
|
2004 |
|
4/26/2023 |
|
7 |
to |
35 |
Years |
| Drug Stores & Pharmacies |
|
Westampton |
|
NJ |
|
— |
|
|
1,251 |
|
|
3,225 |
|
|
— |
|
|
— |
|
|
1,251 |
|
|
3,225 |
|
|
4,476 |
|
|
(99) |
|
|
2008 |
|
4/26/2023 |
|
6 |
to |
30 |
Years |
| Grocery |
|
Park Ridge |
|
IL |
|
— |
|
|
3,967 |
|
|
10,810 |
|
|
— |
|
|
— |
|
|
3,967 |
|
|
10,810 |
|
|
14,777 |
|
|
(274) |
|
|
2013 |
|
4/26/2023 |
|
8 |
to |
35 |
Years |
| Grocery |
|
O'Fallon |
|
IL |
|
— |
|
|
2,076 |
|
|
4,936 |
|
|
— |
|
|
— |
|
|
2,076 |
|
|
4,936 |
|
|
7,012 |
|
|
(234) |
|
|
1996 |
|
4/26/2023 |
|
4 |
to |
20 |
Years |
| Sporting Goods |
|
Frisco |
|
TX |
|
— |
|
|
2,409 |
|
|
9,316 |
|
|
— |
|
|
— |
|
|
2,409 |
|
|
9,316 |
|
|
11,725 |
|
|
(240) |
|
|
2012 |
|
4/26/2023 |
|
10 |
to |
35 |
Years |
| Dollar Stores |
|
Warren |
|
OH |
|
— |
|
|
366 |
|
|
1,054 |
|
|
— |
|
|
— |
|
|
366 |
|
|
1,054 |
|
|
1,420 |
|
|
(29) |
|
|
2023 |
|
4/28/2023 |
|
4 |
to |
34 |
Years |
| Dollar Stores |
|
Alamogordo |
|
NM |
|
— |
|
|
483 |
|
|
1,469 |
|
|
— |
|
|
— |
|
|
483 |
|
|
1,469 |
|
|
1,952 |
|
|
(14) |
|
|
2023 |
|
5/1/2023 |
|
8 |
to |
35 |
Years |
| Dollar Stores |
|
Wise |
|
VA |
|
— |
|
|
419 |
|
|
1,163 |
|
|
— |
|
|
— |
|
|
419 |
|
|
1,163 |
|
|
1,582 |
|
|
(29) |
|
|
2023 |
|
5/2/2023 |
|
3 |
to |
34 |
Years |
| Dollar Stores |
|
Lodi |
|
NY |
|
— |
|
|
288 |
|
|
1,173 |
|
|
— |
|
|
— |
|
|
288 |
|
|
1,173 |
|
|
1,461 |
|
|
(7) |
|
|
2023 |
|
5/4/2023 |
|
8 |
to |
30 |
Years |
| Dollar Stores |
|
Marion |
|
LA |
|
— |
|
|
135 |
|
|
1,322 |
|
|
— |
|
|
— |
|
|
135 |
|
|
1,322 |
|
|
1,457 |
|
|
(14) |
|
|
2023 |
|
5/12/2023 |
|
10 |
to |
35 |
Years |
| Dollar Stores |
|
Eros |
|
LA |
|
— |
|
|
215 |
|
|
1,309 |
|
|
— |
|
|
— |
|
|
215 |
|
|
1,309 |
|
|
1,524 |
|
|
(17) |
|
|
2023 |
|
5/12/2023 |
|
10 |
to |
35 |
Years |
| Dollar Stores |
|
Hackberry |
|
LA |
|
— |
|
|
275 |
|
|
1,186 |
|
|
— |
|
|
— |
|
|
275 |
|
|
1,186 |
|
|
1,461 |
|
|
(17) |
|
|
2023 |
|
5/12/2023 |
|
10 |
to |
35 |
Years |
| Dollar Stores |
|
Summit |
|
MS |
|
— |
|
|
292 |
|
|
1,196 |
|
|
— |
|
|
— |
|
|
292 |
|
|
1,196 |
|
|
1,488 |
|
|
(12) |
|
|
2023 |
|
5/19/2023 |
|
10 |
to |
35 |
Years |
| Dollar Stores |
|
Blossom |
|
TX |
|
— |
|
|
166 |
|
|
1,312 |
|
|
— |
|
|
— |
|
|
166 |
|
|
1,312 |
|
|
1,478 |
|
|
(10) |
|
|
2023 |
|
5/19/2023 |
|
8 |
to |
35 |
Years |
| Dollar Stores |
|
Bellefonte |
|
PA |
|
— |
|
|
343 |
|
|
1,313 |
|
|
— |
|
|
— |
|
|
343 |
|
|
1,313 |
|
|
1,656 |
|
|
(7) |
|
|
2023 |
|
5/19/2023 |
|
8 |
to |
35 |
Years |
| Dollar Stores |
|
Endicott |
|
NY |
|
— |
|
|
433 |
|
|
1,148 |
|
|
— |
|
|
— |
|
|
433 |
|
|
1,148 |
|
|
1,581 |
|
|
(8) |
|
|
2023 |
|
5/19/2023 |
|
8 |
to |
35 |
Years |
| Dollar Stores |
|
Taft |
|
TX |
|
— |
|
|
355 |
|
|
1,360 |
|
|
— |
|
|
— |
|
|
355 |
|
|
1,360 |
|
|
1,715 |
|
|
(12) |
|
|
2023 |
|
5/26/2023 |
|
10 |
to |
35 |
Years |
| Dollar Stores |
|
Lawndale |
|
NC |
|
— |
|
|
299 |
|
|
1,732 |
|
|
— |
|
|
— |
|
|
299 |
|
|
1,732 |
|
|
2,031 |
|
|
(37) |
|
|
2023 |
|
5/30/2023 |
|
8 |
to |
35 |
Years |
| Dollar Stores |
|
Haleyville |
|
AL |
|
— |
|
|
158 |
|
|
1,205 |
|
|
— |
|
|
— |
|
|
158 |
|
|
1,205 |
|
|
1,363 |
|
|
(26) |
|
|
2023 |
|
5/30/2023 |
|
8 |
to |
35 |
Years |
| Dollar Stores |
|
Demopolis |
|
AL |
|
— |
|
|
154 |
|
|
1,321 |
|
|
— |
|
|
— |
|
|
154 |
|
|
1,321 |
|
|
1,475 |
|
|
(30) |
|
|
2023 |
|
5/30/2023 |
|
9 |
to |
35 |
Years |
| Dollar Stores |
|
Moundville |
|
AL |
|
— |
|
|
47 |
|
|
1,766 |
|
|
— |
|
|
— |
|
|
47 |
|
|
1,766 |
|
|
1,813 |
|
|
(38) |
|
|
2023 |
|
5/30/2023 |
|
8 |
to |
35 |
Years |
| Dollar Stores |
|
West Columbia |
|
TX |
|
— |
|
|
583 |
|
|
1,194 |
|
|
— |
|
|
— |
|
|
583 |
|
|
1,194 |
|
|
1,777 |
|
|
(9) |
|
|
1975 |
|
5/31/2023 |
|
10 |
to |
35 |
Years |
| Dollar Stores |
|
Valley View |
|
TX |
|
— |
|
|
276 |
|
|
1,187 |
|
|
— |
|
|
— |
|
|
276 |
|
|
1,187 |
|
|
1,463 |
|
|
(15) |
|
|
1981 |
|
5/31/2023 |
|
10 |
to |
35 |
Years |
| Grocery |
|
Elkhart |
|
IN |
|
— |
|
|
662 |
|
|
5,175 |
|
|
— |
|
|
— |
|
|
662 |
|
|
5,175 |
|
|
5,837 |
|
|
(200) |
|
|
2006 |
|
6/1/2023 |
|
5 |
to |
19 |
Years |
| Dollar Stores |
|
Defuniak Springs |
|
FL |
|
— |
|
|
300 |
|
|
983 |
|
|
— |
|
|
— |
|
|
300 |
|
|
983 |
|
|
1,283 |
|
|
(21) |
|
|
1994 |
|
6/7/2023 |
|
8 |
to |
35 |
Years |
| Dollar Stores |
|
Kenmare |
|
ND |
|
— |
|
|
254 |
|
|
1,478 |
|
|
— |
|
|
— |
|
|
254 |
|
|
1,478 |
|
|
1,732 |
|
|
(2) |
|
|
2023 |
|
6/7/2023 |
|
8 |
to |
35 |
Years |
| Dollar Stores |
|
Boyce |
|
LA |
|
— |
|
|
218 |
|
|
1,318 |
|
|
— |
|
|
— |
|
|
218 |
|
|
1,318 |
|
|
1,536 |
|
|
(6) |
|
|
2023 |
|
6/13/2023 |
|
8 |
to |
35 |
Years |
| Dollar Stores |
|
Gainesville |
|
TX |
|
— |
|
|
312 |
|
|
1,476 |
|
|
— |
|
|
— |
|
|
312 |
|
|
1,476 |
|
|
1,788 |
|
|
(11) |
|
|
2023 |
|
6/13/2023 |
|
9 |
to |
35 |
Years |
| Dollar Stores |
|
Lonoke |
|
AR |
|
— |
|
|
163 |
|
|
1,303 |
|
|
— |
|
|
— |
|
|
163 |
|
|
1,303 |
|
|
1,466 |
|
|
(6) |
|
|
2023 |
|
6/13/2023 |
|
8 |
to |
35 |
Years |
| Dollar Stores |
|
Eden |
|
NC |
|
— |
|
|
195 |
|
|
1,036 |
|
|
— |
|
|
— |
|
|
195 |
|
|
1,036 |
|
|
1,231 |
|
|
(22) |
|
|
1995 |
|
6/21/2023 |
|
9 |
to |
35 |
Years |
| Dollar Stores |
|
Homerville |
|
GA |
|
— |
|
|
273 |
|
|
1,204 |
|
|
— |
|
|
— |
|
|
273 |
|
|
1,204 |
|
|
1,477 |
|
|
(25) |
|
|
2023 |
|
6/21/2023 |
|
9 |
to |
35 |
Years |
| Dollar Stores |
|
Louisville |
|
GA |
|
— |
|
|
545 |
|
|
939 |
|
|
— |
|
|
— |
|
|
545 |
|
|
939 |
|
|
1,484 |
|
|
(19) |
|
|
2023 |
|
6/21/2023 |
|
9 |
to |
35 |
Years |
| Dollar Stores |
|
Reidsville |
|
NC |
|
— |
|
|
324 |
|
|
1,030 |
|
|
— |
|
|
— |
|
|
324 |
|
|
1,030 |
|
|
1,354 |
|
|
(22) |
|
|
2023 |
|
6/21/2023 |
|
9 |
to |
35 |
Years |
| Dollar Stores |
|
Christoval |
|
TX |
|
— |
|
|
323 |
|
|
1,537 |
|
|
— |
|
|
— |
|
|
323 |
|
|
1,537 |
|
|
1,860 |
|
|
(10) |
|
|
1973 |
|
7/6/2023 |
|
12 |
to |
35 |
Years |
| Dollar Stores |
|
Wilkesboro |
|
NC |
|
— |
|
|
309 |
|
|
1,120 |
|
|
— |
|
|
— |
|
|
309 |
|
|
1,120 |
|
|
1,429 |
|
|
(20) |
|
|
2023 |
|
7/7/2023 |
|
9 |
to |
35 |
Years |
| Automotive Service |
|
Dalton |
|
GA |
|
— |
|
|
324 |
|
|
2,697 |
|
|
— |
|
|
— |
|
|
324 |
|
|
2,697 |
|
|
3,021 |
|
|
(11) |
|
|
2023 |
|
7/10/2023 |
|
8 |
to |
35 |
Years |
| Dollar Stores |
|
Mount Orab |
|
OH |
|
— |
|
|
227 |
|
|
1,458 |
|
|
— |
|
|
— |
|
|
227 |
|
|
1,458 |
|
|
1,685 |
|
|
(10) |
|
|
1971 |
|
7/10/2023 |
|
13 |
to |
35 |
Years |
| Dollar Stores |
|
Algona |
|
IA |
|
— |
|
|
199 |
|
|
980 |
|
|
— |
|
|
— |
|
|
199 |
|
|
980 |
|
|
1,179 |
|
|
(47) |
|
|
1975 |
|
7/14/2023 |
|
4 |
to |
13 |
Years |
| Dollar Stores |
|
Ida Grove |
|
IA |
|
— |
|
|
55 |
|
|
1,270 |
|
|
— |
|
|
— |
|
|
55 |
|
|
1,270 |
|
|
1,325 |
|
|
(23) |
|
|
1981 |
|
7/14/2023 |
|
9 |
to |
29 |
Years |
| Sporting Goods |
|
Horseheads |
|
NY |
|
— |
|
|
491 |
|
|
5,772 |
|
|
— |
|
|
— |
|
|
491 |
|
|
5,772 |
|
|
6,263 |
|
|
(117) |
|
|
2009 |
|
7/18/2023 |
|
6 |
to |
32 |
Years |
|
|
|
|
|
|
|
|
|
|
|
|
|
|
|
|
|
|
|
|
|
|
|
|
|
|
|
|
|
|
|
|
|
|
|
|
|
|
|
|
|
|
|
|
|
|
|
|
|
|
|
|
|
|
|
|
|
|
|
|
|
|
|
|
|
|
|
|
|
|
|
|
|
|
|
|
|
|
|
|
|
|
|
|
|
|
|
|
|
|
|
|
|
|
|
|
| Description |
|
|
|
Initial Cost to Company |
|
Cost Capitalized Subsequent to Acquisition(1) |
|
Gross Amount as of December 31, 2023(2), (3) |
|
|
|
|
|
|
|
|
|
|
|
| Industry |
|
City |
|
State |
|
Encumbrances |
|
Land |
|
Building and Improvements |
|
Land |
|
Building and Improvements |
|
Land |
|
Building and Improvements |
|
Total |
|
Accumulated Depreciation(3), (4) |
|
Date of Construction |
|
Date Acquired(5) |
|
Life on Which Depreciation in Statements of Operations and Comprehensive Income is Computed |
| Dollar Stores |
|
Bethune |
|
SC |
|
— |
|
|
121 |
|
|
1,136 |
|
|
— |
|
|
— |
|
|
121 |
|
|
1,136 |
|
|
1,257 |
|
|
(22) |
|
|
1994 |
|
7/19/2023 |
|
7 |
to |
33 |
Years |
| Dollar Stores |
|
Mocksville |
|
NC |
|
— |
|
|
210 |
|
|
1,318 |
|
|
— |
|
|
— |
|
|
210 |
|
|
1,318 |
|
|
1,528 |
|
|
(18) |
|
|
2023 |
|
8/1/2023 |
|
9 |
to |
35 |
Years |
| Dollar Stores |
|
New Lebanon |
|
OH |
|
— |
|
|
275 |
|
|
1,340 |
|
|
— |
|
|
— |
|
|
275 |
|
|
1,340 |
|
|
1,615 |
|
|
(5) |
|
|
2023 |
|
8/11/2023 |
|
12 |
to |
35 |
Years |
| Dollar Stores |
|
Darien |
|
NY |
|
— |
|
|
201 |
|
|
1,467 |
|
|
— |
|
|
— |
|
|
201 |
|
|
1,467 |
|
|
1,668 |
|
|
(20) |
|
|
2023 |
|
8/14/2023 |
|
9 |
to |
35 |
Years |
| Dollar Stores |
|
Ashville |
|
AL |
|
— |
|
|
146 |
|
|
1,386 |
|
|
— |
|
|
— |
|
|
146 |
|
|
1,386 |
|
|
1,532 |
|
|
(20) |
|
|
2023 |
|
8/14/2023 |
|
9 |
to |
35 |
Years |
| Dollar Stores |
|
Hobbs |
|
NM |
|
— |
|
|
440 |
|
|
1,499 |
|
|
— |
|
|
— |
|
|
440 |
|
|
1,499 |
|
|
1,939 |
|
|
(2) |
|
|
2023 |
|
8/16/2023 |
|
9 |
to |
35 |
Years |
| Grocery |
|
Madison |
|
WI |
|
— |
|
|
1,162 |
|
|
7,012 |
|
|
— |
|
|
— |
|
|
1,162 |
|
|
7,012 |
|
|
8,174 |
|
|
(123) |
|
|
1999 |
|
8/16/2023 |
|
5 |
to |
26 |
Years |
| Dollar Stores |
|
George |
|
WA |
|
— |
|
|
315 |
|
|
2,060 |
|
|
— |
|
|
— |
|
|
315 |
|
|
2,060 |
|
|
2,375 |
|
|
(3) |
|
|
2023 |
|
8/18/2023 |
|
12 |
to |
35 |
Years |
| Dollar Stores |
|
Oakwood |
|
VA |
|
— |
|
|
189 |
|
|
865 |
|
|
— |
|
|
— |
|
|
189 |
|
|
865 |
|
|
1,054 |
|
|
(23) |
|
|
1995 |
|
8/24/2023 |
|
4 |
to |
20 |
Years |
| Dollar Stores |
|
Moses Lake |
|
WA |
|
— |
|
|
382 |
|
|
2,065 |
|
|
— |
|
|
— |
|
|
382 |
|
|
2,065 |
|
|
2,447 |
|
|
(3) |
|
|
2023 |
|
8/28/2023 |
|
12 |
to |
35 |
Years |
| Grocery |
|
Somers |
|
NY |
|
— |
|
|
11,127 |
|
|
17,038 |
|
|
— |
|
|
— |
|
|
11,127 |
|
|
17,038 |
|
|
28,165 |
|
|
(147) |
|
|
2002 |
|
9/13/2023 |
|
4 |
to |
35 |
Years |
| Dollar Stores |
|
Canaseraga |
|
NY |
|
— |
|
|
225 |
|
|
1,477 |
|
|
— |
|
|
— |
|
|
225 |
|
|
1,477 |
|
|
1,702 |
|
|
(16) |
|
|
2023 |
|
9/21/2023 |
|
9 |
to |
35 |
Years |
| Telecommunications |
|
Coshocton |
|
OH |
|
— |
|
|
634 |
|
|
1,319 |
|
|
— |
|
|
— |
|
|
634 |
|
|
1,319 |
|
|
1,953 |
|
|
(13) |
|
|
2023 |
|
9/21/2023 |
|
9 |
to |
35 |
Years |
| Casual Dining |
|
Portland |
|
OR |
|
— |
|
|
2,030 |
|
|
— |
|
|
— |
|
|
— |
|
|
2,030 |
|
|
— |
|
|
2,030 |
|
|
— |
|
|
2000 |
|
9/27/2023 |
|
|
|
|
|
| Casual Dining |
|
Portland |
|
OR |
|
— |
|
|
1,960 |
|
|
— |
|
|
— |
|
|
— |
|
|
1,960 |
|
|
— |
|
|
1,960 |
|
|
— |
|
|
2003 |
|
9/27/2023 |
|
|
|
|
|
| Home Improvement |
|
Great Bend |
|
KS |
|
— |
|
|
120 |
|
|
943 |
|
|
— |
|
|
— |
|
|
120 |
|
|
943 |
|
|
1,063 |
|
|
(18) |
|
|
1973 |
|
9/27/2023 |
|
4 |
to |
19 |
Years |
| Dollar Stores |
|
Marion |
|
AL |
|
— |
|
|
157 |
|
|
1,547 |
|
|
— |
|
|
— |
|
|
157 |
|
|
1,547 |
|
|
1,704 |
|
|
(22) |
|
|
2015 |
|
9/28/2023 |
|
8 |
to |
32 |
Years |
| Dollar Stores |
|
Foley |
|
AL |
|
— |
|
|
264 |
|
|
1,609 |
|
|
— |
|
|
— |
|
|
264 |
|
|
1,609 |
|
|
1,873 |
|
|
(20) |
|
|
2023 |
|
9/28/2023 |
|
10 |
to |
35 |
Years |
| Dollar Stores |
|
Baker |
|
FL |
|
— |
|
|
128 |
|
|
1,575 |
|
|
— |
|
|
— |
|
|
128 |
|
|
1,575 |
|
|
1,703 |
|
|
(19) |
|
|
2023 |
|
9/28/2023 |
|
10 |
to |
35 |
Years |
| Dollar Stores |
|
Gerry |
|
NY |
|
— |
|
|
122 |
|
|
1,493 |
|
|
— |
|
|
— |
|
|
122 |
|
|
1,493 |
|
|
1,615 |
|
|
(16) |
|
|
2023 |
|
9/28/2023 |
|
10 |
to |
35 |
Years |
| Grocery |
|
Verona |
|
WI |
|
— |
|
|
2,709 |
|
|
14,479 |
|
|
— |
|
|
— |
|
|
2,709 |
|
|
14,479 |
|
|
17,188 |
|
|
(144) |
|
|
2019 |
|
9/28/2023 |
|
8 |
to |
35 |
Years |
| Home Improvement |
|
Elk Grove Village |
|
IL |
|
— |
|
|
5,783 |
|
|
9,812 |
|
|
— |
|
|
— |
|
|
5,783 |
|
|
9,812 |
|
|
15,595 |
|
|
(131) |
|
|
1995 |
|
10/2/2023 |
|
6 |
to |
20 |
Years |
| Dollar Stores |
|
Lake Park |
|
GA |
|
— |
|
|
406 |
|
|
1,215 |
|
|
— |
|
|
— |
|
|
406 |
|
|
1,215 |
|
|
1,621 |
|
|
(9) |
|
|
2023 |
|
10/5/2023 |
|
8 |
to |
35 |
Years |
| Dollar Stores |
|
Macon |
|
GA |
|
— |
|
|
265 |
|
|
1,392 |
|
|
— |
|
|
— |
|
|
265 |
|
|
1,392 |
|
|
1,657 |
|
|
(10) |
|
|
2023 |
|
10/5/2023 |
|
9 |
to |
35 |
Years |
| Dollar Stores |
|
Perry |
|
GA |
|
— |
|
|
197 |
|
|
1,556 |
|
|
— |
|
|
— |
|
|
197 |
|
|
1,556 |
|
|
1,753 |
|
|
(12) |
|
|
2023 |
|
10/5/2023 |
|
8 |
to |
35 |
Years |
| Dollar Stores |
|
Salisbury |
|
NC |
|
— |
|
|
365 |
|
|
1,142 |
|
|
— |
|
|
— |
|
|
365 |
|
|
1,142 |
|
|
1,507 |
|
|
(10) |
|
|
2023 |
|
10/5/2023 |
|
9 |
to |
35 |
Years |
| Dollar Stores |
|
Sylvania |
|
GA |
|
— |
|
|
461 |
|
|
1,269 |
|
|
— |
|
|
— |
|
|
461 |
|
|
1,269 |
|
|
1,730 |
|
|
(10) |
|
|
2023 |
|
10/5/2023 |
|
9 |
to |
35 |
Years |
| Dollar Stores |
|
Graceville |
|
FL |
|
— |
|
|
195 |
|
|
1,695 |
|
|
— |
|
|
— |
|
|
195 |
|
|
1,695 |
|
|
1,890 |
|
|
(12) |
|
|
2023 |
|
10/26/2023 |
|
8 |
to |
35 |
Years |
| Dollar Stores |
|
Centre |
|
AL |
|
— |
|
|
107 |
|
|
1,402 |
|
|
— |
|
|
— |
|
|
107 |
|
|
1,402 |
|
|
1,509 |
|
|
(10) |
|
|
2023 |
|
10/31/2023 |
|
12 |
to |
35 |
Years |
| Dollar Stores |
|
Vernon |
|
AL |
|
— |
|
|
214 |
|
|
1,516 |
|
|
— |
|
|
— |
|
|
214 |
|
|
1,516 |
|
|
1,730 |
|
|
(11) |
|
|
2023 |
|
10/31/2023 |
|
12 |
to |
35 |
Years |
| Dollar Stores |
|
Addison |
|
AL |
|
— |
|
|
177 |
|
|
1,684 |
|
|
— |
|
|
— |
|
|
177 |
|
|
1,684 |
|
|
1,861 |
|
|
(12) |
|
|
2023 |
|
10/31/2023 |
|
12 |
to |
35 |
Years |
| Dollar Stores |
|
Highland Home (Lapine) |
|
AL |
|
— |
|
|
197 |
|
|
1,947 |
|
|
— |
|
|
— |
|
|
197 |
|
|
1,947 |
|
|
2,144 |
|
|
(15) |
|
|
2023 |
|
10/31/2023 |
|
8 |
to |
35 |
Years |
| Dollar Stores |
|
Jasper |
|
AL |
|
— |
|
|
245 |
|
|
1,738 |
|
|
— |
|
|
— |
|
|
245 |
|
|
1,738 |
|
|
1,983 |
|
|
(8) |
|
|
2023 |
|
11/1/2023 |
|
13 |
to |
35 |
Years |
| Telecommunications |
|
Meadville |
|
PA |
|
— |
|
|
756 |
|
|
1,247 |
|
|
— |
|
|
— |
|
|
756 |
|
|
1,247 |
|
|
2,003 |
|
|
(6) |
|
|
2023 |
|
11/15/2023 |
|
9 |
to |
35 |
Years |
| Dollar Stores |
|
Pulaski |
|
NY |
|
— |
|
|
183 |
|
|
1,317 |
|
|
— |
|
|
— |
|
|
183 |
|
|
1,317 |
|
|
1,500 |
|
|
(8) |
|
|
1997 |
|
11/21/2023 |
|
5 |
to |
25 |
Years |
| Dollar Stores |
|
Harlan |
|
IA |
|
— |
|
|
452 |
|
|
873 |
|
|
— |
|
|
— |
|
|
452 |
|
|
873 |
|
|
1,325 |
|
|
(7) |
|
|
2022 |
|
11/29/2023 |
|
4 |
to |
21 |
Years |
| Dollar Stores |
|
Phenix City |
|
AL |
|
— |
|
|
253 |
|
|
1,833 |
|
|
— |
|
|
— |
|
|
253 |
|
|
1,833 |
|
|
2,086 |
|
|
(3) |
|
|
2023 |
|
12/1/2023 |
|
13 |
to |
35 |
Years |
| Grocery |
|
Manitowoc |
|
WI |
|
— |
|
|
1,550 |
|
|
9,348 |
|
|
— |
|
|
— |
|
|
1,550 |
|
|
9,348 |
|
|
10,898 |
|
|
(16) |
|
|
2008 |
|
12/11/2023 |
|
5 |
to |
31 |
Years |
| Dollar Stores |
|
Baker |
|
FL |
|
— |
|
|
253 |
|
|
1,619 |
|
|
— |
|
|
— |
|
|
253 |
|
|
1,619 |
|
|
1,872 |
|
|
(2) |
|
|
2023 |
|
12/12/2023 |
|
8 |
to |
35 |
Years |
| Dollar Stores |
|
Lehighton |
|
PA |
|
— |
|
|
181 |
|
|
973 |
|
|
— |
|
|
— |
|
|
181 |
|
|
973 |
|
|
1,154 |
|
|
(2) |
|
|
2019 |
|
12/21/2023 |
|
7 |
to |
35 |
Years |
| Dollar Stores |
|
Shohola |
|
PA |
|
— |
|
|
256 |
|
|
918 |
|
|
— |
|
|
— |
|
|
256 |
|
|
918 |
|
|
1,174 |
|
|
(2) |
|
|
2018 |
|
12/21/2023 |
|
8 |
to |
35 |
Years |
| Dollar Stores |
|
Fenton |
|
LA |
|
— |
|
|
112 |
|
|
846 |
|
|
— |
|
|
— |
|
|
112 |
|
|
846 |
|
|
958 |
|
|
(1) |
|
|
2022 |
|
12/21/2023 |
|
12 |
to |
35 |
Years |
| Dollar Stores |
|
Salem |
|
OH |
|
— |
|
|
183 |
|
|
892 |
|
|
— |
|
|
— |
|
|
183 |
|
|
892 |
|
|
1,075 |
|
|
(2) |
|
|
2020 |
|
12/21/2023 |
|
8 |
to |
35 |
Years |
| Dollar Stores |
|
Medina |
|
OH |
|
— |
|
|
215 |
|
|
948 |
|
|
— |
|
|
— |
|
|
215 |
|
|
948 |
|
|
1,163 |
|
|
(2) |
|
|
2020 |
|
12/21/2023 |
|
8 |
to |
35 |
Years |
| Dollar Stores |
|
Mansfield |
|
OH |
|
— |
|
|
133 |
|
|
1,027 |
|
|
— |
|
|
— |
|
|
133 |
|
|
1,027 |
|
|
1,160 |
|
|
(2) |
|
|
2020 |
|
12/21/2023 |
|
8 |
to |
35 |
Years |
| Dollar Stores |
|
Konowa |
|
OK |
|
— |
|
|
109 |
|
|
1,249 |
|
|
— |
|
|
— |
|
|
109 |
|
|
1,249 |
|
|
1,358 |
|
|
(2) |
|
|
2023 |
|
12/21/2023 |
|
10 |
to |
35 |
Years |
| Dollar Stores |
|
Cookville |
|
TX |
|
— |
|
|
243 |
|
|
1,066 |
|
|
— |
|
|
— |
|
|
243 |
|
|
1,066 |
|
|
1,309 |
|
|
(2) |
|
|
2023 |
|
12/21/2023 |
|
10 |
to |
35 |
Years |
|
|
|
|
|
|
|
|
|
|
|
|
|
|
|
|
|
|
|
|
|
|
|
|
|
|
|
|
|
|
|
|
|
|
|
|
|
|
|
|
|
|
|
|
|
|
|
|
|
|
|
|
|
|
|
|
|
|
|
|
|
|
|
|
|
|
|
|
|
|
|
|
|
|
|
|
|
|
|
|
|
|
|
|
|
|
|
|
|
|
|
|
|
|
|
|
| Description |
|
|
|
Initial Cost to Company |
|
Cost Capitalized Subsequent to Acquisition(1) |
|
Gross Amount as of December 31, 2023(2), (3) |
|
|
|
|
|
|
|
|
|
|
|
| Industry |
|
City |
|
State |
|
Encumbrances |
|
Land |
|
Building and Improvements |
|
Land |
|
Building and Improvements |
|
Land |
|
Building and Improvements |
|
Total |
|
Accumulated Depreciation(3), (4) |
|
Date of Construction |
|
Date Acquired(5) |
|
Life on Which Depreciation in Statements of Operations and Comprehensive Income is Computed |
| Dollar Stores |
|
Cordele |
|
GA |
|
— |
|
|
190 |
|
|
1,217 |
|
|
— |
|
|
— |
|
|
190 |
|
|
1,217 |
|
|
1,407 |
|
|
(2) |
|
|
2023 |
|
12/21/2023 |
|
10 |
to |
35 |
Years |
| Dollar Stores |
|
DeBerry |
|
TX |
|
— |
|
|
239 |
|
|
1,108 |
|
|
— |
|
|
— |
|
|
239 |
|
|
1,108 |
|
|
1,347 |
|
|
(2) |
|
|
2023 |
|
12/21/2023 |
|
10 |
to |
35 |
Years |
| Dollar Stores |
|
Lavaca |
|
AR |
|
— |
|
|
128 |
|
|
1,082 |
|
|
— |
|
|
— |
|
|
128 |
|
|
1,082 |
|
|
1,210 |
|
|
(2) |
|
|
2006 |
|
12/21/2023 |
|
9 |
to |
31 |
Years |
| Dollar Stores |
|
Wetumpka |
|
AL |
|
— |
|
|
112 |
|
|
1,328 |
|
|
— |
|
|
— |
|
|
112 |
|
|
1,328 |
|
|
1,440 |
|
|
(2) |
|
|
2023 |
|
12/28/2023 |
|
9 |
to |
35 |
Years |
| Dollar Stores |
|
Livingston |
|
AL |
|
— |
|
|
181 |
|
|
1,378 |
|
|
— |
|
|
— |
|
|
181 |
|
|
1,378 |
|
|
1,559 |
|
|
(2) |
|
|
2023 |
|
12/28/2023 |
|
12 |
to |
35 |
Years |
| Dollar Stores |
|
Warrior |
|
AL |
|
— |
|
|
208 |
|
|
1,174 |
|
|
— |
|
|
— |
|
|
208 |
|
|
1,174 |
|
|
1,382 |
|
|
(2) |
|
|
2023 |
|
12/28/2023 |
|
12 |
to |
35 |
Years |
| Dollar Stores |
|
Andrews |
|
NC |
|
— |
|
|
220 |
|
|
1,792 |
|
|
— |
|
|
— |
|
|
220 |
|
|
1,792 |
|
|
2,012 |
|
|
(3) |
|
|
2023 |
|
12/28/2023 |
|
8 |
to |
35 |
Years |
| Dollar Stores |
|
Blakeslee |
|
PA |
|
— |
|
|
191 |
|
|
1,056 |
|
|
— |
|
|
— |
|
|
191 |
|
|
1,056 |
|
|
1,247 |
|
|
— |
|
|
2020 |
|
12/29/2023 |
|
7 |
to |
35 |
Years |
|
|
|
|
|
|
$ |
8,361 |
|
|
$ |
461,265 |
|
|
$ |
1,142,488 |
|
|
$ |
(369) |
|
|
$ |
7,321 |
|
|
$ |
460,896 |
|
|
$ |
1,149,809 |
|
|
$ |
1,610,705 |
|
|
$ |
(101,210) |
|
|
|
|
|
|
|
|
|
|
(1) Amounts shown as reductions to cost capitalized subsequent to acquisition represent provisions recorded for impairment of real estate.
(2) The aggregate cost for federal income tax purposes is $1.6 billion (unaudited).
(3) Properties with no building value represent a property for which the Company owns only the land, therefore depreciation and estimated life for depreciation are not applicable.
(4) Depreciation is calculated using the straight-line method over the estimated useful life of the asset, which is up to 35 years for buildings and up to 15 years for building improvements.
(5) The acquisition dates for properties acquired prior to December 23, 2019 are stated at the Company’s Private Offering and formation transactions date of December 23, 2019.
The following is a reconciliation of carrying value for land and building and improvements for the periods presented (in thousands):
|
|
|
|
|
|
|
|
|
|
|
|
|
|
|
|
|
|
|
|
|
|
|
Year Ended December 31, |
|
|
2023 |
|
2022 |
|
2021 |
| Balance, beginning of year |
|
$ |
1,308,230 |
|
|
$ |
926,392 |
|
|
$ |
547,733 |
|
| Additions |
|
|
|
|
|
|
| Acquisitions |
|
306,564 |
|
|
398,177 |
|
|
393,147 |
|
| Improvements |
|
4,098 |
|
|
2,383 |
|
|
1,227 |
|
| Property under development completed and placed in service |
|
64,711 |
|
|
22,510 |
|
|
2,909 |
|
| Deductions |
|
|
|
|
|
|
| Reclasses to held for sale |
|
(66,762) |
|
|
(37,880) |
|
|
(1,990) |
|
| Provisions for impairment |
|
(3,509) |
|
|
(1,067) |
|
|
— |
|
Involuntary conversion of assets (1) |
|
— |
|
|
— |
|
|
(502) |
|
| Dispositions |
|
(2,627) |
|
|
(2,285) |
|
|
(16,132) |
|
| Balance, end of year |
|
$ |
1,610,705 |
|
|
$ |
1,308,230 |
|
|
$ |
926,392 |
|
(1) The Company incurred significant damage to a property in Houma, Louisiana as a result of Hurricane Ida making landfall in August 2021. For the year ended December 31, 2022, the Company recorded a loss based on estimated damages of $0.5 million in the accompanying consolidated statements of operations and comprehensive income (loss).
The following is a reconciliation of accumulated depreciation for the periods presented (in thousands):
|
|
|
|
|
|
|
|
|
|
|
|
|
|
|
|
|
|
|
|
|
|
|
Year Ended December 31, |
|
|
2023 |
|
2022 |
|
2021 |
| Balance, beginning of year |
|
$ |
62,526 |
|
|
$ |
30,669 |
|
|
$ |
10,111 |
|
| Additions |
|
|
|
|
|
|
| Depreciation expense |
|
44,104 |
|
|
33,584 |
|
|
21,049 |
|
| Deductions |
|
|
|
|
|
|
| Reclasses to held for sale |
|
(5,154) |
|
|
(1,610) |
|
|
(35) |
|
| Provisions for impairment |
|
(63) |
|
|
— |
|
|
— |
|
Involuntary conversion of assets (1) |
|
— |
|
|
— |
|
|
(12) |
|
| Dispositions |
|
(203) |
|
|
(117) |
|
|
(444) |
|
| Balance, end of year |
|
$ |
101,210 |
|
|
$ |
62,526 |
|
|
$ |
30,669 |
|
(1) The Company incurred significant damage to a property in Houma, Louisiana as a result of Hurricane Ida making landfall in August 2021. As of December 31, 2023, the Company recorded a loss based on estimated damages of $0.5 million in the accompanying consolidated statements of operations and comprehensive income (loss).
See report of independent registered public accounting firm.
|
|
|
|
|
|
|
|
|
|
|
|
|
|
|
|
|
|
|
|
|
|
|
|
|
|
|
|
|
|
|
|
|
|
|
|
|
|
|
|
|
|
|
|
|
|
|
|
|
|
|
|
|
|
|
|
|
|
|
|
|
|
|
| NETSTREIT Corp. |
| Schedule IV - Mortgage Loans on Real Estate |
As of December 31, 2023 |
| (Dollars in thousands) |
| Description and Industry |
|
Number of Secured Properties |
|
State |
|
Interest Rate |
|
Final Maturity Date |
|
Periodic Payment Terms (1) |
|
Final Payment Terms |
|
Prior Liens |
|
Outstanding Face Amount of Mortgages |
|
Carrying Amount of Mortgages |
|
Principal amount of loans subject to delinquent principal or interest |
| Fully collateralized mortgage loans: |
|
|
|
|
|
|
|
|
|
|
|
|
|
|
|
|
|
|
|
None |
| Home Improvement |
|
1 |
|
Oregon |
|
7.00% |
|
4/8/2024 |
|
I/O |
|
Balloon of $43.6 million |
|
None |
|
$ |
43,612 |
|
|
$ |
43,581 |
|
|
None |
|
|
|
|
|
|
|
|
|
|
|
|
|
|
|
|
|
|
|
|
|
| Convenience Stores |
|
46 |
|
North Carolina |
|
9.55% |
|
3/10/2026 |
|
I/O |
|
Balloon of $41.9 million |
|
None |
|
41,940 |
|
|
41,940 |
|
|
None |
| Convenience Stores |
|
3 |
|
North Carolina |
|
6.89% |
|
4/10/2026 |
|
I/O |
|
Balloon of $4.1 million |
|
None |
|
4,132 |
|
|
4,132 |
|
|
None |
| Dollar Stores |
|
9 |
|
Florida, Mississippi and Ohio |
|
7.59% |
|
6/10/2025 |
|
I/O |
|
Balloon of $15.5 million |
|
None |
|
14,024 |
|
|
14,024 |
|
|
None |
| Discount Retail |
|
1 |
|
Wisconsin |
|
8.50% |
|
12/29/2024 |
|
None (2) |
|
Interest + Balloon of $0.7 million |
|
None |
|
660 |
|
|
660 |
|
|
None |
| Discount Retail |
|
1 |
|
Idaho |
|
7.50% |
|
3/8/2024 |
|
P+I |
|
Balloon of $3.2 million |
|
None |
|
3,246 |
|
|
3,219 |
|
|
None |
| Dollar Stores |
|
7 |
|
Florida |
|
10.25% |
|
12/5/2024 |
|
I/O |
|
Balloon of $5.0 million |
|
None |
|
5,007 |
|
|
5,007 |
|
|
None |
| Automotive Service and Quick Service Restaurant |
|
2 |
|
Kentucky and Florida |
|
10.25% |
|
12/22/2024 |
|
I/O |
|
Balloon of $1.9 million |
|
None |
|
1,909 |
|
|
1,909 |
|
|
None |
|
|
|
|
|
|
|
|
|
|
|
|
|
|
|
|
$ |
114,530 |
|
|
$ |
114,472 |
|
|
|
(1) I/O: Interest Only; P+I: Principal and Interest.
(2) Payments of both interest and principal are due at maturity.
The following shows changes in carrying amounts of mortgage loans receivable, net during the years ended December 31, 2023 and 2022 (in thousands):
|
|
|
|
|
|
|
|
|
|
|
|
|
|
|
|
|
Year Ended December 31, |
|
|
2023 |
|
2022 |
| Balance, beginning of year |
|
$ |
46,378 |
|
|
$ |
— |
|
| Additions: |
|
|
|
|
| New mortgage loans receivable |
|
72,399 |
|
|
46,316 |
|
| Other: Increase in existing mortgage loan receivable in exchange for disposition of real estate |
|
1,970 |
|
|
— |
|
| Other: Increase in existing mortgage loan receivable in exchange for settlement of existing mortgage loan |
|
1,327 |
|
|
— |
|
| Capitalized loan origination costs |
|
145 |
|
|
150 |
|
| Discount on new mortgage loan receivable |
|
(155) |
|
|
— |
|
| Amortization of discount |
|
39 |
|
|
— |
|
| Deductions: |
|
|
|
|
| Collections of principal |
|
(1,482) |
|
|
— |
|
| Other: Mortgage loan receivable settled in exchange for acquisition of real estate |
|
(4,673) |
|
|
— |
|
| Other: Mortgage loan receivable settled in refinancing of existing mortgage loan receivable |
|
(1,327) |
|
|
— |
|
| Amortization of loan origination costs |
|
(149) |
|
|
(88) |
|
| Balance, end of year |
|
$ |
114,472 |
|
|
$ |
46,378 |
|
See report of independent registered public accounting firm.
EX-23.1
2
consent.htm
EX-23.1
Document
Consent of Independent Registered Public Accounting Firm
We consent to the incorporation by reference in the registration statements Nos. 333-259226 and 333-248239 on Form S-3 and the registration statements Nos. 333-249739 and 333-246385 on Form S-8 of our reports dated February 14, 2024, with respect to the consolidated financial statements and financial statement schedules III and IV of NETSTREIT Corp. and the effectiveness of internal control over financial reporting.
Chicago, Illinois
February 14, 2024
EX-97
7
netstreit-clawbackpolicyfi.htm
EX-97
Document
NETSTREIT Corp.
Incentive Compensation Recoupment Policy
1. Introduction
The Compensation Committee (the “Compensation Committee”) of the Board of Directors (the “Board”) of NETSTREIT Corp., a Maryland corporation (the “Company”), has determined that it is in the best interests of the Company and its stockholders to adopt this Incentive Compensation Recoupment Policy (this “Policy”) providing for the Company’s recoupment of Recoverable Incentive Compensation that is received by Covered Officers of the Company under certain circumstances. Certain capitalized terms used in this Policy have the meanings given to such terms in Section 3 below.
This Policy is designed to comply with, and shall be interpreted to be consistent with, Section 10D of the Exchange Act, Rule 10D-1 promulgated thereunder (“Rule 10D-1”) and Section 303A.14 of the New York Stock Exchange Listed Company Manual (the “Listing Standards”).
2. Effective Date
This Policy shall apply to all Incentive Compensation that is received by a Covered Officer on or after October 2, 2023 (the “Effective Date”). This Policy shall replace and supersede the Company’s Policy for Recoupment of Incentive Compensation that was adopted on February 22, 2022 (the “Prior Clawback Policy”) with respect to all Incentive Compensation that is received by a Covered Officer on or after the Effective Date; for clarity, the Prior Clawback Policy shall continue to apply to any Incentive Compensation that is received by a Covered Officer prior to the Effective Date. Incentive Compensation is deemed “received” in the Company’s fiscal period in which the Financial Reporting Measure specified in the Incentive Compensation award is attained, even if the payment or grant of such Incentive Compensation occurs after the end of that period.
3. Definitions
“Accounting Restatement” means an accounting restatement that the Company is required to prepare due to the material noncompliance of the Company with any financial reporting requirement under the securities laws, including any required accounting restatement to correct an error in previously issued financial statements that is material to the previously issued financial statements, or that would result in a material misstatement if the error were corrected in the current period or left uncorrected in the current period.
“Accounting Restatement Date” means the earlier to occur of (a) the date that the Board, a committee of the Board authorized to take such action, or the officer or officers of the Company authorized to take such action if Board action is not required, concludes, or reasonably should have concluded, that the Company is required to prepare an Accounting Restatement, or (b) the date that a court, regulator or other legally authorized body directs the Company to prepare an Accounting Restatement.
“Administrator” means the Compensation Committee or, in the absence of such committee, the Board.
“Code” means the U.S. Internal Revenue Code of 1986, as amended, and the regulations promulgated thereunder.
“Covered Officer” means each current and former Executive Officer.
“Exchange” means the New York Stock Exchange.
“Exchange Act” means the U.S. Securities Exchange Act of 1934, as amended.
“Executive Officer” means the Company’s president, principal financial officer, principal accounting officer (or if there is no such accounting officer, the controller), any vice-president of the Company in charge of a principal business unit, division, or function (such as sales, administration, or finance), any other officer who performs a policy-making function, or any other person who performs similar policy-making functions for the Company.
Executive officers of the Company’s parent(s) or subsidiaries are deemed executive officers of the Company if they perform such policy-making functions for the Company. Policy-making function is not intended to include policy-making functions that are not significant. Identification of an executive officer for purposes of this Policy would include at a minimum executive officers identified pursuant to Item 401(b) of Regulation S-K promulgated under the Exchange Act.
“Financial Reporting Measures” means measures that are determined and presented in accordance with the accounting principles used in preparing the Company’s financial statements, and any measures derived wholly or in part from such measures, including Company stock price and total stockholder return (“TSR”). A measure need not be presented in the Company’s financial statements or included in a filing with the SEC in order to be a Financial Reporting Measure.
“Incentive Compensation” means any compensation that is granted, earned or vested based wholly or in part upon the attainment of a Financial Reporting Measure.
“Lookback Period” means the three completed fiscal years immediately preceding the Accounting Restatement Date, as well as any transition period (resulting from a change in the Company’s fiscal year) within or immediately following those three completed fiscal years (except that a transition period of at least nine months shall count as a completed fiscal year). Notwithstanding the foregoing, the Lookback Period shall not include fiscal years completed prior to the Effective Date.
“Recoverable Incentive Compensation” means Incentive Compensation received by a Covered Officer during the Lookback Period that exceeds the amount of Incentive Compensation that would have been received had such amount been determined based on the Accounting Restatement, computed without regard to any taxes paid (i.e., on a gross basis without regard to tax withholdings and other deductions). For any compensation plans or programs that take into account Incentive Compensation, the amount of Recoverable Incentive Compensation for purposes of this Policy shall include, without limitation, the amount contributed to any notional account based on Recoverable Incentive Compensation and any earnings to date on that notional amount. For any Incentive Compensation that is based on stock price or TSR, where the Recoverable Incentive Compensation is not subject to mathematical recalculation directly from the information in an Accounting Restatement, the Administrator will determine the amount of Recoverable Incentive Compensation based on a reasonable estimate of the effect of the Accounting Restatement on the stock price or TSR upon which the Incentive Compensation was received. The Company shall maintain documentation of the determination of that reasonable estimate and provide such documentation to the Exchange in accordance with the Listing Standards.
“SEC” means the U.S. Securities and Exchange Commission.
4. Recoupment
(a) Applicability of Policy. This Policy applies to Incentive Compensation received by a Covered Officer (i) after beginning services as an Executive Officer, (ii) who served as an Executive Officer at any time during the performance period for such Incentive Compensation, (iii) while the Company had a class of securities listed on a national securities exchange or a national securities association, and (iv) during the Lookback Period.
(b) Recoupment Generally. Pursuant to the provisions of this Policy, if there is an Accounting Restatement, the Company must reasonably promptly recoup the full amount of the Recoverable Incentive Compensation, unless the conditions of one or more subsections of Section 4(c) of this Policy are met and the Compensation Committee, or, if such committee does not consist solely of independent directors, a majority of the independent directors serving on the Board, has made a determination that recoupment would be impracticable. Recoupment is required regardless of whether the Covered Officer engaged in any misconduct and regardless of fault, and the Company’s obligation to recoup Recoverable Incentive Compensation is not dependent on whether or when any restated financial statements are filed.
(c) Impracticability of Recovery. Recoupment may be determined to be impracticable if, and only if:
(i) the direct expense paid to a third party to assist in enforcing this Policy would exceed the amount of the applicable Recoverable Incentive Compensation; provided that, before concluding that it would be impracticable to recover any amount of Recoverable Incentive Compensation based on expense of enforcement, the Company shall make a reasonable attempt to recover such Recoverable Incentive Compensation, document such reasonable attempt(s) to recover, and provide that documentation to the Exchange in accordance with the Listing Standards; or
(ii) recoupment of the applicable Recoverable Incentive Compensation would likely cause an otherwise tax-qualified retirement plan, under which benefits are broadly available to employees of the Company, to fail to meet the requirements of Code Section 401(a)(13) or Code Section 411(a) and regulations thereunder.
(d) Sources of Recoupment. To the extent permitted by applicable law, the Administrator shall, in its sole discretion, determine the timing and method for recouping Recoverable Incentive Compensation hereunder, provided that such recoupment is undertaken reasonably promptly. The Administrator may, in its discretion, seek recoupment from a Covered Officer from any of the following sources or a combination thereof, whether the applicable compensation was approved, awarded, granted, payable or paid to the Covered Officer prior to, on or after the Effective Date: (i) direct repayment of Recoverable Incentive Compensation previously paid to the Covered Officer; (ii) cancelling prior cash or equity-based awards (whether vested or unvested and whether paid or unpaid); (iii) cancelling or offsetting against any planned future cash or equity-based awards; (iv) forfeiture of deferred compensation, subject to compliance with Code Section 409A; and (v) any other method authorized by applicable law or contract. Subject to compliance with any applicable law, the Administrator may effectuate recoupment under this Policy from any amount otherwise payable to the Covered Officer, including amounts payable to such individual under any otherwise applicable Company plan or program, e.g., base salary, bonuses or commissions and compensation previously deferred by the Covered Officer. The Administrator need not utilize the same method of recovery for all Covered Officers or with respect to all types of Recoverable Incentive Compensation.
(e) No Indemnification of Covered Officers. Notwithstanding any indemnification agreement, applicable insurance policy or any other agreement or provision of the Company’s certificate of incorporation or bylaws to the contrary, no Covered Officer shall be entitled to indemnification or advancement of expenses in connection with any enforcement of this Policy by the Company, including paying or reimbursing such Covered Officer for insurance premiums to cover potential obligations to the Company under this Policy.
(f) Indemnification of Administrator. Any members of the Administrator, and any other members of the Board who assist in the administration of this Policy, shall not be personally liable for any action, determination or interpretation made with respect to this Policy and shall be indemnified by the Company to the fullest extent under applicable law and Company policy with respect to any such action, determination or interpretation. The foregoing sentence shall not limit any other rights to indemnification of the members of the Board under applicable law or Company policy.
(g) No “Good Reason” for Covered Officers. Any action by the Company to recoup or any recoupment of Recoverable Incentive Compensation under this Policy from a Covered Officer shall not be deemed (i) “good reason” for resignation or to serve as a basis for a claim of constructive termination under any benefits or compensation arrangement applicable to such Covered Officer, or (ii) to constitute a breach of a contract or other arrangement to which such Covered Officer is party.
5. Administration
Except as specifically set forth herein, this Policy shall be administered by the Administrator. The Administrator shall have full and final authority to make any and all determinations required under this Policy. Any determination by the Administrator with respect to this Policy shall be final, conclusive and binding on all interested parties and need not be uniform with respect to each individual covered by this Policy.
In carrying out the administration of this Policy, the Administrator is authorized and directed to consult with the full Board or such other committees of the Board as may be necessary or appropriate as to matters within the scope of such other committee’s responsibility and authority. Subject to applicable law, the Administrator may authorize and empower any officer or employee of the Company to take any and all actions that the Administrator, in its sole discretion, deems necessary or appropriate to carry out the purpose and intent of this Policy (other than with respect to any recovery under this Policy involving such officer or employee).
6. Severability
If any provision of this Policy or the application of any such provision to a Covered Officer shall be adjudicated to be invalid, illegal or unenforceable in any respect, such invalidity, illegality or unenforceability shall not affect any other provisions of this Policy, and the invalid, illegal or unenforceable provisions shall be deemed amended to the minimum extent necessary to render any such provision or application enforceable.
7. No Impairment of Other Remedies
Nothing contained in this Policy, and no recoupment or recovery as contemplated herein, shall limit any claims, damages or other legal remedies the Company or any of its affiliates may have against a Covered Officer arising out of or resulting from any actions or omissions by the Covered Officer. This Policy does not preclude the Company from taking any other action to enforce a Covered Officer’s obligations to the Company, including, without limitation, termination of employment and/or institution of civil proceedings. This Policy is in addition to the requirements of Section 304 of the Sarbanes-Oxley Act of 2002 (“SOX 304”) that are applicable to the Company’s Chief Executive Officer and Chief Financial Officer and to any other compensation recoupment policy and/or similar provisions in any employment, equity plan, equity award, or other individual agreement, to which the Company is a party or which the Company has adopted or may adopt and maintain from time to time; provided, however, that compensation recouped pursuant to this Policy shall not be duplicative of compensation recouped pursuant to SOX 304 or any such compensation recoupment policy and/or similar provisions in any such employment, equity plan, equity award, or other individual agreement except as may be required by law.
8. Amendment; Termination
The Administrator may amend, terminate or replace this Policy or any portion of this Policy at any time and from time to time in its sole discretion. The Administrator shall amend this Policy as it deems necessary to comply with applicable law or any Listing Standard.
9. Successors
This Policy shall be binding and enforceable against all Covered Officers and, to the extent required by Rule 10D-1 and/or the applicable Listing Standards, their beneficiaries, heirs, executors, administrators or other legal representatives.
10. Required Filings
The Company shall make any disclosures and filings with respect to this Policy that are required by law, including as required by the SEC.
* * * * * I, the undersigned, agree and acknowledge that I am bound by, and subject to, the NETSTREIT Corp.
NETSTREIT Corp.
Incentive Compensation Recoupment Policy
Form of Executive Acknowledgment
Incentive Compensation Recoupment Policy, as may be amended, restated, supplemented or otherwise modified from time to time (the “Policy”). In the event of any inconsistency between the Policy and the terms of any employment agreement, offer letter or other individual agreement with NETSTREIT Corp. (the “Company”) to which I am a party, or the terms of any compensation plan, program or agreement, whether or not written, under which any compensation has been granted, awarded, earned or paid to me, the terms of the Policy shall govern.
In the event that the Administrator (as defined in the Policy) determines that any compensation granted, awarded, earned or paid to me must be forfeited or reimbursed to the Company pursuant to the Policy, I will promptly take any action necessary to effectuate such forfeiture and/or reimbursement. I further agree and acknowledge that I am not entitled to indemnification, and hereby waive any right to advancement of expenses, in connection with any such enforcement of the Policy against me by the Company.
Agreed and Acknowledged: