Document
Exhibit 99.1
JOHANNESBURG, 29 August 2023: Sibanye Stillwater Limited (Sibanye-Stillwater or the Group) (JSE: SSW and NYSE: SBSW) is pleased to report operating results and consolidated interim financial statements for the six months ended 30 June 2023.
SALIENT FEATURES FOR THE SIX MONTHS ENDED 30 JUNE 2023
|
|
|
•Strategic commodity and geographical diversification - SA gold turnaround cushions impact of lower PGM prices |
•Strong financial position maintained - 0.01x Net debt: adjusted EBITDA*, net debt of only R262m (US$13.9m) |
•Interim dividend declared of 53 SA cps (11.19 US cents** per ADR) |
•SA gold operations: R5.5bn (US$332m) adjusted EBITDA turnaround year-on-year |
•SA PGM operations: Industry leading cost management. Moving down industry cost curve increases competitiveness |
•US PGM operations: Stillwater West mine shaft repaired, improved operating outlook for H2 2023 |
•Keliber lithium project on track to produce battery grade lithium hydroxide from 2025 - equity capital fully funded |
•Tailings storage facilities conformance with GISTM requirements |
•Well positioned for clean energy transition |
* Refer note 9.1 (footnote 5) of the consolidated interim financial statements
** Based on the closing exchange rate of R18.9400/US$ at 22 August 2023 from EquityRT
KEY STATISTICS – GROUP
|
|
|
|
|
|
|
|
|
|
|
|
|
|
|
|
|
|
|
|
|
|
|
|
|
|
|
|
|
|
|
|
|
| US dollar |
|
|
|
|
|
SA rand |
| Six months ended |
|
|
|
|
|
Six months ended |
| Jun 2022 |
Dec 2022 |
Jun 2023 |
|
KEY STATISTICS |
|
Jun 2023 |
Dec 2022 |
Jun 2022 |
|
|
|
|
GROUP |
|
|
|
|
| 782 |
|
344 |
|
407 |
|
US$m |
Basic earnings |
Rm |
7,423 |
|
6,380 |
|
12,016 |
|
| 775 |
|
350 |
|
324 |
|
US$m |
Headline earnings |
Rm |
5,891 |
|
6,484 |
|
11,938 |
|
| 1,465 |
|
1,045 |
|
776 |
|
US$m |
Adjusted EBITDA1 |
Rm |
14,147 |
|
18,550 |
|
22,561 |
|
| 803 |
|
359 |
|
427 |
|
US$m |
Profit for the period |
Rm |
7,786 |
|
6,639 |
|
12,341 |
|
| 15.40 |
|
17.33 |
|
18.21 |
|
R/US$ |
Average exchange rate using daily closing rate |
|
|
|
|
|
|
|
|
|
|
|
|
|
|
|
|
|
|
|
|
|
|
|
|
|
|
|
|
|
|
| TABLE OF CONTENTS |
Page |
|
Share data for the Six months ended 30 June 2023 |
|
|
|
|
|
|
|
|
Number of shares in issue |
|
|
|
|
- at 30 June 2023 |
2,830,567,264 |
|
|
|
- weighted average |
2,830,487,806 |
|
|
|
Free Float |
99 |
% |
|
|
|
Bloomberg/Reuters |
SSWSJ/SSWJ.J |
|
|
|
|
|
|
|
|
JSE Limited - (SSW) |
|
|
|
|
Price range per ordinary share (High/Low) |
R28.00 to R51.68 |
|
|
|
Average daily volume |
10,798,253 |
|
|
|
|
|
|
|
|
NYSE - (SBSW); one ADR represents four ordinary shares |
|
|
|
|
Price range per ADR (High/Low) |
US$6.12 to US$12.31 |
|
|
|
Average daily volume |
3,710,044 |
|
|
|
|
|
|
|
|
|
|
Sibanye-Stillwater Operating and financial results | Six months ended 30 June 2023 1
|
|
|
|
|
|
|
|
|
|
|
|
|
|
|
|
|
|
|
|
|
|
|
|
|
|
|
|
|
|
|
|
|
| US dollar |
|
|
|
|
|
SA rand |
| Six months ended |
|
|
|
|
|
Six months ended |
| Jun 2022 |
Dec 2022 |
Jun 2023 |
|
KEY STATISTICS |
|
Jun 2023 |
Dec 2022 |
Jun 2022 |
|
|
|
|
AMERICAS REGION |
|
|
|
|
|
|
|
|
US PGM underground operations |
|
|
|
|
| 230,039 |
|
191,094 |
|
205,513 |
|
oz |
2E PGM production2,3 |
kg |
6,392 |
|
5,944 |
|
7,155 |
|
| 1,935 |
|
1,766 |
|
1,390 |
|
US$/2Eoz |
Average basket price |
R/2Eoz |
25,312 |
|
30,609 |
|
29,799 |
|
| 261 |
|
125 |
|
53 |
|
US$m |
Adjusted EBITDA1 |
Rm |
976 |
|
2,309 |
|
4,021 |
|
| 1,366 |
|
1,840 |
|
1,737 |
|
US$/2Eoz |
All-in sustaining cost4 |
R/2Eoz |
31,633 |
|
31,880 |
|
21,036 |
|
|
|
|
|
US PGM recycling |
|
|
|
|
| 361,333 |
|
237,441 |
|
162,452 |
|
oz |
3E PGM recycling2,3 |
kg |
5,053 |
|
7,385 |
|
11,239 |
|
| 2,906 |
|
3,274 |
|
2,735 |
|
US$/3Eoz |
Average basket price |
R/3Eoz |
49,804 |
|
56,747 |
|
44,752 |
|
| 39 |
|
39 |
|
20 |
|
US$m |
Adjusted EBITDA1 |
Rm |
371 |
|
676 |
|
598 |
|
|
|
|
|
SOUTHERN AFRICA (SA) REGION |
|
|
|
|
|
|
|
|
PGM operations |
|
|
|
|
| 823,806 |
|
843,658 |
|
799,182 |
|
oz |
4E PGM production3,5 |
kg |
24,857 |
|
26,241 |
|
25,623 |
|
| 2,817 |
|
2,434 |
|
1,867 |
|
US$/4Eoz |
Average basket price |
R/4Eoz |
34,006 |
|
42,188 |
|
43,379 |
|
| 1,374 |
|
956 |
|
649 |
|
US$m |
Adjusted EBITDA1 |
Rm |
11,794 |
|
16,983 |
|
21,152 |
|
| 1,179 |
|
1,179 |
|
1,083 |
|
US$/4Eoz |
All-in sustaining cost4 |
R/4Eoz |
19,716 |
|
20,431 |
|
18,160 |
|
|
|
|
|
Gold operations |
|
|
|
|
| 191,683 |
|
428,859 |
|
416,738 |
|
oz |
Gold produced |
kg |
12,962 |
|
13,339 |
|
5,962 |
|
| 1,864 |
|
1,720 |
|
1,921 |
|
US$/oz |
Average gold price |
R/kg |
1,124,871 |
|
958,232 |
|
922,851 |
|
| (202) |
|
(17) |
|
130 |
|
US$m |
Adjusted EBITDA1 |
Rm |
2,375 |
|
(440) |
|
(3,106) |
|
| 3,115 |
|
2,019 |
|
1,813 |
|
US$/oz |
All-in sustaining cost4 |
R/kg |
1,061,477 |
|
1,124,737 |
|
1,542,355 |
|
|
|
|
|
EUROPEAN REGION |
|
|
|
|
|
|
|
|
Sandouville nickel refinery6 |
|
|
|
|
| 4,565 |
|
2,277 |
|
3,493 |
|
tNi |
Nickel production7 |
tNi |
3,493 |
|
2,277 |
|
4,565 |
|
| 30,789 |
|
24,646 |
|
26,888 |
|
US$/tNi |
Nickel equivalent average basket price8 |
R/tNi |
489,635 |
|
427,120 |
|
474,144 |
|
| 4 |
|
(34) |
|
(35) |
|
US$m |
Adjusted EBITDA1 |
Rm |
(627) |
|
(553) |
|
61 |
|
| 29,896 |
|
38,333 |
|
37,486 |
|
US$/tNi |
Nickel equivalent sustaining cost9 |
R/tNi |
682,628 |
|
664,311 |
|
460,397 |
|
|
|
|
|
AUSTRALIAN REGION |
|
|
|
|
|
|
|
|
New Century zinc retreatment operation10 |
|
|
|
|
| — |
|
— |
|
24 |
|
ktZn |
Zinc metal produced (payable)11 |
ktZn |
24 |
|
— |
|
— |
|
| — |
|
— |
|
1,640 |
|
US$/tZn |
Average equivalent zinc concentrate price12 |
R/tZn |
29,871 |
|
— |
|
— |
|
| — |
|
— |
|
(28) |
|
US$m |
Adjusted EBITDA1 |
Rm |
(502) |
|
— |
|
— |
|
| — |
|
— |
|
2,418 |
|
US$/tZn |
All-in sustaining cost4 |
R/tZn |
44,030 |
|
— |
|
— |
|
1The Group reports adjusted earnings before interest, taxes, depreciation and amortisation (EBITDA) based on the formula included in the facility agreements for compliance with the debt covenant formula. Adjusted EBITDA may not be comparable to similarly titled measures of other companies. Adjusted EBITDA is not a measure of performance under IFRS and should be considered in addition to and not as a substitute for any other measure of financial performance and liquidity. For a reconciliation of profit before royalties and tax to adjusted EBITDA, see note 9.1 of the consolidated interim financial statements
2The US PGM operations’ underground production is converted to metric tonnes and kilograms, and performance is translated to SA rand (rand). In addition to the US PGM operations’ underground production, the operation treats various recycling material which is excluded from the 2E PGM production, average basket price and All-in sustaining cost statistics shown.
PGM recycling represents palladium, platinum and rhodium ounces fed to the furnace
3The Platinum Group Metals (PGM) production in the SA operations is principally platinum, palladium, rhodium and gold, referred to as 4E (3PGM+Au), and in the US underground operations
is principally platinum and palladium, referred to as 2E (2PGM) and US PGM recycling is principally platinum, palladium and rhodium referred to as 3E (3PGM)
4See “Salient features and cost benchmarks - Six months ” for the definition of All-in sustaining cost (AISC)
5The SA PGM production excludes the production associated with the purchase of concentrate (PoC) from third parties. For a reconciliation of the production including third party PoC,
refer to the "Reconciliation of operating cost excluding third party PoC for Total US and SA PGM, Total SA PGM and Marikana - Six months"
6The Sandouville nickel refinery processes nickel matte and is included in the Group results since the effective date of the acquisition on 4 February 2022
7The nickel production at the Sandouville nickel refinery operations is principally nickel metal and nickel salts (liquid form), together referred to as nickel equivalent products
8The nickel equivalent average basket price per tonne is the total nickel revenue adjusted for other income less non-product sales divided by the total nickel equivalent tonnes sold
9See "Salient features and cost benchmarks - Six months Sandouville nickel refinery" for a reconciliation of cost of sales before amortisation and depreciation to nickel equivalent sustaining cost
10New Century is a leading tailings management and rehabilitation company that currently owns and operates the New Century zinc tailings retreatment operation in Queensland, Australia. Amounts included since effective date of acquisition on 22 February 2023
11Zinc metal produced (payable) is the payable quantity of zinc metal produced after applying smelter content deductions
12Average equivalent zinc concentrate price is the total zinc sales revenue recognised at the price expected to be received excluding the fair value adjustments divided by the payable zinc metal sold
Sibanye-Stillwater Operating and financial results | Six months ended 30 June 2023 2
STATEMENT BY NEAL FRONEMAN, CHIEF EXECUTIVE OFFICER OF SIBANYE-STILLWATER
The Group financial and operating results for the six-months ended 30 June 2023 (H1 2023) reflect the challenging global macro-economic and turbulent geopolitical environment which has prevailed during 2023, with slowing global growth reducing demand for commodities, resulting in a significant decline in commodity prices other than gold during the period.
The operating environment has been equally demanding, with regional factors in our operating jurisdictions posing significant challenges. These regional factors include some which we have previously highlighted as “grey elephants” (highly probable, high impact yet often ignored global trends), such as climate change - causing extreme weather events which are becoming increasingly frequent globally, with severe storms disrupting our US PGM operations in mid-2022 and our New Century tailings operations in Australia in Q1 2023; social discontent - widespread strikes in France causing downtime at our Sandouville nickel refinery in Le Havre during H1 2023 and ongoing community and labour related disruptions common in South Africa. Moreover, the shortage of critical skills impacting the mining industry globally, continues to impact productivity and costs at our US PGM operation, and electricity disruptions and crime (cable theft and illegal mining) have intensified in South Africa.
In periods of change and disruption such as these, an intense focus on safety, which is a core Group value is particularly critical. The improvements in the Group safety performance achieved in 2022 were largely maintained during H1 2023. There was however a regression in Group safety lagging indicators during Q2 2023 which is receiving attention. This included three incidents at the SA gold operations during H1 2023 which resulted in the tragic loss of six colleagues (four contractors and two employees). While these tragic events have set us back, we remain resolute in our efforts towards Zero Harm in the workplace. The Board and management of Sibanye-Stillwater extend their sincere condolences to the family, friends, and loved ones of our departed colleagues.
We remain committed to continuous improvement in health and safety at our operations. This is a deliberate journey and whilst we have made progress, we continue to modify the strategy based on lessons learned and industry best practice to improve our risk approach, eliminate fatalities and improve incident statistics. The journey is not an easy one and requires a committed and sustained focus, but our optimism is supported by the performance of the SA PGM and US PGM operations, which operated without fatal incidents for H1 2023, and the European operations which recorded no recordable safety incidents for Q2 2023. A more detailed assessment of the H1 2023 safety performance can be found on page 5.
The Group has successfully managed various challenges in the last few years, and I am confident that we will again successfully navigate these challenges.
The appropriateness of our ongoing strategic evolution supporting our purpose "to safeguard global sustainability through our metals" and our strategic commodity and geographical diversification since 2016, was again evident during H1 2023.
The impacts of the precipitous decline in PGM prices and operational disruptions at our US and European regions, were cushioned by a significantly improved financial contribution from the SA gold operations. The normalisation of production after the industrial action and lock-out which resulted in operations being suspended for most of H1 2022 (during which the SA PGM operations provided the diversification benefits), ensured timeous exposure to the higher gold price during a period of strategic investment for the Group into the battery metals sector.
Our investments in future facing metals and the green economy in Europe, the US and Australia, are central to the delivery of our green metals and clean energy solutions strategic differentiator. These strategic investments are expected to make an increasing financial contribution to the Group in the second half of this decade, by positioning the Group to benefit from the future global energy transition and will further diversify the Group portfolio. We anticipate that these strategic investments will provide a critical offset against the declining contribution from the SA gold operations as they near the end of their reserve lives over this decade and are restructured in a phased manner.
Some of the previously mentioned regional challenges impacted negatively on our operations during H1 2023. Steps have and are being taken to address and mitigate these challenges and are detailed in the Safety and operating review on pages 7 to 12, as a result of which we expect these impacts to be minimised in H2 2023. Others were extremely well managed with the potential impact on the Group minimised.
The updated protocols implemented at the SA PGM and SA gold operations to address the elevated levels of load curtailment in particular have proven extremely effective, and proactive steps to minimise the potential impact of illegal mining and cable theft on production are starting to have significant impact in reducing the impact on operating results.
The increasing frequency and magnitude of load curtailment posed a significant risk going into 2023. The impact has however been successfully mitigated through the implementation of comprehensive protocols which include, inter alia, re-scheduling energy intensive activities to lower demand periods and utilising our installed generation capacity at our SA gold operations, with unutilised available capacity at our SA PGM processing operations also providing significant processing flexibility, which has enabled our SA PGM operations to avoid the build-up of ore stockpiles or “deferred production” as per our peers.
A more positive narrative has begun to emerge, suggesting an improvement in power availability and reduced load curtailment towards year end. A swift and decisive response from the private sector and general public in South Africa, following the lifting of regulatory thresholds on renewable projects for self-generation, has played a significant role in this, with over 4000 MW of private sector renewable energy estimated to have been installed in the last year. Our self-generation strategy has likewise progressed with our first renewables project, the 89MW Castle Wind Farm announced in July 2023 with earthworks on site now in progress. This is a measurable milestone in the implementation of our 600MW renewable energy programme, which is expected to be complete by 2026 and forecast to significantly reduce operating costs and our dependence on Eskom, as well as the carbon emissions attributable to a reliance on Eskom's coal-fired generation, which dominate our current scope 2 emissions.
Regional opportunities arising from our recognition of global multipolarity becoming a dominant trend (another grey elephant), have begun to yield benefits. The US Inflation Reduction Act of 2022 (IRA), which directs new federal spending toward reducing carbon emissions, lowering healthcare costs, funding the Internal Revenue Service, and improving taxpayer compliance aims to encourage procurement of critical supplies domestically or from free-trade partners amongst other things. Significant benefits are expected to flow from the IRA and similar legislation in Europe, where we have selectively chosen to build strategic platforms to develop our battery metals and recycling businesses.
In addition to the US department of Energy (DOE) conditional loan commitment to provide up to US$700 million in funding to the Rhyolite Ridge JV, the US PGM operations expect to qualify for an IRA credit (45X advanced manufacturing production credit) equal to 10% of qualifying production costs incurred for critical metals produced and sold after 31 December 2022, for a period of 10 years. During H1
Sibanye-Stillwater Operating and financial results | Six months ended 30 June 2023 3
2023, management recognised an IRA credit of US$25 million against operating costs.We are also starting to witness the growing geostrategic importance of Africa to meet the accelerating need for critical minerals in both the western and eastern worlds.
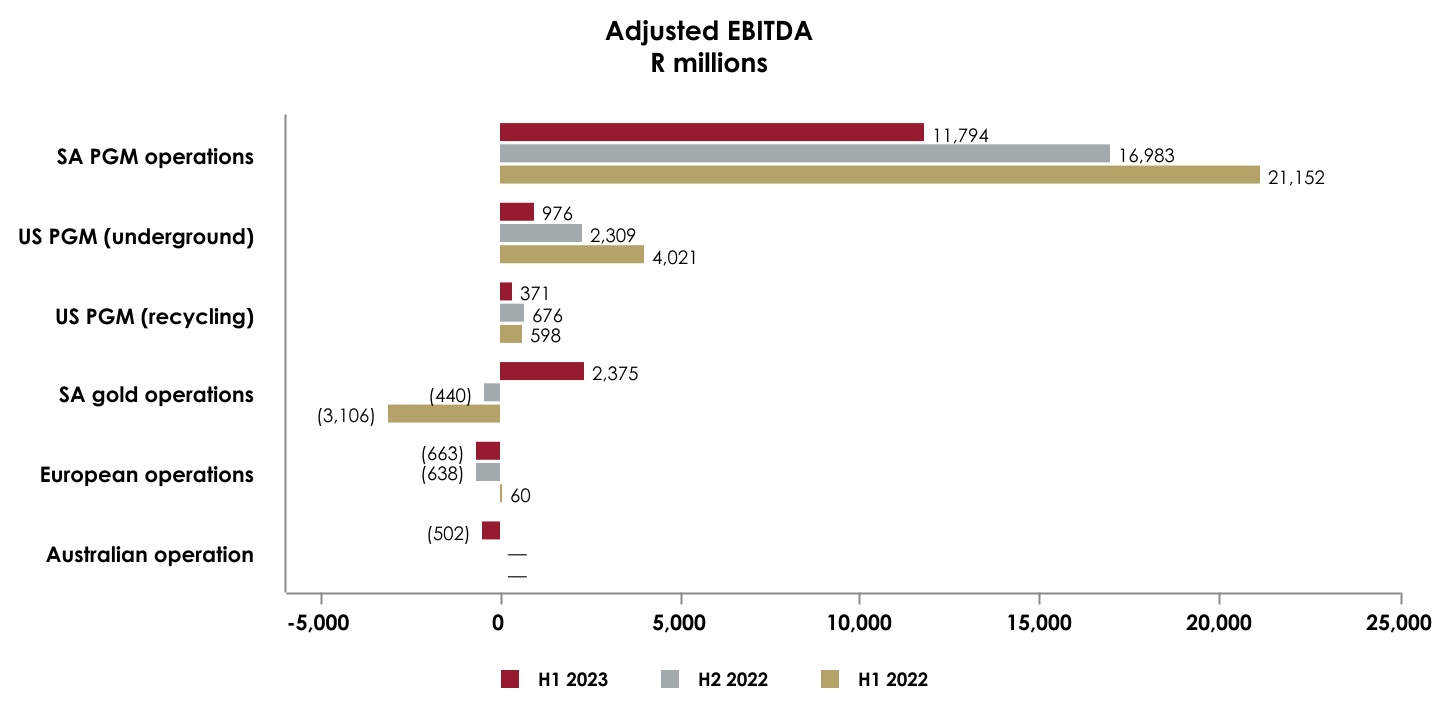
Group adjusted EBITDA of R14.1 billion (US$776 million) for H1 2023 was 37% lower than adjusted EBITDA of R22.6 billion (US$1.5 billion) for the comparable period in 2022, primarily reflecting the significant decline in PGM prices and regional operational challenges partly offset by the improved performance from the SA gold operations.
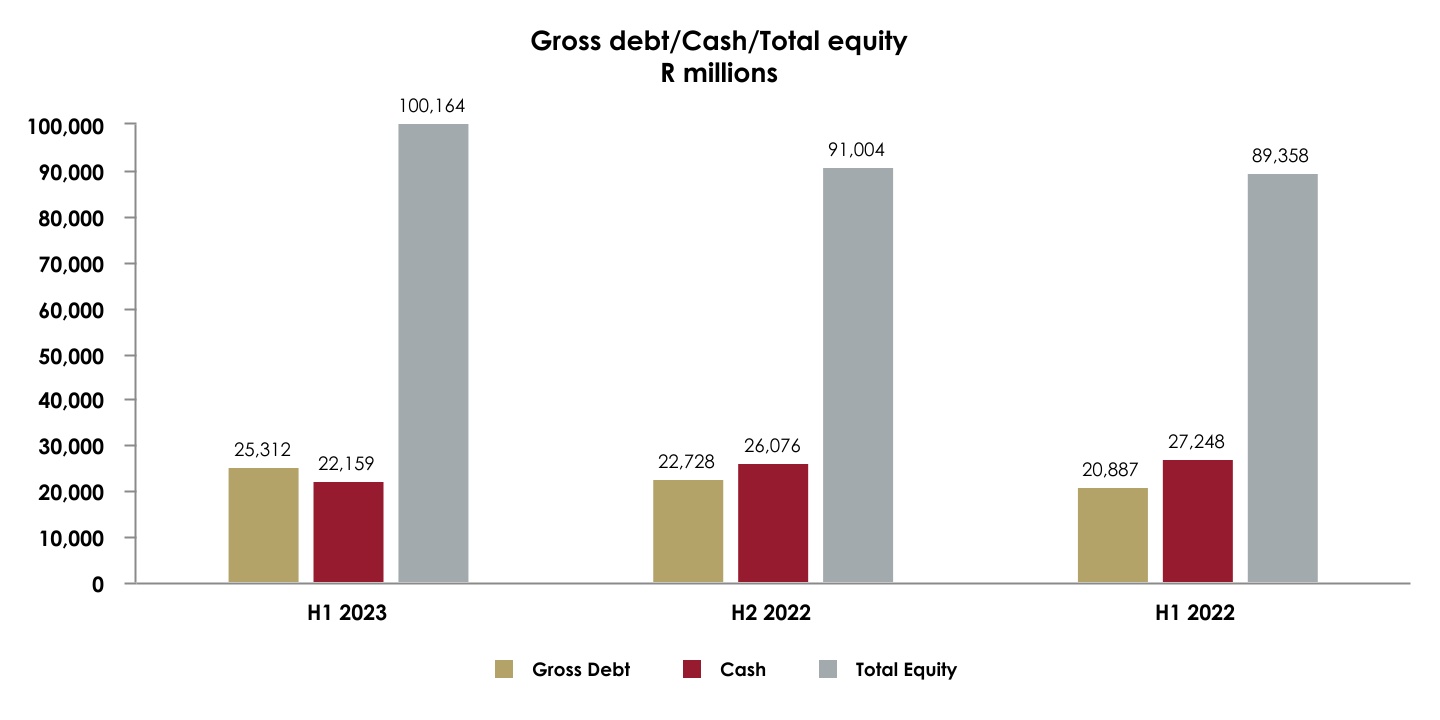
Continued capital allocation discipline has maintained the Group’s robust financial position. Cash and cash equivalents of R22.2 billion (US$1.2 billion) remain above the capital allocation framework reserve target of R20 billion, despite increased investment in our battery metals portfolio and a R3.6 billion (US$198 million) final payment to Anglo American Platinum for the Rustenburg operations (the absence of which will benefit future Rustenburg cash flow) during the period. Along with undrawn Revolving Credit Facilities (RCF) of R25.0 billion (US$1.3 billion), the Group has substantial financial headroom. These undrawn debt facilities include the dollar RCF, which was refinanced with strong support from a syndicate of global banks and increased from US$600 million to US$1 billion on improved terms during H1 2023, further enhancing Group liquidity and financial flexibility.
Cash and cash equivalents at the end of H1 2023 were marginally below borrowings (excluding non-recourse Burnstone debt) of R22.4 billion (US$1.2 billion), resulting in net debt of R262 million (US$14 million) and net debt: adjusted EBITDA ratio of 0.01x, which provides the Group with significant financial headroom to weather any further challenges as well as providing strategic optionality to capitalise on value accretive opportunities.
Profit for the period (after tax) of R7.8 billion (US$427 million) for H1 2023 was 37% lower than for H1 2022, with basic earnings per share (EPS) and headline earnings per share (HEPS) of 262 SA cents (14.4 US cents) and 208 SA cents (11.4 US cents), approximately 38% and 51% lower year-on-year respectively. The variance between EPS and HEPS primarily reflects an adjustment from EPS of R1.5 billion (US$82.0 million) related to non-cash foreign exchange gains arising from the once off accounting treatment of the deregistration of offshore subsidiaries acquired as part of the Lonmin transaction, during the period.
On the basis of the robust Group financial position, the Board of directors declared an interim dividend of R1.5 billion (US$79 million) (53 cents per share/US 11.2 cents** per ADR), equivalent to 35% of normalised earnings1 of R4.3 billion (US$235 million) for H1 2023, and at the upper end of the range of the Group dividend policy. This is in-line with the Group capital allocation framework and the Group commitment to delivering consistent shared value to stakeholders.
While the global macro-economic outlook remains uncertain, central bank rate hiking cycles in many economies appear to have reached or are nearing their peaks, and there are positive signs that a recession may be avoided, although low growth conditions are expected to continue well into 2024.
Global auto sales appear to be recovering, with recent forecasts for 2023 consistently being revised upwards. While this has yet to translate into a tangible increase in demand for PGMs or a recovery in recycling volumes, an implied improvement in PGM demand during H2 2023 would be supportive for spot PGM prices as destocking subsides.
Our robust financial position and diversification, places us well to not only endure through a period of low prices but to realise value from opportunities which may arise. While improvements are expected from our US and European operations and the integration of New Century as a managed operation in Sibanye-Stillwater yields benefits, the decline in commodity prices during H1 2023 has been severe and we are preparing for a lower phase in the commodity price cycle through a stringent focus on unit costs and a disciplined approach to the management of our assets. While we expect that a few tough quarters may be necessary while production is fully restored to plan levels at certain operations, we will be mindful of the operating environment and, where necessary, restructuring may be considered in areas where commercially viable operations cannot be sustained.
1 Normalised earnings is not a measure of performance under IFRS. As a result, it should not be considered in isolation or as alternatives to any other measure of financial performance presented in accordance with IFRS. Non-IFRS measures are the responsibility of the Board. Refer note 7 of the consolidated interim financial statements for the definition and reconciliation of normalised earnings
OPERATIONAL OVERVIEW
The SA PGM operations delivered another solid, consistent operating result for H1 2023, commendably managing the impact of elevated Eskom load curtailment and making significant progress in addressing cable theft during Q2 2023. Production of 848,723 4Eoz (including PoC), was flat compared to H1 2022, benefiting from a 24,195 4Eoz (95%) increase in PoC year-on-year, highlighting another relative advantage arising from our unutilised processing capacity. 4E PGM production (excluding PoC) of 799,182 4Eoz, was 3% lower than for H1 2022, but in line with H1 2022 if adjusted for the year-on-year decline in Kroondal production, which was primarily due to the planned closure of the Simunye shaft at the end of 2022. Costs were again well managed, with AISC (excluding PoC) of R19,716/4Eoz (US$1,083/4Eoz) for H1 2023, increasing by 9% year-on-year, significantly less than recent cost increases reported by industry peers.
The SA PGM operations continue to move down the industry cost curves through consistent, leading cost management. In so doing, they have not only increased their relative profitability and competitiveness, but also ensured greater margin protection than higher cost peers against lower PGM prices.
Production from the SA managed gold operations (excluding DRDGOLD) for H1 2023 of 10,411kg (334,721oz) increased by 233% year-on-year, with AISC of R1,113,391/kg (US$1,902/oz) 47% lower, mainly reflecting the recovery in production from the SA gold operations following the suspension of operations as a result of the industrial action and consequent lockout during H1 2022.
Disappointingly, the positive momentum that had been building at the SA gold operations, has been arrested by some significant operating incidents that occurred post 30 June 2023.
•On 12 July 2023, a fire at Driefontein 5 shaft disrupted operations at both Driefontein 1 and 5 shafts. Tragically, Mr Armando Matias (56) a development miner passed away as a result of the fire incident, during which he was separated from his team. Our heartfelt condolences are extended to the family and friends of our deceased colleague. Twenty-four employees were secure in various refuge bays and safely brought to surface. Whilst most of the crews at Driefontein 1 shaft returned to work and were operational by the beginning of August, the crews from the Driefontein 5 shaft area will only be reintroduced in a phased manner once the fire Is extinguished and the area becomes safe to operate in.
•Production constraints at the Kloof operations resulting from increased seismic activity which restricted access to higher grade production areas and ventilation and cooling constraints at Kloof 4 shaft during H1 2023, have been exacerbated by the shaft incident in late July 2023, which caused significant damage to infrastructure and resulted in the suspension of operations at the Kloof 4
Sibanye-Stillwater Operating and financial results | Six months ended 30 June 2023 4
shaft. The incident is under investigation and the extent of the damage is still being assessed. The full impact of the increased seismicity at Kloof 4, combined with constraints on cooling infrastructure and the shaft repairs required to resume operations at 4 shaft is being assessed.
Mined 2E PGM production from the US PGM operations of 205,513 2Eoz for H1 2023, was 11% lower year-on-year, with AISC of US$1,737/2Eoz, 27% higher than for H1 2022, primarily due to the shaft incident at the Stillwater West mine and ongoing critical skills shortages which continue to affect productivity and unit costs. These factors have also delayed implementation of the repositioning plan, which was announced in mid-2022, although we expect to resume planned implementation by Q4 2023.
The repositioning plan was a proactive response to the changing macro environment and worsening outlook for the palladium price, which we recognised in late 2021. The US PGM operations have delivered on the initial strategic intent and repaid the acquisition cost, hence repositioning the operations for long term profitability and sustainability to deliver optimal value, was deemed prudent. The US PGM operations were bought at the right time, during a low phase in the PGM price cycle, and under conservative PGM price assumptions at the time, so despite operational challenges currently impacting the operations, has not required a write down of the acquisition value.
3E PGM production from the US PGM recycling operation for H1 2023 halved year-on-year to 162,452 3Eoz. The global autocatalyst recycling industry has not recovered as anticipated at the beginning of 2023. The uncertain global economic outlook, recessionary concerns and higher interest rates have led to decreased consumer demand for new vehicles, with light duty vehicles (LDV) remaining in service for extended periods and fewer vehicles being scrapped. Furthermore, the global collection networks have contracted due to the residual impact of COVID-19 and lower PGM prices, leading to an accumulation of inventory within these networks. While there are positive signs of a recovery in global auto sales emerging, these are only expected to reflect in recovery in receipts and feed rates in 2024.
Nickel equivalent production from the Sandouville nickel refinery of 3,493 tonnes for H1 2023 and nickel equivalent sustaining cost of US$37,486/tNi (R682,628/tNi) were impacted by plant downtime of 50 production days during H1 2023, primarily due to equipment failure at the electro-winning circuit, supply chain constraints leading to a shortage of critical inputs and social unrest in France in the form of nationwide strikes. Repairs to the cathode units in the electro winning circuit are largely complete, with circuit availability and nickel recovery trends improving during Q2 2023. Legacy contracts with suppliers and customers are also being renegotiated by the new management team and working capital risks are being managed through the hedging of 70% of nickel purchases. The outlook for H2 2023, barring any unexpected disruptions, is therefore more positive.
Persistently high fixed and maintenance costs and the recent decline in the nickel price and deterioration in the medium-term outlook, has however prompted a review of the business case, which is scheduled for completion before year end. The outcome of this review and optimisation proposals will inform a decision on the way forward.
The strategic rationale for the Sandouville acquisition included the potential to provide a springboard for supply of battery metals and battery materials into the European ecosystem as well as a node for the development of a European recycling business.
Feasibility studies on the battery grade nickel sulphate, PGM autocatalyst recycling, and battery metals recycling projects, are also scheduled to progress to the next stages before the end of 2023.
The commitment and support for the Keliber lithium project from the Finnish Minerals Group, which represents and manages the Finnish State’s mining industry investments was confirmed in April 2023, when it elected to increase its holding in the Keliber project from 14% to 20% by subscribing for €54 million of the €104 million rights issue, which completed the financing of the equity component of the €588 million capital required for the full development of the project. With the equity capital component secured, securing debt funding for the remaining project capital is underway.
The construction of the Keliber lithium refinery is proceeding and we are confident that the concentrator and open cast mines will be developed in due course, ensuring integrated production and supply of battery grade lithium hydroxide from the Keliber project into what we expect is going to be a substantial market deficit in the second half of this decade.
It is worth noting the positive responses we have received from the French and Finnish governments as a result of our investments, with both countries having publicly prioritised the development of a national battery industry and supportive of our investments in these economies. Constructive engagements at the highest levels of Government are positive affirmations of support.
STRATEGIC DELIVERY
Good progress continues to be made in building our green metals and energy solutions business.
Following the classification of the Tiehm's buckwheat as an endangered species at the Rhyolite Ridge lithium project, an alternative mine plan and schedule that avoids all buckwheat, is subject to an updated feasibility study, with additional drilling being done to further define the orebody. While permitting risk remains, the climate has turned positive, and we consider this would have strategic advantage in terms of securing a leading position in developing the United States critical minerals value chain with a positive commercial return. The investment will only be advanced subject to intensive oversight of the technical status of the project. The Federal permitting process (NEPA) continues to advance with completion of the first public scoping period and progress towards publication of a draft EIS.
The integration of New Century into Sibanye-Stillwater is expected to be completed during H2 2023. A feasibility study on Mount Lyell (a previously operated copper mine) in Tasmania is underway and a decision on the option to acquire 100% of Mt Lyell from Vedanta Resources will be taken prior to its expiry on 5 November 2023.
Our involvement in the process to extend our copper portfolio into Zambia through our bid to acquire the Mopani operation is ongoing. A competitive process is underway to determine the successful bidder to enter into a phase of final due diligence and exclusive negotiation on the detailed terms.
OPERATING GUIDANCE FOR 2023*
Operating guidance for the US recycling operation, the SA gold operations and the Sandouville nickel refinery has been revised to reflect the impact of various events described in this report. The latest operating guidance for 2023 is as follows:
•Guidance for the US PGM operations is unchanged. Mined 2E PGM production is forecast to be between 460,000 2Eoz and 480,000 2Eoz, with AISC between US$1,550/2Eoz and US$1,650/2Eoz (R27,900/2Eoz to R29,700/2Eoz). Capital expenditure is forecast to be
Sibanye-Stillwater Operating and financial results | Six months ended 30 June 2023 5
between US$285 million and US$300 million (R5.1 billion to R5.4 billion), including approximately US$25 million (R450 million) project capital.
•3E PGM production from the US PGM recycling operations has been revised downwards to between 350,000 3Eoz and 400,000 3Eoz fed for the year. Capital expenditure is also forecast to be lower than previous guidance at US$1.4 million (R25 million).
•Forecast 4E PGM production from the SA PGM operations for 2023 remains unchanged at between 1.7 million 4Eoz and 1.8 million 4Eoz including approximately 60,000 4Eoz of third party PoC, with AISC between R20,800/4Eoz and R21,800/4Eoz (US$1,156/4Eoz to US$1,211/4Eoz) - excluding the cost of third party PoC. Capital expenditure is forecast at R5.4 billion (US$300 million) for the year, including project capital of R920 million (US$51 million) for the K4 project.
•Gold production from the managed SA gold operations (excluding DRDGOLD) for 2023 is forecast at between 19,500kg (625koz) and 20,500kg (660koz). This revised guidance reflects the estimated impact of a fire at Driefontein and the Kloof 4 shaft incident which occurred after 30 June 2023. The review of the marginal operations is ongoing considering operational constraints as well as sustained high levels of cost inflation. AISC is revised to be between R1,190,000/kg and R1,290,000/kg (US$2,056/oz to US$2,230/oz) due to lower production. Capital expenditure is forecast at R5.4 billion (US$300 million), including R1.6 billion (US$90 million) of project capital expenditure for the Burnstone project.
•Production from the Sandouville nickel refinery has been revised downward due to production constraints which affected H1 2023. Production is forecast at between 7.0 kilotonnes to 7.5 kilotonnes of nickel equivalent product (Ni) at a nickel equivalent AISC of between €33,715/tNi and €34,588/tNi (R657,000/tNi to R675,000/tNi) with capital expenditure of €14 million (R273million).
•Capital expenditure forecast for the Keliber lithium project for 2023 remains unchanged at €231 million (R4.5 billion).
*The guidance has been translated where relevant at an average exchange rate of R18.00/US$ and R19.50/€.
NEAL FRONEMAN
CHIEF EXECUTIVE OFFICER
Sibanye-Stillwater Operating and financial results | Six months ended 30 June 2023 6
SIBANYE-STILLWATER GROUP SAFETY AND OPERATING REVIEW
SAFETY
While zero harm remains our ultimate objective, our immediate goal continues to be eliminating fatal and serious incidents through our Fatal Elimination Strategy, which is comprised of the key pillars of: critical controls, critical lifesaving behaviours and critical management routines.
Group safety indicators were largely consistent year-on-year. The Group serious injury frequency rate (SIFR) improved from 3.05 (per million hours worked) for H1 2022 to 2.78 for H1 2023, a 9% improvement, with the lost time injury frequency rate (LTIFR) increasing by 5% from 4.56 to 4.77 and the total recordable injury frequency rate (TRIFR) increasing marginally from 5.39 to 5.45 for the same period.
Primarily as a result of the incident at the Burnstone project in April 2023, where four contractor employees were fatally injured when a surface waste rock conveyor which was under construction by a 3rd party collapsed, the Group fatal injury frequency rate (FIFR) (per million hours worked) regressed from 0.03 for H1 2022 to 0.07 for H1 2023.
We mourn the tragic loss of Puleng Masombuka (34 years old), Jonas Mofokeng (56), Cornelius van Wyk (50) and Afonso Nguenze (55) as a result of this incident.
On 28 June 2023, Richete Chitlango (55), a special team leader at Driefontein 5 shaft, passed away from injuries sustained in a fall of ground incident while engaged in underground cleaning operations during night shift. Together with the loss of Thabiso Ramotselisi, which was reported in our Q1 2023 results, this resulted in a total of six fatalities (four contractors and two employees) during H1 2023, compared with two during H1 2022.
The loss of our colleagues is deeply regretted, and the Board and management of Sibanye-Stillwater extend their sincere condolences to the loved ones, families and friends of our deceased colleagues. All incidents are being investigated along with relevant stakeholders and support is being provided to the families of the deceased.
While it was pleasing to note that the rest of the Group's operations achieved a fatal free first six months of the year, we continue to intensify the focus on safe production, building on improvements made and embedding our Fatal Elimination Strategy, ensuring improvements in safe performance and behaviour, to achieve sustainable real risk reduction across all our operations.
To support and intensify the Fatal Elimination Strategy, several leading indicators have been developed to monitor the effectiveness of the strategy. In particular, the Group's focus is on learning from high potential incidents (not only fatal incidents) to prevent recurrences, embedding a culture of reporting safety incidents, including near miss incidents and unsafe work conditions without hesitation and fear of retribution.
The Group high potential incident review committee meets at regular intervals, where leaders collectively share and assess the causes of significant incidents. The primary focus of this is to identify and share Group learnings in an effort to sustainably prevent repetitive incidents. Leading indicators being monitored, include measuring compliance to critical controls, critical life-saving behaviours and critical management routines. Of note is that at several operations, there has been an increase in self-stoppages by front line operators and supervisors. This is an encouraging trend, reflecting an enabled and supportive environment for these actions and, for the first time since consistent monitoring of workplace stoppages began, frontline stoppages by employees exceeded those of management. Empowered employees exercising self-stoppages contributes to mitigating potential harm.
Turning to the various operations, the US PGM operations safety performance for H1 2023 regressed, with reportable injuries increasing from 20 to 28 year-on-year resulting in the TRIFR increasing from 8.85 for H1 2022 to 12.61 for H1 2023.
The SA PGM operations also reported a slight regression in the safety performance for H1 2023 with the TRIFR increasing from 5.41 for H1 2022 to 5.48 for H1 2023, an increase of 1%. Pleasingly the SIFR improved by 26% from 3.20 for H1 2022 to 2.37 for H1 2023, one of the lowest SIFR recorded. In addition, the SA PGM mining operations were fatality free during H1 2023, with 9 million fatality free shifts reached on 19 June 2023, a significant and record achievement in these underground operations.
The SA gold operations safety performance regressed as a result of the six fatalities (four contractors and two employees) in three separate incidents in H1 2023 (one fatality in H1 2022) with the FIFR increasing from 0.056 for H1 2022 to 0.19 for H1 2023. This is a deeply disappointing regression, which is being addressed by the operationalisation of the Fatal Elimination Strategy. The TRIFR also regressed marginally from 4.76 for H1 2022 to 4.97 for H1 2023.
The European region (EU region) which includes both the Keliber lithium project and Sandouville, has been integrated into the Group's safety reporting processes. The European region had a TRIFR of 2.90 for H1 2023, a pleasing decrease as compared to 15.95 for H1 2022, which only included Sandouville at the time. Sandouville had 4 recordable incidents in H1 2022 and none in H1 2023. The TRIFR of the European operations is currently significantly lower than the Group average of 5.45, as a result of Sandouville being an industrial surface complex and construction of the refinery now commencing at the Keliber lithium project.
The integration of the recent acquisition of New Century Resources, is underway and New Century will be included in future Group safety statistics as the Australian region.
OPERATING REVIEW
Americas (US) region
US PGM operations
The US PGM operations were significantly impacted by the shaft incident at the Stillwater West mine in March 2023, where structural damage to the shaft prevented access below 50 level for eight weeks during H1 2023, resulting in lower production, higher AISC and a delay in the implementation of the optimisation plan. The shaft was repaired by 16 April 2023 and recommissioned by the end of April 2023. Approximately 24,600 2Eoz of production from the Stillwater West mine was directly impacted for H1 2023, with the implementation of the repositioning plan also affected.
Sibanye-Stillwater Operating and financial results | Six months ended 30 June 2023 7
Consequently, mined 2E PGM production from the US PGM operations of 205,513 2Eoz was 11% or 24,526 2Eoz lower than for H1 2022. In addition to the shaft incident impact, continuing critical skill shortages of miners, geologists, mechanics and artisans across the US operations and geological and geotechnical complexity at East Boulder, adversely impacted productivity.
The shortage of critical skills in mining is a global phenomenon which is expected to continue and intensify with many mining companies reporting similar issues and is exacerbated by the exceptionally low unemployment levels in the United States. Efforts to attract and retain critical mining and geological skills are in progress, however staff attrition rates remain high. We continue to work diligently to determine the reasons for the high turnover rate at the East Boulder mine and on retaining employees, as well as focus on recruitment for critical positions. To buffer the impact of the mechanics skills shortage, we have recently launched an in-house mechanics training program.
2E PGM production from the Stillwater mine of 123,412 2Eoz for H1 2023, was 14% lower than H1 2022, primarily due to the Stillwater West shaft incident and equipment unavailability due to a shortage of mechanics. Production from the East Boulder mine of 82,102 2Eoz was 5% lower than for H1 2022, with the mine continuing to be impacted by geological and geotechnical challenges as mining migrates to the west, with critical skills shortages affecting productivity.
Key focus areas for the US PGM operations include infrastructure maintenance scheduling, which is being overhauled, improving fleet availability, addressing the mining mix at East Boulder and minimising dilution, as well as implementing labour retention strategies.
AISC of US$1,737/2Eoz (R31,633/2Eoz) for H1 2023 was 27% higher than for H1 2022, primarily due to lower production, persistent inflationary pressures on stores and contractor costs, with both Ore Reserve Development (ORD) and sustaining capital higher. ORD increased by 34% from US$83 million (R1.3 billion) for H1 2022 to US$111 million (R2 billion) for H1 2023, primarily due to the reclassification of project development (project capital) to ORD, contractor premiums and higher development support costs, with ORD contributing US$541/2Eoz to AISC, US$181/2Eoz (R4,307/2Eoz) higher year-on-year. Sustaining capital increased by 75% to US$43 million or US$209/2Eoz (R3,815/2Eoz), US$103/2Eoz (R2,172/2Eoz) higher year-on-year as result of higher spending on ventilation improvements, transport and mining fleet replacement and ongoing spend on tailings storage facilities (TSF). Of significant benefit, in terms of the US Inflation Reduction Act (IRA) the US PGM operations would qualify for an IRA credit (45X Advanced Manufacturing Production Credit) equal to 10% of qualifying production costs incurred for critical minerals produced and sold after 31 December 2022, for a period of 10 years. During H1 2023, management recognised an IRA credit of US$25 million against operating costs.
Adjusted EBITDA of US$53 million (R976 million) for H1 2023 was 80% lower than adjusted EBITDA of US$261 million (R4.0 billion) for H1 2022, with 20% lower PGM 2Eoz sold year-on-year compounded by the 28% decrease in the average 2E PGM basket price for H1 2023 to US$1,390/2Eoz (R25,312/2Eoz).
Capital expenditure for H1 2023 increased by 24% year-on-year to US$176 million (R3.2 billion), with 87% (or US$154 million) of this amount spent on ORD and sustaining capital. Growth project capital was 36% lower at US$22 million (R403 million) in line with the US PGM repositioning plan of August 2022 with the completion of spending on the 56-level holing to the Benbow decline and the processing plant upgrade (with the first line successfully commissioned).
Total development for H1 2023 of 11,941 meters was 5% lower than for H1 2022, primarily due to no access below 50 level at the Stillwater West mine, due the shaft incident. Both primary and secondary development at the Stillwater mine was 7% and 10% lower respectively compared with H1 2022. It was pleasing to note that primary and secondary development at East Boulder increased by 6% to 923 metres and 2,742 metres respectively, consistent with the 2022 repositioning plan to increase mining flexibility through increased development. Project development reduced from 1,010 metres for H1 2022 to nil for H1 2023 following the decision to curtail further project capital expenditure at the Stillwater East mine with development now classified as ORD.
US PGM recycling operation
The global autocatalyst recycling industry has not recovered as anticipated at the beginning of 2023. The uncertain global economic outlook, recessionary concerns and higher interest rates have led to decreased consumer demand for new vehicles, with light duty vehicles (LDV) remaining in service for extended periods and fewer vehicles being scrapped. Furthermore, the global collection networks have contracted due to the residual impact of COVID-19 and lower PGM prices, leading to an accumulation of inventory within these networks.
Reflecting these factors, average volumes of spent autocatalysts fed at the US PGM recycling operation of 10.9 tonnes per day (tpd) for H1 2023, was 52% lower than for H1 2022. During H1 2023, 1,957 tonnes of recycled material was received and 1,979 tonnes fed.
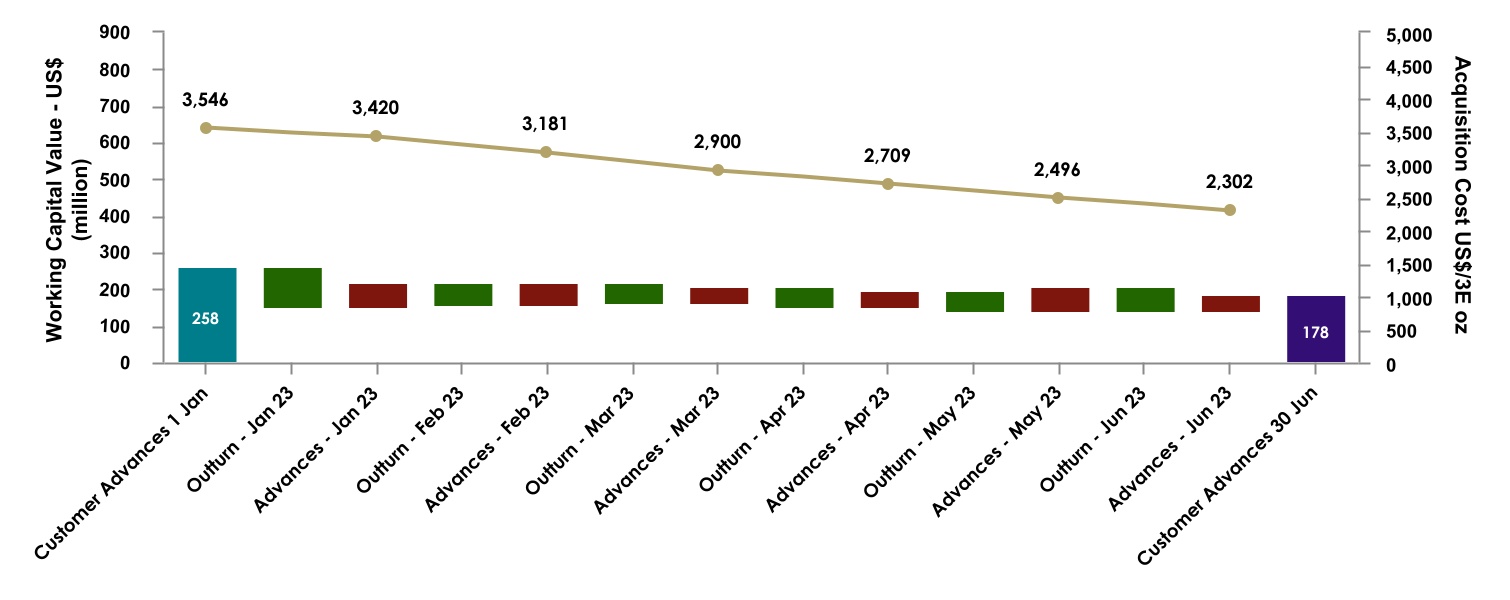
The recycling operation is currently expending approximately US$2 million per day (R36 million) on recycle advances, resulting in recycle advances of approximately US$178 million (R3.2 billion) at the end of H1 2023. At the end of H1 2023, approximately 27 tonnes of recycle inventory was on hand, a 97 tonne decrease versus the H1 2022 ending inventory of 124 tonnes. There was a positive cash inflow from recycling as inventory on hand reduced from US$320 million (R5.4 billion) at the beginning of H1 2023 to US$206 million (R3.8 billion) at the end of H1 2023.
Adjusted EBITDA from PGM recycling decreased by 49% year-on-year to US$20 million (R371 million) at a margin of 5%. The decrease was due to a 6% decrease in 3E PGM recycle basket price to US$2,735/3Eoz (R49,804/3Eoz) and 3E PGM sold declining by 58% to 153,446 3Eoz.
Increasing global auto sales reported recently have prompted upward revisions to sales forecasts for 2023 and are a promising leading indicator of future recycling volumes. The current environment remains challenging however and the recycling segment is actively pursuing volume-driven growth, including potentially venturing beyond conventional autocatalytic feed sources for opportunities.
Southern African (SA) region
SA PGM operations
The SA PGM operations produced a solid operational performance for H1 2023 with commendable management of the elevated levels of load curtailment during H1 2023. The Group's spare processing capacity is a strategic advantage, providing greater operational flexibility, which together with implementation of effective protocols, minimised the impact on production, with no ore stockpiles or "deferred production" recorded at the end of H1 2023, in contrast to some of our peers. 4E PGM production including third party purchase of concentrate (PoC) of 848,723 4Eoz for H1 2023, was in line with H1 2022. 4E PGM production excluding third party PoC of 799,182 4Eoz,
Sibanye-Stillwater Operating and financial results | Six months ended 30 June 2023 8
was 3% lower year-on-year. Surface production of 74,269 4Eoz for H1 2023 (excluding PoC) increased by 3% year-on-year partly offsetting a 4% decline in underground production to 724,913 4Eoz. The decline in underground production was primarily a result of the planned closure of Kroondal's Simunye shaft at the end of 2022. Concentrate purchases from third parties of 49,541 4Eoz for H1 2023 were significantly higher than for H1 2022.
Costs continue to be well managed, comparing favourably to industry peers who have recently reported double digit cost increases, particularly considering the 3% decline in production (excluding PoC) following the closure of Kroondal's Simunye shaft and the inclusion of development from the Marikana K4 project increasing AISC at the Marikana operation (in March 2022, K4 commenced stoping and development outside of the shaft infrastructure footprint resulting in ORD, working costs and sustaining capital ramping up). Inflationary effects (particularly imported commodities such as fuel and imported spares impacted by the weakening of the rand), were largely offset, with AISC (excluding PoC) of R19,716/4Eoz (US$1,083/4Eoz) only 9% higher year-on-year.
The increase in AISC reflects a 43% increase in ORD to R1.3 billion (US$74 million), R405 million (US$13 million) higher year-on-year. This was primarily due to ORD from the K4 project increasing the Marikana operation's overall ORD which increased by 58% year-on-year. AISC for H1 2023 also reflected 50% lower royalties paid compared to H1 2022 (R474 million or US$36 million lower year-on-year) and 12% higher by-product credits (R536 million or US$16 million higher year-on-year), primarily due to a higher chrome price.
AISC (including PoC) of R20,214/4Eoz (US$1,110/4Eoz) for H1 2023 was 8% higher than for H1 2022, due to a 45% increase in PoC cost to R1.6 billion (US$88 million) as per the detailed Marikana commentary (see below).
The average 4E PGM basket price for H1 2023 of R34,006/4Eoz (US$1,867/4Eoz) was 22% lower than for H1 2022, with average rhodium and palladium prices 51% and 36% lower respectively in US dollar terms compared to the same period in 2022, partly offset by the 18% depreciation of the rand versus the US dollar year-on-year. Adjusted EBITDA from the SA PGM operations of R11.8 billion (US$649 million) for H1 2023 was 44% lower than for H1 2022 due to the lower average 4E PGM basket price.
Capital expenditure for H1 2023 increased by 19% to R2.6 billion (US$141 million) compared to H1 2022. This increase was largely driven by a 43% increase in ORD to R1.3 billion (US$74 million), largely driven by Marikana where ORD increased by 58% due to the ramp up in ORD at K4), with sustaining capital 4% lower at R786 million (US$43 million) and project capital 9% higher at R441 million (US$24 million), with spending primarily on the Marikana K4 project.
PGM production from the Rustenburg operation of 314,471 4Eoz for H1 2023 was 3% higher than for H1 2022, with underground production 3% higher and surface production 7% higher year-on-year. Although the Rustenburg operation continues to be impacted by difficult ground conditions, underground production is picking up as mineable face is re-established after successfully developing through the Hex River fault at Bathopele. AISC of R18,323/4Eoz (US$1,006/4Eoz) was 4% lower year-on-year despite inflationary cost pressures on imported spares, steel related products, ammonia-based products, fuel and oil, with by-product credits 25% higher primarily due to 21% higher chrome prices, and royalties 57% lower as a result of lower PGM prices. The Rustenburg operation continues to move down the industry cost curve as a result of exemplary cost management.
PGM production from the Marikana operation for H1 2023 (including third party PoC) increased by 2% to 368,075 4Eoz, primarily due to a 95% increase in third party PoC processed of 49,541 4Eoz. PGM production (excluding PoC) declined by 5% to 318,534 4Eoz due to the combined effect of cable theft and load curtailment. AISC (excluding PoC) increased by 18% for H1 2023 to R22,286/4Eoz (US$1,224/4Eoz) due to lower production, inflationary cost pressures and most notably higher ORD expenditure, which increased by 58% to R987 million (US$54 million), primarily due to the K4 shaft development costs, which prior to March 2022 was classified as project capital. Since K4 commenced stoping and development operations outside the main shaft infrastructure in March 2023, on reef development was expensed in working costs with off reef development capitalised as ORD. Consequently, ORD at K4 increased from R65 million (US$4 million) in H1 2022 to R277 million (US$15 million) in H1 2023. While the K4 project remains in build-up phase, elevated ORD, sustaining and operating costs, coupled with lower ramping up production, will temporarily increase AISC at Marikana. AISC for H1 2023 (including PoC) increased by 13% to R23,012/4Eoz (US$1,264/4Eoz), due to PoC purchase costs which increased by 45% to R1.6 billion (US$88 million), R495 million (US$16 million) higher than for H1 2022 over the same period. Royalties declined by 43% to R278 million (US$15 million) as a result of the lower PGM prices.
The Kroondal operation performed largely in line with plan for H1 2023 with production of 83,516 4Eoz 18% lower than H1 2022 mainly due to planned closure of the Simunye shaft at the end of 2022. Sweeping and vamping operations are now being conducted at the Simunye shaft with excess crews transferring to the Marikana K4 operations to fill vacancies, in a phased manner. Adverse ground conditions at the two shafts (K6 and Bambanani) which are mining through the shear zone increased dilution and reduced the yield. AISC increased by 20% year-on-year to R17,877/4Eoz (US$982/4Eoz), mainly as a result of lower production as well as higher support costs, due to mining through the adverse ground conditions at the shear zone. Overhead costs associated with the Simunye shaft are expected to reduce as crews are transferred to the Marikana K4 project and full closure of Simunye is achieved. By-product credits were 25% lower due to lower chrome production associated with the closure of the Simunye shaft.
Attributable PGM production from Mimosa for H1 2023 of 57,342 4Eoz was in line with H1 2022. The focus at Mimosa has been to optimise the processing plant and recoveries, which has been successful, with the yield increasing in recent periods. Despite the stable production, AISC of US$1,278/4Eoz (R23,264/4Eoz) was 31% higher year-on-year, due to a 47% increase in sustaining capital to US$28 million (R510 million), primarily associated with the processing plant optimisation and construction of a new tailings storage facility (TSF) as the existing TSF is reaching its capacity. The Mimosa Plant optimisation and the new TSF were completed during H1 2023.
PGM production from Platinum Mile for H1 2023 of 25,319 4Eoz was 2% higher than for H1 2022, with steady throughput and recoveries. However, despite general inflationary costs pressures and increased sustaining capital, AISC increased by only 8% to R10,664/4Eoz (US$586/4Eoz). Project capital expenditure was R36 million (US$2 million) for H1 2023 as a result of expenditure on a chrome extraction plant which is planned to produce around 240,000 tonnes of chrome per year and is expected to be commissioned in December 2023. Total capital spend on the project is forecast to be R130 million.
H1 2023 chrome sales of 1,085 kilotonnes (kt) were 18% lower than for H1 2022 due to logistical issues affecting timing of transporting material from the Rustenburg operation as well as lower production from the Marikana and Kroondal operations. Chrome revenue of R2.2 billion (US$122 million) was however 23% higher year-on-year as a result of a 21% year-on-year increase in the average chrome price received to US$287/tonne for H1 2023.
Sibanye-Stillwater Operating and financial results | Six months ended 30 June 2023 9
The K4 project
The project is around 43% complete. Underground infrastructure development and electrical work is progressing well, and surface infrastructure is on track. K4 produced 7,063 4Eoz for H1 2023 with production expected to accelerate during H2 2023 as further ore drawpoints (boxholes) are re-commissioned. Project capital guidance of R920 million (US$51 million) is unchanged for 2023, with R387 million (US$21 million) spent for H1 2023.
SA gold operations
The SA gold operations delivered a significantly improved operating and financial performance for H1 2023, with materially higher production and lower unit costs. This reflects the stabilisation of operations after the production build up during H2 2022, following the industrial action and lockout during H1 2022, which significantly impacted production and unit costs for the period. Normalisation of production in November 2022 secured exposure for the gold operations to the higher gold price and weaker rand during H1 2023, driving a significant financial turnaround by the managed SA gold operations (excluding DRDGOLD), with adjusted EBITDA increasing by R5.4 billion (US$335 million) year-on-year, from an adjusted EBITDA loss of R3.9 billion (US$256 million loss) for H1 2022 to an adjusted EBITDA gain of R1.4 billion (US$79 million) for H1 2023. This turnaround partially offset the impact of substantially lower PGM prices on the Group's profitability, confirming the value of these operations as a hedge against industrial economic downturn with the SA gold operations (including DRDGOLD) accounting for 17% of Group adjusted EBITDA for H1 2023.
Production from the managed SA gold operations (excluding DRDGOLD) for H1 2023 increased by 233% to 10,411kg (334,721oz), with production more reflective of normalised delivery under stable conditions. The period was not without its challenges however, with management having to contend with a significant increase in the frequency and extent of load curtailment which has persisted since the beginning of 2023 and continues to challenge normal operating procedures. The implementation of comprehensive mitigating protocols developed by operational management has proven effective, with load curtailment having little impact on production from the SA gold operations, although negatively impacting operating costs. In addition, elevated seismicity at both Kloof and Driefontein restricted access to high grade panels and resulted in selected loss of certain planned mining areas due to safety considerations, resulting in a number of crews not being able to mine as planned. Production at Beatrix was lower than planned due to disruptions caused by the S189 process. Surface production was also disrupted primarily due to the poor performance of a haulage contractor which led to the hiring of an additional contractor.
AISC (excluding DRDGOLD) declined by 47% year-on-year to R1,113,391/kg (US$1,902/oz), primarily due to the significant increase in H1 2023 gold production and sales from the managed SA gold operations. As mentioned, load curtailment is evident in increased costs associated with higher diesel consumption by installed generators to mitigate the impact of load curtailment on production. Above inflation increases in electricity tariffs (19% tariff increase) and consumables costs, including explosives, support, cyanide, fuel and contractor rates as well as expenditure related to enhanced safety standards in the equipping of mining panels (hydraulic rock prop support increased by 20% year-on-year) also impacted costs.
The benefits of a period of more stable production are evident in the turnaround in the SA gold operations (including DRDGOLD) assisted by record gold prices. The average gold price received for H1 2023 increased by 22% to R1,124,871/kg (US$1,921/oz) compared to H1 2022. Production from the SA gold operations (including DRDGOLD) for H1 2023 of 12,962kg (416,738oz), was 117% higher than for H1 2022, with AISC (including DRDGOLD) of R1,061,477/kg (US$1,813/oz), 31% lower year-on-year. Adjusted EBITDA (including DRDGOLD) increased from negative R3.1billion (US$202 million) for H1 2022 to positive R2.4 billion (US$130 million) for H1 2023.
Capital expenditure (excluding DRDGOLD) increased by 130% year-on-year to R2.7 billion (US$149 million) with ORD 199% higher at R1.4 billion(US$77 million) reflecting the normalisation of operations (H1 2022 had minimal capital expenditure due to the industrial action and lockout) and accelerated development to maintain flexibility, 30% higher sustaining capital of R410 million (US$23 million) and 128% higher project capital due to the ramp-up of activities at the Burnstone project post the 2022 industrial action. Capital expenditure (including DRDGOLD) for H1 2023 increased by 111% to R3.4 billion (US$185 million).
The Driefontein operation produced a strong performance in H1 2023 with gold production of 3,958kg (127,253oz), 166% higher year-on-year. Underground yields for H1 2023 were lower than for the comparable period in 2022 due to an increase in development to restore operational flexibility post the industrial action, resulting in a relative increase in lower grade development material milled and processed. In addition, elevated seismicity at Driefontein 4 and 8 shafts prevented access to several high-grade areas. Underground production of 3,884kg (124,873oz) for H1 2023 was 175% higher year-on-year with surface production of 74kg (2,379oz), 6% lower year-on-year, due to depletion of surface resources as planned. AISC of R1,068,855 (US$1,826/oz) was 37% lower year-on-year due to an 153% increase in gold sold. ORD increased by 202% year-on-year to R760 million (US$42 million).
Underground production from the Kloof operation of 3,579kg (115,067oz) for H1 2023 was 252% higher than for H1 2022, which was impacted by the industrial action. Kloof 4 shaft however continues to be impacted by high seismicity, which further impacted cooling and ventilation constraints, and led to the withdrawal of crews from some high-grade stopes due to safety concerns. Surface production of 207kg (6,655oz) for H1 2023 was 4% higher than for H1 2022 despite the closure of the KP1 plant in December 2022. AISC for H1 2023 of 1,201,379/kg (US$2,052/oz) was 47% lower year-on-year as a result of the increase in production and 185% increase in gold sold. ORD increased by 154% to R470 million (US$26 million) due to the ramp up of development post the H1 2022 industrial action. Project capital at the Kloof 4 deepening project was constrained in H1 2023 to R67 million (US$4 million).
Underground production from the Beatrix operation of 2,027 kg (65,170oz) for H1 2023 was substantially higher than production of 59kg (1,897oz) for H1 2022, due to safety stoppages at the end of 2021, which delayed the return to work in Q1 2022, the suspension of processing to allow remediation of the TSF and the industrial action. Production was 28% lower than for H2 2022 due to the disruption caused by the S189 process and the closure of the higher grade Beatrix 4 shaft in December 2022, which also reflects in a lower underground yield for H1 2023. AISC for H1 2023 decreased by 81% year-on-year to R1,048,556/kg (US$1,791/oz), due to the increase in production and gold sold, as well as the closure of the high cost Beatrix 4 shaft. ORD for H1 2023 increased by 442% to R168 million (US$9 million) due to normalisation of operations compared with the previously mentioned disruptions during H1 2022. Sustaining capital was however 40% lower year-on-year due to the planned closure of Beatrix 4 shaft in Q1 2023.
Gold production from the Cooke surface operation for H1 2023 increased by 60% to 568kg (18,262oz) year-on-year with AISC 9% higher year-on-year on the back of above inflation increases on chemicals and steel balls and higher aggregate purchase costs.
Sibanye-Stillwater Operating and financial results | Six months ended 30 June 2023 10
Gold production from DRDGOLD for H1 2023 decreased by 10% to 2,551kg (82,017oz) with tonnes milled declining by 25% and yield increasing by 21% year-on-year. The decrease in the tonnes milled is a result of load curtailment, the reclamation of final remnant and clean-up of material at operating sites nearing depletion at City Deep and East Rand Gold Operations (Ergo) on the East Rand and at Driefontein 5 at the Far West Gold Recoveries on the West Rand. The increase in yield is associated with higher grade remnant material that is typically encountered during the final stages of reclamation and clean up and the reclamation of high-grade sand material at Ergo. Lower tonnes milled coupled with above inflationary increases in the key consumables of electricity, diesel, steel, reagents and increased security costs as well as additional machine hire costs to enable the reclamation of the final remnant material resulted in operating costs per tonne milled increasing by 38% to R188/tonne (US$10/tonne). Despite this, AISC in H1 2023 only increased by 4% to R837,711/kg (US$1,431/oz) as a result of gold sold only decreasing by 10% year-on-year and sustaining capital 44% lower at R230 million (US13 million). Sustaining capital declined as a result of lower capital spent on the development of new reclamation sites to replace operating sites nearing completion. Project capital increased from R6 million (US$0.4 million) in H1 2022 to R427 million (US$23 million) in H1 2023 due primarily to the development of the 20 MW solar power plant project nearing completion at Ergo. The average rand gold price received by DRDGOLD in H1 2023 increased by 20% year-on-year to R1,114,073/kg (US$1,903/oz) with adjusted EBITDA increasing by 11% to R933 million (US$51 million).
Post H1 2023 the SA gold operations suffered two significant incidents, at Driefontein 5 shaft and Kloof 4 shaft, which will have a significant impact on these operations during H2 2023.
On 12 July 2023, a fire at Driefontein 5 shaft disrupted operations at both Driefontein 1 and 5 shafts. Tragically, Mr Armando Matias (56) a development miner passed away as a result of the fire incident during which he was separated from his team. Our heartfelt condolences are extended to the family, friends and co-workers of our colleague. This incident is being investigated together with the relevant stakeholders and appropriate support has been provided to his family and children. Twenty-four employees were safely rescued from various refuge bays and brought to surface.
Whilst most of the crews at Driefontein 1 were operational by the beginning of August, the Driefontein 5 crews will only be introduced in a phased manner once gasses from the fire have reduced to normal levels and the area is safe to operate in. All workplaces on the 11-raise line have been suspended as a result of the fire and current estimates are that this incident will result in production at D1 and D5 being around 900kg (29,000oz) lower than originally planned.
In a second incident, on 30 July 2023 during a standard safety trial run of the conveyance system at Kloof 4 shaft conducted prior to hoisting employees up the shaft, infrastructure damage occurred when the ascending counterweight to the conveyance encountered an unknown obstruction in the shaft, resulting in a number of ballast plates falling down the shaft. While no injuries occurred as a result of the incident, access via the shaft to underground levels between 39 and 46 levels has been restricted due to damage to the shaft infrastructure. The full impact of the increased seismicity at Kloof 4, combined with constraints on cooling infrastructure and the shaft repairs required to resume operations at 4 shaft is being assessed.
The Burnstone project
The Burnstone project, which was affected by the industrial action during H1 2022, was further impacted by the tragic incident in April 2023, which delayed the completion of the rock handling system by around four months. The Burnstone project is now 59% complete against a budget of 64% as a result of these delays, with the timeline to steady state production delayed from December 2025 to August 2026. The mill refurbishment contract has been awarded and surface infrastructure is advancing. At the end of H1 2023, there were 740 people on site. Project capital guidance has been reduced from R1.95 billion (US$73 million) for 2023 to R1.6 billion (US$89 million) with R819 million (US$45 million) spent in H1 2023.
European region
Sandouville nickel refinery
The Sandouville nickel refinery produced 2,705 tonnes (H1 2022: 3,499 tonnes) of nickel cathode and 788 tonnes of nickel salts for H1 2023 (H1 2022: 1,066 tonnes). Previously reported operational issues at the cathode unit continued during H1 2023, impacting production. Repairs were largely completed during H1 2023, with 50 out of 58 cathode cells operational by the end the period and operational stability and nickel recoveries improving. Further improvements in the operational performance are expected during H2 2023, should this stability be maintained. Production was also impacted by a shortage of key inputs such as carbonates, and nationwide strikes, resulting in 50 cumulative days of lost production. The scheduled annual production shutdown has been scheduled in October 2023 and has been taken into account in estimating H2 2023 production volumes.
The period was also impacted by consistently high input costs since the Russian invasion of Ukraine. Whilst input prices were lower by the end of H1 2023, they still haven’t returned to pre-conflict levels. The nickel-equivalent sustaining cost in H1 2023 was 25% higher year-on-year at US$37,486/tNi (R682,628/tNi) mainly as a result of lower production, above inflation input costs, particularly electricity and gas prices, and higher sustaining capital expenditure on plant maintenance and de-bottlenecking in order to achieve plant stability. This was offset by higher by-product credits of US$6 million (R110 million).
New management appointments during the period have already delivered positive outcomes, with a detailed optimisation study to improve plant performance is underway and completion expected before year-end and will be the basis for a decision on the viability of the refinery in its current product mix. Studies on PGM autocatalyst recycling, battery grade nickel sulphate and battery metals recycling projects, which were the basis for the acquisition of the Sandouville assets, are also scheduled to progress to the next stages before the end of 2023.
The 13% year-on-year decline of the nickel-equivalent average basket price in H1 2023 to US$26,888/tNi (R489,635/tNi) led to a €5 million (R95 million) write down of nickel inventory in H1 2023. In addition, spot cathode premiums have softened since the beginning of the year. The H1 2023 adjusted EBITDA loss was US$35 million (627 million).
Keliber lithium project
The construction of the Keliber lithium refinery commenced in Kokkola, Finland in March 2023.
Sibanye-Stillwater Operating and financial results | Six months ended 30 June 2023 11
Sibanye-Stillwater received the environmental permit for the Rapasaari mine and Päiväneva concentrator from the Regional State Administrative Agency for Western and Inland Finland (AVI), as announced on 6 February 2023. After assessing the 144 permit conditions, submission was made to the Vaasa Administrative Court to request changes to and/or clarification to six of the permit conditions. We also continue to engage and provide information to the court process at Vaasa Administrative Court after two other external appeals were lodged.
As announced on 25 April 2023, the Finnish Minerals Group, which represents and manages the Finnish State’s mining industry investments, confirmed its support for the project, increasing its holding in the Keliber lithium project from 14% to 20% by subscribing for €54 million of the €104 million rights issue.
Key developments in H1 2023
•The commencement of the earthworks for the Keliber lithium refinery (first phase of the Keliber lithium project) on 7 March 2023 with the concrete casting ceremony on 11 May 2023
•The earthworks, foundation and steel frame erection activities are progressing well. To date, several procurement contracts have been signed
•Negotiations to advance the debt financing for the remaining project capital is underway, post the successful conclusion of the €104 million rights issue in April 2023
•Recruitment has proceeded according to plan - with employee headcount reaching 60 people
•About 100 people on site including two main contractors. The preparations for training of the production personnel are ongoing, together with local educational institutes and key systems suppliers
•Exploration drilling progressed well with a total of 77 holes and 17,773 meters drilled at the key exploration target areas during H1 2023, delivering promising results. Regional lithium exploration, including seasonal boulder mapping and till sampling, commenced in June 2023
•Project capital expenditure estimate for the project remains unchanged at €588 million (R11.2 billion). Capital expenditure spent in H1 2023 was €65 million (R1.3 billion) with guidance for 2023 unchanged at €230 million (R4.5 billion)*
* The guidance has been translated where relevant at an average exchange rate of R18.00/US$ and R19.50/€
Australian region
New Century zinc retreatment operation.
Sibanye-Stillwater acquired control of New Century Resources Limited during H1 2023 enhancing the Group's exposure to tailings retreatment and complementing our existing investment in DRDGOLD. The integration of New Century into Sibanye-Stillwater has commenced and is expected to be completed in H2 2023. A feasibility study on Mount Lyell (a previously operated copper mine) in Tasmania is underway and a decision on the option of acquiring 100% of Mt Lyell from Vedanta Resources will be taken prior to its expiry on 5 November 2023.
Production from the New Century zinc tailings reprocessing operation was impacted by adverse weather in March 2023 which resulted in flooding of the operation and the suspension of hydro mining between 3 and 23 March 2023. Mining resumed on 23 March 2023, with normalised production levels reached in mid-April 2023.
Since acquisition, the New Century zinc retreatment operation has produced 24 kilotonnes (kt) of zinc metal (payable) at an AISC of US$2,418/tZn (R44,030/tZn) and sold 27 kilotonnes (kt). As a result of the flood and lower zinc price, New Century's adjusted EBITDA loss was US$28 million (R502 million) since acquisition. New Century spent US$5 million (R90 million) on capital expenditure including US$2 million (R42 million) on sustaining capital and US$3 million (R48 million) on growth projects.
Sibanye-Stillwater Operating and financial results | Six months ended 30 June 2023 12
FINANCIAL REVIEW OF THE SIBANYE-STILLWATER GROUP
For the six months ended 30 June 2023 (H1 2023) compared with the six months ended 30 June 2022 (H1 2022)
The reporting currency for the Group is SA rand (rand) and the functional currency of the US PGM operations is US dollar. Direct comparability of the Group results between the two periods is distorted as the results of the US PGM operations are translated to rand at the average exchange rate, which for H1 2023 was R18.21/US$ or 18% weaker than for H1 2022 (R15.40/US$). The functional currency of the European operations, comprising of Sandouville nickel refinery and the Keliber lithium project, is the euro and the results of Sandouville nickel refinery were translated to rand at the average exchange rate, which for H1 2023 was R19.69/€. Keliber is a project in development phase and project development expenses are capitalised in accordance with the Group’s accounting policies to property, plant and equipment. The functional currency of New Century zinc retreatment operation is the Australian dollar and the results of the New Century zinc retreatment operation were translated to rand at the average exchange rate, which for H1 2023 was R12.40/A$ (average exchange rate for the period from 22 February 2023, the effective date of the acquisition).
Group financial performance
Group revenue for H1 2023 decreased by 14% to R60,568 million (US$3,326 million) mainly due to lower sales volumes at all PGM operations (excluding Marikana and Platinum Mile) and a lower average basket price received by the PGM operations following a further decline in PGM metal prices during H1 2023, partially offset by higher volumes at the SA managed gold operations which was impacted by industrial action during 2022, and higher H1 2023 gold prices received compared to H1 2022. Group cost of sales, before amortisation and depreciation decreased by 4% to R44,938 million (US$2,468 million) mainly due to the lower production volumes at all PGM operations (excluding Rustenburg and Platinum Mile) which were partially offset by above inflation cost increases at the SA gold, SA PGM and US PGM operations and higher volumes at the managed SA gold operations. The decrease in revenue caused Group adjusted EBITDA for H1 2023 to decrease by 37% or R8,414 million (US$689 million) to R14,147 million (US$776 million). The 18% weaker rand relative to the US dollar, partially offset the effect of the lower average basket price at the PGM operations. Group amortisation and depreciation increased by 47% to R4,731 million (US$260 million) mainly due to the increase at the SA gold operations where the industrial action impacted production during H1 2022 and the addition of New Century under the Group's Australian operations which added R569 million (US$31 million) during H1 2023.
The revenue, cost of sales, before amortisation and depreciation, net other cash costs, adjusted EBITDA and amortisation and depreciation are set
out in the table below:
|
|
|
|
|
|
|
|
|
|
|
|
|
|
|
|
|
|
|
|
|
|
|
|
|
|
|
|
|
|
|
|
|
|
|
|
|
|
|
|
|
|
|
|
|
|
|
|
| Figures in million - SA rand |
|
|
|
|
|
|
|
|
|
|
|
|
|
|
|
|
Revenue |
Cost of sales, before amortisation and depreciation |
Net other cash costs |
Adjusted EBITDA |
Amortisation and depreciation |
|
H1 2023 |
H1 2022 |
% Change |
H1 2023 |
H1 2022 |
% Change |
H1 2023 |
H1 2022 |
% Change |
H1 2023 |
H1 2022 |
% Change |
H1 2023 |
H1 2022 |
% Change |
| SA PGM operations |
30,350 |
38,259 |
(21) |
|
(18,133) |
(16,781) |
8 |
|
(423) |
(326) |
30 |
|
11,794 |
21,152 |
(44) |
|
(1,369) |
(1,162) |
18 |
|
| US PGM underground operations |
5,217 |
7,812 |
(33) |
|
(4,166) |
(3,840) |
8 |
|
(75) |
49 |
(254) |
|
976 |
4,021 |
(76) |
|
(1,551) |
(1,422) |
9 |
|
| US PGM Recycling |
7,692 |
16,318 |
(53) |
|
(7,321) |
(15,720) |
(53) |
|
— |
— |
— |
|
371 |
598 |
(38) |
|
(2) |
(2) |
13 |
|
| Managed SA gold operations |
12,419 |
3,361 |
270 |
|
(10,250) |
(6,717) |
53 |
|
(727) |
(590) |
23 |
|
1,442 |
(3,946) |
(137) |
|
(1,059) |
(480) |
121 |
|
| DRDGOLD |
2,842 |
2,620 |
8 |
|
(1,888) |
(1,842) |
2 |
|
(21) |
62 |
(133) |
|
933 |
840 |
11 |
|
(84) |
(97) |
(14) |
|
European region1 |
1,677 |
2,173 |
(23) |
|
(2,329) |
(2,125) |
10 |
|
(11) |
12 |
(192) |
|
(663) |
60 |
(1205) |
|
(97) |
(61) |
59 |
|
Australian region2 |
506 |
— |
100 |
|
(851) |
— |
100 |
|
(157) |
— |
(100) |
|
(502) |
— |
100 |
|
(569) |
— |
100 |
|
Group corporate3 |
(135) |
(164) |
18 |
|
— |
— |
— |
|
(69) |
— |
— |
|
(204) |
(164) |
(24) |
|
— |
— |
— |
|
| Total Group |
60,568 |
70,379 |
(14) |
|
(44,938) |
(47,025) |
(4) |
|
(1,483) |
(793) |
87 |
|
14,147 |
22,561 |
(37) |
|
(4,731) |
(3,224) |
47 |
|
|
|
|
|
|
|
|
|
|
|
|
|
|
|
|
|
|
|
|
|
|
|
|
|
|
|
|
|
|
|
|
|
|
|
|
|
|
|
|
|
|
|
|
|
|
|
|
|
Figures in million - US dollars4 |
|
|
|
|
|
|
|
|
|
|
|
|
|
|
|
|
Revenue |
Cost of sales, before amortisation and depreciation |
Net other cash costs |
Adjusted EBITDA |
Amortisation and depreciation |
|
H1 2023 |
H1 2022 |
% Change |
H1 2023 |
H1 2022 |
% Change |
H1 2023 |
H1 2022 |
% Change |
H1 2023 |
H1 2022 |
% Change |
H1 2023 |
H1 2022 |
% Change |
| SA PGM operations |
1,667 |
2,485 |
(33) |
|
(995) |
(1,090) |
(9) |
|
(23) |
(21) |
10 |
|
649 |
1,374 |
(53) |
|
(76) |
(76) |
— |
|
| US PGM underground operations |
286 |
507 |
(44) |
|
(229) |
(249) |
(8) |
|
(4) |
3 |
(229) |
|
53 |
261 |
(80) |
|
(85) |
(92) |
(8) |
|
| US PGM Recycling |
422 |
1,060 |
(60) |
|
(402) |
(1,021) |
(61) |
|
— |
— |
— |
|
20 |
39 |
(49) |
|
— |
— |
(15) |
|
| Managed SA gold operations |
682 |
218 |
213 |
|
(563) |
(436) |
29 |
|
(40) |
(38) |
5 |
|
79 |
(256) |
(131) |
|
(58) |
(31) |
90 |
|
| DRDGOLD |
156 |
170 |
(8) |
|
(104) |
(120) |
(13) |
|
(1) |
4 |
(129) |
|
51 |
54 |
(6) |
|
(5) |
(6) |
(27) |
|
European region1 |
92 |
141 |
(35) |
|
(128) |
(138) |
(7) |
|
(1) |
1 |
(200) |
|
(37) |
4 |
(1025) |
|
(5) |
(4) |
25 |
|
Australian region2 |
28 |
— |
100 |
|
(47) |
— |
100 |
|
(9) |
— |
(100) |
|
(28) |
— |
100 |
|
(31) |
— |
100 |
|
Group corporate3 |
(7) |
(11) |
36 |
|
— |
— |
— |
|
(4) |
— |
— |
|
(11) |
(11) |
— |
|
— |
— |
— |
|
| Total Group |
3,326 |
4,570 |
(27) |
|
(2,468) |
(3,054) |
(19) |
|
(82) |
(51) |
61 |
|
776 |
1,465 |
(47) |
|
(260) |
(209) |
24 |
|
1 The European region results for the six months ended 30 June 2022 include the results of the Sandouville nickel refinery for the five months since 4 February 2022, the effective date of acquisition
2 The Australian region results for the six months ended 30 June 2023 includes the results of New Century zinc retreatment operation for the four months since 22 February 2023, the effective date of acquisition. Please refer to note 8.1 of the consolidated interim financial statements
3 The effect of the streaming transaction is included under Group Corporate. Please refer to note 14 of the consolidated interim financial statements
4 Convenience translations have been applied to convert the rand Income Statement amounts into US dollars using a foreign exchange rate of R18.21/US$ for H1 2023 and R15.40/US$ for H1 2022
Revenue
Revenue from the SA PGM operations decreased by 21% to R30,350 million (US$1,667 million) due to a 22% lower average rand 4E basket price of R34,006/4Eoz (US$1,867/4Eoz) and a 3% or 27,076 4Eoz decrease in PGMs sold, partially offset by a 95% increase in the sale of third-party purchase of concentrate (PoC) ounces. The decrease in 4Eoz sold was a consequence of lower production volumes.
At the US PGM underground operations revenue decreased by 44% to US$286 million (R5,217 million), mainly due to a 20% decrease in ounces sold, correlated with the lower production achieved, and a 28% decrease in the average 2E basket price to US$1,390, partially offset by the 18% weaker rand. The rand average 2E basket price decreased by 15% to R25,312/2Eoz, combined with the lower sales volumes resulted in a 33% decrease in rand revenue to R5,217 million. Revenue from the US PGM recycling operation decreased by 60% from US$1,060 million (R16,318 million) to US$422
Sibanye-Stillwater Operating and financial results | Six months ended 30 June 2023 13
million (R7,692 million) due to a 6% lower average realised basket price of US$2,735/3Eoz and a 58% decrease in recycled ounces sold. The 18% weaker rand translated into a 53% decrease in recycling revenue to R7,692 million.
Revenue from the managed SA gold operations increased by 270% to R12,419 million (US$682 million) mainly due to higher volumes since H1 2022 production was impacted by the industrial action and H1 2023 experienced a 23% higher rand gold price of R1,127,372/kg (US$1,926/oz). Revenue from DRDGOLD increased by 8% to R2,842 million (US$156 million) due to a 20% higher rand gold price received of R1,114,073/kg (US$1,903/oz), partially offset by 10% lower sales volumes.
At the European region, revenue from the Sandouville nickel refinery decreased by 23% to R1,677 million (US$92 million), mainly due to a 25% decrease in total nickel sold correlated with the lower production, partially offset by a 3% higher nickel equivalent basket price of R489,635/tNi (US$26,888/tNi).
At the Australian region, since acquisition the New Century zinc retreatment operation sold 27 kilotonnes of zinc metal (payable) in concentrate at an average equivalent zinc concentrate price of R29,871/zinc tonne (ztn) (US$1,640/ztn), generating revenue of R506 million (US$28 million).
Cost of sales, before amortisation and depreciation
Cost of sales, before amortisation and depreciation at the SA PGM operations increased by 8% to R18,133 million (US$995 million) mainly due to above inflation cost increases on electricity, imported spares and fuel. Mined underground 4E PGM production decreased by 4% to 667,571 4Eoz due to copper theft, load curtailment, reduced productivity when mining in areas with adverse ground conditions and engineering disruptions. Surface production volumes excluding third-party PoC were 3% higher at 74,269 4Eoz. Third-party PoC at the Marikana smelting and refining operations increased by 95% to 49,541 4Eoz. PoC material is purchased at a higher cost, than own mined ore, due to the direct correlation to the basket price of PGM’s.
Cost of sales, before amortisation and depreciation at the US PGM underground operations decreased by 8% to US$229 million (R4,166 million). Sales volumes decreased by 20% to 190,637 2Eoz with production volumes decreasing by 11% to 205,513 2Eoz. Production was impacted at Stillwater mine due to hoist outages arising from structural damage suffered to the shaft which accesses the deeper levels of the mine, rehabilitation paste plan delays and equipment availability. East Boulder was mainly impacted by low ore grades, labour shortages and low head grade impacted by mining the periphery of the ore body. Cost of sales, before amortisation and depreciation at the US PGM recycling operation decreased, in line with revenue, by 61% from US$1,021 million (R15,720 million) to US$402 million (R7,321 million) due to the industry wide global slowdown of autocatalyst recycling market which started in the second quarter of 2022 and continued to affect receipt rates of spent autocatalysts at the US PGM recycling operation.
Cost of sales, before amortisation and depreciation at the managed SA gold operations increased by 53% to R10,250 million (US$563 million) mainly due to 233% or 7,283kg higher production post the impact of the industrial action during H1 2022. Additionally, above average inflationary increases in electricity, explosives and support consumables costs, and higher overtime due to additional production shifts worked to minimise the impact of production stoppages also contributed towards the increase in cost of sales, before amortisation and depreciation. Cost of sales, before amortisation and depreciation from DRDGOLD increased by 2% to R1,888 million (US$104 million) due to above inflationary cost increases including steel, diesel and electricity.
Cost of sales, before amortisation and depreciation at the Sandouville nickel refinery increased by 10% to R2,329 million (US$128 million) mainly due to higher maintenance costs, higher raw material inventory valuation adjustment caused by lower market prices and once-off fixed costs. Production was 23% lower at the Sandouville refinery mainly due to the lack of metal electrolysis capacity at the cathode plant, protests in France and carbonate supply constraints, which together resulted in the loss of approximately 50 production days.
At the Australian region, the New Century zinc retreatment operation produced 24 kilotonnes of zinc metal (payable) since acquisition, at an all-in sustaining cost of R44,030/ztn (US$2,418/ztn), contributing R851 million (US$47 million) to cost of sales.
Adjusted EBITDA
Adjusted EBITDA includes other cash costs, care and maintenance costs; lease payments; strike costs and corporate social investment costs (refer note 9.1 of the consolidated interim financial statements for a reconciliation of profit before royalties, carbon tax and tax to adjusted EBITDA). Care and maintenance costs for H1 2023 were R438 million (US$24 million) at Cooke (H1 2022: R303 million or US$20 million), R225 million (US$12 million) at Beatrix (H1 2022: R3 million or US$0 million), R71 million (US$4 million) at Kloof (H1 2022: R0 million or US$0 million), R1 million (US$0 million) at DRDGOLD (H1 2022: R2 million or US$0 million), R44 million (US$2 million) at Marikana (H1 2022: R44 million or US$3 million) and R5 million (US$0 million) at Kroondal (H1 2022: R6 million or US$0 million). Care and maintenance costs increased during H1 2023 at Cooke due to additional security to prevent vandalism and the preparation costs for the plug installation at Cooke 1 shaft, at Beatrix due to the closure of Beatrix 4 shaft in December 2022 and at Kloof due to the closure of the Kloof 1 plant and 3 shaft. Lease payments of R123 million (US$7 million) (H1 2022: R89 million or US$6 million) are included in line with the debt covenant formula and corporate social investment costs were R63 million (US$3 million) (H1 2022: R160 million (US$10 million).
Adjusted EBITDA at the SA PGM, US PGM (underground) and US PGM (recycling) operations, decreased due to the lower average PGM basket prices received and a decrease in sales volumes stemming from lower production. Adjusted EBITDA at the SA gold operations increased significantly due to a higher average gold price and higher production and sales volumes during H1 2023 following the impact of the three-month industrial action on production during H1 2022. Adjusted EBITDA at the Sandouville nickel refinery decreased compared to H1 2022, mainly due to lower sales and production volumes, partially offset by a higher rand nickel equivalent average basket price due to an 18% weaker rand. The New Century zinc retreatment operation generated an adjusted EBITDA loss of R502 million (US$28 million).
Sibanye-Stillwater Operating and financial results | Six months ended 30 June 2023 14
Adjusted EBITDA is shown in the graph below:
Amortisation and depreciation
Amortisation and depreciation at the SA PGM operations increased by 18% to R1,369 million (US$76 million) in line with higher progressive capital expenditure at the underground operations, partially offset by lower production volumes. Amortisation and depreciation at the US PGM operations decreased by 8% to US$85 million (R1,551 million), due to lower production volumes. Amortisation and depreciation at the managed SA gold operations increased by 121% to R1,059 million (US$58 million) mainly due to significantly higher production in H1 2023, whereas the amortisation and depreciation of DRDGOLD decreased by 14% to R84 million (US$5 million) due to lower tonnes processed and the increase in the useful life of the Ergo operation from 1 July 2022. Amortisation and depreciation at the New Century zinc retreatment operation for H1 2023 was R569 million (US$31 million) and accounted for approximately 38% of the increase in the Group's amortisation and depreciation for H1 2023.
Interest income
Interest income increased by R129 million (US$1 million) to R718 million (US$39 million) mainly due to an increase in interest received on higher average cash balances (increase: R236 million or US$10 million), interest received on rehabilitation funds (increase: R22 million or US$0 million) and interest received on rehabilitation guarantees (increase: R33 million or US$2 million), partially offset by a decrease in interest on other financial assets.
Finance expense
Finance expense increased by R222 million (US$2 million decrease) to R1,684 million (US$93 million) mainly due to a R44 million (US$3 million decrease) net increase in interest on borrowings, R55 million (US$2 million) increase in the unwinding of amortised cost on borrowings, R33 million (US$1 million) increase in the unwinding of the Marikana dividend obligation, R70 million (US$1 million) increase in unwinding of the environmental rehabilitation obligation, R19 million (US$0 million) increase in the unwinding of the finance costs on the deferred revenue transactions, R4 million (US$0 million) increase in unwinding of interest on lease liabilities and R91 million (US$4 million decrease) increase in other interest, all partially offset by decreases of R5 million (US$1 million) in interest on the occupational healthcare obligation and R89 million (US$7 million) in interest unwinding on the Rustenburg deferred payment to Anglo American Platinum Limited (Anglo). Refer to note 3 of the consolidated interim financial statements for a breakdown of finance expenses.
Gain on financial instruments
The net gain on financial instruments of R371 million (US$20 million) for H1 2023 compared with the loss of R399 million (US$26 million) for H1 2022, represents a period-on-period net gain of R770 million (US$46 million). The net gain for H1 2023 is mainly attributable to fair value gains on hedge contracts for zinc R623 million (US$34 million), palladium R72 million (US$4 million) and gold R44 million (US$2 million), the gain on the Marikana dividend obligation of R11 million (US$1 million), fair value gains on investments of R102 million (US$6 million) and gains on other financial instruments of R9 million (US$0 million), partially offset by fair value losses on the revised cash flows of the Rustenburg and Marikana operations' BEE cash-settled share-based payment obligations and the Rustenburg deferred payment to Anglo of R486 million (US$27 million) and R4 million (US$0 million) respectively. Refer to note 4 of the consolidated interim financial statements for a breakdown of the gain on financial instruments.
Mining and income tax
The mining and income tax expense decreased by 50% to R2,804 million (US$154 million) which is attributable to the Group’s decreased profitability. The current tax expense decreased by 52% to R2,390 million (US$131 million) and the deferred tax expense decreased in H1 2023 by 40% to R414 million (US$23 million). The effective tax rate of the Group decreased from 31% to 26% in H1 2023 mainly due to a higher balance deferred tax assets not recognised during H1 2022 and a larger positive impact on the deferred tax expense during H1 2023 of changes in the estimated deferred tax rate.
The Group’s effective tax rate for H1 2023 is 1% lower than the South African statutory company tax rate of 27%. The lower effective tax rate is mainly attributable to the impact of the following: decrease due to a change in the estimated long-term deferred tax rate of 7% or R741 million
Sibanye-Stillwater Operating and financial results | Six months ended 30 June 2023 15
(US$41 million), decrease due to a rate adjustment to the South African gold mining tax formula of 2% or R189 million (US$10 million) and non-taxable share of results of equity accounted investees of 1% or R71 million (US$4 million), partially offset by net unrecognised deferred tax assets of 4% or R396 million (US$22 million), non-deductible finance expense of 1% or R85 million (US$5 million), non-deductible loss on fair value of financial instruments of 1% or R140 million (US$8 million) and net other non-taxable income and non-deductible expenditure of 2% or R262 million (US$14 million).
Non-recurring items
Restructuring costs
Restructuring costs credit of R174 million (US$10 million) for H1 2023 mainly relates to a net reversal of S189 retrenchment costs of R195 million (US$11 million) mainly due to a reduction in the number of employees taking voluntary separation packages following natural attrition and reassignment of employees at Beatrix: R181 million (US$10 million) and Kloof: R14 million (US$1 million), partially offset by retrenchments for the period at Driefontein: R2 million (US$0 million), Protection Services: R2 million (US$0 million), Health: R2 million (US$0 million), Kroondal: R5 million (US$0 million), Rustenburg: R6 million (US$0 million) and Marikana: R4 million (US$0 million).
Transaction costs
Transaction costs of R80 million (US$4 million) for H1 2023 consisted of legal and advisory fees for New Century of R18 million (US$1 million), ioneer of R8 million (US$0 million) and Keliber of R1 million (US$0 million), and general legal and advisory fees R53 million (US$3 million).
Borrowing and net debt
Gross debt increased by 11% from R22,728 million (US$1,335 million) at 31 December 2022 to R25,312 million (US$1,343 million) at 30 June 2023. The increase in outstanding debt was due to a net increase of R2,457 million (US$130 million) on US dollar denominated debt due to a weaker rand since 31 December 2022. Net debt, excluding the Burnstone Debt which has no recourse to Sibanye-Stillwater, was R262 million (US$14 million) at 30 June 2023. The Group’s cash balance (excluding cash of Burnstone) decreased by 15% to R22,119 million (US$1,173 million) since 31 December 2022, and includes US$397 million (R7,482 million) held by the US PGM operations. Refer to note 9 of the consolidated interim financial statements for a roll forward of the gross debt for the six months ended 30 June 2023.
The Group’s total equity increased to R100,164 million (US$5,309 million) at 30 June 2023 due to total comprehensive income of R13,831 million (US$225 million) for the six months ended 30 June 2023, business combination on the acquisition of New Century Resources Limited (New Century) (R919 million or US$50 million), transactions with Keliber shareholders (R1,097 million or US$59 million) and equity settled share based payments (R40 million or US$2 million). These increases were partially offset by dividends paid of R3,539 million (US$195 million), transactions with New Century shareholders (R906 million or US$49 million) and the recognition of the Keliber dividend obligation (R792 million or US$43 million).
The graph below illustrates the Group's Gross Debt/Cash/Total Equity for H1 2023, H2 2022 and H1 2022:
Purchase of concentrate (PoC)
The Marikana operation has agreements in place to purchase concentrates from third parties. The processing of third party material allows better utilisation of smelting and refining capacity. During H2 2022 the Marikana operation purchased 49,541 4Eoz (H1 2022: 25,346 4Eoz) in concentrate from third parties.
US PGM recycling
The US PGM recycling operation continued to experience low delivery rates during H1 2023 impacted by the industry wide global slowdown of the autocatalyst recycling market which commenced in the second quarter of 2022. Inventory continues to remain below normalised levels and the segment continues to focus on various initiatives to increase volumes. Working capital for H1 2023 decreased from US$258 million (R4,394 million) at 31 December 2022 to US$178 million (R3,355 million) at 30 June 2023 and the segment continues to remain self-funded with no lines of credit drawn. At 30 June 2023, recycling inventory approximated 27 tonnes (H2 2022: 49 tonnes) containing an estimated 2koz (3E) (H2 2022: 5koz (3E)). The graph below, in relation to the average basket price for purchased 3E PGM content of spent autocatalyst, indicates the quarterly cash advances (on receipt of spent catalysts) and final payment (on final assay) to recycle suppliers, and the cash receipts when the 3E PGM metal is outturned, illustrating the 31% decrease in recycle working capital from 1 January 2023 to 30 June 2023.
Sibanye-Stillwater Operating and financial results | Six months ended 30 June 2023 16
Adjusted EBITDA of the US PGM recycling operation decreased by 49% to US$20 million (R371 million) for H1 2023 converting into a 22% (H1 2022: 15%) annualised adjusted EBITDA return on the closing balance recycle working capital.
Cash flow analysis
Sibanye-Stillwater defines adjusted free cash flow as net cash from operating activities, before dividends paid, net interest paid and deferred revenue advance received, less additions to property, plant and equipment.
The following table shows the adjusted free cash flow per operating segment:
|
|
|
|
|
|
|
|
|
|
|
|
|
|
|
|
|
|
|
|
| Figures in million - SA rand |
|
Six months ended |
|
|
H1 2023 |
H2 2022 |
H1 2022 |
| US PGM operations |
|
(1,324) |
3,179 |
1,405 |
| SA PGM operations |
|
2,297 |
2,343 |
11,156 |
SA gold operations1 |
|
46 |
1,733 |
(7,744) |
| European operations |
|
(2,511) |
(1,155) |
(662) |
| Australian operation |
|
(665) |
— |
— |
| Group corporate |
|
(379) |
(313) |
(433) |
Adjusted free cash flow2 |
|
(2,536) |
5,787 |
3,722 |
1Included in the adjusted free cash flow of the SA gold segment is the Group treasury and shared services function, together referred to as gold corporate. The SA PGM operations, through the
intercompany working capital accounts which eliminate on consolidation, contributed R1,349 million (US$74 million) during H1 2023 (H1 2022: R2,545 million or US$165 million received from the SA gold operations) to the working capital decrease (inflow) included in the SA gold and US PGM operations
2 Adjusted free cash flow, defined above and reconciled below, is not a measure of performance under IFRS. As a result, it should not be considered in isolation or as alternatives to any other measure of financial performance presented in accordance with IFRS. Non-IFRS measures are the responsibility of the Board
The US PGM operations generated negative adjusted free cash flow of US$73 million (R1,324 million). Net cash inflow from operating activities amounted to US$88 million (R1,606 million) and includes a net decrease (inflow) of US$32 million (R582 million) in working capital which was mainly attributable to the decrease in recycle inventory, a net decrease (inflow) of US$3 million (R46 million) in intercompany working capital accounts and taxes paid of US$9 million (R163 million). The adjusted free cash flow includes additions to property, plant and equipment of US$183 million (R3,333 million).
Adjusted free cash flow from the SA PGM operations was R2,297 million (US$126 million). Net cash inflow from operating activities amounted to R3,727 million (US$205 million) and includes a net decrease (inflow) of R494 million (US$27 million) in working capital, payments of R2,010 million (US$110 million) towards royalty and income taxes, dividends paid of R1,825 million (US$100 million), additional deferred consideration paid of R3,732 million (US$205 million) and after a net increase (outflow) of R1,349 million (US$74 million) in the intercompany working capital accounts. The adjusted free cash flow includes additions to property, plant and equipment of R2,684 million (US$147 million).
The SA gold operations generated adjusted free cash flow of R46 million (US$3 million). Net cash inflow from operating activities amounted to R5,167 million (US$284 million) and includes a net decrease (inflow) of R242 million (US$13 million) in working capital, a net decrease (inflow) of R1,298 million (US$71 million) in intercompany working capital accounts, net dividends received of R1,739 million (US$95 million) and payments of R277 million (US$15 million) towards royalty and income taxes. The adjusted free cash flow includes additions to property, plant and equipment of R3,522 million (US$194 million).
The European operations, which comprise the Sandouville nickel refinery and the Keliber lithium project which is in project development phase, generated negative adjusted free cash flow of R2,511 million (US$138 million). Net cash outflow from operating activities amounted to R1,359 million (US$75 million) after a net increase (outflow) of R521 million (US$29 million) in working capital, payments of R16 million (US$1 million) towards royalty and income taxes and after a net increase (outflow) of R10 million (US$1 million) in the intercompany working capital accounts. The adjusted free cash flow includes additions to property, plant and equipment of R1,225 million (US$67 million) of which R1,130 million (US$62 million) relates to capital expenditure on the Keliber project.
The Australian operation (New Century zinc retreatment operation) generated negative adjusted free cash flow of R665 million (US$37 million). Net cash outflow from operating activities amounted to R323 million (US$18 million) after a net decrease (inflow) of R155 million (US$9 million) in working capital, payments of R1 million (US$0 million) towards royalties. The adjusted free cash flow includes additions to property, plant and equipment of R89 million (US$5 million).
Group corporate’s negative adjusted free cash flow was R379 million (US$20 million). Net cash outflow from operating activities amounted to R3,836 million (US$210 million) and includes a net decrease (inflow) of R15 million (US$1 million) in the intercompany working capital accounts.
Sibanye-Stillwater Operating and financial results | Six months ended 30 June 2023 17
The following table shows a reconciliation from net cash from operating activities to adjusted free cash flow:
|
|
|
|
|
|
|
|
|
|
|
|
|
|
|
|
|
|
|
|
| Figures in million - SA rand |
|
Six months ended |
|
|
H1 2023 |
H2 2022 |
H1 2022 |
| Net cash from operating activities |
|
4,943 |
11,154 |
4,389 |
| Adjusted for: |
|
|
|
|
| Dividends paid |
|
3,539 |
4,075 |
5,378 |
| Net interest paid |
|
135 |
313 |
123 |
| Deferred revenue advance received |
|
(299) |
— |
(24) |
| Less: |
|
|
|
|
| Additions to property, plant and equipment |
|
(10,854) |
(9,755) |
(6,144) |
| Adjusted free cash flow |
|
(2,536) |
5,787 |
3,722 |
Adjusted free cash flow, defined and reconciled above, is not a measure of performance under IFRS. As a result, it should not be considered in isolation or as alternatives to any other measure of financial performance presented in accordance with IFRS. Non-IFRS measures are the responsibility of the Board
Cash and cash equivalents at 30 June 2023 decreased to R22,159 million (US$1,176 million) from R26,076 million (US$1,531 million) at 31 December 2022), after net cash from operating activities of R4,943 million (US$272 million) (H1 2022: R4,389 million or US$285 million), net cash used in investing activities of R10,379 million (US$570 million) (H1 2022: R7,524 million or US$488 million) and net cash used in financing activities of R23 million (US$1 million) (H1 2022: R73 million or US$5 million).
DIVIDEND DECLARATION
The Sibanye-Stillwater board of directors has declared and approved a cash dividend of 53 SA cents per ordinary share (2.7983 US cents* per share or US 11.1932 cents* per ADR) or approximately R1,500 million (US$79 million*) in respect of the six months ended 30 June 2023 (Interim dividend). The Board applied the solvency and liquidity test and reasonably concluded that the company will satisfy that test immediately after completing the proposed distribution.
Sibanye-Stillwater’s dividend policy is to return between 25% to 35% of normalised earnings to shareholders and after due consideration of future requirements the dividend may be increased beyond these levels.
Normalised earnings is defined as earnings attributable to the owners of Sibanye-Stillwater excluding gains and losses on financial instruments and foreign exchange differences, impairments, gain/loss on disposal of property, plant and equipment, occupational healthcare expenses, restructuring costs, transactions costs, share-based payment expenses on BEE transactions, gain on acquisitions, net other business development costs, share of results of equity-accounted investees, all after tax and the impact of non-controlling interest, and changes in estimated deferred tax rate.
The interim dividend declared of 53 SA cents (H1 2022: 138 cents) equates to 35% of normalised earnings for the period ended June 2023.
The interim dividend will be subject to the Dividends Withholding Tax. In accordance with paragraphs 11.17 of the JSE Listings Requirements the following additional information is disclosed:
•The dividend has been declared out of income reserves;
•The local Dividends Withholding Tax rate is 20% (twenty per centum);
•The gross local dividend amount is 53.00000 SA cents per ordinary share for shareholders exempt from the Dividends Tax;
•The net local dividend amount is 42.40000 SA cents (80% of 53 SA cents) per ordinary share for shareholders liable to pay the Dividends Withholding Tax;
•Sibanye-Stillwater currently has 2,830,567,264 ordinary shares in issue; and
•Sibanye-Stillwater’s income tax reference number is 9723 182 169.
Shareholders are advised of the following dates in respect of the final dividend:
Interim dividend: 53 SA cents per share
Declaration date: Tuesday, 29 August 2023
Last date to trade cum dividend: Tuesday, 19 September 2023
Shares commence trading ex-dividend: Wednesday, 20 September 2023
Record date: Friday, 22 September 2023
Payment of dividend: Tuesday, 26 September 2023
Please note that share certificates may not be dematerialised or rematerialised between Wednesday, 20 September 2023 and Friday, 22 September 2023 both dates inclusive.
To holders of American Depositary Receipts (ADRs):
•Each ADR represents 4 ordinary shares;
•ADRs trade ex-dividend on the New York Stock Exchange (NYSE): Thursday, 21 September 2023;
•Record date: Friday, 22 September 2023;
•Approximate date of currency conversion: Tuesday, 27 September 2023; and
•Approximate payment date of dividend: Tuesday, 10 October 2023
Assuming an exchange rate of R18.9400/US$1*, the dividend payable on an ADR is equivalent to 8.9546 US cents for Shareholders liable to pay dividend withholding tax. However, the actual rate of payment will depend on the exchange rate on the date for currency conversion.
* Based on an exchange rate of R18.9400/US$ at 22 August 2023 from EquityRT. However, the actual rate of payment will depend on the exchange rate on the date for currency conversion
MINERAL RESOURCES AND MINERAL RESERVES
Other than disclosed below, there were no material changes to the Mineral Resources and Mineral Reserves from what was previously reported by the Group at 31 December 2022.
•The loss of high grade mining panels due to seismicity, restrictions due to ventilation and cooling constraints, compounded by the 30 July 2023 Kloof 4 shaft incident, have the potential to materially impact the Mineral Resources and Mineral Reserves of the larger Kloof operation. Management is in the process of assessing the impact of the incident on the Kloof operation and life-of-mine production profile
•On 22 February 2023, Sibanye-Stillwater obtained control over New Century Resources Limited through the on-market purchase of shares and by 30 June 2023, through an off-market takeover offer, acquired the remaining shares to now hold 100% of the issued shares of New Century Resources Limited. The disclosure information provided for New Century at 31 December 2022, apart from the attributable component, also included the 100% basis, which would be fully attributable to the Group going forward
Sibanye-Stillwater Operating and financial results | Six months ended 30 June 2023 18
CHANGE IN BOARD OF DIRECTORS
There was no change to the Board of Sibanye Stillwater Limited during the six month period ended 30 June 2023.
Sibanye-Stillwater Operating and financial results | Six months ended 30 June 2023 19
SALIENT FEATURES AND COST BENCHMARKS - SIX MONTHS
US and SA PGM operations
|
|
|
|
|
|
|
|
|
|
|
|
|
|
|
|
|
|
|
|
|
|
|
|
|
|
|
|
|
|
|
|
|
|
|
|
|
|
|
|
|
|
|
|
|
|
|
|
|
|
|
|
|
|
US and SA PGM operations1 |
US PGM operations |
Total SA PGM operations1 |
Rustenburg |
Marikana1 |
Kroondal |
Plat Mile |
Mimosa |
|
|
|
Under-
ground2
|
Total |
Under-
ground |
Surface |
Under-
ground |
Surface |
Under-
ground |
Surface |
Attribu-table |
Surface |
Attribu-table |
| Production |
|
|
|
|
|
|
|
|
|
|
|
|
|
|
| Tonnes milled/treated |
kt |
Jun 2023 |
18,211 |
|
569 |
|
17,642 |
|
8,070 |
|
9,573 |
|
2,984 |
|
2,649 |
|
2,993 |
|
1,729 |
|
1,413 |
|
5,194 |
|
680 |
|
|
|
Dec 2022 |
18,867 |
|
527 |
|
18,339 |
|
8,532 |
|
9,807 |
|
3,065 |
|
2,803 |
|
3,175 |
|
1,818 |
|
1,604 |
|
5,186 |
|
687 |
|
|
|
Jun 2022 |
18,932 |
|
627 |
|
18,305 |
|
8,459 |
|
9,846 |
|
2,972 |
|
2,807 |
|
3,140 |
|
1,880 |
|
1,647 |
|
5,159 |
|
700 |
|
| Plant head grade |
g/t |
Jun 2023 |
2.29 |
|
12.37 |
|
1.96 |
|
3.29 |
|
0.84 |
|
3.36 |
|
1.04 |
|
3.66 |
|
0.92 |
|
2.25 |
|
0.72 |
|
3.49 |
|
|
|
Dec 2022 |
2.26 |
|
12.43 |
|
1.97 |
|
3.29 |
|
0.82 |
|
3.33 |
|
1.05 |
|
3.66 |
|
0.87 |
|
2.36 |
|
0.67 |
|
3.52 |
|
|
|
Jun 2022 |
2.31 |
|
12.58 |
|
1.96 |
|
3.26 |
|
0.84 |
|
3.27 |
|
1.03 |
|
3.67 |
|
0.86 |
|
2.33 |
|
0.72 |
|
3.53 |
|
| Plant recoveries |
% |
Jun 2023 |
75.07 |
|
91.00 |
|
71.89 |
|
84.93 |
|
28.73 |
|
86.20 |
|
41.34 |
|
86.95 |
|
24.10 |
|
81.71 |
|
21.06 |
|
75.12 |
|
|
|
Dec 2022 |
75.43 |
|
90.31 |
|
72.67 |
|
84.89 |
|
30.00 |
|
86.29 |
|
43.20 |
|
86.86 |
|
25.83 |
|
82.51 |
|
21.09 |
|
74.52 |
|
|
|
Jun 2022 |
74.95 |
|
90.47 |
|
71.48 |
|
84.79 |
|
27.11 |
|
86.58 |
|
36.96 |
|
87.00 |
|
24.87 |
|
82.12 |
|
20.77 |
|
72.45 |
|
| Yield |
g/t |
Jun 2023 |
1.72 |
|
11.26 |
|
1.41 |
|
2.79 |
|
0.24 |
|
2.90 |
|
0.43 |
|
3.18 |
|
0.22 |
|
1.84 |
|
0.15 |
|
2.62 |
|
|
|
Dec 2022 |
1.71 |
|
11.23 |
|
1.43 |
|
2.79 |
|
0.25 |
|
2.87 |
|
0.45 |
|
3.18 |
|
0.22 |
|
1.95 |
|
0.14 |
|
2.62 |
|
|
|
Jun 2022 |
1.73 |
|
11.38 |
|
1.40 |
|
2.76 |
|
0.23 |
|
2.83 |
|
0.38 |
|
3.19 |
|
0.21 |
|
1.91 |
|
0.15 |
|
2.56 |
|
PGM production3 |
4Eoz - 2Eoz |
Jun 2023 |
1,004,695 |
|
205,513 |
|
799,182 |
|
724,913 |
|
74,269 |
|
277,846 |
|
36,625 |
|
306,209 |
|
12,325 |
|
83,516 |
|
25,319 |
|
57,342 |
|
|
|
Dec 2022 |
1,034,752 |
|
191,094 |
|
843,658 |
|
766,087 |
|
77,571 |
|
283,148 |
|
40,877 |
|
324,518 |
|
13,136 |
|
100,441 |
|
23,558 |
|
57,980 |
|
|
|
Jun 2022 |
1,053,845 |
|
230,039 |
|
823,806 |
|
751,717 |
|
72,089 |
|
270,515 |
|
34,357 |
|
322,333 |
|
12,930 |
|
101,315 |
|
24,802 |
|
57,554 |
|
PGM sold4 |
4Eoz - 2Eoz |
Jun 2023 |
1,008,686 |
|
190,637 |
|
818,049 |
|
|
|
250,340 |
|
37,027 |
|
368,923 |
83,516 |
|
25,319 |
|
52,924 |
|
|
|
Dec 2022 |
995,750 |
|
180,356 |
|
815,394 |
|
|
|
287,512 |
|
35,639 |
|
312,517 |
100,441 |
|
23,558 |
|
55,727 |
|
|
|
Jun 2022 |
1,084,907 |
|
238,200 |
|
846,707 |
|
|
|
266,589 |
|
35,054 |
|
364,441 |
101,315 |
|
24,802 |
|
54,506 |
|
Price and costs5 |
|
|
|
|
|
|
|
|
|
|
|
|
|
Average PGM basket price6 |
R/4Eoz - R/2Eoz |
Jun 2023 |
32,245 |
|
25,312 |
|
34,006 |
|
|
|
34,487 |
|
27,476 |
|
34,290 |
35,394 |
|
29,077 |
|
29,083 |
|
|
|
Dec 2022 |
39,966 |
|
30,609 |
|
42,188 |
|
|
|
43,092 |
|
32,789 |
|
42,228 |
44,781 |
|
33,776 |
|
33,348 |
|
|
|
Jun 2022 |
40,240 |
|
29,799 |
|
43,379 |
|
|
|
44,640 |
|
29,326 |
|
43,595 |
46,368 |
|
34,311 |
|
33,418 |
|
|
US$/4Eoz - US$/2Eoz |
Jun 2023 |
1,771 |
|
1,390 |
|
1,867 |
|
|
|
1,894 |
|
1,509 |
|
1,883 |
1,944 |
|
1,597 |
|
1,597 |
|
|
|
Dec 2022 |
2,306 |
|
1,766 |
|
2,434 |
|
|
|
2,487 |
|
1,892 |
|
2,437 |
2,584 |
|
1,949 |
|
1,924 |
|
|
|
Jun 2022 |
2,613 |
|
1,935 |
|
2,817 |
|
|
|
2,899 |
|
1,904 |
|
2,831 |
3,011 |
|
2,228 |
|
2,170 |
|
Operating cost7,8 |
R/t |
Jun 2023 |
1,140 |
|
6,994 |
|
944 |
|
|
|
2,038 |
|
196 |
1,573 |
1,183 |
|
59 |
|
1,692 |
|
|
|
Dec 2022 |
1,091 |
|
7,687 |
|
894 |
|
|
|
1,905 |
|
290 |
|
1,411 |
1,103 |
|
60 |
|
1,524 |
|
|
|
Jun 2022 |
1,007 |
|
6,073 |
|
827 |
|
|
|
1,832 |
|
191 |
|
1,326 |
998 |
|
53 |
|
1,247 |
|
|
US$/t |
Jun 2023 |
63 |
|
384 |
|
52 |
|
|
|
112 |
|
11 |
|
86 |
65 |
|
3 |
|
93 |
|
|
|
Dec 2022 |
63 |
|
444 |
|
52 |
|
|
|
110 |
|
17 |
|
81 |
64 |
|
3 |
|
88 |
|
|
|
Jun 2022 |
65 |
|
394 |
|
54 |
|
|
|
119 |
|
12 |
|
86 |
65 |
|
3 |
|
81 |
|
|
R/4Eoz - R/2Eoz |
Jun 2023 |
21,098 |
|
19,356 |
|
21,580 |
|
|
|
21,883 |
|
14,198 |
|
23,326 |
20,020 |
|
12,125 |
|
20,073 |
|
|
|
Dec 2022 |
20,304 |
|
21,220 |
|
20,081 |
|
|
|
20,618 |
|
19,889 |
|
20,873 |
17,612 |
|
13,117 |
|
18,075 |
|
|
|
Jun 2022 |
18,430 |
|
16,554 |
|
18,994 |
|
|
|
20,128 |
|
15,601 |
|
19,850 |
16,217 |
|
11,088 |
|
15,168 |
|
|
US$/4Eoz - US$/2Eoz |
Jun 2023 |
1,159 |
|
1,063 |
|
1,185 |
|
|
|
1,202 |
|
780 |
|
1,281 |
1,099 |
|
666 |
|
1,102 |
|
|
|
Dec 2022 |
1,172 |
|
1,224 |
|
1,159 |
|
|
|
1,190 |
|
1,148 |
|
1,204 |
1,016 |
|
757 |
|
1,043 |
|
|
|
Jun 2022 |
1,197 |
|
1,075 |
|
1,233 |
|
|
|
1,307 |
|
1,013 |
|
1,289 |
1,053 |
|
720 |
|
985 |
|
Adjusted EBITDA Margin8,9 |
% |
Jun 2023 |
|
19 |
|
39 |
|
|
|
40 |
43 |
24 |
|
15 |
|
35 |
|
|
|
Dec 2022 |
|
38 |
|
51 |
|
|
|
52 |
51 |
53 |
|
28 |
|
46 |
|
|
|
Jun 2022 |
|
51 |
|
55 |
|
|
|
56 |
55 |
59 |
|
34 |
|
61 |
|
All-in sustaining cost8,10 |
R/4Eoz - R/2Eoz |
Jun 2023 |
22,301 |
|
31,633 |
|
19,716 |
|
|
|
18,323 |
22,286 |
17,877 |
|
10,664 |
|
23,264 |
|
|
|
Dec 2022 |
22,671 |
|
31,880 |
|
20,431 |
|
|
|
20,714 |
22,031 |
16,139 |
|
11,886 |
|
22,594 |
|
|
|
Jun 2022 |
18,824 |
|
21,036 |
|
18,160 |
|
|
|
19,054 |
18,949 |
14,874 |
|
9,878 |
|
15,029 |
|
|
US$/4Eoz - US$/2Eoz |
Jun 2023 |
1,225 |
|
1,737 |
|
1,083 |
|
|
|
1,006 |
1,224 |
982 |
|
586 |
|
1278 |
|
|
Dec 2022 |
1,308 |
|
1,840 |
|
1,179 |
|
|
|
1,195 |
1,271 |
931 |
|
686 |
|
1304 |
|
|
Jun 2022 |
1,222 |
|
1,366 |
|
1,179 |
|
|
|
1,237 |
1,230 |
966 |
|
641 |
|
976 |
All-in cost8,10 |
R/4Eoz - R/2Eoz |
Jun 2023 |
23,196 |
|
33,594 |
|
20,316 |
|
|
|
18,323 |
23,514 |
18,092 |
|
12,086 |
|
23,264 |
|
|
|
Dec 2022 |
24,039 |
|
36,139 |
|
21,096 |
|
|
|
20,714 |
23,580 |
16,139 |
|
11,886 |
|
22,594 |
|
|
|
Jun 2022 |
19,770 |
|
23,340 |
|
18,699 |
|
|
|
19,054 |
20,181 |
14,874 |
|
9,878 |
|
15,029 |
|
|
US$/4Eoz - US$/2Eoz |
Jun 2023 |
1,274 |
|
1,845 |
|
1,116 |
|
|
|
1,006 |
1,291 |
994 |
|
664 |
|
1,278 |
|
|
|
Dec 2022 |
1,387 |
|
2,085 |
|
1,217 |
|
|
|
1,195 |
1,361 |
931 |
|
686 |
|
1,304 |
|
|
|
Jun 2022 |
1,284 |
|
1,516 |
|
1,214 |
|
|
|
1,237 |
1,310 |
966 |
|
641 |
|
976 |
|
Capital expenditure5 |
|
|
|
|
|
|
|
|
|
|
|
|
| Total capital expenditure |
R'mil |
Jun 2023 |
5,784 |
|
3,213 |
|
2,571 |
|
|
|
630 |
1,771 |
130 |
|
40 |
|
510 |
|
|
|
Dec 2022 |
6,172 |
|
3,230 |
|
2,942 |
|
|
|
756 |
2,012 |
158 |
|
16 |
|
570 |
|
|
|
Jun 2022 |
4,346 |
|
2,185 |
|
2,161 |
|
|
|
620 |
1,420 |
115 |
|
6 |
|
294 |
|
| Total capital expenditure |
US$m |
Jun 2023 |
318 |
|
176 |
|
141 |
|
|
|
35 |
97 |
7 |
|
2 |
|
28 |
|
|
|
Dec 2022 |
356 |
|
186 |
|
170 |
|
|
|
44 |
116 |
9 |
|
1 |
|
33 |
|
|
|
Jun 2022 |
282 |
|
142 |
|
140 |
|
|
|
40 |
92 |
7 |
|
— |
|
19 |
|
Average exchange rate for the six months ended 30 June 2023, 31 December 2022 and 30 June 2022 was R18.21/US$, R17.33/US$ and R15.40/US$, respectively
Figures may not add as they are rounded independently
1The US and SA PGM operations, Total SA PGM operations and Marikana excludes the production and costs associated with the purchase of concentrate (PoC) from third parties. For a reconciliation of the Operating cost, AISC and AIC excluding third party PoC, refer to “Reconciliation of operating cost excluding third party PoC for US and SA PGM operations, Total SA PGM operations and Marikana - Six Months” and “Reconciliation of AISC and AIC excluding third party PoC for US and SA PGM operations, Total SA PGM operations and Marikana – Six Months”
2The US PGM operations’ underground production is converted to metric tonnes and kilograms, and performance is translated into rand. In addition to the US PGM operations’ underground production, the operation treats various recycling material which is excluded from the statistics shown above and is detailed in the PGM recycling table on the next page
3Production per product – see prill split in the table below
4PGM sold includes the third party PoC ounces sold
5The US and SA PGM operations and Total SA PGM operations’ unit cost benchmarks and capital expenditure exclude the financial results of Mimosa, which is equity accounted and excluded from revenue and cost of sales
6The average PGM basket price is the PGM revenue per 4E/2E ounce, prior to a purchase of concentrate adjustment
Sibanye-Stillwater Operating and financial results | Six months ended 30 June 2023 20
7Operating cost is the average cost of production and operating cost per tonne is calculated by dividing the cost of sales, before amortisation and depreciation and change in inventory in a period by the tonnes milled/treated in the same period, and operating cost per ounce is calculated by dividing the cost of sales, before amortisation and depreciation and change in inventory in a period, by the PGM produced in the same period. For a reconciliation of unit operating cost, see “Unit operating cost - Six months"
8Operating cost, adjusted EBITDA margin, all-in sustaining costs and all-in costs, are not measures of performance under IFRS. As a result, such measures should not be considered in isolation or as alternatives to any other measure of financial performance presented in accordance with IFRS. Non-IFRS measures are the responsibility of the Board
9Adjusted EBITDA margin is calculated by dividing adjusted EBITDA by revenue
10All-in cost is calculated in accordance with the World Gold Council guidance. All-in cost excludes income tax, costs associated with merger and acquisition activities, working capital, impairments, financing costs, one-time severance charges and items needed to normalise earnings. All-in cost is made up of All-in sustaining cost, being the cost to sustain current operations, given as a sub-total in the All-in cost calculation, together with corporate and major capital expenditure associated with growth. All-in sustaining cost per ounce and All-in cost per ounce are calculated by dividing the All-in sustaining cost and All-in cost, respectively, in a period by the total 4E/2E PGM produced in the same period. For a reconciliation of cost of sales, before amortisation and depreciation to All-in cost, see “All-in costs - Six months”
|
|
|
|
|
|
|
|
|
|
|
|
|
|
|
|
|
|
|
|
|
|
|
|
|
|
|
|
|
|
|
|
|
|
|
|
|
|
|
|
|
|
|
|
|
|
|
|
|
|
|
|
|
|
|
|
|
| Mining - PGM Prill split including third party PoC, excluding recycling operations |
|
US AND SA PGM OPERATIONS |
TOTAL SA PGM OPERATIONS |
US PGM OPERATIONS |
|
Jun 2023 |
Dec 2022 |
Jun 2022 |
Jun 2023 |
Dec 2022 |
Jun 2022 |
Jun 2023 |
Dec 2022 |
Jun 2022 |
|
|
% |
|
% |
|
% |
|
% |
|
% |
|
% |
|
% |
|
% |
|
% |
| Platinum |
553,324 |
|
52 |
% |
568,119 |
|
53 |
% |
556,770 |
|
52 |
% |
506,071 |
|
60 |
% |
523,939 |
59 |
% |
504,400 |
59 |
% |
47,253 |
|
23 |
% |
44,180 |
|
23 |
% |
52,370 |
|
23 |
% |
| Palladium |
410,317 |
|
39 |
% |
409,584 |
|
38 |
% |
431,750 |
|
40 |
% |
252,057 |
|
30 |
% |
262,670 |
30 |
% |
254,081 |
30 |
% |
158,260 |
|
77 |
% |
146,914 |
|
77 |
% |
177,669 |
|
77 |
% |
| Rhodium |
75,298 |
|
7 |
% |
78,783 |
|
7 |
% |
74,618 |
|
7 |
% |
75,298 |
|
9 |
% |
78,783 |
9 |
% |
74,618 |
9 |
% |
|
|
|
|
|
|
| Gold |
15,297 |
|
1 |
% |
16,264 |
|
2 |
% |
16,054 |
|
1 |
% |
15,297 |
|
2 |
% |
16,264 |
2 |
% |
16,054 |
2 |
% |
|
|
|
|
|
|
| PGM production 4E/2E |
1,054,236 |
|
100 |
% |
1,072,750 |
|
100 |
% |
1,079,191 |
|
100 |
% |
848,723 |
|
100 |
% |
881,656 |
100 |
% |
849,152 |
100 |
% |
205,513 |
|
100 |
% |
191,094 |
|
100 |
% |
230,039 |
|
100 |
% |
| Ruthenium |
119,656 |
|
|
125,157 |
|
|
118,711 |
|
|
119,656 |
|
|
125,157 |
|
118,711 |
|
|
|
|
|
|
|
| Iridium |
30,339 |
|
|
31,636 |
|
|
29,865 |
|
|
30,339 |
|
|
31,636 |
|
29,865 |
|
|
|
|
|
|
|
| Total 6E/2E |
1,204,231 |
|
|
1,229,543 |
|
|
1,227,767 |
|
|
998,718 |
|
|
1,038,449 |
|
997,728 |
|
205,513 |
|
|
191,094 |
|
|
230,039 |
|
|
Figures may not add as they are rounded independently
|
|
|
|
|
|
|
|
|
|
|
|
|
|
|
| US PGM Recycling |
|
Unit |
Jun 2023 |
Dec 2022 |
Jun 2022 |
| Average catalyst fed/day |
Tonne |
10.9 |
|
14.9 |
|
22.9 |
|
| Total processed |
Tonne |
1,979 |
|
2,740 |
|
4,136 |
|
| Tolled |
Tonne |
— |
|
— |
|
— |
|
| Purchased |
Tonne |
1,979 |
|
2,740 |
|
4,136 |
|
| PGM fed |
3Eoz |
162,452 |
|
237,441 |
|
361,333 |
|
| PGM sold |
3Eoz |
153,446 |
|
281,641 |
|
361,560 |
|
| PGM tolled returned |
3Eoz |
5,052 |
|
5,458 |
|
1,878 |
|
Sibanye-Stillwater Operating and financial results | Six months ended 30 June 2023 21
SALIENT FEATURES AND COST BENCHMARKS - SIX MONTHS (continued)
SA gold operations
|
|
|
|
|
|
|
|
|
|
|
|
|
|
|
|
|
|
|
|
|
|
|
|
|
|
|
|
|
|
|
|
|
|
|
|
|
|
|
|
|
|
|
|
|
|
|
|
|
Total SA gold operations |
Driefontein |
Kloof |
Beatrix |
Cooke |
DRDGOLD |
|
|
|
Total |
Under-
ground |
Surface |
Under-
ground |
Surface |
Under-
ground |
Surface |
Under-
ground |
Surface |
Surface |
Surface |
| Production |
|
|
|
|
|
|
|
|
|
|
|
|
|
| Tonnes milled/treated |
kt |
Jun 2023 |
15,751 |
|
2,185 |
|
13,566 |
|
710 |
|
224 |
|
750 |
|
666 |
|
725 |
|
330 |
|
2,102 |
|
10,243 |
|
|
|
Dec 2022 |
19,301 |
|
2,269 |
|
17,032 |
|
604 |
|
489 |
|
736 |
|
1,291 |
|
929 |
|
124 |
|
2,286 |
|
12,842 |
|
|
|
Jun 2022 |
16,871 |
|
492 |
|
16,379 |
|
236 |
|
205 |
|
256 |
|
663 |
|
— |
|
— |
|
1,788 |
|
13,723 |
|
| Yield |
g/t |
Jun 2023 |
0.82 |
|
4.34 |
|
0.26 |
|
5.47 |
|
0.33 |
|
4.77 |
|
0.31 |
|
2.80 |
|
0.22 |
|
0.27 |
|
0.25 |
|
|
|
Dec 2022 |
0.69 |
|
4.08 |
|
0.24 |
|
5.24 |
|
0.49 |
|
4.46 |
|
0.33 |
|
3.02 |
|
0.34 |
|
0.29 |
|
0.21 |
|
|
|
Jun 2022 |
0.35 |
|
5.05 |
|
0.21 |
|
5.98 |
|
0.39 |
|
3.97 |
|
0.30 |
|
— |
|
— |
|
0.20 |
|
0.21 |
|
| Gold produced |
kg |
Jun 2023 |
12,962 |
|
9,490 |
|
3,472 |
|
3,884 |
|
74 |
|
3,579 |
|
207 |
|
2,027 |
|
72 |
|
568 |
|
2,551 |
|
|
|
Dec 2022 |
13,339 |
|
9,250 |
|
4,089 |
|
3,163 |
|
240 |
|
3,284 |
|
420 |
|
2,803 |
|
42 |
|
656 |
|
2,731 |
|
|
|
Jun 2022 |
5,962 |
|
2,486 |
|
3,476 |
|
1,411 |
|
79 |
|
1,016 |
|
200 |
|
59 |
|
9 |
|
354 |
|
2,834 |
|
|
oz |
Jun 2023 |
416,738 |
|
305,111 |
|
111,627 |
|
124,873 |
|
2,379 |
|
115,067 |
|
6,655 |
|
65,170 |
|
2,315 |
|
18,262 |
|
82,017 |
|
|
|
Dec 2022 |
428,859 |
|
297,394 |
|
131,464 |
|
101,693 |
|
7,716 |
|
105,583 |
|
13,503 |
|
90,119 |
|
1,350 |
|
21,091 |
|
87,804 |
|
|
|
Jun 2022 |
191,683 |
|
79,927 |
|
111,756 |
|
45,365 |
|
2,540 |
|
32,665 |
|
6,430 |
|
1,897 |
|
289 |
|
11,381 |
|
91,115 |
|
| Gold sold |
kg |
Jun 2023 |
13,566 |
|
9,937 |
|
3,629 |
|
3,929 |
|
123 |
|
3,794 |
|
268 |
|
2,214 |
|
72 |
|
615 |
|
2,551 |
|
|
|
Dec 2022 |
12,378 |
|
8,409 |
|
3,969 |
|
2,961 |
|
187 |
|
2,947 |
|
372 |
|
2,501 |
|
42 |
|
606 |
|
2,762 |
|
|
|
Jun 2022 |
6,481 |
|
2,958 |
|
3,523 |
|
1,503 |
|
100 |
|
1,199 |
|
225 |
|
256 |
|
9 |
|
366 |
|
2,823 |
|
|
oz |
Jun 2023 |
436,157 |
|
319,482 |
|
116,675 |
|
126,320 |
|
3,955 |
|
121,980 |
|
8,616 |
|
71,182 |
|
2,315 |
|
19,773 |
|
82,017 |
|
|
|
Dec 2022 |
397,962 |
|
270,356 |
|
127,606 |
|
95,198 |
|
6,012 |
|
94,748 |
|
11,960 |
|
80,409 |
|
1,350 |
|
19,483 |
|
88,800 |
|
|
|
Jun 2022 |
208,369 |
|
95,102 |
|
113,267 |
|
48,323 |
|
3,215 |
|
38,549 |
|
7,234 |
|
8,231 |
|
289 |
|
11,767 |
|
90,762 |
|
| Price and costs |
|
|
|
|
|
|
|
|
|
|
|
|
|
| Gold price received |
R/kg |
Jun 2023 |
1,124,871 |
|
|
|
1,129,566 |
1,127,523 |
1,124,672 |
1,121,951 |
1,114,073 |
|
|
|
Dec 2022 |
958,232 |
|
|
|
958,069 |
958,421 |
956,351 |
953,795 |
960,898 |
|
|
|
Jun 2022 |
922,851 |
|
|
|
917,031 |
916,433 |
939,623 |
920,765 |
928,091 |
|
| Gold price received |
US$/oz |
Jun 2023 |
1,921 |
|
|
|
1,929 |
1,926 |
1,921 |
1,916 |
1,903 |
|
|
|
Dec 2022 |
1,720 |
|
|
|
1,720 |
1,720 |
1,716 |
1,712 |
1,725 |
|
|
|
Jun 2022 |
1,864 |
|
|
|
1,852 |
1,851 |
1,898 |
1,860 |
1,874 |
|
Operating cost1,4 |
R/t |
Jun 2023 |
739 |
|
4,004 |
|
213 |
|
4,432 |
|
370 |
|
4,957 |
|
344 |
|
2,599 |
|
245 |
|
272 |
|
188 |
|
|
|
Dec 2022 |
648 |
|
4,200 |
|
175 |
|
5,155 |
|
280 |
|
4,820 |
|
280 |
|
3,089 |
|
258 |
|
233 |
|
149 |
|
|
|
Jun 2022 |
488 |
|
11,624 |
|
153 |
|
9,191 |
|
288 |
|
9,563 |
|
347 |
|
— |
|
— |
|
180 |
|
135 |
|
|
US$/t |
Jun 2023 |
41 |
|
220 |
|
12 |
|
243 |
|
20 |
|
272 |
|
19 |
|
143 |
|
13 |
|
15 |
|
10 |
|
|
|
Dec 2022 |
37 |
|
242 |
|
10 |
|
297 |
|
16 |
|
278 |
|
16 |
|
178 |
|
15 |
|
13 |
|
9 |
|
|
|
Jun 2022 |
32 |
|
755 |
|
10 |
|
597 |
|
19 |
|
621 |
|
23 |
|
— |
|
— |
|
12 |
|
9 |
|
|
R/kg |
Jun 2023 |
897,778 |
|
922,129 |
|
831,221 |
|
810,247 |
|
1,121,622 |
|
1,039,396 |
|
1,106,280 |
|
929,452 |
|
1,125,000 |
|
1,007,042 |
|
753,038 |
|
|
Dec 2022 |
937,627 |
|
1,030,270 |
|
728,051 |
|
983,876 |
|
570,833 |
|
1,080,085 |
|
859,524 |
|
1,024,260 |
|
761,905 |
|
810,976 |
|
701,208 |
|
|
|
Jun 2022 |
1,379,906 |
|
2,300,483 |
|
721,519 |
|
1,537,208 |
|
746,835 |
|
2,409,449 |
|
1,150,000 |
|
18,677,966 |
|
4,222,222 |
|
909,605 |
|
655,963 |
|
|
US$/oz |
Jun 2023 |
1,533 |
|
1,575 |
|
1,420 |
|
1,384 |
|
1,916 |
|
1,775 |
|
1,890 |
|
1,588 |
|
1,922 |
|
1,720 |
|
1,286 |
|
|
|
Dec 2022 |
1,683 |
|
1,849 |
|
1,307 |
|
1,766 |
|
1,025 |
|
1,939 |
|
1,543 |
|
1,838 |
|
1,367 |
|
1,456 |
|
1,259 |
|
|
|
Jun 2022 |
2,787 |
|
4,646 |
|
1,457 |
|
3,105 |
|
1,508 |
|
4,866 |
|
2,323 |
|
37,724 |
|
8,528 |
|
1,837 |
|
1,325 |
|
Adjusted EBITDA margin2,4 |
% |
Jun 2023 |
16 |
|
|
|
27 |
7 |
8 |
(50) |
|
33 |
|
|
|
Dec 2022 |
(4) |
|
|
|
(1) |
(14) |
(9) |
(53) |
|
26 |
|
|
|
Jun 2022 |
(52) |
|
|
|
(64) |
(124) |
(451) |
(94) |
|
32 |
|
All-in sustaining cost3,4 |
R/kg |
Jun 2023 |
1,061,477 |
|
|
|
1,068,855 |
1,201,379 |
1,048,556 |
1,053,659 |
837,711 |
|
|
|
Dec 2022 |
1,124,737 |
|
|
|
1,219,187 |
1,309,129 |
1,171,844 |
867,987 |
799,421 |
|
|
|
Jun 2022 |
1,542,355 |
|
|
|
1,692,452 |
2,252,809 |
5,415,094 |
969,945 |
808,360 |
|
| All-in sustaining cost2 |
US$/oz |
Jun 2023 |
1,813 |
|
|
|
1,826 |
2,052 |
1,791 |
1,800 |
1,431 |
|
|
|
Dec 2022 |
2,019 |
|
|
|
2,188 |
2,350 |
2,103 |
1,558 |
1,435 |
|
|
|
Jun 2022 |
3,115 |
|
|
|
3,418 |
4,550 |
10,937 |
1,959 |
1,633 |
|
All-in cost3,4 |
R/kg |
Jun 2023 |
1,162,244 |
|
|
|
1,068,855 |
1,217,873 |
1,048,556 |
1,053,659 |
1,005,096 |
|
|
|
Dec 2022 |
1,200,679 |
|
|
|
1,219,187 |
1,355,830 |
1,171,844 |
867,987 |
842,143 |
|
|
|
Jun 2022 |
1,610,091 |
|
|
|
1,692,452 |
2,290,730 |
5,430,189 |
969,945 |
810,485 |
|
| All-in cost2 |
US$/oz |
Jun 2023 |
1,985 |
|
|
|
1,826 |
2,080 |
1,791 |
1,800 |
1,717 |
|
|
|
Dec 2022 |
2,155 |
|
|
|
2,188 |
2,433 |
2,103 |
1,558 |
1,511 |
|
|
|
Jun 2022 |
3,252 |
|
|
|
3,418 |
4,627 |
10,967 |
1,959 |
1,637 |
|
| Capital expenditure |
|
|
|
|
|
|
|
|
|
|
Total capital expenditure5 |
R'mil |
Jun 2023 |
3,367 |
|
|
|
950 |
716 |
209 |
— |
|
657 |
|
|
|
Dec 2022 |
2,963 |
|
|
|
805 |
894 |
272 |
— |
|
354 |
|
|
|
Jun 2022 |
1,595 |
|
|
|
347 |
391 |
103 |
— |
|
416 |
|
| Total capital expenditure |
US$m |
Jun 2023 |
185 |
|
|
|
52 |
39 |
11 |
— |
|
36 |
|
|
|
Dec 2022 |
171 |
|
|
|
46 |
52 |
16 |
— |
|
20 |
|
|
|
Jun 2022 |
104 |
|
|
|
23 |
25 |
7 |
— |
|
27 |
|
Average exchange rate for the six months ended 30 June 2023, 31 December 2022 and 30 June 2022 was R18.21/US$, R17.33/US$ and R15.40/US$, respectively
Figures may not add as they are rounded independently
1Operating cost is the average cost of production and operating cost per tonne is calculated by dividing the cost of sales, before amortisation and depreciation and change in inventory in a period, by the tonnes milled/treated in the same period, and operating cost per kilogram (and ounce) is calculated by dividing the cost of sales, before amortisation and depreciation and change in inventory in a period, by the gold produced in the same period. For a reconciliation of unit operating cost, see “Unit operating cost - Six months"
2Adjusted EBITDA margin is calculated by dividing adjusted EBITDA by revenue
3All-in cost is calculated in accordance with the World Gold Council guidance. All-in cost excludes income tax, costs associated with merger and acquisition activities, working capital, impairments, financing costs, one time severance charges and items needed to normalise earnings. All-in cost is made up of All-in sustaining cost, being the cost to sustain current operations, given as a sub-total in the All-in cost calculation, together with corporate and major capital expenditure associated with growth. All-in sustaining cost per kilogram (and ounce) and All-in cost per kilogram (and ounce) are calculated by dividing the All-in sustaining cost and All-in cost, respectively, in a period by the total gold sold over the same period. For a reconciliation of cost of sales before amortisation and depreciation to All-in cost, see “All-in costs – Six months”
Sibanye-Stillwater Operating and financial results | Six months ended 30 June 2023 22
4Operating cost, adjusted EBITDA margin, all-in sustaining costs and all-in costs, are not measures of performance under IFRS. As a result, such measures should not be considered in isolation or as alternatives to any other measure of financial performance presented in accordance with IFRS. Non-IFRS measures are the responsibility of the Board
5Adjusted EBITDA margin is calculated by dividing adjusted EBITDA by revenue
6Corporate project expenditure for the six months ended 30 June 2023, 31 December 2022 and 30 June 2022 was R835 million (US$46 million), R638 million (US$37 million), and R338 million (US$22 million), respectively, the majority of which related to the Burnstone project
SALIENT FEATURES AND COST BENCHMARKS - SIX MONTHS (continued)
European operations
|
|
|
|
|
|
|
|
|
|
|
|
|
|
|
|
|
|
|
|
|
| Sandouville nickel refinery |
| Metals split |
|
|
Jun 2023 |
Dec 2022 |
Jun 20221 |
| Volumes produced (tonnes) |
|
% |
|
% |
|
% |
Nickel salts2 |
788 |
|
23 |
% |
937 |
|
41 |
% |
1,066 |
|
23 |
% |
| Nickel metal |
2,705 |
|
77 |
% |
1,340 |
|
59 |
% |
3,499 |
|
77 |
% |
| Total Nickel Production tNi |
3,493 |
|
100 |
% |
2,277 |
|
100 |
% |
4,565 |
|
100 |
% |
Nickel cakes3 |
158 |
|
|
91 |
|
|
193 |
|
|
Cobalt chloride (CoCl2)4 |
63 |
|
|
43 |
|
|
113 |
|
|
Ferric chloride (FeCl3)4 |
644 |
|
|
431 |
|
|
968 |
|
|
|
|
|
|
|
|
|
| Volumes sales (tonnes) |
|
|
|
|
|
|
Nickel salts2 |
593 |
|
17 |
% |
876 |
|
39 |
% |
984 |
|
21 |
% |
| Nickel metal |
2,832 |
|
83 |
% |
1,388 |
|
61 |
% |
3,599 |
|
79 |
% |
| Total Nickel Sold tNi |
3,425 |
|
100 |
% |
2,264 |
|
100 |
% |
4,583 |
|
100 |
% |
Nickel cakes3 |
21 |
|
|
— |
|
|
— |
|
|
Cobalt chloride (CoCl2)4 |
50 |
|
|
19 |
|
|
145 |
|
|
Ferric chloride (FeCl3)4 |
644 |
|
|
431 |
|
|
968 |
|
|
|
|
|
|
|
|
|
|
|
|
|
|
|
|
|
| Nickel equivalent basket price |
Unit |
Jun 2023 |
Dec 2022 |
Jun 20221 |
| Revenue from sale of products |
Rm |
1,677 |
|
967 |
|
2,173 |
|
| Nickel Products sold |
tNi |
3,425 |
|
2,264 |
|
4,583 |
|
Nickel equivalent average basket price5 |
R/tNi |
489,635 |
|
427,120 |
|
474,144 |
|
| Nickel equivalent average basket price |
US$/tNi |
26,888 |
|
24,646 |
|
30,789 |
|
|
|
|
|
|
|
|
|
|
|
|
|
|
|
|
| Nickel equivalent sustaining cost |
R'mil |
Jun 2023 |
Dec 2022 |
Jun 20221 |
| Cost of sales, before amortisation and depreciation |
|
2,329 |
|
1,506 |
|
2,125 |
|
|
|
|
|
|
|
|
|
|
|
| Share-based payments |
|
11 |
|
— |
|
— |
|
| Rehabilitation interest and amortisation |
|
3 |
|
3 |
|
3 |
|
| Leases |
|
10 |
|
2 |
|
12 |
|
| Sustaining capital expenditure |
|
95 |
|
61 |
|
29 |
|
| Less: By-product credit |
|
(110) |
|
(68) |
|
(59) |
|
Nickel equivalent sustaining cost6 |
|
2,338 |
|
1,504 |
|
2,110 |
|
| Nickel Products sold |
tNi |
3,425 |
|
2,264 |
|
4,583 |
|
Nickel equivalent sustaining cost6 |
R/tNi |
682,628 |
|
664,311 |
|
460,397 |
|
| Nickel equivalent sustaining cost |
US$/tNi |
37,486 |
|
38,333 |
|
29,896 |
|
|
|
|
|
|
Nickel recovery yield7 |
% |
96.80 |
% |
92.29 |
% |
98.79 |
% |
Average exchange rate for the six months ended 30 June 2023, 31 December 2022 and 30 June 2022 was R18.21/US$, R17.33/US$ and R15.40/US$, respectively
Figures may not add as they are rounded independently
1Amounts included since effective date of the acquisition on 4 February 2022
2Nickel salts consist of anhydrous nickel, nickel chloride low sodium, nickel chloride standard, nickel carbonate and nickel chloride solution
3Nickel cakes occur during the processing of nickel matte and are recycled back into the nickel refining process
4Cobalt chloride and ferric chloride are obtained from nickel matte through a different refining process on an order basis
5The Nickel equivalent average basket price per tonne is the total nickel revenue adjusted for other income less non-product sales divided by the total nickel equivalent tonnes sold
6The Nickel equivalent sustaining cost, is the cost to sustain current operations. Nickel equivalent sustaining cost per tonne nickel is calculated by dividing the Nickel equivalent sustaining cost, in a period by the total nickel products sold over the same period. Nickel equivalent sustaining cost and Nickel equivalent sustaining costs per tonne are intended to provide additional information only, do not have any standardised meaning prescribed by IFRS and should not be considered in isolation or as alternatives to cost of sales, profit before tax, profit for the year, cash from operating activities or any other measure of financial performance presented in accordance with IFRS. Nickel equivalent sustaining cost and Nickel equivalent sustaining costs per tonne as presented in this document may not be comparable to other similarly titled measures of performance of other companies. Other companies may calculate these measures differently as a result of differences in the underlying accounting principles, policies applied and accounting frameworks such as in US GAAP. Differences may also arise related to definitional differences of sustaining versus development capital activities based upon each company’s internal policies. Non-IFRS measures such as Nickel equivalent sustaining cost and Nickel equivalent sustaining costs per tonne are the responsibility of the Group's Board of Directors and because of its nature, should not be considered as a representation of financial performance under IFRS
7Nickel recovery yield is the percentage of total nickel recovered from the matte relative to the nickel contained in the matte received
Sibanye-Stillwater Operating and financial results | Six months ended 30 June 2023 23
SALIENT FEATURES AND COST BENCHMARKS - SIX MONTHS (continued)
Australian operations
|
|
|
|
|
|
|
|
|
|
|
|
| New Century zinc retreatment operation |
| Production |
|
|
New Century1 |
| Ore mined and processed |
kt |
Jun 2023 |
2,061 |
|
|
|
|
|
|
|
|
|
| Processing feed grade |
% |
Jun 2023 |
3.09 |
|
|
|
|
|
|
|
|
|
| Plant recoveries |
% |
Jun 2023 |
46.33 |
|
|
|
|
|
|
|
|
|
Concentrate produced2 |
kt |
Jun 2023 |
66 |
|
|
|
|
|
|
|
|
|
Concentrate zinc grade3 |
% |
Jun 2023 |
45.01 |
|
|
|
|
|
|
|
|
|
Metal produced (zinc in concentrate)4 |
kt |
Jun 2023 |
29 |
|
|
|
|
|
|
|
|
|
Zinc metal produced (payable)5 |
kt |
Jun 2023 |
24 |
|
|
|
|
|
|
|
|
|
Zinc sold6 |
kt |
Jun 2023 |
33 |
|
|
|
|
|
|
|
|
|
Zinc sold (payable)7 |
kt |
Jun 2023 |
27 |
|
|
|
|
|
|
|
|
|
| Price and costs |
|
|
|
| Average LME price |
US$/tZn |
Jun 2023 |
1,640 |
|
|
|
|
|
|
|
|
|
Average equivalent zinc concentrate price8 |
R/tZn |
Jun 2023 |
29,871 |
|
|
|
|
|
|
|
|
|
|
US$/tZn |
Jun 2023 |
1,640 |
|
|
|
|
|
|
|
|
|
All-in sustaining cost9,10 |
R/tZn |
Jun 2023 |
44,030 |
|
|
|
|
|
|
|
|
|
|
US$/tZn |
Jun 2023 |
2,418 |
|
|
|
|
|
|
|
|
|
All-in cost9,10 |
R/tZn |
Jun 2023 |
50,338 |
|
|
|
|
|
|
|
|
|
|
US$/tZn |
Jun 2023 |
2,764 |
|
|
|
|
|
|
|
|
|
Average exchange rate for the six months ended 30 June 2023 was R18.21/US$
Figures may not add as they are rounded independently
1New Century is a leading tailings management and rehabilitation company that currently owns and operates the New Century zinc tailings retreatment operation in Queensland, Australia. Amounts included since effective date of acquisition on 22 February 2023
2Concentrate produced is the dry concentrate which has been processed that contains zinc, silver and waste material
3Concentrate zinc grade is the percentage of zinc contained in the concentrate produced
4Metal produced (zinc in concentrate) is the zinc metal contained in the concentrate produced
5Zinc metal produced (payable) is the payable quantity of zinc metal produced after applying smelter content deductions
6Zinc sold is the zinc metal contained in the concentrate sold
7Zinc sold (payable) is the payable quantity of zinc metal sold after applying smelter content deductions
8Average equivalent zinc concentrate price is the total zinc sales revenue recognised at the price expected to be received excluding the fair value adjustments divided by the payable zinc metal sold
9All-in cost is calculated in accordance with the World Gold Council guidance. All-in cost excludes income tax, costs associated with merger and acquisition activities, working capital, impairments, financing costs, one-time severance charges and items needed to normalise earnings. All-in cost is made up of All-in sustaining cost, being the cost to sustain current operations, given as a sub-total in the All-in cost calculation, together with corporate and major capital expenditure associated with growth. All-in sustaining cost per tonne and All-in cost per tonne are calculated by dividing the All-in sustaining cost and All-in cost, respectively, in a period by the total tonnes of zinc metal produced (payable) in the same period. For a reconciliation of cost of sales, before amortisation and depreciation to All-in cost, see “All-in costs - Six months”
10All-in sustaining costs and all-in costs, are not measures of performance under IFRS. As a result, such measures should not be considered in isolation or as alternatives to any other measure of financial performance presented in accordance with IFRS. Non-IFRS measures are the responsibility of the Board
Sibanye-Stillwater Operating and financial results | Six months ended 30 June 2023 24
CONSOLIDATED INTERIM FINANCIAL STATEMENTS
Condensed consolidated income statement
Figures are in millions unless otherwise stated
|
|
|
|
|
|
|
|
|
|
|
|
|
|
|
|
|
|
|
|
|
|
|
|
| US dollar |
|
|
SA rand |
| Six months ended |
|
|
Six months ended |
| Unaudited |
Unaudited |
Unaudited |
|
|
Unaudited |
Unaudited |
Unaudited |
| Jun 2022 |
Dec 2022 |
Jun 2023 |
|
Notes |
Jun 2023 |
Dec 2022 |
Jun 2022 |
| 4,570 |
3,878 |
3,326 |
Revenue |
2 |
60,568 |
67,909 |
70,379 |
| (3,263) |
(2,945) |
(2,728) |
Cost of sales |
|
(49,669) |
(51,375) |
(50,249) |
| (3,054) |
(2,721) |
(2,468) |
Cost of sales, before amortisation and depreciation |
|
(44,938) |
(47,512) |
(47,025) |
| (209) |
(224) |
(260) |
Amortisation and depreciation |
|
(4,731) |
(3,863) |
(3,224) |
|
|
|
|
|
|
|
|
| 1,307 |
933 |
598 |
|
|
10,899 |
16,534 |
20,130 |
| 38 |
35 |
39 |
Interest income |
|
718 |
614 |
589 |
| (95) |
(78) |
(92) |
Finance expense |
3 |
(1,684) |
(1,378) |
(1,462) |
| (7) |
(6) |
(2) |
Share-based payment expenses |
|
(43) |
(106) |
(112) |
| (26) |
(235) |
20 |
Gain/(loss) on financial instruments |
4 |
371 |
(3,880) |
(399) |
| 9 |
29 |
102 |
Gain on foreign exchange differences |
|
1,850 |
476 |
140 |
| 50 |
29 |
14 |
Share of results of equity-accounted investees after tax |
|
263 |
517 |
770 |
| (92) |
(133) |
(96) |
Other costs |
|
(1,744) |
(2,249) |
(1,430) |
| 48 |
20 |
21 |
Other income |
|
386 |
383 |
727 |
| 6 |
4 |
4 |
Gain on disposal of property, plant and equipment |
|
74 |
68 |
94 |
| — |
— |
— |
(Impairments)/reversal of impairments |
|
(9) |
6 |
— |
| (2) |
(20) |
10 |
Restructuring costs |
|
174 |
(327) |
(36) |
| (7) |
(2) |
(4) |
Transaction costs |
|
(80) |
(44) |
(108) |
| 2 |
11 |
— |
Occupational healthcare gain |
|
8 |
186 |
25 |
| 1,231 |
587 |
614 |
Profit before royalties, carbon tax and tax |
|
11,183 |
10,800 |
18,928 |
| (63) |
(49) |
(33) |
Royalties |
|
(592) |
(864) |
(970) |
| 1 |
— |
— |
Carbon tax |
|
(1) |
(1) |
11 |
| 1,169 |
538 |
581 |
Profit before tax |
|
10,590 |
9,935 |
17,969 |
| (366) |
(179) |
(154) |
Mining and income tax |
5 |
(2,804) |
(3,296) |
(5,628) |
| (321) |
(246) |
(131) |
- Current tax |
|
(2,390) |
(4,345) |
(4,937) |
| (45) |
67 |
(23) |
- Deferred tax |
|
(414) |
1,049 |
(691) |
|
|
|
|
|
|
|
|
| 803 |
359 |
427 |
Profit for the period |
|
7,786 |
6,639 |
12,341 |
|
|
|
Profit for the period attributable to: |
|
|
|
|
| 782 |
344 |
407 |
- Owners of Sibanye-Stillwater |
|
7,423 |
6,380 |
12,016 |
| 21 |
15 |
20 |
- Non-controlling interests (NCI) |
|
363 |
259 |
325 |
|
|
|
Earnings per ordinary share (cents) |
|
|
|
|
| 28 |
13 |
14 |
Basic earnings per share |
6.1 |
262 |
225 |
426 |
| 28 |
13 |
14 |
Diluted earnings per share |
6.2 |
262 |
225 |
424 |
| 2,821,905 |
2,830,197 |
2,830,488 |
Weighted average number of shares ('000) |
6.1 |
2,830,488 |
2,830,197 |
2,821,905 |
| 2,830,908 |
2,830,781 |
2,830,567 |
Diluted weighted average number of shares ('000) |
6.2 |
2,830,567 |
2,830,781 |
2,830,908 |
| 15.40 |
17.33 |
18.21 |
Average R/US$ rate |
|
|
|
|
|
|
|
|
The consolidated interim financial statements for the six months ended 30 June 2023 have been prepared by Sibanye-Stillwater's Group financial reporting team headed by Jacques le Roux (CA (SA)). This process was supervised by the Group's Chief Financial Officer, Charl Keyter and approved by the Sibanye-Stillwater Board of Directors.
A convenience translation has been applied to the primary statements into US dollar based on the average exchange rate for the period for the condensed consolidated income statement, statements of other comprehensive income and cash flows, and the period-end closing exchange rate for the condensed consolidated statement of financial position and exchange differences on translation are accounted for in the condensed consolidated statement of other comprehensive income. This information is provided as supplementary information only and has not been reviewed or reported on by the Company's external auditors.
|
Sibanye-Stillwater Operating and financial results | Six months ended 30 June 2023 25
Condensed consolidated statement of other comprehensive income
Figures are in millions unless otherwise stated
|
|
|
|
|
|
|
|
|
|
|
|
|
|
|
|
|
|
|
|
|
|
|
|
| US dollar |
|
|
SA rand |
| Six months ended |
|
|
Six months ended |
| Unaudited |
Unaudited |
Unaudited |
|
|
Unaudited |
Unaudited |
Unaudited |
| Jun 2022 |
Dec 2022 |
Jun 2023 |
|
|
Jun 2023 |
Dec 2022 |
Jun 2022 |
| 803 |
359 |
427 |
Profit for the period |
|
7,786 |
6,639 |
12,341 |
| (143) |
(64) |
(202) |
Other comprehensive income, net of tax |
|
6,045 |
2,551 |
(182) |
| — |
— |
— |
Foreign currency translation adjustments1 |
|
6,058 |
2,673 |
1,167 |
| (88) |
(2) |
(1) |
Fair value adjustment on other investments2 |
|
(13) |
(118) |
(1,349) |
| — |
— |
— |
Re-measurement of defined benefit plan2 |
|
— |
(4) |
— |
| (55) |
(62) |
(201) |
Currency translation adjustments3 |
|
— |
— |
— |
|
|
|
|
|
|
|
|
| 660 |
295 |
225 |
Total comprehensive income |
|
13,831 |
9,190 |
12,159 |
|
|
|
Total comprehensive income attributable to: |
|
|
|
|
| 638 |
276 |
202 |
- Owners of Sibanye-Stillwater |
|
13,407 |
8,850 |
11,821 |
| 22 |
19 |
23 |
- Non-controlling interests |
|
424 |
340 |
338 |
| 15.40 |
17.33 |
18.21 |
Average R/US$ rate |
|
|
|
|
1These gains and losses will be reclassified to profit or loss upon disposal of the underlying operations
2These gains and losses will never be reclassified to profit or loss
3These gains and losses relate to the convenience translation of the SA rand amounts to US dollar and will never be reclassified to profit or loss
Condensed consolidated statement of financial position
Figures are in millions unless otherwise stated
|
|
|
|
|
|
|
|
|
|
|
|
|
|
|
|
|
|
|
|
|
|
|
|
| US dollar |
|
|
SA rand |
| Unaudited |
Unaudited |
Unaudited |
|
|
Unaudited |
Unaudited |
Unaudited |
| Jun 2022 |
Dec 2022 |
Jun 2023 |
|
Notes |
Jun 2023 |
Dec 2022 |
Jun 2022 |
| 5,857 |
6,216 |
6,564 |
Non-current assets |
|
123,772 |
105,867 |
95,407 |
| 4,246 |
4,516 |
4,924 |
Property, plant and equipment |
|
92,824 |
76,909 |
69,166 |
| 19 |
16 |
32 |
Right-of-use assets |
|
610 |
279 |
306 |
| 490 |
489 |
485 |
Goodwill and other intangibles |
|
9,151 |
8,322 |
7,987 |
| 481 |
497 |
491 |
Equity-accounted investments |
|
9,264 |
8,471 |
7,830 |
| 171 |
196 |
178 |
Other investments |
|
3,364 |
3,340 |
2,788 |
| 320 |
312 |
295 |
Environmental rehabilitation obligation funds |
|
5,555 |
5,306 |
5,219 |
| 61 |
47 |
42 |
Other receivables |
|
794 |
798 |
994 |
| 69 |
143 |
117 |
Deferred tax assets |
|
2,210 |
2,442 |
1,117 |
|
|
|
|
|
|
|
|
| 3,879 |
3,567 |
3,005 |
Current assets |
|
56,652 |
60,764 |
63,182 |
| 1,658 |
1,549 |
1,364 |
Inventories |
|
25,710 |
26,384 |
27,005 |
| 437 |
440 |
425 |
Trade and other receivables |
|
8,016 |
7,500 |
7,124 |
| 14 |
5 |
12 |
Other receivables |
|
233 |
81 |
221 |
| 97 |
42 |
28 |
Tax receivable |
|
534 |
723 |
1,584 |
| 1,673 |
1,531 |
1,176 |
Cash and cash equivalents |
|
22,159 |
26,076 |
27,248 |
|
|
|
|
|
|
|
|
| 9,736 |
9,783 |
9,569 |
Total assets |
|
180,424 |
166,631 |
158,589 |
|
|
|
|
|
|
|
|
| 5,487 |
5,342 |
5,309 |
Total equity |
|
100,164 |
91,004 |
89,358 |
|
|
|
|
|
|
|
|
| 3,097 |
3,254 |
3,303 |
Non-current liabilities |
|
62,238 |
55,408 |
50,436 |
| 1,275 |
1,327 |
1,336 |
Borrowings |
9 |
25,177 |
22,606 |
20,772 |
| 15 |
12 |
23 |
Lease liabilities |
|
440 |
208 |
240 |
| 531 |
502 |
603 |
Environmental rehabilitation obligation and other provisions |
|
11,369 |
8,552 |
8,655 |
| 53 |
46 |
38 |
Occupational healthcare obligation |
|
707 |
781 |
868 |
| 174 |
293 |
236 |
Cash-settled share-based payment obligations |
|
4,445 |
4,991 |
2,833 |
| 125 |
147 |
178 |
Other payables |
10 |
3,347 |
2,500 |
2,029 |
| 379 |
376 |
341 |
Deferred revenue |
|
6,429 |
6,399 |
6,175 |
| 1 |
1 |
1 |
Tax and royalties payable |
|
12 |
11 |
10 |
| 544 |
550 |
547 |
Deferred tax liabilities |
|
10,312 |
9,360 |
8,854 |
|
|
|
|
|
|
|
|
| 1,152 |
1,187 |
957 |
Current Liabilities |
|
18,022 |
20,219 |
18,795 |
| 7 |
7 |
7 |
Borrowings |
9 |
135 |
122 |
115 |
| 7 |
7 |
11 |
Lease liabilities |
|
200 |
111 |
119 |
| 9 |
3 |
4 |
Occupational healthcare obligation |
|
74 |
44 |
140 |
| 15 |
17 |
41 |
Cash-settled share-based payment obligations |
|
764 |
284 |
252 |
| 883 |
919 |
816 |
Trade and other payables |
|
15,377 |
15,653 |
14,392 |
| 175 |
228 |
24 |
Other payables |
10 |
451 |
3,891 |
2,856 |
| 6 |
1 |
17 |
Deferred revenue |
|
324 |
21 |
102 |
| 50 |
5 |
37 |
Tax and royalties payable |
|
697 |
93 |
819 |
|
|
|
|
|
|
|
|
| 9,736 |
9,783 |
9,569 |
Total equity and liabilities |
|
180,424 |
166,631 |
158,589 |
| 16.29 |
17.03 |
18.85 |
Closing R/US$ rate |
|
|
|
|
Sibanye-Stillwater Operating and financial results | Six months ended 30 June 2023 26
Condensed consolidated statement of changes in equity
Figures are in millions unless otherwise stated
|
|
|
|
|
|
|
|
|
|
|
|
|
|
|
|
|
|
|
|
|
|
|
|
|
|
|
|
|
|
|
|
|
|
|
|
|
|
|
|
|
|
US dollar1 |
|
|
SA rand1 |
| Stated capital |
Re- organisation reserve |
Other reserves |
Accum-
ulated
profit |
Non-
controlling interests |
Total
equity |
|
Notes |
Total
equity |
Non-
controlling interests |
Accum-
ulated
profit |
Other reserves |
Re- organisation reserve |
Stated capital |
| 1,361 |
2,599 |
410 |
602 |
130 |
5,102 |
Balance at 31 December 2021 |
|
81,345 |
1,952 |
27,414 |
7,331 |
23,001 |
21,647 |
| — |
— |
(144) |
782 |
22 |
660 |
Total comprehensive income for the period |
|
12,159 |
338 |
12,016 |
(195) |
— |
— |
| — |
— |
— |
782 |
21 |
803 |
Profit for the period |
|
12,341 |
325 |
12,016 |
— |
— |
— |
| — |
— |
(144) |
— |
1 |
(143) |
Other comprehensive income, net of tax |
|
(182) |
13 |
— |
(195) |
— |
— |
| — |
— |
— |
(344) |
(6) |
(350) |
Dividends paid |
|
(5,378) |
(86) |
(5,292) |
— |
— |
— |
| — |
— |
1 |
— |
— |
1 |
Equity-settled share-based payments |
|
14 |
5 |
— |
9 |
— |
— |
| — |
— |
— |
— |
74 |
74 |
Keliber Oy (Keliber) asset acquisition |
|
1,219 |
1,219 |
— |
— |
— |
— |
| — |
— |
— |
— |
— |
— |
Foreign exchange movement recycled through profit or loss |
|
(1) |
— |
— |
(1) |
— |
— |
| 1,361 |
2,599 |
267 |
1,040 |
220 |
5,487 |
Balance at 30 June 2022 (Restated)2 |
|
89,358 |
3,428 |
34,138 |
7,144 |
23,001 |
21,647 |
| — |
— |
(68) |
344 |
19 |
295 |
Total comprehensive income for the period |
|
9,190 |
340 |
6,376 |
2,474 |
— |
— |
| — |
— |
— |
344 |
15 |
359 |
Profit for the period |
|
6,639 |
259 |
6,380 |
— |
— |
— |
| — |
— |
(68) |
— |
4 |
(64) |
Other comprehensive income, net of tax |
|
2,551 |
81 |
(4) |
2,474 |
— |
— |
| — |
— |
— |
(218) |
(10) |
(228) |
Dividends paid |
|
(4,075) |
(170) |
(3,905) |
— |
— |
— |
| — |
— |
— |
— |
1 |
1 |
Equity-settled share-based payments |
|
10 |
5 |
— |
5 |
— |
— |
| — |
— |
4 |
(173) |
(42) |
(211) |
Transaction with shareholders |
|
(3,452) |
(686) |
(2,828) |
62 |
— |
— |
| — |
— |
— |
— |
(1) |
(1) |
Sale of Lonmin Canada Incorporated (Lonmin Canada) |
|
(14) |
(14) |
— |
— |
— |
— |
| — |
— |
(1) |
— |
— |
(1) |
Foreign exchange movement recycled through profit or loss |
|
(13) |
— |
— |
(13) |
— |
— |
| 1,361 |
2,599 |
202 |
993 |
187 |
5,342 |
Balance at 31 December 2022 |
|
91,004 |
2,903 |
33,781 |
9,672 |
23,001 |
21,647 |
| — |
— |
(205) |
407 |
23 |
225 |
Total comprehensive income for the period |
|
13,831 |
424 |
7,423 |
5,984 |
— |
— |
| — |
— |
— |
407 |
20 |
427 |
Profit for the period |
|
7,786 |
363 |
7,423 |
— |
— |
— |
| — |
— |
(205) |
— |
3 |
(202) |
Other comprehensive income, net of tax |
|
6,045 |
61 |
— |
5,984 |
— |
— |
| — |
— |
— |
(190) |
(5) |
(195) |
Dividends paid |
|
(3,539) |
(86) |
(3,453) |
— |
— |
— |
| — |
— |
1 |
— |
1 |
2 |
Equity-settled share-based payments |
|
40 |
20 |
— |
20 |
— |
— |
| — |
— |
— |
— |
50 |
50 |
New Century Resources Limited (New Century) business combination |
8.1 |
919 |
919 |
— |
— |
— |
— |
| — |
— |
(4) |
25 |
38 |
59 |
Transactions with Keliber Oy (Keliber) shareholders |
8.2 |
1,097 |
700 |
463 |
(66) |
— |
— |
| — |
— |
— |
— |
(43) |
(43) |
Keliber dividend obligation |
10 |
(792) |
(792) |
— |
— |
— |
— |
| — |
— |
— |
1 |
(50) |
(49) |
Transactions with New Century shareholders |
8.1 |
(906) |
(914) |
13 |
(5) |
— |
— |
| — |
— |
(82) |
— |
— |
(82) |
Foreign exchange movement recycled through profit or loss3 |
|
(1,490) |
— |
— |
(1,490) |
— |
— |
| 1,361 |
2,599 |
(88) |
1,236 |
201 |
5,309 |
Balance at 30 June 2023 |
|
100,164 |
3,174 |
38,227 |
14,115 |
23,001 |
21,647 |
1 This information is unaudited
2 As disclosed in note 1.5 of the annual financial report for the year ended 31 December 2022, during 2022 management identified that they incorrectly classified the consideration paid for the 10 January 2020 share subscription in DRDGOLD to the owners of Sibanye-Stillwater and therefore excluded this consideration paid from the net asset value of DRDGOLD used in determining the NCI. The accumulated profit and NCI as at and for the twelve months ended 31 December 2020 was appropriately restated in the annual financial report for the year ended 31 December 2022. Consistent with the error disclosed in the annual financial report for the year ended 31 December 2022, the impact of this error resulted in a decrease in the previously reported accumulated profit and increase in NCI as at 30 June 2022 of R544 million, respectively
3 This relates to the deregistration of dormant subsidiaries in the Group which resulted in the reclassification of foreign currency translation reserve movements from other comprehensive income to profit or loss. The foreign exchange movement is included in gain on foreign exchange differences in profit or loss
Sibanye-Stillwater Operating and financial results | Six months ended 30 June 2023 27
Condensed consolidated statement of cash flows
Figures are in millions unless otherwise stated
|
|
|
|
|
|
|
|
|
|
|
|
|
|
|
|
|
|
|
|
|
|
|
|
| US dollar |
|
|
SA rand |
| Six months ended |
|
|
Six months ended |
| Unaudited |
Unaudited |
Unaudited |
|
|
Unaudited |
Unaudited |
Unaudited |
| Jun 2022 |
Dec 2022 |
Jun 2023 |
|
Notes |
Jun 2023 |
Dec 2022 |
Jun 2022 |
|
|
|
Cash flows from operating activities |
|
|
|
|
| 1,436 |
1,053 |
786 |
Cash generated by operations |
|
14,317 |
18,639 |
22,107 |
| 2 |
(1) |
16 |
Deferred revenue advance received |
|
299 |
— |
24 |
| — |
— |
— |
Post-retirement health care payments |
|
— |
— |
(1) |
| (13) |
(4) |
(31) |
Cash-settled share-based payments paid |
|
(567) |
(74) |
(198) |
| (15) |
1 |
(10) |
Payment of Marikana dividend obligation |
|
(191) |
— |
(225) |
| (295) |
17 |
(205) |
Additional deferred/contingent payments relating to acquisition of a business1 |
|
(3,733) |
— |
(4,545) |
| (107) |
131 |
53 |
Change in working capital |
|
963 |
2,034 |
(1,648) |
| 1,008 |
1,197 |
609 |
|
|
11,088 |
20,599 |
15,514 |
| 30 |
12 |
30 |
Interest received |
|
538 |
221 |
461 |
| (38) |
(30) |
(37) |
Interest paid |
|
(673) |
(534) |
(584) |
| (64) |
(47) |
(20) |
Royalties paid |
|
(357) |
(836) |
(979) |
| (302) |
(240) |
(116) |
Tax paid |
|
(2,114) |
(4,221) |
(4,645) |
| (349) |
(228) |
(194) |
Dividends paid |
|
(3,539) |
(4,075) |
(5,378) |
| 285 |
664 |
272 |
Net cash from operating activities |
|
4,943 |
11,154 |
4,389 |
|
|
|
Cash flow from investing activities |
|
|
|
|
| (399) |
(572) |
(596) |
Additions to property, plant and equipment |
|
(10,854) |
(9,755) |
(6,144) |
| 8 |
4 |
5 |
Proceeds on disposal of property, plant and equipment |
|
84 |
75 |
116 |
| (74) |
5 |
12 |
Acquisition of subsidiaries, net of cash acquired |
8.1 |
224 |
— |
(1,132) |
| 24 |
10 |
18 |
Dividends received |
|
334 |
201 |
363 |
| (29) |
(18) |
(1) |
Additions to other investments |
|
(22) |
(322) |
(450) |
| (6) |
— |
(22) |
Acquisition of equity-accounted investment2 |
|
(396) |
— |
(92) |
| (1) |
(4) |
(3) |
Contributions to environmental rehabilitation funds |
|
(57) |
(63) |
(23) |
| (12) |
1 |
— |
Payment of deferred/contingent payment1 |
|
— |
— |
(185) |
| (1) |
— |
— |
Contributions to enterprise development fund |
|
— |
— |
(10) |
| — |
(4) |
— |
Cash outflow on loss of control of subsidiary |
|
— |
(58) |
— |
| — |
4 |
— |
Proceeds on sale of Lonmin Canada |
|
— |
72 |
— |
| 2 |
— |
17 |
Proceeds from environmental rehabilitation funds |
|
308 |
— |
33 |
| (488) |
(574) |
(570) |
Net cash used in investing activities |
|
(10,379) |
(9,850) |
(7,524) |
|
|
|
Cash flow from financing activities |
|
|
|
|
| 357 |
132 |
55 |
Loans raised |
9 |
1,000 |
2,500 |
5,500 |
| (357) |
(132) |
(55) |
Loans repaid |
9 |
(1,008) |
(2,502) |
(5,501) |
| (5) |
(3) |
(6) |
Lease payments |
|
(102) |
(59) |
(72) |
| — |
(205) |
(55) |
Acquisition of NCI3 |
|
(1,009) |
(3,363) |
— |
| — |
— |
60 |
Proceeds from NCI on rights issue |
8.2 |
1,096 |
— |
— |
| (5) |
(208) |
(1) |
Net cash used in financing activities |
|
(23) |
(3,424) |
(73) |
| (208) |
(118) |
(299) |
Net decrease in cash and cash equivalents |
|
(5,459) |
(2,120) |
(3,208) |
| (19) |
(24) |
(56) |
Effect of exchange rate fluctuations on cash held |
|
1,542 |
948 |
164 |
| 1,900 |
1,673 |
1,531 |
Cash and cash equivalents at beginning of the period |
|
26,076 |
27,248 |
30,292 |
| 1,673 |
1,531 |
1,176 |
Cash and cash equivalents at end of the period |
|
22,159 |
26,076 |
27,248 |
| 15.40 |
17.33 |
18.21 |
Average R/US$ rate |
|
|
|
|
| 16.29 |
17.03 |
18.85 |
Closing R/US$ rate |
|
|
|
|
1 Included in the payments made for the six months ended 30 June 2023 is R3,606 million (six months ended 30 June 2022: R4,441 million) and R127 million (six months ended 30 June 2022: R179 million) related to the Rustenburg operation acquisition (Rustenburg deferred payment) and Pandora acquisition, respectively. The payments for the six months ended 30 June 2022 also include R110 million related to the SFA (Oxford) acquisition. Payments made up to the original fair value of the liability are classified as investing cash flows, with any amount paid above the original fair value of the liability classified as operating cash flows
2 The amount includes cash consideration paid amounting to R373 million (A$30 million) for additional shares acquired in New Century on 21 February 2023 (see note 8.1)
3 This consists of cash consideration paid of R906 million in respect of NCI shareholders of New Century (see note 8.1) and R103 million in respect of the voluntary offers to NCI shareholders of Keliber (see note 8.2)
Sibanye-Stillwater Operating and financial results | Six months ended 30 June 2023 28
Notes to the consolidated interim financial statements
1. Basis of accounting and preparation
The consolidated interim financial statements are prepared in accordance with the requirements of the JSE Listings Requirements for interim results and the requirements of the Companies Act of South Africa. The JSE Listings Requirements require interim results to be prepared in accordance with framework concepts, and the measurement and recognition requirements of International Financial Reporting Standards (IFRS), the South African Institute of Chartered Accountants Financial Reporting Guides as issued by the Accounting Practices Committee and Financial Pronouncements as issued by the Financial Reporting Standards Council and to also, as a minimum, contain information required by IAS 34 Interim Financial Reporting. The accounting policies applied in the preparation of these consolidated interim financial statements are in terms of IFRS and are consistent with those applied in the previous consolidated annual financial statements, included in the 31 December 2022 annual financial report.
The condensed consolidated income statement, and statements of other comprehensive income and cash flows for the six months ended 31 December 2022 were not reviewed by the Company’s auditor and were prepared by subtracting the condensed consolidated interim financial statements for the six months ended 30 June 2022 from the consolidated financial statements for the year ended 31 December 2022.
The translation of the primary statements into US dollar is based on the average exchange rate for the period for the condensed consolidated income statement, statements of other comprehensive income and cash flows, and the period-end closing exchange rate for the condensed statement of financial position. Exchange differences on translation are accounted for in the condensed consolidated statement of other comprehensive income. This information is provided as supplementary information only and has not been reviewed by the Company's external auditor.
1.1 Standards, interpretations and amendments to published standards effective on 1 January 2023 and those issued but not yet effective
The amendments to published standards effective on 1 January 2023 and adopted by the Sibanye Stillwater Limited (Sibanye-Stillwater) group (the Group) did not have a material effect on the Group’s consolidated interim financial statements for the six months ended 30 June 2023. Standards, interpretations and amendments to published standards not yet effective on 1 January 2023 are not expected to have a material effect on the Group.
2. Revenue
The Group’s sources of revenue are:
|
|
|
|
|
|
|
|
|
|
|
|
|
|
|
Figures in million - SA rand |
|
Six months ended |
|
|
Unaudited |
Unaudited |
Unaudited |
|
|
Jun 2023 |
Dec 2022 |
Jun 2022 |
| Gold mining activities |
|
15,261 |
11,861 |
5,981 |
PGM mining activities1 |
|
35,882 |
39,017 |
45,342 |
| Nickel refining activities |
|
1,677 |
967 |
2,173 |
Zinc retreatment operation2 |
|
838 |
— |
— |
| Recycling activities (US PGM) |
|
7,692 |
15,949 |
16,318 |
Stream1 |
|
188 |
97 |
241 |
| Toll treatment arrangement |
|
— |
— |
105 |
| Total revenue from contracts with customers |
|
61,538 |
67,891 |
70,160 |
Adjustments relating to sales of PGM concentrate provisional pricing3 |
|
(638) |
18 |
219 |
Adjustments relating to Zinc operation provisional pricing3 |
|
(332) |
— |
— |
| Total revenue |
|
60,568 |
67,909 |
70,379 |
1 The difference between revenue from PGM mining activities above and total revenue from PGM mining activities per the segment report relates to the separate disclosure of revenue from the gold and palladium streaming arrangement with Wheaton Precious Metals International (Wheaton International)(Wheaton Stream) in the above as well as the separate disclosure of revenue related to adjustments on the sales of PGM concentrate. Revenue relating to the Wheaton Stream is incorporated in the Group corporate segment as described in the segment report (refer note 14)
2 The difference between revenue from zinc retreatment operations above and total revenue from zinc retreatment operations per the segment report relates to the separate disclosure of revenue related to adjustments on the provisional pricing on zinc sales
3 These adjustments relate to provisional pricing arrangements resulting in subsequent changes to the amount of revenue recognised
Revenue per geographical region of the relevant operations:
|
|
|
|
|
|
|
|
|
|
|
|
|
|
|
Figures in million - SA rand |
|
Six months ended |
|
|
Unaudited |
Unaudited |
Unaudited |
|
|
Jun 2023 |
Dec 2022 |
Jun 2022 |
| Southern Africa (SA) |
|
45,611 |
45,267 |
44,240 |
| United States (US) |
|
12,774 |
21,675 |
23,966 |
| Europe (EU) |
|
1,677 |
967 |
2,173 |
| Australia (AUS) |
|
506 |
— |
— |
| Total revenue |
|
60,568 |
67,909 |
70,379 |
Sibanye-Stillwater Operating and financial results | Six months ended 30 June 2023 29
Percentage of revenue per segment based on the geographical location of customers purchasing from the Group:
|
|
|
|
|
|
|
|
|
|
|
|
|
Six months ended |
|
Unaudited |
Unaudited |
Unaudited |
|
Jun 2023 |
Dec 2022 |
Jun 2022 |
|
|
|
| Sandouville nickel refinery |
|
|
|
| New Century zinc retreatment operation |
Sibanye-Stillwater Operating and financial results | Six months ended 30 June 2023 30
Revenue generated per product:
|
|
|
|
|
|
|
|
|
|
|
|
|
|
|
Figures in million - SA rand |
|
Six months ended |
|
|
Unaudited |
Unaudited |
Unaudited |
|
|
Jun 2023 |
Dec 2022 |
Jun 2022 |
| Gold |
|
15,807 |
12,287 |
6,525 |
| PGMs |
|
39,320 |
52,278 |
58,792 |
| Platinum |
|
9,604 |
8,817 |
9,009 |
| Palladium |
|
13,296 |
19,540 |
22,735 |
| Rhodium |
|
14,463 |
22,124 |
25,042 |
| Iridium |
|
1,353 |
1,152 |
1,328 |
| Ruthenium |
|
604 |
645 |
678 |
| Chrome |
|
2,218 |
1,675 |
1,806 |
Nickel1 |
|
2,432 |
1,540 |
2,765 |
Zinc2 |
|
483 |
— |
— |
Other3 |
|
308 |
129 |
491 |
| Total revenue |
|
60,568 |
67,909 |
70,379 |
1 For the six months ended 30 June 2023, Nickel includes R323 million (R419 million and R451 million for the six months ended 31 December 2022 and 30 June 2022, respectively) nickel salts and R1,307 million (R424 million and R1,596 million for the six months ended 31 December 2022 and 30 June 2022, respectively) nickel metal sold from the Sandouville nickel refinery. The remaining Nickel is sold from the Group's SA PGM and US PGM operations
2 Zinc sales are from the New Century zinc retreatment operation since the effective date of acquisition (see note 8.1)
3 Other primarily includes revenue from silver, cobalt and copper sales. For the six months ended 30 June 2022, revenue from the Marikana toll treatment arrangement of R105 million is also included
3. Finance expense
|
|
|
|
|
|
|
|
|
|
|
|
|
|
|
| Figures in million - SA rand |
|
Six months ended |
|
|
Unaudited |
Unaudited |
Unaudited |
|
Note |
Jun 2023 |
Dec 2022 |
Jun 2022 |
| Interest charge on: |
|
|
|
|
| Borrowings — interest |
9 |
(575) |
(515) |
(531) |
| - US$1 billion revolving credit facility (RCF) |
|
(46) |
— |
— |
| - US$600 million RCF |
|
(20) |
(34) |
(28) |
| - R5.5 billion RCF |
|
(50) |
(40) |
(115) |
| - 2026 and 2029 Notes |
|
(459) |
(441) |
(388) |
| Borrowings — unwinding of amortised cost |
9 |
(155) |
(116) |
(100) |
| - 2026 and 2029 Notes |
|
(39) |
(36) |
(32) |
| - Burnstone Debt |
|
(116) |
(80) |
(68) |
| Lease liabilities |
|
(21) |
(14) |
(17) |
| Environmental rehabilitation obligation |
|
(372) |
(309) |
(302) |
| Occupational healthcare obligation |
|
(35) |
(45) |
(40) |
| Rustenburg deferred payment |
|
(85) |
(92) |
(174) |
| Marikana dividend obligation |
|
(122) |
(76) |
(89) |
| Deferred revenue |
|
(173) |
(172) |
(154) |
| Other |
|
(146) |
(39) |
(55) |
| Total finance expense |
|
(1,684) |
(1,378) |
(1,462) |
4. Gain/(loss) on financial instruments
|
|
|
|
|
|
|
|
|
|
|
|
|
|
|
Figures in million - SA rand |
|
Six months ended |
|
|
Unaudited |
Unaudited |
Unaudited |
|
Note |
Jun 2023 |
Dec 2022 |
Jun 2022 |
Fair value gain/(loss) on palladium hedge contract1 |
|
72 |
(150) |
(91) |
Fair value gain on gold hedge contracts2 |
|
44 |
— |
— |
Fair value gain on zinc hedge contracts3 |
|
623 |
— |
— |
| Fair value adjustment on share-based payment obligations |
|
(486) |
(1,860) |
(295) |
| Loss on the revised cash flow of the Rustenburg deferred payment |
|
(4) |
(773) |
— |
| Loss on the revised cash flow of the Burnstone Debt |
9 |
— |
(776) |
— |
| Gain/(loss) on revised cash flow of the Marikana dividend obligation |
|
11 |
(625) |
(25) |
| Fair value gain on other investments |
|
102 |
129 |
23 |
| Other |
|
9 |
175 |
(11) |
| Total gain/(loss) on financial instruments |
|
371 |
(3,880) |
(399) |
1On 17 January 2020, Stillwater Mining Company (wholly owned subsidiary of Sibanye-Stillwater) concluded a palladium hedge agreement which commenced on 28 February 2020, comprising the delivery of 240,000 ounces of palladium over two years (10,000 ounces per month) with a zero cost collar which establishes a minimum and a maximum cap of US$1,500 and US$3,400 per ounce, respectively. The hedge agreement concluded on 31 January 2022. On 24 March 2021, Stillwater Mining Company concluded an additional palladium hedge agreement commencing on 28 February 2022, comprising the delivery of 140,000 ounces of palladium over a fourteen month period (10,000 ounces per month) with a zero cost collar which establishes a minimum floor and a maximum cap of US$1,800 and US$3,300 per ounce, respectively. The hedge agreement concluded in March 2023. As hedge accounting is not applied, resulting gains or losses are accounted for as gains or losses on financial instruments in profit or loss
2On 3 May 2023, Sibanye Gold Proprietary Limited concluded a gold hedge agreement which commenced on 4 May 2023. The agreement is structured at monthly average prices, comprising the delivery of 154,320 ounces of gold over 12 months (12,860 ounces per month) with a zero cost collar which establishes a floor and cap of R34,214 and R46,050 per ounce, respectively. As hedge accounting is not applied, resulting gains or losses are accounted for as gains or losses on financial instruments in profit or loss
3New Century concluded a hedge agreement on 15 June 2021 for 90,000 tonnes of payable zinc over three years which commenced July 2021 to June 2024 in equal monthly deliveries (2,500 tonnes per month) at a fixed monthly price of A$3,717/t net of all fees and costs. In November 2021, New Century concluded an additional hedge agreement for 90,000 tonnes of payable zinc for two years (3,750 tonnes per month) which commenced January 2022 to December 2023 at a fixed price of A$3,938/t net of all fees and costs. As hedge accounting is not applied, resulting gains or losses are accounted for as gains or losses on financial instruments in profit or loss
Sibanye-Stillwater Operating and financial results | Six months ended 30 June 2023 31
5. Mining and income tax
|
|
|
|
|
|
|
|
|
|
|
|
|
|
|
Figures in million - SA rand |
|
Six months ended |
|
|
Unaudited |
Unaudited |
Unaudited |
|
|
Jun 2023 |
Dec 2022 |
Jun 2022 |
| Tax on profit before tax at maximum South African statutory company tax rate (27%) |
|
(2,859) |
(2,782) |
(5,031) |
| South African gold mining tax formula rate adjustment |
|
189 |
77 |
(58) |
| US statutory tax rate adjustment |
|
(22) |
32 |
149 |
| Deferred tax rate differentials |
|
— |
16 |
— |
| Non-deductible amortisation and depreciation |
|
(1) |
43 |
(45) |
| Non-taxable dividend received |
|
— |
4 |
— |
Non-deductible finance expense |
|
(85) |
(104) |
(92) |
| Non-deductible share-based payments |
|
(3) |
(3) |
(4) |
| Non-deductible loss on fair value of financial instruments |
|
(140) |
(906) |
(70) |
| Non-taxable gain on foreign exchange differences |
|
9 |
15 |
7 |
| Non-taxable share of results of equity-accounted investees |
|
71 |
145 |
215 |
| Non-deductible impairments |
|
— |
1 |
— |
| Non-deductible transaction costs |
|
(44) |
(76) |
— |
| Tax adjustment in respect of prior periods |
|
(2) |
— |
(35) |
| Net other non-taxable income and non-deductible expenditure |
|
(262) |
140 |
16 |
| Change in estimated deferred tax rate |
|
741 |
(270) |
323 |
(Deferred tax assets unrecognised or derecognised)/unrecognised deferred tax assets recognised or utilised |
|
(396) |
372 |
(1,003) |
| Mining and income tax |
|
(2,804) |
(3,296) |
(5,628) |
| Effective tax rate |
|
26 |
% |
33 |
% |
31 |
% |
6. Earnings per share
6.1 Basic earnings per share
|
|
|
|
|
|
|
|
|
|
|
|
|
|
|
|
|
Six months ended |
|
|
Unaudited |
Unaudited |
Unaudited |
|
|
Jun 2023 |
Dec 2022 |
Jun 2022 |
| Ordinary shares in issue (’000) |
|
2,830,567 |
2,830,370 |
2,830,019 |
| Adjustment for weighting of ordinary shares in issue (’000) |
|
(79) |
(173) |
(8,114) |
| Adjusted weighted average number of shares (’000) |
|
2,830,488 |
2,830,197 |
2,821,905 |
| Profit attributable to owners of Sibanye-Stillwater (SA rand million) |
|
7,423 |
6,380 |
12,016 |
| Basic earnings per share (EPS) (cents) |
|
262 |
225 |
426 |
6.2 Diluted earnings per share
Potential ordinary shares arising from the equity-settled share-based payment scheme resulted in a dilution for the six month periods ended 30 June 2023, 31 December 2022 and 30 June 2022.
|
|
|
|
|
|
|
|
|
|
|
|
|
|
|
|
|
Six months ended |
|
|
Unaudited |
Unaudited |
Unaudited |
|
|
Jun 2023 |
Dec 2022 |
Jun 2022 |
| Weighted average number of shares |
|
|
|
|
| Adjusted weighted average number of shares (’000) |
|
2,830,488 |
2,830,197 |
2,821,905 |
| Potential ordinary shares - equity-settled share plan (’000) |
|
79 |
584 |
9,003 |
| Diluted weighted average number of shares (’000) |
|
2,830,567 |
2,830,781 |
2,830,908 |
| Diluted earnings per share (DEPS) (cents) |
|
262 |
225 |
424 |
6.3 Headline earnings per share
|
|
|
|
|
|
|
|
|
|
|
|
|
|
|
Figures in million - SA rand unless otherwise stated |
|
Six months ended |
|
|
Unaudited |
Unaudited |
Unaudited |
|
|
Jun 2023 |
Dec 2022 |
Jun 2022 |
| Profit attributable to owners of Sibanye-Stillwater |
|
7,423 |
6,380 |
12,016 |
| Gain on disposal of property, plant and equipment |
|
(74) |
(68) |
(94) |
| Impairments/(reversal of impairments) |
|
9 |
(6) |
— |
| Loss/(gain) on deconsolidation of subsidiary |
|
— |
309 |
(1) |
Foreign exchange movement recycled through profit or loss1 |
|
(1,490) |
(13) |
(1) |
| Profit on sale of Lonmin Canada |
|
— |
(145) |
— |
| Taxation effect of re-measurement items |
|
19 |
23 |
13 |
| Re-measurement items, attributable to non-controlling interest |
|
4 |
4 |
5 |
| Headline earnings |
|
5,891 |
6,484 |
11,938 |
| Adjusted weighted average number of shares (’000) |
|
2,830,488 |
2,830,197 |
2,821,905 |
| Headline EPS (cents) |
|
208 |
229 |
423 |
1 This relates to the deregistration of dormant subsidiaries in the Group which resulted in the reclassification of foreign currency translation reserve movements from other comprehensive income to profit or loss. The foreign exchange movement is included in gain on foreign exchange differences in profit or loss
Sibanye-Stillwater Operating and financial results | Six months ended 30 June 2023 32
6.4 Diluted headline earnings per share
|
|
|
|
|
|
|
|
|
|
|
|
|
|
|
Figures in million - SA rand unless otherwise stated |
|
Six months ended |
|
|
Unaudited |
Unaudited |
Unaudited |
|
|
Jun 2023 |
Dec 2022 |
Jun 2022 |
| Headline earnings |
|
5,891 |
6,484 |
11,938 |
| Diluted weighted average number of shares (’000) |
|
2,830,567 |
2,830,781 |
2,830,908 |
| Diluted headline EPS (cents) |
|
208 |
229 |
422 |
7. Dividends
Dividend policy
The Group’s dividend policy is to return between 25% to 35% of normalised earnings to shareholders and after due consideration of future requirements the dividend may be increased beyond these levels. The Board, therefore, considers normalised earnings in determining what value will be distributed to shareholders. The Board believes normalised earnings provides useful information to investors regarding the extent to which results of operations may affect shareholder returns. Normalised earnings is defined as earnings attributable to the owners of Sibanye-Stillwater excluding gains and losses on financial instruments and foreign exchange differences, impairments, gain/loss on disposal of property, plant and equipment, occupational healthcare expenses, restructuring costs, transactions costs, share-based payment expenses on BEE transactions, gain on acquisitions, net other business development costs, share of results of equity-accounted investees, all after tax and the impact of non-controlling interest, and changes in estimated deferred tax rate.
In line with Sibanye-Stillwater’s Capital allocation framework, the Board of Directors resolved to pay an interim dividend of 53 SA cents per share after 30 June 2023 (122 SA cents per share after 31 December 2022 and 138 SA cents per share after 30 June 2022), which represents 35% of normalised earnings for the period.
|
|
|
|
|
|
|
|
|
|
|
|
|
|
|
Figures in million - SA rand |
|
Six months ended |
|
|
Unaudited |
Unaudited |
Unaudited |
|
|
Jun 2023 |
Dec 2022 |
Jun 2022 |
| Profit attributable to the owners of Sibanye-Stillwater |
|
7,423 |
6,380 |
12,016 |
| Adjusted for: |
|
|
|
|
| (Gain)/loss on financial instruments |
|
(371) |
3,880 |
399 |
| Gain on foreign exchange differences |
|
(1,850) |
(476) |
(140) |
| Gain on disposal of property, plant and equipment |
|
(74) |
(68) |
(94) |
| Impairments/(reversal of impairments) |
|
9 |
(6) |
— |
Restructuring costs1 |
|
(174) |
327 |
36 |
| Transaction costs |
|
80 |
44 |
108 |
| Occupational healthcare gain |
|
(8) |
(186) |
(25) |
| Gain on increase in equity-accounted investment |
|
(2) |
— |
— |
| Loss/(gain) on deconsolidation of subsidiary |
|
— |
309 |
(1) |
| Profit on sale of Lonmin Canada |
|
— |
(145) |
— |
| Change in estimated deferred tax rate |
|
(741) |
270 |
(323) |
| Share of results of equity-accounted investees after tax |
|
(263) |
(517) |
(770) |
| Tax effect of the items adjusted above |
|
249 |
20 |
(53) |
| Non-controlling interest effect of the items listed above |
|
8 |
7 |
29 |
Normalised earnings2 |
|
4,286 |
9,839 |
11,182 |
1 Included in restructuring costs for the six months ended 30 June 2023, is R195 million reversal of the restructuring cost provisions raised at 31 December 2022 on the SA gold operations as a result of operational requirements and the employment of individuals on other operations in the Group. The reversal of the restructuring cost provisions is partially offset by restructuring cost for the six months ended 30 June 2023 at the SA gold operations (R6 million) and SA PGM operations (R15 million)
2 Normalised earnings, as defined and reconciled above, is not a measure of performance under IFRS. As a result, it should not be considered in isolation or as alternatives to any other measure of financial performance presented in accordance with IFRS. Non-IFRS measures are the responsibility of the Board
8. Acquisitions and shareholder transactions
8.1 New Century Resources Limited (New Century) business combination
On 21 February 2023, Sibanye-Stillwater announced the launch of an off-market takeover offer, through its wholly-owned subsidiary Sibanye Resources Australia Proprietary Limited, at A$1.10 cash consideration per share for all the shares in New Century that Sibanye-Stillwater did not own. New Century is an Australian base metal producer with significant zinc assets and a brownfield copper development project, which operates Australia's largest hydraulic mine at the Century Mine in Queensland, extracting, processing and marketing zinc recovered from historical tailings. The takeover is in line with the Group’s strategy to invest in the circular economy and to be a global leader in tailings retreatment and recycling.
Prior to the takeover offer, Sibanye-Stillwater was the largest shareholder in New Century with a shareholding of 19.9%. On 22 February 2023, Sibanye-Stillwater obtained a controlling shareholding of 50.15% in New Century through the on-market purchase of shares, therefore being the effective acquisition date.
New Century's financial results were consolidated from the effective date. For the four months ended 30 June 2023, New Century contributed revenue of R506 million (A$41 million) and a net loss of R568 million (A$46 million) to the Group's results. New Century's pro forma revenue and net loss would have been R1,340 million (A$110 million) and R882 million (A$71 million), respectively, had the acquisition been effective from 1 January 2023. In determining these amounts, management assumed that the fair value adjustments that arose on the date of acquisition would have been the same if the acquisition had occurred on 1 January 2023. The functional currency of New Century is Australian dollar.
The purchase price allocation on the effective date was prepared on a provisional basis in accordance with IFRS 3 for, amongst others, property, plant and equipment, contingent liabilities, provisions, as well as any deferred tax implications. If new information obtained within one year of the acquisition date, about facts and circumstances that existed at the acquisition date, identifies adjustments to the below amounts or any additional provisions that existed at the date of acquisition, then the accounting for the acquisition will be revised.
Sibanye-Stillwater Operating and financial results | Six months ended 30 June 2023 33
Consideration
The fair value of the consideration is as follows:
|
|
|
|
|
|
|
|
|
| Figures in million - SA rand |
|
|
|
|
Unaudited |
|
|
Jun 2023 |
| Total fair value of investment in New Century prior to acquisition |
|
730 |
Fair value of original investment in New Century1 |
|
357 |
Consideration paid for investment in associate2 |
|
373 |
Cash consideration paid to obtain control3 |
|
194 |
| Total consideration |
|
924 |
1 This represents Sibanye-Stillwater's 19.89% investment in New Century acquired in 2021. Sibanye-Stillwater held 26,184,675 shares which were revalued at A$1.1 per share, being the offer price for the take-over, directly before the acquisition of New Century. A fair value gain of R99 million was recognised in fair value adjustment on other investments as detailed in other comprehensive income
2 This represents 27,245,481 shares purchased by Sibanye-Stillwater at A$1.1 per share on 21 February 2023 for a cash consideration of A$30 million (R373 million). With this share purchase Sibanye-Stillwater obtained an additional 20.69% interest in New Century, resulting in a total shareholding of 40.58% prior to the acquisition date
3 The cash consideration paid to obtain control was for the purchase of 14,257,682 shares at A$1.1 per share on 22 February 2023, amounting to A$15.7 million (R194 million) and an additional 9.57% interest in New Century, resulting in a total shareholding of 50.15%
Acquisition related costs
The Group incurred total acquisition related costs of R18 million for the six months ended 30 June 2023 on advisory and legal fees. These costs are recognised as transaction costs in profit or loss during the period in which incurred.
Identified assets acquired and liabilities assumed
The following table summarises the recognised amounts of assets acquired and liabilities assumed at the acquisition date:
|
|
|
|
|
|
|
|
|
| Figures in million - SA rand |
|
|
|
|
Unaudited |
|
|
Jun 2023 |
Property, Plant and equipment2 |
|
4,610 |
Right-of-use assets1 |
|
293 |
Other receivables1 |
|
142 |
Environmental rehabilitation obligation funds1 |
|
329 |
Inventories1,2 |
|
422 |
Trade and other receivables1 |
|
262 |
Cash and cash equivalents1,3 |
|
418 |
Lease liabilities1 |
|
(315) |
Environmental rehabilitation obligation and other provisions2 |
|
(2,363) |
Other payables1,2 |
|
(863) |
Borrowings1 |
|
(3) |
Deferred revenue1 |
|
(198) |
Trade and other payables1 |
|
(606) |
Tax and royalties payable1 |
|
(285) |
| Fair value of identifiable net assets acquired |
|
1,843 |
1 Carrying value approximate fair value, except as detailed in footnote 2 below
2 Fair value of assets and liabilities for which the carrying value does not approximate fair value, excluding those not within the IFRS 3 measurement scope, were determined as follows:
•The fair value of property, plant and equipment was based on an income approach consisting of a discounted cash flow model, and where necessary, fair values were limited to the relevant depreciated replacement cost
•The fair value of inventories in respect of zinc concentrate was based on an assessment of net realisable value
•The fair value of the environmental rehabilitation obligation was calculated using a discounted cash flow model considering the cost of rehabilitating and decommissioning the mine and relevant infrastructure
•The fair value of a royalty liability, included in other payables, was based on an income approach consisting of a discounted cash flow model
•The fair value of a zinc hedge liability, included in other payables, was valued through a third party module based on the specifications of the existing hedge agreements and utilising relevant LME price inputs
3 The transaction results in net cash acquired of R224 million based on cash and cash equivalents acquired of R418 million and cash consideration paid of R194 million
The table below summarises the value of the consideration paid and NCI recognised at the date of acquisition:
|
|
|
|
|
|
|
|
|
| Figures in million - SA rand |
|
|
|
|
Unaudited |
|
|
Jun 2023 |
| Consideration |
|
924 |
| Fair value of identifiable net assets acquired |
|
(1,843) |
NCI1 |
|
919 |
1 The amount recognised as NCI represents the NCI holders' effective proportionate share (49.85%) in the fair value of the identifiable net assets acquired
Subsequent shareholder transactions
Sibanye-Stillwater acquired additional shares in New Century through its original take-over offer subsequent to the effective date of the acquisition. On 10 May 2023, Sibanye-Stillwater, through on- and off-market trades, obtained a 100% interest in New Century through cash consideration paid of A$74 million (R906 million) for the additional 49.85% interest in New Century.
Sibanye-Stillwater Operating and financial results | Six months ended 30 June 2023 34
The table below illustrates the effect of the remaining interest acquired in New Century on equity attributable to the owners of Sibanye-Stillwater for the six months ended 30 June 2023:
|
|
|
|
|
|
|
|
|
| Figures in million - SA rand |
|
|
|
|
Unaudited |
|
|
Jun 2023 |
| Consideration paid for acquiring the remaining 49.85% interest in New Century |
|
(906) |
| Carrying value of NCI |
|
914 |
Total impact on equity attributable to owners of Sibanye-Stillwater1 |
|
8 |
1 The amount includes R13 million increase on accumulated profit and R5 million decrease on other reserves in respect of foreign currency translation reserve
8.2 Transactions with Keliber shareholders
On 25 April 2023 the Finnish Minerals Group increased its holding in Keliber from 14% to 20% by subscribing for EUR53.9 million (R1,096 million) of a EUR104 million rights issue. The Group's portion of the subscription (through wholly-owned subsidiary, Keliber Lithium Proprietary Limited) amounted to EUR50.2 million (R1,009 million) which is eliminated on a Sibanye-Stillwater Group level. In addition to the rights issue, other minority shareholders in Keliber (which held 0.79% of the total Keliber shareholding) for which the Group previously recognised an accelerated put option liability at 31 December 2022, received and accepted voluntary offers at the same share price (EUR157.28 per share) as the voluntary offer that concluded in 2022. A total payment of EUR5.2 million (R103 million) was made by the Group to all the shareholders who accepted the voluntary offers during June 2023. Following these transactions, the Finnish Minerals Group holds 20% in Keliber, the Group retained approximately 79%, while other minority shareholders hold the balance of the shares in Keliber.
The below table summarises the above transactions and the impact thereof on the equity attributable to the owners of Sibanye-Stillwater:
|
|
|
|
|
|
| Figures in million - SA rand |
|
|
Unaudited |
|
Jun 2023 |
| Rights issue and voluntary offers |
|
| Cash consideration paid on rights issue subscription by the Group |
(1,009) |
| Payment eliminated on consolidation |
1,009 |
| Cash consideration received from rights issue subscription by NCI |
1,096 |
| Cash consideration paid by the Group to NCI on voluntary offer |
(103) |
| Net cash received by the Group |
993 |
| Net reattribution of equity (accumulated profit and foreign currency translation reserve) |
(596) |
| Net increase on equity attributable to the owners of Sibanye-Stillwater as a result of the transactions with Keliber shareholders |
397 |
| Increase in accumulated profit |
463 |
| Decrease in foreign currency translation reserve |
(66) |
| Increase in NCI |
700 |
| Net increase on total equity as a result of the transactions with Keliber shareholders |
1,097 |
9. Borrowings
|
|
|
|
|
|
|
|
|
|
|
|
|
|
|
Figures in million - SA rand |
|
Six months ended |
|
|
Unaudited |
Unaudited |
Unaudited |
|
Notes |
Jun 2023 |
Dec 2022 |
Jun 2022 |
| Balance at beginning of the period |
|
22,728 |
20,887 |
20,298 |
| Borrowings acquired on acquisition of subsidiaries |
8 |
3 |
— |
39 |
| Loans raised |
|
1,000 |
2,500 |
5,500 |
US$1 billion RCF1 |
|
— |
— |
— |
R5.5 billion RCF2 |
|
1,000 |
2,500 |
5,500 |
| Loans repaid |
|
(1,008) |
(2,502) |
(5,501) |
US$1 billion RCF1 |
|
— |
— |
— |
R5.5 billion RCF2 |
|
(1,000) |
(2,500) |
(5,500) |
| Other borrowings |
|
(8) |
(2) |
(1) |
| Unwinding of loans recognised at amortised cost |
3 |
155 |
116 |
100 |
| Accrued interest |
3 |
575 |
515 |
531 |
| Accrued interest paid |
|
(598) |
(516) |
(545) |
| 2026 and 2029 Notes |
|
(483) |
(442) |
(402) |
| R5.5 billion, US$1 billion and US$600 million RCFs |
|
(115) |
(74) |
(143) |
| Loss on the revised cash flow of the Burnstone Debt |
4 |
— |
776 |
— |
| Loss on foreign exchange differences and foreign currency translation |
|
2,457 |
952 |
465 |
| Balance at end of the period |
|
25,312 |
22,728 |
20,887 |
1 On 6 April 2023, the Group concluded the refinancing of the US$600 million RCF. The new facility is a minimum of US$1 billion RCF for a period of three years, with two optional 1-year extensions (3+1+1), from the effective date of the facility. The facility is linked to a secured overnight financing rate, which was used as a replacement for the US LIBOR upon refinancing of the RCF
2 The R5.5 billion RCF matures on 11 November 2024
Sibanye-Stillwater Operating and financial results | Six months ended 30 June 2023 35
Borrowings consist of:
|
|
|
|
|
|
|
|
|
|
|
|
|
|
|
Figures in million - SA rand |
|
Six months ended |
|
|
Unaudited |
Unaudited |
Unaudited |
|
|
Jun 2023 |
Dec 2022 |
Jun 2022 |
US$1 billion RCF1 |
|
— |
— |
— |
R5.5 billion RCF1,2 |
|
— |
— |
— |
| 2026 and 2029 Notes |
|
22,331 |
20,140 |
19,229 |
Burnstone Debt2 |
|
2,931 |
2,540 |
1,611 |
Other borrowings3 |
|
50 |
48 |
47 |
| Borrowings |
|
25,312 |
22,728 |
20,887 |
| Current portion of borrowings |
|
(135) |
(122) |
(115) |
| Non-current borrowings |
|
25,177 |
22,606 |
20,772 |
1 The facility is undrawn at 30 June 2023 and at the date of this report
2 The R5.5 billion RCF and the Burnstone debt are affected by the IBOR reform amendments to IFRS, which came into effect on 1 January 2021. The R5.5 billion RCF is linked to JIBAR, however the JIBAR is only expected to be impacted by the reform at a later stage and any impact thereof is to be considered when this occurs. The Burnstone debt is linked to a US LIBOR and the Group is in process to transition the debt facility to a new interest rate. The impact on the Burnstone debt due to IBOR reform is unknown at 30 June 2023 and will be assessed when further detail is available in respect of the transition to a new interest rate
3 Other borrowings consist mainly of overnight facilities and borrowings acquired on acquisition of Keliber, Sandouville and New Century
9.1 Capital management
The following are contractually due, undiscounted cash flows resulting from maturities of borrowings, including interest payments:
|
|
|
|
|
|
|
|
|
|
|
|
|
|
|
|
|
|
|
|
|
|
|
|
Figures in million - SA rand |
|
|
|
|
|
|
|
|
|
Total |
Within one year |
Between one and two years |
Between two and three years |
Between three and five years |
After five years |
| 30 June 2023 (Unaudited) |
|
|
|
|
|
|
|
| - Capital |
|
|
|
|
|
|
|
| 2026 and 2029 Notes |
|
22,620 |
— |
— |
— |
12,724 |
9,896 |
| Burnstone Debt |
|
147 |
7 |
63 |
77 |
— |
— |
| Other borrowings |
|
50 |
20 |
6 |
5 |
10 |
9 |
| - Interest |
|
14,373 |
957 |
955 |
1,027 |
1,212 |
10,222 |
Net debt/(cash) to adjusted EBITDA
|
|
|
|
|
|
|
|
|
|
|
|
|
|
|
Figures in million - SA rand |
|
Rolling 12 months |
|
|
Unaudited |
Unaudited |
Unaudited |
|
|
Jun 2023 |
Dec 2022 |
Jun 2022 |
Borrowings1 |
|
22,381 |
20,188 |
19,276 |
Cash and cash equivalents2 |
|
22,119 |
26,038 |
27,211 |
Net debt/(cash)3 |
|
262 |
(5,850) |
(7,935) |
Adjusted EBITDA4 (12 months) |
|
32,697 |
41,111 |
50,618 |
Net debt/(cash) to adjusted EBITDA (ratio)5 |
|
0.01 |
(0.14) |
(0.16) |
1Borrowings are only those borrowings that have recourse to Sibanye-Stillwater. Borrowings, therefore, exclude the Burnstone Debt
2Cash and cash equivalents exclude cash of Burnstone
3Net debt/(cash) represents borrowings and bank overdraft less cash and cash equivalents. Borrowings are only those borrowings that have recourse to Sibanye-Stillwater and, therefore, exclude the Burnstone Debt. Net debt/(cash) excludes cash of Burnstone
4The adjusted earnings before interest, taxes, depreciation and amortisation (EBITDA) calculation included is based on the definitions included in the facility agreements for compliance with the debt covenant formula, except for impact of new accounting standards, project finance subsidiaries (Burnstone) and acquisitions, where the facility agreements allow the results from the acquired operations to be annualised. Adjusted EBITDA may not be comparable to similarly titled measures of other companies. Adjusted EBITDA as defined and reconciled below, is not a measure of performance under IFRS and should be considered in addition to, and not as a substitute for any other measure of financial performance and liquidity
5Net debt/(cash) to adjusted EBITDA ratio is defined as net debt as of the end of a reporting period divided by adjusted EBITDA of the 12 months ended on the same reporting date. Net debt/(cash) to adjusted EBITDA is not a measure of performance under IFRS. As a result, it should not be considered in isolation or as alternatives to any other measure of financial performance presented in accordance with IFRS. Non-IFRS measures are the responsibility of the Board
Sibanye-Stillwater Operating and financial results | Six months ended 30 June 2023 36
Reconciliation of profit before royalties, carbon tax and tax to adjusted EBITDA
|
|
|
|
|
|
|
|
|
|
|
|
|
|
|
Figures in million - SA rand |
|
Six months ended |
|
|
Unaudited |
Unaudited |
Unaudited |
|
|
Jun 2023 |
Dec 2022 |
Jun 2022 |
| Profit before royalties, carbon tax and tax |
|
11,183 |
10,800 |
18,928 |
| Adjusted for: |
|
|
|
|
| Amortisation and depreciation |
|
4,731 |
3,863 |
3,224 |
| Interest income |
|
(718) |
(614) |
(589) |
| Finance expense |
|
1,684 |
1,378 |
1,462 |
| Share-based payments |
|
43 |
106 |
112 |
| (Gain)/loss on financial instruments |
|
(371) |
3,880 |
399 |
| Gain on foreign exchange differences |
|
(1,850) |
(476) |
(140) |
| Share of results of equity-accounted investees after tax |
|
(263) |
(517) |
(770) |
| Change in estimate of environmental rehabilitation obligation, and right of recovery receivable and payable |
|
— |
(71) |
— |
| Gain on disposal of property, plant and equipment |
|
(74) |
(68) |
(94) |
| Impairments/(reversal of impairments) |
|
9 |
(6) |
— |
Restructuring costs |
|
(174) |
327 |
36 |
| Transaction costs |
|
80 |
44 |
108 |
| IFRS 16 lease payments |
|
(123) |
(74) |
(89) |
| Occupational healthcare gain |
|
(8) |
(186) |
(25) |
| Gain on increase in equity-accounted investment |
|
(2) |
— |
— |
| Loss/(gain) on deconsolidation of subsidiary |
|
— |
309 |
(1) |
| Profit on sale of Lonmin Canada |
|
— |
(145) |
— |
| Adjusted EBITDA |
|
14,147 |
18,550 |
22,561 |
10. Other payables
|
|
|
|
|
|
|
|
|
|
|
|
|
|
|
Figures in million - SA rand |
|
|
|
|
Unaudited |
Unaudited |
Unaudited |
|
|
Jun 2023 |
Dec 2022 |
Jun 2022 |
Rustenburg deferred payment1 |
|
— |
3,518 |
2,653 |
| Right of recovery payable |
|
26 |
34 |
34 |
| Deferred consideration (related to the Pandora acquisition) |
|
26 |
128 |
239 |
| Marikana dividend obligation |
|
2,049 |
2,129 |
1,428 |
Keliber dividend obligation2 |
|
822 |
— |
— |
| Other non-current payables |
|
875 |
582 |
531 |
| Other payables |
|
3,798 |
6,391 |
4,885 |
| Current portion of other payables |
|
(451) |
(3,891) |
(2,856) |
| Non-current other payables |
|
3,347 |
2,500 |
2,029 |
1 The Rustenburg deferred payment was settled in cash on 30 March 2023
2 During April 2023, Sibanye-Stillwater (through its wholly-owned subsidiary, Keliber Lithium Proprietary Limited) signed a revised shareholders' agreement with the Finnish Minerals Group, which resulted in a contractual obligation to declare dividends amounting to 40% of the free cash flow of Keliber. A dividend obligation was recognised for the NCI of Keliber on the effective date of the agreement (25 April 2023) at R792 million, with a corresponding reduction in NCI. The Group's attributable portion of the dividend obligation eliminates on consolidation. The dividend obligation is a financial liability and was initially measured at fair value less any directly attributable costs, and subsequently measured at amortised cost. The following assumptions were applied in the fair value measurement of the dividend obligation on the recognition date:
•Long term lithium hydroxide price: US$18,500/t
•Real discount rate: 9.83%
•Inflation rate: 2.5%
•Life-of-mine: 25 years
11. Fair value of financial assets and financial liabilities, and risk management
11.1 Measurement of fair value
The Group uses the following hierarchy for determining and disclosing the fair value of financial instruments:
•Level 1: unadjusted quoted prices in active markets for identical assets or liabilities
•Level 2: inputs other than quoted prices in level 1 that are observable for the asset or liability, either directly (as prices) or indirectly (derived from prices)
•Level 3: inputs for the asset or liability that are not based on observable market data (unobservable inputs)
Sibanye-Stillwater Operating and financial results | Six months ended 30 June 2023 37
The following table sets out the Group’s significant financial instruments measured at fair value by level within the fair value hierarchy:
|
|
|
|
|
|
|
|
|
|
|
|
|
|
|
|
|
|
|
|
|
|
|
|
|
|
|
|
|
|
Figures in million - SA rand |
|
|
|
|
|
|
|
|
|
|
Unaudited |
Unaudited |
Unaudited |
|
Jun 2023 |
Dec 2022 |
Jun 2022 |
|
Level 1 |
Level 2 |
Level 3 |
Level 1 |
Level 2 |
Level 3 |
Level 1 |
Level 2 |
Level 3 |
| Financial assets measured at fair value |
|
|
|
|
|
|
|
|
|
Environmental rehabilitation obligation funds1 |
4,746 |
809 |
— |
4,528 |
778 |
— |
4,469 |
750 |
— |
Trade receivables - PGM concentrate sales2 |
— |
2,632 |
— |
— |
3,564 |
— |
— |
3,570 |
— |
Trade receivables - Zinc provisional price sales2 |
— |
79 |
— |
— |
— |
— |
— |
— |
— |
Other investments3 |
2,093 |
— |
960 |
2,320 |
— |
855 |
2,111 |
— |
677 |
Palladium hedge contract4 |
— |
— |
— |
— |
50 |
— |
— |
193 |
— |
Gold hedge contracts4 |
— |
44 |
— |
— |
— |
— |
— |
— |
— |
Zinc hedge contracts4 |
— |
149 |
— |
— |
— |
— |
— |
— |
— |
1 Environmental rehabilitation obligation funds comprise a fixed income portfolio of bonds as well as fixed and notice deposits. The environmental rehabilitation obligation funds are stated at fair value based on the nature of the fund’s investments
2 The fair value for trade receivables measured at fair value through profit or loss are determined based on ruling market prices, volatilities and interest rates
3 The fair values of listed investments are based on the quoted prices available from the relevant stock exchanges. The carrying amounts of other short-term investment products with short maturity dates approximate fair value. The fair values of non-listed investments are determined through valuation techniques that include inputs that are not based on observable market data. These inputs include price/book ratios as well as marketability and minority shareholding discounts which are impacted by the size of the shareholding. The difference between other investments in the statement of financial position and the table above, relates to investments measured at amortised cost, with carrying amounts that approximate fair values
4 The fair value of the palladium and gold hedge is determined using a Monte Carlo simulation model based on market forward prices, volatilities and interest rates. The fair value of the zinc hedge is determined by calculating the delta of the relevant forward curves relating to the fixed and floating elements of the swaps, and discounting the result using a market-related discount rate
Fair value of financial instruments
The table below shows the fair value and carrying amount of financial instruments where the carrying amount does not approximate fair value:
|
|
|
|
|
|
|
|
|
|
|
|
|
|
|
Figures in million - SA rand |
|
|
|
|
|
Carrying value |
Fair Value |
|
Level 1 |
Level 2 |
Level 3 |
| 30 June 2023 (Unaudited) |
|
|
|
|
2026 and 2029 Notes1 |
22,331 |
19,400 |
— |
— |
Burnstone Debt2 |
2,931 |
— |
— |
2,568 |
| Total |
25,262 |
19,400 |
— |
2,568 |
| 31 December 2022 (Unaudited) |
|
|
|
|
2026 and 2029 Notes1 |
20,140 |
17,379 |
— |
— |
Burnstone Debt2 |
2,540 |
— |
— |
2,245 |
| Total |
22,680 |
17,379 |
— |
2,245 |
| 30 June 2022 (Unaudited) |
|
|
|
|
2026 and 2029 Notes1 |
19,229 |
15,965 |
— |
— |
Burnstone Debt2 |
1,611 |
— |
— |
2,614 |
| Total |
20,840 |
15,965 |
— |
2,614 |
1 The fair value is based on the quoted market prices of the notes
2 The fair value of the Burnstone Debt has been derived from discounted cash flow models. These models use several key assumptions, including estimates of future sales volumes, gold prices, operating costs, capital expenditure and discount rate. The Burnstone long-term gold price at 30 June 2023 and 31 December 2022 was R793,473/kg (30 June 2022: R729,270/kg) and the discount rate applied was 10.64% (31 December 2022: 10.52%, 30 June 2022: 5.55%). The fair value estimate is sensitive to changes in the key assumptions, for example, increases in the market related discount rate would decrease the fair value if all other inputs remain unchanged. The extent of the fair value changes would depend on how inputs change in relation to each other
11.2 Risk management activities
Liquidity risk: working capital and going concern assessment
For the six months ended 30 June 2023, the Group realised a profit of R7,786 million (31 December 2022: R6,639 million and 30 June 2022: R12,341 million). As at 30 June 2023 the Group’s current assets exceeded its current liabilities by R38,630 million (31 December 2022: R40,545 million) and the Group’s total assets exceeded its total liabilities by R100,164 million (31 December 2022: R91,004 million). During the six months ended 30 June 2023 the Group generated net cash from operating activities of R4,943 million (31 December 2022: R11,154 million and 30 June 2022: R4,389 million).
The Group currently has committed undrawn debt facilities of R25,035 million at 30 June 2023 (31 December 2022: R16,403 million) and cash balances of R22,159 million (31 December 2022: R26,076 million). The Group concluded the refinancing of its US$600 million RCF to a US$1 billion RCF during the six months ended 30 June 2023, and the most immediate debt maturity is the R5.5 billion ZAR RCF maturing in November 2024. The Group’s leverage ratio (net debt/(cash) to adjusted EBITDA) as at 30 June 2023 was 0.01:1 (31 December 2022 was (0.14):1 and 30 June 2022 was (0.16):1) and its interest coverage ratio (adjusted EBITDA to net finance charges) was 1,273.0:1 (31 December 2022 was 93.0:1 and 30 June 2022 was (2,532.0):1). Both considerably better than the maximum permitted leverage ratio of at most 2.5:1 and minimum required interest coverage ratio of 4.0:1, calculated on a quarterly basis, required under the US$1 billion RCF and the R5.5 billion RCF. At the date of approving these consolidated interim financial statements, both RCFs are undrawn and there were no significant events which had a significant negative impact on the Group’s strong liquidity position.
Notwithstanding the exceptionally strong liquidity position and financial outlook, events such as the outbreak of infectious diseases or natural disaster events could impose restrictions on all or some of our operations. Events such as these could negatively impact the production outlook and deteriorate the Group’s forecasted liquidity position which may require the Group to further increase operational flexibility by adjusting mine plans and reducing capital expenditure. The Group could also, if necessary, consider options to increase funding flexibility which may include, amongst others, additional loan facilities or debt capital market issuances, streaming facilities, prepayment facilities or, if other options are not deemed preferable or achievable by the Board, an equity capital raise. The Group could also, with lender approval, request covenant amendments or restructure facilities. During past adversity, management has successfully implemented similar actions.
Management believes that the cash forecasted to be generated by operations, cash on hand, the committed unutilised debt facilities as well as additional funding opportunities will enable the Group to continue to meet its obligations as they fall due for a period of at least eighteen months after the reporting date. The consolidated interim financial statements for the six months ended 30 June 2023, therefore, have been prepared on a going concern basis.
Sibanye-Stillwater Operating and financial results | Six months ended 30 June 2023 38
12. Contingent liabilities
12.1 Notice from Appian Capital to commence legal proceedings
On 26 October 2021, Sibanye-Stillwater entered into share purchase agreements to acquire the Santa Rita nickel mine and Serrote copper mine (the Atlantic Nickel SPA and the MVV SPA, respectively) from affiliates of Appian Capital Advisory LLP (Appian). Subsequent to signing the agreements, Appian informed Sibanye-Stillwater that a geotechnical event occurred at the Santa Rita open pit operation. After becoming aware of the geotechnical event, Sibanye-Stillwater assessed the event and its effect and concluded that the event was and was reasonably expected to be material and adverse to the business, financial condition, results of operations, the properties, assets, liabilities or operations of Santa Rita. Accordingly, pursuant to the terms of the Atlantic Nickel SPA, on 24 January 2022, Sibanye-Stillwater gave notice of termination of the Atlantic Nickel SPA. As the MVV SPA was conditional on the closing of the Atlantic Nickel SPA, which had become impossible to satisfy, on the same date Sibanye-Stillwater also gave notice of termination of the MVV SPA.
On 27 May 2022, Appian initiated legal proceedings before the High Court of England and Wales against Sibanye-Stillwater. On 3 August 2022, the Group filed its defence. Sibanye-Stillwater’s view is that the Atlantic Nickel SPA and the MVV SPA were rightfully terminated and the Group is confident that the claim will be defended successfully. The trial is set to begin in June 2024, with the key pre-trial steps taking place over the remainder of 2023. The proceedings are in early stages and additional information and estimates of potential outcomes are unavailable.
13. Events after the reporting period
There were no events that could have a material impact on the financial results of the Group after 30 June 2023, up to the date on which the consolidated interim financial statements for the six months ended 30 June 2023 was authorised for issue, other than those discussed below:
13.1 Completion of earn-in arrangement by Aldebaran Resources Inc. (Aldebaran)
Aldebaran completed the earn-in of a 60% shareholding in Peregrine Metals Limited (Peregrine) on 14 August 2023 by completing the US$30 million spend at the Altar copper-gold project in San Juan Province in Argentina (Altar project), under the terms of the arrangement entered into in 2018 with Sibanye-Stillwater (through its wholly-owned subsidiary Stillwater Canada LLC). Additionally, Aldebaran has notified Sibanye-Stillwater that it intends to proceed with the second option under the arrangement to spend an additional US$25 million at the Altar project over a three-year period to acquire an additional 20% interest in Peregrine. Subsequent to the completion of the earn-in by Aldebaran, Sibanye-Stillwater will continue to equity account its effective 40% shareholding in Peregrine. Management is in the process of determining the accounting implications of Aldebaran exercising its option to earn-in the additional 20%.
13.2 Incidents affecting expected production at the SA gold operations
After 30 June 2023 the SA gold operations suffered incidents at the Driefontein 5 shaft and Kloof 4 shaft which will have an impact on the expected production for the six months ending 31 December 2023 at Driefontein and Kloof.
On 12 July 2023, a fire at Driefontein 5 shaft disrupted operations at both Driefontein 1 and 5 shafts. Whilst most of the crews at Driefontein 1 shaft returned to work and were operational by the beginning of August, the crews from the Driefontein 5 shaft area will only be reintroduced in a phased manner once the fire is extinguished and the area becomes safe to operate in.
In a second incident on 30 July 2023 during a standard safety trial run of the conveyance system at Kloof 4 shaft, conducted prior to hoisting employees up the shaft, infrastructure damage occurred when the ascending counterweight to the conveyance encountered an unknown obstruction in the shaft, resulting in a number of ballast plates falling down the shaft. As a result of the incident, access via the shaft to underground levels between 39 and 46 levels was restricted and operations at the Kloof 4 shaft was suspended. This incident is still under investigation and the impact is being assessed.
Sibanye-Stillwater Operating and financial results | Six months ended 30 June 2023 39
14. Segment reporting
Figures are in millions
|
|
|
|
|
|
|
|
|
|
|
|
|
|
|
|
|
|
|
|
|
|
|
|
|
|
|
|
|
|
|
|
|
|
|
|
|
|
|
|
|
|
|
|
|
|
|
|
|
|
|
|
|
|
|
|
|
|
|
|
|
|
|
|
|
|
|
|
|
|
For the six months ended 30 Jun 2023 (Unaudited) |
For the six months ended 31 Dec 2022 (Unaudited) |
For the six months ended 30 Jun 2022 (Unaudited) |
|
GROUP |
AMERICAS |
SOUTHERN AFRICA |
EUROPE |
AUSTRALIA |
GROUP |
GROUP |
AMERICAS |
SOUTHERN AFRICA |
EUROPE |
GROUP |
GROUP |
AMERICAS |
SOUTHERN AFRICA |
EUROPE |
GROUP |
| SA rand |
Total |
Total US PGM |
Total SA
operations |
Total
SA PGM |
Total
SA gold |
Total EU
operations |
Total AUS operations |
Cor-
porate1
|
Total |
Total US PGM |
Total SA
operations |
Total
SA PGM |
Total
SA gold |
Total EU
operations |
Cor-
porate1
|
Total |
Total US PGM |
Total SA
operations |
Total
SA PGM |
Total
SA gold |
Total EU
operations |
Cor-
porate1
|
| Revenue |
60,568 |
12,909 |
45,611 |
30,350 |
15,261 |
1,677 |
506 |
(135) |
67,909 |
21,960 |
45,267 |
33,406 |
11,861 |
967 |
(285) |
70,379 |
24,130 |
44,240 |
38,259 |
5,981 |
2,173 |
(164) |
| Underground |
44,927 |
5,217 |
39,845 |
28,599 |
11,246 |
— |
— |
(135) |
45,437 |
6,011 |
39,711 |
31,658 |
8,053 |
— |
(285) |
46,888 |
7,812 |
39,240 |
36,524 |
2,716 |
— |
(164) |
| Surface |
6,272 |
— |
5,766 |
1,751 |
4,015 |
— |
506 |
— |
5,556 |
— |
5,556 |
1,748 |
3,808 |
— |
— |
5,000 |
— |
5,000 |
1,735 |
3,265 |
— |
— |
| Recycling/processing |
9,369 |
7,692 |
— |
— |
— |
1,677 |
— |
— |
16,916 |
15,949 |
— |
— |
— |
967 |
— |
18,491 |
16,318 |
— |
— |
— |
2,173 |
— |
| Cost of sales, before amortisation and depreciation |
(44,938) |
(11,487) |
(30,271) |
(18,133) |
(12,138) |
(2,329) |
(851) |
— |
(47,512) |
(18,892) |
(27,114) |
(15,499) |
(11,615) |
(1,506) |
— |
(47,025) |
(19,560) |
(25,340) |
(16,781) |
(8,559) |
(2,125) |
— |
| Underground |
(30,631) |
(4,166) |
(26,465) |
(17,246) |
(9,219) |
— |
— |
— |
(26,897) |
(3,619) |
(23,278) |
(14,575) |
(8,703) |
— |
— |
(25,837) |
(3,840) |
(21,997) |
(15,953) |
(6,044) |
— |
— |
| Surface |
(4,657) |
— |
(3,806) |
(887) |
(2,919) |
— |
(851) |
— |
(3,836) |
— |
(3,836) |
(924) |
(2,912) |
— |
— |
(3,343) |
— |
(3,343) |
(828) |
(2,515) |
— |
— |
| Recycling/processing |
(9,650) |
(7,321) |
— |
— |
— |
(2,329) |
— |
— |
(16,779) |
(15,273) |
— |
— |
— |
(1,506) |
— |
(17,845) |
(15,720) |
— |
— |
— |
(2,125) |
— |
Net other cash costs2 |
(1,483) |
(75) |
(1,171) |
(423) |
(748) |
(11) |
(157) |
(69) |
(1,847) |
(83) |
(1,610) |
(924) |
(686) |
(99) |
(55) |
(793) |
49 |
(854) |
(326) |
(528) |
12 |
— |
| Adjusted EBITDA |
14,147 |
1,347 |
14,169 |
11,794 |
2,375 |
(663) |
(502) |
(204) |
18,550 |
2,985 |
16,543 |
16,983 |
(440) |
(638) |
(340) |
22,561 |
4,619 |
18,046 |
21,152 |
(3,106) |
60 |
(164) |
| Amortisation and depreciation |
(4,731) |
(1,553) |
(2,512) |
(1,369) |
(1,143) |
(97) |
(569) |
— |
(3,863) |
(1,379) |
(2,387) |
(1,256) |
(1,131) |
(97) |
— |
(3,224) |
(1,424) |
(1,739) |
(1,162) |
(577) |
(61) |
— |
| Interest income |
718 |
113 |
595 |
279 |
316 |
1 |
8 |
1 |
614 |
143 |
471 |
207 |
264 |
— |
— |
589 |
166 |
422 |
195 |
227 |
— |
1 |
| Finance expense |
(1,684) |
(531) |
(841) |
(401) |
(440) |
(19) |
(120) |
(173) |
(1,378) |
(507) |
(691) |
(329) |
(362) |
(8) |
(172) |
(1,462) |
(445) |
(856) |
(502) |
(354) |
(7) |
(154) |
| Share-based payments |
(43) |
(12) |
(22) |
(2) |
(20) |
(5) |
— |
(4) |
(106) |
(17) |
(87) |
(34) |
(53) |
— |
(2) |
(112) |
(30) |
(82) |
(39) |
(43) |
— |
— |
Net other3 |
2,607 |
89 |
1,698 |
1,438 |
260 |
158 |
652 |
10 |
(2,742) |
(156) |
(2,742) |
(2,525) |
(217) |
116 |
40 |
600 |
(87) |
687 |
500 |
187 |
(5) |
5 |
Non-underlying items4 |
169 |
3 |
252 |
29 |
223 |
— |
(8) |
(78) |
(275) |
(7) |
(234) |
(140) |
(94) |
— |
(34) |
(24) |
2 |
81 |
8 |
73 |
— |
(107) |
| Royalties and carbon tax |
(593) |
— |
(541) |
(479) |
(62) |
— |
(52) |
— |
(865) |
— |
(865) |
(818) |
(47) |
— |
— |
(959) |
— |
(959) |
(954) |
(5) |
— |
— |
| Profit/(loss) before tax |
10,590 |
(544) |
12,798 |
11,289 |
1,509 |
(625) |
(591) |
(448) |
9,935 |
1,062 |
10,008 |
12,088 |
(2,080) |
(627) |
(508) |
17,969 |
2,801 |
15,600 |
19,198 |
(3,598) |
(13) |
(419) |
| Current taxation |
(2,390) |
(10) |
(2,363) |
(2,160) |
(203) |
(16) |
(1) |
— |
(4,345) |
(318) |
(4,023) |
(3,903) |
(120) |
— |
(4) |
(4,937) |
(337) |
(4,600) |
(4,470) |
(130) |
— |
— |
| Deferred taxation |
(414) |
828 |
(1,216) |
(902) |
(314) |
(24) |
— |
(2) |
1,049 |
202 |
886 |
(364) |
1,250 |
(39) |
— |
(691) |
113 |
(804) |
(968) |
164 |
— |
— |
| Profit/(loss) for the period |
7,786 |
274 |
9,219 |
8,227 |
992 |
(665) |
(592) |
(450) |
6,639 |
946 |
6,871 |
7,821 |
(950) |
(666) |
(512) |
12,341 |
2,577 |
10,196 |
13,760 |
(3,564) |
(13) |
(419) |
| Attributable to: |
|
|
|
|
|
|
|
|
|
|
|
|
|
|
|
|
|
|
|
|
|
|
| Owners of the parent |
7,423 |
274 |
8,836 |
8,227 |
609 |
(645) |
(592) |
(450) |
6,380 |
946 |
6,598 |
7,817 |
(1,219) |
(652) |
(512) |
12,016 |
2,577 |
9,871 |
13,760 |
(3,889) |
(13) |
(419) |
| Non-controlling interest holders |
363 |
— |
383 |
— |
383 |
(20) |
— |
— |
259 |
— |
273 |
4 |
269 |
(14) |
— |
325 |
— |
325 |
— |
325 |
— |
— |
| Sustaining capital expenditure |
(2,348) |
(785) |
(1,426) |
(786) |
(640) |
(95) |
(42) |
— |
(2,997) |
(807) |
(2,129) |
(1,239) |
(890) |
(61) |
— |
(1,949) |
(378) |
(1,542) |
(817) |
(725) |
(29) |
— |
| Ore reserve development |
(4,768) |
(2,026) |
(2,742) |
(1,344) |
(1,398) |
— |
— |
— |
(3,956) |
(1,610) |
(2,346) |
(1,184) |
(1,162) |
— |
— |
(2,684) |
(1,277) |
(1,407) |
(939) |
(468) |
— |
— |
| Growth projects |
(3,492) |
(403) |
(1,770) |
(441) |
(1,329) |
(1,271) |
(48) |
— |
(2,802) |
(815) |
(1,432) |
(520) |
(912) |
(555) |
— |
(1,511) |
(530) |
(807) |
(405) |
(402) |
(174) |
— |
| Total capital expenditure |
(10,608) |
(3,214) |
(5,938) |
(2,571) |
(3,367) |
(1,366) |
(90) |
— |
(9,755) |
(3,232) |
(5,907) |
(2,943) |
(2,964) |
(616) |
— |
(6,144) |
(2,185) |
(3,756) |
(2,161) |
(1,595) |
(203) |
— |
|
|
note 14.1 |
note 14.2 |
|
|
note 14.1 |
note 14.2 |
|
|
note 14.1 |
note 14.2 |
|
Sibanye-Stillwater Operating and financial results | Six months ended 30 June 2023 40
|
|
|
|
|
|
|
|
|
|
|
|
|
|
|
|
|
|
|
|
|
|
|
|
|
|
|
|
|
|
|
|
|
|
|
|
|
|
|
|
|
|
|
|
|
|
|
|
|
|
|
|
|
|
|
|
|
|
|
|
|
|
|
|
|
|
|
|
|
|
For the six months ended 30 Jun 2023 (Unaudited) |
For the six months ended 31 Dec 2022 (Unaudited) |
For the six months ended 30 Jun 2022 (Unaudited) |
|
GROUP |
AMERICAS |
SOUTHERN AFRICA |
EUROPE |
AUSTRALIA |
GROUP |
GROUP |
AMERICAS |
SOUTHERN AFRICA |
EUROPE |
GROUP |
GROUP |
AMERICAS |
SOUTHERN AFRICA |
EUROPE |
GROUP |
US dollars5 |
Total |
Total US PGM |
Total SA
operations |
Total
SA PGM |
Total
SA gold |
Total EU
operations |
Total AUS operations |
Cor-
porate1
|
Total |
Total US PGM |
Total SA
operations |
Total
SA PGM |
Total
SA gold |
Total EU
operations |
Cor-
porate1
|
Total |
Total US PGM |
Total SA
operations |
Total
SA PGM |
Total
SA gold |
Total EU
operations |
Cor-
porate1
|
| Revenue |
3,326 |
708 |
2,505 |
1,667 |
838 |
92 |
28 |
(7) |
3,878 |
1,248 |
2,595 |
1,893 |
702 |
51 |
(16) |
4,570 |
1,567 |
2,873 |
2,485 |
388 |
141 |
(11) |
| Underground |
2,468 |
286 |
2,189 |
1,571 |
618 |
— |
— |
(7) |
2,595 |
337 |
2,274 |
1,792 |
482 |
— |
(16) |
3,045 |
507 |
2,549 |
2,373 |
176 |
— |
(11) |
| Surface |
344 |
— |
316 |
96 |
220 |
— |
28 |
— |
321 |
— |
321 |
101 |
220 |
— |
— |
324 |
— |
324 |
112 |
212 |
— |
— |
| Recycling/processing |
514 |
422 |
— |
— |
— |
92 |
— |
— |
962 |
911 |
— |
— |
— |
51 |
— |
1,201 |
1,060 |
— |
— |
— |
141 |
— |
| Cost of sales, before amortisation and depreciation |
(2,468) |
(631) |
(1,662) |
(995) |
(667) |
(128) |
(47) |
— |
(2,721) |
(1,079) |
(1,558) |
(881) |
(677) |
(84) |
— |
(3,054) |
(1,270) |
(1,646) |
(1,090) |
(556) |
(138) |
— |
| Underground |
(1,681) |
(229) |
(1,452) |
(946) |
(506) |
— |
— |
— |
(1,544) |
(207) |
(1,337) |
(828) |
(509) |
— |
— |
(1,678) |
(249) |
(1,429) |
(1,036) |
(393) |
— |
— |
| Surface |
(257) |
— |
(210) |
(49) |
(161) |
— |
(47) |
— |
(221) |
— |
(221) |
(53) |
(168) |
— |
— |
(217) |
— |
(217) |
(54) |
(163) |
— |
— |
| Recycling/processing |
(530) |
(402) |
— |
— |
— |
(128) |
— |
— |
(956) |
(872) |
— |
— |
— |
(84) |
— |
(1,159) |
(1,021) |
— |
— |
— |
(138) |
— |
Net other cash costs2 |
(82) |
(4) |
(64) |
(23) |
(41) |
(1) |
(9) |
(4) |
(112) |
(5) |
(98) |
(56) |
(42) |
(6) |
(3) |
(51) |
3 |
(55) |
(21) |
(34) |
1 |
— |
| Adjusted EBITDA |
776 |
73 |
779 |
649 |
130 |
(37) |
(28) |
(11) |
1,045 |
164 |
939 |
956 |
(17) |
(39) |
(19) |
1,465 |
300 |
1,172 |
1,374 |
(202) |
4 |
(11) |
| Amortisation and depreciation |
(260) |
(85) |
(139) |
(76) |
(63) |
(5) |
(31) |
— |
(224) |
(79) |
(140) |
(72) |
(68) |
(5) |
— |
(209) |
(92) |
(113) |
(76) |
(37) |
(4) |
— |
| Interest income |
39 |
6 |
33 |
15 |
18 |
— |
— |
— |
35 |
9 |
26 |
11 |
15 |
— |
— |
38 |
10 |
28 |
14 |
14 |
— |
— |
| Finance expense |
(92) |
(29) |
(45) |
(20) |
(25) |
(1) |
(7) |
(10) |
(78) |
(29) |
(38) |
(17) |
(21) |
(1) |
(10) |
(95) |
(29) |
(56) |
(33) |
(23) |
— |
(10) |
| Share-based payments |
(2) |
(1) |
(1) |
1 |
(2) |
— |
— |
— |
(6) |
(1) |
(5) |
(2) |
(3) |
— |
— |
(7) |
(2) |
(5) |
(2) |
(3) |
— |
— |
Net other3 |
144 |
5 |
93 |
78 |
15 |
9 |
36 |
1 |
(170) |
(9) |
(170) |
(157) |
(13) |
6 |
3 |
40 |
(6) |
46 |
34 |
12 |
— |
— |
Non-underlying items4 |
9 |
— |
13 |
1 |
12 |
— |
— |
(4) |
(15) |
— |
(13) |
(7) |
(6) |
— |
(2) |
(1) |
— |
6 |
— |
6 |
— |
(7) |
| Royalties and carbon tax |
(33) |
— |
(30) |
(27) |
(3) |
— |
(3) |
— |
(49) |
— |
(49) |
(46) |
(3) |
— |
— |
(62) |
— |
(62) |
(63) |
1 |
— |
— |
| Profit/(loss) before tax |
581 |
(31) |
703 |
621 |
82 |
(34) |
(33) |
(24) |
538 |
55 |
550 |
666 |
(116) |
(39) |
(28) |
1,169 |
181 |
1,016 |
1,248 |
(232) |
— |
(28) |
| Current taxation |
(131) |
(1) |
(129) |
(118) |
(11) |
(1) |
— |
— |
(246) |
(18) |
(228) |
(221) |
(7) |
— |
— |
(321) |
(22) |
(299) |
(291) |
(8) |
— |
— |
| Deferred taxation |
(23) |
45 |
(67) |
(50) |
(17) |
(1) |
— |
— |
67 |
12 |
57 |
(18) |
75 |
(2) |
— |
(45) |
7 |
(52) |
(63) |
11 |
— |
— |
| Profit/(loss) for the period |
427 |
13 |
507 |
453 |
54 |
(36) |
(33) |
(24) |
359 |
49 |
379 |
427 |
(48) |
(41) |
(28) |
803 |
166 |
665 |
894 |
(229) |
— |
(28) |
| Attributable to: |
|
|
|
|
|
|
|
|
|
|
|
|
|
|
|
|
|
|
|
|
|
|
| Owners of the parent |
407 |
13 |
486 |
453 |
33 |
(35) |
(33) |
(24) |
344 |
49 |
363 |
427 |
(64) |
(40) |
(28) |
782 |
166 |
644 |
894 |
(250) |
— |
(28) |
| Non-controlling interest holders |
20 |
— |
21 |
— |
21 |
(1) |
— |
— |
15 |
— |
16 |
— |
16 |
(1) |
— |
21 |
— |
21 |
— |
21 |
— |
— |
| Sustaining capital expenditure |
(128) |
(43) |
(78) |
(43) |
(35) |
(5) |
(2) |
— |
(175) |
(47) |
(125) |
(73) |
(52) |
(3) |
— |
(126) |
(25) |
(99) |
(52) |
(47) |
(2) |
— |
| Ore reserve development |
(262) |
(111) |
(151) |
(74) |
(77) |
— |
— |
— |
(232) |
(93) |
(139) |
(69) |
(70) |
— |
— |
(174) |
(83) |
(91) |
(61) |
(30) |
— |
— |
| Growth projects |
(192) |
(22) |
(97) |
(24) |
(73) |
(70) |
(3) |
— |
(167) |
(48) |
(85) |
(30) |
(55) |
(34) |
— |
(97) |
(34) |
(52) |
(26) |
(26) |
(11) |
— |
| Total capital expenditure |
(582) |
(176) |
(326) |
(141) |
(185) |
(75) |
(5) |
— |
(574) |
(188) |
(349) |
(172) |
(177) |
(37) |
— |
(397) |
(142) |
(242) |
(139) |
(103) |
(13) |
— |
|
|
note 14.1 |
note 14.2 |
|
|
note 14.1 |
note 14.2 |
|
|
note 14.1 |
note 14.2 |
|
1Group corporate includes the Wheaton Stream transaction and mainly includes corporate transaction and finance costs
2Net other cash costs for the below periods ended consist of the following:
•six months ended 30 June 2023 — service entity and sundry income (R384 million) and other costs as detailed in profit or loss, and include lease payments (R123 million) to conform with the adjusted EBITDA reconciliation disclosed in note 9.1
•six months ended 31 December 2022 — service entity and sundry income (R167 million) and other costs as detailed in profit or loss, excluding the loss on deconsolidation of the Bapo Trust (R309 million) and include lease payments (R74 million) to conform with the adjusted EBITDA reconciliation disclosed in note 9.1
•six months ended 30 June 2022 — service entity and sundry income (R726 million) and other costs as detailed in profit or loss and include lease payments (R89 million) to conform with the adjusted EBITDA reconciliation disclosed in note 9.1
3Net other includes the share of results of equity-accounted investees after tax as detailed in profit or loss for the below periods ended, and also consist of the following:
•six months ended 30 June 2023 — gain on financial instruments, gain on foreign exchange differences as detailed in profit or loss, and the add back of the lease payment referred to in footnote 2 above
•six months ended 31 December 2022 — loss on financial instruments, gain on foreign exchange differences as detailed in profit or loss, change in estimate of environmental rehabilitation obligation, and right of recovery receivable and payable (income of R71 million) and the add back of the lease payment referred to in footnote 2 above
•six months ended 30 June 2022 — loss on financial instruments, gain on foreign exchange differences as detailed in profit or loss and the add back of the lease payment referred to in footnote 2 above
4Non-underlying items for the below periods ended consist of the following:
•six months ended 30 June 2023 — gain on disposal of property, plant and equipment, impairments, restructuring costs, and transaction costs as detailed in profit or loss and also includes the gain on increase of equity-accounted investment (R2 million) and occupational healthcare income as detailed in profit or loss
•six months ended 31 December 2022 — gain on disposal of property, plant and equipment, reversal of impairments, restructuring costs, and transaction costs as detailed in profit or loss and also includes profit on sale of Lonmin Canada (R145 million), loss on deconsolidation of the Bapo Trust (R309 million)and occupational healthcare income as detailed in profit or loss
•six months ended 30 June 2022 — gain on disposal of property, plant and equipment, impairments, restructuring costs and transaction costs as detailed in profit or loss and also includes non-cash gain on deregistration of subsidiary in the Group (R1 million)and occupational healthcare income as detailed in profit or loss
5The average exchange rate for the six months ended 30 June 2023 was R18.21/US$, six months ended 31 December 2022 was R17.33/US$ and six months ended 30 June 2022 was R15.40/US$
Sibanye-Stillwater Operating and financial results | Six months ended 30 June 2023 41
14.1 US PGM and Total SA operations
Figures are in millions
|
|
|
|
|
|
|
|
|
|
|
|
|
|
|
|
|
|
|
|
|
|
|
|
|
|
|
|
|
|
|
|
|
|
|
|
|
|
|
|
|
|
|
|
|
|
|
|
|
|
|
|
|
|
|
|
|
| For the six months ended 30 Jun 2023 (Unaudited) |
|
AMERICAS |
SOUTHERN AFRICA |
| SA rand |
Total US PGM |
Underground |
Recycling |
Total SA
operations |
Total
SA PGM |
Rusten-
burg |
Marikana |
Kroondal |
Platinum
Mile |
Mimosa |
Corporate
and re-
conciling
items1
|
Total
SA gold |
Drie-
fontein |
Kloof |
Beatrix |
Cooke |
DRD-
GOLD |
Corporate
and re-
conciling
items1
|
| Revenue |
12,909 |
5,217 |
7,692 |
45,611 |
30,350 |
12,110 |
15,454 |
2,249 |
537 |
1,821 |
(1,821) |
15,261 |
4,577 |
4,580 |
2,572 |
690 |
2,842 |
— |
| Underground |
5,217 |
5,217 |
— |
39,845 |
28,599 |
10,896 |
15,454 |
2,249 |
— |
1,821 |
(1,821) |
11,246 |
4,442 |
4,312 |
2,492 |
— |
— |
— |
| Surface |
— |
— |
— |
5,766 |
1,751 |
1,214 |
— |
— |
537 |
— |
— |
4,015 |
135 |
268 |
80 |
690 |
2,842 |
— |
| Recycling/processing |
7,692 |
— |
7,692 |
— |
— |
— |
— |
— |
— |
— |
— |
— |
— |
— |
— |
— |
— |
— |
| Cost of sales, before amortisation and depreciation |
(11,487) |
(4,166) |
(7,321) |
(30,271) |
(18,133) |
(7,336) |
(8,813) |
(1,677) |
(307) |
(1,156) |
1,156 |
(12,138) |
(3,347) |
(4,179) |
(2,125) |
(599) |
(1,888) |
— |
| Underground |
(4,166) |
(4,166) |
— |
(26,465) |
(17,246) |
(6,756) |
(8,813) |
(1,677) |
— |
(1,156) |
1,156 |
(9,219) |
(3,264) |
(3,911) |
(2,044) |
— |
— |
— |
| Surface |
— |
— |
— |
(3,806) |
(887) |
(580) |
— |
— |
(307) |
— |
— |
(2,919) |
(83) |
(268) |
(81) |
(599) |
(1,888) |
— |
| Recycling/processing |
(7,321) |
— |
(7,321) |
— |
— |
— |
— |
— |
— |
— |
— |
— |
— |
— |
— |
— |
— |
— |
| Net other cash costs |
(75) |
(75) |
— |
(1,171) |
(423) |
71 |
(65) |
(40) |
(149) |
(28) |
(212) |
(748) |
(12) |
(86) |
(242) |
(439) |
(21) |
52 |
| Adjusted EBITDA |
1,347 |
976 |
371 |
14,169 |
11,794 |
4,845 |
6,576 |
532 |
81 |
637 |
(877) |
2,375 |
1,218 |
315 |
205 |
(348) |
933 |
52 |
| Amortisation and depreciation |
(1,553) |
(1,551) |
(2) |
(2,512) |
(1,369) |
(549) |
(697) |
(94) |
(22) |
(226) |
219 |
(1,143) |
(510) |
(370) |
(146) |
— |
(84) |
(33) |
| Interest income |
113 |
113 |
— |
595 |
279 |
28 |
159 |
64 |
25 |
29 |
(26) |
316 |
35 |
34 |
19 |
13 |
165 |
50 |
| Finance expense |
(531) |
(531) |
— |
(841) |
(401) |
(2,284) |
(203) |
(54) |
— |
(25) |
2,165 |
(440) |
(48) |
(52) |
(51) |
(58) |
(37) |
(194) |
| Share-based payments |
(12) |
(12) |
— |
(22) |
(2) |
(2) |
(3) |
3 |
— |
— |
— |
(20) |
1 |
2 |
3 |
— |
(12) |
(14) |
| Net other |
89 |
89 |
— |
1,698 |
1,438 |
(754) |
1,437 |
184 |
35 |
(179) |
715 |
260 |
12 |
11 |
17 |
10 |
23 |
187 |
| Non-underlying items |
3 |
3 |
— |
252 |
29 |
7 |
27 |
(3) |
— |
— |
(2) |
223 |
7 |
15 |
186 |
— |
10 |
5 |
| Royalties and carbon tax |
— |
— |
— |
(541) |
(479) |
(196) |
(279) |
(5) |
— |
(75) |
76 |
(62) |
(23) |
(23) |
(13) |
(3) |
— |
— |
| Profit/(loss) before tax |
(544) |
(913) |
369 |
12,798 |
11,289 |
1,095 |
7,017 |
627 |
119 |
161 |
2,270 |
1,509 |
692 |
(68) |
220 |
(386) |
998 |
53 |
| Current taxation |
(10) |
|
|
(2,363) |
(2,160) |
(654) |
(1,274) |
(163) |
(27) |
(29) |
(13) |
(203) |
(1) |
— |
— |
— |
(180) |
(22) |
| Deferred taxation |
828 |
|
|
(1,216) |
(902) |
(511) |
(378) |
(10) |
(6) |
(27) |
30 |
(314) |
(493) |
(674) |
(474) |
— |
(60) |
1,387 |
| Profit/(loss) for the period |
274 |
|
|
9,219 |
8,227 |
(70) |
5,365 |
454 |
86 |
105 |
2,287 |
992 |
198 |
(742) |
(254) |
(386) |
758 |
1,418 |
| Attributable to: |
|
|
|
|
|
|
|
|
|
|
|
|
|
|
|
|
|
|
| Owners of the parent |
274 |
|
|
8,836 |
8,227 |
(70) |
5,365 |
454 |
86 |
105 |
2,287 |
609 |
198 |
(742) |
(254) |
(386) |
382 |
1,411 |
| Non-controlling interest holders |
— |
|
|
383 |
— |
— |
— |
— |
— |
— |
— |
383 |
— |
— |
— |
— |
376 |
7 |
| Sustaining capital expenditure |
(785) |
(784) |
(1) |
(1,426) |
(786) |
(273) |
(397) |
(112) |
(4) |
(510) |
510 |
(640) |
(190) |
(179) |
(41) |
— |
(230) |
— |
| Ore reserve development |
(2,026) |
(2,026) |
— |
(2,742) |
(1,344) |
(357) |
(987) |
— |
— |
— |
— |
(1,398) |
(760) |
(470) |
(168) |
— |
— |
— |
| Growth projects |
(403) |
(403) |
— |
(1,770) |
(441) |
— |
(387) |
(18) |
(36) |
— |
— |
(1,329) |
— |
(67) |
— |
— |
(427) |
(835) |
| Total capital expenditure |
(3,214) |
(3,213) |
(1) |
(5,938) |
(2,571) |
(630) |
(1,771) |
(130) |
(40) |
(510) |
510 |
(3,367) |
(950) |
(716) |
(209) |
— |
(657) |
(835) |
Sibanye-Stillwater Operating and financial results | Six months ended 30 June 2023 42
|
|
|
|
|
|
|
|
|
|
|
|
|
|
|
|
|
|
|
|
|
|
|
|
|
|
|
|
|
|
|
|
|
|
|
|
|
|
|
|
|
|
|
|
|
|
|
|
|
|
|
|
|
|
|
|
|
| For the six months ended 30 Jun 2023 (Unaudited) |
|
AMERICAS |
SOUTHERN AFRICA |
US dollars2 |
Total US PGM |
Underground |
Recycling |
Total SA
operations |
Total
SA PGM |
Rusten-
burg |
Marikana |
Kroondal |
Platinum
Mile |
Mimosa |
Corporate
and re-
conciling
items1
|
Total
SA gold |
Drie-
fontein |
Kloof |
Beatrix |
Cooke |
DRD-
GOLD |
Corporate
and re-
conciling
items1
|
| Revenue |
708 |
286 |
422 |
2,505 |
1,667 |
665 |
849 |
124 |
29 |
100 |
(100) |
838 |
251 |
252 |
141 |
38 |
156 |
— |
| Underground |
286 |
286 |
— |
2,189 |
1,571 |
598 |
849 |
124 |
— |
100 |
(100) |
618 |
244 |
237 |
137 |
— |
— |
— |
| Surface |
— |
— |
— |
316 |
96 |
67 |
— |
— |
29 |
— |
— |
220 |
7 |
15 |
4 |
38 |
156 |
— |
| Recycling/processing |
422 |
— |
422 |
— |
— |
— |
— |
— |
— |
— |
— |
— |
— |
— |
— |
— |
— |
— |
| Cost of sales, before amortisation and depreciation |
(631) |
(229) |
(402) |
(1,662) |
(995) |
(403) |
(484) |
(92) |
(17) |
(63) |
64 |
(667) |
(184) |
(230) |
(116) |
(33) |
(104) |
— |
| Underground |
(229) |
(229) |
— |
(1,452) |
(946) |
(371) |
(484) |
(92) |
— |
(63) |
64 |
(506) |
(179) |
(215) |
(112) |
— |
— |
— |
| Surface |
— |
— |
— |
(210) |
(49) |
(32) |
— |
— |
(17) |
— |
— |
(161) |
(5) |
(15) |
(4) |
(33) |
(104) |
— |
| Recycling/processing |
(402) |
— |
(402) |
— |
— |
— |
— |
— |
— |
— |
— |
— |
— |
— |
— |
— |
— |
— |
| Net other cash costs |
(4) |
(4) |
— |
(64) |
(23) |
4 |
(4) |
(2) |
(8) |
(2) |
(11) |
(41) |
(1) |
(5) |
(13) |
(24) |
(1) |
3 |
| Adjusted EBITDA |
73 |
53 |
20 |
779 |
649 |
266 |
361 |
30 |
4 |
35 |
(47) |
130 |
66 |
17 |
12 |
(19) |
51 |
3 |
| Amortisation and depreciation |
(85) |
(85) |
— |
(139) |
(76) |
(30) |
(38) |
(5) |
(1) |
(12) |
10 |
(63) |
(28) |
(20) |
(8) |
— |
(5) |
(2) |
| Interest income |
6 |
6 |
— |
33 |
15 |
2 |
9 |
4 |
1 |
2 |
(3) |
18 |
2 |
2 |
1 |
1 |
9 |
3 |
| Finance expense |
(29) |
(29) |
— |
(45) |
(20) |
(125) |
(11) |
(3) |
— |
(1) |
120 |
(25) |
(3) |
(3) |
(3) |
(3) |
(2) |
(11) |
| Share-based payments |
(1) |
(1) |
— |
(1) |
1 |
— |
— |
— |
— |
— |
1 |
(2) |
— |
— |
— |
— |
(1) |
(1) |
| Net other |
5 |
5 |
— |
93 |
78 |
(41) |
79 |
10 |
2 |
(10) |
38 |
15 |
1 |
1 |
1 |
1 |
1 |
10 |
| Non-underlying items |
— |
— |
— |
13 |
1 |
— |
1 |
— |
— |
— |
— |
12 |
— |
1 |
10 |
— |
1 |
— |
| Royalties and carbon tax |
— |
— |
— |
(30) |
(27) |
(11) |
(15) |
— |
— |
(4) |
3 |
(3) |
(1) |
(1) |
(1) |
— |
— |
— |
| Profit/(loss) before tax |
(31) |
(51) |
20 |
703 |
621 |
61 |
386 |
36 |
6 |
10 |
122 |
82 |
37 |
(3) |
12 |
(20) |
54 |
2 |
| Current taxation |
(1) |
|
|
(129) |
(118) |
(36) |
(70) |
(9) |
(1) |
(2) |
— |
(11) |
— |
— |
— |
— |
(10) |
(1) |
| Deferred taxation |
45 |
|
|
(67) |
(50) |
(28) |
(21) |
(1) |
— |
(1) |
1 |
(17) |
(27) |
(37) |
(26) |
— |
(3) |
76 |
| Profit/(loss) for the period |
13 |
|
|
507 |
453 |
(3) |
295 |
26 |
5 |
7 |
123 |
54 |
10 |
(40) |
(14) |
(20) |
41 |
77 |
| Attributable to: |
|
|
|
|
|
|
|
|
|
|
|
|
|
|
|
|
|
|
| Owners of the parent |
13 |
|
|
486 |
453 |
(3) |
295 |
26 |
5 |
7 |
123 |
33 |
10 |
(40) |
(14) |
(20) |
20 |
77 |
| Non-controlling interest holders |
— |
|
|
21 |
— |
— |
— |
— |
— |
— |
— |
21 |
— |
— |
— |
— |
21 |
— |
| Sustaining capital expenditure |
(43) |
(43) |
— |
(78) |
(43) |
(15) |
(22) |
(6) |
— |
(28) |
28 |
(35) |
(10) |
(10) |
(2) |
— |
(13) |
— |
| Ore reserve development |
(111) |
(111) |
— |
(151) |
(74) |
(20) |
(54) |
— |
— |
— |
— |
(77) |
(42) |
(26) |
(9) |
— |
— |
— |
| Growth projects |
(22) |
(22) |
— |
(97) |
(24) |
— |
(21) |
(1) |
(2) |
— |
— |
(73) |
— |
(4) |
— |
— |
(23) |
(46) |
| Total capital expenditure |
(176) |
(176) |
— |
(326) |
(141) |
(35) |
(97) |
(7) |
(2) |
(28) |
28 |
(185) |
(52) |
(40) |
(11) |
— |
(36) |
(46) |
1Corporate and reconciling items represent the items to reconcile segment data to consolidated financial statement totals. This does not represent a separate segment as it does not generate mining revenue
2The average exchange rate for the six months ended 30 June 2023 was R18.21/US$
Sibanye-Stillwater Operating and financial results | Six months ended 30 June 2023 43
Figures are in millions
|
|
|
|
|
|
|
|
|
|
|
|
|
|
|
|
|
|
|
|
|
|
|
|
|
|
|
|
|
|
|
|
|
|
|
|
|
|
|
|
|
|
|
|
|
|
|
|
|
|
|
|
|
|
|
|
|
| For the six months ended 31 Dec 2022 (Unaudited) |
|
AMERICAS |
SOUTHERN AFRICA |
| SA rand |
Total US PGM |
Underground |
Recycling |
Total SA
operations |
Total
SA PGM |
Rusten-
burg |
Marikana |
Kroondal |
Platinum
Mile |
Mimosa |
Corporate
and re-
conciling
items1
|
Total
SA gold |
Drie-
fontein |
Kloof |
Beatrix |
Cooke |
DRD-
GOLD |
Corporate
and re-
conciling
items1
|
| Revenue |
21,960 |
6,011 |
15,949 |
45,267 |
33,406 |
14,350 |
14,430 |
3,963 |
663 |
1,928 |
(1,928) |
11,861 |
3,016 |
3,181 |
2,432 |
578 |
2,654 |
— |
| Underground |
6,011 |
6,011 |
— |
39,711 |
31,658 |
13,265 |
14,430 |
3,963 |
— |
1,928 |
(1,928) |
8,053 |
2,836 |
2,826 |
2,391 |
— |
— |
— |
| Surface |
— |
— |
— |
5,556 |
1,748 |
1,085 |
— |
— |
663 |
— |
— |
3,808 |
180 |
355 |
41 |
578 |
2,654 |
— |
| Recycling/processing |
15,949 |
— |
15,949 |
— |
— |
— |
— |
— |
— |
— |
— |
— |
— |
— |
— |
— |
— |
— |
| Cost of sales, before amortisation and depreciation |
(18,892) |
(3,619) |
(15,273) |
(27,114) |
(15,499) |
(6,887) |
(6,530) |
(1,774) |
(308) |
(1,046) |
1,046 |
(11,615) |
(2,989) |
(3,564) |
(2,628) |
(496) |
(1,938) |
— |
| Underground |
(3,619) |
(3,619) |
— |
(23,278) |
(14,575) |
(6,271) |
(6,530) |
(1,774) |
— |
(1,046) |
1,046 |
(8,703) |
(2,852) |
(3,254) |
(2,597) |
— |
— |
— |
| Surface |
— |
— |
— |
(3,836) |
(924) |
(616) |
— |
— |
(308) |
— |
— |
(2,912) |
(137) |
(310) |
(31) |
(496) |
(1,938) |
— |
| Recycling/processing |
(15,273) |
— |
(15,273) |
— |
— |
— |
— |
— |
— |
— |
— |
— |
— |
— |
— |
— |
— |
— |
| Net other cash costs |
(83) |
(83) |
— |
(1,610) |
(924) |
(11) |
(507) |
(82) |
(168) |
— |
(156) |
(686) |
(55) |
(56) |
(33) |
(390) |
(22) |
(130) |
| Adjusted EBITDA |
2,985 |
2,309 |
676 |
16,543 |
16,983 |
7,452 |
7,393 |
2,107 |
187 |
882 |
(1,038) |
(440) |
(28) |
(439) |
(229) |
(308) |
694 |
(130) |
| Amortisation and depreciation |
(1,379) |
(1,377) |
(2) |
(2,387) |
(1,256) |
(511) |
(628) |
(91) |
(21) |
(190) |
185 |
(1,131) |
(482) |
(311) |
(242) |
— |
(79) |
(17) |
| Interest income |
143 |
74 |
69 |
471 |
207 |
21 |
101 |
60 |
22 |
84 |
(81) |
264 |
45 |
36 |
23 |
19 |
155 |
(14) |
| Finance expense |
(507) |
(507) |
— |
(691) |
(329) |
(1,953) |
(151) |
(59) |
— |
(17) |
1,851 |
(362) |
(50) |
(47) |
(51) |
(43) |
(34) |
(137) |
| Share-based payments |
(17) |
(17) |
— |
(87) |
(34) |
(13) |
(19) |
(2) |
— |
— |
— |
(53) |
(11) |
(11) |
(8) |
— |
(10) |
(13) |
| Net other |
(156) |
(156) |
— |
(2,742) |
(2,525) |
(9,454) |
(1,487) |
241 |
8 |
(175) |
8,342 |
(217) |
7 |
13 |
17 |
(53) |
13 |
(214) |
| Non-underlying items |
(7) |
(7) |
— |
(234) |
(140) |
5 |
(141) |
12 |
— |
— |
(16) |
(94) |
16 |
(12) |
(281) |
(1) |
— |
184 |
| Royalties and carbon tax |
— |
— |
— |
(865) |
(818) |
(565) |
(245) |
(6) |
— |
(57) |
55 |
(47) |
(15) |
(16) |
(13) |
(3) |
— |
— |
| Profit/(loss) before tax |
1,062 |
319 |
743 |
10,008 |
12,088 |
(5,018) |
4,823 |
2,262 |
196 |
527 |
9,298 |
(2,080) |
(518) |
(787) |
(784) |
(389) |
739 |
(341) |
| Current taxation |
(318) |
|
|
(4,023) |
(3,903) |
(1,766) |
(1,496) |
(586) |
(56) |
(35) |
36 |
(120) |
(1) |
— |
— |
— |
(106) |
(13) |
| Deferred taxation |
202 |
|
|
886 |
(364) |
37 |
(354) |
(48) |
1 |
(92) |
92 |
1,250 |
76 |
(221) |
128 |
— |
(79) |
1,346 |
| Profit/(loss) for the year |
946 |
|
|
6,871 |
7,821 |
(6,747) |
2,973 |
1,628 |
141 |
400 |
9,426 |
(950) |
(443) |
(1,008) |
(656) |
(389) |
554 |
992 |
| Attributable to: |
|
|
|
|
|
|
|
|
|
|
|
|
|
|
|
|
|
|
| Owners of the parent |
946 |
|
|
6,598 |
7,817 |
(6,747) |
2,969 |
1,628 |
141 |
400 |
9,426 |
(1,219) |
(443) |
(1,008) |
(656) |
(389) |
278 |
999 |
| Non-controlling interest holders |
— |
|
|
273 |
4 |
— |
4 |
— |
— |
— |
— |
269 |
— |
— |
— |
— |
276 |
(7) |
| Sustaining capital expenditure |
(807) |
(806) |
(1) |
(2,129) |
(1,239) |
(385) |
(681) |
(158) |
(15) |
(570) |
570 |
(890) |
(263) |
(303) |
(87) |
— |
(237) |
— |
| Ore reserve development |
(1,610) |
(1,610) |
— |
(2,346) |
(1,184) |
(372) |
(812) |
— |
— |
— |
— |
(1,162) |
(542) |
(435) |
(185) |
— |
— |
— |
| Growth projects |
(815) |
(815) |
— |
(1,432) |
(520) |
— |
(519) |
— |
— |
— |
(1) |
(912) |
— |
(156) |
— |
— |
(118) |
(638) |
| Total capital expenditure |
(3,232) |
(3,231) |
(1) |
(5,907) |
(2,943) |
(757) |
(2,012) |
(158) |
(15) |
(570) |
569 |
(2,964) |
(805) |
(894) |
(272) |
— |
(355) |
(638) |
Sibanye-Stillwater Operating and financial results | Six months ended 30 June 2023 44
|
|
|
|
|
|
|
|
|
|
|
|
|
|
|
|
|
|
|
|
|
|
|
|
|
|
|
|
|
|
|
|
|
|
|
|
|
|
|
|
|
|
|
|
|
|
|
|
|
|
|
|
|
|
|
|
|
| For the six months ended 31 Dec 2022 (Unaudited) |
|
AMERICAS |
SOUTHERN AFRICA |
US dollars2 |
Total US PGM |
Underground |
Recycling |
Total SA
operations |
Total
SA PGM |
Rusten-
burg |
Marikana |
Kroondal |
Platinum
Mile |
Mimosa |
Corporate
and re-
conciling
items1
|
Total
SA gold |
Drie-
fontein |
Kloof |
Beatrix |
Cooke |
DRD-
GOLD |
Corporate
and re-
conciling
items1
|
| Revenue |
1,248 |
337 |
911 |
2,595 |
1,893 |
820 |
811 |
225 |
38 |
109 |
(110) |
702 |
179 |
190 |
147 |
34 |
152 |
— |
| Underground |
337 |
337 |
— |
2,274 |
1,792 |
757 |
811 |
225 |
— |
109 |
(110) |
482 |
168 |
169 |
145 |
— |
— |
— |
| Surface |
— |
— |
— |
321 |
101 |
63 |
— |
— |
38 |
— |
— |
220 |
11 |
21 |
2 |
34 |
152 |
— |
| Recycling/processing |
911 |
— |
911 |
— |
— |
— |
— |
— |
— |
— |
— |
— |
— |
— |
— |
— |
— |
— |
| Cost of sales, before amortisation and depreciation |
(1,079) |
(207) |
(872) |
(1,558) |
(881) |
(395) |
(368) |
(102) |
(18) |
(60) |
62 |
(677) |
(174) |
(207) |
(156) |
(29) |
(111) |
— |
| Underground |
(207) |
(207) |
— |
(1,337) |
(828) |
(360) |
(368) |
(102) |
— |
(60) |
62 |
(509) |
(166) |
(189) |
(154) |
— |
— |
— |
| Surface |
— |
— |
— |
(221) |
(53) |
(35) |
— |
— |
(18) |
— |
— |
(168) |
(8) |
(18) |
(2) |
(29) |
(111) |
— |
| Recycling/processing |
(872) |
— |
(872) |
— |
— |
— |
— |
— |
— |
— |
— |
— |
— |
— |
— |
— |
— |
— |
| Net other cash costs |
(5) |
(5) |
— |
(98) |
(56) |
(2) |
(30) |
(5) |
(9) |
— |
(10) |
(42) |
(3) |
(3) |
(2) |
(23) |
(2) |
(9) |
| Adjusted EBITDA |
164 |
125 |
39 |
939 |
956 |
423 |
413 |
118 |
11 |
49 |
(58) |
(17) |
2 |
(20) |
(11) |
(18) |
39 |
(9) |
| Amortisation and depreciation |
(79) |
(79) |
— |
(140) |
(72) |
(29) |
(37) |
(5) |
(1) |
(11) |
11 |
(68) |
(28) |
(19) |
(15) |
— |
(5) |
(1) |
| Interest income |
9 |
5 |
4 |
26 |
11 |
2 |
6 |
4 |
1 |
5 |
(7) |
15 |
3 |
2 |
1 |
1 |
9 |
(1) |
| Finance expense |
(29) |
(29) |
— |
(38) |
(17) |
(109) |
(9) |
(4) |
— |
(1) |
106 |
(21) |
(3) |
(3) |
(3) |
(2) |
(2) |
(8) |
| Share-based payments |
(1) |
(1) |
— |
(5) |
(2) |
(1) |
(1) |
(1) |
— |
— |
1 |
(3) |
— |
(1) |
(1) |
— |
— |
(1) |
| Net other |
(9) |
(9) |
— |
(170) |
(157) |
(578) |
(91) |
15 |
— |
(9) |
506 |
(13) |
1 |
1 |
1 |
(3) |
1 |
(14) |
| Non-underlying items |
— |
— |
— |
(13) |
(7) |
1 |
(8) |
1 |
— |
— |
(1) |
(6) |
1 |
(1) |
(17) |
— |
— |
11 |
| Royalties and carbon tax |
— |
— |
— |
(49) |
(46) |
(32) |
(13) |
(1) |
— |
(3) |
3 |
(3) |
(1) |
(1) |
(1) |
— |
— |
— |
| Profit/(loss) before tax |
55 |
12 |
43 |
550 |
666 |
(323) |
260 |
127 |
11 |
30 |
561 |
(116) |
(25) |
(42) |
(46) |
(22) |
42 |
(23) |
| Current taxation |
(18) |
|
|
(228) |
(221) |
(103) |
(83) |
(33) |
(3) |
(2) |
3 |
(7) |
— |
— |
— |
— |
(6) |
(1) |
| Deferred taxation |
12 |
|
|
57 |
(18) |
5 |
(20) |
(3) |
— |
(5) |
5 |
75 |
4 |
(13) |
7 |
— |
(5) |
82 |
| Profit/(loss) for the year |
49 |
|
|
379 |
427 |
(421) |
157 |
91 |
8 |
23 |
569 |
(48) |
(21) |
(55) |
(39) |
(22) |
31 |
58 |
| Attributable to: |
|
|
|
|
|
|
|
|
|
|
|
|
|
|
|
|
|
|
| Owners of the parent |
49 |
|
|
363 |
427 |
(421) |
157 |
91 |
8 |
23 |
569 |
(64) |
(21) |
(55) |
(39) |
(22) |
15 |
58 |
| Non-controlling interest holders |
— |
|
|
16 |
— |
— |
— |
— |
— |
— |
— |
16 |
— |
— |
— |
— |
16 |
— |
| Sustaining capital expenditure |
(47) |
(47) |
— |
(125) |
(73) |
(22) |
(40) |
(10) |
(1) |
(34) |
34 |
(52) |
(16) |
(18) |
(5) |
— |
(13) |
— |
| Ore reserve development |
(93) |
(93) |
— |
(139) |
(69) |
(22) |
(47) |
— |
— |
— |
— |
(70) |
(33) |
(26) |
(11) |
— |
— |
— |
| Growth projects |
(48) |
(48) |
— |
(85) |
(30) |
— |
(30) |
— |
— |
— |
— |
(55) |
— |
(9) |
— |
— |
(8) |
(38) |
| Total capital expenditure |
(188) |
(188) |
— |
(349) |
(172) |
(44) |
(117) |
(10) |
(1) |
(34) |
34 |
(177) |
(49) |
(53) |
(16) |
— |
(21) |
(38) |
1Corporate and reconciling items represent the items to reconcile segment data to consolidated financial statement totals. This does not represent a separate segment as it does not generate revenue
2The average exchange rate for the six months ended 31 December 2022 was R17.33/US$
Sibanye-Stillwater Operating and financial results | Six months ended 30 June 2023 45
Figures are in millions
|
|
|
|
|
|
|
|
|
|
|
|
|
|
|
|
|
|
|
|
|
|
|
|
|
|
|
|
|
|
|
|
|
|
|
|
|
|
|
|
|
|
|
|
|
|
|
|
|
|
|
|
|
|
|
|
|
| For the six months ended 30 Jun 2022 (Unaudited) |
|
AMERICAS |
SOUTHERN AFRICA |
| SA rand |
Total US PGM |
Underground |
Recycling |
Total SA
operations |
Total
SA PGM |
Rusten-
burg |
Marikana |
Kroondal |
Platinum
Mile |
Mimosa |
Corporate
and re-
conciling
items1
|
Total
SA gold |
Drie-
fontein |
Kloof |
Beatrix |
Cooke |
DRD-
GOLD |
Corporate
and re-
conciling
items1
|
| Revenue |
24,130 |
7,812 |
16,318 |
44,240 |
38,259 |
14,754 |
18,323 |
4,408 |
774 |
2,339 |
(2,339) |
5,981 |
1,470 |
1,305 |
249 |
337 |
2,620 |
— |
| Underground |
7,812 |
7,812 |
— |
39,240 |
36,524 |
13,793 |
18,323 |
4,408 |
— |
2,339 |
(2,339) |
2,716 |
1,377 |
1,098 |
241 |
— |
— |
— |
| Surface |
— |
— |
— |
5,000 |
1,735 |
961 |
— |
— |
774 |
— |
— |
3,265 |
93 |
207 |
8 |
337 |
2,620 |
— |
| Recycling/processing |
16,318 |
— |
16,318 |
— |
— |
— |
— |
— |
— |
— |
— |
— |
— |
— |
— |
— |
— |
— |
| Cost of sales, before amortisation and depreciation |
(19,560) |
(3,840) |
(15,720) |
(25,340) |
(16,781) |
(6,659) |
(8,073) |
(1,774) |
(275) |
(890) |
890 |
(8,559) |
(2,292) |
(2,817) |
(1,282) |
(326) |
(1,842) |
— |
| Underground |
(3,840) |
(3,840) |
— |
(21,997) |
(15,953) |
(6,106) |
(8,073) |
(1,774) |
— |
(890) |
890 |
(6,044) |
(2,233) |
(2,567) |
(1,244) |
— |
— |
— |
| Surface |
— |
— |
— |
(3,343) |
(828) |
(553) |
— |
— |
(275) |
— |
— |
(2,515) |
(59) |
(250) |
(38) |
(326) |
(1,842) |
— |
| Recycling/processing |
(15,720) |
— |
(15,720) |
— |
— |
— |
— |
— |
— |
— |
— |
— |
— |
— |
— |
— |
— |
— |
| Net other cash costs |
49 |
49 |
— |
(854) |
(326) |
162 |
(181) |
(46) |
(239) |
(21) |
(1) |
(528) |
(118) |
(111) |
(90) |
(327) |
62 |
56 |
| Adjusted EBITDA |
4,619 |
4,021 |
598 |
18,046 |
21,152 |
8,257 |
10,069 |
2,588 |
260 |
1,428 |
(1,450) |
(3,106) |
(940) |
(1,623) |
(1,123) |
(316) |
840 |
56 |
| Amortisation and depreciation |
(1,424) |
(1,422) |
(2) |
(1,739) |
(1,162) |
(470) |
(577) |
(89) |
(19) |
(152) |
145 |
(577) |
(239) |
(158) |
(63) |
(3) |
(97) |
(17) |
| Interest income |
166 |
7 |
159 |
422 |
195 |
22 |
113 |
49 |
8 |
18 |
(15) |
227 |
23 |
21 |
12 |
16 |
110 |
45 |
| Finance expense |
(445) |
(445) |
— |
(856) |
(502) |
(2,665) |
(169) |
(52) |
— |
(19) |
2,403 |
(354) |
(50) |
(48) |
(44) |
(43) |
(44) |
(125) |
| Share-based payments |
(30) |
(30) |
— |
(82) |
(39) |
(14) |
(17) |
(7) |
(1) |
— |
— |
(43) |
(9) |
(4) |
(2) |
— |
(9) |
(19) |
| Net other |
(87) |
(87) |
— |
687 |
500 |
101 |
(112) |
62 |
(3) |
(324) |
776 |
187 |
6 |
13 |
17 |
3 |
15 |
133 |
| Non-underlying items |
2 |
2 |
— |
81 |
8 |
5 |
5 |
(16) |
— |
(1) |
15 |
73 |
(6) |
(2) |
— |
(1) |
10 |
72 |
| Royalties and carbon tax |
— |
— |
— |
(959) |
(954) |
(458) |
(490) |
(7) |
— |
(70) |
71 |
(5) |
(7) |
(6) |
10 |
(2) |
— |
— |
| Profit/(loss) before tax |
2,801 |
2,046 |
755 |
15,600 |
19,198 |
4,778 |
8,822 |
2,528 |
245 |
880 |
1,945 |
(3,598) |
(1,222) |
(1,807) |
(1,193) |
(346) |
825 |
145 |
| Current taxation |
(337) |
|
|
(4,600) |
(4,470) |
(1,403) |
(2,270) |
(702) |
(74) |
(173) |
152 |
(130) |
(5) |
(3) |
— |
— |
(120) |
(2) |
| Deferred taxation |
113 |
|
|
(804) |
(968) |
(627) |
(339) |
(12) |
7 |
(46) |
49 |
164 |
8 |
37 |
26 |
— |
(46) |
139 |
| Profit/(loss) for the year |
2,577 |
|
|
10,196 |
13,760 |
2,748 |
6,213 |
1,814 |
178 |
661 |
2,146 |
(3,564) |
(1,219) |
(1,773) |
(1,167) |
(346) |
659 |
282 |
| Attributable to: |
|
|
|
|
|
|
|
|
|
|
|
|
|
|
|
|
|
|
| Owners of the parent |
2,577 |
|
|
9,871 |
13,760 |
2,748 |
6,213 |
1,814 |
178 |
661 |
2,146 |
(3,889) |
(1,219) |
(1,773) |
(1,167) |
(346) |
334 |
282 |
| Non-controlling interest holders |
— |
|
|
325 |
— |
— |
— |
— |
— |
— |
— |
325 |
— |
— |
— |
— |
325 |
— |
| Sustaining capital expenditure |
(378) |
(378) |
— |
(1,542) |
(817) |
(305) |
(391) |
(115) |
(6) |
(294) |
294 |
(725) |
(95) |
(152) |
(68) |
— |
(410) |
— |
| Ore reserve development |
(1,277) |
(1,277) |
— |
(1,407) |
(939) |
(315) |
(624) |
— |
— |
— |
— |
(468) |
(252) |
(185) |
(31) |
— |
— |
— |
| Growth projects |
(530) |
(530) |
— |
(807) |
(405) |
— |
(405) |
— |
— |
— |
— |
(402) |
— |
(54) |
(4) |
— |
(6) |
(338) |
| Total capital expenditure |
(2,185) |
(2,185) |
— |
(3,756) |
(2,161) |
(620) |
(1,420) |
(115) |
(6) |
(294) |
294 |
(1,595) |
(347) |
(391) |
(103) |
— |
(416) |
(338) |
Sibanye-Stillwater Operating and financial results | Six months ended 30 June 2023 46
|
|
|
|
|
|
|
|
|
|
|
|
|
|
|
|
|
|
|
|
|
|
|
|
|
|
|
|
|
|
|
|
|
|
|
|
|
|
|
|
|
|
|
|
|
|
|
|
|
|
|
|
|
|
|
|
|
| For the six months ended 30 Jun 2022 (Unaudited) |
|
AMERICAS |
SOUTHERN AFRICA |
US dollars2 |
Total US PGM |
Underground |
Recycling |
Total SA
operations |
Total
SA PGM |
Rusten-
burg |
Marikana |
Kroondal |
Platinum
Mile |
Mimosa |
Corporate
and re-
conciling
items1
|
Total
SA gold |
Drie-
fontein |
Kloof |
Beatrix |
Cooke |
DRD-
GOLD |
Corporate
and re-
conciling
items1
|
| Revenue |
1,567 |
507 |
1,060 |
2,873 |
2,485 |
958 |
1,190 |
286 |
50 |
152 |
(151) |
388 |
95 |
84 |
17 |
22 |
170 |
— |
| Underground |
507 |
507 |
— |
2,549 |
2,373 |
896 |
1,190 |
286 |
— |
152 |
(151) |
176 |
89 |
71 |
16 |
— |
— |
— |
| Surface |
— |
— |
— |
324 |
112 |
62 |
— |
— |
50 |
— |
— |
212 |
6 |
13 |
1 |
22 |
170 |
— |
| Recycling/processing |
1,060 |
— |
1,060 |
— |
— |
— |
— |
— |
— |
— |
— |
— |
— |
— |
— |
— |
— |
— |
| Cost of sales, before amortisation and depreciation |
(1,270) |
(249) |
(1,021) |
(1,646) |
(1,090) |
(432) |
(524) |
(115) |
(18) |
(58) |
57 |
(556) |
(149) |
(183) |
(83) |
(21) |
(120) |
— |
| Underground |
(249) |
(249) |
— |
(1,429) |
(1,036) |
(396) |
(524) |
(115) |
— |
(58) |
57 |
(393) |
(145) |
(167) |
(81) |
— |
— |
— |
| Surface |
— |
— |
— |
(217) |
(54) |
(36) |
— |
— |
(18) |
— |
— |
(163) |
(4) |
(16) |
(2) |
(21) |
(120) |
— |
| Recycling/processing |
(1,021) |
— |
(1,021) |
— |
— |
— |
— |
— |
— |
— |
— |
— |
— |
— |
— |
— |
— |
— |
| Net other cash costs |
3 |
3 |
— |
(55) |
(21) |
11 |
(12) |
(3) |
(16) |
(1) |
— |
(34) |
(8) |
(7) |
(6) |
(21) |
4 |
4 |
| Adjusted EBITDA |
300 |
261 |
39 |
1,172 |
1,374 |
537 |
654 |
168 |
16 |
93 |
(94) |
(202) |
(62) |
(106) |
(72) |
(20) |
54 |
4 |
| Amortisation and depreciation |
(92) |
(92) |
— |
(113) |
(76) |
(31) |
(37) |
(6) |
(1) |
(10) |
9 |
(37) |
(16) |
(10) |
(4) |
— |
(6) |
(1) |
| Interest income |
10 |
— |
10 |
28 |
14 |
1 |
7 |
3 |
1 |
1 |
1 |
14 |
1 |
1 |
1 |
1 |
7 |
3 |
| Finance expense |
(29) |
(29) |
— |
(56) |
(33) |
(173) |
(11) |
(3) |
— |
(1) |
155 |
(23) |
(3) |
(3) |
(3) |
(3) |
(3) |
(8) |
| Share-based payments |
(2) |
(2) |
— |
(5) |
(2) |
(1) |
(1) |
— |
— |
— |
— |
(3) |
(1) |
— |
— |
— |
(1) |
(1) |
| Net other |
(6) |
(6) |
— |
46 |
34 |
7 |
(7) |
4 |
— |
(21) |
51 |
12 |
— |
1 |
1 |
— |
1 |
9 |
| Non-underlying items |
— |
— |
— |
6 |
— |
— |
— |
(1) |
— |
— |
1 |
6 |
— |
— |
— |
— |
1 |
5 |
| Royalties and carbon tax |
— |
— |
— |
(62) |
(63) |
(30) |
(32) |
— |
— |
(5) |
4 |
1 |
— |
— |
1 |
— |
— |
— |
| Profit/(loss) before tax |
181 |
132 |
49 |
1,016 |
1,248 |
310 |
573 |
165 |
16 |
57 |
127 |
(232) |
(81) |
(117) |
(76) |
(22) |
53 |
11 |
| Current taxation |
(22) |
|
|
(299) |
(291) |
(91) |
(147) |
(46) |
(5) |
(11) |
9 |
(8) |
— |
— |
— |
— |
(8) |
— |
| Deferred taxation |
7 |
|
|
(52) |
(63) |
(41) |
(22) |
(1) |
— |
(3) |
4 |
11 |
1 |
2 |
2 |
— |
(3) |
9 |
| Profit/(loss) for the year |
166 |
|
|
665 |
894 |
178 |
404 |
118 |
11 |
43 |
140 |
(229) |
(80) |
(115) |
(74) |
(22) |
42 |
20 |
| Attributable to: |
|
|
|
|
|
|
|
|
|
|
|
|
|
|
|
|
|
|
| Owners of the parent |
166 |
|
|
644 |
894 |
178 |
404 |
118 |
11 |
43 |
140 |
(250) |
(80) |
(115) |
(74) |
(22) |
21 |
20 |
| Non-controlling interest holders |
— |
|
|
21 |
— |
— |
— |
— |
— |
— |
— |
21 |
— |
— |
— |
— |
21 |
— |
| Sustaining capital expenditure |
(25) |
(25) |
— |
(99) |
(52) |
(20) |
(25) |
(7) |
— |
(19) |
19 |
(47) |
(6) |
(10) |
(4) |
— |
(27) |
— |
| Ore reserve development |
(83) |
(83) |
— |
(91) |
(61) |
(20) |
(41) |
— |
— |
— |
— |
(30) |
(16) |
(12) |
(2) |
— |
— |
— |
| Growth projects |
(34) |
(34) |
— |
(52) |
(26) |
— |
(26) |
— |
— |
— |
— |
(26) |
— |
(4) |
— |
— |
— |
(22) |
| Total capital expenditure |
(142) |
(142) |
— |
(242) |
(139) |
(40) |
(92) |
(7) |
— |
(19) |
19 |
(103) |
(22) |
(26) |
(6) |
— |
(27) |
(22) |
1Corporate and reconciling items represent the items to reconcile segment data to consolidated financial statement totals. This does not represent a separate segment as it does not generate revenue
2The average exchange rate for the six months ended 30 June 2022 was R15.40/US$
Sibanye-Stillwater Operating and financial results | Six months ended 30 June 2023 47
14.2 Sandouville nickel refinery and New Century zinc retreatment operation
Figures are in millions
|
|
|
|
|
|
|
|
|
|
|
|
|
|
|
|
|
|
|
|
|
|
|
|
|
|
|
|
|
|
|
|
|
|
|
|
|
|
|
|
For the six months ended 30 Jun 2023 (Unaudited) |
For the six months ended 31 Dec 2022 (Unaudited) |
For the six months ended 30 Jun 2022 (Unaudited) |
|
EUROPE |
AUSTRALIA |
EUROPE |
EUROPE |
| SA rand |
Total EU
operations |
Sandouville nickel refinery |
Corporate
and re-
conciling
items1
|
Total AUS operations |
New Century zinc retreatment operation2 |
Corporate
and re-
conciling
items1
|
Total EU
operations |
Sandouville nickel refinery |
Corporate
and re-
conciling
items1
|
Total EU
operations |
Sandouville nickel refinery3 |
Corporate
and re-
conciling
items1
|
| Revenue |
1,677 |
1,677 |
— |
506 |
506 |
— |
967 |
967 |
— |
2,173 |
2,173 |
— |
| Underground |
— |
— |
— |
— |
— |
— |
— |
— |
— |
— |
— |
— |
| Surface |
— |
— |
— |
506 |
506 |
— |
— |
— |
— |
— |
— |
— |
| Recycling/processing |
1,677 |
1,677 |
— |
— |
— |
— |
967 |
967 |
— |
2,173 |
2,173 |
— |
| Cost of sales, before amortisation and depreciation |
(2,329) |
(2,329) |
— |
(851) |
(851) |
— |
(1,506) |
(1,506) |
— |
(2,125) |
(2,125) |
— |
| Underground |
— |
— |
— |
— |
— |
— |
— |
— |
— |
— |
— |
— |
| Surface |
— |
— |
— |
(851) |
(851) |
— |
— |
— |
— |
— |
— |
— |
| Recycling/processing |
(2,329) |
(2,329) |
— |
— |
— |
— |
(1,506) |
(1,506) |
— |
(2,125) |
(2,125) |
— |
| Net other cash costs |
(11) |
25 |
(36) |
(157) |
(157) |
— |
(99) |
(14) |
(85) |
12 |
13 |
(1) |
| Adjusted EBITDA |
(663) |
(627) |
(36) |
(502) |
(502) |
— |
(638) |
(553) |
(85) |
60 |
61 |
(1) |
| Amortisation and depreciation |
(97) |
(94) |
(3) |
(569) |
(569) |
— |
(97) |
(92) |
(5) |
(61) |
(61) |
— |
| Interest income |
1 |
— |
1 |
8 |
5 |
3 |
— |
— |
— |
— |
— |
— |
| Finance expense |
(19) |
(5) |
(14) |
(120) |
(120) |
— |
(8) |
(6) |
(2) |
(7) |
(7) |
— |
| Share-based payments |
(5) |
(5) |
— |
— |
— |
— |
— |
— |
— |
— |
— |
— |
| Net other |
158 |
85 |
73 |
652 |
676 |
(24) |
116 |
44 |
72 |
(5) |
(21) |
16 |
| Non-underlying items |
— |
— |
— |
(8) |
(6) |
(2) |
— |
— |
— |
— |
— |
— |
| Royalties and carbon tax |
— |
— |
— |
(52) |
(52) |
— |
— |
— |
— |
— |
— |
— |
| Profit/(loss) before tax |
(625) |
(646) |
21 |
(591) |
(568) |
(23) |
(627) |
(607) |
(20) |
(13) |
(28) |
15 |
| Current taxation |
(16) |
— |
(16) |
(1) |
— |
(1) |
— |
— |
— |
— |
— |
— |
| Deferred taxation |
(24) |
— |
(24) |
— |
— |
— |
(39) |
— |
(39) |
— |
— |
— |
| Profit/(loss) for the period |
(665) |
(646) |
(19) |
(592) |
(568) |
(24) |
(666) |
(607) |
(59) |
(13) |
(28) |
15 |
| Attributable to: |
|
|
|
|
|
|
|
|
|
|
|
|
| Owners of the parent |
(645) |
(646) |
1 |
(592) |
(568) |
(24) |
(652) |
(607) |
(45) |
(13) |
(28) |
15 |
| Non-controlling interest holders |
(20) |
— |
(20) |
— |
— |
— |
(14) |
— |
(14) |
— |
— |
— |
| Sustaining capital expenditure |
(95) |
(95) |
— |
(42) |
(42) |
— |
(61) |
(61) |
— |
(29) |
(29) |
— |
| Ore reserve development |
— |
— |
— |
— |
— |
— |
— |
— |
— |
— |
— |
— |
| Growth projects |
(1,271) |
— |
(1,271) |
(48) |
(48) |
— |
(555) |
— |
(555) |
(174) |
— |
(174) |
| Total capital expenditure |
(1,366) |
(95) |
(1,271) |
(90) |
(90) |
— |
(616) |
(61) |
(555) |
(203) |
(29) |
(174) |
Sibanye-Stillwater Operating and financial results | Six months ended 30 June 2023 48
Figures are in millions
|
|
|
|
|
|
|
|
|
|
|
|
|
|
|
|
|
|
|
|
|
|
|
|
|
|
|
|
|
|
|
|
|
|
|
|
|
|
|
|
For the six months ended 30 Jun 2023 (Unaudited) |
For the six months ended 31 Dec 2022 (Unaudited) |
For the six months ended 30 Jun 2022 (Unaudited) |
|
EUROPE |
AUSTRALIA |
|
|
EUROPE |
EUROPE |
US dollars4 |
Total EU
operations |
Sandouville nickel refinery |
Corporate
and re-
conciling
items1
|
Total AUS operations |
New Century zinc retreatment operation2 |
Corporate
and re-
conciling
items1
|
Total EU
operations |
Sandouville nickel refinery |
Corporate
and re-
conciling
items1
|
Total EU
operations |
Sandouville nickel refinery3 |
Corporate
and re-
conciling
items1
|
| Revenue |
92 |
92 |
— |
28 |
28 |
— |
51 |
51 |
— |
141 |
141 |
— |
| Underground |
— |
— |
— |
— |
— |
— |
— |
— |
— |
— |
— |
— |
| Surface |
— |
— |
— |
28 |
28 |
— |
— |
— |
— |
— |
— |
— |
| Recycling/processing |
92 |
92 |
— |
— |
— |
— |
51 |
51 |
— |
141 |
141 |
— |
| Cost of sales, before amortisation and depreciation |
(128) |
(128) |
— |
(47) |
(47) |
— |
(84) |
(84) |
— |
(138) |
(138) |
— |
| Underground |
— |
— |
— |
— |
— |
— |
— |
— |
— |
— |
— |
— |
| Surface |
— |
— |
— |
(47) |
(47) |
— |
— |
— |
— |
— |
— |
— |
| Recycling/processing |
(128) |
(128) |
— |
— |
— |
— |
(84) |
(84) |
— |
(138) |
(138) |
— |
| Net other cash costs |
(1) |
1 |
(2) |
(9) |
(9) |
— |
(6) |
(1) |
(5) |
1 |
1 |
— |
| Adjusted EBITDA |
(37) |
(35) |
(2) |
(28) |
(28) |
— |
(39) |
(34) |
(5) |
4 |
4 |
— |
| Amortisation and depreciation |
(5) |
(5) |
— |
(31) |
(31) |
— |
(5) |
(5) |
— |
(4) |
(4) |
— |
| Interest income |
— |
— |
— |
— |
— |
— |
— |
— |
— |
— |
— |
— |
| Finance expense |
(1) |
— |
(1) |
(7) |
(7) |
— |
(1) |
(1) |
— |
— |
— |
— |
| Share-based payments |
— |
— |
— |
— |
— |
— |
— |
— |
— |
— |
— |
— |
| Net other |
9 |
5 |
4 |
36 |
37 |
(1) |
6 |
2 |
4 |
— |
(1) |
1 |
| Non-underlying items |
— |
— |
— |
— |
— |
— |
— |
— |
— |
— |
— |
— |
| Royalties and carbon tax |
— |
— |
— |
(3) |
(3) |
— |
— |
— |
— |
— |
— |
— |
| Profit/(loss) before tax |
(34) |
(35) |
1 |
(33) |
(32) |
(1) |
(39) |
(38) |
(1) |
— |
(1) |
1 |
| Current taxation |
(1) |
— |
(1) |
— |
— |
— |
— |
— |
— |
— |
— |
— |
| Deferred taxation |
(1) |
— |
(1) |
— |
— |
— |
(2) |
— |
(2) |
— |
— |
— |
| Profit/(loss) for the period |
(36) |
(35) |
(1) |
(33) |
(32) |
(1) |
(41) |
(38) |
(3) |
— |
(1) |
1 |
| Attributable to: |
|
|
|
|
|
|
|
|
|
|
|
|
| Owners of the parent |
(35) |
(35) |
— |
(33) |
(32) |
(1) |
(40) |
(38) |
(2) |
— |
(1) |
1 |
| Non-controlling interest holders |
(1) |
— |
(1) |
— |
— |
— |
(1) |
— |
(1) |
— |
— |
— |
| Sustaining capital expenditure |
(5) |
(5) |
— |
(2) |
(2) |
— |
(3) |
(3) |
— |
(2) |
(2) |
— |
| Ore reserve development |
— |
— |
— |
— |
— |
— |
— |
— |
— |
— |
— |
— |
| Growth projects |
(70) |
— |
(70) |
(3) |
(3) |
— |
(34) |
— |
(34) |
(11) |
— |
(11) |
| Total capital expenditure |
(75) |
(5) |
(70) |
(5) |
(5) |
— |
(37) |
(3) |
(34) |
(13) |
(2) |
(11) |
1Corporate and reconciling items represent the items to reconcile segment data to consolidated financial statement totals. This does not represent a separate segment as it does not generate revenue. Corporate and reconciling items for Battery metals includes Keliber for the six months ended 30 June 2023, 31 December 2022 and 30 June 2022, respectively
2New Century's results are included for the four months ended 30 June 2023 since the effective date of acquisition (see note 8.1)
3Sandouville nickel refinery's results for the six months ended 30 June 2022 includes the results of Sandouville for the five months since acquisition
4The average exchange rate for the six months ended 30 June 2023 was R18.21/US$, six months ended 31 December 2022 was R17.33/US$ and six months ended 30 June 2022 was R15.40/US$
Sibanye-Stillwater Operating and financial results | Six months ended 30 June 2023 49
ALL-IN COSTS - SIX MONTHS
US and SA PGM operations
Figures are in rand millions unless otherwise stated
|
|
|
|
|
|
|
|
|
|
|
|
|
|
|
|
|
|
|
|
|
|
|
|
|
|
|
|
|
|
|
|
|
|
|
|
|
|
|
|
US and SA PGM operations1 |
US PGM operations2 |
Total SA PGM operations1 |
Rustenburg |
Marikana1 |
Kroondal (Attribu- table) |
Plat Mile |
Mimosa (Attribu- table) |
Corporate |
Cost of sales, before amortisation and depreciation3 |
|
Jun 2023 |
22,298 |
|
4,165 |
|
18,133 |
|
7,336 |
|
8,813 |
|
1,677 |
|
307 |
|
1,156 |
|
(1,156) |
|
|
|
Dec 2022 |
19,117 |
|
3,616 |
|
15,501 |
|
6,888 |
|
6,530 |
|
1,774 |
|
309 |
|
1,046 |
|
(1,046) |
|
|
|
Jun 2022 |
20,623 |
|
3,842 |
|
16,781 |
|
6,659 |
|
8,073 |
|
1,774 |
|
275 |
|
890 |
|
(890) |
|
| Royalties |
|
Jun 2023 |
479 |
|
— |
|
479 |
|
196 |
|
278 |
|
5 |
|
— |
|
75 |
|
(75) |
|
|
|
Dec 2022 |
817 |
|
— |
|
817 |
|
565 |
|
245 |
|
7 |
|
— |
|
57 |
|
(57) |
|
|
|
Jun 2022 |
953 |
|
— |
|
953 |
|
458 |
|
488 |
|
7 |
|
— |
|
70 |
|
(70) |
|
| Carbon tax |
|
Jun 2023 |
1 |
|
— |
|
1 |
|
— |
|
1 |
|
— |
|
— |
|
— |
|
— |
|
|
|
Dec 2022 |
(1) |
|
— |
|
(1) |
|
— |
|
— |
|
(1) |
|
— |
|
— |
|
— |
|
|
|
Jun 2022 |
— |
|
— |
|
— |
|
(1) |
|
1 |
|
— |
|
— |
|
— |
|
— |
|
| Community costs |
|
Jun 2023 |
43 |
|
— |
|
43 |
|
— |
|
43 |
|
— |
|
— |
|
— |
|
— |
|
|
|
Dec 2022 |
49 |
|
— |
|
49 |
|
— |
|
49 |
|
— |
|
— |
|
— |
|
— |
|
|
|
Jun 2022 |
95 |
|
— |
|
95 |
|
— |
|
95 |
|
— |
|
— |
|
— |
|
— |
|
| Inventory change |
|
Jun 2023 |
(8) |
|
(187) |
|
179 |
|
(256) |
|
435 |
|
— |
|
— |
|
(5) |
|
5 |
|
|
|
Dec 2022 |
3,106 |
|
439 |
|
2,667 |
|
347 |
|
2,320 |
|
— |
|
— |
|
2 |
|
(2) |
|
|
|
Jun 2022 |
(385) |
|
(34) |
|
(351) |
|
(245) |
|
(106) |
|
— |
|
— |
|
(17) |
|
17 |
|
Share-based payments4 |
|
Jun 2023 |
84 |
|
52 |
|
32 |
|
13 |
|
19 |
|
(2) |
|
— |
|
— |
|
— |
|
|
|
Dec 2022 |
133 |
|
56 |
|
77 |
|
30 |
|
42 |
|
5 |
|
— |
|
— |
|
— |
|
|
|
Jun 2022 |
182 |
|
81 |
|
101 |
|
37 |
|
45 |
|
17 |
|
1 |
|
— |
|
— |
|
Rehabilitation interest and amortisation5 |
|
Jun 2023 |
106 |
|
41 |
|
65 |
|
(6) |
|
34 |
|
37 |
|
— |
|
3 |
|
(3) |
|
|
|
Dec 2022 |
86 |
|
28 |
|
58 |
|
(13) |
|
26 |
|
45 |
|
— |
|
3 |
|
(3) |
|
|
|
Jun 2022 |
105 |
|
24 |
|
81 |
|
2 |
|
40 |
|
39 |
|
— |
|
12 |
|
(12) |
|
| Leases |
|
Jun 2023 |
33 |
|
2 |
|
31 |
|
10 |
|
19 |
|
2 |
|
— |
|
— |
|
— |
|
|
|
Dec 2022 |
31 |
|
4 |
|
27 |
|
6 |
|
19 |
|
2 |
|
— |
|
— |
|
— |
|
|
|
Jun 2022 |
32 |
|
3 |
|
29 |
|
6 |
|
19 |
|
4 |
|
— |
|
— |
|
— |
|
| Ore reserve development |
|
Jun 2023 |
3,370 |
|
2,026 |
|
1,344 |
|
357 |
|
987 |
|
— |
|
— |
|
— |
|
— |
|
|
|
Dec 2022 |
2,793 |
|
1,610 |
|
1,183 |
|
371 |
|
812 |
|
— |
|
— |
|
— |
|
— |
|
|
|
Jun 2022 |
2,216 |
|
1,277 |
|
939 |
|
315 |
|
624 |
|
— |
|
— |
|
— |
|
— |
|
| Sustaining capital expenditure |
|
Jun 2023 |
1,570 |
|
784 |
|
786 |
|
273 |
|
397 |
|
112 |
|
4 |
|
510 |
|
(510) |
|
|
|
Dec 2022 |
2,046 |
|
806 |
|
1,240 |
|
385 |
|
681 |
|
158 |
|
16 |
|
570 |
|
(570) |
|
|
|
Jun 2022 |
1,195 |
|
378 |
|
817 |
|
305 |
|
391 |
|
115 |
|
6 |
|
294 |
|
(294) |
|
| Less: By-product credit |
|
Jun 2023 |
(5,478) |
|
(382) |
|
(5,096) |
|
(2,161) |
|
(2,556) |
|
(338) |
|
(41) |
|
(405) |
|
405 |
|
|
|
Dec 2022 |
(4,545) |
|
(467) |
|
(4,078) |
|
(1,867) |
|
(1,797) |
|
(369) |
|
(45) |
|
(368) |
|
368 |
|
|
|
Jun 2022 |
(5,292) |
|
(732) |
|
(4,560) |
|
(1,727) |
|
(2,347) |
|
(449) |
|
(37) |
|
(384) |
|
384 |
|
Total All-in-sustaining costs6 |
|
Jun 2023 |
22,498 |
|
6,501 |
|
15,997 |
|
5,762 |
|
8,470 |
|
1,493 |
|
270 |
|
1,334 |
|
(1,334) |
|
|
|
Dec 2022 |
23,632 |
|
6,092 |
|
17,540 |
|
6,712 |
|
8,927 |
|
1,621 |
|
280 |
|
1,310 |
|
(1,310) |
|
|
|
Jun 2022 |
19,724 |
|
4,839 |
|
14,885 |
|
5,809 |
|
7,323 |
|
1,507 |
|
245 |
|
865 |
|
(865) |
|
| Plus: Corporate cost, growth and capital expenditure |
|
Jun 2023 |
848 |
|
403 |
|
445 |
|
— |
|
391 |
|
18 |
|
36 |
|
— |
|
— |
|
|
|
Dec 2022 |
1,337 |
|
814 |
|
523 |
|
— |
|
523 |
|
— |
|
— |
|
— |
|
— |
|
|
|
Jun 2022 |
943 |
|
530 |
|
413 |
|
— |
|
413 |
|
— |
|
— |
|
— |
|
— |
|
Total All-in-costs6 |
|
Jun 2023 |
23,346 |
|
6,904 |
|
16,442 |
|
5,762 |
|
8,861 |
|
1,511 |
|
306 |
|
1,334 |
|
(1,334) |
|
|
|
Dec 2022 |
24,969 |
|
6,906 |
|
18,063 |
|
6,712 |
|
9,450 |
|
1,621 |
|
280 |
|
1,310 |
|
(1,310) |
|
|
|
Jun 2022 |
20,667 |
|
5,369 |
|
15,298 |
|
5,809 |
|
7,736 |
|
1,507 |
|
245 |
|
865 |
|
(865) |
|
| PGM production |
4Eoz - 2Eoz |
Jun 2023 |
1,054,236 |
|
205,513 |
|
848,723 |
|
314,471 |
|
368,075 |
|
83,516 |
|
25,319 |
|
57,342 |
|
— |
|
|
|
Dec 2022 |
1,072,750 |
|
191,094 |
|
881,656 |
|
324,025 |
|
375,652 |
|
100,441 |
|
23,558 |
|
57,980 |
|
— |
|
|
|
Jun 2022 |
1,079,191 |
|
230,039 |
|
849,152 |
|
304,872 |
|
360,609 |
|
101,315 |
|
24,802 |
|
57,554 |
|
— |
|
|
kg |
Jun 2023 |
32,790 |
|
6,392 |
|
26,398 |
|
9,781 |
|
11,448 |
|
2,598 |
|
788 |
|
1,784 |
|
— |
|
|
|
Dec 2022 |
33,366 |
|
5,944 |
|
27,423 |
|
10,078 |
|
11,684 |
|
3,124 |
|
733 |
|
1,803 |
|
— |
|
|
|
Jun 2022 |
33,567 |
|
7,155 |
|
26,412 |
|
9,483 |
|
11,216 |
|
3,151 |
|
771 |
|
1,790 |
|
— |
|
| All-in-sustaining cost |
R/4Eoz - R/2Eoz |
Jun 2023 |
22,568 |
|
31,633 |
|
20,214 |
|
18,323 |
|
23,012 |
|
17,877 |
|
10,664 |
|
23,264 |
|
— |
|
|
|
Dec 2022 |
23,288 |
|
31,880 |
|
21,295 |
|
20,714 |
|
23,764 |
|
16,139 |
|
11,886 |
|
22,594 |
|
— |
|
|
|
Jun 2022 |
19,306 |
|
21,036 |
|
18,804 |
|
19,054 |
|
20,307 |
|
14,874 |
|
9,878 |
|
15,029 |
|
— |
|
|
US$/4Eoz - US$/2Eoz |
Jun 2023 |
1,239 |
|
1,737 |
|
1,110 |
|
1,006 |
|
1,264 |
|
982 |
|
586 |
|
1,278 |
|
— |
|
|
|
Dec 2022 |
1,344 |
|
1,840 |
|
1,229 |
|
1,195 |
|
1,371 |
|
931 |
|
686 |
|
1,304 |
|
— |
|
|
|
Jun 2022 |
1,254 |
|
1,366 |
|
1,221 |
|
1,237 |
|
1,319 |
|
966 |
|
641 |
|
976 |
|
— |
|
| All-in-cost |
R/4Eoz - R/2Eoz |
Jun 2023 |
23,419 |
|
33,594 |
|
20,776 |
|
18,323 |
|
24,074 |
|
18,092 |
|
12,086 |
|
23,264 |
|
— |
|
|
|
Dec 2022 |
24,606 |
|
36,139 |
|
21,930 |
|
20,714 |
|
25,156 |
|
16,139 |
|
11,886 |
|
22,594 |
|
— |
|
|
|
Jun 2022 |
20,229 |
|
23,340 |
|
19,325 |
|
19,054 |
|
21,453 |
|
14,874 |
|
9,878 |
|
15,029 |
|
— |
|
|
US$/4Eoz - US$/2Eoz |
Jun 2023 |
1,286 |
|
1,845 |
|
1,141 |
|
1,006 |
|
1,322 |
|
994 |
|
664 |
|
1,278 |
|
— |
|
|
|
Dec 2022 |
1,420 |
|
2,085 |
|
1,265 |
|
1,195 |
|
1,452 |
|
931 |
|
686 |
|
1,304 |
|
— |
|
|
|
Jun 2022 |
1,314 |
|
1,516 |
|
1,255 |
|
1,237 |
|
1,393 |
|
966 |
|
641 |
|
976 |
|
— |
|
Average exchange rate for the six months ended 30 June 2023, 31 December 2022 and 30 June 2022 was R18.21/US$, R17.33/US$ and R15.40/US$, respectively
Figures may not add as they are rounded independently
Sibanye-Stillwater Operating and financial results | Six months ended 30 June 2023 50
1The US and SA PGM operations, Total SA PGM operations and Marikana includes the production and costs associated with the purchase of concentrate (PoC) from third parties. For a reconciliation of the Operating cost, AISC and AIC excluding third party PoC, refer to “Reconciliation of operating cost excluding third party PoC for US and SA PGM operations, Total SA PGM operations and Marikana - Six Months” and “Reconciliation of AISC and AIC excluding third party PoC for US and SA PGM operations, Total SA PGM operations and Marikana – Six Months”
2The US PGM operations’ underground production is converted to metric tonnes and kilograms, and performance is translated into SA rand. In addition to the US PGM operations’ underground production, the operation processes various recycling material which is excluded from the 2E PGM production, All-in sustaining cost and All-in cost statistics shown
3Cost of sales, before amortisation and depreciation includes all mining and processing costs, third party refining costs, corporate general and administrative costs, and permitting costs
4Share-based payments are calculated based on the fair value at initial recognition and do not include the adjustment of the cash-settled share-based payment obligation to the reporting date fair value
5Rehabilitation includes the interest charge related to the environmental rehabilitation obligation and the amortisation of the related capitalised rehabilitation costs. The interest charge related to the environmental rehabilitation obligation and the amortisation of the capitalised rehabilitation costs reflect the periodic costs of rehabilitation associated with current PGM production
6All-in cost is calculated in accordance with the World Gold Council guidance. All-in cost excludes income tax, costs associated with merger and acquisition activities, working capital, impairments, financing costs, one-time severance charges and items needed to normalise earnings. All-in cost is made up of All-in sustaining cost, being the cost to sustain current operations, given as a sub-total in the All-in cost calculation, together with corporate and major capital expenditure associated with growth. All-in sustaining cost per ounce and All-in cost per ounce are calculated by dividing the All-in sustaining cost and All-in cost, respectively, in a period by the total 4E/2E PGM produced in the same period
|
|
|
|
|
|
|
|
|
|
|
|
|
|
|
|
|
|
|
|
|
|
|
|
|
|
|
|
|
|
|
|
|
| Reconciliation of operating cost excluding third party PoC for US and SA PGM, operations Total SA PGM operations and Marikana - Six Months |
|
|
US and SA PGM operations |
Total SA PGM operations |
Marikana |
|
R' mil |
Jun 2023 |
Dec 2022 |
Jun 2022 |
Jun 2023 |
Dec 2022 |
Jun 2022 |
Jun 2023 |
Dec 2022 |
Jun 2022 |
| Cost of sales, before amortisation and depreciation as reported per table above |
|
22,298 |
|
19,117 |
|
20,623 |
|
18,133 |
|
15,501 |
|
16,781 |
|
8,813 |
|
6,530 |
|
8,073 |
|
| Inventory change as reported per table above |
|
(8) |
|
3,106 |
|
(385) |
|
179 |
|
2,667 |
|
(351) |
|
435 |
|
2,320 |
|
(106) |
|
| Less: Chrome cost of sales |
|
(708) |
|
(753) |
|
(776) |
|
(708) |
|
(753) |
|
(776) |
|
(223) |
|
(164) |
|
(212) |
|
| Total operating cost including third party PoC |
|
21,582 |
|
21,470 |
|
19,462 |
|
17,604 |
|
17,415 |
|
15,654 |
|
9,025 |
|
8,686 |
|
7,755 |
|
| Less: Purchase cost of PoC |
|
(1,595) |
|
(1,638) |
|
(1,100) |
|
(1,595) |
|
(1,638) |
|
(1,100) |
|
(1,595) |
|
(1,638) |
|
(1,100) |
|
| Total operating cost excluding third party PoC |
|
19,987 |
|
19,832 |
|
18,362 |
|
16,009 |
|
15,777 |
|
14,554 |
|
7,430 |
|
7,048 |
|
6,655 |
|
|
|
|
|
|
|
|
|
|
|
|
| PGM production as reported per table above |
4Eoz- 2Eoz |
1,054,236 |
|
1,072,750 |
|
1,079,191 |
|
848,723 |
|
881,656 |
|
849,152 |
|
368,075 |
|
375,652 |
|
360,609 |
|
| Less: Mimosa production |
|
(57,342) |
|
(57,980) |
|
(57,554) |
|
(57,342) |
|
(57,980) |
|
(57,554) |
|
— |
|
— |
|
— |
|
| PGM production excluding Mimosa |
|
996,894 |
|
1,014,770 |
|
1,021,637 |
|
791,381 |
|
823,676 |
|
791,598 |
|
368,075 |
|
375,652 |
|
360,609 |
|
| Less: PoC production |
|
(49,541) |
|
(37,998) |
|
(25,346) |
|
(49,541) |
|
(37,998) |
|
(25,346) |
|
(49,541) |
|
(37,998) |
|
(25,346) |
|
| PGM production excluding Mimosa and third party PoC |
|
947,353 |
|
976,772 |
|
996,291 |
|
741,840 |
|
785,678 |
|
766,252 |
|
318,534 |
|
337,654 |
|
335,263 |
|
|
|
|
|
|
|
|
|
|
|
|
| PGM production including Mimosa and excluding third party PoC |
|
1,004,695 |
|
1,034,752 |
|
1,053,845 |
|
799,182 |
|
843,658 |
|
823,806 |
|
318,534 |
|
337,654 |
|
335,263 |
|
|
|
|
|
|
|
|
|
|
|
|
| Tonnes milled/treated |
kt |
18,211 |
|
18,867 |
|
18,932 |
|
17,642 |
|
18,339 |
|
18,305 |
|
4,722 |
|
4,993 |
|
5,020 |
|
| Less: Mimosa tonnes |
|
(680) |
|
(687) |
|
(700) |
|
(680) |
|
(687) |
|
(700) |
|
— |
|
— |
|
— |
|
| PGM tonnes excluding Mimosa and third party PoC |
|
17,531 |
|
18,179 |
|
18,232 |
|
16,962 |
|
17,652 |
|
17,605 |
|
4,722 |
|
4,993 |
|
5,020 |
|
| Operating cost including third party PoC |
R/4Eoz-R/2Eoz |
21,649 |
|
21,158 |
|
19,050 |
|
22,245 |
|
21,143 |
|
19,775 |
|
24,519 |
|
23,122 |
|
21,505 |
|
|
US$/4Eoz-US$/2Eoz |
1,189 |
|
1,221 |
|
1,237 |
|
1,222 |
|
1,220 |
|
1,284 |
|
1,346 |
|
1,334 |
|
1,396 |
|
|
R/t |
1,231 |
|
1,181 |
|
1,067 |
|
1,038 |
|
987 |
|
889 |
|
1,911 |
|
1,739 |
|
1,545 |
|
|
US$/t |
68 |
|
68 |
|
69 |
|
57 |
|
57 |
|
58 |
|
105 |
|
100 |
|
100 |
|
| Operating cost excluding third party PoC |
R/4Eoz-R/2Eoz |
21,098 |
|
20,304 |
|
18,430 |
|
21,580 |
|
20,081 |
|
18,994 |
|
23,326 |
|
20,873 |
|
19,850 |
|
|
US$/4Eoz-US$/2Eoz |
1,159 |
|
1,172 |
|
1,197 |
|
1,185 |
|
1,159 |
|
1,233 |
|
1,281 |
|
1,204 |
|
1,289 |
|
|
R/t |
1,140 |
|
1,091 |
|
1,007 |
|
944 |
|
894 |
|
827 |
|
1,573 |
|
1,411 |
|
1,326 |
|
|
US$/t |
63 |
|
63 |
|
65 |
|
52 |
|
52 |
|
54 |
|
86 |
|
81 |
|
86 |
|
|
|
|
|
|
|
|
|
|
|
|
|
|
|
|
|
|
|
|
|
|
|
|
|
|
|
|
|
|
|
|
|
|
| Reconciliation of AISC and AIC excluding third party PoC for US and SA PGM operations, Total SA PGM operations and Marikana - Six Months |
|
|
US and SA PGM operations |
Total SA PGM operations |
Marikana |
|
R' mil |
Jun 2023 |
Dec 2022 |
Jun 2022 |
Jun 2023 |
Dec 2022 |
Jun 2022 |
Jun 2023 |
Dec 2022 |
Jun 2022 |
| Total All-in-sustaining cost as reported per table above |
|
22,498 |
|
23,632 |
|
19,724 |
|
15,997 |
|
17,540 |
|
14,885 |
|
8,470 |
|
8,927 |
|
7,323 |
|
| Less: Purchase cost of PoC |
|
(1,595) |
|
(1,638) |
|
(1,100) |
|
(1,595) |
|
(1,638) |
|
(1,100) |
|
(1,595) |
|
(1,638) |
|
(1,100) |
|
| Add: By-product credit of PoC |
|
224 |
|
150 |
|
130 |
|
224 |
|
150 |
|
130 |
|
224 |
|
150 |
|
130 |
|
| Total All-in-sustaining cost excluding third party PoC |
|
21,127 |
|
22,144 |
|
18,754 |
|
14,626 |
|
16,052 |
|
13,915 |
|
7,099 |
|
7,439 |
|
6,353 |
|
| Plus: Corporate cost, growth and capital expenditure |
|
848 |
|
1,337 |
|
943 |
|
445 |
|
523 |
|
413 |
|
391 |
|
523 |
|
413 |
|
| Total All-in-cost excluding third party PoC |
|
21,975 |
|
23,481 |
|
19,697 |
|
15,071 |
|
16,575 |
|
14,328 |
|
7,490 |
|
7,962 |
|
6,766 |
|
|
|
|
|
|
|
|
|
|
|
|
| PGM production excluding Mimosa and third party PoC |
4Eoz- 2Eoz |
947,353 |
|
976,772 |
|
996,291 |
|
741,840 |
|
785,678 |
|
766,252 |
|
318,534 |
|
337,654 |
|
335,263 |
|
|
|
|
|
|
|
|
|
|
|
|
| All-in-sustaining cost excluding third party PoC |
R/4Eoz-R/2Eoz |
22,301 |
|
22,671 |
|
18,824 |
|
19,716 |
|
20,431 |
|
18,160 |
|
22,286 |
|
22,031 |
|
18,949 |
|
|
US$/4Eoz-US$/2Eoz |
1,225 |
|
1,308 |
|
1,222 |
|
1,083 |
|
1,179 |
|
1,179 |
|
1,224 |
|
1,271 |
|
1,230 |
|
|
|
|
|
|
|
|
|
|
|
|
| All-in-cost excluding third party PoC |
R/4Eoz-R/2Eoz |
23,196 |
|
24,039 |
|
19,770 |
|
20,316 |
|
21,096 |
|
18,699 |
|
23,514 |
|
23,580 |
|
20,181 |
|
|
US$/4Eoz-US$/2Eoz |
1,274 |
|
1,387 |
|
1,284 |
|
1,116 |
|
1,217 |
|
1,214 |
|
1,291 |
|
1,361 |
|
1,310 |
|
Sibanye-Stillwater Operating and financial results | Six months ended 30 June 2023 51
ALL-IN-COSTS - SIX MONTHS (continued)
SA gold operations
Figures are in rand millions unless otherwise stated
|
|
|
|
|
|
|
|
|
|
|
|
|
|
|
|
|
|
|
|
|
|
|
|
|
|
|
|
|
|
|
|
|
|
Total SA gold operations |
Driefontein |
Kloof |
Beatrix |
Cooke |
DRDGOLD |
Corporate |
Cost of sales, before amortisation and depreciation1 |
|
Jun 2023 |
12,138 |
|
3,347 |
|
4,179 |
|
2,125 |
|
599 |
|
1,888 |
|
— |
|
|
|
Dec 2022 |
11,616 |
|
2,989 |
|
3,565 |
|
2,629 |
|
496 |
|
1,937 |
|
— |
|
|
|
Jun 2022 |
8,557 |
|
2,292 |
|
2,816 |
|
1,281 |
|
326 |
|
1,842 |
|
— |
|
| Royalties |
|
Jun 2023 |
61 |
|
23 |
|
23 |
|
13 |
|
3 |
|
— |
|
(1) |
|
|
|
Dec 2022 |
46 |
|
15 |
|
16 |
|
12 |
|
3 |
|
— |
|
— |
|
|
|
Jun 2022 |
17 |
|
7 |
|
7 |
|
1 |
|
2 |
|
— |
|
— |
|
| Carbon tax |
|
Jun 2023 |
— |
|
— |
|
— |
|
— |
|
— |
|
— |
|
— |
|
|
|
Dec 2022 |
1 |
|
— |
|
— |
|
1 |
|
— |
|
— |
|
— |
|
|
|
Jun 2022 |
(11) |
|
— |
|
— |
|
(11) |
|
— |
|
— |
|
— |
|
| Community costs |
|
Jun 2023 |
11 |
|
1 |
|
2 |
|
1 |
|
— |
|
7 |
|
— |
|
|
|
Dec 2022 |
27 |
|
8 |
|
7 |
|
6 |
|
— |
|
6 |
|
— |
|
|
|
Jun 2022 |
66 |
|
24 |
|
20 |
|
17 |
|
— |
|
5 |
|
— |
|
Share-based payments2 |
|
Jun 2023 |
35 |
|
9 |
|
8 |
|
1 |
|
— |
|
12 |
|
5 |
|
|
|
Dec 2022 |
76 |
|
24 |
|
25 |
|
17 |
|
— |
|
10 |
|
— |
|
|
|
Jun 2022 |
70 |
|
25 |
|
22 |
|
14 |
|
— |
|
9 |
|
— |
|
Rehabilitation interest and amortisation3 |
|
Jun 2023 |
100 |
|
2 |
|
15 |
|
39 |
|
45 |
|
(3) |
|
2 |
|
|
|
Dec 2022 |
71 |
|
(4) |
|
(14) |
|
30 |
|
26 |
|
8 |
|
25 |
|
|
|
Jun 2022 |
69 |
|
17 |
|
(2) |
|
20 |
|
24 |
|
7 |
|
3 |
|
| Leases |
|
Jun 2023 |
29 |
|
1 |
|
6 |
|
11 |
|
1 |
|
10 |
|
— |
|
|
|
Dec 2022 |
39 |
|
3 |
|
9 |
|
15 |
|
1 |
|
11 |
|
— |
|
|
|
Jun 2022 |
42 |
|
2 |
|
9 |
|
14 |
|
3 |
|
14 |
|
— |
|
| Ore reserve development |
|
Jun 2023 |
1,398 |
|
760 |
|
470 |
|
168 |
|
— |
|
— |
|
— |
|
|
|
Dec 2022 |
1,163 |
|
542 |
|
436 |
|
185 |
|
— |
|
— |
|
— |
|
|
|
Jun 2022 |
468 |
|
252 |
|
185 |
|
31 |
|
— |
|
— |
|
— |
|
| Sustaining capital expenditure |
|
Jun 2023 |
641 |
|
190 |
|
179 |
|
41 |
|
— |
|
230 |
|
1 |
|
|
|
Dec 2022 |
889 |
|
263 |
|
303 |
|
87 |
|
— |
|
236 |
|
— |
|
|
|
Jun 2022 |
725 |
|
95 |
|
152 |
|
68 |
|
— |
|
410 |
|
— |
|
| Less: By-product credit |
|
Jun 2023 |
(13) |
|
(2) |
|
(2) |
|
(2) |
|
— |
|
(7) |
|
— |
|
|
|
Dec 2022 |
(6) |
|
(2) |
|
(2) |
|
(2) |
|
— |
|
— |
|
— |
|
|
|
Jun 2022 |
(7) |
|
(1) |
|
(1) |
|
— |
|
— |
|
(5) |
|
— |
|
Total All-in-sustaining costs4 |
|
Jun 2023 |
14,400 |
|
4,331 |
|
4,880 |
|
2,397 |
|
648 |
|
2,137 |
|
7 |
|
|
|
Dec 2022 |
13,922 |
|
3,838 |
|
4,345 |
|
2,980 |
|
526 |
|
2,208 |
|
25 |
|
|
|
Jun 2022 |
9,996 |
|
2,713 |
|
3,208 |
|
1,435 |
|
355 |
|
2,282 |
|
3 |
|
| Plus: Corporate cost, growth and capital expenditure |
|
Jun 2023 |
1,367 |
|
— |
|
67 |
|
— |
|
— |
|
427 |
|
873 |
|
|
|
Dec 2022 |
940 |
|
— |
|
155 |
|
— |
|
— |
|
118 |
|
667 |
|
|
|
Jun 2022 |
439 |
|
— |
|
54 |
|
4 |
|
— |
|
6 |
|
375 |
|
Total All-in-costs4 |
|
Jun 2023 |
15,767 |
|
4,331 |
|
4,947 |
|
2,397 |
|
648 |
|
2,564 |
|
880 |
|
|
|
Dec 2022 |
14,862 |
|
3,838 |
|
4,500 |
|
2,980 |
|
526 |
|
2,326 |
|
692 |
|
|
|
Jun 2022 |
10,435 |
|
2,713 |
|
3,262 |
|
1,439 |
|
355 |
|
2,288 |
|
378 |
|
| Gold sold |
kg |
Jun 2023 |
13,566 |
|
4,052 |
|
4,062 |
|
2,286 |
|
615 |
|
2,551 |
|
— |
|
|
|
Dec 2022 |
12,378 |
|
3,148 |
|
3,319 |
|
2,543 |
|
606 |
|
2,762 |
|
— |
|
|
|
Jun 2022 |
6,481 |
|
1,603 |
|
1,424 |
|
265 |
|
366 |
|
2,823 |
|
— |
|
|
oz |
Jun 2023 |
436,157 |
|
130,275 |
|
130,596 |
|
73,497 |
|
19,773 |
|
82,017 |
|
— |
|
|
|
Dec 2022 |
397,962 |
|
101,211 |
|
106,708 |
|
81,759 |
|
19,483 |
|
88,800 |
|
— |
|
|
|
Jun 2022 |
208,369 |
|
51,538 |
|
45,783 |
|
8,520 |
|
11,767 |
|
90,762 |
|
— |
|
| All-in-sustaining cost |
R/kg |
Jun 2023 |
1,061,477 |
|
1,068,855 |
|
1,201,379 |
|
1,048,556 |
|
1,053,659 |
|
837,711 |
|
— |
|
|
|
Dec 2022 |
1,124,737 |
|
1,219,187 |
|
1,309,129 |
|
1,171,844 |
|
867,987 |
|
799,421 |
|
— |
|
|
|
Jun 2022 |
1,542,355 |
|
1,692,452 |
|
2,252,809 |
|
5,415,094 |
|
969,945 |
|
808,360 |
|
— |
|
| All-in-sustaining cost |
US$/oz |
Jun 2023 |
1,813 |
|
1,826 |
|
2,052 |
|
1,791 |
|
1,800 |
|
1,431 |
|
— |
|
|
|
Dec 2022 |
2,019 |
|
2,188 |
|
2,350 |
|
2,103 |
|
1,558 |
|
1,435 |
|
— |
|
|
|
Jun 2022 |
3,115 |
|
3,418 |
|
4,550 |
|
10,937 |
|
1,959 |
|
1,633 |
|
— |
|
| All-in-cost |
R/kg |
Jun 2023 |
1,162,244 |
|
1,068,855 |
|
1,217,873 |
|
1,048,556 |
|
1,053,659 |
|
1,005,096 |
|
— |
|
|
|
Dec 2022 |
1,200,679 |
|
1,219,187 |
|
1,355,830 |
|
1,171,844 |
|
867,987 |
|
842,143 |
|
— |
|
|
|
Jun 2022 |
1,610,091 |
|
1,692,452 |
|
2,290,730 |
|
5,430,189 |
|
969,945 |
|
810,485 |
|
— |
|
| All-in-cost |
US$/oz |
Jun 2023 |
1,985 |
|
1,826 |
|
2,080 |
|
1,791 |
|
1,800 |
|
1,717 |
|
— |
|
|
|
Dec 2022 |
2,155 |
|
2,188 |
|
2,433 |
|
2,103 |
|
1,558 |
|
1,511 |
|
— |
|
|
|
Jun 2022 |
3,252 |
|
3,418 |
|
4,627 |
|
10,967 |
|
1,959 |
|
1,637 |
|
— |
|
Average exchange rate for the six months ended 30 June 2023, 31 December 2022 and 30 June 2022 was R18.21/US$, R17.33/US$ and R15.40/US$, respectively
Figures may not add as they are rounded independently
1Cost of sales, before amortisation and depreciation includes all mining and processing costs, third party refining costs, corporate general and administrative costs, and permitting costs
2Share-based payments are calculated based on the fair value at initial recognition and do not include the adjustment of the cash-settled share-based payment obligation to the reporting date fair value
3Rehabilitation includes the interest charge related to the environmental rehabilitation obligation and the amortisation of the related capitalised rehabilitation costs. The interest charge related to the environmental rehabilitation obligation and the amortisation of the capitalised rehabilitation costs reflect the periodic costs of rehabilitation associated with current gold production
4All-in cost is calculated in accordance with the World Gold Council guidance. All-in cost excludes income tax, costs associated with merger and acquisition activities, working capital, impairments, financing costs, one time severance charges and items needed to normalise earnings. All-in cost is made up of All-in sustaining cost, being the cost to sustain current operations, given as a sub-total in the All-in cost calculation, together with corporate and major capital expenditure associated with growth. All-in sustaining cost per kilogram (and ounce) and All-in cost per kilogram (and ounce) are calculated by dividing the All-in sustaining cost and All-in cost, respectively, in a period by the total gold sold over the same period
Sibanye-Stillwater Operating and financial results | Six months ended 30 June 2023 52
ALL-IN-COSTS - SIX MONTHS (continued)
Australian operations
Figures are in rand millions unless otherwise stated
|
|
|
|
|
|
|
|
|
|
|
|
| New Century zinc retreatment operation |
|
|
|
New Century1 |
Cost of sales, before amortisation and depreciation2 |
|
Jun 2023 |
851 |
|
|
|
|
|
|
|
|
|
| Royalties |
|
Jun 2023 |
52 |
|
|
|
|
|
|
|
|
|
| Community costs |
|
Jun 2023 |
10 |
|
|
|
|
|
|
|
|
|
| Inventory change |
|
Jun 2023 |
91 |
|
|
|
|
|
|
|
|
|
| Share-based payments |
|
Jun 2023 |
— |
|
|
|
|
|
|
|
|
|
Rehabilitation interest and amortisation3 |
|
Jun 2023 |
3 |
|
|
|
|
|
|
|
|
|
| Leases |
|
Jun 2023 |
43 |
|
|
|
|
|
|
|
|
|
| Sustaining capital expenditure |
|
Jun 2023 |
42 |
|
|
|
|
|
|
|
|
|
| Less: By-product credit |
|
Jun 2023 |
(24) |
|
|
|
|
|
|
|
|
|
Total All-in-sustaining costs4 |
|
Jun 2023 |
1,068 |
|
|
|
|
|
|
|
|
|
| Plus: Corporate cost, growth and capital expenditure |
|
Jun 2023 |
153 |
|
|
|
|
|
|
|
|
|
Total All-in-costs4 |
|
Jun 2023 |
1,221 |
|
|
|
|
|
|
|
|
|
| Zinc metal produced (payable) |
kt |
Jun 2023 |
24 |
|
|
|
|
|
|
|
|
|
| All-in-sustaining cost |
R/tZn |
Jun 2023 |
44,030 |
|
|
|
|
|
|
|
|
|
|
US$/tZn |
Jun 2023 |
2,418 |
|
|
|
|
|
|
|
|
|
| All-in-cost |
R/tZn |
Jun 2023 |
50,338 |
|
|
|
|
|
|
|
|
|
|
US$/tZn |
Jun 2023 |
2,764 |
|
|
|
|
|
|
|
|
|
Average exchange rate for the six months ended 30 June 2023 was R18.21/US$
Figures may not add as they are rounded independently
1New Century is a leading tailings management and rehabilitation company that currently owns and operates the New Century zinc tailings retreatment operation in Queensland, Australia. Amounts included since effective date of acquisition on 22 February 2023
2Cost of sales, before amortisation and depreciation includes all mining and processing costs, corporate general and administrative costs, and permitting costs
3Rehabilitation includes the interest charge related to the environmental rehabilitation obligation and the amortisation of the related capitalised rehabilitation costs. The interest charge related to the environmental rehabilitation obligation and the amortisation of the capitalised rehabilitation costs reflect the periodic costs of rehabilitation associated with current zinc production
4All-in cost is calculated in accordance with the World Gold Council guidance. All-in cost excludes income tax, costs associated with merger and acquisition activities, working capital, impairments, financing costs, one-time severance charges and items needed to normalise earnings. All-in cost is made up of All-in sustaining cost, being the cost to sustain current operations, given as a sub-total in the All-in cost calculation, together with corporate and major capital expenditure associated with growth. All-in sustaining cost per tonne and All-in cost per tonne are calculated by dividing the All-in sustaining cost and All-in cost, respectively, in a period by the total tonnes of zinc metal produced (payable) in the same period
Sibanye-Stillwater Operating and financial results | Six months ended 30 June 2023 53
UNIT OPERATING COST - SIX MONTHS
US and SA PGM operations
Figures are in rand millions unless otherwise stated
|
|
|
|
|
|
|
|
|
|
|
|
|
|
|
|
|
|
|
|
|
|
|
|
|
|
|
|
|
|
|
|
|
|
|
|
|
|
|
|
|
|
|
US and SA PGM operations1 |
US PGM operations |
Total SA PGM operations1,3 |
Rustenburg3 |
Marikana3 |
Kroondal3 |
Plat Mile |
Mimosa |
|
|
|
Under-
ground2
|
Total |
Under-
ground |
Surface |
Under-
ground |
Surface |
Attribu-table |
Surface |
Attribu-table |
|
| Cost of sales, before amortisation and depreciation |
|
Jun 2023 |
22,298 |
|
4,165 |
|
18,133 |
6,756 |
|
580 |
|
8,813 |
1,677 |
|
307 |
|
1,156 |
|
|
|
Dec 2022 |
19,117 |
|
3,616 |
|
15,501 |
|
6,272 |
|
616 |
|
6,530 |
1,774 |
|
309 |
|
1,046 |
|
|
|
Jun 2022 |
20,623 |
|
3,842 |
|
16,781 |
|
6,106 |
|
553 |
|
8,073 |
1,774 |
|
275 |
|
890 |
|
| Inventory change |
|
Jun 2023 |
(8) |
|
(187) |
|
179 |
(196) |
|
(60) |
|
435 |
— |
|
— |
|
(5) |
|
|
|
Dec 2022 |
3,106 |
|
439 |
|
2,667 |
|
150 |
|
197 |
|
2,320 |
— |
|
— |
|
2 |
|
|
|
Jun 2022 |
(385) |
|
(34) |
|
(351) |
|
(228) |
|
(17) |
|
(106) |
— |
|
— |
|
(17) |
|
| Less: Chrome cost of sales |
|
Jun 2023 |
(708) |
|
— |
|
(708) |
|
(480) |
|
— |
|
(223) |
(5) |
|
— |
|
— |
|
|
|
Dec 2022 |
(753) |
|
— |
|
(753) |
|
(584) |
|
— |
|
(164) |
(5) |
|
— |
|
— |
|
|
|
Jun 2022 |
(776) |
|
— |
|
(776) |
|
(433) |
|
— |
|
(212) |
(131) |
|
— |
|
— |
|
| Less: Purchase cost of PoC |
|
Jun 2023 |
(1,595) |
|
— |
|
(1,595) |
|
— |
|
— |
|
(1,595) |
— |
|
— |
|
— |
|
|
|
Dec 2022 |
(1,638) |
|
— |
|
(1,638) |
|
— |
|
— |
|
(1,638) |
— |
|
— |
|
— |
|
|
|
Jun 2022 |
(1,100) |
|
— |
|
(1,100) |
|
— |
|
— |
|
(1,100) |
— |
|
— |
|
— |
|
| Total operating cost excluding third party PoC |
|
Jun 2023 |
19,987 |
|
3,978 |
|
16,009 |
6,080 |
|
520 |
|
7,430 |
1,672 |
|
307 |
|
1,151 |
|
|
|
Dec 2022 |
19,832 |
|
4,055 |
|
15,777 |
|
5,838 |
|
813 |
|
7,048 |
1,769 |
|
309 |
|
1,048 |
|
|
|
Jun 2022 |
18,362 |
|
3,808 |
|
14,554 |
|
5,445 |
|
536 |
|
6,655 |
1,643 |
|
275 |
|
873 |
|
Tonnes milled/treated excluding third party PoC4 |
kt |
Jun 2023 |
17,531 |
|
569 |
|
16,962 |
|
2,984 |
|
2,649 |
|
2,993 |
|
1,729 |
|
1,413 |
|
5,194 |
|
680 |
|
|
|
Dec 2022 |
18,179 |
|
527 |
|
17,652 |
|
3,065 |
|
2,803 |
|
3,175 |
|
1,818 |
|
1,604 |
|
5,186 |
|
687 |
|
|
|
Jun 2022 |
18,232 |
|
627 |
|
17,605 |
|
2,972 |
|
2,807 |
|
3,140 |
|
1,880 |
|
1,647 |
|
5,159 |
|
700 |
|
PGM production excluding third party PoC4 |
4Eoz |
Jun 2023 |
947,353 |
|
205,513 |
|
741,840 |
277,846 |
|
36,625 |
|
318,534 |
83,516 |
|
25,319 |
|
57,342 |
|
|
|
Dec 2022 |
976,772 |
|
191,094 |
|
785,678 |
|
283,148 |
|
40,877 |
|
337,654 |
100,441 |
|
23,558 |
|
57,980 |
|
|
|
Jun 2022 |
996,291 |
|
230,039 |
|
766,252 |
|
270,515 |
|
34,357 |
|
335,263 |
101,315 |
|
24,802 |
|
57,554 |
|
Operating cost excluding third party PoC5 |
R/t |
Jun 2023 |
1,140 |
|
6,994 |
|
944 |
|
2,038 |
|
196 |
|
1,573 |
1,183 |
|
59 |
|
1,692 |
|
|
|
Dec 2022 |
1,091 |
|
7,687 |
|
894 |
|
1,905 |
|
290 |
|
1,411 |
1,103 |
|
60 |
|
1,524 |
|
|
|
Jun 2022 |
1,007 |
|
6,073 |
|
827 |
|
1,832 |
|
191 |
|
1,326 |
998 |
|
53 |
|
1,247 |
|
|
US$/t |
Jun 2023 |
63 |
|
384 |
|
52 |
|
112 |
|
11 |
|
86 |
65 |
|
3 |
|
93 |
|
|
|
Dec 2022 |
63 |
|
444 |
|
52 |
|
110 |
|
17 |
|
81 |
64 |
|
3 |
|
88 |
|
|
Jun 2022 |
65 |
|
394 |
|
54 |
|
119 |
|
12 |
|
86 |
65 |
|
3 |
|
81 |
|
R/4Eoz - R/2Eoz |
Jun 2023 |
21,098 |
|
19,356 |
|
21,580 |
|
21,883 |
|
14,198 |
|
23,326 |
20,020 |
|
12,125 |
|
20,073 |
|
|
|
Dec 2022 |
20,304 |
|
21,220 |
|
20,081 |
|
20,618 |
|
19,889 |
|
20,873 |
17,612 |
|
13,117 |
|
18,075 |
|
|
|
Jun 2022 |
18,430 |
|
16,554 |
|
18,994 |
|
20,128 |
|
15,601 |
|
19,850 |
16,217 |
|
11,088 |
|
15,168 |
|
|
US$/4Eoz - US$/2Eoz |
Jun 2023 |
1,159 |
|
1,063 |
|
1,185 |
|
1,202 |
|
780 |
|
1,281 |
1,099 |
|
666 |
|
1,102 |
|
|
|
Dec 2022 |
1,172 |
|
1,224 |
|
1,159 |
|
1,190 |
|
1,148 |
|
1,204 |
1,016 |
|
757 |
|
1,043 |
|
|
|
Jun 2022 |
1,197 |
|
1,075 |
|
1,233 |
|
1,307 |
|
1,013 |
|
1,289 |
1,053 |
|
720 |
|
985 |
|
Average exchange rate for the six months ended 30 June 2023, 31 December 2022 and 30 June 2022 was R18.21/US$, R17.33/US$ and R15.40, respectively
Figures may not add as they are rounded independently
1 US and SA PGM operations and Total SA PGM operations’ exclude the results of Mimosa, which is equity accounted
2 The US PGM operations’ underground production is converted to metric tonnes and kilograms, and performance is translated into rand. In addition to the US PGM operations’
underground production, the operation treats various recycling material which is excluded from the statistics shown above
3 Cost of sales, before amortisation and depreciation for Total SA PGM, Rustenburg, Marikana and Kroondal includes the Chrome cost of sales which is excluded for unit cost calculation purposes as Chrome production is excluded from the 4Eoz production
4 For a reconciliation of the production excluding Mimosa and third party PoC, refer to “Reconciliation of operating cost excluding third party PoC for US and SA PGM operations, Total SA PGM operations and Marikana - Six Months”
5 Operating cost is the average cost of production and operating cost per tonne is calculated by dividing the cost of sales, before amortisation and depreciation and change in inventory in a period by the tonnes milled/treated in the same period, and operating cost per ounce is calculated by dividing the cost of sales, before amortisation and depreciation and change in inventory in a period, by the PGM produced in the same period
Sibanye-Stillwater Operating and financial results | Six months ended 30 June 2023 54
UNIT OPERATING COST - SIX MONTHS (continued)
SA gold operations
Figures are in rand millions unless otherwise stated
|
|
|
|
|
|
|
|
|
|
|
|
|
|
|
|
|
|
|
|
|
|
|
|
|
|
|
|
|
|
|
|
|
|
|
|
|
|
|
|
|
|
|
|
|
|
Total SA gold operations |
Driefontein |
Kloof |
Beatrix |
Cooke |
DRDGOLD |
|
|
|
Total |
Under-
ground |
Surface |
Under-
ground |
Surface |
Under-
ground |
Surface |
Under-
ground |
Surface |
Surface |
Surface |
|
| Cost of sales, before amortisation and depreciation |
|
Jun 2023 |
12,138 |
|
9,219 |
|
2,919 |
|
3,264 |
|
83 |
|
3,911 |
|
268 |
|
2,044 |
|
81 |
|
599 |
|
1,888 |
|
|
|
Dec 2022 |
11,616 |
|
8,703 |
|
2,913 |
|
2,852 |
|
137 |
|
3,254 |
|
311 |
|
2,597 |
|
32 |
|
496 |
|
1,937 |
|
|
|
Jun 2022 |
8,557 |
|
6,042 |
|
2,515 |
|
2,233 |
|
59 |
|
2,566 |
|
250 |
|
1,243 |
|
38 |
|
326 |
|
1,842 |
|
| Inventory change |
|
Jun 2023 |
(501) |
|
(468) |
|
(33) |
|
(117) |
|
— |
|
(191) |
|
(39) |
|
(160) |
|
— |
|
(27) |
|
33 |
|
|
|
Dec 2022 |
891 |
|
827 |
|
64 |
|
260 |
|
— |
|
293 |
|
50 |
|
274 |
|
— |
|
36 |
|
(22) |
|
|
|
Jun 2022 |
(330) |
|
(323) |
|
(7) |
|
(64) |
|
— |
|
(118) |
|
(20) |
|
(141) |
|
— |
|
(4) |
|
17 |
|
| Total operating cost |
|
Jun 2023 |
11,637 |
|
8,751 |
|
2,886 |
|
3,147 |
|
83 |
|
3,720 |
|
229 |
|
1,884 |
|
81 |
|
572 |
|
1,921 |
|
|
|
Dec 2022 |
12,507 |
|
9,530 |
|
2,977 |
|
3,112 |
|
137 |
|
3,547 |
|
361 |
|
2,871 |
|
32 |
|
532 |
|
1,915 |
|
|
|
Jun 2022 |
8,227 |
|
5,719 |
|
2,508 |
|
2,169 |
|
59 |
|
2,448 |
|
230 |
|
1,102 |
|
38 |
|
322 |
|
1,859 |
|
| Tonnes milled/treated |
kt |
Jun 2023 |
15,751 |
|
2,185 |
|
13,566 |
|
710 |
|
224 |
|
750 |
|
666 |
|
725 |
|
330 |
|
2,102 |
|
10,243 |
|
|
|
Dec 2022 |
19,301 |
|
2,269 |
|
17,032 |
|
604 |
|
489 |
|
736 |
|
1,291 |
|
929 |
|
124 |
|
2,286 |
|
12,842 |
|
|
|
Jun 2022 |
16,871 |
|
492 |
|
16,379 |
|
236 |
|
205 |
|
256 |
|
663 |
|
— |
|
— |
|
1,788 |
|
13,723 |
|
| Gold produced |
kg |
Jun 2023 |
12,962 |
|
9,490 |
|
3,472 |
|
3,884 |
|
74 |
|
3,579 |
|
207 |
|
2,027 |
|
72 |
|
568 |
|
2,551 |
|
|
|
Dec 2022 |
13,339 |
|
9,250 |
|
4,089 |
|
3,163 |
|
240 |
|
3,284 |
|
420 |
|
2,803 |
|
42 |
|
656 |
|
2,731 |
|
|
|
Jun 2022 |
5,962 |
|
2,486 |
|
3,476 |
|
1,411 |
|
79 |
|
1,016 |
|
200 |
|
59 |
|
9 |
|
354 |
|
2,834 |
|
|
oz |
Jun 2023 |
416,738 |
|
305,111 |
|
111,627 |
|
124,873 |
|
2,379 |
|
115,067 |
|
6,655 |
|
65,170 |
|
2,315 |
|
18,262 |
|
82,017 |
|
|
|
Dec 2022 |
428,859 |
|
297,394 |
|
131,464 |
|
101,693 |
|
7,716 |
|
105,583 |
|
13,503 |
|
90,119 |
|
1,350 |
|
21,091 |
|
87,804 |
|
|
|
Jun 2022 |
191,683 |
|
79,927 |
|
111,756 |
|
45,365 |
|
2,540 |
|
32,665 |
|
6,430 |
|
1,897 |
|
289 |
|
11,381 |
|
91,115 |
|
Operating cost1 |
R/t |
Jun 2023 |
739 |
|
4,004 |
|
213 |
|
4,432 |
|
370 |
|
4,957 |
|
344 |
|
2,599 |
|
245 |
|
272 |
|
188 |
|
|
|
Dec 2022 |
648 |
|
4,200 |
|
175 |
|
5,155 |
|
280 |
|
4,820 |
|
280 |
|
3,089 |
|
258 |
|
233 |
|
149 |
|
|
|
Jun 2022 |
488 |
|
11,624 |
|
153 |
|
9,191 |
|
288 |
|
9,563 |
|
347 |
|
— |
|
— |
|
180 |
|
135 |
|
|
US$/t |
Jun 2023 |
41 |
|
220 |
|
12 |
|
243 |
|
20 |
|
272 |
|
19 |
|
143 |
|
13 |
|
15 |
|
10 |
|
|
|
Dec 2022 |
37 |
|
242 |
|
10 |
|
297 |
|
16 |
|
278 |
|
16 |
|
178 |
|
15 |
|
13 |
|
9 |
|
|
|
Jun 2022 |
32 |
|
755 |
|
10 |
|
597 |
|
19 |
|
621 |
|
23 |
|
— |
|
— |
|
12 |
|
9 |
|
|
R/kg |
Jun 2023 |
897,778 |
|
922,129 |
|
831,221 |
|
810,247 |
|
1,121,622 |
|
1,039,396 |
|
1,106,280 |
|
929,452 |
|
1,125,000 |
|
1,007,042 |
|
753,038 |
|
|
Dec 2022 |
937,627 |
|
1,030,270 |
|
728,051 |
|
983,876 |
|
570,833 |
|
1,080,085 |
|
859,524 |
|
1,024,260 |
|
761,905 |
|
810,976 |
|
701,208 |
|
|
|
Jun 2022 |
1,379,906 |
|
2,300,483 |
|
721,519 |
|
1,537,208 |
|
746,835 |
|
2,409,449 |
|
1,150,000 |
|
18,677,966 |
|
4,222,222 |
|
909,605 |
|
655,963 |
|
|
US$/oz |
Jun 2023 |
1,533 |
|
1,575 |
|
1,420 |
|
1,384 |
|
1,916 |
|
1,775 |
|
1,890 |
|
1,588 |
|
1,922 |
|
1,720 |
|
1,286 |
|
|
|
Dec 2022 |
1,683 |
|
1,849 |
|
1,307 |
|
1,766 |
|
1,025 |
|
1,939 |
|
1,543 |
|
1,838 |
|
1,367 |
|
1,456 |
|
1,259 |
|
|
|
Jun 2022 |
2,787 |
|
4,646 |
|
1,457 |
|
3,105 |
|
1,508 |
|
4,866 |
|
2,323 |
|
37,724 |
|
8,528 |
|
1,837 |
|
1,325 |
|
Average exchange rate for the six months ended 30 June 2023, 31 December 2022 and 30 June 2022 was R18.21/US$, R17.33/US$ and R15.40, respectively
Figures may not add as they are rounded independently
1 Operating cost is the average cost of production and operating cost per tonne is calculated by dividing the cost of sales, before amortisation and depreciation and change in inventory in a period by the tonnes milled/treated in the same period, and operating cost per kilogram (and ounce) is calculated by dividing the cost of sales, before amortisation and depreciation and change in inventory in a period by the gold produced in the same period
Sibanye-Stillwater Operating and financial results | Six months ended 30 June 2023 55
SALIENT FEATURES AND COST BENCHMARKS - QUARTERS
US and SA PGM operations
|
|
|
|
|
|
|
|
|
|
|
|
|
|
|
|
|
|
|
|
|
|
|
|
|
|
|
|
|
|
|
|
|
|
|
|
|
|
|
|
|
|
|
|
|
|
|
|
|
US and SA PGM operations1 |
US PGM operations |
Total SA PGM operations1 |
Rustenburg |
Marikana1 |
Kroondal |
Plat Mile |
Mimosa |
|
|
|
Under-
ground2
|
Total |
Under-
ground |
Surface |
Under-
ground |
Surface |
Under-
ground |
Surface |
Attribu-table |
Surface |
Attribu-table |
| Production |
|
|
|
|
|
|
|
|
|
|
|
|
|
|
| Tonnes milled/treated |
kt |
Jun 2023 |
9,469 |
|
287 |
|
9,182 |
4,210 |
4,972 |
1,572 |
|
1,390 |
|
1,557 |
|
918 |
|
727 |
|
2,665 |
|
354 |
|
|
|
Mar 2023 |
8,742 |
|
282 |
|
8,460 |
|
3,860 |
4,600 |
1,412 |
|
1,260 |
|
1,436 |
|
812 |
|
686 |
|
2,529 |
|
326 |
|
| Plant head grade |
g/t |
Jun 2023 |
2.28 |
|
12.48 |
|
1.96 |
|
3.29 |
0.83 |
3.38 |
|
1.03 |
|
3.67 |
|
0.95 |
|
2.22 |
|
0.69 |
|
3.47 |
|
|
|
Mar 2023 |
2.29 |
|
12.26 |
|
1.96 |
|
3.28 |
0.85 |
3.34 |
|
1.05 |
|
3.64 |
|
0.88 |
|
2.27 |
|
0.74 |
|
3.53 |
|
| Plant recoveries |
% |
Jun 2023 |
75.62 |
|
91.31 |
|
72.48 |
|
85.53 |
29.04 |
86.49 |
|
41.86 |
|
87.03 |
|
25.15 |
|
81.56 |
|
20.67 |
|
78.30 |
|
|
|
Mar 2023 |
74.64 |
|
90.67 |
|
71.24 |
|
84.52 |
28.43 |
85.81 |
|
40.83 |
|
87.08 |
|
22.98 |
|
82.28 |
|
21.77 |
|
71.33 |
|
| Yield |
g/t |
Jun 2023 |
1.72 |
|
11.40 |
|
1.42 |
|
2.81 |
0.24 |
2.92 |
|
0.43 |
|
3.19 |
|
0.24 |
|
1.81 |
|
0.14 |
|
2.72 |
|
|
|
Mar 2023 |
1.71 |
|
11.12 |
|
1.40 |
|
2.77 |
0.24 |
2.87 |
|
0.43 |
|
3.17 |
|
0.20 |
|
1.87 |
|
0.16 |
|
2.52 |
|
PGM production3 |
4Eoz - 2Eoz |
Jun 2023 |
524,214 |
|
104,823 |
|
419,391 |
|
380,861 |
38,530 |
147,723 |
|
19,264 |
|
159,863 |
|
7,049 |
|
42,329 |
|
12,217 |
|
30,946 |
|
|
|
Mar 2023 |
480,481 |
|
100,690 |
|
379,791 |
|
344,052 |
35,739 |
130,123 |
|
17,361 |
|
146,346 |
|
5,276 |
|
41,187 |
|
13,102 |
|
26,396 |
|
PGM sold4 |
4Eoz - 2Eoz |
Jun 2023 |
508,429 |
|
102,856 |
|
405,573 |
|
|
|
114,826 |
|
16,561 |
|
187,994 |
42,329 |
|
12,217 |
|
31,646 |
|
|
|
Mar 2023 |
500,257 |
|
87,781 |
|
412,476 |
|
|
|
135,514 |
|
20,466 |
|
180,929 |
41,187 |
|
13,102 |
|
21,278 |
|
Price and cost5 |
|
|
|
|
|
|
|
|
|
|
|
|
|
Average PGM basket price6 |
R/4Eoz - R/2Eoz |
Jun 2023 |
30,313 |
|
25,378 |
|
31,689 |
|
|
|
32,269 |
|
27,153 |
|
31,741 |
32,564 |
|
27,980 |
|
27,972 |
|
|
|
Mar 2023 |
34,357 |
|
25,326 |
|
36,433 |
|
|
|
36,952 |
|
27,855 |
|
36,988 |
38,142 |
|
29,968 |
|
30,406 |
|
|
US$/4Eoz - US$/2Eoz |
Jun 2023 |
1,624 |
|
1,360 |
|
1,698 |
|
|
|
1,729 |
|
1,455 |
|
1,701 |
1,745 |
|
1,499 |
|
1,499 |
|
|
|
Mar 2023 |
1,935 |
|
1,426 |
|
2,051 |
|
|
|
2,081 |
|
1,568 |
|
2,083 |
2,148 |
|
1,687 |
|
1,712 |
|
Operating cost7 |
R/t |
Jun 2023 |
1,123 |
|
6,333 |
|
953 |
|
|
|
2,035 |
|
245 |
1,560 |
1,186 |
|
59 |
|
1,730 |
|
|
|
Mar 2023 |
1,159 |
|
7,665 |
|
934 |
|
|
|
2,042 |
|
143 |
|
1,589 |
1,180 |
|
60 |
|
1,653 |
|
|
US$/t |
Jun 2023 |
60 |
|
339 |
|
51 |
|
|
|
109 |
|
13 |
|
84 |
64 |
|
3 |
|
93 |
|
|
|
Mar 2023 |
65 |
|
432 |
|
53 |
|
|
|
115 |
|
8 |
|
89 |
66 |
|
3 |
|
93 |
|
|
R/4Eoz - R/2Eoz |
Jun 2023 |
20,747 |
|
17,353 |
|
21,663 |
|
|
|
21,649 |
|
17,650 |
|
23,120 |
20,364 |
|
12,769 |
|
19,809 |
|
|
|
Mar 2023 |
21,476 |
|
21,432 |
|
21,489 |
|
|
|
22,156 |
|
10,368 |
|
23,552 |
19,642 |
|
11,525 |
|
20,420 |
|
|
US$/4Eoz - US$/2Eoz |
Jun 2023 |
1,112 |
|
930 |
|
1,161 |
|
|
|
1,160 |
|
946 |
|
1,239 |
1,091 |
|
684 |
|
1,062 |
|
|
|
Mar 2023 |
1,209 |
|
1,207 |
|
1,210 |
|
|
|
1,248 |
|
584 |
|
1,326 |
1,106 |
|
649 |
|
1,150 |
|
All-in sustaining cost8 |
R/4Eoz - R/2Eoz |
Jun 2023 |
21,724 |
|
30,280 |
|
19,416 |
|
|
|
18,121 |
21,574 |
18,403 |
|
10,886 |
|
22,329 |
|
|
|
Mar 2023 |
22,927 |
|
33,052 |
|
20,043 |
|
|
|
18,558 |
23,057 |
17,311 |
|
10,456 |
|
24,360 |
|
|
US$/4Eoz - US$/2Eoz |
Jun 2023 |
1,164 |
|
1,623 |
|
1,041 |
|
|
|
971 |
1,156 |
986 |
|
583 |
|
1,197 |
|
|
|
Mar 2023 |
1,291 |
|
1,861 |
|
1,129 |
|
|
|
1,045 |
1,298 |
975 |
|
589 |
|
1372 |
All-in cost8 |
R/4Eoz - R/2Eoz |
Jun 2023 |
22,710 |
|
32,235 |
|
20,139 |
|
|
|
18,121 |
22,940 |
18,805 |
|
13,833 |
|
22,329 |
|
|
|
Mar 2023 |
23,725 |
|
35,018 |
|
20,507 |
|
|
|
18,558 |
24,132 |
17,336 |
|
10,456 |
|
24,360 |
|
|
US$/4Eoz - US$/2Eoz |
Jun 2023 |
1,217 |
|
1,728 |
|
1,079 |
|
|
|
971 |
1,229 |
1,008 |
|
741 |
|
1,197 |
|
|
|
Mar 2023 |
1,336 |
|
1,972 |
|
1,155 |
|
|
|
1,045 |
1,359 |
976 |
|
589 |
|
1,372 |
|
Capital expenditure5 |
|
|
|
|
|
|
|
|
|
|
|
|
|
| Ore reserve development |
R'mil |
Jun 2023 |
1,749 |
|
1,050 |
|
699 |
|
|
|
190 |
509 |
— |
|
— |
|
— |
|
|
|
Mar 2023 |
1,622 |
|
976 |
|
646 |
|
|
|
168 |
478 |
— |
|
— |
|
— |
|
| Sustaining capital |
R'mil |
Jun 2023 |
853 |
|
418 |
|
435 |
|
|
|
145 |
229 |
64 |
|
(3) |
|
273 |
|
|
|
Mar 2023 |
718 |
|
367 |
|
351 |
|
|
|
128 |
168 |
48 |
|
7 |
|
237 |
|
| Corporate and projects |
R'mil |
Jun 2023 |
482 |
|
205 |
|
277 |
|
|
|
— |
224 |
17 |
|
36 |
|
— |
|
|
|
Mar 2023 |
362 |
|
198 |
|
164 |
|
|
|
— |
163 |
1 |
|
— |
|
— |
|
| Total capital expenditure |
R'mil |
Jun 2023 |
3,084 |
|
1,673 |
|
1,411 |
|
|
|
335 |
962 |
81 |
|
33 |
|
273 |
|
|
|
Mar 2023 |
2,702 |
|
1,541 |
|
1,161 |
|
|
|
296 |
809 |
49 |
|
7 |
|
237 |
|
|
US$m |
Jun 2023 |
165 |
|
90 |
|
76 |
|
|
|
18 |
52 |
4 |
|
2 |
|
15 |
|
|
|
Mar 2023 |
152 |
|
87 |
|
65 |
|
|
|
17 |
46 |
3 |
|
— |
|
13 |
|
Average exchange rate for the quarters ended 30 June 2023 and 31 March 2023 was R18.66/US$ and R17.76/US$, respectively
Figures may not add as they are rounded independently
1The US and SA PGM operations, Total SA PGM operations and Marikana excludes the production and costs associated with the purchase of concentrate (PoC) from third parties. For a reconciliation of the Operating cost, AISC and AIC excluding third party PoC, refer to “Reconciliation of operating cost excluding third party PoC for US and SA PGM operations, Total SA PGM operations and Marikana - Quarters” and “Reconciliation of AISC and AIC excluding third party PoC for US and SA PGM operations, Total SA PGM operations and Marikana – Quarters”
2The US PGM operations’ underground production is converted to metric tonnes and kilograms, and performance is translated into SA rand. In addition to the US PGM operations’ underground production, the operation treats various recycling material which is excluded from the statistics shown above and is detailed in the PGM recycling table on the next page
3Production per product – see prill split in the table below
4PGM sold includes the third party PoC ounces sold
5The US and SA PGM operations and Total SA PGM operations’ unit cost benchmarks and capital expenditure exclude the financial results of Mimosa, which is equity accounted and excluded from revenue and cost of sales
6The average PGM basket price is the PGM revenue per 4E/2E ounce, prior to a purchase of concentrate adjustment
7Operating cost is the average cost of production and operating cost per tonne is calculated by dividing the cost of sales, before amortisation and depreciation and change in inventory in a period by the tonnes milled/treated in the same period, and operating cost per ounce is calculated by dividing the cost of sales, before amortisation and depreciation and change in inventory in a period by the PGM produced in the same period. For a reconciliation of unit operating cost, see “Unit operating cost - Quarters"
8All-in cost is calculated in accordance with the World Gold Council guidance. All-in cost excludes income tax, costs associated with merger and acquisition activities, working capital, impairments, financing costs, one-time severance charges and items needed to normalise earnings. All-in cost is made up of All-in sustaining cost, being the cost to sustain current operations, given as a sub-total in the All-in cost calculation, together with corporate and major capital expenditure associated with growth. All-in sustaining cost per ounce and All-in cost per ounce are calculated by dividing the All-in sustaining cost and All-in cost, respectively, in a period by the total 4E/2E PGM produced in the same period. For a reconciliation of cost of sales, before amortisation and depreciation to All-in cost, see “All-in costs - Quarters”
Sibanye-Stillwater Operating and financial results | Six months ended 30 June 2023 56
|
|
|
|
|
|
|
|
|
|
|
|
|
|
|
|
|
|
|
|
|
|
|
|
|
|
|
|
|
|
|
|
|
|
|
|
|
|
|
| Mining - PGM Prill split including third party PoC, excluding recycling operations |
|
US AND SA PGM OPERATIONS |
TOTAL SA PGM OPERATIONS |
US PGM OPERATIONS |
|
Jun 2023 |
Mar 2023 |
Jun 2023 |
Mar 2023 |
Jun 2023 |
Mar 2023 |
|
|
% |
|
% |
|
% |
|
% |
|
% |
|
% |
| Platinum |
288,639 |
|
52 |
% |
264,685 |
|
52 |
% |
265,168 |
|
60 |
% |
240,903 |
60 |
% |
23,471 |
|
22 |
% |
23,782 |
|
24 |
% |
| Palladium |
213,734 |
|
39 |
% |
196,583 |
|
39 |
% |
132,382 |
|
30 |
% |
119,675 |
30 |
% |
81,352 |
|
78 |
% |
76,908 |
|
76 |
% |
| Rhodium |
39,649 |
|
7 |
% |
35,649 |
|
7 |
% |
39,649 |
|
9 |
% |
35,649 |
9 |
% |
|
|
|
|
| Gold |
7,825 |
|
1 |
% |
7,472 |
|
1 |
% |
7,825 |
|
2 |
% |
7,472 |
2 |
% |
|
|
|
|
| PGM production 4E/2E |
549,847 |
|
100 |
% |
504,389 |
|
100 |
% |
445,024 |
|
100 |
% |
403,699 |
100 |
% |
104,823 |
|
100 |
% |
100,690 |
|
100 |
% |
| Ruthenium |
63,158 |
|
|
56,498 |
|
|
63,158 |
|
|
56,498 |
|
|
|
|
|
| Iridium |
16,016 |
|
|
14,323 |
|
|
16,016 |
|
|
14,323 |
|
|
|
|
|
| Total 6E/2E |
629,021 |
|
|
575,210 |
|
|
524,198 |
|
|
474,520 |
|
104,823 |
|
|
100,690 |
|
|
Figures may not add as they are rounded independently
|
|
|
|
|
|
|
|
|
|
|
|
| US PGM Recycling |
|
|
|
|
Unit |
Jun 2023 |
Mar 2023 |
| Average catalyst fed/day |
Tonne |
11.2 |
10.7 |
|
| Total processed |
Tonne |
1,014 |
965 |
|
| Tolled |
Tonne |
— |
— |
|
| Purchased |
Tonne |
1,014 |
965 |
|
| PGM fed |
3Eoz |
83,608 |
78,844 |
|
| PGM sold |
3Eoz |
74,041 |
79,405 |
|
| PGM tolled returned |
3Eoz |
2,520 |
2,532 |
|
Sibanye-Stillwater Operating and financial results | Six months ended 30 June 2023 57
SALIENT FEATURES AND COST BENCHMARKS - QUARTERS (continued)
SA gold operations
|
|
|
|
|
|
|
|
|
|
|
|
|
|
|
|
|
|
|
|
|
|
|
|
|
|
|
|
|
|
|
|
|
|
|
|
|
|
|
|
|
|
|
|
|
|
|
|
|
Total SA gold operations |
Driefontein |
Kloof |
Beatrix |
Cooke |
DRDGOLD |
|
|
|
Total |
Under-
ground |
Surface |
Under-
ground |
Surface |
Under-
ground |
Surface |
Under-
ground |
Surface |
Surface |
Surface |
| Production |
|
|
|
|
|
|
|
|
|
|
|
|
|
| Tonnes milled/treated |
kt |
Jun 2023 |
7,670 |
|
1,120 |
|
6,550 |
|
357 |
|
23 |
|
389 |
|
331 |
|
374 |
|
115 |
|
1,110 |
|
4,972 |
|
|
|
Mar 2023 |
8,081 |
|
1,066 |
|
7,015 |
|
353 |
|
201 |
|
361 |
|
335 |
|
351 |
|
216 |
|
992 |
|
5,271 |
|
| Yield |
g/t |
Jun 2023 |
0.88 |
|
4.50 |
|
0.26 |
|
5.71 |
|
0.65 |
|
4.97 |
|
0.36 |
|
2.86 |
|
0.21 |
|
0.28 |
|
0.25 |
|
|
|
Mar 2023 |
0.77 |
|
4.17 |
|
0.25 |
|
5.23 |
|
0.29 |
|
4.55 |
|
0.26 |
|
2.72 |
|
0.22 |
|
0.26 |
|
0.25 |
|
| Gold produced |
kg |
Jun 2023 |
6,733 |
|
5,045 |
|
1,688 |
|
2,040 |
|
15 |
|
1,935 |
|
119 |
|
1,070 |
|
24 |
|
308 |
|
1,222 |
|
|
|
Mar 2023 |
6,229 |
|
4,445 |
|
1,784 |
|
1,844 |
|
59 |
|
1,644 |
|
88 |
|
957 |
|
48 |
|
260 |
|
1,329 |
|
|
oz |
Jun 2023 |
216,471 |
|
162,200 |
|
54,270 |
|
65,588 |
|
482 |
|
62,212 |
|
3,826 |
|
34,401 |
|
772 |
|
9,902 |
|
39,288 |
|
|
|
Mar 2023 |
200,267 |
|
142,910 |
|
57,357 |
|
59,286 |
|
1,897 |
|
52,856 |
|
2,829 |
|
30,768 |
|
1,543 |
|
8,359 |
|
42,728 |
|
| Gold sold |
kg |
Jun 2023 |
6,801 |
|
5,107 |
|
1,694 |
|
2,105 |
|
18 |
|
1,917 |
|
122 |
|
1,085 |
|
24 |
|
308 |
|
1,222 |
|
|
|
Mar 2023 |
6,765 |
|
4,830 |
|
1,935 |
|
1,824 |
|
105 |
|
1,877 |
|
146 |
|
1,129 |
|
48 |
|
307 |
|
1,329 |
|
|
oz |
Jun 2023 |
218,657 |
|
164,194 |
|
54,463 |
|
67,677 |
|
579 |
|
61,633 |
|
3,922 |
|
34,884 |
|
772 |
|
9,902 |
|
39,288 |
|
|
|
Mar 2023 |
217,500 |
|
155,288 |
|
62,212 |
|
58,643 |
|
3,376 |
|
60,347 |
|
4,694 |
|
36,298 |
|
1,543 |
|
9,870 |
|
42,728 |
|
| Price and costs |
|
|
|
|
|
|
|
|
|
|
|
|
|
| Gold price received |
R/kg |
Jun 2023 |
1,184,973 |
|
|
|
1,182,760 |
1,185,875 |
1,186,655 |
1,181,818 |
1,186,579 |
|
|
|
Mar 2023 |
1,064,302 |
|
|
|
1,070,503 |
1,068,710 |
1,066,270 |
1,061,889 |
1,047,404 |
|
| Gold price received |
US$/oz |
Jun 2023 |
1,975 |
|
|
|
1,971 |
1,977 |
1,978 |
1,970 |
1,978 |
|
|
|
Mar 2023 |
1,864 |
|
|
|
1,875 |
1,872 |
1,867 |
1,860 |
1,834 |
|
Operating cost1 |
R/t |
Jun 2023 |
791 |
|
4,081 |
|
229 |
|
4,616 |
|
478 |
|
4,964 |
|
384 |
|
2,650 |
|
279 |
|
298 |
|
200 |
|
|
|
Mar 2023 |
689 |
|
3,923 |
|
198 |
|
4,247 |
|
362 |
|
4,951 |
|
301 |
|
2,541 |
|
232 |
|
243 |
|
175 |
|
|
US$/t |
Jun 2023 |
42 |
|
219 |
|
12 |
|
247 |
|
26 |
|
266 |
|
21 |
|
142 |
|
15 |
|
16 |
|
11 |
|
|
|
Mar 2023 |
39 |
|
221 |
|
11 |
|
239 |
|
20 |
|
279 |
|
17 |
|
143 |
|
13 |
|
14 |
|
10 |
|
|
R/kg |
Jun 2023 |
901,084 |
|
905,847 |
|
886,848 |
|
808,333 |
|
733,333 |
|
997,933 |
|
1,067,227 |
|
925,234 |
|
1,333,333 |
|
1,074,675 |
|
815,057 |
|
|
Mar 2023 |
894,205 |
|
940,382 |
|
779,148 |
|
812,364 |
|
1,237,288 |
|
1,088,200 |
|
1,147,727 |
|
933,124 |
|
1,041,667 |
|
926,923 |
|
696,012 |
|
|
US$/oz |
Jun 2023 |
1,502 |
|
1,510 |
|
1,478 |
|
1,347 |
|
1,222 |
|
1,663 |
|
1,779 |
|
1,542 |
|
2,222 |
|
1,791 |
|
1,359 |
|
|
|
Mar 2023 |
1,566 |
|
1,647 |
|
1,365 |
|
1,423 |
|
2,167 |
|
1,906 |
|
2,010 |
|
1,634 |
|
1,824 |
|
1,623 |
|
1,219 |
|
All-in sustaining cost2 |
R/kg |
Jun 2023 |
1,080,135 |
|
|
|
1,071,597 |
1,190,289 |
1,064,022 |
1,120,130 |
910,802 |
|
|
|
Mar 2023 |
1,042,868 |
|
|
|
1,065,837 |
1,213,050 |
1,033,135 |
983,713 |
772,009 |
|
| All-in sustaining cost2 |
US$/oz |
Jun 2023 |
1,800 |
|
|
|
1,786 |
1,984 |
1,774 |
1,867 |
1,518 |
|
|
|
Mar 2023 |
1,826 |
|
|
|
1,867 |
2,124 |
1,809 |
1,723 |
1,352 |
|
All-in cost2 |
R/kg |
Jun 2023 |
1,197,324 |
|
|
|
1,071,597 |
1,207,945 |
1,064,022 |
1,120,130 |
1,129,296 |
|
|
|
Mar 2023 |
1,127,421 |
|
|
|
1,065,837 |
1,228,374 |
1,033,135 |
983,713 |
892,400 |
|
| All-in cost2 |
US$/oz |
Jun 2023 |
1,996 |
|
|
|
1,786 |
2,013 |
1,774 |
1,867 |
1,882 |
|
|
|
Mar 2023 |
1,974 |
|
|
|
1,867 |
2,151 |
1,809 |
1,723 |
1,563 |
|
| Capital expenditure |
|
|
|
|
|
|
|
|
|
|
| Ore reserve development |
Rm |
Jun 2023 |
745 |
|
|
|
411 |
249 |
85 |
— |
|
— |
|
|
|
Mar 2023 |
653 |
|
|
|
349 |
221 |
83 |
— |
|
— |
|
| Sustaining capital |
Rm |
Jun 2023 |
362 |
|
|
|
110 |
109 |
27 |
— |
|
115 |
|
|
|
Mar 2023 |
279 |
|
|
|
80 |
70 |
14 |
— |
|
115 |
|
Corporate and projects3 |
Rm |
Jun 2023 |
760 |
|
|
|
— |
36 |
— |
— |
|
267 |
|
|
|
Mar 2023 |
570 |
|
|
|
— |
31 |
— |
— |
|
160 |
|
| Total capital expenditure |
Rm |
Jun 2023 |
1,867 |
|
|
|
521 |
394 |
112 |
— |
|
382 |
|
|
|
Mar 2023 |
1,502 |
|
|
|
429 |
322 |
97 |
— |
|
275 |
|
| Total capital expenditure |
US$m |
Jun 2023 |
100 |
|
|
|
28 |
21 |
6 |
— |
|
20 |
|
|
|
Mar 2023 |
85 |
|
|
|
24 |
18 |
5 |
— |
|
15 |
|
Average exchange rate for the quarters ended 30 June 2023 and 31 March 2023 was R18.66/US$ and R17.76/US$, respectively
Figures may not add as they are rounded independently
1Operating cost is the average cost of production and operating cost per tonne is calculated by dividing the cost of sales, before amortisation and depreciation and change in inventory in a period by the tonnes milled/treated in the same period, and operating cost per kilogram (and ounce) is calculated by dividing the cost of sales, before amortisation and depreciation and change in inventory in a period by the gold produced in the same period. For a reconciliation of unit operating cost, see “Unit operating cost - Quarters"
2All-in cost is calculated in accordance with the World Gold Council guidance. All-in cost excludes income tax, costs associated with merger and acquisition activities, working capital, impairments, financing costs, one time severance charges and items needed to normalise earnings. All-in cost is made up of All-in sustaining cost, being the cost to sustain current operations, given as a sub-total in the All-in cost calculation, together with corporate and major capital expenditure associated with growth. All-in sustaining cost per kilogram (and ounce) and All-in cost per kilogram (and ounce) are calculated by dividing the All-in sustaining cost and All-in cost, respectively, in a period by the total gold sold over the same period. For a reconciliation of cost of sales before amortisation and depreciation to All-in cost, see “All-in costs – Quarters”
3Corporate project expenditure for the quarters ended 30 June 2023 and 31 March 2023 was R457 million (US$24 million) and R379 million (US$21 million), respectively, the majority of this expenditure was on Burnstone project
Sibanye-Stillwater Operating and financial results | Six months ended 30 June 2023 58
SALIENT FEATURES AND COST BENCHMARKS - QUARTERS (continued)
European operations
|
|
|
|
|
|
|
|
|
|
|
|
|
|
|
| Sandouville nickel refinery |
| Metal split |
|
|
Jun 2023 |
Mar 2023 |
| Volumes produced (tonnes) |
|
% |
|
% |
Nickel salts1 |
359 |
|
19 |
% |
429 |
|
27 |
% |
| Nickel metal |
1,525 |
|
81 |
% |
1,180 |
|
73 |
% |
| Total Nickel Production tNi |
1,884 |
|
100 |
% |
1,609 |
|
100 |
% |
Nickel cakes2 |
97 |
|
|
61 |
|
Cobalt chloride (CoCl2)3 |
30 |
|
|
33 |
|
Ferric chloride (FeCl3)3 |
348 |
|
|
296 |
|
|
|
|
|
|
| Volumes sales (tonnes) |
|
|
|
|
Nickel salts1 |
364 |
|
18 |
% |
229 |
|
17 |
% |
| Nickel metal |
1,714 |
|
82 |
% |
1,118 |
|
83 |
% |
| Total Nickel Sold tNi |
2,078 |
|
100 |
% |
1,347 |
|
100 |
% |
Nickel cakes2 |
2 |
|
|
19 |
|
Cobalt chloride (CoCl2)3 |
34 |
|
|
16 |
|
Ferric chloride (FeCl3)3 |
348 |
|
|
296 |
|
|
|
|
|
|
|
|
|
|
|
|
|
|
|
|
| Nickel equivalent basket price |
Unit |
Jun 2023 |
Mar 2023 |
|
| Revenue from sale of products |
Rm |
1,001 |
|
676 |
|
|
| Nickel Products sold |
tNi |
2,078 |
|
1,347 |
|
|
Nickel equivalent average basket price4 |
R/tNi |
481,713 |
|
501,856 |
|
|
|
US$/tNi |
25,815 |
|
28,258 |
|
|
|
|
|
|
|
|
|
|
|
|
|
|
| Nickel equivalent sustaining cost |
R'mil |
Jun 2023 |
Mar 2023 |
| Cost of sales, before amortisation and depreciation |
|
1,407 |
|
922 |
|
|
|
|
|
|
|
|
|
| Share-based payments |
|
11 |
|
— |
|
| Rehabilitation interest and amortisation |
|
1 |
|
1 |
|
| Leases |
|
5 |
|
5 |
|
| Sustaining capital expenditure |
|
51 |
|
44 |
|
| Less: By-product credit |
|
(65) |
|
(45) |
|
Nickel equivalent sustaining cost5 |
|
1,410 |
|
927 |
|
| Nickel Products sold |
tNi |
2,078 |
|
1,347 |
|
Nickel equivalent sustaining cost6 |
R/tNi |
678,537 |
|
688,196 |
|
|
US$/tNi |
36,363 |
|
38,750 |
|
|
|
|
|
Nickel recovery yield6 |
% |
97.46 |
% |
96.15 |
% |
Average exchange rate for the quarters ended 30 June 2023 and 31 March 2023 was R18.66/US$ and R17.76/US$, respectively
Figures may not add as they are rounded independently
1Nickel salts consist of anhydrous nickel, nickel chloride low sodium, nickel chloride standard, nickel carbonate and nickel chloride solution
2Nickel cakes occur during the processing of nickel matte and are recycled back into the nickel refining process
3Cobalt chloride and ferric chloride are obtained from nickel matte through a different refining process on an order basis
4The Nickel equivalent average basket price per tonne is the total nickel revenue adjusted for other income less non-product sales divided by the total nickel equivalent tonnes sold
5The Nickel equivalent sustaining cost, is the cost to sustain current operations. Nickel equivalent sustaining cost per tonne nickel is calculated by dividing the Nickel equivalent sustaining cost, in a period by the total nickel products sold over the same period. Nickel equivalent sustaining cost and Nickel equivalent sustaining costs per tonne are intended to provide additional information only, do not have any standardised meaning prescribed by IFRS and should not be considered in isolation or as alternatives to cost of sales, profit before tax, profit for the year, cash from operating activities or any other measure of financial performance presented in accordance with IFRS. Nickel equivalent sustaining cost and Nickel equivalent sustaining costs per tonne as presented in this document may not be comparable to other similarly titled measures of performance of other companies. Other companies may calculate these measures differently as a result of differences in the underlying accounting principles, policies applied and accounting frameworks such as in US GAAP. Differences may also arise related to definitional differences of sustaining versus development capital activities based upon each company’s internal policies
6Nickel recovery yield is the percentage of total nickel recovered from the matte relative to the nickel contained in the matte received
Sibanye-Stillwater Operating and financial results | Six months ended 30 June 2023 59
SALIENT FEATURES AND COST BENCHMARKS - QUARTERS (continued)
Australian operations
|
|
|
|
|
|
|
|
|
|
|
|
| New Century zinc retreatment operation |
| Production |
|
|
New Century1 |
| Ore mined and processed |
kt |
Jun 2023 |
1,949 |
|
|
|
Mar 2023 |
112 |
|
| Processing feed grade |
% |
Jun 2023 |
3.13 |
|
|
|
Mar 2023 |
2.97 |
|
| Plant recoveries |
% |
Jun 2023 |
45.86 |
|
|
|
Mar 2023 |
45.95 |
|
Concentrate produced2 |
kt |
Jun 2023 |
62 |
|
|
|
Mar 2023 |
3 |
|
Concentrate zinc grade3 |
% |
Jun 2023 |
45.02 |
|
|
|
Mar 2023 |
44.78 |
|
Metal produced (zinc in concentrate)4 |
kt |
Jun 2023 |
28 |
|
|
|
Mar 2023 |
2 |
|
Zinc metal produced (payable)5 |
kt |
Jun 2023 |
23 |
|
|
|
Mar 2023 |
1 |
|
Zinc sold6 |
kt |
Jun 2023 |
29 |
|
|
|
Mar 2023 |
5 |
|
Zinc sold (payable)7 |
kt |
Jun 2023 |
23 |
|
|
|
Mar 2023 |
4 |
|
| Price and costs |
|
|
|
| Average LME price |
US$/tZn |
Jun 2023 |
1,601 |
|
|
|
Mar 2023 |
2,013 |
|
Average equivalent zinc concentrate price8 |
R/tZn |
Jun 2023 |
28,832 |
|
|
|
Mar 2023 |
36,287 |
|
|
US$/tZn |
Jun 2023 |
1,545 |
|
|
|
Mar 2023 |
2,043 |
|
All-in sustaining cost9 |
R/tZn |
Jun 2023 |
37,562 |
|
|
|
Mar 2023 |
163,477 |
|
|
US$/tZn |
Jun 2023 |
2,013 |
|
|
|
Mar 2023 |
9,205 |
|
All-in cost9 |
R/tZn |
Jun 2023 |
41,692 |
|
|
|
Mar 2023 |
208,134 |
|
|
US$/tZn |
Jun 2023 |
2,234 |
|
|
|
Mar 2023 |
11,719 |
|
Average exchange rate for the quarters ended 30 June 2023 and 31 March 2023 was R18.66/US$ and R17.76/US$, respectively
Figures may not add as they are rounded independently
1New Century is a leading tailings management and rehabilitation company that currently owns and operates the New Century zinc tailings retreatment operation in Queensland, Australia. Amounts included since effective date of acquisition on 22 February 2023
2Concentrate produced is the dry concentrate which has been processed that contains zinc, silver and waste material
3Concentrate zinc grade is the percentage of zinc contained in the concentrate produced
4Metal produced (zinc in concentrate) is the zinc metal contained in the concentrate produced
5Zinc metal produced (payable) is the payable quantity of zinc metal produced after applying smelter content deductions
6Zinc sold is the zinc metal contained in the concentrate sold
7Zinc sold (payable)is the payable quantity of zinc metal sold after applying smelter content deductions
8Average equivalent zinc concentrate price is the total zinc sales revenue recognised at the price expected to be received excluding the fair value adjustments divided by the payable zinc metal sold
9All-in cost is calculated in accordance with the World Gold Council guidance. All-in cost excludes income tax, costs associated with merger and acquisition activities, working capital, impairments, financing costs, one-time severance charges and items needed to normalise earnings. All-in cost is made up of All-in sustaining cost, being the cost to sustain current operations, given as a sub-total in the All-in cost calculation, together with corporate and major capital expenditure associated with growth. All-in sustaining cost per tonne and All-in cost per tonne are calculated by dividing the All-in sustaining cost and All-in cost, respectively, in a period by the total tonnes of zinc metal produced (payable) in the same period
Sibanye-Stillwater Operating and financial results | Six months ended 30 June 2023 60
ALL-IN COSTS - QUARTERS
US and SA PGM operations
Figures are in rand millions unless otherwise stated
|
|
|
|
|
|
|
|
|
|
|
|
|
|
|
|
|
|
|
|
|
|
|
|
|
|
|
|
|
|
|
|
|
|
|
|
|
|
|
|
|
|
|
|
|
US and SA PGM operations1 |
US PGM operations2 |
Total SA PGM operations1 |
Rustenburg |
Marikana1 |
Kroondal (Attribu- table) |
Plat Mile |
Mimosa (Attribu- table) |
Corporate |
Cost of sales, before amortisation and depreciation3 |
|
Jun 2023 |
11,384 |
|
2,032 |
|
9,352 |
|
3,456 |
|
4,875 |
|
865 |
|
156 |
|
678 |
|
(678) |
|
|
|
Mar 2023 |
10,914 |
|
2,133 |
|
8,781 |
|
3,880 |
|
3,938 |
|
812 |
|
151 |
|
478 |
|
(478) |
|
| Royalties |
|
Jun 2023 |
250 |
|
— |
|
250 |
|
167 |
|
82 |
|
1 |
|
— |
|
43 |
|
(43) |
|
|
|
Mar 2023 |
228 |
|
— |
|
228 |
|
29 |
|
196 |
|
3 |
|
— |
|
32 |
|
(32) |
|
| Carbon tax |
|
Jun 2023 |
— |
|
— |
|
— |
|
— |
|
— |
|
— |
|
— |
|
— |
|
— |
|
|
|
Mar 2023 |
— |
|
— |
|
— |
|
— |
|
— |
|
— |
|
— |
|
— |
|
— |
|
| Community costs |
|
Jun 2023 |
20 |
|
— |
|
20 |
|
— |
|
20 |
|
— |
|
— |
|
— |
|
— |
|
|
|
Mar 2023 |
23 |
|
— |
|
23 |
|
— |
|
23 |
|
— |
|
— |
|
— |
|
— |
|
| Inventory change |
|
Jun 2023 |
74 |
|
(213) |
|
287 |
|
367 |
|
(80) |
|
— |
|
— |
|
(65) |
|
65 |
|
|
|
Mar 2023 |
(83) |
|
25 |
|
(108) |
|
(623) |
|
515 |
|
— |
|
— |
|
61 |
|
(61) |
|
Share-based payments4 |
|
Jun 2023 |
74 |
|
47 |
|
27 |
|
11 |
|
16 |
|
(3) |
|
— |
|
— |
|
— |
|
|
|
Mar 2023 |
10 |
|
6 |
|
4 |
|
1 |
|
2 |
|
1 |
|
— |
|
— |
|
— |
|
Rehabilitation interest and amortisation5 |
|
Jun 2023 |
56 |
|
22 |
|
34 |
|
(2) |
|
18 |
|
18 |
|
— |
|
1 |
|
(1) |
|
|
|
Mar 2023 |
51 |
|
20 |
|
31 |
|
(3) |
|
16 |
|
18 |
|
— |
|
1 |
|
(1) |
|
| Leases |
|
Jun 2023 |
17 |
|
1 |
|
16 |
|
6 |
|
9 |
|
1 |
|
— |
|
— |
|
— |
|
|
|
Mar 2023 |
15 |
|
1 |
|
14 |
|
4 |
|
9 |
|
1 |
|
— |
|
— |
|
— |
|
| Ore reserve development |
|
Jun 2023 |
1,749 |
|
1,050 |
|
699 |
|
190 |
|
509 |
|
— |
|
— |
|
— |
|
— |
|
|
|
Mar 2023 |
1,622 |
|
976 |
|
646 |
|
168 |
|
478 |
|
— |
|
— |
|
— |
|
— |
|
| Sustaining capital expenditure |
|
Jun 2023 |
853 |
|
418 |
|
435 |
|
145 |
|
229 |
|
64 |
|
(3) |
|
273 |
|
(273) |
|
|
|
Mar 2023 |
718 |
|
367 |
|
351 |
|
128 |
|
168 |
|
48 |
|
7 |
|
237 |
|
(237) |
|
| Less: By-product credit |
|
Jun 2023 |
(3,112) |
|
(183) |
|
(2,929) |
|
(1,314) |
|
(1,428) |
|
(167) |
|
(20) |
|
(239) |
|
239 |
|
|
|
Mar 2023 |
(2,365) |
|
(200) |
|
(2,165) |
|
(847) |
|
(1,127) |
|
(170) |
|
(21) |
|
(166) |
|
166 |
|
Total All-in-sustaining costs6 |
|
Jun 2023 |
11,365 |
|
3,174 |
|
8,191 |
|
3,026 |
|
4,250 |
|
779 |
|
133 |
|
691 |
|
(691) |
|
|
|
Mar 2023 |
11,133 |
|
3,328 |
|
7,805 |
|
2,737 |
|
4,218 |
|
713 |
|
137 |
|
643 |
|
(643) |
|
| Plus: Corporate cost, growth and capital expenditure |
|
Jun 2023 |
486 |
|
205 |
|
281 |
|
— |
|
228 |
|
17 |
|
36 |
|
— |
|
— |
|
|
|
Mar 2023 |
362 |
|
198 |
|
164 |
|
— |
|
163 |
|
1 |
|
— |
|
— |
|
— |
|
Total All-in-costs6 |
|
Jun 2023 |
11,851 |
|
3,379 |
|
8,472 |
|
3,026 |
|
4,478 |
|
796 |
|
169 |
|
691 |
|
(691) |
|
|
|
Mar 2023 |
11,495 |
|
3,526 |
|
7,969 |
|
2,737 |
|
4,381 |
|
714 |
|
137 |
|
643 |
|
(643) |
|
| PGM production |
4Eoz - 2Eoz |
Jun 2023 |
549,847 |
|
104,823 |
|
445,024 |
|
166,987 |
|
192,545 |
|
42,329 |
|
12,217 |
|
30,946 |
|
— |
|
|
|
Mar 2023 |
504,389 |
|
100,690 |
|
403,699 |
|
147,484 |
|
175,530 |
|
41,187 |
|
13,102 |
|
26,396 |
|
— |
|
|
kg |
Jun 2023 |
17,102 |
|
3,260 |
|
13,842 |
|
5,194 |
|
5,989 |
|
1,317 |
|
380 |
|
963 |
|
— |
|
|
|
Mar 2023 |
15,688 |
|
3,132 |
|
12,556 |
|
4,587 |
|
5,460 |
|
1,281 |
|
408 |
|
821 |
|
— |
|
| All-in-sustaining cost |
R/4Eoz - R/2Eoz |
Jun 2023 |
21,902 |
|
30,280 |
|
19,781 |
|
18,121 |
|
22,073 |
|
18,403 |
|
10,886 |
|
22,329 |
|
— |
|
|
|
Mar 2023 |
23,291 |
|
33,052 |
|
20,686 |
|
18,558 |
|
24,030 |
|
17,311 |
|
10,456 |
|
24,360 |
|
— |
|
|
US$/4Eoz - US$/2Eoz |
Jun 2023 |
1,174 |
|
1,623 |
|
1,060 |
|
971 |
|
1,183 |
|
986 |
|
583 |
|
1,197 |
|
— |
|
|
|
Mar 2023 |
1,311 |
|
1,861 |
|
1,165 |
|
1,045 |
|
1,353 |
|
975 |
|
589 |
|
1,372 |
|
— |
|
| All-in-cost |
R/4Eoz - R/2Eoz |
Jun 2023 |
22,839 |
|
32,235 |
|
20,460 |
|
18,121 |
|
23,257 |
|
18,805 |
|
13,833 |
|
22,329 |
|
— |
|
|
|
Mar 2023 |
24,048 |
|
35,018 |
|
21,121 |
|
18,558 |
|
24,959 |
|
17,336 |
|
10,456 |
|
24,360 |
|
— |
|
|
US$/4Eoz - US$/2Eoz |
Jun 2023 |
1,224 |
|
1,728 |
|
1,096 |
|
971 |
|
1,246 |
|
1,008 |
|
741 |
|
1,197 |
|
— |
|
|
|
Mar 2023 |
1,354 |
|
1,972 |
|
1,189 |
|
1,045 |
|
1,405 |
|
976 |
|
589 |
|
1,372 |
|
— |
|
Average exchange rate for the quarters ended 30 June 2023 and 31 March 2023 was 18.66/US$ and R17.76/US$, respectively
Figures may not add as they are rounded independently
1 The US and SA PGM operations, Total SA PGM operations and Marikana includes the production and costs associated with the purchase of concentrate (PoC) from third parties. For a reconciliation of the Operating cost, AISC and AIC excluding third party PoC, refer to “Reconciliation of operating cost excluding third party PoC for US and SA PGM operations, Total SA PGM operations and Marikana - Quarters” and “Reconciliation of AISC and AIC excluding third party PoC for US and SA PGM operations, Total SA PGM operations and Marikana – Quarters”
2 US PGM operations’ underground production is converted to metric tonnes and kilograms, and performance is translated into SA rand. In addition to the US PGM operations’ underground production, the operation processes various recycling material which is excluded from the 2E PGM production, All-in sustaining cost and All-in cost statistics shown
3 Cost of sales, before amortisation and depreciation includes all mining and processing costs, third party refining costs, corporate general and administrative costs, and permitting costs
4 Share-based payments are calculated based on the fair value at initial recognition and do not include the adjustment of the cash-settled share-based payment obligation to the reporting date fair value
5 Rehabilitation includes the interest charge related to the environmental rehabilitation obligation and the amortisation of the related capitalised rehabilitation costs. The interest charge related to the environmental rehabilitation obligation and the amortisation of the capitalised rehabilitation costs reflect the periodic costs of rehabilitation associated with current PGM production
6 All-in cost is calculated in accordance with the World Gold Council guidance. All-in cost excludes income tax, costs associated with merger and acquisition activities, working capital, impairments, financing costs, one-time severance charges and items needed to normalise earnings. All-in cost is made up of All-in sustaining cost, being the cost to sustain current operations, given as a sub-total in the All-in cost calculation, together with corporate and major capital expenditure associated with growth. All-in sustaining cost per ounce and All-in cost per ounce are calculated by dividing the All-in sustaining cost and All-in cost, respectively, in a period by the total 4E/2E PGM produced in the same period
Sibanye-Stillwater Operating and financial results | Six months ended 30 June 2023 61
|
|
|
|
|
|
|
|
|
|
|
|
|
|
|
|
|
|
|
|
|
|
|
|
| Reconciliation of operating cost excluding third party PoC for US and SA PGM operations, Total SA PGM operations and Marikana - Quarters |
|
|
US and SA PGM operations |
Total SA PGM operations |
Marikana |
|
R' mil |
Jun 2023 |
Mar 2023 |
Jun 2023 |
Mar 2023 |
Jun 2023 |
Mar 2023 |
| Cost of sales, before amortisation and depreciation as reported per table above |
|
11,384 |
|
10,914 |
|
9,352 |
|
8,781 |
|
4,875 |
|
3,938 |
|
| Inventory change as reported per table above |
|
74 |
|
(83) |
|
287 |
|
(108) |
|
(80) |
|
515 |
|
| Less: Chrome cost of sales |
|
(451) |
|
(257) |
|
(451) |
|
(257) |
|
(163) |
|
(60) |
|
| Total operating cost including third party PoC |
|
11,007 |
|
10,574 |
|
9,188 |
|
8,416 |
|
4,632 |
|
4,393 |
|
| Less: Purchase cost of PoC |
|
(773) |
|
(822) |
|
(773) |
|
(822) |
|
(773) |
|
(822) |
|
| Total operating cost excluding third party PoC |
|
10,234 |
|
9,752 |
|
8,415 |
|
7,594 |
|
3,859 |
|
3,571 |
|
|
|
|
|
|
|
|
|
| PGM production as reported per table above |
4Eoz- 2Eoz |
549,847 |
|
504,389 |
|
445,024 |
|
403,699 |
|
192,545 |
|
175,530 |
|
| Less: Mimosa production |
|
(30,946) |
|
(26,396) |
|
(30,946) |
|
(26,396) |
|
— |
|
— |
|
| PGM production excluding Mimosa |
|
518,901 |
|
477,993 |
|
414,078 |
|
377,303 |
|
192,545 |
|
175,530 |
|
| Less: PoC production |
|
(25,633) |
|
(23,908) |
|
(25,633) |
|
(23,908) |
|
(25,633) |
|
(23,908) |
|
| PGM production excluding Mimosa and third party PoC |
|
493,268 |
|
454,085 |
|
388,445 |
|
353,395 |
|
166,912 |
|
151,622 |
|
|
|
|
|
|
|
|
|
| PGM production including Mimosa and excluding third party PoC |
|
524,214 |
|
480,481 |
|
419,391 |
|
379,791 |
|
166,912 |
|
151,622 |
|
|
|
|
|
|
|
|
|
| Tonnes milled/treated |
kt |
9,469 |
|
8,742 |
|
9,182 |
|
8,460 |
|
2,475 |
|
2,248 |
|
| Less: Mimosa tonnes |
|
(354) |
|
(326) |
|
(354) |
|
(326) |
|
— |
|
— |
|
| PGM tonnes excluding Mimosa and third party PoC |
|
9,115 |
|
8,416 |
|
8,828 |
|
8,134 |
|
2,475 |
|
2,248 |
|
| Operating cost including third party PoC |
R/4Eoz-R/2Eoz |
21,212 |
|
22,122 |
|
22,189 |
|
22,306 |
|
24,057 |
|
25,027 |
|
|
US$/4Eoz-US$/2Eoz |
1,137 |
|
1,246 |
|
1,189 |
|
1,256 |
|
1,289 |
|
1,409 |
|
|
R/t |
1,208 |
|
1,256 |
|
1,041 |
|
1,035 |
|
1,872 |
|
1,955 |
|
|
US$/t |
65 |
|
71 |
|
56 |
|
58 |
|
100 |
|
110 |
|
| Operating cost excluding third party PoC |
R/4Eoz-R/2Eoz |
20,747 |
|
21,476 |
|
21,663 |
|
21,489 |
|
23,120 |
|
23,552 |
|
|
US$/4Eoz-US$/2Eoz |
1,112 |
|
1,209 |
|
1,161 |
|
1,210 |
|
1,239 |
|
1,326 |
|
|
R/t |
1,123 |
|
1,159 |
|
953 |
|
934 |
|
1,560 |
|
1,589 |
|
|
US$/t |
60 |
|
65 |
|
51 |
|
53 |
|
84 |
|
89 |
|
|
|
|
|
|
|
|
|
|
|
|
|
|
|
|
|
|
|
|
|
|
|
|
|
| Reconciliation of AISC and AIC excluding third party PoC for US and SA PGM operations, Total SA PGM operations and Marikana - Quarters |
|
|
Total US and SA PGM |
Total SA PGM |
Marikana |
|
R' mil |
Jun 2023 |
Mar 2023 |
Jun 2023 |
Mar 2023 |
Jun 2023 |
Mar 2023 |
| Total All-in-sustaining cost as reported per table above |
|
11,365 |
|
11,133 |
|
8,191 |
|
7,805 |
|
4,250 |
|
4,218 |
|
| Less: Purchase cost of PoC |
|
(773) |
|
(822) |
|
(773) |
|
(822) |
|
(773) |
|
(822) |
|
| Add: By-product credit of PoC |
|
124 |
|
100 |
|
124 |
|
100 |
|
124 |
|
100 |
|
| Total All-in-sustaining cost excluding third party PoC |
|
10,716 |
|
10,411 |
|
7,542 |
|
7,083 |
|
3,601 |
|
3,496 |
|
| Plus: Corporate cost, growth and capital expenditure |
|
486 |
|
362 |
|
281 |
|
164 |
|
228 |
|
163 |
|
| Total All-in-cost excluding third party PoC |
|
11,202 |
|
10,773 |
|
7,823 |
|
7,247 |
|
3,829 |
|
3,659 |
|
|
|
|
|
|
|
|
|
| PGM production excluding Mimosa and third party PoC |
4Eoz- 2Eoz |
493,268 |
|
454,085 |
|
388,445 |
|
353,395 |
|
166,912 |
|
151,622 |
|
|
|
|
|
|
|
|
|
| All-in-sustaining cost excluding third party PoC |
R/4Eoz-R/2Eoz |
21,724 |
|
22,927 |
|
19,416 |
|
20,043 |
|
21,574 |
|
23,057 |
|
|
US$/4Eoz-US$/2Eoz |
1,164 |
|
1,291 |
|
1,041 |
|
1,129 |
|
1,156 |
|
1,298 |
|
|
|
|
|
|
|
|
|
| All-in-cost excluding third party PoC |
R/4Eoz-R/2Eoz |
22,710 |
|
23,725 |
|
20,139 |
|
20,507 |
|
22,940 |
|
24,132 |
|
|
US$/4Eoz-US$/2Eoz |
1,217 |
|
1,336 |
|
1,079 |
|
1,155 |
|
1,229 |
|
1,359 |
|
Sibanye-Stillwater Operating and financial results | Six months ended 30 June 2023 62
ALL-IN-COSTS - QUARTERS (continued)
SA gold operations
Figures are in rand millions unless otherwise stated
|
|
|
|
|
|
|
|
|
|
|
|
|
|
|
|
|
|
|
|
|
|
|
|
|
|
|
|
|
|
|
|
|
|
Total SA gold operations |
Driefontein |
Kloof |
Beatrix |
Cooke |
DRDGOLD |
Corporate |
Cost of sales, before amortisation and depreciation1 |
|
Jun 2023 |
6,128 |
|
1,735 |
|
2,043 |
|
1,038 |
|
322 |
|
990 |
|
— |
|
|
|
Mar 2023 |
6,011 |
|
1,613 |
|
2,136 |
|
1,087 |
|
277 |
|
898 |
|
— |
|
| Royalties |
|
Jun 2023 |
32 |
|
13 |
|
12 |
|
7 |
|
1 |
|
— |
|
(1) |
|
|
|
Mar 2023 |
29 |
|
10 |
|
11 |
|
6 |
|
2 |
|
— |
|
— |
|
| Carbon tax |
|
Jun 2023 |
— |
|
— |
|
— |
|
— |
|
— |
|
— |
|
— |
|
|
|
Mar 2023 |
— |
|
— |
|
— |
|
— |
|
— |
|
— |
|
— |
|
| Community costs |
|
Jun 2023 |
6 |
|
1 |
|
1 |
|
1 |
|
— |
|
3 |
|
— |
|
|
|
Mar 2023 |
5 |
|
— |
|
1 |
|
— |
|
— |
|
4 |
|
— |
|
Share-based payments2 |
|
Jun 2023 |
24 |
|
7 |
|
7 |
|
(1) |
|
— |
|
6 |
|
5 |
|
|
|
Mar 2023 |
10 |
|
2 |
|
1 |
|
1 |
|
— |
|
6 |
|
— |
|
Rehabilitation interest and amortisation3 |
|
Jun 2023 |
44 |
|
— |
|
6 |
|
19 |
|
22 |
|
(4) |
|
1 |
|
|
|
Mar 2023 |
56 |
|
2 |
|
8 |
|
20 |
|
23 |
|
2 |
|
1 |
|
| Leases |
|
Jun 2023 |
11 |
|
— |
|
1 |
|
5 |
|
— |
|
5 |
|
— |
|
|
|
Mar 2023 |
18 |
|
1 |
|
6 |
|
6 |
|
— |
|
5 |
|
— |
|
| Ore reserve development |
|
Jun 2023 |
745 |
|
411 |
|
249 |
|
85 |
|
— |
|
— |
|
— |
|
|
|
Mar 2023 |
653 |
|
349 |
|
221 |
|
83 |
|
— |
|
— |
|
— |
|
| Sustaining capital expenditure |
|
Jun 2023 |
362 |
|
110 |
|
109 |
|
27 |
|
— |
|
115 |
|
1 |
|
|
|
Mar 2023 |
279 |
|
80 |
|
70 |
|
14 |
|
— |
|
115 |
|
— |
|
| Less: By-product credit |
|
Jun 2023 |
(6) |
|
(2) |
|
(1) |
|
(1) |
|
— |
|
(2) |
|
— |
|
|
|
Mar 2023 |
(6) |
|
(1) |
|
— |
|
(1) |
|
— |
|
(4) |
|
— |
|
Total All-in-sustaining costs4 |
|
Jun 2023 |
7,346 |
|
2,275 |
|
2,427 |
|
1,180 |
|
345 |
|
1,113 |
|
6 |
|
|
|
Mar 2023 |
7,055 |
|
2,056 |
|
2,454 |
|
1,216 |
|
302 |
|
1,026 |
|
1 |
|
| Plus: Corporate cost, growth and capital expenditure |
|
Jun 2023 |
797 |
|
— |
|
36 |
|
— |
|
— |
|
267 |
|
494 |
|
|
|
Mar 2023 |
572 |
|
— |
|
31 |
|
— |
|
— |
|
160 |
|
381 |
|
Total All-in-costs4 |
|
Jun 2023 |
8,143 |
|
2,275 |
|
2,463 |
|
1,180 |
|
345 |
|
1,380 |
|
500 |
|
|
|
Mar 2023 |
7,627 |
|
2,056 |
|
2,485 |
|
1,216 |
|
302 |
|
1,186 |
|
382 |
|
| Gold sold |
kg |
Jun 2023 |
6,801 |
|
2,123 |
|
2,039 |
|
1,109 |
|
308 |
|
1,222 |
|
— |
|
|
|
Mar 2023 |
6,765 |
|
1,929 |
|
2,023 |
|
1,177 |
|
307 |
|
1,329 |
|
— |
|
|
oz |
Jun 2023 |
218,657 |
|
68,256 |
|
65,555 |
|
35,655 |
|
9,902 |
|
39,288 |
|
— |
|
|
|
Mar 2023 |
217,500 |
|
62,019 |
|
65,041 |
|
37,841 |
|
9,870 |
|
42,728 |
|
— |
|
| All-in-sustaining cost |
R/kg |
Jun 2023 |
1,080,135 |
|
1,071,597 |
|
1,190,289 |
|
1,064,022 |
|
1,120,130 |
|
910,802 |
|
— |
|
|
|
Mar 2023 |
1,042,868 |
|
1,065,837 |
|
1,213,050 |
|
1,033,135 |
|
983,713 |
|
772,009 |
|
— |
|
| All-in-sustaining cost |
US$/oz |
Jun 2023 |
1,800 |
|
1,786 |
|
1,984 |
|
1,774 |
|
1,867 |
|
1,518 |
|
— |
|
|
|
Mar 2023 |
1,826 |
|
1,867 |
|
2,124 |
|
1,809 |
|
1,723 |
|
1,352 |
|
— |
|
| All-in-cost |
R/kg |
Jun 2023 |
1,197,324 |
|
1,071,597 |
|
1,207,945 |
|
1,064,022 |
|
1,120,130 |
|
1,129,296 |
|
— |
|
|
|
Mar 2023 |
1,127,421 |
|
1,065,837 |
|
1,228,374 |
|
1,033,135 |
|
983,713 |
|
892,400 |
|
— |
|
| All-in-cost |
US$/oz |
Jun 2023 |
1,996 |
|
1,786 |
|
2,013 |
|
1,774 |
|
1,867 |
|
1,882 |
|
— |
|
|
|
Mar 2023 |
1,974 |
|
1,867 |
|
2,151 |
|
1,809 |
|
1,723 |
|
1,563 |
|
— |
|
Average exchange rate for the quarters ended 30 June 2023 and 31 March 2023 was R18.66/US$ and R17.76/US$, respectively
Figures may not add as they are rounded independently
1 Cost of sales, before amortisation and depreciation includes all mining and processing costs, third party refining costs, corporate general and administrative costs, and permitting costs
2 Share-based payments are calculated based on the fair value at initial recognition and do not include the adjustment of the cash-settled share-based payment obligation to the reporting date fair value
3 Rehabilitation includes the interest charge related to the environmental rehabilitation obligation and the amortisation of the related capitalised rehabilitation costs. The interest charge related to the environmental rehabilitation obligation and the amortisation of the capitalised rehabilitation costs reflect the periodic costs of rehabilitation associated with current gold production
4 All-in cost is calculated in accordance with the World Gold Council guidance. All-in cost excludes income tax, costs associated with merger and acquisition activities, working capital, impairments, financing costs, one time severance charges and items needed to normalise earnings. All-in cost is made up of All-in sustaining cost, being the cost to sustain current operations, given as a sub-total in the All-in cost calculation, together with corporate and major capital expenditure associated with growth. All-in sustaining cost per kilogram (and ounce) and All-in cost per kilogram (and ounce) are calculated by dividing the All-in sustaining cost and All-in cost, respectively, in a period by the total gold sold over the same period
Sibanye-Stillwater Operating and financial results | Six months ended 30 June 2023 63
ALL-IN-COSTS - QUARTERS (continued)
Australian operations
Figures are in rand millions unless otherwise stated
|
|
|
|
|
|
|
|
|
|
|
|
| New Century zinc retreatment operation |
|
|
|
New Century1 |
Cost of sales, before amortisation and depreciation3 |
|
Jun 2023 |
733 |
|
|
|
Mar 2023 |
119 |
|
| Royalties |
|
Jun 2023 |
39 |
|
|
|
Mar 2023 |
13 |
|
| Community costs |
|
Jun 2023 |
8 |
|
|
|
Mar 2023 |
2 |
|
| Inventory change |
|
Jun 2023 |
36 |
|
|
|
Mar 2023 |
56 |
|
Share-based payments4 |
|
Jun 2023 |
— |
|
|
|
Mar 2023 |
— |
|
Rehabilitation interest and amortisation5 |
|
Jun 2023 |
2 |
|
|
|
Mar 2023 |
1 |
|
| Leases |
|
Jun 2023 |
31 |
|
|
|
Mar 2023 |
11 |
|
| Sustaining capital expenditure |
|
Jun 2023 |
35 |
|
|
|
Mar 2023 |
7 |
|
| Less: By-product credit |
|
Jun 2023 |
(20) |
|
|
|
Mar 2023 |
(4) |
|
Total All-in-sustaining costs6 |
|
Jun 2023 |
864 |
|
|
|
Mar 2023 |
205 |
|
| Plus: Corporate cost, growth and capital expenditure |
|
Jun 2023 |
95 |
|
|
|
Mar 2023 |
56 |
|
Total All-in-costs6 |
|
Jun 2023 |
959 |
|
|
|
Mar 2023 |
261 |
|
| Zinc metal produced (payable) |
kt |
Jun 2023 |
23 |
|
|
|
Mar 2023 |
1 |
|
| All-in-sustaining cost |
R/tZn |
Jun 2023 |
37,562 |
|
|
|
Mar 2023 |
163,477 |
|
|
US$/tZn |
Jun 2023 |
2,013 |
|
|
|
Mar 2023 |
9,205 |
|
| All-in-cost |
R/tZn |
Jun 2023 |
41,692 |
|
|
|
Mar 2023 |
208,134 |
|
|
US$/tZn |
Jun 2023 |
2,234 |
|
|
|
Mar 2023 |
11,719 |
|
Average exchange rate for the quarters ended 30 June 2023 and 31 March 2023 was R18.66/US$ and R17.76/US$, respectively
Figures may not add as they are rounded independently
1New Century is a leading tailings management and rehabilitation company that currently owns and operates the New Century zinc tailings retreatment operation in Queensland, Australia. Amounts included since effective date of acquisition on 22 February 2023
2Cost of sales, before amortisation and depreciation includes all mining and processing costs, corporate general and administrative costs, and permitting costs
3Rehabilitation includes the interest charge related to the environmental rehabilitation obligation and the amortisation of the related capitalised rehabilitation costs. The interest charge related to the environmental rehabilitation obligation and the amortisation of the capitalised rehabilitation costs reflect the periodic costs of rehabilitation associated with current zinc production
4All-in cost is calculated in accordance with the World Gold Council guidance. All-in cost excludes income tax, costs associated with merger and acquisition activities, working capital, impairments, financing costs, one-time severance charges and items needed to normalise earnings. All-in cost is made up of All-in sustaining cost, being the cost to sustain current operations, given as a sub-total in the All-in cost calculation, together with corporate and major capital expenditure associated with growth. All-in sustaining cost per tonne and All-in cost per tonne are calculated by dividing the All-in sustaining cost and All-in cost, respectively, in a period by the total tonnes of zinc metal produced (payable) in the same period
Sibanye-Stillwater Operating and financial results | Six months ended 30 June 2023 64
UNIT OPERATING COST - QUARTERS
US and SA PGM operations
Figures are in rand millions unless otherwise stated
|
|
|
|
|
|
|
|
|
|
|
|
|
|
|
|
|
|
|
|
|
|
|
|
|
|
|
|
|
|
|
|
|
|
|
|
|
|
|
|
|
|
|
US and SA PGM operations1 |
US PGM operations |
Total SA PGM operations1,3 |
Rustenburg3 |
Marikana3 |
Kroondal3 |
Plat Mile |
Mimosa |
|
|
|
Under-
ground2
|
Total |
Under-
ground |
Surface |
Under-
ground |
Surface |
Attribu-table |
Surface |
Attribu-table |
|
|
| Cost of sales, before amortisation and depreciation |
|
Jun 2023 |
11,384 |
|
2,032 |
|
9,352 |
3,141 |
|
315 |
|
4,875 |
865 |
|
156 |
|
678 |
|
|
|
Mar 2023 |
10,914 |
|
2,133 |
|
8,781 |
|
3,615 |
|
265 |
|
3,938 |
812 |
|
151 |
|
478 |
|
| Inventory change |
|
Jun 2023 |
74 |
|
(213) |
|
287 |
342 |
|
25 |
|
(80) |
— |
|
— |
|
(65) |
|
|
|
Mar 2023 |
(83) |
|
25 |
|
(108) |
|
(538) |
|
(85) |
|
515 |
— |
|
— |
|
61 |
|
| Less: Chrome cost of sales |
|
Jun 2023 |
(451) |
|
— |
|
(451) |
|
(285) |
|
— |
|
(163) |
(3) |
|
— |
|
— |
|
|
|
Mar 2023 |
(257) |
|
— |
|
(257) |
|
(194) |
|
— |
|
(60) |
(3) |
|
— |
|
— |
|
| Less: Purchase cost of PoC |
|
Jun 2023 |
(773) |
|
— |
|
(773) |
|
— |
|
— |
|
(773) |
— |
|
— |
|
— |
|
|
|
Mar 2023 |
(822) |
|
— |
|
(822) |
|
— |
|
— |
|
(822) |
— |
|
— |
|
— |
|
| Total operating cost excluding third party PoC |
|
Jun 2023 |
10,234 |
|
1,819 |
|
8,415 |
3,198 |
|
340 |
|
3,859 |
862 |
|
156 |
|
613 |
|
|
|
Mar 2023 |
9,752 |
|
2,158 |
|
7,594 |
|
2,883 |
|
180 |
|
3,571 |
809 |
|
151 |
|
539 |
|
Tonnes milled/treated excluding third party PoC4 |
kt |
Jun 2023 |
9,115 |
|
287 |
|
8,828 |
|
1,572 |
|
1,390 |
|
1,557 |
|
918 |
|
727 |
|
2,665 |
|
354 |
|
|
|
Mar 2023 |
8,416 |
|
282 |
|
8,134 |
|
1,412 |
|
1,260 |
|
1,436 |
|
812 |
|
686 |
|
2,529 |
|
326 |
|
PGM production excluding third party PoC4 |
4Eoz |
Jun 2023 |
493,268 |
|
104,823 |
|
388,445 |
147,723 |
|
19,264 |
|
166,912 |
42,329 |
|
12,217 |
|
30,946 |
|
|
|
Mar 2023 |
454,085 |
|
100,690 |
|
353,395 |
|
130,123 |
|
17,361 |
|
151,622 |
41,187 |
|
13,102 |
|
26,396 |
|
Operating cost excluding third party PoC5 |
R/t |
Jun 2023 |
1,123 |
|
6,333 |
|
953 |
|
2,035 |
|
245 |
|
1,560 |
1,186 |
|
59 |
|
1,730 |
|
|
|
Mar 2023 |
1,159 |
|
7,665 |
|
934 |
|
2,042 |
|
143 |
|
1,589 |
1,180 |
|
60 |
|
1,653 |
|
|
US$/t |
Jun 2023 |
60 |
|
339 |
|
51 |
|
109 |
|
13 |
|
84 |
64 |
|
3 |
|
93 |
|
|
|
Mar 2023 |
65 |
|
432 |
|
53 |
|
115 |
|
8 |
|
89 |
66 |
|
3 |
|
93 |
|
R/4Eoz - R/2Eoz |
Jun 2023 |
20,747 |
|
17,353 |
|
21,663 |
|
21,649 |
|
17,650 |
|
23,120 |
20,364 |
|
12,769 |
|
19,809 |
|
|
|
Mar 2023 |
21,476 |
|
21,432 |
|
21,489 |
|
22,156 |
|
10,368 |
|
23,552 |
19,642 |
|
11,525 |
|
20,420 |
|
|
US$/4Eoz - US$/2Eoz |
Jun 2023 |
1,112 |
|
930 |
|
1,161 |
|
1,160 |
|
946 |
|
1,239 |
1,091 |
|
684 |
|
1,062 |
|
|
|
Mar 2023 |
1,209 |
|
1,207 |
|
1,210 |
|
1,248 |
|
584 |
|
1,326 |
1,106 |
|
649 |
|
1,150 |
|
Average exchange rate for the quarters ended 30 June 2023 and 31 March 2023 was R18.66/US$ and R17.76/US$, respectively
Figures may not add as they are rounded independently
1 US and SA PGM operations and Total SA PGM operations’ exclude the results of Mimosa, which is equity accounted
2 The US PGM operations’ underground production is converted to metric tonnes and kilograms, and performance is translated into rand. In addition to the US PGM operations’
underground production, the operation treats various recycling material which is excluded from the statistics shown above
3 Cost of sales, before amortisation and depreciation for Total SA PGM, Rustenburg, Marikana and Kroondal includes the Chrome cost of sales which is excluded for unit cost calculation purposes as Chrome production is excluded from the 4Eoz production
4 For a reconciliation of the production excluding Mimosa and third party PoC, refer to “Reconciliation of operating cost excluding third party PoC for US and SA PGM operations, Total SA PGM operations and Marikana - Quarters”
5 Operating cost is the average cost of production and operating cost per tonne is calculated by dividing the cost of sales, before amortisation and depreciation and change in inventory in a period by the tonnes milled/treated in the same period, and operating cost per ounce is calculated by dividing the cost of sales, before amortisation and depreciation and change in inventory in a period, by the PGM produced in the same period
Sibanye-Stillwater Operating and financial results | Six months ended 30 June 2023 65
UNIT OPERATING COST - QUARTERS (continued)
SA gold operations
Figures are in rand millions unless otherwise stated
|
|
|
|
|
|
|
|
|
|
|
|
|
|
|
|
|
|
|
|
|
|
|
|
|
|
|
|
|
|
|
|
|
|
|
|
|
|
|
|
|
|
|
|
|
|
Total SA gold operations |
Driefontein |
Kloof |
Beatrix |
Cooke |
DRDGOLD |
|
|
|
Total |
Under-
ground |
Surface |
Under-
ground |
Surface |
Under-
ground |
Surface |
Under-
ground |
Surface |
Surface |
Surface |
|
| Cost of sales, before amortisation and depreciation |
|
Jun 2023 |
6,128 |
|
4,648 |
|
1,480 |
|
1,724 |
|
11 |
|
1,918 |
|
125 |
|
1,006 |
|
32 |
|
322 |
|
990 |
|
|
|
Mar 2023 |
6,011 |
|
4,570 |
|
1,441 |
|
1,540 |
|
73 |
|
1,993 |
|
143 |
|
1,037 |
|
50 |
|
277 |
|
898 |
|
| Inventory change |
|
Jun 2023 |
(61) |
|
(78) |
|
17 |
|
(75) |
|
— |
|
13 |
|
2 |
|
(16) |
|
— |
|
9 |
|
6 |
|
|
|
Mar 2023 |
(441) |
|
(390) |
|
(51) |
|
(42) |
|
— |
|
(204) |
|
(42) |
|
(144) |
|
— |
|
(36) |
|
27 |
|
| Total operating cost |
|
Jun 2023 |
6,067 |
|
4,570 |
|
1,497 |
|
1,649 |
|
11 |
|
1,931 |
|
127 |
|
990 |
|
32 |
|
331 |
|
996 |
|
|
|
Mar 2023 |
5,570 |
|
4,180 |
|
1,390 |
|
1,498 |
|
73 |
|
1,789 |
|
101 |
|
893 |
|
50 |
|
241 |
|
925 |
|
| Tonnes milled/treated |
kt |
Jun 2023 |
7,670 |
|
1,120 |
|
6,550 |
|
357 |
|
23 |
|
389 |
|
331 |
|
374 |
|
115 |
|
1,110 |
|
4,972 |
|
|
|
Mar 2023 |
8,081 |
|
1,066 |
|
7,015 |
|
353 |
|
201 |
|
361 |
|
335 |
|
351 |
|
216 |
|
992 |
|
5,271 |
|
| Gold produced |
kg |
Jun 2023 |
6,733 |
|
5,045 |
|
1,688 |
|
2,040 |
|
15 |
|
1,935 |
|
119 |
|
1,070 |
|
24 |
|
308 |
|
1,222 |
|
|
|
Mar 2023 |
6,229 |
|
4,445 |
|
1,784 |
|
1,844 |
|
59 |
|
1,644 |
|
88 |
|
957 |
|
48 |
|
260 |
|
1,329 |
|
|
oz |
Jun 2023 |
216,471 |
|
162,200 |
|
54,270 |
|
65,588 |
|
482 |
|
62,212 |
|
3,826 |
|
34,401 |
|
772 |
|
9,902 |
|
39,288 |
|
|
|
Mar 2023 |
200,267 |
|
142,910 |
|
57,357 |
|
59,286 |
|
1,897 |
|
52,856 |
|
2,829 |
|
30,768 |
|
1,543 |
|
8,359 |
|
42,728 |
|
Operating cost1 |
R/t |
Jun 2023 |
791 |
|
4,081 |
|
229 |
|
4,616 |
|
478 |
|
4,964 |
|
384 |
|
2,650 |
|
279 |
|
298 |
|
200 |
|
|
|
Mar 2023 |
689 |
|
3,923 |
|
198 |
|
4,247 |
|
362 |
|
4,951 |
|
301 |
|
2,541 |
|
232 |
|
243 |
|
175 |
|
|
US$/t |
Jun 2023 |
42 |
|
219 |
|
12 |
|
247 |
|
26 |
|
266 |
|
21 |
|
142 |
|
15 |
|
16 |
|
11 |
|
|
|
Mar 2023 |
39 |
|
221 |
|
11 |
|
239 |
|
20 |
|
279 |
|
17 |
|
143 |
|
13 |
|
14 |
|
10 |
|
|
R/kg |
Jun 2023 |
901,084 |
|
905,847 |
|
886,848 |
|
808,333 |
|
733,333 |
|
997,933 |
|
1,067,227 |
|
925,234 |
|
1,333,333 |
|
1,074,675 |
|
815,057 |
|
|
Mar 2023 |
894,205 |
|
940,382 |
|
779,148 |
|
812,364 |
|
1,237,288 |
|
1,088,200 |
|
1,147,727 |
|
933,124 |
|
1,041,667 |
|
926,923 |
|
696,012 |
|
|
US$/oz |
Jun 2023 |
1,502 |
|
1,510 |
|
1,478 |
|
1,347 |
|
1,222 |
|
1,663 |
|
1,779 |
|
1,542 |
|
2,222 |
|
1,791 |
|
1,359 |
|
|
|
Mar 2023 |
1,566 |
|
1,647 |
|
1,365 |
|
1,423 |
|
2,167 |
|
1,906 |
|
2,010 |
|
1,634 |
|
1,824 |
|
1,623 |
|
1,219 |
|
Average exchange rate for the quarters ended 30 June 2023 and 31 March 2023 was R18.66/US$ and R17.76/US$, respectively
Figures may not add as they are rounded independently
1 Operating cost is the average cost of production and operating cost per tonne is calculated by dividing the cost of sales, before amortisation and depreciation and change in inventory in a period by the tonnes milled/treated in the same period, and operating cost per kilogram (and ounce) is calculated by dividing the cost of sales, before amortisation and depreciation and change in inventory in a period by the gold produced in the same period
Sibanye-Stillwater Operating and financial results | Six months ended 30 June 2023 66
DEVELOPMENT RESULTS
Development values represent the actual results of sampling and no allowance has been made for any adjustments which may be necessary when estimating ore reserves. All figures below exclude shaft sinking metres, which are reported separately where appropriate.
|
|
|
|
|
|
|
|
|
|
|
|
|
|
|
|
|
|
|
|
|
|
|
|
|
|
|
|
|
|
|
|
|
|
|
|
|
|
|
|
|
|
|
|
|
|
|
|
|
|
|
|
|
|
|
|
|
|
|
|
|
|
|
|
|
|
|
|
|
|
|
|
|
|
|
|
|
|
|
| US PGM operations |
|
Jun 2023 quarter |
Mar 2023 quarter |
Six months ended 30 June 2023 |
|
Reef |
|
|
|
|
Stillwater incl Blitz |
East Boulder |
|
|
|
|
Stillwater incl Blitz |
East Boulder |
|
|
|
|
Stillwater incl Blitz |
East Boulder |
| Total US PGM |
Unit |
|
|
|
|
|
|
|
|
|
|
|
|
|
|
|
|
|
|
| Primary development (off reef) |
(m) |
|
|
|
|
1,671 |
|
472 |
|
|
|
|
|
1,503 |
|
451 |
|
|
|
|
|
3,174 |
|
923 |
|
| Secondary development |
(m) |
|
|
|
|
2,659 |
|
1,319 |
|
|
|
|
|
2,443 |
|
1,424 |
|
|
|
|
|
5,101 |
|
2,742 |
|
|
|
|
|
|
|
|
|
|
|
|
|
|
|
|
|
|
|
|
|
|
|
|
|
|
|
|
|
|
|
|
|
|
|
|
|
|
|
|
|
|
|
|
|
|
|
|
|
|
|
|
|
|
|
|
|
|
|
|
|
|
|
|
|
|
|
|
|
|
|
|
|
|
|
|
|
|
|
| SA PGM operations |
|
Jun 2023 quarter |
Mar 2023 quarter |
Six months ended 30 June 2023 |
|
Reef |
|
|
Bathopele |
Thembe- lani |
Khuseleka |
Siphume-lele |
|
|
Bathopele |
Thembe-lani |
Khuseleka |
Siphume-lele |
|
|
Bathopele |
Thembe-lani |
Khuseleka |
Siphume-lele |
| Rustenburg |
Unit |
|
|
|
|
|
|
|
|
|
|
|
|
|
|
|
|
|
|
| Advanced |
(m) |
|
|
793 |
|
1,846 |
|
2,762 |
|
582 |
|
|
|
606 |
|
1,325 |
|
2,290 |
|
521 |
|
|
|
1,399 |
|
3,171 |
|
5,052 |
|
1,103 |
|
| Advanced on reef |
(m) |
|
|
793 |
|
865 |
|
938 |
|
363 |
|
|
|
606 |
|
572 |
|
805 |
|
337 |
|
|
|
1,399 |
|
1,437 |
|
1,743 |
|
699 |
|
| Height |
(cm) |
|
|
224 |
|
295 |
|
286 |
|
273 |
|
|
|
229 |
|
294 |
|
289 |
|
272 |
|
|
|
225 |
|
294 |
|
288 |
|
271 |
|
| Average value |
(g/t) |
|
|
2.8 |
|
2.4 |
|
2.3 |
|
3.0 |
|
|
|
2.7 |
|
2.4 |
|
2.3 |
|
2.9 |
|
|
|
2.8 |
|
2.4 |
|
2.3 |
|
3.0 |
|
|
(cm.g/t) |
|
|
624 |
|
696 |
|
664 |
|
818 |
|
|
|
615 |
|
696 |
|
655 |
|
787 |
|
|
|
618 |
|
694 |
|
661 |
|
800 |
|
|
|
|
|
|
|
|
|
|
|
|
|
|
|
|
|
|
|
|
|
| SA PGM operations |
|
Jun 2023 quarter |
Mar 2023 quarter |
Six months ended 30 June 2023 |
|
Reef |
K3 |
Rowland |
Saffy |
E3 |
4B |
K4 |
K3 |
Rowland |
Saffy |
E3 |
4B |
K4 |
K3 |
Rowland |
Saffy |
E3 |
4B |
K4 |
| Marikana |
Unit |
|
|
|
|
|
|
|
|
|
|
|
|
|
|
|
|
|
|
| Primary development |
(m) |
8,174 |
|
4,353 |
|
3,283 |
|
1,225 |
|
790 |
|
3,189 |
|
6,661 |
|
3,864 |
|
2,933 |
|
640 |
|
949 |
|
2,607 |
|
14,835 |
|
8,216 |
|
6,216 |
|
1,865 |
|
1,739 |
|
5,796 |
|
| Primary development - on reef |
(m) |
6,032 |
|
2,456 |
|
1,716 |
|
756 |
|
469 |
|
981 |
|
4,803 |
|
2,327 |
|
1,663 |
|
378 |
|
662 |
|
877 |
|
10,835 |
|
4,783 |
|
3,379 |
|
1,135 |
|
1,131 |
|
1,858 |
|
| Height |
(cm) |
216 |
|
220 |
|
235 |
|
221 |
|
215 |
|
238 |
|
216 |
|
220 |
|
236 |
|
225 |
|
212 |
|
240 |
|
216 |
|
220 |
|
235 |
|
222 |
|
214 |
|
239 |
|
| Average value |
(g/t) |
2.9 |
|
2.3 |
|
2.5 |
|
2.7 |
|
2.9 |
|
2.5 |
|
2.8 |
|
2.5 |
|
2.5 |
|
2.6 |
|
2.9 |
|
2.5 |
|
2.9 |
|
2.4 |
|
2.5 |
|
2.7 |
|
2.9 |
|
2.5 |
|
|
(cm.g/t) |
623 |
|
515 |
|
583 |
|
586 |
|
625 |
|
599 |
|
611 |
|
548 |
|
583 |
|
593 |
|
621 |
|
589 |
|
618 |
|
532 |
|
583 |
|
588 |
|
622 |
|
595 |
|
|
|
|
|
|
|
|
|
|
|
|
|
|
|
|
|
|
|
|
|
| SA PGM operations |
|
Jun 2023 quarter |
Mar 2023 quarter |
Six months ended 30 June 2023 |
|
Reef |
|
Simunye1 |
Kopaneng |
Bamba-nani |
Kwezi |
K6 |
|
Simunye1 |
Kopaneng |
Bamba-nani |
Kwezi |
K6 |
|
Simunye1 |
Kopaneng |
Bamba-nani |
Kwezi |
K6 |
| Kroondal |
Unit |
|
|
|
|
|
|
|
|
|
|
|
|
|
|
|
|
|
|
| Advanced |
(m) |
|
— |
1,161 |
|
1,245 |
|
332 |
|
537 |
|
|
675 |
|
541 |
|
1,014 |
|
273 |
|
438 |
|
|
675 |
|
1,702 |
|
2,259 |
|
605 |
|
974 |
|
| Advanced on reef |
(m) |
|
— |
1,048 |
|
900 |
|
299 |
|
515 |
|
|
604 |
|
462 |
|
747 |
|
230 |
|
423 |
|
|
604 |
|
1,510 |
|
1,647 |
|
529 |
|
937 |
|
| Height |
(cm) |
|
— |
236 |
|
247 |
|
243 |
|
228 |
|
|
230 |
|
235 |
|
250 |
|
229 |
|
235 |
|
|
230 |
|
235 |
|
248 |
|
237 |
|
231 |
|
| Average value |
(g/t) |
|
— |
2.2 |
|
1.9 |
|
2.2 |
|
|
2.0 |
|
|
2.2 |
|
2.0 |
|
1.9 |
|
2.0 |
|
2.2 |
|
|
2.2 |
|
2.1 |
|
1.9 |
|
2.1 |
|
2.1 |
|
|
(cm.g/t) |
|
— |
523 |
|
462 |
|
535 |
|
466 |
|
|
516 |
|
470 |
|
468 |
|
450 |
|
509 |
|
|
516 |
|
504 |
|
465 |
|
496 |
|
484 |
|
1 Simunye development was done as part of the Kopaneng extraction strategy. Based on planning and measuring this portion of mining below Simunye will be allocated to Kopaneng with effect from April 2023 onwards
Sibanye-Stillwater Operating and financial results | Six months ended 30 June 2023 67
|
|
|
|
|
|
|
|
|
|
|
|
|
|
|
|
|
|
|
|
|
|
|
|
|
|
|
|
|
|
|
|
|
|
|
|
|
|
|
|
|
|
|
|
|
|
|
|
|
|
|
|
|
|
|
|
|
|
|
|
|
|
|
|
|
|
|
|
|
|
|
|
|
|
|
|
|
|
| SA gold operations |
|
Jun 2023 quarter |
Mar 2023 quarter |
Six months ended 30 June 2023 |
|
Reef |
|
|
|
Carbon
leader |
Main |
VCR |
|
|
|
Carbon
leader |
Main |
VCR |
|
|
|
Carbon
leader |
Main |
VCR |
| Driefontein |
Unit |
|
|
|
|
|
|
|
|
|
|
|
|
|
|
|
|
|
|
| Advanced |
(m) |
|
|
|
492 |
|
504 |
|
1,377 |
|
|
|
|
544 |
|
545 |
|
1,072 |
|
|
|
|
1,036 |
|
1,049 |
|
2,449 |
|
| Advanced on reef |
(m) |
|
|
|
56 |
|
14 |
|
126 |
|
|
|
|
67 |
|
38 |
|
195 |
|
|
|
|
123 |
|
51 |
|
320 |
|
| Channel width |
(cm) |
|
|
|
13 |
|
199 |
|
55 |
|
|
|
|
41 |
|
27 |
|
46 |
|
|
|
|
28 |
|
73 |
|
50 |
|
| Average value |
(g/t) |
|
|
|
62.3 |
|
7.2 |
|
44.5 |
|
|
|
|
22.8 |
|
8.3 |
|
24.5 |
|
|
|
|
30.9 |
|
7.5 |
|
33.2 |
|
|
(cm.g/t) |
|
|
|
797 |
|
1,434 |
|
2,468 |
|
|
|
|
937 |
|
224 |
|
1,123 |
|
|
|
|
874 |
|
550 |
|
1,650 |
|
|
|
|
|
|
|
|
|
|
|
|
|
|
|
|
|
|
|
|
|
|
|
|
|
|
|
|
|
|
|
|
|
|
|
|
|
|
|
|
|
|
|
|
|
|
|
|
|
|
|
|
|
|
|
|
|
|
|
|
|
| SA gold operations |
|
Jun 2023 quarter |
Mar 2023 quarter |
Six months ended 30 June 2023 |
|
Reef |
|
|
Kloof |
Main |
Libanon |
VCR |
|
|
Kloof |
Main |
Libanon |
VCR |
|
|
Kloof |
Main |
Libanon |
VCR |
| Kloof |
Unit |
|
|
|
|
|
|
|
|
|
|
|
|
|
|
|
|
|
|
| Advanced |
(m) |
|
|
1,064 |
|
697 |
|
46 |
|
885 |
|
|
|
1,002 |
|
534 |
|
46 |
|
709 |
|
|
|
2,065 |
|
1,231 |
|
91 |
|
1,594 |
|
| Advanced on reef |
(m) |
|
|
452 |
|
155 |
|
46 |
|
108 |
|
|
|
375 |
|
125 |
|
46 |
|
142 |
|
|
|
827 |
|
280 |
|
91 |
|
250 |
|
| Channel width |
(cm) |
|
|
165 |
|
49 |
|
93 |
|
104 |
|
|
|
152 |
|
85 |
|
101 |
|
107 |
|
|
|
159 |
|
65 |
|
97 |
|
106 |
|
| Average value |
(g/t) |
|
|
4.8 |
|
16.3 |
|
2.2 |
|
11.8 |
|
|
|
5.4 |
|
9.0 |
|
1.9 |
|
10.8 |
|
|
|
5.1 |
|
12.0 |
|
2.1 |
|
11.2 |
|
|
(cm.g/t) |
|
|
795 |
|
800 |
|
206 |
|
1,226 |
|
|
|
819 |
|
764 |
|
196 |
|
1,151 |
|
|
|
806 |
|
784 |
|
201 |
|
1,183 |
|
|
|
|
|
|
|
|
|
|
|
|
|
|
|
|
|
|
|
|
|
|
|
|
|
|
|
|
|
|
|
|
|
|
|
|
|
|
|
|
|
|
|
|
|
|
|
|
|
|
|
|
|
|
|
|
|
|
|
|
|
| SA gold operations |
|
Jun 2023 quarter |
Mar 2023 quarter |
Six months ended 30 June 2023 |
|
Reef |
|
|
|
|
Beatrix |
Kalkoen-krans |
|
|
|
|
Beatrix |
Kalkoen-krans |
|
|
|
|
Beatrix |
Kalkoen-krans |
| Beatrix |
Unit |
|
|
|
|
|
|
|
|
|
|
|
|
|
|
|
|
|
|
| Advanced |
(m) |
|
|
|
|
2,061 |
|
0 |
|
|
|
|
|
1,917 |
|
8 |
|
|
|
|
|
3,978 |
|
8 |
|
| Advanced on reef |
(m) |
|
|
|
|
612 |
|
0 |
|
|
|
|
|
566 |
|
— |
|
|
|
|
|
1,179 |
|
— |
|
| Channel width |
(cm) |
|
|
|
|
162 |
|
0 |
|
|
|
|
|
172 |
|
— |
|
|
|
|
|
167 |
|
— |
|
| Average value |
(g/t) |
|
|
|
|
6.1 |
|
0 |
|
|
|
|
|
7.3 |
|
— |
|
|
|
|
|
6.7 |
|
— |
|
|
(cm.g/t) |
|
|
|
|
997 |
|
0 |
|
|
|
|
|
1,262 |
|
— |
|
|
|
|
|
1,124 |
|
— |
|
|
|
|
|
|
|
|
|
|
|
|
|
|
|
|
|
|
|
|
|
|
|
|
|
|
|
|
|
|
|
|
|
|
|
|
|
|
|
|
|
|
|
|
|
|
|
|
|
|
|
|
|
|
|
|
|
|
|
|
|
| SA gold operations |
|
Jun 2023 quarter |
Mar 2023 quarter |
Six months ended 30 June 2023 |
|
Reef |
|
|
|
|
|
Kimberley |
|
|
|
|
|
Kimberley |
|
|
|
|
|
Kimberley |
| Burnstone |
Unit |
|
|
|
|
|
|
|
|
|
|
|
|
|
|
|
|
|
|
| Advanced |
(m) |
|
|
|
|
|
630 |
|
|
|
|
|
|
571 |
|
|
|
|
|
|
1,201 |
|
| Advanced on reef |
(m) |
|
|
|
|
|
— |
|
|
|
|
|
|
— |
|
|
|
|
|
|
— |
|
| Channel width |
(cm) |
|
|
|
|
|
— |
|
|
|
|
|
|
— |
|
|
|
|
|
|
— |
|
| Average value |
(g/t) |
|
|
|
|
|
— |
|
|
|
|
|
|
— |
|
|
|
|
|
|
— |
|
|
(cm.g/t) |
|
|
|
|
|
— |
|
|
|
|
|
|
— |
|
|
|
|
|
|
— |
|
Sibanye-Stillwater Operating and financial results | Six months ended 30 June 2023 68
ADMINISTRATION AND CORPORATE
|
|
|
|
|
|
|
SIBANYE STILLWATER LIMITED
(SIBANYE-STILLWATER)
Incorporated in the Republic of South Africa
Registration number 2014/243852/06
Share code: SSW and SBSW
Issuer code: SSW
ISIN: ZAE000259701
LISTINGS
JSE: SSW
NYSE: SBSW
WEBSITE
 www.sibanyestillwater.com
REGISTERED AND CORPORATE OFFICE
Constantia Office Park
Bridgeview House, Building 11, Ground floor,
Cnr 14th Avenue & Hendrik Potgieter Road
Weltevreden Park 1709
South Africa
Private Bag X5
Westonaria 1780
South Africa
Tel: +27 11 278 9600
Fax: +27 11 278 9863
COMPANY SECRETARY
Lerato Matlosa
Email: lerato.matlosa@sibanyestillwater.com
DIRECTORS
Dr Vincent Maphai* (Chairman)
Neal Froneman (CEO)
Charl Keyter (CFO)
Dr Elaine Dorward-King*
Harry Kenyon-Slaney*
Jeremiah Vilakazi*
Keith Rayner*
Nkosemntu Nika*
Richard Menell*^
Savannah Danson*
Susan van der Merwe*
Timothy Cumming*
Sindiswa Zilwa*
* Independent non-executive
^ Lead independent director
INVESTOR ENQUIRIES
James Wellsted
Executive Vice President: Investor Relations and Corporate Affairs
Mobile: +27 83 453 4014
Email: james.wellsted@sibanyestillwater.com
or ir@sibanyestillwater.com
|
JSE SPONSOR
JP Morgan Equities South Africa Proprietary Limited
Registration number 1995/011815/07
1 Fricker Road
Illovo
Johannesburg 2196
South Africa
Private Bag X9936
Sandton 2146
South Africa
AUDITORS
Ernst & Young Inc. (EY)
102 Rivonia Road
Sandton 2196
South Africa
Private Bag X14
Sandton 2146
South Africa
Tel: +27 11 772 3000
AMERICAN DEPOSITARY RECEIPTS
TRANSFER AGENT
BNY Mellon Shareowner Correspondence (ADR)
Mailing address of agent:
Computershare
PO Box 43078
Providence, RI 02940-3078
Overnight/certified/registered delivery:
Computershare
150 Royall Street, Suite 101
Canton, MA 02021
US toll free: + 1 888 269 2377
Tel: +1 201 680 6825
Email: shrrelations@cpushareownerservices.com
Tatyana Vesselovskaya
Relationship Manager - BNY Mellon
Depositary Receipts
Email: tatyana.vesselovskaya@bnymellon.com
TRANSFER SECRETARIES SOUTH AFRICA
Computershare Investor Services Proprietary Limited
Rosebank Towers
15 Biermann Avenue
Rosebank 2196
PO Box 61051
Marshalltown 2107
South Africa
Tel: +27 11 370 5000
Fax: +27 11 688 5248
|
Sibanye-Stillwater Operating and financial results | Six months ended 30 June 2023 69
DISCLAIMER
Forward looking statements
The information in this document may contain forward-looking statements within the meaning of the “safe harbour” provisions of the United States Private Securities Litigation Reform Act of 1995 with respect to Sibanye Stillwater Limited’s (Sibanye-Stillwater or the Group) financial condition, results of operations, business strategies, operating efficiencies, competitive position, growth opportunities for existing services, plans and objectives of management for future operations, markets for stock and other matters. These forward-looking statements, including, among others, those relating to Sibanye-Stillwater’s future business prospects, revenues and income, climate change-related targets and metrics, the potential benefits of past and future acquisitions (including statements regarding growth, cost savings, benefits from and access to international financing and financial re-ratings), gold, PGM, nickel and lithium pricing expectations, levels of output, supply and demand, information relating to Sibanye-Stillwater’s new or ongoing development projects, any proposed, anticipated or planned expansions into the battery metals or adjacent sectors and estimations or expectations of enterprise value, adjusted EBITDA and net asset, are necessarily estimates reflecting the best judgment of the senior management and directors of Sibanye-Stillwater and involve a number of risks and uncertainties that could cause actual results to differ materially from those suggested by the forward-looking statements. As a consequence, these forward-looking statements should be considered in light of various important factors, including those set forth in this document.
All statements other than statements of historical facts included in this document may be forward-looking statements. Forward-looking statements also often use words such as “will”, “would”, “expect”, “forecast”, “goal”, “vision”, “potential”, “may”, “could”, “believe”, “aim”, “anticipate”, “target”, “estimate” and words of similar meaning. By their nature, forward-looking statements involve risk and uncertainty because they relate to future events and circumstances and should be considered in light of various important factors, including those set forth in this disclaimer. Readers are cautioned not to place undue reliance on such statements.
The important factors that could cause Sibanye-Stillwater’s actual results, performance or achievements to differ materially from estimates or projections contained in the forward-looking statements include, without limitation, Sibanye-Stillwater’s future financial position, plans, strategies, objectives, capital expenditures, projected costs and anticipated cost savings, financing plans, debt position and ability to reduce debt leverage; economic, business, political and social conditions in South Africa, Zimbabwe, the United States, Europe and elsewhere; plans and objectives of management for future operations; Sibanye-Stillwater’s ability to obtain the benefits of any streaming arrangements or pipeline financing; the ability of Sibanye-Stillwater to comply with loan and other covenants and restrictions and difficulties in obtaining additional financing or refinancing; Sibanye-Stillwater’s ability to service its bond instruments; changes in assumptions underlying Sibanye-Stillwater’s estimation of its Mineral Resources and Mineral Reserves; any failure of a tailings storage facility; the ability to achieve anticipated efficiencies and other cost savings in connection with, and the ability to successfully integrate, past, ongoing and future acquisitions, as well as at existing operations; the ability of Sibanye-Stillwater to complete any ongoing or future acquisitions; the success of Sibanye-Stillwater’s business strategy and exploration and development activities, including any proposed, anticipated or planned expansions into the battery metals or adjacent sectors and estimations or expectations of enterprise value (including the Rhyolite Ridge project); the ability of Sibanye-Stillwater to comply with requirements that it operate in ways that provide progressive benefits to affected communities; changes in the market price of gold, PGMs, battery metals (e.g., nickel, lithium, copper and zinc) and the cost of power, petroleum fuels, and oil, among other commodities and supply requirements; the occurrence of hazards associated with underground and surface mining; any further downgrade of South Africa’s credit rating; the impact of South Africa's greylisting; a challenge regarding the title to any of Sibanye-Stillwater’s properties by claimants to land under restitution and other legislation; Sibanye-Stillwater’s ability to implement its strategy and any changes thereto; the outcome of legal challenges to the Group’s mining or other land use rights; the occurrence of labour disputes, disruptions and industrial actions; the availability, terms and deployment of capital or credit; changes in the imposition of industry standards, regulatory costs and relevant government regulations, particularly environmental, sustainability, tax, health and safety regulations and new legislation affecting water, mining, mineral rights and business ownership, including any interpretation thereof which may be subject to dispute; increasing regulation of environmental and sustainability matters such as greenhouse gas emissions and climate change; being subject to, and the outcome and consequence of, any potential or pending litigation or regulatory proceedings, including in relation to any environmental, health or safety issues; failure to meet ethical standards, including actual or alleged instances of fraud, bribery or corruption; the effect of climate change or other extreme weather events on Sibanye-Stillwater’s business; the concentration of all final refining activity and a large portion of Sibanye-Stillwater’s PGM sales from mine production in the United States with one entity; the identification of a material weakness in disclosure and internal controls over financial reporting; the effect of US tax reform legislation on Sibanye-Stillwater and its subsidiaries; the effect of South African Exchange Control Regulations on Sibanye-Stillwater’s financial flexibility; operating in new geographies and regulatory environments where Sibanye-Stillwater has no previous experience; power disruptions, constraints and cost increases; supply chain disruptions and shortages and increases in the price of production inputs; the regional concentration of Sibanye-Stillwater’s operations; fluctuations in exchange rates, currency devaluations, inflation and other macro-economic monetary policies; the occurrence of temporary stoppages or precautionary suspension of operations at its mines for safety or environmental incidents (including natural disasters) and unplanned maintenance; Sibanye-Stillwater’s ability to hire and retain senior management and employees with sufficient technical and/or production skills across its global operations necessary to meet its labour recruitment and retention goals, as well as its ability to achieve sufficient representation of historically disadvantaged South Africans in its management positions; failure of Sibanye-Stillwater’s information technology, communications and systems; the adequacy of Sibanye-Stillwater’s insurance coverage; social unrest, sickness or natural or man-made disaster at informal settlements in the vicinity of some of Sibanye-Stillwater’s South African-based operations; and the impact of HIV, tuberculosis and the spread of other contagious diseases, including global pandemics.
Further details of potential risks and uncertainties affecting Sibanye-Stillwater are described in Sibanye-Stillwater’s filings with the Johannesburg Stock Exchange and the United States Securities and Exchange Commission, including the 2022 Integrated Report and the Annual Financial Report for the fiscal year ended 31 December 2022 on Form 20-F filed with the United States Securities and Exchange Commission on 24 April 2023 (SEC File no. 333-234096).
These forward-looking statements speak only as of the date of the content. Sibanye-Stillwater expressly disclaims any obligation or undertaking to update or revise any forward-looking statement (except to the extent legally required). These forward-looking statements have not been reviewed or reported on by the Group’s external auditors.
Non-IFRS Measures
The information contained in this document may contain certain non-IFRS measures, including, among others, adjusted EBITDA, adjusted free cash flow, AISC, AIC, Nickel equivalent sustaining cost, average equivalent zinc concentrate price and normalised earnings. These measures may not be comparable to similarly-titled measures used by other companies and are not measures of Sibanye-Stillwater’s financial performance under IFRS. These measures should not be considered in isolation or as a substitute for measures of performance prepared in accordance with IFRS. Sibanye-Stillwater is not providing a reconciliation of the forecast non-IFRS financial information presented in this document because it is unable to provide this reconciliation without unreasonable effort. These forecast non-IFRS financial information presented have not been reviewed or reported on by the Group’s external auditors.
Websites
References in this document to information on websites (and/or social media sites) are included as an aid to their location and such information is not incorporated in, and does not form part of, this document.
Sibanye-Stillwater Operating and financial results | Six months ended 30 June 2023 70