0001782524FALSEFY2023http://fasb.org/us-gaap/2023#DebtAndEquitySecuritiesUnrealizedGainLosshttp://fasb.org/us-gaap/2023#DebtAndEquitySecuritiesUnrealizedGainLosshttp://fasb.org/us-gaap/2023#DebtAndEquitySecuritiesRealizedGainLosshttp://fasb.org/us-gaap/2023#DebtAndEquitySecuritiesUnrealizedGainLosshttp://fasb.org/us-gaap/2023#DebtAndEquitySecuritiesUnrealizedGainLosshttp://fasb.org/us-gaap/2023#DebtAndEquitySecuritiesRealizedGainLoss00017825242023-01-012023-12-3100017825242023-12-31iso4217:USD00017825242024-03-01xbrli:shares00017825242022-12-31iso4217:USDxbrli:shares00017825242022-01-012022-12-3100017825242021-01-012021-12-3100017825242021-12-3100017825242020-12-310001782524Jonathan Acquisition Company2023-12-31xbrli:pure0001782524Mantech International CP 12023-12-310001782524Mantech International CP 22023-12-310001782524Mantech International CP 32023-12-310001782524PCX Holding Corp. 12023-12-310001782524PCX Holding Corp. 22023-12-310001782524PCX Holding Corp. 32023-12-310001782524Two Six Labs, LLC 12023-12-310001782524Two Six Labs, LLC 22023-12-310001782524Two Six Labs, LLC 32023-12-310001782524msdlf:DebtSecuritiesFirstLienMemberus-gaap:AerospaceSectorMember2023-12-310001782524AGI-CFI Holdings, Inc.2023-12-310001782524Omni Intermediate Holdings, LLC 12023-12-310001782524Omni Intermediate Holdings, LLC 22023-12-310001782524Omni Intermediate Holdings, LLC 32023-12-310001782524RoadOne IntermodaLogistics 12023-12-310001782524RoadOne IntermodaLogistics 22023-12-310001782524RoadOne IntermodaLogistics 32023-12-310001782524msdlf:AirFreightAndLogisticsSectorMembermsdlf:DebtSecuritiesFirstLienMember2023-12-310001782524Continental Battery Company2023-12-310001782524Randy's Holdings, Inc. 12023-12-310001782524Randy's Holdings, Inc. 22023-12-310001782524Randy's Holdings, Inc. 32023-12-310001782524Sonny's Enterprises, LLC 12023-12-310001782524Spectrum Automotive Holdings Corp. 12023-12-310001782524Spectrum Automotive Holdings Corp. 22023-12-310001782524Spectrum Automotive Holdings Corp. 32023-12-310001782524msdlf:AutoComponentsSectorMembermsdlf:DebtSecuritiesFirstLienMember2023-12-310001782524ARI Network Services, Inc. 12023-12-310001782524ARI Network Services, Inc. 22023-12-310001782524ARI Network Services, Inc. 32023-12-310001782524Summit Buyer, LLC 12023-12-310001782524Summit Buyer, LLC 22023-12-310001782524Summit Buyer, LLC 32023-12-310001782524Turbo Buyer, Inc. 12023-12-310001782524Turbo Buyer, Inc. 22023-12-310001782524msdlf:AutomobilesSectorMembermsdlf:DebtSecuritiesFirstLienMember2023-12-310001782524GraphPad Software, LLC 12023-12-310001782524GraphPad Software, LLC 22023-12-310001782524msdlf:BiotechnologySectorMembermsdlf:DebtSecuritiesFirstLienMember2023-12-310001782524Tank Holding Corp. 12023-12-310001782524Tank Holding Corp. 22023-12-310001782524Tank Holding Corp. 32023-12-310001782524V Global Holdings, LLC 12023-12-310001782524V Global Holdings, LLC 22023-12-310001782524us-gaap:ChemicalsSectorMembermsdlf:DebtSecuritiesFirstLienMember2023-12-310001782524365 Retail Markets, LLC 12023-12-310001782524365 Retail Markets, LLC 22023-12-310001782524365 Retail Markets, LLC 32023-12-310001782524Atlas Us Finco, Inc. 12023-12-310001782524Atlas Us Finco, Inc. 22023-12-310001782524BPG Holdings IV Corp.2023-12-310001782524Encore Holdings, LLC 12023-12-310001782524Encore Holdings, LLC 22023-12-310001782524Encore Holdings, LLC 32023-12-310001782524Energy Labs Holdings Corp. 12023-12-310001782524Energy Labs Holdings Corp. 22023-12-310001782524Energy Labs Holdings Corp. 32023-12-310001782524FLS Holding, Inc. 12023-12-310001782524FLS Holding, Inc. 22023-12-310001782524FLS Holding, Inc. 32023-12-310001782524Helios Service Partners, LLC 12023-12-310001782524Helios Service Partners, LLC 22023-12-310001782524Helios Service Partners, LLC 32023-12-310001782524Iris Buyer, LLC 12023-12-310001782524Iris Buyer, LLC 22023-12-310001782524Iris Buyer, LLC 32023-12-310001782524Atlas US Finco, Inc.2023-12-310001782524PDFTron Systems, Inc. 12023-12-310001782524PDFTron Systems, Inc. 22023-12-310001782524PDFTron Systems, Inc. 32023-12-310001782524Procure Acquireco, Inc. (Procure Analytics) 12023-12-310001782524Procure Acquireco, Inc. (Procure Analytics) 22023-12-310001782524Procure Acquireco, Inc. (Procure Analytics) 32023-12-310001782524Sherlock Buyer Corp. 12023-12-310001782524Sherlock Buyer Corp. 22023-12-310001782524Sherlock Buyer Corp. 32023-12-310001782524Surewerx Purchaser III, Inc. 12023-12-310001782524Surewerx Purchaser III, Inc. 22023-12-310001782524Surewerx Purchaser III, Inc. 32023-12-310001782524Sweep Purchaser, LLC 12023-12-310001782524Sweep Purchaser, LLC 22023-12-310001782524Sweep Purchaser, LLC 32023-12-310001782524Tamarack Intermediate, LLC 12023-12-310001782524Tamarack Intermediate, LLC 22023-12-310001782524Tamarack Intermediate, LLC 32023-12-310001782524United Flow Technologies Intermediate Holdco II, LLC 12023-12-310001782524United Flow Technologies Intermediate Holdco II, LLC 22023-12-310001782524United Flow Technologies Intermediate Holdco II, LLC 32023-12-310001782524US Infra Svcs Buyer, LLC 12023-12-310001782524US Infra Svcs Buyer, LLC 22023-12-310001782524US Infra Svcs Buyer, LLC 32023-12-310001782524Vensure Employer Services, Inc.2023-12-310001782524VRC Companies, LLC 12023-12-310001782524VRC Companies, LLC 22023-12-310001782524VRC Companies, LLC 32023-12-310001782524msdlf:DebtSecuritiesFirstLienMembermsdlf:CommercialServicesAndSuppliesSectorMember2023-12-310001782524KPSKY Acquisition, Inc. 12023-12-310001782524KPSKY Acquisition, Inc. 22023-12-310001782524LJ Avalon Holdings, LLC 12023-12-310001782524LJ Avalon Holdings, LLC 22023-12-310001782524LJ Avalon Holdings, LLC 32023-12-310001782524Superman Holdings, LLC 12023-12-310001782524Superman Holdings, LLC 22023-12-310001782524msdlf:ConstructionAndEngineeringSectorMembermsdlf:DebtSecuritiesFirstLienMember2023-12-310001782524BP Purchaser, LLC2023-12-310001782524FORTIS Solutions Group, LLC 12023-12-310001782524FORTIS Solutions Group, LLC 22023-12-310001782524FORTIS Solutions Group, LLC 32023-12-310001782524us-gaap:ContainerAndPackagingSectorMembermsdlf:DebtSecuritiesFirstLienMember2023-12-31000178252448Forty Solutions, LLC 12023-12-31000178252448Forty Solutions, LLC 22023-12-310001782524ABB Concise Optical Group, LLC2023-12-310001782524Avalara, Inc. 12023-12-310001782524Avalara, Inc. 22023-12-310001782524Bradyifs Holdings, LLC 12023-12-310001782524Bradyifs Holdings, LLC 22023-12-310001782524Bradyifs Holdings, LLC 32023-12-310001782524PT Intermediate Holdings III, LLC 12023-12-310001782524PT Intermediate Holdings III, LLC 22023-12-310001782524msdlf:DebtSecuritiesFirstLienMembermsdlf:DistributorsSectorMember2023-12-310001782524Apex Service Partners, LLC 12023-12-310001782524Apex Service Partners, LLC 22023-12-310001782524Apex Service Partners, LLC 32023-12-310001782524Assembly Intermediate, LLC 12023-12-310001782524Assembly Intermediate, LLC 22023-12-310001782524Assembly Intermediate, LLC 32023-12-310001782524FPG Intermediate Holdco, LLC2023-12-310001782524Groundworks, LLC 12023-12-310001782524Groundworks, LLC 22023-12-310001782524Groundworks, LLC 32023-12-310001782524Heartland Home Services, Inc.2023-12-310001782524Lightspeed Solution, LLC 12023-12-310001782524Lightspeed Solution, LLC 22023-12-310001782524LUV Car Wash Group, LLC2023-12-310001782524Magnolia Wash Holdings 12023-12-310001782524Magnolia Wash Holdings 22023-12-310001782524Magnolia Wash Holdings 32023-12-310001782524Spotless Brands, LLC 12023-12-310001782524Spotless Brands, LLC 22023-12-310001782524Spotless Brands, LLC 32023-12-310001782524Vertex Service Partners, LLC 12023-12-310001782524Vertex Service Partners, LLC 22023-12-310001782524Vertex Service Partners, LLC, 32023-12-310001782524msdlf:DebtSecuritiesFirstLienMemberus-gaap:ConsumerSectorMember2023-12-310001782524Abracon Group Holdings, LLC 12023-12-310001782524Abracon Group Holdings, LLC 22023-12-310001782524Abracon Group Holdings, LLC 32023-12-310001782524Dwyer Instruments, Inc. 12023-12-310001782524Dwyer Instruments, Inc. 22023-12-310001782524Dwyer Instruments, Inc. 32023-12-310001782524Infinite Bidco, LLC 12023-12-310001782524Magneto Components Buyco, LLC 12023-12-310001782524Magneto Components Buyco, LLC 22023-12-310001782524Magneto Components Buyco, LLC 32023-12-310001782524msdlf:ElectronicEquipmentInstrumentsAndComponentsSectorMembermsdlf:DebtSecuritiesFirstLienMember2023-12-310001782524Applitools, Inc. 12023-12-310001782524Applitools, Inc. 22023-12-310001782524Cerity Partners, LLC 12023-12-310001782524Cerity Partners, LLC 22023-12-310001782524GC Waves Holdings, Inc. 12023-12-310001782524GC Waves Holdings, Inc. 22023-12-310001782524GC Waves Holdings, Inc. 32023-12-310001782524SitusAMC Holdings Corp.2023-12-310001782524Smarsh, Inc. 12023-12-310001782524Smarsh, Inc. 22023-12-310001782524Smarsh, Inc. 32023-12-310001782524Trintech, Inc. 12023-12-310001782524Trintech, Inc. 22023-12-310001782524us-gaap:FinancialServicesSectorMembermsdlf:DebtSecuritiesFirstLienMember2023-12-310001782524AMCP Pet Holdings, Inc. (Brightpet) 12023-12-310001782524AMCP Pet Holdings, Inc. (Brightpet) 22023-12-310001782524Nellson Nutraceutical, Inc.2023-12-310001782524Teasdale Foods, Inc. (Teasdale Latin Foods)2023-12-310001782524us-gaap:FoodAndBeverageSectorMembermsdlf:DebtSecuritiesFirstLienMember2023-12-310001782524Performance Health Holdings, Inc.2023-12-310001782524PerkinElmer U.S., LLC2023-12-310001782524Tidi Legacy Products, Inc. 12023-12-310001782524Tidi Legacy Products, Inc. 22023-12-310001782524Tidi Legacy Products, Inc. 32023-12-310001782524YI, LLC 12023-12-310001782524YI, LLC 22023-12-310001782524YI, LLC 32023-12-310001782524msdlf:HealthCareEquipmentAndSuppliesSectorMembermsdlf:DebtSecuritiesFirstLienMember2023-12-310001782524Advarra Holdings, Inc. 12023-12-310001782524Advarra Holdings, Inc. 22023-12-310001782524DCA Investment Holdings, LLC 12023-12-310001782524DCA Investment Holdings, LLC 22023-12-310001782524Gateway US Holdings, Inc. 12023-12-310001782524Gateway US Holdings, Inc. 22023-12-310001782524Gateway US Holdings, Inc. 32023-12-310001782524Heartland Veterinary Partners, LLC 12023-12-310001782524Heartland Veterinary Partners, LLC 22023-12-310001782524Heartland Veterinary Partners, LLC 32023-12-310001782524iCIMS, Inc. 12023-12-310001782524iCIMS, Inc. 22023-12-310001782524iCIMS, Inc. 32023-12-310001782524Intelerad Medical Systems Incorporated 12023-12-310001782524Intelerad Medical Systems Incorporated 22023-12-310001782524mPulse Mobile, Inc. 12023-12-310001782524mPulse Mobile, Inc. 22023-12-310001782524mPulse Mobile, Inc. 32023-12-310001782524Pareto Health Intermediate Holdings, Inc. 12023-12-310001782524Pareto Health Intermediate Holdings, Inc. 22023-12-310001782524PPV Intermediate Holdings LLC2023-12-310001782524PPV Intermediate Holdings, LLC2023-12-310001782524Promptcare Infusion Buyer, Inc. 12023-12-310001782524Promptcare Infusion Buyer, Inc. 22023-12-310001782524Stepping Stones Healthcare Services, LLC 12023-12-310001782524Stepping Stones Healthcare Services, LLC 22023-12-310001782524Stepping Stones Healthcare Services, LLC 32023-12-310001782524Suveto 12023-12-310001782524Suveto 22023-12-310001782524Tivity Health, Inc.2023-12-310001782524Vardiman Black Holdings, LLC 12023-12-310001782524Vardiman Black Holdings, LLC 22023-12-310001782524Vermont Aus Pty Ltd2023-12-310001782524msdlf:HealthCareProvidersServicesSectorMembermsdlf:DebtSecuritiesFirstLienMember2023-12-310001782524Hyland Software, Inc. 12023-12-310001782524Hyland Software, Inc. 22023-12-310001782524Lightspeed Buyer, Inc. 12023-12-310001782524Lightspeed Buyer, Inc. 22023-12-310001782524msdlf:HealthCareTechnologyMembermsdlf:DebtSecuritiesFirstLienMember2023-12-310001782524Excelitas Technologies Corp. 12023-12-310001782524Excelitas Technologies Corp. 22023-12-310001782524Excelitas Technologies Corp. 32023-12-310001782524Excelitas Technologies Corp. 42023-12-310001782524Raptor Merger Sub Debt, LLC 12023-12-310001782524Raptor Merger Sub Debt, LLC 22023-12-310001782524msdlf:DebtSecuritiesFirstLienMembermsdlf:IndustrialConglomeratesSectorMember2023-12-310001782524Amerilife Holdings, LLC 12023-12-310001782524Amerilife Holdings, LLC 22023-12-310001782524Amerilife Holdings, LLC 32023-12-310001782524Foundation Risk Partners Corp. 12023-12-310001782524Foundation Risk Partners Corp. 22023-12-310001782524Foundation Risk Partners Corp. 32023-12-310001782524Galway Borrower, LLC 12023-12-310001782524Galway Borrower, LLC 22023-12-310001782524Galway Borrower, LLC 32023-12-310001782524Higginbotham Insurance Agency, Inc. 12023-12-310001782524Higginbotham Insurance Agency, Inc. 22023-12-310001782524High Street Buyer, Inc. 12023-12-310001782524High Street Buyer, Inc. 22023-12-310001782524High Street Buyer, Inc. 32023-12-310001782524Long Term Care Group, Inc.2023-12-310001782524Inszone Mid, LLC 12023-12-310001782524Inszone Mid, LLC 22023-12-310001782524Inszone Mid, LLC 32023-12-310001782524Integrity Marketing Acquisition, LLC 12023-12-310001782524Integrity Marketing Acquisition, LLC 22023-12-310001782524Integrity Marketing Acquisition, LLC 32023-12-310001782524Keystone Agency Investors 12023-12-310001782524Keystone Agency Investors 22023-12-310001782524Majesco 12023-12-310001782524Majesco 22023-12-310001782524Patriot Growth Insurance Services, LLC 12023-12-310001782524Patriot Growth Insurance Services, LLC 22023-12-310001782524Peter C. Foy & Associates Insurance Services, LLC 12023-12-310001782524Peter C. Foy & Associates Insurance Services, LLC 22023-12-310001782524Peter C. Foy & Associates Insurance Services, LLC 32023-12-310001782524RSC Acquisition, Inc. 12023-12-310001782524RSC Acquisition, Inc. 22023-12-310001782524Summit Acquisition Inc2023-12-310001782524Summit Acquisition, Inc. 12023-12-310001782524Summit Acquisition, Inc. 22023-12-310001782524World Insurance Associates, LLC 12023-12-310001782524World Insurance Associates, LLC 22023-12-310001782524us-gaap:InsuranceSectorMembermsdlf:DebtSecuritiesFirstLienMember2023-12-310001782524FMG Suite Holdings, LLC 12023-12-310001782524FMG Suite Holdings, LLC 22023-12-310001782524FMG Suite Holdings, LLC 32023-12-310001782524Spectrio, LLC 12023-12-310001782524Spectrio, LLC 22023-12-310001782524Spectrio, LLC 32023-12-310001782524Triple Lift, Inc. 12023-12-310001782524Triple Lift, Inc. 22023-12-310001782524msdlf:InteractiveMediaAndServicesSectorMembermsdlf:DebtSecuritiesFirstLienMember2023-12-310001782524Atlas Purchaser, Inc.2023-12-310001782524Catalis Intermediate, Inc. 12023-12-310001782524Catalis Intermediate, Inc. 22023-12-310001782524Catalis Intermediate, Inc. 32023-12-310001782524Donuts, Inc.2023-12-310001782524Recovery Point Systems, Inc. 12023-12-310001782524Recovery Point Systems, Inc. 22023-12-310001782524Redwood Services Group, LLC 12023-12-310001782524Redwood Services Group, LLC 22023-12-310001782524Syntax Systems Ltd 12023-12-310001782524Syntax Systems Ltd 22023-12-310001782524Thrive Buyer, Inc. (Thrive Networks) 12023-12-310001782524Thrive Buyer, Inc. (Thrive Networks) 22023-12-310001782524Thrive Buyer, Inc. (Thrive Networks) 32023-12-310001782524UpStack, Inc. 12023-12-310001782524UpStack, Inc. 22023-12-310001782524UpStack, Inc. 32023-12-310001782524us-gaap:TechnologySectorMembermsdlf:DebtSecuritiesFirstLienMember2023-12-310001782524GSM Acquisition Corp. (GSM Outdoors) 12023-12-310001782524GSM Acquisition Corp. (GSM Outdoors) 22023-12-310001782524GSM Acquisition Corp. (GSM Outdoors) 32023-12-310001782524msdlf:LeisureProductsSectorMembermsdlf:DebtSecuritiesFirstLienMember2023-12-310001782524Answer Acquisition, LLC 12023-12-310001782524Answer Acquisition, LLC 22023-12-310001782524Chase Intermediate, LLC 12023-12-310001782524Chase Intermediate, LLC 22023-12-310001782524Komline Sanderson Engineering Corp. 12023-12-310001782524Komline Sanderson Engineering Corp. 22023-12-310001782524Komline Sanderson Engineering Corp. 32023-12-310001782524MHE Intermediate Holdings, LLC 12023-12-310001782524MHE Intermediate Holdings, LLC 22023-12-310001782524MHE Intermediate Holdings, LLC 32023-12-310001782524msdlf:DebtSecuritiesFirstLienMembermsdlf:MachinerySectorMember2023-12-310001782524AWP Group Holdings, Inc 12023-12-310001782524AWP Group Holdings, Inc 22023-12-310001782524AWP Group Holdings, Inc 32023-12-310001782524Ground Penetrating Radar Systems, LLC 12023-12-310001782524Ground Penetrating Radar Systems, LLC 22023-12-310001782524Vessco Midco Holdings, LLC 12023-12-310001782524Vessco Midco Holdings, LLC 22023-12-310001782524Vessco Midco Holdings, LLC 32023-12-310001782524msdlf:UtilitiesSectorMembermsdlf:DebtSecuritiesFirstLienMember2023-12-310001782524Caerus US 1, Inc. 12023-12-310001782524Caerus US 1, Inc. 22023-12-310001782524Caerus US 1, Inc. 32023-12-310001782524msdlf:PharmaceuticalsSectorMembermsdlf:DebtSecuritiesFirstLienMember2023-12-310001782524Abacus Data Holdings, Inc. (AbacusNext) 12023-12-310001782524Abacus Data Holdings, Inc. (AbacusNext) 22023-12-310001782524Abacus Data Holdings, Inc. (AbacusNext) 32023-12-310001782524Bridgepointe Technologies, LLC 12023-12-310001782524Bridgepointe Technologies, LLC 22023-12-310001782524Bullhorn, Inc. 12023-12-310001782524Bullhorn, Inc. 22023-12-310001782524Bullhorn, Inc. 32023-12-310001782524Citrin Cooperman Advisors, LLC 12023-12-310001782524Citrin Cooperman Advisors, LLC 22023-12-310001782524GPS Merger Sub, LLC 12023-12-310001782524GPS Merger Sub, LLC 22023-12-310001782524GPS Merger Sub, LLC 32023-12-310001782524KENG Acquisition, Inc 12023-12-310001782524KENG Acquisition, Inc 22023-12-310001782524KENG Acquisition, Inc 32023-12-310001782524KWOR Acquisition, Inc. 12023-12-310001782524KWOR Acquisition, Inc. 22023-12-310001782524KWOR Acquisition, Inc. 32023-12-310001782524Project Boost Purchaser, LLC 12023-12-310001782524Project Boost Purchaser, LLC 22023-12-310001782524Project Boost Purchaser, LLC 32023-12-310001782524msdlf:DebtSecuritiesFirstLienMembermsdlf:ProfessionalServicesSectorMember2023-12-310001782524Associations, Inc. 12023-12-310001782524Associations, Inc. 22023-12-310001782524Associations, Inc. 32023-12-310001782524MRI Software, LLC 12023-12-310001782524MRI Software, LLC 22023-12-310001782524MRI Software, LLC 32023-12-310001782524Pritchard Industries, LLC 12023-12-310001782524Pritchard Industries, LLC 22023-12-310001782524Zarya Intermediate, LLC 12023-12-310001782524Zarya Intermediate, LLC 22023-12-310001782524msdlf:DebtSecuritiesFirstLienMemberus-gaap:RealEstateSectorMember2023-12-310001782524Alert Media, Inc. 12023-12-310001782524Alert Media, Inc. 22023-12-310001782524Anaplan, Inc.2023-12-310001782524Appfire Technologies, LLC 12023-12-310001782524Appfire Technologies, LLC 22023-12-310001782524Appfire Technologies, LLC 32023-12-310001782524Bottomline Technologies, Inc. 12023-12-310001782524Bottomline Technologies, Inc. 22023-12-310001782524CLEO Communications Holding, LLC 12023-12-310001782524CLEO Communications Holding, LLC 22023-12-310001782524Coupa Holdings, LLC 12023-12-310001782524Coupa Holdings, LLC 22023-12-310001782524Coupa Holdings, LLC 32023-12-310001782524Cyara AcquisitionCo, LLC 12023-12-310001782524Cyara AcquisitionCo, LLC 22023-12-310001782524Diligent Corporation 12023-12-310001782524Diligent Corporation 22023-12-310001782524Diligent Corporation 32023-12-310001782524E-Discovery AcquireCo, LLC 12023-12-310001782524E-Discovery AcquireCo, LLC 22023-12-310001782524Fullsteam Operations, LLC 12023-12-310001782524Fullsteam Operations, LLC 22023-12-310001782524Fullsteam Operations, LLC 32023-12-310001782524GS AcquisitionCo, Inc. 12023-12-310001782524GS AcquisitionCo, Inc. 22023-12-310001782524Kaseya, Inc. 12023-12-310001782524Kaseya, Inc. 22023-12-310001782524Kaseya, Inc. 32023-12-310001782524LegitScript, LLC 12023-12-310001782524LegitScript, LLC 22023-12-310001782524LegitScript, LLC 32023-12-310001782524Matrix Parent, Inc. 12023-12-310001782524Montana Buyer, Inc. 12023-12-310001782524Montana Buyer, Inc. 22023-12-310001782524Netwrix Corporation And Concept Searching, Inc. 12023-12-310001782524Netwrix Corporation And Concept Searching, Inc. 22023-12-310001782524Netwrix Corporation And Concept Searching, Inc. 32023-12-310001782524Oak Purchaser, Inc. 12023-12-310001782524Oak Purchaser, Inc. 22023-12-310001782524Oak Purchaser, Inc. 32023-12-310001782524Pound Bidco, Inc. 12023-12-310001782524Pound Bidco, Inc. 22023-12-310001782524Pound Bidco, Inc. 32023-12-310001782524Project Leopard Holdings, Inc.2023-12-310001782524Revalize, Inc. 12023-12-310001782524Revalize, Inc. 22023-12-310001782524Riskonnect Parent, LLC 12023-12-310001782524Riskonnect Parent, LLC 22023-12-310001782524Securonix, Inc. 12023-12-310001782524Securonix, Inc. 22023-12-310001782524Skykick, Inc. 12023-12-310001782524Skykick, Inc. 22023-12-310001782524Trunk Acquisition, Inc. 12023-12-310001782524Trunk Acquisition, Inc. 22023-12-310001782524User Zoom Technologies, Inc.2023-12-310001782524msdlf:SoftwareSectorMembermsdlf:DebtSecuritiesFirstLienMember2023-12-310001782524Mobile Communications America, Inc. 12023-12-310001782524Mobile Communications America, Inc. 22023-12-310001782524Mobile Communications America, Inc. 42023-12-310001782524msdlf:WirelessTelecommunicationServicesSectorMembermsdlf:DebtSecuritiesFirstLienMember2023-12-310001782524msdlf:DebtSecuritiesFirstLienMember2023-12-310001782524Omni Intermediate Holdings, LLC 42023-12-310001782524PAI Holdco, Inc.2023-12-310001782524Infinite Bidco, LLC 22023-12-310001782524QBS Parent, Inc.2023-12-310001782524Heartland Veterinary Partners, LLC 42023-12-310001782524Heartland Veterinary Partners, LLC 52023-12-310001782524msdlf:DebtSecuritiesSecondLienMembermsdlf:HealthCareProvidersServicesSectorMember2023-12-310001782524Aptean, Inc.2023-12-310001782524Help/Systems Holdings, Inc.2023-12-310001782524Idera, Inc.2023-12-310001782524Red Dawn SEI Buyer, Inc.2023-12-310001782524msdlf:DebtSecuritiesSecondLienMemberus-gaap:TechnologySectorMember2023-12-310001782524Flexera Software, LLC2023-12-310001782524Matrix Parent, Inc. 22023-12-310001782524msdlf:DebtSecuritiesSecondLienMembermsdlf:SoftwareSectorMember2023-12-310001782524msdlf:DebtSecuritiesSecondLienMember2023-12-310001782524Familia Intermediate Holdings I Corp. (Teasdale Latin Foods)2023-12-310001782524Fetch Insurance Services, LLC2023-12-310001782524msdlf:OtherSecurityInvestmentsUnsecuredDebtMember2023-12-310001782524Diligent Corporation2023-12-310001782524FORTIS Solutions Group, LLC2023-12-310001782524Integrity Marketing Acquisition, LLC2023-12-310001782524Knockout Intermediate Holdings I, Inc.2023-12-310001782524Revalize, Inc.2023-12-310001782524RSK Holdings, Inc. (Riskonnect)2023-12-310001782524Skykick, Inc.2023-12-310001782524msdlf:OtherSecurityInvestmentsPreferredEquityMember2023-12-310001782524Abacus Data Holdings, Inc. (AbacusNext)2023-12-310001782524Amerilife Holdings, LLC2023-12-310001782524BP Purchaser, LLC, Common Equity2023-12-310001782524CSC Thrive Holdings, LP (Thrive Networks)2023-12-310001782524Encore Holdings, LLC2023-12-310001782524Frisbee Holdings, LP (Fetch)2023-12-310001782524Fullsteam Operations, LLC2023-12-310001782524GSM Equity Investors, LP (GSM Outdoors)2023-12-310001782524Help HP SCF Investor, LP (Help/Systems)2023-12-310001782524LUV Car Wash2023-12-310001782524mPulse Mobile, Inc.2023-12-310001782524PCX Holding Corp.2023-12-310001782524Pet Holdings, Inc. (Brightpet)2023-12-310001782524Pritchard Industries, Inc.2023-12-310001782524Procure Acquiom Financial, LLC (Procure Analytics)2023-12-310001782524Recovery Point Systems, Inc.2023-12-310001782524Reveal Data Solutions2023-12-310001782524Shelby Co-invest, LP. (Spectrum Automotive)2023-12-310001782524Surewerx Topco, LP2023-12-310001782524Suveto Buyer, LLC2023-12-310001782524msdlf:OtherSecurityInvestmentsCommonEquityMember2023-12-310001782524us-gaap:OtherAggregatedInvestmentsMember2023-12-310001782524Total Portfolio Investments2023-12-310001782524msdlf:EuroInterbankOfferedRateEURIBORMember2023-12-310001782524msdlf:InterestRatePeriodOneMembermsdlf:SecuredOvernightFinancingRateSOFRMember2023-12-310001782524msdlf:SecuredOvernightFinancingRateSOFRMembermsdlf:InterestRatePeriodTwoMember2023-12-310001782524msdlf:InterestRatePeriodThreeMembermsdlf:SecuredOvernightFinancingRateSOFRMember2023-12-310001782524us-gaap:PrimeRateMember2023-12-310001782524Investment One2023-12-310001782524Investment Two2023-12-310001782524Investment Three2023-12-310001782524us-gaap:CustomerConcentrationRiskMembermsdlf:NonQualifyingAssetsMemberus-gaap:AssetsTotalMember2023-01-012023-12-310001782524msdlf:RestrictedSecuritiesMember2023-12-310001782524365 Retail Market, LLC2023-12-31000178252448Forty Solutions, LLC2023-12-310001782524AMCP Pet Holdings, Inc. (Brightpet)2023-12-310001782524ARI Network Services, Inc.2023-12-310001782524Abracon Group Holdings, LLC2023-12-310001782524Advarra Holdings, Inc.2023-12-310001782524Alert Media, Inc.2023-12-310001782524Answer Acquisition, LLC2023-12-310001782524Applitools, Inc.2023-12-310001782524Atlas Us Finco, Inc.2023-12-310001782524Avalara, Inc.2023-12-310001782524Bottomline Technologies, Inc.2023-12-310001782524Bridgepointe Technologies, LLC2023-12-310001782524Bullhorn, Inc.2023-12-310001782524CLEO Communications Holding, LLC2023-12-310001782524Catalis Intermediate, Inc.2023-12-310001782524Citrin Cooperman Advisors, LLC2023-12-310001782524Cyara AcquisitionCo, LLC2023-12-310001782524E-Discovery AcquireCo, LLC2023-12-310001782524Energy Labs Holdings Corp.2023-12-310001782524FLS Holding, Inc.2023-12-310001782524FMG Suite Holdings, LLC2023-12-310001782524Foundation Risk Partners Corp.2023-12-310001782524GS AcquisitionCo, Inc.2023-12-310001782524GSM Acquisition Corp. (GSM Outdoors)2023-12-310001782524Gateway US Holdings, Inc.2023-12-310001782524GraphPad Software, LLC2023-12-310001782524Ground Penetrating Radar Systems, LLC2023-12-310001782524Heartland Veterinary Partners, LLC2023-12-310001782524Higginbotham Insurance Agency, Inc.2023-12-310001782524High Street Buyer, Inc.2023-12-310001782524Hyland Software, Inc.2023-12-310001782524MRI Software, LLC2023-12-310001782524Lightspeed Solution, LLC2023-12-310001782524MHE Intermediate Holdings, LLC2023-12-310001782524Magnolia Wash Holdings2023-12-310001782524Majesco2023-12-310001782524Montana Buyer, Inc.2023-12-310001782524PDFTron Systems, Inc.2023-12-310001782524Pareto Health Intermediate Holdings, Inc.2023-12-310001782524Patriot Growth Insurance Services, LLC2023-12-310001782524Pound Bidco, Inc.2023-12-310001782524Pound Bidco, Inc 22023-12-310001782524RSC Acquisition, Inc.2023-12-310001782524Raptor Merger Sub Debt, LLC2023-12-310001782524Redwood Services Group, LLC2023-12-310001782524Riskonnect Parent, LLC2023-12-310001782524Securonix, Inc.2023-12-310001782524Spectrio, LLC2023-12-310001782524Spotless Brands, LLC2023-12-310001782524Superman Holdings, LLC2023-12-310001782524Suveto2023-12-310001782524Thrive Buyer, Inc. (Thrive Networks)2023-12-310001782524Trintech, Inc.2023-12-310001782524Triple Lift, Inc.2023-12-310001782524Trunk Acquisition, Inc.2023-12-310001782524V Global Holdings, LLC2023-12-310001782524Vessco Midco Holdings, LLC2023-12-310001782524World Insurance Associates, LLC2023-12-310001782524Zarya Intermediate, LLC2023-12-310001782524mPulse Mobile, Inc. 2023-12-310001782524msdlf:UnfundedDebtSecuritiesFirstLienMember2023-12-310001782524msdlf:DelayedDrawAndRevolvingSeniorSecuredLoansMember2023-12-310001782524msdlf:UnfundedDebtSecuritiesMember2023-12-310001782524Jonathan Acquisition Company2022-12-310001782524Mantech International CP 12022-12-310001782524Mantech International CP 22022-12-310001782524Mantech International CP 32022-12-310001782524PCX Holding Corp. 12022-12-310001782524PCX Holding Corp. 22022-12-310001782524PCX Holding Corp. 32022-12-310001782524Two Six Labs, LLC 12022-12-310001782524Two Six Labs, LLC 22022-12-310001782524Two Six Labs, LLC 32022-12-310001782524msdlf:DebtSecuritiesFirstLienMemberus-gaap:AerospaceSectorMember2022-12-310001782524AGI-CFI Holdings, Inc.2022-12-310001782524Omni Intermediate Holdings, LLC 12022-12-310001782524Omni Intermediate Holdings, LLC 22022-12-310001782524Omni Intermediate Holdings, LLC 32022-12-310001782524Omni Intermediate Holdings, LLC 42022-12-310001782524RoadOne IntermodaLogistics 12022-12-310001782524RoadOne IntermodaLogistics 22022-12-310001782524RoadOne IntermodaLogistics 32022-12-310001782524msdlf:AirFreightAndLogisticsSectorMembermsdlf:DebtSecuritiesFirstLienMember2022-12-310001782524Continental Battery Company2022-12-310001782524Randy's Holdings, Inc. 12022-12-310001782524Randy's Holdings, Inc. 22022-12-310001782524Randy's Holdings, Inc. 32022-12-310001782524Sonny's Enterprises, LLC 12022-12-310001782524Sonny's Enterprises, LLC 22022-12-310001782524Spectrum Automotive Holdings Corp. 12022-12-310001782524Spectrum Automotive Holdings Corp. 22022-12-310001782524Spectrum Automotive Holdings Corp. 32022-12-310001782524msdlf:AutoComponentsSectorMembermsdlf:DebtSecuritiesFirstLienMember2022-12-310001782524ARI Network Services, Inc. 12022-12-310001782524ARI Network Services, Inc. 22022-12-310001782524ARI Network Services, Inc. 32022-12-310001782524Summit Buyer, LLC 12022-12-310001782524Summit Buyer, LLC 22022-12-310001782524Summit Buyer, LLC 32022-12-310001782524Turbo Buyer, Inc. 12022-12-310001782524Turbo Buyer, Inc. 22022-12-310001782524msdlf:AutomobilesSectorMembermsdlf:DebtSecuritiesFirstLienMember2022-12-310001782524GraphPad Software, LLC 12022-12-310001782524GraphPad Software, LLC 22022-12-310001782524GraphPad Software, LLC 32022-12-310001782524msdlf:BiotechnologySectorMembermsdlf:DebtSecuritiesFirstLienMember2022-12-310001782524Tank Holding Corp. 12022-12-310001782524Tank Holding Corp. 22022-12-310001782524V Global Holdings, LLC 12022-12-310001782524V Global Holdings, LLC 22022-12-310001782524us-gaap:ChemicalsSectorMembermsdlf:DebtSecuritiesFirstLienMember2022-12-310001782524365 Retail Markets, LLC 12022-12-310001782524365 Retail Markets, LLC 22022-12-310001782524365 Retail Markets, LLC 32022-12-310001782524Atlas Us Finco, Inc. 12022-12-310001782524Atlas Us Finco, Inc. 22022-12-310001782524BPG Holdings IV Corp.2022-12-310001782524Encore Holdings, LLC 12022-12-310001782524Encore Holdings, LLC 22022-12-310001782524Encore Holdings, LLC 32022-12-310001782524FLS Holding, Inc. 12022-12-310001782524FLS Holding, Inc. 22022-12-310001782524FLS Holding, Inc. 32022-12-310001782524PDFTron Systems, Inc. 12022-12-310001782524PDFTron Systems, Inc. 22022-12-310001782524PDFTron Systems, Inc. 32022-12-310001782524Procure Acquireco, Inc. (Procure Analytics) 12022-12-310001782524Procure Acquireco, Inc. (Procure Analytics) 22022-12-310001782524Procure Acquireco, Inc. (Procure Analytics) 32022-12-310001782524QW Holding Corporation 12022-12-310001782524QW Holding Corporation 22022-12-310001782524QW Holding Corporation 32022-12-310001782524Sherlock Buyer Corp. 12022-12-310001782524Sherlock Buyer Corp. 22022-12-310001782524Sherlock Buyer Corp. 32022-12-310001782524Surewerx Purchaser III, Inc. 12022-12-310001782524Surewerx Purchaser III, Inc. 22022-12-310001782524Surewerx Purchaser III, Inc. 32022-12-310001782524Sweep Purchaser, LLC 12022-12-310001782524Sweep Purchaser, LLC 22022-12-310001782524Sweep Purchaser, LLC 32022-12-310001782524Tamarack Intermediate, LLC 12022-12-310001782524Tamarack Intermediate, LLC 22022-12-310001782524United Flow Technologies Intermediate Holdco II, LLC 12022-12-310001782524United Flow Technologies Intermediate Holdco II, LLC 22022-12-310001782524United Flow Technologies Intermediate Holdco II, LLC 32022-12-310001782524US Infra Svcs Buyer, LLC 12022-12-310001782524US Infra Svcs Buyer, LLC 22022-12-310001782524US Infra Svcs Buyer, LLC 32022-12-310001782524Valcourt Holdings II, LLC 12022-12-310001782524Valcourt Holdings II, LLC 22022-12-310001782524Valcourt Holdings II, LLC 32022-12-310001782524VRC Companies, LLC 12022-12-310001782524VRC Companies, LLC 22022-12-310001782524VRC Companies, LLC 32022-12-310001782524VRC Companies, LLC 42022-12-310001782524VRC Companies, LLC 52022-12-310001782524msdlf:DebtSecuritiesFirstLienMembermsdlf:CommercialServicesAndSuppliesSectorMember2022-12-310001782524KPSKY Acquisition, Inc. 12022-12-310001782524KPSKY Acquisition, Inc. 22022-12-310001782524msdlf:ConstructionAndEngineeringSectorMembermsdlf:DebtSecuritiesFirstLienMember2022-12-310001782524BP Purchaser, LLC2022-12-310001782524Fortis Solutions Group, LLC 12022-12-310001782524Fortis Solutions Group, LLC 22022-12-310001782524Fortis Solutions Group, LLC 32022-12-310001782524Fortis Solutions Group, LLC 42022-12-310001782524us-gaap:ContainerAndPackagingSectorMembermsdlf:DebtSecuritiesFirstLienMember2022-12-31000178252448Forty Solutions LLC 12022-12-31000178252448Forty Solutions LLC 22022-12-31000178252448Forty Solutions LLC 32022-12-310001782524ABB Concise Optical Group, LLC 12022-12-310001782524ABB Concise Optical Group, LLC 22022-12-310001782524Avalara, Inc. 12022-12-310001782524Avalara, Inc. 22022-12-310001782524PT Intermediate Holdings III, LLC 12022-12-310001782524PT Intermediate Holdings III, LLC 22022-12-310001782524Radwell Parent, LLC 12022-12-310001782524Radwell Parent, LLC 22022-12-310001782524msdlf:DebtSecuritiesFirstLienMembermsdlf:DistributorsSectorMember2022-12-310001782524Assembly Intermediate, LLC 12022-12-310001782524Assembly Intermediate, LLC 22022-12-310001782524Assembly Intermediate, LLC 32022-12-310001782524FPG Intermediate Holdco, LLC2022-12-310001782524Heartland Home Services, Inc.2022-12-310001782524Lightspeed Solution, LLC 12022-12-310001782524Lightspeed Solution, LLC 22022-12-310001782524LUV Car Wash Group, LLC 12022-12-310001782524LUV Car Wash Group, LLC 22022-12-310001782524Magnolia Wash Holdings 12022-12-310001782524Magnolia Wash Holdings 22022-12-310001782524Magnolia Wash Holdings 32022-12-310001782524Mammoth Holdings, LLC 12022-12-310001782524Mammoth Holdings, LLC 22022-12-310001782524Mammoth Holdings, LLC 32022-12-310001782524Spotless Brands, LLC 12022-12-310001782524Spotless Brands, LLC 22022-12-310001782524Spotless Brands, LLC 32022-12-310001782524msdlf:DebtSecuritiesFirstLienMemberus-gaap:ConsumerSectorMember2022-12-310001782524Applitools, Inc. 12022-12-310001782524Applitools, Inc. 22022-12-310001782524Cerity Partners, LLC 12022-12-310001782524Cerity Partners, LLC 22022-12-310001782524SitusAMC Holdings Corp.2022-12-310001782524Smarsh, Inc. 12022-12-310001782524Smarsh, Inc. 22022-12-310001782524Smarsh, Inc. 32022-12-310001782524us-gaap:FinancialServicesSectorMembermsdlf:DebtSecuritiesFirstLienMember2022-12-310001782524Abracon Group Holdings, LLC 12022-12-310001782524Abracon Group Holdings, LLC 22022-12-310001782524Abracon Group Holdings, LLC 32022-12-310001782524Dwyer Instruments, Inc. 12022-12-310001782524Dwyer Instruments, Inc. 22022-12-310001782524Dwyer Instruments, Inc. 32022-12-310001782524msdlf:ElectronicEquipmentInstrumentsAndComponentsSectorMembermsdlf:DebtSecuritiesFirstLienMember2022-12-310001782524AMCP Pet Holdings, Inc. (Brightpet) 12022-12-310001782524AMCP Pet Holdings, Inc. (Brightpet) 22022-12-310001782524AMCP Pet Holdings, Inc. (Brightpet) 32022-12-310001782524Nellson Nutraceutical, Inc.2022-12-310001782524Teasdale Foods, Inc. (Teasdale Latin Foods)2022-12-310001782524us-gaap:FoodAndBeverageSectorMembermsdlf:DebtSecuritiesFirstLienMember2022-12-310001782524Performance Health & Wellness2022-12-310001782524Advarra Holdings, Inc. 12022-12-310001782524Advarra Holdings, Inc. 22022-12-310001782524DCA Investment Holdings, LLC 12022-12-310001782524DCA Investment Holdings, LLC 22022-12-310001782524Gateway US Holdings, Inc. 12022-12-310001782524Gateway US Holdings, Inc. 22022-12-310001782524Gateway US Holdings, Inc. 32022-12-310001782524Heartland Veterinary Partners, LLC 12022-12-310001782524Heartland Veterinary Partners, LLC 22022-12-310001782524Heartland Veterinary Partners, LLC 32022-12-310001782524iCIMS, Inc.2022-12-310001782524Intelerad Medical Systems Incorporated2022-12-310001782524mPulse Mobile, Inc. 12022-12-310001782524mPulse Mobile, Inc. 22022-12-310001782524mPulse Mobile, Inc. 32022-12-310001782524Promptcare Infusion Buyer, Inc. 12022-12-310001782524Promptcare Infusion Buyer, Inc. 22022-12-310001782524Southern Veterinary Partners, LLC2022-12-310001782524Stepping Stones Healthcare Services, LLC 12022-12-310001782524Stepping Stones Healthcare Services, LLC 22022-12-310001782524Stepping Stones Healthcare Services, LLC 32022-12-310001782524Suveto 12022-12-310001782524Suveto 22022-12-310001782524Tivity Health, Inc.2022-12-310001782524Vardiman Black Holdings, LLC 12022-12-310001782524Vardiman Black Holdings, LLC 22022-12-310001782524Vermont Aus Pty Ltd2022-12-310001782524msdlf:HealthCareProvidersServicesSectorMembermsdlf:DebtSecuritiesFirstLienMember2022-12-310001782524Lightspeed Buyer, Inc. 12022-12-310001782524Lightspeed Buyer, Inc. 22022-12-310001782524Lightspeed Buyer, Inc. 32022-12-310001782524msdlf:HealthCareTechnologyMembermsdlf:DebtSecuritiesFirstLienMember2022-12-310001782524Excelitas Technologies Corp. 12022-12-310001782524Excelitas Technologies Corp. 22022-12-310001782524Excelitas Technologies Corp. 32022-12-310001782524Excelitas Technologies Corp. 42022-12-310001782524msdlf:DebtSecuritiesFirstLienMembermsdlf:IndustrialConglomeratesSectorMember2022-12-310001782524Amerilife Holdings, LLC 12022-12-310001782524Amerilife Holdings, LLC 22022-12-310001782524Amerilife Holdings, LLC 32022-12-310001782524Foundation Risk Partners Corp. 12022-12-310001782524Foundation Risk Partners Corp. 22022-12-310001782524Foundation Risk Partners Corp. 32022-12-310001782524Galway Borrower, LLC 12022-12-310001782524Galway Borrower, LLC 22022-12-310001782524Galway Borrower, LLC 32022-12-310001782524Higginbotham Insurance Agency, Inc.2022-12-310001782524High Street Buyer, Inc. 12022-12-310001782524High Street Buyer, Inc. 22022-12-310001782524High Street Buyer, Inc. 32022-12-310001782524Integrity Marketing Acquisition, LLC 12022-12-310001782524Integrity Marketing Acquisition, LLC 22022-12-310001782524Integrity Marketing Acquisition, LLC 32022-12-310001782524Keystone Agency Investors 12022-12-310001782524Keystone Agency Investors 22022-12-310001782524Majesco 12022-12-310001782524Majesco 22022-12-310001782524Oakbridge Insurance Agency, LLC 12022-12-310001782524Oakbridge Insurance Agency, LLC 22022-12-310001782524Oakbridge Insurance Agency, LLC 32022-12-310001782524Patriot Growth Insurance Services, LLC 12022-12-310001782524Patriot Growth Insurance Services, LLC 22022-12-310001782524Patriot Growth Insurance Services, LLC 32022-12-310001782524Peter C. Foy & Associates Insurance Services, LLC 12022-12-310001782524Peter C. Foy & Associates Insurance Services, LLC 22022-12-310001782524Peter C. Foy & Associates Insurance Services, LLC 32022-12-310001782524Peter C. Foy & Associates Insurance Services, LLC 42022-12-310001782524Peter C. Foy & Associates Insurance Services, LLC 52022-12-310001782524RSC Acquisition, Inc. 12022-12-310001782524RSC Acquisition, Inc. 22022-12-310001782524World Insurance Associates, LLC 12022-12-310001782524World Insurance Associates, LLC 22022-12-310001782524World Insurance Associates, LLC 32022-12-310001782524us-gaap:InsuranceSectorMembermsdlf:DebtSecuritiesFirstLienMember2022-12-310001782524FMG Suite Holdings, LLC 12022-12-310001782524FMG Suite Holdings, LLC 22022-12-310001782524FMG Suite Holdings, LLC 32022-12-310001782524MSM Acquisitions, Inc. 12022-12-310001782524MSM Acquisitions, Inc. 22022-12-310001782524MSM Acquisitions, Inc. 32022-12-310001782524Triple Lift, Inc. 12022-12-310001782524Triple Lift, Inc. 22022-12-310001782524msdlf:InteractiveMediaAndServicesSectorMembermsdlf:DebtSecuritiesFirstLienMember2022-12-310001782524Atlas Purchaser, Inc.2022-12-310001782524Donuts, Inc. 12022-12-310001782524Donuts, Inc. 22022-12-310001782524Donuts, Inc. 32022-12-310001782524Govbrands Intermediate, Inc. 12022-12-310001782524Govbrands Intermediate, Inc. 22022-12-310001782524Govbrands Intermediate, Inc. 32022-12-310001782524Long Term Care Group, Inc.2022-12-310001782524Recovery Point Systems, Inc. 12022-12-310001782524Recovery Point Systems, Inc. 22022-12-310001782524Redwood Services Group, LLC 12022-12-310001782524Redwood Services Group, LLC 22022-12-310001782524Syntax Systems Ltd 12022-12-310001782524Syntax Systems Ltd 22022-12-310001782524Syntax Systems Ltd 32022-12-310001782524Thrive Buyer, Inc. (Thrive Networks) 12022-12-310001782524Thrive Buyer, Inc. (Thrive Networks) 22022-12-310001782524Thrive Buyer, Inc. (Thrive Networks) 32022-12-310001782524UpStack, Inc. 12022-12-310001782524UpStack, Inc. 22022-12-310001782524UpStack, Inc. 32022-12-310001782524us-gaap:TechnologySectorMembermsdlf:DebtSecuritiesFirstLienMember2022-12-310001782524GSM Acquisition Corp. (GSM Outdoors) 12022-12-310001782524GSM Acquisition Corp. (GSM Outdoors) 22022-12-310001782524GSM Acquisition Corp. (GSM Outdoors) 32022-12-310001782524msdlf:LeisureProductsSectorMembermsdlf:DebtSecuritiesFirstLienMember2022-12-310001782524Answer Acquisition, LLC 12022-12-310001782524Answer Acquisition, LLC 22022-12-310001782524Komline Sanderson Engineering Corp. 12022-12-310001782524Komline Sanderson Engineering Corp. 22022-12-310001782524Komline Sanderson Engineering Corp. 32022-12-310001782524Komline Sanderson Engineering Corp. 42022-12-310001782524Komline Sanderson Engineering Corp. 52022-12-310001782524MHE Intermediate Holdings, LLC 12022-12-310001782524MHE Intermediate Holdings, LLC 22022-12-310001782524MHE Intermediate Holdings, LLC 32022-12-310001782524MHE Intermediate Holdings, LLC 42022-12-310001782524MHE Intermediate Holdings, LLC 52022-12-310001782524msdlf:DebtSecuritiesFirstLienMembermsdlf:MachinerySectorMember2022-12-310001782524AWP Group Holdings, Inc. 12022-12-310001782524AWP Group Holdings, Inc. 22022-12-310001782524AWP Group Holdings, Inc. 32022-12-310001782524Ground Penetrating Radar Systems, LLC 12022-12-310001782524Ground Penetrating Radar Systems, LLC 22022-12-310001782524Vessco Midco Holdings, LLC 12022-12-310001782524Vessco Midco Holdings, LLC 22022-12-310001782524Vessco Midco Holdings, LLC 32022-12-310001782524msdlf:UtilitiesSectorMembermsdlf:DebtSecuritiesFirstLienMember2022-12-310001782524Energy Labs Holdings Corp. 12022-12-310001782524Energy Labs Holdings Corp. 22022-12-310001782524Energy Labs Holdings Corp. 32022-12-310001782524msdlf:DebtSecuritiesFirstLienMembermsdlf:OilGasAndConsumableFuelsSectorMember2022-12-310001782524Caerus US 1, Inc. 12022-12-310001782524Caerus US 1, Inc. 22022-12-310001782524Caerus US 1, Inc. 32022-12-310001782524msdlf:PharmaceuticalsSectorMembermsdlf:DebtSecuritiesFirstLienMember2022-12-310001782524Abacus Data Holdings, Inc. (AbacusNext) 12022-12-310001782524Abacus Data Holdings, Inc. (AbacusNext) 22022-12-310001782524Abacus Data Holdings, Inc. (AbacusNext) 32022-12-310001782524Bridgepointe Technologies, LLC 12022-12-310001782524Bridgepointe Technologies, LLC 22022-12-310001782524Bullhorn, Inc. 12022-12-310001782524Bullhorn, Inc. 22022-12-310001782524Bullhorn, Inc. 32022-12-310001782524Citrin Cooperman Advisors, LLC 12022-12-310001782524Citrin Cooperman Advisors, LLC 22022-12-310001782524KWOR Acquisition, Inc. 12022-12-310001782524KWOR Acquisition, Inc. 22022-12-310001782524KWOR Acquisition, Inc. 32022-12-310001782524Project Boost Purchaser, LLC 12022-12-310001782524Project Boost Purchaser, LLC 22022-12-310001782524Project Boost Purchaser, LLC 32022-12-310001782524msdlf:DebtSecuritiesFirstLienMembermsdlf:ProfessionalServicesSectorMember2022-12-310001782524Associations, Inc. 12022-12-310001782524Associations, Inc. 22022-12-310001782524Associations, Inc. 32022-12-310001782524MRI Software, LLC 12022-12-310001782524MRI Software, LLC 22022-12-310001782524Pritchard Industries, LLC 12022-12-310001782524Pritchard Industries, LLC 22022-12-310001782524Zarya Intermediate, LLC 12022-12-310001782524Zarya Intermediate, LLC 22022-12-310001782524msdlf:DebtSecuritiesFirstLienMemberus-gaap:RealEstateSectorMember2022-12-310001782524Alert Media, Inc. 12022-12-310001782524Alert Media, Inc. 22022-12-310001782524Anaplan, Inc.2022-12-310001782524Appfire Technologies, LLC 12022-12-310001782524Appfire Technologies, LLC 22022-12-310001782524Appfire Technologies, LLC 32022-12-310001782524Bottomline Technologies, Inc. 12022-12-310001782524Bottomline Technologies, Inc. 22022-12-310001782524CLEO Communications Holding, LLC 12022-12-310001782524CLEO Communications Holding, LLC 22022-12-310001782524Diligent Corporation 12022-12-310001782524Diligent Corporation 22022-12-310001782524Diligent Corporation 32022-12-310001782524GS AcquisitionCo, Inc. 12022-12-310001782524GS AcquisitionCo, Inc. 22022-12-310001782524GS AcquisitionCo, Inc. 32022-12-310001782524Gurobi Optimization, LLC 12022-12-310001782524Gurobi Optimization, LLC 22022-12-310001782524Kaseya, Inc. 12022-12-310001782524Kaseya, Inc. 22022-12-310001782524Kaseya, Inc. 32022-12-310001782524LegitScript 12022-12-310001782524LegitScript 22022-12-310001782524LegitScript 32022-12-310001782524Montana Buyer, Inc. 12022-12-310001782524Montana Buyer, Inc. 22022-12-310001782524Netwrix Corporation And Concept Searching, Inc. 12022-12-310001782524Netwrix Corporation And Concept Searching, Inc. 22022-12-310001782524Netwrix Corporation And Concept Searching, Inc. 32022-12-310001782524Oak Purchaser, Inc. 12022-12-310001782524Oak Purchaser, Inc. 22022-12-310001782524Oak Purchaser, Inc. 32022-12-310001782524Pound Bidco, Inc. 12022-12-310001782524Pound Bidco, Inc. 22022-12-310001782524Project Leopard Holdings, Inc.2022-12-310001782524Revalize, Inc. 12022-12-310001782524Revalize, Inc. 22022-12-310001782524Riskonnect Parent, LLC 12022-12-310001782524Riskonnect Parent, LLC 22022-12-310001782524Securonix, Inc. 12022-12-310001782524Securonix, Inc. 22022-12-310001782524Skykick, Inc. 12022-12-310001782524Skykick, Inc. 22022-12-310001782524Trunk Acquisition, Inc. 12022-12-310001782524Trunk Acquisition, Inc. 22022-12-310001782524User Zoom Technologies, Inc.2022-12-310001782524msdlf:SoftwareSectorMembermsdlf:DebtSecuritiesFirstLienMember2022-12-310001782524msdlf:DebtSecuritiesFirstLienMember2022-12-310001782524Omni Intermediate Holdings, LLC2022-12-310001782524PAI Holdco, Inc.2022-12-310001782524Infinite Bidco, LLC 12022-12-310001782524Infinite Bidco, LLC 22022-12-310001782524msdlf:DebtSecuritiesSecondLienMembermsdlf:ElectronicEquipmentInstrumentsAndComponentsSectorMember2022-12-310001782524QBS Parent, Inc.2022-12-310001782524Heartland Veterinary Partners, LLC 42022-12-310001782524Heartland Veterinary Partners, LLC 52022-12-310001782524msdlf:DebtSecuritiesSecondLienMembermsdlf:HealthCareProvidersServicesSectorMember2022-12-310001782524Aptean, Inc.2022-12-310001782524Help/Systems Holdings, Inc.2022-12-310001782524Idera, Inc.2022-12-310001782524Red Dawn SEI Buyer, Inc.2022-12-310001782524msdlf:DebtSecuritiesSecondLienMemberus-gaap:TechnologySectorMember2022-12-310001782524Flexera Software, LLC2022-12-310001782524Matrix Parent, Inc.2022-12-310001782524msdlf:DebtSecuritiesSecondLienMembermsdlf:SoftwareSectorMember2022-12-310001782524msdlf:DebtSecuritiesSecondLienMember2022-12-310001782524Familia Intermediate Holdings I Corp. (Teasdale Latin Foods)2022-12-310001782524Fetch Insurance Services, LLC (Fetch)2022-12-310001782524msdlf:OtherSecurityInvestmentsUnsecuredDebtMember2022-12-310001782524Diligent Corporation2022-12-310001782524Fortis Solutions Group, LLC2022-12-310001782524Integrity Marketing Acquisition, LLC2022-12-310001782524Knockout Intermediate Holdings I, Inc.2022-12-310001782524Revalize, Inc.2022-12-310001782524RSK Holdings, Inc. (Riskonnect)2022-12-310001782524Skykick, Inc.2022-12-310001782524msdlf:OtherSecurityInvestmentsPreferredEquityMember2022-12-310001782524Abacus Data Holdings, Inc. (AbacusNext)2022-12-310001782524Amerilife Holdings, LLC2022-12-310001782524BP Purchaser, LLC 22022-12-310001782524CSC Thrive Holdings, LP (Thrive Networks)2022-12-310001782524Encore Holdings, LLC2022-12-310001782524Frisbee Holding, LP (Fetch)2022-12-310001782524GSM Equity Investors, LP (GSM Outdoors)2022-12-310001782524Help HP SCF Investor, LP (Help/Systems)2022-12-310001782524LUV Car Wash Holdings, LLC2022-12-310001782524mPulse Mobile, Inc.2022-12-310001782524PCX Holding Corp.2022-12-310001782524Pet Holdings, Inc. (Brightpet)2022-12-310001782524Pritchard Industries, Inc.2022-12-310001782524Procure Acquiom Financial, LLC (Procure Analytics)2022-12-310001782524Recovery Point Systems, Inc.2022-12-310001782524Shelby Co-invest, LP (Spectrum Automotive)2022-12-310001782524Surewerx Topco, LP2022-12-310001782524Suveto Co-Invest, LP2022-12-310001782524msdlf:OtherSecurityInvestmentsCommonEquityMember2022-12-310001782524us-gaap:OtherAggregatedInvestmentsMember2022-12-310001782524msdlf:EuroInterbankOfferedRateEURIBORMember2022-12-310001782524msdlf:LondonInterbankOfferedRateMembermsdlf:InterestRatePeriodOneMember2022-12-310001782524msdlf:LondonInterbankOfferedRateMembermsdlf:InterestRatePeriodTwoMember2022-12-310001782524msdlf:LondonInterbankOfferedRateMembermsdlf:InterestRatePeriodThreeMember2022-12-310001782524msdlf:InterestRatePeriodOneMembermsdlf:SecuredOvernightFinancingRateSOFRMember2022-12-310001782524msdlf:SecuredOvernightFinancingRateSOFRMembermsdlf:InterestRatePeriodTwoMember2022-12-310001782524msdlf:InterestRatePeriodThreeMembermsdlf:SecuredOvernightFinancingRateSOFRMember2022-12-310001782524us-gaap:PrimeRateMember2022-12-310001782524Investment One2022-12-310001782524Investment Two2022-12-310001782524Investment Three2022-12-310001782524us-gaap:CustomerConcentrationRiskMembermsdlf:NonQualifyingAssetsMemberus-gaap:AssetsTotalMember2022-01-012022-12-310001782524msdlf:RestrictedSecuritiesMember2022-12-310001782524365 Retail Markets, LLC2022-12-31000178252448Forty Solutions LLC2022-12-310001782524ABB Concise Optical Group, LLC2022-12-310001782524ARI Network Services, Inc.2022-12-310001782524AWP Group Holdings, Inc.2022-12-310001782524Advarra Holdings, Inc.2022-12-310001782524Alert Media, Inc.2022-12-310001782524Answer Acquisition, LLC2022-12-310001782524Applitools, Inc.2022-12-310001782524Atlas Us Finco, Inc.2022-12-310001782524Avalara, Inc.2022-12-310001782524Bottomline Technologies, Inc.2022-12-310001782524Bridgepointe Technologies, LLC2022-12-310001782524Bullhorn, Inc.2022-12-310001782524CLEO Communications Holding, LLC2022-12-310001782524Cerity Partners, LLC2022-12-310001782524DCA Investment Holdings, LLC2022-12-310001782524Donuts, Inc.2022-12-310001782524FLS Holding, Inc.2022-12-310001782524FMG Suite Holdings, LLC2022-12-310001782524Foundation Risk Partners Corp.2022-12-310001782524GS AcquisitionCo, Inc.2022-12-310001782524GSM Acquisition Corp.2022-12-310001782524GraphPad Software, LLC2022-12-310001782524Ground Penetrating Radar Systems, LLC2022-12-310001782524Gurobi Optimization, LLC2022-12-310001782524High Street Buyer, Inc.2022-12-310001782524KPSKY Acquisition, Inc.2022-12-310001782524LUV Car Wash Group, LLC2022-12-310001782524Lightspeed Buyer, Inc.2022-12-310001782524Lightspeed Solution, LLC2022-12-310001782524MHE Intermediate Holdings, LLC2022-12-310001782524MRI Software, LLC2022-12-310001782524Magnolia Wash Holdings2022-12-310001782524Majesco2022-12-310001782524Mammoth Holdings, LLC2022-12-310001782524Montana Buyer, Inc.2022-12-310001782524PDFTron Systems, Inc.2022-12-310001782524Patriot Growth Insurance Services, LLC2022-12-310001782524Pound Bidco, Inc.2022-12-310001782524Pritchard Industries, LLC2022-12-310001782524Promptcare Infusion Buyer, Inc.2022-12-310001782524Radwell Parent, LLC2022-12-310001782524Redwood Services Group, LLC2022-12-310001782524Riskonnect Parent, LLC2022-12-310001782524Securonix, Inc.2022-12-310001782524Spotless Brands, LLC2022-12-310001782524Tamarack Intermediate, LLC2022-12-310001782524Tank Holding Corp.2022-12-310001782524Thrive Buyer, Inc. (Thrive Networks)2022-12-310001782524Triple Lift, Inc.2022-12-310001782524Trunk Acquisition, Inc.2022-12-310001782524V Global Holdings, LLC2022-12-310001782524Valcourt Holdings II, LLC2022-12-310001782524Vardiman Black Holdings, LLC2022-12-310001782524Vessco Midco Holdings, LLC2022-12-310001782524World Insurance Associates, LLC2022-12-310001782524Zarya Intermediate, LLC2022-12-310001782524msdlf:UnfundedDebtSecuritiesFirstLienMember2022-12-310001782524Infinite Bidco, LLC2022-12-310001782524msdlf:UnfundedDebtSecuritiesSecondLienMember2022-12-310001782524msdlf:UnfundedDebtSecuritiesMember2022-12-310001782524us-gaap:IPOMemberus-gaap:SubsequentEventMember2024-01-262024-01-260001782524us-gaap:IPOMemberus-gaap:SubsequentEventMember2024-01-26msdlf:investment0001782524us-gaap:RelatedPartyMembermsdlf:InvestmentAdvisoryAgreementMember2019-11-252019-11-250001782524us-gaap:RelatedPartyMember2023-01-012023-12-310001782524us-gaap:RelatedPartyMembermsdlf:IncentiveFeeRateQuarterlyHurdleRateMember2023-01-012023-12-310001782524us-gaap:RelatedPartyMembermsdlf:IncentiveFeeRateAnnualizedHurdleRateMember2023-01-012023-12-310001782524us-gaap:RelatedPartyMembermsdlf:IncentiveFeeRatePreIncentiveFeeNetInvestmentIncomeBelowCatchUpThresholdMember2023-01-012023-12-310001782524us-gaap:RelatedPartyMembermsdlf:IncentiveFeeRateQuarterlyCatchUpThresholdMember2023-01-012023-12-310001782524us-gaap:RelatedPartyMembermsdlf:IncentiveFeeRateAnnualizedCatchUpThresholdMember2023-01-012023-12-310001782524us-gaap:RelatedPartyMembermsdlf:IncentiveFeeRatePreIncentiveFeeNetInvestmentIncomeExceedsCatchUpThresholdMember2023-01-012023-12-310001782524msdlf:IncentiveFeeRateRealizedCapitalGainsMemberus-gaap:RelatedPartyMember2023-01-012023-12-310001782524us-gaap:RelatedPartyMembermsdlf:AdministrationAgreementMember2023-01-012023-12-310001782524us-gaap:RelatedPartyMembermsdlf:AdministrationAgreementMember2023-12-310001782524us-gaap:RelatedPartyMembermsdlf:AdministrationAgreementMember2022-12-3100017825242019-12-3100017825242019-05-302020-12-310001782524msdlf:MSCreditPartnersHoldingsMember2019-12-310001782524msdlf:MSCreditPartnersHoldingsMembermsdlf:MorganStanleyDirectLendingFundMember2023-01-012023-12-310001782524msdlf:MSCreditPartnersHoldingsMembermsdlf:MorganStanleyDirectLendingFundMember2022-01-012022-03-310001782524us-gaap:RelatedPartyMembermsdlf:A2027NotesMember2023-01-012023-12-310001782524msdlf:A2025NotesMemberus-gaap:RelatedPartyMember2023-01-012023-12-310001782524msdlf:InvestmentOwnedAtFairValueMembermsdlf:DebtSecuritiesFirstLienMembermsdlf:InvestmentTypeConcentrationRiskMember2023-01-012023-12-310001782524msdlf:InvestmentOwnedAtFairValueMembermsdlf:DebtSecuritiesFirstLienMembermsdlf:InvestmentTypeConcentrationRiskMember2022-01-012022-12-310001782524msdlf:DebtSecuritiesSecondLienMembermsdlf:InvestmentOwnedAtFairValueMembermsdlf:InvestmentTypeConcentrationRiskMember2023-01-012023-12-310001782524msdlf:DebtSecuritiesSecondLienMembermsdlf:InvestmentOwnedAtFairValueMembermsdlf:InvestmentTypeConcentrationRiskMember2022-01-012022-12-310001782524msdlf:InvestmentOwnedAtFairValueMembermsdlf:InvestmentTypeConcentrationRiskMemberus-gaap:OtherAggregatedInvestmentsMember2023-01-012023-12-310001782524msdlf:InvestmentOwnedAtFairValueMembermsdlf:InvestmentTypeConcentrationRiskMemberus-gaap:OtherAggregatedInvestmentsMember2022-01-012022-12-310001782524msdlf:InvestmentOwnedAtFairValueMembermsdlf:InvestmentTypeConcentrationRiskMember2023-01-012023-12-310001782524msdlf:InvestmentOwnedAtFairValueMembermsdlf:InvestmentTypeConcentrationRiskMember2022-01-012022-12-310001782524msdlf:InvestmentOwnedAtFairValueMembermsdlf:InvestmentTypeConcentrationRiskMemberus-gaap:AerospaceSectorMember2023-01-012023-12-310001782524msdlf:InvestmentOwnedAtFairValueMembermsdlf:InvestmentTypeConcentrationRiskMemberus-gaap:AerospaceSectorMember2022-01-012022-12-310001782524msdlf:InvestmentOwnedAtFairValueMembermsdlf:AirFreightAndLogisticsSectorMembermsdlf:InvestmentTypeConcentrationRiskMember2023-01-012023-12-310001782524msdlf:InvestmentOwnedAtFairValueMembermsdlf:AirFreightAndLogisticsSectorMembermsdlf:InvestmentTypeConcentrationRiskMember2022-01-012022-12-310001782524msdlf:InvestmentOwnedAtFairValueMembermsdlf:AutoComponentsSectorMembermsdlf:InvestmentTypeConcentrationRiskMember2023-01-012023-12-310001782524msdlf:InvestmentOwnedAtFairValueMembermsdlf:AutoComponentsSectorMembermsdlf:InvestmentTypeConcentrationRiskMember2022-01-012022-12-310001782524msdlf:InvestmentOwnedAtFairValueMembermsdlf:AutomobilesSectorMembermsdlf:InvestmentTypeConcentrationRiskMember2023-01-012023-12-310001782524msdlf:InvestmentOwnedAtFairValueMembermsdlf:AutomobilesSectorMembermsdlf:InvestmentTypeConcentrationRiskMember2022-01-012022-12-310001782524msdlf:InvestmentOwnedAtFairValueMembermsdlf:BiotechnologySectorMembermsdlf:InvestmentTypeConcentrationRiskMember2023-01-012023-12-310001782524msdlf:InvestmentOwnedAtFairValueMembermsdlf:BiotechnologySectorMembermsdlf:InvestmentTypeConcentrationRiskMember2022-01-012022-12-310001782524msdlf:InvestmentOwnedAtFairValueMemberus-gaap:ChemicalsSectorMembermsdlf:InvestmentTypeConcentrationRiskMember2023-01-012023-12-310001782524msdlf:InvestmentOwnedAtFairValueMemberus-gaap:ChemicalsSectorMembermsdlf:InvestmentTypeConcentrationRiskMember2022-01-012022-12-310001782524msdlf:InvestmentOwnedAtFairValueMembermsdlf:InvestmentTypeConcentrationRiskMembermsdlf:CommercialServicesAndSuppliesSectorMember2023-01-012023-12-310001782524msdlf:InvestmentOwnedAtFairValueMembermsdlf:InvestmentTypeConcentrationRiskMembermsdlf:CommercialServicesAndSuppliesSectorMember2022-01-012022-12-310001782524msdlf:ConstructionAndEngineeringSectorMembermsdlf:InvestmentOwnedAtFairValueMembermsdlf:InvestmentTypeConcentrationRiskMember2023-01-012023-12-310001782524msdlf:ConstructionAndEngineeringSectorMembermsdlf:InvestmentOwnedAtFairValueMembermsdlf:InvestmentTypeConcentrationRiskMember2022-01-012022-12-310001782524msdlf:InvestmentOwnedAtFairValueMemberus-gaap:ContainerAndPackagingSectorMembermsdlf:InvestmentTypeConcentrationRiskMember2023-01-012023-12-310001782524msdlf:InvestmentOwnedAtFairValueMemberus-gaap:ContainerAndPackagingSectorMembermsdlf:InvestmentTypeConcentrationRiskMember2022-01-012022-12-310001782524msdlf:InvestmentOwnedAtFairValueMembermsdlf:InvestmentTypeConcentrationRiskMembermsdlf:DistributorsSectorMember2023-01-012023-12-310001782524msdlf:InvestmentOwnedAtFairValueMembermsdlf:InvestmentTypeConcentrationRiskMembermsdlf:DistributorsSectorMember2022-01-012022-12-310001782524msdlf:InvestmentOwnedAtFairValueMembermsdlf:InvestmentTypeConcentrationRiskMemberus-gaap:ConsumerSectorMember2023-01-012023-12-310001782524msdlf:InvestmentOwnedAtFairValueMembermsdlf:InvestmentTypeConcentrationRiskMemberus-gaap:ConsumerSectorMember2022-01-012022-12-310001782524msdlf:InvestmentOwnedAtFairValueMembermsdlf:ElectronicEquipmentInstrumentsAndComponentsSectorMembermsdlf:InvestmentTypeConcentrationRiskMember2023-01-012023-12-310001782524msdlf:InvestmentOwnedAtFairValueMembermsdlf:ElectronicEquipmentInstrumentsAndComponentsSectorMembermsdlf:InvestmentTypeConcentrationRiskMember2022-01-012022-12-310001782524msdlf:InvestmentOwnedAtFairValueMembermsdlf:InvestmentTypeConcentrationRiskMemberus-gaap:EnergySectorMember2023-01-012023-12-310001782524msdlf:InvestmentOwnedAtFairValueMembermsdlf:InvestmentTypeConcentrationRiskMemberus-gaap:EnergySectorMember2022-01-012022-12-310001782524us-gaap:FinancialServicesSectorMembermsdlf:InvestmentOwnedAtFairValueMembermsdlf:InvestmentTypeConcentrationRiskMember2023-01-012023-12-310001782524us-gaap:FinancialServicesSectorMembermsdlf:InvestmentOwnedAtFairValueMembermsdlf:InvestmentTypeConcentrationRiskMember2022-01-012022-12-310001782524us-gaap:FoodAndBeverageSectorMembermsdlf:InvestmentOwnedAtFairValueMembermsdlf:InvestmentTypeConcentrationRiskMember2023-01-012023-12-310001782524us-gaap:FoodAndBeverageSectorMembermsdlf:InvestmentOwnedAtFairValueMembermsdlf:InvestmentTypeConcentrationRiskMember2022-01-012022-12-310001782524msdlf:InvestmentOwnedAtFairValueMembermsdlf:HealthCareEquipmentAndSuppliesSectorMembermsdlf:InvestmentTypeConcentrationRiskMember2023-01-012023-12-310001782524msdlf:InvestmentOwnedAtFairValueMembermsdlf:HealthCareEquipmentAndSuppliesSectorMembermsdlf:InvestmentTypeConcentrationRiskMember2022-01-012022-12-310001782524msdlf:HealthCareProvidersServicesSectorMembermsdlf:InvestmentOwnedAtFairValueMembermsdlf:InvestmentTypeConcentrationRiskMember2023-01-012023-12-310001782524msdlf:HealthCareProvidersServicesSectorMembermsdlf:InvestmentOwnedAtFairValueMembermsdlf:InvestmentTypeConcentrationRiskMember2022-01-012022-12-310001782524msdlf:InvestmentOwnedAtFairValueMembermsdlf:HealthCareTechnologyMembermsdlf:InvestmentTypeConcentrationRiskMember2023-01-012023-12-310001782524msdlf:InvestmentOwnedAtFairValueMembermsdlf:HealthCareTechnologyMembermsdlf:InvestmentTypeConcentrationRiskMember2022-01-012022-12-310001782524msdlf:InvestmentOwnedAtFairValueMembermsdlf:InvestmentTypeConcentrationRiskMembermsdlf:IndustrialConglomeratesSectorMember2023-01-012023-12-310001782524msdlf:InvestmentOwnedAtFairValueMembermsdlf:InvestmentTypeConcentrationRiskMembermsdlf:IndustrialConglomeratesSectorMember2022-01-012022-12-310001782524msdlf:InvestmentOwnedAtFairValueMemberus-gaap:InsuranceSectorMembermsdlf:InvestmentTypeConcentrationRiskMember2023-01-012023-12-310001782524msdlf:InvestmentOwnedAtFairValueMemberus-gaap:InsuranceSectorMembermsdlf:InvestmentTypeConcentrationRiskMember2022-01-012022-12-310001782524msdlf:InvestmentOwnedAtFairValueMembermsdlf:InteractiveMediaAndServicesSectorMembermsdlf:InvestmentTypeConcentrationRiskMember2023-01-012023-12-310001782524msdlf:InvestmentOwnedAtFairValueMembermsdlf:InteractiveMediaAndServicesSectorMembermsdlf:InvestmentTypeConcentrationRiskMember2022-01-012022-12-310001782524msdlf:InvestmentOwnedAtFairValueMemberus-gaap:TechnologySectorMembermsdlf:InvestmentTypeConcentrationRiskMember2023-01-012023-12-310001782524msdlf:InvestmentOwnedAtFairValueMemberus-gaap:TechnologySectorMembermsdlf:InvestmentTypeConcentrationRiskMember2022-01-012022-12-310001782524msdlf:LeisureProductsSectorMembermsdlf:InvestmentOwnedAtFairValueMembermsdlf:InvestmentTypeConcentrationRiskMember2023-01-012023-12-310001782524msdlf:LeisureProductsSectorMembermsdlf:InvestmentOwnedAtFairValueMembermsdlf:InvestmentTypeConcentrationRiskMember2022-01-012022-12-310001782524msdlf:InvestmentOwnedAtFairValueMembermsdlf:InvestmentTypeConcentrationRiskMembermsdlf:MachinerySectorMember2023-01-012023-12-310001782524msdlf:InvestmentOwnedAtFairValueMembermsdlf:InvestmentTypeConcentrationRiskMembermsdlf:MachinerySectorMember2022-01-012022-12-310001782524msdlf:UtilitiesSectorMembermsdlf:InvestmentOwnedAtFairValueMembermsdlf:InvestmentTypeConcentrationRiskMember2023-01-012023-12-310001782524msdlf:UtilitiesSectorMembermsdlf:InvestmentOwnedAtFairValueMembermsdlf:InvestmentTypeConcentrationRiskMember2022-01-012022-12-310001782524msdlf:InvestmentOwnedAtFairValueMembermsdlf:InvestmentTypeConcentrationRiskMembermsdlf:OilGasAndConsumableFuelsSectorMember2023-01-012023-12-310001782524msdlf:InvestmentOwnedAtFairValueMembermsdlf:InvestmentTypeConcentrationRiskMembermsdlf:OilGasAndConsumableFuelsSectorMember2022-01-012022-12-310001782524msdlf:PharmaceuticalsSectorMembermsdlf:InvestmentOwnedAtFairValueMembermsdlf:InvestmentTypeConcentrationRiskMember2023-01-012023-12-310001782524msdlf:PharmaceuticalsSectorMembermsdlf:InvestmentOwnedAtFairValueMembermsdlf:InvestmentTypeConcentrationRiskMember2022-01-012022-12-310001782524msdlf:InvestmentOwnedAtFairValueMembermsdlf:InvestmentTypeConcentrationRiskMembermsdlf:ProfessionalServicesSectorMember2023-01-012023-12-310001782524msdlf:InvestmentOwnedAtFairValueMembermsdlf:InvestmentTypeConcentrationRiskMembermsdlf:ProfessionalServicesSectorMember2022-01-012022-12-310001782524msdlf:InvestmentOwnedAtFairValueMembermsdlf:InvestmentTypeConcentrationRiskMemberus-gaap:RealEstateSectorMember2023-01-012023-12-310001782524msdlf:InvestmentOwnedAtFairValueMembermsdlf:InvestmentTypeConcentrationRiskMemberus-gaap:RealEstateSectorMember2022-01-012022-12-310001782524msdlf:InvestmentOwnedAtFairValueMembermsdlf:SoftwareSectorMembermsdlf:InvestmentTypeConcentrationRiskMember2023-01-012023-12-310001782524msdlf:InvestmentOwnedAtFairValueMembermsdlf:SoftwareSectorMembermsdlf:InvestmentTypeConcentrationRiskMember2022-01-012022-12-310001782524msdlf:InvestmentOwnedAtFairValueMembermsdlf:WirelessTelecommunicationServicesSectorMembermsdlf:InvestmentTypeConcentrationRiskMember2023-01-012023-12-310001782524msdlf:InvestmentOwnedAtFairValueMembermsdlf:WirelessTelecommunicationServicesSectorMembermsdlf:InvestmentTypeConcentrationRiskMember2022-01-012022-12-310001782524country:AU2023-12-310001782524country:AUmsdlf:InvestmentOwnedAtFairValueMembermsdlf:InvestmentTypeConcentrationRiskMember2023-01-012023-12-310001782524country:AU2022-12-310001782524country:AUmsdlf:InvestmentOwnedAtFairValueMembermsdlf:InvestmentTypeConcentrationRiskMember2022-01-012022-12-310001782524country:CA2023-12-310001782524msdlf:InvestmentOwnedAtFairValueMembercountry:CAmsdlf:InvestmentTypeConcentrationRiskMember2023-01-012023-12-310001782524country:CA2022-12-310001782524msdlf:InvestmentOwnedAtFairValueMembercountry:CAmsdlf:InvestmentTypeConcentrationRiskMember2022-01-012022-12-310001782524country:GB2023-12-310001782524msdlf:InvestmentOwnedAtFairValueMembercountry:GBmsdlf:InvestmentTypeConcentrationRiskMember2023-01-012023-12-310001782524country:GB2022-12-310001782524msdlf:InvestmentOwnedAtFairValueMembercountry:GBmsdlf:InvestmentTypeConcentrationRiskMember2022-01-012022-12-310001782524country:US2023-12-310001782524msdlf:InvestmentOwnedAtFairValueMembercountry:USmsdlf:InvestmentTypeConcentrationRiskMember2023-01-012023-12-310001782524country:US2022-12-310001782524msdlf:InvestmentOwnedAtFairValueMembercountry:USmsdlf:InvestmentTypeConcentrationRiskMember2022-01-012022-12-310001782524us-gaap:FairValueInputsLevel1Membermsdlf:DebtSecuritiesFirstLienMember2023-12-310001782524msdlf:DebtSecuritiesFirstLienMemberus-gaap:FairValueInputsLevel2Member2023-12-310001782524us-gaap:FairValueInputsLevel3Membermsdlf:DebtSecuritiesFirstLienMember2023-12-310001782524us-gaap:FairValueInputsLevel12And3Membermsdlf:DebtSecuritiesFirstLienMember2023-12-310001782524us-gaap:FairValueInputsLevel1Membermsdlf:DebtSecuritiesFirstLienMember2022-12-310001782524msdlf:DebtSecuritiesFirstLienMemberus-gaap:FairValueInputsLevel2Member2022-12-310001782524us-gaap:FairValueInputsLevel3Membermsdlf:DebtSecuritiesFirstLienMember2022-12-310001782524us-gaap:FairValueInputsLevel12And3Membermsdlf:DebtSecuritiesFirstLienMember2022-12-310001782524us-gaap:FairValueInputsLevel1Membermsdlf:DebtSecuritiesSecondLienMember2023-12-310001782524us-gaap:FairValueInputsLevel2Membermsdlf:DebtSecuritiesSecondLienMember2023-12-310001782524us-gaap:FairValueInputsLevel3Membermsdlf:DebtSecuritiesSecondLienMember2023-12-310001782524us-gaap:FairValueInputsLevel12And3Membermsdlf:DebtSecuritiesSecondLienMember2023-12-310001782524us-gaap:FairValueInputsLevel1Membermsdlf:DebtSecuritiesSecondLienMember2022-12-310001782524us-gaap:FairValueInputsLevel2Membermsdlf:DebtSecuritiesSecondLienMember2022-12-310001782524us-gaap:FairValueInputsLevel3Membermsdlf:DebtSecuritiesSecondLienMember2022-12-310001782524us-gaap:FairValueInputsLevel12And3Membermsdlf:DebtSecuritiesSecondLienMember2022-12-310001782524us-gaap:FairValueInputsLevel1Memberus-gaap:OtherAggregatedInvestmentsMember2023-12-310001782524us-gaap:OtherAggregatedInvestmentsMemberus-gaap:FairValueInputsLevel2Member2023-12-310001782524us-gaap:FairValueInputsLevel3Memberus-gaap:OtherAggregatedInvestmentsMember2023-12-310001782524us-gaap:FairValueInputsLevel12And3Memberus-gaap:OtherAggregatedInvestmentsMember2023-12-310001782524us-gaap:FairValueInputsLevel1Memberus-gaap:OtherAggregatedInvestmentsMember2022-12-310001782524us-gaap:OtherAggregatedInvestmentsMemberus-gaap:FairValueInputsLevel2Member2022-12-310001782524us-gaap:FairValueInputsLevel3Memberus-gaap:OtherAggregatedInvestmentsMember2022-12-310001782524us-gaap:FairValueInputsLevel12And3Memberus-gaap:OtherAggregatedInvestmentsMember2022-12-310001782524us-gaap:FairValueInputsLevel1Member2023-12-310001782524us-gaap:FairValueInputsLevel2Member2023-12-310001782524us-gaap:FairValueInputsLevel3Member2023-12-310001782524us-gaap:FairValueInputsLevel12And3Member2023-12-310001782524us-gaap:FairValueInputsLevel1Member2022-12-310001782524us-gaap:FairValueInputsLevel2Member2022-12-310001782524us-gaap:FairValueInputsLevel3Member2022-12-310001782524us-gaap:FairValueInputsLevel12And3Member2022-12-310001782524us-gaap:FairValueMeasuredAtNetAssetValuePerShareMember2023-12-310001782524us-gaap:FairValueMeasuredAtNetAssetValuePerShareMember2022-12-310001782524msdlf:DebtSecuritiesFirstLienMember2022-12-310001782524msdlf:DebtSecuritiesSecondLienMember2022-12-310001782524us-gaap:OtherAggregatedInvestmentsMember2022-12-310001782524msdlf:DebtSecuritiesFirstLienMember2023-01-012023-12-310001782524msdlf:DebtSecuritiesSecondLienMember2023-01-012023-12-310001782524us-gaap:OtherAggregatedInvestmentsMember2023-01-012023-12-310001782524msdlf:DebtAndEquitySecuritiesUnrealizedGainLossMember2023-01-012023-12-310001782524msdlf:DebtAndEquitySecuritiesUnrealizedGainLossMembermsdlf:DebtSecuritiesFirstLienMember2023-01-012023-12-310001782524msdlf:DebtSecuritiesSecondLienMembermsdlf:DebtAndEquitySecuritiesUnrealizedGainLossMember2023-01-012023-12-310001782524us-gaap:OtherAggregatedInvestmentsMembermsdlf:DebtAndEquitySecuritiesUnrealizedGainLossMember2023-01-012023-12-310001782524msdlf:DebtAndEquitySecuritiesRealizedGainLossMember2023-01-012023-12-310001782524msdlf:DebtAndEquitySecuritiesRealizedGainLossMembermsdlf:DebtSecuritiesFirstLienMember2023-01-012023-12-310001782524msdlf:DebtAndEquitySecuritiesRealizedGainLossMembermsdlf:DebtSecuritiesSecondLienMember2023-01-012023-12-310001782524msdlf:DebtAndEquitySecuritiesRealizedGainLossMemberus-gaap:OtherAggregatedInvestmentsMember2023-01-012023-12-310001782524msdlf:DebtSecuritiesFirstLienMember2023-12-310001782524msdlf:DebtSecuritiesSecondLienMember2023-12-310001782524us-gaap:OtherAggregatedInvestmentsMember2023-12-310001782524msdlf:DebtSecuritiesFirstLienMember2021-12-310001782524msdlf:DebtSecuritiesSecondLienMember2021-12-310001782524us-gaap:OtherAggregatedInvestmentsMember2021-12-310001782524msdlf:DebtSecuritiesFirstLienMember2022-01-012022-12-310001782524msdlf:DebtSecuritiesSecondLienMember2022-01-012022-12-310001782524us-gaap:OtherAggregatedInvestmentsMember2022-01-012022-12-310001782524msdlf:DebtAndEquitySecuritiesUnrealizedGainLossMember2022-01-012022-12-310001782524msdlf:DebtAndEquitySecuritiesUnrealizedGainLossMembermsdlf:DebtSecuritiesFirstLienMember2022-01-012022-12-310001782524msdlf:DebtSecuritiesSecondLienMembermsdlf:DebtAndEquitySecuritiesUnrealizedGainLossMember2022-01-012022-12-310001782524us-gaap:OtherAggregatedInvestmentsMembermsdlf:DebtAndEquitySecuritiesUnrealizedGainLossMember2022-01-012022-12-310001782524msdlf:DebtAndEquitySecuritiesRealizedGainLossMember2022-01-012022-12-310001782524msdlf:DebtAndEquitySecuritiesRealizedGainLossMembermsdlf:DebtSecuritiesFirstLienMember2022-01-012022-12-310001782524msdlf:DebtAndEquitySecuritiesRealizedGainLossMembermsdlf:DebtSecuritiesSecondLienMember2022-01-012022-12-310001782524msdlf:DebtAndEquitySecuritiesRealizedGainLossMemberus-gaap:OtherAggregatedInvestmentsMember2022-01-012022-12-310001782524us-gaap:MeasurementInputDiscountRateMemberus-gaap:FairValueInputsLevel3Membermsdlf:DebtSecuritiesFirstLienMembermsdlf:ValuationYieldAnalysisMember2023-12-310001782524us-gaap:MeasurementInputDiscountRateMemberus-gaap:FairValueInputsLevel3Membersrt:MinimumMembermsdlf:DebtSecuritiesFirstLienMembermsdlf:ValuationYieldAnalysisMember2023-12-310001782524us-gaap:MeasurementInputDiscountRateMemberus-gaap:FairValueInputsLevel3Membermsdlf:DebtSecuritiesFirstLienMembermsdlf:ValuationYieldAnalysisMembersrt:MaximumMember2023-12-310001782524us-gaap:MeasurementInputDiscountRateMemberus-gaap:FairValueInputsLevel3Membersrt:WeightedAverageMembermsdlf:DebtSecuritiesFirstLienMembermsdlf:ValuationYieldAnalysisMember2023-12-310001782524us-gaap:MeasurementInputDiscountRateMemberus-gaap:FairValueInputsLevel3Membermsdlf:ValuationYieldAnalysisMembermsdlf:DebtSecuritiesSecondLienMember2023-12-310001782524us-gaap:MeasurementInputDiscountRateMemberus-gaap:FairValueInputsLevel3Membersrt:MinimumMembermsdlf:ValuationYieldAnalysisMembermsdlf:DebtSecuritiesSecondLienMember2023-12-310001782524us-gaap:MeasurementInputDiscountRateMemberus-gaap:FairValueInputsLevel3Membermsdlf:ValuationYieldAnalysisMembersrt:MaximumMembermsdlf:DebtSecuritiesSecondLienMember2023-12-310001782524us-gaap:MeasurementInputDiscountRateMemberus-gaap:FairValueInputsLevel3Membersrt:WeightedAverageMembermsdlf:ValuationYieldAnalysisMembermsdlf:DebtSecuritiesSecondLienMember2023-12-310001782524us-gaap:MeasurementInputDiscountRateMemberus-gaap:FairValueInputsLevel3Memberus-gaap:IncomeApproachValuationTechniqueMembermsdlf:OtherSecurityInvestmentsUnsecuredDebtMember2023-12-310001782524us-gaap:MeasurementInputDiscountRateMemberus-gaap:IncomeApproachValuationTechniqueMemberus-gaap:FairValueInputsLevel3Membersrt:MinimumMembermsdlf:OtherSecurityInvestmentsUnsecuredDebtMember2023-12-310001782524us-gaap:MeasurementInputDiscountRateMemberus-gaap:IncomeApproachValuationTechniqueMemberus-gaap:FairValueInputsLevel3Membermsdlf:OtherSecurityInvestmentsUnsecuredDebtMembersrt:MaximumMember2023-12-310001782524us-gaap:MeasurementInputDiscountRateMemberus-gaap:IncomeApproachValuationTechniqueMemberus-gaap:FairValueInputsLevel3Membersrt:WeightedAverageMembermsdlf:OtherSecurityInvestmentsUnsecuredDebtMember2023-12-310001782524us-gaap:FairValueInputsLevel3Memberus-gaap:MarketApproachValuationTechniqueMembermsdlf:OtherSecurityInvestmentsUnsecuredDebtMemberus-gaap:MeasurementInputEbitdaMultipleMember2023-12-310001782524us-gaap:MarketApproachValuationTechniqueMemberus-gaap:FairValueInputsLevel3Membersrt:MinimumMembermsdlf:OtherSecurityInvestmentsUnsecuredDebtMemberus-gaap:MeasurementInputEbitdaMultipleMember2023-12-310001782524us-gaap:MarketApproachValuationTechniqueMemberus-gaap:FairValueInputsLevel3Membermsdlf:OtherSecurityInvestmentsUnsecuredDebtMemberus-gaap:MeasurementInputEbitdaMultipleMembersrt:MaximumMember2023-12-310001782524us-gaap:MarketApproachValuationTechniqueMemberus-gaap:FairValueInputsLevel3Membersrt:WeightedAverageMembermsdlf:OtherSecurityInvestmentsUnsecuredDebtMemberus-gaap:MeasurementInputEbitdaMultipleMember2023-12-310001782524us-gaap:MeasurementInputDiscountRateMemberus-gaap:FairValueInputsLevel3Memberus-gaap:IncomeApproachValuationTechniqueMembermsdlf:OtherSecurityInvestmentsPreferredEquityMember2023-12-310001782524us-gaap:MeasurementInputDiscountRateMemberus-gaap:IncomeApproachValuationTechniqueMemberus-gaap:FairValueInputsLevel3Membersrt:MinimumMembermsdlf:OtherSecurityInvestmentsPreferredEquityMember2023-12-310001782524us-gaap:MeasurementInputDiscountRateMemberus-gaap:IncomeApproachValuationTechniqueMemberus-gaap:FairValueInputsLevel3Membermsdlf:OtherSecurityInvestmentsPreferredEquityMembersrt:MaximumMember2023-12-310001782524us-gaap:MeasurementInputDiscountRateMemberus-gaap:IncomeApproachValuationTechniqueMemberus-gaap:FairValueInputsLevel3Membersrt:WeightedAverageMembermsdlf:OtherSecurityInvestmentsPreferredEquityMember2023-12-310001782524us-gaap:FairValueInputsLevel3Memberus-gaap:MarketApproachValuationTechniqueMemberus-gaap:MeasurementInputRevenueMultipleMembermsdlf:OtherSecurityInvestmentsPreferredEquityMember2023-12-310001782524us-gaap:MarketApproachValuationTechniqueMemberus-gaap:FairValueInputsLevel3Memberus-gaap:MeasurementInputRevenueMultipleMembersrt:MinimumMembermsdlf:OtherSecurityInvestmentsPreferredEquityMember2023-12-310001782524us-gaap:MarketApproachValuationTechniqueMemberus-gaap:FairValueInputsLevel3Memberus-gaap:MeasurementInputRevenueMultipleMembermsdlf:OtherSecurityInvestmentsPreferredEquityMembersrt:MaximumMember2023-12-310001782524us-gaap:MarketApproachValuationTechniqueMemberus-gaap:FairValueInputsLevel3Memberus-gaap:MeasurementInputRevenueMultipleMembersrt:WeightedAverageMembermsdlf:OtherSecurityInvestmentsPreferredEquityMember2023-12-310001782524us-gaap:FairValueInputsLevel3Memberus-gaap:MarketApproachValuationTechniqueMemberus-gaap:MeasurementInputEbitdaMultipleMembermsdlf:OtherSecurityInvestmentsCommonEquityMember2023-12-310001782524us-gaap:MarketApproachValuationTechniqueMemberus-gaap:FairValueInputsLevel3Membersrt:MinimumMembermsdlf:OtherSecurityInvestmentsCommonEquityMemberus-gaap:MeasurementInputEbitdaMultipleMember2023-12-310001782524us-gaap:MarketApproachValuationTechniqueMemberus-gaap:FairValueInputsLevel3Membermsdlf:OtherSecurityInvestmentsCommonEquityMemberus-gaap:MeasurementInputEbitdaMultipleMembersrt:MaximumMember2023-12-310001782524us-gaap:MarketApproachValuationTechniqueMemberus-gaap:FairValueInputsLevel3Membersrt:WeightedAverageMembermsdlf:OtherSecurityInvestmentsCommonEquityMemberus-gaap:MeasurementInputEbitdaMultipleMember2023-12-310001782524us-gaap:FairValueInputsLevel3Memberus-gaap:MarketApproachValuationTechniqueMemberus-gaap:MeasurementInputRevenueMultipleMembermsdlf:OtherSecurityInvestmentsCommonEquityMember2023-12-310001782524us-gaap:MarketApproachValuationTechniqueMemberus-gaap:FairValueInputsLevel3Memberus-gaap:MeasurementInputRevenueMultipleMembersrt:MinimumMembermsdlf:OtherSecurityInvestmentsCommonEquityMember2023-12-310001782524us-gaap:MarketApproachValuationTechniqueMemberus-gaap:FairValueInputsLevel3Memberus-gaap:MeasurementInputRevenueMultipleMembermsdlf:OtherSecurityInvestmentsCommonEquityMembersrt:MaximumMember2023-12-310001782524us-gaap:MarketApproachValuationTechniqueMemberus-gaap:FairValueInputsLevel3Memberus-gaap:MeasurementInputRevenueMultipleMembersrt:WeightedAverageMembermsdlf:OtherSecurityInvestmentsCommonEquityMember2023-12-310001782524us-gaap:MeasurementInputDiscountRateMemberus-gaap:FairValueInputsLevel3Membermsdlf:DebtSecuritiesFirstLienMembermsdlf:ValuationYieldAnalysisMember2022-12-310001782524us-gaap:MeasurementInputDiscountRateMemberus-gaap:FairValueInputsLevel3Membersrt:MinimumMembermsdlf:DebtSecuritiesFirstLienMembermsdlf:ValuationYieldAnalysisMember2022-12-310001782524us-gaap:MeasurementInputDiscountRateMemberus-gaap:FairValueInputsLevel3Membermsdlf:DebtSecuritiesFirstLienMembermsdlf:ValuationYieldAnalysisMembersrt:MaximumMember2022-12-310001782524us-gaap:MeasurementInputDiscountRateMemberus-gaap:FairValueInputsLevel3Membersrt:WeightedAverageMembermsdlf:DebtSecuritiesFirstLienMembermsdlf:ValuationYieldAnalysisMember2022-12-310001782524us-gaap:FairValueInputsLevel3Membermsdlf:DebtSecuritiesFirstLienMembermsdlf:ValuationTransactionPriceMembermsdlf:MeasurementInputRecentTransactionMember2022-12-310001782524us-gaap:FairValueInputsLevel3Membersrt:MinimumMembermsdlf:DebtSecuritiesFirstLienMembermsdlf:ValuationTransactionPriceMembermsdlf:MeasurementInputRecentTransactionMember2022-12-310001782524us-gaap:FairValueInputsLevel3Membermsdlf:DebtSecuritiesFirstLienMembersrt:MaximumMembermsdlf:ValuationTransactionPriceMembermsdlf:MeasurementInputRecentTransactionMember2022-12-310001782524us-gaap:FairValueInputsLevel3Membersrt:WeightedAverageMembermsdlf:DebtSecuritiesFirstLienMembermsdlf:ValuationTransactionPriceMembermsdlf:MeasurementInputRecentTransactionMember2022-12-310001782524us-gaap:MeasurementInputDiscountRateMemberus-gaap:FairValueInputsLevel3Membermsdlf:ValuationYieldAnalysisMembermsdlf:DebtSecuritiesSecondLienMember2022-12-310001782524us-gaap:MeasurementInputDiscountRateMemberus-gaap:FairValueInputsLevel3Membersrt:MinimumMembermsdlf:ValuationYieldAnalysisMembermsdlf:DebtSecuritiesSecondLienMember2022-12-310001782524us-gaap:MeasurementInputDiscountRateMemberus-gaap:FairValueInputsLevel3Membermsdlf:ValuationYieldAnalysisMembersrt:MaximumMembermsdlf:DebtSecuritiesSecondLienMember2022-12-310001782524us-gaap:MeasurementInputDiscountRateMemberus-gaap:FairValueInputsLevel3Membersrt:WeightedAverageMembermsdlf:ValuationYieldAnalysisMembermsdlf:DebtSecuritiesSecondLienMember2022-12-310001782524us-gaap:MeasurementInputDiscountRateMemberus-gaap:FairValueInputsLevel3Memberus-gaap:IncomeApproachValuationTechniqueMembermsdlf:OtherSecurityInvestmentsUnsecuredDebtMember2022-12-310001782524us-gaap:MeasurementInputDiscountRateMemberus-gaap:IncomeApproachValuationTechniqueMemberus-gaap:FairValueInputsLevel3Membersrt:MinimumMembermsdlf:OtherSecurityInvestmentsUnsecuredDebtMember2022-12-310001782524us-gaap:MeasurementInputDiscountRateMemberus-gaap:IncomeApproachValuationTechniqueMemberus-gaap:FairValueInputsLevel3Membermsdlf:OtherSecurityInvestmentsUnsecuredDebtMembersrt:MaximumMember2022-12-310001782524us-gaap:MeasurementInputDiscountRateMemberus-gaap:IncomeApproachValuationTechniqueMemberus-gaap:FairValueInputsLevel3Membersrt:WeightedAverageMembermsdlf:OtherSecurityInvestmentsUnsecuredDebtMember2022-12-310001782524us-gaap:FairValueInputsLevel3Memberus-gaap:MarketApproachValuationTechniqueMembermsdlf:OtherSecurityInvestmentsUnsecuredDebtMemberus-gaap:MeasurementInputEbitdaMultipleMember2022-12-310001782524us-gaap:MarketApproachValuationTechniqueMemberus-gaap:FairValueInputsLevel3Membersrt:MinimumMembermsdlf:OtherSecurityInvestmentsUnsecuredDebtMemberus-gaap:MeasurementInputEbitdaMultipleMember2022-12-310001782524us-gaap:MarketApproachValuationTechniqueMemberus-gaap:FairValueInputsLevel3Membermsdlf:OtherSecurityInvestmentsUnsecuredDebtMemberus-gaap:MeasurementInputEbitdaMultipleMembersrt:MaximumMember2022-12-310001782524us-gaap:MarketApproachValuationTechniqueMemberus-gaap:FairValueInputsLevel3Membersrt:WeightedAverageMembermsdlf:OtherSecurityInvestmentsUnsecuredDebtMemberus-gaap:MeasurementInputEbitdaMultipleMember2022-12-310001782524us-gaap:MeasurementInputDiscountRateMemberus-gaap:FairValueInputsLevel3Memberus-gaap:IncomeApproachValuationTechniqueMembermsdlf:OtherSecurityInvestmentsPreferredEquityMember2022-12-310001782524us-gaap:MeasurementInputDiscountRateMemberus-gaap:IncomeApproachValuationTechniqueMemberus-gaap:FairValueInputsLevel3Membersrt:MinimumMembermsdlf:OtherSecurityInvestmentsPreferredEquityMember2022-12-310001782524us-gaap:MeasurementInputDiscountRateMemberus-gaap:IncomeApproachValuationTechniqueMemberus-gaap:FairValueInputsLevel3Membermsdlf:OtherSecurityInvestmentsPreferredEquityMembersrt:MaximumMember2022-12-310001782524us-gaap:MeasurementInputDiscountRateMemberus-gaap:IncomeApproachValuationTechniqueMemberus-gaap:FairValueInputsLevel3Membersrt:WeightedAverageMembermsdlf:OtherSecurityInvestmentsPreferredEquityMember2022-12-310001782524us-gaap:FairValueInputsLevel3Memberus-gaap:MarketApproachValuationTechniqueMemberus-gaap:MeasurementInputRevenueMultipleMembermsdlf:OtherSecurityInvestmentsPreferredEquityMember2022-12-310001782524us-gaap:MarketApproachValuationTechniqueMemberus-gaap:FairValueInputsLevel3Memberus-gaap:MeasurementInputRevenueMultipleMembersrt:MinimumMembermsdlf:OtherSecurityInvestmentsPreferredEquityMember2022-12-310001782524us-gaap:MarketApproachValuationTechniqueMemberus-gaap:FairValueInputsLevel3Memberus-gaap:MeasurementInputRevenueMultipleMembermsdlf:OtherSecurityInvestmentsPreferredEquityMembersrt:MaximumMember2022-12-310001782524us-gaap:MarketApproachValuationTechniqueMemberus-gaap:FairValueInputsLevel3Memberus-gaap:MeasurementInputRevenueMultipleMembersrt:WeightedAverageMembermsdlf:OtherSecurityInvestmentsPreferredEquityMember2022-12-310001782524us-gaap:FairValueInputsLevel3Memberus-gaap:MarketApproachValuationTechniqueMemberus-gaap:MeasurementInputEbitdaMultipleMembermsdlf:OtherSecurityInvestmentsCommonEquityMember2022-12-310001782524us-gaap:MarketApproachValuationTechniqueMemberus-gaap:FairValueInputsLevel3Membersrt:MinimumMembermsdlf:OtherSecurityInvestmentsCommonEquityMemberus-gaap:MeasurementInputEbitdaMultipleMember2022-12-310001782524us-gaap:MarketApproachValuationTechniqueMemberus-gaap:FairValueInputsLevel3Membermsdlf:OtherSecurityInvestmentsCommonEquityMemberus-gaap:MeasurementInputEbitdaMultipleMembersrt:MaximumMember2022-12-310001782524us-gaap:MarketApproachValuationTechniqueMemberus-gaap:FairValueInputsLevel3Membersrt:WeightedAverageMembermsdlf:OtherSecurityInvestmentsCommonEquityMemberus-gaap:MeasurementInputEbitdaMultipleMember2022-12-310001782524us-gaap:FairValueInputsLevel3Memberus-gaap:MarketApproachValuationTechniqueMemberus-gaap:MeasurementInputRevenueMultipleMembermsdlf:OtherSecurityInvestmentsCommonEquityMember2022-12-310001782524us-gaap:MarketApproachValuationTechniqueMemberus-gaap:FairValueInputsLevel3Memberus-gaap:MeasurementInputRevenueMultipleMembersrt:MinimumMembermsdlf:OtherSecurityInvestmentsCommonEquityMember2022-12-310001782524us-gaap:MarketApproachValuationTechniqueMemberus-gaap:FairValueInputsLevel3Memberus-gaap:MeasurementInputRevenueMultipleMembermsdlf:OtherSecurityInvestmentsCommonEquityMembersrt:MaximumMember2022-12-310001782524us-gaap:MarketApproachValuationTechniqueMemberus-gaap:FairValueInputsLevel3Memberus-gaap:MeasurementInputRevenueMultipleMembersrt:WeightedAverageMembermsdlf:OtherSecurityInvestmentsCommonEquityMember2022-12-310001782524us-gaap:EstimateOfFairValueFairValueDisclosureMembermsdlf:TruistCreditFacilityMemberus-gaap:LineOfCreditMemberus-gaap:FairValueInputsLevel2Member2023-12-310001782524us-gaap:CarryingReportedAmountFairValueDisclosureMembermsdlf:BNPFundingFacilityMemberus-gaap:LineOfCreditMember2023-12-310001782524us-gaap:EstimateOfFairValueFairValueDisclosureMembermsdlf:BNPFundingFacilityMemberus-gaap:LineOfCreditMember2023-12-310001782524us-gaap:CarryingReportedAmountFairValueDisclosureMembermsdlf:BNPFundingFacilityMemberus-gaap:LineOfCreditMember2022-12-310001782524us-gaap:EstimateOfFairValueFairValueDisclosureMembermsdlf:BNPFundingFacilityMemberus-gaap:LineOfCreditMember2022-12-310001782524us-gaap:CarryingReportedAmountFairValueDisclosureMembermsdlf:TruistCreditFacilityMemberus-gaap:LineOfCreditMember2023-12-310001782524us-gaap:EstimateOfFairValueFairValueDisclosureMembermsdlf:TruistCreditFacilityMemberus-gaap:LineOfCreditMember2023-12-310001782524us-gaap:CarryingReportedAmountFairValueDisclosureMembermsdlf:TruistCreditFacilityMemberus-gaap:LineOfCreditMember2022-12-310001782524us-gaap:EstimateOfFairValueFairValueDisclosureMembermsdlf:TruistCreditFacilityMemberus-gaap:LineOfCreditMember2022-12-310001782524us-gaap:CarryingReportedAmountFairValueDisclosureMemberus-gaap:SeniorNotesMembermsdlf:A2027NotesMember2023-12-310001782524us-gaap:EstimateOfFairValueFairValueDisclosureMemberus-gaap:SeniorNotesMembermsdlf:A2027NotesMember2023-12-310001782524us-gaap:CarryingReportedAmountFairValueDisclosureMemberus-gaap:SeniorNotesMembermsdlf:A2027NotesMember2022-12-310001782524us-gaap:EstimateOfFairValueFairValueDisclosureMemberus-gaap:SeniorNotesMembermsdlf:A2027NotesMember2022-12-310001782524msdlf:A2025NotesMemberus-gaap:CarryingReportedAmountFairValueDisclosureMemberus-gaap:SeniorNotesMember2023-12-310001782524msdlf:A2025NotesMemberus-gaap:EstimateOfFairValueFairValueDisclosureMemberus-gaap:SeniorNotesMember2023-12-310001782524msdlf:A2025NotesMemberus-gaap:CarryingReportedAmountFairValueDisclosureMemberus-gaap:SeniorNotesMember2022-12-310001782524msdlf:A2025NotesMemberus-gaap:EstimateOfFairValueFairValueDisclosureMemberus-gaap:SeniorNotesMember2022-12-310001782524us-gaap:CarryingReportedAmountFairValueDisclosureMember2023-12-310001782524us-gaap:EstimateOfFairValueFairValueDisclosureMember2023-12-310001782524us-gaap:CarryingReportedAmountFairValueDisclosureMember2022-12-310001782524us-gaap:EstimateOfFairValueFairValueDisclosureMember2022-12-310001782524us-gaap:SeniorNotesMembermsdlf:A2027NotesMember2023-12-310001782524msdlf:A2025NotesMemberus-gaap:SeniorNotesMember2023-12-310001782524us-gaap:SeniorNotesMembermsdlf:A2027NotesMember2022-12-310001782524msdlf:A2025NotesMemberus-gaap:SeniorNotesMember2022-12-310001782524msdlf:CIBCSubscriptionFacilityMemberus-gaap:LineOfCreditMember2023-12-310001782524msdlf:CIBCSubscriptionFacilityMemberus-gaap:LineOfCreditMember2022-12-310001782524us-gaap:LineOfCreditMembermsdlf:BNPFundingFacilityMember2023-12-310001782524us-gaap:LineOfCreditMembermsdlf:BNPFundingFacilityMember2022-12-310001782524us-gaap:LineOfCreditMembermsdlf:TruistCreditFacilityMember2023-12-310001782524us-gaap:LineOfCreditMembermsdlf:TruistCreditFacilityMember2022-12-31iso4217:EUR0001782524msdlf:CIBCSubscriptionFacilityMemberus-gaap:LineOfCreditMember2023-01-012023-12-310001782524msdlf:CIBCSubscriptionFacilityMemberus-gaap:LineOfCreditMember2022-01-012022-12-310001782524msdlf:CIBCSubscriptionFacilityMemberus-gaap:LineOfCreditMember2021-01-012021-12-310001782524srt:MinimumMembermsdlf:BNPFundingFacilityMemberus-gaap:LineOfCreditMembermsdlf:InterestRatePeriodOneMemberus-gaap:BaseRateMember2023-01-012023-12-310001782524msdlf:BNPFundingFacilityMemberus-gaap:LineOfCreditMembersrt:MaximumMembermsdlf:InterestRatePeriodTwoMemberus-gaap:BaseRateMember2023-01-012023-12-310001782524us-gaap:LineOfCreditMembermsdlf:BNPFundingFacilityMember2023-01-012023-12-310001782524us-gaap:LineOfCreditMembermsdlf:BNPFundingFacilityMember2022-01-012022-12-310001782524us-gaap:LineOfCreditMembermsdlf:BNPFundingFacilityMember2021-01-012021-12-310001782524us-gaap:LineOfCreditMembermsdlf:TruistCreditFacilityMember2023-01-310001782524msdlf:TruistCreditFacilityMemberus-gaap:LineOfCreditMembermsdlf:FederalResereBankOfNewYorkRateMember2023-01-012023-12-310001782524msdlf:TruistCreditFacilityMemberus-gaap:LineOfCreditMembermsdlf:SecuredOvernightFinancingRateSOFRMember2023-01-012023-12-310001782524msdlf:TruistCreditFacilityMemberus-gaap:LineOfCreditMemberus-gaap:EurodollarMember2023-01-012023-12-310001782524us-gaap:LineOfCreditMembermsdlf:TruistCreditFacilityMember2023-01-012023-12-310001782524us-gaap:LineOfCreditMembermsdlf:TruistCreditFacilityMember2022-01-012022-12-310001782524us-gaap:LineOfCreditMembermsdlf:TruistCreditFacilityMember2021-01-012021-12-310001782524us-gaap:SeniorNotesMembermsdlf:A2027NotesMember2022-02-110001782524us-gaap:SeniorNotesMembermsdlf:A2027NotesMember2023-01-012023-12-310001782524us-gaap:SeniorNotesMembermsdlf:A2027NotesMember2022-01-012022-12-310001782524msdlf:A2025NotesMemberus-gaap:SeniorNotesMember2022-09-130001782524msdlf:A2025NotesMemberus-gaap:SeniorNotesMember2023-01-012023-12-310001782524msdlf:A2025NotesMemberus-gaap:SeniorNotesMember2022-01-012022-12-310001782524msdlf:DelayedDrawAndRevolvingSeniorSecuredLoansMember2022-12-310001782524us-gaap:RetainedEarningsMember2022-12-310001782524us-gaap:RetainedEarningsMember2021-12-310001782524us-gaap:RetainedEarningsMember2020-12-310001782524us-gaap:RetainedEarningsMember2023-01-012023-12-310001782524us-gaap:RetainedEarningsMember2022-01-012022-12-310001782524us-gaap:RetainedEarningsMember2021-01-012021-12-310001782524us-gaap:RetainedEarningsMember2023-12-3100017825242023-10-042023-10-0400017825242022-05-162022-05-1600017825242022-07-282022-07-2800017825242022-12-232022-12-2300017825242023-03-282023-03-2800017825242023-06-272023-06-2700017825242023-09-262023-09-2600017825242023-12-282023-12-2800017825242022-03-252022-03-2500017825242022-06-242022-06-2400017825242022-09-282022-09-2800017825242022-12-202022-12-2000017825242023-01-252023-01-2500017825242023-04-252023-04-2500017825242023-07-252023-07-2500017825242023-10-252023-10-2500017825242022-01-252022-01-2500017825242022-04-272022-04-2700017825242022-07-272022-07-2700017825242022-10-192022-10-190001782524msdlf:ShortTermCapitalLossCarryforwardMember2023-12-310001782524msdlf:LongTermCapitalLossCarryforwardMember2023-12-310001782524us-gaap:AdditionalPaidInCapitalMember2023-01-012023-12-310001782524us-gaap:AdditionalPaidInCapitalMember2022-01-012022-12-310001782524us-gaap:AdditionalPaidInCapitalMember2021-01-012021-12-3100017825242020-01-012020-12-310001782524msdlf:AmendedAndRestatedInvestmentAdvisoryAgreementMemberus-gaap:RelatedPartyMemberus-gaap:SubsequentEventMember2024-01-242024-01-240001782524srt:ScenarioForecastMember2024-01-112024-01-110001782524us-gaap:SubsequentEventMember2024-02-292024-02-290001782524us-gaap:SubsequentEventMembermsdlf:Company10b51PlanMember2024-01-2500017825242023-10-012023-12-31
UNITED STATES
SECURITIES AND EXCHANGE COMMISSION
Washington, D.C. 20549
FORM 10-K
|
|
|
|
|
|
x |
ANNUAL REPORT PURSUANT TO SECTION 13 OR 15(d) OF THE SECURITIES EXCHANGE ACT OF 1934 |
For the fiscal year ended December 31, 2023
OR
|
|
|
|
|
|
¨ |
TRANSITION REPORT PURSUANT TO SECTION 13 OR 15(d) OF THE SECURITIES EXCHANGE ACT OF 1934 |
For the transition period from to
Commission File No. 814-01332
Morgan Stanley Direct Lending Fund
(Exact name of registrant as specified in charter)
|
|
|
|
|
|
Delaware
(State or other jurisdiction of
incorporation or registration) |
84-2009506
(I.R.S. Employer
Identification No.) |
|
|
1585 Broadway, New York, NY
(Address of principal executive offices) |
10036
(Zip Code) |
1 212-761-4000
(Registrant’s telephone number, including area code)
Securities registered pursuant to Section 12(b) of the Act:
|
|
|
|
|
|
|
|
|
|
|
|
|
|
|
|
|
|
Title of each class |
|
Trading Symbol |
|
Name of each exchange on which registered |
Common Stock, $0.001 par value per share |
|
MSDL |
|
The New York Stock Exchange |
Securities registered pursuant to Section 12(g) of the Act: None
Indicate by check mark if the registrant is a well-known seasoned issuer, as defined in Rule 405 of the Securities Act. Yes ¨ No x
Indicate by check mark if the registrant is not required to file reports pursuant to Section 13 or Section 15(d) of the Act. Yes ¨ No x
Indicate by check mark whether the registrant (1) has filed all reports required to be filed by Section 13 or 15(d) of the Securities Exchange Act of 1934 during the preceding 12 months (or for such shorter period that the registrant was required to file such reports), and (2) has been subject to such filing requirements for the past 90 days: Yes x No ¨
Indicate by check mark whether the registrant has submitted electronically every Interactive Data File required to be submitted pursuant to Rule 405 of Regulation S-T (§232.405 of this chapter) during the preceding 12 months (or for such shorter period that the registrant was required to submit such files). Yes x No ¨
Indicate by check mark whether the registrant is a large accelerated filer, an accelerated filer, a non-accelerated filer, a smaller reporting company, or an emerging growth company. See definitions of “large accelerated filer,” “accelerated filer,” “smaller reporting company,” and “emerging growth company” in Rule 12b-2 of the Exchange Act.
|
|
|
|
|
|
|
|
|
|
|
|
Large accelerated filer |
¨ |
Accelerated filer |
¨ |
|
|
|
|
Non-accelerated filer |
x |
Smaller reporting company |
¨ |
|
|
|
|
Emerging growth company |
x |
|
|
If an emerging growth company, indicate by check mark if the registrant has elected not to use the extended transition period complying with any new or revised financial accounting standards provided pursuant to Section 13(a) of the Exchange Act. ☒
Indicate by check mark whether the registrant has filed a report on and attestation to its management’s assessment of the effectiveness of its internal control over financial reporting under Section 404(b) of the Sarbanes-Oxley Act (15 U.S.C. 7262(b)) by the registered public accounting firm that prepared or issued its audit report. ☐
If securities are registered pursuant to Section 12(b) of the Act, indicate by check mark whether the financial statements of the Registrant included in the filing reflect the correction of an error to previously issued financial statements. ☐
Indicate by check mark whether any of those error corrections are restatements that required a recovery analysis of incentive-based compensation received by any of the Registrant’s executive officers during the relevant recovery period pursuant to §240.10D-1(b). ☐
Indicate by check mark whether the registrant is a shell company (as defined in Rule 12b-2 of the Exchange Act). Yes ☐ No ☒
The aggregate market value of the common stock held by non-affiliates of the Registrant as of June 30, 2023 has not been provided because trading of the Registrant’s common stock on The New York Stock Exchange did not commence until January 24, 2024.
The number of shares of the registrant’s common stock, $0.001 par value per share, outstanding at March 1, 2024 was 88,897,708.
Documents Incorporated by Reference: Portions of the registrant’s Proxy Statement for its 2024 annual meeting of stockholders are incorporated by reference into Part III of this Annual Report on Form 10-K.
Auditor Firm ID: 34 Auditor Name: Deloitte & Touche LLP Auditor Location: New York, New York
MORGAN STANLEY DIRECT LENDING FUND
TABLE OF CONTENTS
|
|
|
|
|
|
|
|
|
| Part I |
|
|
| Item 1. |
|
|
| Item 1A. |
|
|
| Item 1B. |
|
|
| Item 1C. |
|
|
| Item 2. |
|
|
| Item 3. |
|
|
| Item 4. |
|
|
| Part II |
|
|
| Item 5. |
|
|
| Item 6. |
|
|
| Item 7. |
|
|
| Item 7A. |
|
|
| Item 8. |
|
|
| Item 9. |
|
|
| Item 9A. |
|
|
| Item 9B. |
|
|
| Item 9C. |
|
|
| Part III |
|
| Item 10. |
|
|
| Item 11. |
|
|
| Item 12. |
|
|
| Item 13. |
|
|
| Item 14. |
|
|
| Part IV |
|
|
| Item 15. |
|
|
SIGNATURES
EXPLANATORY NOTE
In this report, except where the context suggests otherwise:
•the terms “we,” “us,” “our,” and the “Company” refer to Morgan Stanley Direct Lending Fund, a Delaware corporation, together with its consolidated subsidiaries, where applicable;
•the terms “Morgan Stanley” or the “Firm” refer to Morgan Stanley (NYSE: MS) and its consolidated subsidiaries. For the avoidance of doubt, we are not a subsidiary of or consolidated with Morgan Stanley. Furthermore, Morgan Stanley has no obligation, contractual or otherwise, to financially support us. Morgan Stanley has no history of financially supporting any of the other MS BDCs, even during periods of financial distress;
•the term “IM” refers to the Morgan Stanley Investment Management platform, which is Morgan Stanley’s investment management unit and represents one of Morgan Stanley’s three business segments;
•the term “MS Private Credit” refers to the U.S. private credit strategies within the private credit platform of IM;
•the terms “Adviser” or “Investment Adviser” refer to MS Capital Partners Adviser Inc., our investment adviser, an indirect, wholly owned and consolidated subsidiary of Morgan Stanley;
•the term “Administrator” refers to MS Private Credit Administrative Services LLC, our administrator, an indirect, wholly owned and consolidated subsidiary of Morgan Stanley;
•the term “MS BDCs” refers to the Company and the other business development companies, or BDCs, managed by our Adviser;
•the term “Common Stock” refers to our common stock, par value $0.001 per share; and
•references to “this Form 10-K” and “this report” are to this Annual Report on Form 10-K for the year ended December 31, 2023.
CAUTIONARY STATEMENT REGARDING FORWARD-LOOKING STATEMENTS
This report, including the documents we incorporate by reference into this report, contains forward-looking statements that involve substantial risks and uncertainties. Such statements involve known and unknown risks, uncertainties and other factors and you should not place undue reliance on such statements. These forward-looking statements are not historical facts, but rather are based on current expectations, estimates and projections about us, our current and prospective portfolio investments, our industry, our beliefs and opinions and our assumptions. Words such as “anticipates,” “expects,” “intends,” “plans,” “will,” “may,” “continue,” “believes,” “seeks,” “estimates,” “would,” “could,” “should,” “targets,” “projects,” “potential,” “predicts” and variations of these words and similar expressions are intended to identify forward-looking statements. These statements are not guarantees of future performance and are subject to risks, uncertainties and other factors, some of which are beyond our control and difficult to predict and could cause actual results to differ materially from those expressed or forecasted in the forward-looking statements, including:
•our future operating results;
•our business prospects and the prospects of our portfolio companies;
•risk associated with possible disruptions in our operations or the economy generally, including disruptions from the impact of global health events;
•uncertainty and changes in the general interest rate environment;
•general economic, political and industry trends and other external factors, including uncertainty surrounding the financial and political stability of the United States and other countries;
•the effect of an inflationary economic environment on our portfolio companies, our financial condition and our results of operations;
•the impact of interruptions in the supply chain on our portfolio companies;
•our contractual arrangements and relationships with third parties;
•actual and potential conflicts of interest with our Adviser and its affiliates;
•the dependence of our future success on the general economy and its effect on the industries in which we invest;
•the ability of our portfolio companies to achieve their objectives;
•the timing and amount of cash flows, distributions and dividends, if any, from the operations of our portfolio companies;
•the use of borrowed money to finance a portion of our investments;
•the adequacy of our financing sources and working capital;
•the ability of our Adviser to locate suitable investments for us and to monitor and administer our investments;
•the ability of our Adviser and its affiliates to attract and retain highly talented professionals;
•our ability to maintain our qualification as a BDC and as a regulated investment company (“RIC”) under the Internal Revenue Code of 1986, as amended (the “Code”);
•the impact on our business of U.S. and international financial reform legislation, rules and regulations;
•currency fluctuations, particularly to the extent that we receive payments denominated in foreign currency rather than U.S. dollars, could adversely affect the results of our investments in foreign companies;
•the effect of changes in tax laws and regulations and interpretations thereof; and
•the risks, uncertainties and other factors we identify under “Item 1A. Risk Factors” and elsewhere in this report.
Although we believe that the assumptions on which these forward-looking statements are based are reasonable, any of the assumptions could prove to be inaccurate, and as a result, the forward-looking statements based on those assumptions also could be inaccurate. In light of these and other uncertainties, the inclusion of a projection or forward-looking statements in this report should not be regarded as a representation by us that our plans and objectives will be achieved. These risks and uncertainties include those described or identified in the section entitled “Item 1A. Risk Factors” and elsewhere in this report. You should not place undue reliance on these forward-looking statements, which apply only as of the date of this report. Moreover, we assume no duty and do not undertake to update the forward-looking statements. You are advised to consult any additional disclosures that we make directly to you or through reports that we have filed or in the future file with the Securities and Exchange Commission (the “SEC”), including Annual Reports on Form 10-K, Quarterly Reports on Form 10-Q and Current Reports on Form 8-K.
You should understand that under Section 27A(b)(2)(B) of the Securities Act of 1933, as amended (the “Securities Act”), Section 21E(b)(2)(B) of the Securities Exchange Act of 1934, as amended (the “Exchange Act”), and the “safe harbor” provisions of the Private Securities Litigation Reform Act of 1995 do not apply to forward-looking statements made in periodic reports we file under the Exchange Act.
Part I
Item 1. Business
We are a non-diversified, externally managed specialty finance company focused on lending to middle-market companies. We have elected to be regulated as a BDC under the Investment Company Act of 1940, as amended (the “1940 Act”). For U.S. federal income tax purposes, we have elected to be treated, and intend to comply with the requirements to qualify annually, as a RIC under Subchapter M of the Code. We are externally managed by the Adviser, an indirect, wholly owned subsidiary of Morgan Stanley. We are not a subsidiary of, or consolidated with, Morgan Stanley.
Our investment objective is to achieve attractive risk-adjusted returns via current income and, to a lesser extent, capital appreciation by investing primarily in directly originated senior secured term loans issued by U.S. middle-market companies in which private equity sponsors have a controlling equity stake in the portfolio company. For the purposes of this report, “middle-market companies” refers to companies that, in general, generate annual earnings before interest, taxes, depreciation and amortization, or EBITDA, in the range of approximately $15 million to $200 million, although not all of our portfolio companies will meet this criterion.
We invest primarily in directly originated senior secured term loans including first lien senior secured term loans (including unitranche loans) and second lien senior secured term loans, with the balance of our investments expected to be in higher-yielding assets such as mezzanine debt, unsecured debt, equity investments and other opportunistic asset purchases. Typical middle-market senior loans may be issued by middle-market companies in the context of leveraged buyouts, or LBOs, acquisitions, debt refinancings, recapitalizations, and other similar transactions. We generally expect our debt investments to have a stated term of five to eight years and typically to bear interest at a floating rate usually determined on the basis of a benchmark such as the Secured Overnight Financing Rate, or SOFR.
We generate revenues primarily in the form of interest income from investments we hold. In addition, we generate income from dividends or distributions of income on any direct equity investments, capital gains on the sale of loans and debt and equity securities, and various other loan origination and other fees, including commitment, origination, amendment, structuring, syndication or due diligence fees, fees for providing managerial assistance and consulting fees.
The middle-market loans in which we generally invest are typically not rated by any rating agency, but we believe that if they were rated, they would be below investment grade (rated lower than “Baa3” by Moody’s Investors Service, lower than “BBB-” by Fitch Ratings or lower than “BBB-” by Standard & Poor’s Ratings Services), which under the guidelines established by these rating agencies is an indication of having predominantly speculative characteristics with respect to the issuer’s capacity to pay interest and repay principal. Debt instruments that are rated below investment grade are sometimes referred to as “high yield bonds” or “junk bonds.”
Our investment approach is focused on long-term credit performance, risk mitigation and preservation of principal. Utilizing our proprietary investment approach, we intend to execute on our investment objective by (1) drawing upon the Adviser’s and the Firm’s longstanding and deep relationships with middle-market companies, private equity sponsors, commercial and investment banks, industry executives and financial intermediaries to provide a strong pipeline of investment opportunities, (2) implementing the Adviser’s rigorous, fundamentals-driven and disciplined investment and risk management process, (3) drawing on the investment committee’s extensive experience in credit and principal investing, credit analysis and structuring, and (4) accessing Morgan Stanley’s global resources.
By leveraging the established origination and underwriting capabilities within the MS Private Credit platform and targeting an attractive investing area in the U.S. middle-market, we believe we are able to offer attractive risk-adjusted returns to our investors. Despite recent market volatility, we believe the middle-market direct lending market environment continues to be attractive. We remain highly focused on conducting extensive due diligence and leveraging the Morgan Stanley platform. We continue to seek to invest in companies that are led by strong management teams, generate substantial free cash flow, have leading market positions, benefit from sustainable business models, and are well positioned to perform well despite the impact of recent market volatility. We believe the current market environment offers opportunities to seek compelling risk adjusted returns. Our investment pace will depend on several factors including the market environment, including the current inflationary economic environment, and deal flow.
On December 23, 2019, we completed our initial closing, or (“Initial Closing”), of capital commitments to purchase shares of our Common Stock in a private placement pursuant to subscription agreements with investors (the “Subscription Agreements”). As of December 31, 2023 all of our capital commitments have been called.
On January 26, 2024, we closed our initial public offering (“IPO”), issuing 5,000,000 shares of our Common Stock at a public offering price of $20.67 per share. Net of underwriting fees, we received net cash proceeds, before offering expenses, of approximately $97.1 million. Our Common Stock began trading on The New York Stock Exchange ("NYSE") under the symbol “MSDL” on January 24, 2024.
The Adviser
We entered into an investment advisory agreement with our Adviser on November 25, 2019 (the “Original Investment Advisory Agreement”), which was most recently renewed in August 2023.
On January 24, 2024, in connection with our IPO, we entered into an amended and restated investment advisory agreement with our Adviser (the “Amended and Restated Investment Advisory Agreement” and together with the Original Investment Advisory Agreement, the “Investment Advisory Agreement”). Pursuant to the Investment Advisory Agreement, we pay the Adviser a fee for investment advisory and management services consisting of two components — a base management fee and an incentive fee. The Amended and Restated Investment Advisory Agreement incorporates (i) a cumulative three-year lookback provision and (ii) a cap on quarterly income incentive fee payments based on net realized capital loss, if any, during the applicable three-year lookback period. For a one-year period commencing on the date of execution of the Amended and Restated Investment Advisory Agreement, the Adviser has also agreed to waive any portion of the base management fee in excess of 0.75% and each component of the incentive fee above 15%. The Amended and Restated Investment Advisory Agreement will continue from year to year if approved annually by a majority of our stockholders or a majority of the Board of Directors, including a majority of the directors who are not “interested persons” as defined in Section 2(a)(19) of the 1940 Act, or the Independent Directors. The Amended and Restated Investment Advisory Agreement was initially approved by the Board in September 2023, subject to the completion of our IPO. For more information, see “Investment Advisory Agreement” below.
Morgan Stanley launched its private credit platform in 2010. The private credit platform includes dedicated strategies targeting different credit products, asset yields and issuer sizes, resulting in a platform that we believe is well positioned to provide scale and flexible financing solutions to borrowers, maximize deal origination and enhance the ability to generate attractive risk adjusted returns for our stockholders. These strategies include U.S. private credit (referred to herein as MS Private Credit), European private credit and tactical credit.
Our Adviser, an indirect, wholly owned subsidiary of Morgan Stanley, was established in 2007 and serves as the investment adviser for various funds, accounts and strategies, including the funds and accounts on the MS Private Credit platform, including the MS BDCs, and managed approximately $18.5 billion in committed capital1 as of January 1, 2024.
MS Private Credit’s primary areas of focus include:
•Direct Lending. As of December 31, 2023, the Direct Lending strategy includes us and the other MS BDCs advised by our Adviser and other funds and separately managed accounts. Investments made primarily in directly originated first lien senior secured and second lien senior secured loans, mezzanine notes, unsecured debt, preferred stock, and common stock issued by U.S. middle-market companies owned by private equity firms, typically, although not always, with annual EBITDA of up to $200 million. As of January 1, 2024, Direct Lending managed approximately $15.6 billion in committed capital.
•Opportunistic Credit. Investments made primarily in complex assets, unusual credit situations or companies experiencing difficulties in sourcing capital. Other potential investments included in this category may include purchasing public or private securities in the open market at deep discounts to their fundamental value. Investments are made primarily in first lien senior secured and second lien senior secured loans, mezzanine notes, unsecured debt, preferred stock and common stock issued by U.S. middle-market companies, typically, although not always, with annual EBITDA of $10 million to $100+ million. As of January 1, 2024, Opportunistic Credit managed approximately $2.9 billion in committed capital.
Our Adviser’s investment committee servicing us, or the Investment Committee, is comprised of ten senior investment professionals of IM and is chaired by Jeffrey S. Levin, our Chief Executive Officer and President and a member of our Board of Directors. The Investment Committee members have an average of over 23 years of relevant industry experience and have experience investing across multiple credit cycles and different investing environments, including the global financial crisis of 2008. All investment decisions are reviewed and approved by the Investment Committee, which has principal responsibility for approving new investments and overseeing the management of existing investments.
Our Adviser is served by experienced investment professionals, or the Investment Team, within the MS Private Credit platform. The Investment Team is responsible for origination, due diligence, underwriting, structuring and monitoring each investment throughout its life cycle. In addition to our executive officers and their support teams, the MS Private Credit platform is supported by numerous professionals in legal, compliance, risk management, finance, accounting and tax who help support the platform by providing guidance on our operations.
Morgan Stanley, the parent of our Adviser, is a global financial services firm whose predecessor companies date back to 1924 and, through its subsidiaries and affiliates, advises, originates, trades, manages and distributes capital for governments, institutions and individuals. Morgan Stanley maintains a significant market position in each of its business divisions-Institutional Securities Group, or ISG, Wealth Management, or WM, and IM. We are not a subsidiary of or consolidated with Morgan Stanley and Morgan Stanley does not guarantee any of our financial obligations.
IM is a global investment manager, delivering innovative investment solutions across public and private markets. As of December 31, 2023, IM managed approximately $1.5 trillion in assets under management across its business lines, which include equity, fixed income, liquidity, real assets and private investment funds.
1 Committed capital is calculated as aggregate capital commitments received and total committed leverage within each of the funds or accounts with the exception for funds past their investment period, where committed capital is calculated as invested capital.
The Administrator
Our Administrator, an indirect, wholly owned subsidiary of Morgan Stanley, provides the administrative services necessary for us to operate pursuant to an administration agreement, dated November 25, 2019, between us and the Administrator (the “Administration Agreement”). The Administration Agreement was most recently renewed by our Board of Directors in August 2023.
We pay our Administrator our allocable portion of certain expenses incurred by our Administrator in performing its obligations under the Administration Agreement, including our allocable portion of the cost of our Chief Financial Officer and Chief Compliance Officer. Our Administrator is reimbursed for certain expenses it incurs on our behalf. Our Administrator reserves the right to waive all or part of any reimbursements due from us at its sole discretion. See “— Administration Agreement” below for a discussion of the expenses that we reimburse to the Administrator (subject to the review and approval of our Independent Directors).
Investment Strategy
Our primary investment strategy is to make privately negotiated senior secured credit investments in U.S. middle-market companies that have leading market positions, enjoy high barriers to entry, such as high startup costs or other obstacles that prevent new competitors from easily entering the portfolio company’s industry or area of business, generate strong and stable free cash flow and are led by a proven management team with strong private equity sponsor backing. Our investment approach is focused on long-term credit performance, risk mitigation and preservation of capital. Our Adviser employs a highly rigorous, fundamentals-driven and disciplined investment process developed and refined by the investment professionals of the MS Private Credit platform. The Investment Team works on a particular transaction from origination to close and continues to monitor each investment throughout its life cycle.
We invest primarily in companies backed by leading private equity sponsors with strong track records. We believe lending to sponsor-backed companies (or companies where private equity sponsors hold a controlling equity position) versus non-sponsor-backed companies (or companies where private equity sponsors do not hold a controlling equity position) has many distinct potential advantages including:
•Strong, predictable deal flow given significant private equity committed capital;
•Well-capitalized borrowers, including potential access to additional capital from sponsors, if needed;
•Access to detailed financial, operational, industry data, and third-party legal and accounting due diligence reports conducted by the sponsor as part of their due diligence;
•Proper oversight and governance provided by an experienced management team and a board of directors, as well as other industry and/or operating expertise from the sponsors;
•Natural alignment of interests between lender and sponsor given focus on exit strategy; and
•Supplemental diligence beyond the credit analysis of the borrower, given the ability to analyze track records of each private equity firm.
We have created what we believe is a defensive portfolio of investments focusing on generally avoiding issuer or industry concentration in order to mitigate risk and achieve our investment objective.
We focus primarily on U.S. middle-market companies. However, to the extent that we invest in foreign companies, we intend to do so in accordance with the limitations under the 1940 Act and only in jurisdictions with established legal frameworks and a history of respecting creditor rights, including the United Kingdom and countries that are members of the European Union, as well as Canada, Australia and Japan. Our investment strategy is predicated on seeking to lend to companies with proven management teams in what we believe to be non-cyclical industry sectors. As of December 31, 2023, our exposure to businesses that the Adviser believes may be subject to business cycle volatility, was approximately 6.0% of our gross investment commitments in our debt portfolio. Additionally, we typically avoid direct exposure to investments in certain sectors such as in companies whose primary revenues are related to retail, restaurants, energy, alcohol, tobacco, pork manufacturing, gaming and gambling, and pornography, and for the avoidance of doubt, investments in such sectors is separate and apart from ESG (as defined below) considerations described below. See “—Investment Process—Due Diligence & Structuring” below.
Investment Criteria
In order to achieve our investment objectives, we seek to build an investment portfolio that consists primarily of directly originated floating-rate first lien senior secured term loans (including unitranche loans), and second lien senior secured term loans of U.S. middle-market companies. The balance of our investments is expected to be in higher-yielding assets such as mezzanine debt, unsecured debt and equity investments in U.S. middle-market companies, and other opportunistic asset purchases. Our debt investments typically have maturities of five to eight years. We seek to create and have created what we believe is a defensive portfolio of investments focusing on generally avoiding issuer or industry concentration in order to mitigate risk and achieve our investment objective.
We expect our target portfolio companies to exhibit some, or all, of the following characteristics at the time of the initial investment, although not all of our portfolio companies will meet these criteria:
•EBITDA of $15 – $200 million;
•Defensible, leading market positions;
•Unique or specialized strategy or other meaningful barriers to entry;
•Low technology or market risks;
•Diversified product offering, customer and supplier base;
•Stable cash flows;
•Low capital expenditure requirements;
•General avoidance of what we believe to be cyclical industry sectors;
•Predominantly North American base of operations;
•Typical loan-to-value of up to 60%; and
•Experienced management teams with successful track records.
Key themes of our investment strategy include:
•Maintaining an appropriate allocation of first lien senior secured and second lien senior secured debt to allow us to achieve attractive returns within the targeted risk profile, while investing prudently based on the market and economic environment;
•Performing thorough fundamental business and industry due diligence;
•Conducting in-depth due diligence on management teams and sponsors to bolster our position that we are investing in businesses led by experienced professionals;
•Structuring investments focused on providing us with security, covenant protection and current income while seeking to provide our borrowers with adequate liquidity and flexibility to operate; and
•Ongoing active management of our portfolio companies through consistent dialogue with management and/or the sponsor, review of financial reporting, monitoring of key performance indicators and evaluation of exit strategies.
Market Opportunity
We believe the middle-market direct lending market environment continues to be attractive, despite the recent market volatility resulting from elevated inflation and broader macroeconomic uncertainty.
Demand for Direct Lending Solutions
We believe that demand has increased for financing from direct lenders relative to other sources because of the attractiveness of the product as well as structural and market factors. According to Preqin, private credit’s share of the sub-investment grade credit market, relative to the high yield and syndicated loan markets, has increased from 3% in 2010 to 22% as of June 30, 2023.
•We believe that when sponsors experience the flexibility of private credit transactions and the speed and certainty of execution, they will continue to seek financing from non-bank lenders. We believe this presents a compelling opportunity for us to invest in quality companies on attractive terms and conditions.
•Bank participation in middle-market secured loans decreased in recent years. We believe recent market-driven disruptions in the regional bank sector could further constrain bank capacity for middle-market secured lending.
•Certain private equity sponsors who historically sought to finance their transactions in the public, syndicated markets have turned to private credit providers, including us, to finance their transactions.
Large and Growing U.S. Middle-Market
We believe U.S. middle-market companies represent a large and growing opportunity set and will likely require additional amounts of private debt financing for various purposes.
•Recent data from Refinitiv LPC, a premier global provider of information on the syndicated loan and high yield bond markets, indicates that there are approximately $618 billion of middle-market loans with maturities between the second quarter of 2023 and the fourth quarter of 2029 that will likely require a refinancing event.
•In addition, data from Preqin, shows that as of December 31, 2023, there was more than $1,045 billion of raised, but not yet invested, capital by global private equity managers, representing a sizeable pool of support for both new and existing investments.
We expect that these two important dynamics will provide for significant financing opportunities for lenders like us who have longstanding and deep relationships with middle-market private equity firms.
Attractive Attributes of Middle Market Direct Lending
We believe that focusing on lending to private equity owned middle-market businesses will provide for attractive risk adjusted return opportunities, due to a series of structural and market factors. We have generally witnessed an improvement in terms in recent periods, including higher reference rates, still-elevated spreads, conservative leverage profiles and lender-friendly documentation. Although leveraged buyout activity has remained relatively subdued in recent quarters, the private credit market has continued to present high quality opportunities, that could offer compelling risk-adjusted returns.
•Middle-market companies, we believe, typically have less leverage, larger equity contributions, lower rates of default, and achieve higher recoveries as compared to broadly syndicated loans. We believe middle-market loans also tend to garner more attractive pricing, conservative structures, tighter legal documentation, meaningful financial covenants, and provide for greater access to management than broadly syndicated loans. Furthermore, we believe middle-market loans often avoid riskier large deal debt characteristics such as covenant-lite structures. Maintaining financial covenants allows us to diagnose and respond to borrower underperformance typically before value materially erodes. We believe it is this more conservative loan structuring that also contributes to the better overall performance of middle-market loans.
Competitive Advantages
We believe we are able to execute on our investment objective and achieve attractive risk-adjusted returns as a result of our competitive strengths. In addition to the Adviser’s relationships with middle market private equity firms, the Firm has relationships with many middle-market private equity firms and middle-market companies that may provide significant investment opportunities. MS Private Credit is the primary private credit investment management platform of the Firm. The Adviser capitalizes on the significant number of lending opportunities with middle-market companies through relationships established by the Firm and otherwise. We believe the large volume of potential lending opportunities and scale of the MS Private Credit origination and due diligence platform allows us to increase investment selectivity and potentially enhance risk-adjusted returns.
Ability to Leverage Morgan Stanley’s Relationships and Network
Morgan Stanley has a substantial network of business relationships with individuals, companies, institutions and governments in the United States and around the world which we believe is a potential source of investment opportunities for us and differentiates us relative to other BDCs. Additionally, we believe that this network may potentially assist our portfolio companies through our efforts to make introductions and referrals to the investment banking and capital markets services of the Firm.
In all cases, subject to applicable laws, rules and regulations, information barriers, confidentiality provisions and policies and procedures, our Adviser utilizes Morgan Stanley’s global resources throughout the life cycle of each investment. The Investment Teams consult with teams across IM, ISG (and its business units, Investment Banking, Sales and Trading, Commodities and Equity and Fixed Income Research) and WM to assess potential investments and determine the investment opportunities to which we should devote substantial time and resources. Upon the consummation of a transaction, our Adviser monitors each portfolio company investment. We believe that we benefit, where appropriate, from the expertise, infrastructure, track record, relationships and institutional knowledge of Morgan Stanley.
Access to certain parts of Morgan Stanley may be limited in certain instances by a number of factors, including third-party confidentiality obligations and information barriers established by Morgan Stanley in order to manage compliance with applicable law and potential conflicts of interest and regulatory restrictions, including without limitation joint transaction restrictions pursuant to the 1940 Act and internal policies and procedures. The investment sources described above are not necessarily indicative of all sources that the Adviser may utilize in sourcing investments for us. There can be no assurance that the Adviser will be able to source investments from any one or more parts of the Morgan Stanley network, implement our strategy, achieve our investment objectives, find investments that fit its investment criteria or avoid substantial losses. See “Part 1—Item 1A. Risk Factors—Risks Relating to Our Business and Structure—There are significant potential conflicts of interest that could affect our investment returns.”
Highly Differentiated Deal Sourcing Advantages
We believe the relationships that the Investment Team maintains with sponsors, commercial and investment banks, industry executives and financial intermediaries provides a strong pipeline of proprietary investment opportunities. However, unlike many other competing alternative lending strategies, our Adviser operates within a global financial institution with multiple groups within the Firm. We expect the broader Morgan Stanley platform to be a source of potential lending opportunities. We believe this position within the Firm is a key factor that differentiates us and constitutes a meaningful competitive advantage relative to other private credit funds and BDCs.
Distinctive Approach to Credit Investing and Due Diligence
We believe that our Adviser utilizes an investment approach that is differentiated in the industry. Our Adviser employs a highly rigorous, fundamentals-driven and disciplined investment process which has been developed utilizing Morgan Stanley’s extensive investing experience. The Adviser generally seeks to invest in companies that have leading, defensible market positions, generate strong and stable free cash flow, and have high barriers to entry, highly capable management teams and strong private equity sponsor ownership.
We believe that our Adviser’s investment approach coupled with our portfolio construction strategy, flexible capital, and focus on financial covenant protection, differentiates us from our competitors.
Experienced and Accomplished Investment Team & Investment Committee
The Investment Team is led by investment professionals with extensive experience in credit and principal investing, credit analysis, credit origination and structuring. Jeffrey S. Levin, our Chief Executive Officer and President, and member of the Board of Directors, has principal management responsibility for us and serves as Chair of the Investment Committee. Mr. Levin has over 22 years of experience in direct lending, mezzanine lending, credit investing and leveraged finance, and he also currently serves as the Chief Executive Officer and President and a member of the board of directors of each of the MS BDCs. Prior to that, through his tenure at The Carlyle Group as Managing Director and Partner, a member of the management team of the Carlyle private credit platform and as President of certain BDCs managed by affiliates of The Carlyle Group, he also has direct experience in successfully capitalizing and managing BDCs. Before working at The Carlyle Group, Mr. Levin was a founding member of the MS Private Credit platform.
The Investment Committee members have an average of over 23 years of relevant industry experience. The Investment Committee is comprised of senior members of IM and provides guidance to the Investment Team throughout the investment process.
In addition, the Investment Team has strong private equity sponsor and intermediary relationships and a highly developed network within Morgan Stanley. Collectively, the investment professionals of the Adviser have substantial leveraged lending experience, and we believe the Investment Team is well positioned to generate attractive risk-adjusted returns.
Efficient Expense Model
We believe that we have an efficient expense model, as compared to other publicly traded BDCs, based on our low operating expense rate as well as our low management fees. We believe that our efficient expense model reinforces our focus on alignment with stockholders and enhances the potential returns we are able to generate.
MS Credit Partners Holdings Investment
MS Credit Partners Holdings, Inc., or MS Credit Partners Holdings, an indirect, wholly owned subsidiary of Morgan Stanley and an affiliate of the Investment Adviser, made an equity investment of $200.0 million to us pursuant to a subscription agreement initially entered into in December 2019, and which was fully funded as of October 4, 2023. As of December 31, 2023 and December 31, 2022, MS Credit Partners Holdings held approximately 11.7% and 11.9% of our outstanding shares of Common Stock, respectively. Morgan Stanley has no other obligation, contractual or otherwise, to financially support us. Morgan Stanley has no history of financially supporting any of the BDCs on the MS Private Credit platform, even during periods of financial distress.
Investment Process
Our investment activities are managed by our Adviser. Our Adviser is responsible for origination, underwriting, structuring and monitoring our investments.
The Adviser’s investment process has five stages: Origination, Preliminary Screen, Due Diligence & Structuring, Investment Committee Approval & Closing and Portfolio Management, and it employs the same rigorous and disciplined investment process to all types of investments. The Investment Team works on a particular transaction from origination to close and continues to monitor each investment throughout its life cycle.
Origination
We believe we benefit from the Adviser’s highly differentiated direct origination platform. The MS Private Credit origination platform is complemented by opportunities sourced by other Morgan Stanley divisions and businesses.
The Firm has deep relationships with many middle-market private equity firms and middle-market companies that may provide significant investment opportunities. MS Private Credit is the primary private credit investment management platform across the Firm. The Adviser seeks to capitalize on a significant number of lending opportunities with middle-market companies through relationships established by the Firm.
We believe the large volume of untapped potential lending opportunities and the scale of the MS Private Credit origination and due diligence platform allows us to increase investment selectivity and potentially enhance risk-adjusted returns.
Preliminary Screen
An initial review of each investment opportunity is conducted by the Investment Team to determine whether it is consistent with our investment objectives and credit standards. If the opportunity fits our investment objective and 1940 Act requirements, the opportunity is further evaluated by the Investment Team.
The Investment Team utilizes the extensive industry expertise resident in IM and ISG (subject in all cases to applicable regulations, confidentiality provisions, information barriers and policies and procedures) to assist in this preliminary evaluation. Access to these resources allows the Investment Team to assess each opportunity quickly and effectively and enables it to focus only on compelling opportunities.
If the members of the Investment Team conducting the initial review conclude that the investment opportunity meets our objectives, the Investment Team prepares a screening memo which is discussed with a subset of the Investment Committee at a Preliminary Screen meeting. At a Preliminary Screen meeting, the Investment Team presents an overview of the business, proposed capital structure, proposed terms (if applicable at this stage), key investment highlights and risks, and preliminary financial analysis. Opportunities that are approved at the Preliminary Screen meeting advance to the Due Diligence & Structuring phase.
Due Diligence & Structuring
All investment opportunities that pass the Preliminary Screen are subject to a comprehensive due diligence process. The Adviser uses both internal and external resources in its due diligence process including leveraging the extensive industry expertise resident in Morgan Stanley’s businesses (subject in all cases to applicable regulations, confidentiality provisions, information barriers and policies and procedures). Diligence typically involves meeting with company management and the private equity sponsor to achieve a comprehensive understanding of the portfolio company’s competitive positioning, competitive advantage, company strategy and risks and mitigants associated with the proposed investment.
Additionally, the Investment Team, to the extent applicable, conducts supplemental diligence including:
•Financial analysis;
•Capital structure review;
•Covenant analysis;
•Review of third-party due diligence reports (financial, industry, legal, technology, insurance and/or environmental);
•Industry research;
•Customer calls;
•Industry expert calls;
•Management background checks;
•Consideration of environmental, social and governance ("ESG") issues; and
•Negotiation of legal documentation.
The Investment Team reviews ESG considerations as part of its due diligence process. As a part of ESG due diligence, the Investment Team evaluates each potential borrower utilizing a standard ESG template to determine an ESG score for each potential borrower. Borrowers who score beneath an internally set threshold require additional discussion and consideration by the Investment Committee. The identification of a material ESG risk will not necessarily be determinative in our Adviser’s decision to lend to a potential borrower and we may invest in portfolio companies that score poorly in our Adviser’s ESG due diligence. In addition, material ESG issues are reported and discussed as part of the Adviser’s ongoing portfolio management processes on a regular basis.
Investment Committee Approval & Closing
The Investment Committee is engaged throughout the investment process to provide guidance on best practices, industry expertise and related deal experience drawn from their relevant experience.
Based on the findings in the Due Diligence & Structuring phase, the Investment Team prepares a detailed memo that is presented to the Investment Committee. A majority of the Investment Committee, including approval by Mr. Levin, must approve a transaction in order for us to pursue the opportunity. Once approved, the Investment Team works towards closing and funding the investment. Any changes to the investment after approval along with key legal terms are documented and circulated to the Investment Committee prior to closing in the form of a closing memo.
Portfolio Monitoring and Risk Management
We believe that proactive monitoring of our portfolio companies is an important part of the investment process. The Adviser engages in formal and informal dialogue with portfolio company management teams, private equity sponsors, suppliers and customers, as appropriate, through conversations facilitated, in part, by the Firm’s global network in an attempt to give us an ongoing advantage relative to other investors. The Adviser receives monthly or quarterly financial reports from portfolio companies. This information access and ongoing interactions with portfolio companies and sponsors should provide the Adviser with the ability to anticipate any potential performance or liquidity issues at an early stage and to work proactively toward mitigating potential losses. Our Adviser holds quarterly portfolio reviews. In conjunction with the quarterly portfolio reviews, the Adviser compiles a quarterly risk report that examines, among other things, migration in portfolio and loan level investment mix, industry diversification, ESG review, Internal Risk Ratings, revenue, EBITDA and leverage.
Frequency of review of individual loans is determined on a case-by-case basis, based on an Internal Risk Rating, total exposure and other criteria set forth by the Investment Committee. Performing loans, or loans on which the borrower has historically made payments of principal and interest on time, are typically discussed every quarter, while any loan that has been downgraded under our Internal Risk Rating scale is typically discussed quarterly at a minimum and more frequently as appropriate.
In addition, the Adviser holds monthly “watchlist” meetings which include a discussion of all transactions that have been downgraded, or are at risk for downgrade, under our Adviser’s Internal Risk Rating system.
As part of the monitoring process, our Adviser has developed risk policies pursuant to which it regularly assesses the risk profile of each of our debt investments. Our Adviser has developed a classification system to group investments into four categories. The investments are evaluated regularly and assigned a category based on certain credit metrics. Our Adviser’s ratings do not constitute any rating of investments by a nationally recognized statistical rating organization or represent or reflect any third-party assessment of any of our investments. Please see below for a description of the four categories of the Adviser’s Internal Risk Rating system:
|
|
|
|
|
|
| Risk Rating 1 |
In the opinion of our Adviser, investments in Risk Rating 1 involve the least amount of risk relative to our initial cost basis at the time of origination or acquisition. Risk Rating 1 investments performance is above our initial underwriting expectations and the business trends and risk factors are generally favorable, which may include the performance of the portfolio company, or the likelihood of a potential exit. |
|
|
| Risk Rating 2 |
In the opinion of our Adviser, investments in Risk Rating 2 involve a level of risk relative to our initial cost basis at the time of origination or acquisition. Risk Rating 2 investments are generally performing in line with our initial underwriting expectations and risk factors to ultimately recoup the cost of our principal investment and are neutral to favorable. All new originated or acquired investments are initially included in Risk Rating 2. |
|
|
| Risk Rating 3 |
In the opinion of our Adviser, investments in Risk Rating 3 indicate that the risk to our ability to recoup the initial cost basis at the time of origination or acquisition has increased materially since the origination or acquisition of the investment, such as declining financial performance and non-compliance with debt covenants; however principal and interest payments are not more than 120 days past due. |
|
|
| Risk Rating 4 |
In the opinion of our Adviser, investments in Risk Rating 4 involve a borrower performing substantially below expectations and indicate that the loan’s risk has increased substantially since origination or acquisition. Most or all of the debt covenants are out of compliance and payments are substantially delinquent. For Risk Rating 4 investments, it is anticipated that we will not recoup our initial cost basis and may realize a substantial loss of our initial cost basis at the time of origination or acquisition upon exit. |
Our Adviser rates the investments in our portfolio at least quarterly, and it is possible that the rating of a portfolio investment may be changed over time. For investments rated 3 or 4, our Adviser enhances its level of scrutiny over the monitoring of such portfolio company by conducting a formal review of the portfolio company on a monthly basis and taking any actions deemed appropriate from the results of such review. Refer to “Item 7. Management’s Discussion and Analysis of Financial Condition and Results of Operations—Portfolio, Investment Activity and Results of Operations.” for further details.
Beyond the policies and protocols detailed above, our Investment Team performs analysis and projections in response to market conditions to assess potential exposure to our portfolio. Sample analysis includes evaluation of the impact from market, economic and geopolitical conditions that may from time to time result in periods of capital markets volatility and economic uncertainty.
The Internal Risk Ratings do not constitute any rating of investments by a nationally recognized statistical rating organization or represent or reflect any third-party assessment of any of our investments.
Allocation of Investment Opportunities and Potential Conflicts of Interest; Co-Investment Opportunities
As a diversified global financial services firm, Morgan Stanley engages in a broad spectrum of activities. In the ordinary course of its business, Morgan Stanley is a full-service investment banking and financial services firm and therefore engages in activities where Morgan Stanley’s interests or the interests of its clients may conflict with the interests of our stockholders. Morgan Stanley has advised and may advise clients and has sponsored, managed or advised Affiliated Investment Accounts (as defined below) with a wide variety of investment objectives that in some instances may overlap or conflict with our investment objectives and present conflicts of interest. Certain members of the Investment Team and the Investment Committee will make investment decisions on behalf of Affiliated Investment Accounts, including Affiliated Investment Accounts with investment objectives that overlap with ours. The term “Affiliated Investment Accounts” includes certain alternative investment funds, regulated funds and investment programs, accounts and businesses that are advised by or affiliated with the Adviser or its affiliates or through which IM otherwise conducts its business, together with any new or successor to such funds, programs, accounts or businesses. For instance, the Adviser serves as the investment adviser to the other MS BDCs, whose investment objectives overlap with our investment objectives. For the avoidance of doubt, we are not a subsidiary of or consolidated with Morgan Stanley. Furthermore, Morgan Stanley has no obligation, contractual or otherwise, to financially support us. See “Item 7 — Management’s Discussion and Analysis of Financial Condition and Results of Operations — MS Credit Partners Holdings Investment.” Morgan Stanley has no history of financially supporting any of the BDCs on the MS Private Credit platform, even during periods of financial distress.
Competition
Our primary competitors in providing financing to middle-market companies include public and private investment funds, other BDCs, commercial finance companies and, to the extent they provide an alternative form of financing, private equity, mezzanine and hedge funds, as well as issuers of collateralized loan obligations ("CLOs") and other structured loan funds, and to a lesser extent, commercial and investment banks. Some of our potential competitors may be more experienced and may have more resources than we do. For example, some competitors may have a lower cost of funds and access to funding sources that are not available to us. Our competitors have incurred, or may in the future incur, leverage to finance their debt investments at levels or on terms more favorable than those available to us. In addition, some of our competitors may have higher risk tolerances or different risk assessments than we do, which could allow them to consider a wider variety of investments and establish more relationships than us.
Among other factors, the returns on investments available in the marketplace are a function of the supply of investment opportunities and the amount of capital investing in such opportunities. Strong competition for investments, including from new competitors, could result in fewer investment opportunities and less favorable pricing for us, as our competitors target the same or similar investments that we intend to purchase. Moreover, identifying attractive investment opportunities is difficult and involves a high degree of uncertainty. For additional information concerning the competitive risks we face, see “Item 1A. Risk Factors — Risks Relating to Our Business and Structure — We operate in a highly competitive market for investment opportunities, which could reduce returns and result in losses.”
Implications of Being an Emerging Growth Company
We currently are and expect to remain an “emerging growth company,” as defined in the Jumpstart Our Business Startups Act of 2012, as amended (the “JOBS Act”), until the earliest of:
•the last day of our fiscal year in which the fifth anniversary of our IPO occurs;
•the end of the fiscal year in which our total annual gross revenues first exceed $1.235 billion;
•the date on which we have, during the prior three-year period, issued more than $1.0 billion in non-convertible debt; and
•the last day of a fiscal year in which we (1) have an aggregate worldwide market value of shares of our Common Stock held by non-affiliates of $700 million or more, computed at the end of each fiscal year as of the last business day of our most recently completed second fiscal quarter and (2) have been an Exchange Act reporting company for at least one year (and filed at least one annual report under the Exchange Act).
Under the JOBS Act and the Dodd-Frank Wall Street Reform and Consumer Protection Act (“Dodd-Frank Act”), we are exempt from the provisions of Section 404(b) of the Sarbanes-Oxley Act of 2002, as amended, or the Sarbanes-Oxley Act, which would require that our independent registered public accounting firm provide an attestation report on the effectiveness of our internal control over financial reporting, until such time as we cease to be an emerging growth company and become an accelerated filer as defined in Rule 12b-2 under the Exchange Act. This may increase the risk that material weaknesses or other deficiencies in our internal control over financial reporting go undetected.
Under the JOBS Act, emerging growth companies can delay adopting new or revised accounting standards until such time as those standards apply to private companies. We have made an irrevocable election not to take advantage of this exemption from new or revised accounting standards. We therefore are subject to the same new or revised accounting standards as other public companies that are not emerging growth companies.
Investments
As of December 31, 2023, we had investments in 172 portfolio companies across 30 industries. Based on fair value as of December 31, 2023, approximately 99.9% of our debt portfolio was invested in debt bearing a floating interest rate, which floating rate debt investments primarily are subject to interest rate floors. Our weighted average total yield of investments in debt securities at amortized cost was 12.0%. Weighted average yields include the effect of accretion of discounts and amortization of premiums and are based on interest rates as of December 31, 2023.
As of December 31, 2022, we had investments in 150 portfolio companies across 30 industries. Based on fair value as of December 31, 2022, approximately 100% of our debt portfolio was invested in debt bearing a floating interest rate, which floating rate debt investments primarily are subject to interest rate floors. Approximately 99.4% of our debt portfolio at fair value had an interest rate floor denoted in LIBOR or SOFR. Our weighted average total yield of investments in debt securities at amortized cost was 10.9%. Weighted average yields include the effect of accretion of discounts and amortization of premiums and are based on interest rates as of December 31, 2022.
The composition of our investment portfolio at cost and fair value is as follows (dollar amounts in thousands):
|
|
|
|
|
|
|
|
|
|
|
|
|
|
|
|
|
|
|
|
|
|
|
|
|
|
|
|
|
|
|
|
|
|
|
|
|
|
|
|
|
December 31, 2023 |
|
December 31, 2022 |
|
|
Cost |
|
Fair Value |
|
% of Total Investments at Fair Value |
|
Cost |
|
Fair Value |
|
% of Total Investments at Fair Value |
| First Lien Debt |
|
$ |
3,027,413 |
|
|
$ |
3,004,544 |
|
|
94.1 |
% |
|
$ |
2,753,620 |
|
|
$ |
2,694,111 |
|
|
93.8 |
% |
| Second Lien Debt |
|
146,014 |
|
|
132,415 |
|
|
4.1 |
|
|
136,620 |
|
|
128,350 |
|
|
4.5 |
|
| Other Investments |
|
53,349 |
|
|
56,602 |
|
|
1.8 |
|
|
49,406 |
|
|
51,127 |
|
|
1.7 |
|
| Total |
|
$ |
3,226,776 |
|
|
$ |
3,193,561 |
|
|
100.0 |
% |
|
$ |
2,939,646 |
|
|
$ |
2,873,588 |
|
|
100.0 |
% |
The industry composition of our investments at fair value is as follows:
|
|
|
|
|
|
|
|
|
|
|
|
|
|
|
|
|
|
|
|
December 31, 2023 |
|
December 31, 2022 |
(1) |
| Aerospace & Defense |
|
2.2 |
|
% |
1.8 |
|
% |
| Air Freight & Logistics |
|
1.1 |
|
|
1.1 |
|
|
| Automobile Components |
|
3.5 |
|
|
3.8 |
|
|
| Automobiles |
|
4.7 |
|
|
5.1 |
|
|
| Biotechnology |
|
0.5 |
|
|
0.5 |
|
|
| Chemicals |
|
0.6 |
|
|
0.6 |
|
|
| Commercial Services & Supplies |
|
9.6 |
|
|
11.2 |
|
|
| Construction & Engineering |
|
1.5 |
|
|
1.3 |
|
|
| Containers & Packaging |
|
1.4 |
|
|
1.6 |
|
|
| Distributors |
|
2.9 |
|
|
4.2 |
|
|
| Diversified Consumer Services |
|
2.5 |
|
|
3.0 |
|
|
| Electronic Equipment, Instruments & Components |
|
2.1 |
|
|
1.0 |
|
|
| Energy Equipment & Services |
|
0.5 |
|
|
0.5 |
|
|
| Financial Services |
|
1.9 |
|
|
0.7 |
|
|
| Food Products |
|
2.3 |
|
|
2.5 |
|
|
| Health Care Equipment & Supplies |
|
0.7 |
|
|
0.3 |
|
|
| Health Care Providers & Services |
|
4.6 |
|
|
3.4 |
|
|
| Health Care Technology |
|
1.9 |
|
|
0.7 |
|
|
| Industrial Conglomerates |
|
1.3 |
|
|
0.2 |
|
|
| Insurance Services |
|
14.9 |
|
|
15.7 |
|
|
| Interactive Media & Services |
|
3.2 |
|
|
3.5 |
|
|
| IT Services |
|
8.7 |
|
|
9.6 |
|
|
| Leisure Products |
|
0.7 |
|
|
0.8 |
|
|
| Machinery |
|
2.1 |
|
|
3.0 |
|
|
| Multi-Utilities |
|
0.7 |
|
|
0.6 |
|
|
| Oil, Gas & Consumable Fuels |
|
— |
|
|
— |
|
(2) |
| Pharmaceuticals |
|
0.4 |
|
|
0.4 |
|
|
| Professional Services |
|
3.8 |
|
|
3.2 |
|
|
| Real Estate Management & Development |
|
5.3 |
|
|
5.4 |
|
|
| Software |
|
14.2 |
|
|
14.3 |
|
|
| Wireless Telecommunication Services |
|
0.2 |
|
|
— |
|
|
| Total |
|
100.0 |
|
% |
100.0 |
|
% |
(1) The Company reclassified certain industry groupings of its portfolio companies presented in the consolidated financial statements as of December 31, 2022 to align with the recently updated GICS, where applicable. These reclassifications had no impact on the Consolidated Statement of Assets and Liabilities as of December 31, 2022.
(2) Amount rounds to 0.0%.
The geographic composition of our investments at cost and fair value is as follows (dollar amounts in thousands):
|
|
|
|
|
|
|
|
|
|
|
|
|
|
|
|
|
|
|
|
|
|
|
|
|
|
|
|
|
|
|
|
|
|
|
|
|
|
|
|
|
December 31, 2023 |
|
December 31, 2022 |
|
|
Cost |
|
Fair Value |
|
% of Total
Investments at
Fair Value |
|
Cost |
|
Fair Value |
|
% of Total
Investments at
Fair Value |
| Australia |
|
$ |
16,985 |
|
|
$ |
17,048 |
|
|
0.5 |
% |
|
$ |
10,187 |
|
|
$ |
9,870 |
|
|
0.3 |
% |
| Canada |
|
98,674 |
|
|
98,387 |
|
|
3.1 |
|
|
108,820 |
|
|
105,764 |
|
|
3.7 |
|
| United Kingdom |
|
12,398 |
|
|
12,629 |
|
|
0.4 |
|
|
11,157 |
|
|
11,157 |
|
|
0.4 |
|
| United States |
|
3,098,719 |
|
|
3,065,497 |
|
|
96.0 |
|
|
2,809,482 |
|
|
2,746,797 |
|
|
95.6 |
|
| Total |
|
$ |
3,226,776 |
|
|
$ |
3,193,561 |
|
|
100.0 |
% |
|
$ |
2,939,646 |
|
|
$ |
2,873,588 |
|
|
100.0 |
% |
See the Consolidated Schedule of Investments as of December 31, 2023 in “Item 8. Consolidated Financial Statements and Supplementary Data—Consolidated Schedule of Investments” for more information on these investments.
Capital Resources and Borrowings
As a RIC, we intend to distribute substantially all of our net income to our stockholders. We anticipate generating cash from the issuance of shares and cash flows from operations, including interest received on our debt investments.
Additionally, we are permitted, under specified conditions, to issue multiple classes of indebtedness and one class of shares senior to our Common Stock if our asset coverage, as defined in the 1940 Act, is at least equal to 150% immediately after each such issuance. As of December 31, 2023 and December 31, 2022, our asset coverage ratio was 214.6% and 191.2%, respectively.
While any indebtedness and senior securities remain outstanding, we must take provisions to prohibit any distribution to our stockholders (which may cause us to fail to distribute amounts necessary to avoid entity-level taxation under the Code), or the repurchase of such securities or shares unless we meet the applicable asset coverage ratios at the time of the distribution or repurchase. In addition, we must also comply with positive and negative covenants customary for these types of facilities. See “Item 7. Management’s Discussion and Analysis of Financial Condition and Results of Operations—Financial Condition, Liquidity and Capital Resources.”
Share Repurchase Plan
On September 11, 2023, our Board of Directors approved a share repurchase plan, or the Company 10b5-1 Plan, to acquire up to $100 million in the aggregate of our Common Stock at prices below our net asset value per share over a specified period, in accordance with the guidelines specified in Rule 10b5-1 and Rule 10b-18 of the Exchange Act. We adopted the Company 10b5-1 Plan because we believe if our Common Stock is trading below our then-current net asset value per share after the closing of this offering it will be in the best interest of our stockholders for us to reinvest in our portfolio.
The Company 10b5-1 Plan is intended to allow us to repurchase our Common Stock even at times when we otherwise might be prevented from doing so under insider trading laws. The Company 10b5-1 Plan will require Wells Fargo Securities, LLC, as our agent, to repurchase Common Stock on our behalf when the market price per share is below the most recently reported net asset value per share (including any updates, corrections or adjustments publicly announced by us to any previously announced net asset value per share, including any distributions declared). Under the Company 10b5-1 Plan, the volume of purchases would be expected to increase as the price of our Common Stock declines, subject to volume restrictions. The timing and amount of any share repurchases will depend on the terms and conditions of the Company 10b5-1 Plan, the market price of our Common Stock and trading volumes, and no assurance can be given that Common Stock will be repurchased in any particular amount or at all.
The repurchase of shares pursuant to the Company 10b5-1 Plan is intended to satisfy the conditions of Rule 10b5-1 and Rule 10b-18 under the Exchange Act, and will otherwise be subject to applicable law, including Regulation M, which may prohibit repurchases under certain circumstances.
The Company 10b5-1 Plan will commence beginning 60 calendar days following the end of the “restricted period” related to the IPO under Regulation M and will terminate upon the earliest to occur of (i) 12-months from the commencement date of the Company 10b5-1 Plan , (ii) the end of the trading day on which the aggregate purchase price for all shares purchased under the Company 10b5-1 Plan equals $100 million and (iii) the occurrence of certain other events described in the Company 10b5-1 Plan.
The “restricted period” under Regulation M ended upon the closing of the IPO and, therefore, the Common Stock repurchases/purchases described above will begin 60 days after the closing of the IPO, or March 26, 2024.
Investment Advisory Agreement
Pursuant to the Amended and Restated Investment Advisory Agreement with our Adviser, we pay our Adviser a fee for investment advisory and management services consisting of two components—a base management fee and an incentive fee.
Base Management Fee Pursuant to the Amended and Restated Investment Advisory Agreement
The base management fee is calculated at an annual rate of 1.0% of our average gross assets at the end of the two most recently completed calendar quarters, including assets purchased with borrowed funds or other forms of leverage but excluding cash and cash equivalents. The Adviser has agreed to irrevocably waive any portion of the base management fee in excess of 0.75% of our average gross assets calculated in accordance with the Amended and Restated Investment Advisory Agreement for the period from January 24, 2024 to January 24, 2025 (the “Waiver Period”). Waived base management fees are not subject to recoupment by the Adviser. For services rendered under the Amended and Restated Investment Advisory Agreement, the base management fee is payable quarterly in arrears. Base management fees for any partial month or quarter will be appropriately pro-rated.
The Adviser and its affiliates, at their own expense and out of their own assets, may make payments to, or enter into arrangements with, financial intermediaries or other persons in consideration of services, arrangements, significant investments in shares of our Common Stock or other activities that the Adviser and its affiliates believe may, among other things, benefit our business, facilitate investment in our Common Stock or otherwise benefit our stockholders. Payments of the type described above are sometimes referred to as profit-sharing payments.
Incentive Fee Pursuant to the Amended and Restated Investment Advisory Agreement
We also pay the Adviser an incentive fee consisting of two parts. The first part is determined and paid quarterly based on our pre-incentive fee net investment income, and is subject to an Incentive Fee Cap (as defined below) pursuant to the Amended and Restated Investment Advisory Agreement, and the second part is determined and payable in arrears based on net capital gains as of the end of each calendar year or upon termination of the Amended and Restated Investment Advisory Agreement. Pre-incentive fee net investment income is defined as interest income, dividend income and any other income accrued during the calendar quarter, minus operating expenses for the quarter, including the base management fee, expenses payable under the Administration Agreement, any interest expense and distributions paid on any issued and outstanding preferred stock, but excluding the incentive fee. Pre-incentive fee net investment income does not include any realized capital gains, realized capital losses or unrealized capital appreciation or depreciation.
Pre-incentive fee net investment income includes, in the case of investments with a deferred interest feature (such as debt instruments with pay-in-kind (“PIK”) interest and zero coupon securities), accrued income that we have not yet received in cash. Our Adviser is not obligated to return to us the incentive fee it receives on PIK interest that is later determined to be uncollectible in cash.
Pursuant to the Amended and Restated Investment Advisory Agreement, we pay our Adviser an incentive fee on our aggregate pre-incentive fee net investment income in respect of (1) for the quarter ending March 31, 2024 (the “First Calendar Quarter”), the First Calendar Quarter, and (2) commencing with the quarter ending June 30, 2024, the current calendar quarter and eleven preceding calendar quarters beginning with the calendar quarter commencing on April 1, 2024 (or the appropriate portion thereof in the case of any of our first eleven calendar quarters that commence on or after April 1, 2024) (in either case, the “Trailing Twelve Quarters”).
Pre-incentive fee net investment income in respect of the First Calendar Quarter will be compared to a hurdle rate equal to 1.5% (6.0% annualized), and, if pre-incentive fee net investment income for the First Calendar Quarter exceeds the hurdle rate, the incentive fee will be 100% of pre-incentive fee net investment income until our Adviser has received a “catch up” equal to 17.5%, plus 17.5% of pre-incentive fee net investment income above the catch up.
Commencing with the quarter ending June 30, 2024, pre-incentive fee net investment income in respect of the relevant Trailing Twelve Quarters will be compared to a “Hurdle Rate” equal to the product of (i) the hurdle rate of 1.5% per quarter (6% annualized) and (ii) the sum of our net assets (defined as total assets less indebtedness and before taking into account any incentive fees payable during the period) at the beginning of each applicable calendar quarter comprising the relevant Trailing Twelve Quarters. The incentive fee based on income for each calendar quarter will be determined as follows:
•No incentive fee based on pre-incentive fee net investment income in any calendar quarter in which our pre-incentive fee net investment income in respect of the relevant Trailing Twelve Quarters does not exceed the Hurdle Rate;
•100% of pre-incentive fee net investment income in respect of the Trailing Twelve Quarters with respect to that portion of such pre-incentive fee net investment income, if any, that exceeds the hurdle rate but is less than 1.8182% in any calendar quarter (7.2728% annualized). We refer to this portion of the pre-incentive fee net investment income (which exceeds the hurdle rate but is less than 1.8182%) as the “catch-up.” The “catch-up” is meant to provide the Adviser with approximately 17.5% of our pre-incentive fee net investment income as if a hurdle rate did not apply if this net investment income exceeds 1.8182% in any calendar quarter; and
•17.5% of the pre-incentive fee net investment income in respect of the Trailing Twelve Quarters that exceeds 1.8182% in any calendar quarter (7.2728% annualized), which reflects that once the hurdle rate is reached and the catch-up is achieved, 17.5% of all pre-incentive fee net investment income is paid to the Adviser.
Commencing with the quarter ending June 30, 2024, each income incentive fee will be subject to an incentive fee cap (the “Incentive Fee Cap”) that in respect of any calendar quarter is an amount equal to 17.5% of the Cumulative Pre-Incentive Fee Net Return (as defined herein) during the Trailing Twelve Quarters less the aggregate incentive fees based on income that were paid to the Adviser in the preceding eleven calendar quarters (or portion thereof) comprising the relevant Trailing Twelve Quarters. In the event the Incentive Fee Cap is zero or a negative value then no income incentive fee shall be payable and if the Incentive Fee Cap is less than the amount of incentive fee based on income that would otherwise be payable, the amount of incentive fee based on income shall be reduced to an amount equal to the Incentive Fee Cap.
“Cumulative Pre-Incentive Fee Net Return” (A) during the First Calendar Quarter, the sum of Pre-Incentive Fee Net Investment Income in the First Calendar Quarter and (B) during the relevant Trailing Twelve Quarters, the sum of (x) Pre-Incentive Fee Net Investment Income in respect of the Trailing Twelve Quarters and (y) Adjusted Capital Returns (as defined below) in respect of the Trailing Twelve Quarters. If, in any calendar quarter, the Incentive Fee Cap is zero or a negative value, we shall pay no income incentive fee to the Adviser in respect of that quarter. If, in any calendar quarter, the Incentive Fee Cap is a positive value but is less than the incentive fee calculated as described above, we shall pay the Adviser the Income Incentive Fee Cap in respect of such quarter. If, in any calendar quarter, the Incentive Fee Cap is equal to or greater than the incentive fee calculated as described above, the we shall pay the Adviser the incentive fee in respect of such quarter. “Adjusted Capital Returns” in respect of a particular period means the sum of aggregate realized losses and aggregate realized capital gains in respect of such period.
For the Waiver Period, the Adviser has irrevocably waived its right to receive each component of the income incentive fee in excess of amounts calculated as described above using (1) 15.0% instead of 17.5% and (2) a catch-up amount (as applicable) calculated using 1.7647% in place of 1.8182%. For periods in which the waiver described in this paragraph is in effect for less than a full quarter or calendar year, as applicable, the applicable incentive fee shall be calculated at a weighted rate during the applicable days in such period during the Waiver Period.
If market interest rates rise, we may be able to invest our funds in debt instruments that provide for a higher return, which would increase our pre-incentive fee net investment income and make it easier for the Adviser to surpass the hurdle rate and receive an incentive fee on such net investment income. PIK interest and original issue discount (“OID”) will also increase our pre-incentive fee net investment income and make it easier to surpass the hurdle rate. Our pre-incentive fee net investment income used to calculate this part of the incentive fee is also included in the amount of our total assets (other than cash and cash equivalents but including assets purchased with borrowed amounts) used to calculate the base management fee.
The following is a graphical representative of the incentive fee calculation pursuant to the Amended and Restated Investment Advisory Agreement:
Incentive Fee based on Income During the Waiver Period
Percentage of pre-incentive fee net income comprising the Incentive Fee based on Income
(expressed as an annualized rate of return on the value of net assets as of the beginning
of each of the quarters included in the Trailing Twelve Quarters)
Incentive Fee based on Income After the Waiver Period
Percentage of pre-incentive fee net income comprising the Incentive Fee based on Income
(expressed as an annualized rate of return on the value of net assets as of the beginning
of each of the quarters included in the Trailing Twelve Quarters)
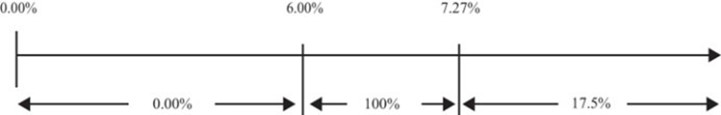
Under the Amended and Restated Investment Advisory Agreement, we pay the Adviser an incentive fee on capital gains calculated and payable in arrears in cash as of the end of each calendar year or upon the termination of the Amended and Restated Investment Advisory Agreement in an amount equal to 17.5% of our realized capital gains, if any, on a cumulative basis from the date of our election to be regulated as a BDC through the end of a given calendar year or upon the termination of the Amended and Restated Investment Advisory Agreement, computed net of all realized capital losses and unrealized capital depreciation on a cumulative basis, less the aggregate amount of any previously paid capital gain incentive fees (the “Cumulative Capital Gains”). For the purpose of computing the incentive fee on capital gains, the calculation methodology looks through derivative financial instruments or swaps as if we owned the reference assets directly.
For the Waiver Period, the Adviser has irrevocably waived any capital gains incentive fee in excess of amounts calculated as described above using 15.0% instead of 17.5%. For periods in which the waiver described in this paragraph is in effect for less than a full quarter or calendar year, as applicable, the applicable incentive fee shall be calculated at a weighted rate during the applicable days in such period during the Waiver Period.
Our Board of Directors monitors the mix and performance of our investments over time and seeks to satisfy itself that the Adviser is acting in our interests and that our fee structure appropriately incentivizes the Adviser to do so.
Example 1: Income Related Portion of Incentive Fee under Amended and Restated Investment Advisory Agreement:
Alternative 1 — Three Quarters under Amended and Restated Investment Advisory Agreement in which Pre-Incentive Fee Net Investment Income Exceeds the Hurdle Amount and Catch-up Amount
Assumptions
Stable net asset value (NAV) of $1.8 billion across all quarters with 1.0x leverage
Hurdle rate(1) = 1.5%
Catch-up Amount = 100% of pre-incentive fee net investment income that is greater than the hurdle amount but less than 1.8182%
Pre-incentive fee net investment income for each quarter = 5.0% (*)
No Adjusted Capital Returns each quarter
Assumes no other quarters in the applicable relevant Trailing Twelve Quarters
Incentive fee for first quarter
Aggregate pre-incentive fee net investment income during the relevant Trailing Twelve Quarters = $45.0 million
Hurdle Amount = Q1 NAV × 1.5% = $1.8 billion × 0.015 = $27.0 million
Excess Income Amount = pre-incentive fee net investment income during the relevant Trailing Twelve Quarters — Hurdle Amount = $45.0 million — $27.0 million = $18.0 million
Catch-up Fee Amount = 100% of pre-incentive fee net investment income that is greater than $27.0 million (the Hurdle Amount) but less than 1.8182% × Q1 NAV, or $32.728 million. This Catch-up Fee Amount equals $5.727 million
Post Catch-up Fee Amount = 17.5% of pre-incentive fee net investment income that exceeds the Catch-up Amount = 0.175 × ($45.0 million — $32.7 million) = $2.148 million
Catch-up Fee Amount + Post Catch-up Fee Amount = income incentive fee payment = $7.875 million
Income incentive fee previously paid during the relevant Trailing Twelve Quarters = none
Incentive Fee Cap = 17.5% of Cumulative Net Return during the relevant Trailing Twelve Quarters
Cumulative Net Return = pre-incentive fee net investment income during the relevant Trailing Twelve Quarters — Net Adjusted Capital Returns in respect of the relevant Trailing Twelve Quarters
Therefore Incentive Fee Cap = 17.5% of Cumulative Net Return during the relevant Trailing Twelve Quarters is greater than the income incentive fee and the cap is not applied
Incentive fee for second quarter
Aggregate pre-incentive fee net investment income during the relevant Trailing Twelve Quarters = $45.0 million + $45.0 million = $90.0 million
Hurdle Amount = (Q1 NAV + Q2 NAV) × 1.5% = $3.6 billion × 0.015 = $54.0 million
Excess Income Amount = aggregate pre-incentive fee net investment income during the relevant Trailing Twelve Quarters (e.g., Q1 and Q2) — Hurdle Amount = $90.0 million — $54.0 million = $36.0 million
Catch-up Fee Amount = 100% of pre-incentive fee net investment income that is greater than $54.0 million (the Hurdle Amount) but less than 1.8182% × (Q1 NAV + Q2 NAV), or $65.5 million. This Catch-up Fee Amount equals $11.455 million
Post Catch-up Fee Amount = 17.5% of pre-incentive fee net investment income that exceeds the Catch-up Amount = 0.175 × ($90.0 million — $65.5 million) = $4.295 million
Catch-up Fee Amount + Post Catch-up Fee Amount = income incentive fee payment = $15.750 million
$7.875 million income incentive fee previously paid during the Trailing Twelve Quarters
Total income incentive fee payment for Q2 = income incentive fee payment — amount previously paid = $7.875 million
Incentive Fee Cap = 17.5% of Cumulative Net Return during the relevant Trailing Twelve Quarters
Cumulative Net Return = aggregate pre-incentive fee net investment income during the relevant Trailing Twelve Quarters — Net Adjusted Capital Returns in respect of the relevant Trailing Twelve Quarters
Therefore Incentive Fee Cap = 17.5% of Cumulative Net Return during the relevant Trailing Twelve Quarters is greater than income incentive fee and the cap is not applied
Incentive fee for third quarter
Aggregate pre-incentive fee net investment income during the relevant Trailing Twelve Quarters = $45.0 million + $45.0 million + $45.0 million = $135.0 million
Hurdle Amount = (Q1 NAV + Q2 NAV + Q3 NAV) × 1.5% = $5.4 billion × 0.015 = $81.0 million
Excess Income Amount = aggregate pre-incentive fee net investment income during the relevant Trailing Twelve Quarters (e.g., Q1, Q2 and Q3) — Hurdle Amount = $135.0 million — $81.0 million = $54.0 million
Catch-up Fee Amount = 100% of pre-incentive fee net investment income that is greater than $81.0 million (the Hurdle Amount) but less than 1.8182% × (Q1 NAV + Q2 NAV + Q3 NAV), or $98.2 million. This Catch-up Fee Amount equals $17.183 million
Post Catch-up Fee Amount = 17.5% of pre-incentive fee net investment income that exceeds the Catch-up Amount = 0.175 × ($135.0 million — $98.2 million) = $6.443 million
Catch-up Fee Amount + Post Catch-up Fee Amount = income incentive fee payment = $23.625 million
$15.750 million income incentive fee previously paid during the Trailing Twelve Quarters
Total income incentive fee payment for Q3 = income incentive fee payment — amount previously paid = $7.875 million Stable NAV of $1.8 billion across all quarters with 1.0x leverage
Incentive Fee Cap = 17.5% of Cumulative Net Return during the relevant Trailing Twelve Quarters
Cumulative Net Return = aggregate pre-incentive fee net investment income during the relevant Trailing Twelve Quarters — Net Adjusted Capital Returns in respect of the relevant Trailing Twelve Quarters
Therefore Incentive Fee Cap = 17.5% of Cumulative Net Return during the relevant Trailing Twelve Quarters is greater than the income incentive fee and the cap is not applied
Alternative 2 — Three Quarters under Amended and Restated Investment Advisory Agreement, in which Pre-Incentive Fee Net Investment Income does not meet the Hurdle Amount for one Quarter
Assumptions
Hurdle rate(1) = 1.5%
Catch-up Amount = 100% of pre-incentive fee net investment income that is greater than the hurdle amount but less than 1.8182%
Pre-incentive fee net investment income for Q1 = 5.0% (*)
Pre-incentive fee net investment income for Q2 = 3.0% (*)
Pre-incentive fee net investment income for Q3 = 0.0% (*)
No Adjusted Capital Returns each quarter
Assumes no other quarters in the applicable relevant Trailing Twelve Quarters
Incentive fee for first quarter
Aggregate pre-incentive fee net investment income during the relevant Trailing Twelve Quarters = $45.0 million
Hurdle Amount = Q1 NAV × 1.5% = $1.8 billion × 0.015 = $27.0 million
Excess Income Amount = pre-incentive fee net investment income during the relevant Trailing Twelve Quarters — Hurdle Amount = $45.0 million — $27.0 million = $18.0 million
Catch-up Fee Amount = 100% of pre-incentive fee net investment income that is greater than $27.0 million (the Hurdle Amount) but less than 1.8182% × Q1 NAV, or $32.7 million. This Catch-up Fee Amount equals $5.727 million
Post Catch-up Fee Amount = 17.5% of pre-incentive fee net investment income that exceeds the Catch-up Amount = 0.175 × ($45.0 million — $32.7 million) = $2.148 million
Catch-up Fee Amount + Post Catch-up Fee Amount = income incentive fee payment = $7.875 million
No income incentive fee previously paid during the relevant Trailing Twelve Quarters
Incentive Fee Cap = 17.5% of Cumulative Net Return during the relevant Trailing Twelve Quarters
Cumulative Net Return = pre-incentive fee net investment income during the relevant Trailing Twelve Quarters — Net Adjust Capital Returns in respect of the relevant Trailing Twelve Quarters
Therefore Incentive Fee Cap = 17.5% of Cumulative Net Return during the relevant Trailing Twelve Quarters is greater than the income incentive fee and the cap is not applied
Incentive fee for second quarter
Aggregate pre-incentive fee net investment income during the relevant Trailing Twelve Quarters = $45.0 million + $27.0 million = $72.0 million Excess Income Amount = (aggregate pre-incentive fee net investment income during the relevant Trailing Twelve Quarters (e.g., Q1 and Q2)) — Hurdle Amount — $72.0 million — $54.0 million = $18.0 million
Hurdle Amount = (Q1 NAV + Q2 NAV) × 1.5% = $3.6 billion × 0.015 = $54.0 million
Catch-up Fee Amount = 100% of pre-incentive fee net investment income that is greater than $54.0 million (the Hurdle Amount) but less than 1.8182% × (Q1 NAV + Q2 NAV), or $65.5 million. This Catch-up Fee Amount equals $65.5 million — $54.0 million, or $11.455 million
Post Catch-up Fee Amount = 17.5% of pre-incentive fee net investment income that exceeds the Catch-up Amount = 0.175 × ($72.0 million — $65.5 million) = $1.145 million
Catch-up Fee Amount + Post Catch-up Fee Amount = income incentive fee payment = $12.600 million
$7.875 million income incentive fee previously paid during the relevant Trailing Twelve Quarters
Total income incentive fee payment for Q2 = income incentive fee payment — amount previously paid = $4.725 million
Incentive Fee Cap = 17.5% of Cumulative Net Return during the relevant Trailing Twelve Quarters
Cumulative Net Return = pre-incentive fee net investment income during the relevant Trailing Twelve Quarters — Net Adjusted Capital Returns in respect of the relevant Trailing Twelve Quarters
Therefore Incentive Fee Cap = 17.5% of Cumulative Net Return during the relevant Trailing Twelve Quarters is greater than the income incentive fee and the cap is not applied
Incentive fee for third quarter
Aggregate pre-incentive fee net investment income during the relevant Trailing Twelve Quarters = $45.0 million + $27.0 million + $0.0 million = $72.0 million
Hurdle Amount = Q1 NAV + Q2 NAV + Q3 NAV × 1.5% = $5.4 billion × 0.015 = $81.0 million
Catch-up Amount = 100% of pre-incentive fee net investment income that is greater than the hurdle amount but less than 1.8182%
Aggregate pre-incentive fee net investment income < Hurdle Amount. Therefore, no income incentive fee is payable for the quarter
Alternative 3 — Three Quarters under Amended and Restated Investment Advisory Agreement in which Pre-Incentive Fee Net Investment Income Exceeds the Hurdle Rate with Net Capital Losses
Assumptions
Stable net asset value (NAV) of $1.8 billion across all quarters with 1.0x leverage
Hurdle rate(1) = 1.5%
Catch-up Amount = 100% of pre-incentive fee net investment income that is greater than the hurdle amount but less than 1.8182%
Pre-incentive fee net investment income for each quarter = 5.0% (*)
Net Realized losses of 0.25% of NAV each in Q1, Q2 and Q3
Assumes no other quarters in the applicable relevant Trailing Twelve Quarters
Incentive fee for first quarter
Aggregate pre-incentive fee net investment income during the relevant Trailing Twelve Quarters = $45.0 million
Hurdle Amount = Q1 NAV × 1.5% = $1.8 billion × 0.015 = $27.0 million
Excess Income Amount = pre-incentive fee net investment income during the relevant Trailing Twelve Quarters — Hurdle Amount = $45.0 million — $27.0 million = $18.0 million
Catch-up Fee Amount = 100% of pre-incentive fee net investment income that is greater than $27.0 million (the Hurdle Amount) but less than 1.8182% × Q1 NAV, or $32.7 million. This Catch-up Fee Amount equals $5.727 million
Post Catch-up Fee Amount = 17.5% of pre-incentive fee net investment income that exceeds the Catch-up Amount = 0.175 × ($45.0 million — $32.7 million) = $2.148 million
Catch-up Fee Amount + Post Catch-up Fee Amount = income incentive fee payment = $7.875 million
Incentive Fee Cap = 17.5% of Cumulative Net Return during the Trailing Twelve Quarters
Cumulative Net Return = aggregate pre-incentive fee net investment income during the relevant Trailing Twelve Quarters — Net Adjusted Capital Returns during the relevant Trailing Twelve Quarters
Adjusted Capital Returns (losses) = $9.0 million
Cumulative Net Return = $45.0 million — $9.0 million = $36.0 million
Therefore Incentive Fee Cap = 17.5% × $36.0 million = $6.300 million. Since the Incentive Fee Cap ($6.300 million) is less than the income incentive fee ($7.875 million), the Incentive Fee Cap is applied and a $6.300 million income incentive fee is paid for the quarter
Incentive fee for second quarter
Aggregate pre-incentive fee net investment income during the relevant Trailing Twelve Quarters = $45.0 million + $45.0 million = $90.0 million
Hurdle Amount = (Q1 NAV + Q2 NAV) × 1.5% = $3.6 billion × 0.015 = $54.0 million
Excess Income Amount = aggregate pre-incentive fee net investment income during the relevant Trailing Twelve Quarters (e.g., Q1 and Q2) — Hurdle Amount = $90.0 million — $54.0 million = $36.0 million
Catch-up Fee Amount = 100% of pre-incentive fee net investment income that is greater than $54.0 million (the Hurdle Amount) but less than 1.8182% × (Q1 NAV + Q2 NAV), or $65.5 million. This Catch-up Fee Amount equals $11.455 million
Post Catch-up Fee Amount = 17.5% of pre-incentive fee net investment income that exceeds the Catch-up Amount = 0.175 × ($90.0 million — $65.5 million) = $4.295 million
Catch-up Fee Amount + Post Catch-up Fee Amount = income incentive fee payment = $15.750 million
Total income incentive fee for Q2 = Catch-up Fee Amount + Post Catch-up Fee Amount — Q1 income incentive fee = $7.875 million
Incentive Fee Cap = 17.5% of Cumulative Net Return for the Trailing Twelve Quarters — income incentive fees previously paid for the Trailing Twelve Quarters
Cumulative Net Return = aggregate pre-incentive fee net investment income during the relevant Trailing Twelve Quarters — Net Adjusted Capital Returns in respect of the Trailing Twelve Quarters
Net Adjusted Capital Returns (losses) = $18.0 million Cumulative Net Return = $90.0 million — $18.0 million = $72.0 million
Therefore Incentive Fee Cap = (17.5% × $72.0 million) — $6.300 million = $6.300 million. Since the Incentive Fee Cap ($6.300 million) is less than the income incentive fee ($7.875 million), the Incentive Fee Cap is applied and a $6.300 million income incentive fee is paid for the quarter
Incentive fee for third quarter
Aggregate pre-incentive fee net investment income during the relevant Trailing Twelve Quarters = $45.0 million + $45.0 million + $45.0 million = $135.0 million
Hurdle Amount = (Q1 NAV + Q2 NAV + Q3 NAV) × 1.5% = $5.4 billion × 0.015 = $81.0 million
Excess Income Amount = aggregate pre-incentive fee net investment income during the relevant Trailing Twelve Quarters (e.g., Q1, Q2 and Q3) — Hurdle Amount = $135.0 million — $81.0 million = $54.0 million
Catch-up Fee Amount = 100% of pre-incentive fee net investment income that is greater than $81.0 million (the Hurdle Amount) but less than 1.8182% × (Q1 NAV + Q2 NAV + Q3 NAV), or $98.2 million. This Catch-up Fee Amount equals $17.183 million
Post Catch-up Fee Amount = 17.5% of pre-incentive fee net investment income that exceeds the Catch-up Amount = 0.175 × ($135.0 million — $98.2 million) = $6.443 million
Catch-up Fee Amount + Post Catch-up Fee Amount = income incentive fee payment = $23.626 million
Total income incentive fee for Q3 = Catch-up Fee Amount + Post Catch-up Fee Amount — Q1 income incentive fee — Q1 income incentive fee = $7.875 million
Incentive Fee Cap = 17.5% of Cumulative Net Return for the Trailing Twelve Quarters — income incentive fees previously paid for the Trailing Twelve Quarters
Cumulative Net Return = aggregate pre-incentive fee net investment income during the relevant Trailing Twelve Quarters — Net Capital Loss in respect of the Trailing Twelve Quarters
Net Capital Loss = $27.0 million
Cumulative Net Return = $135.0 million — $27.0 million = $108.0 million
Therefore Incentive Fee Cap = (17.5% × $108.0 million) — $12.600 million previously paid during the Trailing Twelve Quarters = $6.300 million. Since the Incentive Fee Cap ($6.3 million) is less than the income incentive fee ($7.875 million), the Incentive Fee Cap is applied and a $6.300 million income incentive fee is paid for the quarter
(1) Represents 6.0% annualized hurdle rate
* Hypothetical Pre incentive fee net investment income is comprised of investment income net of cost of debt, management fees, other expenses and before incentive fees
** Amount included in above example are rounded to the nearest 3 decimals in millions, where applicable
Administration Agreement
We entered into the Administration Agreement with our Administrator, who provides us with office space, office services and equipment. Under the Administration Agreement, our Administrator also performs, or oversees the performance of, our required administrative services, which include, among other things, providing assistance in accounting, legal, compliance, operations, technology, internal audit and investor relations, and being responsible for the financial records that we are required to maintain and preparing reports to our stockholders and reports filed with the SEC. In addition, our Administrator assists us in determining and publishing our net asset value, overseeing the preparation and filing of our tax returns and the printing and dissemination of reports to our stockholders, our internal control assessment under the Sarbanes-Oxley Act and generally overseeing the payment of our expenses and the performance of administrative and professional services rendered to us by others. The Administration Agreement had an initial term of two years and continues thereafter from year to year if approved annually by our Board of Directors, which most recently approved the renewal of the Administration Agreement in August 2023.
Payments under the Administration Agreement are equal to an amount that reimburses our Administrator for its costs and expenses and our allocable portion of certain expenses incurred by our Administrator in performing its obligations under the Administration Agreement, including our allocable portion of the compensation paid to our Chief Compliance Officer and Chief Financial Officer. Our Board of Directors, including our Independent Directors, reviews the allocable portion of certain expenses incurred by our Administrator in performing its obligations under the Administration Agreement to determine whether such expenses are reasonable and allocated appropriately among us and other funds sponsored or advised by the Administrator and its affiliates. The Administration Agreement may be terminated by either party without penalty upon 60 days’ written notice to the other party. Additionally, we ultimately bear the costs of any sub-administration agreements that our Administrator enters into.
Our Administrator reserves the right to waive all or part of any reimbursements due from us at its sole discretion.
The Administration Agreement provides that, absent willful misfeasance, bad faith or gross negligence in the performance of its duties or by reason of the reckless disregard of its duties and obligations, our Administrator and its officers, managers, partners, agents, employees, controlling persons, members and any other person or entity affiliated with it will be entitled to indemnification from us for any damages, liabilities, costs and expenses (including reasonable attorneys’ fees and amounts reasonably paid in settlement) arising from the rendering of our Administrator’s services under the Administration Agreement or otherwise as an administrator for us, subject to the provisions of the 1940 Act.
In addition, our Administrator has, pursuant to a sub-administration agreement, engaged State Street Bank and Trust Company (“State Street”), to act on behalf of our Administrator in the performance of certain other administrative services for us. We have also engaged State Street directly to serve as our custodian, transfer agent, distribution paying agent and registrar.
Summary Risk Factors
The risk factors described below are a summary of the principal risk factors associated with an investment in us. These are not the only risks we face. You should carefully consider these risk factors, together with the risk factors set forth in “Item 1A. Risk Factors” of this report and other reports and documents we file with the SEC.
Risks Relating to Our Business and Structure
•Operating as a BDC imposes numerous constraints on us and significantly reduces our operating flexibility.
•We are subject to risks associated with the current interest rate environment and to the extent we use debt to finance our investments, changes in interest rates will affect our cost of capital and net investment income.
•We depend upon our Adviser and Administrator for our success and upon their access to the investment professionals and partners of Morgan Stanley and its affiliates.
•Our business model depends to a significant extent upon strong referral relationships with private equity sponsors.
•We may not replicate the historical results achieved by other entities advised by or sponsored by members of the Investment Committee or by the Adviser or its affiliates.
•The Adviser may frequently be required to make investment analyses and decisions on an expedited basis.
•There are significant potential conflicts of interest that could affect our investment returns.
•Our management fee and incentive fee structure may create incentives for the Adviser that are not fully aligned with the interests of our stockholders and may induce the Adviser to make speculative investments.
•Our ability to enter into transactions with our affiliates is restricted.
•We operate in a highly competitive market for investment opportunities.
•We will be subject to corporate-level income tax if we are unable to qualify as a RIC.
•We will need to raise additional capital to grow because we must distribute most of our income.
•Regulations governing our operation as a BDC affect our ability to, and the way in which we, raise additional capital.
•We are subject to risks associated with our Credit Facilities.
•Failure to qualify as a BDC would decrease our operating flexibility.
•Certain investors are limited in their ability to make significant investments in us
•The majority of our portfolio investments are recorded at fair value as determined in good faith by our Valuation Designee, and, as a result, there may be uncertainty as to the value of our portfolio investments.
•Our Board of Directors may change our investment objective, operating policies and strategies without prior notice or stockholder approval, and we may temporarily deviate from our regular investment strategy.
•The Adviser and Administrator can each resign on 60 days’ notice, and we may not be able to find a suitable replacement within that time.
•The liability of each of the Adviser and the Administrator is limited.
Risks Relating to Our Investments
•Limitations of investment due diligence expose us to investment risk.
•Our debt investments may be risky, and we could lose all or part of our investments.
•Defaults by our portfolio companies will harm our operating results.
•Economic recessions or downturns could impair our portfolio companies and defaults by our portfolio companies will harm our operating results.
•Subordinated liens on collateral securing debt investments that we will make to our portfolio companies may be subject to control by senior creditors with first priority liens.
•Covenant-lite loans may expose us to different risks.
•The lack of liquidity in our investments may adversely affect our business.
•Price declines and illiquidity in the corporate debt markets may adversely affect the fair value of our portfolio investments, reducing our net asset value through increased net unrealized depreciation.
•Our portfolio companies may prepay loans, which may reduce our yields if capital returned cannot be invested in transactions with equal or greater expected yields.
•Our failure to make follow-on investments in our portfolio companies could impair the value of our portfolio.
•Because we generally do not hold controlling equity interests in our portfolio companies, we may not be able to exercise control over our portfolio companies.
•We can offer no assurance that portfolio company management will be able to operate their companies in accordance with our expectations.
•Our portfolio companies may incur debt that ranks equally with, or senior to, our investments in such companies.
Risks Relating to Our Common Stock
•The market price of our Common Stock may be volatile and may fluctuate significantly.
•There is a risk you may not receive distributions.
•Investing in our Common Stock may involve an above average degree of risk.
•We have not established any limit on the amount of funds we may use from available sources to fund dividends.
Risks Relating to the Notes
•The Company’s 4.50% notes due 2027, or the 2027 Notes, and the Company’s 7.55% Series A Senior Notes due September 13, 2025, or the 2025 Notes and, together with the 2027 Notes, the Notes, are unsecured and therefore are effectively subordinated to any secured indebtedness we may incur. Additionally, the Notes are not guaranteed by Morgan Stanley.
•The Notes are subordinated structurally to the indebtedness and other liabilities of our subsidiaries.
•A downgrade, suspension or withdrawal of the credit rating assigned by a rating agency to us or the Notes, if any, could cause the liquidity or market value of the Notes to decline significantly.
•An increase in market interest rates could result in a decrease in the value of the Notes.
General Risk Factors
•We are operating in a period of capital markets volatility and economic uncertainty.
•New or modified laws or regulations governing our or Morgan Stanley’s operations may adversely affect our business.
•We are highly dependent on information systems, and systems failures could significantly disrupt our business.
•Terrorist attacks, acts of war, natural disasters, outbreaks, or pandemics, may impact our portfolio companies and our Adviser and harm our business, operating results, and financial condition.
Regulation as a Business Development Company
General
On November 25, 2019, we elected to be regulated as a BDC under the 1940 Act. A BDC is a specialized investment vehicle that elects to be regulated under the 1940 Act as an investment company but is generally subject to less onerous requirements than other registered investment companies under a regime designed to encourage lending to U.S. based small and mid-sized businesses. Unlike many similar types of investment vehicles that are restricted to being private entities, the stock of a BDC is permitted to trade in the public equity markets. On January 26, 2024, we closed our IPO issuing 5,000,000 shares of our Common Stock at a public offering price of $20.67 per share. Our Common Stock began trading on the NYSE under the symbol “MSDL” on January 24, 2024. BDCs are also eligible to elect to be treated as a RIC under Subchapter M of the Code. A RIC typically does not incur significant entity-level income taxes, because it is generally entitled to deduct distributions made to its stockholders. We have elected to be treated and intend to qualify annually as a RIC. See “Certain Material U.S. Federal Income Tax Considerations.”
Qualifying Assets
Under the 1940 Act, a BDC may not acquire any asset other than assets of the type listed in Section 55(a) of the 1940 Act, which are referred to as qualifying assets, unless, at the time the acquisition is made, qualifying assets represent at least 70% of the BDC’s total assets. The principal categories of qualifying assets relevant to our proposed business are the following:
1)Securities purchased in transactions not involving any public offering from the issuer of such securities, which issuer (subject to certain limited exceptions) is an eligible portfolio company, or from any person who is, or has been during the preceding 13 months, an affiliated person of an eligible portfolio company, or from any other person, subject to such rules as may be prescribed by the SEC. An eligible portfolio company is defined in the 1940 Act as any issuer which:
a)is organized under the laws of, and has its principal place of business in, the United States;
b)is not an investment company (other than a small business investment company wholly owned by the BDC) or a company that would be an investment company but for certain exclusions under the 1940 Act; and
c)satisfies either of the following:
i)does not have any class of securities listed on a national securities exchange or has any class of securities listed on a national securities exchange subject to a $250 million market capitalization maximum; or
ii)is controlled by a BDC or a group of companies including a BDC, the BDC actually exercises a controlling influence over the management or policies of the eligible portfolio company, and, as a result, the BDC has an affiliated person who is a director of the eligible portfolio company.
2)Securities of any eligible portfolio company which we control.
3)Securities purchased in a private transaction from a U.S. issuer that is not an investment company or from an affiliated person of the issuer, or in transactions incident thereto, if the issuer is in bankruptcy and subject to reorganization or if the issuer, immediately prior to the purchase of its securities, was unable to meet its obligations as they came due without material assistance other than conventional lending or financing arrangements.
4)Securities of an eligible portfolio company purchased from any person in a private transaction if there is no ready market for such securities and we already own 60% of the outstanding equity of the eligible portfolio company.
5)Securities received in exchange for or distributed on or with respect to securities described in (1) through (4) above, or pursuant to the exercise of warrants or rights relating to such securities.
6)Cash, cash equivalents, U.S. government securities or high-quality debt securities maturing in one year or less from the time of investment.
We deem certain U.S. Treasury bills, repurchase agreements and other high-quality, short-term debt securities as cash equivalents. We primarily make investments in securities described in paragraphs 1 through 3 of Section 55(a) of the 1940 Act. From time to time, including at or near the end of each fiscal quarter, we may consider using various temporary investment strategies for our business, including taking proactive steps by utilizing cash equivalents as temporary assets with the objective of enhancing our investment flexibility pursuant to Section 55 of the 1940 Act. More specifically, from time-to-time we may draw down our credit facilities, as deemed appropriate, and repay such borrowings subsequent to quarter end. We may also purchase U.S. Treasury bills or other high-quality, short-term debt securities at or near the end of the quarter and typically close out the position on a net cash basis subsequent to quarter end.
Managerial Assistance to Portfolio Companies
In addition, a BDC must have been organized and have its principal place of business in the United States and must be operated for the purpose of making investments in the types of securities described in (1), (2) or (3) above. However, in order to count portfolio securities as qualifying assets for the purpose of the 70% test, the BDC must either control the issuer of the securities or must offer to make available to the issuer of the securities significant managerial assistance. However, when a BDC purchases securities in conjunction with one or more other persons acting together, one of the other persons in the group may make available such managerial assistance. Making available managerial assistance means, among other things, any arrangement whereby the BDC, through its directors, officers or employees, offers to provide, and, if accepted, does so provide, significant guidance and counsel concerning the management, operations or business objectives and policies of a portfolio company. The Investment Advisory Agreement excludes the amount of these transactions or such cash drawn for this purpose from total assets for purposes of computing the base management fee.
Temporary Investments
Pending investment in other types of “qualifying assets,” as described above, our investments may consist of cash, cash equivalents, U.S. government securities or high-quality debt securities maturing in one year or less from the time of investment, which we refer to, collectively, as temporary investments, so that 70% of our assets are qualifying assets.
Senior Securities
As a BDC, we are permitted, under specified conditions, to issue multiple classes of indebtedness and one class of stock senior to shares of our Common Stock if our asset coverage, as defined in the 1940 Act, is at least equal to the percentage set forth in Section 61 of the 1940 Act that is applicable to us at such time. On December 16, 2019, our sole stockholder approved the application of the reduced asset coverage requirements in Section 61(a)(2) to us, effective as of December 17, 2019. As a result of stockholder approval, effective December 17, 2019, the asset coverage ratio under the 1940 Act applicable to us decreased to 150% from 200%, so long as we meet certain disclosure requirements, which means that for every $100 of net assets we hold, we may raise $200 from borrowing and issuing senior securities as compared to $100 from borrowing and issuing senior securities for every $100 of net assets under 200% asset coverage. In addition, while any senior securities remain outstanding, we will be required to make provisions to prohibit any dividend distribution to our stockholders or the repurchase of such securities or shares unless we meet the applicable asset coverage ratios at the time of the distribution or repurchase. We are also permitted to borrow amounts up to 5% of the value of our total assets for temporary purposes without regard to asset coverage, which borrowings would not be considered senior securities, provided that any such borrowings in excess of 5% of the value of our total assets would be subject to the asset coverage ratio requirements of the 1940 Act, even if for temporary purposes. Regulations governing our operations as a BDC will affect our ability to raise, and the method of raising, additional capital, which may expose us to risks. We comply with the provisions of Section 61 of the 1940 Act governing capital structure and leverage on an aggregate basis with our wholly-owned, consolidated subsidiaries.
Code of Ethics
We and our Adviser have adopted a code of ethics pursuant to Rule 17j-1 under the 1940 Act that establishes procedures for personal investments and restricts certain personal securities transactions. Personnel subject to the code of ethics may invest in securities for their personal investment accounts, including securities that may be purchased or held by us, so long as such investments are made in accordance with the codes of ethics’ requirements.
Our codes of ethics is available on our website at www.msdl.com. The Code of Ethics of the Adviser is available on the SEC's website at www.sec.gov and you may obtain copies of the code of ethics, after paying a duplicating fee, by electronic request at the following email address: publicinfo@sec.gov.
Proxy Voting Policies and Procedures
We have delegated our proxy voting responsibility to our Adviser. A summary of the Proxy Voting Policies and Procedures of our Adviser are set forth below. These policies and procedures are reviewed periodically by our Adviser and our Independent Directors, and, accordingly, are subject to change.
An investment adviser registered under the Investment Advisers Act of 1940, or the Advisers Act, has a fiduciary duty to act solely in the best interests of its clients. As part of this duty, the Adviser recognizes that it must vote our securities in a timely manner free of conflicts of interest and in our best interests and the best interests of our stockholders.
These policies and procedures for voting proxies are intended to comply with Section 206 of, and Rule 206(4)-6 under, the Advisers Act.
The Adviser votes proxies relating to our portfolio securities in what it believes to be the best interest of our stockholders. To ensure that our vote is not the product of a conflict of interest, the Adviser requires that: (1) anyone involved in the decision making process disclose to our Chief Compliance Officer any potential conflict that he or she is aware of and any contact that he or she has had with any interested party regarding a proxy vote; and (2) employees involved in the decision making process or vote administration are prohibited from revealing how the Adviser intends to vote on a proposal in order to reduce any attempted influence from interested parties.
A copy of the Adviser’s policies and procedures with respect to the voting of proxies relating to our portfolio securities is available without charge, upon request. Stockholders may obtain information regarding how the Adviser voted proxies by making a written request for proxy voting information to: Morgan Stanley Direct Lending Fund c/o Morgan Stanley 1585 Broadway, New York, NY 10036 Attn: Chief Compliance Officer.
Privacy Principles
The Adviser has established policies with respect to nonpublic personal information provided to it with respect to individuals who are investors in us, which policies also apply to the Administrator. We have adopted the privacy policies of the Adviser as applicable to us.
We and the Adviser each recognizes the importance of maintaining the privacy of any nonpublic personal information it received with respect to each investor. In the course of providing management services to us, the Adviser collects nonpublic personal information about investors from the Subscription Agreements and the certificates and exhibits thereto that each investor submits. We and the Adviser may also collect nonpublic personal information about each investor from conversations and correspondence between each investor and us or the Adviser, both prior to and during the course of each investor’s investment in us.
We and the Adviser each treat all of the nonpublic personal information we receive with respect to each investor as confidential. We and the Adviser restrict access to such information to those employees, affiliates and agents who need to know the information in order for us and the Adviser to determine whether each investor meets the regulatory requirements for an investment in us and, in the case of the Adviser, to provide ongoing management services to us. The Adviser maintains physical, electronic, and procedural safeguards to comply with U.S. federal standards to guard each investor’s nonpublic personal information.
The Adviser does not disclose any nonpublic personal information about any investor to any third parties, other than the Adviser’s agents, representatives and/or affiliates, or as permitted or required by law. Among other things, the law permits the Adviser to disclose such information for purposes of making investments on our behalf, complying with anti-money laundering laws, preparing tax returns and reports for each investor and determining whether each investor meets the regulatory requirements for investing in us. The privacy policy is available on our website at www.msdl.com.
Other
We are prohibited under the 1940 Act from knowingly participating in certain transactions with our affiliates without the prior approval of our Independent Directors and, in some cases, prior approval by the SEC. We and our wholly-owned, consolidated subsidiaries will comply with the provisions of the 1940 Act related to affiliated transactions and custody (Section 17 as modified by Section 57).
We will be periodically examined by the SEC for compliance with the 1940 Act.
We are required to provide and maintain a bond issued by a reputable fidelity insurance company to protect us against larceny and embezzlement. Furthermore, as a BDC, we are prohibited from protecting any director or officer against any liability to us or our stockholders arising from willful misfeasance, bad faith, gross negligence or reckless disregard of the duties involved in the conduct of such person’s office.
We and our Adviser are each required to adopt and implement written policies and procedures reasonably designed to prevent violation of the federal securities laws, review these policies and procedures annually for their adequacy and the effectiveness of their implementation, and designate a chief compliance officer to be responsible for administering the policies and procedures.
Sarbanes-Oxley Act
The Sarbanes-Oxley Act imposes a variety of regulatory requirements on companies with a class of securities registered under the Exchange Act and their insiders. Many of these requirements affect us. For example:
•pursuant to Rule 13a-14 under the Exchange Act our principal executive officer and principal financial officer must certify the accuracy of the financial statements contained in our periodic reports;
•pursuant to Item 307 under Regulation S-K under the Securities Act our periodic reports must disclose our conclusions about the effectiveness of our disclosure controls and procedures;
•pursuant to Rule 13a-15 under the Exchange Act, our management must prepare an annual report regarding its assessment of our internal control over financial reporting, which may be required to be audited by our independent registered public accounting firm if at any such time we are no longer eligible to rely on the exclusion provided in Section 404(c) of the Sarbanes-Oxley Act; and
•pursuant to Item 308 of Regulation S-K under the Securities Act and Rule 13a-15 under the Exchange Act, our periodic reports must disclose whether there were significant changes in our internal controls over financial reporting or in other factors that could significantly affect these controls subsequent to the date of their evaluation, including any corrective actions with regard to significant deficiencies and material weaknesses.
The Sarbanes-Oxley Act requires us to review our current policies and procedures to determine whether we comply with the Sarbanes-Oxley Act and the regulations promulgated under such act. We will continue to monitor our compliance with all regulations that are adopted under the Sarbanes-Oxley Act and will take actions necessary to ensure that we comply with that act in the future.
Bank Holding Company Act
As a bank holding company (“BHC”) that has elected Financial Holding Company, or FHC, status under the Bank Holding Company Act of 1956, as amended (the “BHCA”), Morgan Stanley and its affiliates are subject to comprehensive, consolidated supervision and regulation by the Board of Governors of the Federal Reserve System (the “Federal Reserve”). Because a Morgan Stanley affiliate is acting as our Adviser and Morgan Stanley has a 5% or greater voting investment in us, we are subject to the certain federal banking and financial requirements, including the BHCA, regulations of the Federal Reserve, and certain provisions of the Dodd-Frank Act.
Because we are controlled by Morgan Stanley for purposes of the BHCA, we must generally comply with the investment and activity restrictions applicable to Morgan Stanley under the BHCA. Such restrictions may place certain limitations on our ability to engage in activities or make investments in companies. For instance, the BHCA permits a BHC as well as any non-bank affiliate of such BHC, to make investment representing less than 5% of any class of voting shares of another company so long as that investment is otherwise non-controlling under the BHCA. The BHCA also permits well-capitalized, well-managed BHCs that have elected to be treated as an FHC to engage in expanded “financial in nature” activities without prior approval of the Federal Reserve. Such financial in nature activities include bona fide merchant banking activities, so long as (i) the FHC holds its merchant banking investments only for a period of time sufficient to enable the sale or disposition thereof on a reasonable basis (generally no more than 10 years) and (ii) the FHC does not routinely manage or operate the companies in which it invests except as necessary or required to obtain a reasonable return on its investment. The BHCA does not, however, require Morgan Stanley to financially support us.
The BHCA generally prohibits BHCs, such as Morgan Stanley, and its subsidiaries from acquiring more than de minimis equity interests in non-financial companies unless certain exemptions apply. Further, under the BHCA, eligible FHCs and their subsidiaries have authority to engage in a broader range of investments and activities than BHCs that are not FHCs.
A significant focus of the regulatory framework that applies to Morgan Stanley is to ensure that Morgan Stanley and its subsidiaries operate in a safe and sound manner, with sufficient capital, earnings and liquidity to allow Morgan Stanley to serve as a source of financial and managerial strength to Morgan Stanley Bank, N.A. and Morgan Stanley Private Bank, National Association, or the Banks. These Banks must remain well capitalized and well managed if Morgan Stanley is to maintain its FHC status and continue to engage in the widest range of permissible financial activities. In addition, the general exercise by the Federal Reserve of its regulatory, supervisory and enforcement authority with respect to Morgan Stanley and certain provisions of Dodd-Frank could result in the need for Morgan Stanley to change its business practices or the scope of its current lines of business, including certain limited divestitures. Although such changes could have an impact on and consequences for Morgan Stanley and the Adviser, any limited divestiture should not directly involve the Adviser.
Dodd-Frank and Volcker Rule Disclosure
Section 619 of Dodd-Frank, commonly known as the “Volcker Rule,” and regulations to implement the Volcker Rule issued by the U.S. federal financial regulators in December 2013, referred to as the Implementing Regulations, generally restrict any “banking entity” (which includes Morgan Stanley and most affiliates of Morgan Stanley) from engaging in “proprietary trading” as well as from acquiring or retaining any “ownership interest” in a “covered fund”, in each case unless the investment or activity is conducted in accordance with an exclusion or exemption.
The Volcker Rule also generally prohibits certain transactions between a banking entity and any of its affiliates, on the one hand, and a covered fund for which the banking entity or any of its affiliates serves, directly or indirectly, as the investment manager, investment adviser, or that the banking entity or any of its affiliates sponsors in connection with organizing and offering that fund (or with any other covered fund that is controlled by such fund, on the other hand. The term “covered fund” includes, among others, hedge funds and private-equity funds that are privately offered in the United States and that rely on Sections 3(c)(1) or 3(c)(7) of the 1940 Act to avoid being treated as “investment companies” under the 1940 Act.
The Volcker Rule and the Implementing Regulations impose a number of restrictions on Morgan Stanley and its affiliates that affect us and the Adviser. As a BDC, we are not considered to be a covered fund. As a result, Morgan Stanley and its subsidiaries investments in us would not be subject to the Volcker Rule restrictions on investments in covered funds, but we would during that time be considered a banking entity subject to restrictions on proprietary trading to the extent we are “controlled” by Morgan Stanley or its affiliates. Generally, we will be deemed to be controlled for these purposes for so long as entities affiliated with Morgan Stanley own 5% or more of our outstanding voting securities. However, for a limited seeding period following the Initial Closing, which pursuant to the Volcker Rule and the Implementing Regulations, may be three years or more, we will not be deemed to be a “banking entity” solely because of the ownership of our voting securities by Morgan Stanley and its affiliates. We can offer no assurances that, at the conclusion of this seeding period, Morgan Stanley and its subsidiaries would not be deemed to control us for purposes of the Volcker Rule as a result of their investment in us. To the extent that we are deemed a banking entity under the Volcker Rule and the Implementing Regulations, our operations may be restricted, although, given the anticipated nature of the investments we make and intend to make, we do not anticipate that these restrictions, if they were to apply, would impose material limitations on our operations, but can provide no assurances that they would not. Furthermore, we can offer no assurances that the rules and regulations enacted under the Volcker Rule, the BHCA and other statutes will not change in a future in a manner that would limit our operations and investments.
It is not certain how all aspects of the Volcker Rule will be interpreted and applied, or what the impact of the Volcker Rule will have on us. In addition, the restrictions and limitation on Morgan Stanley and us may change in the future as the Federal Reserve and other agencies consider whether and how to revise and apply the Volcker Rule. We believe that we may perform our activities and services without violation of applicable U.S. banking laws and regulations. However, it is possible that future changes or clarifications in the BHCA and Volcker Rule, as well as judicial or administrative decisions or interpretations of present of future laws or regulations, could restrict (or possibly prevent) our ability to continue to conduct our operations as currently contemplated. In such event, we, the Adviser and/or Morgan Stanley may agree to make certain amendments or changes to the extent necessary to permit the Adviser to continue to provide services to us, while enabling us to continue to achieve our purposes and objectives.
Exclusion of the Adviser from Commodity Pool Operator Definition
Engaging in commodity interest transactions such as swap transactions or futures contracts for us may cause the Adviser to fall within the definition of “commodity pool operator” under the Commodity Exchange Act (the “CEA”) and related Commodity Futures Trading Commission (the “CFTC”) regulations. On January 24, 2020, the Adviser claimed an exclusion from the definition of the term “commodity pool operator” under the CEA and the CFTC regulations in connection with its management of us (the “Exclusion”) and, therefore, the Adviser is not subject to CFTC registration or regulation under the CEA as a commodity pool operator with respect to its management of us. The Adviser intends to affirm the Exclusion on an annual basis, which current annual affirmation was filed by the Adviser on February 24, 2023.
Reporting Obligations and Available Information
We make available, free of charge, on our website our annual reports containing audited financial statements, quarterly reports, and other periodic reports as soon as reasonably practicable after we electronically file such material with, or furnish it to, the SEC. Our internet address is www.msdl.com. We are required to comply with all periodic reporting, proxy solicitation and other applicable requirements under the Exchange Act.
The SEC also maintains a website that contains annual reports, quarterly reports, current reports, proxy and information statements, and other information regarding issuers that file electronically with the SEC, including us, which can be accessed at www.sec.gov.
Certain Material U.S. Federal Income Tax Considerations
The following discussion is a general summary of the material U.S. federal income tax considerations applicable to us and to an investment in shares of our Common Stock. This summary does not purport to be a complete description of the income tax considerations applicable to such an investment. For example, we have not described certain considerations that may be relevant to certain types of holders subject to special treatment under U.S. federal income tax laws, including stockholders subject to the alternative minimum tax (the “AMT”), tax-exempt organizations, insurance companies, dealers in securities, traders in securities that elect to mark-to-market their securities holdings, pension plans and trusts, persons that have a functional currency (as defined in Section 985 of the Code) other than the U.S. dollar and financial institutions. This summary assumes that investors hold shares of our Common Stock as capital assets (within the meaning of Section 1221 of the Code). The discussion is based upon the Code, Treasury regulations, and administrative and judicial interpretations, each as of the date of the filing of this report and all of which are subject to change, possibly retroactively, which could affect the continuing validity of this discussion.
We have not sought and will not seek any ruling from the Internal Revenue Service (the “IRS”), regarding any offering of our securities. This summary does not discuss any aspects of U.S. estate or gift tax or foreign, state or local tax. It does not discuss the special treatment under U.S. federal income tax laws that could result if we invested in tax-exempt securities or certain other investment assets. For purposes of this discussion, references to “dividends” are to dividends within the meaning of the U.S. federal income tax laws and associated regulations and may include amounts subject to treatment as a return of capital under section 19(a) of the 1940 Act.
A “U.S. stockholder” is a beneficial owner of shares of our Common Stock that is for U.S. federal income tax purposes:
•a citizen or individual resident of the United States;
•a corporation, or other entity treated as a corporation for U.S. federal income tax purposes, created or organized in or under the laws of the United States or any state thereof or the District of Columbia;
•an estate, the income of which is subject to U.S. federal income taxation regardless of its source; or
•a trust if either a U.S. court can exercise primary supervision over its administration and one or more U.S. persons have the authority to control all of its substantial decisions or the trust was in existence on August 20, 1996, was treated as a U.S. person prior to that date, and has made a valid election to be treated as a U.S. person.
A “non-U.S. stockholder” is a beneficial owner of shares of our Common Stock that is not a U.S. stockholder.
If a partnership (including an entity treated as a partnership for U.S. federal income tax purposes) holds shares of Common Stock, the tax treatment of a partner in the partnership will generally depend upon the status of the partner and the activities of the partnership. A prospective investor that is a partner in a partnership that will hold shares of Common Stock should consult its tax advisors with respect to the purchase, ownership and disposition of shares of Common Stock.
Tax matters are very complicated and the tax consequences to an investor of an investment in shares of our Common Stock will depend on the facts of his, her or its particular situation. We encourage investors to consult their own tax advisors regarding the specific consequences of such an investment, including tax reporting requirements, the applicability of U.S. federal, state, local and foreign tax laws, eligibility for the benefits of any applicable tax treaty, and the effect of any possible changes in the tax laws.
Election to Be Taxed as a RIC
We have elected to be treated as a RIC under Subchapter M of the Code, and we intend to operate in a manner so as to continue to qualify for the tax treatment applicable to RICs. As a RIC, we generally will not have to pay corporate-level U.S. federal income taxes on any net ordinary income or capital gains that we timely distribute to our stockholders as dividends. To qualify as a RIC, we must, among other things, meet certain source-of-income and asset diversification requirements (as described below). In addition, we must distribute to our stockholders, for each taxable year, dividends of an amount at least equal to 90% of our investment company taxable income (“ICTI”), as defined by the Code, which is generally our net ordinary income plus the excess of realized net short-term capital gains over realized net long-term capital losses and determined without regard to any deduction for dividends paid (the “Annual Distribution Requirement”). Although not required for us to maintain our RIC tax status, in order to preclude the imposition of a 4% nondeductible federal excise tax imposed on RICs, we must distribute to our stockholders in respect of each calendar year dividends of an amount at least equal to the sum of (1) 98% of our net ordinary income (taking into account certain deferrals and elections) for the calendar year, (2) 98.2% of the excess (if any) of our realized capital gains over our realized capital losses, or capital gain net income (adjusted for certain ordinary losses), generally for the one-year period ending on October 31 of the calendar year and (3) the sum of any net ordinary income plus capital gains net income for preceding years that were not distributed during such years and on which we paid no federal income tax (the “Excise Tax Avoidance Requirement”).
Taxation as a RIC
If we:
•qualify as a RIC; and
•satisfy the Annual Distribution Requirement;
then we will not be subject to U.S. federal income tax on the portion of our ICTI and net capital gain, defined as net long-term capital gains in excess of net short-term capital losses, we distribute to stockholders. As a RIC, we will be subject to U.S. federal income tax at regular corporate rates on any net income or net capital gain not distributed as dividends to our stockholders.
In order to qualify as a RIC for U.S. federal income tax purposes, we must, among other things:
•qualify to be regulated as a BDC under the 1940 Act at all times during each taxable year;
•derive in each taxable year at least 90% of our gross income from dividends, interest, payments with respect to certain securities loans, gains from the sale of stock or other securities, or other income derived with respect to our business of investing in such stock or securities, and net income derived from interests in “qualified publicly traded partnerships” (partnerships that are traded on an established securities market or tradable on a secondary market, other than partnerships that derive 90% of their income from interest, dividends and other permitted RIC income) (the “90% Income Test”); and
•diversify our holdings so that at the end of each quarter of the taxable year:
◦at least 50% of the value of our assets consists of cash, cash equivalents, U.S. government securities, securities of other RICs, and other securities if such other securities of any one issuer do not represent more than 5% of the value of our assets or more than 10% of the outstanding voting securities of the issuer; and
◦no more than 25% of the value of our assets is invested in the securities, other than U.S. government securities or securities of other RICs, of one issuer or of two or more issuers that are controlled, as determined under applicable tax rules, by us and that are engaged in the same or similar or related trades or businesses or in the securities of one or more qualified publicly traded partnerships.
We may invest in partnerships, including qualified publicly traded partnerships, which may result in our being subject to state, local or foreign income, franchise or other tax liabilities.
In addition, as a RIC we are subject to ordinary income and capital gain distribution requirements under the Excise Tax Avoidance Requirement. If we do not meet the required distributions under the Excise Tax Avoidance Requirement, we will be subject to a 4% nondeductible federal excise tax on the undistributed amount. The failure to meet the Excise Tax Avoidance Requirement will not cause us to lose our RIC status. Although we currently intend to make sufficient distributions each taxable year to satisfy the Excise Tax Avoidance Requirement, under certain circumstances, we may choose to retain taxable income or capital gains in excess of current year distributions into the next tax year in an amount less than what would trigger payments of federal income tax under Subchapter M of the Code. We may then be required to pay a 4% excise tax on such income or capital gains.
A RIC is limited in its ability to deduct expenses in excess of its ICTI. If our deductible expenses in a given taxable year exceed our ICTI, we may incur a net operating loss for that taxable year. However, a RIC is not permitted to carry forward net operating losses to subsequent taxable years and such net operating losses do not pass through to its stockholders. In addition, deductible expenses can be used only to offset ICTI, not net capital gain. A RIC may not use any net capital losses (that is, the excess of realized capital losses over realized capital gains) to offset its ICTI, but may carry forward such net capital losses, and use them to offset future capital gains, indefinitely. Due to these limits on deductibility of expenses and net capital losses, we may for tax purposes have aggregate taxable income for several taxable years that we are required to distribute and that is taxable to our stockholders even if such taxable income is greater than the net income we actually earn during those taxable years.
Any underwriting fees paid by us are not deductible. We may be required to recognize taxable income in circumstances in which we do not receive cash. For example, if we hold debt obligations that are treated under applicable tax rules as having OID (such as debt instruments with PIK interest or, in certain cases, with increasing interest rates or issued with warrants), we must include in income each year a portion of the OID that accrues over the life of the obligation, regardless of whether cash representing such income is received by us in the same taxable year. Because any OID accrued will be included in our ICTI for the taxable year of accrual, we may be required to make a distribution to our stockholders in order to satisfy the Annual Distribution Requirement, even though we will not have received any corresponding cash amount. Furthermore, a portfolio company in which we hold equity or debt instruments may face financial difficulty that requires us to work out, modify, or otherwise restructure such equity or debt instruments. Any such restructuring could, depending upon the terms of the restructuring, cause us to incur unusable or nondeductible losses or recognize future non-cash taxable income.
Certain of our investment practices may be subject to special and complex U.S. federal income tax provisions that may, among other things, (1) treat dividends that would otherwise constitute qualified dividend income as non-qualified dividend income, (2) treat dividends that would otherwise be eligible for the corporate dividends-received deduction as ineligible for such treatment, (3) disallow, suspend or otherwise limit the allowance of certain losses or deductions, (4) convert lower-taxed long-term capital gain into higher-taxed short-term capital gain or ordinary income, (5) convert an ordinary loss or a deduction into a capital loss (the deductibility of which is more limited), (6) cause us to recognize income or gain without a corresponding receipt of cash, (7) adversely affect the time as to when a purchase or sale of stock or securities is deemed to occur, (8) adversely alter the characterization of certain complex financial transactions and (9) produce income that will not be qualifying income for purposes of the 90% Income Test. We intend to monitor our transactions and may make certain tax elections to mitigate the effect of these provisions and prevent our ability to be subject to tax as a RIC.
Gain or loss realized by us from warrants acquired by us as well as any loss attributable to the lapse of such warrants generally will be treated as capital gain or loss. Such gain or loss generally will be long-term or short-term, depending on how long we held a particular warrant or security.
A portfolio company in which we invest may face financial difficulties that require us to work-out, modify or otherwise restructure its investment in the portfolio company. Any such transaction could, depending upon the specific terms of the transaction, result in unusable capital losses and future non-cash income. Any such transaction could also result in our receiving assets that give rise to income that is not qualifying income for purposes of the 90% Income Test.
Our investment in non-U.S. securities may be subject to non-U.S. income, withholding and other taxes. In that case, our yield on those securities would be decreased. stockholders generally will not be entitled to claim a U.S. foreign tax credit or deduction with respect to non-U.S. taxes paid by the Company.
Although we do not presently expect to do so, we are authorized to borrow funds and to sell assets in order to satisfy distribution requirements. However, under the 1940 Act, we are not permitted to make distributions to our stockholders while our debt obligations and other senior securities are outstanding unless certain “asset coverage” tests are met. See “Item 1. Business—Regulation as a Business Development Company—Senior Securities.” Moreover, our ability to dispose of assets to meet our distribution requirements may be limited by (1) the illiquid nature of our portfolio and/or (2) other requirements relating to our qualification as a RIC, including certain diversification tests in order to qualify as a RIC for U.S. federal income tax purposes (the “Diversification Tests”). If we dispose of assets in order to meet the Annual Distribution Requirement or the Excise Tax Avoidance Requirement, we may make such dispositions at times that, from an investment standpoint, are not advantageous.
Some of the income and fees that we may recognize, such as fees for providing managerial assistance, certain fees earned with respect to our investments, income recognized in a work-out or restructuring of a portfolio investment, or income recognized from an equity investment in an operating partnership, will not satisfy the 90% Income Test. In order to manage the risk that such income and fees might disqualify us as a RIC for a failure to satisfy the 90% Income Test, we may be required to recognize such income and fees indirectly through one or more entities treated as corporations for U.S. federal income tax purposes. Such corporations will be required to pay U.S. corporate income tax on their earnings, which ultimately will reduce our return on such income and fees.
There may be uncertainty as to the appropriate treatment of certain of our investments for U.S. federal income tax purposes. In particular, we may invest a portion of our net assets in below investment grade instruments. U.S. federal income tax rules with respect to such instruments are not entirely clear about issues such as if an instrument is treated as debt or equity, whether and to what extent we should recognize interest, OID or market discount, when and to what extent deductions may be taken for bad debts or worthless instruments, how payments received on obligations in default should be allocated between principal and income and whether exchanges of debt obligations in a bankruptcy or workout context are taxable. These and other issues will be addressed by us, to the extent necessary, in order to seek to ensure that we distribute sufficient income to qualify, and maintain our qualification as, a RIC and to ensure that we do not become subject to U.S. federal income or excise tax.
Income received by us from sources outside the United States may be subject to withholding and other taxes imposed by such countries, thereby reducing income available to us. Tax conventions between certain countries and the United States may reduce or eliminate such taxes. We generally intend to conduct our investment activities to minimize the impact of foreign taxation, but there is no guarantee that we will be successful in this regard.
We may invest in stocks of foreign companies that are classified under the Code as passive foreign investment companies (“PFICs”). In general, a foreign company is classified as a PFIC if at least 50% of its assets constitute investment-type assets or 75% or more of its gross income is investment-type income. In general, under the PFIC rules, an “excess distribution” received with respect to PFIC stock is treated as having been realized ratably over the period during which we held the PFIC stock. We will be subject to tax on the portion, if any, of the excess distribution that is allocated to our holding period in prior taxable years (and an interest factor will be added to the tax, as if the tax had actually been payable in such prior taxable years) even though we distribute the corresponding income to stockholders. Excess distributions include any gain from the sale of PFIC stock as well as certain distributions from a PFIC. All excess distributions are taxable as ordinary income.
We may be eligible to elect alternative tax treatment with respect to PFIC stock. Under such an election, we generally would be required to include in our gross income its share of the earnings of a PFIC on a current basis, regardless of whether any distributions are received from the PFIC. If this election is made, the special rules, discussed above, relating to the taxation of excess distributions, would not apply. Alternatively, we may be able to elect to mark to market our PFIC stock, resulting in any unrealized gains at year end being treated as though they were realized and reported as ordinary income. Any mark-to-market losses and any loss from an actual disposition of the PFIC’s shares would be deductible as ordinary losses to the extent of any net mark-to-market gains included in income in prior years with respect to stock in the same PFIC.
Because the application of the PFIC rules may affect, among other things, the character of gains, the amount of gain or loss and the timing of the recognition of income with respect to PFIC stock, as well as subject us to tax on certain income from PFIC stock, the amount that must be distributed to stockholders, and which will be taxed to stockholders as ordinary income or long-term capital gain, may be increased or decreased substantially as compared to a fund that did not invest in PFIC stock.
Under the Code, gains or losses attributable to fluctuations in foreign currency exchange rates that occur between the time we accrue interest income or other receivables or accrues expenses or other liabilities denominated in a foreign currency and the time we actually collect such receivables or pays such liabilities generally are treated as ordinary income or ordinary loss. Similarly, on disposition of some investments, including debt securities and certain forward contracts denominated in a foreign currency, gains or losses attributable to fluctuations in the value of foreign currency between the date of acquisition of the security or contract and the date of disposition also are treated as ordinary gain or loss. These gains and losses, referred to under the Code as “section 988” gains and losses, may increase or decrease the amount of our ICTI to be distributed to stockholders as ordinary income. For example, fluctuations in exchange rates may increase the amount of income that we must distribute in order to qualify for treatment as a RIC and to prevent application of an excise tax on undistributed income.
Alternatively, fluctuations in exchange rates may decrease or eliminate income available for distribution. If section 988 losses exceed other ICTI during a taxable year, we would not be able to make ordinary distributions, or distributions made before the losses were realized would be re-characterized as a return of capital to stockholders for U.S. federal income tax purposes, rather than as ordinary dividend income, and would reduce each stockholder’s basis in Common Stock.
Certain distributions reported by us as section 163(j) interest dividends may be treated as interest income by stockholders for purposes of the tax rules applicable to interest expense limitations under Code section 163(j). Such treatment by the stockholder is generally subject to holding period requirements and other potential limitations, although the holding period requirements are generally not applicable to dividends declared by money market funds and certain other funds that declare dividends daily and pay such dividends on a monthly or more frequent basis. The amount that we are eligible to report as a Section 163(j) dividend for a tax year is generally limited to the excess of our business interest income over the sum of our (i) business interest expense and (ii) other deductions properly allocable to our business interest income.
Failure to Qualify as a RIC
If we were unable to qualify for treatment as a RIC and are unable to cure the failure, for example, by disposing of certain investments quickly or raising additional capital to prevent the loss of RIC status, we would be subject to tax on all of our taxable income at regular corporate rates. The Code provides some relief from RIC disqualification due to failures to comply with the 90% Income Test and the Diversification Tests, although there may be additional taxes due in such cases. We cannot assure you that we would qualify for any such relief should we fail the 90% Income Test or the Diversification Tests.
Should failure occur, all our taxable income would be subject to tax at regular corporate rates and we would not be able to deduct our dividend distributions to stockholders. Additionally, we would no longer be required to distribute our income and gains. Distributions, including distributions of net long-term capital gain, would generally be taxable to our stockholders as ordinary dividend income to the extent of our current and accumulated earnings and profits. Subject to certain limitations under the Code, certain corporate stockholders would be eligible to claim a dividends-received deduction with respect to such dividends and non-corporate stockholders would generally be able to treat such dividends as “qualified dividend income,” which is subject to reduced rates of U.S. federal income tax. Distributions in excess of our current and accumulated earnings and profits would be treated first as a return of capital to the extent of the stockholder’s tax basis, and any remaining distributions would be treated as a capital gain. If we fail to qualify as a RIC, we may be subject to regular corporate tax on any net built-in gains with respect to certain of our assets (i.e., the excess of the aggregate gains, including items of income, over aggregate losses that would have been realized with respect to such assets if we had been liquidated) that we elect to recognize on requalification or when recognized over the next five taxable years.
Staffing
We do not currently have any employees. Our day-to-day investment operations are managed by our Adviser, and our Administrator provides services necessary to conduct our business. We pay no compensation directly to any interested director or executive officer of the Company. We pay our Administrator our allocable portion of certain expenses incurred by our Administrator in performing its obligations under the Administration Agreement, including our allocable portion of the cost of our Chief Financial Officer and Chief Compliance Officer.
Item 1A. Risk Factors
Investing in shares of our Common Stock involves a number of significant risks. Before you invest in shares of our Common Stock, you should be aware of various risks, including those described below. The risks set out below are not the only risks we face. Additional risks and uncertainties not presently known to us or not presently deemed material by us may also impair our operations and performance. If any of the following events occur, our business, financial condition, results of operations and cash flows could be materially and adversely affected. In such case, our net asset value could decline, and you may lose all or part of your investment. The risk factors described below are the principal risk factors associated with an investment in us as well as those factors generally associated with an investment company with investment objectives, investment policies, capital structure or trading markets similar to ours.
Risks Relating to Our Business and Structure
Operating as a BDC imposes numerous constraints on us and significantly reduces our operating flexibility. In addition, if we fail to maintain our status as a BDC, we might be regulated as a closed-end investment company, which would subject us to additional regulatory restrictions.
The 1940 Act imposes numerous constraints on the operations of BDCs that do not apply to certain of the other investment vehicles advised by our Adviser and its affiliates. BDCs are required, for example, to invest at least 70% of their total assets primarily in securities of U.S. private or thinly traded public companies, cash, cash equivalents, U.S. government securities and other high-quality debt instruments that mature in one year or less from the date of investment. These constraints may hinder our ability to take advantage of attractive investment opportunities and to achieve our investment objective. Furthermore, any failure to comply with the requirements imposed on BDCs by the 1940 Act could cause the SEC to bring an enforcement action against us and/or expose us to claims of private litigants.
We may be precluded from investing in what our Adviser believes are attractive investments if such investments are not qualifying assets for purposes of the 1940 Act. If we do not invest a sufficient portion of our assets in qualifying assets, we will be prohibited from making any additional investment that is not a qualifying asset and could be forced to forgo attractive investment opportunities. Similarly, these rules could prevent us from making follow-on investments in existing portfolio companies (which could result in the dilution of our position).
If we fail to maintain our status as a BDC, we might be regulated as a closed-end investment company that is required to register under the 1940 Act, which would subject us to additional regulatory restrictions and significantly decrease our operating flexibility. In addition, any such failure could cause an event of default under any outstanding indebtedness we might have, which could have a material adverse effect on our business, financial condition or results of operations.
We are subject to risks associated with the current interest rate environment and to the extent we use debt to finance our investments, changes in interest rates will affect our cost of capital and net investment income.
To the extent we borrow money or issue debt securities or any preferred stock to make investments, our net investment income will depend, in part, upon the difference between the rate at which we borrow funds or pay interest or distributions on such debt securities or preferred stock and the rate at which we invest these funds. In addition, we anticipate that many of our debt investments and borrowings will have floating interest rates that reset on a periodic basis, and many of our investments will be subject to interest rate floors. As a result, a significant change in market interest rates could have a material adverse effect on our net investment income. Rising interest rates on floating rate loans we make to portfolio companies could drive an increase in defaults or accelerated refinancings. Some portfolio companies may be unable to refinance into fixed rate loans or repay outstanding amounts, leading to a gradual decline in the credit quality of our portfolio. In periods of rising interest rates, our cost of funds will increase because we expect that the interest rates on the majority of amounts we borrow will be floating. This change could reduce our net investment income to the extent any debt investments have fixed interest rates. We may use interest rate risk management techniques in an effort to limit our exposure to interest rate fluctuations. Such techniques may include various interest rate hedging activities to the extent permitted by the 1940 Act and applicable commodities laws. These activities may limit our ability to benefit from lower interest rates with respect to hedged borrowings. Adverse developments resulting from changes in interest rates or hedging transactions could have a material adverse effect on our business, financial condition and results of operations.
The discontinuation of LIBOR and replacement or reform of other interest rate benchmarks may adversely affect our business and results of operations.
Many financial instruments have historically used a floating rate based on LIBOR, which was the offered rate for short-term Eurodollar deposits between major international banks. LIBOR was and other benchmark interest rates may, in the future, be the subject of national and international regulatory scrutiny.
Following their publication on June 30, 2023, no settings of LIBOR continue to be published on a representative basis and publication of many non-U.S. dollar LIBOR settings has been entirely discontinued.
On March 15, 2022, the U.S. enacted federal legislation that is intended to minimize legal and economic uncertainty following U.S. dollar LIBOR’s cessation by replacing LIBOR references in certain U.S. law- governed contracts under certain circumstances with a SOFR-based rate identified in a Federal Reserve rule plus a statutory spread adjustment. The legislation also creates a safe harbor that shields lenders from litigation if they choose to utilize a replacement rate recommended by the Board of Governors of the Federal Reserve. In addition, the U.K. Financial Conduct Authority (“FCA”), which regulates the publisher of LIBOR (ICE Benchmark Administration), has announced that it will require the continued publication of the one-, three- and six-month tenors of U.S. dollar LIBOR on a non-representative synthetic basis until the end of September 2024, which may result in certain non-U.S. law-governed contracts and U.S. law- governed contracts not covered by the federal legislation remaining on synthetic U.S. dollar LIBOR until the end of this period.
Although the transition process away from LIBOR has become increasingly well-defined (e.g., the LIBOR Act now provides a uniform benchmark replacement for certain LIBOR-based instruments in the United States), the transition process is complex. The market transition away from LIBOR and reform, modification, or adjustments of other reference rate benchmarks to alternative reference rates is complex and could have a range of adverse impacts on our business, financial condition and results of operations. In particular, any such transition or reform could:
•Adversely impact the pricing, liquidity, value of, return on and trading for a broad array of financial products, including any securities, linked to LIBOR, or the applicable benchmark rate, loans and derivatives that are included in our assets and liabilities;
•Require further extensive changes to documentation that governs or reference based products using applicable benchmark rate, including, for example, pursuant to time-consuming renegotiations of existing documentation to modify the terms of outstanding transactions;
•Result in disputes, litigation or other actions with portfolio companies, or other counterparties, regarding the interpretation and enforceability of provisions in investments, that utilize certain benchmark rates, the transition from one benchmark rate to other benchmark rates, including through fallback language, legislative requirements or other related provisions, or, in connection with any economic, legal, operational or other impact resulting from the fundamental differences of the various alternative reference rates;
•Require the transition and/or development of appropriate systems and analytics to effectively transition risk management processes to those based on one or more alternative reference rates in a timely manner, including by quantifying value and risk for various alternative reference rates, which may prove challenging given the limited history of an applicable alternative reference rate; and
•Cause us to incur additional costs in relation to any of the above factors.
In addition, the failure of any alternative benchmark rate to gain or maintain market acceptance could adversely affect the return on, value of and market for securities, variable rate debt and derivative financial instruments linked to such rates. Depending on several factors, including those set forth above, our business, financial condition and results of operations could be materially adversely impacted by the market transition or reform of certain reference rates and benchmarks. Other factors include the pace of the transition to replacement or reformed rates, timing mismatches between cash and derivative markets, the specific terms and parameters for and market acceptance of any alternative reference rate, market conventions for the use of any alternative reference rate in connection with a particular product (including the timing and market adoption of any conventions proposed or recommended by any industry or other group), prices of and the liquidity of trading markets for products based on alternative reference rates, and our ability to transition and develop appropriate systems and analytics for one or more alternative reference rates. As of December 31, 2023, we did not hold any investments in our debt portfolio that bore interest at a floating rate determined on the basis of LIBOR.
We depend upon our Adviser and Administrator for our success and upon their access to the investment professionals and partners of Morgan Stanley and its affiliates.
We do not have any internal management capacity or employees. We depend on the diligence, skill and network of business contacts of the senior investment professionals of our Adviser to achieve our investment objective. We cannot assure you that we will replicate the historical results achieved for other Morgan Stanley funds, and we caution you that our investment returns could be substantially lower than the returns achieved by them in prior periods. We expect that the Adviser will evaluate, negotiate, structure, close and monitor our investments in accordance with the terms of the Investment Advisory Agreement. We can offer no assurance, however, that the senior investment professionals of the Adviser will continue to provide investment advice to us. The loss of any member of the Investment Committee or of other senior investment professionals of the Adviser and its affiliates could limit our ability to achieve our investment objective and operate as we anticipate. In addition, we can offer no assurance that the resources, relationships and expertise of Morgan Stanley will be available for every transaction or generally during the term of the Company. This could have a material adverse effect on our financial condition, results of operations and cash flows. For the avoidance of doubt, we are not a subsidiary of or consolidated with Morgan Stanley. Furthermore, Morgan Stanley has no obligation, contractual or otherwise, to financially support us. See “Management’s Discussion and Analysis of Financial Condition and Results of Operations — MS Credit Partners Holdings Investment.” Morgan Stanley has no history of financially supporting any of the BDCs on the MS Private Credit platform, even during periods of financial distress.
We depend on the diligence, skill and network of business contacts of the professionals available to our Administrator to carry out the administrative functions necessary for us to operate, including the ability to select and engage sub-administrators and third-party service providers. We can offer no assurance, however, that the professionals of the Administrator will continue to provide administrative services to us. In addition, we can offer no assurance that the resources, relationships and expertise of Morgan Stanley will be available to the Administrator throughout the term of the Company. This could have a material adverse effect on our financial condition, results of operations and cash flows.
Our business model depends to a significant extent upon strong referral relationships with private equity sponsors. Any inability of the Adviser to maintain or develop these relationships, or the failure of these relationships to generate investment opportunities, could adversely affect our business.
We depend upon the Adviser’s and its affiliates’ relationships with private equity sponsors, and we intend to rely to a significant extent upon these relationships to provide us with potential investment opportunities. If the Adviser fails to maintain such relationships, or to develop new relationships with other sponsors or sources of investment opportunities, we will not be able to grow our investment portfolio. In addition, individuals with whom the principals of the Adviser and its affiliates have relationships are not obligated to provide us with investment opportunities, and, therefore, we can offer no assurance that these relationships will generate investment opportunities for us in the future.
The time and resources that individuals associated with our Adviser devote to us may be diverted, and we may face additional competition due to the fact that neither our Adviser nor its affiliates are prohibited from raising money for or managing another entity that makes the same types of investments that we target.
The Adviser and its affiliates currently serve as the investment adviser for various funds, accounts and strategies, including the funds and accounts on the MS Private Credit platform, including the MS BDCs, and are not prohibited from raising money for and managing future investment entities that make the same or similar types of investments as those we target. As a result, the time and resources that our Adviser devotes to us may be diverted, and during times of intense activity in other investment programs they may devote less time and resources to our business than is necessary or appropriate. In addition, we may compete with any such investment entity also advised by the Adviser or its affiliates for the same investors and investment opportunities.
We may not replicate the historical results achieved by other entities advised or sponsored by members of the Investment Committee, or by the Adviser or its affiliates.
Our investments may differ from those of existing accounts that are or have been sponsored or advised by members of the Investment Committee, the Adviser or affiliates of the Adviser. Investors in our securities are not acquiring an interest in any accounts that are or have been sponsored or advised by members of the Investment Committee, the Adviser or affiliates of the Adviser. Subject to the requirements of the 1940 Act and the provisions of the co-investment exemptive order applicable to us, or, as amended, the exemptive order, we often co-invest in portfolio investments with other Affiliated Investment Accounts. Any such investments are subject to regulatory limitations and approvals by the Independent Directors. We can offer no assurance, however, that we will obtain such approvals or develop opportunities that comply with such limitations. We also cannot assure you that we will replicate the historical results achieved for other Morgan Stanley funds by members of the Investment Committee (including the Affiliated Investment Accounts), and we caution you that our investment returns could be substantially lower than the returns achieved by them in prior periods. Additionally, all or a portion of the prior results may have been achieved in particular market conditions which may never be repeated. Moreover, current or future market volatility and regulatory uncertainty may have an adverse impact on our future performance. Our financial condition and results of operation depend on our ability to manage future growth effectively.
Our ability to achieve our investment objective depends on our ability to grow, which depends, in turn, on the Adviser’s ability to identify, invest in and monitor companies that meet our investment selection criteria. Accomplishing this result on a cost-effective basis is largely a function of the Adviser’s structuring of the investment process, its ability to provide competent, attentive and efficient services to us and our access to financing on acceptable terms. We can offer no assurance that any current or future employees of the Adviser will contribute effectively to the work of, or remain associated with, the Adviser. We caution you that the principals of our Adviser or Administrator may also be called upon to provide managerial assistance to our portfolio companies and those of other investment vehicles, including the MS BDCs, which are advised by the Adviser. Such demands on their time may distract them or slow our rate of investment. Any failure to manage our future growth effectively could have a material adverse effect on our business, financial condition and results of operations.
The Adviser may frequently be required to make investment analyses and decisions on an expedited basis in order to take advantage of investment opportunities, and our Adviser may not have knowledge of all circumstances that could impact our investments.
Investment analyses and decisions by the Adviser may frequently be required to be undertaken on an expedited basis to take advantage of investment opportunities. In such cases, the information available to the Adviser at the time of making an investment decision may be limited. Therefore, we can offer no assurance that the Adviser will have knowledge of all circumstances that may adversely affect a portfolio investment, and the Adviser may make portfolio investments which it would not have made if more extensive due diligence had been undertaken.
In addition, the Adviser may rely upon independent consultants and advisors in connection with its evaluation of proposed investments, and we can offer no assurance as to the accuracy or completeness of the information provided by such independent consultants and advisors or to the Adviser’s right of recourse against them in the event errors or omissions do occur.
There are significant potential conflicts of interest that could affect our investment returns.
As a result of our Adviser and Administrator’s affiliation with, and the Investment Committee members’ employment by, Morgan Stanley, there may be times when the Adviser, the Administrator or such persons have interests that differ from those of our stockholders, giving rise to a conflict of interest. As a diversified global financial services firm, Morgan Stanley engages in a broad spectrum of activities, including financial advisory services, investment management activities, lending, commercial banking, sponsoring and managing private investment funds, engaging in broker-dealer transactions and principal securities, commodities and foreign exchange transactions, research publication and other activities. In the ordinary course of its business, Morgan Stanley is a full-service investment banking and financial services firm and therefore engages in activities where Morgan Stanley’s interests or the interests of its clients may conflict with the interests of our stockholders, notwithstanding Morgan Stanley’s participation as one of our investors. Investors should be aware that potential and actual conflicts of interest between Morgan Stanley or any Affiliated Investment Account, on the one hand, and us, on the other hand, may exist and others may arise in connection with our operation. Morgan Stanley’s employees may also have interests separate from those of Morgan Stanley and us. There is no assurance that conflicts of interest will be resolved in favor of the Company’s stockholders, and, in fact, they may not be.
Conflicts related to obligations the Investment Committee, the Adviser or its affiliates have to other clients and conflicts related to fees and expenses of such other clients.
Morgan Stanley, the parent company of the Adviser, has advised and may advise clients and has sponsored, managed or advised other Affiliated Investment Accounts with a wide variety of investment objectives that in some instances may overlap or conflict with our investment objectives and present conflicts of interest. In addition, Morgan Stanley routinely makes equity and debt investments in connection with its global business and operations. MS Private Credit may also from time to time create new or successor Affiliated Investment Accounts that may compete with us and present similar conflicts of interest. In serving in these multiple capacities, Morgan Stanley, including the Adviser, the Investment Committee and the Investment Team, may have obligations to other clients or investors in Affiliated Investment Accounts, the fulfillment of which may not be in the best interests of us or our stockholders. For example, in connection with the management of investments for other Affiliated Investment Accounts, members of Morgan Stanley and its affiliates may serve on the boards of directors of or advise companies which may compete with our portfolio investments. Our investment objective may overlap with the investment objectives of certain Affiliated Investment Accounts. For example, the Adviser currently serves as the investment adviser to the MS BDCs. As a result, the members of the Investment Committee may face conflicts in the allocation of investment opportunities among us and other Affiliated Investment Accounts. Certain Affiliated Investment Accounts, including the MS BDCs, may provide for higher management fees, incentive fees, greater expense reimbursements or overhead allocations or may permit the Adviser and its affiliates to receive higher origination and other transaction fees, all of which may contribute to this conflict of interest and create an incentive for the Adviser to favor such Affiliated Investment Accounts. For example, the 1940 Act restricts the Adviser from receiving more than a 1% fee in connection with loans that we acquire, or originate, a limitation that does not exist for certain other accounts.
Morgan Stanley currently invests and plans to continue to invest on its own behalf and on behalf of its Affiliated Investment Accounts in a wide variety of investment opportunities in North America, Europe and elsewhere. Morgan Stanley and, to the extent consistent with applicable law and/or exemptive relief, its Affiliated Investment Accounts will be permitted to invest in investment opportunities without making such opportunities available to us beforehand. Subject to the requirements of any applicable exemptive relief, Morgan Stanley may offer investments that fall into the investment objectives of an Affiliated Investment Account to such account or make such investment on its own behalf, even though such investment also falls within our investment objectives. We may invest in opportunities that Morgan Stanley and/or one or more Affiliated Investment Accounts has declined, and vice versa. In addition, to the extent permitted by applicable law, investment opportunities in companies in which certain Affiliated Investment Accounts have already invested may be available to the Company notwithstanding that the Company has no existing investments in such portfolio company, resulting in assets of the Company potentially providing value to, or otherwise supporting the investments of, other Affiliated Investment Accounts. All of the foregoing may reduce the number of investment opportunities available to us and may create conflicts of interest in allocating investment opportunities among the Company, itself and the Affiliated Investment Accounts, including the MS BDCs. Our Adviser has established allocation policies and procedures and will continue to allocate opportunities among one or more of the Company and such Affiliated Investment Accounts in accordance with the terms of such policies and procedures. Investors should note that such allocation decisions may not be resolved to our advantage. There can be no assurance that we will have an opportunity to participate in certain opportunities that fall within our investment objectives.
It is possible that Morgan Stanley or an Affiliated Investment Account will invest in a company that is or becomes a competitor of one of our portfolio companies. Such investment could create conflicts of interest among the Company, Morgan Stanley and/or the Affiliated Investment Account. Morgan Stanley may also have conflicts of interest in the allocation of Morgan Stanley resources to the portfolio company. In addition, certain Affiliated Investment Accounts will be focused primarily on investing in other funds which may have strategies that overlap and/or directly conflict and compete with us. In certain cases, we may be unable to invest in attractive opportunities because of the investment by these Affiliated Investment Accounts in such private equity or private credit sponsoring funds.
We do not expect to invest in, or hold securities of, companies that are controlled by an affiliate’s other clients. However, our Adviser or an affiliate’s other clients may invest in, and gain control over, one of our portfolio companies. If our Adviser or an affiliate’s other client, or clients, gains control over one of our portfolio companies, it may create conflicts of interest and may subject us to certain restrictions under the 1940 Act. As a result of these conflicts and restrictions our Adviser may be unable to implement our investment strategies as effectively as they could have in the absence of such conflicts or restrictions. For example, as a result of a conflict or restriction, our Adviser may be unable to engage in certain transactions that it would otherwise pursue. In order to avoid these conflicts and restrictions, our Adviser may choose to exit such investments prematurely and, as a result, we may forego any positive returns associated with such investments. In addition, to the extent that an affiliate’s other client holds a different class of securities than us as a result of such transactions, our interests may not be aligned.
It should be noted that Morgan Stanley has, directly and indirectly, made investments in certain of its Affiliated Investment Accounts, and accordingly Morgan Stanley’s investment in us in itself may not determine the outcome in the resolution of any of the foregoing conflicts.
In the course of our investing activities, we pay management and incentive fees to the Adviser and reimburse certain expenses of the Administrator. As a result, investors in shares of our Common Stock will invest on a “gross” basis and receive distributions on a “net” basis after expenses, resulting in a lower rate of return than one might achieve through direct investments. As a result of this arrangement, there may be times when the Adviser has interests that differ from those of our common stockholders, giving rise to a conflict.
The Investment Committee, the Adviser or its affiliates may, from time to time, possess material non-public information, or may not have access to certain information held by Morgan Stanley, each of which would limit our investment discretion.
Principals of the Adviser and its affiliates and members of the Investment Committee may serve as directors of, or in a similar capacity with, companies in which we invest, the securities of which are purchased or sold on our behalf. In the event that material nonpublic information is obtained with respect to such companies, or we become subject to trading restrictions in order to comply with applicable law, regulatory restrictions or internal policies or procedures, including without limitation joint transaction restrictions pursuant to the 1940 Act, we could be prohibited for a period of time from purchasing or selling the securities of such companies, and this prohibition may have an adverse effect on us. The Adviser and/or Morgan Stanley may also from time to time be subject to contractual “stand-still” obligations and/or confidentiality obligations that may restrict the Adviser’s ability to trade in or make certain investments on behalf of the Company. In addition, Morgan Stanley may be precluded from disclosing such information to the Investment Team, even in circumstances in which the information would benefit the Company if disclosed. Therefore, the Adviser may not be provided access to material nonpublic information in the possession of Morgan Stanley that might be relevant to an investment decision to be made by the Company, and the Company may initiate a transaction or sell an investment that, if such information had been known to it, may not have been undertaken. In addition, certain members of the Investment Team and of the Investment Committee may be recused from certain investment-related discussions, including investment committee meetings, so that such members do not receive information that would limit their ability to perform functions of their employment with Morgan Stanley unrelated to the Company. Furthermore, access to certain parts of Morgan Stanley may be subject to third party confidentiality obligations and to information barriers established by Morgan Stanley in order to manage potential conflicts of interest and regulatory restrictions, including without limitation joint transaction restrictions pursuant to the 1940 Act. Accordingly, the Company’s ability to source investments from other business units within Morgan Stanley may be limited and there can be no assurance that the Company will be able to source any investments from any one or more parts of the Morgan Stanley network.
Our management fee and incentive fee structure may create incentives for the Adviser that are not fully aligned with the interests of our stockholders and may induce the Adviser to make speculative investments.
In the course of our investing activities, we pay a management fee and incentive fees to the Adviser. The base management fee is based on our average gross assets and the incentive fee is computed and paid on income, both of which include leverage. As a result, investors in shares of our Common Stock will invest on a “gross” basis and receive distributions on a “net” basis after expenses, resulting in a lower rate of return than one might achieve through direct investments. Because the management fee is based on our average gross assets, the Adviser benefits when we incur debt or use leverage. Under certain circumstances, the use of leverage may increase the likelihood of default, which would disfavor us and our stockholders.
In addition, as additional leverage would magnify positive returns, if any, on our portfolio, our incentive fee would become payable to our Adviser (i.e., exceed the hurdle rate) at a lower average return on our portfolio. Thus, if we incur additional leverage, our Adviser may receive additional incentive fees without any corresponding increase (and potentially with a decrease) in our net performance. Additionally, the incentive fee payable by us to the Adviser may create an incentive for the Adviser to cause us to realize capital gains or losses that may not be in the best interests of us or our stockholders. Under the incentive fee structure, the Adviser benefits when we recognize capital gains and, because the Adviser determines when an investment is sold, the Adviser controls the timing of the recognition of such capital gains.
As a result, our Adviser may have an incentive to invest more in companies whose securities are likely to yield capital gains, as compared to income producing securities. Such a practice could result in our investing in more speculative securities than would otherwise be the case, which could result in higher investment losses, particularly during cyclical economic downturns. PIK interest and OID, would increase our pre-incentive fee net investment income by increasing the size of the loan balance of underlying loans and increasing our assets under management and makes it easier for our Adviser to surpass the hurdle rate and increase the amount of incentive fees payable to our Adviser.
This fee structure may be considered to give rise to a conflict of interest for the Adviser to the extent that it may encourage the Adviser to favor debt financings that provide for deferred interest, rather than current cash payments of interest. Under these investments, we will accrue the interest over the life of the investment, but we will not receive the cash income from the investment until the end of the term. Our net investment income used to calculate the income portion of our investment fee, however, includes accrued interest. The Adviser may have an incentive to invest in deferred interest securities in circumstances where it would not have done so but for the opportunity to continue to earn the fees even when the issuers of the deferred interest securities would not be able to make actual cash payments to us on such securities. This risk could be increased because the Adviser is not obligated to reimburse us for any fees received even if we subsequently incur losses or never receive in cash the deferred income that was previously accrued.
For federal income tax purposes, we may be required to recognize taxable income in some circumstances in which we do not receive a corresponding payment in cash and to make distributions with respect to such income to maintain our tax treatment as a RIC and/or minimize corporate-level U.S. federal income or excise tax. Under such circumstances, we may have difficulty meeting the Annual Distribution Requirement (as defined below) necessary to maintain RIC tax treatment under the Code. See “Item 1. Business—Certain Material U.S. Federal Income Tax Considerations—Election to be Taxed as a RIC.” This difficulty in making the required distribution may be amplified to the extent that we are required to pay the incentive fee on income with respect to such accrued income. As a result, we may have to sell some of our investments at times and/or at prices we would not consider advantageous, raise additional debt or equity capital, or forgo new investment opportunities for this purpose. If we are not able to obtain cash from other sources, we may fail to qualify for RIC tax treatment and thus become subject to corporate-level U.S. federal income tax.
Conflicts related to other arrangements with the Adviser and its affiliates.
We have entered into a license agreement, or the License Agreement, with Morgan Stanley Investment Management, Inc., an affiliate of our Adviser, under which Morgan Stanley Investment Management, Inc. has granted us a non-exclusive, royalty-free license to use the name “Morgan Stanley.” In addition, we pay to the Administrator our allocable portion of certain expenses incurred by the Administrator in performing its obligations under the Administration Agreement, such as our allocable portion of the cost of our Chief Financial Officer and Chief Compliance Officer. These arrangements create conflicts of interest that our Board of Directors monitors.
Our ability to enter into transactions with our affiliates is restricted.
As a BDC, we are prohibited under the 1940 Act from participating in certain transactions with certain of our affiliates without the prior approval of a majority of our Independent Directors and, in some cases, the SEC. Any person that owns, directly or indirectly, 5% or more of our outstanding voting securities is our affiliate for purposes of the 1940 Act, and we are generally prohibited from buying or selling any securities from or to such affiliate on a principal basis, absent the prior approval of our Board of Directors and, in some cases, the SEC. The 1940 Act also prohibits certain “joint” transactions with certain of our affiliates, which in certain circumstances could include investments in the same portfolio company (whether at the same or different times to the extent the transaction involves a joint investment), without prior approval of our Board of Directors and, in some cases, the SEC. If a person acquires more than 25% of our voting securities, we will be prohibited from buying or selling any security from or to such person or certain of that person’s affiliates, or entering into prohibited joint transactions with such persons, absent the prior approval of the SEC. Similar restrictions limit our ability to transact business with our officers or directors or their affiliates.
The SEC has interpreted the BDC regulations governing transactions with affiliates to prohibit certain joint transactions involving entities that share a common investment adviser. As a result of these restrictions, we are prohibited from buying or selling any security from or to any portfolio company that is controlled by a fund advised by the Adviser or their respective affiliates without the prior approval of the SEC, which may limit the scope of investment opportunities that would otherwise be available to us.
We may, however, invest alongside our Adviser’s and/or its affiliates’ other clients, in certain circumstances where doing so is consistent with applicable law and SEC staff interpretations, guidance and exemptive relief orders. However, although the Adviser endeavors to fairly allocate investment opportunities in the long run, we can offer no assurance that investment opportunities will be allocated to us fairly or equitably in the short-term or over time. The SEC has granted us and our Adviser exemptive relief (the "Order") that allows us to enter into certain negotiated co-investment transactions alongside certain Affiliated Investment Accounts in a manner consistent with our investment objective, positions, policies, strategies, and restrictions as well as regulatory requirements and other pertinent factors, subject to compliance with the conditions specified in the Order. Pursuant to the Order, we are permitted to co-invest with our affiliates if a “required majority” (as defined in Section 57(o) of the 1940 Act) of our eligible directors make certain conclusions in connection with a co-investment transaction, including that (1) the terms of the transactions, including the consideration to be paid, are reasonable and fair to us and our stockholders and do not involve overreaching in respect of us or our stockholders on the part of any person concerned, and (2) the transaction is consistent with the interests of our stockholders and is consistent with our investment objective and strategies. We have applied for a new exemptive relief order which, if granted, would supersede the Order with respect to negotiated co-investment transactions alongside certain Regulated Funds and Affiliated Funds (each as defined in the application).
There can be no assurance that we will obtain such new exemptive relief from the SEC.
In situations where co-investment with affiliates’ other clients is not permitted under the 1940 Act and related rules, existing or future staff guidance, or the terms and conditions of the Order, our Adviser will need to decide which client or clients will proceed with the investment. Generally, we will not have an entitlement to make a co-investment in these circumstances and, to the extent that another client elects to proceed with the investment, we will not be permitted to participate. Moreover, except in certain circumstances, we will not invest in any issuer in which an affiliate’s other client holds a controlling interest.
The recommendations given to us by our Adviser may differ from those rendered to their other clients.
Our Adviser and its affiliates may give advice and recommend securities to other clients which may differ from advice given to, or securities recommended or bought for, us even though such other clients’ investment objectives may be similar to ours.
We operate in a highly competitive market for investment opportunities, which could reduce returns and result in losses.
The business of identifying and structuring investments of the types contemplated by us is competitive and involves a high degree of uncertainty. We are competing for investments with other investment funds, including the MS BDCs, as well as more traditional lending institutions and private credit-focused competitors. Over the past several years, an increasing number of funds have been formed, with investment objectives similar to, or overlapping with, our investment objectives (and many such existing funds have grown substantially in size).
In addition, other firms and institutions are seeking to capitalize on the perceived opportunities with vehicles, funds and other products that are expected to compete with us for investments. Other investors may make competing offers for investment opportunities that we identify. Even after an agreement in principle has been reached with the board of directors or owners of an acquisition target, consummating the transaction is subject to a myriad of uncertainties, only some of which are foreseeable or within the control of the Adviser. Some of our competitors may have access to greater amounts of capital and to capital that may be committed for longer periods of time or may have different return thresholds than us, and thus these competitors may have advantages over us. In addition, issuers may prefer to take advantage of favorable high-yield markets and issue subordinated debt in those markets, which could result in fewer credit investment opportunities for us. In addition to competition from other investors, the availability of investment opportunities generally will be subject to market conditions as well as, in many cases, the prevailing regulatory or political climate. We can offer no assurance that we will be successful in obtaining suitable investments, or that if we make such investments, our objectives will be achieved.
We will be subject to corporate-level income tax if we are unable to qualify as a RIC.
In order to qualify as a RIC under the Code, we must meet certain source-of-income, asset diversification and distribution requirements. The distribution requirement for a RIC is satisfied if we distribute to our stockholders dividends for U.S. federal income tax purposes of an amount generally at least equal to 90% of our ICTI, which is generally our net ordinary income plus the excess of our net short-term capital gains in excess of our net long-term capital losses, determined without regard to any deduction for dividends paid, to our stockholders on an annual basis. We are subject, to the extent we use debt financing, to certain asset coverage ratio requirements under the 1940 Act and financial covenants under loan and credit agreements that could, under certain circumstances, restrict us from making distributions necessary to qualify as a RIC. If we are unable to obtain cash from other sources, we may fail to be subject to tax as a RIC, in which case we will be subject to corporate-level income tax. To qualify as a RIC, we must also meet certain asset diversification requirements at the end of each quarter of our taxable year. Failure to meet these requirements may result in our having to dispose of certain investments quickly in order to continue to qualify as a RIC. Because most of our investments are in private or thinly traded public companies, any such dispositions could be made at disadvantageous prices and may result in substantial losses. If we fail to qualify as a RIC for any reason and become subject to corporate-level income tax, the resulting corporate taxes could substantially reduce our net assets, the amount of income available for distributions to stockholders, the amount of our distributions and the amount of funds available for new investments. Such a failure would have a material adverse effect on us and our stockholders. See “Item 1. Business—Certain Material U.S. Federal Income Tax Considerations—Taxation as a RIC.”
We may have difficulty paying our required distributions if we recognize income before, or without, receiving cash representing such income.
For U.S. federal income tax purposes, we include in income certain amounts that we have not yet received in cash, such as the accretion of OID. This may arise if we receive warrants in connection with the making of a loan and in other circumstances, or through contracted PIK interest, which represents contractual interest added to the loan balance and due at the end of the loan term. Such OID, which could be significant relative to our overall investment activities, or increases in loan balances as a result of contracted PIK arrangements, is included in our income before we receive any corresponding cash payments. We also may be required to include in income certain other amounts that we do not receive in cash.
That part of the incentive fee payable by us that relates to our net investment income is computed and paid on income that may include interest that has been accrued but not yet received in cash, such as market discount, debt instruments with PIK interest, preferred stock with PIK dividends and zero coupon securities. If a portfolio company defaults on a loan that is structured to provide accrued interest, it is possible that accrued interest previously used in the calculation of the incentive fee will become uncollectible, and the Adviser will have no obligation to refund any fees it received in respect of such accrued income.
Since in certain cases we may recognize income before or without receiving cash representing such income, we may have difficulty meeting the requirement in a given taxable year to distribute to our stockholders dividends for U.S. federal income tax purposes an amount at least equal to 90% of our ICTI, determined without regard to any deduction for dividends paid, to our stockholders to qualify and maintain our ability to be subject to tax as a RIC. In such a case, we may have to sell some of our investments at times we would not consider advantageous, raise additional debt or equity capital or reduce new investment originations to meet these distribution requirements. If we are not able to obtain such cash from other sources, we may fail to qualify as a RIC and thus be subject to corporate-level income tax.
We will need to raise additional capital to grow because we must distribute most of our income.
We will need additional capital to fund new investments and grow our portfolio of investments. We intend to access the capital markets periodically to issue debt or equity securities or borrow from financial institutions in order to obtain such additional capital. Unfavorable economic conditions could increase our funding costs, limit our access to the capital markets or result in a decision by lenders not to extend credit to us. A reduction in the availability of new capital could limit our ability to grow. In addition, we are required to distribute each taxable year an amount at least equal to 90% of our ICTI, determined without regard to any deduction for dividends paid as dividends for U.S. federal income tax purposes, to our stockholders to maintain our ability to be subject to tax as a RIC. As a result, these earnings are not available to fund new investments. An inability to access the capital markets successfully could limit our ability to grow our business and execute our business strategy fully and could decrease our earnings, if any. This would have an adverse effect on the value of our securities. If we are not able to raise capital and are at or near our targeted leverage ratios, we may receive smaller allocations, if any, on new investment opportunities under the Adviser’s allocation policies and procedures.
Regulations governing our operation as a BDC affect our ability to, and the way in which we, raise additional capital. As a BDC, the necessity of raising additional capital exposes us to risks, including the typical risks associated with leverage.
We may issue debt securities or preferred stock and/or borrow money from banks or other financial institutions, which we refer to collectively as “senior securities,” up to the maximum amount permitted by the 1940 Act. Under the provisions of the 1940 Act, we are currently permitted to issue "senior securities," including borrowing money from banks or other financial institutions, only in amounts such that our asset coverage, as defined in the 1940 Act, equals at least 150% of gross assets less all liabilities and indebtedness not represented by senior securities, after each issuance of senior securities. If we fail to comply with certain disclosure requirements, our asset coverage ratio under the 1940 Act would be 200%, which would decrease the amount of leverage we are able to incur. If the value of our assets declines, we may be unable to satisfy the applicable asset coverage ratio. If that happens, we may be required to sell a portion of our investments and, depending on the nature of our leverage, repay a portion of our indebtedness at a time when such sales may be disadvantageous. Also, any amounts that we use to service our indebtedness would not be available for distributions to holders of shares of our Common Stock. If we issue senior securities, we will be exposed to typical risks associated with leverage, including an increased risk of loss.
In the absence of an event of default, no person or entity from which we borrow money has a veto right or voting power over our ability to set policy, make investment decisions or adopt investment strategies. If we issue preferred stock, which is another form of leverage, the preferred stock would rank “senior” to Common Stock in our capital structure, preferred stockholders would have separate voting rights on certain matters and might have other rights, preferences or privileges more favorable than those of our common stockholders, and the issuance of preferred stock could have the effect of delaying, deferring or preventing a transaction or a change of control that might involve a premium price for holders of our Common Stock or otherwise be in the best interest of our common stockholders. Holders of our Common Stock will directly or indirectly bear all of the costs associated with offering and servicing any preferred stock that we issue. In addition, any interests of preferred stockholders may not necessarily align with the interests of holders of our Common Stock and the rights of holders of shares of preferred stock to receive distributions would be senior to those of holders of shares of Common Stock. We do not, however, anticipate issuing preferred stock in the next 12 months.
We are not generally able to issue and sell our Common Stock at a price below net asset value per share. We may, however, sell our Common Stock, or warrants, options or rights to acquire our Common Stock, at a price below the then-current net asset value per share of our Common Stock if our Board of Directors determines that such sale is in the best interests of us and our stockholders, and if our stockholders approve such sale. In any such case, the price at which our securities are to be issued and sold may not be less than a price that, in the determination of our Board of Directors, closely approximates the market value of such securities (less any distributing commission or discount). If we raise additional funds by issuing Common Stock or senior securities convertible into, or exchangeable for, our Common Stock, then the percentage ownership of our stockholders at that time will decrease, and holders of our Common Stock might experience dilution.
We intend to finance our investments with borrowed money, which will magnify the potential for gain or loss on amounts invested and may increase the risk of investing in us.
The use of leverage magnifies the potential for gain or loss on amounts invested. The use of leverage is generally considered a speculative investment technique and increases the risks associated with investing in our securities. The amount of leverage that we employ will be subject to the restrictions of the 1940 Act and the supervision of our Board of Directors.
At the time of any proposed borrowing, the amount of leverage we employ will also depend on our Adviser’s assessment of market and other factors. We cannot assure you that we will be able to obtain credit at all or on terms acceptable to us. For example, due to the interplay of the 1940 Act restrictions on principal and joint transactions and the U.S. risk retention rules adopted pursuant to Section 941 of Dodd-Frank, as a BDC we are limited in our ability to enter into any securitization transactions. We cannot assure you that the SEC or any other regulatory authority will modify such regulations or provide administrative guidance that would give us greater flexibility to enter into securitizations. We have in the past and may in the future issue senior debt securities to banks, insurance companies and other lenders. Lenders of these senior securities will have fixed dollar claims on our assets that are superior to the claims of our common stockholders, and we would expect such lenders to seek recovery against our assets in the event of a default. We may pledge up to 100% of our assets, may grant a security interest in all of our assets and may pledge the right to make capital calls of stockholders under the terms of any debt instruments we may enter into with lenders. Under the terms of any credit facility or debt instrument we enter into, we are likely to be required to comply with certain financial and operational covenants. Failure to comply with such covenants could result in a default under the applicable credit facility or debt instrument if we are unable to obtain a waiver from the applicable lender or holder, and such lender or holder could accelerate repayment under such indebtedness and negatively affect our business, financial condition, results of operations and cash flows. In addition, under the terms of any credit facility or other debt instrument we enter into, we are likely to be required by its terms to use the net proceeds of any investments that we sell to repay a portion of the amount borrowed under such facility or instrument before applying such net proceeds to any other uses. If the value of our assets decreases, leveraging would cause our net asset value to decline more sharply than it otherwise would have had we not leveraged, thereby magnifying losses or eliminating our equity stake in a leveraged investment. Similarly, any decrease in our net investment income will cause our net income to decline more sharply than it would have had we not borrowed. Such a decline would also negatively affect our ability to make distributions on our Common Stock or any outstanding preferred stock. Our ability to service our debt depends largely on our financial performance and is subject to prevailing economic conditions and competitive pressures. Our common stockholders bear the burden of any increase in our expenses as a result of our use of leverage, including interest expenses and any increase in the base management fee payable to the Adviser.
As a BDC, we generally are required to meet a coverage ratio of total assets to total borrowings and other senior securities, which include our borrowings and any preferred stock that we may issue in the future, which is currently 150%. If this ratio were to decline below 150% (or such other percentage as may be prescribed by law from time to time), we could not incur additional debt and could be required to sell a portion of our investments to repay some debt when it was disadvantageous to do so. This could have a material adverse effect on our operations, and we may not be able to make distributions in amounts sufficient to maintain our status as a RIC, or at all.
The following table illustrates the effect of leverage on returns from an investment in our Common Stock as of December 31, 2023, assuming various annual returns, net of expenses. The calculations in the table below are hypothetical and actual returns may be higher or lower than those appearing in the table below.
|
|
|
|
|
|
|
|
|
|
|
|
|
|
|
|
|
|
|
|
|
|
|
|
|
|
|
|
|
|
|
|
|
|
|
Assumed Return on Our Portfolio (Net of Expenses) |
|
|
(10)% |
|
(5)% |
|
0% |
|
5% |
|
10% |
Corresponding return to common stockholder assuming actual asset coverage as of December 31, 2023 (1) |
|
(24.9)% |
|
(15.3)% |
|
(5.7)% |
|
3.9% |
|
13.5% |
(1) Assumes $3,306,734 million in total assets, $1,502,263 million in debt outstanding and $1,721,151 million in net assets as of December 31, 2023, and an effective weighted average annual interest of 6.51% as of December 31, 2023 (excluding unused fees and financing costs).
Based on our outstanding indebtedness of $1,502,263 million as of December 31, 2023 and the effective weighted average annual interest rate of 6.51% (excluding unused fees and financing costs), our investment portfolio would have been required to experience an annual return of at least 2.96% to cover annual interest payments on the outstanding debt.
We are subject to risks associated with our Credit Facilities.
We have entered into a Senior Secured Revolving Credit Agreement with Truist Bank, or the Truist Credit Facility and DLF Financing SPV LLC, our wholly owned subsidiary, or DLF LLC, has entered into a Revolving Credit and Security Agreement with BNP Paribas, or the BNP Funding Facility and, together with the Truist Credit Facility, the Credit Facilities. We anticipate that we or a direct subsidiary of ours may enter into one or more additional Credit Facilities. As a result of our current Credit Facilities and any future Credit Facility, we are subject to a variety of risks, including those set forth below.
Any inability to renew, extend or replace any of our Credit Facilities could adversely impact our liquidity and ability to find new investments or maintain distributions to our stockholders.
There can be no assurance that we would be able to renew, extend or replace any of our Credit Facilities upon its maturity on terms that are favorable to us, if at all. Our ability to renew, extend or replace any such Credit Facilities would be constrained by then-current economic conditions affecting the credit markets. In the event that we were not able to renew, extend or replace any of our Credit Facilities at the time of its maturity, this could have a material adverse effect on our liquidity and ability to fund new investments, our ability to make distributions to our stockholders and our ability to qualify as a RIC.
In addition to regulatory limitations on our ability to raise capital, each of our Credit Facilities and the documents governing the Notes contains various covenants, which, if not complied with, could accelerate our repayment obligations under such facilities, thereby materially and adversely affecting our liquidity, financial condition, results of operations and ability to pay distributions.
We have entered into the Truist Credit Facility, and DLF LLC has entered into the BNP Funding Facility, and as a result, we are subject to certain risks. The Truist Credit Facility is guaranteed by certain domestic subsidiaries of the Company, and the Truist Credit Facility is secured by a first priority security interest in substantially all of the assets of the Company and each such guarantor, subject to certain exceptions. We have made customary representations and warranties and are required to comply with various covenants, reporting requirements and other customary requirements for similar credit facilities.
On February 11, 2022, we issued $425.0 million in aggregate principal amount of 2027 Notes. Pursuant to a Registration Statement on Form N-14 (File No. 333-264774), on July 20, 2022, we closed an exchange offer in which holders of our 2027 Notes that were restricted because they were issued in a private placement, or the Restricted 2027 Notes, were offered the opportunity to exchange such notes for new, registered notes with substantially identical terms, or the Unrestricted 2027.
On September 13, 2022, we issued $275.0 million in aggregate principal amount of 2025 Notes.
The indenture governing the 2027 Notes, or the Indenture, contains certain covenants, including covenants requiring us to comply with the asset coverage requirements of Section 18(a)(1)(A) as modified by Section 61(a)(1) and (2) of the 1940 Act, whether or not it is subject to those requirements, and to provide financial information to the holders of the 2027 Notes and the trustee if we are no longer subject to the reporting requirements under the Exchange Act. These covenants are subject to important limitations and exceptions that are described in the Indenture.
The Note Purchase Agreement under which the 2025 Notes were issued, or the Note Purchase Agreement, contains certain representations and warranties, and various covenants and reporting requirements customary for agreements of this type, including, without limitation, information reporting, maintenance of our status as a BDC within the meaning of the 1940 Act, and certain restrictions with respect to transactions with affiliates, fundamental changes, changes of line of business and permitted liens. In addition, the Note Purchase Agreement contains the following financial covenants: (a) maintaining a minimum shareholders’ equity, measured as of each fiscal quarter-end and (b) not permitting our asset coverage ratio, as of the date of the incurrence of any debt for borrowed money or the making of any cash dividend to stockholders to be less than the statutory minimum then applicable to us under the 1940 Act.
Our continued compliance with the covenants contained under the Credit Facilities, the Indenture and the Note Purchase Agreement depends on many factors, some of which are beyond our control, and there can be no assurance that we will continue to comply with such covenants. Our failure to satisfy the respective covenants could result in foreclosure by the lenders under the applicable credit facility or governing instrument or acceleration by the applicable lenders or noteholders, which would accelerate our repayment obligations under the relevant agreement and thereby have a material adverse effect on our business, liquidity, financial condition, results of operations and ability to pay distributions to our stockholders. Because the Credit Facilities and the Note Purchase Agreement have, and any future credit facilities will likely have, customary cross-default provisions, if the indebtedness under the Credit Facilities or represented by the 2027 Notes or the 2025 Notes, or under any future credit facility, is accelerated, we may be unable to repay or finance the amounts due.
Our interests in any subsidiary that enters into a Credit Facility would be subordinated, and we may not receive cash on our equity interests from any such subsidiary.
We consolidate the financial statements of our wholly owned subsidiaries in our consolidated financial statements and treat the indebtedness of any such subsidiary as our leverage. Our interests in any wholly owned direct or indirect subsidiary of ours would be subordinated in priority of payment to every other obligation of any such subsidiary and would be subject to certain payment restrictions set forth in the Credit Facility. We would receive cash distributions on our equity interests in any such subsidiary only if such subsidiary had made all required cash interest payments to the lenders and no default exists under the Credit Facility. We cannot assure you that distributions on the assets held by any such subsidiary would be sufficient to make any distributions to us or that such distributions would meet our expectations.
We would receive cash from any such subsidiary only to the extent that we would receive distributions on our equity interests in such subsidiary. Any such subsidiary would be able to make distributions on its equity interests only to the extent permitted by the payment priority provisions of the Credit Facility. We expect that the Credit Facility would generally provide that payments on such interests may not be made on any payment date unless all amounts owing to the lenders and other secured parties are paid in full. In addition, if such subsidiary would not meet the borrowing base test set forth in the Credit Facility documents, a default would occur. In the event of a default under the Credit Facility documents, cash would be diverted from us to pay the lender and other secured parties until they would be paid in full. In the event that we would fail to receive cash from such subsidiary, we could be unable to make distributions to our stockholders in amounts sufficient to maintain our status as a RIC, or at all. We also could be forced to sell investments in portfolio companies at less than their fair value in order to continue making such distributions.
Our equity interests in any such subsidiary would rank behind all of the secured and unsecured creditors, known or unknown, of such subsidiary, including the lenders in the Credit Facility. Consequently, to the extent that the value of such subsidiary’s portfolio of loan investments would have been reduced as a result of conditions in the credit markets, defaulted loans, capital gains and losses on the underlying assets, prepayment or changes in interest rates, the return on our investment in such subsidiary could be reduced.
Accordingly, our investment in such subsidiary may be subject to up to a complete loss.
Our ability to sell investments held by any subsidiary that enters into a Credit Facility would be limited.
Our existing Credit Facilities place significant restrictions on our ability, as servicer, to sell investments, and we expect that any Credit Facility we enter into in the future would include similar restrictions. As a result, there may be times or circumstances during which we would be unable to sell investments or take other actions that might be in our best interests.
We may be subject to risks associated with any CLOs, we enter into to finance our investments.
We may enter into CLOs through a direct or indirect subsidiary of ours (any such subsidiary, an “MS Issuer”). As a result of these CLOs, we would be subject to a variety of risks, including those set forth below. We use the term “CLO” to describe a form of secured borrowing under which an operating company (sometimes referred to as an “originator” or “sponsor”) acquires or originates mortgages, receivables, loans or other assets that earn income, whether on a one-time or recurring basis (collectively, “income producing assets”), and borrows money on a non-recourse basis against a legally separate pool of loans or other income producing assets. In a typical CLO, the originator transfers the loans or income producing assets to a single-purpose, bankruptcy-remote subsidiary (also referred to as a “special purpose entity”), which is established solely for the purpose of holding loans and income producing assets and issuing debt secured by these income producing assets. The special purpose entity completes the borrowing through the issuance of notes secured by the loans or other assets. The special purpose entity may issue the notes in the capital markets to a variety of investors, including banks, non-bank financial institutions and other investors. In the CLOs, we would expect institutional investors to purchase the notes issued by an MS Issuer in a private placement, while we would retain the equity interest in the CLOs and consolidate the assets and liabilities of the CLOs on our balance sheet.
We may enter into reverse repurchase agreements, which are another form of leverage.
We may enter into reverse repurchase agreements as part of our management of our temporary investment portfolio. Under a reverse repurchase agreement, we will effectively pledge our assets as collateral to secure a short-term loan. Generally, the other party to the agreement makes the loan in an amount equal to a percentage of the fair value of the pledged collateral. At the maturity of the reverse repurchase agreement, we will be required to repay the loan and correspondingly receive back our collateral. While used as collateral, the assets continue to pay principal and interest which are for the benefit of us.
Our use of reverse repurchase agreements, if any, involves many of the same risks involved in our use of leverage, as the proceeds from reverse repurchase agreements generally will be invested in additional securities. There is a risk that the market value of the securities acquired in the reverse repurchase agreement may decline below the price of the securities that we have sold but remain obligated to purchase. In addition, there is a risk that the market value of the securities retained by us may decline. If a buyer of securities under a reverse repurchase agreement were to file for bankruptcy or experience insolvency, we may be adversely affected. Also, in entering into reverse repurchase agreements, we would bear the risk of loss to the extent that the proceeds of such agreements at settlement are less than the fair value of the underlying securities being pledged. In addition, due to the interest costs associated with reverse repurchase agreements, our net asset value will decline, and, in some cases, we may be worse off than if we had not used such agreements.
If we do not invest a sufficient portion of our assets in qualifying assets, we could fail to qualify as a BDC or be precluded from investing according to our current business strategy.
As a BDC, we may not acquire any assets other than “qualifying assets” unless, at the time of and after giving effect to such acquisition, at least 70% of our total assets are qualifying assets. See “Item 1. Business—Regulation as a Business Development Company—Qualifying Assets.”
In the future, we believe that most of our investments will constitute qualifying assets. However, we may be precluded from investing in what we believe are attractive investments if such investments are not qualifying assets for purposes of the 1940 Act. If we do not invest a sufficient portion of our assets in qualifying assets, we could violate the 1940 Act provisions applicable to BDCs. As a result of such violation, specific rules under the 1940 Act could prevent us, for example, from making follow-on investments in existing portfolio companies (which could result in the dilution of our position) or could require us to dispose of investments at inappropriate times in order to come into compliance with the 1940 Act. If we need to dispose of such investments quickly, it could be difficult to dispose of such investments on favorable terms. We may not be able to find a buyer for such investments and, even if we do find a buyer, we may have to sell the investments at a substantial loss. Any such outcomes would have a material adverse effect on our business, financial condition, results of operations and cash flows.
Failure to qualify as a BDC would decrease our operating flexibility.
If we do not maintain our status as a BDC, we would be subject to regulation as a registered closed-end investment company under the 1940 Act. As a registered closed-end investment company, we would be subject to substantially more regulatory restrictions under the 1940 Act which would significantly decrease our operating flexibility.
Certain investors are limited in their ability to make significant investments in us.
Investment companies registered under the 1940 Act are restricted from acquiring directly or through a controlled entity more than 3% of our total outstanding voting stock (measured at the time of the acquisition), unless these funds comply with certain requirements under the 1940 Act that would restrict the amount that they are able to invest in our securities. Private funds that are excluded from the definition of “investment company” either pursuant to Section 3(c)(1) or 3(c)(7) of the 1940 Act are also subject to these restrictions. As a result, certain investors may be precluded from acquiring additional shares at a time that they might desire to do so.
The majority of our portfolio investments are recorded at fair value as determined in good faith by our Valuation Designee, under the supervision of our Board of Directors and, as a result, there may be uncertainty as to the value of our portfolio investments.
The majority of our portfolio investments take the form of securities for which no market quotations are readily available. The fair value of securities and other investments that are not publicly traded may not be readily determinable, and we value these securities at fair value as determined in good faith by our Board of Directors, including to reflect significant events affecting the value of our securities. As discussed in more detail under “Part II. Item 7. Management’s Discussion and Analysis of Financial Condition and Results of Operations—Critical Accounting Estimates”, most, if not all, of our investments (other than cash and cash equivalents) are classified as Level 3 under ASC Topic 820, Fair Value Measurements (“ASC 820”). This means that our portfolio valuations are based on unobservable inputs and our own assumptions about how market participants would price the asset or liability in question. Inputs into the determination of fair value of our portfolio investments require significant management judgment or estimation. Even if observable market data are available, such information may be the result of consensus pricing information or broker quotes, which may include a disclaimer that the broker would not be held to such a price in an actual transaction. The non-binding nature of consensus pricing and/or quotes accompanied by disclaimers materially reduces the reliability of such information.
The Board of Directors has delegated to the Adviser as a valuation designee, or the Valuation Designee, the responsibility of determining the fair value of the Company’s investment portfolio, subject to oversight of the Board of Directors, pursuant to Rule 2a-5 under the 1940 Act. As such, the Valuation Designee is charged with determining the fair value of the Company’s investment portfolio, subject to oversight of the Board of Directors. The participation of the Adviser’s investment professionals in our valuation process could result in a conflict of interest as the Adviser’s base management fee is based, in part, on our average adjusted gross assets and our incentive fees will be based, in part, on unrealized losses.
We have retained the services of independent service providers to review the valuation of these securities. The valuation of all or portion of our portfolio investments for which a market quote is not readily available will be reviewed by an independent valuation firm each quarter and month-end. The types of factors that our Valuation Designee, under the supervision of our Board of Directors, may take into account in determining the fair value of our investments generally include, as appropriate, comparison to publicly traded securities, including such factors as yield, maturity and measures of credit quality, the enterprise value of a portfolio company, the nature and realizable value of any collateral, the portfolio company’s ability to make payments and its earnings and discounted cash flow, the markets in which the portfolio company does business and other relevant factors. Because such valuations, and in particular, the valuations of private securities and private companies, are inherently uncertain, they may fluctuate over short periods of time and may be based on estimates, our determinations of fair value may differ materially from the values that would have been used if a ready market for these securities existed. Our net asset value could be adversely affected if our determinations regarding the fair value of our investments were materially higher than the values that we ultimately realize upon the disposal of such securities.
We adjust quarterly (or as otherwise may be required by the 1940 Act in connection with the issuance of shares of our Common Stock) the valuation of our portfolio to reflect our Board of Directors’ approval of the fair value of each investment in our portfolio, as determined by the Valuation Designee. Any changes in fair value are recorded in the aggregate in our consolidated statement of operations as a net change in unrealized appreciation or depreciation.
Our Board of Directors may change our investment objective, operating policies and strategies without prior notice or stockholder approval, and we may temporarily deviate from our regular investment strategy.
Our Board of Directors has the authority, except as otherwise provided in the 1940 Act, to modify or waive our investment objective and certain of our operating policies and strategies without prior notice and without stockholder approval. However, absent stockholder approval, we may not change the nature of our business so as to cease to be, or withdraw our election as, a BDC. We cannot predict the effect any changes to our current investment objective, operating policies and strategies would have on our business, operating results and the value of our Common Stock. Nevertheless, any such changes could adversely affect our business and impair our ability to make distributions.
Provisions of the Delaware General Corporation Law, as amended, or the DGCL, and of our Certificate of Incorporation and bylaws could deter takeover attempts and have an adverse effect on the price of shares of Common Stock.
The DGCL contains provisions that may discourage, delay or make more difficult a change in control of us or the removal of our directors. Our certificate of incorporation and bylaws contain provisions that limit liability and provide for indemnification of our directors and officers. These provisions and others which we may adopt also may have the effect of deterring hostile takeovers or delaying changes in control or management. We are subject to Section 203 of the DGCL, the application of which is subject to any applicable requirements of the 1940 Act. This section generally prohibits us from engaging in mergers and other business combinations with stockholders that beneficially own 15% or more of our voting stock, either individually or together with their affiliates, unless our directors or stockholders approve the business combination in the prescribed manner.
Our Board of Directors has adopted a resolution exempting from Section 203 of the DGCL any business combination between us and any other person, subject to prior approval of such business combination by our Board of Directors, including approval by a majority of our Independent Directors. If our Board of Directors later repeals such resolution exempting business combinations, or if our Board of Directors does not approve a business combination, Section 203 of the DGCL may discourage third parties from trying to acquire control of us and increase the difficulty of consummating such an offer.
We have also adopted measures that may make it difficult for a third party to obtain control of us, including provisions of our certificate of incorporation that classify our Board of Directors in three classes serving staggered three-year terms, and provisions of our certificate of incorporation authorizing our Board of Directors to classify or reclassify shares of our preferred stock in one or more classes or series, to cause the issuance of additional shares of our Common Stock, and to amend our certificate of incorporation, without stockholder approval, to increase or decrease the number of shares of Common Stock that we have authority to issue. These provisions, as well as other provisions we have adopted in our certificate of incorporation and bylaws, may delay, defer or prevent a transaction or a change in control in circumstances that could give our stockholders the opportunity to realize a premium of the net asset value of shares of our Common Stock.
The Adviser can resign on 60 days’ notice, and we may not be able to find a suitable replacement within that time, resulting in a disruption in our operations that could adversely affect our financial condition, business and results of operations.
The Adviser has the right to resign under the Investment Advisory Agreement at any time upon not less than 60 days’ written notice, whether we have found a replacement or not. If the Adviser resigns, we may not be able to find a new investment adviser or hire internal management with similar expertise and ability to provide the same or equivalent services on acceptable terms within 60 days, or at all. If we are unable to do so quickly, our operations are likely to experience a disruption, our business, financial condition, results of operations and cash flows as well as our ability to pay distributions are likely to be adversely affected and the value of our shares may decline. In addition, the coordination of our internal management and investment activities is likely to suffer if we are unable to identify and reach an agreement with a single institution or group of executives having the expertise possessed by the Adviser and its affiliates. Even if we are able to retain comparable management, whether internal or external, the integration of such management and their lack of familiarity with our investment objective may result in additional costs and time delays that may adversely affect our business, financial condition, results of operations and cash flows.
The Administrator can resign on 60 days’ notice, and we may not be able to find a suitable replacement, resulting in a disruption in our operations that could adversely affect our financial condition, business and results of operations.
The Administrator has the right to resign under the Administration Agreement at any time upon not less than 60 days’ written notice, whether we have found a replacement or not. If the Administrator resigns, we may not be able to find a new administrator or hire internal management with similar expertise and ability to provide the same or equivalent services on acceptable terms, or at all. If we are unable to do so quickly, our operations are likely to experience a disruption, our financial condition, business and results of operations as well as our ability to pay distributions are likely to be adversely affected and the value of our shares may decline. In addition, the coordination of our internal management and administrative activities is likely to suffer if we are unable to identify and reach an agreement with a service provider or individuals with the expertise possessed by the Administrator. Even if we are able to retain a comparable service provider or individuals to perform such services, whether internal or external, their integration into our business and lack of familiarity with our investment objective may result in additional costs and time delays that may adversely affect our business, financial condition, results of operations and cash flows.
We are a non-diversified investment company within the meaning of the 1940 Act, and therefore we are not limited with respect to the proportion of our assets that may be invested in securities of a single issuer and our portfolio may be concentrated in a limited number of industries.
We are classified as a non-diversified investment company within the meaning of the 1940 Act, which means that we are not limited by the 1940 Act with respect to the proportion of our assets that we may invest in securities of a single issuer. Additionally, our portfolio may be concentrated in a limited number of industries and a downturn in any particular industry in which we are invested could significantly impact the aggregate returns we realize.
To the extent that we assume large positions in the securities of a small number of issuers or our portfolio is concentrated in a limited number of industries, our net asset value may fluctuate to a greater extent than that of a diversified investment company as a result of changes in the financial condition or the market’s assessment of the issuer or particular industry. We may also be more susceptible to any single economic or regulatory occurrence than a diversified investment company. Beyond our asset diversification requirements as a RIC under the Code, we do not have fixed guidelines for diversification, and our investments could be concentrated in relatively few portfolio companies. Although we are classified as a non-diversified investment company within the meaning of the 1940 Act, we maintain the flexibility to operate as a diversified investment company. To the extent that we operate as a non-diversified investment company, we may be subject to greater risk.
We may be subject to risks associated with our investments in the software industry.
We could invest in portfolio companies in the software industry and a downturn in the industry could significantly impact the aggregate returns we realize on such investments. For example, portfolio companies in the software industry are subject to a number of risks. The revenue, income (or losses) and valuations of software and other technology-related companies can and often do fluctuate suddenly and dramatically. In addition, because of rapid technological change, the average selling prices of software products have historically decreased over their productive lives. As a result, the average selling prices of software offered by our portfolio companies may decrease over time, which could adversely affect their operating results and, correspondingly, the value of any securities that we may hold. Additionally, companies operating in the software industry are subject to vigorous competition, changing technology, changing client and end-consumer needs, evolving industry standards and frequent introductions of new products and services. Our portfolio companies in the software industry could compete with companies that are larger and could be engaged in a greater range of businesses or have greater financial, technical, sales or other resources than our portfolio companies do. Our portfolio companies could lose market share if their competitors introduce or acquire new products that compete with their software and related services or add new features to existing products. Any deterioration in the results of our portfolio companies due to competition or otherwise could, in turn, materially adversely affect our business, financial condition and results of operations.
Laws and regulations regulating insurance activities are complex and could negatively affect the business of our portfolio companies in the insurance services industry, which could reduce their profitability and potentially limit their growth.
We could invest in portfolio companies in the insurance services industry and a downturn in the industry could significantly impact the aggregate returns we realize on such investments. For example, the insurance industry in the United States is heavily regulated, and the insurance regulatory framework addresses, among other things: (i) granting licenses to companies and agents to transact particular business activities and (ii) regulating trade, marketing, compensation, and claims practices. Certain of our portfolio companies may be subject to laws and regulations applicable to insurance brokers and to the authority of the insurance regulators in their respective jurisdictions of operation. The cost of compliance with such regulations or any non-compliance could impose material costs on our portfolio companies and negatively affect their business, marketing practices, and budgets. Any of these factors could affect our portfolio company investments and, in turn, materially adversely affect our business, financial condition and results of operations.
Furthermore, the laws and regulations governing the sale of insurance may change in ways that adversely impact the business of our portfolio companies. These changes could impact the manner in which our portfolio companies are permitted to conduct their businesses and could result in increased expenses and/or decreased revenues as well as negatively affect their marketing practices, budgets, and overall level of business, which could adversely impact our business, financial condition, operating results and cash flows.
The liability of each of the Adviser and the Administrator is limited, and we have agreed to indemnify each against certain liabilities, which may lead them to act in a riskier manner on our behalf than each would when acting for its own account.
Under the Investment Advisory Agreement, the Adviser does not assume any responsibility to us other than to render the services called for under that agreement, and it is not responsible for any action of our Board of Directors in following or declining to follow the Adviser’s advice or recommendations. Under the terms of the Investment Advisory Agreement, the Adviser, its officers, members, personnel and any person controlling or controlled by the Adviser are not liable to us, any subsidiary of ours, our directors, our stockholders or any subsidiary’s stockholders or partners for acts or omissions performed in accordance with and pursuant to the Investment Advisory Agreement, except where primarily attributable to the willful misfeasance, bad faith or gross negligence in the performance of such person’s obligations or duties or by reason of reckless disregard of the Adviser’s duties under the Investment Advisory Agreement. In addition, we have agreed to indemnify the Adviser and each of its officers, directors, members, managers and employees from and against any claims or liabilities, including reasonable legal fees and other expenses reasonably incurred, arising out of or in connection with our business and operations or any action taken or omitted on our behalf pursuant to authority granted by the Investment Advisory Agreement, except where primarily attributable to the willful misfeasance, bad faith or gross negligence or by reason of reckless disregard of such person’s duties under the Investment Advisory Agreement. Under the Administration Agreement, the Administrator and certain specified parties providing administrative services pursuant to that agreement are not liable to us or our stockholders for, and we have agreed to indemnify them for, any claims or losses arising out of the good faith performance of their duties or obligations under the Administration Agreement, except where primarily attributable to the willful misfeasance, bad faith or gross negligence or by reason of reckless disregard of the Administrator’s duties under the Administration Agreement. These protections may lead the Adviser or the Administrator to act in a riskier manner when acting on our behalf than it would when acting for its own account.
Our ability to enter into transactions involving derivatives and financial commitment transactions may be limited.
In November 2020, the SEC adopted a revised version of Rule 18f-4, which is designed to modernize the regulation of the use of derivatives by registered investment companies and BDCs. Among other things, Rule 18f-4 requires BDCs that use derivatives to be subject to a value-at-risk leverage limit and requires the adoption and implementation of a derivatives risk management program that is reasonably designed to identify, assess and manage its derivatives transaction trading risk, subject to certain exceptions. Additionally, subject to certain conditions, funds that do not invest heavily in derivatives may be deemed limited derivatives users and would not be subject to the full requirements of Rule 18f-4. The Company intends to operate under the limited derivatives user exemption of Rule 18f-4 and has adopted written policies and procedures reasonably designed to manage the Company’s derivatives risk pursuant to Rule 18f-4.
In connection with the adoption of Rule 18f-4, the SEC also eliminated the asset segregation and cover framework arising from prior SEC guidance for covering derivatives and certain financial instruments. Compliance with Rule 18f-4 has been required since August 19, 2022. Collectively, these requirements may limit our ability to use derivatives and/or enter into certain other financial contracts.
Risks Relating to Our Investments
Limitations of investment due diligence expose us to investment risk.
Our due diligence may not reveal all of a portfolio company’s liabilities and may not reveal other weaknesses in its business. We can offer no assurance that our due diligence processes will uncover all relevant facts that would be material to an investment decision. Before making an investment in, or a loan to, a company, our Adviser will assess the strength and skills of the company’s management and other factors that it believes are material to the performance of the investment.
In making the assessment and otherwise conducting customary due diligence, our Adviser will rely on the resources available to it and, in some cases, an investigation by third parties. This process is particularly important and highly subjective with respect to newly organized entities because there may be little or no information publicly available about the entities.
We may make investments in, or loans to, companies which are not subject to public company reporting requirements including requirements regarding preparation of financial statements and our portfolio companies may utilize divergent reporting standards that may make it difficult for the Adviser to accurately assess the prior performance of a portfolio company. We will, therefore, depend upon the compliance by investment companies with their contractual reporting obligations. As a result, the evaluation of potential investments and our ability to perform due diligence on, and effectively monitor investments, may be impeded, and we may not realize the returns which we expect on any particular investment. In the event of fraud by any company in which we invest or with respect to which we make a loan, we may suffer a partial or total loss of the amounts invested in that company.
Our debt investments may be risky and we could lose all or part of our investments.
The debt instruments in which we invest are typically not rated by any rating agency, but we believe that if such investments were rated, they would be below investment grade (rated lower than “Baa3” by Moody’s Investors Service, lower than “BBB–” by Fitch Ratings or lower than “BBB–” by Standard & Poor’s Ratings Services), which under the guidelines established by these entities is an indication of having predominantly speculative characteristics with respect to the issuer’s capacity to pay interest and repay principal. Bonds that are rated below investment grade are sometimes referred to as “high yield bonds” or “junk bonds.” Therefore, our investments may result in an above average amount of risk and volatility or loss of principal.
Defaults by our portfolio companies will harm our operating results.
A portfolio company’s failure to satisfy financial or operating covenants imposed by us or other lenders could lead to defaults and, potentially, termination of its debt financing and foreclosure on its secured assets, which could trigger cross-defaults under other agreements and jeopardize a portfolio company’s ability to meet its obligations under the debt or equity securities that we hold. We may incur expenses to the extent necessary to seek recovery upon default or to negotiate new terms, which may include the waiver of certain financial covenants, with a defaulting portfolio company. In addition, lenders in certain cases can be subject to lender liability claims for actions taken by them when they become too involved in the borrower’s business or exercise control over a borrower. It is possible that we could become subject to a lender’s liability claim, including as a result of actions taken if we render managerial assistance to the borrower.
Economic recessions or downturns could impair our portfolio companies and defaults by our portfolio companies will harm our operating results.
Many of our portfolio companies are susceptible to economic slowdowns or recessions and may be unable to repay our loans during these periods. Therefore, our non-performing assets are likely to increase and the value of our portfolio is likely to decrease during these periods. Adverse economic conditions may decrease the value of collateral securing some of our loans and the value of our equity investments. Economic slowdowns or recessions could lead to financial losses in our portfolio and a decrease in revenues, net income and assets. Unfavorable economic conditions also could increase our funding costs, limit our access to the capital markets or result in a decision by lenders not to extend credit to us. These events could prevent us from increasing our investments and harm our operating results. For more information, see “—We are operating in a period of capital markets volatility and economic uncertainty. The conditions have materially and adversely affected debt and equity capital markets in the United States, and any future volatility or instability in capital markets may have negative impact on our business and operations.”
Inflation and supply chain risk could adversely impact our portfolio companies and our results of our operations.
Economic activity has accelerated across sectors and regions in recent periods. Nevertheless, due to global supply chain issues, a rise in energy prices, strong consumer demand and other factors, inflation has accelerated in the United States. and globally. Higher inflation is likely to continue in the near to medium-term, particularly in the United States, with the possibility that monetary policy could continue to tighten in response. Persistent inflationary pressures could affect our portfolio companies’ profit margins.
We may hold the debt securities of distressed companies that may enter into bankruptcy proceedings.
Companies that are financially distressed due to leverage or other factors may experience bankruptcy or similar financial distress. The bankruptcy process has a number of significant inherent risks. Many events in a bankruptcy proceeding are the product of contested matters and adversary proceedings and are beyond the control of the creditors. A bankruptcy filing by an issuer may adversely and permanently affect the issuer. If the proceeding is converted to a liquidation, the value of the issuer may not equal the liquidation value that was believed to exist at the time of the investment. The duration of a bankruptcy proceeding is also difficult to predict, and a creditor’s return on investment can be adversely affected by delays until the plan of reorganization or liquidation ultimately becomes effective. The administrative costs of a bankruptcy proceeding are frequently high and would be paid out of the debtor’s estate prior to any return to creditors. Because the standards for classification of claims under bankruptcy law are vague, our influence with respect to the class of securities or other obligations we own may be lost by increases in the number and amount of claims in the same class or by different classification and treatment. In the early stages of the bankruptcy process, it is often difficult to estimate the extent of, or even to identify, any contingent claims that might be made. In addition, certain claims that have priority by law (for example, claims for taxes) may be substantial.
Depending on the facts and circumstances of our investments and the extent of our involvement in the management of a portfolio company, upon the bankruptcy of a portfolio company, a bankruptcy court may recharacterize our debt investments as equity interests and subordinate all or a portion of our claim to that of other creditors. This could occur even though we may have structured our investment as senior debt.
Our investments in private middle-market portfolio companies are risky, and you could lose all or part of your investment.
Investments in private middle-market companies involve a number of significant risks. Generally, little public information exists about these companies, and we rely on the ability of the Adviser’s investment professionals to obtain adequate information to evaluate the potential returns from investing in these companies. Further, these companies may not have third-party debt ratings or audited financial statements. We must therefore rely solely on the ability of the Adviser to obtain adequate information through due diligence to evaluate the creditworthiness and potential returns from investing in these companies, which information may not include all information or resources which may be available from other areas of Morgan Stanley. If the Adviser is unable to uncover all material information about these companies, it may not make a fully informed investment decision, and we may lose money on our investments. Middle-market companies generally have less predictable operating results and may require substantial additional capital to support their operations, finance expansion or maintain their competitive position. Middle-market companies may have limited financial resources, may have difficulty accessing the capital markets to meet future capital needs and may be unable to meet their obligations under their debt securities that we hold, which may be accompanied by a deterioration in the value of any collateral and a reduction in the likelihood of our realizing any guarantees we may have obtained in connection with our investment. In addition, such companies typically have shorter operating histories, narrower product lines and smaller market shares than larger businesses, which tend to render them more vulnerable to competitors’ actions and market conditions, as well as general economic downturns. Additionally, middle-market companies are more likely to depend on the management talents and efforts of a small group of persons. Therefore, the death, disability, resignation or termination of one or more of these persons could have a material adverse impact on our portfolio company and, in turn, on us. Middle-market companies also may be parties to litigation and may be engaged in rapidly changing businesses with products subject to a substantial risk of obsolescence. In addition, our executive officers, directors and the Adviser may, in the ordinary course of business, be named as defendants in litigation arising from our investments.
Subordinated liens on collateral securing debt investments that we will make to our portfolio companies may be subject to control by senior creditors with first priority liens. If there is a default, the value of the collateral may not be sufficient to repay in full both the first priority creditors and us.
Certain debt investments that we make in portfolio companies will be secured on a second priority basis by the same collateral securing senior debt of such companies. The first priority liens on the collateral will secure the portfolio company’s obligations under any outstanding senior debt and may secure certain other future debt that may be permitted to be incurred by the portfolio company under the agreements governing the debt. The holders of obligations secured by the first priority liens on the collateral will generally control the liquidation of and be entitled to receive proceeds from any realization of the collateral to repay their obligations in full before us. In addition, the value of the collateral in the event of liquidation will depend on market and economic conditions, the availability of buyers and other factors. We can offer no assurance that the proceeds, if any, from the sale or sales of all of the collateral would be sufficient to satisfy the debt obligations secured by the second priority liens after payment in full of all obligations secured by the first priority liens on the collateral. If such proceeds are not sufficient to repay amounts outstanding under the debt obligations secured by the second priority liens, then we, to the extent not repaid from the proceeds of the sale of the collateral, will only have an unsecured claim against the portfolio company’s remaining assets, if any. Similarly, investments in “last out” pieces of tranched first lien loans will be similar to second lien loans in that such investments will be junior in priority to the “first out” piece of the same tranched loan with respect to payment of principal, interest and other amounts.
We may also make unsecured debt investments in portfolio companies, meaning that such investments will not benefit from any interest in collateral of such companies. Liens on such portfolio companies’ collateral, if any, will secure the portfolio company’s obligations under its outstanding secured debt and may secure certain future debt that is permitted to be incurred by the portfolio company under its secured debt agreements. The holders of obligations secured by such liens will generally control the liquidation of, and be entitled to receive proceeds from, any realization of such collateral to repay their obligations in full before us. In addition, the value of such collateral in the event of liquidation will depend on market and economic conditions, the availability of buyers and other factors.
We can offer no assurance that the proceeds, if any, from sales of such collateral would be sufficient to satisfy our unsecured debt obligations after payment in full of all secured debt obligations. If such proceeds were not sufficient to repay the outstanding secured debt obligations, then our unsecured claims would rank equally with the unpaid portion of such secured creditors’ claims against the portfolio company’s remaining assets, if any.
The rights we may have with respect to the collateral securing the debt investments we make in our portfolio companies with senior debt outstanding, or first-out pieces of tranched first lien debt, may also be limited pursuant to the terms of one or more inter-creditor agreements that we enter into with the holders of senior debt. Under such an inter-creditor agreement, at any time that obligations that have the benefit of the first priority liens are outstanding, any of the following actions that may be taken in respect of the collateral will be at the direction of the holders of the obligations secured by the first priority liens: the ability to cause the commencement of enforcement proceedings against the collateral; the ability to control the conduct of such proceedings; the approval of amendments to collateral documents; releases of liens on the collateral; and waivers of past defaults under collateral documents. We may not have the ability to control or direct such actions, even if our rights are adversely affected.
Covenant-lite loans may expose us to different risks, including with respect to liquidity, ability to restructure loans, credit risks and less protective loan documentation, than is the case with loans that contain financial maintenance covenants.
Certain loans in our portfolio may consist of “covenant-lite” loans. Generally, covenant-lite loans permit borrowers more opportunity to negatively impact lenders because such loans may not require the borrower to maintain debt service or other financial ratios and do not include terms which allow the lender to monitor the performance of the borrower and declare a default if certain criteria are breached. Accordingly, to the extent we invest in covenant-lite loans, we may have less protection from borrower actions and may have a greater risk of loss on such investments as compared to investments in or exposure to loans with financial maintenance covenants. Ownership of covenant-lite loans may expose us to different risks, including with respect to liquidity, ability to restructure loans, credit risks and less protective loan documentation, than is the case with loans that contain financial maintenance covenants. As of December 31, 2023, approximately 24% of our portfolio, measured as percent of gross commitments, is in loans that are considered “covenant-lite.”
The lack of liquidity in our investments may adversely affect our business.
Our investments are illiquid in most cases, and we can offer no assurance that we will be able to realize on such investments in a timely manner. A substantial portion of our investments in leveraged companies are and will be subject to legal and other restrictions on resale or will otherwise be less liquid than more broadly traded public securities. The illiquidity of these investments may make it difficult for us to sell such investments if the need arises. In addition, if we are required to liquidate all or a portion of our portfolio quickly, we may realize significantly less than the value at which we have previously recorded our investments. We may also face other restrictions on our ability to liquidate an investment in a portfolio company to the extent that we, the Adviser or any of its affiliates have material nonpublic information regarding such portfolio company.
In addition, we generally expect to invest in securities, instruments and assets that are not, and are not expected to become, publicly traded. We will generally not be able to sell securities publicly unless the sale is registered under applicable securities laws, or unless an exemption from such registration requirements is available.
Investments may be illiquid and long-term. Illiquidity may result from the absence of an established or liquid market for investments as well as legal and contractual restrictions on their resale by us. It is generally expected that we will hold assets to maturity, and the amount of “discretionary sales” of investments generally will be limited. Our investment in illiquid investments may restrict its ability to dispose of investments in a timely fashion and for a fair price. Furthermore, we likely will be limited in our ability to sell investments because Morgan Stanley may have material, non-public information regarding the issuers of such loans or investments or as a result of measures established by Morgan Stanley in order to comply with applicable law, regulatory restrictions or internal policies or procedures, including without limitation joint transaction restrictions pursuant to the 1940 Act. This limited ability to sell investments could materially adversely affect our investment results. As a result, our exposure to losses, including a potential loss of principal, as a result of which you could potentially lose all or a portion of your investment in us, may be increased due to the illiquidity of our investments generally.
In certain cases, we may also be prohibited by contract from selling our investments for a period of time or otherwise be restricted from disposing of our investments. Furthermore, certain types of investments expected to be made may require a substantial length of time to realize a return or fully liquidate. We may exit some investments through distributions in kind to the common stockholders, after which such you will still bear the risks associated with holding the securities and must make your own disposition decisions.
Given the nature of the investments contemplated by the Company, there is a material risk that we will be unable to realize our investment objectives by sale or other disposition at attractive prices or will otherwise be unable to complete any exit strategy. In particular, this risk could arise from changes in the financial condition or prospects of the portfolio company in which the investment is made, changes in national or international economic conditions, changes in debt and equity capital markets and changes in laws, regulations, fiscal policies or political conditions of countries in which investments are made.
In connection with the disposition of an investment in a portfolio company, we may be required to make representations about the business and financial affairs of the portfolio company or may be responsible for the contents of disclosure documents under applicable securities laws. We may also be required to indemnify the purchasers of such investment or underwriters to the extent that any such representations or disclosure documents turn out to be incorrect, inaccurate or misleading. These arrangements may result in contingent liabilities, for which we may establish reserves or escrows. However, we can offer no assurance that we will adequately reserve for our contingent liabilities and that such liabilities will not have an adverse effect on us. Such contingent liabilities might ultimately have to be funded by proceeds, including the return of capital, from our other investments.
Price declines and illiquidity in the corporate debt markets may adversely affect the fair value of our portfolio investments, reducing our net asset value through increased net unrealized depreciation.
As a BDC, we are required to carry our investments at market value or, if no market value is ascertainable, at fair value as determined in good faith by our Valuation Designee, under the supervision of our Board of Directors. As part of the valuation process, we may take into account the following types of factors, if relevant, in determining the fair value of our investments:
•a comparison of the portfolio company’s securities to publicly traded securities;
•the enterprise value of the portfolio company;
•the nature and realizable value of any collateral;
•the portfolio company’s ability to make payments and its earnings and discounted cash flow;
•the markets in which the portfolio company does business; and
•the changes in the interest rate environment and the credit markets generally that may affect the price at which similar investments may be made in the future and other relevant factors.
When an external event such as a purchase transaction, public offering or subsequent equity sale occurs, we use the pricing indicated by the external event to corroborate our valuation. We record decreases in the market values or fair values of our investments as unrealized depreciation. Declines in prices and liquidity in the corporate debt markets may result in significant net unrealized depreciation in our portfolio. The effect of all of these factors on our portfolio may reduce our net asset value by increasing net unrealized depreciation in our portfolio. Any unrealized losses in our portfolio could be an indication of a portfolio company’s inability to meet its repayment obligations to us with respect to the affected loans. Depending on market conditions, we could incur substantial realized losses and ultimately experience reductions of our income available for distribution in future periods. We may also suffer additional unrealized losses in future periods, which could have a material adverse effect on our business, financial condition, results of operations and cash flows. In addition, decreases in the market value or fair value of our investments will reduce our net asset value.
Our portfolio companies may be unable to repay or refinance outstanding principal on their loans at or prior to maturity, and rising interest rates may make it more difficult for portfolio companies to make periodic payments on their loans.
Our portfolio companies may be unable to repay or refinance outstanding principal on their loans at or prior to maturity. This risk and the risk of default is increased to the extent that the loan documents do not require the portfolio companies to pay down the outstanding principal of such debt prior to maturity. In addition, if general interest rates rise, there is a risk that our portfolio companies will be unable to pay escalating interest amounts, which could result in a default under their loan documents with us. Rising interest rates could also cause portfolio companies to shift cash from other productive uses to the payment of interest, which may have a material adverse effect on their business and operations and could, over time, lead to increased defaults. Investments with a deferred interest feature, such as OID and PIK interest, could represent a higher credit risk than investments that must pay interest in full in cash on a regular basis. Any failure of one or more portfolio companies to repay or refinance its debt at or prior to maturity or the inability of one or more portfolio companies to make ongoing payments following an increase in contractual interest rates could have a material adverse effect on our business, financial condition, results of operations and cash flows.
Our portfolio companies may prepay loans, which may reduce our yields if capital returned cannot be invested in transactions with equal or greater expected yields.
The loans in our investment portfolio may be prepaid at any time, generally with little advance notice. Whether a loan is prepaid will depend both on the continued positive performance of the portfolio company and the existence of favorable financing market conditions that allow such company the ability to replace existing financing with less expensive capital. As market conditions change, we do not know when, and if, prepayment may be possible for each portfolio company. In some cases, the prepayment of a loan may reduce our achievable yield if the capital returned cannot be invested in transactions with equal or greater expected yields, which could have a material adverse effect on our business, financial condition and results of operations.
Our investments in portfolio companies may expose us to environmental risks.
We may invest in portfolio entities that are subject to changing and increasingly stringent environmental and health and safety laws, regulations and permit requirements and environmental costs that could place increasing financial burdens on such portfolio entities.
Required expenditures for environmental compliance may adversely impact investment returns on portfolio entities. The imposition of new environmental and other laws, regulations and initiatives could adversely affect the business operations and financial stability of portfolio entities.
There can be no guarantee that all costs and risks regarding compliance with environmental laws and regulations can be identified. New and more stringent environmental and health and safety laws, regulations and permit requirements or stricter interpretations of current laws or regulations could impose substantial additional costs on portfolio investment or potential investments. Compliance with such current or future environmental requirements does not ensure that the operations of the portfolio investments will not cause injury to the environment or to people under all circumstances or that the portfolio investments will not be required to incur additional unforeseen environmental expenditures. Moreover, failure to comply with any such requirements could have a material adverse effect on an investment, and we can offer no assurance that the portfolio investments will at all times comply with all applicable environmental laws, regulations and permit requirements.
Additionally, our portfolio companies may be subject to certain so-called sustainability risks or ESG events or conditions that, if they occur, could cause an actual or potential material impact on the value of the Company, including, but not limited to, the following:
•Natural resource risks including rising costs from resource scarcity or resource usage taxes and systemic risk from biodiversity loss;
•Pollution and waste risks including liabilities associated with contamination and waste management costs;
•Human capital risks include declining employee productivity, attrition and turnover costs, pandemics and supply chain reputational risks or disruption;
•Community risks factors including loss of license to operate, operational disruptions caused by protests or boycotts and systematic inequality and instability;
•Security and safety risks such as consumer security, data privacy and security; and
•Other climate-related conditions and events that present risks related to the physical impacts of the climate and risks related to a potential transition to a lower carbon economy.
We have not yet identified all of the portfolio company investments we will acquire and we may have difficulty sourcing investment opportunities.
We have not yet identified all of the potential investments for our portfolio that we will acquire with the proceeds of any sales of our securities or repayments of investments currently in our portfolio, and we cannot assure investors that we will be able to locate a sufficient number of suitable investment opportunities to allow us to deploy all available capital successfully. Privately negotiated investments in loans and illiquid securities of private, middle-market companies require substantial due diligence and structuring, and we cannot assure you that we will achieve our anticipated investment pace. As a result, investors will be unable to evaluate any future portfolio company investments prior to purchasing our shares. The Adviser selects all of our investments, and our stockholders will have no input with respect to such investment decisions. These factors increase the uncertainty, and thus the risk, of investing in our securities. Until such appropriate investment opportunities can be found, we may also invest the net proceeds in cash, cash equivalents, U.S. government securities and high-quality debt investments that mature in one year or less from the date of investment. We expect these temporary investments to earn yields substantially lower than the income that we expect to receive in respect of our targeted investment types. As a result, any distributions we make during this period may be substantially smaller than the distributions that we expect to pay when our portfolio is fully invested. To the extent we are unable to deploy all available capital, our investment income and, in turn, our results of operations, will likely be materially adversely affected. There is no assurance that we will be able to consummate investment transactions or that such transactions will be successful.
Our failure to make follow-on investments in our portfolio companies could impair the value of our portfolio.
Following an initial investment in a portfolio company, we may make additional investments in that portfolio company as “follow-on” investments, in seeking to:
•increase or maintain in whole or in part our position as a creditor or equity ownership percentage in a portfolio company;
•exercise warrants, options or convertible securities that were acquired in the original or subsequent financing; or
•preserve or enhance the value of our investment.
We have discretion to make follow-on investments, subject to the availability of capital resources and certain limitations on co-investment with affiliates under the 1940 Act. Failure on our part to make follow-on investments may, in some circumstances, jeopardize the continued viability of a portfolio company and our initial investment, or may result in a missed opportunity for us to increase our participation in a successful portfolio company. Even if we have sufficient capital to make a desired follow-on investment, we may elect not to make a follow-on investment because we may not want to increase our level of risk, because we prefer other opportunities or because of regulatory or other considerations. Our ability to make follow-on investments may also be limited by the Adviser’s allocation policies and procedures.
Because we generally do not hold controlling equity interests in our portfolio companies, we may not be able to exercise control over our portfolio companies or to prevent decisions by management of our portfolio companies that could decrease the value of our investments.
To the extent that we do not hold controlling equity interests in portfolio companies, we will have a limited ability to protect our position in such portfolio companies. We may also co-invest with third parties through partnerships, joint ventures or other entities. Such investments may involve risks in connection with such third-party involvement, including the possibility that a third-party co-investor may have economic or business interests or goals that are inconsistent with ours or may be in a position to take (or block) action in a manner contrary to our investment objective. In those circumstances where such third parties involve a management group, such third parties may receive compensation arrangements relating to such investments, including incentive compensation arrangements.
We can offer no assurance that portfolio company management will be able to operate their companies in accordance with our expectations.
The day-to-day operations of each portfolio company in which we invest are the responsibility of that portfolio company’s management team. Although we are responsible for monitoring the performance of each investment and generally intend to invest in portfolio companies operated by strong management, we can offer no assurance that the existing management team, or any successor, will be able to operate any such portfolio company in accordance with our expectations. We can offer no assurance that a portfolio company will be successful in retaining key members of its management team, the loss of whom could have a material adverse effect on us. Although we generally intend to invest in companies with strong management teams and defensible market positions, we can offer no assurance that the existing management of such companies will continue to operate a company successfully.
Our portfolio companies may incur debt that ranks equally with, or senior to, our investments in such companies and such portfolio companies may not generate sufficient cash flow to service their debt obligations to us.
We may invest a portion of our capital in second lien and subordinated loans issued by our portfolio companies. Our portfolio companies may have, or be permitted to incur, other debt that ranks equally with, or senior to, the debt securities in which we invest. Such subordinated investments are subject to greater risk of default than senior obligations as a result of adverse changes in the financial condition of the obligor or in general economic conditions. If we make a subordinated investment in a portfolio company, the portfolio company may be highly leveraged, and its relatively high debt-to-equity ratio may create increased risks that its operations might not generate sufficient cash flow to service all of its debt obligations. By their terms, such debt instruments may provide that the holders are entitled to receive payment of interest or principal on or before the dates on which we are entitled to receive payments in respect of the securities in which we invest. These debt instruments would usually prohibit the portfolio companies from paying interest on or repaying our investments in the event of and during the continuance of a default under such debt. Also, in the event of insolvency, liquidation, dissolution, reorganization or bankruptcy of a portfolio company, holders of securities ranking senior to our investment in that portfolio company would typically be entitled to receive payment in full before we receive any distribution in respect of our investment. After repaying senior creditors, the portfolio company may not have any remaining assets to use for repaying its obligation to us where we are junior creditor. In the case of debt ranking equally with debt securities in which we invest, we would have to share any distributions on an equal and ratable basis with other creditors holding such debt in the event of an insolvency, liquidation, dissolution, reorganization or bankruptcy of the relevant portfolio company.
Additionally, certain loans that we make to portfolio companies may be secured on a second priority basis by the same collateral securing senior secured debt of such companies. The first priority liens on the collateral will secure the portfolio company’s obligations under any outstanding senior debt and may secure certain other future debt that may be permitted to be incurred by the portfolio company under the agreements governing the loans. The holders of obligations secured by first priority liens on the collateral will generally control the liquidation of, and be entitled to receive proceeds from, any realization of the collateral to repay their obligations in full before us. In addition, the value of the collateral in the event of liquidation will depend on market and economic conditions, the availability of buyers and other factors. Similarly, investments in “last out” pieces of tranched first lien loans will be similar to second lien loans in that such investments will be junior in priority to the “first out” piece of the same tranched first lien loan with respect to payment of principal, interest and other amounts. We can offer no assurance that the proceeds, if any, from sales of all of the collateral would be sufficient to satisfy the loan obligations secured by the second priority liens or the “last out” pieces of the tranched first lien loans after payment in full of all obligations secured by the first priority liens on the collateral. If such proceeds were not sufficient to repay amounts outstanding under the loan obligations secured by the second priority liens or the “last out” pieces of unitranche loans, then we, to the extent not repaid from the proceeds of the sale of the collateral, will only have an unsecured claim against the portfolio company’s remaining assets, if any.
We may make unsecured loans to portfolio companies, meaning that such loans will not benefit from any interest in collateral of such companies. Liens on a portfolio company’s collateral, if any, will secure the portfolio company’s obligations under its outstanding secured debt and may secure certain future debt that is permitted to be incurred by the portfolio company under its secured loan agreements. The holders of obligations secured by such liens will generally control the liquidation of, and be entitled to receive proceeds from, any realization of such collateral to repay their obligations in full before us. In addition, the value of such collateral in the event of liquidation will depend on market and economic conditions, the availability of buyers and other factors. We can offer no assurance that the proceeds, if any, from sales of such collateral would be sufficient to satisfy our unsecured loan obligations after payment in full of all loans secured by collateral.
If such proceeds were not sufficient to repay the outstanding secured loan obligations, then our unsecured claims would rank equally with the unpaid portion of such secured creditors’ claims against the portfolio company’s remaining assets, if any.
The rights we may have with respect to the collateral securing any junior priority loans, including any “last out” pieces of tranched first lien loans, we make to our portfolio companies may also be limited pursuant to the terms of one or more intercreditor agreements that we enter into (or the absence of an intercreditor agreement) with the holders of senior debt. Under a typical intercreditor agreement, at any time that obligations that have the benefit of the first priority liens are outstanding, any of the following actions that may be taken in respect of the collateral will be at the direction of the holders of the obligations secured by the first priority liens:
•the ability to cause the commencement of enforcement proceedings against the collateral;
•the ability to control the conduct of such proceedings;
•the approval of amendments to collateral documents;
•releases of liens on the collateral; and
•waivers of past defaults under collateral documents.
We may not have the ability to control or direct such actions, even if our rights as junior lenders are adversely affected.
We may suffer a loss if a portfolio company defaults on a loan and the underlying collateral is not sufficient.
In the event of a default by a portfolio company on a secured loan, we will only have recourse to the assets collateralizing the loan. If the underlying collateral value is less than the loan amount, we will suffer a loss. In addition, we may make loans that are unsecured, which are subject to the risk that other lenders may be directly secured by the assets of the portfolio company. In the event of a default, those collateralized lenders would have priority over us with respect to the proceeds of a sale of the underlying assets. In cases described above, we may lack control over the underlying asset collateralizing our loan or the underlying assets of the portfolio company prior to a default, and as a result the value of the collateral may be reduced by acts or omissions by owners or managers of the assets.
In the event of bankruptcy of a portfolio company, we may not have full recourse to its assets in order to satisfy our loan, or our loan may be subject to “equitable subordination.” This means that depending on the facts and circumstances, including the extent to which we actually provided significant “managerial assistance,” if any, to that portfolio company, a bankruptcy court might re-characterize our debt holding and subordinate all or a portion of our claim to that of other creditors. In addition, certain of our loans are subordinate to other debt of the portfolio company. If a portfolio company defaults on our loan or on debt senior to our loan, or in the event of a portfolio company bankruptcy, our loan will be satisfied only after the senior debt receives payment. Where debt senior to our loan exists, the presence of inter-creditor arrangements may limit our ability to amend our loan documents, assign our loans, accept prepayments, exercise our remedies (through “standstill” periods) and control decisions made in bankruptcy proceedings relating to the portfolio company. Bankruptcy and portfolio company litigation can significantly increase collection losses and the time needed for us to acquire the underlying collateral in the event of a default, during which time the collateral may decline in value, causing us to suffer losses.
If the value of collateral underlying our loan declines or interest rates increase during the term of our loan, a portfolio company may not be able to obtain the necessary funds to repay our loan at maturity through refinancing. Decreasing collateral value and/or increasing interest rates may hinder a portfolio company’s ability to refinance our loan because the underlying collateral cannot satisfy the debt service coverage requirements necessary to obtain new financing. If a borrower is unable to repay our loan at maturity, we could suffer a loss which may adversely impact our financial performance.
We may be subject to risks under hedging transactions and may become subject to risks if we invest in foreign securities.
We may invest in non-U.S. companies to the limited extent such investments are permitted under the 1940 Act. We expect that these investments would focus on the same types of investments that we make in U.S. middle-market companies. Investing in securities of non-U.S. companies involves many risks including economic, social, political, financial, tax and security conditions, potential inflationary economic environments, regulation by foreign governments, different accounting standards and political uncertainties. These factors could include changes in economic and fiscal policies, the possible imposition of, or changes in, currency exchange laws or other laws or restrictions applicable to the non-U.S. company or investments in their securities and the possibility of fluctuations in the rate of exchange between currencies.
We may engage in hedging transactions to the limited extent such transactions are permitted under the 1940 Act and applicable commodities laws. Engaging in hedging transactions or investing in foreign securities would entail additional risks to our stockholders. We could, for example, use instruments such as interest rate swaps, caps, collars and floors and, if we were to invest in foreign securities, we could use instruments such as forward contracts or currency options and borrow under a credit facility in currencies selected to minimize our foreign currency exposure. In each such case, we generally would seek to hedge against fluctuations of the relative values of our portfolio positions from changes in market interest rates or currency exchange rates. Hedging against a decline in the values of our portfolio positions would not eliminate the possibility of fluctuations in the values of such positions or prevent losses if the values of the positions declined.
However, such hedging could establish other positions designed to gain from those same developments, thereby offsetting the decline in the value of such portfolio positions. Such hedging transactions could also limit the opportunity for gain if the values of the underlying portfolio positions increased. Moreover, it might not be possible to hedge against an exchange rate or interest rate fluctuation that was so generally anticipated that we would not be able to enter into a hedging transaction at an acceptable price. Use of a hedging transaction could involve counterparty credit risk.
The success of any hedging transactions we may enter into will depend on our ability to correctly predict movements in currencies and interest rates. Therefore, while we may enter into hedging transactions to seek to reduce currency exchange rate and interest rate risks, unanticipated changes in currency exchange rates or interest rates could result in poorer overall investment performance than if we had not engaged in any such hedging transactions. In addition, the degree of correlation between price movements of the instruments used in a hedging strategy and price movements in the portfolio positions being hedged could vary. Moreover, for a variety of reasons, we might not seek to (or be able to) establish a perfect correlation between the hedging instruments and the portfolio holdings being hedged. Any such imperfect correlation could prevent us from achieving the intended hedge and expose us to risk of loss. In addition, it might not be possible to hedge fully or perfectly against currency fluctuations affecting the value of securities denominated in non-U.S. currencies because the value of those securities is likely to fluctuate as a result of factors not related to currency fluctuations. Our ability to engage in hedging transactions may also be adversely affected by rules adopted by the CFTC.
We may not realize gains from our equity investments.
When we invest in unitranche, second lien and subordinated loans, we may acquire warrants or other equity securities of portfolio companies as well. We may also invest in equity securities directly. To the extent we hold equity investments, we will seek to dispose of them and realize gains upon our disposition of them. However, the equity interests we receive may not appreciate in value and may decline in value. As a result, we may not be able to realize gains from our equity interests, and any gains that we do realize on the disposition of any equity interests may not be sufficient to offset any other losses we experience.
We may be subject to risks to the extent we provide managerial assistance to our portfolio companies.
To the extent we participate substantially in the conduct of the management of certain of our portfolio companies, such as designating directors to serve on the boards of directors of certain portfolio companies, such designation of representatives and other measures contemplated could expose our assets to claims by a portfolio company in which we invest, its security-holders and its creditors, including claims that we are a controlling person and thus are liable for securities laws violations of a portfolio company. These measures also could result in certain liabilities in the event of the bankruptcy or reorganization of a portfolio company, could result in claims against us if a designated director violates their fiduciary or other duties to a portfolio company or fail to exercise appropriate levels of care under applicable corporate or securities laws, environmental laws or other legal principles, and could expose us to claims that we have interfered in management to the detriment of a portfolio company.
Risks Relating to an Investment in our Common Stock
We cannot assure you that the market price of our Common Stock will not decline below the IPO price or below our net asset value. The market price of our Common Stock may be volatile and may fluctuate significantly.
We currently list our Common Stock on the NYSE under the symbol “MSDL.” We cannot assure you that the trading market can be sustained. In addition, we cannot predict the prices at which our Common Stock will trade. The IPO offering price for our Common Stock was determined through our negotiations with the IPO underwriters and may not bear any relationship to the market price at which it may trade in the future. Shares of companies offered in an initial public offering often trade at a discount to the initial offering price due to underwriting discounts and commissions and related offering expenses. Also, shares of closed-end investment companies, including BDCs, frequently trade at a discount from their net asset value and our shares may also be discounted in the market. This characteristic of closed-end investment companies is separate and distinct from the risk that our net asset value per share may decline. We cannot predict whether our Common Stock will trade at, above or below net asset value. The risk of loss associated with this characteristic of closed-end management investment companies may be greater for investors expecting to sell Common Stock purchased in the offering soon after the offering. In addition, if our Common Stock trades below its net asset value, we will generally not be able to sell additional Common Stock to the public at its market price without first obtaining the approval of a majority of our stockholders (including a majority of our unaffiliated stockholder) and our independent directors for such issuance.
The market price and liquidity of the market for our Common Stock that will prevail in the market after this offering may be higher or lower than the price you pay and may be significantly affected by numerous factors, some of which are beyond our control and may not be directly related to our operating performance. These factors include:
•Significant volatility in the market price and trading volume of securities of BDCs or other companies in our sector, which are not necessarily related to the operating performance of these companies;
•Price and volume fluctuations in the overall stock market from time to time;
•The inclusion or exclusion of our Common Stock from certain indices;
•Changes in the value of our portfolio of investments and derivative instruments as a result of changes in market factors, such as interest rate shifts, and also portfolio specific performance, such as portfolio company defaults, among other reasons;
•Changes in regulatory policies or tax guidelines, particularly with respect to RICs or BDCs;
•Loss of RIC tax treatment or BDC status;
•Distributions that exceed our net investment income and net income as reported according to the generally accepted accounting principles in the United States of America;
•Changes in earnings or variations in operating results;
•Changes in accounting guidelines governing valuation of our investments;
•Any shortfall in revenue or net income or any increase in losses from levels expected by investors;
•Departure of our Adviser or certain of its key personnel;
•Inability of the Adviser to employ additional experienced investment professionals;
•General economic trends and other external factors;
•Escalation of tensions and conflicts in Europe and elsewhere, including in Ukraine and Russia, Israel and Gaza, and disruptions in local, regional, national and global markets and economies affected thereby, including the potential for volatility in energy prices and its impact on the industries in which we invest;
•Elevating levels of inflation, and its impact on our portfolio companies and on the industries in which we invest;
•The impact of supply chain constraints on our portfolio companies and the global economy;
•Loss of a major funding source;
•The impact of information technology system failures, data security breaches, data privacy compliance, network disruptions, and cybersecurity attacks; and
•The economic and other impacts of disease outbreaks, pandemics, or any other serious public health concern, such as the Coronavirus pandemic, in the United States as well as worldwide.
There is a risk that you may not receive distributions or that our distributions may not grow over time and a portion of our distributions may be a return of capital.
We intend to make periodic distributions to our stockholders out of assets legally available for distribution. We may fund our cash distributions to stockholders from any sources of funds available to us, including offering proceeds, borrowings, net investment income from operations, capital gains proceeds from the sale of assets, non-capital gains proceeds from the sale of assets, dividends or other distributions paid to us on account of preferred and common equity investments in portfolio companies and fee and expense reimbursement waivers from the Adviser or the Administrator, if any. We cannot assure you that we will achieve investment results that will allow us to make a specified level of cash distributions or year-to-year increases in cash distributions. Our ability to pay distributions might be adversely affected by the impact of one or more of the risk factors described in this report.
Due to the asset coverage test applicable to us under the 1940 Act as a BDC, we may be limited in our ability to make distributions. To the extent we make distributions to stockholders that include a return of capital, such portion of the distribution essentially constitutes a return of the stockholder’s investment. Although such return of capital may not be taxable, such distributions may increase an investor’s tax liability for capital gains upon the future sale of our Common Stock. A return of capital distribution may cause a stockholder to recognize a capital gain from the sale of our Common Stock even if the stockholder sells its shares for less than the original purchase price.
Purchases of our Common Stock by us under the Company 10b5-1 Plan may result in the price of our Common Stock being higher than the price might otherwise exist in the open market.
On September 11, 2023, our Board of Directors approved the Company 10b5-1 Plan which we entered into on January 25, 2024. Under the Company 10b5-1 Plan, Wells Fargo Securities, LLC, as agent for the Company, will acquire up to $100 million in the aggregate of our Common Stock during the period beginning 60 calendar days following the end of the “restricted period” under Regulation M and will terminate upon the earliest to occur of (i) 12-months from the commencement date of the Company 10b5-1 Plan, (ii) the end of the trading day on which the aggregate purchase price for all shares purchased under the Company 10b5-1 Plan equals $100 million and (iii) the occurrence of certain other events described in the Company 10b5-1 Plan.
The “restricted period” under Regulation M ended upon the closing of the IPO and, therefore, the Common Stock repurchases/purchases described above will begin 60 days after the closing of the IPO, or March 26, 2024.
Whether purchases will be made under the Company 10b5-1 Plan and how much will be purchased at any time is uncertain, dependent on prevailing market prices and trading volumes, all of which we cannot predict. These activities may have the effect of maintaining the market price of our Common Stock or retarding a decline in the market price of the Common Stock, and, as a result, the price of our Common Stock may be higher than the price that otherwise might exist in the open market.
Purchases of our Common Stock by us under the Company 10b5-1 Plan may result in dilution to our net asset value per share.
The Company 10b5-1 Plan is intended to require Wells Fargo Securities, LLC, as our agent, to repurchase our Common Stock on our behalf when the market price per share is below the most recently reported net asset value per share (including any updates, corrections or adjustments publicly announced by us to any previously announced net asset value per share, including any distributions declared).
Under the Company 10b5-1 Plan, the agent will increase the volume of purchases made as the price of our Common Stock declines, subject to volume restrictions.
Because purchases under the Company 10b5-1 Plan will be made beginning at any price below our most recently reported net asset value per share, if our net asset value per share as of the end of a quarter is lower than the net asset per share as of the end of the prior quarter, purchases under the Company 10b5-1 Plan during the period from the end of a quarter to the time of our earnings release announcing the new net asset value per share for that quarter may result in dilution to our net asset value per share. This dilution would occur because we would repurchase Common Stock under the Company 10b5-1 Plan at a price above the net asset value per share as of the end of the most recent quarter end, which would cause a proportionately smaller increase in our stockholders’ interest in our earnings and assets and their voting interest in us than the decrease in our assets resulting from such repurchase. As a result of any such dilution, our market price per share may decline. The actual dilutive effect will depend on the number of Common Stock that could be so repurchased, the price and the timing of any repurchases under the Company 10b5-1 Plan.
Investing in our Common Stock may involve an above average degree of risk.
The investments we make in accordance with our investment objective may result in a higher amount of risk than alternative investment options and a higher risk of volatility or loss of principal. Our investments in portfolio companies involve higher levels of risk, and therefore, an investment in our shares may not be suitable for someone with lower risk tolerance. In addition, our Common Stock is intended for long-term investors who can accept the risks of investing primarily in illiquid loans and other debt or debt-like instruments and should not be treated as a trading vehicle.
We have not established any limit on the amount of funds we may use from available sources, such as borrowings, if any, or proceeds from any offering of securities, to fund dividends (which may reduce the amount of capital we ultimately invest in assets).
Stockholders should understand that any distributions made from sources other than cash flow from operations or relying on fee or expense reimbursement waivers, if any, from the Adviser of the Administrator are not based on our investment performance and can only be sustained if we achieve positive investment performance in future periods and/or the Adviser or the Administrator continues to make such expense reimbursements, if any. The extent to which we pay distributions from sources other than cash flow from operations will depend on various factors, including the level of participation in our distribution reinvestment plan, how quickly we invest the proceeds from any securities offerings and the performance of our investments. There can be no assurance that we will achieve such performance in order to sustain these distributions or be able to pay distributions at all. The Adviser and the Administrator have no obligation to waive fees or receipt of expense reimbursements, if any.
Sales of substantial amounts of our Common Stock in the public market, including shares of our Common Stock held by MS Credit Partners Holdings, may have an adverse effect on the market price of our Common Stock.
The shares of Common Stock sold in the IPO will be freely tradable without restriction or limitation under the Securities Act.
Each of MS Credit Partners Holdings and our directors, officers and members of the Investment Committee agreed that they will not transfer their shares in accordance with the transfer restrictions provided for in a lock-up agreement with the underwriters in our IPO for a period of 365 days after the date of the prospectus relating to the IPO, which was January 23, 2024.
Certain other stockholders holding in the aggregate approximately 88.0% of the outstanding shares of Common Stock agreed that they will not transfer their shares that they own prior to the IPO in accordance with the transfer restrictions provided for in a lock-up agreement with the underwriters in our IPO for 365 days after January 23, 2024 (or January 22, 2025), provided, however that (i) 33% of the shares of our Common Stock held by such stockholder prior to this offering will be automatically released from the transfer restrictions at any time beginning 180 days after January 23, 2024 (or July 21, 2024), (ii) an additional 33% of the shares of our Common Stock held by such stockholder prior to this offering will be automatically released from the transfer restrictions at any time beginning 270 days after January 23, 2024 (or October 19, 2024), and (iii) the remaining 33% of the shares of our Common Stock held by such stockholder prior to this offering will be released from such transfer restrictions 365 days after January 23, 2024 (or January 22, 2025).
Following this offering and the expiration of applicable lock-up periods with the underwriters for MS Credit Partners Holdings, directors, officers and stockholders of our outstanding shares of Common Stock, and subject to applicable securities laws, including Rule 144, sales of substantial amounts of our Common Stock, or the perception that such sales could occur, could adversely affect the prevailing market prices for our Common Stock. If these sales occur, it could impair our ability to raise additional capital through the sale of equity securities should we desire to do so. We cannot predict what effect, if any, future sales of securities, or the availability of securities for future sales, will have on the market price of our Common Stock prevailing from time to time.
Our stockholders may experience dilution in their ownership percentage.
Our stockholders do not have preemptive rights to purchase any shares of our Common Stock we issue in the future. To the extent that we issue additional equity interests at or below net asset value your percentage ownership interest in us may be diluted. In addition, depending upon the terms and pricing of any future sales of Common Stock and the value of our investments, you may also experience dilution in the book value and fair value of your shares of Common Stock.
Under the 1940 Act, we generally are prohibited from issuing or selling shares of our Common Stock at a price below net asset value per share, which may be a disadvantage as compared with certain public companies. We may, however, sell shares of our Common Stock, or warrants, options, or rights to acquire shares of our Common Stock, at a price below the current net asset value of shares of our Common Stock if our Board of Directors determines that such sale is in our best interests and the best interests of our stockholders, and our stockholders, including a majority of those stockholders that are not affiliated with us, approve such sale. In any such case, the price at which our securities are to be issued and sold may not be less than a price that, in the determination of our Board of Directors, closely approximates the fair value of such securities (less any distributing commission or discount). If we raise additional funds by issuing shares of our Common Stock or senior securities convertible into, or exchangeable for, shares of our Common Stock, then the percentage ownership of our stockholders at that time will decrease and you will experience dilution.
Our stockholders will experience dilution in their ownership percentage if they do not participate in our DRIP.
On January 26, 2024, we adopted an “opt out” DRIP pursuant to which all distributions declared will be automatically reinvested in shares of our Common Stock unless stockholders elect to receive their distributions in cash. As a result, our stockholders that do not participate in our DRIP will experience dilution in their ownership percentage of our Common Stock over time. See “Item 5. Market for Registrant’s Common Equity, Related Stockholder Matters and Issuer Purchases of Equity Securities—Distribution Policy and Dividend Reinvestment Plan” for a description of our dividend policy and obligations.
Our stockholders may receive shares of our Common Stock as dividends, which could result in adverse tax consequences to them.
In order to satisfy the Annual Distribution Requirement applicable to RICs, we will have the ability to declare a large portion of a dividend in shares of our Common Stock instead of in cash. Revenue procedures issued by the IRS, allow a publicly offered regulated investment company (as defined above) to distribute its own stock as a dividend for the purpose of fulfilling its distribution requirements, if certain conditions are satisfied. As long as a portion of such dividend is paid in cash (which portion may be as low as 20% of such dividend) and certain requirements are met, the entire distribution will be treated as a dividend for U.S. federal income tax purposes. As a result, a stockholder generally would be subject to tax on 100% of the fair market value of the dividend on the date the dividend is received by the stockholder in the same manner as a cash dividend, even though most of the dividend was paid in shares of our Common Stock.
We may in the future determine to issue preferred stock, which could adversely affect the value of shares of Common Stock.
The issuance of preferred stock with dividend or conversion rights, liquidation preferences or other economic terms favorable to the holders of preferred stock could make an investment in shares of Common Stock less attractive. In addition, the dividends on any preferred stock we issue must be cumulative. Payment of dividends and repayment of the liquidation preference of preferred stock must take preference over any distributions or other payments to holders of Common Stock, and holders of preferred stock are not subject to any of our expenses or losses and are not entitled to participate in any income or appreciation in excess of their stated preference (other than convertible preferred stock that converts into shares of Common Stock). In addition, under the 1940 Act, preferred stock would constitute a “senior security” for purposes of the 150% asset coverage test.
Our stockholders may be subject to filing requirements under the Exchange Act as a result of an investment in us.
Because our Common Stock is registered under the Exchange Act, ownership information for any person who beneficially owns 5% or more of our Common Stock must be disclosed in a Schedule 13G or other filings with the SEC. Beneficial ownership for these purposes is determined in accordance with the rules of the SEC, and includes having voting or investment power over the securities. Although we will provide in our quarterly financial statements the amount of outstanding stock and the amount of the investor’s stock, the responsibility for determining the filing obligation and preparing the filing remains with the investor. In addition, owners of 10% or more of our Common Stock are subject to reporting obligations under Section 16(a) of the Exchange Act.
Our stockholders may be subject to the short-swing profits rules under the Exchange Act as a result of an investment in us.
Persons with the right to appoint a director or who hold 10% or more of a class of our shares may be subject to Section 16(b) of the Exchange Act, which recaptures for the benefit of the issuer profits from the purchase and sale of registered stock within a six-month period.
Risks Related to the Notes
The Notes are unsecured and therefore are effectively subordinated to any secured indebtedness we may incur. Additionally, the Notes are not guaranteed by Morgan Stanley.
The Notes are not secured by any of our assets or any of the assets of our subsidiaries. As a result, the Notes are effectively subordinated to any secured indebtedness we or our subsidiaries have outstanding or that we or our subsidiaries may incur in the future (or any indebtedness that is initially unsecured in respect of which we subsequently grant security) to the extent of the value of the assets securing such indebtedness. In any liquidation, dissolution, bankruptcy or other similar proceeding, the holders of any of our existing or future secured indebtedness and the secured indebtedness of our subsidiaries may assert rights against the assets pledged to secure that indebtedness in order to receive full payment of their indebtedness before the assets may be used to pay other creditors, including the holders of the Notes.
As of December 31, 2023, our total consolidated indebtedness was approximately $1.5 billion, approximately $0.8 billion of which was secured by our assets. The Notes are not obligations of Morgan Stanley nor are they guaranteed by Morgan Stanley and Morgan Stanley has no obligation to pay any amounts due on the Notes. The Company is not a subsidiary of or consolidated with Morgan Stanley. Furthermore, Morgan Stanley has no obligation, contractual or otherwise, to financially support us. Morgan Stanley has no history of financially supporting any of the MS BDCs on the MS Private Credit platform, even during periods of financial distress.
The Notes are subordinated structurally to the indebtedness and other liabilities of our subsidiaries.
The 2027 Notes are obligations exclusively of the Company and not of any of our subsidiaries. None of our subsidiaries is a guarantor of the 2027 Notes and the 2027 Notes are not required to be guaranteed by any subsidiaries we may acquire or create in the future. Although the 2025 Notes are guaranteed by certain of our subsidiaries, the 2025 Notes are not secured by any of the assets of our subsidiaries and are effectively subordinated to any secured indebtedness our subsidiaries have outstanding or that our subsidiaries may incur in the future.
As of December 31, 2023, approximately $1.5 billion of the indebtedness required to be consolidated on our balance sheet was held through subsidiary financing vehicles and/or secured by assets of the Company and its subsidiaries. Except to the extent we are a creditor with recognized claims against our subsidiaries, all claims of creditors, including trade creditors, and holders of preferred stock, if any, of our subsidiaries will have priority over our claims (and therefore the claims of our creditors, including holders of the 2027 Notes) with respect to the assets of such subsidiaries. Even if we were recognized as a creditor of one or more of our subsidiaries, our claims (and therefore the claims of our creditors, including the holders of the Notes) would still be effectively subordinated to any security interests in the assets of any such subsidiary and to any indebtedness or other liabilities of any such subsidiary senior to our claims. Consequently, the Notes are subordinated structurally to all existing indebtedness and other liabilities of any of our subsidiaries and the 2027 Notes are subordinated structurally to all indebtedness of any subsidiaries that we may in the future acquire or establish as financing vehicles or otherwise. All of the existing indebtedness of our subsidiaries is structurally senior to the Notes. In addition, our subsidiaries may incur substantial additional indebtedness in the future, all of which would be structurally senior to the 2027 Notes.
A downgrade, suspension or withdrawal of the credit rating assigned by a rating agency to us or the Notes, if any, could cause the liquidity or market value of the Notes to decline significantly.
Our credit ratings are an internal assessment by rating agencies of our ability to pay our debts when due. Consequently, real or anticipated changes in our credit ratings will generally affect the market value of the Notes or other debt securities we may issue. Our credit ratings, however, may not reflect the potential impact of risks related to market conditions generally or other factors discussed above on the market value of or trading market of our debt securities, if any. These credit ratings may not reflect the potential impact of risks relating to the structure or marketing of the Notes or an investment in other debt securities we may issue. Credit ratings are not a recommendation to buy, sell or hold any security, and may be revised or withdrawn at any time by the issuing organization in its sole discretion. None of the initial purchasers, us, or Morgan Stanley undertakes any obligation to maintain our credit ratings or to advise holders of the Notes of any changes in our credit ratings.
The 2025 Notes and the 2027 Notes are rated by certain credit rating agencies. There can be no assurance that the respective credit ratings will remain for any given period of time or that such credit ratings will not be lowered or withdrawn entirely by the applicable ratings agency if in its judgment future circumstances relating to the basis of the credit rating, such as adverse changes in our business, financial condition and results of operations, so warrant.
An increase in market interest rates could result in a decrease in the value of the Notes.
The condition of the financial markets and prevailing interest rates have fluctuated in the past and are likely to fluctuate in the future, which could have an adverse effect on the market prices, if any, or values of the Notes. In general, as market interest rates rise, debt securities bearing interest at fixed rates of interest decline in value. Consequently, if an investor purchases Notes bearing interest at fixed rates and market interest rates increase, the market prices, if any, or values of those Notes may decline. We cannot predict the future level of market interest rates.
The Indenture governing the 2027 Notes contains limited protection for holders of the 2027 Notes.
The Indenture governing the 2027 Notes offers limited protection to holders of the 2027 Notes. The terms of the Indenture and the 2027 Notes do not restrict our or any of our subsidiaries’ ability to engage in, or otherwise be a party to, a variety of corporate transactions, circumstances or events that could have an adverse impact on a holder’s investment in the 2027 Notes. In particular, the terms of the Indenture and the 2027 Notes do not place any restrictions on our or our subsidiaries’ ability to:
•issue securities or otherwise incur additional indebtedness or other obligations, including (1) any indebtedness or other obligations that would be equal in right of payment to the 2027 Notes, (2) any indebtedness or other obligations that would be secured and therefore rank effectively senior in right of payment to the 2027 Notes to the extent of the values of the assets securing such debt, (3) indebtedness of ours that is guaranteed by one or more of our subsidiaries and which therefore is structurally senior to the 2027 Notes and (4) securities, indebtedness or obligations issued or incurred by our subsidiaries that would be senior to our equity interests in our subsidiaries and therefore rank structurally senior to the 2027 Notes with respect to the assets of our subsidiaries, in each case other than an incurrence of indebtedness or other obligation that would cause a violation of Section 18(a)(1)(A) of the 1940 Act as modified by Section 61(a)(1) and (2) of the 1940 Act or any successor provisions, as such obligations may be amended or superseded, giving effect to any exemptive relief granted to us by the SEC;
•pay dividends on, or purchase or redeem or make any payments in respect of, capital stock or other securities ranking junior in right of payment to the 2027 Notes;
•sell assets (other than certain limited restrictions on our ability to consolidate, merge or sell all or substantially all of our assets);
•enter into transactions with affiliates;
•create liens (including liens on the shares of our subsidiaries) or enter into sale and leaseback transactions;
•make investments; or
•create restrictions on the payment of dividends or other amounts to us from our subsidiaries.
In addition, the terms of the Indenture and the 2027 Notes do not protect holders of the 2027 Notes in the event that we experience changes (including significant adverse changes) in our financial condition, results of operations or credit ratings, as they do not require that we or our subsidiaries adhere to any financial tests or ratios or specified levels of net worth, revenues, income, cash flow or liquidity other than certain events of default under the Indenture governing the 2027 Notes.
Our ability to recapitalize, incur additional debt and take a number of other actions are not limited by the terms of the 2027 Notes and may have important consequences for holders of the 2027 Notes, including making it more difficult for us to satisfy our obligations with respect to the 2027 Notes or negatively affecting the trading value of the 2027 Notes.
Other debt we issue or incur in the future could contain more protections for its holders than the indenture and the Notes, including additional covenants and events of default. The issuance or incurrence of any such debt with incremental protections could affect the market for and trading levels and prices of the 2027 Notes. The indenture governing the 2027 Notes does not place any restrictions on the operations of Morgan Stanley or its subsidiaries.
The optional redemption provision for the Notes may materially adversely affect the return on the Notes.
The Notes are redeemable in whole or in part upon certain conditions at any time or from time to time at our option. We may choose to redeem the Notes at times when prevailing interest rates are lower than the interest rate paid on the Notes. In this circumstance, a holder of the Notes may not be able to reinvest the redemption proceeds in a comparable security at an effective interest rate as high as the Notes being redeemed.
If an active trading market for the Notes does not develop or is not maintained, a noteholder may not be able to sell its Notes.
The Unrestricted 2027 Notes have been registered for resale under the Securities Act. However, the Restricted 2027 Notes and the 2025 Notes have not been registered under the Securities Act and may only be offered or sold in transactions that are not subject to, or that are otherwise exempt from, the registration requirements of the Securities Act and applicable state securities laws or pursuant to an effective registration statement.
We cannot provide any assurances that an active trading market for any of the Notes will exist in the future or that holders will be able to sell their Notes. We do not currently intend to apply for listing of the Notes on any securities exchange or for quotation of the Notes on any automated dealer quotation system. Even if an active trading market does exist, the Notes may trade at a discount from their initial offering price depending on prevailing interest rates, the market for similar securities, our credit ratings, if any, general economic conditions, our financial condition, performance and prospects and other factors. To the extent an active trading market does not exist, the liquidity and trading price for the Notes may be harmed. Accordingly, a holder of the Notes may be required to bear the financial risk of an investment in the Notes for an indefinite period of time.
There are significant restrictions on the ability to transfer or resell the Restricted 2027 Notes and the 2025 Notes.
The Restricted 2027 Notes and the 2025 Notes have not been registered under the Securities Act. Accordingly, the Restricted 2027 Notes and the 2025 Notes may only be offered or sold in transactions that are not subject to, or that are otherwise exempt from, the registration requirements of the Securities Act and applicable state securities laws or pursuant to an effective registration statement. Therefore, a noteholder may transfer or resell the Restricted 2027 Notes or the 2025 Notes in the United States only in a transaction exempt from the registration requirements of Securities Act and applicable state securities laws or pursuant to an effective registration statement, and a noteholder may be required to bear the risk of its investment until the maturity of the Restricted 2027 Notes or 2025 Notes, as applicable.
We relied on exemptions from the registration and/or prospectus qualification requirements under the laws of other jurisdictions where the Restricted 2027 Notes and 2025 Notes are being offered and sold, and, therefore, the Restricted 2027 Notes and 2025 Notes may be transferred and resold by purchasers that are resident in or otherwise subject to the laws of those jurisdictions, to the extent applicable.
We may not be able to repurchase the Notes upon a Change of Control Repurchase Event.
We may not be able to repurchase the Notes upon a Change of Control Repurchase Event (as defined in the indenture governing the 2027 Notes or the Note Purchase Agreement governing the 2025 Notes, as applicable) because we may not have sufficient funds. Upon a Change of Control Repurchase Event, holders of the Notes may require us to repurchase for cash some or all of the Notes at a repurchase price equal to 100% of the aggregate principal amount of the Notes being repurchased, plus accrued and unpaid interest to, but not including, the repurchase date. Our failure to purchase such tendered Notes upon the occurrence of such Change of Control Repurchase Event would cause an event of default under the indenture governing the 2027 Notes or the Note Purchase Agreement governing the 2025 Notes, as applicable, and a cross-default under the agreements governing certain of our other indebtedness, which may result in the acceleration of such indebtedness requiring us to repay that indebtedness immediately. If a Change of Control Repurchase Event were to occur, we may not have sufficient funds to repay any such accelerated indebtedness and/or to make the required repurchase of the Notes. For the avoidance of doubt, except with respect to the subscription agreement entered into by MS Credit Partners Holdings to purchase our Common Stock described above, Morgan Stanley does not have any obligation to provide us with funding to repurchase the Notes upon a Change of Control Repurchase Event or otherwise.
General Risk Factors
We are operating in a period of capital markets volatility and economic uncertainty. The conditions have materially and adversely affected debt and equity capital markets in the United States, and any future volatility or instability in capital markets may have a negative impact on our business and operations.
From time to time, capital markets may experience periods of volatility and instability for a variety of reasons. We are currently operating in a period of market volatility, as a result of, among other factors, elevated levels of inflation. Uncertainty remains as to the probability of, and length and depth of a global recession and the impact of actions taken by the Federal Reserve, foreign central banks and other U.S. and global governmental entities. Government spending, government policies, including recent increases in certain interest rates by the Federal Reserve and other global central banks, the failure of certain regional banks earlier this year and the potential for disruptions in the availability of credit in the United States and elsewhere, in conjunction with other factors have led and could continue to lead to a continued inflationary economic environment that could affect the Company’s portfolio companies, the Company’s financial condition and the Company’s results of operations. In addition to the factors described above, other factors described herein that may affect market, economic and geopolitical conditions, and thereby adversely affect the Company including, without limitation, economic slowdown in the United States and internationally, changes in interest rates and/or a lack of availability of credit in the United States and internationally, commodity price volatility and changes in law and/or regulation, and uncertainty regarding government and regulatory policy. The full impact of any such risks is uncertain and difficult to predict.
Capital markets volatility and instability have also occurred in the past and may occur in the future. For example, from 2008 to 2009, the global capital markets were unstable as evidenced by the lack of liquidity in the debt capital markets, significant write-offs in the financial services sector, the re-pricing of credit risk in the broadly syndicated credit market and the failure of major financial institutions. Despite actions of the U.S. federal government and various foreign governments, these events contributed to worsening general economic conditions that materially and adversely impacted the broader financial and credit markets and reduced the availability of debt and equity capital for the market as a whole and financial services firms in particular. There have been more recent periods of volatility and there can be no assurance that adverse market conditions will not repeat themselves in the future. Furthermore, uncertainty between the United States and other countries with respect to trade policies, treaties and tariffs, among other factors, have caused volatility in the global markets, and we cannot assure you that these market conditions will not continue or worsen in the future. Terrorist acts, acts of war, natural disasters, or disease outbreaks, pandemics or other public health crises may cause periods of market instability and volatility and may disrupt the operations of us and our portfolio companies for extended periods of time. If similar adverse and volatile market conditions repeat in the future, we and other companies in the financial services sector may have to access, if available, alternative markets for debt and equity capital in order to grow. Equity capital may be particularly difficult to raise during periods of adverse or volatile market conditions because, subject to some limited exceptions, as a BDC, we are generally not able to issue additional shares of Common Stock at a price less than the net asset value per share without first obtaining approval for such issuance from our stockholders and our Board of Directors, including all of our directors who are not “interested persons” of the Company, as defined in the 1940 Act.
Moreover, the re-appearance of market conditions similar to those experienced from 2008 through 2009 for any substantial length of time or worsened market conditions, including as a result of U.S. government shutdowns or the perceived creditworthiness of the United States, could make it difficult for us to borrow money or to extend the maturity of or refinance any indebtedness we may have under similar terms and any failure to do so could have a material adverse effect on our business. The debt capital that will be available to us in the future, if any, may be at a higher cost and on less favorable terms and conditions than would currently be available. If we are unable to raise or refinance debt, stockholders may not benefit from the potential for increased returns on equity resulting from leverage and we may be limited in our ability to make new commitments or to fund existing commitments to our portfolio companies.
Given the periods of extreme volatility and dislocation in the capital markets from time to time, many BDCs have faced, and may in the future face, a challenging environment in which to raise or access capital. In addition, significant changes in the capital markets, including the extreme volatility and disruption over the past several years, has had, and may in the future have, a negative effect on asset valuations and on the potential for liquidity events. While most of our investments will not be publicly traded, applicable accounting standards require us to assume as part of our valuation process that our investments are sold in a principal market to market participants (even if we plan on holding an investment through to maturity). As a result, volatility in the capital markets can adversely affect the valuations of our investments. Further, the illiquidity of our investments may make it difficult for us to sell such investments to access capital if required. As a result, we could realize significantly less than the value at which we have recorded our investments if we were required to sell them for liquidity purposes. In addition, a prolonged period of market illiquidity may cause us to reduce the volume of loans and debt securities we originate and/or fund and adversely affect the value of our portfolio investments, which could have a material and adverse effect on our business, financial condition, results of operations and cash flows. An inability to raise or access capital could have a material adverse impact on our business, financial condition or results of operations.
New or modified laws or regulations governing our or Morgan Stanley’s operations may adversely affect our business.
We and certain of our portfolio companies are subject to regulation by laws at the U.S. federal, state and local levels. These laws and regulations, as well as their interpretation, may change from time to time, including as the result of interpretive guidance or other directives from the relevant government agencies charged with implementing those laws and regulations, and new laws, regulations and interpretations may also come into effect. For example, because a Morgan Stanley affiliate is acting as the Adviser and Morgan Stanley has a 5% or greater voting investment in us, we are subject to the certain federal banking and financial requirements, including the BHCA, regulations of the Federal Reserve, and certain provisions of the Dodd-Frank Act. See “Regulation as a Business Development Company — Bank Holding Company Act and Dodd Frank and Volcker Rule Disclosure.” Because we are controlled by Morgan Stanley for purposes of the BHCA, we must generally comply with the investment and activity restrictions applicable to Morgan Stanley under the BHCA. Such restrictions may place certain limitations on our ability to engage in activities or make investments in companies. For instance, the BHCA permits a BHC as well as any non-bank affiliate of such BHC, to make investment representing less than 5% of any class of voting shares of another company so long as that investment is otherwise non-controlling under the BHCA. The BHCA also permits well-capitalized, well- managed BHCs that have elected to be treated as a FHC to engage in expanded “financial in nature” activities without prior approval of the Federal Reserve. Such financial in nature activities include bona fide merchant banking activities, so long as (i) the FHC holds its merchant banking investments only for a period of time sufficient to enable the sale or disposition thereof on a reasonable basis (generally no more than 10 years) and (ii) the FHC does not routinely manage or operate the companies in which it invests except as necessary or required to obtain a reasonable return on its investment. The BHCA does not, however, require Morgan Stanley to financially support us.
Similarly, the Volcker Rule generally restricts any banking entity (which includes Morgan Stanley and most affiliates of Morgan Stanley, including us as a BDC controlled by Morgan Stanley) from engaging in “proprietary trading” as well as from acquiring or retaining any “ownership interest” in a “covered fund”, in each case unless the investment or activity is conducted in accordance with an exclusion or exemption. The Volcker Rule also generally prohibits certain transactions between a banking entity and any of its affiliates, on the one hand, and a covered fund for which the banking entity or any of its affiliates serves, directly or indirectly, as the investment manager, investment adviser, or that the banking entity or any of its affiliates sponsors in connection with organizing and offering that fund (or with any other covered fund that is controlled by such fund, on the other hand. It is not certain how all aspects of the Volcker Rule will be interpreted and applied, or what the impact of the Volcker Rule will have on us. In addition, the restrictions and limitation on Morgan Stanley and us may change in the future as the Federal Reserve and other agencies consider whether and how to revise and apply the Volcker Rule. We believe that we may perform our activities and services without violation of applicable U.S. banking laws and regulations. However, it is possible that future changes or clarifications in the BHCA and Volcker Rule, as well as judicial or administrative decisions or interpretations of present of future laws or regulations, could restrict (or possibly prevent) our ability to continue to conduct our operations as currently contemplated. In such event, we, the Adviser and/or Morgan Stanley may agree to make certain amendments or changes to the extent necessary to permit the Adviser to continue to provide services to us, while enabling us to continue to achieve our purposes and objectives.
These regulations and any future legislative and regulatory proposals, as well as future interpretations of existing rules, that are directed at the financial services industry, including those that may be proposed or pending in the U.S. Congress, may negatively impact the operations, cash flows or financial condition of us or our portfolio companies, impose additional costs on us or our portfolio companies, intensify the regulatory supervision of us or our portfolio companies or otherwise adversely affect our business or the business of our portfolio companies. Laws that apply to us, either now or in the future, are often highly complex and may include licensing requirements. The licensing process can be lengthy and can be expected to subject us to increased regulatory oversight. Failure, even if unintentional, to comply fully with applicable laws may result in sanctions, fines or limitations on the ability of the Company or the Adviser to do business in the relevant jurisdiction or to procure required licenses in other jurisdictions, all of which could have a material adverse effect on us. In addition, if we do not comply with applicable laws and regulations, we could lose any licenses that we then hold for the conduct of our business and may be subject to civil fines and criminal penalties.
Additionally, changes to the laws and regulations governing our operations, including those associated with RICs and BDCs, may cause us to alter our investment strategy in order to avail ourselves of new or different opportunities, or to comply with additional restrictions on our investments or capital structure, or result in the imposition of corporate-level taxes on us.
Such changes could result in material differences to our strategies and plans and may shift our investment focus from the areas of expertise of the Adviser to other types of investments in which the Adviser may have little or no expertise or experience. Any such changes, if they occur, could have a material adverse effect on our results of operations and the value of your investment. The Adviser currently acts pursuant to an exemption from registration as a commodity trading advisor with the CFTC. These requirements restrict the types of commodity investment strategies that the Adviser can pursue while remaining exempt, and if the Adviser were to seek other investment strategies that required it to register with the CFTC, that registration would increase their, and therefore our, costs. In addition, new legislation and any U.S. Treasury regulations, administrative interpretations or court decisions interpreting such legislation could significantly and negatively affect our ability to qualify for tax treatment as a RIC or the U.S. federal income tax consequences to us and our stockholders of such qualification, or could have other adverse consequences. Stockholders are urged to consult with their tax advisor regarding tax legislative, regulatory, or administrative developments and proposals and their potential effect on an investment in our securities.
In addition, certain regulations applicable to debt securitizations implementing credit risk retention requirements in effect in both the United States and in Europe may adversely affect or prevent us from entering into any future securitization transaction. These risk retention rules may cause an increase in our cost of funds under or may prevent us from completing any future securitization transactions. The U.S. risk retention rules require the sponsor (directly or through a majority-owned affiliate) of a debt securitization subject to such rules, such as collateralized loan obligations, in the absence of an exemption, to retain an economic interest in the credit risk of the assets being securitized. If, and to the extent that, we engage in securitization transactions that require the retention of an economic interest, these rules would increase our financing costs in comparison to other types of financings and this increase in financing costs would ultimately be borne by our stockholders.
Over the last several years, there also has been an increase in regulatory attention to the extension of credit outside of the traditional banking sector, raising the possibility that some portion of the non-bank financial sector will be subject to new regulation. While it cannot be known at this time whether any regulation will be implemented or what form it will take, increased regulation of non-bank credit extension could negatively impact our operations, cash flows or financial condition, impose additional costs on us, intensify the regulatory supervision of us or otherwise adversely affect our business, financial condition and results of operations.
Certain tax law changes have been enacted, including, among others, a minimum tax on book income and profits of certain multinational corporations. Such legislative changes, any other significant changes in economic or tax policy and/or government programs, as well as any future such changes could have a material adverse impact on us and on our investments.
Ongoing implementation of, or changes in, including changes in interpretation or enforcement of, laws and regulations could impose greater costs on us and on financial services companies and impact the value of assets we hold and our business, financial condition and results of operations. In addition, uncertainty regarding legislation and regulations affecting the financial services industry or taxation could also adversely impact our business or the business of our portfolio companies. If we do not comply with applicable laws and regulations, we could lose any licenses that we then hold for the conduct of our business and may be subject to civil fines and criminal penalties.
We are highly dependent on information systems, and systems failures could significantly disrupt our business, which may, in turn, negatively affect the value of shares of our Common Stock and our ability to pay distributions.
The operations of the Company, the Adviser, the Administrator and any third-party service provider to any of the foregoing are susceptible to risks from cybersecurity attacks and incidents due to reliance on the secure processing, storage and transmission of confidential and other information in the relevant computer systems and networks. In particular, cyber security incidents and cyber-attacks have been occurring globally at a more frequent and severe level and will likely continue to increase in frequency in the future. These attacks could involve gaining unauthorized access to information systems for purposes of misappropriating assets, stealing confidential information, corrupting data or causing operational disruption and result in disrupted operations, misstated or unreliable financial data, liability for stolen assets or information, increased cybersecurity protection and insurance costs, litigation and damage to our business relationships, any of which could have a material adverse effect on our business, financial condition and results of operations. We, the Adviser and the Administrator must each continuously monitor and innovate our cybersecurity to protect our technology and data from corruption or unauthorized access. In addition, due to the use of third-party vendors, agents, exchanges, clearing houses and other financial institutions and service providers, we, the Adviser and the Administrator could be adversely impacted if any of us are subject to a successful cyber-attack or other breach of our information.
Furthermore, in recent years cybersecurity risks for financial institutions have significantly increased in part because of the proliferation of new technologies, the use of the internet, mobile telecommunications and cloud technologies to conduct financial transactions, and the increased sophistication and activities of organized crime, hackers, terrorists and other external extremist parties, including foreign state actors in some circumstances as a means to promote political ends. Global events and geopolitical instability may lead to increased nation state targeting of financial institutions in the U.S. and abroad. Any of these parties may also attempt to fraudulently induce employees, customers, clients, vendors, or other third parties or users of the Company, the Adviser, the Administrator and their affiliates’ systems to disclose sensitive information in order to gain access to such parties’ data or that of their employees or clients.
Cybersecurity risks may also derive from human error, fraud or malice on the part of the Adviser or the Administrator and their affiliates’ employees or third parties, or may result from accidental technological failure.
Like other financial services firms, Morgan Stanley continues to be the subject of unauthorized access attacks, mishandling or misuse of information, computer viruses or malware, cyber attacks designed to obtain confidential information, destroy data, disrupt or degrade service, sabotage systems or cause other damage, denial of service attacks, data breaches, social engineering attacks and other events, and there can be no assurance that such unauthorized access, mishandling or misuse of information, or cyber incidents will not occur in the future, and they could occur more frequently and on a more significant scale. Given Morgan Stanley’s global footprint and the high volume of transactions it processes, the large number of clients, partners, vendors and counterparties with which it does business, and the increasing sophistication of cyber attacks, a cyber attack, information or security breaches could occur and persist for an extended period of time without detection.
Although we, the Adviser, the Administrator and Morgan Stanley have developed protocols, processes, internal controls and other protective measures to help mitigate cybersecurity risks and cyber intrusions, these measures, as well as our increased awareness of the nature and extent of the risk of a cyber incident, may be ineffective and do not guarantee that a cyber incident will not occur or that our financial results, operations or confidential information will not be negatively impacted by such an incident. If any of the foregoing events occur, the confidential and other information of the Company, the Adviser, and the Administrator could be compromised. Such events could also cause interruptions or malfunctions in the operations of the Company, the Adviser or the Administrator, and in particular the Adviser’s investment activities on our behalf and the provision of administrative services to us by the Administrator. In addition, the Company, the Adviser, the Administrator or our portfolio companies could be required to make a significant investment to remedy the effects of any cybersecurity incident, harm to their reputations, legal claims that they and their respective affiliates may be subjected to, regulatory action or enforcement arising out of applicable privacy and other laws, adverse publicity, and other events that may affect their business and financial performance. The increased use of mobile and cloud technologies can heighten these and other operational risks.
We, the Adviser and the Administrator currently or in the future are expected to routinely transmit and receive personal, confidential and proprietary information by email and other electronic means. We, the Adviser and the Administrator have discussed and worked with clients, vendors, service providers, counterparties and other third parties to develop secure transmission capabilities and protect against cyber-attacks. However, we, the Adviser and the Administrator may not be able to ensure secure capabilities with all of our clients, vendors, service providers, counterparties and other third parties to protect the confidentiality of the information.
The systems and technology resources used by us, our Adviser, our Administrator and our and their respective affiliates could be strained by extended periods of remote working by our Adviser, our Administrator and their affiliate’s employees and such extended remote working could introduce operational risks, including heightened cybersecurity risk. Remote working environments may be less secure and more susceptible to hacking attacks, including phishing and social engineering attempts.
In addition, cybersecurity continues to be a key priority for regulators around the world, and some jurisdictions have enacted laws requiring companies to notify individuals or the general investing public of data security breaches involving certain types of personal data, including the SEC, which, on July 26, 2023, adopted amendments requiring the prompt public disclosure of certain cybersecurity breaches. If we fail to comply with the relevant laws and regulations, we could suffer financial losses, a disruption of our business, liability to investors, regulatory intervention or reputational damage.
Terrorist attacks, acts of war, natural disasters, outbreaks or pandemics, such as the Coronavirus pandemic, may impact our portfolio companies and our Adviser and harm our business, operating results and financial condition.
Terrorist acts, acts of war, natural disasters, disease outbreaks, pandemics or other similar events may disrupt our operations, as well as the operations of our portfolio companies and our Adviser. Such acts have created, and continue to create, economic and political uncertainties and have contributed to recent global economic instability. For example, many countries have experienced outbreaks of infectious illnesses in recent decades, including polio, swine flu, avian influenza, SARS, coronaviruses and the monkeypox virus.
The Israel-Hamas war and the conflict between Russia and Ukraine, and resulting market volatility, could also adversely affect the Company’s business, operating results, and financial condition. The extent and duration or escalation of such conflicts, resulting sanctions and resulting future market disruptions are impossible to predict, but could be significant. Any disruptions resulting from such conflicts and any future conflict (including cyberattacks, espionage or the use or threatened use of nuclear weapons) or resulting from actual or threatened responses to such actions could cause disruptions to any of our portfolio companies located in Europe or the Middle East or that have substantial business relationships with companies in affected regions. It is not possible to predict the duration or extent of longer-term consequences of these conflicts, which could include further sanctions, retaliatory and escalating measures, embargoes, regional instability, geopolitical shifts and adverse effects on or involving macroeconomic conditions, the energy sector, supply chains, inflation, security conditions, currency exchange rates and financial markets around the globe. Any such market disruptions could affect our portfolio companies’ operations and, as a result, could have a material adverse effect on our business, financial condition and results of operations.
Market volatility has had a material adverse impact on local economies in the affected jurisdictions and also on the global economy, as cross border commercial activity and market sentiment continue to be impacted by such events.
In addition to these and any future developments potentially having adverse consequences for certain portfolio companies and other issuers in or through which we may invest and the value of our investments therein, the operations of the Adviser (including those relating to us) have been, and could continue to be, adversely impacted. Any of the foregoing events could materially and adversely affect our ability to source, manage and divest our investments and our ability to fulfill our investment objectives. Similar consequences could arise with respect to other comparable infectious diseases.
The extent to which the Coronavirus and/or other disease outbreaks or health pandemics may negatively affect our and our portfolio companies’ operating results, or the duration of any potential business or supply- chain disruption, is uncertain. These potential impacts, while uncertain, could adversely affect our operating results and the operating results of the portfolio companies in which we invest. There is a risk that any future disease outbreaks or health pandemics (including a recurrence of the Coronavirus) would impact our ability to achieve our investment objectives. Further, if a future pandemic occurs during a period when our investments are maturing, we may not be able to realize our investments within the Company’s term, or at all. In addition, future terrorist activities, military or security operations, natural disasters, disease outbreaks, pandemics or other similar events could weaken the domestic/global economies and create additional uncertainties, which may negatively impact our portfolio companies and, in turn, could have a material adverse impact on our business, operating results and financial condition.
We may be the target of litigation.
We may be the target of securities litigation in the future, particularly if the value of shares of our Common Stock fluctuates significantly. We could also generally be subject to litigation, including derivative actions by our stockholders. Any litigation could result in substantial costs and divert management’s attention and resources from our business and cause a material adverse effect on our business, financial condition and results of operations.
We may experience fluctuations in our quarterly operating results.
We could experience fluctuations in our quarterly operating results due to a number of factors, including the interest rate payable on the debt securities we acquire, the default rate on such securities, the number and size of investments we originate or acquire, the level of our expenses, variations in and the timing of the recognition of realized and unrealized gains or losses, the degree to which we encounter competition in our markets and general economic conditions. In light of these factors, results for any period should not be relied upon as being indicative of our performance in future periods.
We are an “emerging growth company,” and we do not know if such status will make our shares less attractive to investors.
We are an “emerging growth company,” as defined in the JOBS Act, until the earliest of:
•The last day of the fiscal year ending after the fifth anniversary of the IPO;
•The year in which our total annual gross revenues first exceed $1.235 billion;
•The date on which we have, during the prior three-year period, issued more than $1.0 billion in non-convertible debt; and
•The last day of a fiscal year in which we (1) have an aggregate worldwide market value of our shares of our Common Stock held by non-affiliates of $700 million or more, computed at the end of the last business day of the second fiscal quarter in such fiscal year and (2) have been a reporting company under the Exchange Act for at least one year (and filed at least one annual report under the Exchange Act).
As an “emerging growth company”, we may take advantage of certain reduced regulatory and disclosure requirements permitted by the JOBS Act and, as a result, some investors may consider shares of our Common Stock less attractive. For example, while we are an emerging growth company and/or a non-accelerated filer within the meaning of the Exchange Act, we are exempt from the provisions of Section 404(b) of the Sarbanes-Oxley Act, requiring that our independent registered public accounting firm provide an attestation report on the effectiveness of our internal control over financial reporting. This may increase the risk that material weaknesses or other deficiencies in our internal control over financial reporting go undetected.
Efforts to comply with the Sarbanes-Oxley Act will involve significant expenditures, and non-compliance with the Sarbanes-Oxley Act would adversely affect us and the value of our Common Stock.
We are required to comply with certain requirements of the Sarbanes-Oxley Act and the related rules and regulations promulgated by the SEC but will not have to comply with certain requirements until we cease to be an “emerging growth company.” Because shares of our Common Stock are registered under the Exchange Act, we are subject to the Sarbanes-Oxley Act and the related rules and regulations promulgated by the SEC, and our management is required to report on our internal control over financial reporting pursuant to Section 404 of the Sarbanes-Oxley Act. We are required to review on an annual basis our internal control over financial reporting, and on a quarterly and annual basis to evaluate and disclose changes in our internal control over financial reporting. As a result, we expect to incur significant additional expenses that may negatively impact our financial performance and our ability to make distributions. This process will also result in a diversion of management’s time and attention. We do not know when our evaluation, testing and remediation actions will be completed or its impact on our operations. In addition, we may be unable to ensure that the process is effective or that our internal control over financial reporting is or will be effective. In the event that we are unable to come into and maintain compliance with the Sarbanes- Oxley Act and related rules, we and the value of our securities would be adversely affected.
Additionally, we will not be required to comply with all of the requirements under Section 404 of the Sarbanes- Oxley Act until we have been subject to the reporting requirements of the Exchange Act for a specified period of time or the date we are no longer an emerging growth company under the JOBS Act.
Our independent registered public accounting firm will not be required to attest to the effectiveness of our internal control over financial reporting until the date we are no longer an emerging growth company under the JOBS Act. Because we do not currently have comprehensive documentation of our internal control and have not yet tested our internal control in accordance with Section 404 of the Sarbanes-Oxley Act, we cannot conclude, as required by Section 404, that we do not have a material weakness in our internal control or a combination of significant deficiencies that could result in the conclusion that we have a material weakness in our internal control. If we are not able to implement the applicable requirements of Section 404 of the Sarbanes-Oxley Act in a timely manner or with adequate compliance, our operations, financial reporting or financial results could be adversely affected. Matters impacting our internal controls may cause us to be unable to report our financial information on a timely basis and thereby subject us to adverse regulatory consequences, including sanctions by the SEC, and result in a breach of the covenants under the agreements governing any of our financing arrangements. There could also be a negative reaction in the financial markets due to a loss of investor confidence in us and the reliability of our financial statements. Confidence in the reliability of our financial statements could also suffer if we or our independent registered public accounting firm were to report a material weakness in our internal controls over financial reporting. This could materially adversely affect us.
Our internal control over financial reporting may not prevent or detect misstatements because of its inherent limitations, including the possibility of human error, the circumvention or overriding of controls, or fraud. Even effective internal controls can provide only reasonable assurance with respect to the preparation and fair presentation of financial statements. If we fail to maintain the adequacy of our internal controls, including any failure to implement required new or improved controls, or if we experience difficulties in their implementation, our business and operating results could be harmed and we could fail to meet our financial reporting obligations.
We and our portfolio companies may maintain cash balances at financial institutions that exceed federally insured limits with the
FDIC and may otherwise be materially affected by adverse developments affecting the financial services industry, such as actual events or concerns involving liquidity, defaults or non-performance by financial institutions or transactional counterparties.
Cash held by us and by our portfolio companies in non-interest-bearing and interest-bearing operating accounts may exceed the FDIC insurance limits. If such banking institutions were to fail, we or our portfolio companies could lose all or a portion of those amounts held in excess of such FDIC insurance limitations. In addition, actual events involving limited liquidity, defaults, non-performance or other adverse developments that affect financial institutions, transactional counterparties or other companies in the financial services industry or the financial services industry generally, or concerns or rumors about any events of these kinds or other similar risks, have in the past and may in the future lead to market-wide liquidity problems, which could adversely affect our and our portfolio companies’ business, financial condition, results of operations, or prospects.
Although we assess our and our portfolio companies’ banking relationships as we believe necessary or appropriate, our and our portfolio companies’ access to funding sources and other credit arrangements in amounts adequate to finance or capitalize our respective current and projected future business operations could be significantly impaired by factors that affect us or our portfolio companies, the financial institutions with which we, or our portfolio companies have arrangements directly, or the financial services industry or economy in general. These factors could include, among others, events such as liquidity constraints or failures, the ability to perform obligations under various types of financial, credit or liquidity agreements or arrangements, disruptions or instability in the financial services industry or financial markets, or concerns or negative expectations about the prospects for companies in the financial services industry. These factors could involve financial institutions or financial services industry companies with which we or our portfolio companies have financial or business relationships, but could also include factors involving financial markets or the financial services industry generally. In addition, investor concerns regarding the U.S. or international financial systems could result in less favorable commercial financing terms, including higher interest rates or costs and tighter financial and operating covenants, or systemic limitations on access to credit and liquidity sources, thereby making it more difficult for us or our portfolio companies to acquire financing on acceptable terms or at all.
Item 1B. Unresolved Staff Comments
None.
Item 1C. Cybersecurity
Risk management and strategy
The Company and the broader financial services industry face an increasingly complex and evolving threat environment.
Morgan Stanley has made and continues to make substantial investments in cybersecurity and fraud prevention technology, and employ experienced talent to lead its Cybersecurity and Information Security organizations and program under the oversight of Morgan Stanley’s Board of Directors (the “MS Board”) and the Operations and Technology Committee of the MS Board (“BOTC”).
As part of its enterprise risk management (“ERM”) framework, Morgan Stanley has implemented and maintains a program to assess, identify, and manage risks arising from the cybersecurity threats confronting the Firm (“Cybersecurity Program”). Morgan Stanley’s Cybersecurity Program helps protect the Firm’s clients, customers, employees, property, products, services, and reputation by seeking to preserve the confidentiality, integrity, and availability of information, enable the secure delivery of financial services, and protect the business and the safe operation of our technology systems, including as applicable to the Company and its stockholders. Morgan Stanley continually adjusts its Cybersecurity Program to address the evolving cybersecurity threat landscape and comply with extensive legal and regulatory expectations.
The Adviser and the Administrator manage the Company’s day-to-day operations, and the Company uses the Cybersecurity Program to assess, identify and manage material cybersecurity risks affecting the Company and its operations. The Company’s business is dependent on the communications and information systems of Morgan Stanley, including but not limited to the Cybersecurity Program, and other third-party service providers.
Processes for assessing, identifying, and managing material risks from cybersecurity threats
Morgan Stanley’s Cybersecurity Program takes into account industry best practices and addresses risks from cybersecurity threats to the Firm’s network, infrastructure, computing environment, and the third-parties Morgan Stanley relies on, including third parties relied on by the Company. Morgan Stanley periodically assesses the design of its cybersecurity controls against the Cyber Risk Institute Cyber Profile, which is based on the National Institute of Standards and Technology Cybersecurity (“NIST”) Framework for Improving Critical Infrastructure Cybersecurity, as well as against global cybersecurity regulations, and develops improvements to those controls in response to those assessments. Morgan Stanley’s Cybersecurity Program also includes cybersecurity and information security policies, procedures, and technologies that are designed to address regulatory requirements and protect Morgan Stanley’s clients’, employees’ and own data, and the data of the Company and its officers and stockholders, against unauthorized disclosure, modification, and misuse. These policies, procedures, and technologies cover a broad range of areas, including: identification of internal and external threats, access control, data security, protective controls, detection of malicious or unauthorized activity, incident response, and recovery planning.
Morgan Stanley’s threat intelligence function within the Cybersecurity Program actively engages in private and public information sharing communities and leverages both commercial and proprietary products to collect a wide variety of industry and governmental information regarding the latest cybersecurity threats, which informs Morgan Stanley’s cybersecurity risk assessments and strategy, including as applicable to the Company. This information is also provided to an internal Morgan Stanley forensics team, which develops and implements technologies designed to help detect these cybersecurity threats across Morgan Stanley’s environment, including systems and applications that may be relied upon by the Company. Where a potential threat is identified in Morgan Stanley’s environment or which impacts the Company, Morgan Stanley’s incident response team evaluates the potential impact to the Firm and, as relevant, the Company, and coordinates remediation where required. These groups, as well as Morgan Stanley’s Operational Risk Department, review external cybersecurity incidents that may be relevant to the Firm and the Company, and the outcomes of these incidents further inform the design of the Cybersecurity Program. In addition, Morgan Stanley maintains a robust global training program on cybersecurity risks and requirements and conducts regular training exercises for its employees and consultants, including those personnel relied upon by the Company.
Morgan Stanley’s processes are designed to help oversee, identify, and mitigate cybersecurity risks associated with its use of third-party vendors, including those vendors relied upon by the Company. Morgan Stanley maintains a third-party risk management program that includes evaluation of, and response to, cybersecurity risks at its third-party vendors, including those vendors relied upon by the Company. Prior to engaging third-party vendors to provide services to the Firm or the Company, Morgan Stanley conducts assessments of the third-party vendors’ cybersecurity program to identify the impact of their services on the cybersecurity risks to the Firm or, as relevant, the Company. Once on-boarded, third-party vendors’ cybersecurity programs are subject to risk-based oversight, which may include security questionnaires, submission of independent security audit reports or a Firm audit of the third-party vendor’s security program, and, with limited exceptions, third-party vendors are required to meet Morgan Stanley’s cybersecurity standards. Where a third-party vendor cannot meet those standards, its services, and the residual risk to the Firm, are subject to review, challenge, and escalation through Morgan Stanley’s risk management processes and ERM committees, which may ultimately result in requesting increased security measures or ceasing engagement with such third-party vendor.
Morgan Stanley’s Cybersecurity Program is regularly assessed by the Morgan Stanley Internal Audit Department (“IAD”) through various assurance activities, with the results reported to the Audit Committee of the MS Board (“BAC”) and the BOTC and, as applicable to the Board of Directors of the Company. Annually, certain elements of the Cybersecurity Program are subject to an audit by an independent consultant, as well as an assessment by a separate, independent third-party, the results of which, including opportunities identified for improvement and related remediation plans, are reviewed with the BOTC. The Cybersecurity Program is also examined regularly by the Firm’s prudential and conduct regulators within the scope of their jurisdiction.
Governance
Morgan Stanley and Company Management’s role in assessing and managing material risks from cybersecurity threats
Morgan Stanley’s Cybersecurity Program is operated and maintained by its management, including the Chief Information Officer (“CIO”) of Cyber, Data, Risk and Resilience and the Chief Information Security Officer (“CISO”). These senior officers are responsible for assessing and managing the Firm’s cybersecurity risks, which includes cybersecurity risks faced by the Company.
Morgan Stanley’s Cybersecurity Program strategy, which is set by the CISO and overseen by the Morgan Stanley’s Head of Operational Risk, is informed by various risk and control assessments, control testing, external assessments, threat intelligence, and public and private information sharing. Morgan Stanley’s Cybersecurity Program also includes processes for escalating and considering the materiality of incidents that impact the Firm and the Company, including escalation to senior management of Morgan Stanley, the MS Board, and management of the Company. Those processes are periodically tested through tabletop exercises.
The Chief Compliance Officer ("CCO") of the Company is responsible for overseeing the Company’s risk management function and generally and relies on the CIO, CISO, and Head of Operational Risk to assist with assessing and managing material risks from cybersecurity threats that are applicable to the Company. The CIO has over 30 years of experience in various engineering, information technology (“IT"), operations, and information security roles. The CISO has over 25 years of experience leading cybersecurity teams at financial institutions, including in the areas of IT strategy, risk management, and information security. The Head of Operational Risk has over 20 years of experience in technology, security, and compliance roles, including experience in government security agencies. The Company's CCO has worked in the financial services industry for 19 years and has covered business developments from a compliance perspective for over 10 years, during which time the Company’s CCO has gained expertise in assessing and managing risk applicable to the Company.
Risk levels and mitigating measures are presented to and monitored by dedicated management-level cybersecurity risk committees at Morgan Stanley. These committees include representatives from Firm management as well as business and control stakeholders who review, challenge and, where appropriate, consider exceptions to the Firm’s policies and procedures. Significant cybersecurity risks are escalated from these committees to Morgan Stanley’s Non-Financial Risk Committee. The CIO and the Head of Operational Risk report on the status of Morgan Stanley’s Cybersecurity Program, including significant cybersecurity risks; review metrics related to the program; and discuss the status of regulatory and remedial actions and incidents to the Firm Risk Committee, the BOTC and the MS Board. To the extent any cybersecurity incidents relate to the Company, the status of such incidents and remedial actions will be reported to our Board.
Board oversight of risks from cybersecurity threats
Our Board provides strategic oversight on cybersecurity matters, including risks associated with cybersecurity threats. Our Board receives periodic updates from the CCO of the Company, the CIO, the CISO, and the Head of Operational Risk, regarding the overall state of Morgan Stanley’s Cybersecurity Program, information on the current threat landscape, and risks from cybersecurity threats and cybersecurity incidents impacting the Company.
Assessment of Cybersecurity Risk
The potential impact of risks from cybersecurity threats on the Company are assessed on an ongoing basis, and how such risks could materially affect the Company’s business strategy, operational results, and financial condition are regularly evaluated. During the fiscal year ended December 31, 2023, the Company has not identified any risks from cybersecurity threats, including as a result of previous cybersecurity incidents, that the Company believes have materially affected, or are reasonably likely to materially affect, the Company, including its business strategy, operational results, and financial condition.
Item 2. Properties
Our headquarters are located at 1585 Broadway, New York, NY 10036. We do not own any real estate.
Item 3. Legal Proceedings
The Company, the Adviser and the Administrator may become party to certain lawsuits in the ordinary course of business, including proceedings relating to the enforcement of our rights under contracts with our portfolio companies. Each of the Company, the Adviser and the Administrator is not currently subject to any material legal proceedings, nor, to our knowledge, is any material legal proceeding threatened against the Company. See also “Note 1 to Consolidated Financial Statements in Part II, Item 8. Consolidated Financial Statements and Supplementary Data” of this Form 10-K.
Item 4. Mine Safety Disclosures
Not applicable.
PART II.
Item 5. Market for Registrant’s Common Equity, Related Stockholder Matters and Issuer Purchases of Equity Securities (dollar amounts in thousands, except per share amounts)
Market Information
Our Common Stock began trading on the NYSE on January 24, 2024 under the symbol “MSDL” in connection with the IPO. Shares of BDCs may trade at a market price that is less than the value of the net assets attributable to those shares. The possibility that our shares of Common Stock will trade at a discount from net asset value per share or at premiums that are unsustainable over the long term are separate and distinct from the risk that our net asset value per share will decrease. It is not possible to predict whether our Common Stock will trade at, above, or below net asset value per share.
See “Item 1A. Risk Factors—Risks Related to an Investment in Our Common Stock.” On February 29, 2024, the last reported closing sales price of our Common Stock on the NYSE was $19.69 per share, which represented a discount of approximately 4.7% to net asset value per share reported by us as of December 31, 2023.
Prior to our IPO, the shares of our Common Stock were offered and sold in transactions exempt from registration under the Securities Act. As such, there was no public market for shares of our common stock during the year ended December 31, 2023.
Holders
As of March 1, 2024, we had 6,539 stockholders of record, which did not include stockholders for whom shares are held in "nominee" or "street name."
Distribution Policy
To the extent that we have income available, we intend to make quarterly distributions to our stockholders. We have elected to be taxed as a RIC under Subchapter M of the Code. To maintain our RIC tax status, we intend to distribute at least 90% of our ICTI (as defined by the Code, which generally includes net ordinary income and net short-term taxable gains) to our stockholders in respect of each taxable year and to distribute net capital gains (that is, net long-term capital gains in excess of net short-term capital losses), if any, at least annually out of the assets legally available for such distributions as well as satisfy other applicable requirements under the Code. See “Item 1. Business—Certain Material U.S. Federal Income Tax Considerations.”
We cannot assure you that we will achieve results that will permit us to pay any cash distributions, and we will be prohibited from making distributions if doing so would cause us to fail to maintain the asset coverage ratios stipulated by the 1940 Act.
Dividend Reinvestment Plan
Prior to January 26, 2024, we had an “opt in” DRIP. As a result, if our Board of Directors authorized, and we declared, a cash dividend or distribution, our stockholders could elect to “opt in” to our DRIP and have their cash dividends or distributions automatically reinvested in additional shares of our Common Stock, rather than receiving cash. Stockholders who do not make such an election will receive their distributions in cash.
Prior to January 26, 2024, we used newly issued shares of Common Stock to implement the DRIP, with such shares were issued at a per-share price as determined by our Board of Directors (including any committee thereof), which price would be determined prior to the issuance of shares of Common Stock and in accordance with the limitations under Section 23 of the 1940 Act.
Effective as of January 26, 2024, we adopted an “opt out” DRIP that provides for reinvestment of dividends and other distributions on behalf of stockholders, unless a stockholder elects to receive cash as provided below. As a result, if the Board of Directors authorizes, and we declare, a cash dividend or other distribution, then the stockholders who have not “opted out” of the DRIP will have their cash dividends or distributions automatically reinvested in additional shares of Common Stock, rather than receiving cash.
For the avoidance of doubt, our stockholders who did not elect to “opt in” to the DRIP in effect prior to the effective date of the “opt out” DRIP will be deemed to have made an election to “opt out” of our DRIP as of the effective date of the “opt out” DRIP and to continue to receive cash.
No action is required on the part of a registered stockholder to have their cash dividend or other distribution reinvested in shares of our Common Stock. A registered stockholder may elect to receive an entire distribution in cash by notifying the plan administrator and our transfer agent and registrar in writing so that such notice is received by the plan administrator no later than 10 days prior to the record date for distributions to stockholders. The plan administrator will set up an account for each stockholder to acquire shares of Common Stock in non-certificated form through the plan if such stockholders have elected to receive their distributions in shares of Common Stock. Those stockholders who hold shares of Common Stock through a broker or other financial intermediary may receive dividends and other distributions in cash by notifying their broker or other financial intermediary of their election.
The Board reserves the right, subject to the provisions of the 1940 Act, to either issue new shares of Common Stock or to make open market purchases of shares of Common Stock for the accounts of participants or a combination of each. The number of shares of Common Stock to be issued to a participant is determined by dividing the total dollar amount of the distribution payable to such stockholder by the market price per share of our Common Stock at the close of regular trading on the NYSE on the date of such distribution and/or the price to be paid to acquire shares of Common Stock on the NYSE pursuant to the DRIP, provided that in the event the market price per share on the date of such distribution exceeds the most recently computed net asset value per share, the Company will issue shares at the greater of the most recently computed net asset value per share or 95% of the current market price per share (or such lesser discount to the current market price per share that still exceeds the most recently computed net asset value per share). The market price per share on that date will be the closing price for such shares on the NYSE or, if no sale is reported for such day, at the average of their reported bid and asked prices.
There will be no brokerage or other charges to stockholders who participate in the plan. The DRIP administrator’s fees under the plan will be paid by us.
Stockholders who receive dividends and other distributions in the form of shares of Common Stock are generally subject to the same U.S. federal, state and local tax consequences as are stockholders who elect to receive their distributions in cash. However, since a participating stockholder’s cash dividends would be reinvested in shares of our Common Stock, such stockholder will not receive cash with which to pay any applicable taxes on reinvested dividends.
A stockholder’s basis for determining gain or loss upon the sale of shares of Common Stock received in a dividend or other distribution from us will generally be equal to the cash that would have been received if the stockholder had received the distribution in cash. Any shares of Common Stock received in a dividend or other distribution will have a new holding period for tax purposes commencing on the day following the day on which such shares are credited to the U.S. holder’s account.
The following table summarizes our distributions declared and payable for the year ended December 31, 2023:
|
|
|
|
|
|
|
|
|
|
|
|
|
|
|
|
|
|
|
|
|
|
|
|
|
|
|
|
|
|
|
|
| Date Declared |
|
Record Date |
|
Payment Date |
|
Per Share Amount |
|
|
|
Total Amount |
|
| March 28, 2023 |
|
March 28, 2023 |
|
April 25, 2023 |
|
$ |
0.50 |
|
|
|
|
$ |
35,377 |
|
|
| June 27, 2023 |
|
June 27, 2023 |
|
July 25, 2023 |
|
0.57 |
|
|
|
|
40,735 |
|
(1) |
| September 26, 2023 |
|
September 26, 2023 |
|
October 25, 2023 |
|
0.60 |
|
|
|
|
43,211 |
|
(2) |
| December 28, 2023 |
|
December 28, 2023 |
|
January 25, 2024 |
|
0.60 |
|
|
|
|
49,968 |
|
(3) |
| Total Distributions |
|
|
|
|
|
$ |
2.27 |
|
|
|
|
$ |
169,291 |
|
|
(1) Includes a supplemental distribution of $0.07.
(2) Includes a supplemental distribution of $0.10.
(3) Includes a special distribution of $0.10.
Pursuant to our DRIP(1), the following table summarizes the amounts received and shares issued to stockholders who had “opted in” to the DRIP during the year ended December 31, 2023:
|
|
|
|
|
|
|
|
|
|
|
|
|
|
|
| Payment Date |
|
DRIP Shares Issued |
|
DRIP Shares Value |
| January 25, 2023 |
|
445,235 |
|
|
$ |
8,891 |
|
| April 25, 2023 |
|
482,721 |
|
|
9,698 |
|
| July 25, 2023 |
|
554,001 |
|
|
11,274 |
|
| October 25, 2023 |
|
579,388 |
|
|
12,022 |
|
| Total |
|
2,061,345 |
|
|
$ |
41,885 |
|
(1)During the fiscal year ended December 31, 2023, the Company had an “opt in” DRIP in effect, pursuant to which stockholders who had elected to “opt in” to the DRIP had their cash dividends or distributions automatically reinvested in additional shares of Common Stock, rather than receiving cash.
The following table summarizes our distributions declared and payable for the year ended December 31, 2022:
|
|
|
|
|
|
|
|
|
|
|
|
|
|
|
|
|
|
|
|
|
|
|
|
|
|
|
|
|
| Date Declared |
|
Record Date |
|
Payment Date |
|
Per Share Amount |
|
|
|
Total Amount |
| March 25, 2022 |
|
March 25, 2022 |
|
April 27, 2022 |
|
$ |
0.48 |
|
|
|
|
$ |
27,455 |
|
| June 24, 2022 |
|
June 24, 2022 |
|
July 27, 2022 |
|
0.47 |
|
|
|
|
28,601 |
|
| September 26, 2022 |
|
September 28, 2022 |
|
October 19, 2022 |
|
0.47 |
|
|
|
|
30,611 |
|
| December 20, 2022 |
|
December 20, 2022 |
|
January 25, 2023 |
|
0.50 |
|
|
|
|
32,770 |
|
| Total Distributions |
|
|
|
|
|
$ |
1.92 |
|
|
|
|
$ |
119,437 |
|
Pursuant to our DRIP(1), the following table summarizes the amounts received and shares issued to stockholders who had “opted in” to the DRIP during the year ended December 31, 2022:
|
|
|
|
|
|
|
|
|
|
|
|
|
|
|
| Payment Date |
|
DRIP Shares Issued |
|
DRIP Shares Value |
| January 25, 2022 |
|
358,891 |
|
|
$ |
7,540 |
|
| April 27, 2022 |
|
332,212 |
|
|
6,964 |
|
| July 27, 2022 |
|
372,338 |
|
|
7,614 |
|
| October 19, 2022 |
|
408,126 |
|
|
8,204 |
|
| Total |
|
1,471,567 |
|
|
$ |
30,322 |
|
(1)During the fiscal year ended December 31, 2022, the Company had an “opt in” DRIP in effect, pursuant to which stockholders who had elected to “opt in” to the DRIP had their cash dividends or distributions automatically reinvested in additional shares of Common Stock, rather than receiving cash.
Recent Sales of Unregistered Securities and Use of Proceeds
Except as previously reported by the Company on its Current Reports on Form 8-K, we did not sell any securities during the period covered by this Form 10-K that were not registered under the Securities Act.
Item 6. [Reserved]
Item 7. Management’s Discussion and Analysis of Financial Condition and Results of Operations (dollar amounts in thousands, except per share amounts, unless otherwise indicated)
The discussion and analysis contained in this section refers to our financial condition, results of operations and cash flows. The information contained in this section should be read in conjunction with the consolidated financial statements and notes thereto in Part II, Item 8 of this Form 10-K, “Consolidated Financial Statements and Supplementary Data.” This discussion contains forward-looking statements and involves numerous risks and uncertainties, including, but not limited to those described in Part I, Item 1A of this Form 10-K, “Risk Factors.” Our actual results could differ materially from those anticipated by such forward-looking information due to factors discussed under “Risk Factors” and “Cautionary Statement Regarding Forward-Looking Statements” appearing elsewhere in this Form 10-K.
OVERVIEW
We are a non-diversified, externally managed specialty finance company focused on lending to middle-market companies. We have elected to be regulated as a BDC under the 1940 Act. In addition, for U.S. federal income tax purposes, we have elected to be treated, and intend to comply with the requirements to qualify annually, as a RIC under Subchapter M of the Code. We are externally managed by our Adviser, an indirect, wholly owned subsidiary of Morgan Stanley. We are not a subsidiary of, or consolidated with, Morgan Stanley.
Our investment objective is to achieve attractive risk-adjusted returns via current income and, to a lesser extent, capital appreciation by investing primarily in directly originated senior secured term loans issued by U.S. middle-market companies in which private equity sponsors have a controlling equity stake in the portfolio company. For the purposes of this Report, “middle-market companies” refers to companies that, in general, generate annual EBITDA in the range of approximately $15 million to $200 million, although not all of our portfolio companies will meet this criterion.
We invest primarily in directly originated senior secured term loans including first lien senior secured term loans (including unitranche loans) and second lien senior secured term loans, with the balance of our investments expected to be in higher-yielding assets such as mezzanine debt, unsecured debt, equity investments and other opportunistic asset purchases. Typical middle-market senior loans may be issued by middle-market companies in the context of LBOs, acquisitions, debt refinancings, recapitalizations, and other similar transactions. We generally expect our debt investments to have a stated term of five to eight years and typically bear interest at a floating rate usually determined on the basis of a benchmark (such as SOFR).
We generate revenues primarily in the form of interest income from investments we hold. In addition, we generate income from dividends or distributions of income on any direct equity investments, capital gains on the sale of loans and equity investments and various other loan origination and other fees, including commitment, origination, amendment, structuring, syndication or due diligence fees, fees for providing managerial assistance and consulting fees.
Pursuant to the Order, we are able to enter into certain negotiated co-investment transactions alongside certain Regulated Funds and Affiliated Funds (each as defined in the Order) in a manner consistent with our investment objective, positions, policies, strategies, and restrictions as well as regulatory requirements and other pertinent factors, subject to compliance with the Order. Pursuant to the Order, we are permitted to co-invest with our affiliates if a “required majority” (as defined in Section 57(o) of the 1940 Act) of our eligible directors make certain conclusions in connection with a co-investment transaction, including that (1) the terms of the transactions, including the consideration to be paid, are reasonable and fair to us and our stockholders and do not involve overreaching in respect of us or our stockholders on the part of any person concerned, and (2) the transaction is consistent with the interests of our stockholders and is consistent with our investment objective and strategies.
We have applied for a new exemptive relief order which, if granted, would supersede the Order with respect to negotiated co-investment transactions alongside certain Regulated Funds and Affiliated Funds (each as defined in the application). There can be no assurance that we will obtain such new exemptive relief from the SEC.
KEY COMPONENTS OF OUR RESULTS OF OPERATIONS
Investments
Our level of investment activity can and does vary substantially from period to period depending on many factors, including the amount of debt available to middle-market companies, the general economic environment and the competitive environment for the type of investments we make.
Revenue
We generate revenue primarily in the form of interest income on debt investments we hold. In addition, we generate income from dividends or distributions of income on direct equity investments, capital gains on the sales of loans and equity securities and various loan origination and other fees. Our debt investments generally have a stated term of five to eight years and typically bear interest at a floating rate usually determined on the basis of a benchmark such as SOFR, or historically LIBOR. Interest on these debt investments is generally paid quarterly. In some instances, we receive payments on our debt investments based on scheduled amortization of the outstanding balances. In addition, we may receive repayments of some of our debt investments prior to their scheduled maturity date.
The frequency or volume of these repayments fluctuates significantly from period to period. Our portfolio activity also reflects the proceeds of sales of securities.
We may also generate revenue in the form of commitment, origination, amendment, structuring, syndication or due diligence fees, fees for providing managerial assistance and consulting fees.
Expenses
Our primary operating expenses include the payment of: (i) investment advisory fees, including base management fees and incentive fees, to our Adviser pursuant to the Investment Advisory Agreement; (ii) costs and other expenses and our allocable portion of overhead incurred by our Administrator in performing its administrative obligations under the Administration Agreement between us and the Administrator; and (iii) other operating expenses as detailed below:
•initial organization costs and offering costs incurred prior to the filing of our election to be regulated as a BDC
•costs associated with our initial private offering;
•costs of any other offerings of our Common Stock and other securities;
•calculating individual asset values and our net asset value (including the cost and expenses of any third-party valuation services);
•out of pocket expenses, including travel, entertainment, lodging, and meal expenses, incurred by the Investment Adviser, or members of its investment team or payable to third parties, in evaluating, developing, negotiating, structuring and performing due diligence on prospective portfolio companies (including, without limitation, any reverse termination fees and any liquidated damage and any costs related to broken deals) and monitoring actual portfolio companies and, if necessary, enforcing our rights;
•base management fee and any incentive fees payable under the Investment Advisory Agreement;
•certain costs and expenses relating to distributions paid by us;
•administration fees payable under the Administration Agreement and any sub-administration agreements, including related expenses;
•arrangement, debt service and other costs of borrowings, senior securities or other financing arrangements;
•the allocated costs incurred by the Investment Adviser in providing managerial assistance to those portfolio companies that request it;
•amounts payable to third parties relating to, or associated with, making or holding investments;
•the costs associated with subscriptions to data service, research-related subscriptions and expenses and quotation equipment and services used in making or holding investments;
•transfer agent and custodial fees;
•costs of derivatives and hedging;
•commissions and other compensation payable to brokers or dealers;
•any stock exchange listing fees and fees payable to rating agencies;
•cost of effecting any sales and repurchases of our Common Stock and other securities;
•federal and state registration fees;
•U.S. federal, state and local taxes, including any excise taxes;
•independent director fees and expenses;
•costs of preparing consolidated financial statements and maintaining books and records, costs of preparing tax returns, costs of Sarbanes-Oxley Act compliance and attestation and costs of filing reports or other documents with the SEC (or other regulatory bodies), and other reporting and compliance costs, including registration and listing fees, and the compensation of professionals responsible for the preparation or review of the foregoing;
•the costs of any reports, proxy statements or other notices to our stockholders (including printing and mailing costs), the costs of any stockholders’ meetings, and costs and expenses of preparation for the foregoing and related matters;
•the costs of specialty and custom software for monitoring risk, compliance and overall investments;
•fees and expenses associated with marketing efforts;
•any fidelity bond required by applicable law;
•any necessary insurance premiums;
•any extraordinary expenses (such as litigation or indemnification payments or amounts payable pursuant to any agreement to provide indemnification entered into by the Company);
•direct fees and expenses associated with independent audits, agency, consulting and legal costs;
•cost of winding up; and
•all other expenses incurred by either the Administrator or us in connection with administering our business, including payments under the Administration Agreement based upon our allocable portion of the compensation paid to our Chief Financial Officer and Chief Compliance Officer and reimbursing third-party expenses incurred by the Administrator in carrying out its administrative services including, but not limited to, the fees and expenses associated with performing compliance functions.
We reimburse the Administrator or its affiliates for amounts paid or costs borne that properly constitute Company expenses as set forth in the Administration Agreement or otherwise. We expect our general and administrative expenses to be relatively stable or to decline as a percentage of total assets during periods of asset growth and to increase during periods of asset declines.
PORTFOLIO, INVESTMENT ACTIVITY AND RESULTS OF OPERATIONS
The composition of our portfolio is presented below:
|
|
|
|
|
|
|
|
|
|
|
|
|
|
|
|
|
|
|
|
|
|
|
|
|
|
|
|
|
|
|
|
|
|
|
|
|
|
|
|
|
December 31, 2023 |
|
December 31, 2022 |
|
|
Cost |
|
Fair Value |
|
% of Total Investments at Fair Value |
|
Cost |
|
Fair Value |
|
% of Total Investments at Fair Value |
| First Lien Debt |
|
$ |
3,027,413 |
|
|
$ |
3,004,544 |
|
|
94.1 |
% |
|
$ |
2,753,620 |
|
|
$ |
2,694,111 |
|
|
93.8 |
% |
| Second Lien Debt |
|
146,014 |
|
|
132,415 |
|
|
4.1 |
|
|
136,620 |
|
|
128,350 |
|
|
4.5 |
|
| Other Investments |
|
53,349 |
|
|
56,602 |
|
|
1.8 |
|
|
49,406 |
|
|
51,127 |
|
|
1.7 |
|
| Total |
|
$ |
3,226,776 |
|
|
$ |
3,193,561 |
|
|
100.0 |
% |
|
$ |
2,939,646 |
|
|
$ |
2,873,588 |
|
|
100.0 |
% |
Our debt portfolio displayed the following characteristics of each of our investments(1)(2) unless otherwise noted:
|
|
|
|
|
|
|
|
|
|
|
|
|
|
|
|
|
As of |
|
|
December 31, 2023 |
|
December 31, 2022 |
| Number of portfolio companies |
|
172 |
|
150 |
| Number of new investment commitments in portfolio companies |
|
29 |
|
59 |
| Number of portfolio companies exited or fully repaid |
|
7 |
|
7 |
| Percentage of performing debt bearing a floating rate, at fair value |
|
99.9 |
% |
|
99.9 |
% |
| Percentage of performing debt bearing a fixed rate, at fair value |
|
0.1 |
% |
|
0.1 |
% |
Weighted average yield on debt and income producing investments, at cost(3) |
|
12.0 |
% |
|
10.9 |
% |
Weighted average yield on debt and income producing investments, at fair value(3) |
|
12.1 |
% |
|
11.2 |
% |
| Weighted average 12-month EBITDA |
|
$ |
153.1 |
|
|
$ |
124.0 |
|
Weighted average net leverage through tranche(4) |
|
6.0x |
|
6.0x |
Weighted average loan to value of our portfolio companies(5) |
|
43.0 |
% |
|
44.0 |
% |
| Percentage of debt investments with one or more financial covenants |
|
74.6 |
% |
|
78.0 |
% |
| Percentage of our debt investments that are sponsor backed |
|
98.5 |
% |
|
98.5 |
% |
| Percentage of loans and other debt in support of LBOs and acquisitions |
|
76.3 |
% |
|
79.2 |
% |
| Percentage of our debt portfolio subject to business cycle volatility |
|
6.0 |
% |
|
6.5 |
% |
| Percentage of our total portfolio on non-accrual, at cost |
|
0.6 |
% |
|
0.1 |
% |
Our weighted average interest coverage was 1.5x(6) as of December 31, 2023. The average position size of our investments was approximately $18.6 million, or 0.6% of total fair value and our top ten portfolio companies represented approximately 20.3% of total fair value.
1 Calculated as a percentage of gross debt commitments (funds and unfunded). Weighted average EBITDA, net leverage through the tranche that the Company is a lender, interest coverage and loan to value exclude recurring revenue investments, which are investments in portfolio companies in which the Company lends based on a multiple of recurring revenue generated by the portfolio company and not based on a multiple of EBITDA.
2 Amounts were derived from investment due diligence information provided by the portfolio company. Such amounts have not been independently estimated by us, and accordingly, we take no responsibility for such numbers and make no representation or warranty in respect of this information.
3 Computed as (a) the annual stated spread, plus reference rate, as applicable, plus the annual accretion of discounts, as applicable on debt securities divided by (b) total debt investments (at fair value or cost, as applicable) included in such securities. Actual yields earned over the life of each investment could differ materially from the yields presented herein..
4 Net leverage is the ratio of total debt minus cash divided by EBITDA and taking into account leverage through the tranche that the Company is a lender, excluding recurring revenue investments.
5 Calculated using total outstanding debt through the tranche that the Company is a lender divided by total enterprise value from the private equity sponsor or market comparables.
6 Interest coverage for a particular portfolio company is calculated by taking credit agreement EBITDA and dividing by annualized latest reported interest expense. Total interest coverage is calculated on a weighted average basis based on total gross debt commitments (funded and unfunded). Calculation excludes recurring revenue deals which are investments in portfolio companies in which the Company lends based on a multiple of recurring revenue generated by the portfolio company and not based on a multiple of EBITDA. Portfolio company statistics are derived from the most recently available financial statements of each portfolio company as of the reported end date. Statistics of the portfolio companies have not been independently verified by us and may reflect a normalized or adjusted amount.
Investment Activity
Our investment activity is presented below (information presented herein is at amortized cost unless otherwise indicated):
|
|
|
|
|
|
|
|
|
|
|
|
|
As of and For the Year Ended |
|
December 31, 2023 |
|
December 31, 2022 |
| New Investments Committed |
|
|
|
Gross Principal Balance(1) |
$ |
667,870 |
|
|
$ |
809,313 |
|
| Less: Syndications |
(40,751) |
|
|
(69,477) |
|
| Net New Investments Committed |
$ |
627,119 |
|
|
$ |
739,836 |
|
| Investments, at Cost |
|
|
|
| Investments, beginning of period |
$ |
2,939,646 |
|
|
$ |
2,373,435 |
|
| New investments purchased |
632,105 |
|
|
945,209 |
|
| Net accretion of discount on investments |
11,314 |
|
|
11,418 |
|
| Payment-in-kind |
6,069 |
|
|
2,714 |
|
| Net realized gain (loss) on investments |
118 |
|
|
537 |
|
| Investments sold or repaid |
(362,476) |
|
|
(393,667) |
|
| Investments, end of period |
$ |
3,226,776 |
|
|
$ |
2,939,646 |
|
| Amount of investments funded, at principal |
|
|
|
| First lien debt investments |
$ |
637,946 |
|
|
$ |
938,043 |
|
| Second lien debt investments |
8,588 |
|
|
16,033 |
|
Other Investments(2) |
1,812 |
|
|
8,315 |
|
| Total |
$ |
648,346 |
|
|
$ |
962,391 |
|
| Amount of investments sold/fully repaid, at principal |
|
|
|
| First lien debt investments |
$ |
239,383 |
|
|
$ |
207,907 |
|
| Second lien debt investments |
— |
|
|
— |
|
Other Investments(2) |
— |
|
|
— |
|
| Total |
$ |
239,383 |
|
|
$ |
207,907 |
|
|
|
|
|
(1)Includes new investment commitments, excluding sale/repayments and including new unfunded investment commitments.
(2)Represents dollar amount of other investments funded.
Investment Performance Rating
As part of the monitoring process, our Investment Adviser has developed risk policies pursuant to which it regularly assesses the risk profile of each of our debt investments. Our Investment Adviser has developed a classification system to group investments into four categories. The investments are evaluated regularly and assigned a category based on certain credit metrics. Our Investment Adviser’s ratings do not constitute any rating of investments by a nationally recognized statistical rating organization or represent or reflect any third-party assessment of any of our investments. Please see below for a description of the four categories of the Investment Adviser’s Internal Risk Rating system:
Risk Rating 1 — In the opinion of our Investment Adviser, investments in Category 1 involve the least amount of risk relative to our initial cost basis at the time of origination or acquisition. Category 1 investments performance is above our initial underwriting expectations and the business trends and risk factors are generally favorable, which may include the performance of the portfolio company, or the likelihood of a potential exit.
Risk Rating 2 — In the opinion of our Investment Adviser, investments in Category 2 involve a level of risk relative to our initial cost basis at the time of origination or acquisition. Category 2 investments are generally performing in line with our initial underwriting expectations and risk factors to ultimately recoup the cost of our principal investment are neutral to favorable. All new originated or acquired investments are initially included in Category 2.
Risk Rating 3 — In the opinion of our Investment Adviser, investments in Category 3 indicate that the risk to our ability to recoup the initial cost basis at the time of origination or acquisition has increased materially since the origination or acquisition of the investment, such as declining financial performance and non-compliance with debt covenants; however, principal and interest payments are not more than 120 days past due.
Risk Rating 4 — In the opinion of our Investment Adviser, investments in Category 4 involve a borrower performing substantially below expectations and indicate that the loan’s risk has increased substantially since origination or acquisition. Most or all of the debt covenants are out of compliance and payments are substantially delinquent. For Category 4 investments, it is anticipated that we will not recoup our initial cost basis and may realize a substantial loss of our initial cost basis at the time of origination or acquisition upon exit.
The distribution of our portfolio on the Investment Adviser’s Internal Risk Rating System is as follows:
|
|
|
|
|
|
|
|
|
|
|
|
|
|
|
|
|
|
|
|
|
|
|
|
|
|
|
|
|
|
|
|
December 31, 2023 |
December 31, 2022 |
|
|
Fair Value |
|
% of Total |
|
Fair Value |
|
% of Total |
|
| Risk rating 1 |
|
$ |
5,950 |
|
|
0.2 |
% |
|
$ |
— |
|
|
— |
% |
|
| Risk rating 2 |
|
3,126,464 |
|
|
97.9 |
|
|
2,844,451 |
|
|
99.0 |
|
|
| Risk rating 3 |
|
49,257 |
|
|
1.5 |
|
|
29,137 |
|
|
1.0 |
|
|
| Risk rating 4 |
|
11,890 |
|
|
0.4 |
|
|
— |
|
|
— |
|
|
|
|
$ |
3,193,561 |
|
|
100.0 |
% |
|
$ |
2,873,588 |
|
|
100.0 |
% |
|
CONSOLIDATED RESULTS OF OPERATIONS
The following table represents our operating results:
|
|
|
|
|
|
|
|
|
|
|
|
|
|
|
|
|
For the Year Ended |
|
|
December 31, 2023 |
|
December 31, 2022 |
| Total investment income |
|
$ |
367,738 |
|
|
$ |
230,593 |
|
| Less: Net expenses |
|
168,158 |
|
|
102,249 |
|
| Net investment income |
|
199,580 |
|
|
128,344 |
|
| Less: Excise tax expense |
|
1,519 |
|
|
334 |
|
| Net investment income (loss) after taxes |
|
198,061 |
|
|
128,010 |
|
| Net change in unrealized appreciation (depreciation) |
|
32,835 |
|
|
(80,005) |
|
| Net realized gain (loss) |
|
118 |
|
|
537 |
|
| Net increase (decrease) in net assets resulting from operations |
|
$ |
231,014 |
|
|
$ |
48,542 |
|
Investment Income
Investment income was as follows:
|
|
|
|
|
|
|
|
|
|
|
|
|
|
|
|
|
For the Year Ended |
|
|
December 31, 2023 |
|
December 31, 2022 |
| Investment income: |
|
|
|
|
| Interest income |
|
$ |
355,530 |
|
|
$ |
223,119 |
|
| Payment-in-kind |
|
4,276 |
|
|
1,626 |
|
| Dividend income |
|
2,124 |
|
|
1,488 |
|
| Other income |
|
5,808 |
|
|
4,360 |
|
| Total investment income |
|
$ |
367,738 |
|
|
$ |
230,593 |
|
Total investment income increased from $230,593 for the year ended December 31, 2022 to $367,738 for the year ended December 31, 2023. The increase was primarily driven by our deployment of capital and rising SOFR rates on our floating-rate debt investments. The size of our investment portfolio at amortized cost increased from $2,939,646 as of December 31, 2022 to $3,226,776 as of December 31, 2023. Weighted average asset yield of debt investments at cost increased from 10.9% at December 31, 2022 to 12.0% at December 31, 2023.
Expenses
Expenses were as follows:
|
|
|
|
|
|
|
|
|
|
|
|
|
|
|
|
|
For the Year Ended |
|
|
December 31, 2023 |
|
December 31, 2022 |
| Expenses: |
|
|
|
|
| Interest and other financing expenses |
|
$ |
112,883 |
|
|
$ |
67,182 |
|
| Management fees |
|
30,550 |
|
|
26,715 |
|
| Income based incentive fees |
|
42,012 |
|
|
26,635 |
|
| Capital gains incentive fees |
|
— |
|
|
(2,441) |
|
| Professional fees |
|
4,470 |
|
|
3,206 |
|
| Directors’ fees |
|
345 |
|
|
362 |
|
| Administrative service fees |
|
178 |
|
|
72 |
|
| General and other expenses |
|
633 |
|
|
510 |
|
| Total expenses |
|
191,071 |
|
|
122,241 |
|
| Expense support |
|
— |
|
|
44 |
|
| Management fees waiver |
|
(22,913) |
|
|
(20,036) |
|
| Net expenses |
|
$ |
168,158 |
|
|
$ |
102,249 |
|
| Excise tax expense |
|
$ |
1,519 |
|
|
$ |
334 |
|
Interest and Other Financing Expenses
Interest and other financing expenses, including unused commitment fees, amortization of debt issuance costs and deferred financing costs, were $112,883 and $67,182 for the year ended December 31, 2023 and December 31, 2022, respectively. The increase was primarily due to higher average borrowings outstanding over time, increased reference rates and higher cost of unsecured debt issued. For the year ended December 31, 2023 and December 31, 2022, average borrowings outstanding were $1,576,285 and $1,432,492, respectively. The combined weighted average interest rate (excluding unused fees and financing costs) of the aggregate borrowings outstanding for the year ended December 31, 2023 and December 31, 2022 were 6.51% and 4.05%, respectively.
Management Fees
The base management fees, net of waiver, were $7,637 and $6,679 for the year ended December 31, 2023 and December 31, 2022. The increases were primarily due to an increase in average gross assets.
Incentive Fee
The incentive fee consists of two components: (1) income based incentive fee and (2) capital gains incentive fee. The income based incentive fees were $42,012 and $26,635 for the year ended December 31, 2023 and December 31, 2022. The increases were primarily due to an increase in pre-incentive fee net investment income. For the year ended December 31, 2023, there was $0 capital gains incentive fees accrued to the Investment Adviser. For the year ended December 31, 2022, $2,441 of previously accrued capital gains incentive fees to the Investment Adviser were reversed due to changes in unrealized depreciation on investments during the period.
Professional Fees, Administrative Service Fee and Other Expenses
Professional fees include legal, audit, tax, valuation and other professional fees incurred related to the management of our Company. Administrative service fee represents fees paid to the Administrator for our allocable portion of the cost of certain of our executive officers that perform duties for us. Other general and administrative expenses include insurance, filing, research, subscriptions and other costs.
Net Realized Gain (Loss) and Unrealized Gain (Loss) on Investments
|
|
|
|
|
|
|
|
|
|
|
|
|
|
|
|
|
For the Year Ended |
|
|
December 31, 2023 |
|
December 31, 2022 |
| Net realized and unrealized gains (losses) on investment transactions: |
|
|
|
|
| Net realized gain (loss): |
|
|
|
|
| Non-controlled/non-affiliated investments |
|
$ |
118 |
|
|
$ |
537 |
|
|
|
|
|
|
|
|
|
|
|
| Net change in unrealized appreciation (depreciation): |
|
|
|
|
| Non-controlled/non-affiliated investments |
|
32,835 |
|
|
(80,005) |
|
|
|
|
|
|
|
|
|
|
|
| Net realized and unrealized gains (losses) |
|
$ |
32,953 |
|
|
$ |
(79,468) |
|
For the year ended December 31, 2023, net change in unrealized appreciation on our investments of $32,835, was primarily the result of the changes in spreads in the primary and secondary markets. For the year ended December 31, 2022, net change in unrealized depreciation on our investments of $80,005 was primarily driven by a widening credit spread environment and volatile markets.
For further details of the consolidated results of operations for the year ended December 31, 2021, see annual report Form 10-K filed on March 9, 2023.
FINANCIAL CONDITION, LIQUIDITY AND CAPITAL RESOURCES
We generate cash from the net proceeds of offerings of our Common Stock, net borrowings from our credit facilities, and net proceeds of our unsecured debt issuances and through cash flows from operations, including investment sales and repayments as well as income earned on investments. Details of our credit facilities and unsecured debt issuance are described in “—Debt” below. We may from time to time enter into new credit facilities, increase the size of existing credit facilities or issue additional debt securities. Any such incurrence or issuance would be subject to prevailing market conditions, our liquidity requirements, contractual and regulatory restrictions and other factors.
As of December 31, 2023, we had approximately $69.7 million of cash, which taken together with our approximately $318.0 million and $599.5 million of availability under the BNP Funding Facility and the Truist Credit Facility (subject to borrowing base availability) (each as defined in Note 6. “Debt” in the notes to the accompanying consolidated financial statements), respectively, we expect to be sufficient for our investing activities and sufficient to conduct our operations in the near term. As of December 31, 2023, we believed we had adequate financial resources to satisfy unfunded portfolio company commitments of $295.0 million.
Equity
The following table summarizes the total shares issued and proceeds received from the Company’s capital drawdowns delivered pursuant to the Subscription Agreements for the year ended December 31, 2023:
|
|
|
|
|
|
|
|
|
|
|
|
|
|
|
| Share Issuance Date |
|
Shares Issued |
|
Amount |
| October 04, 2023 |
|
10,680,808 |
|
|
$ |
220,238 |
|
| Total |
|
10,680,808 |
|
|
$ |
220,238 |
|
Following the above capital call, the Company does not have any remaining undrawn capital commitments.
The total shares issued and proceeds received related to capital drawdowns delivered pursuant to the Subscription Agreements for the year ended December 31, 2022 were as follows:
|
|
|
|
|
|
|
|
|
|
|
|
|
|
|
| Share Issuance Date |
|
Shares Issued |
|
Amount |
| May 16, 2022 |
|
3,548,132 |
|
|
$ |
74,866 |
|
| July 28, 2022 |
|
3,903,231 |
|
|
79,821 |
|
| December 23, 2022 |
|
4,775,721 |
|
|
94,604 |
|
| Total |
|
12,227,084 |
|
|
$ |
249,291 |
|
Distributions and Dividend Reinvestment
The following tables summarize our distributions declared and payable for the year ended December 31, 2023 and December 31, 2022, respectively:
|
|
|
|
|
|
|
|
|
|
|
|
|
|
|
|
|
|
|
|
|
|
|
|
|
|
|
|
|
|
|
|
| Date Declared |
|
Record Date |
|
Payment Date |
|
Per Share Amount |
|
|
|
Total Amount |
|
| March 28, 2023 |
|
March 28, 2023 |
|
April 25, 2023 |
|
$ |
0.50 |
|
|
|
|
$ |
35,377 |
|
|
| June 27, 2023 |
|
June 27, 2023 |
|
July 25, 2023 |
|
0.57 |
|
|
|
|
40,735 |
|
(1) |
| September 26, 2023 |
|
September 26, 2023 |
|
October 25, 2023 |
|
0.60 |
|
|
|
|
43,211 |
|
(2) |
| December 28, 2023 |
|
December 28, 2023 |
|
January 25, 2024 |
|
0.60 |
|
|
|
|
49,968 |
|
(3) |
| Total Distributions |
|
|
|
|
|
$ |
2.27 |
|
|
|
|
$ |
169,291 |
|
|
|
|
|
|
|
|
|
|
|
|
|
|
|
|
|
|
|
|
|
|
|
|
|
|
|
|
|
|
|
| Date Declared |
|
Record Date |
|
Payment Date |
|
Per Share Amount |
|
|
|
Total Amount |
| March 25, 2022 |
|
March 25, 2022 |
|
April 27, 2022 |
|
$ |
0.48 |
|
|
|
|
$ |
27,455 |
|
| June 24, 2022 |
|
June 24, 2022 |
|
July 27, 2022 |
|
0.47 |
|
|
|
|
28,601 |
|
| September 26, 2022 |
|
September 28, 2022 |
|
October 19, 2022 |
|
0.47 |
|
|
|
|
30,611 |
|
| December 20, 2022 |
|
December 20, 2022 |
|
January 25, 2023 |
|
0.50 |
|
|
|
|
32,770 |
|
| Total Distributions |
|
|
|
|
|
$ |
1.92 |
|
|
|
|
$ |
119,437 |
|
(1)Includes a regular distribution to stockholders in the amount of $0.50 per share and a supplemental distribution to the stockholders in the amount of $0.07 per share.
(2)Includes a regular distribution to stockholders in the amount of $0.50 per share and a supplemental distribution to the stockholders in the amount of $0.10 per share.
(3)Includes a regular distribution to stockholders in the amount of $0.50 per share and a special distribution to the stockholders in the amount of $0.10 per share.
Prior to January 26, 2024, we had an “opt in” dividend reinvestment plan, or the DRIP. As a result, our stockholders who elected to “opt in” to the DRIP had their cash dividends or distributions automatically reinvested in additional shares of Common Stock, rather than receiving cash. We adopted an “opt out” DRIP effective as of January 26, 2024. As a result, our stockholders who have not “opted out” of the DRIP will have their cash dividends or distributions automatically reinvested in additional shares of Common Stock, rather than receiving cash. Stockholders who receive distributions in the form of shares of Common Stock will generally be subject to the same U.S. federal, state and local tax consequences as if they received cash distributions; however, those stockholders will not receive cash with which to pay any applicable taxes.
The following tables summarize DRIP(1) shares issued and amounts for the year ended December 31, 2023 and December 31, 2022, respectively:
|
|
|
|
|
|
|
|
|
|
|
|
|
|
|
| Payment Date |
|
DRIP Shares Issued |
|
DRIP Shares Value |
| January 25, 2023 |
|
445,235 |
|
|
$ |
8,891 |
|
| April 25, 2023 |
|
482,721 |
|
|
9,698 |
|
| July 25, 2023 |
|
554,001 |
|
|
11,274 |
|
|
|
|
|
|
| October 25, 2023 |
|
579,388 |
|
|
12,022 |
|
| Total |
|
2,061,345 |
|
|
$ |
41,885 |
|
|
|
|
|
|
|
|
|
|
|
|
|
|
|
|
| Payment Date |
|
DRIP Shares Issued |
|
DRIP Shares Value |
| January 25, 2022 |
|
358,891 |
|
|
$ |
7,540 |
|
| April 27, 2022 |
|
332,212 |
|
|
6,964 |
|
| July 27, 2022 |
|
372,338 |
|
|
7,614 |
|
| October 19, 2022 |
|
408,126 |
|
|
8,204 |
|
| Total |
|
1,471,567 |
|
|
$ |
30,322 |
|
(1)During the fiscal years ended December 31, 2023 and December 31, 2022, the Company had an “opt in” DRIP in effect, pursuant to which stockholders who had elected to “opt in” to the DRIP had their cash dividends or distributions automatically reinvested in additional shares of Common Stock, rather than receiving cash.
Debt
Our outstanding debt obligations were as follows:
|
|
|
|
|
|
|
|
|
|
|
|
|
|
|
|
|
|
|
|
|
|
|
|
|
December 31, 2023 |
|
December 31, 2022 |
|
Aggregate Principal Committed |
Outstanding Principal |
Unused Portion |
|
Aggregate Principal Committed |
Outstanding Principal |
Unused Portion |
| BNP Funding Facility |
$ |
600,000 |
|
$ |
282,000 |
|
$ |
318,000 |
|
|
$ |
600,000 |
|
$ |
400,000 |
|
$ |
200,000 |
|
Truist Credit Facility(1)(2) |
1,120,000 |
|
520,263 |
|
599,484 |
|
|
975,000 |
|
432,254 |
|
538,521 |
|
2027 Notes(3) |
425,000 |
|
425,000 |
|
— |
|
|
425,000 |
|
425,000 |
|
— |
|
2025 Notes(3) |
275,000 |
|
275,000 |
|
— |
|
|
275,000 |
|
275,000 |
|
— |
|
| Total |
$ |
2,420,000 |
|
$ |
1,502,263 |
|
$ |
917,484 |
|
|
$ |
2,275,000 |
|
$ |
1,532,254 |
|
$ |
738,521 |
|
(1)As of December 31, 2023 and December 31, 2022, a letter of credit of $253 and $4,225, respectively, was outstanding, which reduced the unused availability under the Truist Credit Facility by the same amount.
(2)Under the Truist Credit Facility, the Company may borrow in U.S. dollars or certain other permitted currencies. As of December 31, 2023 and December 31, 2022, the Company had borrowings denominated in Euros (EUR) of 238 and 238, respectively.
(3)As of December 31, 2023, the carrying value of the Company’s 2027 Notes and 2025 Notes were presented on the Consolidated Statements of Assets and Liabilities net of unamortized debt issuance costs of $3,499 and $2,065, and unamortized original issuance discount of $667 and $0, respectively. As of December
31, 2022, the carrying value of the Company’s 2027 Notes and 2025 Notes were presented on the Consolidated Statements of Assets and Liabilities net of unamortized debt issuance costs of $4,622 and $3,277, and unamortized original issuance discount of $881 and $0, respectively.
For additional information on our debt obligations, see Note 6. “Debt” to our consolidated financial statements included in this report.
RECENT DEVELOPMENTS
IPO
On January 26, 2024, we closed our IPO, issuing 5,000,000 shares of our Common Stock at a public offering price of $20.67 per share. Net of underwriting fees, we received net cash proceeds, before offering expenses, of approximately $97.1 million. The Company’s Common Stock began trading on the NYSE under the symbol “MSDL” on January 24, 2024.
Investment Advisory Agreement
On January 24, 2024, we entered into an Amended and Restated Investment Advisory Agreement. The Amended and Restated Investment Advisory Agreement incorporates (i) a cumulative three-year lookback provision and (ii) a cap on quarterly income incentive fee payments based on net realized capital loss, if any, during the applicable three-year lookback period. From January 24, 2024 to January 24, 2025 the Adviser has also agreed to waive any portion of the base management fee in excess of 0.75% and each component of the incentive fee above 15%. For additional detail, see “Item 1. Business—Investment Advisory Agreement.” Otherwise, no material changes were made as compared to the Original Investment Advisory Agreement.
Dividend Declarations
On January 11, 2024, the Board of Directors declared the following special distributions:
|
|
|
|
|
|
|
|
|
| Record Date |
|
Special Distribution Amount (per Share) |
| 195 days after the date of the final prospectus relating to the Company’s IPO |
|
$ |
0.10 |
|
| 285 days after the date of the final prospectus relating to the Company’s IPO |
|
$ |
0.10 |
|
The payable date of each of the above distributions shall be on or about 25 days after the end of the calendar quarter in which the record date occurred, or if such date is not a business day, the preceding business day. Shares of Common Stock sold pursuant to the prospectus relating to the Company's IPO will be entitled to receive these distributions.
On February 29, 2024, the Board of Directors of the Company declared a regular distribution to stockholders in the amount of $0.50 per share. The distributions will be payable on or around April 25, 2024 to stockholders of record as of March 29, 2024.
Share Repurchase Plan
On January 25, 2024, we entered into the Company 10b5-1 Plan, to acquire up to $100 million in the aggregate of our Common Stock at prices below our net asset value per share over a specified period, in accordance with the guidelines specified in Rule 10b5-1 and Rule 10b-18 of the Exchange Act. The Company 10b5-1 Plan was approved by our Board of Directors on September 11, 2023. The Company 10b5-1 Plan requires Wells Fargo Securities, LLC, as our agent, to repurchase Common Stock on our behalf when the market price per share is below the most recently reported net asset value per share (including any updates, corrections or adjustments publicly announced by us to any previously announced net asset value per share, including any distributions declared). Under the Company 10b5-1 Plan, the volume of purchases would be expected to increase as the price of our Common Stock declines, subject to volume restrictions. The timing and amount of any share repurchases will depend on the terms and conditions of the Company 10b5-1 Plan, the market price of our Common Stock and trading volumes, and no assurance can be given that Common Stock will be repurchased in any particular amount or at all. The repurchase of shares pursuant to the Company 10b5-1 Plan is intended to satisfy the conditions of Rule 10b5-1 and Rule 10b-18 under the Exchange Act, and will otherwise be subject to applicable law, including Regulation M, which may prohibit repurchases under certain circumstances. The Company 10b5-1 Plan will commence beginning 60 calendar days following the end of the “restricted period” under Regulation M and will terminate upon the earliest to occur of (i) 12-months from the commencement date of the Company 10b5-1 Plan , (ii) the end of the trading day on which the aggregate purchase price for all shares purchased under the Company 10b5-1 Plan equals $100 million and (iii) the occurrence of certain other events described in the Company 10b5-1 Plan. The “restricted period” under Regulation M ended upon the closing of our IPO and, therefore, the Common Stock repurchases/purchases described above will begin 60 days after the closing of the IPO, or March 26, 2024.
Dividend Reinvestment Plan
Effective January 26, 2024, the Company has adopted an “opt out” DRIP that provides for reinvestment of dividends and other distributions on behalf of stockholders, unless a stockholder elects to receive cash. As a result, if the Board of Directors authorizes, and the Company declares, a cash dividend or other distribution, then the stockholders who have not “opted out” of the DRIP will have their cash dividends or distributions automatically reinvested in additional shares of Common Stock, rather than receiving cash.
CRITICAL ACCOUNTING ESTIMATES
The preparation of our consolidated financial statements requires us to make estimates and assumptions that affect the reported amounts of assets, liabilities, revenues, and expenses. Changes in the economic environment, financial markets, and any other parameters used in determining such estimates could cause actual results to differ. Our critical accounting estimates including those relating to the valuation of our investment portfolio, should be read in connection with the consolidated financial statements in Part I, Item 1 of this Report, “Management’s Discussion and Analysis of Financial Condition and Results of Operations – Critical Accounting Policies” in Part II, Item 7 of our Form 10-K, and “Risk Factors” in Part I, Item 1A of our Form 10-K.
RELATED PARTY TRANSACTIONS
We have entered into a number of business relationships with affiliated or related parties, including the following (which are defined
in the notes to the accompanying unaudited financial statements if not defined herein):
•the Investment Advisory Agreement;
•the Administration Agreement; and
•the License Agreement.
See Note 3. “Related Party Transactions” to our consolidated financial statements included in this report.
Item 7A. Quantitative and Qualitative Disclosures About Market Risk
We are subject to financial market risks, including valuation risk, market risk and interest rate risk.
Valuation Risk
We have invested, and plan to continue to invest, primarily in illiquid debt and equity securities of portfolio companies. During periods of market dislocation, we will seek to invest prudently in the secondary loan market to provide our investors better risk adjusted returns while adhering to our core investment tenants. Most of our investments will not have a readily available market price. To ensure accurate valuations, our investments are valued at fair value in good faith by the Board based on, among other things, the input of the Investment Adviser, including the Valuation Designee, our Audit Committee and independent third-party valuation firms engaged at the direction of the Board of Directors, and in accordance with our valuation policy. There is no single standard for determining fair value. As a result, determining fair value requires that judgment be applied to the specific facts and circumstances of each investment while employing a consistently applied valuation process for the investments we hold. If we were required to liquidate a portfolio investment in a forced or liquidation sale, we may realize amounts that are different from the amounts presented and such differences could be material.
Market Risk
The market value of a security may move up or down, sometimes rapidly and unpredictably. These fluctuations may cause a security to be worth less than the price originally paid for it, or less than it was worth at an earlier time. Market risk may affect a single issuer, industry, sector of the economy or the market as a whole. Global economies and financial markets are increasingly interconnected, which increases the probabilities that conditions in one country or region might adversely impact issuers in a different country or region. Conditions affecting the general economy, including political, social, or economic instability at the local, regional, or global level, may also affect the market value of a security. Health crises, such as pandemic and epidemic diseases, as well as other incidents that interrupt the expected course of events, such as natural disasters, war or civil disturbance, acts of terrorism, power outages and other unforeseeable and external events, and the public response to or fear of such diseases or events, have and may in the future have an adverse effect on a company’s investments and net asset value and can lead to increased market volatility. See “Part I, Item 1A. Risk Factors—General Risk Factors—Risks Relating to Our Business and Structure—We are operating in a period of capital markets disruption and economic uncertainty. The conditions have materially and adversely affected debt and equity capital markets in the United States, and any future volatility or instability in capital markets may have a negative impact on our business and operations.” of our Form 10-K and Part II, Item 1A. Risk Factors — "Terrorist attacks, acts of war, natural disasters, outbreaks or pandemics, such as the Coronavirus pandemic, may impact our portfolio companies and our Adviser and harm our business, operating results and financial condition” of this Report.
Interest Rate Risk
We are subject to financial market risks, most significantly changes in interest rates. Interest rate sensitivity refers to the change in our earnings that may result from changes in the level of interest rates. Because we expect to fund a portion of our investments with borrowings, our net investment income is expected to be affected by the difference between the rate at which we invest and the rate at which we borrow. As a result, we can offer no assurance that a significant change in market interest rates will not have a material adverse effect on our net investment income.
As of December 31, 2023, approximately 99.9% of our debt investments were at floating rates. Based on our Consolidated Statement of Assets and Liabilities as of December 31, 2023, the following table shows the annualized impact on net income of hypothetical reference rate changes in interest rates (considering interest rate floors and ceilings for floating rate debt instruments assuming no changes in our investments and borrowing structure as of December 31, 2023) (dollar amounts in thousands):
|
|
|
|
|
|
|
|
|
|
|
|
|
|
|
|
|
|
|
|
|
|
|
Interest |
|
Interest |
|
Net |
| Basis Point Change - Interest Rates |
|
Income |
|
Expense |
|
Income |
| Up 300 basis points |
$ |
96,036 |
|
$ |
(24,068) |
|
$ |
71,968 |
|
| Up 200 basis points |
$ |
64,024 |
|
$ |
(16,045) |
|
$ |
47,979 |
|
| Up 100 basis points |
$ |
32,012 |
|
$ |
(8,023) |
|
$ |
23,989 |
|
| Up 25 basis points |
$ |
8,003 |
|
$ |
(2,006) |
|
$ |
5,997 |
|
| Down 25 basis points |
$ |
(8,003) |
|
$ |
2,006 |
|
$ |
(5,997) |
|
| Down 100 basis points |
$ |
(32,012) |
|
$ |
8,023 |
|
$ |
(23,989) |
|
| Down 200 basis points |
$ |
(64,024) |
|
$ |
16,045 |
|
$ |
(47,979) |
|
| Down 300 basis points |
$ |
(96,036) |
|
$ |
24,068 |
|
$ |
(71,968) |
|
We may hedge against interest rate fluctuations by using standard hedging instruments such as futures, options and forward contracts or our credit facilities, subject to the requirements of the 1940 Act and applicable commodities laws. While hedging activities may insulate us against adverse changes in interest rates, they may also limit our ability to participate in benefits of lower interest rates or higher exchange rates with respect to our portfolio of investments with fixed interest rates or investments denominated in foreign currencies. During the periods covered by this Report, we did not engage in interest rate hedging activities.
Item 8. Consolidated Financial Statements and Supplementary Data
Table of contents
REPORT OF INDEPENDENT REGISTERED PUBLIC ACCOUNTING FIRM
To the stockholders and the Board of Directors of Morgan Stanley Direct Lending Fund
Opinion on the Financial Statements and Financial Highlights
We have audited the accompanying consolidated statements of assets and liabilities of Morgan Stanley Direct Lending Fund and subsidiaries (the "Company"), including the consolidated schedules of investments, as of December 31, 2023 and 2022, the related consolidated statements of operations, changes in net assets and cash flows for each of the three years in the period then ended, the financial highlights for each of the four years in the period then ended, and the related notes (collectively referred to as the “consolidated financial statements and financial highlights”). In our opinion, the consolidated financial statements and financial highlights present fairly, in all material respects, the financial position of the Company as of December 31, 2023 and 2022, and the results of its operations, changes in net assets and cash flows for each of the three years in the period then ended, and the financial highlights for each of the four years in the period then ended in conformity with accounting principles generally accepted in the United States of America.
Basis for Opinion
These consolidated financial statements and financial highlights are the responsibility of the Company's management. Our responsibility is to express an opinion on the Company's consolidated financial statements and financial highlights based on our audits. We are a public accounting firm registered with the Public Company Accounting Oversight Board (United States) (PCAOB) and are required to be independent with respect to the Company in accordance with the U.S. federal securities laws and the applicable rules and regulations of the Securities and Exchange Commission and the PCAOB.
We conducted our audits in accordance with the standards of the PCAOB. Those standards require that we plan and perform the audit to obtain reasonable assurance about whether the consolidated financial statements and financial highlights are free of material misstatement, whether due to error or fraud. The Company is not required to have, nor were we engaged to perform, an audit of its internal control over financial reporting. As part of our audits, we are required to obtain an understanding of internal control over financial reporting but not for the purpose of expressing an opinion on the effectiveness of the Company’s internal control over financial reporting. Accordingly, we express no such opinion.
Our audits included performing procedures to assess the risks of material misstatement of the consolidated financial statements and financial highlights, whether due to error or fraud, and performing procedures that respond to those risks. Such procedures included examining, on a test basis, evidence regarding the amounts and disclosures in the consolidated financial statements and financial highlights. Our audits also included evaluating the accounting principles used and significant estimates made by management, as well as evaluating the overall presentation of the consolidated financial statements and financial highlights. Our procedures included confirmation of investments owned as of December 31, 2023 and 2022, by correspondence with the custodian, loan agents, and borrowers; when replies were not received, we performed other auditing procedures. We believe that our audits provide a reasonable basis for our opinion.
/s/Deloitte & Touche LLP
New York, NY
March 1, 2024
We have served as the Company's auditor since 2019.
Morgan Stanley Direct Lending Fund
Consolidated Statements of Assets and Liabilities
(In thousands, except share and per share amounts)
|
|
|
|
|
|
|
|
|
|
|
|
|
|
|
|
|
As of |
|
|
December 31, 2023 |
|
December 31, 2022 |
|
|
(Audited) |
|
(Audited) |
| Assets |
|
|
|
|
Non-controlled/non-affiliated investments, at fair value (amortized cost of $3,226,776 and $2,939,646) |
|
$ |
3,193,561 |
|
|
$ |
2,873,588 |
|
| Cash |
|
69,705 |
|
|
81,215 |
|
| Deferred financing costs |
|
14,317 |
|
|
7,624 |
|
|
|
|
|
|
| Interest and dividend receivable from non-controlled/non-affiliated investments |
|
28,884 |
|
|
20,911 |
|
| Subscription receivable |
|
41 |
|
|
2,556 |
|
| Receivable for investments sold/repaid |
|
173 |
|
|
188 |
|
| Prepaid expenses and other assets |
|
53 |
|
|
40 |
|
| Total assets |
|
3,306,734 |
|
|
2,986,122 |
|
|
|
|
|
|
| Liabilities |
|
|
|
|
Debt (net of unamortized debt issuance costs of $5,564 and $7,899) |
|
1,496,032 |
|
|
1,523,475 |
|
| Payable for investment purchased |
|
8 |
|
|
— |
|
| Payable to affiliates (Note 3) |
|
2,870 |
|
|
2,086 |
|
| Dividends payable |
|
49,968 |
|
|
33,058 |
|
| Management fees payable |
|
2,012 |
|
|
1,783 |
|
| Income based incentive fees payable |
|
11,766 |
|
|
8,118 |
|
|
|
|
|
|
| Interest payable |
|
18,823 |
|
|
17,019 |
|
| Accrued expenses and other liabilities |
|
4,104 |
|
|
3,278 |
|
| Total liabilities |
|
1,585,583 |
|
|
1,588,817 |
|
|
|
|
|
|
| Commitments and Contingencies (Note 7) |
|
|
|
|
|
|
|
|
|
| Net assets |
|
|
|
|
Preferred stock, $0.001 par value (1,000,000 shares authorized; no shares issued and outstanding) |
|
— |
|
|
— |
|
Common stock, par value $0.001 (100,000,000 shares authorized; 83,278,831 and 70,536,678 shares issued and outstanding) |
|
83 |
|
|
71 |
|
| Paid-in capital in excess of par value |
|
1,712,609 |
|
|
1,452,013 |
|
|
|
|
|
|
|
|
|
|
|
| Total distributable earnings (loss) |
|
8,459 |
|
|
(54,779) |
|
| Total net assets |
|
$ |
1,721,151 |
|
|
$ |
1,397,305 |
|
| Total liabilities and net assets |
|
$ |
3,306,734 |
|
|
$ |
2,986,122 |
|
| Net asset value per share |
|
$ |
20.67 |
|
|
$ |
19.81 |
|
The accompanying notes are an integral part of these audited consolidated financial statements
Morgan Stanley Direct Lending Fund
Consolidated Statements of Operations
(In thousands, except share and per share amounts)
|
|
|
|
|
|
|
|
|
|
|
|
|
|
|
|
|
|
|
|
|
|
|
For the Year Ended |
|
|
December 31, 2023 |
|
December 31, 2022 |
|
December 31, 2021 |
| Investment Income: |
|
|
|
|
|
|
| From non-controlled/non-affiliated investments: |
|
|
|
|
|
|
| Interest income |
|
$ |
355,530 |
|
|
$ |
223,119 |
|
|
$ |
108,277 |
|
| Payment-in-kind |
|
4,276 |
|
|
1,626 |
|
|
1,021 |
|
| Dividend income |
|
2,124 |
|
|
1,488 |
|
|
409 |
|
| Other income |
|
5,808 |
|
|
4,360 |
|
|
10,109 |
|
| Total investment income |
|
367,738 |
|
|
230,593 |
|
|
119,816 |
|
|
|
|
|
|
|
|
| Expenses: |
|
|
|
|
|
|
| Interest and other financing expenses |
|
112,883 |
|
|
67,182 |
|
|
21,015 |
|
| Management fees |
|
30,550 |
|
|
26,715 |
|
|
13,860 |
|
| Income based incentive fees |
|
42,012 |
|
|
26,635 |
|
|
15,852 |
|
| Capital gains incentive fees |
|
— |
|
|
(2,441) |
|
|
1,809 |
|
| Professional fees |
|
4,470 |
|
|
3,206 |
|
|
2,440 |
|
| Offering costs |
|
— |
|
|
— |
|
|
42 |
|
| Directors’ fees |
|
345 |
|
|
362 |
|
|
336 |
|
| Administrative service fees |
|
178 |
|
|
72 |
|
|
212 |
|
| General and other expenses |
|
633 |
|
|
510 |
|
|
1,538 |
|
| Total expenses |
|
191,071 |
|
|
122,241 |
|
|
57,104 |
|
| Expense support (Note 3) |
|
— |
|
|
44 |
|
|
98 |
|
| Management fees waiver (Note 3) |
|
(22,913) |
|
|
(20,036) |
|
|
(10,395) |
|
| Net expenses |
|
168,158 |
|
|
102,249 |
|
|
46,807 |
|
| Net investment income (loss) before taxes |
|
199,580 |
|
|
128,344 |
|
|
73,009 |
|
| Excise tax expense |
|
1,519 |
|
|
334 |
|
|
80 |
|
| Net investment income/(loss) after taxes |
|
198,061 |
|
|
128,010 |
|
|
72,929 |
|
|
|
|
|
|
|
|
| Net realized and unrealized gain (loss) on investment transactions: |
|
|
|
|
|
|
|
|
|
|
|
|
|
| Net realized gain (loss) on non-controlled/non-affiliated investments |
|
118 |
|
|
537 |
|
|
1,895 |
|
|
|
|
|
|
|
|
|
|
|
|
|
|
|
|
|
|
|
|
|
|
| Net change in unrealized appreciation (depreciation) on non-controlled/non-affiliated investments |
|
32,835 |
|
|
(80,005) |
|
|
8,431 |
|
|
|
|
|
|
|
|
|
|
|
|
|
|
|
| Net realized and unrealized gain (loss) |
|
32,953 |
|
|
(79,468) |
|
|
10,326 |
|
| Net increase (decrease) in net assets resulting from operations |
|
$ |
231,014 |
|
|
$ |
48,542 |
|
|
$ |
83,255 |
|
|
|
|
|
|
|
|
| Per share information—basic and diluted |
|
|
|
|
|
|
| Net investment income (loss) per share (basic and diluted) |
|
$ |
2.67 |
|
|
$ |
2.08 |
|
|
$ |
2.34 |
|
| Earnings (loss) per share (basic and diluted) |
|
$ |
3.11 |
|
|
$ |
0.79 |
|
|
$ |
2.67 |
|
| Weighted average shares outstanding |
|
74,239,743 |
|
|
61,676,363 |
|
|
31,159,302 |
|
The accompanying notes are an integral part of these audited consolidated financial statements
Morgan Stanley Direct Lending Fund
Consolidated Statements of Changes in Net Assets
(In thousands, except share and per share amount)
|
|
|
|
|
|
|
|
|
|
|
|
|
|
|
|
|
|
|
|
|
|
|
For the Year Ended |
|
|
December 31, 2023 |
|
December 31, 2022 |
|
December 31, 2021 |
| Net assets at beginning of period |
|
$ |
1,397,305 |
|
|
$ |
1,188,587 |
|
|
$ |
301,620 |
|
| Increase (decrease) in net assets resulting from operations: |
|
|
|
|
|
|
| Net investment income (loss) |
|
198,061 |
|
|
128,010 |
|
|
72,929 |
|
| Net realized gain (loss) |
|
118 |
|
|
537 |
|
|
1,895 |
|
| Net change in unrealized appreciation (depreciation) |
|
32,835 |
|
|
(80,005) |
|
|
8,431 |
|
| Net increase in net assets resulting from operations |
|
231,014 |
|
|
48,542 |
|
|
83,255 |
|
|
|
|
|
|
|
|
| Distributions to stockholders from: |
|
|
|
|
|
|
| Distributable earnings |
|
(169,291) |
|
|
(119,437) |
|
|
(72,315) |
|
| Total distributions to stockholders |
|
(169,291) |
|
|
(119,437) |
|
— |
|
(72,315) |
|
|
|
|
|
|
|
|
| Capital transactions: |
|
|
|
|
|
|
| Issuance of common stock |
|
220,238 |
|
|
249,291 |
|
|
862,455 |
|
| Reinvestment of dividends |
|
41,885 |
|
|
30,322 |
|
|
13,572 |
|
|
|
|
|
|
|
|
| Net increase (decrease) in net assets resulting from capital transactions |
|
262,123 |
|
|
279,613 |
|
|
876,027 |
|
| Total increase (decrease) in net assets |
|
323,846 |
|
|
208,718 |
|
|
886,967 |
|
| Net assets at end of period |
|
$ |
1,721,151 |
|
|
$ |
1,397,305 |
|
|
$ |
1,188,587 |
|
| Dividends per share |
|
$ |
2.27 |
|
|
$ |
1.92 |
|
|
$ |
2.07 |
|
The accompanying notes are an integral part of these audited consolidated financial statements
Morgan Stanley Direct Lending Fund
Consolidated Statements of Cash Flows
(In thousands)
|
|
|
|
|
|
|
|
|
|
|
|
|
|
|
|
|
|
|
|
|
|
|
For the Year Ended |
|
|
December 31, 2023 |
|
December 31, 2022 |
|
December 31, 2021 |
| Cash flows from operating activities: |
|
|
|
|
|
|
| Net increase (decrease) in net assets resulting from operations |
|
$ |
231,014 |
|
|
$ |
48,542 |
|
|
$ |
83,255 |
|
| Adjustments to reconcile net increase (decrease) in net assets resulting from operations to net cash provided by (used in) operating activities: |
|
|
|
|
|
|
| Net unrealized (appreciation) depreciation on investments |
|
(32,835) |
|
|
80,005 |
|
|
(8,431) |
|
|
|
|
|
|
|
|
| Net realized (gain) loss on investments |
|
(118) |
|
|
(537) |
|
|
(1,895) |
|
|
|
|
|
|
|
|
| Net accretion of discount and amortization of premium on investments |
|
(11,314) |
|
|
(11,418) |
|
|
(10,133) |
|
Payment-in-kind interest and dividend capitalized |
|
(6,069) |
|
|
(2,714) |
|
|
(1,179) |
|
| Amortization of deferred financing costs |
|
3,249 |
|
|
3,735 |
|
|
2,913 |
|
| Amortization of debt issuance costs and original issuance discount on Unsecured Notes |
|
2,548 |
|
|
1,551 |
|
|
— |
|
| Amortization of deferred offering costs |
|
— |
|
|
— |
|
|
24 |
|
| Purchases of investments and change in payable for investments purchased |
|
(632,097) |
|
|
(945,209) |
|
|
(2,113,463) |
|
| Proceeds from sale of investments and principal repayments and change in receivable for investments sold/repaid |
|
362,493 |
|
|
393,780 |
|
|
384,486 |
|
| Changes in operating assets and liabilities: |
|
|
|
|
|
|
(Increase) decrease in interest and dividend receivable from non-controlled/non-affiliated investments |
|
(7,973) |
|
|
(9,171) |
|
|
(9,460) |
|
|
|
|
|
|
|
|
| (Increase) decrease in prepaid expenses and other assets |
|
(13) |
|
|
228 |
|
|
(70) |
|
| (Decrease) increase in payable to affiliates |
|
784 |
|
|
(2,345) |
|
|
2,571 |
|
| (Decrease) increase in management fees payable |
|
229 |
|
|
477 |
|
|
1,011 |
|
| (Decrease) increase in incentive fees payable |
|
3,648 |
|
|
(541) |
|
|
5,770 |
|
| (Decrease) increase in interest payable |
|
1,804 |
|
|
13,738 |
|
|
2,127 |
|
| (Decrease) increase in accrued expenses and other liabilities |
|
826 |
|
|
44 |
|
|
1,186 |
|
| Net cash provided by (used in) operating activities |
|
(83,824) |
|
|
(429,835) |
|
|
(1,661,288) |
|
| Cash flows from financing activities: |
|
|
|
|
|
|
| Borrowings on debt |
|
408,000 |
|
|
1,566,175 |
|
|
1,514,000 |
|
| Repayments on debt |
|
(438,000) |
|
|
(1,284,850) |
|
|
(598,000) |
|
| Deferred financing costs paid |
|
(9,942) |
|
|
(4,006) |
|
|
(8,204) |
|
| Debt issuance costs paid |
|
— |
|
|
(9,259) |
|
|
— |
|
| Dividends paid in cash |
|
(110,497) |
|
|
(85,748) |
|
|
(38,217) |
|
| Proceeds from issuance of common stock |
|
222,753 |
|
|
254,585 |
|
|
854,605 |
|
| Offering costs paid |
|
— |
|
|
— |
|
|
(6) |
|
| Net cash provided by (used in) financing activities |
|
72,314 |
|
|
436,897 |
|
|
1,724,178 |
|
| Net increase (decrease) in cash |
|
(11,510) |
|
|
7,062 |
|
|
62,890 |
|
|
|
|
|
|
|
|
| Cash, beginning of period |
|
81,215 |
|
|
74,153 |
|
|
11,263 |
|
| Cash, end of period |
|
$ |
69,705 |
|
|
$ |
81,215 |
|
|
$ |
74,153 |
|
Morgan Stanley Direct Lending Fund
Consolidated Statements of Cash Flows
(In thousands)
|
|
|
|
|
|
|
|
|
|
|
|
|
|
|
|
|
|
|
|
|
| Supplemental information and non-cash activities: |
|
|
|
|
|
|
| Excise tax paid |
|
$ |
361 |
|
|
$ |
57 |
|
|
$ |
5 |
|
| Interest expense paid |
|
$ |
105,282 |
|
|
$ |
48,565 |
|
|
$ |
14,956 |
|
| Reinvestment of dividends |
|
$ |
41,885 |
|
|
$ |
30,322 |
|
|
$ |
13,572 |
|
| Subscriptions receivable |
|
$ |
41 |
|
|
$ |
2,556 |
|
|
$ |
7,850 |
|
| Dividends payable |
|
$ |
49,968 |
|
|
$ |
33,058 |
|
|
$ |
29,691 |
|
| Accrued but unpaid deferred financing costs |
|
$ |
— |
|
|
$ |
— |
|
|
$ |
1,487 |
|
|
|
|
|
|
|
|
The accompanying notes are an integral part of these audited consolidated financial statements
Morgan Stanley Direct Lending Fund
Consolidated Schedule of Investments
December 31, 2023
(In thousands)
|
|
|
|
|
|
|
|
|
|
|
|
|
|
|
|
|
|
|
|
|
|
|
|
|
|
|
|
|
|
|
|
|
|
|
|
|
|
|
|
|
|
|
|
|
|
|
|
|
|
|
|
|
|
|
|
|
|
|
|
|
|
Investments-non-controlled/non-affiliated(1)(2) |
|
Footnotes |
|
Reference Rate and Spread |
|
Interest Rate(3) |
|
|
|
Maturity Date |
|
Par Amount/ Shares |
|
Cost(4) |
|
Fair Value |
|
Percentage of Net Assets |
|
| First Lien Debt |
|
|
|
|
|
|
|
|
|
|
|
|
|
|
|
|
|
|
|
|
|
| Aerospace & Defense |
|
|
|
|
|
|
|
|
|
|
|
|
|
|
|
|
|
|
|
|
|
| Jonathan Acquisition Company |
|
(5) (7) |
|
S + |
|
5.00% |
|
10.45% |
|
|
|
12/22/2026 |
|
2,684 |
|
|
$ |
2,641 |
|
|
$ |
2,659 |
|
|
0.15 |
|
% |
| Mantech International CP |
|
(5) (8) |
|
S + |
|
5.75% |
|
11.13% |
|
|
|
9/14/2029 |
|
355 |
|
|
349 |
|
|
355 |
|
|
0.02 |
|
|
| Mantech International CP |
|
(5) (8) (13) |
|
S + |
|
5.75% |
|
11.13% |
|
|
|
9/14/2029 |
|
31 |
|
|
30 |
|
|
31 |
|
|
— |
|
|
| Mantech International CP |
|
(5) (8) (13) |
|
S + |
|
5.75% |
|
11.13% |
|
|
|
9/14/2028 |
|
— |
|
|
(1) |
|
|
— |
|
|
— |
|
|
| PCX Holding Corp. |
|
(5) (6) (7) |
|
S + |
|
6.25% |
|
11.75% |
|
|
|
4/22/2027 |
|
18,047 |
|
|
17,936 |
|
|
17,944 |
|
|
1.04 |
|
|
| PCX Holding Corp. |
|
(5) (7) |
|
S + |
|
6.25% |
|
11.75% |
|
|
|
4/22/2027 |
|
18,172 |
|
|
17,937 |
|
|
18,068 |
|
|
1.05 |
|
|
| PCX Holding Corp. |
|
(5) (7) (13) |
|
S + |
|
6.25% |
|
11.75% |
|
|
|
4/22/2027 |
|
864 |
|
|
854 |
|
|
853 |
|
|
0.05 |
|
|
| Two Six Labs, LLC |
|
(5) (6) (8) |
|
S + |
|
5.50% |
|
10.85% |
|
|
|
8/20/2027 |
|
25,894 |
|
|
25,465 |
|
|
25,366 |
|
|
1.47 |
|
|
| Two Six Labs, LLC |
|
(5) (8) |
|
S + |
|
5.50% |
|
10.85% |
|
|
|
8/20/2027 |
|
4,231 |
|
|
4,169 |
|
|
4,136 |
|
|
0.24 |
|
|
| Two Six Labs, LLC |
|
(5) (8) (13) |
|
S + |
|
5.50% |
|
10.85% |
|
|
|
8/20/2027 |
|
— |
|
|
(26) |
|
|
(48) |
|
|
— |
|
|
|
|
|
|
|
|
|
|
|
|
|
|
|
|
|
|
69,354 |
|
|
69,364 |
|
|
4.03 |
|
|
| Air Freight & Logistics |
|
|
|
|
|
|
|
|
|
|
|
|
|
|
|
|
|
|
|
|
|
| AGI-CFI Holdings, Inc. |
|
(5) (8) |
|
S + |
|
5.75% |
|
11.18% |
|
|
|
6/11/2027 |
|
14,263 |
|
|
14,048 |
|
|
14,159 |
|
|
0.82 |
|
|
| Omni Intermediate Holdings, LLC |
|
(5) (7) |
|
S + |
|
5.00% |
|
10.54% |
|
|
|
12/30/2026 |
|
12,410 |
|
|
12,324 |
|
|
11,824 |
|
|
0.69 |
|
|
| Omni Intermediate Holdings, LLC |
|
(5) (7) (13) |
|
S + |
|
5.00% |
|
10.54% |
|
|
|
12/30/2026 |
|
1,263 |
|
|
1,247 |
|
|
1,196 |
|
|
0.07 |
|
|
| Omni Intermediate Holdings, LLC |
|
(5) (7) (13) |
|
P + |
|
4.00% |
|
12.50% |
|
|
|
12/30/2025 |
|
832 |
|
|
826 |
|
|
781 |
|
|
0.05 |
|
|
| RoadOne IntermodaLogistics |
|
(5) (7) |
|
S + |
|
6.25% |
|
11.61% |
|
|
|
12/29/2028 |
|
1,655 |
|
|
1,612 |
|
|
1,626 |
|
|
0.09 |
|
|
| RoadOne IntermodaLogistics |
|
(5) (7) (13) |
|
S + |
|
6.25% |
|
11.61% |
|
|
|
12/29/2028 |
|
152 |
|
|
144 |
|
|
144 |
|
|
0.01 |
|
|
| RoadOne IntermodaLogistics |
|
(5) (7) (13) |
|
S + |
|
6.25% |
|
11.61% |
|
|
|
12/29/2028 |
|
20 |
|
|
12 |
|
|
14 |
|
|
— |
|
|
|
|
|
|
|
|
|
|
|
|
|
|
|
|
|
|
30,213 |
|
|
29,744 |
|
|
1.73 |
|
|
| Automobile Components |
|
|
|
|
|
|
|
|
|
|
|
|
|
|
|
|
|
|
|
|
|
| Continental Battery Company |
|
(5) (7) |
|
S + |
|
6.75% (incl. 4.08% PIK) |
|
12.34% |
|
|
|
1/20/2027 |
|
6,204 |
|
|
6,121 |
|
|
5,165 |
|
|
0.30 |
|
|
| Randy's Holdings, Inc. |
|
(5) (7) |
|
S + |
|
6.50% |
|
11.87% |
|
|
|
11/1/2028 |
|
6,676 |
|
|
6,505 |
|
|
6,653 |
|
|
0.39 |
|
|
| Randy's Holdings, Inc. |
|
(5) (7) (13) |
|
S + |
|
6.50% |
|
11.87% |
|
|
|
11/1/2028 |
|
— |
|
|
(27) |
|
|
(8) |
|
|
— |
|
|
| Randy's Holdings, Inc. |
|
(5) (7) (13) |
|
S + |
|
6.50% |
|
11.87% |
|
|
|
11/1/2028 |
|
260 |
|
|
238 |
|
|
257 |
|
|
0.01 |
|
|
| Sonny's Enterprises, LLC |
|
(5) (6) (7) |
|
S + |
|
6.75% |
|
12.28% |
|
|
|
8/5/2028 |
|
46,018 |
|
|
45,462 |
|
|
46,018 |
|
|
2.67 |
|
|
| Spectrum Automotive Holdings Corp. |
|
(5) (6) (8) |
|
S + |
|
5.75% |
|
11.22% |
|
|
|
6/29/2028 |
|
23,410 |
|
|
23,162 |
|
|
22,888 |
|
|
1.33 |
|
|
| Spectrum Automotive Holdings Corp. |
|
(5) (8) (13) |
|
S + |
|
5.75% |
|
11.22% |
|
|
|
6/29/2028 |
|
5,366 |
|
|
5,301 |
|
|
5,220 |
|
|
0.30 |
|
|
| Spectrum Automotive Holdings Corp. |
|
(5) (8) (13) |
|
S + |
|
5.75% |
|
11.22% |
|
|
|
6/29/2027 |
|
— |
|
|
(8) |
|
|
(20) |
|
|
— |
|
|
|
|
|
|
|
|
|
|
|
|
|
|
|
|
|
|
86,754 |
|
|
86,173 |
|
|
5.01 |
|
|
| Automobiles |
|
|
|
|
|
|
|
|
|
|
|
|
|
|
|
|
|
|
|
|
|
| ARI Network Services, Inc. |
|
(5) (6) (8) |
|
S + |
|
5.25% |
|
10.60% |
|
|
|
2/28/2025 |
|
20,512 |
|
|
20,369 |
|
|
20,315 |
|
|
1.18 |
|
|
| ARI Network Services, Inc. |
|
(5) (6) (8) |
|
S + |
|
5.25% |
|
10.60% |
|
|
|
2/28/2025 |
|
3,594 |
|
|
3,569 |
|
|
3,559 |
|
|
0.21 |
|
|
| ARI Network Services, Inc. |
|
(5) (8) (13) |
|
S + |
|
5.25% |
|
10.60% |
|
|
|
2/28/2025 |
|
— |
|
|
(19) |
|
|
(29) |
|
|
— |
|
|
Morgan Stanley Direct Lending Fund
Consolidated Schedule of Investments
December 31, 2023
(In thousands)
|
|
|
|
|
|
|
|
|
|
|
|
|
|
|
|
|
|
|
|
|
|
|
|
|
|
|
|
|
|
|
|
|
|
|
|
|
|
|
|
|
|
|
|
|
|
|
|
|
|
|
|
|
|
|
|
|
|
|
|
|
|
Investments-non-controlled/non-affiliated(1)(2) |
|
Footnotes |
|
Reference Rate and Spread |
|
Interest Rate(3) |
|
|
|
Maturity Date |
|
Par Amount/ Shares |
|
Cost(4) |
|
Fair Value |
|
Percentage of Net Assets |
|
| Summit Buyer, LLC |
|
(5) (7) |
|
S + |
|
5.75% |
|
11.26% |
|
|
|
1/14/2026 |
|
21,896 |
|
|
$ |
21,670 |
|
|
$ |
21,370 |
|
|
1.24 |
|
% |
| Summit Buyer, LLC |
|
(5) (7) (13) |
|
S + |
|
5.75% |
|
11.26% |
|
|
|
1/14/2026 |
|
32,011 |
|
|
31,671 |
|
|
31,239 |
|
|
1.82 |
|
|
| Summit Buyer, LLC |
|
(5) (13) |
|
P + |
|
4.75% |
|
13.25% |
|
|
|
1/14/2026 |
|
— |
|
|
(22) |
|
|
(59) |
|
|
— |
|
|
| Turbo Buyer, Inc. |
|
(5) (7) |
|
S + |
|
6.00% |
|
11.50% |
|
|
|
12/2/2025 |
|
37,555 |
|
|
37,197 |
|
|
37,202 |
|
|
2.16 |
|
|
| Turbo Buyer, Inc. |
|
(5) (7) |
|
S + |
|
6.00% |
|
11.50% |
|
|
|
12/2/2025 |
|
37,738 |
|
|
37,306 |
|
|
37,383 |
|
|
2.17 |
|
|
|
|
|
|
|
|
|
|
|
|
|
|
|
|
|
|
151,741 |
|
|
150,980 |
|
|
8.77 |
|
|
| Biotechnology |
|
|
|
|
|
|
|
|
|
|
|
|
|
|
|
|
|
|
|
|
|
| GraphPad Software, LLC |
|
(5) (6) (7) |
|
S + |
|
5.50% |
|
11.20% |
|
|
|
4/27/2027 |
|
14,807 |
|
|
14,714 |
|
|
14,751 |
|
|
0.86 |
|
|
| GraphPad Software, LLC |
|
(5) (6) (13) |
|
P + |
|
5.00% |
|
13.50% |
|
|
|
4/27/2027 |
|
875 |
|
|
866 |
|
|
868 |
|
|
0.05 |
|
|
|
|
|
|
|
|
|
|
|
|
|
|
|
|
|
|
15,580 |
|
|
15,619 |
|
|
0.91 |
|
|
| Chemicals |
|
|
|
|
|
|
|
|
|
|
|
|
|
|
|
|
|
|
|
|
|
| Tank Holding Corp. |
|
(5) (6) (8) |
|
S + |
|
5.75% |
|
11.21% |
|
|
|
3/31/2028 |
|
15,713 |
|
|
15,452 |
|
|
15,050 |
|
|
0.87 |
|
|
| Tank Holding Corp. |
|
(5) (8) (13) |
|
S + |
|
5.75% |
|
11.21% |
|
|
|
3/31/2028 |
|
250 |
|
|
237 |
|
|
236 |
|
|
0.01 |
|
|
| Tank Holding Corp. |
|
(8) (13) |
|
S + |
|
5.75% |
|
11.21% |
|
|
|
3/31/2028 |
|
213 |
|
|
202 |
|
|
177 |
|
|
0.01 |
|
|
| V Global Holdings, LLC |
|
(5) (6) (8) |
|
S + |
|
5.75% |
|
11.21% |
|
|
|
12/22/2027 |
|
4,854 |
|
|
4,780 |
|
|
4,756 |
|
|
0.28 |
|
|
| V Global Holdings, LLC |
|
(5) (8) (13) |
|
S + |
|
5.75% |
|
11.21% |
|
|
|
12/22/2025 |
|
276 |
|
|
269 |
|
|
262 |
|
|
0.02 |
|
|
|
|
|
|
|
|
|
|
|
|
|
|
|
|
|
|
20,940 |
|
|
20,481 |
|
|
1.19 |
|
|
| Commercial Services & Supplies |
|
|
|
|
|
|
|
|
|
|
|
|
|
|
|
|
|
|
|
|
|
| 365 Retail Markets, LLC |
|
(5) (7) |
|
S + |
|
4.75% |
|
10.30% |
|
|
|
12/23/2026 |
|
17,105 |
|
|
16,922 |
|
|
17,105 |
|
|
0.99 |
|
|
| 365 Retail Markets, LLC |
|
(5) (7) |
|
S + |
|
4.75% |
|
10.30% |
|
|
|
12/23/2026 |
|
5,488 |
|
|
5,442 |
|
|
5,488 |
|
|
0.32 |
|
|
| 365 Retail Markets, LLC |
|
(5) (7) (13) |
|
S + |
|
4.75% |
|
10.30% |
|
|
|
12/23/2026 |
|
— |
|
|
(27) |
|
|
— |
|
|
— |
|
|
| Atlas Us Finco, Inc. |
|
(5) (7) (10) |
|
S + |
|
7.25% |
|
12.51% |
|
|
|
12/9/2029 |
|
2,009 |
|
|
1,955 |
|
|
2,009 |
|
|
0.12 |
|
|
| Atlas Us Finco, Inc. |
|
(5) (7) (10) (13) |
|
S + |
|
7.25% |
|
12.51% |
|
|
|
12/9/2028 |
|
— |
|
|
(5) |
|
|
— |
|
|
— |
|
|
| BPG Holdings IV Corp. |
|
(5) (8) |
|
S + |
|
6.00% |
|
11.36% |
|
|
|
7/29/2029 |
|
11,647 |
|
|
10,972 |
|
|
11,374 |
|
|
0.66 |
|
|
| Encore Holdings, LLC |
|
(5) (8) |
|
S + |
|
4.50% |
|
10.45% |
|
|
|
11/23/2028 |
|
1,831 |
|
|
1,807 |
|
|
1,831 |
|
|
0.11 |
|
|
| Encore Holdings, LLC |
|
(5) (8) |
|
S + |
|
4.50% |
|
10.45% |
|
|
|
11/23/2028 |
|
3,561 |
|
|
3,511 |
|
|
3,561 |
|
|
0.21 |
|
|
| Encore Holdings, LLC |
|
(5) (8) (13) |
|
S + |
|
4.50% |
|
10.45% |
|
|
|
11/23/2027 |
|
— |
|
|
(6) |
|
|
— |
|
|
— |
|
|
| Energy Labs Holdings Corp. |
|
(5) (7) |
|
S + |
|
5.25% |
|
10.71% |
|
|
|
4/7/2028 |
|
384 |
|
|
379 |
|
|
379 |
|
|
0.02 |
|
|
| Energy Labs Holdings Corp. |
|
(5) (7) |
|
S + |
|
5.25% |
|
10.71% |
|
|
|
4/7/2028 |
|
36 |
|
|
36 |
|
|
36 |
|
|
— |
|
|
| Energy Labs Holdings Corp. |
|
(5) (7) (13) |
|
S + |
|
5.25% |
|
10.71% |
|
|
|
4/7/2028 |
|
24 |
|
|
23 |
|
|
23 |
|
|
— |
|
|
| FLS Holding, Inc. |
|
(5) (7) (10) |
|
S + |
|
5.25% |
|
10.77% |
|
|
|
12/15/2028 |
|
19,025 |
|
|
18,733 |
|
|
18,911 |
|
|
1.10 |
|
|
| FLS Holding, Inc. |
|
(5) (7) (10) |
|
S + |
|
5.25% |
|
10.77% |
|
|
|
12/15/2028 |
|
4,461 |
|
|
4,390 |
|
|
4,434 |
|
|
0.26 |
|
|
| FLS Holding, Inc. |
|
(5) (7) (10) (13) |
|
S + |
|
5.25% |
|
10.77% |
|
|
|
12/17/2027 |
|
— |
|
|
(24) |
|
|
(11) |
|
|
— |
|
|
| Helios Service Partners, LLC |
|
(5) (7) |
|
S + |
|
6.25% |
|
11.88% |
|
|
|
3/19/2027 |
|
6,859 |
|
|
6,703 |
|
|
6,790 |
|
|
0.39 |
|
|
| Helios Service Partners, LLC |
|
(5) (7) (13) |
|
S + |
|
6.25% |
|
11.88% |
|
|
|
3/19/2027 |
|
6,965 |
|
|
6,737 |
|
|
6,836 |
|
|
0.40 |
|
|
| Helios Service Partners, LLC |
|
(5) (7) (13) |
|
S + |
|
6.00% |
|
11.62% |
|
|
|
3/19/2027 |
|
748 |
|
|
719 |
|
|
735 |
|
|
0.04 |
|
|
| Iris Buyer, LLC |
|
(5) (7) |
|
S + |
|
6.25% |
|
11.60% |
|
|
|
10/2/2030 |
|
7,008 |
|
|
6,820 |
|
|
6,820 |
|
|
0.40 |
|
|
Morgan Stanley Direct Lending Fund
Consolidated Schedule of Investments
December 31, 2023
(In thousands)
|
|
|
|
|
|
|
|
|
|
|
|
|
|
|
|
|
|
|
|
|
|
|
|
|
|
|
|
|
|
|
|
|
|
|
|
|
|
|
|
|
|
|
|
|
|
|
|
|
|
|
|
|
|
|
|
|
|
|
|
|
|
Investments-non-controlled/non-affiliated(1)(2) |
|
Footnotes |
|
Reference Rate and Spread |
|
Interest Rate(3) |
|
|
|
Maturity Date |
|
Par Amount/ Shares |
|
Cost(4) |
|
Fair Value |
|
Percentage of Net Assets |
|
| Iris Buyer, LLC |
|
(5) (7) (13) |
|
S + |
|
6.25% |
|
11.60% |
|
|
|
10/2/2030 |
|
145 |
|
|
$ |
130 |
|
|
$ |
130 |
|
|
0.01 |
|
% |
| Iris Buyer, LLC |
|
(5) (7) (13) |
|
S + |
|
6.25% |
|
11.60% |
|
|
|
10/2/2029 |
|
— |
|
|
(26) |
|
|
(26) |
|
|
— |
|
|
| Atlas Us Finco, Inc. |
|
(5) (10) |
|
S + |
|
7.25% |
|
12.51% |
|
|
|
12/9/2029 |
|
6,984 |
|
|
6,845 |
|
|
6,845 |
|
|
0.40 |
|
|
| PDFTron Systems, Inc. |
|
(5) (6) (7) (10) |
|
S + |
|
5.50% |
|
10.86% |
|
|
|
7/15/2027 |
|
30,030 |
|
|
29,694 |
|
|
29,550 |
|
|
1.72 |
|
|
| PDFTron Systems, Inc. |
|
(5) (7) (10) |
|
S + |
|
5.50% |
|
10.86% |
|
|
|
7/15/2027 |
|
9,727 |
|
|
9,595 |
|
|
9,571 |
|
|
0.56 |
|
|
| PDFTron Systems, Inc. |
|
(5) (7) (10) (13) |
|
S + |
|
5.50% |
|
10.86% |
|
|
|
7/15/2026 |
|
3,850 |
|
|
3,772 |
|
|
3,727 |
|
|
0.22 |
|
|
| Procure Acquireco, Inc. (Procure Analytics) |
|
(5) (8) |
|
S + |
|
5.00% |
|
10.54% |
|
|
|
12/20/2028 |
|
3,889 |
|
|
3,829 |
|
|
3,773 |
|
|
0.22 |
|
|
| Procure Acquireco, Inc. (Procure Analytics) |
|
(5) (8) |
|
S + |
|
5.00% |
|
10.54% |
|
|
|
12/20/2028 |
|
192 |
|
|
189 |
|
|
186 |
|
|
0.01 |
|
|
| Procure Acquireco, Inc. (Procure Analytics) |
|
(5) (8) (13) |
|
S + |
|
5.00% |
|
10.54% |
|
|
|
12/20/2028 |
|
— |
|
|
(3) |
|
|
(7) |
|
|
— |
|
|
| Sherlock Buyer Corp. |
|
(5) (7) |
|
S + |
|
5.75% |
|
11.20% |
|
|
|
12/8/2028 |
|
10,950 |
|
|
10,782 |
|
|
10,943 |
|
|
0.64 |
|
|
| Sherlock Buyer Corp. |
|
(5) (7) (13) |
|
S + |
|
5.75% |
|
11.20% |
|
|
|
12/8/2028 |
|
— |
|
|
(23) |
|
|
(2) |
|
|
— |
|
|
| Sherlock Buyer Corp. |
|
(5) (7) (13) |
|
S + |
|
5.75% |
|
11.20% |
|
|
|
12/8/2027 |
|
— |
|
|
(17) |
|
|
(1) |
|
|
— |
|
|
| Surewerx Purchaser III, Inc. |
|
(5) (8) (10) |
|
S + |
|
6.75% |
|
12.10% |
|
|
|
12/28/2029 |
|
5,447 |
|
|
5,300 |
|
|
5,447 |
|
|
0.32 |
|
|
| Surewerx Purchaser III, Inc. |
|
(5) (8) (10) (13) |
|
S + |
|
6.75% |
|
12.10% |
|
|
|
12/28/2029 |
|
— |
|
|
(19) |
|
|
— |
|
|
— |
|
|
| Surewerx Purchaser III, Inc. |
|
(5) (8) (10) (13) |
|
S + |
|
6.75% |
|
12.10% |
|
|
|
12/28/2028 |
|
574 |
|
|
547 |
|
|
574 |
|
|
0.03 |
|
|
| Sweep Purchaser, LLC |
|
(5) (7) |
|
S + |
|
5.75% |
|
11.23% |
|
|
|
11/30/2026 |
|
8,616 |
|
|
8,522 |
|
|
6,878 |
|
|
0.40 |
|
|
| Sweep Purchaser, LLC |
|
(5) (7) (13) |
|
S + |
|
5.75% |
|
11.23% |
|
|
|
11/30/2026 |
|
5,873 |
|
|
5,803 |
|
|
4,634 |
|
|
0.27 |
|
|
| Sweep Purchaser, LLC |
|
(5) (7) (13) |
|
S + |
|
5.75% |
|
11.23% |
|
|
|
11/30/2026 |
|
1,378 |
|
|
1,364 |
|
|
1,094 |
|
|
0.06 |
|
|
| Tamarack Intermediate, LLC |
|
(5) (8) |
|
S + |
|
5.75% |
|
11.28% |
|
|
|
3/13/2028 |
|
5,548 |
|
|
5,462 |
|
|
5,415 |
|
|
0.31 |
|
|
| Tamarack Intermediate, LLC |
|
(5) (8) (13) |
|
S + |
|
5.75% |
|
11.28% |
|
|
|
3/13/2028 |
|
202 |
|
|
192 |
|
|
192 |
|
|
0.01 |
|
|
| Tamarack Intermediate, LLC |
|
(5) (8) (13) |
|
S + |
|
5.75% |
|
11.28% |
|
|
|
3/13/2028 |
|
— |
|
|
(13) |
|
|
(22) |
|
|
— |
|
|
| United Flow Technologies Intermediate Holdco II, LLC |
|
(5) (7) |
|
S + |
|
5.75% |
|
11.28% |
|
|
|
10/29/2027 |
|
16,801 |
|
|
16,566 |
|
|
16,577 |
|
|
0.96 |
|
|
| United Flow Technologies Intermediate Holdco II, LLC |
|
(5) (7) (13) |
|
S + |
|
5.75% |
|
11.28% |
|
|
|
10/29/2027 |
|
19,651 |
|
|
19,349 |
|
|
19,390 |
|
|
1.13 |
|
|
| United Flow Technologies Intermediate Holdco II, LLC |
|
(5) (7) (13) |
|
S + |
|
5.75% |
|
11.28% |
|
|
|
10/29/2026 |
|
1,845 |
|
|
1,811 |
|
|
1,805 |
|
|
0.10 |
|
|
| US Infra Svcs Buyer, LLC |
|
(5) (6) (7) |
|
S + |
|
7.25% (incl. 0.50% PIK) |
|
12.33% |
|
|
|
4/13/2026 |
|
14,973 |
|
|
14,842 |
|
|
14,193 |
|
|
0.82 |
|
|
| US Infra Svcs Buyer, LLC |
|
(5) (6) (7) |
|
S + |
|
7.25% (incl. 0.50% PIK) |
|
12.33% |
|
|
|
4/13/2026 |
|
2,113 |
|
|
2,095 |
|
|
2,003 |
|
|
0.12 |
|
|
| US Infra Svcs Buyer, LLC |
|
(5) (7) |
|
S + |
|
7.25% (incl. 0.50% PIK) |
|
12.33% |
|
|
|
4/13/2026 |
|
2,250 |
|
|
2,233 |
|
|
2,133 |
|
|
0.12 |
|
|
| Vensure Employer Services, Inc. |
|
(5) (8) (13) |
|
S + |
|
5.25% |
|
10.63% |
|
|
|
4/1/2027 |
|
328 |
|
|
306 |
|
|
306 |
|
|
0.02 |
|
|
| VRC Companies, LLC |
|
(5) (6) (7) |
|
S + |
|
5.75% |
|
11.12% |
|
|
|
6/29/2027 |
|
63,939 |
|
|
63,310 |
|
|
63,856 |
|
|
3.71 |
|
|
| VRC Companies, LLC |
|
(5) (7) |
|
S + |
|
5.75% |
|
11.12% |
|
|
|
6/29/2027 |
|
9,063 |
|
|
8,966 |
|
|
9,051 |
|
|
0.53 |
|
|
| VRC Companies, LLC |
|
(5) (7) (13) |
|
S + |
|
5.75% |
|
11.12% |
|
|
|
6/29/2027 |
|
— |
|
|
(15) |
|
|
(2) |
|
|
— |
|
|
|
|
|
|
|
|
|
|
|
|
|
|
|
|
|
|
306,475 |
|
|
304,534 |
|
|
17.69 |
|
|
| Construction & Engineering |
|
|
|
|
|
|
|
|
|
|
|
|
|
|
|
|
|
|
|
|
|
| KPSKY Acquisition, Inc. |
|
(5) (8) |
|
S + |
|
5.25% |
|
10.74% |
|
|
|
10/19/2028 |
|
33,864 |
|
|
33,358 |
|
|
33,085 |
|
|
1.92 |
|
|
Morgan Stanley Direct Lending Fund
Consolidated Schedule of Investments
December 31, 2023
(In thousands)
|
|
|
|
|
|
|
|
|
|
|
|
|
|
|
|
|
|
|
|
|
|
|
|
|
|
|
|
|
|
|
|
|
|
|
|
|
|
|
|
|
|
|
|
|
|
|
|
|
|
|
|
|
|
|
|
|
|
|
|
|
|
Investments-non-controlled/non-affiliated(1)(2) |
|
Footnotes |
|
Reference Rate and Spread |
|
Interest Rate(3) |
|
|
|
Maturity Date |
|
Par Amount/ Shares |
|
Cost(4) |
|
Fair Value |
|
Percentage of Net Assets |
|
| KPSKY Acquisition, Inc. |
|
(5) (8) |
|
S + |
|
5.25% |
|
10.74% |
|
|
|
10/19/2028 |
|
7,754 |
|
|
$ |
7,630 |
|
|
$ |
7,576 |
|
|
0.44 |
|
% |
| LJ Avalon Holdings, LLC |
|
(5) (7) |
|
S + |
|
6.50% |
|
12.04% |
|
|
|
2/1/2030 |
|
4,131 |
|
|
4,019 |
|
|
4,036 |
|
|
0.23 |
|
|
| LJ Avalon Holdings, LLC |
|
(5) (7) (13) |
|
S + |
|
6.50% |
|
12.04% |
|
|
|
2/1/2030 |
|
658 |
|
|
626 |
|
|
619 |
|
|
0.04 |
|
|
| LJ Avalon Holdings, LLC |
|
(5) (7) (13) |
|
S + |
|
6.50% |
|
12.04% |
|
|
|
2/1/2029 |
|
— |
|
|
(17) |
|
|
(15) |
|
|
— |
|
|
| Superman Holdings, LLC |
|
(5) (7) |
|
S + |
|
6.13% |
|
11.47% |
|
|
|
8/31/2027 |
|
1,601 |
|
|
1,566 |
|
|
1,581 |
|
|
0.09 |
|
|
| Superman Holdings, LLC |
|
(5) (7) (13) |
|
S + |
|
6.13% |
|
11.47% |
|
|
|
8/31/2027 |
|
— |
|
|
(4) |
|
|
(5) |
|
|
— |
|
|
|
|
|
|
|
|
|
|
|
|
|
|
|
|
|
|
47,178 |
|
|
46,877 |
|
|
2.72 |
|
|
| Containers & Packaging |
|
|
|
|
|
|
|
|
|
|
|
|
|
|
|
|
|
|
|
|
|
| BP Purchaser, LLC |
|
(5) (8) |
|
S + |
|
5.50% |
|
10.95% |
|
|
|
12/11/2028 |
|
17,161 |
|
|
16,898 |
|
|
16,677 |
|
|
0.97 |
|
|
| FORTIS Solutions Group, LLC |
|
(5) (8) |
|
S + |
|
5.50% |
|
10.95% |
|
|
|
10/15/2028 |
|
26,772 |
|
|
26,371 |
|
|
26,772 |
|
|
1.56 |
|
|
| FORTIS Solutions Group, LLC |
|
(5) (8) (13) |
|
S + |
|
5.50% |
|
10.95% |
|
|
|
10/15/2028 |
|
104 |
|
|
96 |
|
|
104 |
|
|
0.01 |
|
|
| FORTIS Solutions Group, LLC |
|
(5) (8) (13) |
|
S + |
|
5.50% |
|
10.95% |
|
|
|
10/15/2027 |
|
135 |
|
|
101 |
|
|
135 |
|
|
0.01 |
|
|
|
|
|
|
|
|
|
|
|
|
|
|
|
|
|
|
43,466 |
|
|
43,688 |
|
|
2.54 |
|
|
| Distributors |
|
|
|
|
|
|
|
|
|
|
|
|
|
|
|
|
|
|
|
|
|
| 48Forty Solutions, LLC |
|
(5) (6) (7) |
|
S + |
|
6.00% |
|
11.44% |
|
|
|
11/30/2026 |
|
17,722 |
|
|
17,455 |
|
|
16,618 |
|
|
0.97 |
|
|
| 48Forty Solutions, LLC |
|
(5) (13) |
|
P + |
|
5.00% |
|
13.50% |
|
|
|
11/30/2026 |
|
1,629 |
|
|
1,594 |
|
|
1,459 |
|
|
0.08 |
|
|
| ABB Concise Optical Group, LLC |
|
(5) (8) |
|
S + |
|
7.50% |
|
13.01% |
|
|
|
2/23/2028 |
|
17,008 |
|
|
16,685 |
|
|
14,653 |
|
|
0.85 |
|
|
| Avalara, Inc. |
|
(5) (8) |
|
S + |
|
7.25% |
|
12.60% |
|
|
|
10/19/2028 |
|
11,302 |
|
|
11,070 |
|
|
11,302 |
|
|
0.66 |
|
|
| Avalara, Inc. |
|
(5) (8) (13) |
|
S + |
|
7.25% |
|
12.60% |
|
|
|
10/19/2028 |
|
— |
|
|
(22) |
|
|
— |
|
|
— |
|
|
| Bradyifs Holdings, LLC |
|
(5) (6) (7) |
|
S + |
|
6.00% |
|
11.38% |
|
|
|
10/31/2029 |
|
7,444 |
|
|
7,298 |
|
|
7,298 |
|
|
0.42 |
|
|
| Bradyifs Holdings, LLC |
|
(5) (7) (13) |
|
S + |
|
6.00% |
|
11.38% |
|
|
|
10/31/2029 |
|
201 |
|
|
191 |
|
|
191 |
|
|
0.01 |
|
|
| Bradyifs Holdings, LLC |
|
(5) (7) (13) |
|
S + |
|
6.00% |
|
11.38% |
|
|
|
10/31/2029 |
|
— |
|
|
(12) |
|
|
(12) |
|
|
— |
|
|
| PT Intermediate Holdings III, LLC |
|
(5) (8) |
|
S + |
|
5.98% |
|
11.47% |
|
|
|
11/1/2028 |
|
28,342 |
|
|
28,128 |
|
|
27,257 |
|
|
1.58 |
|
|
| PT Intermediate Holdings III, LLC |
|
(5) (8) |
|
S + |
|
5.98% |
|
11.47% |
|
|
|
11/1/2028 |
|
15,768 |
|
|
15,646 |
|
|
15,164 |
|
|
0.88 |
|
|
|
|
|
|
|
|
|
|
|
|
|
|
|
|
|
|
98,033 |
|
|
93,930 |
|
|
5.46 |
|
|
| Diversified Consumer Services |
|
|
|
|
|
|
|
|
|
|
|
|
|
|
|
|
|
|
|
|
|
| Apex Service Partners, LLC |
|
(5) (6) (7) |
|
S + |
|
7.00% (incl. 2.00% PIK) |
|
12.38% |
|
|
|
10/24/2030 |
|
31,834 |
|
|
31,235 |
|
|
31,235 |
|
|
1.81 |
|
|
| Apex Service Partners, LLC |
|
(5) (7) (13) |
|
S + |
|
7.00% (incl. 2.00% PIK) |
|
12.38% |
|
|
|
10/24/2030 |
|
1,692 |
|
|
1,598 |
|
|
1,598 |
|
|
0.09 |
|
|
| Apex Service Partners, LLC |
|
(5) (7) (13) |
|
S + |
|
7.00% (incl. 2.00% PIK) |
|
12.38% |
|
|
|
10/24/2029 |
|
203 |
|
|
156 |
|
|
156 |
|
|
0.01 |
|
|
| Assembly Intermediate, LLC |
|
(5) (7) |
|
S + |
|
6.00% |
|
11.45% |
|
|
|
10/19/2027 |
|
20,741 |
|
|
20,451 |
|
|
19,961 |
|
|
1.16 |
|
|
| Assembly Intermediate, LLC |
|
(5) (7) (13) |
|
S + |
|
6.00% |
|
11.45% |
|
|
|
10/19/2027 |
|
3,630 |
|
|
3,568 |
|
|
3,435 |
|
|
0.20 |
|
|
| Assembly Intermediate, LLC |
|
(5) (7) (13) |
|
S + |
|
6.00% |
|
11.45% |
|
|
|
10/19/2027 |
|
— |
|
|
(26) |
|
|
(78) |
|
|
— |
|
|
| FPG Intermediate Holdco, LLC |
|
(5) (7) |
|
S + |
|
6.50% |
|
12.04% |
|
|
|
3/5/2027 |
|
418 |
|
|
412 |
|
|
385 |
|
|
0.02 |
|
|
| Groundworks, LLC |
|
(5) (6) (7) |
|
S + |
|
6.50% |
|
11.90% |
|
|
|
3/14/2030 |
|
1,164 |
|
|
1,134 |
|
|
1,157 |
|
|
0.07 |
|
|
| Groundworks, LLC |
|
(5) (7) (13) |
|
S + |
|
6.50% |
|
11.90% |
|
|
|
3/14/2030 |
|
28 |
|
|
25 |
|
|
28 |
|
|
— |
|
|
Morgan Stanley Direct Lending Fund
Consolidated Schedule of Investments
December 31, 2023
(In thousands)
|
|
|
|
|
|
|
|
|
|
|
|
|
|
|
|
|
|
|
|
|
|
|
|
|
|
|
|
|
|
|
|
|
|
|
|
|
|
|
|
|
|
|
|
|
|
|
|
|
|
|
|
|
|
|
|
|
|
|
|
|
|
Investments-non-controlled/non-affiliated(1)(2) |
|
Footnotes |
|
Reference Rate and Spread |
|
Interest Rate(3) |
|
|
|
Maturity Date |
|
Par Amount/ Shares |
|
Cost(4) |
|
Fair Value |
|
Percentage of Net Assets |
|
| Groundworks, LLC |
|
(5) (7) (13) |
|
S + |
|
6.50% |
|
11.90% |
|
|
|
3/14/2029 |
|
— |
|
|
$ |
(2) |
|
|
$ |
— |
|
|
— |
|
% |
| Heartland Home Services, Inc. |
|
(5) (8) |
|
S + |
|
5.75% |
|
11.11% |
|
|
|
12/15/2026 |
|
1,946 |
|
|
1,936 |
|
|
1,942 |
|
|
0.11 |
|
|
| Lightspeed Solution, LLC |
|
(5) (8) |
|
S + |
|
6.50% (incl. 2.17% PIK) |
|
11.86% |
|
|
|
3/1/2028 |
|
7,881 |
|
|
7,768 |
|
|
7,741 |
|
|
0.45 |
|
|
| Lightspeed Solution, LLC |
|
(5) (8) (13) |
|
S + |
|
6.50% (incl. 2.17% PIK) |
|
11.86% |
|
|
|
3/1/2028 |
|
423 |
|
|
402 |
|
|
379 |
|
|
0.02 |
|
|
| LUV Car Wash Group, LLC |
|
(5) (7) (13) |
|
S + |
|
7.00% |
|
12.55% |
|
|
|
12/9/2026 |
|
714 |
|
|
708 |
|
|
711 |
|
|
0.04 |
|
|
| Magnolia Wash Holdings |
|
(5) (7) |
|
S + |
|
6.50% |
|
12.16% |
|
|
|
7/14/2028 |
|
3,263 |
|
|
3,210 |
|
|
2,947 |
|
|
0.17 |
|
|
| Magnolia Wash Holdings |
|
(5) (7) |
|
S + |
|
6.50% |
|
12.16% |
|
|
|
7/14/2028 |
|
699 |
|
|
687 |
|
|
631 |
|
|
0.04 |
|
|
| Magnolia Wash Holdings |
|
(5) (7) (13) |
|
S + |
|
6.50% |
|
12.16% |
|
|
|
7/14/2028 |
|
87 |
|
|
85 |
|
|
72 |
|
|
— |
|
|
| Spotless Brands, LLC |
|
(5) (7) |
|
S + |
|
6.50% |
|
12.03% |
|
|
|
7/25/2028 |
|
4,503 |
|
|
4,429 |
|
|
4,463 |
|
|
0.26 |
|
|
| Spotless Brands, LLC |
|
(5) (7) |
|
S + |
|
6.50% |
|
12.03% |
|
|
|
7/25/2028 |
|
852 |
|
|
838 |
|
|
845 |
|
|
0.05 |
|
|
| Spotless Brands, LLC |
|
(5) (7) (13) |
|
S + |
|
6.50% |
|
12.03% |
|
|
|
7/25/2028 |
|
31 |
|
|
29 |
|
|
30 |
|
|
— |
|
|
| Vertex Service Partners, LLC |
|
(5) (6) (8) |
|
S + |
|
5.50% |
|
10.90% |
|
|
|
11/8/2030 |
|
1,774 |
|
|
1,730 |
|
|
1,730 |
|
|
0.10 |
|
|
| Vertex Service Partners, LLC |
|
(5) (8) (13) |
|
S + |
|
5.50% |
|
10.90% |
|
|
|
11/8/2030 |
|
854 |
|
|
802 |
|
|
802 |
|
|
0.05 |
|
|
| Vertex Service Partners, LLC |
|
(5) (8) (13) |
|
S + |
|
5.50% |
|
10.90% |
|
|
|
11/8/2030 |
|
— |
|
|
(11) |
|
|
(11) |
|
|
— |
|
|
|
|
|
|
|
|
|
|
|
|
|
|
|
|
|
|
81,164 |
|
|
80,159 |
|
|
4.66 |
|
|
| Electronic Equipment, Instruments & Components |
|
|
|
|
|
|
|
|
|
|
|
|
|
|
|
|
|
|
|
|
|
| Abracon Group Holdings, LLC |
|
(5) (8) |
|
S + |
|
6.00% |
|
11.54% |
|
|
|
7/6/2028 |
|
6,037 |
|
|
5,943 |
|
|
4,986 |
|
|
0.29 |
|
|
| Abracon Group Holdings, LLC |
|
(5) (8) (13) |
|
S + |
|
6.00% |
|
11.54% |
|
|
|
7/6/2028 |
|
— |
|
|
(8) |
|
|
(77) |
|
|
— |
|
|
| Abracon Group Holdings, LLC |
|
(5) (8) |
|
S + |
|
6.00% |
|
11.54% |
|
|
|
7/6/2028 |
|
401 |
|
|
395 |
|
|
331 |
|
|
0.02 |
|
|
| Dwyer Instruments, Inc. |
|
(5) (8) |
|
S + |
|
5.75% |
|
11.17% |
|
|
|
7/21/2027 |
|
10,512 |
|
|
10,342 |
|
|
10,303 |
|
|
0.60 |
|
|
| Dwyer Instruments, Inc. |
|
(5) (8) (13) |
|
S + |
|
5.75% |
|
11.17% |
|
|
|
7/21/2027 |
|
2,023 |
|
|
1,960 |
|
|
1,953 |
|
|
0.11 |
|
|
| Dwyer Instruments, Inc. |
|
(5) (8) (13) |
|
S + |
|
5.75% |
|
11.17% |
|
|
|
7/21/2027 |
|
— |
|
|
(14) |
|
|
(20) |
|
|
— |
|
|
| Infinite Bidco, LLC |
|
(5) (9) |
|
S + |
|
6.25% |
|
11.88% |
|
|
|
3/2/2028 |
|
12,360 |
|
|
12,043 |
|
|
12,285 |
|
|
0.71 |
|
|
| Magneto Components Buyco, LLC |
|
(5) (6) (8) |
|
S + |
|
6.00% |
|
11.36% |
|
|
|
12/5/2030 |
|
15,302 |
|
|
15,024 |
|
|
15,024 |
|
|
0.87 |
|
|
| Magneto Components Buyco, LLC |
|
(5) (8) (13) |
|
S + |
|
6.00% |
|
11.36% |
|
|
|
12/5/2030 |
|
— |
|
|
(28) |
|
|
(28) |
|
|
— |
|
|
| Magneto Components Buyco, LLC |
|
(5) (8) (13) |
|
S + |
|
6.00% |
|
11.36% |
|
|
|
12/5/2029 |
|
— |
|
|
(46) |
|
|
(46) |
|
|
— |
|
|
|
|
|
|
|
|
|
|
|
|
|
|
|
|
|
|
45,611 |
|
|
44,711 |
|
|
2.60 |
|
|
|
|
|
|
|
|
|
|
|
|
|
|
|
|
|
|
|
|
|
|
|
|
| Financial Services |
|
|
|
|
|
|
|
|
|
|
|
|
|
|
|
|
|
|
|
|
|
| Applitools, Inc. |
|
(5) (8) (10) |
|
S + |
|
6.25% PIK |
|
11.61% |
|
|
|
5/25/2029 |
|
3,584 |
|
|
3,541 |
|
|
3,498 |
|
|
0.20 |
|
|
| Applitools, Inc. |
|
(5) (8) (10) (13) |
|
S + |
|
6.25% |
|
11.61% |
|
|
|
5/25/2028 |
|
— |
|
|
(6) |
|
|
(10) |
|
|
— |
|
|
| Cerity Partners, LLC |
|
(5) (8) |
|
S + |
|
6.75% |
|
12.11% |
|
|
|
7/30/2029 |
|
4,767 |
|
|
4,639 |
|
|
4,767 |
|
|
0.28 |
|
|
| Cerity Partners, LLC |
|
(5) (8) |
|
S + |
|
6.75% |
|
12.11% |
|
|
|
7/30/2029 |
|
6,698 |
|
|
6,528 |
|
|
6,698 |
|
|
0.39 |
|
|
| GC Waves Holdings, Inc. |
|
(5) (8) |
|
S + |
|
6.00% |
|
11.46% |
|
|
|
8/11/2028 |
|
2,302 |
|
|
2,259 |
|
|
2,259 |
|
|
0.13 |
|
|
| GC Waves Holdings, Inc. |
|
(5) (8) (13) |
|
S + |
|
6.00% |
|
11.46% |
|
|
|
8/11/2028 |
|
628 |
|
|
476 |
|
|
503 |
|
|
0.03 |
|
|
Morgan Stanley Direct Lending Fund
Consolidated Schedule of Investments
December 31, 2023
(In thousands)
|
|
|
|
|
|
|
|
|
|
|
|
|
|
|
|
|
|
|
|
|
|
|
|
|
|
|
|
|
|
|
|
|
|
|
|
|
|
|
|
|
|
|
|
|
|
|
|
|
|
|
|
|
|
|
|
|
|
|
|
|
|
Investments-non-controlled/non-affiliated(1)(2) |
|
Footnotes |
|
Reference Rate and Spread |
|
Interest Rate(3) |
|
|
|
Maturity Date |
|
Par Amount/ Shares |
|
Cost(4) |
|
Fair Value |
|
Percentage of Net Assets |
|
| GC Waves Holdings, Inc. |
|
(5) (8) (13) |
|
S + |
|
6.00% |
|
11.46% |
|
|
|
8/11/2028 |
|
— |
|
|
$ |
(6) |
|
|
$ |
(6) |
|
|
— |
|
% |
| SitusAMC Holdings Corp. |
|
(5) (8) |
|
S + |
|
5.50% |
|
10.95% |
|
|
|
12/22/2027 |
|
3,337 |
|
|
3,312 |
|
|
3,330 |
|
|
0.19 |
|
|
| Smarsh, Inc. |
|
(5) (8) |
|
S + |
|
5.75% |
|
11.10% |
|
|
|
2/16/2029 |
|
4,286 |
|
|
4,217 |
|
|
4,213 |
|
|
0.24 |
|
|
| Smarsh, Inc. |
|
(5) (8) (13) |
|
S + |
|
5.75% |
|
11.10% |
|
|
|
2/16/2029 |
|
536 |
|
|
523 |
|
|
518 |
|
|
0.03 |
|
|
| Smarsh, Inc. |
|
(5) (8) (13) |
|
S + |
|
5.75% |
|
11.10% |
|
|
|
2/16/2029 |
|
— |
|
|
(4) |
|
|
(5) |
|
|
— |
|
|
| Trintech, Inc. |
|
(5) (6) (7) |
|
S + |
|
6.50% |
|
11.86% |
|
|
|
7/25/2029 |
|
34,086 |
|
|
33,440 |
|
|
33,445 |
|
|
1.94 |
|
|
| Trintech, Inc. |
|
(5) (7) (13) |
|
S + |
|
6.50% |
|
11.86% |
|
|
|
7/25/2029 |
|
837 |
|
|
782 |
|
|
782 |
|
|
0.05 |
|
|
|
|
|
|
|
|
|
|
|
|
|
|
|
|
|
|
59,701 |
|
|
59,992 |
|
|
3.49 |
|
|
| Food Products |
|
|
|
|
|
|
|
|
|
|
|
|
|
|
|
|
|
|
|
|
|
| AMCP Pet Holdings, Inc. (Brightpet) |
|
(5) (6) (7) |
|
S + |
|
7.00% (incl. 0.75% PIK) |
|
12.50% |
|
|
|
10/5/2026 |
|
41,763 |
|
|
41,011 |
|
|
40,856 |
|
|
2.37 |
|
|
| AMCP Pet Holdings, Inc. (Brightpet) |
|
(5) (7) (13) |
|
S + |
|
7.00% (incl. 0.75% PIK) |
|
12.50% |
|
|
|
10/5/2026 |
|
3,798 |
|
|
3,715 |
|
|
3,671 |
|
|
0.21 |
|
|
| Nellson Nutraceutical, Inc. |
|
(5) (6) (7) |
|
S + |
|
5.75% |
|
11.30% |
|
|
|
12/23/2025 |
|
18,419 |
|
|
18,265 |
|
|
18,329 |
|
|
1.06 |
|
|
| Teasdale Foods, Inc. (Teasdale Latin Foods) |
|
(5) (7) |
|
S + |
|
7.25% (incl. 1.00% PIK) |
|
12.68% |
|
|
|
12/18/2025 |
|
10,837 |
|
|
10,742 |
|
|
9,928 |
|
|
0.58 |
|
|
|
|
|
|
|
|
|
|
|
|
|
|
|
|
|
|
73,733 |
|
|
72,784 |
|
|
4.23 |
|
|
| Health Care Equipment & Supplies |
|
|
|
|
|
|
|
|
|
|
|
|
|
|
|
|
|
|
|
|
|
| Performance Health Holdings, Inc. |
|
(5) (6) (7) |
|
S + |
|
5.75% |
|
11.32% |
|
|
|
7/12/2027 |
|
9,398 |
|
|
9,275 |
|
|
9,350 |
|
|
0.54 |
|
|
| PerkinElmer U.S., LLC |
|
(5) (6) (7) |
|
S + |
|
6.75% |
|
12.00% |
|
|
|
3/13/2029 |
|
4,383 |
|
|
4,268 |
|
|
4,373 |
|
|
0.25 |
|
|
| Tidi Legacy Products, Inc. |
|
(5) (7) |
|
S + |
|
5.50% |
|
10.86% |
|
|
|
12/19/2029 |
|
3,470 |
|
|
3,400 |
|
|
3,400 |
|
|
0.20 |
|
|
| Tidi Legacy Products, Inc. |
|
(5) (7) (13) |
|
S + |
|
5.50% |
|
10.86% |
|
|
|
12/19/2029 |
|
— |
|
|
(9) |
|
|
(9) |
|
|
— |
|
|
| Tidi Legacy Products, Inc. |
|
(5) (7) (13) |
|
S + |
|
5.50% |
|
10.86% |
|
|
|
12/19/2029 |
|
— |
|
|
(13) |
|
|
(13) |
|
|
— |
|
|
| YI, LLC |
|
(5) (6) (7) |
|
S + |
|
5.75% |
|
11.09% |
|
|
|
12/3/2029 |
|
5,654 |
|
|
5,542 |
|
|
5,542 |
|
|
0.32 |
|
|
| YI, LLC |
|
(5) (7) (13) |
|
S + |
|
5.75% |
|
11.09% |
|
|
|
12/1/2029 |
|
— |
|
|
(12) |
|
|
(12) |
|
|
— |
|
|
| YI, LLC |
|
(5) (7) (13) |
|
S + |
|
5.75% |
|
11.09% |
|
|
|
12/3/2029 |
|
— |
|
|
(17) |
|
|
(17) |
|
|
— |
|
|
|
|
|
|
|
|
|
|
|
|
|
|
|
|
|
|
22,434 |
|
|
22,614 |
|
|
1.31 |
|
|
| Health Care Providers & Services |
|
|
|
|
|
|
|
|
|
|
|
|
|
|
|
|
|
|
|
|
|
| Advarra Holdings, Inc. |
|
(5) (9) |
|
S + |
|
5.25% |
|
10.61% |
|
|
|
8/24/2029 |
|
454 |
|
|
447 |
|
|
447 |
|
|
0.03 |
|
|
| Advarra Holdings, Inc. |
|
(5) (9) (13) |
|
S + |
|
5.25% |
|
10.61% |
|
|
|
8/24/2029 |
|
— |
|
|
— |
|
|
(1) |
|
|
— |
|
|
| DCA Investment Holdings, LLC |
|
(5) (6) (8) |
|
S + |
|
6.50% |
|
11.85% |
|
|
|
4/3/2028 |
|
18,680 |
|
|
18,377 |
|
|
18,247 |
|
|
1.06 |
|
|
| DCA Investment Holdings, LLC |
|
(5) (8) |
|
S + |
|
6.50% |
|
11.85% |
|
|
|
4/3/2028 |
|
3,625 |
|
|
3,564 |
|
|
3,541 |
|
|
0.21 |
|
|
| Gateway US Holdings, Inc. |
|
(5) (8) (10) |
|
S + |
|
6.50% |
|
11.85% |
|
|
|
9/22/2026 |
|
750 |
|
|
745 |
|
|
750 |
|
|
0.04 |
|
|
| Gateway US Holdings, Inc. |
|
(5) (8) (10) |
|
S + |
|
6.50% |
|
11.85% |
|
|
|
9/22/2026 |
|
211 |
|
|
210 |
|
|
211 |
|
|
0.01 |
|
|
| Gateway US Holdings, Inc. |
|
(5) (8) (10) (13) |
|
S + |
|
6.50% |
|
11.85% |
|
|
|
9/22/2026 |
|
— |
|
|
— |
|
|
— |
|
|
— |
|
|
| Heartland Veterinary Partners, LLC |
|
(5) (7) |
|
S + |
|
4.75% |
|
10.21% |
|
|
|
12/10/2026 |
|
1,847 |
|
|
1,835 |
|
|
1,830 |
|
|
0.11 |
|
|
| Heartland Veterinary Partners, LLC |
|
(5) (7) |
|
S + |
|
4.75% |
|
10.21% |
|
|
|
12/10/2026 |
|
4,182 |
|
|
4,158 |
|
|
4,143 |
|
|
0.24 |
|
|
| Heartland Veterinary Partners, LLC |
|
(5) (7) (13) |
|
S + |
|
4.75% |
|
10.21% |
|
|
|
12/10/2026 |
|
— |
|
|
(2) |
|
|
(3) |
|
|
— |
|
|
Morgan Stanley Direct Lending Fund
Consolidated Schedule of Investments
December 31, 2023
(In thousands)
|
|
|
|
|
|
|
|
|
|
|
|
|
|
|
|
|
|
|
|
|
|
|
|
|
|
|
|
|
|
|
|
|
|
|
|
|
|
|
|
|
|
|
|
|
|
|
|
|
|
|
|
|
|
|
|
|
|
|
|
|
|
Investments-non-controlled/non-affiliated(1)(2) |
|
Footnotes |
|
Reference Rate and Spread |
|
Interest Rate(3) |
|
|
|
Maturity Date |
|
Par Amount/ Shares |
|
Cost(4) |
|
Fair Value |
|
Percentage of Net Assets |
|
| iCIMS, Inc. |
|
(5) (8) |
|
S + |
|
7.25% (incl. 3.88% PIK) |
|
12.62% |
|
|
|
8/18/2028 |
|
7,064 |
|
|
$ |
6,963 |
|
|
$ |
7,064 |
|
|
0.41 |
|
% |
| iCIMS, Inc. |
|
(5) (8) (13) |
|
S + |
|
7.25% (incl. 3.88% PIK) |
|
12.62% |
|
|
|
8/18/2028 |
|
— |
|
|
(1) |
|
|
— |
|
|
— |
|
|
| iCIMS, Inc. |
|
(5) (8) (13) |
|
S + |
|
7.25% (incl. 3.88% PIK) |
|
12.62% |
|
|
|
8/18/2028 |
|
8 |
|
|
7 |
|
|
8 |
|
|
— |
|
|
| Intelerad Medical Systems Incorporated |
|
(5) (7) (10) |
|
S + |
|
6.50% |
|
12.03% |
|
|
|
8/21/2026 |
|
495 |
|
|
484 |
|
|
466 |
|
|
0.03 |
|
|
| Intelerad Medical Systems Incorporated |
|
(5) (7) (10) |
|
S + |
|
6.50% |
|
12.03% |
|
|
|
8/21/2026 |
|
34 |
|
|
33 |
|
|
32 |
|
|
— |
|
|
| mPulse Mobile, Inc. |
|
(5) (8) |
|
S + |
|
6.50% |
|
11.83% |
|
|
|
12/17/2027 |
|
40,740 |
|
|
39,916 |
|
|
39,947 |
|
|
2.32 |
|
|
| mPulse Mobile, Inc. |
|
(5) (8) |
|
S + |
|
6.50% |
|
11.98% |
|
|
|
12/17/2027 |
|
5,417 |
|
|
5,300 |
|
|
5,308 |
|
|
0.31 |
|
|
| mPulse Mobile, Inc. |
|
(5) (8) (13) |
|
S + |
|
6.50% |
|
11.83% |
|
|
|
12/17/2027 |
|
— |
|
|
(60) |
|
|
(59) |
|
|
— |
|
|
| Pareto Health Intermediate Holdings, Inc. |
|
(5)(7) |
|
S + |
|
6.50% |
|
11.97% |
|
|
|
5/31/2030 |
|
6,745 |
|
|
6,619 |
|
|
6,695 |
|
|
0.39 |
|
|
| Pareto Health Intermediate Holdings, Inc. |
|
(5) (7)(13) |
|
S + |
|
6.50% |
|
11.97% |
|
|
|
5/31/2029 |
|
— |
|
|
(14) |
|
|
(6) |
|
|
— |
|
|
| PPV Intermediate Holdings, LLC |
|
(5) (8) |
|
S + |
|
5.75% |
|
11.14% |
|
|
|
8/31/2029 |
|
4,357 |
|
|
4,198 |
|
|
4,275 |
|
|
0.25 |
|
|
| PPV Intermediate Holdings, LLC |
|
(5) (8) (13) |
|
S + |
|
5.75% |
|
11.14% |
|
|
|
8/31/2029 |
|
— |
|
|
(71) |
|
|
(124) |
|
|
(0.01) |
|
|
| Promptcare Infusion Buyer, Inc. |
|
(5) (7) |
|
S + |
|
6.00% |
|
11.46% |
|
|
|
9/1/2027 |
|
8,981 |
|
|
8,860 |
|
|
8,865 |
|
|
0.52 |
|
|
| Promptcare Infusion Buyer, Inc. |
|
(5) (7) |
|
S + |
|
6.00% |
|
11.46% |
|
|
|
9/1/2027 |
|
1,399 |
|
|
1,385 |
|
|
1,381 |
|
|
0.08 |
|
|
| Stepping Stones Healthcare Services, LLC |
|
(5) (8) |
|
S + |
|
5.75% |
|
11.20% |
|
|
|
1/2/2029 |
|
4,288 |
|
|
4,237 |
|
|
4,227 |
|
|
0.25 |
|
|
| Stepping Stones Healthcare Services, LLC |
|
(5) (8) (13) |
|
S + |
|
5.75% |
|
11.20% |
|
|
|
1/2/2029 |
|
965 |
|
|
952 |
|
|
947 |
|
|
0.06 |
|
|
| Stepping Stones Healthcare Services, LLC |
|
(5) (8) (13) |
|
S + |
|
5.75% |
|
11.20% |
|
|
|
12/30/2026 |
|
— |
|
|
(6) |
|
|
(9) |
|
|
— |
|
|
| Suveto |
|
(5) (8) |
|
S + |
|
4.25% |
|
9.71% |
|
|
|
9/9/2027 |
|
11,837 |
|
|
11,753 |
|
|
11,597 |
|
|
0.67 |
|
|
| Suveto |
|
(5) (8) (13) |
|
S + |
|
4.25% |
|
9.71% |
|
|
|
9/9/2027 |
|
366 |
|
|
352 |
|
|
340 |
|
|
0.02 |
|
|
| Tivity Health, Inc. |
|
(5) (8) |
|
S + |
|
6.00% |
|
11.35% |
|
|
|
6/28/2029 |
|
3,674 |
|
|
3,627 |
|
|
3,668 |
|
|
0.21 |
|
|
| Vardiman Black Holdings, LLC |
|
(5) (9) (11) |
|
S + |
|
9.00% (incl. 2.00% PIK) |
|
14.40% |
|
|
|
3/18/2027 |
|
3,386 |
|
|
3,360 |
|
|
2,815 |
|
|
0.16 |
|
|
| Vardiman Black Holdings, LLC |
|
(5) (9) (11) |
|
S + |
|
9.00% (incl. 2.00% PIK) |
|
14.40% |
|
|
|
3/18/2027 |
|
4,020 |
|
|
3,988 |
|
|
3,342 |
|
|
0.19 |
|
|
| Vermont Aus Pty Ltd |
|
(5) (8) (10) |
|
S + |
|
5.50% |
|
11.00% |
|
|
|
3/23/2028 |
|
8,351 |
|
|
8,190 |
|
|
8,194 |
|
|
0.48 |
|
|
|
|
|
|
|
|
|
|
|
|
|
|
|
|
|
|
139,406 |
|
|
138,138 |
|
|
8.03 |
|
|
| Health Care Technology |
|
|
|
|
|
|
|
|
|
|
|
|
|
|
|
|
|
|
|
|
|
| Hyland Software, Inc. |
|
(5) (6) (8) |
|
S + |
|
6.00% |
|
11.36% |
|
|
|
9/19/2030 |
|
39,656 |
|
|
39,077 |
|
|
39,212 |
|
|
2.28 |
|
|
| Hyland Software, Inc. |
|
(5) (8) (13) |
|
S + |
|
6.00% |
|
11.36% |
|
|
|
9/19/2029 |
|
— |
|
|
(27) |
|
|
(21) |
|
|
— |
|
|
| Lightspeed Buyer, Inc. |
|
(5) (6) (7) |
|
S + |
|
5.25% |
|
10.71% |
|
|
|
2/3/2026 |
|
12,540 |
|
|
12,381 |
|
|
12,429 |
|
|
0.72 |
|
|
| Lightspeed Buyer, Inc. |
|
(5) (7) |
|
S + |
|
5.25% |
|
10.71% |
|
|
|
2/3/2026 |
|
9,911 |
|
|
9,774 |
|
|
9,823 |
|
|
0.57 |
|
|
|
|
|
|
|
|
|
|
|
|
|
|
|
|
|
|
61,205 |
|
|
61,443 |
|
|
3.57 |
|
|
| Industrial Conglomerates |
|
|
|
|
|
|
|
|
|
|
|
|
|
|
|
|
|
|
|
|
|
| Excelitas Technologies Corp. |
|
(5) (8) |
|
S + |
|
5.75% |
|
11.23% |
|
|
|
8/13/2029 |
|
1,455 |
|
|
1,431 |
|
|
1,442 |
|
|
0.08 |
|
|
| Excelitas Technologies Corp. |
|
(5) (8) |
|
E + |
|
5.75% |
|
9.74% |
|
|
|
8/13/2029 |
|
€ |
239 |
|
|
244 |
|
|
262 |
|
|
0.02 |
|
|
Morgan Stanley Direct Lending Fund
Consolidated Schedule of Investments
December 31, 2023
(In thousands)
|
|
|
|
|
|
|
|
|
|
|
|
|
|
|
|
|
|
|
|
|
|
|
|
|
|
|
|
|
|
|
|
|
|
|
|
|
|
|
|
|
|
|
|
|
|
|
|
|
|
|
|
|
|
|
|
|
|
|
|
|
|
Investments-non-controlled/non-affiliated(1)(2) |
|
Footnotes |
|
Reference Rate and Spread |
|
Interest Rate(3) |
|
|
|
Maturity Date |
|
Par Amount/ Shares |
|
Cost(4) |
|
Fair Value |
|
Percentage of Net Assets |
|
| Excelitas Technologies Corp. |
|
(5) (8) (13) |
|
S + |
|
5.75% |
|
11.23% |
|
|
|
8/13/2029 |
|
126 |
|
|
$ |
124 |
|
|
$ |
125 |
|
|
0.01 |
|
% |
| Excelitas Technologies Corp. |
|
(5) (8) (13) |
|
S + |
|
5.75% |
|
11.23% |
|
|
|
8/14/2028 |
|
80 |
|
|
78 |
|
|
79 |
|
|
— |
|
|
| Raptor Merger Sub Debt, LLC |
|
(5) (6) (8) |
|
S + |
|
6.75% |
|
12.10% |
|
|
|
4/1/2029 |
|
32,233 |
|
|
31,399 |
|
|
32,201 |
|
|
1.87 |
|
|
| Raptor Merger Sub Debt, LLC |
|
(5) (8) (13) |
|
S + |
|
6.75% |
|
12.10% |
|
|
|
4/1/2028 |
|
488 |
|
|
431 |
|
|
486 |
|
|
0.03 |
|
|
|
|
|
|
|
|
|
|
|
|
|
|
|
|
|
|
33,707 |
|
|
34,595 |
|
|
2.01 |
|
|
| Insurance Services |
|
|
|
|
|
|
|
|
|
|
|
|
|
|
|
|
|
|
|
|
|
| Amerilife Holdings, LLC |
|
(5) (8) |
|
S + |
|
5.75% |
|
11.15% |
|
|
|
8/31/2029 |
|
2,024 |
|
|
1,989 |
|
|
1,997 |
|
|
0.12 |
|
|
| Amerilife Holdings, LLC |
|
(5) (8) (13) |
|
S + |
|
5.75% |
|
11.15% |
|
|
|
8/31/2029 |
|
722 |
|
|
708 |
|
|
710 |
|
|
0.04 |
|
|
| Amerilife Holdings, LLC |
|
(5) (8) (13) |
|
S + |
|
5.75% |
|
11.15% |
|
|
|
8/31/2028 |
|
— |
|
|
(7) |
|
|
(6) |
|
|
— |
|
|
| Foundation Risk Partners Corp. |
|
(5) (8) |
|
S + |
|
6.00% |
|
11.45% |
|
|
|
10/29/2028 |
|
42,533 |
|
|
42,053 |
|
|
42,533 |
|
|
2.47 |
|
|
| Foundation Risk Partners Corp. |
|
(5) (8) |
|
S + |
|
6.00% |
|
11.45% |
|
|
|
10/29/2028 |
|
9,251 |
|
|
9,146 |
|
|
9,251 |
|
|
0.54 |
|
|
| Foundation Risk Partners Corp. |
|
(5) (8) (13) |
|
S + |
|
6.00% |
|
11.45% |
|
|
|
10/29/2027 |
|
— |
|
|
(44) |
|
|
— |
|
|
— |
|
|
| Galway Borrower, LLC |
|
(5) (8) |
|
S + |
|
5.25% |
|
10.71% |
|
|
|
9/29/2028 |
|
33,377 |
|
|
32,879 |
|
|
32,430 |
|
|
1.88 |
|
|
| Galway Borrower, LLC |
|
(5) (8) (13) |
|
S + |
|
5.25% |
|
10.71% |
|
|
|
9/29/2028 |
|
— |
|
|
(15) |
|
|
(18) |
|
|
— |
|
|
| Galway Borrower, LLC |
|
(5) (8) (13) |
|
S + |
|
5.25% |
|
10.71% |
|
|
|
9/30/2027 |
|
— |
|
|
(26) |
|
|
(59) |
|
|
— |
|
|
| Higginbotham Insurance Agency, Inc. |
|
(5) (6) (7) |
|
S + |
|
5.50% |
|
10.96% |
|
|
|
11/24/2028 |
|
18,295 |
|
|
18,118 |
|
|
18,290 |
|
|
1.06 |
|
|
| Higginbotham Insurance Agency, Inc. |
|
(5) (7) (13) |
|
S + |
|
5.50% |
|
10.96% |
|
|
|
11/24/2028 |
|
2,494 |
|
|
2,464 |
|
|
2,493 |
|
|
0.14 |
|
|
| High Street Buyer, Inc. |
|
(5) (6) (8) |
|
S + |
|
5.75% |
|
11.25% |
|
|
|
4/14/2028 |
|
9,890 |
|
|
9,756 |
|
|
9,890 |
|
|
0.57 |
|
|
| High Street Buyer, Inc. |
|
(5) (6) (8) |
|
S + |
|
5.75% |
|
11.25% |
|
|
|
4/14/2028 |
|
39,719 |
|
|
39,156 |
|
|
39,719 |
|
|
2.31 |
|
|
| High Street Buyer, Inc. |
|
(5) (8) (13) |
|
S + |
|
5.75% |
|
11.25% |
|
|
|
4/16/2027 |
|
— |
|
|
(23) |
|
|
— |
|
|
— |
|
|
| Long Term Care Group, Inc. |
|
(5) (8) |
|
S + |
|
7.00% (incl. 6.00% PIK) |
|
12.66% |
|
|
|
9/8/2027 |
|
5,115 |
|
|
5,043 |
|
|
4,235 |
|
|
0.25 |
|
|
| Inszone Mid, LLC |
|
(5) (7) |
|
S + |
|
5.75% |
|
11.11% |
|
|
|
11/12/2029 |
|
4,460 |
|
|
4,372 |
|
|
4,372 |
|
|
0.25 |
|
|
| Inszone Mid, LLC |
|
(5) (7) (13) |
|
S + |
|
5.75% |
|
11.11% |
|
|
|
11/12/2029 |
|
533 |
|
|
463 |
|
|
464 |
|
|
0.03 |
|
|
| Inszone Mid, LLC |
|
(5) (7) (13) |
|
S + |
|
5.75% |
|
11.11% |
|
|
|
11/12/2029 |
|
— |
|
|
(16) |
|
|
(16) |
|
|
— |
|
|
| Integrity Marketing Acquisition, LLC |
|
(5) (6) (8) |
|
S + |
|
6.00% |
|
11.39% |
|
|
|
8/27/2026 |
|
392 |
|
|
385 |
|
|
384 |
|
|
0.02 |
|
|
| Integrity Marketing Acquisition, LLC |
|
(5) (6) (8) |
|
S + |
|
6.00% |
|
11.54% |
|
|
|
8/27/2026 |
|
85,345 |
|
|
84,685 |
|
|
83,705 |
|
|
4.86 |
|
|
| Integrity Marketing Acquisition, LLC |
|
(5) (8) (13) |
|
S + |
|
6.00% |
|
11.39% |
|
|
|
8/27/2026 |
|
— |
|
|
(2) |
|
|
(1) |
|
|
— |
|
|
| Keystone Agency Investors |
|
(5) (7) |
|
S + |
|
5.50% |
|
11.00% |
|
|
|
5/3/2027 |
|
3,480 |
|
|
3,442 |
|
|
3,429 |
|
|
0.20 |
|
|
| Keystone Agency Investors |
|
(5) (7) |
|
S + |
|
5.50% |
|
11.00% |
|
|
|
5/3/2027 |
|
4,007 |
|
|
3,964 |
|
|
3,948 |
|
|
0.23 |
|
|
| Majesco |
|
(5) (6) (7) |
|
S + |
|
7.25% |
|
12.60% |
|
|
|
9/21/2027 |
|
23,182 |
|
|
22,792 |
|
|
22,920 |
|
|
1.33 |
|
|
| Majesco |
|
(5) (7) (13) |
|
S + |
|
7.25% |
|
12.60% |
|
|
|
9/21/2026 |
|
— |
|
|
(21) |
|
|
(18) |
|
|
— |
|
|
| Patriot Growth Insurance Services, LLC |
|
(5) (6) (8) |
|
S + |
|
5.50% |
|
11.00% |
|
|
|
10/16/2028 |
|
62,358 |
|
|
61,419 |
|
|
61,747 |
|
|
3.59 |
|
|
| Patriot Growth Insurance Services, LLC |
|
(5) (8) (13) |
|
S + |
|
5.50% |
|
11.00% |
|
|
|
10/16/2028 |
|
— |
|
|
(61) |
|
|
(44) |
|
|
— |
|
|
| Peter C. Foy & Associates Insurance Services, LLC |
|
(5) (6) (8) |
|
S + |
|
6.00% |
|
11.47% |
|
|
|
11/1/2028 |
|
20,205 |
|
|
20,029 |
|
|
19,938 |
|
|
1.16 |
|
|
| Peter C. Foy & Associates Insurance Services, LLC |
|
(5) (8) (13) |
|
S + |
|
6.00% |
|
11.47% |
|
|
|
11/1/2028 |
|
7,140 |
|
|
7,060 |
|
|
7,033 |
|
|
0.41 |
|
|
| Peter C. Foy & Associates Insurance Services, LLC |
|
(5) (8) (13) |
|
S + |
|
6.00% |
|
11.47% |
|
|
|
11/1/2027 |
|
— |
|
|
(5) |
|
|
(12) |
|
|
— |
|
|
Morgan Stanley Direct Lending Fund
Consolidated Schedule of Investments
December 31, 2023
(In thousands)
|
|
|
|
|
|
|
|
|
|
|
|
|
|
|
|
|
|
|
|
|
|
|
|
|
|
|
|
|
|
|
|
|
|
|
|
|
|
|
|
|
|
|
|
|
|
|
|
|
|
|
|
|
|
|
|
|
|
|
|
|
|
Investments-non-controlled/non-affiliated(1)(2) |
|
Footnotes |
|
Reference Rate and Spread |
|
Interest Rate(3) |
|
|
|
Maturity Date |
|
Par Amount/ Shares |
|
Cost(4) |
|
Fair Value |
|
Percentage of Net Assets |
|
| RSC Acquisition, Inc. |
|
(5) (6) (8) |
|
S + |
|
5.50% |
|
11.02% |
|
|
|
11/1/2029 |
|
32,400 |
|
|
$ |
31,989 |
|
|
$ |
32,125 |
|
|
1.87 |
|
% |
| RSC Acquisition, Inc. |
|
(5) (8) (13) |
|
S + |
|
6.00% |
|
11.39% |
|
|
|
11/1/2029 |
|
135 |
|
|
124 |
|
|
128 |
|
|
0.01 |
|
|
| Summit Acquisition, Inc. |
|
(5) (6) (8) |
|
S + |
|
6.75% |
|
12.10% |
|
|
|
5/1/2030 |
|
7,353 |
|
|
7,146 |
|
|
7,242 |
|
|
0.42 |
|
|
| Summit Acquisition, Inc. |
|
(5) (8) (13) |
|
S + |
|
6.75% |
|
12.10% |
|
|
|
5/1/2030 |
|
— |
|
|
(22) |
|
|
(25) |
|
|
— |
|
|
| Summit Acquisition, Inc. |
|
(5) (8) (13) |
|
S + |
|
6.75% |
|
12.10% |
|
|
|
5/1/2029 |
|
— |
|
|
(22) |
|
|
(12) |
|
|
— |
|
|
| World Insurance Associates, LLC |
|
(5) (6) (7) |
|
S + |
|
6.00% |
|
11.36% |
|
|
|
4/3/2028 |
|
64,847 |
|
|
63,382 |
|
|
62,776 |
|
|
3.65 |
|
|
| World Insurance Associates, LLC |
|
(5) (7) (13) |
|
S + |
|
6.00% |
|
11.36% |
|
|
|
4/3/2028 |
|
— |
|
|
(11) |
|
|
(41) |
|
|
— |
|
|
|
|
|
|
|
|
|
|
|
|
|
|
|
|
|
|
472,289 |
|
|
471,507 |
|
|
27.39 |
|
|
| Interactive Media & Services |
|
|
|
|
|
|
|
|
|
|
|
|
|
|
|
|
|
|
|
|
|
| FMG Suite Holdings, LLC |
|
(5) (7) |
|
S + |
|
5.50% |
|
10.78% |
|
|
|
10/30/2026 |
|
23,574 |
|
|
23,267 |
|
|
23,392 |
|
|
1.36 |
|
|
| FMG Suite Holdings, LLC |
|
(5) (7) |
|
S + |
|
5.50% |
|
10.78% |
|
|
|
10/30/2026 |
|
4,568 |
|
|
4,521 |
|
|
4,538 |
|
|
0.26 |
|
|
| FMG Suite Holdings, LLC |
|
(5) (13) |
|
P + |
|
4.25% |
|
12.75% |
|
|
|
10/30/2026 |
|
777 |
|
|
753 |
|
|
762 |
|
|
0.04 |
|
|
| Spectrio, LLC |
|
(5) (6) (7) |
|
S + |
|
6.00% (incl. 5.00% PIK) |
|
11.38% |
|
|
|
12/9/2026 |
|
31,645 |
|
|
31,343 |
|
|
30,028 |
|
|
1.74 |
|
|
| Spectrio, LLC |
|
(5) (7) |
|
S + |
|
6.00% (incl. 5.00% PIK) |
|
11.38% |
|
|
|
12/9/2026 |
|
12,765 |
|
|
12,725 |
|
|
12,113 |
|
|
0.70 |
|
|
| Spectrio, LLC |
|
(5) (7) (13) |
|
S + |
|
6.00% (incl. 5.00% PIK) |
|
11.38% |
|
|
|
12/9/2026 |
|
3,498 |
|
|
3,460 |
|
|
3,294 |
|
|
0.19 |
|
|
| Triple Lift, Inc. |
|
(5) (6) (8) |
|
S + |
|
5.75% |
|
11.17% |
|
|
|
5/5/2028 |
|
27,300 |
|
|
26,926 |
|
|
25,400 |
|
|
1.48 |
|
|
| Triple Lift, Inc. |
|
(5) (8) (13) |
|
S + |
|
5.75% |
|
11.17% |
|
|
|
5/5/2028 |
|
1,533 |
|
|
1,484 |
|
|
1,255 |
|
|
0.07 |
|
|
|
|
|
|
|
|
|
|
|
|
|
|
|
|
|
|
104,479 |
|
|
100,782 |
|
|
5.86 |
|
|
| IT Services |
|
|
|
|
|
|
|
|
|
|
|
|
|
|
|
|
|
|
|
|
|
| Atlas Purchaser, Inc. |
|
(6) (8) |
|
S + |
|
5.25% |
|
10.88% |
|
|
|
5/8/2028 |
|
8,831 |
|
|
8,710 |
|
|
5,210 |
|
|
0.30 |
|
|
| Catalis Intermediate, Inc. |
|
(5) (6) (8) |
|
S + |
|
5.50% |
|
11.00% |
|
|
|
8/4/2027 |
|
39,357 |
|
|
38,709 |
|
|
37,192 |
|
|
2.16 |
|
|
| Catalis Intermediate, Inc. |
|
(5) (8) |
|
S + |
|
5.50% |
|
11.00% |
|
|
|
8/4/2027 |
|
8,855 |
|
|
8,723 |
|
|
8,368 |
|
|
0.49 |
|
|
| Catalis Intermediate, Inc. |
|
(5) (8) (13) |
|
S + |
|
5.50% |
|
11.00% |
|
|
|
8/4/2027 |
|
1,460 |
|
|
1,396 |
|
|
1,227 |
|
|
0.07 |
|
|
| Donuts, Inc. |
|
(5) (6) (7) |
|
S + |
|
6.00% |
|
11.59% |
|
|
|
12/29/2027 |
|
24,855 |
|
|
24,618 |
|
|
24,838 |
|
|
1.44 |
|
|
| Recovery Point Systems, Inc. |
|
(5) (6) (7) |
|
S + |
|
6.50% |
|
11.07% |
|
|
|
8/12/2026 |
|
40,635 |
|
|
40,229 |
|
|
40,635 |
|
|
2.36 |
|
|
| Recovery Point Systems, Inc. |
|
(5) (7) (13) |
|
S + |
|
6.50% |
|
11.07% |
|
|
|
8/12/2026 |
|
— |
|
|
(35) |
|
|
— |
|
|
— |
|
|
| Redwood Services Group, LLC |
|
(5) (8) |
|
S + |
|
6.25% |
|
11.70% |
|
|
|
6/15/2029 |
|
10,829 |
|
|
10,648 |
|
|
10,563 |
|
|
0.61 |
|
|
| Redwood Services Group, LLC |
|
(5) (8) (13) |
|
S + |
|
6.25% |
|
11.70% |
|
|
|
6/15/2029 |
|
5,706 |
|
|
5,645 |
|
|
5,553 |
|
|
0.32 |
|
|
| Syntax Systems Ltd |
|
(5) (8) (10) |
|
S + |
|
5.50% |
|
10.96% |
|
|
|
10/29/2028 |
|
35,093 |
|
|
34,830 |
|
|
34,469 |
|
|
2.00 |
|
|
| Syntax Systems Ltd |
|
(5) (8) (10) (13) |
|
S + |
|
5.50% |
|
10.96% |
|
|
|
10/29/2026 |
|
2,295 |
|
|
2,274 |
|
|
2,229 |
|
|
0.13 |
|
|
| Thrive Buyer, Inc. (Thrive Networks) |
|
(5) (6) (7) |
|
S + |
|
6.00% |
|
11.55% |
|
|
|
1/22/2027 |
|
22,937 |
|
|
22,634 |
|
|
22,516 |
|
|
1.31 |
|
|
| Thrive Buyer, Inc. (Thrive Networks) |
|
(5) (7) |
|
S + |
|
6.00% |
|
11.50% |
|
|
|
1/22/2027 |
|
16,912 |
|
|
16,705 |
|
|
16,577 |
|
|
0.96 |
|
|
| Thrive Buyer, Inc. (Thrive Networks) |
|
(5) (13) |
|
P + |
|
5.00% |
|
13.50% |
|
|
|
1/22/2027 |
|
661 |
|
|
639 |
|
|
621 |
|
|
0.04 |
|
|
| UpStack, Inc. |
|
(5) (7) |
|
S + |
|
5.75% |
|
11.60% |
|
|
|
8/20/2027 |
|
8,250 |
|
|
8,115 |
|
|
8,044 |
|
|
0.47 |
|
|
| UpStack, Inc. |
|
(5) (7) (13) |
|
S + |
|
6.25% |
|
11.60% |
|
|
|
8/20/2027 |
|
6,767 |
|
|
6,548 |
|
|
6,442 |
|
|
0.37 |
|
|
Morgan Stanley Direct Lending Fund
Consolidated Schedule of Investments
December 31, 2023
(In thousands)
|
|
|
|
|
|
|
|
|
|
|
|
|
|
|
|
|
|
|
|
|
|
|
|
|
|
|
|
|
|
|
|
|
|
|
|
|
|
|
|
|
|
|
|
|
|
|
|
|
|
|
|
|
|
|
|
|
|
|
|
|
|
Investments-non-controlled/non-affiliated(1)(2) |
|
Footnotes |
|
Reference Rate and Spread |
|
Interest Rate(3) |
|
|
|
Maturity Date |
|
Par Amount/ Shares |
|
Cost(4) |
|
Fair Value |
|
Percentage of Net Assets |
|
| UpStack, Inc. |
|
(5) (7) (13) |
|
S + |
|
6.25% |
|
11.60% |
|
|
|
8/20/2027 |
|
263 |
|
|
$ |
248 |
|
|
$ |
241 |
|
|
0.01 |
|
% |
|
|
|
|
|
|
|
|
|
|
|
|
|
|
|
|
230,636 |
|
|
224,725 |
|
|
13.06 |
|
|
| Leisure Products |
|
|
|
|
|
|
|
|
|
|
|
|
|
|
|
|
|
|
|
|
|
| GSM Acquisition Corp. (GSM Outdoors) |
|
(5) (6) (7) |
|
S + |
|
5.00% |
|
10.47% |
|
|
|
11/16/2026 |
|
17,269 |
|
|
17,170 |
|
|
17,096 |
|
|
0.99 |
|
|
| GSM Acquisition Corp. (GSM Outdoors) |
|
(5) (7) |
|
S + |
|
5.00% |
|
10.47% |
|
|
|
11/16/2026 |
|
4,445 |
|
|
4,411 |
|
|
4,400 |
|
|
0.26 |
|
|
| GSM Acquisition Corp. (GSM Outdoors) |
|
(5) (7) (13) |
|
S + |
|
5.00% |
|
10.47% |
|
|
|
11/16/2026 |
|
— |
|
|
(29) |
|
|
(43) |
|
|
— |
|
|
|
|
|
|
|
|
|
|
|
|
|
|
|
|
|
|
21,552 |
|
|
21,453 |
|
|
1.25 |
|
|
| Machinery |
|
|
|
|
|
|
|
|
|
|
|
|
|
|
|
|
|
|
|
|
|
| Answer Acquisition, LLC |
|
(5) (7) |
|
S + |
|
5.75% |
|
11.25% |
|
|
|
12/30/2026 |
|
10,611 |
|
|
10,472 |
|
|
10,454 |
|
|
0.61 |
|
|
| Answer Acquisition, LLC |
|
(5) (7) (13) |
|
S + |
|
5.75% |
|
11.25% |
|
|
|
12/30/2026 |
|
641 |
|
|
631 |
|
|
629 |
|
|
0.04 |
|
|
| Chase Intermediate, LLC |
|
(5) (13) |
|
S + |
|
5.25% |
|
11.00% |
|
|
|
10/30/2028 |
|
— |
|
|
(99) |
|
|
(196) |
|
|
(0.01) |
|
|
| Chase Intermediate, LLC |
|
(5) (13) |
|
S + |
|
5.25% |
|
11.00% |
|
|
|
10/30/2028 |
|
— |
|
|
(10) |
|
|
(10) |
|
|
— |
|
|
| Komline Sanderson Engineering Corp. |
|
(5) (6) (9) |
|
S + |
|
6.00% |
|
11.78% |
|
|
|
3/17/2026 |
|
17,218 |
|
|
17,124 |
|
|
16,681 |
|
|
0.97 |
|
|
| Komline Sanderson Engineering Corp. |
|
(5) (9) (13) |
|
S + |
|
6.00% |
|
11.78% |
|
|
|
3/17/2026 |
|
17,776 |
|
|
17,634 |
|
|
16,955 |
|
|
0.99 |
|
|
| Komline Sanderson Engineering Corp. |
|
(5) (13) |
|
P + |
|
5.00% |
|
13.50% |
|
|
|
3/17/2026 |
|
— |
|
|
(21) |
|
|
(148) |
|
|
(0.01) |
|
|
| MHE Intermediate Holdings, LLC |
|
(5) (6) (7) |
|
S + |
|
6.00% |
|
11.60% |
|
|
|
7/21/2027 |
|
19,165 |
|
|
18,905 |
|
|
18,990 |
|
|
1.10 |
|
|
| MHE Intermediate Holdings, LLC |
|
(5) (7) |
|
S + |
|
6.00% |
|
11.60% |
|
|
|
7/21/2027 |
|
3,674 |
|
|
3,624 |
|
|
3,636 |
|
|
0.21 |
|
|
| MHE Intermediate Holdings, LLC |
|
(5) (7) (13) |
|
S + |
|
6.00% |
|
11.60% |
|
|
|
7/21/2027 |
|
— |
|
|
(30) |
|
|
(25) |
|
|
— |
|
|
|
|
|
|
|
|
|
|
|
|
|
|
|
|
|
|
68,230 |
|
|
66,966 |
|
|
3.89 |
|
|
| Multi-Utilities |
|
|
|
|
|
|
|
|
|
|
|
|
|
|
|
|
|
|
|
|
|
| AWP Group Holdings, Inc. |
|
(5) (6) (7) |
|
S + |
|
5.50% |
|
10.95% |
|
|
|
12/24/2029 |
|
6,152 |
|
|
5,917 |
|
|
6,058 |
|
|
0.35 |
|
|
| AWP Group Holdings, Inc. |
|
(5) (7) (13) |
|
S + |
|
5.50% |
|
10.95% |
|
|
|
12/24/2029 |
|
79 |
|
|
63 |
|
|
54 |
|
|
— |
|
|
| AWP Group Holdings, Inc. |
|
(5) (7) (13) |
|
S + |
|
5.50% |
|
10.95% |
|
|
|
12/24/2029 |
|
170 |
|
|
154 |
|
|
158 |
|
|
0.01 |
|
|
| Ground Penetrating Radar Systems, LLC |
|
(5) (6) (7) |
|
S + |
|
4.50% |
|
10.03% |
|
|
|
6/26/2026 |
|
10,202 |
|
|
10,098 |
|
|
10,114 |
|
|
0.59 |
|
|
| Ground Penetrating Radar Systems, LLC |
|
(5) (7) (13) |
|
S + |
|
4.50% |
|
10.03% |
|
|
|
6/26/2025 |
|
— |
|
|
(11) |
|
|
(14) |
|
|
— |
|
|
| Vessco Midco Holdings, LLC |
|
(5) (6) (7) |
|
S + |
|
4.50% |
|
9.97% |
|
|
|
11/2/2026 |
|
2,687 |
|
|
2,673 |
|
|
2,687 |
|
|
0.16 |
|
|
| Vessco Midco Holdings, LLC |
|
(5) (7) |
|
S + |
|
4.50% |
|
9.97% |
|
|
|
11/2/2026 |
|
1,751 |
|
|
1,742 |
|
|
1,751 |
|
|
0.10 |
|
|
| Vessco Midco Holdings, LLC |
|
(5) (13) |
|
P + |
|
3.50% |
|
12.00% |
|
|
|
10/18/2026 |
|
20 |
|
|
18 |
|
|
20 |
|
|
— |
|
|
|
|
|
|
|
|
|
|
|
|
|
|
|
|
|
|
20,654 |
|
|
20,828 |
|
|
1.21 |
|
|
| Pharmaceuticals |
|
|
|
|
|
|
|
|
|
|
|
|
|
|
|
|
|
|
|
|
|
| Caerus US 1, Inc. |
|
(5) (8) (10) |
|
S + |
|
5.75% |
|
11.11% |
|
|
|
5/25/2029 |
|
11,038 |
|
|
10,846 |
|
|
11,038 |
|
|
0.64 |
|
|
| Caerus US 1, Inc. |
|
(5) (8) (10) (13) |
|
S + |
|
5.75% |
|
11.11% |
|
|
|
5/25/2029 |
|
713 |
|
|
693 |
|
|
713 |
|
|
0.04 |
|
|
| Caerus US 1, Inc. |
|
(5) (8) (10) (13) |
|
S + |
|
5.75% |
|
11.11% |
|
|
|
5/25/2029 |
|
878 |
|
|
859 |
|
|
878 |
|
|
0.05 |
|
|
|
|
|
|
|
|
|
|
|
|
|
|
|
|
|
|
12,398 |
|
|
12,629 |
|
|
0.73 |
|
|
| Professional Services |
|
|
|
|
|
|
|
|
|
|
|
|
|
|
|
|
|
|
|
|
|
| Abacus Data Holdings, Inc. (AbacusNext) |
|
(5) (6) (7) |
|
S + |
|
6.25% |
|
11.71% |
|
|
|
3/10/2027 |
|
18,427 |
|
|
18,180 |
|
|
18,427 |
|
|
1.07 |
|
|
| Abacus Data Holdings, Inc. (AbacusNext) |
|
(5) (7) |
|
S + |
|
6.25% |
|
11.71% |
|
|
|
3/10/2027 |
|
1,931 |
|
|
1,919 |
|
|
1,931 |
|
|
0.11 |
|
|
Morgan Stanley Direct Lending Fund
Consolidated Schedule of Investments
December 31, 2023
(In thousands)
|
|
|
|
|
|
|
|
|
|
|
|
|
|
|
|
|
|
|
|
|
|
|
|
|
|
|
|
|
|
|
|
|
|
|
|
|
|
|
|
|
|
|
|
|
|
|
|
|
|
|
|
|
|
|
|
|
|
|
|
|
|
Investments-non-controlled/non-affiliated(1)(2) |
|
Footnotes |
|
Reference Rate and Spread |
|
Interest Rate(3) |
|
|
|
Maturity Date |
|
Par Amount/ Shares |
|
Cost(4) |
|
Fair Value |
|
Percentage of Net Assets |
|
| Abacus Data Holdings, Inc. (AbacusNext) |
|
(5) (7) (13) |
|
S + |
|
6.25% |
|
11.71% |
|
|
|
3/10/2027 |
|
1,050 |
|
|
$ |
1,032 |
|
|
$ |
1,050 |
|
|
0.06 |
|
% |
| Bridgepointe Technologies, LLC |
|
(5) (7) |
|
S + |
|
6.50% |
|
12.00% |
|
|
|
12/31/2027 |
|
17,230 |
|
|
16,726 |
|
|
16,944 |
|
|
0.98 |
|
|
| Bridgepointe Technologies, LLC |
|
(5) (7) (13) |
|
S + |
|
6.50% |
|
12.00% |
|
|
|
12/31/2027 |
|
10,091 |
|
|
9,582 |
|
|
9,850 |
|
|
0.57 |
|
|
| Bullhorn, Inc. |
|
(5) (6) (7) |
|
S + |
|
5.50% |
|
10.96% |
|
|
|
9/30/2026 |
|
15,447 |
|
|
15,364 |
|
|
15,399 |
|
|
0.89 |
|
|
| Bullhorn, Inc. |
|
(5) (7) |
|
S + |
|
5.50% |
|
10.96% |
|
|
|
9/30/2026 |
|
63 |
|
|
61 |
|
|
62 |
|
|
— |
|
|
| Bullhorn, Inc. |
|
(5) (7) (13) |
|
S + |
|
5.50% |
|
10.96% |
|
|
|
9/30/2026 |
|
— |
|
|
(4) |
|
|
(2) |
|
|
— |
|
|
| Citrin Cooperman Advisors, LLC |
|
(5) (8) |
|
S + |
|
5.75% |
|
11.37% |
|
|
|
10/1/2027 |
|
24,505 |
|
|
24,123 |
|
|
24,486 |
|
|
1.42 |
|
|
| Citrin Cooperman Advisors, LLC |
|
(5) (8) (13) |
|
S + |
|
5.75% |
|
11.37% |
|
|
|
10/1/2027 |
|
9,330 |
|
|
9,115 |
|
|
9,260 |
|
|
0.54 |
|
|
| GPS Merger Sub, LLC |
|
(5) (6) (7) |
|
S + |
|
6.00% |
|
11.38% |
|
|
|
10/2/2029 |
|
4,927 |
|
|
4,831 |
|
|
4,831 |
|
|
0.28 |
|
|
| GPS Merger Sub, LLC |
|
(5) (7) (13) |
|
S + |
|
6.00% |
|
11.38% |
|
|
|
10/2/2029 |
|
— |
|
|
(12) |
|
|
(12) |
|
|
— |
|
|
| GPS Merger Sub, LLC |
|
(5) (7) (13) |
|
S + |
|
6.00% |
|
11.38% |
|
|
|
10/2/2029 |
|
— |
|
|
(20) |
|
|
(20) |
|
|
— |
|
|
| KENG Acquisition, Inc. |
|
(5) (7) |
|
S + |
|
6.25% |
|
11.60% |
|
|
|
8/1/2029 |
|
3,221 |
|
|
3,144 |
|
|
3,180 |
|
|
0.18 |
|
|
| KENG Acquisition, Inc. |
|
(5) (7) (13) |
|
S + |
|
6.25% |
|
11.60% |
|
|
|
8/1/2029 |
|
400 |
|
|
367 |
|
|
369 |
|
|
0.02 |
|
|
| KENG Acquisition, Inc. |
|
(5) (7) (13) |
|
S + |
|
6.25% |
|
11.60% |
|
|
|
8/1/2029 |
|
98 |
|
|
77 |
|
|
86 |
|
|
— |
|
|
| KWOR Acquisition, Inc. |
|
(5) (7) |
|
S + |
|
5.25% |
|
10.71% |
|
|
|
12/22/2028 |
|
5,333 |
|
|
5,250 |
|
|
5,257 |
|
|
0.31 |
|
|
| KWOR Acquisition, Inc. |
|
(5) (7) (13) |
|
S + |
|
5.25% |
|
10.71% |
|
|
|
12/22/2028 |
|
1,301 |
|
|
1,253 |
|
|
1,233 |
|
|
0.07 |
|
|
| KWOR Acquisition, Inc. |
|
(5) (13) |
|
P + |
|
4.25% |
|
12.75% |
|
|
|
12/22/2027 |
|
52 |
|
|
51 |
|
|
51 |
|
|
— |
|
|
| Project Boost Purchaser, LLC |
|
(5) (8) |
|
S + |
|
5.25% |
|
10.64% |
|
|
|
5/2/2029 |
|
5,668 |
|
|
5,623 |
|
|
5,662 |
|
|
0.33 |
|
|
| Project Boost Purchaser, LLC |
|
(5) (8) (13) |
|
S + |
|
5.25% |
|
10.64% |
|
|
|
5/2/2029 |
|
— |
|
|
(4) |
|
|
(1) |
|
|
— |
|
|
| Project Boost Purchaser, LLC |
|
(5) (8) (13) |
|
S + |
|
5.25% |
|
10.64% |
|
|
|
5/2/2028 |
|
— |
|
|
(3) |
|
|
— |
|
|
— |
|
|
|
|
|
|
|
|
|
|
|
|
|
|
|
|
|
|
116,655 |
|
|
118,043 |
|
|
6.86 |
|
|
| Real Estate Management & Development |
|
|
|
|
|
|
|
|
|
|
|
|
|
|
|
|
|
|
|
|
|
| Associations, Inc. |
|
(5) (6) (7) |
|
S + |
|
6.50% (incl. 2.50% PIK) |
|
12.17% |
|
|
|
7/2/2027 |
|
17,780 |
|
|
17,669 |
|
|
17,610 |
|
|
1.02 |
|
|
| Associations, Inc. |
|
(5) (7) (13) |
|
S + |
|
6.50% (incl. 2.50% PIK) |
|
12.17% |
|
|
|
7/2/2027 |
|
21,896 |
|
|
21,757 |
|
|
21,687 |
|
|
1.26 |
|
|
| Associations, Inc. |
|
(5) (7) (13) |
|
S + |
|
6.50% (incl. 2.50% PIK) |
|
12.17% |
|
|
|
7/2/2027 |
|
657 |
|
|
646 |
|
|
640 |
|
|
0.04 |
|
|
| MRI Software, LLC |
|
(5) (6) (7) |
|
S + |
|
5.50% |
|
10.90% |
|
|
|
2/10/2027 |
|
59,262 |
|
|
58,975 |
|
|
58,936 |
|
|
3.42 |
|
|
| MRI Software, LLC |
|
(5) (7) (13) |
|
S + |
|
5.50% |
|
10.90% |
|
|
|
2/10/2027 |
|
— |
|
|
— |
|
|
— |
|
|
— |
|
|
| MRI Software, LLC |
|
(5) (7) (13) |
|
S + |
|
5.50% |
|
10.90% |
|
|
|
2/10/2027 |
|
— |
|
|
(8) |
|
|
(12) |
|
|
— |
|
|
| Pritchard Industries, LLC |
|
(5) (8) |
|
S + |
|
5.50% |
|
10.94% |
|
|
|
10/13/2027 |
|
25,274 |
|
|
24,925 |
|
|
24,771 |
|
|
1.44 |
|
|
| Pritchard Industries, LLC |
|
(5) (8) |
|
S + |
|
5.50% |
|
10.94% |
|
|
|
10/13/2027 |
|
6,043 |
|
|
5,956 |
|
|
5,922 |
|
|
0.34 |
|
|
| Zarya Intermediate, LLC |
|
(5) (7) (10) |
|
S + |
|
6.50% |
|
11.89% |
|
|
|
7/1/2027 |
|
35,408 |
|
|
35,408 |
|
|
35,408 |
|
|
2.06 |
|
|
| Zarya Intermediate, LLC |
|
(5) (7) (10) (13) |
|
S + |
|
6.50% |
|
11.89% |
|
|
|
7/1/2027 |
|
3,128 |
|
|
3,128 |
|
|
3,128 |
|
|
0.18 |
|
|
|
|
|
|
|
|
|
|
|
|
|
|
|
|
|
|
168,456 |
|
|
168,090 |
|
|
9.77 |
|
|
|
|
|
|
|
|
|
|
|
|
|
|
|
|
|
|
|
|
|
|
|
|
Morgan Stanley Direct Lending Fund
Consolidated Schedule of Investments
December 31, 2023
(In thousands)
|
|
|
|
|
|
|
|
|
|
|
|
|
|
|
|
|
|
|
|
|
|
|
|
|
|
|
|
|
|
|
|
|
|
|
|
|
|
|
|
|
|
|
|
|
|
|
|
|
|
|
|
|
|
|
|
|
|
|
|
|
|
Investments-non-controlled/non-affiliated(1)(2) |
|
Footnotes |
|
Reference Rate and Spread |
|
Interest Rate(3) |
|
|
|
Maturity Date |
|
Par Amount/ Shares |
|
Cost(4) |
|
Fair Value |
|
Percentage of Net Assets |
|
| Software |
|
|
|
|
|
|
|
|
|
|
|
|
|
|
|
|
|
|
|
|
|
| Alert Media, Inc. |
|
(5) (6) (7) |
|
S + |
|
6.25% |
|
13.08% |
|
|
|
4/12/2027 |
|
19,283 |
|
|
$ |
19,048 |
|
|
$ |
18,983 |
|
|
1.10 |
|
% |
| Alert Media, Inc. |
|
(5) (7) (13) |
|
S + |
|
6.25% |
|
13.08% |
|
|
|
4/12/2027 |
|
— |
|
|
(37) |
|
|
(53) |
|
|
— |
|
|
| Anaplan, Inc. |
|
(5) (8) |
|
S + |
|
6.50% |
|
11.85% |
|
|
|
6/21/2029 |
|
24,000 |
|
|
23,597 |
|
|
24,000 |
|
|
1.39 |
|
|
| Appfire Technologies, LLC |
|
(5) (7) |
|
S + |
|
5.65% |
|
11.03% |
|
|
|
3/9/2027 |
|
18,667 |
|
|
18,576 |
|
|
18,426 |
|
|
1.07 |
|
|
| Appfire Technologies, LLC |
|
(5) (7) (13) |
|
S + |
|
5.65% |
|
11.03% |
|
|
|
3/9/2027 |
|
— |
|
|
(9) |
|
|
(14) |
|
|
— |
|
|
| Appfire Technologies, LLC |
|
(5) (13) |
|
P + |
|
4.50% |
|
13.00% |
|
|
|
3/9/2027 |
|
38 |
|
|
36 |
|
|
36 |
|
|
— |
|
|
| Bottomline Technologies, Inc. |
|
(5) (8) |
|
S + |
|
5.25% |
|
10.68% |
|
|
|
5/14/2029 |
|
3,692 |
|
|
3,630 |
|
|
3,682 |
|
|
0.21 |
|
|
| Bottomline Technologies, Inc. |
|
(5) (8) (13) |
|
S + |
|
5.25% |
|
10.68% |
|
|
|
5/15/2028 |
|
— |
|
|
(4) |
|
|
— |
|
|
— |
|
|
| CLEO Communications Holding, LLC |
|
(5) (6) (7) |
|
S + |
|
6.50% |
|
11.96% |
|
|
|
6/9/2027 |
|
39,998 |
|
|
39,743 |
|
|
39,370 |
|
|
2.29 |
|
|
| CLEO Communications Holding, LLC |
|
(5) (7) (13) |
|
S + |
|
6.50% |
|
11.96% |
|
|
|
6/9/2027 |
|
— |
|
|
(72) |
|
|
(196) |
|
|
(0.01) |
|
|
| Coupa Holdings, LLC |
|
(5) (8) |
|
S + |
|
7.50% |
|
12.86% |
|
|
|
2/27/2030 |
|
2,264 |
|
|
2,212 |
|
|
2,239 |
|
|
0.13 |
|
|
| Coupa Holdings, LLC |
|
(5) (8) (13) |
|
S + |
|
7.50% |
|
12.86% |
|
|
|
2/27/2030 |
|
— |
|
|
(12) |
|
|
(12) |
|
|
— |
|
|
| Coupa Holdings, LLC |
|
(5) (8) (13) |
|
S + |
|
7.50% |
|
12.86% |
|
|
|
2/27/2029 |
|
— |
|
|
(18) |
|
|
(9) |
|
|
— |
|
|
| Cyara AcquisitionCo, LLC |
|
(5) (7) |
|
S + |
|
6.75% (incl. 2.75% PIK) |
|
12.08% |
|
|
|
6/28/2029 |
|
4,664 |
|
|
4,545 |
|
|
4,580 |
|
|
0.27 |
|
|
| Cyara AcquisitionCo, LLC |
|
(5) (7) (13) |
|
S + |
|
6.75% (incl. 2.75% PIK) |
|
12.08% |
|
|
|
6/28/2029 |
|
— |
|
|
(8) |
|
|
(6) |
|
|
— |
|
|
| Diligent Corporation |
|
(5) (6) (7) |
|
S + |
|
5.75% |
|
11.28% |
|
|
|
8/4/2025 |
|
29,740 |
|
|
29,629 |
|
|
29,678 |
|
|
1.72 |
|
|
| Diligent Corporation |
|
(5) (6) (7) |
|
S + |
|
5.75% |
|
11.23% |
|
|
|
8/4/2025 |
|
2,179 |
|
|
2,170 |
|
|
2,174 |
|
|
0.13 |
|
|
| Diligent Corporation |
|
(5) (7) (13) |
|
S + |
|
5.75% |
|
11.23% |
|
|
|
8/4/2025 |
|
2,430 |
|
|
2,413 |
|
|
2,421 |
|
|
0.14 |
|
|
| E-Discovery AcquireCo, LLC |
|
(5) (7) |
|
S + |
|
6.50% |
|
11.89% |
|
|
|
8/29/2029 |
|
17,795 |
|
|
17,368 |
|
|
17,482 |
|
|
1.02 |
|
|
| E-Discovery AcquireCo, LLC |
|
(5) (7) (13) |
|
S + |
|
6.50% |
|
11.89% |
|
|
|
8/29/2029 |
|
— |
|
|
(38) |
|
|
(29) |
|
|
— |
|
|
| Fullsteam Operations, LLC |
|
(5) (7) |
|
S + |
|
8.25% |
|
13.78% |
|
|
|
11/27/2029 |
|
10,860 |
|
|
10,538 |
|
|
10,538 |
|
|
0.61 |
|
|
| Fullsteam Operations, LLC |
|
(5) (7) (13) |
|
S + |
|
8.25% |
|
13.78% |
|
|
|
11/27/2029 |
|
1,034 |
|
|
947 |
|
|
946 |
|
|
0.05 |
|
|
| Fullsteam Operations, LLC |
|
(5) (7) (13) |
|
S + |
|
8.25% |
|
13.78% |
|
|
|
11/27/2029 |
|
— |
|
|
(18) |
|
|
(18) |
|
|
— |
|
|
| GS AcquisitionCo, Inc. |
|
(5) (6) (7) |
|
S + |
|
5.50% |
|
11.00% |
|
|
|
5/22/2026 |
|
75,145 |
|
|
74,784 |
|
|
75,145 |
|
|
4.37 |
|
|
| GS AcquisitionCo, Inc. |
|
(5) (7) (13) |
|
S + |
|
5.50% |
|
11.00% |
|
|
|
5/22/2026 |
|
— |
|
|
(13) |
|
|
— |
|
|
— |
|
|
| Kaseya, Inc. |
|
(5) (8) |
|
S + |
|
6.00% (incl. 2.50% PIK) |
|
11.38% |
|
|
|
6/25/2029 |
|
14,219 |
|
|
14,043 |
|
|
14,155 |
|
|
0.82 |
|
|
| Kaseya, Inc. |
|
(5) (8) (13) |
|
S + |
|
6.00% (incl. 2.50% PIK) |
|
11.38% |
|
|
|
6/25/2029 |
|
53 |
|
|
47 |
|
|
49 |
|
|
— |
|
|
| Kaseya, Inc. |
|
(5) (8) (13) |
|
S + |
|
6.00% (incl. 2.50% PIK) |
|
11.38% |
|
|
|
6/25/2029 |
|
216 |
|
|
206 |
|
|
212 |
|
|
0.01 |
|
|
| LegitScript, LLC |
|
(5) (8) |
|
S + |
|
5.75% |
|
11.11% |
|
|
|
6/24/2029 |
|
26,569 |
|
|
26,128 |
|
|
26,332 |
|
|
1.53 |
|
|
| LegitScript, LLC |
|
(5) (8) (13) |
|
S + |
|
5.75% |
|
11.11% |
|
|
|
6/24/2029 |
|
702 |
|
|
641 |
|
|
637 |
|
|
0.04 |
|
|
| LegitScript, LLC |
|
(5) (8) (13) |
|
S + |
|
5.75% |
|
11.11% |
|
|
|
6/24/2028 |
|
1,000 |
|
|
938 |
|
|
963 |
|
|
0.06 |
|
|
Morgan Stanley Direct Lending Fund
Consolidated Schedule of Investments
December 31, 2023
(In thousands)
|
|
|
|
|
|
|
|
|
|
|
|
|
|
|
|
|
|
|
|
|
|
|
|
|
|
|
|
|
|
|
|
|
|
|
|
|
|
|
|
|
|
|
|
|
|
|
|
|
|
|
|
|
|
|
|
|
|
|
|
|
|
Investments-non-controlled/non-affiliated(1)(2) |
|
Footnotes |
|
Reference Rate and Spread |
|
Interest Rate(3) |
|
|
|
Maturity Date |
|
Par Amount/ Shares |
|
Cost(4) |
|
Fair Value |
|
Percentage of Net Assets |
|
| Matrix Parent, Inc. |
|
(8) |
|
S + |
|
5.00% |
|
10.35% |
|
|
|
3/1/2029 |
|
499 |
|
|
$ |
370 |
|
|
$ |
339 |
|
|
0.02 |
|
% |
| Montana Buyer, Inc. |
|
(5) (8) |
|
S + |
|
5.75% |
|
11.11% |
|
|
|
7/22/2029 |
|
4,089 |
|
|
4,020 |
|
|
4,056 |
|
|
0.24 |
|
|
| Montana Buyer, Inc. |
|
(5) (13) |
|
P + |
|
4.75% |
|
13.25% |
|
|
|
7/22/2028 |
|
67 |
|
|
60 |
|
|
63 |
|
|
— |
|
|
| Netwrix Corporation And Concept Searching, Inc. |
|
(5) (8) |
|
S + |
|
5.00% |
|
10.39% |
|
|
|
6/11/2029 |
|
5,489 |
|
|
5,446 |
|
|
5,407 |
|
|
0.31 |
|
|
| Netwrix Corporation And Concept Searching, Inc. |
|
(5) (8) (13) |
|
S + |
|
5.00% |
|
10.39% |
|
|
|
6/11/2029 |
|
— |
|
|
(7) |
|
|
(23) |
|
|
— |
|
|
| Netwrix Corporation And Concept Searching, Inc. |
|
(5) (8) (13) |
|
S + |
|
5.00% |
|
10.39% |
|
|
|
6/11/2029 |
|
— |
|
|
(3) |
|
|
(6) |
|
|
— |
|
|
| Oak Purchaser, Inc. |
|
(5) (8) |
|
S + |
|
5.50% |
|
10.85% |
|
|
|
4/28/2028 |
|
2,792 |
|
|
2,770 |
|
|
2,732 |
|
|
0.16 |
|
|
| Oak Purchaser, Inc. |
|
(5) (8) (13) |
|
S + |
|
5.50% |
|
10.85% |
|
|
|
4/28/2028 |
|
1,735 |
|
|
1,721 |
|
|
1,694 |
|
|
0.10 |
|
|
| Oak Purchaser, Inc. |
|
(5) (8) (13) |
|
S + |
|
5.50% |
|
10.85% |
|
|
|
4/28/2028 |
|
— |
|
|
(3) |
|
|
(8) |
|
|
— |
|
|
| Pound Bidco, Inc. |
|
(5) (6) (7) (10) |
|
S + |
|
6.50% |
|
11.96% |
|
|
|
1/30/2026 |
|
10,832 |
|
|
10,707 |
|
|
10,796 |
|
|
0.63 |
|
|
| Pound Bidco, Inc. |
|
(5) (7) (10) (13) |
|
S + |
|
6.50% |
|
11.96% |
|
|
|
1/30/2026 |
|
— |
|
|
— |
|
|
— |
|
|
— |
|
|
| Pound Bidco, Inc. |
|
(5) (6) (7) (10) (13) |
|
S + |
|
6.50% |
|
11.96% |
|
|
|
1/30/2026 |
|
— |
|
|
(10) |
|
|
— |
|
|
— |
|
|
| Project Leopard Holdings, Inc. |
|
(9) (10) |
|
S + |
|
5.25% |
|
10.73% |
|
|
|
7/20/2029 |
|
6,217 |
|
|
5,849 |
|
|
5,590 |
|
|
0.32 |
|
|
| Revalize, Inc. |
|
(5) (7) |
|
S + |
|
5.75% |
|
11.21% |
|
|
|
4/15/2027 |
|
19,455 |
|
|
19,376 |
|
|
19,053 |
|
|
1.11 |
|
|
| Revalize, Inc. |
|
(5) (7) (13) |
|
S + |
|
5.75% |
|
11.21% |
|
|
|
4/15/2027 |
|
18 |
|
|
17 |
|
|
16 |
|
|
— |
|
|
| Riskonnect Parent, LLC |
|
(5) (8) |
|
S + |
|
5.50% |
|
11.00% |
|
|
|
12/7/2028 |
|
519 |
|
|
511 |
|
|
518 |
|
|
0.03 |
|
|
| Riskonnect Parent, LLC |
|
(5) (8) (13) |
|
S + |
|
5.50% |
|
11.00% |
|
|
|
12/7/2028 |
|
— |
|
|
(5) |
|
|
(1) |
|
|
— |
|
|
| Securonix, Inc. |
|
(5) (8) |
|
S + |
|
6.00% |
|
11.41% |
|
|
|
4/5/2028 |
|
21,010 |
|
|
20,727 |
|
|
19,846 |
|
|
1.15 |
|
|
| Securonix, Inc. |
|
(5) (8) (13) |
|
S + |
|
6.00% |
|
11.41% |
|
|
|
4/5/2028 |
|
— |
|
|
(47) |
|
|
(210) |
|
|
(0.01) |
|
|
| Skykick, Inc. |
|
(5) (7) |
|
S + |
|
10.25% (incl. 7.00% PIK) |
|
15.91% |
|
|
|
9/1/2027 |
|
7,754 |
|
|
7,647 |
|
|
7,181 |
|
|
0.42 |
|
|
| Skykick, Inc. |
|
(5) (7) |
|
S + |
|
10.25% (incl. 7.00% PIK) |
|
15.91% |
|
|
|
9/1/2027 |
|
2,470 |
|
|
2,426 |
|
|
2,250 |
|
|
0.13 |
|
|
| Trunk Acquisition, Inc. |
|
(5) (7) |
|
S + |
|
5.75% |
|
11.25% |
|
|
|
2/19/2027 |
|
8,960 |
|
|
8,901 |
|
|
8,797 |
|
|
0.51 |
|
|
| Trunk Acquisition, Inc. |
|
(5) (7) (13) |
|
S + |
|
5.75% |
|
11.25% |
|
|
|
2/19/2026 |
|
— |
|
|
(4) |
|
|
(16) |
|
|
— |
|
|
| User Zoom Technologies, Inc. |
|
(5) (8) |
|
S + |
|
7.00% |
|
12.49% |
|
|
|
4/5/2029 |
|
38,689 |
|
|
38,050 |
|
|
38,070 |
|
|
2.21 |
|
|
|
|
|
|
|
|
|
|
|
|
|
|
|
|
|
|
419,529 |
|
|
417,855 |
|
|
24.28 |
|
|
| Wireless Telecommunication Services |
|
|
|
|
|
|
|
|
|
|
|
|
|
|
|
|
|
|
|
|
|
| Mobile Communications America, Inc. |
|
(5) (6) (7) |
|
S + |
|
6.00% |
|
11.35% |
|
|
|
10/16/2029 |
|
5,955 |
|
|
5,868 |
|
|
5,868 |
|
|
0.34 |
|
|
| Mobile Communications America, Inc. |
|
(5) (7) (13) |
|
S + |
|
6.00% |
|
11.35% |
|
|
|
10/16/2029 |
|
— |
|
|
(14) |
|
|
(14) |
|
|
— |
|
|
| Mobile Communications America, Inc. |
|
(5) (7) (13) |
|
S + |
|
6.00% |
|
11.35% |
|
|
|
10/16/2029 |
|
— |
|
|
(14) |
|
|
(14) |
|
|
— |
|
|
|
|
|
|
|
|
|
|
|
|
|
|
|
|
|
|
5,840 |
|
|
5,840 |
|
|
0.34 |
|
|
| Total First Lien Debt |
|
|
|
|
|
|
|
|
|
|
|
|
|
|
|
$ |
3,027,413 |
|
|
$ |
3,004,544 |
|
|
174.57 |
|
% |
| Second Lien Debt |
|
|
|
|
|
|
|
|
|
|
|
|
|
|
|
|
|
|
|
|
|
| Air Freight & Logistics |
|
|
|
|
|
|
|
|
|
|
|
|
|
|
|
|
|
|
|
|
|
| Omni Intermediate Holdings, LLC |
|
(5) (7) |
|
S + |
|
9.15% |
|
14.53% |
|
|
|
12/30/2027 |
|
4,500 |
|
|
$ |
4,393 |
|
|
$ |
4,223 |
|
|
0.25 |
|
% |
| Automobile Components |
|
|
|
|
|
|
|
|
|
|
|
|
|
|
|
|
|
|
|
|
|
Morgan Stanley Direct Lending Fund
Consolidated Schedule of Investments
December 31, 2023
(In thousands)
|
|
|
|
|
|
|
|
|
|
|
|
|
|
|
|
|
|
|
|
|
|
|
|
|
|
|
|
|
|
|
|
|
|
|
|
|
|
|
|
|
|
|
|
|
|
|
|
|
|
|
|
|
|
|
|
|
|
|
|
|
|
Investments-non-controlled/non-affiliated(1)(2) |
|
Footnotes |
|
Reference Rate and Spread |
|
Interest Rate(3) |
|
|
|
Maturity Date |
|
Par Amount/ Shares |
|
Cost(4) |
|
Fair Value |
|
Percentage of Net Assets |
|
| PAI Holdco, Inc. |
|
(5) (7) |
|
S + |
|
7.50% (incl. 2.00% PIK) |
|
13.03% |
|
|
|
10/28/2028 |
|
26,565 |
|
|
$ |
26,053 |
|
|
$ |
24,823 |
|
|
1.44 |
|
% |
|
|
|
|
|
|
|
|
|
|
|
|
|
|
|
|
|
|
|
|
|
|
| Electronic Equipment, Instruments & Components |
|
|
|
|
|
|
|
|
|
|
|
|
|
|
|
|
|
|
|
|
|
| Infinite Bidco, LLC |
|
(9) |
|
S + |
|
7.00% |
|
12.65% |
|
|
|
3/2/2029 |
|
25,500 |
|
|
25,446 |
|
|
21,420 |
|
|
1.24 |
|
|
| Energy Equipment & Services |
|
|
|
|
|
|
|
|
|
|
|
|
|
|
|
|
|
|
|
|
|
| QBS Parent, Inc. |
|
(5) |
|
S + |
|
8.50% |
|
14.04% |
|
|
|
9/21/2026 |
|
15,000 |
|
|
14,853 |
|
|
14,400 |
|
|
0.84 |
|
|
| Health Care Providers & Services |
|
|
|
|
|
|
|
|
|
|
|
|
|
|
|
|
|
|
|
|
|
| Heartland Veterinary Partners, LLC |
|
(5) (7) |
|
S + |
|
8.00% |
|
13.46% |
|
|
|
12/10/2027 |
|
3,960 |
|
|
3,903 |
|
|
3,879 |
|
|
0.23 |
|
|
| Heartland Veterinary Partners, LLC |
|
(5) (7) |
|
S + |
|
8.00% |
|
13.46% |
|
|
|
12/10/2027 |
|
1,540 |
|
|
1,516 |
|
|
1,508 |
|
|
0.09 |
|
|
|
|
|
|
|
|
|
|
|
|
|
|
|
|
|
|
5,419 |
|
|
5,387 |
|
|
0.31 |
|
|
| Industrial Conglomerates |
|
|
|
|
|
|
|
|
|
|
|
|
|
|
|
|
|
|
|
|
|
| Aptean, Inc. |
|
(5)(8) |
|
S + |
|
7.00% |
|
12.46% |
|
|
|
4/23/2027 |
|
5,950 |
|
|
5,950 |
|
|
5,950 |
|
|
0.35 |
|
|
| IT Services |
|
|
|
|
|
|
|
|
|
|
|
|
|
|
|
|
|
|
|
|
|
| Help/Systems Holdings, Inc. |
|
(8) |
|
S + |
|
6.75% |
|
12.35% |
|
|
|
11/19/2027 |
|
17,500 |
|
|
17,500 |
|
|
14,147 |
|
|
0.82 |
|
|
| Idera, Inc. |
|
(5) (8) |
|
S + |
|
6.75% |
|
12.28% |
|
|
|
3/2/2029 |
|
3,887 |
|
|
3,865 |
|
|
3,887 |
|
|
0.23 |
|
|
| Red Dawn SEI Buyer, Inc. |
|
(5) (7) |
|
S + |
|
8.50% |
|
13.86% |
|
|
|
11/20/2026 |
|
19,000 |
|
|
18,727 |
|
|
18,945 |
|
|
1.10 |
|
|
|
|
|
|
|
|
|
|
|
|
|
|
|
|
|
|
40,092 |
|
|
36,979 |
|
|
2.15 |
|
|
| Software |
|
|
|
|
|
|
|
|
|
|
|
|
|
|
|
|
|
|
|
|
|
| Flexera Software, LLC |
|
(5) (7) |
|
S + |
|
7.00% |
|
12.47% |
|
|
|
3/3/2029 |
|
13,500 |
|
|
13,303 |
|
|
13,500 |
|
|
0.78 |
|
|
| Matrix Parent, Inc. |
|
(5) (9) (11) |
|
S + |
|
8.00% |
|
13.53% |
|
|
|
3/1/2030 |
|
10,667 |
|
|
10,505 |
|
|
5,733 |
|
|
0.33 |
|
|
|
|
|
|
|
|
|
|
|
|
|
|
|
|
|
|
23,808 |
|
|
19,233 |
|
|
1.12 |
|
|
| Total Second Lien Debt |
|
|
|
|
|
|
|
|
|
|
|
|
|
|
|
$ |
146,014 |
|
|
$ |
132,415 |
|
|
7.69 |
|
% |
| Other Investments |
|
|
|
|
|
|
|
|
|
|
|
|
|
|
|
|
|
|
|
|
|
| Unsecured Debt |
|
|
|
|
|
|
|
|
|
|
|
|
|
|
|
|
|
|
|
|
|
| Familia Intermediate Holdings I Corp. (Teasdale Latin Foods) |
|
(5) (11) |
|
|
|
16.25% PIK |
|
|
|
|
|
6/18/2026 |
|
1,500 |
|
|
$ |
1,500 |
|
|
$ |
170 |
|
|
0.01 |
|
% |
| Fetch Insurance Services, LLC |
|
(5) |
|
|
|
12.75% (incl. 3.75% PIK) |
|
|
|
|
|
10/31/2027 |
|
1,953 |
|
|
1,910 |
|
|
1,894 |
|
|
0.11 |
|
|
| Total Unsecured Debt |
|
|
|
|
|
|
|
|
|
|
|
|
|
|
|
$ |
3,410 |
|
|
$ |
2,064 |
|
|
0.12 |
|
% |
Morgan Stanley Direct Lending Fund
Consolidated Schedule of Investments
December 31, 2023
(In thousands)
|
|
|
|
|
|
|
|
|
|
|
|
|
|
|
|
|
|
|
|
|
|
|
|
|
|
|
|
|
|
|
|
|
|
|
|
|
|
|
|
|
|
|
|
|
|
Investments-non-controlled/non-affiliated(1)(2) |
|
Footnotes |
|
Reference Rate and Spread |
|
|
|
Acquisition Date |
|
|
|
Par Amount/ Shares |
|
Cost(4) |
|
Fair Value |
|
Percentage of Net Assets |
|
| Preferred Equity |
|
|
|
|
|
|
|
|
|
|
|
|
|
|
|
|
|
|
|
|
|
| Diligent Corporation |
|
(5) (12) |
|
|
|
10.50% |
|
|
|
4/5/2021 |
|
|
|
5,000 |
|
|
$ |
6,329 |
|
|
$ |
6,513 |
|
|
0.38 |
|
% |
| FORTIS Solutions Group, LLC |
|
(5) (12) |
|
|
|
12.25% |
|
|
|
6/24/2022 |
|
|
|
1,000,000 |
|
|
1,179 |
|
|
970 |
|
|
0.06 |
|
|
| Integrity Marketing Acquisition, LLC |
|
(5) (12) |
|
|
|
10.50% |
|
|
|
12/21/2021 |
|
|
|
3,250,000 |
|
|
3,956 |
|
|
3,900 |
|
|
0.23 |
|
|
| Knockout Intermediate Holdings I, Inc. |
|
(5) (12) |
|
|
|
11.75% |
|
|
|
6/25/2022 |
|
|
|
2,790 |
|
|
3,265 |
|
|
3,267 |
|
|
0.19 |
|
|
| Revalize, Inc. |
|
(5) (7) (12) |
|
S + |
|
10.00% |
|
|
|
12/14/2021 |
|
|
|
2,255 |
|
|
2,776 |
|
|
2,833 |
|
|
0.16 |
|
|
| RSK Holdings, Inc. (Riskonnect) |
|
(5) (8) (12) |
|
S + |
|
10.50% |
|
|
|
7/7/2022 |
|
|
|
1,012,200 |
|
|
1,137 |
|
|
1,275 |
|
|
0.07 |
|
|
| Skykick, Inc. |
|
(5) (12) |
|
|
|
|
|
|
|
8/31/2021 |
|
|
|
134,101 |
|
|
1,275 |
|
|
1,275 |
|
|
0.07 |
|
|
| Total Preferred Equity |
|
|
|
|
|
|
|
|
|
|
|
|
|
|
|
$ |
19,917 |
|
|
$ |
20,033 |
|
|
1.16 |
|
% |
| Common Equity |
|
|
|
|
|
|
|
|
|
|
|
|
|
|
|
|
|
|
|
|
|
| Abacus Data Holdings, Inc. (AbacusNext) |
|
(5) (12) |
|
|
|
|
|
|
|
3/9/2021 |
|
|
|
29,441 |
|
|
$ |
2,944 |
|
|
$ |
2,586 |
|
|
0.15 |
|
% |
| Amerilife Holdings, LLC |
|
(5) (12) |
|
|
|
|
|
|
|
9/1/2022 |
|
|
|
908 |
|
|
25 |
|
|
33 |
|
|
0.00 |
|
|
| BP Purchaser, LLC |
|
(5) (12) |
|
|
|
|
|
|
|
12/10/2021 |
|
|
|
1,383,156 |
|
|
1,378 |
|
|
1,297 |
|
|
0.08 |
|
|
| CSC Thrive Holdings, LP (Thrive Networks) |
|
(5) (12) |
|
|
|
|
|
|
|
3/1/2021 |
|
|
|
162,309 |
|
|
421 |
|
|
855 |
|
|
0.05 |
|
|
| Encore Holdings, LLC |
|
(5) (12) |
|
|
|
|
|
|
|
11/23/2021 |
|
|
|
2,796 |
|
|
348 |
|
|
696 |
|
|
0.04 |
|
|
| Frisbee Holdings, LP (Fetch) |
|
(5) (12) |
|
|
|
|
|
|
|
10/31/2022 |
|
|
|
21,744 |
|
|
277 |
|
|
277 |
|
|
0.02 |
|
|
| Fullsteam Operations, LLC |
|
(5) (12) |
|
|
|
|
|
|
|
11/27/2023 |
|
|
|
3,043 |
|
|
100 |
|
|
100 |
|
|
0.01 |
|
|
| GSM Equity Investors, LP (GSM Outdoors) |
|
(5) (12) |
|
|
|
|
|
|
|
11/16/2020 |
|
|
|
4,500 |
|
|
450 |
|
|
884 |
|
|
0.05 |
|
|
| Help HP SCF Investor, LP (Help/Systems) |
|
(10) (12) |
|
|
|
|
|
|
|
5/12/2021 |
|
|
|
9,619,564 |
|
|
12,460 |
|
|
15,966 |
|
|
0.93 |
|
|
| LUV Car Wash |
|
(5) (12) |
|
|
|
|
|
|
|
4/6/2022 |
|
|
|
123 |
|
|
123 |
|
|
68 |
|
|
0.00 |
|
|
| mPulse Mobile, Inc. |
|
(5) (12) |
|
|
|
|
|
|
|
12/17/2021 |
|
|
|
165,761 |
|
|
1,220 |
|
|
1,218 |
|
|
0.07 |
|
|
| PCX Holding Corp. |
|
(5) (12) |
|
|
|
|
|
|
|
4/22/2021 |
|
|
|
6,538 |
|
|
654 |
|
|
675 |
|
|
0.04 |
|
|
| Pet Holdings, Inc. (Brightpet) |
|
(5) (12) |
|
|
|
|
|
|
|
10/6/2020 |
|
|
|
17,543 |
|
|
2,013 |
|
|
1,762 |
|
|
0.10 |
|
|
| Pritchard Industries, Inc. |
|
(5) (12) |
|
|
|
|
|
|
|
10/13/2021 |
|
|
|
1,700,000 |
|
|
1,700 |
|
|
1,785 |
|
|
0.10 |
|
|
| Procure Acquiom Financial, LLC (Procure Analytics) |
|
(5) (12) |
|
|
|
|
|
|
|
12/20/2021 |
|
|
|
1,000,000 |
|
|
1,000 |
|
|
1,290 |
|
|
0.07 |
|
|
| Recovery Point Systems, Inc. |
|
(5) (12) |
|
|
|
|
|
|
|
3/5/2021 |
|
|
|
1,000,000 |
|
|
1,000 |
|
|
810 |
|
|
0.05 |
|
|
| Reveal Data Solutions |
|
(5) (12) |
|
|
|
|
|
|
|
8/29/2023 |
|
|
|
477,846 |
|
|
621 |
|
|
621 |
|
|
0.04 |
|
|
| Shelby Co-invest, LP. (Spectrum Automotive) |
|
(5) (12) |
|
|
|
|
|
|
|
6/29/2021 |
|
|
|
8,500 |
|
|
850 |
|
|
1,316 |
|
|
0.08 |
|
|
| Surewerx Topco, LP |
|
(5) (10) (12) |
|
|
|
|
|
|
|
12/28/2022 |
|
|
|
512 |
|
|
512 |
|
|
565 |
|
|
0.03 |
|
|
| Suveto Buyer, LLC |
|
(5) (10) (12) |
|
|
|
|
|
|
|
11/19/2021 |
|
|
|
19,257 |
|
|
1,926 |
|
|
1,701 |
|
|
0.10 |
|
|
| Total Common Equity |
|
|
|
|
|
|
|
|
|
|
|
|
|
|
|
30,022 |
|
|
34,505 |
|
|
2.00 |
|
|
| Total Other Investments |
|
|
|
|
|
|
|
|
|
|
|
|
|
|
|
$ |
53,349 |
|
|
$ |
56,602 |
|
|
3.29 |
|
% |
| Total Portfolio Investments |
|
|
|
|
|
|
|
|
|
|
|
|
|
|
|
$ |
3,226,776 |
|
|
$ |
3,193,561 |
|
|
185.55 |
|
% |
Morgan Stanley Direct Lending Fund
Consolidated Schedule of Investments
December 31, 2023
(In thousands)
|
|
|
|
|
|
| (1) |
Unless otherwise indicated, issuers of debt and equity investments held by the Company (where such term “Company” shall include the Company’s consolidated subsidiaries for purposes of this Consolidated Schedule of Investments) are denominated in dollars. All debt investments are income producing unless otherwise indicated. All equity investments are non-income producing unless otherwise noted. Certain portfolio company investments are subject to contractual restrictions on sales. Under the Investment Company Act of 1940, as amended (together with the rules and regulations promulgated thereunder, the “1940 Act”), the Company would be deemed to “control” a portfolio company if the Company owned more than 25% of its outstanding voting securities and/or held the power to exercise control over the management or policies of the portfolio company. As of December 31, 2023, the Company does not “control” any of these portfolio companies. Under the 1940 Act, the Company would be deemed an “affiliated person” of a portfolio company if the Company owns 5% or more of the portfolio company’s outstanding voting securities. As of December 31, 2023, the Company is not an “affiliated person” of any of its portfolio companies. |
| (2) |
Unless otherwise indicated, the Company’s investments are pledged as collateral supporting the amounts outstanding under the Truist Credit Facility (as defined below). See Note 6 “Debt”. |
| (3) |
Variable rate loans to the portfolio companies bear interest at a rate that is determined by reference to either EURIBOR (“E”) or SOFR (“S”) or an alternate base rate (commonly based on the Federal Funds Rate (“F”) or the U.S. Prime Rate (“P”)), each of which generally resets periodically. For each loan, the Company has indicated the reference rate used and provided the spread and the interest rate in effect as of December 31, 2023. For investments with multiple reference rates or alternate base rates, the interest rate shown is the weighted average interest rate in effect at December 31, 2023. As of December 31, 2023, the reference rates for our variable rate loans were the 3-month E at 3.91%, 1-month S at 5.35%, the 3-month S at 5.33%; the 6-month S at 5.16% and the P at 8.50% . |
| (4) |
The cost represents the original cost adjusted for the amortization of discounts and premiums, as applicable, on debt investments using the effective interest method. |
| (5) |
These investments were valued using unobservable inputs and are considered Level 3 investments. Fair value was determined in good faith by or under the direction of the Company’s Board of Directors (the “Board of Directors” or the “Board”) (see Note 2 and Note 5), pursuant to the Company’s valuation policy. |
| (6) |
Assets or a portion thereof are pledged as collateral for the BNP Funding Facility (as defined below). See Note 6 “Debt”. |
| (7) |
Loan includes interest rate floor of 1.00%. |
| (8) |
Loan includes interest rate floor of 0.75%. |
| (9) |
Loan includes interest rate floor of 0.50%. |
| (10) |
The investment is not a qualifying asset under Section 55(a) of the 1940 Act. The Company may not acquire any non-qualifying asset unless, at the time of acquisition, qualifying assets represent at least 70% of the Company’s total assets. As of December 31, 2023, non-qualifying assets represented 6.55% of total assets as calculated in accordance with regulatory requirements. |
| (11) |
Investment was on non-accrual status as of December 31, 2023. |
| (12) |
Securities exempt from registration under the Securities Act of 1933, and may be deemed to be “restricted securities”. As of December 31, 2023, the aggregate fair value of these securities is $54,538 or 3.17% of the Company’s net assets. The initial acquisition dates have been included for such securities. |
(13) Position or portion thereof is an unfunded loan commitment, and no interest is being earned on the unfunded portion, although the investment may earn unused commitment fees. Negative cost and fair value, if any, results from unamortized fees, which are capitalized to the cost of the investment. The unfunded loan commitment may be subject to a commitment termination date that may expire prior to the maturity date stated. See below for more information on the Company’s unfunded commitments as of December 31, 2023:
|
|
|
|
|
|
|
|
|
|
|
|
|
|
|
|
| Investments — non-controlled/non-affiliated |
|
Commitment Type |
Commitment Expiration Date |
Unfunded Commitment |
Fair Value |
| First Lien Debt |
|
|
|
|
|
| 365 Retail Markets, LLC |
|
Revolver |
12/23/2026 |
$ |
2,800 |
|
$ |
— |
|
| 48Forty Solutions, LLC |
|
Revolver |
11/30/2026 |
1,086 |
|
(68) |
|
| AMCP Pet Holdings, Inc. (Brightpet) |
|
Revolver |
10/5/2026 |
2,042 |
|
(44) |
|
| ARI Network Services, Inc. |
|
Revolver |
2/28/2025 |
3,030 |
|
(29) |
|
| AWP Group Holdings, Inc. |
|
Delayed Draw Term Loan |
8/1/2025 |
1,579 |
|
(24) |
|
| AWP Group Holdings, Inc. |
|
Revolver |
12/24/2029 |
620 |
|
(9) |
|
| Abacus Data Holdings, Inc. (AbacusNext) |
|
Revolver |
3/10/2027 |
350 |
|
— |
|
| Abracon Group Holdings, LLC |
|
Delayed Draw Term Loan |
7/6/2024 |
441 |
|
(77) |
|
| Advarra Holdings, Inc. |
|
Delayed Draw Term Loan |
8/26/2024 |
41 |
|
(1) |
|
| Alert Media, Inc. |
|
Revolver |
4/10/2026 |
3,043 |
|
(53) |
|
| Amerilife Holdings, LLC |
|
Delayed Draw Term Loan |
10/7/2025 |
147 |
|
(2) |
|
| Amerilife Holdings, LLC |
|
Revolver |
8/31/2028 |
437 |
|
(6) |
|
Morgan Stanley Direct Lending Fund
Consolidated Schedule of Investments
December 31, 2023
(In thousands)
|
|
|
|
|
|
|
|
|
|
|
|
|
|
|
|
| Investments — non-controlled/non-affiliated |
|
Commitment Type |
Commitment Expiration Date |
Unfunded Commitment |
Fair Value |
| Answer Acquisition, LLC |
|
Revolver |
12/30/2026 |
$ |
192 |
|
$ |
(3) |
|
| Apex Service Partners, LLC |
|
Delayed Draw Term Loan |
10/24/2025 |
5,922 |
|
(73) |
|
| Apex Service Partners, LLC |
|
Revolver |
10/24/2029 |
2,335 |
|
(43) |
|
| Appfire Technologies, LLC |
|
Delayed Draw Term Loan |
6/13/2024 |
1,083 |
|
(14) |
|
| Appfire Technologies, LLC |
|
Revolver |
3/9/2027 |
129 |
|
(2) |
|
| Applitools, Inc. |
|
Revolver |
5/25/2028 |
433 |
|
(10) |
|
| Assembly Intermediate, LLC |
|
Delayed Draw Term Loan |
1/1/2024 |
1,556 |
|
(58) |
|
| Assembly Intermediate, LLC |
|
Revolver |
10/19/2027 |
2,074 |
|
(78) |
|
| Associations, Inc. |
|
Delayed Draw Term Loan |
6/10/2024 |
60 |
|
(1) |
|
| Associations, Inc. |
|
Revolver |
7/2/2027 |
1,203 |
|
(11) |
|
| Atlas Us Finco, Inc. |
|
Revolver |
12/9/2028 |
186 |
|
— |
|
| Avalara, Inc. |
|
Revolver |
10/19/2028 |
1,130 |
|
— |
|
| Bottomline Technologies, Inc. |
|
Revolver |
5/15/2028 |
267 |
|
— |
|
| Bradyifs Holdings, LLC |
|
Delayed Draw Term Loan |
10/31/2025 |
619 |
|
(8) |
|
| Bradyifs Holdings, LLC |
|
Revolver |
10/31/2029 |
631 |
|
(12) |
|
| Bridgepointe Technologies, LLC |
|
Delayed Draw Term Loan |
4/1/2025 |
4,426 |
|
(73) |
|
| Bullhorn, Inc. |
|
Revolver |
9/30/2026 |
593 |
|
(2) |
|
| CLEO Communications Holding, LLC |
|
Revolver |
6/9/2027 |
12,502 |
|
(196) |
|
| Caerus US 1, Inc. |
|
Delayed Draw Term Loan |
10/28/2024 |
893 |
|
— |
|
| Caerus US 1, Inc. |
|
Revolver |
5/25/2029 |
293 |
|
— |
|
| Catalis Intermediate, Inc. |
|
Revolver |
8/4/2027 |
2,778 |
|
(153) |
|
| Chase Intermediate, LLC |
|
Delayed Draw Term Loan |
8/31/2025 |
10,601 |
|
(196) |
|
| Chase Intermediate, LLC |
|
Revolver |
10/30/2028 |
530 |
|
(10) |
|
| Citrin Cooperman Advisors, LLC |
|
Delayed Draw Term Loan |
12/13/2025 |
7,275 |
|
(70) |
|
| Coupa Holdings, LLC |
|
Delayed Draw Term Loan |
8/27/2024 |
1,085 |
|
(12) |
|
| Coupa Holdings, LLC |
|
Revolver |
2/27/2029 |
831 |
|
(9) |
|
| Cyara AcquisitionCo, LLC |
|
Revolver |
6/28/2029 |
313 |
|
(6) |
|
| Diligent Corporation |
|
Revolver |
8/24/2025 |
2,070 |
|
(4) |
|
| Dwyer Instruments, Inc. |
|
Delayed Draw Term Loan |
12/22/2025 |
2,954 |
|
(29) |
|
| Dwyer Instruments, Inc. |
|
Revolver |
7/21/2027 |
1,014 |
|
(20) |
|
| E-Discovery AcquireCo, LLC |
|
Revolver |
8/29/2029 |
1,618 |
|
(28) |
|
| Encore Holdings, LLC |
|
Revolver |
11/23/2027 |
539 |
|
— |
|
| Energy Labs Holdings Corp. |
|
Revolver |
4/7/2028 |
39 |
|
— |
|
| Excelitas Technologies Corp. |
|
Delayed Draw Term Loan |
8/12/2024 |
44 |
|
— |
|
| Excelitas Technologies Corp. |
|
Revolver |
8/14/2028 |
51 |
|
— |
|
| FLS Holding, Inc. |
|
Revolver |
12/17/2027 |
1,802 |
|
(11) |
|
| FMG Suite Holdings, LLC |
|
Revolver |
10/30/2026 |
1,542 |
|
(10) |
|
| FORTIS Solutions Group, LLC |
|
Delayed Draw Term Loan |
6/24/2024 |
908 |
|
— |
|
Morgan Stanley Direct Lending Fund
Consolidated Schedule of Investments
December 31, 2023
(In thousands)
|
|
|
|
|
|
|
|
|
|
|
|
|
|
|
|
| Investments — non-controlled/non-affiliated |
|
Commitment Type |
Commitment Expiration Date |
Unfunded Commitment |
Fair Value |
| FORTIS Solutions Group, LLC |
|
Revolver |
10/15/2027 |
$ |
2,564 |
|
$ |
— |
|
| Foundation Risk Partners Corp. |
|
Revolver |
10/29/2027 |
4,571 |
|
— |
|
| Fullsteam Operations, LLC |
|
Delayed Draw Term Loan |
5/27/2025 |
3,902 |
|
(68) |
|
| Fullsteam Operations, LLC |
|
Revolver |
11/27/2029 |
608 |
|
(18) |
|
| GC Waves Holdings, Inc. |
|
Delayed Draw Term Loan |
12/31/2024 |
6,095 |
|
(113) |
|
| GC Waves Holdings, Inc. |
|
Revolver |
8/11/2028 |
331 |
|
(6) |
|
| GPS Merger Sub, LLC |
|
Delayed Draw Term Loan |
10/2/2025 |
1,274 |
|
(12) |
|
| GPS Merger Sub, LLC |
|
Revolver |
10/2/2029 |
1,019 |
|
(20) |
|
| GS AcquisitionCo, Inc. |
|
Revolver |
5/22/2026 |
2,420 |
|
— |
|
| GSM Acquisition Corp. (GSM Outdoors) |
|
Revolver |
11/16/2026 |
4,280 |
|
(43) |
|
| Galway Borrower, LLC |
|
Delayed Draw Term Loan |
4/28/2024 |
1,712 |
|
(18) |
|
| Galway Borrower, LLC |
|
Revolver |
9/30/2027 |
2,053 |
|
(60) |
|
| Gateway US Holdings, Inc. |
|
Revolver |
9/22/2026 |
30 |
|
— |
|
| GraphPad Software, LLC |
|
Revolver |
4/27/2027 |
875 |
|
(3) |
|
| Ground Penetrating Radar Systems, LLC |
|
Revolver |
6/26/2025 |
1,641 |
|
(14) |
|
| Groundworks, LLC |
|
Delayed Draw Term Loan |
9/14/2024 |
54 |
|
— |
|
| Groundworks, LLC |
|
Revolver |
3/14/2029 |
62 |
|
— |
|
| Heartland Veterinary Partners, LLC |
|
Revolver |
12/10/2026 |
375 |
|
(3) |
|
| Helios Service Partners, LLC |
|
Delayed Draw Term Loan |
2/7/2025 |
5,933 |
|
(59) |
|
| Helios Service Partners, LLC |
|
Revolver |
3/19/2027 |
542 |
|
(5) |
|
| Higginbotham Insurance Agency, Inc. |
|
Delayed Draw Term Loan |
8/23/2025 |
1,254 |
|
— |
|
| High Street Buyer, Inc. |
|
Revolver |
4/16/2027 |
2,136 |
|
— |
|
| Hyland Software, Inc. |
|
Revolver |
9/19/2029 |
1,879 |
|
(21) |
|
| Inszone Mid, LLC |
|
Delayed Draw Term Loan |
11/10/2025 |
6,000 |
|
(64) |
|
| Inszone Mid, LLC |
|
Revolver |
11/12/2029 |
817 |
|
(16) |
|
| Integrity Marketing Acquisition, LLC |
|
Revolver |
8/27/2026 |
52 |
|
(1) |
|
| Iris Buyer, LLC |
|
Delayed Draw Term Loan |
10/2/2030 |
856 |
|
(13) |
|
| Iris Buyer, LLC |
|
Revolver |
10/2/2029 |
1,001 |
|
(26) |
|
| KENG Acquisition, Inc. |
|
Delayed Draw Term Loan |
8/1/2025 |
2,040 |
|
(26) |
|
| KENG Acquisition, Inc. |
|
Revolver |
8/1/2029 |
781 |
|
(10) |
|
| KWOR Acquisition, Inc. |
|
Delayed Draw Term Loan |
6/22/2024 |
3,473 |
|
(50) |
|
| KWOR Acquisition, Inc. |
|
Revolver |
12/22/2027 |
70 |
|
(1) |
|
| Kaseya, Inc. |
|
Delayed Draw Term Loan |
6/23/2024 |
803 |
|
(4) |
|
| Kaseya, Inc. |
|
Revolver |
6/25/2029 |
642 |
|
(3) |
|
| Komline Sanderson Engineering Corp. |
|
Delayed Draw Term Loan |
5/27/2024 |
8,529 |
|
(266) |
|
| Komline Sanderson Engineering Corp. |
|
Revolver |
3/17/2026 |
4,746 |
|
(148) |
|
Morgan Stanley Direct Lending Fund
Consolidated Schedule of Investments
December 31, 2023
(In thousands)
|
|
|
|
|
|
|
|
|
|
|
|
|
|
|
|
| Investments — non-controlled/non-affiliated |
|
Commitment Type |
Commitment Expiration Date |
Unfunded Commitment |
Fair Value |
| LJ Avalon Holdings, LLC |
|
Delayed Draw Term Loan |
8/1/2024 |
$ |
1,028 |
|
$ |
(24) |
|
| LJ Avalon Holdings, LLC |
|
Revolver |
2/1/2029 |
675 |
|
(16) |
|
| LUV Car Wash Group, LLC |
|
Delayed Draw Term Loan |
3/14/2024 |
274 |
|
(1) |
|
| LegitScript, LLC |
|
Delayed Draw Term Loan |
6/24/2024 |
6,612 |
|
(59) |
|
| LegitScript, LLC |
|
Revolver |
6/24/2028 |
3,167 |
|
(28) |
|
| Lightspeed Solution, LLC |
|
Delayed Draw Term Loan |
3/1/2024 |
2,024 |
|
(36) |
|
| MHE Intermediate Holdings, LLC |
|
Revolver |
7/21/2027 |
2,500 |
|
(25) |
|
| MRI Software, LLC |
|
Delayed Draw Term Loan |
12/19/2025 |
74 |
|
— |
|
| MRI Software, LLC |
|
Revolver |
2/10/2026 |
2,252 |
|
(12) |
|
| Magneto Components Buyco, LLC |
|
Delayed Draw Term Loan |
6/5/2025 |
3,035 |
|
(28) |
|
| Magneto Components Buyco, LLC |
|
Revolver |
12/5/2029 |
2,529 |
|
(46) |
|
| Magnolia Wash Holdings |
|
Revolver |
7/14/2028 |
71 |
|
(7) |
|
| Majesco |
|
Revolver |
9/21/2026 |
1,575 |
|
(18) |
|
| Mantech International CP |
|
Delayed Draw Term Loan |
9/14/2024 |
56 |
|
— |
|
| Mantech International CP |
|
Revolver |
9/14/2028 |
53 |
|
— |
|
| Mobile Communications America, Inc. |
|
Delayed Draw Term Loan |
10/16/2025 |
1,921 |
|
(14) |
|
| Mobile Communications America, Inc. |
|
Revolver |
10/16/2029 |
960 |
|
(14) |
|
| Montana Buyer, Inc. |
|
Revolver |
7/22/2028 |
400 |
|
(3) |
|
| Netwrix Corporation And Concept Searching, Inc. |
|
Delayed Draw Term Loan |
6/10/2024 |
1,528 |
|
(23) |
|
| Netwrix Corporation And Concept Searching, Inc. |
|
Revolver |
6/11/2029 |
431 |
|
(6) |
|
| Oak Purchaser, Inc. |
|
Delayed Draw Term Loan |
4/28/2024 |
127 |
|
(3) |
|
| Oak Purchaser, Inc. |
|
Revolver |
4/28/2028 |
372 |
|
(8) |
|
| Omni Intermediate Holdings, LLC |
|
Delayed Draw Term Loan |
6/24/2024 |
138 |
|
(7) |
|
| Omni Intermediate Holdings, LLC |
|
Revolver |
12/30/2025 |
233 |
|
(11) |
|
| PCX Holding Corp. |
|
Revolver |
4/22/2027 |
987 |
|
(6) |
|
| PDFTron Systems, Inc. |
|
Revolver |
7/15/2026 |
3,850 |
|
(62) |
|
| PPV Intermediate Holdings, LLC |
|
Delayed Draw Term Loan |
8/31/2025 |
15,090 |
|
(124) |
|
| Pareto Health Intermediate Holdings, Inc. |
|
Revolver |
6/1/2029 |
792 |
|
(6) |
|
| Patriot Growth Insurance Services, LLC |
|
Revolver |
10/16/2028 |
4,485 |
|
(44) |
|
| Peter C. Foy & Associates Insurance Services, LLC |
|
Delayed Draw Term Loan |
10/19/2024 |
1,695 |
|
(8) |
|
| Peter C. Foy & Associates Insurance Services, LLC |
|
Revolver |
11/1/2027 |
832 |
|
(12) |
|
| Pound Bidco, Inc. |
|
Delayed Draw Term Loan |
12/31/2024 |
297 |
|
— |
|
| Pound Bidco, Inc. |
|
Revolver |
1/30/2026 |
1,163 |
|
— |
| Procure Acquireco, Inc. (Procure Analytics) |
|
Revolver |
12/20/2028 |
238 |
|
(7) |
|
| Project Boost Purchaser, LLC |
|
Delayed Draw Term Loan |
5/2/2024 |
589 |
|
(1) |
|
Morgan Stanley Direct Lending Fund
Consolidated Schedule of Investments
December 31, 2023
(In thousands)
|
|
|
|
|
|
|
|
|
|
|
|
|
|
|
|
| Investments — non-controlled/non-affiliated |
|
Commitment Type |
Commitment Expiration Date |
Unfunded Commitment |
Fair Value |
| Project Boost Purchaser, LLC |
|
Revolver |
5/2/2028 |
$ |
449 |
|
$ |
— |
|
| RSC Acquisition, Inc. |
|
Delayed Draw Term Loan |
2/14/2025 |
610 |
|
(5) |
|
| Randy's Holdings, Inc. |
|
Delayed Draw Term Loan |
11/1/2024 |
2,248 |
|
(8) |
|
| Randy's Holdings, Inc. |
|
Revolver |
11/1/2028 |
639 |
|
(2) |
|
| Raptor Merger Sub Debt, LLC |
|
Revolver |
4/1/2028 |
1,953 |
|
(2) |
|
| Recovery Point Systems, Inc. |
|
Revolver |
8/12/2026 |
4,000 |
|
— |
|
| Redwood Services Group, LLC |
|
Delayed Draw Term Loan |
1/31/2025 |
505 |
|
(12) |
|
| Revalize, Inc. |
|
Revolver |
4/15/2027 |
53 |
|
(1) |
|
| Riskonnect Parent, LLC |
|
Delayed Draw Term Loan |
7/7/2024 |
558 |
|
(1) |
|
| RoadOne IntermodaLogistics |
|
Delayed Draw Term Loan |
6/30/2024 |
273 |
|
(5) |
|
| RoadOne IntermodaLogistics |
|
Revolver |
12/29/2028 |
309 |
|
(6) |
|
| Securonix, Inc. |
|
Revolver |
4/5/2028 |
3,782 |
|
(210) |
|
| Sherlock Buyer Corp. |
|
Delayed Draw Term Loan |
9/6/2025 |
3,215 |
|
(2) |
|
| Sherlock Buyer Corp. |
|
Revolver |
12/8/2027 |
1,286 |
|
(1) |
|
| Smarsh, Inc. |
|
Delayed Draw Term Loan |
2/18/2024 |
536 |
|
(9) |
|
| Smarsh, Inc. |
|
Revolver |
2/16/2029 |
268 |
|
(5) |
|
| Spectrio, LLC |
|
Revolver |
12/9/2026 |
493 |
|
(25) |
|
| Spectrum Automotive Holdings Corp. |
|
Delayed Draw Term Loan |
6/29/2024 |
1,154 |
|
(26) |
|
| Spectrum Automotive Holdings Corp. |
|
Revolver |
6/29/2027 |
881 |
|
(20) |
|
| Spotless Brands, LLC |
|
Revolver |
7/25/2028 |
114 |
|
(1) |
|
| Stepping Stones Healthcare Services, LLC |
|
Delayed Draw Term Loan |
1/1/2024 |
276 |
|
(4) |
|
| Stepping Stones Healthcare Services, LLC |
|
Revolver |
12/30/2026 |
625 |
|
(9) |
|
| Summit Acquisition, Inc. |
|
Delayed Draw Term Loan |
11/1/2024 |
1,638 |
|
(25) |
|
| Summit Acquisition, Inc. |
|
Revolver |
5/1/2029 |
819 |
|
(12) |
|
| Summit Buyer, LLC |
|
Delayed Draw Term Loan |
8/25/2025 |
197 |
|
(5) |
|
| Summit Buyer, LLC |
|
Revolver |
1/14/2026 |
2,443 |
|
(59) |
|
| Superman Holdings, LLC |
|
Delayed Draw Term Loan |
5/1/2025 |
380 |
|
(5) |
|
| Surewerx Purchaser III, Inc. |
|
Delayed Draw Term Loan |
6/28/2024 |
1,128 |
|
— |
|
| Surewerx Purchaser III, Inc. |
|
Revolver |
12/28/2028 |
494 |
|
— |
|
| Suveto |
|
Revolver |
9/9/2027 |
930 |
|
(19) |
|
| Sweep Purchaser, LLC |
|
Delayed Draw Term Loan |
5/5/2024 |
273 |
|
(55) |
|
| Sweep Purchaser, LLC |
|
Revolver |
11/30/2026 |
28 |
|
(6) |
|
| Syntax Systems Ltd |
|
Revolver |
10/29/2026 |
1,447 |
|
(26) |
|
| Tamarack Intermediate, LLC |
|
Delayed Draw Term Loan |
10/6/2025 |
398 |
|
(6) |
|
| Tamarack Intermediate, LLC |
|
Revolver |
3/13/2028 |
900 |
|
(22) |
|
| Tank Holding Corp. |
|
Delayed Draw Term Loan |
5/22/2024 |
494 |
|
(10) |
|
Morgan Stanley Direct Lending Fund
Consolidated Schedule of Investments
December 31, 2023
(In thousands)
|
|
|
|
|
|
|
|
|
|
|
|
|
|
|
|
| Investments — non-controlled/non-affiliated |
|
Commitment Type |
Commitment Expiration Date |
Unfunded Commitment |
Fair Value |
| Tank Holding Corp. |
|
Revolver |
3/31/2028 |
$ |
587 |
|
$ |
(26) |
|
| Thrive Buyer, Inc. (Thrive Networks) |
|
Revolver |
1/22/2027 |
1,321 |
|
(26) |
|
| Tidi Legacy Products, Inc. |
|
Delayed Draw Term Loan |
6/19/2025 |
913 |
|
(9) |
|
| Tidi Legacy Products, Inc. |
|
Revolver |
12/19/2029 |
657 |
|
(13) |
|
| Trintech, Inc. |
|
Revolver |
7/25/2029 |
2,092 |
|
(39) |
|
| Triple Lift, Inc. |
|
Revolver |
5/5/2028 |
2,467 |
|
(172) |
|
| Trunk Acquisition, Inc. |
|
Revolver |
2/19/2026 |
857 |
|
(16) |
|
| Two Six Labs, LLC |
|
Revolver |
8/20/2027 |
2,134 |
|
(48) |
|
| United Flow Technologies Intermediate Holdco II, LLC |
|
Delayed Draw Term Loan |
1/1/2024 |
32 |
|
— |
|
| United Flow Technologies Intermediate Holdco II, LLC |
|
Revolver |
10/29/2026 |
1,155 |
|
(15) |
|
| UpStack, Inc. |
|
Delayed Draw Term Loan |
6/30/2025 |
6,197 |
|
(155) |
|
| UpStack, Inc. |
|
Revolver |
8/20/2027 |
613 |
|
(15) |
|
| V Global Holdings, LLC |
|
Revolver |
12/22/2025 |
396 |
|
(8) |
|
| VRC Companies, LLC |
|
Revolver |
6/29/2027 |
1,653 |
|
(2) |
|
| Vensure Employer Services, Inc. |
|
Delayed Draw Term Loan |
6/15/2025 |
2,362 |
|
(20) |
|
| Vertex Service Partners, LLC |
|
Delayed Draw Term Loan |
11/8/2025 |
2,562 |
|
(39) |
|
| Vertex Service Partners, LLC |
|
Revolver |
11/8/2030 |
460 |
|
(11) |
|
| Vessco Midco Holdings, LLC |
|
Revolver |
10/18/2026 |
428 |
|
— |
|
| World Insurance Associates, LLC |
|
Revolver |
4/3/2028 |
1,269 |
|
(41) |
|
| YI, LLC |
|
Delayed Draw Term Loan |
6/6/2025 |
1,178 |
|
(12) |
|
| YI, LLC |
|
Revolver |
12/3/2029 |
883 |
|
(17) |
|
| Zarya Intermediate, LLC |
|
Revolver |
7/1/2027 |
521 |
|
— |
|
| iCIMS, Inc. |
|
Delayed Draw Term Loan |
8/18/2025 |
101 |
|
— |
|
| iCIMS, Inc. |
|
Revolver |
8/18/2028 |
38 |
|
— |
|
| mPulse Mobile, Inc. |
|
Revolver |
12/18/2027 |
2,668 |
|
(59) |
|
| Total First Lien Debt Unfunded Commitments |
|
|
|
$ |
294,950 |
|
$ |
(4,552) |
|
| Total Unfunded Commitments |
|
|
|
$ |
294,950 |
|
$ |
(4,552) |
|
Morgan Stanley Direct Lending Fund
Consolidated Schedule of Investments
December 31, 2022
(In thousands)
|
|
|
|
|
|
|
|
|
|
|
|
|
|
|
|
|
|
|
|
|
|
|
|
|
|
|
|
|
|
|
|
|
|
|
|
|
|
|
|
|
|
|
|
|
|
|
|
|
|
|
|
|
|
|
|
|
|
|
|
|
|
Investments-non-controlled/non-affiliated(1)(2) |
|
Footnotes |
|
Reference Rate and Spread |
|
Interest Rate(3) |
|
|
|
Maturity Date |
|
Par Amount/ Shares |
|
Cost(4) |
|
Fair Value |
|
Percentage of Net Assets |
|
| First Lien Debt |
|
|
|
|
|
|
|
|
|
|
|
|
|
|
|
|
|
|
|
|
|
| Aerospace & Defense |
|
|
|
|
|
|
|
|
|
|
|
|
|
|
|
|
|
|
|
|
|
| Jonathan Acquisition Company |
|
(5) (7) |
|
L + |
|
5.00% |
|
9.73% |
|
|
|
12/22/2026 |
|
2,712 |
|
|
$ |
2,656 |
|
|
$ |
2,641 |
|
|
0.19 |
|
% |
| Mantech International CP |
|
(5) (8) |
|
S + |
|
5.75% |
|
9.58% |
|
|
|
09/14/2029 |
|
359 |
|
|
352 |
|
|
350 |
|
|
0.03 |
|
|
| Mantech International CP |
|
(5) (8) (13) |
|
S + |
|
5.75% |
|
9.58% |
|
|
|
09/14/2029 |
|
— |
|
|
(1) |
|
|
(2) |
|
|
— |
|
|
| Mantech International CP |
|
(5) (8) (13) |
|
S + |
|
5.75% |
|
9.58% |
|
|
|
09/14/2028 |
|
— |
|
|
(1) |
|
|
(2) |
|
|
— |
|
|
| PCX Holding Corp. |
|
(5) (6) (7) |
|
L + |
|
6.25% |
|
10.98% |
|
|
|
04/22/2027 |
|
18,232 |
|
|
18,093 |
|
|
17,636 |
|
|
1.26 |
|
|
| PCX Holding Corp. |
|
(5) (7) |
|
L + |
|
6.25% |
|
10.98% |
|
|
|
04/22/2027 |
|
18,356 |
|
|
18,064 |
|
|
17,756 |
|
|
1.27 |
|
|
| PCX Holding Corp. |
|
(5) (7) (13) |
|
L + |
|
6.25% |
|
10.98% |
|
|
|
04/22/2027 |
|
555 |
|
|
542 |
|
|
495 |
|
|
0.04 |
|
|
| Two Six Labs, LLC |
|
(5) (8) |
|
S + |
|
5.50% |
|
10.08% |
|
|
|
08/20/2027 |
|
10,959 |
|
|
10,782 |
|
|
10,694 |
|
|
0.77 |
|
|
| Two Six Labs, LLC |
|
(5) (8) (13) |
|
S + |
|
5.50% |
|
10.08% |
|
|
|
08/20/2027 |
|
2,118 |
|
|
2,066 |
|
|
2,015 |
|
|
0.14 |
|
|
| Two Six Labs, LLC |
|
(5) (8) (13) |
|
S + |
|
5.50% |
|
10.08% |
|
|
|
08/20/2027 |
|
— |
|
|
(33) |
|
|
(52) |
|
|
— |
|
|
|
|
|
|
|
|
|
|
|
|
|
|
|
|
|
|
52,520 |
|
|
51,531 |
|
|
3.69 |
|
|
| Air Freight & Logistics |
|
|
|
|
|
|
|
|
|
|
|
|
|
|
|
|
|
|
|
|
|
| AGI-CFI Holdings, Inc. |
|
(5) (8) |
|
S + |
|
5.75% |
|
10.48% |
|
|
|
06/11/2027 |
|
14,408 |
|
|
14,140 |
|
|
13,851 |
|
|
0.99 |
|
|
| Omni Intermediate Holdings, LLC |
|
(5) (7) |
|
S + |
|
5.00% |
|
9.73% |
|
|
|
12/30/2026 |
|
12,131 |
|
|
12,027 |
|
|
11,617 |
|
|
0.83 |
|
|
| Omni Intermediate Holdings, LLC |
|
(5) (7) (13) |
|
S + |
|
5.00% |
|
9.73% |
|
|
|
12/30/2026 |
|
531 |
|
|
519 |
|
|
471 |
|
|
0.03 |
|
|
| Omni Intermediate Holdings, LLC |
|
(5) (7) |
|
S + |
|
5.00% |
|
9.73% |
|
|
|
12/30/2026 |
|
385 |
|
|
378 |
|
|
368 |
|
|
0.03 |
|
|
| Omni Intermediate Holdings, LLC |
|
(5) (7) (13) |
|
S + |
|
5.00% |
|
9.73% |
|
|
|
12/30/2025 |
|
— |
|
|
(9) |
|
|
(45) |
|
|
— |
|
|
| RoadOne IntermodaLogistics |
|
(5) (7) |
|
S + |
|
6.25% |
|
10.81% |
|
|
|
12/30/2028 |
|
1,672 |
|
|
1,622 |
|
|
1,622 |
|
|
0.12 |
|
|
| RoadOne IntermodaLogistics |
|
(5) (7) (13) |
|
S + |
|
6.25% |
|
10.81% |
|
|
|
12/30/2028 |
|
— |
|
|
(6) |
|
|
(6) |
|
|
— |
|
|
| RoadOne IntermodaLogistics |
|
(5) (7) (13) |
|
S + |
|
6.25% |
|
10.81% |
|
|
|
12/30/2028 |
|
75 |
|
|
65 |
|
|
65 |
|
|
— |
|
|
|
|
|
|
|
|
|
|
|
|
|
|
|
|
|
|
28,736 |
|
|
27,943 |
|
|
2.00 |
|
|
| Automobile Components |
|
|
|
|
|
|
|
|
|
|
|
|
|
|
|
|
|
|
|
|
|
| Continental Battery Company |
|
(5) (7) |
|
L + |
|
6.75% |
|
11.48% |
|
|
|
01/20/2027 |
|
6,188 |
|
|
6,083 |
|
|
5,903 |
|
|
0.42 |
|
|
| Randy's Holdings, Inc. |
|
(5) (7) |
|
S + |
|
6.50% |
|
10.59% |
|
|
|
11/01/2028 |
|
6,743 |
|
|
6,545 |
|
|
6,545 |
|
|
0.47 |
|
|
| Randy's Holdings, Inc. |
|
(5) (7) (13) |
|
S + |
|
6.50% |
|
10.59% |
|
|
|
11/01/2028 |
|
— |
|
|
(31) |
|
|
(31) |
|
|
— |
|
|
| Randy's Holdings, Inc. |
|
(5) (7) (13) |
|
S + |
|
6.50% |
|
10.59% |
|
|
|
11/01/2028 |
|
142 |
|
|
116 |
|
|
116 |
|
|
0.01 |
|
|
| Sonny's Enterprises, LLC |
|
(5) (6) (7) |
|
S + |
|
6.04% |
|
10.29% |
|
|
|
08/05/2026 |
|
12,363 |
|
|
12,178 |
|
|
11,839 |
|
|
0.85 |
|
|
| Sonny's Enterprises, LLC |
|
(5) (7) |
|
S + |
|
6.75% |
|
11.00% |
|
|
|
08/05/2026 |
|
34,154 |
|
|
33,656 |
|
|
32,706 |
|
|
2.34 |
|
|
| Spectrum Automotive Holdings Corp. |
|
(5) (6) (8) |
|
L + |
|
5.75% |
|
10.48% |
|
|
|
06/29/2028 |
|
23,650 |
|
|
23,358 |
|
|
22,274 |
|
|
1.59 |
|
|
| Spectrum Automotive Holdings Corp. |
|
(5) (8) (13) |
|
L + |
|
5.75% |
|
10.48% |
|
|
|
06/29/2028 |
|
4,656 |
|
|
4,585 |
|
|
4,273 |
|
|
0.31 |
|
|
| Spectrum Automotive Holdings Corp. |
|
(5) (8) (13) |
|
L + |
|
5.75% |
|
10.48% |
|
|
|
06/29/2027 |
|
— |
|
|
(10) |
|
|
(51) |
|
|
— |
|
|
|
|
|
|
|
|
|
|
|
|
|
|
|
|
|
|
86,480 |
|
|
83,574 |
|
|
5.98 |
|
|
| Automobiles |
|
|
|
|
|
|
|
|
|
|
|
|
|
|
|
|
|
|
|
|
|
| ARI Network Services, Inc. |
|
(5) (6) (8) |
|
S + |
|
5.50% |
|
9.92% |
|
|
|
02/28/2025 |
|
20,723 |
|
|
20,465 |
|
|
20,134 |
|
|
1.44 |
|
|
| ARI Network Services, Inc. |
|
(5) (6) (8) |
|
S + |
|
5.50% |
|
9.92% |
|
|
|
02/28/2025 |
|
3,630 |
|
|
3,586 |
|
|
3,527 |
|
|
0.25 |
|
|
Morgan Stanley Direct Lending Fund
Consolidated Schedule of Investments (continued)
December 31, 2022
(In thousands)
|
|
|
|
|
|
|
|
|
|
|
|
|
|
|
|
|
|
|
|
|
|
|
|
|
|
|
|
|
|
|
|
|
|
|
|
|
|
|
|
|
|
|
|
|
|
|
|
|
|
|
|
|
|
|
|
|
|
|
|
|
|
Investments-non-controlled/non-affiliated(1)(2) |
|
Footnotes |
|
Reference Rate and Spread |
|
Interest Rate(3) |
|
|
|
Maturity Date |
|
Par Amount/ Shares |
|
Cost(4) |
|
Fair Value |
|
Percentage of Net Assets |
|
| ARI Network Services, Inc. |
|
(5) (8) (13) |
|
S + |
|
5.50% |
|
9.92% |
|
|
|
02/28/2025 |
|
909 |
|
|
$ |
873 |
|
|
$ |
823 |
|
|
0.06 |
|
% |
| Summit Buyer, LLC |
|
(5) (7) |
|
L + |
|
5.75% |
|
10.13% |
|
|
|
01/14/2026 |
|
22,120 |
|
|
21,795 |
|
|
21,142 |
|
|
1.51 |
|
|
| Summit Buyer, LLC |
|
(5) (7) (13) |
|
L + |
|
5.75% |
|
10.13% |
|
|
|
01/14/2026 |
|
28,996 |
|
|
28,544 |
|
|
27,569 |
|
|
1.97 |
|
|
| Summit Buyer, LLC |
|
(5) (7) (13) |
|
L + |
|
5.75% |
|
10.13% |
|
|
|
01/14/2026 |
|
— |
|
|
(32) |
|
|
(107) |
|
|
(0.01) |
|
|
| Turbo Buyer, Inc. |
|
(5) (7) |
|
L + |
|
6.00% |
|
11.15% |
|
|
|
12/02/2025 |
|
37,940 |
|
|
37,419 |
|
|
36,574 |
|
|
2.62 |
|
|
| Turbo Buyer, Inc. |
|
(5) (7) |
|
L + |
|
6.00% |
|
11.15% |
|
|
|
12/02/2025 |
|
38,123 |
|
|
37,494 |
|
|
36,751 |
|
|
2.63 |
|
|
|
|
|
|
|
|
|
|
|
|
|
|
|
|
|
|
150,144 |
|
|
146,413 |
|
|
10.48 |
|
|
| Biotechnology |
|
|
|
|
|
|
|
|
|
|
|
|
|
|
|
|
|
|
|
|
|
| GraphPad Software, LLC |
|
(5) (6) (7) |
|
L + |
|
5.50% |
|
10.39% |
|
|
|
04/27/2027 |
|
12,066 |
|
|
11,974 |
|
|
11,668 |
|
|
0.84 |
|
|
| GraphPad Software, LLC |
|
(5) (7) |
|
L + |
|
5.50% |
|
10.39% |
|
|
|
04/27/2027 |
|
2,892 |
|
|
2,869 |
|
|
2,797 |
|
|
0.20 |
|
|
| GraphPad Software, LLC |
|
(5) (7) (13) |
|
L + |
|
5.50% |
|
10.39% |
|
|
|
04/27/2027 |
|
— |
|
|
(13) |
|
|
(58) |
|
|
— |
|
|
|
|
|
|
|
|
|
|
|
|
|
|
|
|
|
|
14,830 |
|
|
14,407 |
|
|
1.03 |
|
|
| Chemicals |
|
|
|
|
|
|
|
|
|
|
|
|
|
|
|
|
|
|
|
|
|
| Tank Holding Corp. |
|
(6) (8) |
|
S + |
|
5.75% |
|
10.17% |
|
|
|
03/31/2028 |
|
14,129 |
|
|
13,875 |
|
|
13,352 |
|
|
0.96 |
|
|
| Tank Holding Corp. |
|
(8) (13) |
|
P + |
|
4.75% |
|
12.25% |
|
|
|
03/31/2028 |
|
133 |
|
|
119 |
|
|
89 |
|
|
0.01 |
|
|
| V Global Holdings, LLC |
|
(5) (6) (8) |
|
S + |
|
5.75% |
|
8.99% |
|
|
|
12/22/2027 |
|
4,903 |
|
|
4,814 |
|
|
4,659 |
|
|
0.33 |
|
|
| V Global Holdings, LLC |
|
(5) (8) (13) |
|
S + |
|
5.75% |
|
8.99% |
|
|
|
12/22/2025 |
|
— |
|
|
(11) |
|
|
(34) |
|
|
— |
|
|
|
|
|
|
|
|
|
|
|
|
|
|
|
|
|
|
18,797 |
|
|
18,066 |
|
|
1.29 |
|
|
| Commercial Services & Supplies |
|
|
|
|
|
|
|
|
|
|
|
|
|
|
|
|
|
|
|
|
|
| 365 Retail Markets, LLC |
|
(5) (7) |
|
L + |
|
4.75% |
|
8.45% |
|
|
|
12/23/2026 |
|
17,280 |
|
|
17,045 |
|
|
16,890 |
|
|
1.21 |
|
|
| 365 Retail Markets, LLC |
|
(5) (7) |
|
L + |
|
4.75% |
|
8.45% |
|
|
|
12/23/2026 |
|
5,543 |
|
|
5,484 |
|
|
5,418 |
|
|
0.39 |
|
|
| 365 Retail Markets, LLC |
|
(5) (7) (13) |
|
L + |
|
4.75% |
|
8.45% |
|
|
|
12/23/2026 |
|
1,600 |
|
|
1,563 |
|
|
1,537 |
|
|
0.11 |
|
|
| Atlas Us Finco, Inc. |
|
(5) (7) (10) |
|
S + |
|
7.25% |
|
11.48% |
|
|
|
12/09/2029 |
|
2,009 |
|
|
1,949 |
|
|
1,949 |
|
|
0.14 |
|
|
| Atlas Us Finco, Inc. |
|
(5) (7) (10) (13) |
|
S + |
|
7.25% |
|
11.48% |
|
|
|
12/09/2028 |
|
— |
|
|
(6) |
|
|
(6) |
|
|
— |
|
|
| BPG Holdings IV Corp. |
|
(5) (8) |
|
S + |
|
6.00% |
|
10.54% |
|
|
|
07/29/2029 |
|
11,765 |
|
|
11,001 |
|
|
11,001 |
|
|
0.79 |
|
|
| Encore Holdings, LLC |
|
(5) (8) |
|
L + |
|
4.50% |
|
9.23% |
|
|
|
11/23/2028 |
|
1,850 |
|
|
1,821 |
|
|
1,806 |
|
|
0.13 |
|
|
| Encore Holdings, LLC |
|
(5) (8) (13) |
|
L + |
|
4.50% |
|
9.23% |
|
|
|
11/23/2028 |
|
2,118 |
|
|
2,074 |
|
|
2,034 |
|
|
0.15 |
|
|
| Encore Holdings, LLC |
|
(5) (8) (13) |
|
L + |
|
4.50% |
|
9.23% |
|
|
|
11/23/2027 |
|
— |
|
|
(8) |
|
|
(13) |
|
|
— |
|
|
| FLS Holding, Inc. |
|
(5) (7) (10) |
|
L + |
|
5.25% |
|
10.40% |
|
|
|
12/15/2028 |
|
20,727 |
|
|
20,361 |
|
|
20,389 |
|
|
1.46 |
|
|
| FLS Holding, Inc. |
|
(5) (7) (10) |
|
L + |
|
5.25% |
|
10.40% |
|
|
|
12/15/2028 |
|
4,506 |
|
|
4,424 |
|
|
4,432 |
|
|
0.32 |
|
|
| FLS Holding, Inc. |
|
(5) (7) (10) (13) |
|
L + |
|
5.25% |
|
10.40% |
|
|
|
12/17/2027 |
|
— |
|
|
(30) |
|
|
(29) |
|
|
— |
|
|
| PDFTron Systems, Inc. |
|
(5) (6) (7) (10) |
|
S + |
|
5.50% |
|
9.82% |
|
|
|
07/15/2027 |
|
30,415 |
|
|
29,998 |
|
|
29,402 |
|
|
2.10 |
|
|
| PDFTron Systems, Inc. |
|
(5) (7) (10) |
|
S + |
|
5.50% |
|
9.82% |
|
|
|
07/15/2027 |
|
9,800 |
|
|
9,638 |
|
|
9,474 |
|
|
0.68 |
|
|
| PDFTron Systems, Inc. |
|
(5) (7) (10) (13) |
|
S + |
|
5.50% |
|
9.82% |
|
|
|
07/15/2026 |
|
3,850 |
|
|
3,741 |
|
|
3,594 |
|
|
0.26 |
|
|
| Procure Acquireco, Inc. (Procure Analytics) |
|
(5) (8) |
|
L + |
|
5.00% |
|
9.35% |
|
|
|
12/20/2028 |
|
3,929 |
|
|
3,859 |
|
|
3,755 |
|
|
0.27 |
|
|
| Procure Acquireco, Inc. (Procure Analytics) |
|
(5) (8) (13) |
|
L + |
|
5.00% |
|
9.35% |
|
|
|
12/20/2028 |
|
— |
|
|
(7) |
|
|
(35) |
|
|
— |
|
|
| Procure Acquireco, Inc. (Procure Analytics) |
|
(5) (8) (13) |
|
L + |
|
5.00% |
|
9.35% |
|
|
|
12/20/2028 |
|
— |
|
|
(4) |
|
|
(11) |
|
|
— |
|
|
Morgan Stanley Direct Lending Fund
Consolidated Schedule of Investments (continued)
December 31, 2022
(In thousands)
|
|
|
|
|
|
|
|
|
|
|
|
|
|
|
|
|
|
|
|
|
|
|
|
|
|
|
|
|
|
|
|
|
|
|
|
|
|
|
|
|
|
|
|
|
|
|
|
|
|
|
|
|
|
|
|
|
|
|
|
|
|
Investments-non-controlled/non-affiliated(1)(2) |
|
Footnotes |
|
Reference Rate and Spread |
|
Interest Rate(3) |
|
|
|
Maturity Date |
|
Par Amount/ Shares |
|
Cost(4) |
|
Fair Value |
|
Percentage of Net Assets |
|
| QW Holding Corporation |
|
(5) (6) (7) |
|
L + |
|
5.50% |
|
9.44% |
|
|
|
08/31/2026 |
|
8,907 |
|
|
$ |
8,791 |
|
|
$ |
8,575 |
|
|
0.61 |
|
% |
| QW Holding Corporation |
|
(5) (7) (13) |
|
L + |
|
5.50% |
|
9.44% |
|
|
|
08/31/2026 |
|
1,851 |
|
|
1,824 |
|
|
1,767 |
|
|
0.13 |
|
|
| QW Holding Corporation |
|
(5) (7) (13) |
|
L + |
|
5.50% |
|
9.44% |
|
|
|
08/31/2026 |
|
— |
|
|
(29) |
|
|
(84) |
|
|
(0.01) |
|
|
| Sherlock Buyer Corp. |
|
(5) (8) |
|
L + |
|
5.75% |
|
10.48% |
|
|
|
12/08/2028 |
|
11,061 |
|
|
10,867 |
|
|
10,816 |
|
|
0.77 |
|
|
| Sherlock Buyer Corp. |
|
(5) (8) (13) |
|
L + |
|
5.75% |
|
10.48% |
|
|
|
12/08/2028 |
|
— |
|
|
(27) |
|
|
(71) |
|
|
(0.01) |
|
|
| Sherlock Buyer Corp. |
|
(5) (8) (13) |
|
L + |
|
5.75% |
|
10.48% |
|
|
|
12/08/2027 |
|
— |
|
|
(21) |
|
|
(28) |
|
|
— |
|
|
| Surewerx Purchaser III, Inc. |
|
(5) (8) (10) |
|
S + |
|
6.75% |
|
11.30% |
|
|
|
12/28/2029 |
|
17,527 |
|
|
17,002 |
|
|
17,002 |
|
|
1.22 |
|
|
| Surewerx Purchaser III, Inc. |
|
(5) (8) (10) (13) |
|
S + |
|
6.75% |
|
11.30% |
|
|
|
12/28/2029 |
|
— |
|
|
(72) |
|
|
(72) |
|
|
(0.01) |
|
|
| Surewerx Purchaser III, Inc. |
|
(5) (8) (10) (13) |
|
S + |
|
6.75% |
|
11.30% |
|
|
|
12/28/2028 |
|
240 |
|
|
183 |
|
|
183 |
|
|
0.01 |
|
|
| Sweep Purchaser, LLC |
|
(5) (7) |
|
L + |
|
5.75% |
|
10.47% |
|
|
|
11/30/2026 |
|
8,704 |
|
|
8,582 |
|
|
8,239 |
|
|
0.59 |
|
|
| Sweep Purchaser, LLC |
|
(5) (7) (13) |
|
L + |
|
5.75% |
|
10.47% |
|
|
|
11/30/2026 |
|
5,934 |
|
|
5,843 |
|
|
5,601 |
|
|
0.40 |
|
|
| Sweep Purchaser, LLC |
|
(5) (7) (13) |
|
L + |
|
5.75% |
|
10.47% |
|
|
|
11/30/2026 |
|
253 |
|
|
235 |
|
|
178 |
|
|
0.01 |
|
|
| Tamarack Intermediate, LLC |
|
(5) (8) |
|
S + |
|
5.75% |
|
9.23% |
|
|
|
03/13/2028 |
|
5,473 |
|
|
5,375 |
|
|
5,232 |
|
|
0.37 |
|
|
| Tamarack Intermediate, LLC |
|
(5) (8) (13) |
|
S + |
|
5.75% |
|
9.23% |
|
|
|
03/13/2028 |
|
91 |
|
|
76 |
|
|
52 |
|
|
— |
|
|
| United Flow Technologies Intermediate Holdco II, LLC |
|
(5) (7) |
|
L + |
|
5.75% |
|
10.17% |
|
|
|
10/29/2027 |
|
16,972 |
|
|
16,687 |
|
|
16,457 |
|
|
1.18 |
|
|
| United Flow Technologies Intermediate Holdco II, LLC |
|
(5) (7) (13) |
|
L + |
|
5.75% |
|
10.17% |
|
|
|
10/29/2027 |
|
9,668 |
|
|
9,409 |
|
|
9,067 |
|
|
0.65 |
|
|
| United Flow Technologies Intermediate Holdco II, LLC |
|
(5) (7) (13) |
|
L + |
|
5.75% |
|
10.17% |
|
|
|
10/29/2026 |
|
— |
|
|
(46) |
|
|
(91) |
|
|
(0.01) |
|
|
| US Infra Svcs Buyer, LLC |
|
(5) (6) (7) |
|
L + |
|
6.75% (incl. 0.25% PIK) |
|
11.67% |
|
|
|
04/13/2026 |
|
16,193 |
|
|
15,998 |
|
|
15,427 |
|
|
1.10 |
|
|
| US Infra Svcs Buyer, LLC |
|
(5) (6) (7) |
|
L + |
|
6.75% (incl. 0.25% PIK) |
|
11.67% |
|
|
|
04/13/2026 |
|
2,285 |
|
|
2,259 |
|
|
2,177 |
|
|
0.16 |
|
|
| US Infra Svcs Buyer, LLC |
|
(5) (7) |
|
L + |
|
6.75% (incl. 0.25% PIK) |
|
11.67% |
|
|
|
04/13/2026 |
|
2,250 |
|
|
2,225 |
|
|
2,144 |
|
|
0.15 |
|
|
| Valcourt Holdings II, LLC |
|
(5) (7) |
|
S + |
|
5.25% |
|
9.98% |
|
|
|
01/07/2027 |
|
25,145 |
|
|
24,785 |
|
|
24,850 |
|
|
1.78 |
|
|
| Valcourt Holdings II, LLC |
|
(5) (6) (7) |
|
S + |
|
5.25% |
|
9.98% |
|
|
|
01/07/2027 |
|
9,929 |
|
|
9,783 |
|
|
9,813 |
|
|
0.70 |
|
|
| Valcourt Holdings II, LLC |
|
(5) (7) (13) |
|
S + |
|
5.25% |
|
9.98% |
|
|
|
01/07/2027 |
|
5,738 |
|
|
5,643 |
|
|
5,658 |
|
|
0.40 |
|
|
| VRC Companies, LLC |
|
(5) (8) |
|
S + |
|
5.75% |
|
8.52% |
|
|
|
06/29/2027 |
|
7,540 |
|
|
7,435 |
|
|
7,276 |
|
|
0.52 |
|
|
| VRC Companies, LLC |
|
(5) (8) (13) |
|
S + |
|
5.75% |
|
8.52% |
|
|
|
06/29/2027 |
|
3,074 |
|
|
2,950 |
|
|
2,754 |
|
|
0.20 |
|
|
| VRC Companies, LLC |
|
(5) (6) (8) |
|
S + |
|
5.50% |
|
10.65% |
|
|
|
06/29/2027 |
|
48,840 |
|
|
48,260 |
|
|
47,130 |
|
|
3.37 |
|
|
| VRC Companies, LLC |
|
(5) (6) (8) (13) |
|
L + |
|
5.50% |
|
10.22% |
|
|
|
06/29/2027 |
|
8,214 |
|
|
8,119 |
|
|
7,927 |
|
|
0.57 |
|
|
| VRC Companies, LLC |
|
(5) (8) (13) |
|
L + |
|
5.50% |
|
10.22% |
|
|
|
06/29/2027 |
|
— |
|
|
(19) |
|
|
(58) |
|
|
— |
|
|
|
|
|
|
|
|
|
|
|
|
|
|
|
|
|
|
325,020 |
|
|
319,508 |
|
|
22.87 |
|
|
| Construction & Engineering |
|
|
|
|
|
|
|
|
|
|
|
|
|
|
|
|
|
|
|
|
|
| KPSKY Acquisition, Inc. |
|
(5) (8) |
|
L + |
|
5.50% |
|
9.89% |
|
|
|
10/19/2028 |
|
34,211 |
|
|
33,621 |
|
|
32,668 |
|
|
2.34 |
|
|
| KPSKY Acquisition, Inc. |
|
(5) (8) (13) |
|
P + |
|
4.53% |
|
12.03% |
|
|
|
10/19/2028 |
|
4,420 |
|
|
4,311 |
|
|
4,066 |
|
|
0.29 |
|
|
|
|
|
|
|
|
|
|
|
|
|
|
|
|
|
|
37,932 |
|
|
36,734 |
|
|
2.63 |
|
|
|
|
|
|
|
|
|
|
|
|
|
|
|
|
|
|
|
|
|
|
|
|
Morgan Stanley Direct Lending Fund
Consolidated Schedule of Investments (continued)
December 31, 2022
(In thousands)
|
|
|
|
|
|
|
|
|
|
|
|
|
|
|
|
|
|
|
|
|
|
|
|
|
|
|
|
|
|
|
|
|
|
|
|
|
|
|
|
|
|
|
|
|
|
|
|
|
|
|
|
|
|
|
|
|
|
|
|
|
|
Investments-non-controlled/non-affiliated(1)(2) |
|
Footnotes |
|
Reference Rate and Spread |
|
Interest Rate(3) |
|
|
|
Maturity Date |
|
Par Amount/ Shares |
|
Cost(4) |
|
Fair Value |
|
Percentage of Net Assets |
|
| Containers & Packaging |
|
|
|
|
|
|
|
|
|
|
|
|
|
|
|
|
|
|
|
|
|
| BP Purchaser, LLC |
|
(5) (8) |
|
L + |
|
5.50% |
|
10.24% |
|
|
|
12/11/2028 |
|
17,336 |
|
|
$ |
17,031 |
|
|
$ |
16,185 |
|
|
1.16 |
|
% |
| Fortis Solutions Group, LLC |
|
(5) (8) |
|
L + |
|
5.50% |
|
9.73% |
|
|
|
10/13/2028 |
|
26,980 |
|
|
26,513 |
|
|
26,101 |
|
|
1.87 |
|
|
| Fortis Solutions Group, LLC |
|
(5) (8) (13) |
|
L + |
|
5.50% |
|
9.73% |
|
|
|
10/13/2028 |
|
— |
|
|
(2) |
|
|
(3) |
|
|
— |
|
|
| Fortis Solutions Group, LLC |
|
(5) (8) (13) |
|
L + |
|
5.50% |
|
9.73% |
|
|
|
10/15/2028 |
|
— |
|
|
(7) |
|
|
(33) |
|
|
— |
|
|
| Fortis Solutions Group, LLC |
|
(5) (8) (13) |
|
L + |
|
5.50% |
|
9.73% |
|
|
|
10/15/2027 |
|
360 |
|
|
317 |
|
|
272 |
|
|
0.02 |
|
|
|
|
|
|
|
|
|
|
|
|
|
|
|
|
|
|
43,852 |
|
|
42,522 |
|
|
3.04 |
|
|
| Distributors |
|
|
|
|
|
|
|
|
|
|
|
|
|
|
|
|
|
|
|
|
|
| 48Forty Solutions LLC |
|
(5) (7) |
|
S + |
|
6.00% |
|
10.26% |
|
|
|
11/30/2026 |
|
1,796 |
|
|
1,728 |
|
|
1,732 |
|
|
0.12 |
|
|
| 48Forty Solutions LLC |
|
(5) (6) (7) |
|
S + |
|
5.50% |
|
9.76% |
|
|
|
11/30/2026 |
|
16,106 |
|
|
15,825 |
|
|
15,283 |
|
|
1.09 |
|
|
| 48Forty Solutions LLC |
|
(5) (7) (13) |
|
S + |
|
5.50% |
|
9.76% |
|
|
|
11/30/2026 |
|
— |
|
|
(46) |
|
|
(139) |
|
|
(0.01) |
|
|
| ABB Concise Optical Group, LLC |
|
(5) (8) |
|
L + |
|
7.50% |
|
12.67% |
|
|
|
02/23/2028 |
|
17,977 |
|
|
17,578 |
|
|
17,165 |
|
|
1.23 |
|
|
| ABB Concise Optical Group, LLC |
|
(5) (8) (13) |
|
P + |
|
6.50% |
|
13.99% |
|
|
|
02/23/2028 |
|
1,792 |
|
|
1,752 |
|
|
1,707 |
|
|
0.12 |
|
|
| Avalara, Inc. |
|
(5) (8) |
|
S + |
|
7.25% |
|
11.83% |
|
|
|
10/19/2028 |
|
10,712 |
|
|
10,451 |
|
|
10,451 |
|
|
0.75 |
|
|
| Avalara, Inc. |
|
(5) (8) (13) |
|
S + |
|
7.25% |
|
11.83% |
|
|
|
10/19/2028 |
|
— |
|
|
(26) |
|
|
(26) |
|
|
— |
|
|
| PT Intermediate Holdings III, LLC |
|
(5) (8) |
|
L + |
|
5.50% |
|
10.23% |
|
|
|
11/01/2028 |
|
28,632 |
|
|
28,383 |
|
|
27,804 |
|
|
1.99 |
|
|
| PT Intermediate Holdings III, LLC |
|
(5) (8) |
|
L + |
|
5.50% |
|
10.23% |
|
|
|
11/01/2028 |
|
15,929 |
|
|
15,787 |
|
|
15,469 |
|
|
1.11 |
|
|
| Radwell Parent, LLC |
|
(5) (6) (8) |
|
S + |
|
6.75% |
|
11.33% |
|
|
|
04/01/2029 |
|
32,558 |
|
|
31,607 |
|
|
31,607 |
|
|
2.26 |
|
|
| Radwell Parent, LLC |
|
(5) (8) (13) |
|
S + |
|
6.75% |
|
11.33% |
|
|
|
04/01/2028 |
|
— |
|
|
(71) |
|
|
(71) |
|
|
(0.01) |
|
|
|
|
|
|
|
|
|
|
|
|
|
|
|
|
|
|
122,968 |
|
|
120,982 |
|
|
8.66 |
|
|
| Diversified Consumer Services |
|
|
|
|
|
|
|
|
|
|
|
|
|
|
|
|
|
|
|
|
|
| Assembly Intermediate, LLC |
|
(5) (7) |
|
L + |
|
6.50% |
|
11.23% |
|
|
|
10/19/2027 |
|
20,741 |
|
|
20,393 |
|
|
19,944 |
|
|
1.43 |
|
|
| Assembly Intermediate, LLC |
|
(5) (7) (13) |
|
L + |
|
6.50% |
|
11.23% |
|
|
|
10/19/2027 |
|
2,904 |
|
|
2,836 |
|
|
2,705 |
|
|
0.19 |
|
|
| Assembly Intermediate, LLC |
|
(5) (7) (13) |
|
L + |
|
6.50% |
|
11.23% |
|
|
|
10/19/2027 |
|
830 |
|
|
796 |
|
|
750 |
|
|
0.05 |
|
|
| FPG Intermediate Holdco, LLC |
|
(5) (7) |
|
S + |
|
6.50% |
|
10.92% |
|
|
|
03/05/2027 |
|
497 |
|
|
488 |
|
|
472 |
|
|
0.03 |
|
|
| Heartland Home Services, Inc. |
|
(5) (8) (13) |
|
L + |
|
5.75% |
|
10.10% |
|
|
|
12/15/2026 |
|
1,877 |
|
|
1,860 |
|
|
1,802 |
|
|
0.13 |
|
|
| Lightspeed Solution, LLC |
|
(5) (8) |
|
S + |
|
6.50% |
|
10.82% |
|
|
|
03/01/2028 |
|
7,585 |
|
|
7,451 |
|
|
7,308 |
|
|
0.52 |
|
|
| Lightspeed Solution, LLC |
|
(5) (8) (13) |
|
S + |
|
6.50% |
|
10.82% |
|
|
|
03/01/2028 |
|
— |
|
|
(21) |
|
|
(89) |
|
|
(0.01) |
|
|
| LUV Car Wash Group, LLC |
|
(5) (7) (13) |
|
L + |
|
5.50% |
|
9.24% |
|
|
|
12/09/2026 |
|
372 |
|
|
367 |
|
|
359 |
|
|
0.03 |
|
|
| LUV Car Wash Group, LLC |
|
(5) (7) |
|
L + |
|
5.50% |
|
9.24% |
|
|
|
12/09/2026 |
|
349 |
|
|
346 |
|
|
341 |
|
|
0.02 |
|
|
| Magnolia Wash Holdings |
|
(5) (7) |
|
S + |
|
6.50% |
|
10.32% |
|
|
|
07/14/2028 |
|
3,767 |
|
|
3,696 |
|
|
3,608 |
|
|
0.26 |
|
|
| Magnolia Wash Holdings |
|
(5) (7) |
|
S + |
|
6.50% |
|
10.32% |
|
|
|
07/14/2028 |
|
706 |
|
|
692 |
|
|
676 |
|
|
0.05 |
|
|
| Magnolia Wash Holdings |
|
(5) (7) (13) |
|
S + |
|
6.50% |
|
10.32% |
|
|
|
07/14/2028 |
|
87 |
|
|
84 |
|
|
81 |
|
|
0.01 |
|
|
| Mammoth Holdings, LLC |
|
(5) (6) (7) |
|
S + |
|
6.00% |
|
9.82% |
|
|
|
10/16/2023 |
|
8,033 |
|
|
8,008 |
|
|
8,033 |
|
|
0.57 |
|
|
| Mammoth Holdings, LLC |
|
(5) (7) |
|
S + |
|
6.00% |
|
9.82% |
|
|
|
10/16/2023 |
|
35,966 |
|
|
35,846 |
|
|
35,966 |
|
|
2.57 |
|
|
| Mammoth Holdings, LLC |
|
(5) (7) (13) |
|
S + |
|
6.00% |
|
9.82% |
|
|
|
10/16/2023 |
|
— |
|
|
(3) |
|
|
— |
|
|
— |
|
|
| Spotless Brands, LLC |
|
(5) (7) |
|
S + |
|
6.50% |
|
10.71% |
|
|
|
07/25/2028 |
|
4,549 |
|
|
4,463 |
|
|
4,371 |
|
|
0.31 |
|
|
Morgan Stanley Direct Lending Fund
Consolidated Schedule of Investments (continued)
December 31, 2022
(In thousands)
|
|
|
|
|
|
|
|
|
|
|
|
|
|
|
|
|
|
|
|
|
|
|
|
|
|
|
|
|
|
|
|
|
|
|
|
|
|
|
|
|
|
|
|
|
|
|
|
|
|
|
|
|
|
|
|
|
|
|
|
|
|
Investments-non-controlled/non-affiliated(1)(2) |
|
Footnotes |
|
Reference Rate and Spread |
|
Interest Rate(3) |
|
|
|
Maturity Date |
|
Par Amount/ Shares |
|
Cost(4) |
|
Fair Value |
|
Percentage of Net Assets |
|
| Spotless Brands, LLC |
|
(5) (7) |
|
S + |
|
6.50% |
|
10.71% |
|
|
|
07/25/2028 |
|
860 |
|
|
$ |
843 |
|
|
$ |
826 |
|
|
0.06 |
|
% |
| Spotless Brands, LLC |
|
(5) (7) (13) |
|
S + |
|
6.50% |
|
10.71% |
|
|
|
07/25/2028 |
|
— |
|
|
(3) |
|
|
(6) |
|
|
— |
|
|
|
|
|
|
|
|
|
|
|
|
|
|
|
|
|
|
88,142 |
|
|
87,147 |
|
|
6.24 |
|
|
| Financial Services |
|
|
|
|
|
|
|
|
|
|
|
|
|
|
|
|
|
|
|
|
|
| Applitools, Inc. |
|
(5) (8) (10) |
|
S + |
|
6.25% |
|
10.57% |
|
|
|
05/25/2029 |
|
3,200 |
|
|
3,143 |
|
|
3,145 |
|
|
0.23 |
|
|
| Applitools, Inc. |
|
(5) (8) (10) (13) |
|
S + |
|
6.25% |
|
10.57% |
|
|
|
05/25/2028 |
|
— |
|
|
(8) |
|
|
(7) |
|
|
— |
|
|
| Cerity Partners, LLC |
|
(5) (8) |
|
S + |
|
6.75% |
|
11.32% |
|
|
|
12/29/2029 |
|
8,617 |
|
|
8,359 |
|
|
8,359 |
|
|
0.60 |
|
|
| Cerity Partners, LLC |
|
(5) (8) (13) |
|
S + |
|
6.75% |
|
11.32% |
|
|
|
12/29/2029 |
|
454 |
|
|
60 |
|
|
60 |
|
|
— |
|
|
| SitusAMC Holdings Corp. |
|
(5) (8) |
|
L + |
|
5.50% |
|
10.23% |
|
|
|
12/22/2027 |
|
3,573 |
|
|
3,542 |
|
|
3,417 |
|
|
0.24 |
|
|
| Smarsh, Inc. |
|
(5) (8) |
|
S + |
|
6.50% |
|
11.29% |
|
|
|
02/16/2029 |
|
4,286 |
|
|
4,208 |
|
|
4,126 |
|
|
0.30 |
|
|
| Smarsh, Inc. |
|
(5) (8) (13) |
|
S + |
|
6.50% |
|
11.29% |
|
|
|
02/16/2029 |
|
536 |
|
|
521 |
|
|
496 |
|
|
0.04 |
|
|
| Smarsh, Inc. |
|
(5) (8) (13) |
|
S + |
|
6.50% |
|
11.29% |
|
|
|
02/16/2029 |
|
— |
|
|
(5) |
|
|
(10) |
|
|
— |
|
|
|
|
|
|
|
|
|
|
|
|
|
|
|
|
|
|
19,820 |
|
|
19,586 |
|
|
1.40 |
|
|
| Electronic Equipment, Instruments & Components |
|
|
|
|
|
|
|
|
|
|
|
|
|
|
|
|
|
|
|
|
|
| Abracon Group Holdings, LLC |
|
(5) (8) |
|
S + |
|
5.75% |
|
10.48% |
|
|
|
07/06/2028 |
|
5,534 |
|
|
5,431 |
|
|
5,249 |
|
|
0.38 |
|
|
| Abracon Group Holdings, LLC |
|
(5) (8) (13) |
|
S + |
|
5.75% |
|
10.48% |
|
|
|
07/06/2028 |
|
— |
|
|
(9) |
|
|
(51) |
|
|
— |
|
|
| Abracon Group Holdings, LLC |
|
(5) (8) (13) |
|
S + |
|
5.75% |
|
10.48% |
|
|
|
07/06/2028 |
|
— |
|
|
(7) |
|
|
(21) |
|
|
— |
|
|
| Dwyer Instruments, Inc. |
|
(5) (8) |
|
L + |
|
6.00% |
|
10.73% |
|
|
|
07/21/2027 |
|
8,059 |
|
|
7,911 |
|
|
7,694 |
|
|
0.55 |
|
|
| Dwyer Instruments, Inc. |
|
(5) (8) (13) |
|
L + |
|
6.00% |
|
10.73% |
|
|
|
07/21/2027 |
|
— |
|
|
(18) |
|
|
(92) |
|
|
(0.01) |
|
|
| Dwyer Instruments, Inc. |
|
(5) (8) (13) |
|
L + |
|
6.00% |
|
10.73% |
|
|
|
07/21/2027 |
|
158 |
|
|
140 |
|
|
113 |
|
|
0.01 |
|
|
|
|
|
|
|
|
|
|
|
|
|
|
|
|
|
|
13,448 |
|
|
12,892 |
|
|
0.92 |
|
|
| Food Products |
|
|
|
|
|
|
|
|
|
|
|
|
|
|
|
|
|
|
|
|
|
| AMCP Pet Holdings, Inc. (Brightpet) |
|
(5) (6) (7) |
|
L + |
|
6.25% |
|
10.98% |
|
|
|
10/05/2026 |
|
17,150 |
|
|
16,798 |
|
|
16,795 |
|
|
1.20 |
|
|
| AMCP Pet Holdings, Inc. (Brightpet) |
|
(5) (7) |
|
L + |
|
6.25% |
|
10.98% |
|
|
|
10/05/2026 |
|
16,333 |
|
|
15,989 |
|
|
15,995 |
|
|
1.14 |
|
|
| AMCP Pet Holdings, Inc. (Brightpet) |
|
(5) (7) |
|
L + |
|
6.25% |
|
10.98% |
|
|
|
10/05/2026 |
|
5,833 |
|
|
5,721 |
|
|
5,713 |
|
|
0.41 |
|
|
| Nellson Nutraceutical, Inc. |
|
(5) (6) (7) |
|
S + |
|
5.75% |
|
10.17% |
|
|
|
12/23/2025 |
|
23,592 |
|
|
23,439 |
|
|
23,476 |
|
|
1.68 |
|
|
| Teasdale Foods, Inc. (Teasdale Latin Foods) |
|
(5) (7) |
|
L + |
|
7.25% (incl. 1.00% PIK) |
|
12.29% |
|
|
|
12/18/2025 |
|
10,812 |
|
|
10,675 |
|
|
9,017 |
|
|
0.65 |
|
|
|
|
|
|
|
|
|
|
|
|
|
|
|
|
|
|
72,622 |
|
|
70,996 |
|
|
5.08 |
|
|
| Health Care Equipment & Supplies |
|
|
|
|
|
|
|
|
|
|
|
|
|
|
|
|
|
|
|
|
|
| Performance Health & Wellness |
|
(5) (6) (7) |
|
L + |
|
6.00% |
|
10.73% |
|
|
|
07/12/2027 |
|
9,398 |
|
|
9,248 |
|
|
8,956 |
|
|
0.64 |
|
|
| Health Care Providers & Services |
|
|
|
|
|
|
|
|
|
|
|
|
|
|
|
|
|
|
|
|
|
| Advarra Holdings, Inc. |
|
(5) (8) |
|
S + |
|
5.75% |
|
10.15% |
|
|
|
08/24/2029 |
|
459 |
|
|
451 |
|
|
434 |
|
|
0.03 |
|
|
| Advarra Holdings, Inc. |
|
(5) (8) (13) |
|
S + |
|
5.75% |
|
10.15% |
|
|
|
08/24/2029 |
|
— |
|
|
— |
|
|
(2) |
|
|
— |
|
|
| DCA Investment Holdings, LLC |
|
(5) (6) (8) |
|
S + |
|
6.00% |
|
10.39% |
|
|
|
04/03/2028 |
|
11,053 |
|
|
10,922 |
|
|
10,887 |
|
|
0.78 |
|
|
| DCA Investment Holdings, LLC |
|
(5) (8) (13) |
|
S + |
|
6.00% |
|
10.39% |
|
|
|
04/03/2028 |
|
2,629 |
|
|
2,572 |
|
|
2,575 |
|
|
0.18 |
|
|
| Gateway US Holdings, Inc. |
|
(5) (8) (10) |
|
S + |
|
6.50% |
|
11.23% |
|
|
|
09/22/2026 |
|
750 |
|
|
744 |
|
|
736 |
|
|
0.05 |
|
|
Morgan Stanley Direct Lending Fund
Consolidated Schedule of Investments (continued)
December 31, 2022
(In thousands)
|
|
|
|
|
|
|
|
|
|
|
|
|
|
|
|
|
|
|
|
|
|
|
|
|
|
|
|
|
|
|
|
|
|
|
|
|
|
|
|
|
|
|
|
|
|
|
|
|
|
|
|
|
|
|
|
|
|
|
|
|
|
Investments-non-controlled/non-affiliated(1)(2) |
|
Footnotes |
|
Reference Rate and Spread |
|
Interest Rate(3) |
|
|
|
Maturity Date |
|
Par Amount/ Shares |
|
Cost(4) |
|
Fair Value |
|
Percentage of Net Assets |
|
| Gateway US Holdings, Inc. |
|
(5) (8) (10) (13) |
|
S + |
|
6.50% |
|
11.23% |
|
|
|
09/22/2026 |
|
165 |
|
|
$ |
164 |
|
|
$ |
162 |
|
|
0.01 |
|
% |
| Gateway US Holdings, Inc. |
|
(5) (8) (10) (13) |
|
S + |
|
6.50% |
|
11.23% |
|
|
|
09/22/2026 |
|
17 |
|
|
16 |
|
|
16 |
|
|
— |
|
|
| Heartland Veterinary Partners, LLC |
|
(5) (7) |
|
S + |
|
4.75% |
|
9.56% |
|
|
|
12/10/2026 |
|
1,866 |
|
|
1,851 |
|
|
1,812 |
|
|
0.13 |
|
|
| Heartland Veterinary Partners, LLC |
|
(5) (7) (13) |
|
S + |
|
4.75% |
|
9.56% |
|
|
|
12/10/2026 |
|
2,969 |
|
|
2,936 |
|
|
2,847 |
|
|
0.20 |
|
|
| Heartland Veterinary Partners, LLC |
|
(5) (7) (13) |
|
S + |
|
4.75% |
|
9.56% |
|
|
|
12/10/2026 |
|
— |
|
|
(3) |
|
|
(11) |
|
|
— |
|
|
| iCIMS, Inc. |
|
(5) (8) |
|
S + |
|
7.25% (incl. 3.88% PIK) |
|
11.52% |
|
|
|
08/18/2028 |
|
6,568 |
|
|
6,455 |
|
|
6,455 |
|
|
0.46 |
|
|
| Intelerad Medical Systems Incorporated |
|
(5) (7) (10) |
|
S + |
|
6.50% |
|
11.23% |
|
|
|
08/21/2026 |
|
500 |
|
|
486 |
|
|
489 |
|
|
0.03 |
|
|
| mPulse Mobile, Inc. |
|
(5) (8) |
|
L + |
|
5.25% |
|
9.32% |
|
|
|
12/17/2027 |
|
17,500 |
|
|
17,200 |
|
|
16,977 |
|
|
1.21 |
|
|
| mPulse Mobile, Inc. |
|
(5) (8) (13) |
|
L + |
|
5.25% |
|
9.32% |
|
|
|
12/17/2027 |
|
— |
|
|
(17) |
|
|
(60) |
|
|
— |
|
|
| mPulse Mobile, Inc. |
|
(5) (8) (13) |
|
L + |
|
5.25% |
|
9.32% |
|
|
|
12/17/2027 |
|
151 |
|
|
143 |
|
|
136 |
|
|
0.01 |
|
|
| Promptcare Infusion Buyer, Inc. |
|
(5) (7) |
|
L + |
|
6.00% |
|
10.22% |
|
|
|
09/01/2027 |
|
9,073 |
|
|
8,925 |
|
|
8,757 |
|
|
0.63 |
|
|
| Promptcare Infusion Buyer, Inc. |
|
(5) (7) (13) |
|
L + |
|
6.00% |
|
10.22% |
|
|
|
09/01/2027 |
|
881 |
|
|
849 |
|
|
766 |
|
|
0.05 |
|
|
| Southern Veterinary Partners, LLC |
|
(5) (7) |
|
S + |
|
5.50% |
|
9.93% |
|
|
|
10/05/2027 |
|
899 |
|
|
883 |
|
|
854 |
|
|
0.06 |
|
|
| Stepping Stones Healthcare Services, LLC |
|
(5) (8) |
|
L + |
|
5.75% |
|
10.48% |
|
|
|
01/02/2029 |
|
4,342 |
|
|
4,284 |
|
|
4,111 |
|
|
0.29 |
|
|
| Stepping Stones Healthcare Services, LLC |
|
(5) (8) (13) |
|
L + |
|
5.75% |
|
10.48% |
|
|
|
01/02/2029 |
|
511 |
|
|
500 |
|
|
444 |
|
|
0.03 |
|
|
| Stepping Stones Healthcare Services, LLC |
|
(5) (8) (13) |
|
P + |
|
4.75% |
|
12.25% |
|
|
|
12/30/2026 |
|
450 |
|
|
442 |
|
|
417 |
|
|
0.03 |
|
|
| Suveto |
|
(5) (8) (13) |
|
L + |
|
5.00% |
|
9.38% |
|
|
|
09/09/2027 |
|
11,038 |
|
|
10,935 |
|
|
10,461 |
|
|
0.75 |
|
|
| Suveto |
|
(5) (8) (13) |
|
L + |
|
5.00% |
|
9.38% |
|
|
|
09/09/2027 |
|
810 |
|
|
793 |
|
|
764 |
|
|
0.05 |
|
|
| Tivity Health, Inc. |
|
(5) (8) |
|
S + |
|
6.00% |
|
10.58% |
|
|
|
06/28/2029 |
|
3,711 |
|
|
3,658 |
|
|
3,592 |
|
|
0.26 |
|
|
| Vardiman Black Holdings, LLC |
|
(5) (9) |
|
S + |
|
7.00% |
|
11.22% |
|
|
|
03/18/2027 |
|
3,412 |
|
|
3,382 |
|
|
3,227 |
|
|
0.23 |
|
|
| Vardiman Black Holdings, LLC |
|
(5) (9) (13) |
|
S + |
|
7.00% |
|
11.22% |
|
|
|
03/18/2027 |
|
3,907 |
|
|
3,871 |
|
|
3,687 |
|
|
0.26 |
|
|
| Vermont Aus Pty Ltd |
|
(5) (8) (10) |
|
S + |
|
5.65% |
|
10.23% |
|
|
|
03/23/2028 |
|
8,436 |
|
|
8,244 |
|
|
7,927 |
|
|
0.57 |
|
|
|
|
|
|
|
|
|
|
|
|
|
|
|
|
|
|
90,686 |
|
|
88,460 |
|
|
6.33 |
|
|
| Health Care Technology |
|
|
|
|
|
|
|
|
|
|
|
|
|
|
|
|
|
|
|
|
|
| Lightspeed Buyer, Inc. |
|
(5) (6) (7) |
|
L + |
|
5.50% |
|
9.98% |
|
|
|
02/03/2026 |
|
12,669 |
|
|
12,442 |
|
|
12,300 |
|
|
0.88 |
|
|
| Lightspeed Buyer, Inc. |
|
(5) (7) |
|
L + |
|
5.50% |
|
9.98% |
|
|
|
02/03/2026 |
|
9,234 |
|
|
9,053 |
|
|
8,966 |
|
|
0.64 |
|
|
| Lightspeed Buyer, Inc. |
|
(5) (7) (13) |
|
L + |
|
5.50% |
|
9.98% |
|
|
|
02/03/2026 |
|
— |
|
|
(28) |
|
|
(118) |
|
|
(0.01) |
|
|
|
|
|
|
|
|
|
|
|
|
|
|
|
|
|
|
21,467 |
|
|
21,148 |
|
|
1.51 |
|
|
| Industrial Conglomerates |
|
|
|
|
|
|
|
|
|
|
|
|
|
|
|
|
|
|
|
|
|
| Excelitas Technologies Corp. |
|
(5) (8) |
|
S + |
|
5.75% |
|
10.12% |
|
|
|
08/13/2029 |
|
1,378 |
|
|
1,351 |
|
|
1,311 |
|
|
0.09 |
|
|
| Excelitas Technologies Corp. |
|
(5) (8) |
|
E + |
|
5.75% |
|
7.55% |
|
|
|
08/13/2029 |
|
€ |
242 |
|
|
245 |
|
|
246 |
|
|
0.02 |
|
|
| Excelitas Technologies Corp. |
|
(5) (8) (13) |
|
S + |
|
5.75% |
|
10.12% |
|
|
|
08/13/2029 |
|
— |
|
|
(2) |
|
|
(13) |
|
|
— |
|
|
| Excelitas Technologies Corp. |
|
(5) (8) (13) |
|
S + |
|
5.75% |
|
10.12% |
|
|
|
08/14/2028 |
|
74 |
|
|
72 |
|
|
68 |
|
|
— |
|
|
|
|
|
|
|
|
|
|
|
|
|
|
|
|
|
|
1,666 |
|
|
1,612 |
|
|
0.12 |
|
|
| Insurance Services |
|
|
|
|
|
|
|
|
|
|
|
|
|
|
|
|
|
|
|
|
|
| Amerilife Holdings, LLC |
|
(5) (8) |
|
S + |
|
5.75% |
|
9.58% |
|
|
|
08/31/2029 |
|
2,044 |
|
|
2,005 |
|
|
2,005 |
|
|
0.14 |
|
|
Morgan Stanley Direct Lending Fund
Consolidated Schedule of Investments (continued)
December 31, 2022
(In thousands)
|
|
|
|
|
|
|
|
|
|
|
|
|
|
|
|
|
|
|
|
|
|
|
|
|
|
|
|
|
|
|
|
|
|
|
|
|
|
|
|
|
|
|
|
|
|
|
|
|
|
|
|
|
|
|
|
|
|
|
|
|
|
Investments-non-controlled/non-affiliated(1)(2) |
|
Footnotes |
|
Reference Rate and Spread |
|
Interest Rate(3) |
|
|
|
Maturity Date |
|
Par Amount/ Shares |
|
Cost(4) |
|
Fair Value |
|
Percentage of Net Assets |
|
| Amerilife Holdings, LLC |
|
(5) (8) (13) |
|
S + |
|
5.75% |
|
10.15% |
|
|
|
08/31/2029 |
|
583 |
|
|
$ |
569 |
|
|
$ |
569 |
|
|
0.04 |
|
% |
| Amerilife Holdings, LLC |
|
(5) (8) (13) |
|
S + |
|
5.75% |
|
10.15% |
|
|
|
08/31/2028 |
|
— |
|
|
(8) |
|
|
(8) |
|
|
— |
|
|
| Foundation Risk Partners Corp. |
|
(5) (8) |
|
S + |
|
6.00% |
|
10.68% |
|
|
|
10/29/2028 |
|
42,966 |
|
|
42,408 |
|
|
42,218 |
|
|
3.02 |
|
|
| Foundation Risk Partners Corp. |
|
(5) (8) |
|
S + |
|
6.00% |
|
10.68% |
|
|
|
10/29/2028 |
|
9,345 |
|
|
9,222 |
|
|
9,182 |
|
|
0.66 |
|
|
| Foundation Risk Partners Corp. |
|
(5) (8) (13) |
|
S + |
|
6.00% |
|
10.32% |
|
|
|
10/29/2027 |
|
1,882 |
|
|
1,827 |
|
|
1,803 |
|
|
0.13 |
|
|
| Galway Borrower, LLC |
|
(5) (8) |
|
L + |
|
5.25% |
|
9.98% |
|
|
|
09/29/2028 |
|
32,271 |
|
|
31,721 |
|
|
30,880 |
|
|
2.21 |
|
|
| Galway Borrower, LLC |
|
(5) (8) (13) |
|
L + |
|
5.25% |
|
9.98% |
|
|
|
09/29/2028 |
|
— |
|
|
(7) |
|
|
(13) |
|
|
— |
|
|
| Galway Borrower, LLC |
|
(5) (8) (13) |
|
L + |
|
5.25% |
|
9.98% |
|
|
|
09/30/2027 |
|
— |
|
|
(32) |
|
|
(88) |
|
|
(0.01) |
|
|
| Higginbotham Insurance Agency, Inc. |
|
(5) (6) (8) |
|
L + |
|
5.25% |
|
9.63% |
|
|
|
11/25/2026 |
|
18,482 |
|
|
18,287 |
|
|
17,986 |
|
|
1.29 |
|
|
| High Street Buyer, Inc. |
|
(5) (6) (8) |
|
L + |
|
6.00% |
|
10.73% |
|
|
|
04/14/2028 |
|
9,992 |
|
|
9,832 |
|
|
9,702 |
|
|
0.69 |
|
|
| High Street Buyer, Inc. |
|
(5) (6) (8) |
|
L + |
|
6.00% |
|
10.73% |
|
|
|
04/14/2028 |
|
40,125 |
|
|
39,459 |
|
|
38,961 |
|
|
2.79 |
|
|
| High Street Buyer, Inc. |
|
(5) (8) (13) |
|
L + |
|
6.00% |
|
10.73% |
|
|
|
04/16/2027 |
|
— |
|
|
(31) |
|
|
(62) |
|
|
— |
|
|
| Integrity Marketing Acquisition, LLC |
|
(5) (6) (8) |
|
L + |
|
6.05% |
|
10.81% |
|
|
|
08/27/2025 |
|
44,059 |
|
|
43,688 |
|
|
42,808 |
|
|
3.06 |
|
|
| Integrity Marketing Acquisition, LLC |
|
(5) (8) |
|
L + |
|
6.05% |
|
10.81% |
|
|
|
08/27/2025 |
|
24,599 |
|
|
24,373 |
|
|
23,900 |
|
|
1.71 |
|
|
| Integrity Marketing Acquisition, LLC |
|
(5) (8) |
|
L + |
|
6.05% |
|
10.81% |
|
|
|
08/27/2025 |
|
17,290 |
|
|
17,108 |
|
|
16,799 |
|
|
1.20 |
|
|
| Keystone Agency Investors |
|
(5) (7) |
|
S + |
|
6.25% |
|
10.98% |
|
|
|
05/03/2027 |
|
3,516 |
|
|
3,467 |
|
|
3,467 |
|
|
0.25 |
|
|
| Keystone Agency Investors |
|
(5) (7) |
|
S + |
|
6.25% |
|
10.98% |
|
|
|
05/03/2027 |
|
4,047 |
|
|
3,993 |
|
|
3,993 |
|
|
0.29 |
|
|
| Majesco |
|
(5) (6) (7) |
|
L + |
|
7.25% |
|
11.98% |
|
|
|
09/21/2027 |
|
23,421 |
|
|
22,948 |
|
|
22,447 |
|
|
1.61 |
|
|
| Majesco |
|
(5) (7) (13) |
|
L + |
|
7.25% |
|
11.98% |
|
|
|
09/21/2026 |
|
— |
|
|
(29) |
|
|
(66) |
|
|
— |
|
|
| Oakbridge Insurance Agency, LLC |
|
(5) (7) |
|
S + |
|
5.75% |
|
10.17% |
|
|
|
12/31/2026 |
|
1,078 |
|
|
1,062 |
|
|
1,062 |
|
|
0.08 |
|
|
| Oakbridge Insurance Agency, LLC |
|
(5) (7) (13) |
|
S + |
|
5.75% |
|
10.17% |
|
|
|
12/31/2026 |
|
60 |
|
|
56 |
|
|
56 |
|
|
— |
|
|
| Oakbridge Insurance Agency, LLC |
|
(5) (7) (13) |
|
S + |
|
5.75% |
|
10.17% |
|
|
|
12/31/2026 |
|
19 |
|
|
18 |
|
|
18 |
|
|
— |
|
|
| Patriot Growth Insurance Services, LLC |
|
(5) (6) (8) |
|
L + |
|
5.50% |
|
8.86% |
|
|
|
10/16/2028 |
|
61,902 |
|
|
60,837 |
|
|
59,042 |
|
|
4.23 |
|
|
| Patriot Growth Insurance Services, LLC |
|
(5) (8) |
|
L + |
|
5.50% |
|
8.86% |
|
|
|
10/16/2028 |
|
1,089 |
|
|
1,060 |
|
|
1,039 |
|
|
0.07 |
|
|
| Patriot Growth Insurance Services, LLC |
|
(5) (8) (13) |
|
L + |
|
5.50% |
|
8.86% |
|
|
|
10/16/2028 |
|
— |
|
|
(74) |
|
|
(207) |
|
|
(0.01) |
|
|
| Peter C. Foy & Associates Insurance Services, LLC |
|
(5) (8) |
|
S + |
|
6.00% |
|
11.12% |
|
|
|
11/01/2028 |
|
910 |
|
|
897 |
|
|
866 |
|
|
0.06 |
|
|
| Peter C. Foy & Associates Insurance Services, LLC |
|
(5) (8) (13) |
|
S + |
|
6.00% |
|
11.12% |
|
|
|
11/01/2028 |
|
1,985 |
|
|
1,955 |
|
|
1,874 |
|
|
0.13 |
|
|
| Peter C. Foy & Associates Insurance Services, LLC |
|
(5) (8) |
|
L + |
|
6.00% |
|
11.21% |
|
|
|
11/01/2028 |
|
17,793 |
|
|
17,638 |
|
|
16,930 |
|
|
1.21 |
|
|
| Peter C. Foy & Associates Insurance Services, LLC |
|
(5) (8) (13) |
|
L + |
|
6.00% |
|
11.21% |
|
|
|
11/01/2028 |
|
4,942 |
|
|
4,899 |
|
|
4,703 |
|
|
0.34 |
|
|
| Peter C. Foy & Associates Insurance Services, LLC |
|
(5) (8) (13) |
|
L + |
|
6.00% |
|
11.21% |
|
|
|
11/01/2027 |
|
— |
|
|
(7) |
|
|
(40) |
|
|
— |
|
|
| RSC Acquisition, Inc. |
|
(5) (6) (8) |
|
S + |
|
5.50% |
|
9.97% |
|
|
|
10/30/2026 |
|
24,774 |
|
|
24,417 |
|
|
23,999 |
|
|
1.72 |
|
|
| RSC Acquisition, Inc. |
|
(5) (8) |
|
S + |
|
5.50% |
|
9.97% |
|
|
|
10/30/2026 |
|
7,961 |
|
|
7,900 |
|
|
7,712 |
|
|
0.55 |
|
|
| World Insurance Associates, LLC |
|
(5) (6) (7) |
|
S + |
|
5.75% |
|
10.33% |
|
|
|
04/01/2026 |
|
33,331 |
|
|
32,499 |
|
|
32,288 |
|
|
2.31 |
|
|
| World Insurance Associates, LLC |
|
(5) (6) (7) |
|
S + |
|
5.75% |
|
10.33% |
|
|
|
04/01/2026 |
|
31,170 |
|
|
30,528 |
|
|
30,194 |
|
|
2.16 |
|
|
| World Insurance Associates, LLC |
|
(5) (7) (13) |
|
S + |
|
5.75% |
|
10.33% |
|
|
|
04/01/2026 |
|
825 |
|
|
808 |
|
|
785 |
|
|
0.06 |
|
|
|
|
|
|
|
|
|
|
|
|
|
|
|
|
|
|
455,293 |
|
|
446,804 |
|
|
31.98 |
|
|
|
|
|
|
|
|
|
|
|
|
|
|
|
|
|
|
|
|
|
|
|
|
Morgan Stanley Direct Lending Fund
Consolidated Schedule of Investments (continued)
December 31, 2022
(In thousands)
|
|
|
|
|
|
|
|
|
|
|
|
|
|
|
|
|
|
|
|
|
|
|
|
|
|
|
|
|
|
|
|
|
|
|
|
|
|
|
|
|
|
|
|
|
|
|
|
|
|
|
|
|
|
|
|
|
|
|
|
|
|
Investments-non-controlled/non-affiliated(1)(2) |
|
Footnotes |
|
Reference Rate and Spread |
|
Interest Rate(3) |
|
|
|
Maturity Date |
|
Par Amount/ Shares |
|
Cost(4) |
|
Fair Value |
|
Percentage of Net Assets |
|
| Interactive Media & Services |
|
|
|
|
|
|
|
|
|
|
|
|
|
|
|
|
|
|
|
|
|
| FMG Suite Holdings, LLC |
|
(5) (7) |
|
S + |
|
5.50% |
|
9.34% |
|
|
|
10/30/2026 |
|
24,060 |
|
|
$ |
23,699 |
|
|
$ |
23,546 |
|
|
1.69 |
|
% |
| FMG Suite Holdings, LLC |
|
(5) (7) |
|
S + |
|
5.50% |
|
9.34% |
|
|
|
10/30/2026 |
|
5,224 |
|
|
5,151 |
|
|
5,112 |
|
|
0.37 |
|
|
| FMG Suite Holdings, LLC |
|
(5) (7) (13) |
|
S + |
|
5.50% |
|
9.34% |
|
|
|
10/30/2026 |
|
551 |
|
|
515 |
|
|
495 |
|
|
0.04 |
|
|
| MSM Acquisitions, Inc. |
|
(5) (6) (7) |
|
L + |
|
6.00% |
|
10.75% |
|
|
|
12/09/2026 |
|
31,570 |
|
|
31,179 |
|
|
30,815 |
|
|
2.21 |
|
|
| MSM Acquisitions, Inc. |
|
(5) (7) (13) |
|
L + |
|
6.00% |
|
10.75% |
|
|
|
12/09/2026 |
|
12,743 |
|
|
12,493 |
|
|
11,878 |
|
|
0.85 |
|
|
| MSM Acquisitions, Inc. |
|
(5) (7) (13) |
|
L + |
|
6.00% |
|
10.75% |
|
|
|
12/09/2026 |
|
1,836 |
|
|
1,784 |
|
|
1,741 |
|
|
0.12 |
|
|
| Triple Lift, Inc. |
|
(5) (6) (8) |
|
S + |
|
5.50% |
|
10.12% |
|
|
|
05/08/2028 |
|
27,580 |
|
|
27,136 |
|
|
26,162 |
|
|
1.87 |
|
|
| Triple Lift, Inc. |
|
(5) (8) (13) |
|
S + |
|
5.25% |
|
9.58% |
|
|
|
05/08/2028 |
|
1,533 |
|
|
1,472 |
|
|
1,328 |
|
|
0.10 |
|
|
|
|
|
|
|
|
|
|
|
|
|
|
|
|
|
|
103,429 |
|
|
101,077 |
|
|
7.23 |
|
|
| IT Services |
|
|
|
|
|
|
|
|
|
|
|
|
|
|
|
|
|
|
|
|
|
| Atlas Purchaser, Inc. |
|
(6) (8) |
|
L + |
|
5.25% |
|
9.81% |
|
|
|
05/08/2028 |
|
8,922 |
|
|
8,778 |
|
|
6,225 |
|
|
0.45 |
|
|
| Donuts, Inc. |
|
(5) (6) (7) |
|
S + |
|
6.00% |
|
10.43% |
|
|
|
12/29/2027 |
|
18,375 |
|
|
18,108 |
|
|
17,910 |
|
|
1.28 |
|
|
| Donuts, Inc. |
|
(5) (7) |
|
S + |
|
6.00% |
|
10.43% |
|
|
|
12/29/2027 |
|
6,735 |
|
|
6,735 |
|
|
6,565 |
|
|
0.47 |
|
|
| Donuts, Inc. |
|
(5) (7) (13) |
|
S + |
|
6.00% |
|
10.43% |
|
|
|
12/29/2027 |
|
— |
|
|
— |
|
|
(80) |
|
|
(0.01) |
|
|
| Govbrands Intermediate, Inc. |
|
(5) (6) (8) |
|
L + |
|
5.50% |
|
10.23% |
|
|
|
08/04/2027 |
|
39,759 |
|
|
38,962 |
|
|
37,942 |
|
|
2.72 |
|
|
| Govbrands Intermediate, Inc. |
|
(5) (8) (13) |
|
L + |
|
5.50% |
|
10.23% |
|
|
|
08/04/2027 |
|
8,969 |
|
|
8,751 |
|
|
8,367 |
|
|
0.60 |
|
|
| Govbrands Intermediate, Inc. |
|
(5) (8) (13) |
|
L + |
|
5.50% |
|
10.23% |
|
|
|
08/04/2027 |
|
3,814 |
|
|
3,733 |
|
|
3,620 |
|
|
0.26 |
|
|
| Long Term Care Group, Inc. |
|
(5) (8) |
|
L + |
|
6.00% |
|
10.34% |
|
|
|
09/08/2027 |
|
4,963 |
|
|
4,875 |
|
|
4,768 |
|
|
0.34 |
|
|
| Recovery Point Systems, Inc. |
|
(5) (6) (7) |
|
S + |
|
6.50% |
|
10.26% |
|
|
|
08/12/2026 |
|
41,055 |
|
|
40,514 |
|
|
41,002 |
|
|
2.93 |
|
|
| Recovery Point Systems, Inc. |
|
(5) (7) (13) |
|
S + |
|
6.50% |
|
10.26% |
|
|
|
08/12/2026 |
|
— |
|
|
(48) |
|
|
(5) |
|
|
— |
|
|
| Redwood Services Group, LLC |
|
(5) (8) |
|
S + |
|
6.00% |
|
10.68% |
|
|
|
06/15/2029 |
|
10,939 |
|
|
10,732 |
|
|
10,462 |
|
|
0.75 |
|
|
| Redwood Services Group, LLC |
|
(5) (8) (13) |
|
S + |
|
6.00% |
|
10.68% |
|
|
|
06/15/2029 |
|
1,880 |
|
|
1,848 |
|
|
1,766 |
|
|
0.13 |
|
|
| Syntax Systems Ltd |
|
(5) (8) (10) |
|
L + |
|
5.50% |
|
10.13% |
|
|
|
10/29/2028 |
|
35,452 |
|
|
35,146 |
|
|
33,520 |
|
|
2.40 |
|
|
| Syntax Systems Ltd |
|
(5) (8) (10) (13) |
|
L + |
|
5.50% |
|
10.13% |
|
|
|
10/29/2028 |
|
— |
|
|
(78) |
|
|
(510) |
|
|
(0.04) |
|
|
| Syntax Systems Ltd |
|
(5) (8) (10) (13) |
|
L + |
|
5.61% |
|
10.08% |
|
|
|
10/29/2026 |
|
2,495 |
|
|
2,466 |
|
|
2,291 |
|
|
0.16 |
|
|
| Thrive Buyer, Inc. (Thrive Networks) |
|
(5) (6) (7) |
|
L + |
|
6.00% |
|
10.73% |
|
|
|
01/22/2027 |
|
20,561 |
|
|
20,258 |
|
|
20,059 |
|
|
1.44 |
|
|
| Thrive Buyer, Inc. (Thrive Networks) |
|
(5) (7) |
|
L + |
|
6.00% |
|
10.73% |
|
|
|
01/22/2027 |
|
17,085 |
|
|
16,820 |
|
|
16,668 |
|
|
1.19 |
|
|
| Thrive Buyer, Inc. (Thrive Networks) |
|
(5) (7) (13) |
|
P + |
|
5.00% |
|
12.50% |
|
|
|
01/22/2027 |
|
264 |
|
|
236 |
|
|
216 |
|
|
0.02 |
|
|
| UpStack, Inc. |
|
(5) (7) |
|
L + |
|
5.75% |
|
10.32% |
|
|
|
08/20/2027 |
|
9,737 |
|
|
9,539 |
|
|
9,444 |
|
|
0.68 |
|
|
| UpStack, Inc. |
|
(5) (7) (13) |
|
L + |
|
5.75% |
|
10.32% |
|
|
|
08/20/2027 |
|
3,292 |
|
|
3,205 |
|
|
3,162 |
|
|
0.23 |
|
|
| UpStack, Inc. |
|
(5) (7) (13) |
|
L + |
|
5.75% |
|
10.32% |
|
|
|
08/20/2027 |
|
— |
|
|
(19) |
|
|
(26) |
|
|
— |
|
|
|
|
|
|
|
|
|
|
|
|
|
|
|
|
|
|
230,561 |
|
|
223,366 |
|
|
15.99 |
|
|
|
|
|
|
|
|
|
|
|
|
|
|
|
|
|
|
|
|
|
|
|
|
| Leisure Products |
|
|
|
|
|
|
|
|
|
|
|
|
|
|
|
|
|
|
|
|
|
| GSM Acquisition Corp. (GSM Outdoors) |
|
(5) (6) (7) |
|
S + |
|
5.00% |
|
9.84% |
|
|
|
11/16/2026 |
|
17,447 |
|
|
17,319 |
|
|
17,194 |
|
|
1.23 |
|
|
| GSM Acquisition Corp. (GSM Outdoors) |
|
(5) (7) |
|
S + |
|
5.00% |
|
9.84% |
|
|
|
11/16/2026 |
|
4,490 |
|
|
4,446 |
|
|
4,425 |
|
|
0.32 |
|
|
Morgan Stanley Direct Lending Fund
Consolidated Schedule of Investments (continued)
December 31, 2022
(In thousands)
|
|
|
|
|
|
|
|
|
|
|
|
|
|
|
|
|
|
|
|
|
|
|
|
|
|
|
|
|
|
|
|
|
|
|
|
|
|
|
|
|
|
|
|
|
|
|
|
|
|
|
|
|
|
|
|
|
|
|
|
|
|
Investments-non-controlled/non-affiliated(1)(2) |
|
Footnotes |
|
Reference Rate and Spread |
|
Interest Rate(3) |
|
|
|
Maturity Date |
|
Par Amount/ Shares |
|
Cost(4) |
|
Fair Value |
|
Percentage of Net Assets |
|
| GSM Acquisition Corp. (GSM Outdoors) |
|
(5) (7) (13) |
|
S + |
|
5.00% |
|
9.84% |
|
|
|
11/16/2026 |
|
— |
|
|
$ |
(39) |
|
|
$ |
(62) |
|
|
— |
|
% |
|
|
|
|
|
|
|
|
|
|
|
|
|
|
|
|
21,726 |
|
|
21,557 |
|
|
1.54 |
|
|
| Machinery |
|
|
|
|
|
|
|
|
|
|
|
|
|
|
|
|
|
|
|
|
|
| Answer Acquisition, LLC |
|
(5) (7) |
|
L + |
|
5.50% |
|
10.23% |
|
|
|
12/30/2026 |
|
10,719 |
|
|
10,541 |
|
|
10,265 |
|
|
0.73 |
|
|
| Answer Acquisition, LLC |
|
(5) (7) (13) |
|
L + |
|
5.50% |
|
10.23% |
|
|
|
12/30/2026 |
|
— |
|
|
(13) |
|
|
(35) |
|
|
— |
|
|
| Komline Sanderson Engineering Corp. |
|
(5) (6) (9) |
|
S + |
|
6.00% |
|
11.14% |
|
|
|
03/17/2026 |
|
4,080 |
|
|
4,045 |
|
|
3,837 |
|
|
0.27 |
|
|
| Komline Sanderson Engineering Corp. |
|
(5) (9) (13) |
|
S + |
|
6.00% |
|
11.14% |
|
|
|
03/17/2026 |
|
— |
|
|
(72) |
|
|
(507) |
|
|
(0.04) |
|
|
| Komline Sanderson Engineering Corp. |
|
(5) (6) (9) |
|
L + |
|
6.00% |
|
10.67% |
|
|
|
03/17/2026 |
|
16,629 |
|
|
16,507 |
|
|
15,640 |
|
|
1.12 |
|
|
| Komline Sanderson Engineering Corp. |
|
(5) (9) |
|
L + |
|
6.00% |
|
10.67% |
|
|
|
03/17/2026 |
|
19,118 |
|
|
18,984 |
|
|
17,981 |
|
|
1.29 |
|
|
| Komline Sanderson Engineering Corp. |
|
(5) (9) (13) |
|
L + |
|
6.00% |
|
10.67% |
|
|
|
03/17/2026 |
|
2,689 |
|
|
2,659 |
|
|
2,407 |
|
|
0.17 |
|
|
| MHE Intermediate Holdings, LLC |
|
(5) (6) (7) |
|
S + |
|
6.25% |
|
9.75% |
|
|
|
07/21/2027 |
|
121 |
|
|
117 |
|
|
117 |
|
|
0.01 |
|
|
| MHE Intermediate Holdings, LLC |
|
(5) (7) |
|
S + |
|
6.50% |
|
11.46% |
|
|
|
07/21/2027 |
|
4,419 |
|
|
4,332 |
|
|
4,332 |
|
|
0.31 |
|
|
| MHE Intermediate Holdings, LLC |
|
(5) (6) (7) |
|
S + |
|
6.25% |
|
9.50% |
|
|
|
07/21/2027 |
|
28,391 |
|
|
27,937 |
|
|
27,550 |
|
|
1.97 |
|
|
| MHE Intermediate Holdings, LLC |
|
(5) (7) |
|
S + |
|
6.25% |
|
9.50% |
|
|
|
07/21/2027 |
|
3,711 |
|
|
3,650 |
|
|
3,601 |
|
|
0.26 |
|
|
| MHE Intermediate Holdings, LLC |
|
(5) (7) (13) |
|
S + |
|
6.00% |
|
10.94% |
|
|
|
07/21/2027 |
|
350 |
|
|
312 |
|
|
276 |
|
|
0.02 |
|
|
|
|
|
|
|
|
|
|
|
|
|
|
|
|
|
|
88,999 |
|
|
85,464 |
|
|
6.12 |
|
|
| Multi-Utilities |
|
|
|
|
|
|
|
|
|
|
|
|
|
|
|
|
|
|
|
|
|
| AWP Group Holdings, Inc. |
|
(5) (6) (7) |
|
L + |
|
4.75% |
|
9.38% |
|
|
|
12/22/2027 |
|
1,021 |
|
|
1,010 |
|
|
991 |
|
|
0.07 |
|
|
| AWP Group Holdings, Inc. |
|
(5) (7) |
|
L + |
|
4.75% |
|
9.41% |
|
|
|
12/22/2027 |
|
131 |
|
|
130 |
|
|
127 |
|
|
0.01 |
|
|
| AWP Group Holdings, Inc. |
|
(5) (7) (13) |
|
L + |
|
4.75% |
|
9.41% |
|
|
|
12/22/2026 |
|
54 |
|
|
52 |
|
|
49 |
|
|
— |
|
|
| Ground Penetrating Radar Systems, LLC |
|
(5) (6) (7) |
|
S + |
|
4.75% |
|
9.39% |
|
|
|
06/26/2026 |
|
10,306 |
|
|
10,166 |
|
|
10,045 |
|
|
0.72 |
|
|
| Ground Penetrating Radar Systems, LLC |
|
(5) (7) (13) |
|
S + |
|
4.75% |
|
9.39% |
|
|
|
06/26/2025 |
|
459 |
|
|
440 |
|
|
418 |
|
|
0.03 |
|
|
| Vessco Midco Holdings, LLC |
|
(5) (6) (7) |
|
L + |
|
4.50% |
|
8.88% |
|
|
|
11/02/2026 |
|
2,715 |
|
|
2,696 |
|
|
2,679 |
|
|
0.19 |
|
|
| Vessco Midco Holdings, LLC |
|
(5) (7) |
|
L + |
|
4.50% |
|
8.88% |
|
|
|
11/02/2026 |
|
1,769 |
|
|
1,757 |
|
|
1,746 |
|
|
0.12 |
|
|
| Vessco Midco Holdings, LLC |
|
(5) (7) (13) |
|
P + |
|
3.50% |
|
11.00% |
|
|
|
10/18/2026 |
|
179 |
|
|
176 |
|
|
173 |
|
|
0.01 |
|
|
|
|
|
|
|
|
|
|
|
|
|
|
|
|
|
|
16,427 |
|
|
16,228 |
|
|
1.16 |
|
|
| Oil, Gas & Consumable Fuels |
|
|
|
|
|
|
|
|
|
|
|
|
|
|
|
|
|
|
|
|
|
| Energy Labs Holdings Corp. |
|
(5) (7) |
|
S + |
|
5.25% |
|
9.57% |
|
|
|
04/07/2028 |
|
388 |
|
|
382 |
|
|
376 |
|
|
0.03 |
|
|
| Energy Labs Holdings Corp. |
|
(5) (7) (13) |
|
S + |
|
5.25% |
|
9.57% |
|
|
|
04/07/2028 |
|
— |
|
|
— |
|
|
(2) |
|
|
— |
|
|
| Energy Labs Holdings Corp. |
|
(5) (7) (13) |
|
S + |
|
5.25% |
|
9.57% |
|
|
|
04/07/2028 |
|
18 |
|
|
17 |
|
|
16 |
|
|
— |
|
|
|
|
|
|
|
|
|
|
|
|
|
|
|
|
|
|
399 |
|
|
390 |
|
|
0.03 |
|
|
| Pharmaceuticals |
|
|
|
|
|
|
|
|
|
|
|
|
|
|
|
|
|
|
|
|
|
| Caerus US 1, Inc. |
|
(5) (8) (10) |
|
S + |
|
5.75% |
|
9.83% |
|
|
|
05/25/2029 |
|
11,121 |
|
|
10,903 |
|
|
10,903 |
|
|
0.78 |
|
|
| Caerus US 1, Inc. |
|
(5) (8) (10) (13) |
|
S + |
|
5.75% |
|
9.83% |
|
|
|
05/25/2029 |
|
— |
|
|
(16) |
|
|
(16) |
|
|
— |
|
|
| Caerus US 1, Inc. |
|
(5) (8) (10) (13) |
|
S + |
|
5.75% |
|
9.83% |
|
|
|
05/25/2029 |
|
293 |
|
|
270 |
|
|
270 |
|
|
0.02 |
|
|
|
|
|
|
|
|
|
|
|
|
|
|
|
|
|
|
11,157 |
|
|
11,157 |
|
|
0.80 |
|
|
|
|
|
|
|
|
|
|
|
|
|
|
|
|
|
|
|
|
|
|
|
|
Morgan Stanley Direct Lending Fund
Consolidated Schedule of Investments (continued)
December 31, 2022
(In thousands)
|
|
|
|
|
|
|
|
|
|
|
|
|
|
|
|
|
|
|
|
|
|
|
|
|
|
|
|
|
|
|
|
|
|
|
|
|
|
|
|
|
|
|
|
|
|
|
|
|
|
|
|
|
|
|
|
|
|
|
|
|
|
Investments-non-controlled/non-affiliated(1)(2) |
|
Footnotes |
|
Reference Rate and Spread |
|
Interest Rate(3) |
|
|
|
Maturity Date |
|
Par Amount/ Shares |
|
Cost(4) |
|
Fair Value |
|
Percentage of Net Assets |
|
| Professional Services |
|
|
|
|
|
|
|
|
|
|
|
|
|
|
|
|
|
|
|
|
|
| Abacus Data Holdings, Inc. (AbacusNext) |
|
(5) (6) (7) |
|
L + |
|
6.25% |
|
9.99% |
|
|
|
03/10/2027 |
|
18,617 |
|
|
$ |
18,303 |
|
|
$ |
18,479 |
|
|
1.32 |
|
% |
| Abacus Data Holdings, Inc. (AbacusNext) |
|
(5) (7) |
|
L + |
|
6.25% |
|
9.99% |
|
|
|
03/10/2027 |
|
1,950 |
|
|
1,935 |
|
|
1,936 |
|
|
0.14 |
|
|
| Abacus Data Holdings, Inc. (AbacusNext) |
|
(5) (7) (13) |
|
L + |
|
6.25% |
|
9.99% |
|
|
|
03/10/2027 |
|
700 |
|
|
677 |
|
|
690 |
|
|
0.05 |
|
|
| Bridgepointe Technologies, LLC |
|
(5) (7) |
|
S + |
|
6.50% |
|
11.23% |
|
|
|
12/31/2027 |
|
15,174 |
|
|
14,570 |
|
|
14,570 |
|
|
1.04 |
|
|
| Bridgepointe Technologies, LLC |
|
(5) (7) (13) |
|
S + |
|
6.50% |
|
11.23% |
|
|
|
12/31/2027 |
|
— |
|
|
(403) |
|
|
(403) |
|
|
(0.03) |
|
|
| Bullhorn, Inc. |
|
(5) (6) (7) |
|
L + |
|
5.75% |
|
10.48% |
|
|
|
09/30/2026 |
|
12,948 |
|
|
12,847 |
|
|
12,571 |
|
|
0.90 |
|
|
| Bullhorn, Inc. |
|
(5) (7) |
|
L + |
|
5.75% |
|
10.48% |
|
|
|
09/30/2026 |
|
2,723 |
|
|
2,712 |
|
|
2,643 |
|
|
0.19 |
|
|
| Bullhorn, Inc. |
|
(5) (7) (13) |
|
L + |
|
5.75% |
|
10.48% |
|
|
|
09/30/2026 |
|
273 |
|
|
267 |
|
|
256 |
|
|
0.02 |
|
|
| Citrin Cooperman Advisors, LLC |
|
(5) (8) |
|
L + |
|
5.00% |
|
9.21% |
|
|
|
10/01/2027 |
|
20,025 |
|
|
19,695 |
|
|
19,428 |
|
|
1.39 |
|
|
| Citrin Cooperman Advisors, LLC |
|
(5) (8) |
|
L + |
|
5.00% |
|
9.21% |
|
|
|
10/01/2027 |
|
8,582 |
|
|
8,437 |
|
|
8,326 |
|
|
0.60 |
|
|
| KWOR Acquisition, Inc. |
|
(5) (8) |
|
L + |
|
5.25% |
|
9.63% |
|
|
|
12/22/2028 |
|
5,376 |
|
|
5,280 |
|
|
5,096 |
|
|
0.36 |
|
|
| KWOR Acquisition, Inc. |
|
(5) (8) (13) |
|
L + |
|
5.25% |
|
9.63% |
|
|
|
12/22/2028 |
|
— |
|
|
(44) |
|
|
(248) |
|
|
(0.02) |
|
|
| KWOR Acquisition, Inc. |
|
(5) (8) (13) |
|
P + |
|
4.25% |
|
11.75% |
|
|
|
12/22/2027 |
|
— |
|
|
(1) |
|
|
(6) |
|
|
— |
|
|
| Project Boost Purchaser, LLC |
|
(5) (8) |
|
S + |
|
5.25% |
|
9.65% |
|
|
|
05/02/2029 |
|
5,414 |
|
|
5,364 |
|
|
5,362 |
|
|
0.38 |
|
|
| Project Boost Purchaser, LLC |
|
(5) (8) (13) |
|
S + |
|
5.25% |
|
9.65% |
|
|
|
05/02/2029 |
|
85 |
|
|
79 |
|
|
74 |
|
|
0.01 |
|
|
| Project Boost Purchaser, LLC |
|
(5) (8) (13) |
|
S + |
|
5.25% |
|
9.65% |
|
|
|
05/02/2028 |
|
— |
|
|
(4) |
|
|
(4) |
|
|
— |
|
|
|
|
|
|
|
|
|
|
|
|
|
|
|
|
|
|
89,714 |
|
|
88,770 |
|
|
6.35 |
|
|
| Real Estate Management & Development |
|
|
|
|
|
|
|
|
|
|
|
|
|
|
|
|
|
|
|
|
|
| Associations, Inc. |
|
(5) (6) (7) |
|
S + |
|
6.50% (incl. 2.50% PIK) |
|
10.36% |
|
|
|
07/02/2027 |
|
30,525 |
|
|
30,293 |
|
|
29,139 |
|
|
2.09 |
|
|
| Associations, Inc. |
|
(5) (7) (13) |
|
S + |
|
6.50% (incl. 2.50% PIK) |
|
10.36% |
|
|
|
07/02/2027 |
|
546 |
|
|
481 |
|
|
218 |
|
|
0.02 |
|
|
| Associations, Inc. |
|
(5) (7) (13) |
|
S + |
|
6.50% (incl. 2.50% PIK) |
|
10.36% |
|
|
|
07/02/2027 |
|
— |
|
|
(14) |
|
|
(84) |
|
|
(0.01) |
|
|
| MRI Software, LLC |
|
(5) (6) (7) |
|
L + |
|
5.50% |
|
10.23% |
|
|
|
02/10/2026 |
|
59,485 |
|
|
59,075 |
|
|
58,278 |
|
|
4.17 |
|
|
| MRI Software, LLC |
|
(5) (7) (13) |
|
L + |
|
5.50% |
|
10.23% |
|
|
|
02/10/2026 |
|
— |
|
|
(12) |
|
|
(45) |
|
|
— |
|
|
| Pritchard Industries, LLC |
|
(5) (8) |
|
L + |
|
5.50% |
|
10.54% |
|
|
|
10/13/2027 |
|
25,532 |
|
|
25,108 |
|
|
24,112 |
|
|
1.73 |
|
|
| Pritchard Industries, LLC |
|
(5) (8) (13) |
|
L + |
|
5.50% |
|
10.54% |
|
|
|
10/13/2027 |
|
5,413 |
|
|
5,315 |
|
|
5,074 |
|
|
0.36 |
|
|
| Zarya Intermediate, LLC |
|
(5) (7) (10) |
|
S + |
|
6.50% |
|
10.90% |
|
|
|
07/01/2027 |
|
35,408 |
|
|
35,408 |
|
|
35,344 |
|
|
2.53 |
|
|
| Zarya Intermediate, LLC |
|
(5) (7) (10) (13) |
|
S + |
|
6.50% |
|
10.90% |
|
|
|
07/01/2027 |
|
— |
|
|
— |
|
|
(7) |
|
|
— |
|
|
|
|
|
|
|
|
|
|
|
|
|
|
|
|
|
|
155,654 |
|
|
152,029 |
|
|
10.88 |
|
|
| Software |
|
|
|
|
|
|
|
|
|
|
|
|
|
|
|
|
|
|
|
|
|
| Alert Media, Inc. |
|
(5) (6) (7) |
|
S + |
|
5.00% |
|
9.26% |
|
|
|
04/12/2027 |
|
14,000 |
|
|
13,842 |
|
|
13,534 |
|
|
0.97 |
|
|
| Alert Media, Inc. |
|
(5) (7) (13) |
|
S + |
|
5.00% |
|
9.26% |
|
|
|
04/10/2026 |
|
— |
|
|
(17) |
|
|
(58) |
|
|
— |
|
|
| Anaplan, Inc. |
|
(5) (8) |
|
S + |
|
6.50% |
|
10.82% |
|
|
|
06/21/2029 |
|
24,000 |
|
|
23,546 |
|
|
23,578 |
|
|
1.69 |
|
|
| Appfire Technologies, LLC |
|
(5) (7) |
|
S + |
|
5.50% |
|
9.92% |
|
|
|
03/09/2027 |
|
14,617 |
|
|
14,549 |
|
|
14,063 |
|
|
1.01 |
|
|
| Appfire Technologies, LLC |
|
(5) (7) (13) |
|
S + |
|
5.50% |
|
9.92% |
|
|
|
03/09/2027 |
|
3,696 |
|
|
3,653 |
|
|
3,491 |
|
|
0.25 |
|
|
Morgan Stanley Direct Lending Fund
Consolidated Schedule of Investments (continued)
December 31, 2022
(In thousands)
|
|
|
|
|
|
|
|
|
|
|
|
|
|
|
|
|
|
|
|
|
|
|
|
|
|
|
|
|
|
|
|
|
|
|
|
|
|
|
|
|
|
|
|
|
|
|
|
|
|
|
|
|
|
|
|
|
|
|
|
|
|
Investments-non-controlled/non-affiliated(1)(2) |
|
Footnotes |
|
Reference Rate and Spread |
|
Interest Rate(3) |
|
|
|
Maturity Date |
|
Par Amount/ Shares |
|
Cost(4) |
|
Fair Value |
|
Percentage of Net Assets |
|
| Appfire Technologies, LLC |
|
(5) (7) (13) |
|
S + |
|
5.50% |
|
9.92% |
|
|
|
03/09/2027 |
|
10 |
|
|
$ |
7 |
|
|
$ |
3 |
|
|
— |
|
% |
| Bottomline Technologies, Inc. |
|
(5) (8) |
|
S + |
|
5.50% |
|
9.83% |
|
|
|
05/14/2029 |
|
3,192 |
|
|
3,133 |
|
|
3,070 |
|
|
0.22 |
|
|
| Bottomline Technologies, Inc. |
|
(5) (8) (13) |
|
S + |
|
5.50% |
|
9.83% |
|
|
|
05/15/2028 |
|
— |
|
|
(5) |
|
|
(10) |
|
|
— |
|
|
| CLEO Communications Holding, LLC |
|
(5) (6) (7) |
|
L + |
|
6.50% |
|
10.74% |
|
|
|
06/09/2027 |
|
39,998 |
|
|
39,685 |
|
|
38,574 |
|
|
2.76 |
|
|
| CLEO Communications Holding, LLC |
|
(5) (7) (13) |
|
L + |
|
6.50% |
|
10.74% |
|
|
|
06/09/2027 |
|
— |
|
|
(92) |
|
|
(445) |
|
|
(0.03) |
|
|
| Diligent Corporation |
|
(5) (6) (7) |
|
L + |
|
5.75% |
|
10.13% |
|
|
|
08/04/2025 |
|
27,510 |
|
|
27,337 |
|
|
26,905 |
|
|
1.93 |
|
|
| Diligent Corporation |
|
(5) (6) (7) |
|
L + |
|
5.75% |
|
10.13% |
|
|
|
08/04/2025 |
|
2,201 |
|
|
2,187 |
|
|
2,152 |
|
|
0.15 |
|
|
| Diligent Corporation |
|
(5) (7) (13) |
|
L + |
|
6.25% |
|
10.63% |
|
|
|
08/04/2025 |
|
1,350 |
|
|
1,323 |
|
|
1,251 |
|
|
0.09 |
|
|
| GS AcquisitionCo, Inc. |
|
(5) (6) (7) |
|
L + |
|
5.75% |
|
9.91% |
|
|
|
05/22/2026 |
|
75,927 |
|
|
75,432 |
|
|
74,120 |
|
|
5.30 |
|
|
| GS AcquisitionCo, Inc. |
|
(5) (7) |
|
L + |
|
5.75% |
|
9.91% |
|
|
|
05/22/2026 |
|
— |
|
|
— |
|
|
— |
|
|
— |
|
|
| GS AcquisitionCo, Inc. |
|
(5) (7) (13) |
|
L + |
|
5.75% |
|
9.91% |
|
|
|
05/22/2026 |
|
— |
|
|
(19) |
|
|
(58) |
|
|
— |
|
|
| Gurobi Optimization, LLC |
|
(5) (6) (7) |
|
L + |
|
5.00% |
|
9.38% |
|
|
|
12/19/2023 |
|
13,091 |
|
|
13,048 |
|
|
13,091 |
|
|
0.94 |
|
|
| Gurobi Optimization, LLC |
|
(5) (7) (13) |
|
L + |
|
5.00% |
|
9.38% |
|
|
|
12/19/2023 |
|
— |
|
|
(5) |
|
|
— |
|
|
— |
|
|
| Kaseya, Inc. |
|
(5) (8) |
|
S + |
|
5.75% |
|
10.33% |
|
|
|
06/25/2029 |
|
14,099 |
|
|
13,899 |
|
|
13,484 |
|
|
0.97 |
|
|
| Kaseya, Inc. |
|
(5) (8) (13) |
|
S + |
|
5.75% |
|
10.33% |
|
|
|
06/25/2029 |
|
— |
|
|
(6) |
|
|
(37) |
|
|
— |
|
|
| Kaseya, Inc. |
|
(5) (8) (13) |
|
S + |
|
5.75% |
|
10.33% |
|
|
|
06/25/2029 |
|
— |
|
|
(12) |
|
|
(37) |
|
|
— |
|
|
| LegitScript |
|
(5) (8) |
|
S + |
|
5.25% |
|
8.23% |
|
|
|
06/24/2029 |
|
28,108 |
|
|
27,580 |
|
|
27,580 |
|
|
1.97 |
|
|
| LegitScript |
|
(5) (8) (13) |
|
S + |
|
5.25% |
|
9.57% |
|
|
|
06/24/2029 |
|
— |
|
|
(68) |
|
|
(68) |
|
|
— |
|
|
| LegitScript |
|
(5) (8) (13) |
|
S + |
|
5.25% |
|
9.57% |
|
|
|
06/24/2028 |
|
250 |
|
|
174 |
|
|
174 |
|
|
0.01 |
|
|
| Montana Buyer, Inc. |
|
(5) (8) |
|
S + |
|
5.75% |
|
8.70% |
|
|
|
07/22/2029 |
|
4,131 |
|
|
4,051 |
|
|
3,991 |
|
|
0.29 |
|
|
| Montana Buyer, Inc. |
|
(5) (8) (13) |
|
S + |
|
5.75% |
|
8.70% |
|
|
|
07/22/2028 |
|
— |
|
|
(9) |
|
|
(16) |
|
|
— |
|
|
| Netwrix Corporation And Concept Searching, Inc. |
|
(5) (8) |
|
S + |
|
5.00% |
|
9.70% |
|
|
|
06/11/2029 |
|
4,605 |
|
|
4,562 |
|
|
4,358 |
|
|
0.31 |
|
|
| Netwrix Corporation And Concept Searching, Inc. |
|
(5) (8) (13) |
|
S + |
|
5.00% |
|
9.70% |
|
|
|
06/11/2029 |
|
812 |
|
|
798 |
|
|
680 |
|
|
0.05 |
|
|
| Netwrix Corporation And Concept Searching, Inc. |
|
(5) (8) (13) |
|
S + |
|
5.00% |
|
9.70% |
|
|
|
06/11/2029 |
|
— |
|
|
(4) |
|
|
(23) |
|
|
— |
|
|
| Oak Purchaser, Inc. |
|
(5) (8) |
|
S + |
|
5.50% |
|
9.48% |
|
|
|
04/28/2028 |
|
2,792 |
|
|
2,766 |
|
|
2,752 |
|
|
0.20 |
|
|
| Oak Purchaser, Inc. |
|
(5) (8) (13) |
|
S + |
|
5.50% |
|
9.48% |
|
|
|
04/28/2028 |
|
625 |
|
|
609 |
|
|
599 |
|
|
0.04 |
|
|
| Oak Purchaser, Inc. |
|
(5) (8) (13) |
|
S + |
|
5.50% |
|
9.48% |
|
|
|
04/28/2028 |
|
— |
|
|
(3) |
|
|
(5) |
|
|
— |
|
|
| Pound Bidco, Inc. |
|
(5) (6) (7) (10) |
|
L + |
|
6.50% |
|
10.67% |
|
|
|
01/30/2026 |
|
9,012 |
|
|
8,888 |
|
|
8,970 |
|
|
0.64 |
|
|
| Pound Bidco, Inc. |
|
(5) (6) (7) (10) (13) |
|
L + |
|
6.50% |
|
10.67% |
|
|
|
01/30/2026 |
|
— |
|
|
(14) |
|
|
(5) |
|
|
— |
|
|
| Project Leopard Holdings, Inc. |
|
(9) (10) |
|
S + |
|
5.25% |
|
9.80% |
|
|
|
07/20/2029 |
|
6,280 |
|
|
5,862 |
|
|
5,696 |
|
|
0.41 |
|
|
| Revalize, Inc. |
|
(5) (7) |
|
S + |
|
5.75% |
|
10.48% |
|
|
|
04/15/2027 |
|
19,652 |
|
|
19,543 |
|
|
18,737 |
|
|
1.34 |
|
|
| Revalize, Inc. |
|
(5) (7) (13) |
|
S + |
|
5.75% |
|
10.48% |
|
|
|
04/15/2027 |
|
— |
|
|
(1) |
|
|
(3) |
|
|
— |
|
|
| Riskonnect Parent, LLC |
|
(5) (8) |
|
S + |
|
5.50% |
|
10.08% |
|
|
|
12/07/2028 |
|
444 |
|
|
436 |
|
|
427 |
|
|
0.03 |
|
|
| Riskonnect Parent, LLC |
|
(5) (8) (13) |
|
S + |
|
5.50% |
|
10.08% |
|
|
|
12/07/2028 |
|
80 |
|
|
73 |
|
|
55 |
|
|
— |
|
|
| Securonix, Inc. |
|
(5) (8) |
|
S + |
|
6.50% |
|
10.10% |
|
|
|
04/05/2028 |
|
21,010 |
|
|
20,678 |
|
|
20,249 |
|
|
1.45 |
|
|
| Securonix, Inc. |
|
(5) (8) (13) |
|
S + |
|
6.50% |
|
10.10% |
|
|
|
04/05/2028 |
|
— |
|
|
(58) |
|
|
(137) |
|
|
(0.01) |
|
|
Morgan Stanley Direct Lending Fund
Consolidated Schedule of Investments (continued)
December 31, 2022
(In thousands)
|
|
|
|
|
|
|
|
|
|
|
|
|
|
|
|
|
|
|
|
|
|
|
|
|
|
|
|
|
|
|
|
|
|
|
|
|
|
|
|
|
|
|
|
|
|
|
|
|
|
|
|
|
|
|
|
|
|
|
|
|
|
Investments-non-controlled/non-affiliated(1)(2) |
|
Footnotes |
|
Reference Rate and Spread |
|
Interest Rate(3) |
|
|
|
Maturity Date |
|
Par Amount/ Shares |
|
Cost(4) |
|
Fair Value |
|
Percentage of Net Assets |
|
| Skykick, Inc. |
|
(5) (7) |
|
L + |
|
7.25% |
|
11.00% |
|
|
|
09/01/2027 |
|
6,300 |
|
|
$ |
6,171 |
|
|
$ |
6,142 |
|
|
0.44 |
|
% |
| Skykick, Inc. |
|
(5) (7) (13) |
|
L + |
|
7.25% |
|
11.00% |
|
|
|
09/01/2027 |
|
1,470 |
|
|
1,427 |
|
|
1,404 |
|
|
0.10 |
|
|
| Trunk Acquisition, Inc. |
|
(5) (7) |
|
L + |
|
5.50% |
|
10.23% |
|
|
|
02/19/2027 |
|
9,051 |
|
|
8,976 |
|
|
8,638 |
|
|
0.62 |
|
|
| Trunk Acquisition, Inc. |
|
(5) (7) (13) |
|
L + |
|
5.50% |
|
10.23% |
|
|
|
02/19/2026 |
|
— |
|
|
(6) |
|
|
(39) |
|
|
— |
|
|
| User Zoom Technologies, Inc. |
|
(5) (8) |
|
S + |
|
5.75% |
|
9.35% |
|
|
|
04/05/2029 |
|
38,689 |
|
|
37,967 |
|
|
37,965 |
|
|
2.72 |
|
|
|
|
|
|
|
|
|
|
|
|
|
|
|
|
|
|
381,883 |
|
|
374,792 |
|
|
26.82 |
|
|
| Total First Lien Debt |
|
|
|
|
|
|
|
|
|
|
|
|
|
|
|
$ |
2,753,620 |
|
|
$ |
2,694,111 |
|
|
192.81 |
|
% |
| Second Lien Debt |
|
|
|
|
|
|
|
|
|
|
|
|
|
|
|
|
|
|
|
|
|
| Air Freight & Logistics |
|
|
|
|
|
|
|
|
|
|
|
|
|
|
|
|
|
|
|
|
|
| Omni Intermediate Holdings, LLC |
|
(5) (7) |
|
S + |
|
9.00% |
|
13.69% |
|
|
|
12/30/2027 |
|
4,500 |
|
|
$ |
4,374 |
|
|
$ |
4,319 |
|
|
0.31 |
|
% |
| Automobile Components |
|
|
|
|
|
|
|
|
|
|
|
|
|
|
|
|
|
|
|
|
|
| PAI Holdco, Inc. |
|
(5) (7) |
|
L + |
|
7.50% (incl. 2.00% PIK) |
|
11.92% |
|
|
|
10/28/2028 |
|
26,033 |
|
|
25,444 |
|
|
23,787 |
|
|
1.70 |
|
|
| Electronic Equipment, Instruments & Components |
|
|
|
|
|
|
|
|
|
|
|
|
|
|
|
|
|
|
|
|
|
| Infinite Bidco, LLC |
|
(5) (9) |
|
L + |
|
7.00% |
|
11.73% |
|
|
|
03/02/2029 |
|
17,000 |
|
|
16,939 |
|
|
16,463 |
|
|
1.18 |
|
|
| Infinite Bidco, LLC |
|
(5) (9) (13) |
|
L + |
|
7.00% |
|
11.73% |
|
|
|
03/02/2029 |
|
— |
|
|
— |
|
|
(269) |
|
|
(0.02) |
|
|
|
|
|
|
|
|
|
|
|
|
|
|
|
|
|
|
16,939 |
|
|
16,194 |
|
|
1.16 |
|
|
| Energy Equipment & Services |
|
|
|
|
|
|
|
|
|
|
|
|
|
|
|
|
|
|
|
|
|
| QBS Parent, Inc. |
|
(5) |
|
L + |
|
8.50% |
|
12.88% |
|
|
|
09/21/2026 |
|
15,000 |
|
|
14,809 |
|
|
13,569 |
|
|
0.97 |
|
|
| Health Care Providers & Services |
|
|
|
|
|
|
|
|
|
|
|
|
|
|
|
|
|
|
|
|
|
| Heartland Veterinary Partners, LLC |
|
(5) (7) |
|
S + |
|
8.00% |
|
12.81% |
|
|
|
12/10/2027 |
|
3,960 |
|
|
3,892 |
|
|
3,624 |
|
|
0.26 |
|
|
| Heartland Veterinary Partners, LLC |
|
(5) (7) (13) |
|
S + |
|
8.00% |
|
12.81% |
|
|
|
12/10/2027 |
|
1,452 |
|
|
1,426 |
|
|
1,322 |
|
|
0.09 |
|
|
|
|
|
|
|
|
|
|
|
|
|
|
|
|
|
|
5,318 |
|
|
4,946 |
|
|
0.35 |
|
|
| Industrial Conglomerates |
|
|
|
|
|
|
|
|
|
|
|
|
|
|
|
|
|
|
|
|
|
| Aptean, Inc. |
|
(8) |
|
S + |
|
7.00% |
|
11.74% |
|
|
|
04/23/2027 |
|
5,950 |
|
|
5,950 |
|
|
5,459 |
|
|
0.39 |
|
|
| IT Services |
|
|
|
|
|
|
|
|
|
|
|
|
|
|
|
|
|
|
|
|
|
| Help/Systems Holdings, Inc. |
|
(5) (8) |
|
S + |
|
6.75% |
|
10.94% |
|
|
|
11/19/2027 |
|
17,500 |
|
|
17,500 |
|
|
16,189 |
|
|
1.16 |
|
|
| Idera, Inc. |
|
(5) (8) |
|
L + |
|
6.75% |
|
10.50% |
|
|
|
03/02/2029 |
|
3,887 |
|
|
3,863 |
|
|
3,642 |
|
|
0.26 |
|
|
| Red Dawn SEI Buyer, Inc. |
|
(5) (7) |
|
L + |
|
8.50% |
|
12.67% |
|
|
|
11/20/2026 |
|
19,000 |
|
|
18,653 |
|
|
17,904 |
|
|
1.28 |
|
|
|
|
|
|
|
|
|
|
|
|
|
|
|
|
|
|
40,016 |
|
|
37,735 |
|
|
2.70 |
|
|
| Software |
|
|
|
|
|
|
|
|
|
|
|
|
|
|
|
|
|
|
|
|
|
| Flexera Software, LLC |
|
(5) (7) |
|
L + |
|
7.00% |
|
11.39% |
|
|
|
03/03/2029 |
|
13,500 |
|
|
13,277 |
|
|
12,584 |
|
|
0.90 |
|
|
| Matrix Parent, Inc. |
|
(5) (8) |
|
S + |
|
8.00% |
|
12.55% |
|
|
|
03/01/2030 |
|
10,667 |
|
|
10,493 |
|
|
9,757 |
|
|
0.70 |
|
|
|
|
|
|
|
|
|
|
|
|
|
|
|
|
|
|
23,770 |
|
|
22,341 |
|
|
1.60 |
|
|
| Total Second Lien Debt |
|
|
|
|
|
|
|
|
|
|
|
|
|
|
|
$ |
136,620 |
|
|
$ |
128,350 |
|
|
9.19 |
|
% |
| Other Securities |
|
|
|
|
|
|
|
|
|
|
|
|
|
|
|
|
|
|
|
|
|
|
|
|
|
|
|
|
|
|
|
|
|
|
|
|
|
|
|
|
|
|
|
Morgan Stanley Direct Lending Fund
Consolidated Schedule of Investments (continued)
December 31, 2022
(In thousands)
|
|
|
|
|
|
|
|
|
|
|
|
|
|
|
|
|
|
|
|
|
|
|
|
|
|
|
|
|
|
|
|
|
|
|
|
|
|
|
|
|
|
|
|
|
|
|
|
|
|
|
|
|
|
|
|
|
|
|
|
|
|
Investments-non-controlled/non-affiliated(1)(2) |
|
Footnotes |
|
Reference Rate and Spread |
|
Interest Rate(3) |
|
|
|
Maturity Date |
|
Par Amount/ Shares |
|
Cost(4) |
|
Fair Value |
|
Percentage of Net Assets |
|
| Unsecured Debt |
|
|
|
|
|
|
|
|
|
|
|
|
|
|
|
|
|
|
|
|
|
| Familia Intermediate Holdings I Corp. (Teasdale Latin Foods) |
|
(5) (11) |
|
|
|
|
|
16.25% PIK |
|
|
|
06/18/2026 |
|
1,500 |
|
|
$ |
1,500 |
|
|
$ |
372 |
|
|
0.03 |
|
% |
| Fetch Insurance Services, LLC (Fetch) |
|
(5) |
|
|
|
|
|
12.75% (incl. 3.75% PIK) |
|
|
|
10/31/2027 |
|
1,881 |
|
|
1,826 |
|
|
1,826 |
|
|
0.13 |
|
|
| Total Unsecured Debt |
|
|
|
|
|
|
|
|
|
|
|
|
|
|
|
$ |
3,326 |
|
|
$ |
2,198 |
|
|
0.16 |
|
% |
|
|
|
|
|
|
|
|
|
|
|
|
|
|
|
|
|
|
|
|
|
|
|
|
|
|
|
|
|
|
|
|
|
|
|
|
|
|
|
|
|
|
|
|
|
|
Investments-non-controlled/non-affiliated(1)(2) |
|
Footnotes |
|
Reference Rate and Spread |
|
|
|
Acquisition Date |
|
|
|
Par Amount/ Shares |
|
Cost(4) |
|
Fair Value |
|
Percentage of Net Assets |
|
| Preferred Equity |
|
|
|
|
|
|
|
|
|
|
|
|
|
|
|
|
|
|
|
|
|
| Diligent Corporation |
|
(5) (12) |
|
|
|
10.50% |
|
|
|
04/05/2021 |
|
|
|
5,000 |
|
|
$ |
5,693 |
|
|
$ |
5,766 |
|
|
0.41 |
|
% |
| Fortis Solutions Group, LLC |
|
(5) (12) |
|
|
|
12.25% |
|
|
|
06/24/2022 |
|
|
|
1,000,000 |
|
|
1,041 |
|
|
1,024 |
|
|
0.07 |
|
|
| Integrity Marketing Acquisition, LLC |
|
(5) (12) |
|
|
|
10.50% |
|
|
|
12/21/2021 |
|
|
|
3,250,000 |
|
|
3,555 |
|
|
3,165 |
|
|
0.23 |
|
|
| Knockout Intermediate Holdings I, Inc. |
|
(5) (12) |
|
|
|
11.75% |
|
|
|
06/25/2022 |
|
|
|
2,790 |
|
|
2,895 |
|
|
2,787 |
|
|
0.20 |
|
|
| Revalize, Inc. |
|
(5) (7) (12) |
|
S + |
|
10.00% |
|
|
|
12/14/2021 |
|
|
|
2,255 |
|
|
2,391 |
|
|
2,281 |
|
|
0.16 |
|
|
| RSK Holdings, Inc. (Riskonnect) |
|
(5) (8) (12) |
|
S + |
|
10.50% |
|
|
|
07/07/2022 |
|
|
|
1,012,200 |
|
|
1,019 |
|
|
1,053 |
|
|
0.08 |
|
|
| Skykick, Inc. |
|
(5) (12) |
|
|
|
|
|
|
|
08/31/2021 |
|
|
|
134,101 |
|
|
1,275 |
|
|
963 |
|
|
0.07 |
|
|
| Total Preferred Equity |
|
|
|
|
|
|
|
|
|
|
|
|
|
|
|
17,869 |
|
|
17,039 |
|
|
1.22 |
|
|
| Common Equity |
|
|
|
|
|
|
|
|
|
|
|
|
|
|
|
|
|
|
|
|
|
| Abacus Data Holdings, Inc. (AbacusNext) |
|
(5) (12) |
|
|
|
|
|
|
|
03/09/2021 |
|
|
|
29,441 |
|
|
2,944 |
|
|
2,193 |
|
|
0.16 |
|
|
| Amerilife Holdings, LLC |
|
(5) (12) |
|
|
|
|
|
|
|
09/01/2022 |
|
|
|
873 |
|
|
24 |
|
|
24 |
|
|
0.00 |
|
|
| BP Purchaser, LLC |
|
(5) (12) |
|
|
|
|
|
|
|
12/10/2021 |
|
|
|
1,233,333 |
|
|
1,233 |
|
|
1,468 |
|
|
0.11 |
|
|
| CSC Thrive Holdings, LP (Thrive Networks) |
|
(5) (12) |
|
|
|
|
|
|
|
03/01/2021 |
|
|
|
160,016 |
|
|
411 |
|
|
640 |
|
|
0.05 |
|
|
| Encore Holdings, LLC |
|
(5) (12) |
|
|
|
|
|
|
|
11/23/2021 |
|
|
|
2,391 |
|
|
275 |
|
|
449 |
|
|
0.03 |
|
|
| Frisbee Holding, LP (Fetch) |
|
(5) (12) |
|
|
|
|
|
|
|
10/31/2022 |
|
|
|
21,744 |
|
|
277 |
|
|
277 |
|
|
0.02 |
|
|
| GSM Equity Investors, LP (GSM Outdoors) |
|
(5) (12) |
|
|
|
|
|
|
|
11/16/2020 |
|
|
|
4,500 |
|
|
450 |
|
|
916 |
|
|
0.07 |
|
|
| Help HP SCF Investor, LP (Help/Systems) |
|
(10) (12) |
|
|
|
|
|
|
|
05/12/2021 |
|
|
|
|
|
12,460 |
|
|
14,732 |
|
|
1.05 |
|
|
| LUV Car Wash Holdings, LLC |
|
(5) (12) |
|
|
|
|
|
|
|
04/06/2022 |
|
|
|
116 |
|
|
116 |
|
|
116 |
|
|
0.01 |
|
|
| mPulse Mobile, Inc. |
|
(5) (12) |
|
|
|
|
|
|
|
12/17/2021 |
|
|
|
165,761 |
|
|
1,220 |
|
|
1,281 |
|
|
0.09 |
|
|
| PCX Holding Corp. |
|
(5) (12) |
|
|
|
|
|
|
|
04/22/2021 |
|
|
|
6,538 |
|
|
654 |
|
|
747 |
|
|
0.05 |
|
|
| Pet Holdings, Inc. (Brightpet) |
|
(5) (12) |
|
|
|
|
|
|
|
10/06/2020 |
|
|
|
13,846 |
|
|
1,385 |
|
|
1,028 |
|
|
0.07 |
|
|
| Pritchard Industries, Inc. |
|
(5) (12) |
|
|
|
|
|
|
|
10/13/2021 |
|
|
|
1,700,000 |
|
|
1,700 |
|
|
2,210 |
|
|
0.16 |
|
|
| Procure Acquiom Financial, LLC (Procure Analytics) |
|
(5) (12) |
|
|
|
|
|
|
|
12/20/2021 |
|
|
|
1,000,000 |
|
|
1,000 |
|
|
1,380 |
|
|
0.10 |
|
|
| Recovery Point Systems, Inc. |
|
(5) (12) |
|
|
|
|
|
|
|
03/05/2021 |
|
|
|
1,000,000 |
|
|
1,000 |
|
|
760 |
|
|
0.05 |
|
|
| Shelby Co-invest, LP (Spectrum Automotive) |
|
(5) (12) |
|
|
|
|
|
|
|
06/29/2021 |
|
|
|
8,500 |
|
|
850 |
|
|
1,194 |
|
|
0.09 |
|
|
| Surewerx Topco, LP |
|
(5) (10) (12) |
|
|
|
|
|
|
|
12/28/2022 |
|
|
|
512 |
|
|
512 |
|
|
512 |
|
|
0.04 |
|
|
| Suveto Co-Invest, LP |
|
(5) (10) (12) |
|
|
|
|
|
|
|
11/19/2021 |
|
|
|
17,000 |
|
|
1,700 |
|
|
1,963 |
|
|
0.14 |
|
|
| Total Common Equity |
|
|
|
|
|
|
|
|
|
|
|
|
|
|
|
28,211 |
|
|
31,890 |
|
|
2.28 |
|
|
| Total Other Securities |
|
|
|
|
|
|
|
|
|
|
|
|
|
|
|
$ |
49,406 |
|
|
$ |
51,127 |
|
|
3.66 |
|
% |
| Total Portfolio Investments |
|
|
|
|
|
|
|
|
|
|
|
|
|
|
|
$ |
2,939,646 |
|
|
$ |
2,873,588 |
|
|
205.65 |
|
% |
Morgan Stanley Direct Lending Fund
Consolidated Schedule of Investments (continued)
December 31, 2022
(In thousands)
|
|
|
|
|
|
| (1) |
Unless otherwise indicated, issuers of debt and equity investments held by the Company are denominated in dollars. All debt investments are income producing unless otherwise indicated. All equity investments are non-income producing unless otherwise noted. Certain portfolio company investments are subject to contractual restrictions on sales. Under the 1940 Act, the Company would be deemed to “control” a portfolio company if the Company owned more than 25% of its outstanding voting securities and/or held the power to exercise control over the management or policies of the portfolio company. As of December 31, 2022 the Company does not “control” any of these portfolio companies. Under the 1940 Act, the Company would be deemed an “affiliated person” of a portfolio company if the Company owns 5% or more of the portfolio company’s outstanding voting securities. As of December 31, 2022, the Company is not an “affiliated person” of any of its portfolio companies. |
| (2) |
Unless otherwise indicated, the Company’s investments are pledged as collateral supporting the amounts outstanding under the Truist Credit Facility. See Note 6 “Debt”. |
| (3) |
Variable rate loans to the portfolio companies bear interest at a rate that is determined by reference to either E, L or S or an alternate base rate (commonly based on F or P), each of which generally resets periodically. For each loan, the Company has indicated the reference rate used and provided the spread and the interest rate in effect as of December 31, 2022. For investments with multiple reference rates or alternate base rates, the interest rate shown is the weighted average interest rate in effect at December 31, 2022. As of December 31, 2022, the reference rates for our LIBOR-based loans were the 3-month E at 2.13%, the 1-month L at 4.39%, the 3-month L at 4.77%, the 6-month L at 5.14%; the reference rates for our SOFR-based loans were the 1-month S at 4.36%, the 3-month S at 4.59%, the 6-month S at 4.78%; and the reference rate for our Prime rate-based loans were at 7.50%. |
| (4) |
The cost represents the original cost adjusted for the amortization of discounts and premiums, as applicable, on debt investments using the effective interest method. |
| (5) |
These investments were valued using unobservable inputs and are considered Level 3 investments. Fair value was determined in good faith by or under the direction of the Company’s Valuation Designee, under the supervision of the Board of Directors (see Note 2 and Note 5), pursuant to the Company’s valuation policy. |
| (6) |
Assets or a portion thereof are pledged as collateral for the BNP Funding Facility (as defined below). See Note 6 “Debt”. |
| (7) |
Loan includes interest rate floor of 1.00%. |
| (8) |
Loan includes interest rate floor of 0.75%. |
| (9) |
Loan includes interest rate floor of 0.50%. |
| (10) |
The investment is not a qualifying asset under Section 55(a) of the 1940 Act. The Company may not acquire any non-qualifying asset unless, at the time of acquisition, qualifying assets represent at least 70% of the Company’s total assets. As of December 31, 2022, non-qualifying assets represented 7.10% of total assets as calculated in accordance with regulatory requirements. |
| (11) |
Investment was on non-accrual status as of December 31, 2022. |
| (12) |
Securities exempt from registration under the Securities Act of 1933, and may be deemed to be “restricted securities”. As of December 31, 2022, the aggregate fair value of these securities is $48,929 or 3.50% of the Company’s net assets. The initial acquisition dates have been included for such securities. |
(13) Position or portion thereof is an unfunded loan commitment, and no interest is being earned on the unfunded portion, although the investment may earn unused commitment fees. Negative cost and fair value, if any, results from unamortized fees, which are capitalized to the cost of the investment. The unfunded loan commitment may be subject to a commitment termination date that may expire prior to the maturity date stated. See below for more information on the Company’s unfunded commitments as of December 31, 2022:
|
|
|
|
|
|
|
|
|
|
|
|
|
|
|
|
| Investments-non-controlled/non-affiliated |
|
Commitment Type |
Commitment Expiration Date |
Unfunded Commitment |
Fair Value |
| First Lien Debt |
|
|
|
|
|
| 365 Retail Markets, LLC |
|
Revolver |
12/23/2026 |
$ |
1,200 |
|
$ |
(27) |
|
| 48Forty Solutions LLC |
|
Revolver |
11/30/2026 |
2,715 |
|
(139) |
|
| ABB Concise Optical Group, LLC |
|
Revolver |
02/23/2028 |
94 |
|
(4) |
|
| ARI Network Services, Inc. |
|
Revolver |
02/28/2025 |
2,121 |
|
(60) |
|
| AWP Group Holdings, Inc. |
|
Revolver |
12/22/2026 |
104 |
|
(3) |
|
| Abacus Data Holdings, Inc. (AbacusNext) |
|
Revolver |
03/10/2027 |
700 |
|
(5) |
|
| Abracon Group Holdings, LLC |
|
Delayed Draw Term Loan |
07/06/2024 |
1,003 |
|
(52) |
|
| Abracon Group Holdings, LLC |
|
Revolver |
07/06/2028 |
401 |
|
(21) |
|
| Advarra Holdings, Inc. |
|
Delayed Draw Term Loan |
08/26/2024 |
41 |
|
(2) |
|
| Alert Media, Inc. |
|
Revolver |
04/10/2026 |
1,750 |
|
(58) |
|
| Amerilife Holdings, LLC |
|
Delayed Draw Term Loan |
08/31/2024 |
292 |
|
(5) |
|
| Amerilife Holdings, LLC |
|
Revolver |
08/31/2028 |
437 |
|
(8) |
|
| Answer Acquisition, LLC |
|
Revolver |
12/30/2026 |
833 |
|
(35) |
|
Morgan Stanley Direct Lending Fund
Consolidated Schedule of Investments (continued)
December 31, 2022
(In thousands)
|
|
|
|
|
|
|
|
|
|
|
|
|
|
|
|
| Investments-non-controlled/non-affiliated |
|
Commitment Type |
Commitment Expiration Date |
Unfunded Commitment |
Fair Value |
| Appfire Technologies, LLC |
|
Delayed Draw Term Loan |
06/13/2024 |
$ |
1,674 |
|
$ |
(63) |
|
| Appfire Technologies, LLC |
|
Revolver |
03/09/2027 |
157 |
|
(6) |
|
| Applitools, Inc. |
|
Revolver |
05/25/2028 |
433 |
|
(7) |
|
| Assembly Intermediate, LLC |
|
Delayed Draw Term Loan |
10/19/2023 |
2,281 |
|
(88) |
|
| Assembly Intermediate, LLC |
|
Revolver |
10/19/2027 |
1,244 |
|
(48) |
|
| Associations, Inc. |
|
Delayed Draw Term Loan |
06/10/2024 |
6,694 |
|
(304) |
|
| Associations, Inc. |
|
Revolver |
07/02/2027 |
1,860 |
|
(84) |
|
| Atlas Us Finco, Inc. |
|
Revolver |
12/09/2028 |
186 |
|
(6) |
|
| Avalara, Inc. |
|
Revolver |
10/19/2028 |
1,071 |
|
(26) |
|
| Bottomline Technologies, Inc. |
|
Revolver |
05/15/2028 |
267 |
|
(10) |
|
| Bridgepointe Technologies, LLC |
|
Delayed Draw Term Loan |
09/23/2024 |
10,116 |
|
(403) |
|
| Bullhorn, Inc. |
|
Revolver |
09/30/2026 |
320 |
|
(10) |
|
| CLEO Communications Holding, LLC |
|
Revolver |
06/09/2027 |
12,502 |
|
(445) |
|
| Caerus US 1, Inc. |
|
Delayed Draw Term Loan |
10/31/2024 |
1,608 |
|
(16) |
|
| Caerus US 1, Inc. |
|
Revolver |
05/25/2029 |
878 |
|
(17) |
|
| Cerity Partners, LLC |
|
Delayed Draw Term Loan |
12/30/2023 |
12,699 |
|
(381) |
|
| DCA Investment Holdings, LLC |
|
Delayed Draw Term Loan |
03/02/2023 |
1,026 |
|
(15) |
|
| Diligent Corporation |
|
Revolver |
08/04/2025 |
3,150 |
|
(69) |
|
| Donuts, Inc. |
|
Delayed Draw Term Loan |
08/14/2023 |
3,166 |
|
(80) |
|
| Dwyer Instruments, Inc. |
|
Delayed Draw Term Loan |
07/01/2024 |
2,028 |
|
(92) |
|
| Dwyer Instruments, Inc. |
|
Revolver |
07/21/2027 |
855 |
|
(39) |
|
| Encore Holdings, LLC |
|
Delayed Draw Term Loan |
11/23/2024 |
1,469 |
|
(35) |
|
| Encore Holdings, LLC |
|
Revolver |
11/23/2027 |
539 |
|
(13) |
|
| Energy Labs Holdings Corp. |
|
Delayed Draw Term Loan |
04/13/2023 |
47 |
|
(1) |
|
| Energy Labs Holdings Corp. |
|
Revolver |
04/07/2028 |
45 |
|
(1) |
|
| Excelitas Technologies Corp. |
|
Delayed Draw Term Loan |
08/11/2024 |
262 |
|
(13) |
|
| Excelitas Technologies Corp. |
|
Revolver |
08/14/2028 |
57 |
|
(3) |
|
| FLS Holding, Inc. |
|
Revolver |
12/17/2027 |
1,802 |
|
(29) |
|
| FMG Suite Holdings, LLC |
|
Revolver |
10/30/2026 |
2,074 |
|
(44) |
|
| Fortis Solutions Group, LLC |
|
Delayed Draw Term Loan |
10/15/2023 |
76 |
|
(2) |
|
| Fortis Solutions Group, LLC |
|
Delayed Draw Term Loan |
06/24/2024 |
1,000 |
|
(33) |
|
| Fortis Solutions Group, LLC |
|
Revolver |
10/15/2027 |
2,339 |
|
(76) |
|
| Foundation Risk Partners Corp. |
|
Revolver |
10/29/2027 |
2,689 |
|
(47) |
|
| GS AcquisitionCo, Inc. |
|
Revolver |
05/22/2026 |
2,420 |
|
(58) |
|
| GSM Acquisition Corp. |
|
Revolver |
11/16/2026 |
4,280 |
|
(62) |
|
| Galway Borrower, LLC |
|
Delayed Draw Term Loan |
09/30/2023 |
298 |
|
(12) |
|
| Galway Borrower, LLC |
|
Revolver |
09/30/2027 |
2,053 |
|
(88) |
|
| Gateway US Holdings, Inc. |
|
Delayed Draw Term Loan |
03/09/2024 |
6 |
|
— |
|
Morgan Stanley Direct Lending Fund
Consolidated Schedule of Investments (continued)
December 31, 2022
(In thousands)
|
|
|
|
|
|
|
|
|
|
|
|
|
|
|
|
| Investments-non-controlled/non-affiliated |
|
Commitment Type |
Commitment Expiration Date |
Unfunded Commitment |
Fair Value |
| Gateway US Holdings, Inc. |
|
Revolver |
09/22/2026 |
$ |
14 |
|
$ |
— |
|
| Govbrands Intermediate, Inc. |
|
Delayed Draw Term Loan |
08/04/2023 |
4,185 |
|
(191) |
|
| Govbrands Intermediate, Inc. |
|
Revolver |
08/04/2027 |
424 |
|
(19) |
|
| GraphPad Software, LLC |
|
Revolver |
04/27/2027 |
1,750 |
|
(58) |
|
| Ground Penetrating Radar Systems, LLC |
|
Revolver |
06/26/2025 |
1,181 |
|
(30) |
|
| Gurobi Optimization, LLC |
|
Revolver |
12/19/2023 |
1,607 |
|
— |
|
| Heartland Home Services, Inc. |
|
Delayed Draw Term Loan |
08/10/2023 |
612 |
|
(18) |
|
| Heartland Veterinary Partners, LLC |
|
Delayed Draw Term Loan |
11/17/2023 |
1,255 |
|
(36) |
|
| Heartland Veterinary Partners, LLC |
|
Revolver |
12/10/2026 |
375 |
|
(11) |
|
| High Street Buyer, Inc. |
|
Revolver |
04/16/2027 |
2,136 |
|
(62) |
|
| KPSKY Acquisition, Inc. |
|
Delayed Draw Term Loan |
06/17/2024 |
3,413 |
|
(154) |
|
| KWOR Acquisition, Inc. |
|
Delayed Draw Term Loan |
06/22/2024 |
4,777 |
|
(248) |
|
| KWOR Acquisition, Inc. |
|
Revolver |
12/22/2027 |
122 |
|
(6) |
|
| Kaseya, Inc. |
|
Delayed Draw Term Loan |
06/22/2024 |
856 |
|
(37) |
|
| Kaseya, Inc. |
|
Revolver |
06/25/2029 |
856 |
|
(37) |
|
| Komline Sanderson Engineering Corp. |
|
Delayed Draw Term Loan |
05/27/2024 |
8,529 |
|
(507) |
|
| Komline Sanderson Engineering Corp. |
|
Revolver |
03/17/2026 |
2,057 |
|
(122) |
|
| LUV Car Wash Group, LLC |
|
Delayed Draw Term Loan |
03/14/2024 |
257 |
|
(5) |
|
| LegitScript |
|
Delayed Draw Term Loan |
06/24/2024 |
7,654 |
|
(68) |
|
| LegitScript |
|
Revolver |
06/24/2028 |
3,917 |
|
(72) |
|
| Lightspeed Buyer, Inc. |
|
Delayed Draw Term Loan |
02/28/2023 |
4,050 |
|
(118) |
|
| Lightspeed Solution, LLC |
|
Delayed Draw Term Loan |
03/01/2024 |
2,439 |
|
(89) |
|
| MHE Intermediate Holdings, LLC |
|
Revolver |
07/21/2027 |
2,150 |
|
(64) |
|
| MRI Software, LLC |
|
Revolver |
02/10/2026 |
2,215 |
|
(45) |
|
| Magnolia Wash Holdings |
|
Revolver |
07/14/2028 |
71 |
|
(3) |
|
| Majesco |
|
Revolver |
09/21/2026 |
1,575 |
|
(66) |
|
| Mammoth Holdings, LLC |
|
Revolver |
10/16/2023 |
953 |
|
— |
|
| Mantech International CP |
|
Delayed Draw Term Loan |
09/14/2024 |
87 |
|
(2) |
|
| Mantech International CP |
|
Revolver |
09/14/2028 |
53 |
|
(1) |
|
| Montana Buyer, Inc. |
|
Revolver |
07/22/2028 |
466 |
|
(16) |
|
| Netwrix Corporation And Concept Searching, Inc. |
|
Delayed Draw Term Loan |
06/09/2024 |
1,652 |
|
(89) |
|
| Netwrix Corporation And Concept Searching, Inc. |
|
Revolver |
06/11/2029 |
431 |
|
(23) |
|
| Oak Purchaser, Inc. |
|
Delayed Draw Term Loan |
04/28/2024 |
1,236 |
|
(18) |
|
| Oak Purchaser, Inc. |
|
Revolver |
04/28/2028 |
372 |
|
(5) |
|
| Oakbridge Insurance Agency, LLC |
|
Delayed Draw Term Loan |
03/31/2024 |
399 |
|
(3) |
|
| Oakbridge Insurance Agency, LLC |
|
Revolver |
12/31/2026 |
36 |
|
— |
|
| Omni Intermediate Holdings, LLC |
|
Delayed Draw Term Loan |
06/24/2024 |
732 |
|
(31) |
|
| Omni Intermediate Holdings, LLC |
|
Delayed Draw Term Loan |
06/24/2024 |
173 |
|
(7) |
|
Morgan Stanley Direct Lending Fund
Consolidated Schedule of Investments (continued)
December 31, 2022
(In thousands)
|
|
|
|
|
|
|
|
|
|
|
|
|
|
|
|
| Investments-non-controlled/non-affiliated |
|
Commitment Type |
Commitment Expiration Date |
Unfunded Commitment |
Fair Value |
| Omni Intermediate Holdings, LLC |
|
Revolver |
12/30/2025 |
$ |
1,065 |
|
$ |
(45) |
|
| PCX Holding Corp. |
|
Revolver |
04/22/2027 |
1,296 |
|
(42) |
|
| PDFTron Systems, Inc. |
|
Revolver |
07/15/2026 |
3,850 |
|
(128) |
|
| Patriot Growth Insurance Services, LLC |
|
Revolver |
10/16/2028 |
4,485 |
|
(207) |
|
| Peter C. Foy & Associates Insurance Services, LLC |
|
Delayed Draw Term Loan |
12/14/2023 |
292 |
|
(14) |
|
| Peter C. Foy & Associates Insurance Services, LLC |
|
Revolver |
11/01/2027 |
832 |
|
(40) |
|
| Pound Bidco, Inc. |
|
Revolver |
01/30/2026 |
1,163 |
|
(5) |
|
| Pritchard Industries, LLC |
|
Delayed Draw Term Loan |
10/13/2023 |
691 |
|
(38) |
|
| Procure Acquireco, Inc. (Procure Analytics) |
|
Delayed Draw Term Loan |
12/20/2023 |
794 |
|
(35) |
|
| Procure Acquireco, Inc. (Procure Analytics) |
|
Revolver |
12/20/2028 |
238 |
|
(11) |
|
| Project Boost Purchaser, LLC |
|
Delayed Draw Term Loan |
05/02/2024 |
1,038 |
|
(10) |
|
| Project Boost Purchaser, LLC |
|
Revolver |
05/02/2028 |
449 |
|
(4) |
|
| Promptcare Infusion Buyer, Inc. |
|
Delayed Draw Term Loan |
09/01/2023 |
2,431 |
|
(85) |
|
| QW Holding Corporation |
|
Delayed Draw Term Loan |
05/02/2024 |
394 |
|
(15) |
|
| QW Holding Corporation |
|
Revolver |
08/31/2026 |
2,250 |
|
(84) |
|
| Randy's Holdings, Inc. |
|
Delayed Draw Term Loan |
11/01/2024 |
2,248 |
|
(31) |
|
| Randy's Holdings, Inc. |
|
Revolver |
10/31/2027 |
757 |
|
(22) |
|
| Radwell Parent, LLC |
|
Revolver |
04/01/2028 |
2,442 |
|
(71) |
|
| Recovery Point Systems, Inc. |
|
Revolver |
08/12/2026 |
4,000 |
|
(5) |
|
| Redwood Services Group, LLC |
|
Delayed Draw Term Loan |
12/22/2023 |
729 |
|
(32) |
|
| Revalize, Inc. |
|
Revolver |
04/15/2027 |
71 |
|
(3) |
|
| Riskonnect Parent, LLC |
|
Delayed Draw Term Loan |
07/07/2024 |
558 |
|
(21) |
|
| RoadOne IntermodaLogistics |
|
Delayed Draw Term Loan |
06/30/2024 |
426 |
|
(6) |
|
| RoadOne IntermodaLogistics |
|
Revolver |
12/30/2028 |
255 |
|
(8) |
|
| Securonix, Inc. |
|
Revolver |
04/05/2028 |
3,782 |
|
(137) |
|
| Sherlock Buyer Corp. |
|
Delayed Draw Term Loan |
02/08/2023 |
3,215 |
|
(71) |
|
| Sherlock Buyer Corp. |
|
Revolver |
12/08/2027 |
1,286 |
|
(28) |
|
| Skykick, Inc. |
|
Delayed Draw Term Loan |
03/01/2023 |
1,155 |
|
(29) |
|
| Smarsh, Inc. |
|
Delayed Draw Term Loan |
02/18/2024 |
536 |
|
(20) |
|
| Smarsh, Inc. |
|
Revolver |
02/16/2029 |
268 |
|
(10) |
|
| MSM Acquisitions, Inc. |
|
Delayed Draw Term Loan |
01/30/2023 |
23,439 |
|
(560) |
|
| MSM Acquisitions, Inc. |
|
Revolver |
12/09/2026 |
2,112 |
|
(51) |
|
| Spectrum Automotive Holdings Corp. |
|
Delayed Draw Term Loan |
06/29/2023 |
1,917 |
|
(112) |
|
| Spectrum Automotive Holdings Corp. |
|
Revolver |
06/29/2027 |
881 |
|
(51) |
|
| Spotless Brands, LLC |
|
Revolver |
07/25/2028 |
145 |
|
(6) |
|
| Stepping Stones Healthcare Services, LLC |
|
Delayed Draw Term Loan |
01/14/2024 |
737 |
|
(39) |
|
| Stepping Stones Healthcare Services, LLC |
|
Revolver |
12/30/2026 |
175 |
|
(9) |
|
| Summit Buyer, LLC |
|
Delayed Draw Term Loan |
06/23/2023 |
3,304 |
|
(146) |
|
Morgan Stanley Direct Lending Fund
Consolidated Schedule of Investments (continued)
December 31, 2022
(In thousands)
|
|
|
|
|
|
|
|
|
|
|
|
|
|
|
|
| Investments-non-controlled/non-affiliated |
|
Commitment Type |
Commitment Expiration Date |
Unfunded Commitment |
Fair Value |
| Summit Buyer, LLC |
|
Revolver |
01/14/2026 |
$ |
2,420 |
|
$ |
(107) |
|
| Surewerx Purchaser III, Inc. |
|
Revolver |
12/28/2028 |
1,681 |
|
(50) |
|
| Surewerx Purchaser III, Inc. |
|
Delayed Draw Term Loan |
06/27/2024 |
3,601 |
|
(72) |
|
| Suveto |
|
Delayed Draw Term Loan |
09/09/2023 |
5,081 |
|
(182) |
|
| Suveto |
|
Revolver |
09/09/2027 |
486 |
|
(18) |
|
| Sweep Purchaser, LLC |
|
Delayed Draw Term Loan |
05/05/2024 |
273 |
|
(15) |
|
| Sweep Purchaser, LLC |
|
Revolver |
11/30/2026 |
1,153 |
|
(62) |
|
| Syntax Systems Ltd |
|
Delayed Draw Term Loan |
10/29/2023 |
9,356 |
|
(510) |
|
| Syntax Systems Ltd |
|
Revolver |
10/29/2026 |
1,247 |
|
(68) |
|
| Tamarack Intermediate, LLC |
|
Revolver |
03/13/2028 |
808 |
|
(36) |
|
| Tank Holding Corp. |
|
Revolver |
03/31/2028 |
667 |
|
(37) |
|
| Thrive Buyer, Inc. (Thrive Networks) |
|
Revolver |
01/22/2027 |
1,717 |
|
(42) |
|
| Triple Lift, Inc. |
|
Revolver |
05/08/2028 |
2,467 |
|
(127) |
|
| Trunk Acquisition, Inc. |
|
Revolver |
02/19/2026 |
857 |
|
(39) |
|
| Two Six Labs, LLC |
|
Delayed Draw Term Loan |
08/20/2023 |
2,134 |
|
(52) |
|
| Two Six Labs, LLC |
|
Revolver |
08/20/2027 |
2,134 |
|
(52) |
|
| United Flow Technologies Intermediate Holdco II, LLC |
|
Delayed Draw Term Loan |
10/29/2023 |
164 |
|
(5) |
|
| United Flow Technologies Intermediate Holdco II, LLC |
|
Delayed Draw Term Loan |
10/29/2023 |
10,000 |
|
(303) |
|
| United Flow Technologies Intermediate Holdco II, LLC |
|
Revolver |
10/29/2026 |
3,000 |
|
(91) |
|
| UpStack, Inc. |
|
Delayed Draw Term Loan |
08/26/2023 |
1,050 |
|
(32) |
|
| UpStack, Inc. |
|
Revolver |
08/20/2027 |
875 |
|
(26) |
|
| V Global Holdings, LLC |
|
Revolver |
12/22/2025 |
672 |
|
(34) |
|
| VRC Companies, LLC |
|
Delayed Draw Term Loan |
01/06/2024 |
6,059 |
|
(212) |
|
| VRC Companies, LLC |
|
Revolver |
06/29/2027 |
1,653 |
|
(58) |
|
| Valcourt Holdings II, LLC |
|
Delayed Draw Term Loan |
01/07/2023 |
1,121 |
|
(13) |
|
| Vardiman Black Holdings, LLC |
|
Delayed Draw Term Loan |
03/18/2024 |
142 |
|
(8) |
|
| Vessco Midco Holdings, LLC |
|
Revolver |
10/18/2026 |
268 |
|
(4) |
|
| World Insurance Associates, LLC |
|
Revolver |
04/01/2026 |
444 |
|
(14) |
|
| Zarya Intermediate, LLC |
|
Revolver |
07/01/2027 |
3,649 |
|
(7) |
|
| mPulse Mobile, Inc. |
|
Delayed Draw Term Loan |
02/17/2023 |
1,996 |
|
(60) |
|
| mPulse Mobile, Inc. |
|
Revolver |
12/17/2027 |
353 |
|
(11) |
|
| Total First Lien Debt Unfunded Commitments |
|
|
|
$ |
305,663 |
|
$ |
(9,984) |
|
| Second Lien Debt |
|
|
|
|
|
| Heartland Veterinary Partners, LLC |
|
Delayed Draw Term Loan |
11/17/2023 |
$ |
88 |
|
$ |
(7) |
|
| Infinite Bidco, LLC |
|
Delayed Draw Term Loan |
03/14/2023 |
8,500 |
|
(269) |
|
| Total Second Lien Debt Unfunded Commitments |
|
|
|
$ |
8,588 |
|
$ |
(276) |
|
| Total Unfunded Commitments |
|
|
|
$ |
314,251 |
|
$ |
(10,260) |
|
Morgan Stanley Direct Lending Fund
Consolidated Schedule of Investments (continued)
December 31, 2022
(In thousands)
(1) ORGANIZATION
Morgan Stanley Direct Lending Fund (the “Company”) is a non-diversified, externally managed specialty finance company focused on lending to middle-market companies. The Company has elected to be regulated as a business development company (“BDC”) under the Investment Company Act of 1940, as amended (the “1940 Act”). In addition, for U.S. federal income tax purposes, the Company has elected to be treated, and intends to comply with the requirements to qualify annually, as a regulated investment company (“RIC”) under Subchapter M of the Internal Revenue Code of 1986, as amended (the “Code”). The Company is not a subsidiary of or consolidated with Morgan Stanley.
The Company was formed as a Delaware limited liability company on May 30, 2019 and, effective November 25, 2019, converted to a Delaware corporation. The Company commenced investment operations in January 2020. The Company has delegated the right to manage the assets of the Company to MS Capital Partners Adviser Inc., as the investment adviser to the Company (the “Adviser” or “Investment Adviser”). The Investment Adviser is an indirect, wholly owned subsidiary of Morgan Stanley.
The Company’s investment objective is to achieve attractive risk-adjusted returns via current income and, to a lesser extent, capital appreciation by investing primarily in directly originated senior secured term loans issued by U.S. middle-market companies backed by private equity sponsors.
The Company conducted private offerings of its common stock, par value $0.001 per share (the “Common Stock”), to investors in reliance on exemptions from the registration requirements of the Securities Act of 1933, as amended (the “Securities Act”). At the closing of each private offering, each investor made a capital commitment (a “Capital Commitment”) to purchase shares of Common Stock pursuant to a subscription agreement entered into with the Company. In accordance with the terms of the subscription agreements (the “Subscription Agreements”) entered into by investors in the Company's private offerings,, the Company’s Board of Directors (the “Board of Directors”) approved a one-year extension of the Investment Period (as defined in the Subscription Agreements) such that the Investment Period expired on December 23, 2023. As of October 4, 2023, all Capital Commitments had been fully funded.
On January 26, 2024, the Company closed its initial public offering (“IPO”), issuing 5,000,000 shares of its Common Stock at a public offering price of $20.67 per share. Net of underwriting fees, the Company received net cash proceeds, before offering expenses, of approximately $97.1 million. The Company’s Common Stock began trading on the NYSE under the symbol “MSDL” on January 24, 2024. See Note 12 “Subsequent Events.”
The Company has formed wholly owned subsidiaries for the purpose of holding certain investments in portfolio companies made by the Company. As of December 31, 2023, the Company’s wholly owned subsidiaries were formed as Delaware limited liability companies and included: DLF CA SPV LLC (“CA SPV”), DLF SPV LLC (“DLF SPV”), DLF Financing SPV LLC (“Financing SPV”) and DLF Equity Holdings LLC (“Equity Holdings,” and collectively with CA SPV, DLF SPV and Financing SPV, the “subsidiaries”). The Company consolidates its wholly owned subsidiaries in these consolidated financial statements from the date of the respective subsidiary’s formation.
Morgan Stanley Direct Lending Fund
Notes to Consolidated Financial Statements
December 31, 2023
(In thousands, except shares and per share amounts)
(2) SUMMARY OF SIGNIFICANT ACCOUNTING POLICIES
Basis of Presentation
The accompanying consolidated financial statements have been prepared in accordance with generally accepted accounting principles in the United States of America (“U.S. GAAP”). As an investment company, the Company applies the accounting and reporting guidance in Accounting Standards Codification (“ASC”) Topic 946, Financial Services – Investment Companies (“ASC 946”) issued by the Financial Accounting Standards Board (“FASB”).
The Company reclassified certain industry groupings of its portfolio companies presented in the accompanying consolidated financial statements as of December 31, 2023 to align with the recently updated Global Industry Classification Standards (“GICS”), where applicable. These reclassifications had no impact on the Consolidated Statement of Assets and Liabilities as of December 31, 2023.
Use of Estimates
The preparation of consolidated financial statements in conformity with U.S. GAAP requires management to make estimates and assumptions that affect the reported amounts of assets, liabilities and expenses and disclosure of contingent assets and liabilities at the date of the consolidated financial statements. Such amounts could differ from those estimates and such differences could be material. Management’s estimates are based on historical experiences and other factors, including expectations of future events that management believes to be reasonable under the circumstances. Assumptions and estimates regarding the valuation of investments involve a higher degree of judgment and complexity and these assumptions and estimates may be significant to the consolidated financial statements.
Consolidation
As provided under ASC 946, the Company will not consolidate its investment in a company other than an investment company subsidiary or a controlled operating company whose business consists of providing services to the Company. Accordingly, the Company consolidated the accounts of the Company’s wholly owned subsidiaries in the consolidated financial statements. All intercompany balances and transactions have been eliminated in consolidation.
Cash
Cash is carried at cost, which approximates fair value. The Company deposits its cash with multiple financial institutions and, at times, may exceed the Federal Deposit Insurance Corporation insured limit.
Foreign Currency Translation
The functional currency of the Company is the U.S. Dollar. Investments denominated in foreign currencies are translated into U.S. Dollars based upon currency exchange rates effective on the last business day of the current reporting period. Net changes in fair value of investments due to foreign exchange rates fluctuation is recorded as change in unrealized appreciation (depreciation) from translation of assets and liabilities in foreign currencies on the Consolidated Statements of Operations. Investment and non-investment activities denominated in foreign currencies, including purchase and sales of investments, borrowings and repayments of debt, income and expenses, are translated into U.S. dollars based upon currency exchange rates prevailing on the transaction dates.
Investments
Investment transactions are recorded on the trade date. Receivables/payables from investments sold/purchased on the Consolidated Statements of Assets and Liabilities consist of amounts receivable to or payable by the Company for transactions that have not settled at the reporting date. Realized gains or losses are measured by the difference between the net proceeds received (excluding prepayment fees, if any) and the amortized cost basis of the investment using the specific identification method without regard to unrealized gains or losses previously recognized, and include investments charged off during the period, net of recoveries. The net change in unrealized gains or losses primarily reflects the change in investment values, including the reversal of previously recorded unrealized gains or losses with respect to investments realized during the period.
The Board of Directors, with the assistance of the Company’s audit committee (the “Audit Committee”), determines the fair value of the Company’s investments in accordance with ASC Topic 820, Fair Value Measurements (“ASC 820”) issued by the FASB. The Board of Directors has delegated to the Investment Adviser as the Valuation Designee the responsibility of determining the fair value of the Company’s investment portfolio, subject to oversight of the Board of Directors, pursuant to Rule 2a-5 under the 1940 Act. As such, the Valuation Designee is charged with determining the fair value of the Company’s investment portfolio, subject to oversight of the Board of Directors. ASC 820 defines fair value as “the price that would be received to sell an asset or paid to transfer a liability in an orderly transaction between market participants at the measurement date.” Fair value is a market-based measurement, not an entity-specific measurement. For some investments, observable market transactions or market information might be available. For other investments, observable market transactions and market information might not be available. However, the objective of a fair value measurement in both cases is the same - to estimate the price when an orderly transaction to sell the investment would take place between market participants at the measurement date under current market conditions (that is, an exit price at the measurement date from the perspective of a market participant). Refer to Note 5 “Fair Value Measurements” for the Company’s framework for determining fair value, fair value hierarchies, and the composition of the Company’s portfolio.
Revenue Recognition
Interest Income
Interest income is recorded on an accrual basis and includes the accretion of discounts and amortizations of premiums. Discounts from and premiums to par value on debt investments purchased are accreted/amortized into interest income over the life of the respective investment using the effective interest method. The amortized cost of debt investments represents the original cost, including loan origination fees and upfront fees received that are deemed to be an adjustment to yield, adjusted for the accretion of discounts and amortization of premiums, if any. Upon prepayment of a loan or debt investment, any prepayment premiums, unamortized upfront loan origination fees and unamortized discounts are recorded as interest income in the current period.
PIK Income
The Company has debt investments in its portfolio that contain payment-in-kind (“PIK”) provisions. PIK represents interest that is accrued and recorded as interest income at the contractual rates, increases the loan principal on the respective capitalization dates, and is generally due at maturity. Such income is included in PIK income on the Consolidated Statements of Operations. If at any point the Company believes PIK is not expected to be realized, the investment generating PIK will be placed on non-accrual status. When a PIK investment is placed on non-accrual status, the accrued, uncapitalized interest is generally reversed through PIK income. This non-cash source of income is included when determining what must be paid out to stockholders in the form of distributions in order for the Company to maintain its status as a RIC, even though the Company has not yet collected cash.
Dividend Income
Dividend income on preferred equity investments is recorded on an accrual basis to the extent that such amounts are payable by the portfolio company and are expected to be collected. Dividend income on common equity investments is recorded on the record date for private portfolio companies. Dividend income is presented net of withholding tax, if any.
Other Income
The Company may receive various fees in the ordinary course of business such as structuring, consent, waiver, amendment and syndication fees as well as fees for managerial assistance rendered by the Company to the portfolio companies. Such fees are recognized in income when earned or when the services are rendered and there is no uncertainty or contingency related to the amount to be received.
Non-Accrual Investments
Loans are generally placed on non-accrual status when there is reasonable doubt that principal or interest will be collected in full. Accrued interest is generally reversed when a loan is placed on non-accrual status. Additionally, any original issue discount and market discount are no longer accreted to interest income as of the date the loan is placed on non-accrual status. Interest payments received on non-accrual loans may be recognized as income or applied to principal depending upon management’s judgment regarding collectability. Non-accrual loans are restored to accrual status when past due principal and interest are paid current and, in management’s judgment, are likely to remain current. Management may determine to not place a loan on non-accrual status if the loan has sufficient collateral value and is in the process of collection.
As of December 31, 2023 and December 31, 2022, the Company had three and one investments, respectively, that were on non-accrual status. The amortized cost of investments on non-accrual status as of December 31, 2023 and December 31, 2022 was $19,353 and $1,500, respectively.
Organization and Offering Costs
Costs associated with the organization of the Company are expensed as incurred. These costs consist primarily of legal fees and other costs of organizing the Company. Costs associated with the offering of Common Stock are capitalized as “deferred offering costs” on the Consolidated Statements of Assets and Liabilities and amortized over a twelve-month period from the initial capital call, subject to the limitation described in Note 3 below. These costs consist primarily of legal fees and other costs incurred in connection with the Company’s continuous private offerings of its Common Stock.
Expenses
The Company is responsible for investment expenses, professional fees and other general and administrative expenses related to the Company’s operations. Such fees and expenses, including expenses incurred by the Adviser on behalf of the Company, is reimbursed by the Company.
The Company pays the Investment Adviser a base management fee and an incentive fee under the Investment Advisory Agreement between the Company and the Investment Adviser entered into on November 25, 2019 (the “Original Investment Advisory Agreement”) as described in Note 3 “Related Party Transactions” below. The fees are recorded on the Consolidated Statements of Operations. On January 24, 2024, the Company entered into an Amended and Restated Investment Advisory Agreement with the Adviser (the “Amended and Restated Investment Advisory Agreement” and together with the Original Investment Advisory Agreement, the "Investment Advisory Agreement").
See Note 12 “Subsequent Events.”
Deferred Financing Costs and Debt Issuance Costs
Deferred financing and debt issuance costs consist of fees and expenses paid in connection with the closing of and amendments to the Company’s borrowings. The aforementioned costs are amortized using the straight-line method over each instrument’s term. Deferred financing costs related to a revolving credit facility is presented separately as an asset on the Company’s Consolidated Statements of Assets and Liabilities. Deferred debt issuance costs related to any notes are presented net against the outstanding debt balance on the Consolidated Statements of Assets and Liabilities.
Income Taxes
The Company has elected to be treated as a RIC under Subchapter M of the Code. So long as the Company maintains its status as a RIC, it generally will not pay corporate U.S. federal income taxes on any ordinary income or capital gains that it distributes, at least annually, to its stockholders as distributions.
In order to continue to qualify as a RIC, the Company must meet certain minimum distribution, source-of-income and asset diversification requirements. If such requirements are met, then the Company is generally required to pay income taxes only on the portion of its taxable income and gains it does not distribute.
The minimum distribution requirements applicable to RICs require the Company to distribute to its stockholders at least 90% of its investment company taxable income (the “ICTI”), as defined by the Code, each year. Depending on the level of ICTI earned in a tax year, the Company may choose to carry forward ICTI in excess of current year distributions into the next tax year. Any such carryover ICTI must be distributed before the end of that next tax year through a distribution declared prior to filing the final tax return related to the year which generated such ICTI.
In addition, based on the excise distribution requirements, the Company is subject to a 4% nondeductible federal excise tax on undistributed income unless the Company distributes in a timely manner an amount at least equal to the sum of (1) 98% of its ordinary income for each calendar year, (2) 98.2% of capital gain net income (both long-term and short-term) for the one-year period ending October 31 in that calendar year and (3) any income realized, but not distributed, in the preceding year. For this purpose, however, any ordinary income or capital gain net income retained by the Company that is subject to corporate income tax is considered to have been distributed. For the December 31, 2023, December 31, 2022 and December 31, 2021, the Company accrued $1,519, $334 and $80 of U.S. federal excise tax, respectively.
The Company evaluates tax positions taken or expected to be taken in the course of preparing its consolidated financial statements to determine whether the tax positions are “more likely than not” to be sustained by the applicable tax authority. All penalties and interest associated with income taxes, if any, are included in income tax expense.
New Accounting Pronouncements
The Company considers the applicability and impact of all accounting standard updates (“ASU”) issued by the FASB. The Company has assessed currently issued ASUs and has determined that they are not applicable or expected to have minimal impact on its consolidated financial statements.
(3)RELATED PARTY TRANSACTIONS
Investment Advisory Agreement
On November 25, 2019, the Company entered into the Original Investment Advisory Agreement. The Original Investment Advisory Agreement had an initial term of two years continued thereafter from year to year if approved annually by the Board of Directors or the Company’s stockholders, including, in each case, a majority of the directors who are not “interested persons” as defined in Section 2(a)(19) of the 1940 Act (the “Independent Directors”). The renewal of the Original Investment Advisory Agreement was most recently approved in August 2023.
On January 24, 2024, the Company entered into the Amended and Restated Investment Advisory Agreement with the Adviser. See Note 12. “Subsequent Events.”
The Company pays the Investment Adviser a fee for its services under the Investment Advisory Agreement consisting of two components: a base management fee (the “Base Management Fee”) and an incentive fee. The cost of both the Base Management Fee and the incentive fee are ultimately be borne by the stockholders.
Base Management Fee
The Base Management Fee is calculated at an annual rate of 1.0% of the Company’s average gross assets at the end of the two most recently completed calendar quarters, including assets purchased with borrowed funds or other forms of leverage but excluding cash and cash equivalents. Pursuant to the Original Investment Advisory Agreement, the Adviser agreed to irrevocably waive the portion of the Base Management Fee in excess of 0.25% of the Company’s average gross assets calculated in accordance with the Original Investment Advisory Agreement prior to a listing of the Common Stock on a national securities exchange.
Any Base Management Fees so waived were not subject to recoupment by the Investment Adviser. The Base Management Fee is payable quarterly in arrears, and no management fee was charged on committed but undrawn Capital Commitments.
For the year ended December 31, 2023, December 31, 2022 and December 31, 2021, Base Management Fees were $7,637, $6,679 and $3,465 net of waiver, respectively. As of December 31, 2023 and December 31, 2022, $2,012 and $1,783 were payable to the Investment Adviser relating to Base Management Fees.
Incentive Fee
The incentive fee consists of two components that are determined independently of each other, with the result that one component may be payable even if the other is not. One component is based on income and the other component is based on capital gains.
Pre-incentive fee net investment income is defined as interest income, dividend income and any other income accrued during the calendar quarter, minus operating expenses for the quarter, including the base management fee, expenses payable under the Administration Agreement (as defined below), any interest expense and distributions paid on any issued and outstanding preferred stock, but excluding the incentive fee. Pre-incentive fee net investment income does not include any realized capital gains, realized capital losses or unrealized capital appreciation or depreciation.
Pre-incentive fee net investment income includes, in the case of investments with a deferred interest feature (such as debt instruments with PIK interest and zero coupon securities), accrued income that the Company has not yet received in cash. The Investment Adviser is not obligated to return any incentive fee it receives on PIK interest that is later determined to be uncollectible in cash. Pre-incentive fee net investment income does not include any realized capital gains, realized capital losses or unrealized capital appreciation or depreciation.
Pursuant to the Original Investment Advisory Agreement, the Company paid its Adviser an income based incentive fee with respect to the Company’s pre-incentive fee net investment income in each calendar quarter as follows:
•No income based incentive fee if the Company’s pre-incentive fee net investment income, expressed as a return on the value of the Company’s net assets at the end of the immediately preceding calendar quarter, does not exceed the hurdle rate of 1.5% (6.0% annualized);
•100% of the Company’s pre-incentive fee net investment income, if any, that exceeds the hurdle rate but is less than 1.8182% (7.2728% annualized). This portion of the pre-incentive fee net investment income (which exceeds the Hurdle Rate but is less than 1.8182%) is referred to as the “catch-up”. This “catch-up” portion is meant to provide the Adviser with approximately 17.5% of the Company’s pre-incentive fee net investment income as if a hurdle rate did not apply if the “catch up” is achieved; and
•17.5% of the Company’s pre-incentive fee net investment income, if any, that exceeds the rate of return of 1.8182% (7.2728% annualized).
The second part of the incentive fee is determined on realized capital gains calculated and payable in arrears in cash as of the end of each calendar year or upon the termination of the Original Investment Advisory Agreement in an amount equal to 17.5% of the realized capital gains, if any, on a cumulative basis from the date of the Company's election to be regulated as a BDC through the end of a given calendar year or upon the termination of the Original Investment Advisory Agreement, computed net of all realized capital losses and unrealized capital depreciation on a cumulative basis, less the aggregate amount of any previously paid capital gain incentive fees (the “Cumulative Capital Gains”).
Under U.S. GAAP, the Company is required to accrue an incentive fee on capital gains, including unrealized capital appreciation even though such unrealized capital appreciation is not included in calculating the incentive fee payable under the Investment Advisory Agreement. If such amount is positive at the end of a period, then the Company records an incentive fee on capital gain incentive fee equal to 17.5% of such amount, less the aggregate amount of any previously paid capital gain incentive fees. If such amount is negative, no accrual is recorded for such period.
For the year ended December 31, 2023, December 31, 2022 and December 31, 2021, $42,012, $26,635 and $15,852 respectively, of income based incentive fees were accrued to the Investment Adviser.
For the year ended December 31, 2023, December 31, 2022 and December 31, 2021, the Investment Adviser accrued $0, $(2,441) and $1,809 capital gains incentive fees. For the year ended December 31, 2022, there was $2,441 a reversal of previously accrued capital gains incentive fees as there was net unrealized depreciation on investments during the period. The Investment Advisory Agreement does not permit unrealized capital appreciation for purposes of calculating the amount payable to the Investment Adviser. Amounts due related to unrealized capital appreciation, if any, will not be paid to the Investment Adviser until realized under the terms of the Investment Advisory Agreement and determined based on the calculation. Incentive fees on Cumulative Capital Gains crystallize at calendar year-end.
As of December 31, 2023, $11,766 and $0 were payable to the Investment Adviser relating to income-based incentive fees and capital gains incentive fees payable. As of December 31, 2022, $8,118 and $0 were payable to the Investment Adviser relating to income-based incentive fees and capital gains incentive fees, respectively.
Administration Agreement
MS Private Credit Administrative Services LLC (the “Administrator”) is the administrator of the Company pursuant to an administration agreement (the “Administration Agreement”). The Administrator is an indirect, wholly owned subsidiary of Morgan Stanley. Pursuant to the Administration Agreement, the Administrator provides services and receives reimbursements from the Company for its costs and expenses and the Company’s allocable portion of overhead costs incurred by the Administrator in performing its obligations under the Administration Agreement, including the Company’s allocable portion of the compensation paid to its Chief Financial Officer and Chief Compliance Officer. Reimbursement under the Administration Agreement occurs quarterly in arrears. The Administration Agreement had an initial term of two years and continues thereafter from year to year if approved annually by the Board of Directors, which most recently approved the renewal of the Administration Agreement in August 2023.
For the year ended December 31, 2023, December 31, 2022 and December 31, 2021, the Company incurred $178, $72 and $212, respectively, in expenses under the Administration Agreement, which were recorded in administrative service fees on the Consolidated Statements of Operations.
Amounts unpaid and included in payable to affiliates on the Consolidated Statements of Assets and Liabilities as of December 31, 2023 and December 31, 2022 were $178 and $110, respectively.
Expense Support and Waiver Agreement
On December 31, 2019, the Company entered into an expense support and waiver agreement (the “Expense Support and Waiver Agreement”) with the Investment Adviser. Under the terms of the Expense Support and Waiver Agreement, the Investment Adviser agreed to waive any reimbursement by the Company of offering and organizational expenses incurred by the Investment Adviser on behalf of the Company in excess of $1,000 or 0.10% of the aggregate Capital Commitments of the Company, whichever is greater. If actual organization and offering costs incurred exceeded the greater of $1,000 or 0.10% of the Company’s total Capital Commitments, the Investment Adviser or its affiliate would bear the excess costs.
For the year ended December 31, 2023, the Company did not incur any organization costs and all previously waived amount were already recaptured as of December 31, 2022. For the year ended December 31, 2022, the Company did not incur any organization costs. For the year ended December 31, 2021, the Investment Adviser recaptured $98 of previously waived amounts from the Company. The Investment Adviser recaptured $44 of previously waived amounts from the Company since actual offering and organizational expenses incurred from May 30, 2019 (inception) as a result of additional closings of investor commitments.
License Agreement
The Company entered into the license agreement (the “License Agreement”) with Morgan Stanley under which Morgan Stanley Investment Management, Inc. has granted the Company a non-exclusive, royalty-free license to use the name “Morgan Stanley” for specified purposes in the Company’s business. Under the License Agreement, the Company has a right to use the “Morgan Stanley” name, subject to certain conditions, for so long as the Adviser or one of its affiliates remains the Company’s investment adviser. Other than with respect to this limited license, the Company has no legal right to the “Morgan Stanley” name.
Placement Agent Agreement
On August 30, 2019, the Company entered into a placement agent agreement (the “Placement Agent Agreement”) with Morgan Stanley Distribution Inc. (the “Paying Agent”), Morgan Stanley Smith Barney LLC (the “Placement Agent”) and the Investment Adviser. Under the terms of the Placement Agent Agreement, the Placement Agent and certain of its affiliates assist in the placement of Common Stock in the Company’s private offerings. The Company was not liable for any payments to the Placement Agent pursuant to the Placement Agent Agreement. Payments were made by the Investment Adviser to the Placement Agent. To the extent the Paying Agent received any payments it would remit the payment to the Placement Agent. The Placement Agent Agreement terminated on January 24, 2024.
Indemnification Agreements
The Company has entered into indemnification agreements with its directors and officers. The indemnification agreements are intended to provide the directors and officers the maximum indemnification permitted under Delaware law and the 1940 Act and are generally consistent with the indemnification provisions of the Company’s certificate of incorporation and bylaws. Each indemnification agreement provides that the Company will indemnify the director or officer who is a party to the agreement (an “Indemnitee”), including the advancement of legal expenses, if, by reason of his or her corporate status, the Indemnitee is, or is threatened to be, made a party to or a witness in any threatened, pending, or completed proceeding, to the maximum extent permitted by Delaware law and the 1940 Act.
MS Credit Partners Holdings, Inc. Investment
MS Credit Partners Holdings, Inc., or MS Credit Partners Holdings, a wholly owned subsidiary of Morgan Stanley and an affiliate of the Investment Adviser, made an aggregate capital commitment of $200,000 to the Company pursuant to a subscription agreement entered into in December 2019, which had been fully funded as of October 4, 2023. As of December 31, 2023 and December 31, 2022, MS Credit Partners Holdings held approximately 11.7% and 11.9% of the Company’s outstanding shares of Common Stock, respectively. Morgan Stanley has no further capital, liquidity or other financial obligation to the Company beyond this equity investment.
Morgan Stanley & Co. Related Transactions
Morgan Stanley & Co. LLC, a wholly owned subsidiary of Morgan Stanley and an affiliate of the Investment Adviser, served as an initial purchaser in connection with the private placement of the Company’s 2027 Notes (as defined below in Note 6. “Debt”) and received fees of $213 at closing, under the purchase agreement entered into by the Company in connection with such private placement.
Morgan Stanley & Co. LLC served as a co-agent in connection with the private placement of the Company’s 2025 Notes (as defined below in Note 6. “Debt”) and received fees of $138 at closing.
These fees are deferred and amortized over the life of the related term obligation using the straight-line method. Any unamortized amounts are presented as a reduction to the outstanding term debt principal amount on the Consolidated Statements of Assets and Liabilities.
(4) INVESTMENTS
The composition of the Company’s investment portfolio at cost and fair value was as follows:
|
|
|
|
|
|
|
|
|
|
|
|
|
|
|
|
|
|
|
|
|
|
|
|
|
|
|
|
|
|
|
|
|
|
|
|
|
|
|
|
|
December 31, 2023 |
|
December 31, 2022 |
|
|
Cost |
|
Fair Value |
|
% of Total Investments at Fair Value |
|
Cost |
|
Fair Value |
|
% of Total Investments at Fair Value |
| First Lien Debt |
|
$ |
3,027,413 |
|
|
$ |
3,004,544 |
|
|
94.1 |
% |
|
$ |
2,753,620 |
|
|
$ |
2,694,111 |
|
|
93.8 |
% |
| Second Lien Debt |
|
146,014 |
|
|
132,415 |
|
|
4.1 |
|
|
136,620 |
|
|
128,350 |
|
|
4.5 |
|
| Other Investments |
|
53,349 |
|
|
56,602 |
|
|
1.8 |
|
|
49,406 |
|
|
51,127 |
|
|
1.7 |
|
| Total |
|
$ |
3,226,776 |
|
|
$ |
3,193,561 |
|
|
100.0 |
% |
|
$ |
2,939,646 |
|
|
$ |
2,873,588 |
|
|
100.0 |
% |
The industry composition of investments at fair value was as follows:
|
|
|
|
|
|
|
|
|
|
|
|
|
|
|
|
|
|
|
|
December 31, 2023 |
|
December 31, 2022(1) |
|
| Aerospace & Defense |
|
2.2 |
|
% |
1.8 |
|
% |
| Air Freight & Logistics |
|
1.1 |
|
|
1.1 |
|
|
| Automobile Components |
|
3.5 |
|
|
3.8 |
|
|
| Automobiles |
|
4.7 |
|
|
5.1 |
|
|
| Biotechnology |
|
0.5 |
|
|
0.5 |
|
|
| Chemicals |
|
0.6 |
|
|
0.6 |
|
|
| Commercial Services & Supplies |
|
9.6 |
|
|
11.2 |
|
|
| Construction & Engineering |
|
1.5 |
|
|
1.3 |
|
|
| Containers & Packaging |
|
1.4 |
|
|
1.6 |
|
|
| Distributors |
|
2.9 |
|
|
4.2 |
|
|
| Diversified Consumer Services |
|
2.5 |
|
|
3.0 |
|
|
| Electronic Equipment, Instruments & Components |
|
2.1 |
|
|
1.0 |
|
|
| Energy Equipment & Services |
|
0.5 |
|
|
0.5 |
|
|
| Financial Services |
|
1.9 |
|
|
0.7 |
|
|
| Food Products |
|
2.3 |
|
|
2.5 |
|
|
| Health Care Equipment & Supplies |
|
0.7 |
|
|
0.3 |
|
|
| Health Care Providers & Services |
|
4.6 |
|
|
3.4 |
|
|
| Health Care Technology |
|
1.9 |
|
|
0.7 |
|
|
| Industrial Conglomerates |
|
1.3 |
|
|
0.2 |
|
|
| Insurance Services |
|
14.9 |
|
|
15.7 |
|
|
| Interactive Media & Services |
|
3.2 |
|
|
3.5 |
|
|
| IT Services |
|
8.7 |
|
|
9.6 |
|
|
| Leisure Products |
|
0.7 |
|
|
0.8 |
|
|
| Machinery |
|
2.1 |
|
|
3.0 |
|
|
| Multi-Utilities |
|
0.7 |
|
|
0.6 |
|
|
| Oil, Gas & Consumable Fuels |
|
— |
|
|
0.0 |
|
(2) |
| Pharmaceuticals |
|
0.4 |
|
|
0.4 |
|
|
| Professional Services |
|
3.8 |
|
|
3.2 |
|
|
| Real Estate Management & Development |
|
5.3 |
|
|
5.4 |
|
|
| Software |
|
14.2 |
|
|
14.3 |
|
|
| Wireless Telecommunication Services |
|
0.2 |
|
|
— |
|
|
| Total |
|
100.0 |
|
% |
100.0 |
|
% |
(1) The Company reclassified certain industry groupings of its portfolio companies presented in the consolidated financial statements as of December 31, 2022 to align with the recently updated GICS, where applicable. These reclassifications had no impact on the Consolidated Statement of Assets and Liabilities as of December 31, 2022.
(2) Amount rounds to 0.0%.
The geographic composition of investments at cost and fair value was as follows:
|
|
|
|
|
|
|
|
|
|
|
|
|
|
|
|
|
|
|
|
|
|
|
|
|
|
|
|
|
|
|
|
|
|
|
|
|
|
|
|
|
December 31, 2023 |
|
December 31, 2022 |
|
|
Cost |
|
Fair Value |
|
% of Total
Investments at
Fair Value |
|
Cost |
|
Fair Value |
|
% of Total
Investments at
Fair Value |
| Australia |
|
$ |
16,985 |
|
|
$ |
17,048 |
|
|
0.5 |
% |
|
$ |
10,187 |
|
|
$ |
9,870 |
|
|
0.3 |
% |
| Canada |
|
98,674 |
|
|
98,387 |
|
|
3.1 |
|
|
108,820 |
|
|
105,764 |
|
|
3.7 |
|
| United Kingdom |
|
12,398 |
|
|
12,629 |
|
|
0.4 |
|
|
11,157 |
|
|
11,157 |
|
|
0.4 |
|
| United States |
|
3,098,719 |
|
|
3,065,497 |
|
|
96.0 |
|
|
2,809,482 |
|
|
2,746,797 |
|
|
95.6 |
|
| Total |
|
$ |
3,226,776 |
|
|
$ |
3,193,561 |
|
|
100.0 |
% |
|
$ |
2,939,646 |
|
|
$ |
2,873,588 |
|
|
100.0 |
% |
(5) FAIR VALUE MEASUREMENTS
ASC 820 establishes a hierarchical disclosure framework which ranks the observability of inputs used in measuring financial instruments at fair value. The observability of inputs is impacted by a number of factors, including the type of financial instruments and their specific characteristics. Financial instruments with readily available quoted prices, or for which fair value can be measured from quoted prices in active markets, generally will have a higher degree of market price observability and a lesser degree of judgment applied in determining fair value.
The three-level hierarchy for fair value measurements is defined as follows:
Level 1—inputs to the valuation methodology are quoted prices available in active markets for identical financial instruments as of the measurement date. The types of financial instruments in this category include unrestricted securities, including equities and derivatives, listed in active markets. The Company will not adjust the quoted price for these instruments, even in situations where the Company holds a large position and a sale could reasonably impact the quoted price.
Level 2—inputs to the valuation methodology are quoted prices in markets that are not active or for which all significant inputs are either directly or indirectly observable as of the measurement date. The types of financial instruments in this category include less liquid and restricted securities listed in active markets, securities traded in markets that are not active, and certain over-the-counter derivatives where the fair value is based on observable inputs.
Level 3—inputs to the valuation methodology are unobservable and significant to the overall fair value measurement, and include situations where there is little, if any, market activity for the investment. The inputs into the determination of fair value require significant management judgment or estimation. The types of financial instruments in this category include investments in privately held entities, non-investment grade residual interests in securitizations and certain over-the-counter derivatives where the fair value is based on unobservable inputs.
In certain cases, the inputs used to measure fair value may fall into different levels of the fair value hierarchy. In such cases, the determination of which category within the fair value hierarchy is appropriate for any given financial instrument is based on the lowest level of input that is significant to the fair value measurement. Assessment of the significance of a particular input to the fair value measurement in its entirety requires judgment and considers factors specific to the financial instrument.
Pursuant to the framework set forth above, the Company values securities traded in active markets on the measurement date by multiplying the exchange closing price of such traded securities/instruments by the quantity of shares or amount of the instrument held. The Company may also obtain quotes with respect to certain of the investments from pricing services, brokers or dealers’ quotes, or counterparty marks in order to value liquid assets that are not traded in active markets. Pricing services aggregate, evaluate and report pricing from a variety of sources including observed trades of identical or similar securities, broker or dealer quotes, model-based valuations and internal fundamental analysis and research. When doing so, the Company determines whether the quote obtained is sufficient according to U.S. GAAP to determine the fair value of the security. If determined adequate, the Company uses the quote obtained.
Securities that are illiquid or for which the pricing source does not provide a valuation or methodology or provides a valuation or methodology that, in the judgment of the Valuation Designee or the Board of Directors, does not represent fair value, each is valued as of the measurement date using all techniques appropriate under the circumstances and for which sufficient data is available. These valuation techniques may vary by investment but include comparable public market valuations, comparable precedent transaction valuations and discounted cash flow analyses. Non-controlled debt investments are generally fair valued using discounted cash flow technique. Expected cash flows are projected based on contractual terms and discounted back to the measurement date based on a discount rate. Discount rate is determined based upon an assessment of current and expected yields for similar investments and risk profiles. Non-controlled equity investments are generally fair valued using a market approach and/or an income approach. The market approach typically utilizes market value multiples of comparable publicly traded companies. The income approach typically utilizes a discounted cash flow analysis of the portfolio company. The Valuation Designee, under the supervision of the Board of Directors undertakes a multi-step valuation process each quarter, as described below:
1)each portfolio company or investment is initially valued by using a standardized template designed to approximate fair market value based on observable market inputs and updated credit statistics and unobservable inputs;
2)preliminary valuation conclusions are documented and reviewed by a valuation committee comprised of members of the Investment Adviser’s senior management;
3)the Board of Directors or Valuation Designee engages independent third-party valuation firms to provide positive assurance on a portion of the Company’s illiquid investments each quarter (such that each illiquid investment is reviewed by an independent valuation firm at least once on a rolling twelve-month basis) including review of management’s preliminary valuation and conclusion of fair value;
4)the Audit Committee reviews the assessments of the Valuation Designee and the independent third-party valuation firms and provides the Board of Directors with recommendations with respect to the fair value of each investment in the Company’s portfolio; and 5)the Board of Directors discusses the valuation recommendations of the Audit Committee and determine the fair value of each investment in the Company’s portfolio in good faith based on the input of the Valuation Designee and, where applicable, the third-party valuation firms.
The fair value is generally determined based on the assessment of the following factors, as relevant:
• the nature and realizable value of any collateral;
• call features, put features and other relevant terms of debt;
• the portfolio company’s leverage and ability to make payments;
• the portfolio company’s public or private letter credit ratings;
• the portfolio company’s actual and expected earnings and discounted cash flow;
• prevailing interest rates for like securities and expected volatility in future interest rates;
• the markets in which the issuer does business and recent economic and/or market events; and
• comparisons to publicly traded securities.
Investment performance data utilized will be the most recently available as of the measurement date which in many cases may reflect up to a one quarter lag in information.
The Board of Directors is ultimately responsible for the determination, in good faith, of the fair value of the Company’s portfolio investments.
The following tables present the fair value hierarchy of investments:
|
|
|
|
|
|
|
|
|
|
|
|
|
|
|
|
|
|
|
|
|
|
|
|
|
|
|
|
|
|
|
|
|
|
|
|
|
|
|
|
|
|
|
|
|
|
|
|
|
|
|
|
|
December 31, 2023 |
|
December 31, 2022 |
|
|
Level 1 |
|
Level 2 |
|
Level 3 |
|
Total |
|
Level 1 |
|
Level 2 |
|
Level 3 |
|
Total |
| First Lien Debt |
|
$ |
— |
|
|
$ |
24,674 |
|
|
$ |
2,979,870 |
|
|
$ |
3,004,544 |
|
|
$ |
— |
|
|
$ |
25,362 |
|
|
$ |
2,668,749 |
|
|
$ |
2,694,111 |
|
| Second Lien Debt |
|
— |
|
|
35,567 |
|
|
96,848 |
|
|
132,415 |
|
|
— |
|
|
5,459 |
|
|
122,891 |
|
|
128,350 |
|
| Other Securities |
|
— |
|
|
— |
|
|
40,636 |
|
|
40,636 |
|
|
— |
|
|
— |
|
|
36,395 |
|
|
36,395 |
|
| Subtotal |
|
$ |
— |
|
|
$ |
60,241 |
|
|
$ |
3,117,354 |
|
|
$ |
3,177,595 |
|
|
$ |
— |
|
|
$ |
30,821 |
|
|
$ |
2,828,035 |
|
|
$ |
2,858,856 |
|
Investment measured at net asset value(1) |
|
|
|
|
|
|
|
15,966 |
|
|
|
|
|
|
|
|
14,732 |
|
| Total |
|
|
|
|
|
|
|
$ |
3,193,561 |
|
|
|
|
|
|
|
|
$ |
2,873,588 |
|
(1) The Company, as a practical expedient, estimates the fair value of its investment in Help HP SCF Investor, LP using the net asset value of the Company’s members’ interest in the entity. As such, the fair value has not been classified within the fair value hierarchy.
The following table presents changes in the fair value of the investments for which Level 3 inputs were used to determine the fair value for the year ended December 31, 2023:
|
|
|
|
|
|
|
|
|
|
|
|
|
|
|
|
|
|
|
|
|
|
|
|
|
|
|
|
|
First Lien Debt |
|
Second Lien Debt |
|
Other Securities |
|
Total Investments |
| Fair value, beginning of period |
|
$ |
2,668,749 |
|
|
$ |
122,891 |
|
|
$ |
36,395 |
|
|
$ |
2,828,035 |
|
| Purchases of investments |
|
618,914 |
|
|
86 |
|
|
1,812 |
|
|
620,812 |
|
| Proceeds from principal repayments and sales of investments |
|
(359,835) |
|
|
— |
|
|
— |
|
|
(359,835) |
|
| Accretion of discount/amortization of premium |
|
10,908 |
|
|
269 |
|
|
10 |
|
|
11,187 |
|
| Payment-in-kind |
|
3,417 |
|
|
532 |
|
|
2,120 |
|
|
6,069 |
|
| Net change in unrealized appreciation (depreciation) |
|
37,599 |
|
|
(6) |
|
|
299 |
|
|
37,892 |
|
| Net realized gains (losses) |
|
118 |
|
|
— |
|
|
— |
|
|
118 |
|
Transfers into/(out) of Level 3(1) |
|
— |
|
|
(26,924) |
|
|
— |
|
|
(26,924) |
|
| Fair value, end of period |
|
$ |
2,979,870 |
|
|
$ |
96,848 |
|
|
$ |
40,636 |
|
|
$ |
3,117,354 |
|
|
|
|
|
|
|
|
|
|
| Net change in unrealized appreciation (depreciation) from investments still held as of December 31, 2023 |
|
$ |
37,547 |
|
|
$ |
(6) |
|
|
$ |
299 |
|
|
$ |
37,840 |
|
(1) Transfer of portfolio investments within the three-level hierarchy is recorded during the period of such reclassification occurrence at the fair value as of the beginning of the respective period. Generally, reclassifications are primarily due to increase/decrease of price transparency.
The following table presents changes in the fair value of the investments for which Level 3 inputs were used to determine the fair value for the year ended December 31, 2022:
|
|
|
|
|
|
|
|
|
|
|
|
|
|
|
|
|
|
|
|
|
|
|
|
|
|
|
|
|
First Lien Debt |
|
Second Lien Debt |
|
Other Securities |
|
Total Investments |
| Fair value, beginning of period |
|
$ |
2,207,036 |
|
|
$ |
121,550 |
|
|
$ |
27,973 |
|
|
$ |
2,356,559 |
|
| Purchases of investments |
|
900,740 |
|
|
15,694 |
|
|
8,315 |
|
|
924,749 |
|
| Proceeds from principal repayments and sales of investments |
|
(384,631) |
|
|
— |
|
|
(48) |
|
|
(384,679) |
|
| Accretion of discount/amortization of premium |
|
11,062 |
|
|
278 |
|
|
1 |
|
|
11,341 |
|
| Payment-in-kind |
|
1,080 |
|
|
524 |
|
|
1,110 |
|
|
2,714 |
|
| Net change in unrealized appreciation (depreciation) |
|
(67,033) |
|
|
(9,205) |
|
|
(1,004) |
|
|
(77,242) |
|
| Net realized gains (losses) |
|
495 |
|
|
— |
|
|
48 |
|
|
543 |
|
Transfers into/(out) of Level 3(1) |
|
— |
|
|
(5,950) |
|
|
— |
|
|
(5,950) |
|
| Fair value, end of period |
|
$ |
2,668,749 |
|
|
$ |
122,891 |
|
|
$ |
36,395 |
|
|
$ |
2,828,035 |
|
|
|
|
|
|
|
|
|
|
| Net change in unrealized appreciation (depreciation) from investments still held as of December 31, 2022 |
|
$ |
(64,817) |
|
|
$ |
(9,186) |
|
|
$ |
(1,004) |
|
|
$ |
(75,007) |
|
(1) Transfer of portfolio investments within the three-level hierarchy is recorded during the period of such reclassification occurrence at the fair value as of the beginning of the respective period. Generally, reclassifications are primarily due to increase/decrease of price transparency.
The following table presents quantitative information about the significant unobservable inputs of the Company’s Level 3 financial instruments. The table is not intended to be all-inclusive but instead captures the significant unobservable inputs relevant to the Company’s determination of fair value.
|
|
|
|
|
|
|
|
|
|
|
|
|
|
|
|
|
|
|
|
|
|
|
|
|
|
|
|
|
|
|
|
|
|
|
|
|
|
|
|
|
December 31, 2023 |
|
|
|
|
|
|
|
|
Range |
|
|
|
|
Fair
Value |
|
Valuation Technique |
|
Unobservable
Input |
|
Low |
|
High |
|
Weighted
Average |
| Investments in first lien debt |
|
$ |
2,979,870 |
|
|
Yield Analysis |
|
Discount Rate |
|
8.61 |
% |
|
25.09 |
% |
|
11.00 |
% |
|
|
|
|
|
|
|
|
|
|
|
|
|
| Investments in second lien debt |
|
$ |
96,848 |
|
|
Yield Analysis |
|
Discount Rate |
|
10.80 |
% |
|
31.13 |
% |
|
14.37 |
% |
|
|
|
|
|
|
|
|
|
|
|
|
|
| Investments in other securities: |
|
|
|
|
|
|
|
|
|
|
|
|
| Unsecured debt |
|
$ |
1,894 |
|
|
Income Approach |
|
Discount Rate |
|
14.60 |
% |
|
14.60 |
% |
|
14.60 |
% |
|
|
170 |
|
|
Market Approach |
|
EBITDA Multiple |
|
9.00x |
|
9.00x |
|
9.00x |
| Preferred equity |
|
18,758 |
|
|
Income Approach |
|
Discount Rate |
|
12.19 |
% |
|
15.68 |
% |
|
13.47 |
% |
|
|
1,275 |
|
|
Market Approach |
|
Revenue Multiple |
|
7.50x |
|
7.50x |
|
7.50x |
| Common equity |
|
16,600 |
|
|
Market Approach |
|
EBITDA Multiple |
|
8.10x |
|
18.70x |
|
13.26x |
|
|
1,939 |
|
|
Market Approach |
|
Revenue Multiple |
|
7.60x |
|
9.80x |
|
8.47x |
| Total investments in other securities |
|
$ |
40,636 |
|
|
|
|
|
|
|
|
|
|
|
| Total Investments |
|
$ |
3,117,354 |
|
|
|
|
|
|
|
|
|
|
|
|
|
|
|
|
|
|
|
|
|
|
|
|
|
|
|
|
|
|
|
|
|
|
|
|
|
|
|
|
|
|
|
|
|
|
|
|
|
|
|
|
December 31, 2022 |
|
|
|
|
|
|
|
|
Range |
|
|
|
|
Fair
Value |
|
Valuation Technique |
|
Unobservable
Input |
|
Low |
|
High |
|
Weighted
Average |
| Investments in first lien debt |
|
$ |
2,624,749 |
|
|
Yield Analysis |
|
Discount Rate |
|
9.20 |
% |
|
20.44 |
% |
|
11.27 |
% |
|
|
44,000 |
|
|
Transaction Price |
|
Recent Transaction |
|
100.00 |
% |
|
100.00 |
% |
|
100.00 |
% |
| Investments in second lien debt |
|
$ |
122,891 |
|
|
Yield Analysis |
|
Discount Rate |
|
12.14 |
% |
|
17.20 |
% |
|
14.24 |
% |
| Investments in other securities |
|
|
|
|
|
|
|
|
|
|
|
|
| Unsecured debt |
|
$ |
1,826 |
|
|
Income Approach |
|
Discount Rate |
|
16.60 |
% |
|
16.60 |
% |
|
16.60 |
% |
|
|
372 |
|
|
Market Approach |
|
EBITDA Multiple |
|
9.00x |
|
9.00x |
|
9.00x |
| Preferred equity |
|
16,076 |
|
|
Income Approach |
|
Discount Rate |
|
12.20 |
% |
|
15.69 |
% |
|
13.62 |
% |
|
|
963 |
|
|
Market Approach |
|
Revenue Multiple |
|
8.78x |
|
8.78x |
|
8.78x |
| Common equity |
|
15,877 |
|
|
Market Approach |
|
EBITDA Multiple |
|
8.10x |
|
18.70x |
|
13.25x |
|
|
1,281 |
|
|
Market Approach |
|
Revenue Multiple |
|
10.20x |
|
10.20x |
|
10.20x |
| Total investments in other securities |
|
$ |
36,395 |
|
|
|
|
|
|
|
|
|
|
|
| Total Investments |
|
$ |
2,828,035 |
|
|
|
|
|
|
|
|
|
|
|
The significant unobservable input used in yield analysis is discount rate based on comparable market yields. Significant increases in discount rates in isolation would result in a significantly lower fair value measurement. The significant unobservable input used in the market approach is the comparable company multiple. The multiple is used to estimate the enterprise value of the underlying investment. An increase/decrease in the multiple would result in an increase/decrease, respectively, in the fair value.
Financial instruments disclosed but not carried at fair value
The Company’s debt, including its credit facilities, 2027 Notes (as defined below in Note 6. “Debt”) and 2025 Notes (as defined below in Note 6. “Debt”), are presented at carrying value on the Consolidated Statements of Assets and Liabilities. The fair value of the Company’s 2027 Notes is based on third party pricing received by the Company, which is categorized as Level 2 within the fair value hierarchy, and as of December 31, 2023, the fair value of the Company’s 2027 Notes was $407,617. The fair value of the Company’s credit facilities and 2025 Notes are estimated in accordance with the Company's valuation policy. The carrying value and fair value of the Company’s debt were as follows:
|
|
|
|
|
|
|
|
|
|
|
|
|
|
|
|
|
|
|
|
|
|
|
|
|
|
|
|
|
December 31, 2023 |
|
December 31, 2022 |
|
|
Carrying Value |
|
Fair Value |
|
Carrying Value |
|
Fair Value |
|
|
|
|
|
|
|
|
|
| BNP Funding Facility |
|
$ |
282,000 |
|
|
$ |
282,000 |
|
|
$ |
400,000 |
|
|
$ |
400,000 |
|
| Truist Credit Facility |
|
520,263 |
|
|
520,263 |
|
|
432,254 |
|
|
432,254 |
|
2027 Notes(1) |
|
420,834 |
|
|
407,617 |
|
|
419,498 |
|
|
394,995 |
|
2025 Notes(1) |
|
272,935 |
|
|
275,000 |
|
|
271,723 |
|
|
275,000 |
|
| Total |
|
$ |
1,496,032 |
|
|
$ |
1,484,880 |
|
|
$ |
1,523,475 |
|
|
$ |
1,502,249 |
|
(1)As of December 31, 2023, the carrying value of the Company’s 2027 Notes and 2025 Notes were presented net of unamortized debt issuance costs of $3,499 and $2,065, and unamortized original issuance discount of $667 and $0, respectively. As of December 31, 2022, the carrying value of the Company’s 2027 Notes and 2025 Notes were presented net of unamortized debt issuance costs of $4,622 and $3,277, and unamortized original issuance discount of $881 and $0, respectively.
The carrying amounts of the Company’s assets and liabilities, other than investments at fair value and debt, approximate fair value. These financial instruments are categorized as Level 3 within the hierarchy.
(6) DEBT
The Company’s debt obligations were as follows. Unused debt capacity of credit facilities were subject to certain borrowing base restrictions:
|
|
|
|
|
|
|
|
|
|
|
|
|
|
|
|
|
|
|
|
|
|
|
|
|
December 31, 2023 |
|
December 31, 2022 |
|
Aggregate Principal Committed |
Outstanding Principal |
Unused Portion |
|
Aggregate Principal Committed |
Outstanding Principal |
Unused Portion |
CIBC Subscription Facility(1) |
$ |
— |
|
$ |
— |
|
$ |
— |
|
|
$ |
— |
|
$ |
— |
|
$ |
— |
|
| BNP Funding Facility |
600,000 |
|
282,000 |
|
318,000 |
|
|
600,000 |
|
400,000 |
|
200,000 |
|
Truist Credit Facility(2)(3) |
1,120,000 |
|
520,263 |
|
599,484 |
|
|
975,000 |
|
432,254 |
|
538,521 |
|
2027 Notes(4) |
425,000 |
|
425,000 |
|
— |
|
|
425,000 |
|
425,000 |
|
— |
|
2025 Notes(4) |
275,000 |
|
275,000 |
|
— |
|
|
275,000 |
|
275,000 |
|
— |
|
| Total |
$ |
2,420,000 |
|
$ |
1,502,263 |
|
$ |
917,484 |
|
|
$ |
2,275,000 |
|
$ |
1,532,254 |
|
$ |
738,521 |
|
(1)The CIBC Subscription Facility matured and was fully paid off as of December 31, 2022.
(2)As of December 31, 2023 and December 31, 2022, a letter of credit of $253 and $4,225, respectively, was outstanding, which reduced the unused availability under the Truist Credit Facility by the same amount.
(3)Under the Truist Credit Facility, the Company may borrow in U.S. dollars or certain other permitted currencies. As of December 31, 2023 and December 31, 2022, the Company had borrowings denominated in Euros (EUR) of 238 and 238, respectively.
(4)As of December 31, 2023, the carrying value of the Company’s 2027 Notes and 2025 Notes were presented on the Consolidated Statements of Assets and Liabilities net of unamortized debt issuance costs of $3,499 and $2,065, and unamortized original issuance discount of $667 and $0, respectively. As of December 31, 2022, the carrying value of the Company’s 2027 Notes and 2025 Notes were presented on the Consolidated Statements of Assets and Liabilities net of unamortized debt issuance costs of $4,622 and $3,277, and unamortized original issuance discount of $881 and $0, respectively.
The combined weighted average interest rate (excluding unused fees and financing costs) of the aggregate borrowings outstanding for the year ended December 31, 2023, December 31, 2022 and December 31, 2021 was 6.51% and 4.05%, and 2.12% respectively. The combined weighted average debt of the aggregate borrowings outstanding for the year ended December 31, 2023, December 31, 2022 and December 31, 2021 was $1,576,285 and $1,432,492, and $796,272 respectively.
As of December 31, 2023 and December 31, 2022, the Company was in compliance with all covenants and other requirements of each of the credit facilities, the 2027 Notes and the 2025 Notes.
CIBC Subscription Facility
On December 31, 2019, the Company entered into a revolving credit agreement (as amended, restated or otherwise modified from time to time, the "CIBC Subscription Facility") with CIBC Bank USA as administrative agent and arranger. The CIBC Subscription Facility allowed the Company to borrow up to the maximum revolving commitment at any one time outstanding, subject to certain restrictions, including availability under the borrowing base, which is based on unused Capital Commitments. The CIBC Subscription Facility bore interest at a rate at the Company’s election of either (i) the per annum one or three-month LIBOR, divided by a number determined by subtracting from 1.00 the then stated maximum reserve percentage for determining reserves to be maintained by member banks of the Federal Reserve System for Eurocurrency funding or liabilities, plus 1.65% or (ii) the prime rate plus 0.65%, as calculated under the CIBC Subscription Facility. The CIBC Subscription Facility was secured by the unfunded commitments of certain stockholders of the Company. The CIBC Subscription Facility matured and was fully paid off as of December 31, 2022.
The summary information of the CIBC Subscription Facility is as follows:
|
|
|
|
|
|
|
|
|
|
|
|
|
|
|
|
|
|
|
|
|
|
|
For the Year Ended |
|
|
December 31, 2023 |
|
December 31, 2022 |
|
December 31, 2021 |
| Borrowing interest expense |
|
$ |
— |
|
|
$ |
8,312 |
|
|
$ |
6,379 |
|
| Facility unused commitment fees |
|
— |
|
|
26 |
|
|
92 |
|
| Amortization of deferred financing costs |
|
— |
|
|
1,347 |
|
|
1,375 |
|
| Total |
|
$ |
— |
|
|
$ |
9,685 |
|
|
$ |
7,846 |
|
| Weighted average interest rate |
|
— |
% |
|
3.13 |
% |
|
1.77 |
% |
| Weighted average outstanding balance |
|
$ |
— |
|
|
$ |
262,184 |
|
|
$ |
354,810 |
|
BNP Funding Facility
On October 14, 2020, DLF LLC entered into a Revolving Credit and Security Agreement (as amended, restated or otherwise modified from time to time, the “Credit and Security Agreement”) with DLF LLC, as the borrower, BNP Paribas (“BNP”), as the administrative agent and lender, the Company, as the equity holder and as the servicer, and U.S. Bank National Association, as collateral agent to (as amended, the “BNP Funding Facility”). As of December 31, 2023, the borrowing capacity under the BNP Funding Facility was $600,000.
The applicable margin on borrowings during the reinvestment period is 2.85% and, after the reinvestment period 3.35%. The obligations of DLF LLC under the BNP Funding Facility are secured by the assets held by DLF LLC. The BNP Funding Facility has a maturity date of September 22, 2028.
The summary information of the BNP Funding Facility is as follows:
|
|
|
|
|
|
|
|
|
|
|
|
|
|
|
|
|
|
|
|
|
|
|
For the Year Ended |
|
|
December 31, 2023 |
|
December 31, 2022 |
|
December 31, 2021 |
| Borrowing interest expense |
|
$ |
27,086 |
|
|
$ |
15,376 |
|
|
$ |
8,559 |
|
| Facility unused commitment fees |
|
771 |
|
|
507 |
|
|
69 |
|
| Amortization of deferred financing costs |
|
1,257 |
|
|
1,145 |
|
|
1,073 |
|
| Total |
|
$ |
29,114 |
|
|
$ |
17,028 |
|
|
$ |
9,701 |
|
| Weighted average interest rate |
|
7.51 |
% |
|
3.90 |
% |
|
2.48 |
% |
| Weighted average outstanding balance |
|
$ |
355,507 |
|
|
$ |
389,216 |
|
|
$ |
340,437 |
|
Truist Credit Facility
On July 16, 2021, the Company entered into a Senior Secured Revolving Credit Agreement with Truist Bank (as amended, restated or otherwise modified from time to time, the “Truist Credit Facility). The maximum principal amount of the Truist Credit Facility is $1,120,000, subject to availability under the borrowing base. The Truist Credit Facility includes an uncommitted accordion feature that, as of December 31, 2023, allows the Company, under certain circumstances, to increase the borrowing capacity to up to $1,500,000. As of December 31, 2023, the availability period of the Truist Credit Facility will terminate on January 29, 2027. The Truist Credit Facility is guaranteed by certain domestic subsidiaries of the Company (the “Guarantors”). The Company’s obligations to the lenders under the Truist Credit Facility are secured by a first priority security interest in substantially all of the assets of the Company and each Guarantor, subject to certain exceptions.
The Company may borrow amounts in U.S. dollars or certain other permitted currencies. Borrowings under the Truist Credit Facility bear interest at a per annum rate equal to, (x) for loans for which the Company elects the base rate option, the “alternate base rate” (which is the highest of (a) the prime rate as publicly announced by Truist Bank, (b) the sum of (i) the weighted average of the rates on overnight federal funds transactions, as published by the Federal Reserve Bank of New York plus (ii) 0.5%, and (c) one month Term SOFR (as defined in the Truist Credit Facility) plus 1% per annum) plus and (y) for loans for which the Company elects the term benchmark option, Term SOFR, for borrowings denominated in U.S. dollars, or the applicable term benchmark rate for borrowings denominated in certain foreign currencies, in each case for the related interest period for such borrowing plus 1.875% per annum or such other applicable margin as is applicable to such foreign currency borrowings. The Company pays an unused fee of 0.375% per annum on the daily unused amount of the revolver commitments. The Company pays letter of credit participation fees and a fronting fee on the average daily amount of any letter of credit issued and outstanding under the Truist Credit Facility, as applicable. The Truist Credit Facility has a maturity date of January 31, 2028.
The summary information of the Truist Credit Facility is as follows:
|
|
|
|
|
|
|
|
|
|
|
|
|
|
|
|
|
|
|
|
|
|
|
For the Year Ended |
|
|
December 31, 2023 |
|
December 31, 2022 |
|
From July 16, 2021 to
December 31, 2021 |
| Borrowing interest expense |
|
$ |
37,055 |
|
|
$ |
11,959 |
|
|
$ |
2,145 |
|
| Facility unused commitment fees |
|
2,287 |
|
|
2,487 |
|
|
858 |
|
| Amortization of deferred financing costs |
|
1,992 |
|
|
1,243 |
|
|
465 |
|
| Total |
|
$ |
41,334 |
|
|
$ |
15,689 |
|
|
$ |
3,468 |
|
| Weighted average interest rate |
|
7.02 |
% |
|
3.68 |
% |
|
2.09 |
% |
| Weighted average outstanding balance |
|
$ |
520,778 |
|
|
$ |
320,955 |
|
|
$ |
218,189 |
|
Unsecured Notes
2027 Notes
On February 11, 2022, the Company issued $425,000 in aggregate principal amount of 4.50% notes due 2027 (the restricted securities initially issued on February 11, 2022 together with the unrestricted securities issued pursuant to the exchange offer described below, the “2027 Notes”). The 2027 Notes will mature on February 11, 2027 and may be redeemed in whole or in part at the Company’s option at any time or from time to time at the redemption prices set forth in the indenture governing the 2027 Notes. The 2027 Notes are general unsecured obligations of the Company that rank senior in right of payment to all of the Company’s existing and future indebtedness that is expressly subordinated in right of payment to the 2027 Notes, rank pari passu with all existing and future unsecured unsubordinated indebtedness issued by the Company, rank effectively junior to any of the Company’s secured indebtedness (including unsecured indebtedness that the Company later secures) to the extent of the value of the assets securing such indebtedness, and rank structurally junior to all existing and future indebtedness (including trade payables) incurred by the Company’s subsidiaries, financing vehicles or similar facilities.
Pursuant to a Registration Statement on Form N-14 (File No. 333-264774), filed on July 20, 2022, the Company closed an exchange offer in which holders of the 2027 Notes that were restricted because they were issued in a private placement were offered the opportunity to exchange such notes for new, registered notes with substantially identical terms. Through this exchange offer, holders representing 85.87% of the outstanding principal of the then restricted 2027 Notes obtained registered unrestricted 2027 Notes.
The summary information of 2027 Notes is as follows:
|
|
|
|
|
|
|
|
|
|
|
|
|
|
|
|
|
For the Year Ended |
|
|
December 31, 2023 |
|
December 31, 2022 |
| Borrowing interest expense |
|
$ |
19,125 |
|
|
$ |
17,000 |
|
| Accretion of original issuance discount |
|
214 |
|
|
190 |
|
| Amortization of debt issuance costs |
|
1,122 |
|
|
996 |
|
| Total |
|
$ |
20,461 |
|
|
$ |
18,186 |
|
| Stated interest rate |
|
4.50 |
% |
|
4.50 |
% |
2025 Notes
On September 13, 2022, the Company entered into a Master Note Purchase Agreement (the “Note Purchase Agreement”) governing the issuance of $275,000 in aggregate principal amount of Series A Senior Notes due September 13, 2025 (the “2025 Notes”) to certain qualified institutional investors in a private placement. The 2025 Notes were delivered and paid for on September 13, 2022, subject to certain customary closing conditions. The 2025 Notes have a fixed interest rate of 7.55% per year. The 2025 Notes will mature on September 13, 2025 unless redeemed, purchased or prepaid prior to such date by the Company in accordance with the terms of the Note Purchase Agreement. Interest on the 2025 Notes is due semiannually in February and August of each year. Subject to the terms of the Note Purchase Agreement, the Company may redeem the 2025 Notes in whole or in part at any time or from time to time at the Company’s option at par plus accrued interest to the prepayment date and, if redeemed on or before June 13, 2025, a make-whole premium. The Company’s obligations under the Note Purchase Agreement are general unsecured obligations that rank pari passu with all outstanding and future unsecured unsubordinated indebtedness issued by the Company.
The summary information of 2025 Notes is as follows:
|
|
|
|
|
|
|
|
|
|
|
|
|
|
|
|
|
For the Year Ended |
|
|
December 31, 2023 |
|
December 31, 2022 |
| Borrowing interest expense |
|
$ |
20,762 |
|
|
$ |
6,229 |
|
|
|
|
|
|
| Amortization of debt issuance costs |
|
1,212 |
|
|
365 |
|
| Total |
|
$ |
21,974 |
|
|
$ |
6,594 |
|
| Stated interest rate |
|
7.55 |
% |
|
7.55 |
% |
(7) COMMITMENTS AND CONTINGENCIES
In the normal course of business, the Company may enter into contracts that provide a variety of general indemnifications. Any exposure to the Company under these arrangements could involve future claims that may be made against the Company. Currently, no such claims exist or are expected to arise and, accordingly, the Company has not accrued any liability in connection with such indemnifications.
The Company’s investment portfolio contains debt investments which are in the form of lines of credit or delayed draw commitments, which require us to provide funding when requested by portfolio companies in accordance with underlying loan agreements. As of December 31, 2023 and December 31, 2022, the Company had $294,950 and $314,251 of unfunded commitments to fund delayed draw and revolving senior secured loans, respectively.
(8) NET ASSETS
The following table shows the components of total distributable earnings (loss) as shown on the Consolidated Statements of Assets and Liabilities:
|
|
|
|
|
|
|
|
|
|
|
|
|
|
|
|
|
|
|
|
|
|
|
As of |
|
|
December 31, 2023 |
|
December 31, 2022 |
|
December 31, 2021 |
| Total distributable earnings (loss), beginning of period |
|
$ |
(54,779) |
|
|
$ |
15,782 |
|
|
$ |
4,702 |
|
| Net investment income/(loss) after taxes |
|
198,061 |
|
|
128,010 |
|
|
72,929 |
|
| Accumulated net realized gain (loss) |
|
118 |
|
|
537 |
|
|
1,895 |
|
| Net unrealized appreciation (depreciation) |
|
32,835 |
|
|
(80,005) |
|
|
8,431 |
|
| Dividends declared |
|
(169,291) |
|
|
(119,437) |
|
|
(72,315) |
|
| Tax reclassification of stockholders’ equity |
|
1,515 |
|
|
334 |
|
|
140 |
|
| Total distributable earnings (loss), end of period |
|
$ |
8,459 |
|
|
$ |
(54,779) |
|
|
$ |
15,782 |
|
The following table summarizes the total shares issued and proceeds received from the Company’s capital drawdowns delivered pursuant to the Subscription Agreements for the year ended December 31, 2023:
|
|
|
|
|
|
|
|
|
|
|
|
|
|
|
| Share Issuance Date |
|
Shares Issued |
|
Amount |
| October 04, 2023 |
|
10,680,808 |
|
|
$ |
220,238 |
|
| Total |
|
10,680,808 |
|
|
$ |
220,238 |
|
Following the above capital call, the Company did not have any remaining undrawn capital commitments.
The following table summarizes the total shares issued and proceeds received from the Company’s capital drawdowns delivered pursuant to the Subscription Agreements for the year ended December 31, 2022:
|
|
|
|
|
|
|
|
|
|
|
|
|
|
|
| Share Issuance Date |
|
Shares Issued |
|
Amount |
| May 16, 2022 |
|
3,548,132 |
|
|
$ |
74,866 |
|
| July 28, 2022 |
|
3,903,231 |
|
|
79,821 |
|
| December 23, 2022 |
|
4,775,721 |
|
|
94,604 |
|
| Total |
|
12,227,084 |
|
|
$ |
249,291 |
|
The following table summarizes the Company’s distributions declared and payable for the year ended December 31, 2023:
|
|
|
|
|
|
|
|
|
|
|
|
|
|
|
|
|
|
|
|
|
|
|
|
|
|
|
|
|
|
|
|
| Date Declared |
|
Record Date |
|
Payment Date |
|
Per Share Amount |
|
|
|
Total Amount |
|
| March 28, 2023 |
|
March 28, 2023 |
|
April 25, 2023 |
|
$ |
0.50 |
|
|
|
|
$ |
35,377 |
|
|
| June 27, 2023 |
|
June 27, 2023 |
|
July 25, 2023 |
|
0.57 |
|
|
|
|
40,735 |
|
(1) |
| September 26, 2023 |
|
September 26, 2023 |
|
October 25, 2023 |
|
0.60 |
|
|
|
|
43,211 |
|
(2) |
|
|
|
|
|
|
|
|
|
|
|
|
| December 28, 2023 |
|
December 28, 2023 |
|
January 25, 2024 |
|
0.60 |
|
|
|
|
49,968 |
|
(3) |
| Total Distributions |
|
|
|
|
|
$ |
2.27 |
|
|
|
|
$ |
169,291 |
|
|
(1) Includes a supplemental distribution of $0.07.
(2) Includes a supplemental distribution of $0.10.
(3) Includes a special distribution of $0.10.
The following table summarizes the Company’s distributions declared and payable for the year ended December 31, 2022:
|
|
|
|
|
|
|
|
|
|
|
|
|
|
|
|
|
|
|
|
|
|
|
|
|
|
|
|
|
| Date Declared |
|
Record Date |
|
Payment Date |
|
Per Share Amount |
|
|
|
Total Amount |
| March 25, 2022 |
|
March 25, 2022 |
|
April 27, 2022 |
|
$ |
0.48 |
|
|
|
|
$ |
27,455 |
|
| June 24, 2022 |
|
June 24, 2022 |
|
July 27, 2022 |
|
0.47 |
|
|
|
|
28,601 |
|
| September 26, 2022 |
|
September 28, 2022 |
|
October 19, 2022 |
|
0.47 |
|
|
|
|
30,611 |
|
| December 20, 2022 |
|
December 20, 2022 |
|
January 25, 2023 |
|
0.50 |
|
|
|
|
32,770 |
|
| Total Distributions |
|
|
|
|
|
$ |
1.92 |
|
|
|
|
$ |
119,437 |
|
Prior to January 26, 2024, the Company had an “opt in” dividend reinvestment plan, or the DRIP. As a result, the Company’s stockholders who elected to “opt in” to the DRIP had their cash dividends or distributions automatically reinvested in additional shares of Common Stock, rather than receiving cash. The Company adopted an “opt out” DRIP on January 26, 2024. As a result, the Company’s stockholders who have not “opted out” of the DRIP will have their cash dividends or distributions automatically reinvested in additional shares of Common Stock, rather than receiving cash.
Stockholders who receive distributions in the form of shares of Common Stock will generally be subject to the same U.S. federal, state and local tax consequences as if they received cash distributions; however, those stockholders will not receive cash with which to pay any applicable taxes.
The following table summarizes the DRIP(1) shares issued to stockholders who have “opted in” to the DRIP for the year ended December 31, 2023 and the value of such shares as of the payment dates:
|
|
|
|
|
|
|
|
|
|
|
|
|
|
|
| Payment Date |
|
DRIP Shares Issued |
|
DRIP Shares Value |
| January 25, 2023 |
|
445,235 |
|
|
$ |
8,891 |
|
| April 25, 2023 |
|
482,721 |
|
|
9,698 |
|
| July 25, 2023 |
|
554,001 |
|
|
11,274 |
|
| October 25, 2023 |
|
579,388 |
|
|
12,022 |
|
|
|
|
|
|
| Total |
|
2,061,345 |
|
|
$ |
41,885 |
|
(1)During the fiscal year ended December 31, 2023 the Company had an “opt in” DRIP in effect, pursuant to which stockholders who had elected to “opt in” to the DRIP had their cash dividends or distributions automatically reinvested in additional shares of Common Stock, rather than receiving cash.
The following table summarizes the DRIP(1) shares issued to stockholders who have “opted in” to the DRIP for the year ended December 31, 2022 and the value of such shares as of the payment dates:
|
|
|
|
|
|
|
|
|
|
|
|
|
|
|
| Payment Date |
|
DRIP Shares Issued |
|
DRIP Shares Value |
| January 25, 2022 |
|
358,891 |
|
|
$ |
7,540 |
|
| April 27, 2022 |
|
332,212 |
|
|
6,964 |
|
| July 27, 2022 |
|
372,338 |
|
|
7,614 |
|
| October 19, 2022 |
|
408,126 |
|
|
8,204 |
|
| Total |
|
1,471,567 |
|
|
$ |
30,322 |
|
(1)During the fiscal year ended December 31, 2022, the Company had an “opt in” DRIP in effect, pursuant to which stockholders who had elected to “opt in” to the DRIP had their cash dividends or distributions automatically reinvested in additional shares of Common Stock, rather than receiving cash.
(9) EARNINGS (LOSS) PER SHARE
The following table sets forth the computation of basic and diluted earnings per share:
|
|
|
|
|
|
|
|
|
|
|
|
|
|
|
|
|
|
|
|
|
|
|
For the Year Ended |
|
|
December 31, 2023 |
|
December 31, 2022 |
|
December 31, 2021 |
| Numerator—net increase/(decrease) in net assets resulting from operations |
|
$ |
231,014 |
|
|
$ |
48,542 |
|
|
$ |
83,255 |
|
| Denominator—weighted average shares outstanding |
|
74,239,743 |
|
|
61,676,363 |
|
|
31,159,302 |
|
| Basic and diluted earnings (loss) per share |
|
$ |
3.11 |
|
|
$ |
0.79 |
|
|
$ |
2.67 |
|
(10) INCOME TAXES
For income tax purposes, distributions made to the Company’s stockholders are reported as ordinary income, capital gains, or a combination thereof. The tax character of distributions made were as follows:
|
|
|
|
|
|
|
|
|
|
|
|
|
|
|
|
|
|
|
|
|
|
|
For the Year Ended |
|
|
December 31, 2023 |
|
December 31, 2022 |
|
December 31, 2021 |
| Distributions paid from: |
|
|
|
|
|
|
| Ordinary income (including net short-term capital gains) |
|
$ |
168,975 |
|
|
$ |
119,433 |
|
|
$ |
72,315 |
|
| Net long-term capital gains |
|
316 |
|
|
4 |
|
|
— |
|
| Total taxable distributions |
|
$ |
169,291 |
|
|
$ |
119,437 |
|
|
$ |
72,315 |
|
Taxable income generally differs from net increase in net assets resulting from operations for financial reporting purposes due to temporary and permanent differences in the recognition of income and expenses, and generally excludes net unrealized gains or losses, and incentive fee accrual associated with any unrealized gains, as unrealized gains or losses are generally not included in taxable income until they are realized.
For the year ended December 31, 2023, the Company estimated U.S. federal taxable income exceeded its distributions made from such taxable income during the year; consequently, the Company has elected to carry forward the excess for distribution to stockholders in 2023. The amount carried forward to 2024 is estimated to be approximately $41,893, of which $41,775 is expected to be ordinary income and $118 is expected to be capital gains, although these amounts will not be finalized until the 2023 tax returns are filed in 2024.
The Company makes certain adjustments to the classification of net assets as a result of permanent book-to-tax differences, which include differences in the book-to-tax treatment of net operating losses, dividend re-designations and timing of the deductibility of certain business expenses, as applicable. To the extent these differences are permanent, they are charged or credited to additional paid-in capital, undistributed net investment income or undistributed net realized gains on investments, as appropriate.
The book-to-tax differences relating to distributions made to the Company’s stockholders resulted in reclassifications among certain capital accounts as follows:
|
|
|
|
|
|
|
|
|
|
|
|
|
|
|
|
|
|
|
|
|
|
|
As of |
|
|
December 31, 2023 |
|
December 31, 2022 |
|
December 31, 2021 |
| Paid-in capital in excess of par value |
|
$ |
(1,515) |
|
|
$ |
(334) |
|
|
$ |
(140) |
|
| Total distributable earnings (loss) |
|
1,515 |
|
|
334 |
|
|
140 |
|
The cost and unrealized gain (loss) on the Company’s consolidated financial instruments, as calculated on a tax basis, were as follows (amounts calculated using book-to-tax differences as of the most recent fiscal year ended December 31, 2023, December 31, 2022 and December 31, 2021):
|
|
|
|
|
|
|
|
|
|
|
|
|
|
|
|
|
|
|
|
|
|
|
As of |
|
|
December 31, 2023 |
|
December 31, 2022 |
|
December 31, 2021 |
| Gross unrealized appreciation |
|
$ |
19,066 |
|
|
$ |
6,529 |
|
|
$ |
18,635 |
|
| Gross unrealized depreciation |
|
(52,242) |
|
|
(72,587) |
|
|
(4,696) |
|
| Net unrealized appreciation (depreciation) |
|
$ |
(33,176) |
|
|
$ |
(66,058) |
|
|
$ |
13,939 |
|
| Tax cost of investments at year end |
|
$ |
3,226,720 |
|
|
$ |
2,939,635 |
|
|
$ |
2,373,435 |
|
(11) CONSOLIDATED FINANCIAL HIGHLIGHTS
The following are the financial highlights (dollar amounts in thousands, except per share amounts):
|
|
|
|
|
|
|
|
|
|
|
|
|
|
|
|
|
|
|
|
|
|
|
|
|
|
|
|
|
For the Year Ended |
|
|
December 31, 2023 |
|
December 31, 2022 |
|
December 31, 2021 |
|
December 31, 2020 |
Per Share Data(1): |
|
|
|
|
|
|
|
|
| Net asset value, beginning of period |
|
$ |
19.81 |
|
|
$ |
20.91 |
|
|
$ |
20.08 |
|
|
$ |
20.00 |
|
Net investment income (loss) |
|
2.67 |
|
|
2.08 |
|
|
2.34 |
|
|
1.41 |
|
Net unrealized and realized gain (loss)(2) |
|
0.46 |
|
|
(1.26) |
|
|
0.52 |
|
|
(0.28) |
|
| Net increase (decrease) in net assets resulting from operations |
|
3.13 |
|
|
0.82 |
|
|
2.86 |
|
|
1.13 |
|
| Dividends declared |
|
(2.27) |
|
|
(1.92) |
|
|
(2.07) |
|
|
(1.30) |
|
| Issuance of common stock |
|
— |
|
|
— |
|
|
0.04 |
|
|
0.25 |
|
| Total increase (decrease) in net assets |
|
0.86 |
|
|
(1.10) |
|
|
0.83 |
|
|
0.08 |
|
| Net asset value, end of period |
|
$ |
20.67 |
|
|
$ |
19.81 |
|
|
$ |
20.91 |
|
|
$ |
20.08 |
|
| Shares outstanding, end of period |
|
83,278,831 |
|
|
70,536,678 |
|
|
56,838,027 |
|
|
15,024,425 |
|
| Weighted average shares outstanding |
|
74,239,743 |
|
|
61,676,363 |
|
31,159,302 |
|
7,559,426 |
Total return based on net asset value(3) |
|
16.40 |
% |
|
3.99 |
% |
|
14.83 |
% |
|
7.07 |
% |
| Ratio/Supplemental Data (all amounts in thousands except ratios): |
|
|
|
|
|
|
|
|
| Net assets, end of period |
|
$ |
1,721,151 |
|
|
$ |
1,397,305 |
|
$ |
1,188,587 |
|
$ |
301,620 |
Ratio of net expenses to average net assets(4) |
|
11.14 |
% |
|
7.99 |
% |
|
6.77 |
% |
|
7.02 |
% |
Ratio of expenses before waivers to average net assets(4) |
|
12.65 |
% |
|
9.55 |
% |
|
8.26 |
% |
|
8.20 |
% |
Ratio of net investment income to average net assets(4) |
|
13.01 |
% |
|
9.97 |
% |
|
10.55 |
% |
|
6.62 |
% |
|
|
|
|
|
|
|
|
|
| Ratio of total contributed capital to total committed capital, end of period |
|
100.00 |
% |
|
86.48 |
% |
|
88.87 |
% |
|
20.57 |
% |
| Asset coverage ratio |
|
214.57 |
% |
|
191.19 |
% |
|
195.10 |
% |
|
190.35 |
% |
| Portfolio turnover rate |
|
11.98 |
% |
|
14.87 |
% |
|
27.18 |
% |
|
31.11 |
% |
(1)The per share data was derived by using the weighted average shares outstanding during the period.
(2)For the year ended December 31, 2023 , December 31, 2022 and December 31, 2021, the amount shown may not correspond for the period as it includes the effect of the timing of the distribution and the issuance of common stock.
(3)Total return (not annualized) is calculated assuming a purchase of Common Stock at the opening of the first day of the period and a sale on the closing of the last business day of the period. Dividends and distributions, if any, are assumed for purposes of this calculation, to be reinvested at prices obtained under the Company’s DRIP.
(4)Amounts are annualized except for incentive fees, and expense support amounts relating to organization and offering costs.
(12) SUBSEQUENT EVENTS
Subsequent events have been evaluated through the date the consolidated financial statements were issued. There have been no subsequent events that require recognition or disclosure through the date the consolidated financial statements were issued, except as disclosed below.
IPO
On January 26, 2024, the Company closed its IPO, issuing 5,000,000 shares of its Common Stock at a public offering price of $20.67 per share. Net of underwriting fees, the Company received net cash proceeds, before offering expenses, of approximately $97.1 million. The Company’s Common Stock began trading on the NYSE under the symbol “MSDL” on January 24, 2024.
Amended and Restated Investment Advisory Agreement
On January 24, 2024, the Company entered into the Amended and Restated Investment Advisory Agreement. The Amended and Restated Investment Advisory Agreement incorporates (i) a cumulative three-year lookback provision and (ii) a cap on quarterly income incentive fee payments based on net realized capital loss, if any, during the applicable three-year lookback period. From January 24, 2024 to January 24, 2025 the Adviser has also agreed to waive any portion of the Base Management Fee in excess of 0.75% and each component of the incentive fee above 15%.
Otherwise, no material changes were made to the Original Investment Advisory Agreement.
Dividend Declarations
On January 11, 2024, the Board of Directors declared the following special distributions:
|
|
|
|
|
|
|
|
|
| Record Date |
|
Special Distribution Amount (per Share) |
| 195 days after the date of the final prospectus relating to the Company’s IPO |
|
$ |
0.10 |
|
| 285 days after the date of the final prospectus relating to the Company’s IPO |
|
$ |
0.10 |
|
The payable date of each of the above distributions shall be on or about 25 days after the end of the calendar quarter in which the record date occurred, or if such date is not a business day, the preceding business day. Shares of Common Stock sold pursuant to the prospectus relating to the Company's IPO will be entitled to receive these distributions.
On February 29, 2024, the Board of Directors declared a regular distribution to stockholders in the amount of $0.50 per share. The distributions will be payable on or around April 25, 2024 to stockholders of record as of March 29, 2024.
Share Repurchase Plan
On January 25, 2024, the Company entered into a share repurchase plan, or the Company 10b5-1 Plan, to acquire up to $100 million in the aggregate of the Company’s Common Stock at prices below the Company’s net asset value per share over a specified period, in accordance with the guidelines specified in Rule 10b5-1 and Rule 10b-18 of the Securities Exchange Act of 1934, as amended. The Company 10b5-1 Plan was approved by the Board of Directors on September 11, 2023. The Company 10b5-1 Plan requires Wells Fargo Securities, LLC, as the Company’s agent, to repurchase Common Stock on its behalf when the market price per share is below the most recently reported net asset value per share (including any updates, corrections or adjustments publicly announced by the Company to any previously announced net asset value per share, including any distributions declared). Under the Company 10b5-1 Plan, the volume of purchases would be expected to increase as the price of the Company’s Common Stock declines, subject to volume restrictions. The timing and amount of any share repurchases will depend on the terms and conditions of the Company 10b5-1 Plan, the market price of the Company’s Common Stock and trading volumes, and no assurance can be given that Common Stock will be repurchased in any particular amount or at all. The repurchase of shares pursuant to the Company 10b5-1 Plan is intended to satisfy the conditions of Rule 10b5-1 and Rule 10b-18 under the Exchange Act, and will otherwise be subject to applicable law, including Regulation M, which may prohibit repurchases under certain circumstances. The Company 10b5-1 Plan will commence beginning 60 calendar days following the end of the “restricted period” under Regulation M and will terminate upon the earliest to occur of (i) 12-months from the commencement date of the Company 10b5-1 Plan , (ii) the end of the trading day on which the aggregate purchase price for all shares purchased under the Company 10b5-1 Plan equals $100 million and (iii) the occurrence of certain other events described in the Company 10b5-1 Plan.
The “restricted period” under Regulation M ended upon the closing of the Company's IPO and, therefore, the Common Stock repurchases/purchases described above will begin 60 days after the closing of the IPO, or March 26, 2024.
Dividend Reinvestment Plan
Effective January 26, 2024, the Company has adopted an “opt out” DRIP that provides for reinvestment of dividends and other distributions on behalf of stockholders, unless a stockholder elects to receive cash. As a result, if the Board of Directors authorizes, and the Company declares, a cash dividend or other distribution, then the stockholders who have not “opted out” of the DRIP will have their cash dividends or distributions automatically reinvested in additional shares of Common Stock, rather than receiving cash.
Item 9. Changes and Disagreements with Accountants on Accounting and Financial Disclosure
None.
Item 9A. Controls and Procedures.
Evaluation of Disclosure Controls and Procedures
As of December 31, 2023 (the end of the period covered by this report), we carried out an evaluation, under the supervision and with the participation of our management, including our Chief Executive Officer (Principal Executive Officer) and our Chief Financial Officer (Principal Financial Officer), of the effectiveness of the design and operation of our disclosure controls and procedures (as defined in Rule 13a-15 of the Securities Exchange Act of 1934, as amended (the “Exchange Act”)). Based on that evaluation, our Chief Executive Officer and our Chief Financial Officer have concluded that our current disclosure controls and procedures are effective in timely alerting them of material information relating to the Company that is required to be disclosed by us in the reports we file or submit under the Exchange Act.
Management’s Report on Internal Control Over Financial Reporting
Our management is responsible for establishing and maintaining adequate internal control over financial reporting (as defined in Rules 13a-15(f) and 15d-15(f) of the Exchange Act). The Company’s internal control over financial reporting is a process designed under the supervision of its Chief Executive Officer (Principal Executive Officer) and Chief Financial Officer (Principal Financial Officer) and effected by the Board of Directors, management and other personnel, to provide reasonable assurance regarding the reliability of financial reporting and the preparation of its consolidated financial statements for external reporting purposes in accordance with GAAP.
The Company’s internal control over financial reporting includes policies and procedures that pertain to the maintenance of records that, in reasonable detail, accurately and fairly reflect transactions and dispositions of the Company’s assets; provide reasonable assurance that transactions are recorded as necessary to permit preparation of the consolidated financial statements in accordance with GAAP, and that receipts and expenditures of the Company are being made only in accordance with authorizations of management and the directors; and provide reasonable assurance regarding prevention or timely detection of unauthorized acquisition, use or disposition of the Company’s assets that could have a material effect on its consolidated financial statements.
Because of its inherent limitations, internal control over financial reporting may not prevent or detect misstatements. In addition, projections of any evaluation of effectiveness to future periods are subject to the risk that controls may become inadequate because of changes in conditions, or that the degree of compliance with the policies or procedures may deteriorate.
Management conducted an evaluation of the effectiveness of the Company’s internal control over financial reporting as of December 31, 2023 based on the framework established in Internal Control—Integrated Framework (2013) issued by the Committee of Sponsoring Organizations of the Treadway Commission. Based on this assessment, management concluded that the Company’s internal control over financial reporting as of December 31, 2023 was effective.
Attestation Report of the Registered Public Accounting Firm
The independent registered public accounting firm that audited our consolidated financial statements has not issued an audit report on the effectiveness of our internal control over financial reporting, due to exemptions for non-accelerated filers under the Sarbanes-Oxley Act of 2002, as amended, and for emerging growth companies under the Jumpstart Our Business Startups Act of 2012, as amended.
Changes in Internal Controls Over Financial Reporting
There have been no changes in our internal control over financial reporting that occurred for the quarter ended December 31, 2023 that have materially affected, or are reasonably likely to materially affect, our internal control over financial reporting.
Item 9B. Other Information
Rule 10b5-1 Trading Plans
During the fiscal quarter ended December 31, 2023, none of our directors or executive officers adopted or terminated any contract, instruction or written plan for the purchase or sale of our securities to satisfy the affirmative defense conditions of Rule 10b5-1(c) or any “non-Rule 10b5-1 trading arrangement.”
Item 9C. Disclosure Regarding Foreign Jurisdictions that Prevent Inspections
Not applicable.
PART III.
Item 10. Directors, Executive Officers and Corporate Governance
Information in response to this item is incorporated by reference from our Proxy Statement relating to our 2024 annual meeting of stockholders. The Proxy Statement will be filed with the SEC within 120 days after the end of the fiscal year covered by this Form 10-K pursuant to Regulation 14A under the Exchange Act.
Information relating to our and the Adviser’s codes of ethics, which apply to, among others, our Chief Executive Officer and Chief Financial Officer, is included in “Part I, Item 1. Business-Regulation-Code of Ethics” of this Form 10-K.
Item 11. Executive Compensation
Information in response to this item is incorporated by reference from our Proxy Statement relating to our 2024 annual meeting of stockholders.
Item 12. Security Ownership of Certain Beneficial Owners and Management and Related Stockholder Matters
Information in response to this item is incorporated by reference from our Proxy Statement relating to our 2024 annual meeting of stockholders.
Item 13. Certain Relationships and Related Transactions, and Director Independence
Information in response to this item is incorporated by reference from our Proxy Statement relating to our 2024 annual meeting of stockholders.
Item 14. Principal Accountant Fees and Services
Information in response to this item is incorporated by reference from our Proxy Statement relating to our 2024 annual meeting of stockholders.
PART IV
Item 15. Exhibits
(a) Documents filed as part of this report
The following documents are filed as part of this annual report:
(1) Financial Statements – Financial statements are included in Item 8. See the Index to the consolidated financial statements on page 82 of this annual report on Form 10-K.
(2) Financial Statement Schedules – None. We have omitted financial statement schedules because they are not required or are not applicable, or the required information is shown in the consolidated statements or notes to the consolidated financial statements.
(3) Exhibits – The following is a list of all exhibits filed as a part of this annual report on Form 10-K, including those incorporated by reference. Please note that the agreements included as exhibits to this Form 10-K are included to provide information regarding their terms and are not intended to provide any other factual or disclosure information about us or the other parties to the agreements. The agreements contain representations and warranties by each of the parties to the applicable agreement that have been made solely for the benefit of the other parties to the applicable agreement and may not describe the actual state of affairs as of the date they were made or at any other time.
(b) Exhibits
|
|
|
|
|
|
| Exhibit |
|
| 3.1 |
|
| 3.2 |
|
| 4.1* |
|
| 4.2 |
|
| 4.3 |
|
| 4.4 |
|
4.5 |
|
| 10.1 |
|
| 10.2 |
|
| 10.3 |
|
| 10.4 |
|
| 10.5 |
|
| 10.6 |
|
| 10.7 |
|
| 10.12 |
Revolving Credit and Security Agreement, dated as of October 14, 2020, among DLF Financing SPV LLC, as borrower, the lenders from time to time parties thereto, BNP Paribas, as administrative agent and lender, Morgan Stanley Direct Lending Fund, as equityholder and servicer, and U.S. Bank National Association, as collateral agent(5)
|
| 10.13 |
|
| 10.14 |
Amendment No. 1 to Revolving Credit and Security Agreement, dated as of December 11, 2020, among DLF Financing SPV LLC, as borrower, the lenders from time to time parties thereto, BNP Paribas, as administrative agent and lender, Morgan Stanley Direct Lending Fund, as equity holder and servicer, and U.S. Bank National Association, as collateral agent(6)
|
| 10.15 |
Amendment No. 2 to Revolving Credit and Security Agreement, dated as of March 2, 2021, among DLF Financing SPV LLC, as borrower, the lenders from time to time parties thereto, BNP Paribas, as administrative agent and lender, Morgan Stanley Direct Lending Fund, as equity holder and servicer, and U.S. Bank National Association, as collateral agent(7)
|
| 10.16 |
Senior Secured Revolving Credit Agreement, dated as of July 16, 2021, among Morgan Stanley Direct Lending Fund, as Borrower, the Lenders and Issuing Banks party thereto, Truist Bank, as Administrative Agent, and Truist Securities, Inc., as Joint Lead Arranger and Sole Book Runner(8)
|
|
|
|
|
|
|
| Exhibit |
|
| 10.17 |
Amendment No. 1 to Senior Secured Revolving Credit Agreement, dated as of December 3, 2021, among Morgan Stanley Direct Lending Fund, as Borrower, the Lenders and Issuing Banks party thereto, Truist Bank, as Administrative Agent, and Truist Securities, Inc., as Joint Lead Arranger and Sole Book Runner(12)
|
| 10.21 |
Second Amendment to Senior Secured Revolving Credit Agreement, dated as of May 20, 2022, among the Company, as Borrower, the Lenders and Issuing Banks party thereto, Truist Bank, as Administrative Agent, Truist Securities, Inc., as Joint Lead Arranger and Sole Book Runner, and ING Capital LLC, MUFG Union Bank, N.A., and Sumitomo Mitsui Banking Corporation, as additional Joint Lead Arranger(9)
|
| 10.23 |
|
| 10.25 |
|
| 10.26 |
Amendment No. 3 to Revolving Credit and Security Agreement, dated as of September 22, 2023, among DLF Financing SPV LLC, as borrower, the lenders from time to time parties thereto, BNP Paribas, as administrative agent and lender, Morgan Stanley Direct Lending Fund, as equity holder and servicer, and U.S. Bank National Association, as collateral agent(15)
|
| 14.1 |
|
| 14.2 |
|
| 21.1* |
|
| 31.1* |
|
| 31.2* |
|
| 32.1* |
|
| 32.2* |
|
| 99.7* |
|
| * |
Filed herewith |
| (1) |
Incorporated by reference to the Company’s Form 10-12G/A filed by the Company on November 19, 2019 (File No. 000-56098) |
| (2) |
Incorporated by reference to Exhibit 4.1 to the Company’s Current Report on Form 8-K, filed by the Company on February 11, 2022 (File No. 814-01332) |
| (3) |
Incorporated by reference to Exhibit 4.2 to the Company’s Current Report on Form 8-K, filed by the Company on February 11, 2022 (File No. 814-01332) |
| (4) |
Incorporated by reference to Exhibit 4.4 to the Company’s Current Report on Form 8-K, filed by the Company on February 11, 2022 (File No. 814-01332) |
| (5) |
Incorporated by reference to Exhibit 10.1 to the Company’s Current Report on Form 8-K, filed by the Company on October 20, 2020 (File No. 814-01332) |
| (6) |
Incorporated by reference to Exhibit 10.14 to the Company’s Annual Report on Form 10-K, filed by the Company on March 19, 2021 (File No. 814-01332) |
| (7) |
Incorporated by reference to Exhibit 10.15 to the Company’s Annual Report on Form 10-K, filed by the Company on March 19, 2021 (File No. 814-01332) |
| (8) |
Incorporated by reference to Exhibit 10.1 to the Company’s Current Report on Form 8-K, filed by the Company on July 22, 2021 (File No. 814-01332) |
| (9) |
Incorporated by reference to Exhibit 10.1 to the Company’s Current Report on Form 8-K, filed by the Company on May 18, 2022 (File No. 814-01332) |
| (10) |
Incorporated by reference to Exhibit 10.1 to the Company’s Current Report on Form 8-K, filed by the Company on September 14, 2022 (File No. 814-01332) |
| (11) |
Incorporated by reference to Exhibit 10.1 to the Company’s Current Report on Form 8-K, filed by the Company on February 6, 2023 (File No. 814-01332) |
| (12) |
Incorporated by reference to Exhibit 10.17 to the Company’s Annual Report on Form 10-K, filed by the Company on March 18, 2022 (File No. 814-01332) |
| (13) |
Incorporated by reference to Exhibit 3.1 to the Company’s Quarterly Report on Form 10-Q filed by the Company on May 10, 2023 (File No. 814-01332) |
|
|
|
|
|
|
| Exhibit |
|
| (14) |
Incorporated by Reference to the Company’s Post-Effective Amendment No. 1 to its Registration Statement on Form N-2 filed by the Company on January 29, 2024 (File No. 333-276056) |
| (15) |
Incorporated by reference to Exhibit 10.1 to the Company’s Current Report on Form 8-K, filed by the Company on September 28, 2023 (File No. 814-01332) |
SIGNATURES
Pursuant to the requirements of the Securities Exchange Act of 1934, the registrant has duly caused this report to be signed on its behalf by the undersigned thereunto duly authorized.
|
|
|
|
|
|
|
|
|
|
|
|
|
|
Morgan Stanley Direct Lending Fund |
Dated: March 1, 2024 |
|
By: |
/s/ Jeffrey S. Levin |
|
|
|
Jeffrey S. Levin
Director and Chief Executive Officer (principal executive officer)
|
Pursuant to the requirements of the Securities Exchange Act of 1934, this report has been signed below by the following persons on behalf of the registrant and in the capacities and on the dates indicated.
|
|
|
|
|
|
|
|
|
|
|
|
Dated: March 1, 2024 |
|
By: |
/s/ Jeffrey S. Levin |
|
|
|
Jeffrey S. Levin
Director and Chief Executive Officer (principal executive officer)
|
|
|
|
|
Dated: March 1, 2024 |
|
By: |
/s/ David Pessah |
|
|
|
David Pessah
Chief Financial Officer
(principal financial officer)
|
|
|
|
|
Dated: March 1, 2024 |
|
By: |
/s/ David Miller |
|
|
|
David Miller
Chairman of the Board of Directors
|
|
|
|
|
Dated: March 1, 2024 |
|
By: |
/s/ Joan Binstock |
|
|
|
Joan Binstock
Director
|
|
|
|
|
Dated: March 1, 2024 |
|
By: |
/s/ Bruce Frank |
|
|
|
Bruce Frank
Director
|
|
|
|
|
Dated: March 1, 2024 |
|
By: |
/s/ Kevin Shannon |
|
|
|
Kevin Shannon
Director
|
|
|
|
|
Dated: March 1, 2024 |
|
By: |
/s/ Adam Metz |
|
|
|
Adam Metz
Director |
EX-4.1
2
exhibit41descriptionofsecu.htm
EX-4.1
Document
DESCRIPTION OF SECURITIES
As of December 31, 2023, Morgan Stanley Direct Lending Fund (“we,” “our,” “us” or the “Company”) had one class of securities registered under Section 12 of the Securities Exchange Act of 1934, as amended (the “Exchange Act”): our common stock, par value $0.001 per share.
Capitalized terms used but not defined herein shall have the meaning ascribed to them in the Annual Report on Form 10-K to which this Description of Securities is attached as an exhibit.
The following description of our capital stock is based on relevant portions of the Delaware General Corporation Law (the “DGCL”) and on our certificate of incorporation and bylaws, each of which is filed as an exhibit to our Annual Report on Form 10-K of which this Exhibit 4.1 is a part. This summary is not necessarily complete, and we refer you to the DGCL and our certificate of incorporation and bylaws for a more detailed description of the provisions summarized below.
Capital Stock
Our authorized stock consists of 100,000,000 shares of Common Stock, par value $0.001 per share (the “Common Stock”), and 1,000,000 shares of preferred stock, par value $0.001 per share. Our Common Stock is traded on The New York Stock Exchange under the ticker symbol “MSDL”. There are no outstanding options or warrants to purchase shares of our Common Stock. No stock has been authorized for issuance under any equity compensation plan. Under Delaware law, our stockholders generally are not personally liable for our debts or obligations.
The following are our outstanding classes of securities as of December 31, 2023:
|
|
|
|
|
|
|
|
|
|
|
|
| Title of Class |
(2) Amount authorized |
(3) Amount held by us or for Our Account |
(4) Amount Outstanding Exclusive of Amounts shown Under (3) |
| Common Stock |
100,000,000 |
|
— |
|
88,897,708 |
|
| Preferred Stock |
1,000,000 |
|
— |
|
— |
|
All shares of our Common Stock have equal rights as to earnings, assets, dividends and other distributions and voting and, when they are issued, will be duly authorized, validly issued, fully paid and nonassessable. Distributions may be paid to the holders of our Common Stock if, as and when authorized by our Board of Directors and declared by us out of assets legally available therefor. Shares of our Common Stock have no preemptive, exchange, conversion or redemption rights and are freely transferable, except when their transfer is restricted by federal and state securities laws or by contract. In the event of our liquidation, dissolution or winding up, each share of our Common Stock would be entitled to share ratably in all of our assets that are legally available for distribution after we pay all debts and other liabilities and subject to any preferential rights of holders of our preferred stock, if any preferred stock is outstanding at such time. Each share of our Common Stock is entitled to one vote on all matters submitted to a vote of stockholders, including the election of directors. Except as provided with respect to any other class or series of stock, the holders of our Common Stock possess exclusive voting power. There is no cumulative voting in the election of directors, which means that holders of a majority of the outstanding shares of Common Stock can elect all of our directors, and holders of less than a majority of such shares are not able to elect any directors.
Provisions of the DGCL and Our Certificate of Incorporation and Bylaws
Limitation on Liability of Directors and Officers; Indemnification and Advance of Expenses
The indemnification of our officers and directors is governed by Section 145 of the DGCL, our certificate of incorporation and bylaws.
Section 145(a) of the DGCL empowers a corporation to indemnify any person who was or is a party or is threatened to be made a party to any threatened, pending or completed action, suit or proceeding, whether civil, criminal, administrative or investigative (other than an action by or in the right of the corporation) by reason of the fact that the person is or was a director, officer, employee or agent of the corporation, or is or was serving at the request of the corporation as a director, officer, employee or agent of another corporation, partnership, joint venture, trust or other enterprise, against expenses (including attorneys’ fees), judgments, fines and amounts paid in settlement actually and reasonably incurred by the person in connection with such action, suit or proceeding if (1) such person acted in good faith, (2) in a manner such person reasonably believed to be in or not opposed to the best interests of the corporation and (3) with respect to any criminal action or proceeding, such person had no reasonable cause to believe the person’s conduct was unlawful.
Section 145(b) of the DGCL empowers a corporation to indemnify any person who was or is a party or is threatened to be made a party to any threatened, pending or completed action or suit by or in the right of the corporation to procure a judgment in its favor by reason of the fact that the person is or was a director, officer, employee or agent of the corporation, or is or was serving at the request of the corporation as a director, officer, employee or agent of another corporation, partnership, joint venture, trust or other enterprise against expenses (including attorneys’ fees) actually and reasonably incurred by such person in connection with the defense or settlement of such action or suit if such person acted in good faith and in a manner the person reasonably believed to be in, or not opposed to, the best interests of the corporation, and except that no indemnification may be made in respect of any claim, issue or matter as to which such person has been adjudged to be liable to the corporation unless and only to the extent that the Delaware Court of Chancery or the court in which such action or suit was brought determines upon application that, despite the adjudication of liability but in view of all the circumstances of the case, such person is fairly and reasonably entitled to indemnity for such expenses which the Court of Chancery or such other court deems proper.
Section 145 of the DGCL further provides that to the extent that a present or former director or officer is successful, on the merits or otherwise, in the defense of any action, suit or proceeding referred to in subsections (a) and (b) of Section 145, or in defense of any claim, issue or matter therein, such person will be indemnified against expenses (including attorneys’ fees) actually and reasonably incurred by such person in connection with such action, suit or proceeding. In all cases in which indemnification is permitted
under subsections (a) and (b) of Section 145 (unless ordered by a court), it will be made by the corporation only as authorized in the specific case upon a determination that indemnification of the present or former director, officer, employee or agent is proper in the circumstances because the applicable standard of conduct has been met by the party to be indemnified. Such determination must be made, with respect to a person who is a director or officer at the time of such determination, (1) by a majority vote of the directors who are not parties to such action, suit or proceeding, even though less than a quorum, (2) by a committee of such directors designated by majority vote of such directors, even though less than a quorum, (3) if there are no such directors, or if such directors so direct, by independent legal counsel in a written opinion or (4) by the stockholders. The statute authorizes the corporation to pay expenses incurred by an officer or director in advance of the final disposition of a proceeding upon receipt of an undertaking by or on behalf of the person to whom the advance will be made, to repay the advances if it is ultimately determined that he or she was not entitled to indemnification. Section 145 of the DGCL also provides that indemnification and advancement of expenses permitted under such Section are not to be exclusive of any other rights to which those seeking indemnification or advancement of expenses may be entitled under any bylaw, agreement, vote of stockholders or disinterested directors, or otherwise. Section 145 of the DGCL also authorizes the corporation to purchase and maintain liability insurance on behalf of its directors, officers, employees and agents regardless of whether the corporation would have the statutory power to indemnify such persons against the liabilities insured.
Our certificate of incorporation provides that our directors will not be liable to us or our stockholders for monetary damages for breach of fiduciary duty as a director to the fullest extent permitted by the current DGCL or as the DGCL may be amended. Section 102(b)(7) of the DGCL provides that the personal liability of a director to a corporation or its stockholders for breach of fiduciary duty as a director may be eliminated except for liability (1) for any breach of the director’s duty of loyalty to the registrant or its stockholders, (2) for acts or omissions not in good faith or which involve intentional misconduct or a knowing violation of law, (3) under Section 174 of the DGCL, relating to unlawful payment of dividends or unlawful stock purchases or redemption of stock or (4) for any transaction from which the director derives an improper personal benefit.
Our bylaws provide for the indemnification of any person to the full extent permitted, and in the manner provided, by the current DGCL or as the DGCL may be amended. In addition, we have entered into indemnification agreements with each of our directors in order to effect the foregoing except to the extent that such indemnification would exceed the limitations on indemnification under section 17(h) of the 1940 Act.
As a BDC, we are not permitted to and will not indemnify our Adviser, any of our executive officers and directors, or any other person against liability arising from willful misfeasance, bad faith, gross negligence or reckless disregard of the duties involved in the conduct of such person’s office, or by reason of reckless disregard of obligations and duties of such person arising under contract or agreement.
Election of Directors
Our bylaws provide that the affirmative vote of a majority of the total votes cast “for” or “against” a nominee for director at a duly called meeting of stockholders at which a quorum is present is required to elect a director in an uncontested election. In a contested election, directors are elected by a plurality of the votes cast at a meeting of stockholders duly called and at which is a quorum is present. Under our bylaws, our Board of Directors may amend the bylaws to alter the vote required to elect directors.
Classified Board of Directors
Our Board of Directors is divided into three classes of directors serving staggered three-year terms, with the term of office of only one of the three classes expiring each year. At each annual meeting of stockholders, directors of the class of directors whose term expires at such meeting will be elected to hold office for a term expiring at the third succeeding annual meeting of stockholders following the meeting at which they were elected and until their successors are duly elected and qualified. A classified Board of Directors may render a change in control of us or removal of our incumbent management more difficult. We believe, however, that the longer time required to elect a majority of a classified Board of Directors helps to ensure the continuity and stability of our management and policies.
Number of Directors; Removal; Vacancies
Our certificate of incorporation and bylaws provide that the number of directors will be set only by the Board of Directors. Our bylaws provide that a majority of our entire Board of Directors may at any time increase or decrease the number of directors. However, unless our bylaws are amended, the number of directors may never be less than the minimum number required by the DGCL. Under the DGCL, unless the certificate of incorporation provides otherwise (which our certificate of incorporation does not), directors on a classified board such as our Board of Directors may be removed only for cause. Under our certificate of incorporation and bylaws, any vacancy on the Board of Directors, including a vacancy resulting from an enlargement of the Board of Directors, may be filled only by vote of a majority of the directors then in office.
The limitations on the ability of our stockholders to remove directors and fill vacancies could make it more difficult for a third-party to acquire, or discourage a third-party from seeking to acquire, control of us.
Action by Stockholders
Our certificate of incorporation provides that stockholder action can be taken only at an annual or special meeting of stockholders or by unanimous written consent in lieu of a meeting. This may have the effect of delaying consideration of a stockholder proposal until the next annual meeting.
Advance Notice Provisions for Stockholder Nominations and Stockholder Proposals
Our bylaws provide that with respect to an annual meeting of stockholders, nominations of persons for election to the Board of Directors and the proposal of business to be considered by stockholders may be made only (1) by or at the direction of the Board of Directors, (2) pursuant to our notice of meeting or (3) by a stockholder who was a stockholder of record at the time of provision of notice, at the record date and at the time of the meeting, who is entitled to vote at the meeting and who has complied with the advance notice procedures of the bylaws. With respect to special meetings of stockholders, only the business specified in our notice of the meeting may be brought before the meeting. Nominations of persons for election to the Board of Directors at a special meeting may be made only (1) by or at the direction of the Board of Directors or (2) provided that the special meeting has been called in accordance with our bylaws for the purposes of electing directors, by a stockholder who was a stockholder of record at the time of provision of notice, at the record date and at the time of the meeting, who is entitled to vote at the meeting and who has complied with the advance notice provisions of the bylaws.
The purpose of requiring stockholders to give us advance notice of nominations and other business is to afford our Board of Directors a meaningful opportunity to consider the qualifications of the proposed nominees and the advisability of any other proposed business and, to the extent deemed necessary or desirable by our Board of Directors, to inform stockholders and make recommendations about such qualifications or business, as well as to provide a more orderly procedure for conducting meetings of stockholders. Although our bylaws do not give our Board of Directors any power to disapprove stockholder nominations for the election of directors or proposals recommending certain action, they may have the effect of precluding a contest for the election of directors or the consideration of stockholder proposals if proper procedures are not followed and of discouraging or deterring a third party from conducting a solicitation of proxies to elect its own slate of directors or to approve its own proposal without regard to whether consideration of such nominees or proposals might be harmful or beneficial to us and our stockholders.
Calling of Special Meetings of Stockholders
Our bylaws provide that special meetings of stockholders may be called by our Board of Directors and certain of our officers. Additionally, our bylaws provide that, subject to the satisfaction of certain procedural and informational requirements by the stockholders requesting the meeting, a special meeting of stockholders will be called by the secretary of the corporation upon the written request of stockholders entitled to cast not less than a majority of all the votes entitled to be cast at such meeting.
Delaware Anti-Takeover Law
The DGCL contains provisions that could make it more difficult for a potential acquirer to acquire us by means of a tender offer, proxy contest or otherwise. These provisions are expected to discourage certain coercive takeover practices and inadequate takeover bids and to encourage persons seeking to acquire control of us to negotiate first with our Board of Directors. These measures may delay, defer or prevent a transaction or a change in control that might otherwise be in the best interests of our stockholders. Our Board of Directors has considered the implications of these provisions, including Section 203 of the DGCL, which is described in further detail below, and believes, however, that the benefits of these provisions outweigh the potential disadvantages of discouraging any such acquisition proposals because the negotiation of such proposals may improve their terms.
We are subject to the provisions of Section 203 of the DGCL regulating corporate takeovers. In general, these provisions prohibit a Delaware corporation from engaging in any business combination with any interested stockholder for a period of three years following the date that the stockholder became an interested stockholder, unless:
a.prior to such time, the board of directors approved either the business combination or the transaction which resulted in the stockholder becoming an interested stockholder;
b.upon consummation of the transaction that resulted in the stockholder becoming an interested stockholder, the interested stockholder owned at least 85% of the voting stock of the corporation outstanding at the time the transaction commenced; or
c.at or subsequent to such time, the business combination is approved by the board of directors and authorized at a meeting of stockholders, by at least two-thirds of the outstanding voting stock that is not owned by the interested stockholder.
Section 203 of the DGCL defines “business combination” to include the following:
a.any merger or consolidation involving the corporation and the interested stockholder;
b.any sale, transfer, pledge or other disposition (in one transaction or a series of transactions) of 10% or more of either the aggregate market value of all the assets of the corporation or the aggregate market value of all the outstanding stock of the corporation involving the interested stockholder;
c.subject to certain exceptions, any transaction that results in the issuance or transfer by the corporation of any stock of the corporation to the interested stockholder;
d.any transaction involving the corporation that has the effect of increasing the proportionate share of the stock of any class or series of the corporation owned by the interested stockholder; or
e.the receipt by the interested stockholder of the benefit of any loans, advances, guarantees, pledges or other financial benefits provided by or through the corporation.
In general, Section 203 of the DGCL defines an interested stockholder as any entity or person beneficially owning 15% or more of the outstanding voting stock of the corporation and any entity or person affiliated with or controlling or controlled by any of these entities or persons.
The statute could prohibit or delay mergers or other takeover or change in control attempts and, accordingly, may discourage attempts to acquire us.
Our Board of Directors may choose to adopt a resolution exempting from Section 203 of the DGCL any business combination between us and any other person, subject to prior approval of such business combination by our Board of Directors, including approval by a majority of our Independent Directors.
The Company is aware of certain recent federal and state court decisions regarding certain control share statutes in jurisdictions other than Delaware holding that such control share statutes are not consistent with the 1940 Act and acknowledges the possibility that a court may determine that Section 203 of the DGCL similarly conflicts with the 1940 Act. The Company’s bylaws provide that to the extent that any provision of the DGCL, including Section 203 of the DGCL, conflicts with any provision of the 1940 Act, the applicable provision of the 1940 Act shall control.
Conflict with 1940 Act
Our bylaws provide that, if and to the extent that any provision of the DGCL or any provision of our certificate of incorporation or bylaws conflicts with any provision of the 1940 Act, the applicable provision of the 1940 Act will control.
Exclusive Forum
Our certificate of incorporation and bylaws provide that, to the fullest extent permitted by law, unless we consent in writing to the selection of an alternative forum, the sole and exclusive forum for (1) any derivative action or proceeding brought on behalf of the Company, (2) any action asserting a claim of breach of a fiduciary duty owed by any director, officer or other employee of the Company to the Company or the Company’s stockholders, (3) any action asserting a claim arising pursuant to any provision of the DGCL, our certificate of incorporation or bylaws or the securities, antifraud, unfair trade practices or similar laws of any international, national, state, provincial, territorial, local or other governmental or regulatory authority, including, in each case, the applicable rules and regulations promulgated thereunder, or (4) any action asserting a claim governed by the internal affairs doctrine will be a federal or state court located in the state of Delaware. Any person or entity purchasing or otherwise acquiring any interest in shares of our Common Stock will be deemed, to the fullest extent permitted by law, to have notice of and consented to these exclusive forum provisions and to have irrevocably submitted to, and waived any objection to, the exclusive jurisdiction of such courts in connection with any such action or proceeding and consented to process being served in any such action or proceeding, without limitation, by U.S. mail addressed to the stockholder at the stockholder’s address as it appears on the records of the Company, with postage thereon prepaid. Our certificate of incorporation includes this provision so that we can respond to litigation more efficiently, reduce the costs associated with our responses to such litigation, particularly litigation that might otherwise be brought in multiple forums, and make it less likely that plaintiffs’ attorneys will be able to employ such litigation to coerce us into otherwise unjustified settlements. However, this exclusive forum provision may limit a stockholder’s ability to bring a claim in a judicial forum that such stockholder believes is favorable for disputes with us or our directors, officers or other employees, if any, and may discourage lawsuits against us and our directors, officers or other employees, if any. Alternatively, if a court were to find such provision inapplicable or unenforceable in an action, we may incur additional costs associated with resolving such matters in other jurisdictions, which could adversely affect our business, financial condition and results of operations. The exclusive forum provision does not apply to claims arising under the federal securities laws.
EX-21.1
3
ex211subsidiariesoftheregi.htm
EX-21.1
Document
LIST OF SUBSIDIARIES
At the time of this filing, the following entities are subsidiaries of Morgan Stanley Direct Lending Fund:
|
|
|
|
|
|
|
|
|
|
|
|
|
|
|
|
|
|
|
|
|
|
|
|
|
|
|
|
|
|
|
|
|
|
|
|
|
|
|
|
|
|
|
|
| Company Name |
|
Jurisdiction of Organization |
|
|
|
|
| DLF CA SPV LLC |
|
Delaware |
|
| DLF SPV LLC |
|
Delaware |
|
| DLF Financing SPV LLC |
|
Delaware |
|
| DLF Equity Holdings LLC |
|
Delaware |
|
EX-31.1
4
a20231231exhibit311.htm
EX-31.1
Document
Exhibit 31.1
CERTIFICATION OF PRINCIPAL EXECUTIVE OFFICER
CERTIFICATION
I, Jeffrey S. Levin, certify that:
1.I have reviewed this annual report on Form 10-K of MORGAN STANLEY DIRECT LENDING FUND;
2.Based on my knowledge, this report does not contain any untrue statement of a material fact or omit to state a material fact necessary to make the statements made, in light of the circumstances under which such statements were made, not misleading with respect to the period covered by this report;
3.Based on my knowledge, the financial statements, and other financial information included in this report, fairly present in all material respects the financial condition, results of operations and cash flows of the registrant as of, and for, the periods presented in this report;
4.The registrant’s other certifying officer and I are responsible for establishing and maintaining disclosure controls and procedures (as defined in Exchange Act Rules 13a-15(e) and 15d-15(e)) and internal control over financial reporting (as defined in Exchange Act Rule 13a-15(f) and 15d-15(f)) for the registrant and have:
a.Designed such disclosure controls and procedures, or caused such disclosure controls and procedures to be designed under our supervision, to ensure that material information relating to the registrant, including its consolidated subsidiaries, if any, is made known to us by others within those entities, particularly during the period in which this report is being prepared;
b.Designed such internal control over financial reporting, or caused such internal control over financial reporting to be designed under our supervision, to provide reasonable assurance regarding the reliability of financial reporting and the preparation of financial statements for external purposes in accordance with generally accepted accounting principles;
c.Evaluated the effectiveness of the registrant’s disclosure controls and procedures and presented in this report our conclusions about the effectiveness of the disclosure controls and procedures, as of the end of the period covered by this report based on such evaluation; and
d.Disclosed in this report any change in the registrant’s internal control over financial reporting that occurred during the registrant’s most recent fiscal quarter (the registrant’s fourth fiscal quarter in the case of an annual report) that has materially affected, or is reasonably likely to materially affect, the registrant’s internal control over financial reporting; and
5.The registrant’s other certifying officer and I have disclosed, based on our most recent evaluation of internal control over financial reporting, to the registrant’s auditors and the audit committee of the registrant’s board of directors (or persons performing the equivalent functions):
a.All significant deficiencies and material weaknesses in the design or operation of internal control over financial reporting which are reasonably likely to adversely affect the registrant’s ability to record, process, summarize and report financial information; and
b.Any fraud, whether or not material, that involves management or other employees who have a significant role in the registrant’s internal control over financial reporting.
Dated: March 1, 2024
|
|
|
/s/ Jeffrey S. Levin |
|
Jeffrey S. Levin
Chief Executive Officer
(Principal Executive Officer)
|
EX-31.2
5
a20231231exhibit312.htm
EX-31.2
Document
Exhibit 31.2
CERTIFICATION OF PRINCIPAL FINANCIAL OFFICER
CERTIFICATION
I, David Pessah, certify that:
1.I have reviewed this annual report on Form 10-K of MORGAN STANLEY DIRECT LENDING FUND;
2.Based on my knowledge, this report does not contain any untrue statement of a material fact or omit to state a material fact necessary to make the statements made, in light of the circumstances under which such statements were made, not misleading with respect to the period covered by this report;
3.Based on my knowledge, the financial statements, and other financial information included in this report, fairly present in all material respects the financial condition, results of operations and cash flows of the registrant as of, and for, the periods presented in this report;
4.The registrant’s other certifying officer and I are responsible for establishing and maintaining disclosure controls and procedures (as defined in Exchange Act Rules 13a-15(e) and 15d-15(e)) and internal control over financial reporting (as defined in Exchange Act Rule 13a-15(f) and 15d-15(f)) for the registrant and have:
a.Designed such disclosure controls and procedures, or caused such disclosure controls and procedures to be designed under our supervision, to ensure that material information relating to the registrant, including its consolidated subsidiaries, if any, is made known to us by others within those entities, particularly during the period in which this report is being prepared;
b.Designed such internal control over financial reporting, or caused such internal control over financial reporting to be designed under our supervision, to provide reasonable assurance regarding the reliability of financial reporting and the preparation of financial statements for external purposes in accordance with generally accepted accounting principles;
c.Evaluated the effectiveness of the registrant’s disclosure controls and procedures and presented in this report our conclusions about the effectiveness of the disclosure controls and procedures, as of the end of the period covered by this report based on such evaluation; and
d.Disclosed in this report any change in the registrant’s internal control over financial reporting that occurred during the registrant’s most recent fiscal quarter (the registrant’s fourth fiscal quarter in the case of an annual report) that has materially affected, or is reasonably likely to materially affect, the registrant’s internal control over financial reporting; and
5.The registrant’s other certifying officer and I have disclosed, based on our most recent evaluation of internal control over financial reporting, to the registrant’s auditors and the audit committee of the registrant’s board of directors (or persons performing the equivalent functions):
a.All significant deficiencies and material weaknesses in the design or operation of internal control over financial reporting which are reasonably likely to adversely affect the registrant’s ability to record, process, summarize and report financial information; and
b.Any fraud, whether or not material, that involves management or other employees who have a significant role in the registrant’s internal control over financial reporting.
Dated: March 1, 2024
|
|
|
| /s/ David Pessah |
|
David Pessah
Chief Financial Officer
(Principal Financial Officer)
|
EX-32.1
6
a20231231exhibit321.htm
EX-32.1
Document
Exhibit 32.1
CERTIFICATION OF PRINCIPAL EXECUTIVE OFFICER, SECTION 906
CERTIFICATION PURSUANT TO
18 U.S.C. SECTION 1350,
AS ADOPTED PURSUANT TO
SECTION 906 OF THE SARBANES-OXLEY ACT OF 2002
I, Jeffrey S. Levin, the Chief Executive Officer (Principal Executive Officer) of MORGAN STANLEY DIRECT LENDING FUND (the “Company”), hereby certify, pursuant to 18 U.S.C. Section 1350, as adopted pursuant to Section 906 of the Sarbanes-Oxley Act of 2002, that, to the best of my knowledge:
•the Form 10-K of the Company for the year ended December 31, 2023 as filed with the Securities and Exchange Commission on the date hereof (the “Form 10-K”), fully complies with the requirements of Section 13(a) or 15(d) of the Securities Exchange Act of 1934; and
•the information contained in the Form 10-K of the Company for the year ended December 31, 2023 fairly presents, in all material respects, the financial condition and results of operations of the Company.
|
|
|
Dated: March 1, 2024 |
/s/ Jeffrey S. Levin |
|
Jeffrey S. Levin
Chief Executive Officer
(Principal Executive Officer)
|
EX-32.2
7
a20231231exhibit322.htm
EX-32.2
Document
Exhibit 32.2
CERTIFICATION OF PRINCIPAL FINANCIAL OFFICER, SECTION 906
CERTIFICATION PURSUANT TO
18 U.S.C. SECTION 1350,
AS ADOPTED PURSUANT TO
SECTION 906 OF THE SARBANES-OXLEY ACT OF 2002
I, David Pessah, the Chief Financial Officer (Principal Financial Officer) of MORGAN STANLEY DIRECT LENDING FUND (the “Company”), hereby certify, pursuant to 18 U.S.C. Section 1350, as adopted pursuant to Section 906 of the Sarbanes-Oxley Act of 2002, that, to the best of my knowledge:
•the Form 10-K of the Company for the year ended December 31, 2023 as filed with the Securities and Exchange Commission on the date hereof (the “Form 10-K”), fully complies with the requirements of Section 13(a) or 15(d) of the Securities Exchange Act of 1934; and
•the information contained in the Form 10-K of the Company for the year ended December 31, 2023 fairly presents, in all material respects, the financial condition and results of operations of the Company.
|
|
|
Dated: March 1, 2024 |
/s/ David Pessah |
|
David Pessah
Chief Financial Officer
(Principal Financial Officer)
|
EX-99.7
8
exhibit997clawbackpolicy.htm
EX-99.7
Document
Morgan Stanley Direct Lending Fund
CLAWBACK POLICY
The Board of Directors (the “Board”) of Morgan Stanley Direct Lending Fund (the “Company”) has adopted this Clawback Policy (the “Policy”) to comply with Section 10D of the Securities Exchange Act of 1934, as amended (the “Exchange Act”), Rule 10D-1 promulgated under the Exchange Act (“Rule 10D-1”) and Section 303A.14 of the New York Stock Exchange Listed Company Manual (the “Listing Standards”). This Policy provides for the recovery of Incentive-Based Compensation (as defined below) received by Covered Executives (as defined below), if any, in the event of an Accounting Restatement (as defined below) and shall be interpreted to be consistent with, Section 10D of the Exchange Act, Rule 10D-1 and the Listing Standards.
The Company, as an externally-managed business development company regulated under the Investment Company Act of 1940, as amended (the “1940 Act”), currently neither pays nor has any plans to pay or otherwise award Incentive-Based Compensation to Covered Executives, but nevertheless has designed and implemented this Policy to comply with Section 10D of the Exchange Act, Rule 10D-1 and the Listing Standards). Rule 10D-1 and the Listing Standards require the Company to adopt this Policy regardless of whether Incentive-Based Compensation is paid or otherwise awarded by the Company to Covered Executives.
1) Administration
Except as specifically set forth herein, this Policy shall be administered by the Board or, if designated by the Board, a committee thereof (the Board or such committee charged with administration of this Policy, the “Policy Administrator”). The Policy Administrator is authorized to interpret and construe this Policy and to make all determinations necessary, appropriate or advisable for the administration of this Policy. Any determinations made by the Policy Administrator shall be final and binding on all affected individuals and need not be uniform with respect to each individual covered by the Policy. In the administration of this Policy, the Policy Administrator is authorized and directed to consult with the full Board or such other committees of the Board, such as the Audit Committee, the Compensation Committee or such other committee as may be necessary or appropriate as to matters within the scope of such other committee’s responsibility and authority. Subject to any limitation of applicable law, the Policy Administrator may authorize and empower any officer or employee of the Company to take any and all actions necessary or appropriate to carry out the purpose and intent of this Policy (other than with respect to any recovery under this Policy involving such officer or employee).
2) Definitions
As used in this Policy, the following definitions shall apply:
•“Accounting Restatement” means an accounting restatement of the Company’s financial statements due to the Company’s material noncompliance with any financial reporting requirement under the securities laws, including any required accounting restatement to correct an error in previously issued financial statements that is material to the previously issued financial statements, or that would result in a material misstatement if the error were corrected in the current period or left uncorrected in the current period.
•“Applicable Period” means the three completed fiscal years immediately preceding the date on which the Company is required to prepare an Accounting Restatement, as well as any transition period (that results from a change in the Company’s fiscal year) within or immediately following those three completed fiscal years (except that a transition period between the last day of the Company’s previous fiscal year-end and the first day of its new fiscal year that comprises a period of nine to twelve months shall be deemed to be a completed fiscal year). The “date on which the Company is required to prepare an Accounting Restatement” is the earlier to occur of (a) the date the Board, a committee of the Board, or the officer or officers of the Company authorized to take such action if action by the Board or a committee thereof is not required, concludes or reasonably should have concluded, that the Company is required to prepare an Accounting Restatement or (b) the date a court, regulator or other legally authorized body directs the Company to prepare an Accounting Restatement, in each case regardless of if or when the restated financial statements are filed.
•“Covered Executives” means the Company’s current and former president, principal financial officer, principal accounting officer (or if there is no such accounting officer, the controller), any vice-president of the Company in charge of a principal business unit, division, or function (such as sales, administration, or finance), any other officer of the Company who performs a policy-making function, or any other person who performs similar policy-making functions for the Company and any officer within the meaning of 17 C.F. R. 229.401(b). An executive officer of a parent or subsidiary of the Company is deemed a Covered Executive if the executive officer performs policy making functions for the Company. “Policy-making function” for purposes of this definition is not intended to include policy-making functions that are not significant to the Company. The definition of Covered Executives shall be interpreted in accordance with the definition of “Executive Offer” set forth in Rule 10D-1 and the Listing Standards. For the avoidance of doubt, “Covered Executives” does not include the Company’s investment adviser (the “Adviser”) or any of the Investment Adviser’s directors, partners, officers or employees, solely in their capacity as such.
•“Erroneously Awarded Compensation” has the meaning set forth in Section 6 of this Policy.
•A “Financial Reporting Measure” means any measure that is determined and presented in accordance with the accounting principles used in preparing the Company’s financial statements, and any measure that is derived wholly or in part from such measure. For the avoidance of doubt, Financial Reporting Measures include but are not limited to the following (and any measure derived from the following): Company stock price; total shareholder return (“TSR”); net asset value, net investment income; net income; net realized or unrealized gains; profitability; financial ratios; earnings before interest, taxes, depreciation and amortization; funds from operations and adjusted funds from operations; liquidity measures; return measures (e.g., return on investments, return on assets); earnings measures (e.g., earnings per share); and any of such financial reporting measures relative to a peer group, where the Company’s financial reporting measure is subject to an Accounting Restatement. A Financial Reporting Measure need not be presented within the Company’s financial statements or included in a filing with the Securities and Exchange Commission.
•“Incentive-Based Compensation” means any compensation that is granted by the Company, or earned and/or vested based wholly or in part upon the attainment of a Financial Reporting Measure. For purposes of this Policy, Incentive-Based Compensation is deemed “received” in the Company’s fiscal period during which the Financial Reporting Measure specified in the Incentive-Based Compensation award is attained, even if the payment or grant of such Incentive-Based Compensation occurs after the end of that period.
3) Scope; Covered Executives; Incentive-Based Compensation
The Company currently neither pays nor has any plans to pay or otherwise award Incentive-Based Compensation to Covered Executives1.
4) Board Review
This Policy will be presented to the Board for review and approval at such times as the Board in its discretion determines is necessary and appropriate. The Board may amend, modify, supplement, rescind or replace all or any portion of this Policy at any time and from time to time in its discretion, and shall amend this Policy as it deems necessary to comply with applicable law or any rules or standards adopted by a national securities exchange on which the Company’s securities are listed.
5) Required Recovery of Erroneously Awarded Compensation in the Event of an Accounting Restatement
In the event that the Company is required to prepare an Accounting Restatement, the Company shall recover, on a reasonably prompt basis, the amount of any Erroneously Awarded Compensation received by any Covered Executive from the Company, as calculated pursuant to Section 6 of this Policy, during the Applicable Period. Recovery under this Policy with respect to a Covered Executive shall not require the finding of any misconduct by such Covered Executive or such Covered Executive being found responsible for the accounting error leading to an Accounting Restatement.
6) Erroneously Awarded Compensation: Amount Subject to Recovery The amount of Erroneously Awarded Compensation subject to recovery under this Policy, as determined by the Company, is the amount of Incentive-Based Compensation received by the Covered Executive that exceeds the amount of Incentive-Based Compensation that otherwise would have been received by the Covered Executive had it been determined based on applicable restated Financial Reporting Measure.
Erroneously Awarded Compensation shall be computed without regard to any taxes paid by the Covered Executive in respect of the Erroneously Awarded Compensation.
With respect to any compensation plans or programs that take into account Incentive-Based Compensation, the amount of Erroneously Awarded Compensation subject to recovery hereunder includes, but is not limited to, the amount contributed to any notional account based on Erroneously Awarded Compensation and any earnings accrued to date on that notional amount.
For Incentive-Based Compensation based on the Company’s stock price or TSR: (a) the Company shall determine the amount of Erroneously Awarded Compensation based on a reasonable estimate of the effect of the Accounting Restatement on the stock price or TSR upon which the Incentive-Based Compensation was received; and (b) the Company shall maintain documentation of the determination of that reasonable estimate and provide such documentation to the New York Stock Exchange (“NYSE”).
7) Method of Recovery
The Company shall determine, in its sole discretion, the timing and method for promptly recovering Erroneously Awarded Compensation hereunder, which may include without limitation (a) seeking reimbursement of all or part of any cash or equity-based award, (b) cancelling prior cash or equity-based awards, whether vested or unvested or paid or unpaid, (c) cancelling or offsetting against any planned future cash or equity-based awards, (d) forfeiture of deferred compensation, subject to compliance with Section 409A of the Internal Revenue Code and the regulations promulgated thereunder and (e) any other method authorized by applicable law or contract.
Subject to compliance with any applicable law, the Company may effect recovery under this Policy from any amount otherwise payable to the Covered Executive, including amounts payable to such individual under any otherwise applicable Company plan or program, including base salary, bonuses, other compensation and/or compensation previously deferred by the Covered Executive.
The Company is authorized and directed pursuant to this Policy to recover Erroneously Awarded Compensation on a reasonably prompt basis in compliance with this Policy unless the Board (including a majority of its directors who are not “interest persons” of the Company, as defined in Section 2(a)(19) of the 1940 Act) or applicable committee thereof has determined that such recovery would be impracticable for one of the following reasons, and subject to the following procedural and disclosure requirements:
•The direct expense paid to a third party to assist in enforcing the Policy would exceed the amount to be recovered. Before concluding that it would be impracticable to recover any amount of Erroneously Awarded Compensation based on the expense of enforcement, the Company must make, or cause to be made, a reasonable attempt to recover such Erroneously Awarded Compensation, document such reasonable attempt(s) to recover and provide that documentation to NYSE;
•Recovery would violate home country law where that law was adopted prior to November 28, 2022. Before concluding that it would be impracticable to recover any amount of Erroneously Awarded Compensation based on violation of home country law, the Company must obtain an opinion of home country counsel, acceptable to NYSE, that recovery would result in such a violation, and must provide such opinion to NYSE; or
•Recovery would likely cause an otherwise tax-qualified retirement plan, under which benefits are broadly available to employees of the Company, if any, to fail to meet the requirements of 26 U.S.C. 401(a)(13) or 26 U.S.C. 411(a) and regulations thereunder.
8) No Indemnification of Covered Executives Notwithstanding the terms of any indemnification or insurance policy or any contractual arrangement with any Covered Executive that may be interpreted to the contrary, the Company shall not indemnify any Covered Executives against losses caused by the recovery of any Erroneously Awarded Compensation. In addition, the Company is not permitted to pay or reimburse a Covered Executive for premiums on an insurance policy purchased by such Covered Executive to protect them from such recovery. Other than as expressly stated herein, this Policy does not otherwise limit a Covered Executive’s insurance coverage (including any insurance coverage acquired by the Company) or a Covered Executive’s right to indemnification from the Company, including in each case, for actions related to any Accounting Restatement.
9) Policy Administrator Indemnification
Any directors and officers of the Company, and any other personnel who assist in the administration of this Policy, including, but not limited to employees of the Adviser and Morgan Stanley, shall not be personally liable for any action, determination or interpretation made with respect to this Policy and shall be fully indemnified by the Company to the fullest extent under applicable law and Company policy with respect to any such action, determination or interpretation. The foregoing sentence shall not limit any other rights to indemnification of the members of the Board under applicable law or Company policy.
10) Effective Date; Retroactive Application
This Policy shall be effective as of January 11, 2024 (the Effective Date). The terms of this Policy shall apply to any Incentive-Based Compensation that is received by Covered Executives from the Company on or after the Effective Date, even if such Incentive-Based Compensation was approved, awarded, granted or paid to Covered Executives prior to the Effective Date. Without limiting the generality of Section 7 of this Policy, and subject to applicable law, the Company may effect recovery under this Policy from any amount of compensation approved, awarded, granted, payable or paid to the Covered Executive prior to, on or after the Effective Date.
11) Other Recovery Rights; Company Claims
Any right of recovery under this Policy is in addition to, and not in lieu of, any other remedies or rights of recovery that may be available to the Company under applicable law or pursuant to the terms of any similar policy in any employment agreement, equity award agreement or similar agreement and any other legal remedies available to the Company.
Nothing contained in this Policy limits any claims, damages or other legal remedies the Company or any of its affiliates may have against a Covered Executive arising out of, or resulting from, any actions or omissions by the Covered Executive.
12) Exhibit Filing Requirement
A copy of this Policy and any amendments thereto shall be filed as an exhibit to the Company’s annual report on Form 10-K to the extent required by law.
1This Policy applies to Incentive-Based Compensation received by a person (a) after beginning services as a Covered Executive; (b) if that person served as a Covered Executive at any time during the performance period for such Incentive-Based Compensation; (c) while the Company had a listed class of securities on a national securities exchange; and (d) during the Applicable Period.