
3Q24 Shareholder Letter
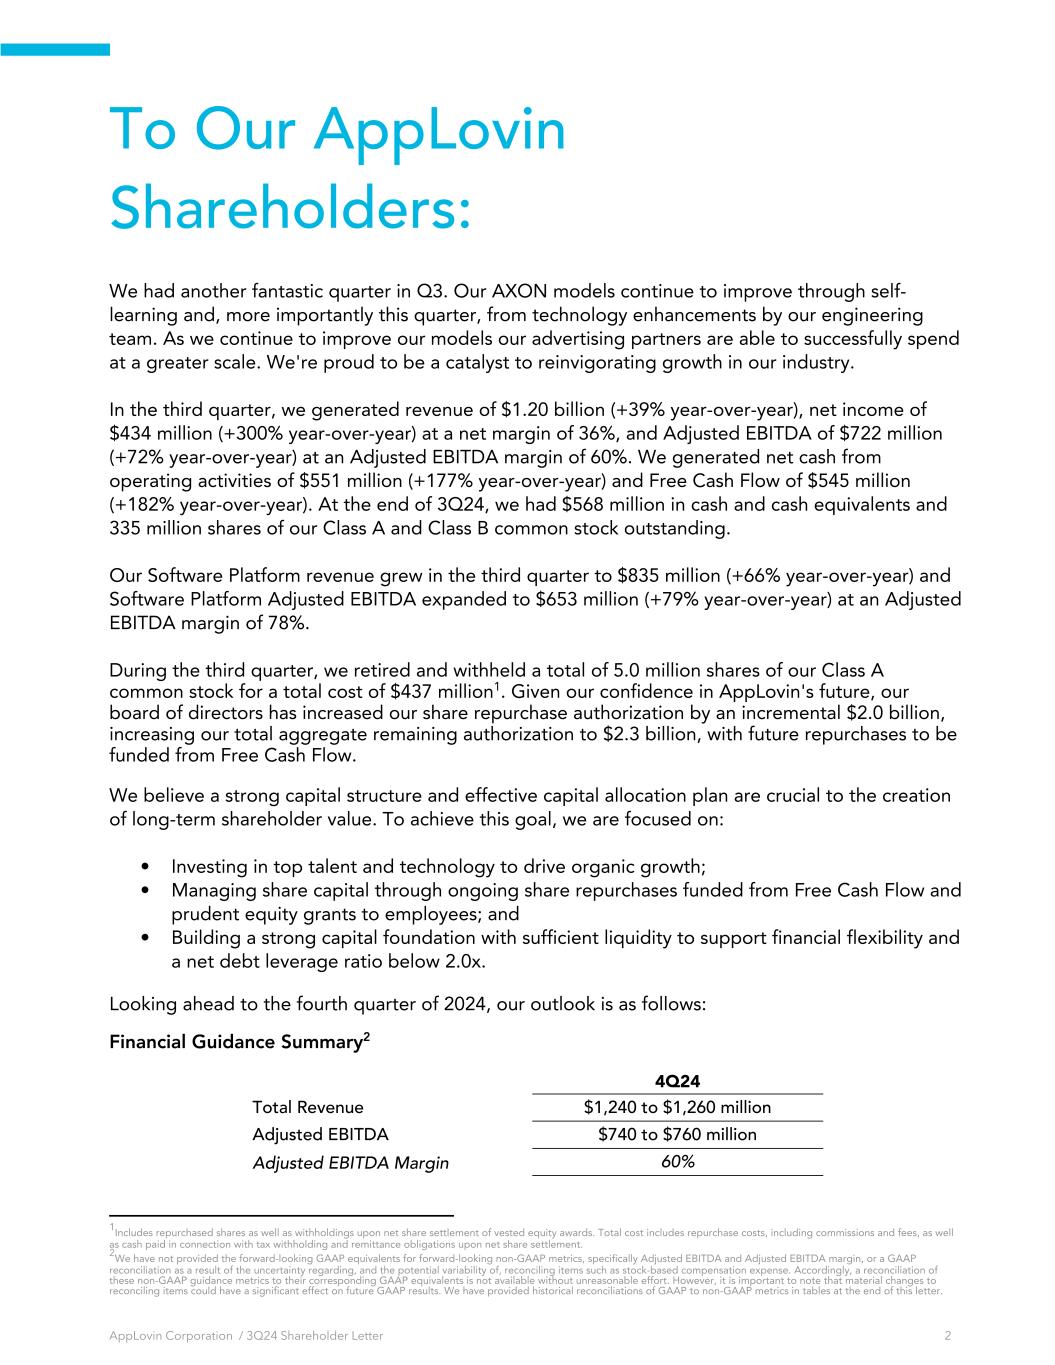
To Our AppLovin Shareholders: We had another fantastic quarter in Q3. Our AXON models continue to improve through self- learning and, more importantly this quarter, from technology enhancements by our engineering team. As we continue to improve our models our advertising partners are able to successfully spend at a greater scale. We're proud to be a catalyst to reinvigorating growth in our industry. In the third quarter, we generated revenue of $1.20 billion (+39% year-over-year), net income of $434 million (+300% year-over-year) at a net margin of 36%, and Adjusted EBITDA of $722 million (+72% year-over-year) at an Adjusted EBITDA margin of 60%. We generated net cash from operating activities of $551 million (+177% year-over-year) and Free Cash Flow of $545 million (+182% year-over-year). At the end of 3Q24, we had $568 million in cash and cash equivalents and 335 million shares of our Class A and Class B common stock outstanding. Our Software Platform revenue grew in the third quarter to $835 million (+66% year-over-year) and Software Platform Adjusted EBITDA expanded to $653 million (+79% year-over-year) at an Adjusted EBITDA margin of 78%. During the third quarter, we retired and withheld a total of 5.0 million shares of our Class A common stock for a total cost of $437 million1. Given our confidence in AppLovin's future, our board of directors has increased our share repurchase authorization by an incremental $2.0 billion, increasing our total aggregate remaining authorization to $2.3 billion, with future repurchases to be funded from Free Cash Flow. We believe a strong capital structure and effective capital allocation plan are crucial to the creation of long-term shareholder value. To achieve this goal, we are focused on: • Investing in top talent and technology to drive organic growth; • Managing share capital through ongoing share repurchases funded from Free Cash Flow and prudent equity grants to employees; and • Building a strong capital foundation with sufficient liquidity to support financial flexibility and a net debt leverage ratio below 2.0x. Looking ahead to the fourth quarter of 2024, our outlook is as follows: Financial Guidance Summary2 4Q24 Total Revenue $1,240 to $1,260 million Adjusted EBITDA $740 to $760 million Adjusted EBITDA Margin 60% AppLovin Corporation / 3Q24 Shareholder Letter 2 1Includes repurchased shares as well as withholdings upon net share settlement of vested equity awards. Total cost includes repurchase costs, including commissions and fees, as well as cash paid in connection with tax withholding and remittance obligations upon net share settlement. 2We have not provided the forward-looking GAAP equivalents for forward-looking non-GAAP metrics, specifically Adjusted EBITDA and Adjusted EBITDA margin, or a GAAP reconciliation as a result of the uncertainty regarding, and the potential variability of, reconciling items such as stock-based compensation expense. Accordingly, a reconciliation of these non-GAAP guidance metrics to their corresponding GAAP equivalents is not available without unreasonable effort. However, it is important to note that material changes to reconciling items could have a significant effect on future GAAP results. We have provided historical reconciliations of GAAP to non-GAAP metrics in tables at the end of this letter.
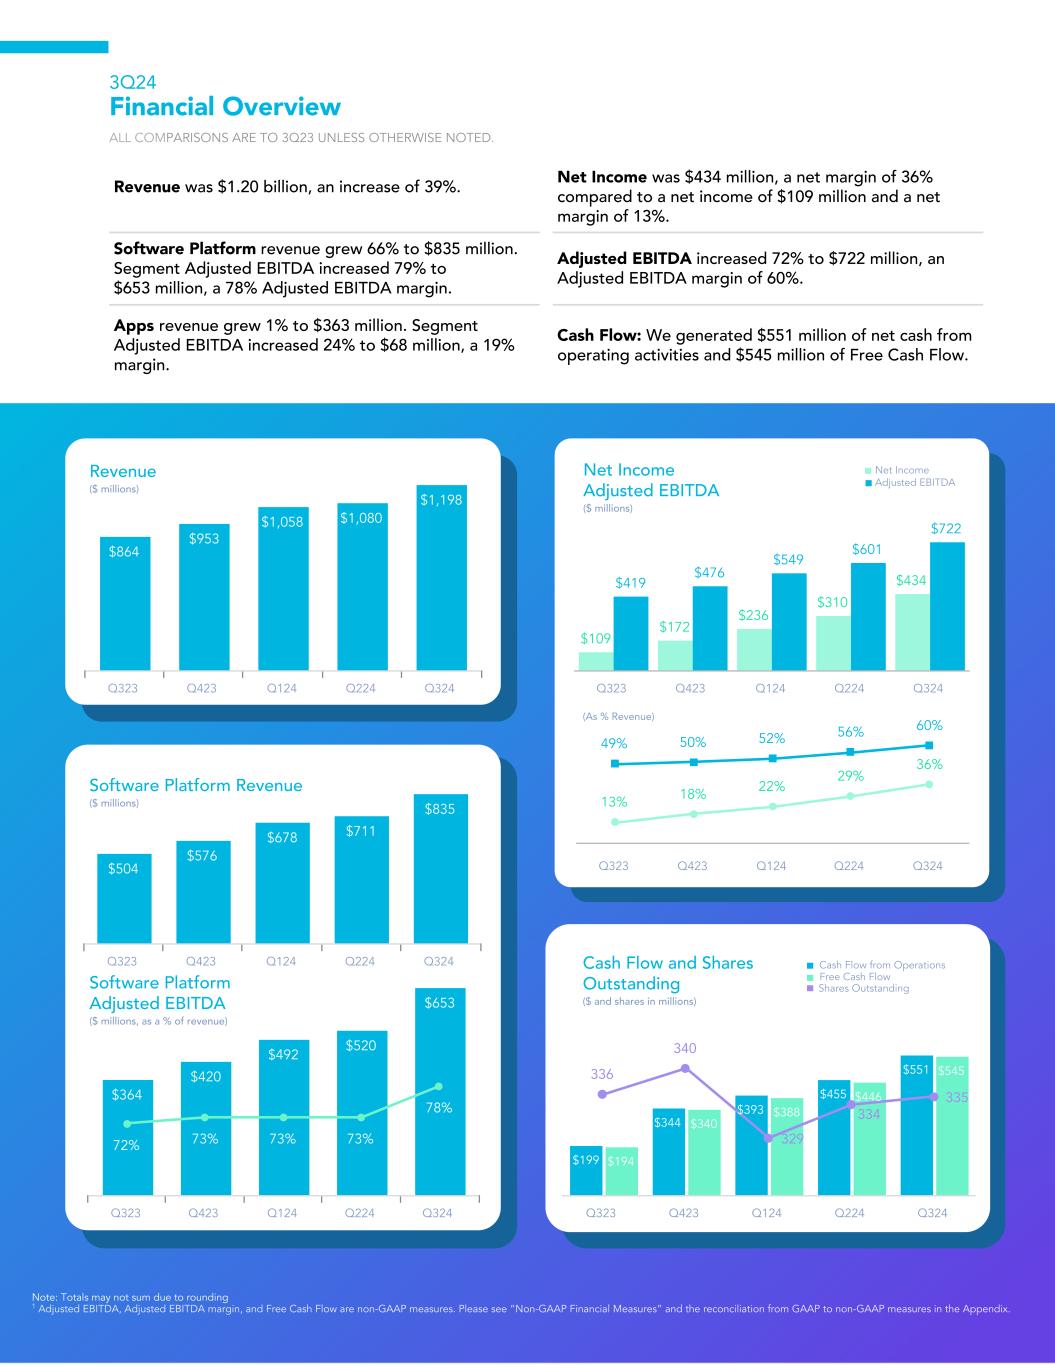
$864 $953 $1,058 $1,080 $1,198 Q323 Q423 Q124 Q224 Q324 Revenue ($ millions) $504 $576 $678 $711 $835 Q323 Q423 Q124 Q224 Q324 Software Platform Revenue ($ millions) $364 $420 $492 $520 $653 72% 73% 73% 73% 78% Q323 Q423 Q124 Q224 Q324 Software Platform Adjusted EBITDA ($ millions, as a % of revenue) $109 $172 $236 $310 $434$419 $476 $549 $601 $722 Q323 Q423 Q124 Q224 Q324 Net Income Adjusted EBITDA ($ millions) $199 $344 $393 $455 $551 $194 $340 $388 $446 $545336 340 329 334 335 Q323 Q423 Q124 Q224 Q324 Cash Flow and Shares Outstanding ($ and shares in millions) 3Q24 Financial Overview ALL COMPARISONS ARE TO 3Q23 UNLESS OTHERWISE NOTED. Note: Totals may not sum due to rounding 1 Adjusted EBITDA, Adjusted EBITDA margin, and Free Cash Flow are non-GAAP measures. Please see “Non-GAAP Financial Measures” and the reconciliation from GAAP to non-GAAP measures in the Appendix. Cash Flow from Operations Free Cash Flow Net Income Shares Outstanding Adjusted EBITDA 49% 50% 52% 56% 60% 13% 18% 22% 29% 36% Q323 Q423 Q124 Q224 Q324 Revenue was $1.20 billion, an increase of 39%. Net Income was $434 million, a net margin of 36% compared to a net income of $109 million and a net margin of 13%. Software Platform revenue grew 66% to $835 million. Segment Adjusted EBITDA increased 79% to $653 million, a 78% Adjusted EBITDA margin. Adjusted EBITDA increased 72% to $722 million, an Adjusted EBITDA margin of 60%. Apps revenue grew 1% to $363 million. Segment Adjusted EBITDA increased 24% to $68 million, a 19% margin. Cash Flow: We generated $551 million of net cash from operating activities and $545 million of Free Cash Flow. (As % Revenue) 334
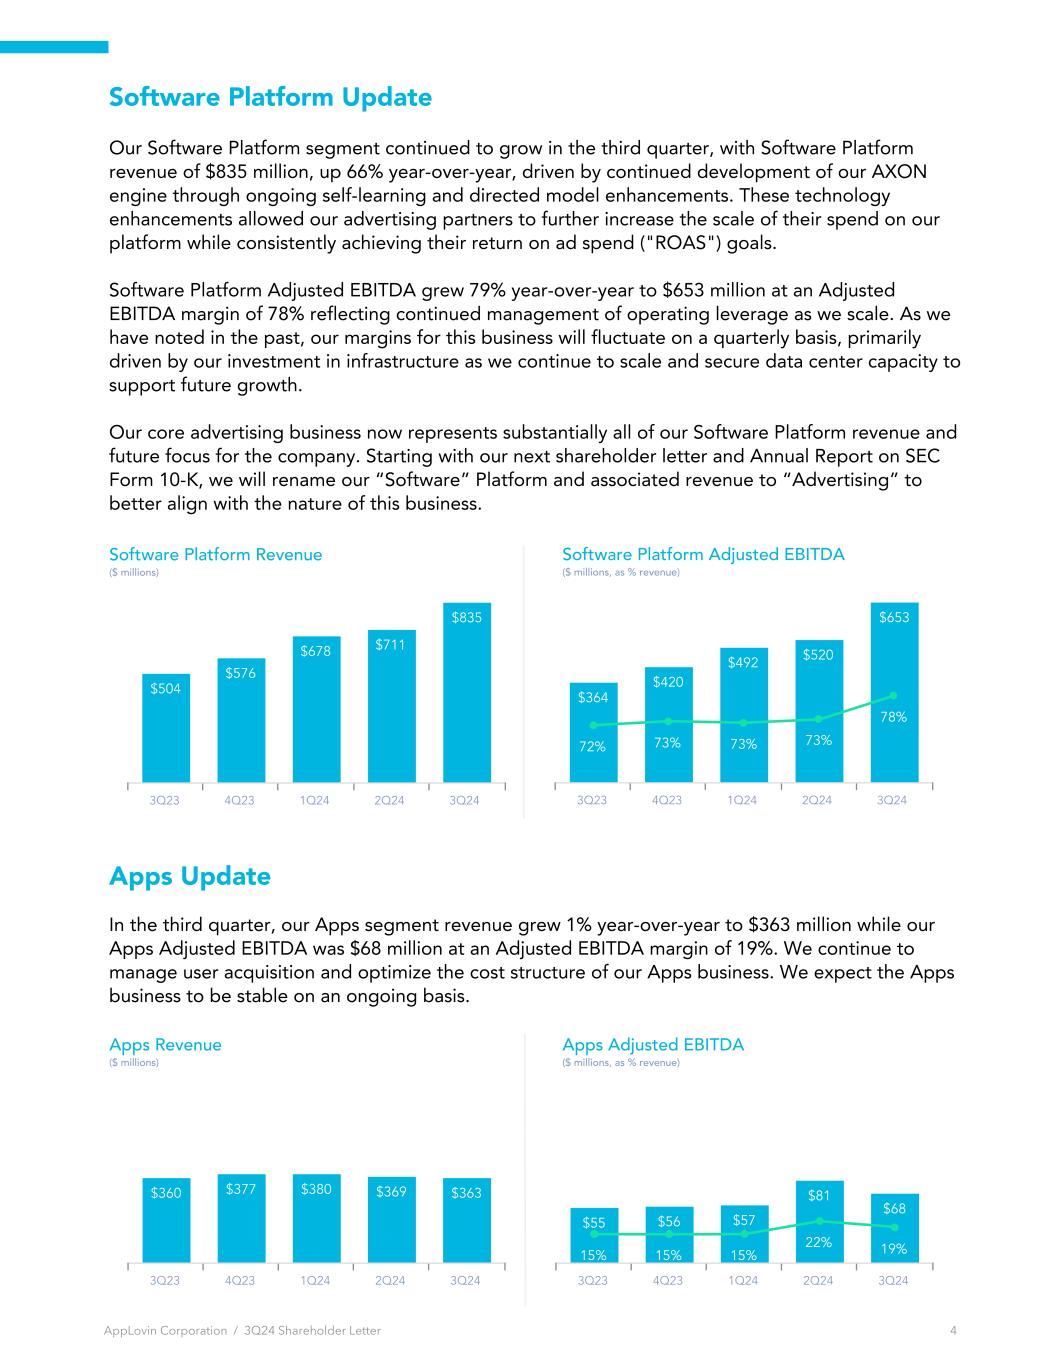
Software Platform Update Our Software Platform segment continued to grow in the third quarter, with Software Platform revenue of $835 million, up 66% year-over-year, driven by continued development of our AXON engine through ongoing self-learning and directed model enhancements. These technology enhancements allowed our advertising partners to further increase the scale of their spend on our platform while consistently achieving their return on ad spend ("ROAS") goals. Software Platform Adjusted EBITDA grew 79% year-over-year to $653 million at an Adjusted EBITDA margin of 78% reflecting continued management of operating leverage as we scale. As we have noted in the past, our margins for this business will fluctuate on a quarterly basis, primarily driven by our investment in infrastructure as we continue to scale and secure data center capacity to support future growth. Our core advertising business now represents substantially all of our Software Platform revenue and future focus for the company. Starting with our next shareholder letter and Annual Report on SEC Form 10-K, we will rename our “Software” Platform and associated revenue to “Advertising” to better align with the nature of this business. $504 $576 $678 $711 $835 3Q23 4Q23 1Q24 2Q24 3Q24 $364 $420 $492 $520 $653 72% 73% 73% 73% 78% 3Q23 4Q23 1Q24 2Q24 3Q24 AppLovin Corporation / 3Q24 Shareholder Letter 4 Software Platform Revenue ($ millions) Software Platform Adjusted EBITDA ($ millions, as % revenue) $360 $377 $380 $369 $363 3Q23 4Q23 1Q24 2Q24 3Q24 Apps Revenue ($ millions) $55 $56 $57 $81 $68 15% 15% 15% 22% 19% 3Q23 4Q23 1Q24 2Q24 3Q24 Apps Adjusted EBITDA ($ millions, as % revenue) Apps Update In the third quarter, our Apps segment revenue grew 1% year-over-year to $363 million while our Apps Adjusted EBITDA was $68 million at an Adjusted EBITDA margin of 19%. We continue to manage user acquisition and optimize the cost structure of our Apps business. We expect the Apps business to be stable on an ongoing basis.
Conclusion AXON’s continued growth demonstrates our team’s ability to consistently drive improvement in our technology. Our investments are enabling us to facilitate growth across the entire advertising ecosystem we support. We thank you for your continued trust and confidence in AppLovin and we look forward to sharing future developments. Regards, Adam Foroughi, CEO Matt Stumpf, CFO AppLovin Corporation / 3Q24 Shareholder Letter 5
Appendix This shareholder letter contains forward-looking statements within the meaning of Section 27A of the Securities Act of 1933 and Section 21E of the Securities Exchange Act of 1934. Forward-looking statements generally relate to future events or our future financial or operating performance. In some cases, you can identify forward-looking statements because they contain words such as “may,” “will,” “should,” “expect,” “plan,” “anticipate,” “going to,” “could,” “intend,” “target,” “project,” “contemplate,” “believe,” “estimate,” “predict,” “potential,” or “continue,” or the negative of these words or other similar terms or expressions that concern our expectations, strategy, priorities, plans, or intentions. Forward-looking statements in this letter to shareholders include, but are not limited to, statements regarding our future financial performance, including our expected financial results and guidance, and growth prospects; statements regarding our share repurchase program, including any future authorized increases to the amount available under our program; our long-term goals; our expectations regarding improvements to our AXON technology; our expectations regarding trends impacting our Software Platform; our expectations regarding the benefits of our Software Platform to and the growth of our advertising partners; our expectations regarding the growth of our advertising partners, the growth of advertising spending and the advertising ecosystem; our expectations regarding our capital allocation plans; our expectations on our cost management efforts, as well as, our plans for user acquisition spend in our Apps segment. Our ability to increase the amount authorized under our share repurchase program, and to utilize any amounts authorized, will depend on a variety of factors, including compliance with legal requirements, such as solvency and surplus requirements; contractual restrictions, as may be set forth in our credit facility or any future debt or other applicable agreements; market conditions; our capital allocation strategy; and our other capital requirements from time to time, including any strategic acquisitions and partnerships we may undertake. Over time, we may modify our capital allocation strategy or pursue alternative objectives and strategies. Our expectations and beliefs regarding our share repurchase program and the other forward looking statements contained in this letter may not materialize, and actual results in future periods are subject to risks and uncertainties, including changes in our plans or assumptions, which could cause actual results to differ materially from those projected. These risks include our inability to forecast our business effectively, the macroeconomic environment, fluctuations in our results of operations, our ability to execute on our operational and financial priorities, our ability to scale our Software Platform to support new users or verticals, our ability to continue to develop our AXON technology as well as expand into new supply and demand verticals, the competitive advertising and mobile app ecosystems, and our inability to adapt to emerging technologies and business models. The forward-looking statements contained in this letter are also subject to other risks and uncertainties, including those more fully described in our Quarterly Report on Form 10-Q for the fiscal quarter ended June 30, 2024. Additional information will also be set forth in our Quarterly Report on Form 10-Q for the fiscal quarter ended September 30, 2024. The forward-looking statements in this letter are based on information available to us as of the date hereof, and we disclaim any obligation to update any forward-looking statements, except as required by law. AppLovin Corporation / 3Q24 Shareholder Letter 6
Non-GAAP Financial Metrics To supplement our financial information presented in accordance with generally accepted accounting principles in the United States (“GAAP”), this shareholder letter includes certain financial measures that are not prepared in accordance with GAAP, including Adjusted EBITDA, Adjusted EBITDA margin, and Free Cash Flow. A reconciliation of each such non-GAAP financial measure to the most directly comparable GAAP measure can be found below. We define Adjusted EBITDA for a particular period as net income before interest expense and loss on settlement of debt, interest income and other, net (excluding certain recurring items), provision for income taxes, amortization, depreciation and write-offs and as further adjusted for non- operating foreign exchange (gains) losses, stock-based compensation expense, transaction-related expense and transaction bonuses, restructuring costs, impairment and loss in connection with sale of long-lived assets, loss (gain) on extinguishments of acquisition-related contingent consideration, lease modification and abandonment of leasehold improvements, change in the fair value of contingent consideration, and loss on disposal of long lived assets. We define Adjusted EBITDA margin as Adjusted EBITDA divided by revenue for the same period. We define Free Cash Flow as net cash provided by operating activities less purchases of property and equipment and principal payments on finance leases. We subtract both purchases of property and equipment and payment of finance leases in our calculation of Free Cash Flow because we believe these items represent our ongoing requirements for property and equipment to support our business, regardless of whether we utilize a finance lease to obtain such property or equipment. We believe that the presentation of these non-GAAP financial measures provides useful information to investors regarding our results of operations and operating performance, as they are similar to measures reported by our public competitors and are regularly used by securities analysts, institutional investors, and other interested parties in analyzing operating performance and prospects. Adjusted EBITDA and Adjusted EBITDA margin are key measures we use to assess our financial performance and are also used for internal planning and forecasting purposes. We believe Adjusted EBITDA and Adjusted EBITDA margin are helpful to investors, analysts, and other interested parties because they can assist in providing a more consistent and comparable overview of our operations across our historical financial periods. We use Adjusted EBITDA and Adjusted EBITDA margin in conjunction with GAAP measures as part of our overall assessment of our performance, including the preparation of our annual operating budget and quarterly forecasts, to evaluate the effectiveness of our business strategies, and to communicate with our board of directors concerning our financial performance. We use Free Cash Flow in addition to GAAP measures to help manage our business and prepare budgets and annual planning, and we believe Free Cash Flow provides useful supplemental information to help investors understand underlying trends in our business and our liquidity. These measures have certain limitations in that they do not include the impact of certain expenses that are reflected in our consolidated statement of operations that are necessary to run our business. Our definitions may differ from the definitions used by other companies and therefore comparability may be limited. In addition, other companies may not publish these or similar metrics. Thus, our non-GAAP financial measures should be considered in addition to, not as substitutes for, or in isolation from, measures prepared in accordance with GAAP. AppLovin Corporation / 3Q24 Shareholder Letter 7
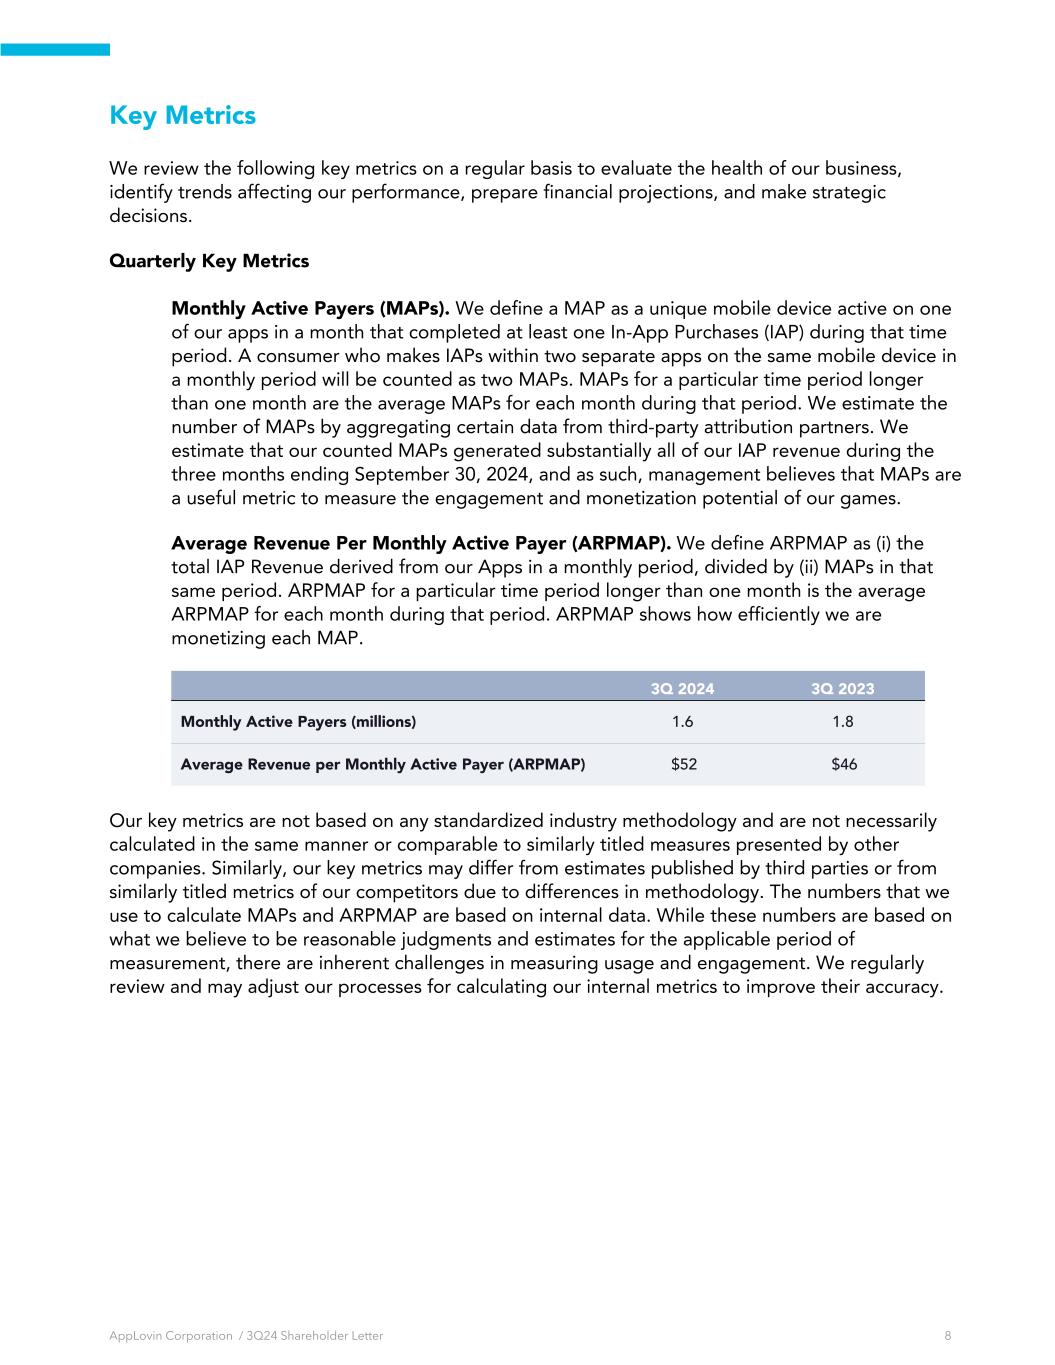
Key Metrics We review the following key metrics on a regular basis to evaluate the health of our business, identify trends affecting our performance, prepare financial projections, and make strategic decisions. Quarterly Key Metrics Monthly Active Payers (MAPs). We define a MAP as a unique mobile device active on one of our apps in a month that completed at least one In-App Purchases (IAP) during that time period. A consumer who makes IAPs within two separate apps on the same mobile device in a monthly period will be counted as two MAPs. MAPs for a particular time period longer than one month are the average MAPs for each month during that period. We estimate the number of MAPs by aggregating certain data from third-party attribution partners. We estimate that our counted MAPs generated substantially all of our IAP revenue during the three months ending September 30, 2024, and as such, management believes that MAPs are a useful metric to measure the engagement and monetization potential of our games. Average Revenue Per Monthly Active Payer (ARPMAP). We define ARPMAP as (i) the total IAP Revenue derived from our Apps in a monthly period, divided by (ii) MAPs in that same period. ARPMAP for a particular time period longer than one month is the average ARPMAP for each month during that period. ARPMAP shows how efficiently we are monetizing each MAP. 3Q 2024 3Q 2023 Monthly Active Payers (millions) 1.6 1.8 Average Revenue per Monthly Active Payer (ARPMAP) $52 $46 Our key metrics are not based on any standardized industry methodology and are not necessarily calculated in the same manner or comparable to similarly titled measures presented by other companies. Similarly, our key metrics may differ from estimates published by third parties or from similarly titled metrics of our competitors due to differences in methodology. The numbers that we use to calculate MAPs and ARPMAP are based on internal data. While these numbers are based on what we believe to be reasonable judgments and estimates for the applicable period of measurement, there are inherent challenges in measuring usage and engagement. We regularly review and may adjust our processes for calculating our internal metrics to improve their accuracy. AppLovin Corporation / 3Q24 Shareholder Letter 8
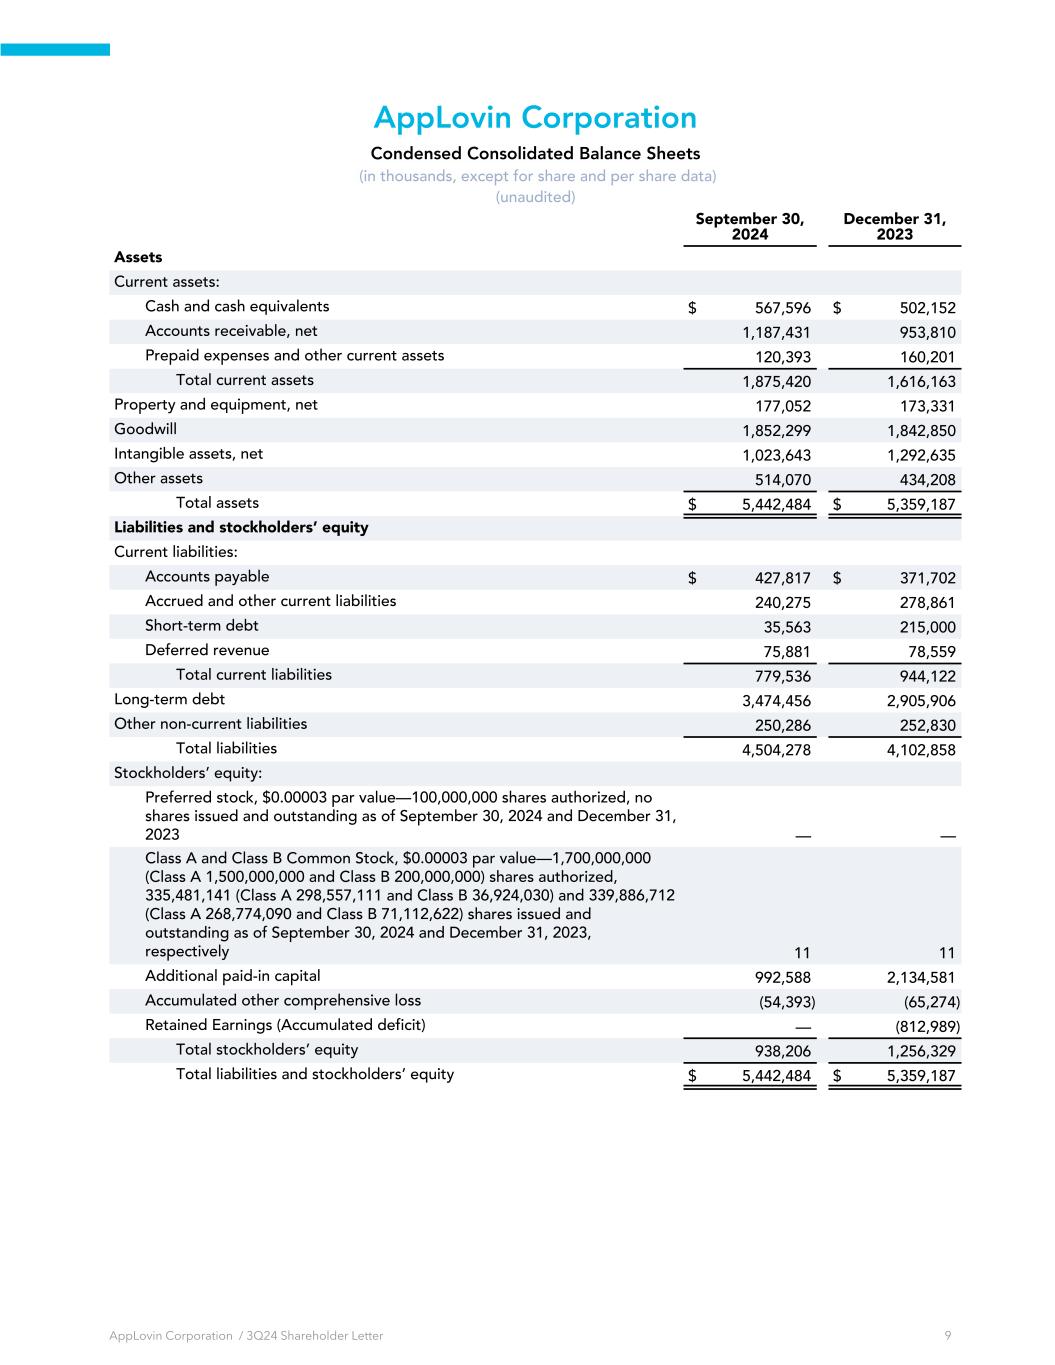
AppLovin Corporation Condensed Consolidated Balance Sheets (in thousands, except for share and per share data) (unaudited) September 30, 2024 December 31, 2023 Assets Current assets: Cash and cash equivalents $ 567,596 $ 502,152 Accounts receivable, net 1,187,431 953,810 Prepaid expenses and other current assets 120,393 160,201 Total current assets 1,875,420 1,616,163 Property and equipment, net 177,052 173,331 Goodwill 1,852,299 1,842,850 Intangible assets, net 1,023,643 1,292,635 Other assets 514,070 434,208 Total assets $ 5,442,484 $ 5,359,187 Liabilities and stockholders’ equity Current liabilities: Accounts payable $ 427,817 $ 371,702 Accrued and other current liabilities 240,275 278,861 Short-term debt 35,563 215,000 Deferred revenue 75,881 78,559 Total current liabilities 779,536 944,122 Long-term debt 3,474,456 2,905,906 Other non-current liabilities 250,286 252,830 Total liabilities 4,504,278 4,102,858 Stockholders’ equity: Preferred stock, $0.00003 par value—100,000,000 shares authorized, no shares issued and outstanding as of September 30, 2024 and December 31, 2023 — — Class A and Class B Common Stock, $0.00003 par value—1,700,000,000 (Class A 1,500,000,000 and Class B 200,000,000) shares authorized, 335,481,141 (Class A 298,557,111 and Class B 36,924,030) and 339,886,712 (Class A 268,774,090 and Class B 71,112,622) shares issued and outstanding as of September 30, 2024 and December 31, 2023, respectively 11 11 Additional paid-in capital 992,588 2,134,581 Accumulated other comprehensive loss (54,393) (65,274) Retained Earnings (Accumulated deficit) — (812,989) Total stockholders’ equity 938,206 1,256,329 Total liabilities and stockholders’ equity $ 5,442,484 $ 5,359,187 AppLovin Corporation / 3Q24 Shareholder Letter 9
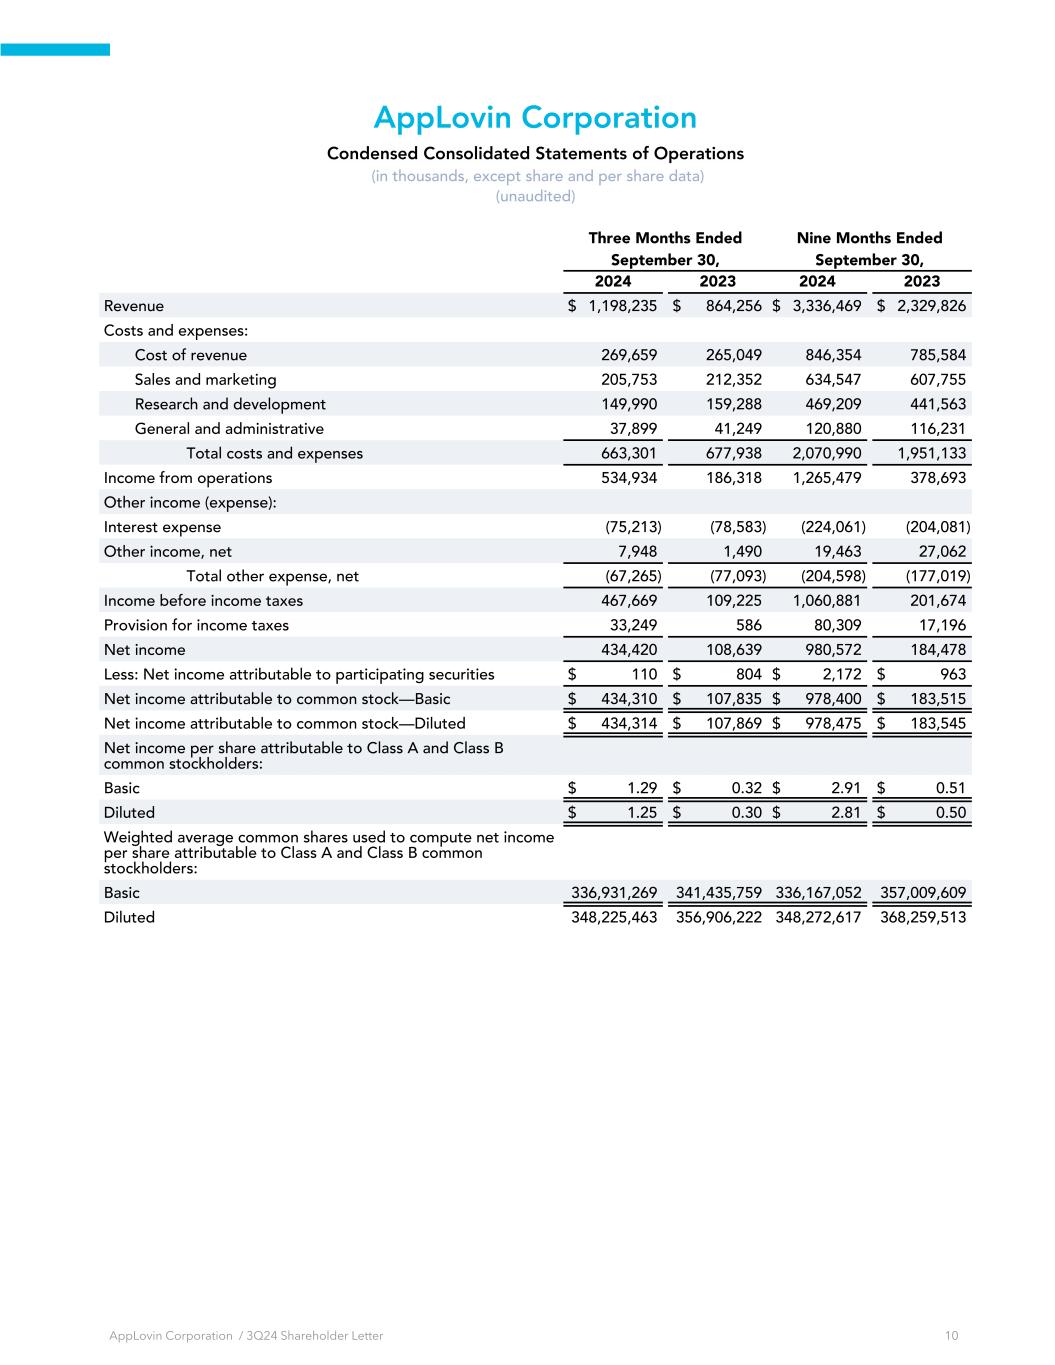
AppLovin Corporation Condensed Consolidated Statements of Operations (in thousands, except share and per share data) (unaudited) Three Months Ended Nine Months Ended September 30, September 30, 2024 2023 2024 2023 Revenue $ 1,198,235 $ 864,256 $ 3,336,469 $ 2,329,826 Costs and expenses: Cost of revenue 269,659 265,049 846,354 785,584 Sales and marketing 205,753 212,352 634,547 607,755 Research and development 149,990 159,288 469,209 441,563 General and administrative 37,899 41,249 120,880 116,231 Total costs and expenses 663,301 677,938 2,070,990 1,951,133 Income from operations 534,934 186,318 1,265,479 378,693 Other income (expense): Interest expense (75,213) (78,583) (224,061) (204,081) Other income, net 7,948 1,490 19,463 27,062 Total other expense, net (67,265) (77,093) (204,598) (177,019) Income before income taxes 467,669 109,225 1,060,881 201,674 Provision for income taxes 33,249 586 80,309 17,196 Net income 434,420 108,639 980,572 184,478 Less: Net income attributable to participating securities $ 110 $ 804 $ 2,172 $ 963 Net income attributable to common stock—Basic $ 434,310 $ 107,835 $ 978,400 $ 183,515 Net income attributable to common stock—Diluted $ 434,314 $ 107,869 $ 978,475 $ 183,545 Net income per share attributable to Class A and Class B common stockholders: Basic $ 1.29 $ 0.32 $ 2.91 $ 0.51 Diluted $ 1.25 $ 0.30 $ 2.81 $ 0.50 Weighted average common shares used to compute net income per share attributable to Class A and Class B common stockholders: Basic 336,931,269 341,435,759 336,167,052 357,009,609 Diluted 348,225,463 356,906,222 348,272,617 368,259,513 AppLovin Corporation / 3Q24 Shareholder Letter 10

AppLovin Corporation Condensed Consolidated Statements of Cash Flows (in thousands) (unaudited) Nine Months Ended September 30, 2024 2023 Operating Activities Net income $ 980,572 $ 184,478 Adjustments to reconcile net income to operating activities: Amortization, depreciation and write-offs 320,843 369,897 Stock-based compensation 275,534 275,058 Other 17,229 21,826 Changes in operating assets and liabilities: Accounts receivable (237,530) (146,796) Prepaid expenses and other assets 33,199 (29,484) Accounts payable 55,575 7,955 Accrued and other liabilities (47,414) 34,588 Net cash provided by operating activities 1,398,008 717,522 Investing Activities Purchase of non-marketable equity securities (76,983) (16,934) Acquisition of intangible assets (18,289) (51,816) Other investing activities (11,115) (2,275) Net cash used in investing activities (106,387) (71,025) Financing Activities Repurchases of stock (980,672) (1,153,593) Principal repayments of debt (686,754) (490,494) Payment of withholding taxes related to net share settlement of equity awards (644,442) (115,846) Payments of licensed asset obligation — (15,254) Proceeds from issuance of debt 1,072,330 395,281 Proceeds from issuance of common stock upon exercise of stock options and purchase of ESPP shares 28,800 19,878 Other financing activities (15,949) (32,239) Net cash used in financing activities (1,226,687) (1,392,267) Effect of foreign exchange rate on cash and cash equivalents 510 (2,223) Net increase (decrease) in cash and cash equivalents 65,444 (747,993) Cash and cash equivalents at beginning of the period 502,152 1,080,484 Cash and cash equivalents at end of the period $ 567,596 $ 332,491 AppLovin Corporation / 3Q24 Shareholder Letter 11
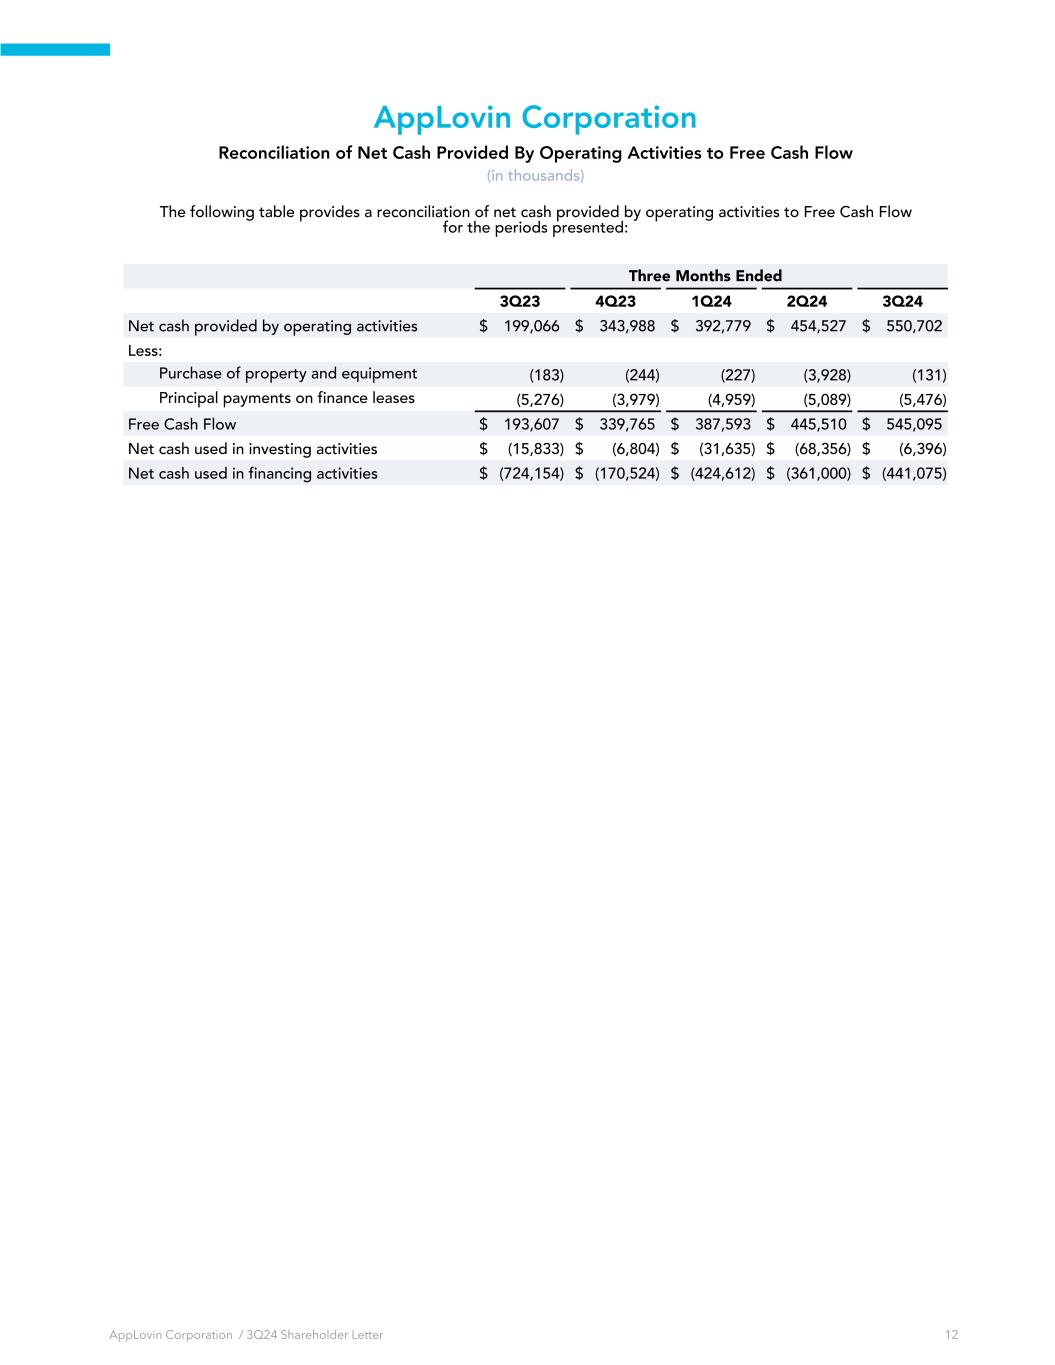
AppLovin Corporation Reconciliation of Net Cash Provided By Operating Activities to Free Cash Flow (in thousands) The following table provides a reconciliation of net cash provided by operating activities to Free Cash Flow for the periods presented: Three Months Ended 3Q23 4Q23 1Q24 2Q24 3Q24 Net cash provided by operating activities $ 199,066 $ 343,988 $ 392,779 $ 454,527 $ 550,702 Less: Purchase of property and equipment (183) (244) (227) (3,928) (131) Principal payments on finance leases (5,276) (3,979) (4,959) (5,089) (5,476) Free Cash Flow $ 193,607 $ 339,765 $ 387,593 $ 445,510 $ 545,095 Net cash used in investing activities $ (15,833) $ (6,804) $ (31,635) $ (68,356) $ (6,396) Net cash used in financing activities $ (724,154) $ (170,524) $ (424,612) $ (361,000) $ (441,075) AppLovin Corporation / 3Q24 Shareholder Letter 12

AppLovin Corporation Reconciliation of Net Income to Adjusted EBITDA (in thousands) The following table provides our Adjusted EBITDA and Adjusted EBITDA margin and a reconciliation of Net Income to Adjusted EBITDA for the periods presented: Three Months Ended 3Q23 4Q23 1Q24 2Q24 3Q24 Revenue $ 864,256 $ 953,261 $ 1,058,115 $ 1,080,119 $ 1,198,235 Net income $ 108,639 $ 172,233 $ 236,183 $ 309,969 $ 434,420 Net Margin 13 % 18 % 22 % 29 % 36 % Interest expense 78,583 71,584 74,182 74,666 75,213 Other (income) expense, net (771) 18,528 (3,397) (9,241) (4,500) Provision for income taxes 586 6,663 31,762 15,298 33,249 Amortization, depreciation and write-offs 121,797 119,111 112,667 108,541 99,635 Loss on disposal of long lived assets — — 1,646 — — Non-operating foreign exchange loss (gain) (613) (65) 106 (330) (935) Stock-based compensation 110,839 88,049 95,253 98,724 81,557 Transaction-related expense 231 52 369 485 26 Restructuring costs — — — 3,082 2,951 Total adjustments 310,652 303,922 312,588 291,225 287,196 Adjusted EBITDA $ 419,291 $ 476,155 $ 548,771 $ 601,194 $ 721,616 Adjusted EBITDA Margin 49 % 50 % 52 % 56 % 60 % AppLovin Corporation / 3Q24 Shareholder Letter 13
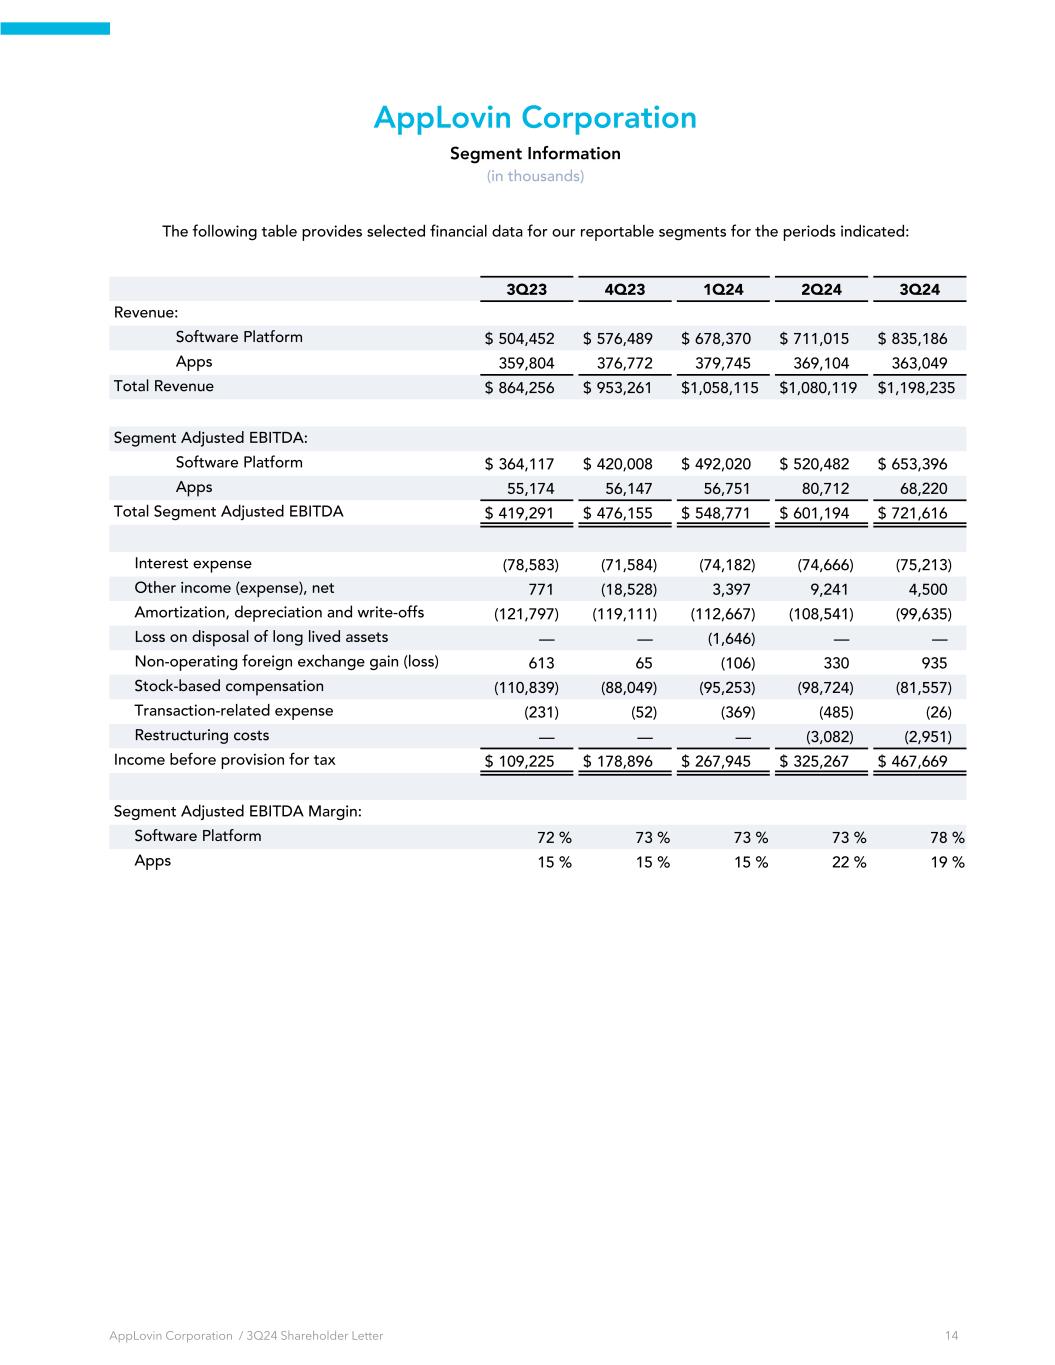
AppLovin Corporation Segment Information (in thousands) The following table provides selected financial data for our reportable segments for the periods indicated: 3Q23 4Q23 1Q24 2Q24 3Q24 Revenue: Software Platform $ 504,452 $ 576,489 $ 678,370 $ 711,015 $ 835,186 Apps 359,804 376,772 379,745 369,104 363,049 Total Revenue $ 864,256 $ 953,261 $ 1,058,115 $ 1,080,119 $ 1,198,235 Segment Adjusted EBITDA: Software Platform $ 364,117 $ 420,008 $ 492,020 $ 520,482 $ 653,396 Apps 55,174 56,147 56,751 80,712 68,220 Total Segment Adjusted EBITDA $ 419,291 $ 476,155 $ 548,771 $ 601,194 $ 721,616 Interest expense (78,583) (71,584) (74,182) (74,666) (75,213) Other income (expense), net 771 (18,528) 3,397 9,241 4,500 Amortization, depreciation and write-offs (121,797) (119,111) (112,667) (108,541) (99,635) Loss on disposal of long lived assets — — (1,646) — — Non-operating foreign exchange gain (loss) 613 65 (106) 330 935 Stock-based compensation (110,839) (88,049) (95,253) (98,724) (81,557) Transaction-related expense (231) (52) (369) (485) (26) Restructuring costs — — — (3,082) (2,951) Income before provision for tax $ 109,225 $ 178,896 $ 267,945 $ 325,267 $ 467,669 Segment Adjusted EBITDA Margin: Software Platform 72 % 73 % 73 % 73 % 78 % Apps 15 % 15 % 15 % 22 % 19 % AppLovin Corporation / 3Q24 Shareholder Letter 14