Investor Update November 14, 2023 NYSE: AMTB amerantbank.com
Being the bank of choice in the markets we serve. Table of Contents 1 2 3 4 About Us Company Updates Performance Updates Community Updates Investor Update | 2
Important Notices and Disclosures Forward-Looking Statements This presentation contains “forward-looking statements” including statements with respect to the Company’s objectives, expectations and intentions and other statements that are not historical facts. All statements other than statements of historical fact are statements that could be forward-looking statements. You can identify these forward-looking statements through our use of words such as “may,” “will,” “anticipate,” “assume,” “should,” “indicate,” “would,” “believe,” “contemplate,” “expect,” “estimate,” “continue,” “plan,” “point to,” “project,” “could,” “intend,” “target,” “goals,” “outlooks,” “modeled,” “dedicated,” “create,” and other similar words and expressions of the future. Forward-looking statements, including those relating to our beliefs, plans, objectives, goals, expectations, anticipations, estimates and intentions, involve known and unknown risks, uncertainties and other factors, which may be beyond our control, and which may cause the Company’s actual results, performance, achievements, or financial condition to be materially different from future results, performance, achievements, or financial condition expressed or implied by such forward-looking statements. You should not rely on any forward-looking statements as predictions of future events. You should not expect us to update any forward-looking statements, except as required by law. All written or oral forward-looking statements attributable to us are expressly qualified in their entirety by this cautionary notice, together with those risks and uncertainties described in “Risk factors” in our annual report on Form 10-K for the fiscal year ended December 31, 2022 filed on March 1, 2023 (the “Form 10-K”), our quarterly report on Form 10-Q for the quarter ended March 31, 2023 filed on May 2, 2023, and in our other filings with the U.S. Securities and Exchange Commission (the “SEC”), which are available at the SEC’s website www.sec.gov. Interim Financial Information Unaudited financial information as of and for interim periods, including the three month periods ended September 30, 2023, June 30, 2023, March 31, 2023, December 31, 2022 and September 30, 2022, may not reflect our results of operations for our fiscal year ending, or financial condition as of December 31, 2023, or any other period of time or date. As previously disclosed in the Form 10-K, the Company adopted the new guidance on accounting for current expected credit losses on financial instruments (“CECL”) effective as of January 1, 2022. Quarterly amounts previously reported on our quarterly reports on Form 10-Q for the periods ended March 31, 2022, June 30, 2022 and September 30, 2022 do not reflect the adoption of CECL. In the fourth quarter of 2022, the Company recorded a provision for credit losses totaling $20.9 million, including $11.1 million related to the retroactive effect of adopting CECL for all previous quarterly periods in the year ended December 31, 2022, including loan growth and changes to macro-economic conditions during the period. Recast amounts included in the earnings release and accompanying presentation reflect the impacts of the adoption of CECL on each interim period of 2022. See the Form 10-K for more details on the adoption of CECL and related effects to quarterly results for each quarter in the year ended December 31, 2022. Non-GAAP Financial Measures The Company supplements its financial results that are determined in accordance with accounting principles generally accepted in the United States of America (“GAAP”) with non-GAAP financial measures, such as “pre-provision net revenue (PPNR)”, “core pre-provision net revenue (Core PPNR)”, “core noninterest income”, “core noninterest expenses”, “core net income”, “core earnings per share (basic and diluted)”, “core return on assets (Core ROA)”, “core return on equity (Core ROE)”, “core efficiency ratio”, “tangible stockholders’ equity (book value) per common share”, “tangible common equity ratio, adjusted for unrealized losses on debt securities held to maturity”, and “tangible stockholders’ equity (book value) per common share, adjusted for unrealized losses on debt securities held to maturity”, and “tangible stockholders’ book value per common share, adjusted for unrealized losses on securities held to maturity”. This supplemental information is not required by or is not presented in accordance with GAAP. The Company refers to these financial measures and ratios as “non-GAAP financial measures” and they should not be considered in isolation or as a substitute for the GAAP measures presented herein. We use certain non-GAAP financial measures, including those mentioned above, both to explain our results to shareholders and the investment community and in the internal evaluation and management of our businesses. Our management believes that these non-GAAP financial measures and the information they provide are useful to investors since these measures permit investors to view our performance using the same tools that our management uses to evaluate our past performance and prospects for future performance, especially in light of the additional costs we have incurred in connection with the Company’s restructuring activities that began in 2018 and continued in 2023, including the effect of non-core banking activities such as the sale of loans and securities and other repossessed assets, the valuation of securities, derivatives, loans held for sale and other real estate owned, impairment of investments, early repayment of FHLB advances, and other non-recurring actions intended to improve customer service and operating performance. While we believe that these non-GAAP financial measures are useful in evaluating our performance, this information should be considered as supplemental and not as a substitute for or superior to the related financial information prepared in accordance with GAAP. Additionally, these non-GAAP financial measures may differ from similar measures presented by other companies. Appendix 1 reconciles these non-GAAP financial measures to reported results. Investor Update | 3

About Us
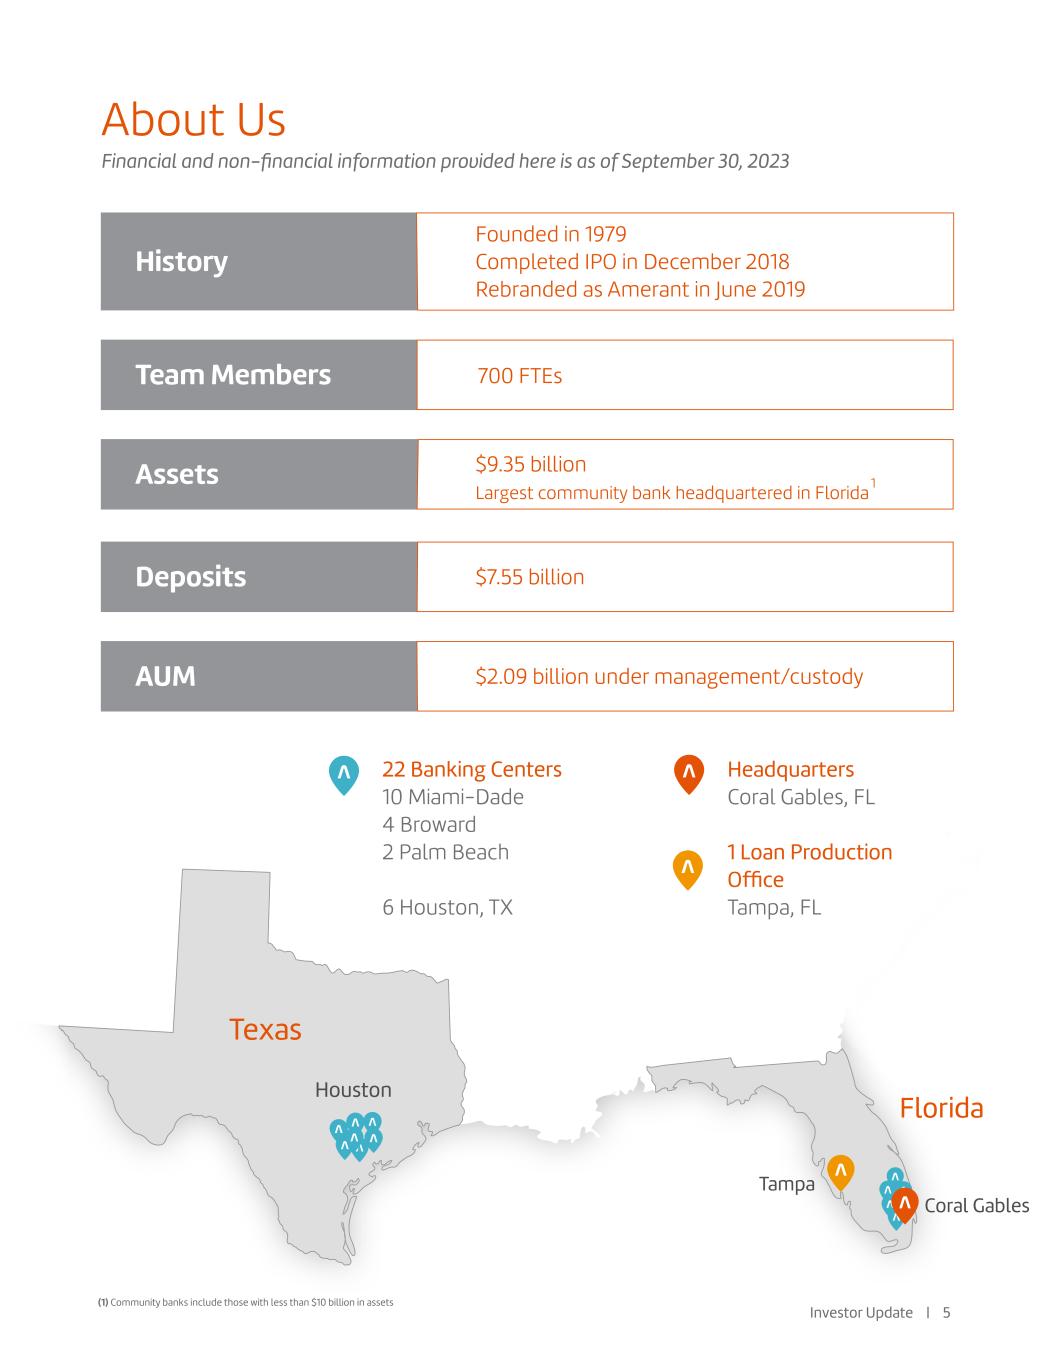
About Us History Team Members Assets Deposits AUM Founded in 1979 Completed IPO in December 2018 Rebranded as Amerant in June 2019 700 FTEs $9.35 billion Largest community bank headquartered in Florida $7.55 billion $2.09 billion under management/custody 22 Banking Centers 10 Miami-Dade 4 Broward 2 Palm Beach 6 Houston, TX Headquarters Coral Gables, FL 1 Loan Production Office Tampa, FL 1 (1) Community banks include those with less than $10 billion in assets Investor Update | 5 Financial and non-financial information provided here is as of September 30, 2023
Our Investment Proposition Established franchise with high scarcity value; presence in attractive, high-growth markets of Miami/South Florida, Tampa and Houston. Strong and diverse deposit base; organic, deposits-first focus. Strong reserve coverage and disciplined credit culture. Well capitalized; committed to enhancing shareholder returns via dynamic capital management. Nearing end of our transformation phase. Investor Update | 6 Executive leadership team in place Recently completed core conversion; now operating with a new, fully integrated, state-of-the-art core tech system to better serve our customers and team members New locations nearing completion Transferred listing to the NYSE We have the strong foundation now to enable us to become a consistent top-quartile performer.
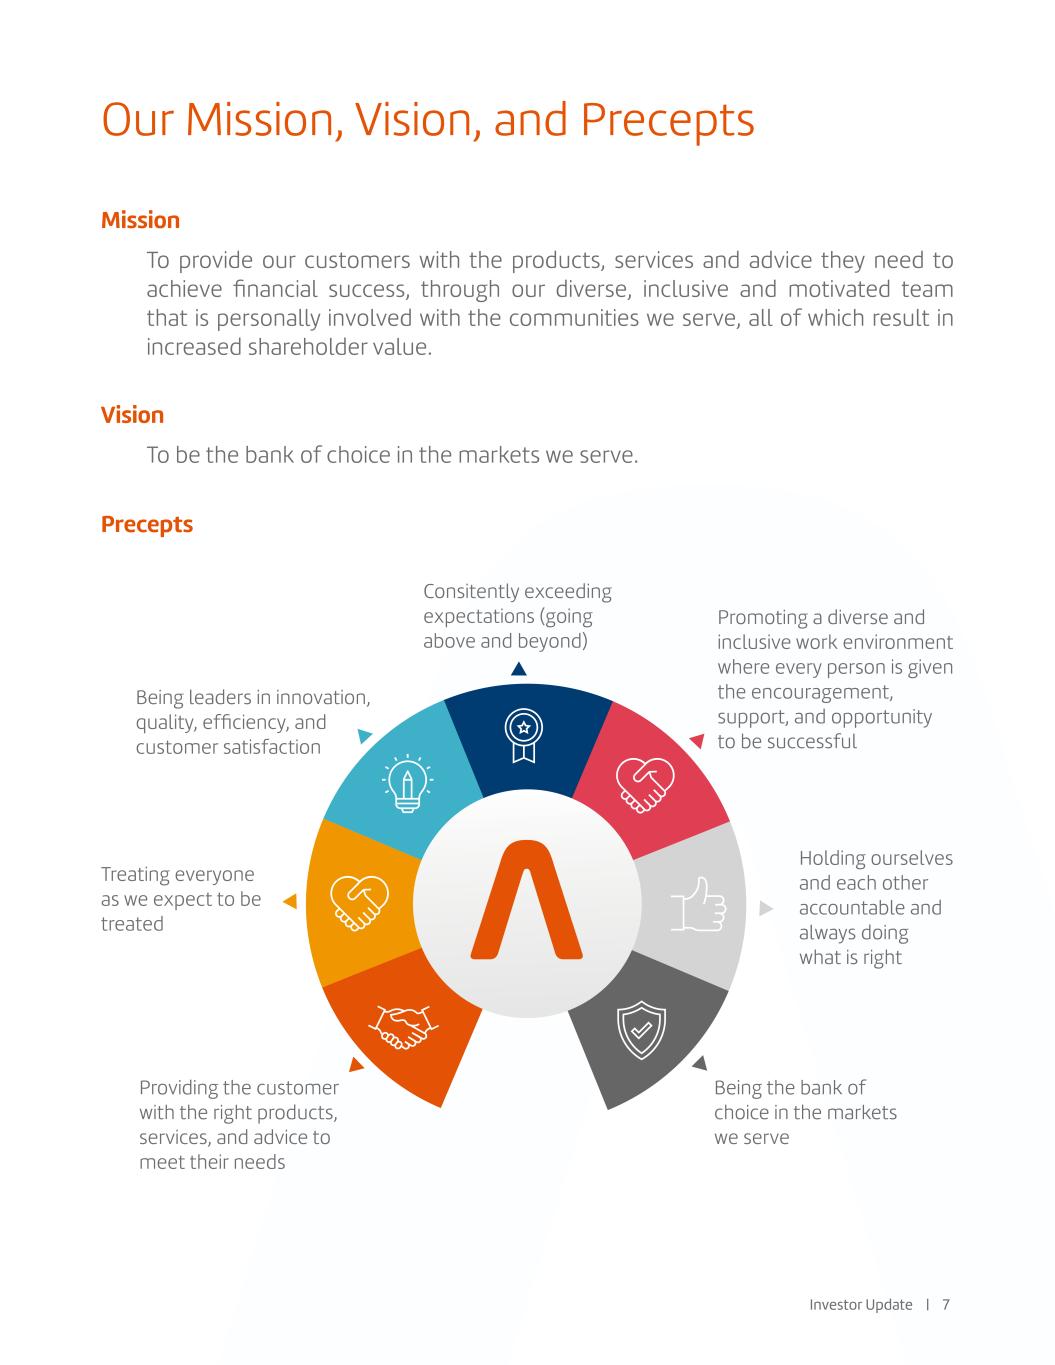
Being leaders in innovation, quality, efficiency, and customer satisfaction Our Mission, Vision, and Precepts Mission Vision Precepts To provide our customers with the products, services and advice they need to achieve financial success, through our diverse, inclusive and motivated team that is personally involved with the communities we serve, all of which result in increased shareholder value. To be the bank of choice in the markets we serve. Consitently exceeding expectations (going above and beyond) Promoting a diverse and inclusive work environment where every person is given the encouragement, support, and opportunity to be successful Holding ourselves and each other accountable and always doing what is right Treating everyone as we expect to be treated Being the bank of choice in the markets we serve Providing the customer with the right products, services, and advice to meet their needs Investor Update | 7

Experienced Leadership Team Jerry Plush | Chairman and CEO Mr. Plush serves as the Company’s Chairman, President, and CEO since June 8, 2022, having served previously as Vice-Chairman & CEO since March 20, 2021, and as Vice Chairman since February 15, 2021. Mr. Plush is a highly respected financial services industry professional with over 35 years of senior executive leadership experience. Sharymar Calderon | EVP, Chief Financial Officer Sharymar Calderón Yépez was appointed Executive Vice President, Chief Financial Officer (CFO) in June 2023. Calderón is responsible for Amerant’s financial management, including treasury, financial reporting and accounting, financial analysis, investor relations & sustainability, internal controls and corporate tax. Alberto Capriles | SEVP, Chief Risk Officer Alberto Capriles was appointed Senior Executive Vice President in January 2023 and named Chief Risk Officer in February 2018. He is responsible for all enterprise risk management oversight, including credit, market, operational and information security risk. Juan Esterripa | SEVP, Head of Commercial Banking Juan Esterripa serves as Amerant Bank’s SEVP, Head of Commercial Banking since April 2023. He is a seasoned banking professional with significant experience in corporate and commercial banking. In his role, Esterripa oversees multiple business sectors, including commercial banking, commercial real estate, syndications, specialty finance, and treasury management. Carlos Iafigliola | SEVP, Chief Operating Officer Carlos Iafigliola was appointed Senior Executive Vice President, Chief Operating Officer (COO) in June 2023. He is responsible for Amerant’s loan and deposit operations, project management, technology services, procurement, facilities, strategy and digital. Prior to his appointment as COO, Iafigliola served as CFO since May 2020. Howard Levine | SEVP, Head of Consumer Banking Howard Levine was appointed Senior Executive Vice President in January 2023. He has served as Head of Consumer Banking since joining Amerant in June 2022. Levine oversees the Private Client Group, Wealth Management, Small Business Banking, Retail Banking, and Amerant Mortgage. Most recently, he served as EVP and Chief Revenue Officer at Amerant Mortgage. Mariola Sanchez | SEVP, Chief People Officer Mariola Triana Sanchez leads Amerant Bank’s approach to people and organizational culture as the bank’s Chief People Officer. Previously serving as Amerant’s General Counsel, Mariola was appointed to her new position in June 2022. Laura Rossi | SVP, Head of Investor Relations & Sustainability Laura Rossi was appointed Senior Vice President and Head of Investor Relations & Sustainability in August 2022, having served previously as SVP, Head of Investor Relations since March 2018. In her role, Rossi spearheads Amerant’s relationship with the investment community and rating agencies, as well as the Company’s ESG program execution and strategy. Investor Update | 8
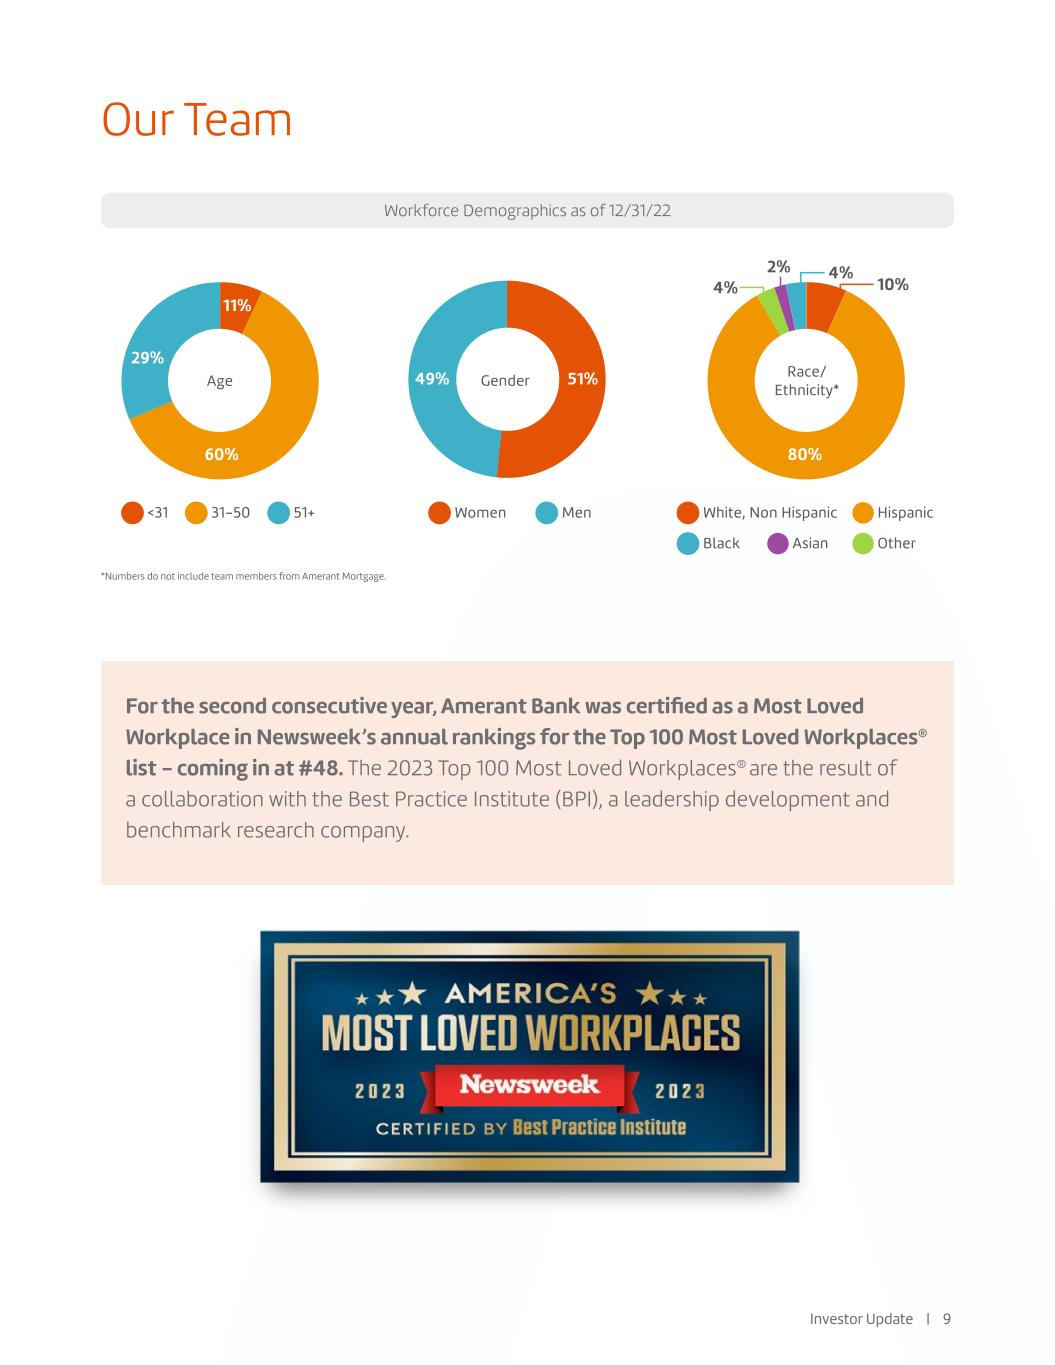
Our Team Workforce Demographics as of 12/31/22 For the second consecutive year, Amerant Bank was certified as a Most Loved Workplace in Newsweek’s annual rankings for the Top 100 Most Loved Workplaces® list - coming in at #48. The 2023 Top 100 Most Loved Workplaces® are the result of a collaboration with the Best Practice Institute (BPI), a leadership development and benchmark research company. *Numbers do not include team members from Amerant Mortgage. White, Non Hispanic Hispanic Black OtherAsian Women Men<31 31-50 51+ 49% 80% 10% 4% 4% 2% 51% 60% 11% 29% Age Gender Race/ Ethnicity* Investor Update | 9

Company Updates
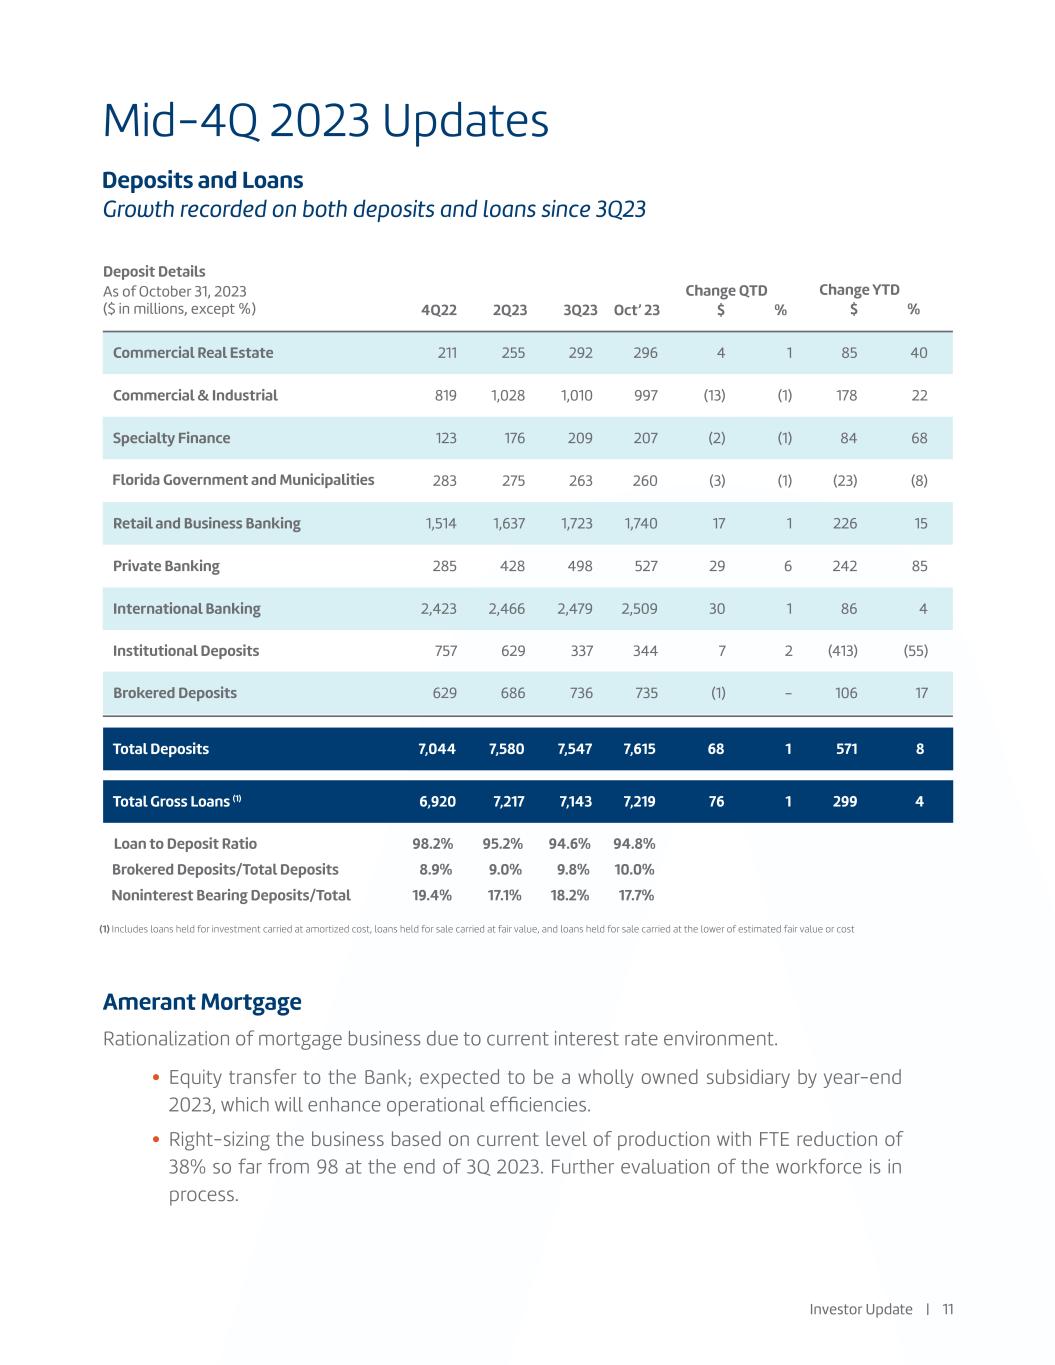
Mid-4Q 2023 Updates Amerant Mortgage Rationalization of mortgage business due to current interest rate environment. Investor Update | 11 Deposits and Loans Growth recorded on both deposits and loans since 3Q23 Equity transfer to the Bank; expected to be a wholly owned subsidiary by year-end 2023, which will enhance operational efficiencies. Right-sizing the business based on current level of production with FTE reduction of 38% so far from 98 at the end of 3Q 2023. Further evaluation of the workforce is in process. Deposit Details Commercial Real Estate Commercial & Industrial Specialty Finance Retail and Business Banking Florida Government and Municipalities Private Banking International Banking 4Q22 2Q23 3Q23 Oct’ 23 Change QTD 211 255 292 296 4 1 85 40 819 1,028 1,010 997 (13) (1) 178 22 123 176 209 207 (2) (1) 84 68 283 275 263 260 (3) (1) (23) (8) 1,514 1,637 1,723 1,740 17 1 226 15 285 428 498 527 29 6 242 85 2,423 2,466 2,479 2,509 30 1 86 4 Institutional Deposits 757 629 337 344 7 2 (413) (55) (1) Includes loans held for investment carried at amortized cost, loans held for sale carried at fair value, and loans held for sale carried at the lower of estimated fair value or cost Total Deposits 7,044 7,580 7,547 7,615 68 1 Total Gross Loans (1) 6,920 7,217 7,143 7,219 76 1 Loan to Deposit Ratio 98.2% 95.2% 94.6% 94.8% Brokered Deposits/Total Deposits 8.9% 9.0% 9.8% 10.0% Noninterest Bearing Deposits/Total 19.4% 17.1% 18.2% 17.7% Brokered Deposits 629 686 736 735 (1) - 106 17 $ % Change YTD $ % 571 8 299 4 As of October 31, 2023 ($ in millions, except %)
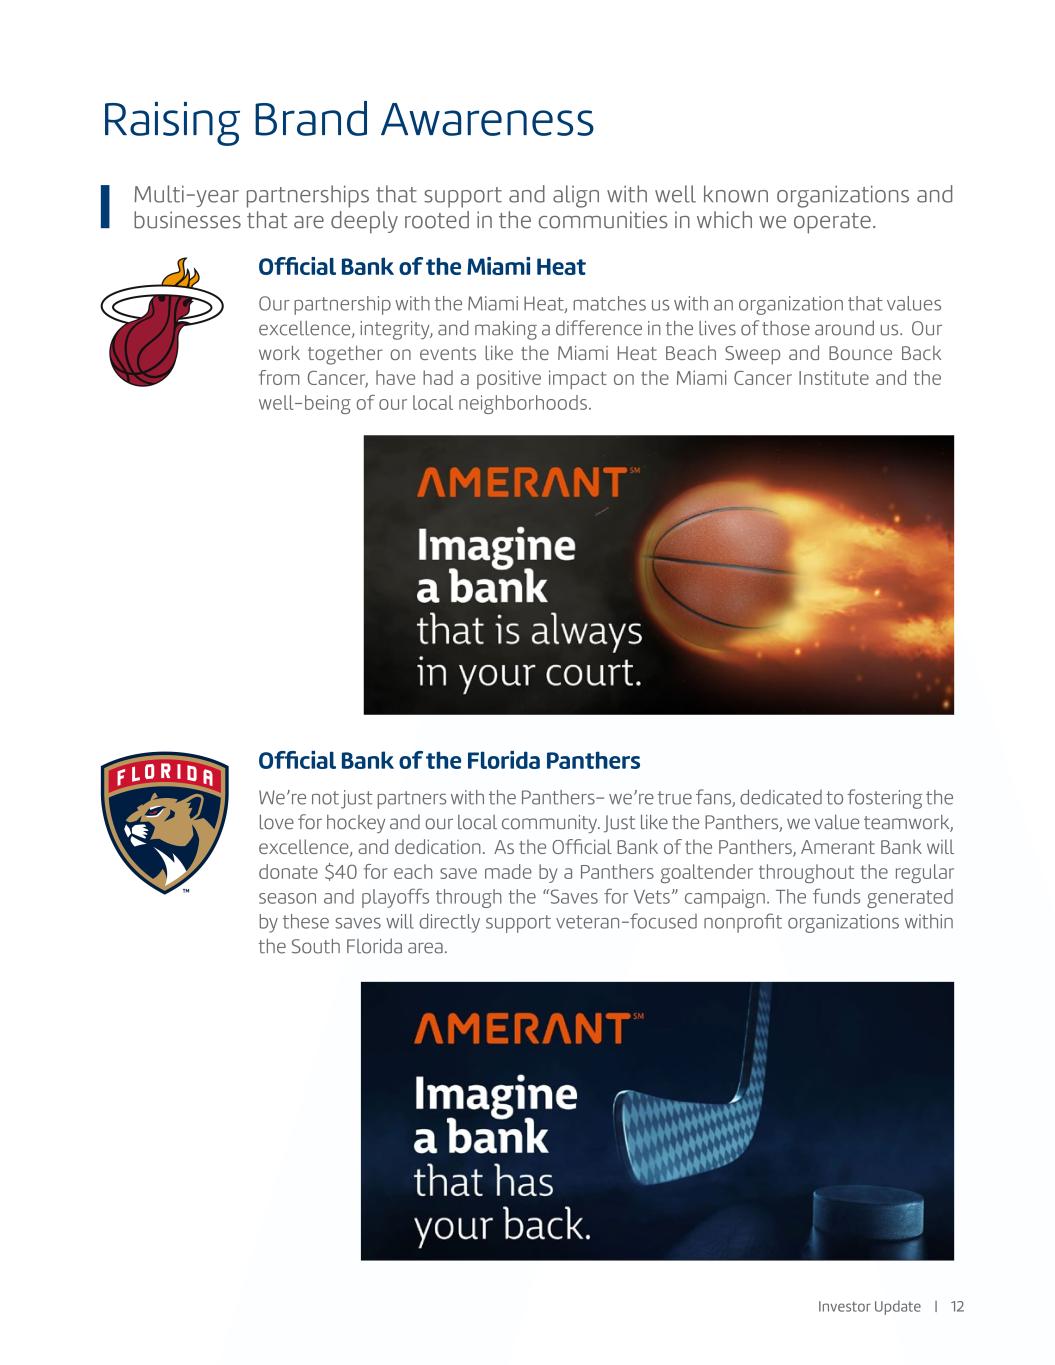
Raising Brand Awareness Official Bank of the Miami Heat Official Bank of the Florida Panthers Our partnership with the Miami Heat, matches us with an organization that values excellence, integrity, and making a difference in the lives of those around us. Our work together on events like the Miami Heat Beach Sweep and Bounce Back from Cancer, have had a positive impact on the Miami Cancer Institute and the well-being of our local neighborhoods. We’re not just partners with the Panthers– we’re true fans, dedicated to fostering the love for hockey and our local community. Just like the Panthers, we value teamwork, excellence, and dedication. As the Official Bank of the Panthers, Amerant Bank will donate $40 for each save made by a Panthers goaltender throughout the regular season and playoffs through the “Saves for Vets” campaign. The funds generated by these saves will directly support veteran-focused nonprofit organizations within the South Florida area. Multi-year partnerships that support and align with well known organizations and businesses that are deeply rooted in the communities in which we operate. Our branding - Imagine a bank image Investor Update | 12
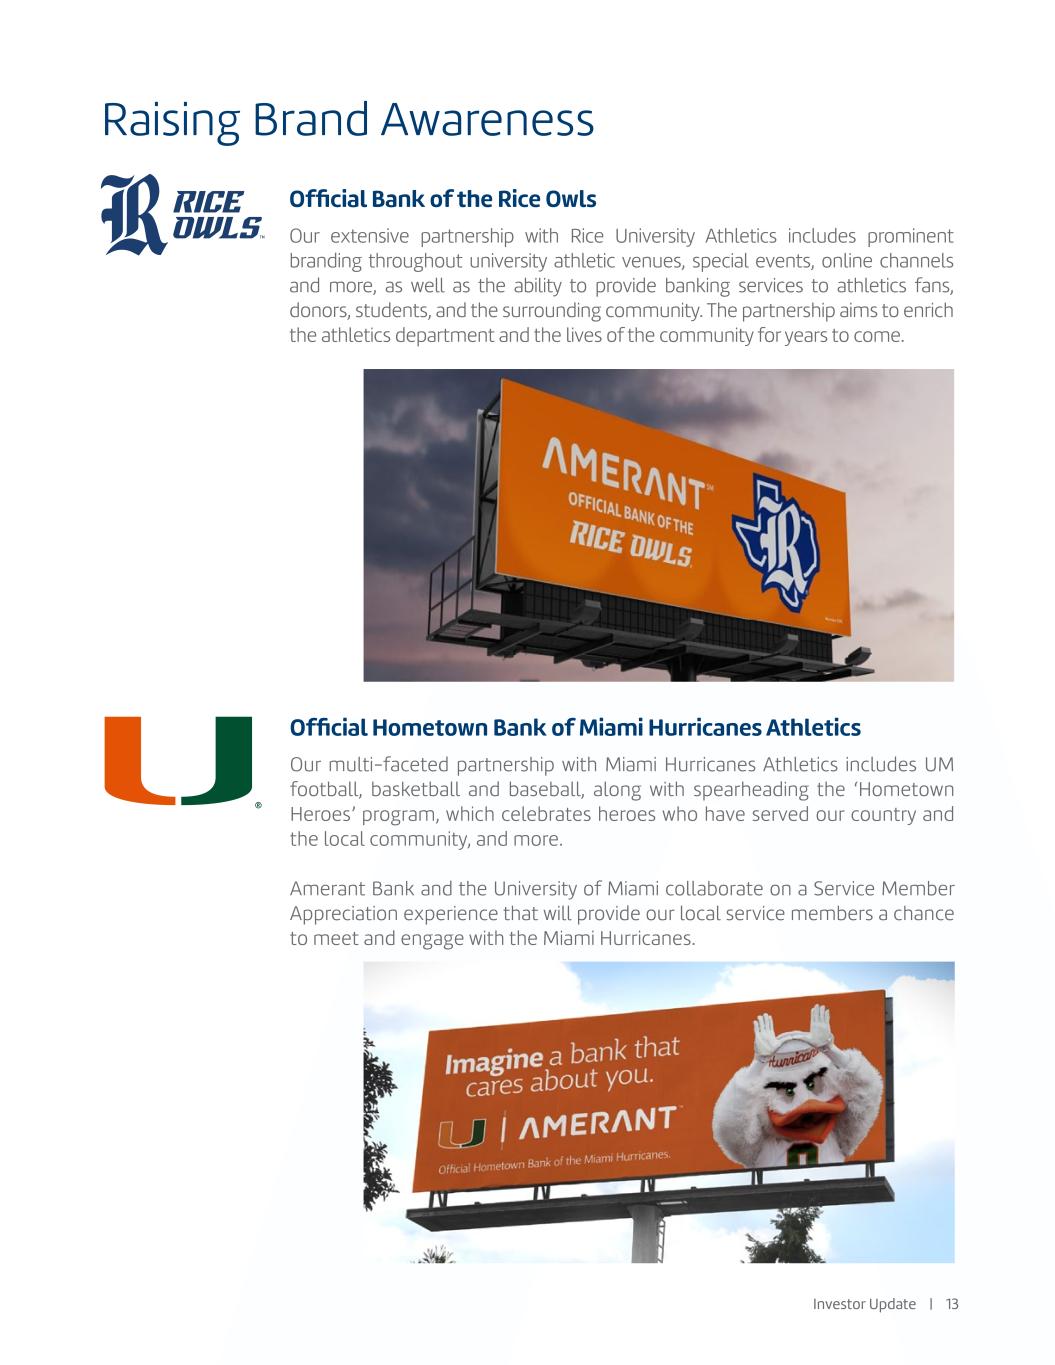
Raising Brand Awareness Official Hometown Bank of Miami Hurricanes Athletics Official Bank of the Rice Owls Our multi-faceted partnership with Miami Hurricanes Athletics includes UM football, basketball and baseball, along with spearheading the ‘Hometown Heroes’ program, which celebrates heroes who have served our country and the local community, and more. Amerant Bank and the University of Miami collaborate on a Service Member Appreciation experience that will provide our local service members a chance to meet and engage with the Miami Hurricanes. Our extensive partnership with Rice University Athletics includes prominent branding throughout university athletic venues, special events, online channels and more, as well as the ability to provide banking services to athletics fans, donors, students, and the surrounding community. The partnership aims to enrich the athletics department and the lives of the community for years to come. Investor Update | 13
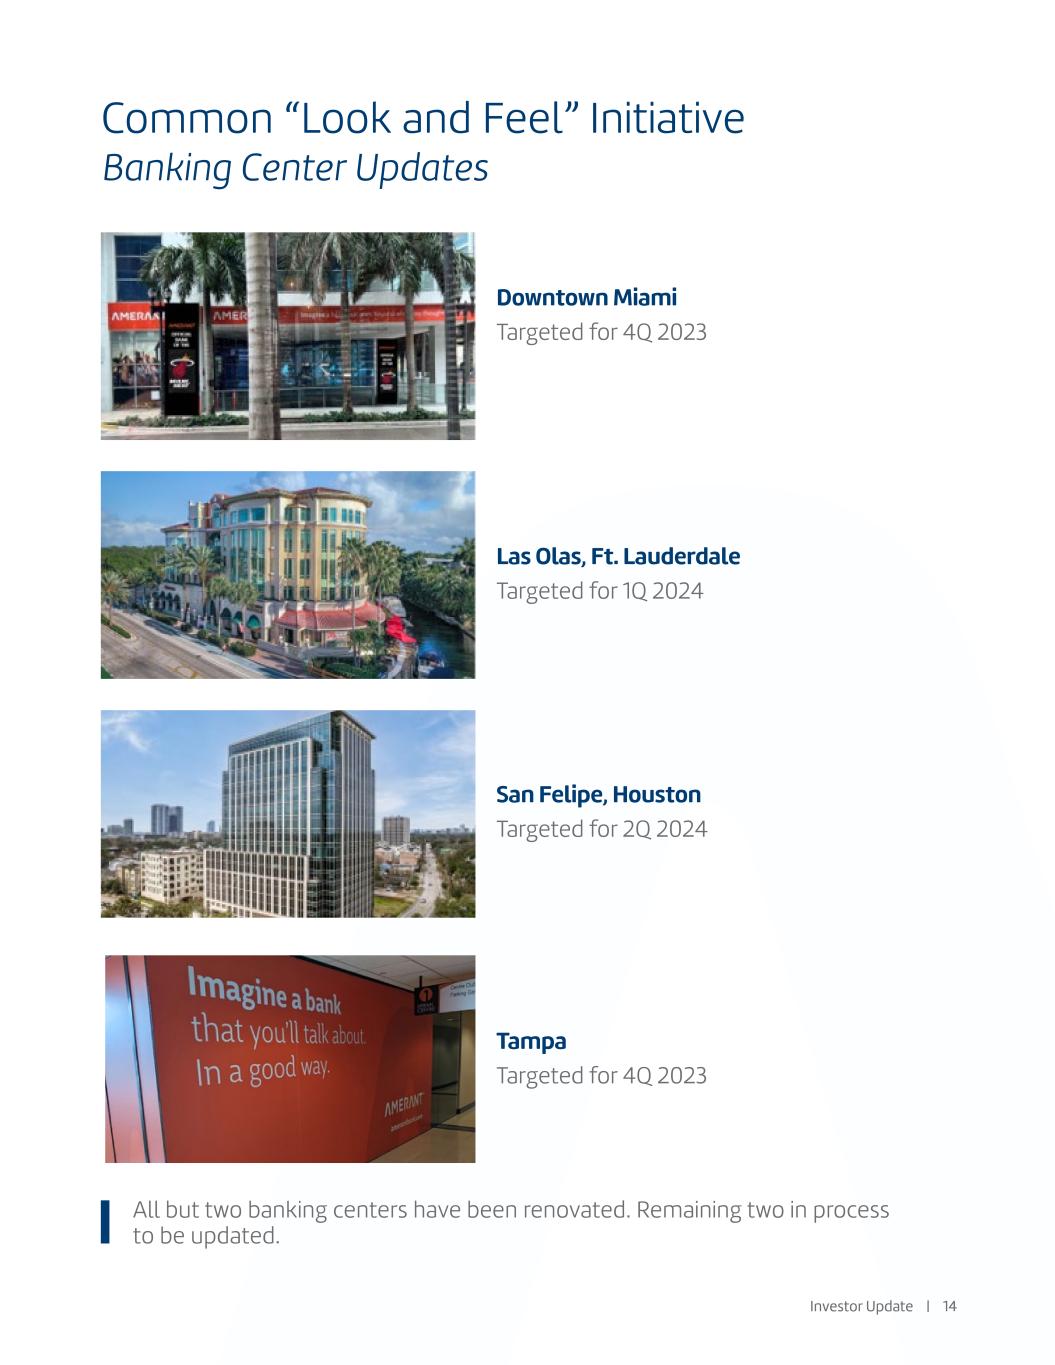
Common “Look and Feel” Initiative Banking Center Updates Downtown Miami Targeted for 4Q 2023 Las Olas, Ft. Lauderdale Targeted for 1Q 2024 San Felipe, Houston Targeted for 2Q 2024 Tampa Targeted for 4Q 2023 All but two banking centers have been renovated. Remaining two in process to be updated. Investor Update | 14
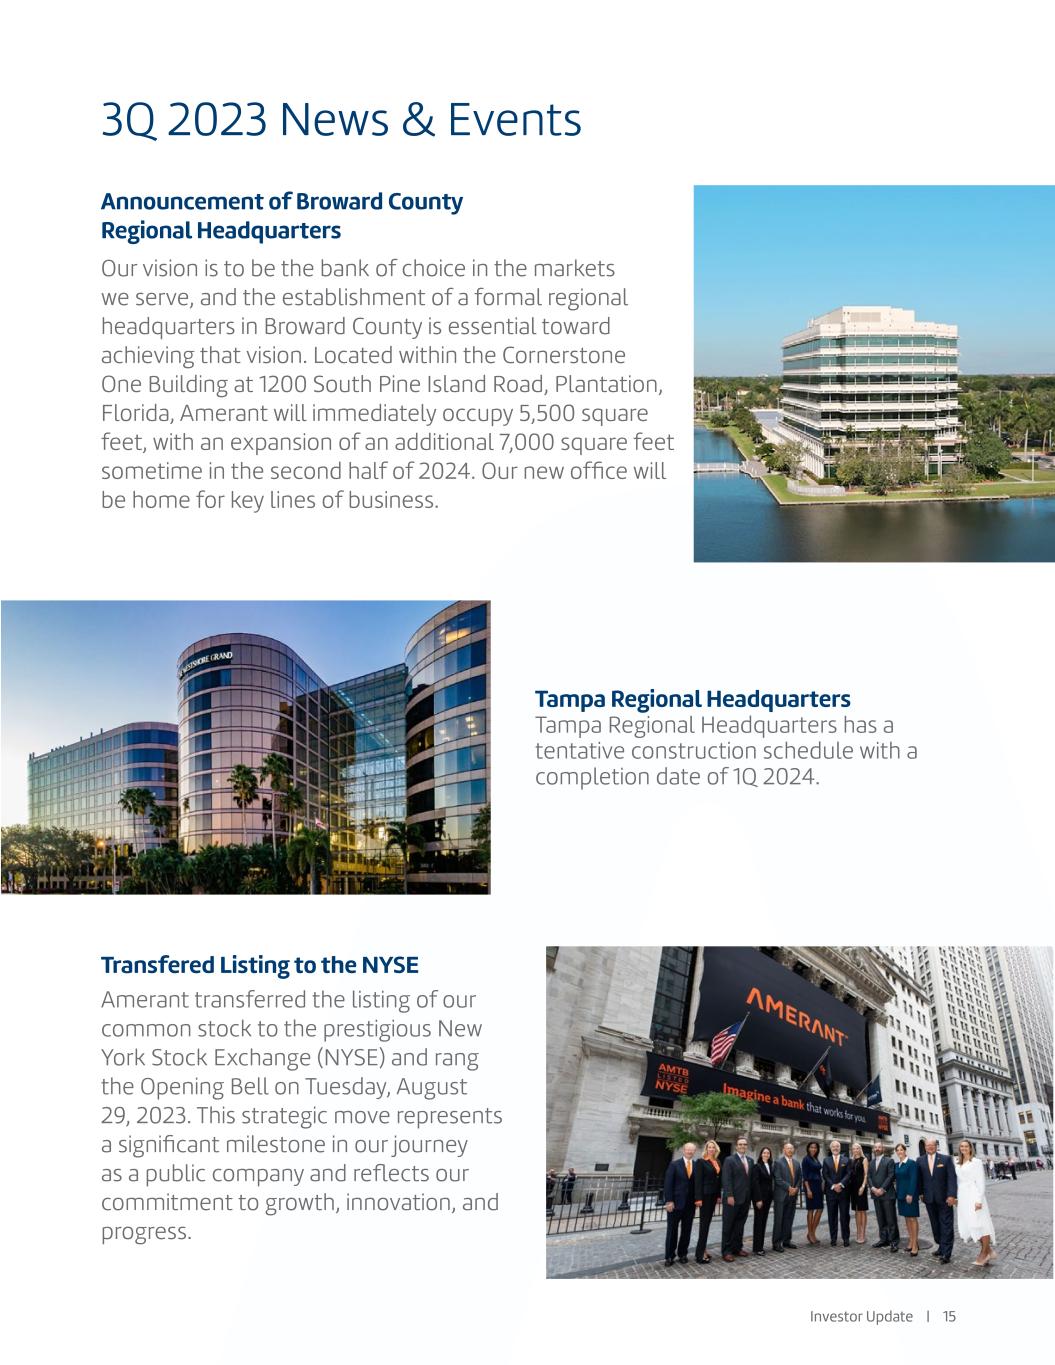
3Q 2023 News & Events Announcement of Broward County Regional Headquarters Our vision is to be the bank of choice in the markets we serve, and the establishment of a formal regional headquarters in Broward County is essential toward achieving that vision. Located within the Cornerstone One Building at 1200 South Pine Island Road, Plantation, Florida, Amerant will immediately occupy 5,500 square feet, with an expansion of an additional 7,000 square feet sometime in the second half of 2024. Our new office will be home for key lines of business. Transfered Listing to the NYSE Amerant transferred the listing of our common stock to the prestigious New York Stock Exchange (NYSE) and rang the Opening Bell on Tuesday, August 29, 2023. This strategic move represents a significant milestone in our journey as a public company and reflects our commitment to growth, innovation, and progress. Tampa Regional Headquarters Tampa Regional Headquarters has a tentative construction schedule with a completion date of 1Q 2024. Investor Update | 15
Performance Updates
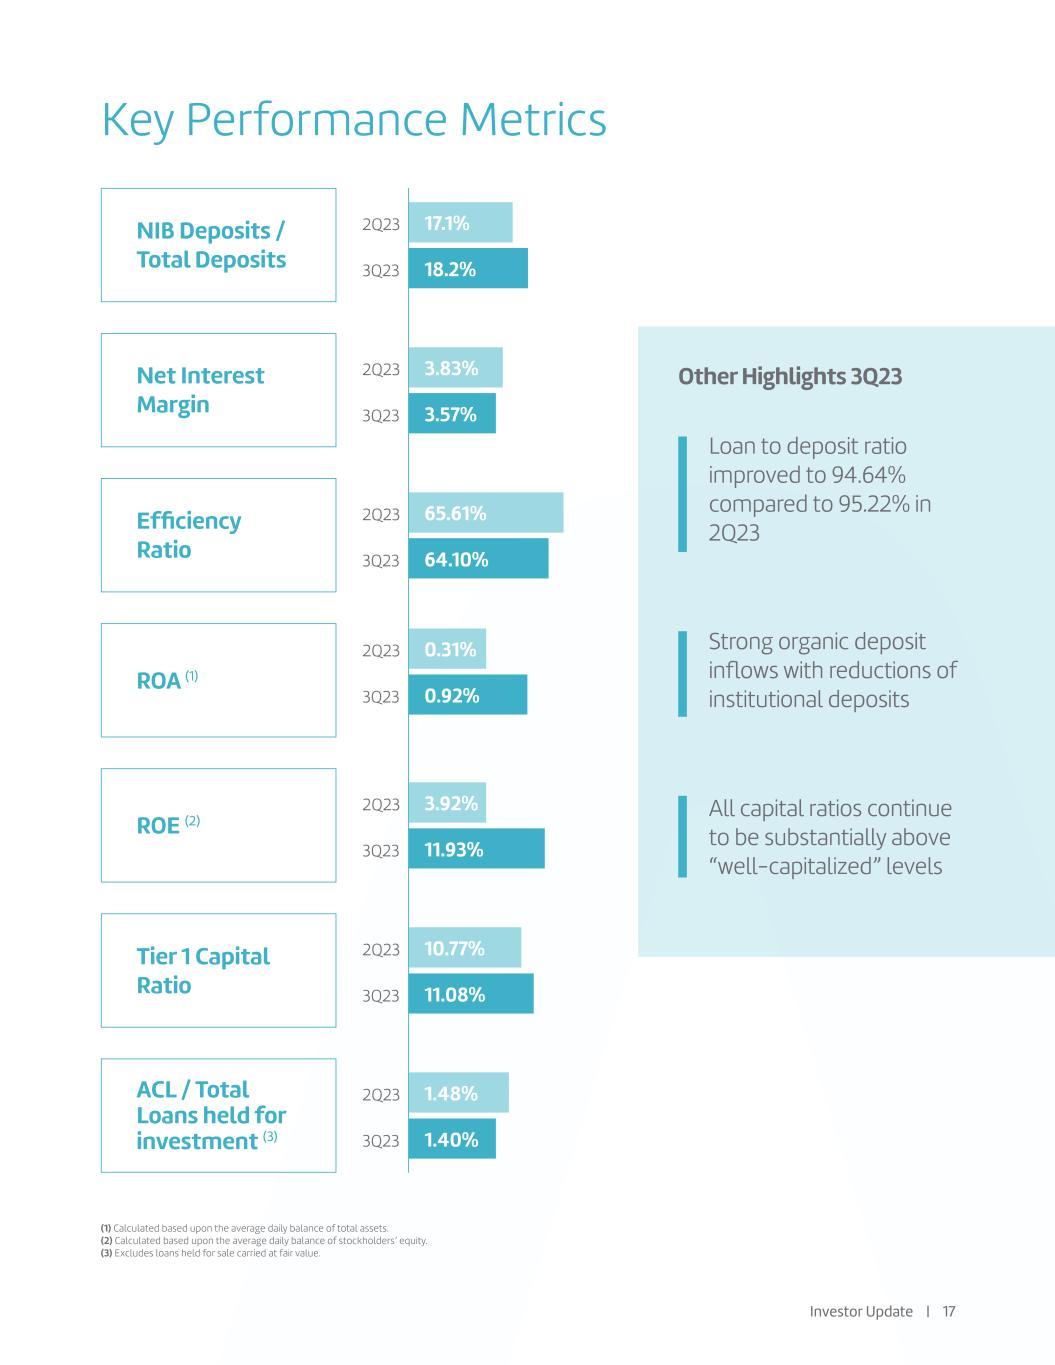
Key Performance Metrics NIB Deposits / Total Deposits Net Interest Margin Efficiency Ratio ROA (1) ROE (2) Tier 1 Capital Ratio ACL / Total Loans held for investment (3) Loan to deposit ratio improved to 94.64% compared to 95.22% in 2Q23 2Q23 17.1% 2Q23 3.83% 2Q23 65.61% 2Q23 0.31% 2Q23 3.92% 2Q23 10.77% 2Q23 1.48% 3Q23 18.2% 3Q23 3.57% 3Q23 64.10% 3Q23 0.92% 3Q23 11.93% 3Q23 11.08% 3Q23 1.40% Strong organic deposit inflows with reductions of institutional deposits Other Highlights 3Q23 All capital ratios continue to be substantially above “well-capitalized” levels Investor Update | 17 (1) Calculated based upon the average daily balance of total assets. (2) Calculated based upon the average daily balance of stockholders’ equity. (3) Excludes loans held for sale carried at fair value.
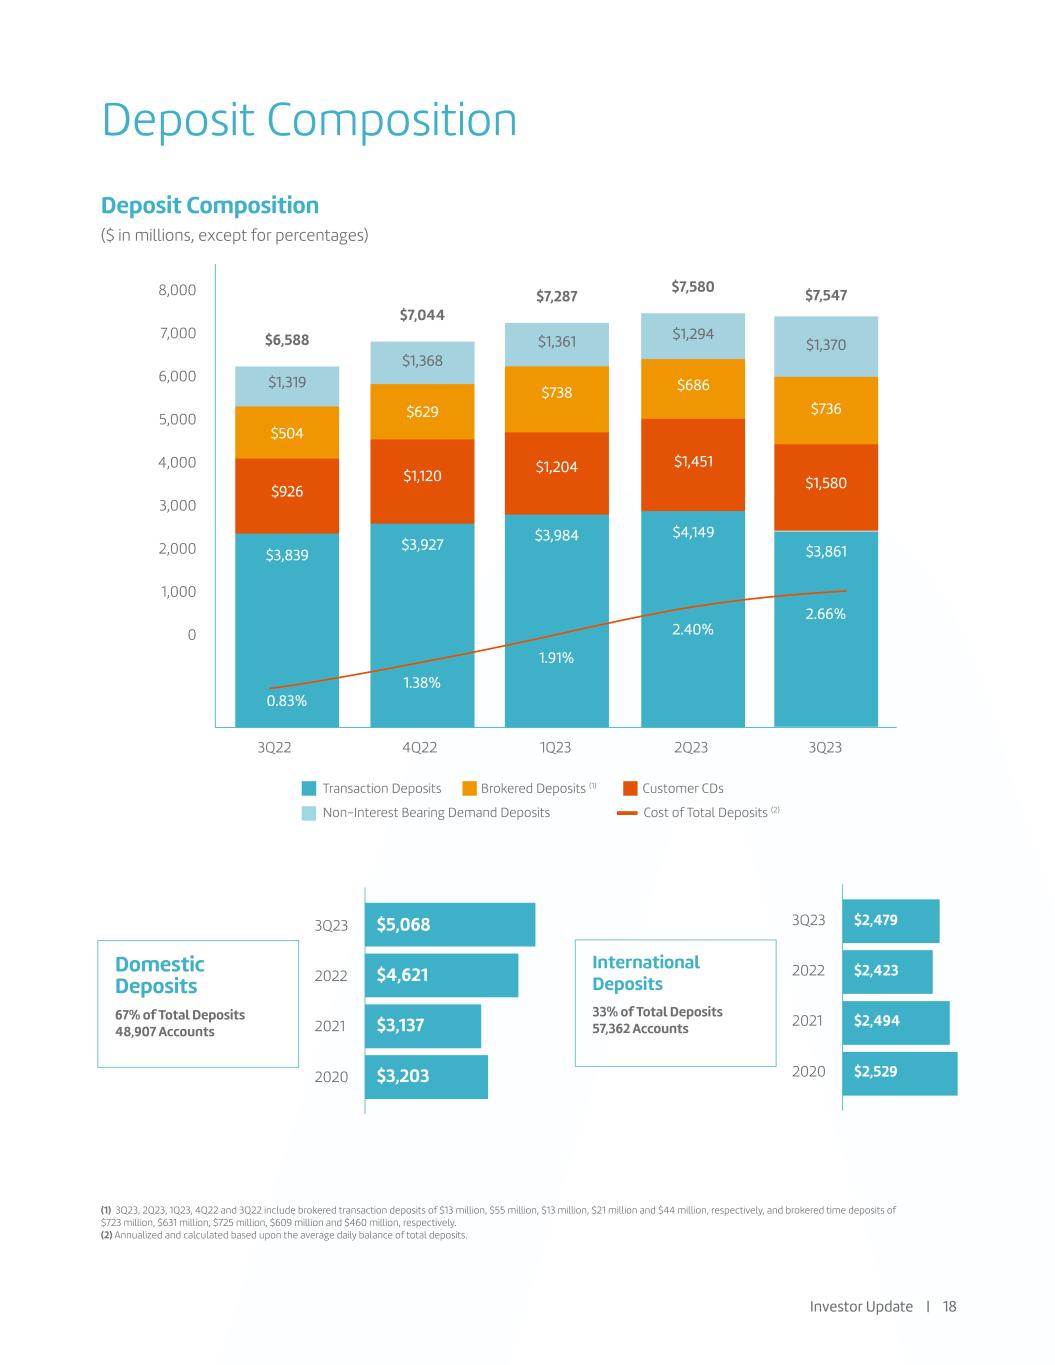
Deposit Composition Deposit Composition ($ in millions, except for percentages) (1) 3Q23, 2Q23, 1Q23, 4Q22 and 3Q22 include brokered transaction deposits of $13 million, $55 million, $13 million, $21 million and $44 million, respectively, and brokered time deposits of $723 million, $631 million, $725 million, $609 million and $460 million, respectively. (2) Annualized and calculated based upon the average daily balance of total deposits. Transaction Deposits Brokered Deposits (1) Customer CDs Non-Interest Bearing Demand Deposits Cost of Total Deposits (2) International Deposits 33% of Total Deposits 57,362 Accounts 3Q23 $2,4793Q23 $5,068 2022 $2,4232022 $4,621 2021 $2,4942021 $3,137 3Q22 4Q22 1Q23 2Q23 3Q23 $1,319 $1,368 $1,361 $1,294$6,588 $7,044 $7,287 $7,5808,000 7,000 6,000 5,000 4,000 3,000 2,000 1,000 0 2020 $2,5292020 $3,203 Domestic Deposits 67% of Total Deposits 48,907 Accounts 0.83% 1.38% 1.91% 2.40% $504 $926 $3,839 $629 $1,120 $3,927 $738 $1,204 $3,984 $686 $1,451 $4,149 $1,370 $7,547 2.66% $736 $1,580 $3,861 Investor Update | 18
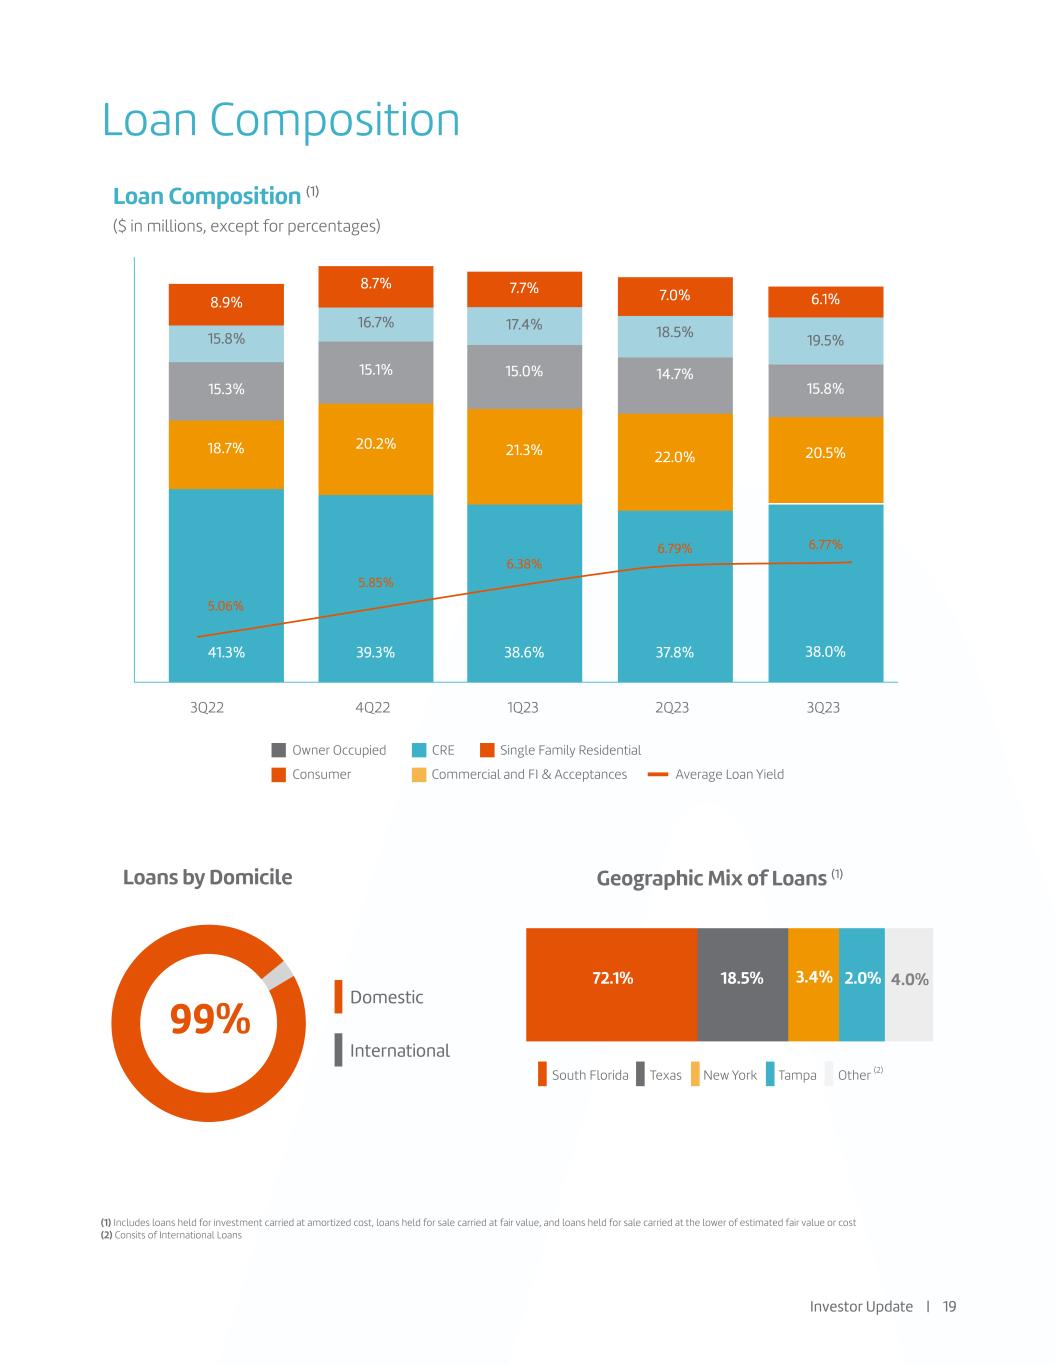
Loan Composition Loan Composition (1) ($ in millions, except for percentages) (1) Includes loans held for investment carried at amortized cost, loans held for sale carried at fair value, and loans held for sale carried at the lower of estimated fair value or cost (2) Consits of International Loans South Florida Texas New York Tampa Other (2) Owner Occupied CRE Single Family Residential Consumer Commercial and FI & Acceptances Average Loan Yield Loans by Domicile Geographic Mix of Loans (1) 3Q22 4Q22 1Q23 2Q23 3Q23 Domestic International 99% 72.1% 18.5% 3.4% 2.0% 41.3% 39.3% 38.6% 37.8% 18.7% 8.9% 15.8% 15.3% 8.7% 16.7% 15.1% 20.2% 5.85% 5.06% 6.38% 6.79% 7.7% 17.4% 15.0% 21.3% 7.0% 18.5% 14.7% 22.0% 6.1% 19.5% 15.8% 20.5% 38.0% 6.77% 4.0% Investor Update | 19
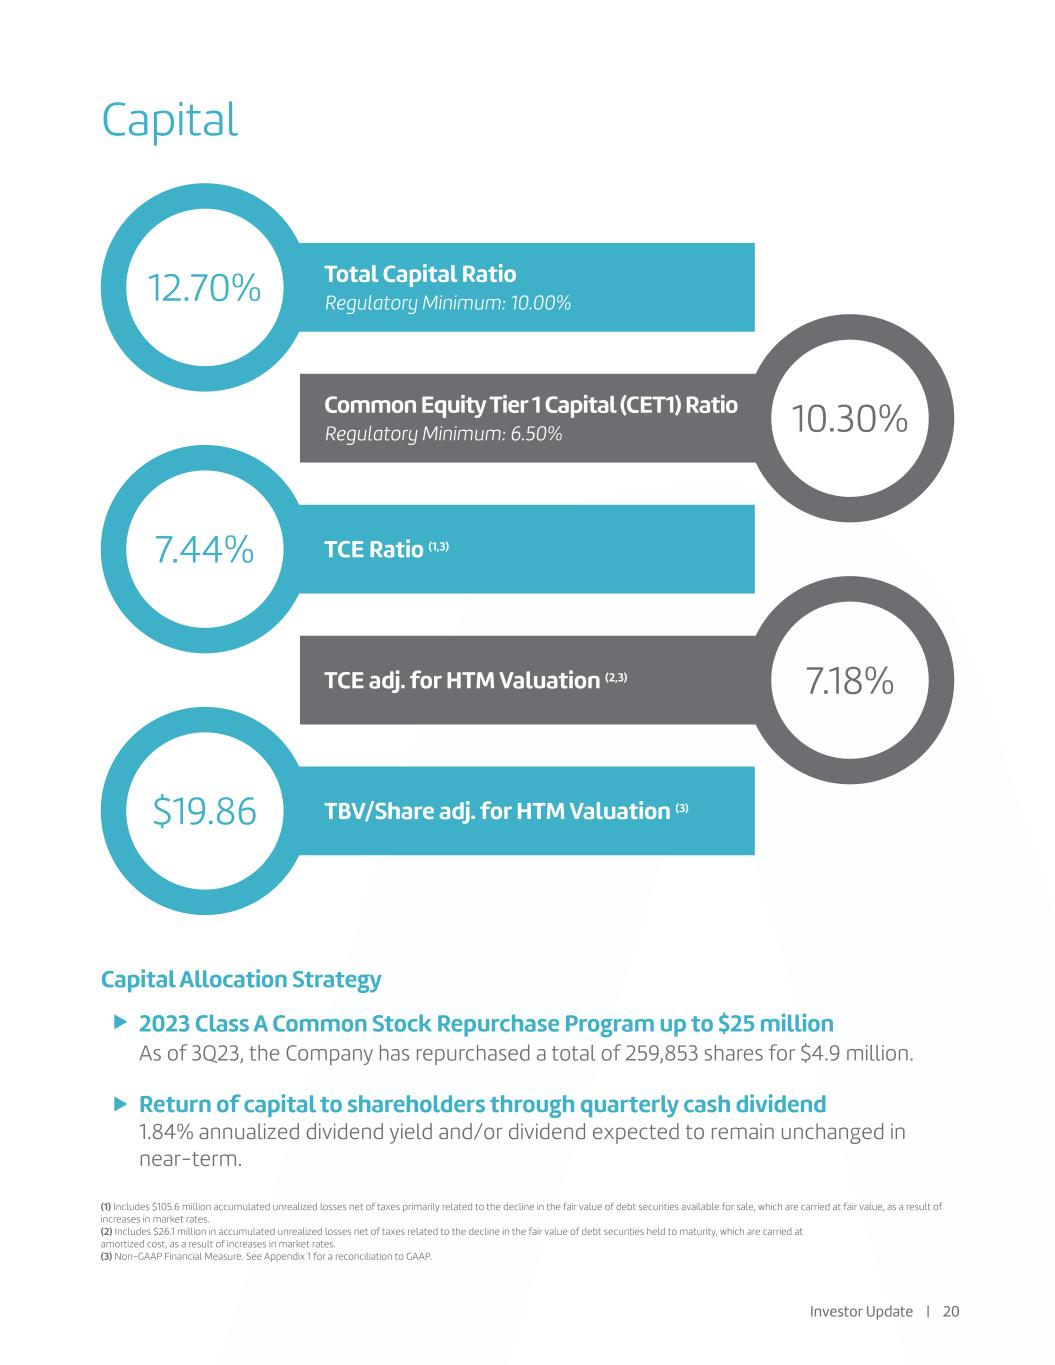
Capital 12.70% 7.44% 10.30% 7.18% $19.86 Total Capital Ratio Regulatory Minimum: 10.00% Common Equity Tier 1 Capital (CET1) Ratio Regulatory Minimum: 6.50% TCE Ratio (1,3) TCE adj. for HTM Valuation (2,3) TBV/Share adj. for HTM Valuation (3) Capital Allocation Strategy 2023 Class A Common Stock Repurchase Program up to $25 million As of 3Q23, the Company has repurchased a total of 259,853 shares for $4.9 million. Return of capital to shareholders through quarterly cash dividend 1.84% annualized dividend yield and/or dividend expected to remain unchanged in near-term. (1) Includes $105.6 million accumulated unrealized losses net of taxes primarily related to the decline in the fair value of debt securities available for sale, which are carried at fair value, as a result of increases in market rates. (2) Includes $26.1 million in accumulated unrealized losses net of taxes related to the decline in the fair value of debt securities held to maturity, which are carried at amortized cost, as a result of increases in market rates. (3) Non-GAAP Financial Measure. See Appendix 1 for a reconciliation to GAAP. Investor Update | 20
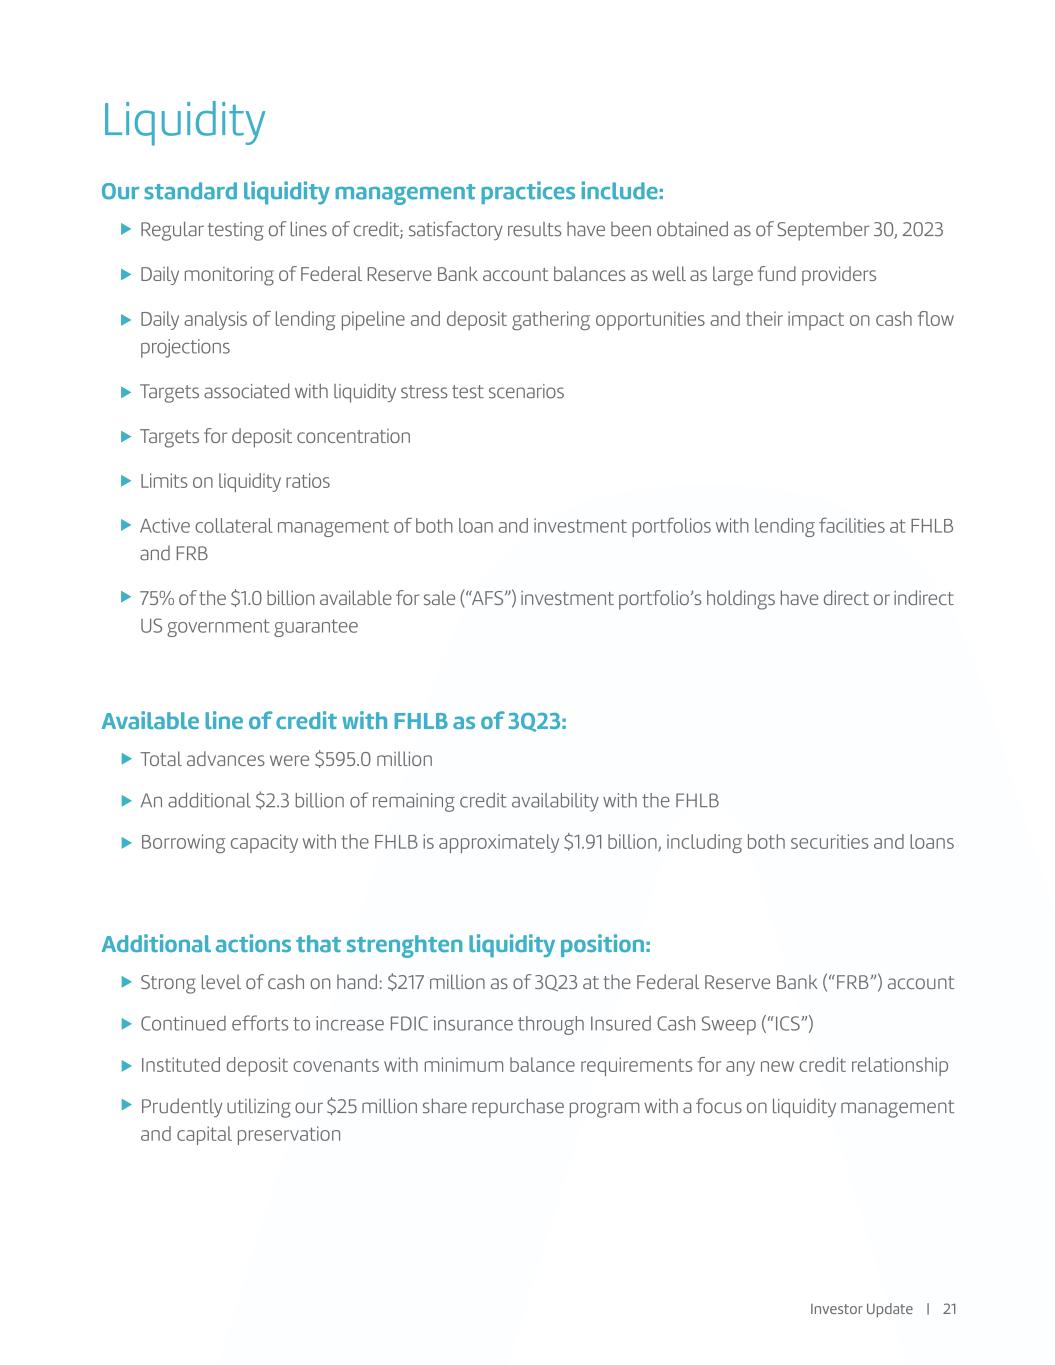
Liquidity Regular testing of lines of credit; satisfactory results have been obtained as of September 30, 2023 Daily monitoring of Federal Reserve Bank account balances as well as large fund providers Daily analysis of lending pipeline and deposit gathering opportunities and their impact on cash flow projections Targets associated with liquidity stress test scenarios Targets for deposit concentration Limits on liquidity ratios Active collateral management of both loan and investment portfolios with lending facilities at FHLB and FRB 75% of the $1.0 billion available for sale (“AFS”) investment portfolio’s holdings have direct or indirect US government guarantee Total advances were $595.0 million An additional $2.3 billion of remaining credit availability with the FHLB Borrowing capacity with the FHLB is approximately $1.91 billion, including both securities and loans Strong level of cash on hand: $217 million as of 3Q23 at the Federal Reserve Bank (“FRB”) account Continued efforts to increase FDIC insurance through Insured Cash Sweep (“ICS”) Instituted deposit covenants with minimum balance requirements for any new credit relationship Prudently utilizing our $25 million share repurchase program with a focus on liquidity management and capital preservation Our standard liquidity management practices include: Available line of credit with FHLB as of 3Q23: Additional actions that strenghten liquidity position: Investor Update | 21

Community Updates

Examples of Community Partnerships Habitat for Humanity - Miami, Broward, Houston OYC Miami - Overtown Youth Center We’ve partnered with the Overtown Youth Center (OYC Miami) to leverage our financial expertise and resources to bolster OYC Miami’s ongoing efforts in financial literacy for South Florida’s underserved communities. Investor Update | 23 Baptist Foundation Amerant is a proud participant in Bounce Back from Cancer™, a signature event hosted between the Miami HEAT and Baptist Health Foundation and their signature, annual, grassroots event that brings the community together to raise critical funds for the Miami Cancer Institute. United Way Miami Including significant sponsorship initiatives like the Amerant Bank 5K and the Unied Way’s Women United Let’s Do Lunch Series, our partnership with the United Way Miami plays an integral part in enhancing the lives of those in need within the South Florida community. We are proud to support organizations doing incredible work in our backyard, like Habitat for Humanity in Miami and Houston. Our teams work together with deserving home owners to complete beautiful homes in under served areas.

Supplemental Information
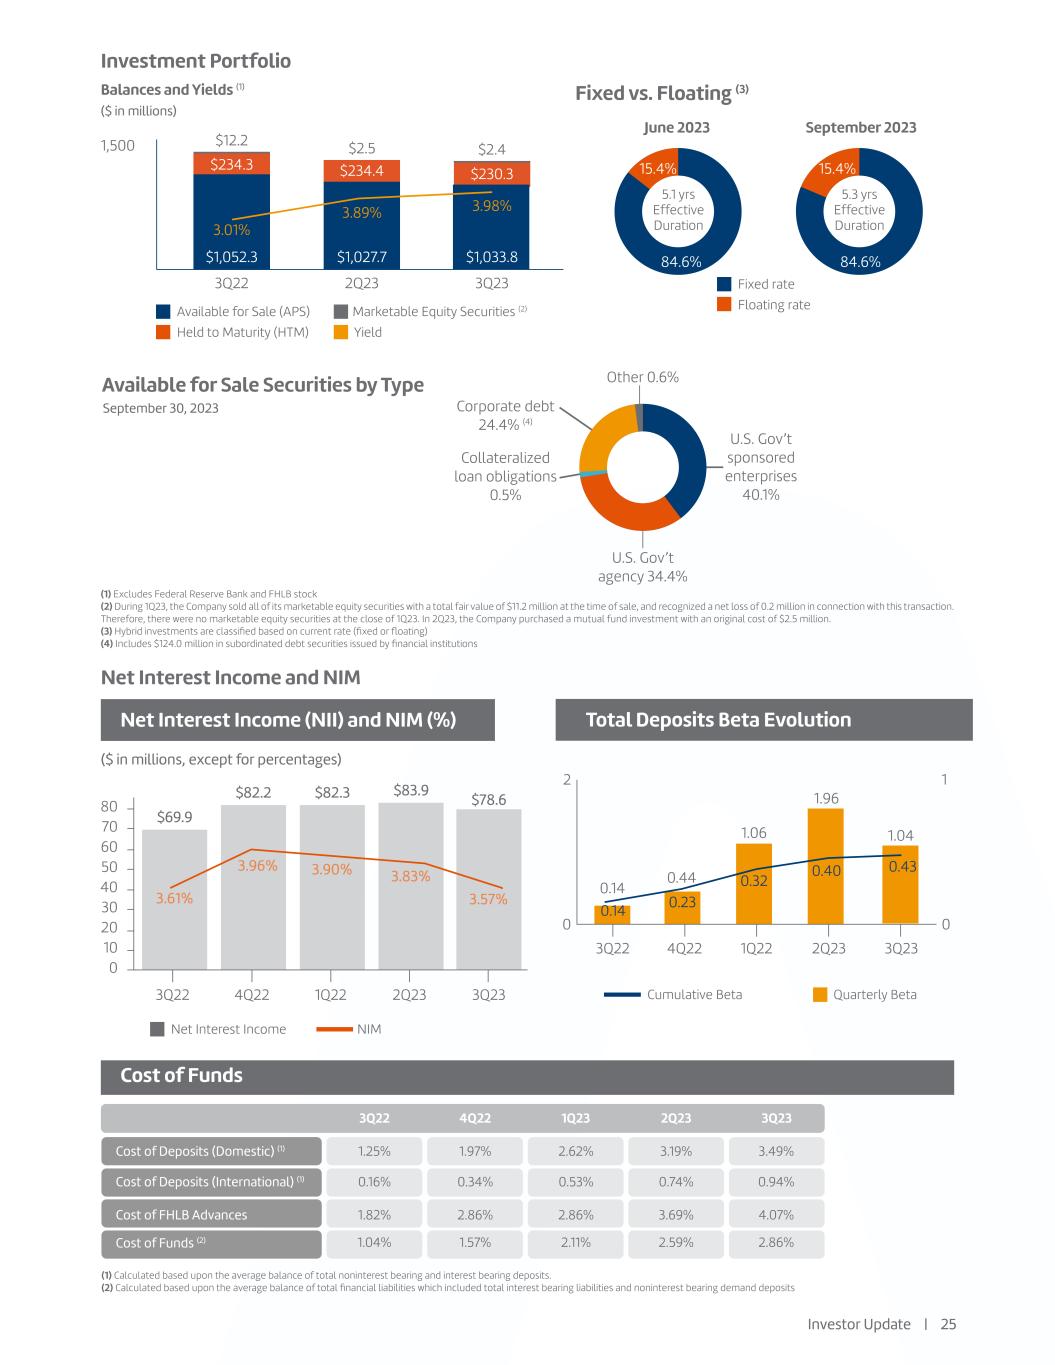
Net Interest Income and NIM ($ in millions, except for percentages) Net Interest Income (NII) and NIM (%) Total Deposits Beta Evolution Cost of Funds (1) Calculated based upon the average balance of total noninterest bearing and interest bearing deposits. (2) Calculated based upon the average balance of total financial liabilities which included total interest bearing liabilities and noninterest bearing demand deposits Cumulative Beta Quarterly Beta Net Interest Income NIM 2 0 80 70 60 50 40 30 20 10 0 1 0 3Q22 3Q22 $78.6 3.57%3.61% 3.96% 3.90% 3.83% $69.9 $82.2 $82.3 $83.9 0.14 4Q22 4Q22 1.04 1Q22 1Q22 0.44 2Q23 2Q23 1.06 3Q23 3Q23 1.96 3Q22 1.25% 0.16% 1.82% 1.04% 1.97% 0.34% 2.86% 1.57% 2.62% 0.53% 2.86% 2.11% 3.19% 0.74% 3.69% 2.59% 3.49% 0.94% 4.07% 2.86% Cost of Deposits (Domestic) (1) Cost of Deposits (International) (1) Cost of FHLB Advances Cost of Funds (2) 4Q22 1Q23 2Q23 3Q23 0.14 0.23 0.32 0.40 0.43 Investment Portfolio Balances and Yields (1) ($ in millions) Available for Sale (APS) Marketable Equity Securities (2) Held to Maturity (HTM) Yield 1,500 $12.2 $2.4 3Q22 2Q23 3Q23 $234.3 $234.4 $230.3 $1,052.3 $1,027.7 $1,033.8 3.01% 3.89% 3.98% $2.5 Fixed vs. Floating (3) June 2023 September 2023 5.1 yrs Effective Duration 5.3 yrs Effective Duration Fixed rate Floating rate 15.4% 84.6% 15.4% 84.6% Available for Sale Securities by Type September 30, 2023 Corporate debt 24.4% (4) Collateralized loan obligations 0.5% U.S. Gov’t agency 34.4% U.S. Gov’t sponsored enterprises 40.1% Other 0.6% (1) Excludes Federal Reserve Bank and FHLB stock (2) During 1Q23, the Company sold all of its marketable equity securities with a total fair value of $11.2 million at the time of sale, and recognized a net loss of 0.2 million in connection with this transaction. Therefore, there were no marketable equity securities at the close of 1Q23. In 2Q23, the Company purchased a mutual fund investment with an original cost of $2.5 million. (3) Hybrid investments are classified based on current rate (fixed or floating) (4) Includes $124.0 million in subordinated debt securities issued by financial institutions Investor Update | 25
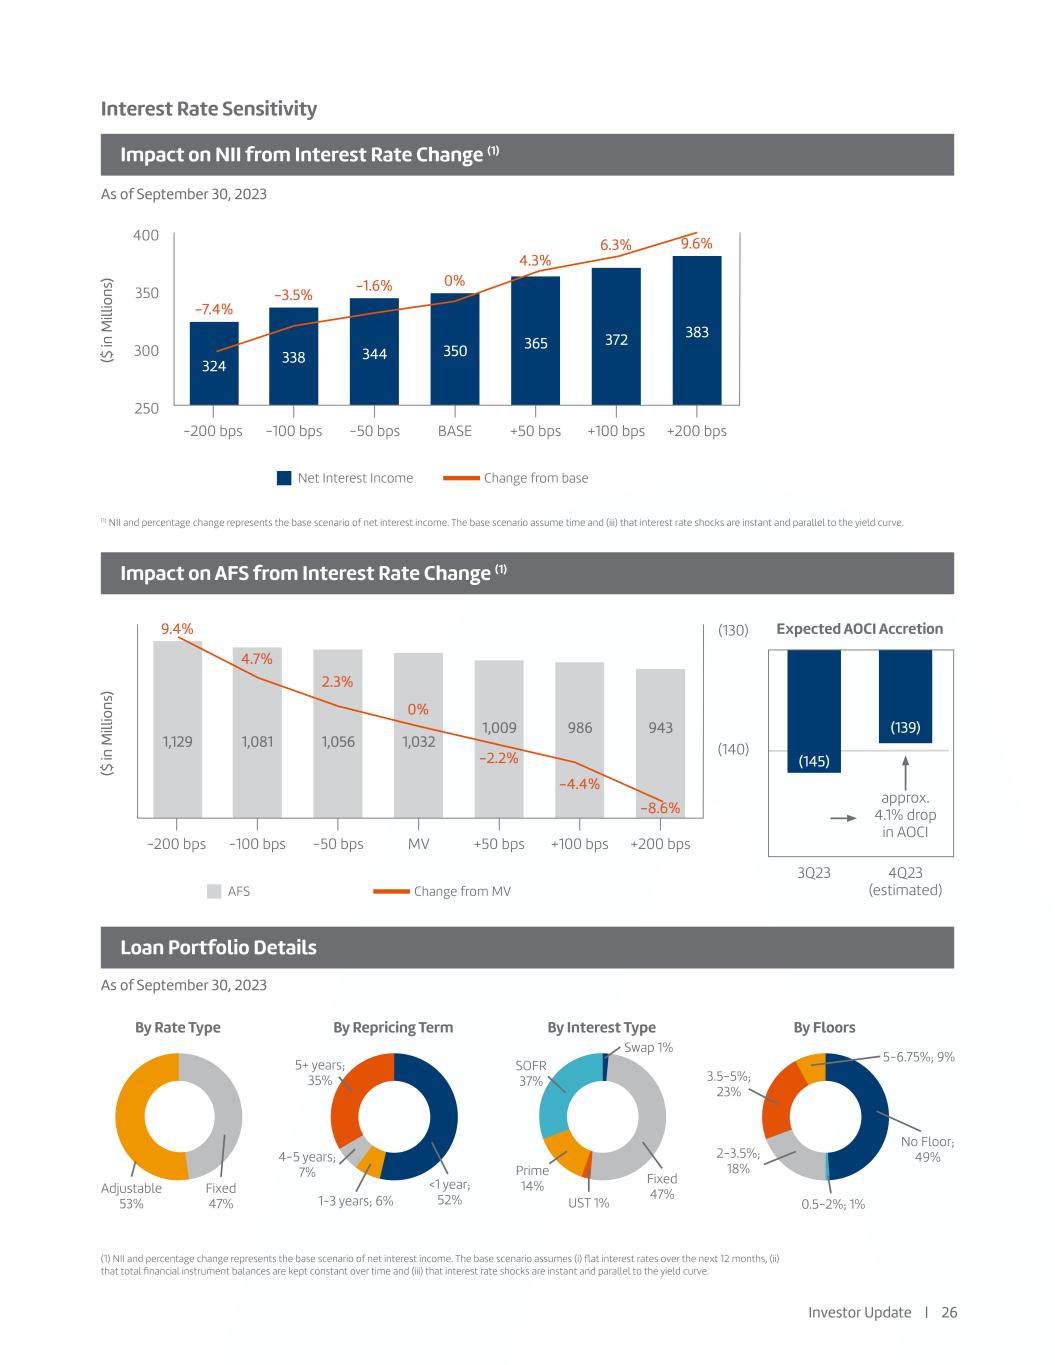
Interest Rate Sensitivity Impact on NII from Interest Rate Change (1) Impact on AFS from Interest Rate Change (1) Loan Portfolio Details As of September 30, 2023 As of September 30, 2023 ($ in M ill io ns ) ($ in M ill io ns ) Net Interest Income Change from base AFS Change from MV 400 350 300 250 -7.4% 9.4% 324 1,129 338 1,081 344 1,056 350 1,032 365 (145) (139)1,009 372 986 383 943 -3.5% 4.7% -1.6% 2.3% 0% 0% 4.3% -2.2% 6.3% -4.4% 9.6% -8.6% -200 bps (130) 3Q23 4Q23 (estimated) approx. 4.1% drop in AOCI (140) -200 bps -100 bps -100 bps -50 bps -50 bps BASE MV +50 bps +50 bps +100 bps +100 bps +200 bps +200 bps (1) NII and percentage change represents the base scenario of net interest income. The base scenario assume time and (iii) that interest rate shocks are instant and parallel to the yield curve. (1) NII and percentage change represents the base scenario of net interest income. The base scenario assumes (i) flat interest rates over the next 12 months, (ii) that total financial instrument balances are kept constant over time and (iii) that interest rate shocks are instant and parallel to the yield curve. Expected AOCI Accretion By Rate Type By Repricing Term By Interest Type By Floors Adjustable 53% Fixed 47% 5+ years; 35% <1 year; 52% Swap 1% Fixed 47% UST 1% Prime 14% 4-5 years; 7% 1-3 years; 6% SOFR 37% 5-6.75%; 9% 3.5-5%; 23% 2-3.5%; 18% 0.5-2%; 1% No Floor; 49% Investor Update | 26
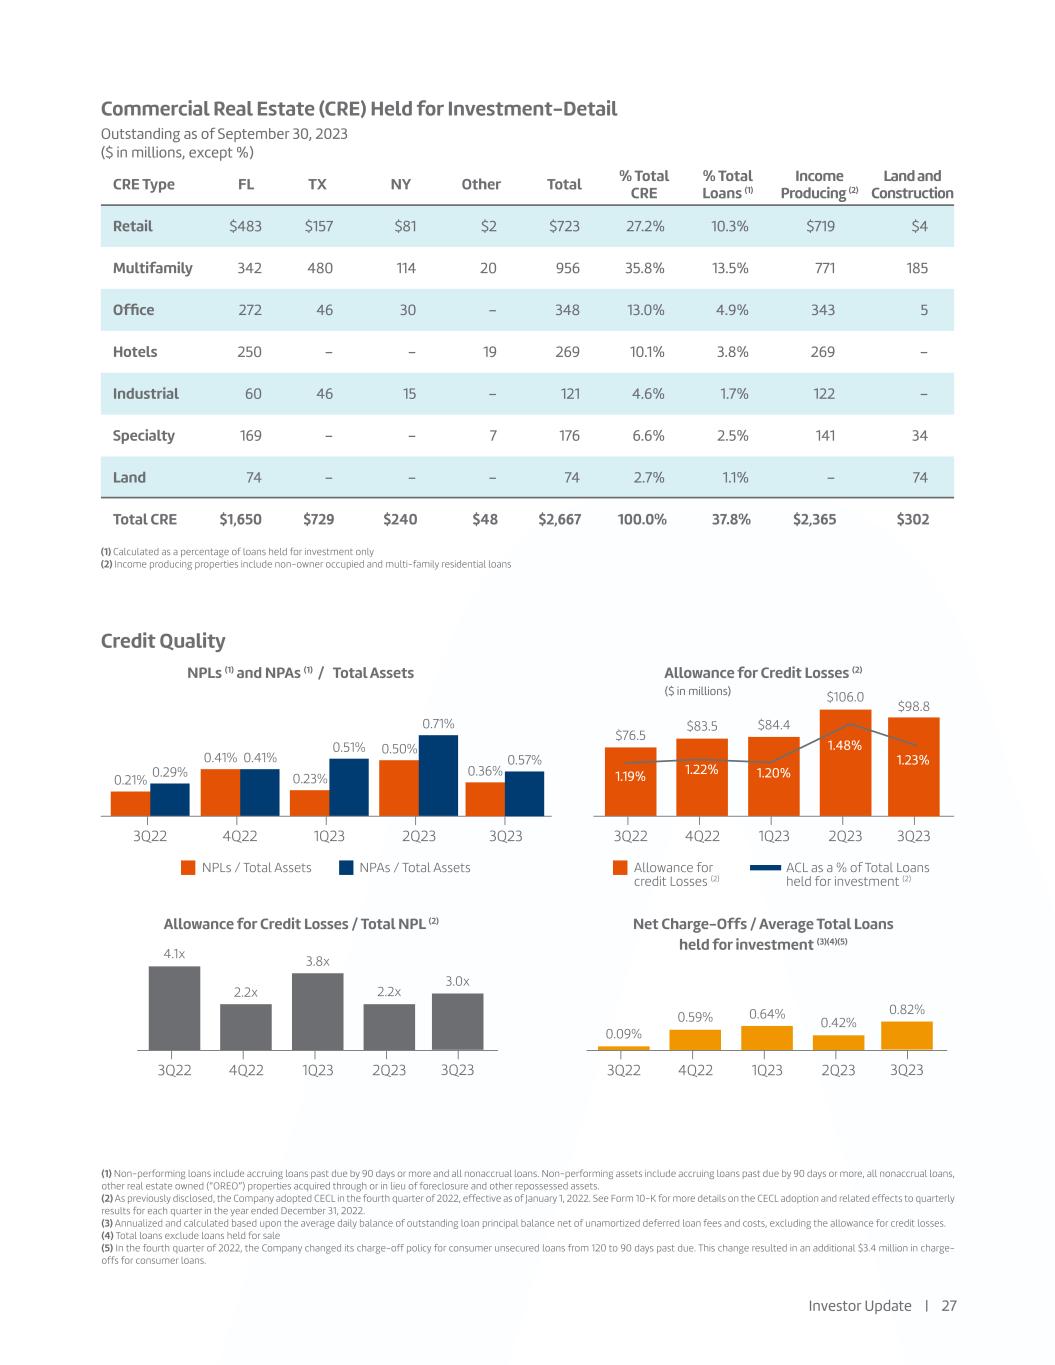
Commercial Real Estate (CRE) Held for Investment-Detail Credit Quality Outstanding as of September 30, 2023 ($ in millions, except %) (1) Calculated as a percentage of loans held for investment only (2) Income producing properties include non-owner occupied and multi-family residential loans CRE Type Retail Multifamily Office Industrial Hotels Specialty Total CRE Land FL TX NY Other Total % Total CRE % Total Loans (1) Income Producing (2) Land and Construction $483 $157 $81 $2 $723 27.2% 10.3% $719 $4 342 480 114 20 956 35.8% 13.5% 771 185 272 46 30 – 348 13.0% 4.9% 343 5 250 – – 19 269 10.1% 3.8% 269 – 60 46 15 – 121 4.6% 1.7% 122 – 169 – – 7 176 6.6% 2.5% 141 34 74 – – – 74 2.7% 1.1% – 74 $1,650 $729 $240 $48 $2,667 100.0% 37.8% $2,365 $302 (1) Non-performing loans include accruing loans past due by 90 days or more and all nonaccrual loans. Non-performing assets include accruing loans past due by 90 days or more, all nonaccrual loans, other real estate owned (“OREO”) properties acquired through or in lieu of foreclosure and other repossessed assets. (2) As previously disclosed, the Company adopted CECL in the fourth quarter of 2022, effective as of January 1, 2022. See Form 10-K for more details on the CECL adoption and related effects to quarterly results for each quarter in the year ended December 31, 2022. (3) Annualized and calculated based upon the average daily balance of outstanding loan principal balance net of unamortized deferred loan fees and costs, excluding the allowance for credit losses. (4) Total loans exclude loans held for sale (5) In the fourth quarter of 2022, the Company changed its charge-off policy for consumer unsecured loans from 120 to 90 days past due. This change resulted in an additional $3.4 million in charge- offs for consumer loans. 3Q23 3Q23 3Q23 3Q23 0.36% 0.21% 0.23% 0.51% 0.50% 0.71% $98.8 3.0x 0.82% $76.5 4.1x 0.09% $83.5 2.2x 0.59% $84.4 3.8x 0.64% $106.0 2.2x 0.42% 0.41%0.41% 0.29% 0.57% 3Q22 3Q22 3Q22 3Q22 4Q22 4Q22 4Q22 4Q22 1Q23 1Q23 1Q23 1Q23 2Q23 2Q23 2Q23 2Q23 ($ in millions) NPLs (1) and NPAs (1) / Total Assets Allowance for Credit Losses / Total NPL (2) Allowance for Credit Losses (2) Net Charge-Offs / Average Total Loans held for investment (3)(4)(5) NPLs / Total Assets NPAs / Total Assets Allowance for credit Losses (2) ACL as a % of Total Loans held for investment (2) 1.23% 1.19% 1.22% 1.20% 1.48% Investor Update | 27
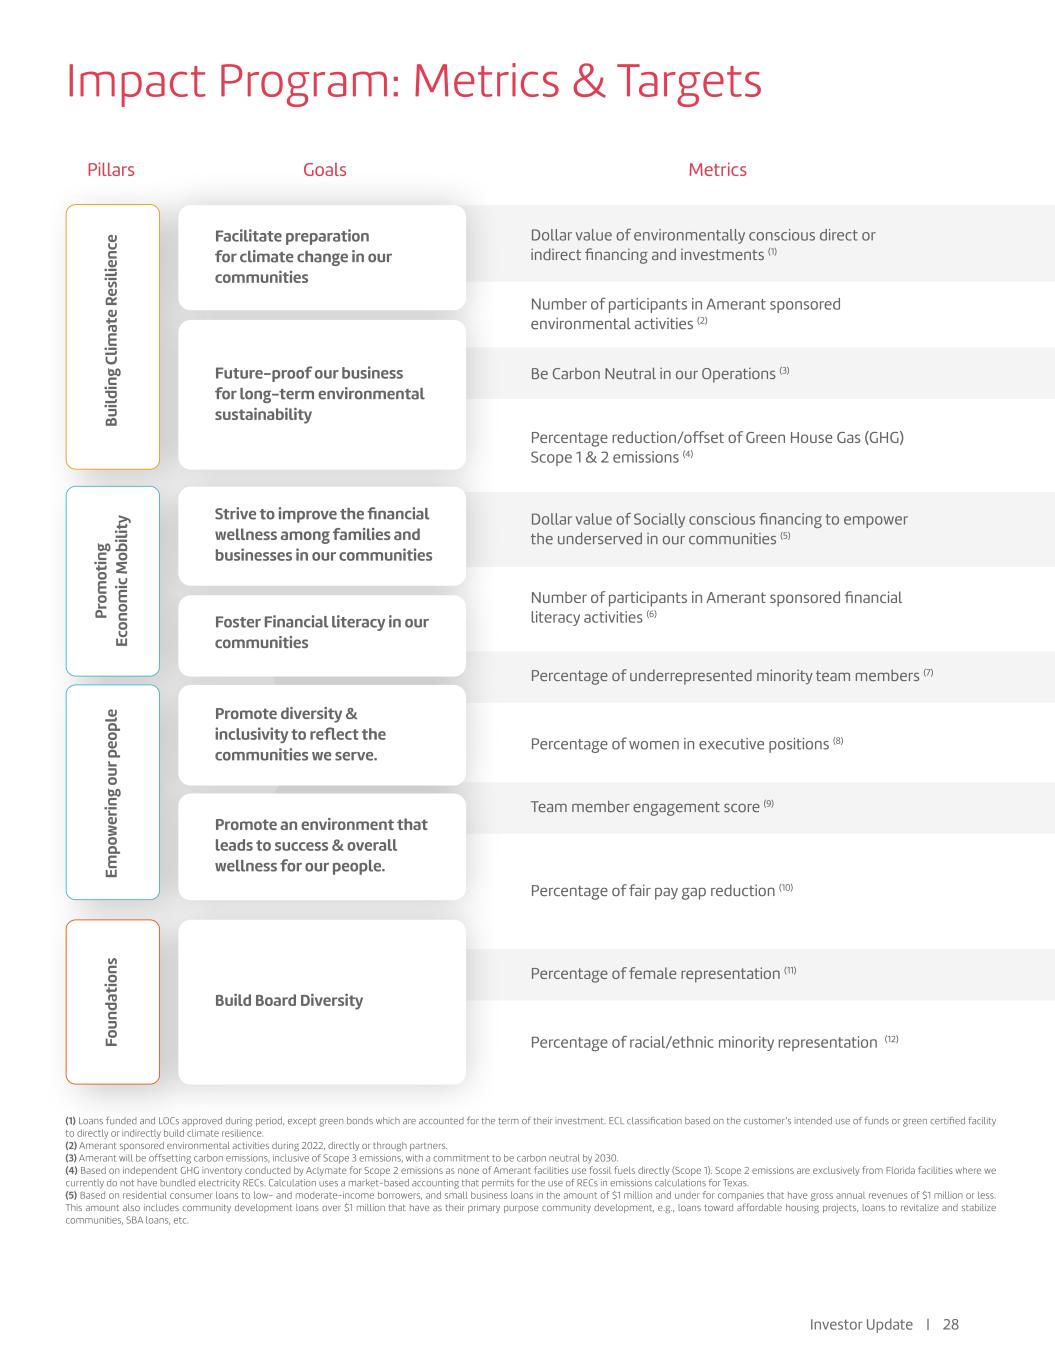
Pillars Goals Metrics Number of participants in Amerant sponsored environmental activities (2) Dollar value of environmentally conscious direct or indirect financing and investments (1) Percentage reduction/offset of Green House Gas (GHG) Scope 1 & 2 emissions (4) Dollar value of Socially conscious financing to empower the underserved in our communities (5) Number of participants in Amerant sponsored financial literacy activities (6) Percentage of underrepresented minority team members (7) Percentage of women in executive positions (8) Team member engagement score (9) Percentage of fair pay gap reduction (10) Percentage of female representation (11) Percentage of racial/ethnic minority representation (12) Be Carbon Neutral in our Operations (3) (1) Loans funded and LOCs approved during period, except green bonds which are accounted for the term of their investment. ECL classification based on the customer’s intended use of funds or green certified facility to directly or indirectly build climate resilience. (2) Amerant sponsored environmental activities during 2022, directly or through partners. (3) Amerant will be offsetting carbon emissions, inclusive of Scope 3 emissions, with a commitment to be carbon neutral by 2030. (4) Based on independent GHG inventory conducted by Aclymate for Scope 2 emissions as none of Amerant facilities use fossil fuels directly (Scope 1). Scope 2 emissions are exclusively from Florida facilities where we currently do not have bundled electricity RECs. Calculation uses a market-based accounting that permits for the use of RECs in emissions calculations for Texas. (5) Based on residential consumer loans to low- and moderate-income borrowers, and small business loans in the amount of $1 million and under for companies that have gross annual revenues of $1 million or less. This amount also includes community development loans over $1 million that have as their primary purpose community development, e.g., loans toward affordable housing projects, loans to revitalize and stabilize communities, SBA loans, etc. Facilitate preparation for climate change in our communities Future-proof our business for long-term environmental sustainabilityBu ild in g Cl im at e Re si lie nc e Fo un da ti on s Em po w er in g ou r p eo pl e Pr om ot in g Ec on om ic M ob ili ty Strive to improve the financial wellness among families and businesses in our communities Foster Financial literacy in our communities Promote diversity & inclusivity to reflect the communities we serve. Promote an environment that leads to success & overall wellness for our people. Build Board Diversity Impact Program: Metrics & Targets Investor Update | 28
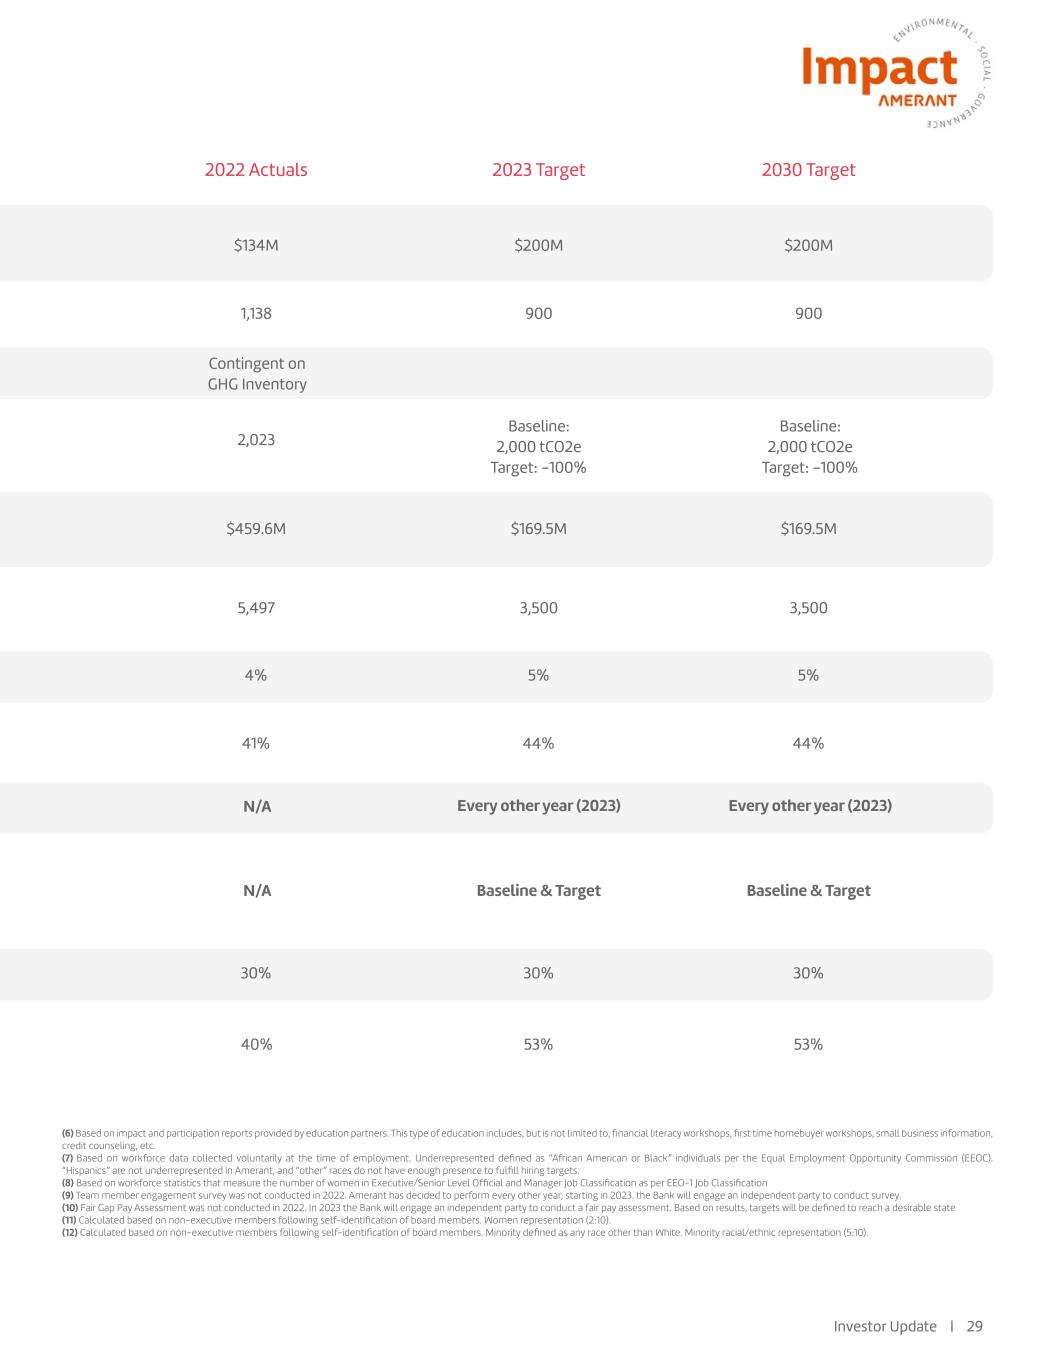
$134M $459.6M 5,497 4% 41% 30% 40% 53% 53% 30% 30% N/A N/A 44% 44% 5% 5% 3,500 3,500 $169.5M $169.5M 1,138 Contingent on GHG Inventory Baseline: 2,000 tCO2e Target: -100% Baseline: 2,000 tCO2e Target: -100% 2,023 Baseline & Target Baseline & Target Every other year (2023) Every other year (2023) 900 900 $200M $200M 2022 Actuals 2023 Target 2030 Target (6) Based on impact and participation reports provided by education partners. This type of education includes, but is not limited to, financial literacy workshops, first time homebuyer workshops, small business information, credit counseling, etc. (7) Based on workforce data collected voluntarily at the time of employment. Underrepresented defined as “African American or Black” individuals per the Equal Employment Opportunity Commission (EEOC). “Hispanics” are not underrepresented in Amerant, and “other” races do not have enough presence to fulfill hiring targets. (8) Based on workforce statistics that measure the number of women in Executive/Senior Level Official and Manager Job Classification as per EEO-1 Job Classification (9) Team member engagement survey was not conducted in 2022. Amerant has decided to perform every other year, starting in 2023. the Bank will engage an independent party to conduct survey. (10) Fair Gap Pay Assessment was not conducted in 2022. In 2023 the Bank will engage an independent party to conduct a fair pay assessment. Based on results, targets will be defined to reach a desirable state (11) Calculated based on non-executive members following self-identification of board members. Women representation (2:10). (12) Calculated based on non-executive members following self-identification of board members. Minority defined as any race other than White. Minority racial/ethnic representation (5:10). Investor Update | 29

Appendix
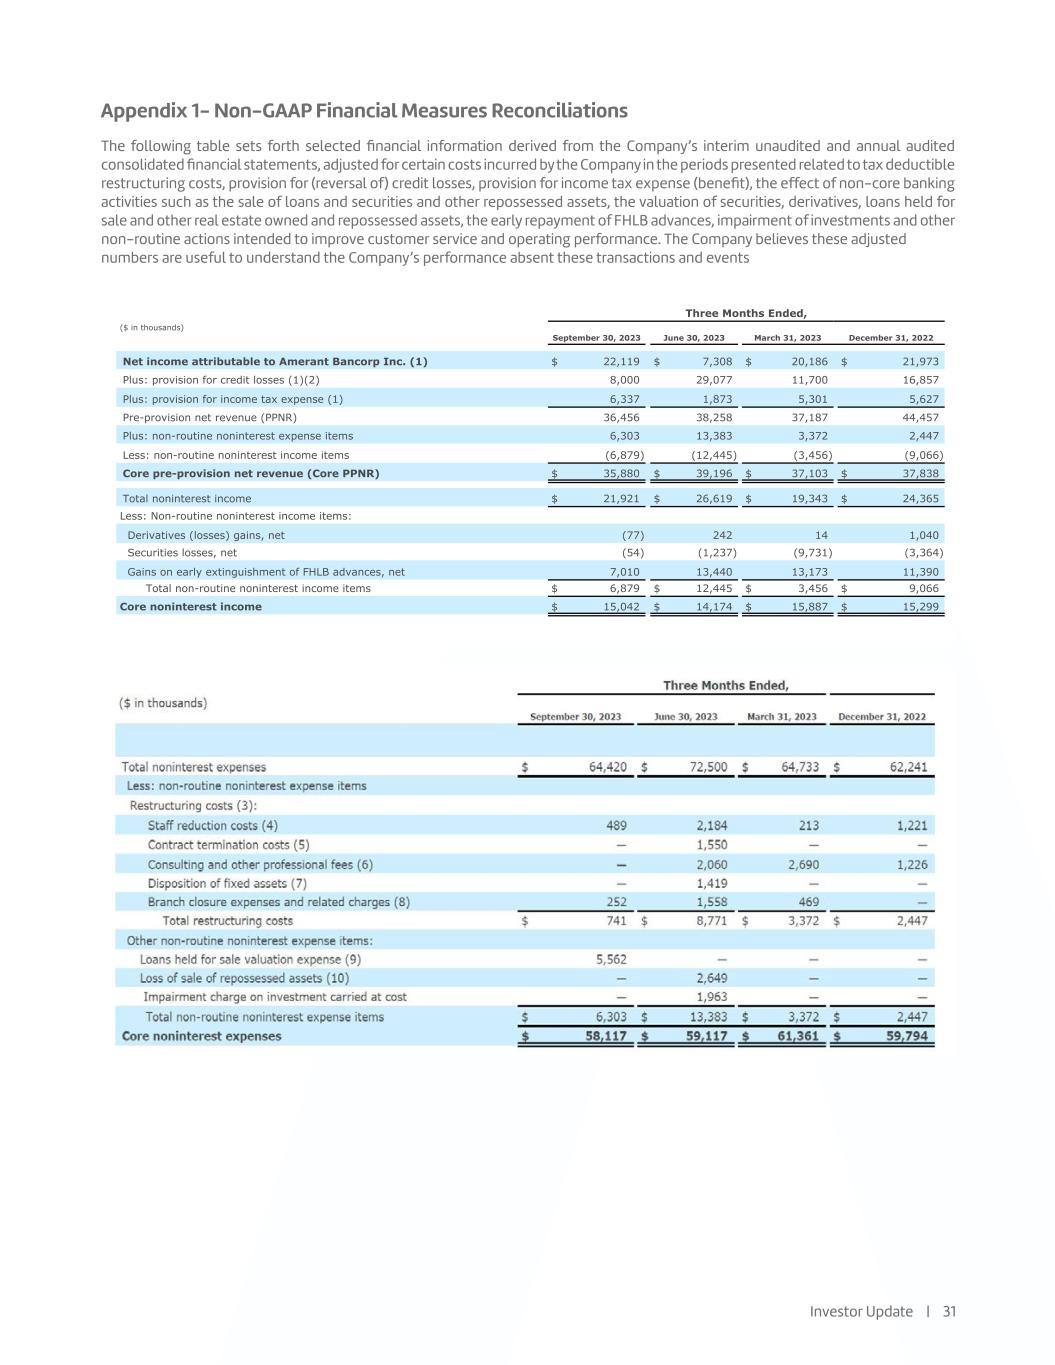
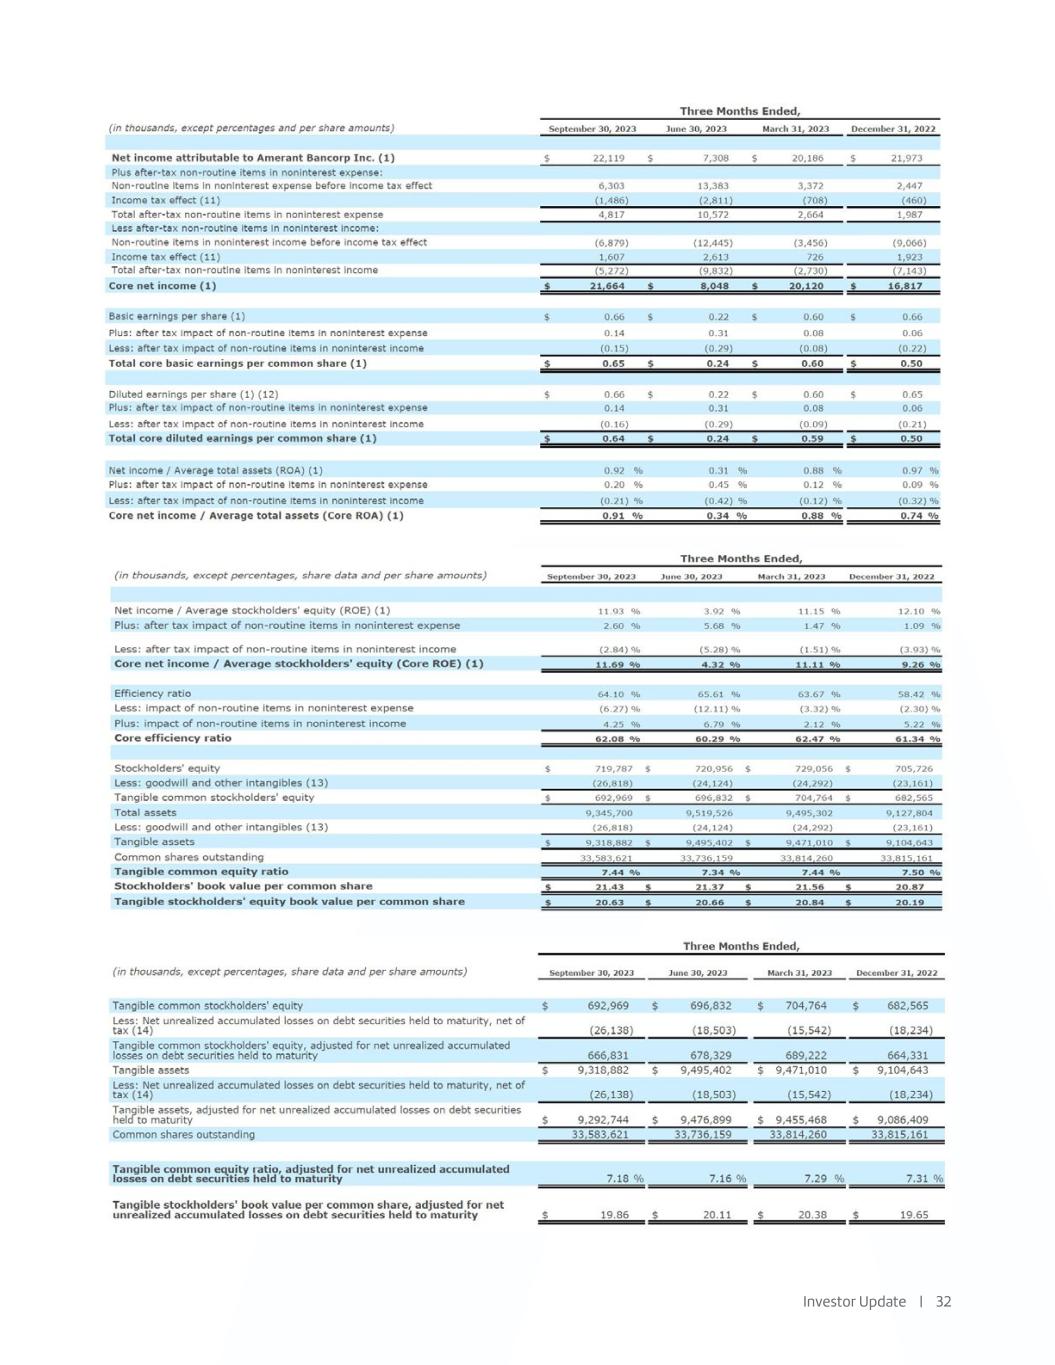
Appendix 1- Non-GAAP Financial Measures Reconciliations The following table sets forth selected financial information derived from the Company’s interim unaudited and annual audited consolidated financial statements, adjusted for certain costs incurred by the Company in the periods presented related to tax deductible restructuring costs, provision for (reversal of) credit losses, provision for income tax expense (benefit), the effect of non-core banking activities such as the sale of loans and securities and other repossessed assets, the valuation of securities, derivatives, loans held for sale and other real estate owned and repossessed assets, the early repayment of FHLB advances, impairment of investments and other non-routine actions intended to improve customer service and operating performance. The Company believes these adjusted numbers are useful to understand the Company’s performance absent these transactions and events Investor Update | 31 1Appendix 1 Non-GAAP Financial Measures Reconciliations The following table sets forth selected financial information derived from the Company’s interim unaudited and annual audited consolidated financial statements, adjusted for certain costs incurred by the Company in the periods presented r lated to tax de uctible restructuring costs, provision for (r versal of) credit losses, provision for income tax expense (benefit), the ffect of non-core banking activities such as the sale of loans and securities and other repossessed assets, the valuation of securities, derivatives, loans held for sale and other real estate owned, early repayment of FHLB advances, impairment of investments, and other non- routine actions intended to improve customer service and operating performance. The Company believes these adjusted numbers are useful to understand the Company’s performance absent these transactions and events. Three Months Ended, ($ in thousands) September 30, 2023 June 30, 2023 March 31, 2023 December 31, 2022 Net income attributable to Amerant Bancorp Inc. (1) $ 22,119 $ 7,308 $ 20,186 $ 21,973 Plus: provision for credit losses (1)(2) 8,000 29,077 11,700 16,857 Plus: provision for income tax expense (1) 6,337 1,873 5,301 5,627 Pre-provision net revenue (PPNR) 36,456 38,258 37,187 44,457 Plus: non-routine noninterest expense items 6,303 13,383 3,372 2,447 Less: non-routine noninterest income items (6,879) (12,445) (3,456) (9,066) Core pre-provision net revenue (Core PPNR) $ 35,880 $ 39,196 $ 37,103 $ 37,838 Total noninterest income $ 21,921 $ 26,619 $ 19,343 $ 24,365 Less: Non-routine noninterest income items: Derivatives (losses) gains, net (77) 242 14 1,040 Securities losses, net (54) (1,237) (9,731) (3,364) Gains on early extinguishment of FHLB advances, net 7,010 13,440 13,173 11,390 Total non-routine noninterest income items $ 6,879 $ 12,445 $ 3,456 $ 9,066 Core noninterest income $ 15,042 $ 14,174 $ 15,887 $ 15,299
Investor Update | 32
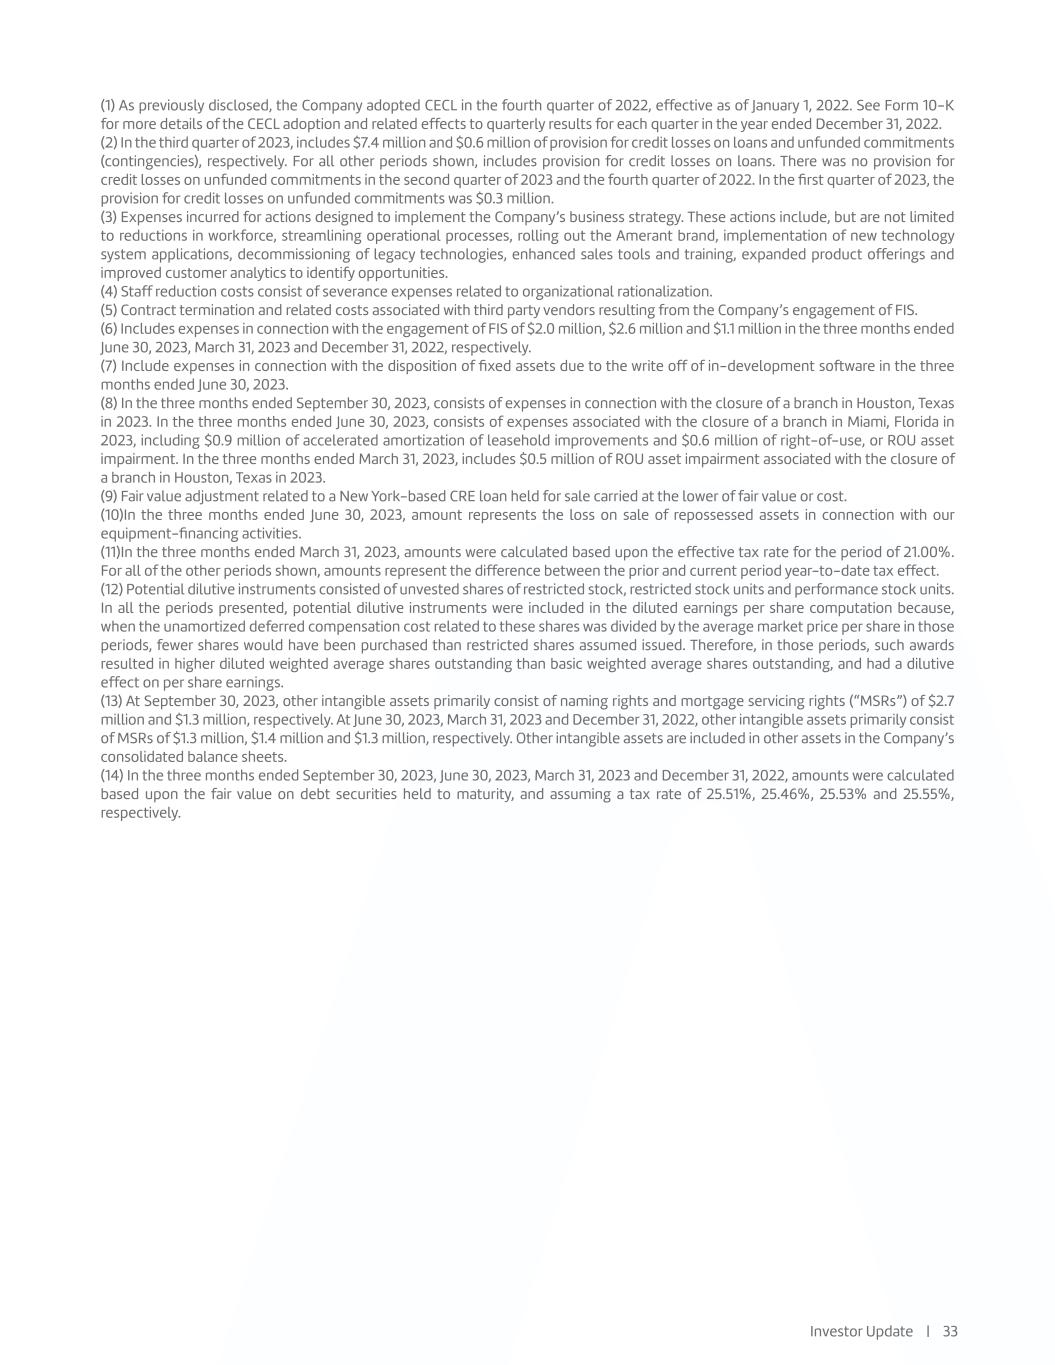
Investor Update | 33 (1) As previously disclosed, the Company adopted CECL in the fourth quarter of 2022, effective as of January 1, 2022. See Form 10-K for more details of the CECL adoption and related effects to quarterly results for each quarter in the year ended December 31, 2022. (2) In the third quarter of 2023, includes $7.4 million and $0.6 million of provision for credit losses on loans and unfunded commitments (contingencies), respectively. For all other periods shown, includes provision for credit losses on loans. There was no provision for credit losses on unfunded commitments in the second quarter of 2023 and the fourth quarter of 2022. In the first quarter of 2023, the provision for credit losses on unfunded commitments was $0.3 million. (3) Expenses incurred for actions designed to implement the Company’s business strategy. These actions include, but are not limited to reductions in workforce, streamlining operational processes, rolling out the Amerant brand, implementation of new technology system applications, decommissioning of legacy technologies, enhanced sales tools and training, expanded product offerings and improved customer analytics to identify opportunities. (4) Staff reduction costs consist of severance expenses related to organizational rationalization. (5) Contract termination and related costs associated with third party vendors resulting from the Company’s engagement of FIS. (6) Includes expenses in connection with the engagement of FIS of $2.0 million, $2.6 million and $1.1 million in the three months ended June 30, 2023, March 31, 2023 and December 31, 2022, respectively. (7) Include expenses in connection with the disposition of fixed assets due to the write off of in-development software in the three months ended June 30, 2023. (8) In the three months ended September 30, 2023, consists of expenses in connection with the closure of a branch in Houston, Texas in 2023. In the three months ended June 30, 2023, consists of expenses associated with the closure of a branch in Miami, Florida in 2023, including $0.9 million of accelerated amortization of leasehold improvements and $0.6 million of right-of-use, or ROU asset impairment. In the three months ended March 31, 2023, includes $0.5 million of ROU asset impairment associated with the closure of a branch in Houston, Texas in 2023. (9) Fair value adjustment related to a New York-based CRE loan held for sale carried at the lower of fair value or cost. (10)In the three months ended June 30, 2023, amount represents the loss on sale of repossessed assets in connection with our equipment-financing activities. (11)In the three months ended March 31, 2023, amounts were calculated based upon the effective tax rate for the period of 21.00%. For all of the other periods shown, amounts represent the difference between the prior and current period year-to-date tax effect. (12) Potential dilutive instruments consisted of unvested shares of restricted stock, restricted stock units and performance stock units. In all the periods presented, potential dilutive instruments were included in the diluted earnings per share computation because, when the unamortized deferred compensation cost related to these shares was divided by the average market price per share in those periods, fewer shares would have been purchased than restricted shares assumed issued. Therefore, in those periods, such awards resulted in higher diluted weighted average shares outstanding than basic weighted average shares outstanding, and had a dilutive effect on per share earnings. (13) At September 30, 2023, other intangible assets primarily consist of naming rights and mortgage servicing rights (“MSRs”) of $2.7 million and $1.3 million, respectively. At June 30, 2023, March 31, 2023 and December 31, 2022, other intangible assets primarily consist of MSRs of $1.3 million, $1.4 million and $1.3 million, respectively. Other intangible assets are included in other assets in the Company’s consolidated balance sheets. (14) In the three months ended September 30, 2023, June 30, 2023, March 31, 2023 and December 31, 2022, amounts were calculated based upon the fair value on debt securities held to maturity, and assuming a tax rate of 25.51%, 25.46%, 25.53% and 25.55%, respectively.

Thank You NYSE: AMTB amerantbank.com
