false2023FY0001728205http://fasb.org/us-gaap/2023#OtherAssetsNoncurrenthttp://fasb.org/us-gaap/2023#OtherAssetsNoncurrenthttp://fasb.org/us-gaap/2023#OtherLiabilitiesCurrenthttp://fasb.org/us-gaap/2023#OtherLiabilitiesCurrent100017282052023-01-012023-12-3100017282052023-06-30iso4217:USD00017282052024-02-23xbrli:shares00017282052023-10-012023-12-3100017282052022-01-012022-12-3100017282052021-07-012021-12-3100017282052020-07-012021-06-30iso4217:USDxbrli:shares00017282052023-12-3100017282052022-12-3100017282052021-12-3100017282052021-06-3000017282052020-06-300001728205us-gaap:CommonStockMember2020-06-300001728205us-gaap:AdditionalPaidInCapitalMember2020-06-300001728205us-gaap:RetainedEarningsMember2020-06-300001728205us-gaap:AccumulatedOtherComprehensiveIncomeMember2020-06-300001728205us-gaap:CommonStockMember2020-07-012021-06-300001728205us-gaap:AdditionalPaidInCapitalMember2020-07-012021-06-300001728205us-gaap:RetainedEarningsMember2020-07-012021-06-300001728205us-gaap:AccumulatedOtherComprehensiveIncomeMember2020-07-012021-06-300001728205us-gaap:CommonStockMember2021-06-300001728205us-gaap:AdditionalPaidInCapitalMember2021-06-300001728205us-gaap:RetainedEarningsMember2021-06-300001728205us-gaap:AccumulatedOtherComprehensiveIncomeMember2021-06-300001728205us-gaap:AdditionalPaidInCapitalMember2021-07-012021-12-310001728205us-gaap:CommonStockMember2021-07-012021-12-310001728205us-gaap:AccumulatedOtherComprehensiveIncomeMember2021-07-012021-12-310001728205us-gaap:RetainedEarningsMember2021-07-012021-12-310001728205us-gaap:CommonStockMember2021-12-310001728205us-gaap:AdditionalPaidInCapitalMember2021-12-310001728205us-gaap:RetainedEarningsMember2021-12-310001728205us-gaap:AccumulatedOtherComprehensiveIncomeMember2021-12-310001728205us-gaap:CommonStockMember2022-01-012022-12-310001728205us-gaap:AdditionalPaidInCapitalMember2022-01-012022-12-310001728205us-gaap:AccumulatedOtherComprehensiveIncomeMember2022-01-012022-12-310001728205us-gaap:RetainedEarningsMember2022-01-012022-12-310001728205us-gaap:CommonStockMember2022-12-310001728205us-gaap:AdditionalPaidInCapitalMember2022-12-310001728205us-gaap:RetainedEarningsMember2022-12-310001728205us-gaap:AccumulatedOtherComprehensiveIncomeMember2022-12-310001728205us-gaap:CommonStockMember2023-01-012023-12-310001728205us-gaap:AdditionalPaidInCapitalMember2023-01-012023-12-310001728205us-gaap:RetainedEarningsMember2023-01-012023-12-310001728205us-gaap:AccumulatedOtherComprehensiveIncomeMember2023-01-012023-12-310001728205us-gaap:CommonStockMember2023-12-310001728205us-gaap:AdditionalPaidInCapitalMember2023-12-310001728205us-gaap:RetainedEarningsMember2023-12-310001728205us-gaap:AccumulatedOtherComprehensiveIncomeMember2023-12-310001728205srt:MinimumMember2023-01-012023-12-310001728205srt:MaximumMember2023-01-012023-12-310001728205pll:SayonaMiningLimitedMember2023-01-012023-12-310001728205us-gaap:CustomerConcentrationRiskMemberus-gaap:RevenueFromContractWithCustomerMemberpll:ThreeLargestCustomersMember2023-01-012023-12-31xbrli:pure0001728205pll:StockIncentivePlanMember2023-01-012023-12-310001728205pll:StockIncentivePlanMember2023-12-310001728205pll:ExplorationCostsMember2023-01-012023-12-310001728205pll:ExplorationCostsMember2022-01-012022-12-310001728205pll:ExplorationCostsMember2021-07-012021-12-310001728205pll:ExplorationCostsMember2020-07-012021-06-300001728205us-gaap:SellingGeneralAndAdministrativeExpensesMember2023-01-012023-12-310001728205us-gaap:SellingGeneralAndAdministrativeExpensesMember2022-01-012022-12-310001728205us-gaap:SellingGeneralAndAdministrativeExpensesMember2021-07-012021-12-310001728205us-gaap:SellingGeneralAndAdministrativeExpensesMember2020-07-012021-06-300001728205srt:MinimumMember2022-01-012022-12-310001728205srt:MaximumMember2022-01-012022-12-310001728205srt:MinimumMember2020-07-012021-06-300001728205srt:MaximumMember2020-07-012021-06-300001728205pll:MilestonePRAsMember2023-12-310001728205pll:TSRPRAsMember2023-12-310001728205us-gaap:PerformanceSharesMember2023-12-310001728205pll:TSRPRAsMembersrt:MinimumMember2023-12-310001728205pll:TSRPRAsMembersrt:MaximumMember2023-12-310001728205pll:TSRPRAsMembersrt:MinimumMember2023-01-012023-12-310001728205pll:TSRPRAsMembersrt:MaximumMember2023-01-012023-12-310001728205pll:TSRPRAsMember2023-01-012023-12-310001728205us-gaap:RestrictedStockUnitsRSUMember2020-06-300001728205us-gaap:PerformanceSharesMember2020-06-300001728205us-gaap:RestrictedStockUnitsRSUMember2020-07-012021-06-300001728205us-gaap:PerformanceSharesMember2020-07-012021-06-300001728205us-gaap:RestrictedStockUnitsRSUMember2021-06-300001728205us-gaap:PerformanceSharesMember2021-06-300001728205us-gaap:RestrictedStockUnitsRSUMember2021-07-012021-12-310001728205us-gaap:PerformanceSharesMember2021-07-012021-12-310001728205us-gaap:RestrictedStockUnitsRSUMember2021-12-310001728205us-gaap:PerformanceSharesMember2021-12-310001728205us-gaap:RestrictedStockUnitsRSUMember2022-01-012022-12-310001728205us-gaap:PerformanceSharesMember2022-01-012022-12-310001728205us-gaap:RestrictedStockUnitsRSUMember2022-12-310001728205us-gaap:PerformanceSharesMember2022-12-310001728205us-gaap:RestrictedStockUnitsRSUMember2023-01-012023-12-310001728205us-gaap:PerformanceSharesMember2023-01-012023-12-310001728205us-gaap:RestrictedStockUnitsRSUMember2023-12-310001728205us-gaap:EmployeeStockOptionMember2023-01-012023-12-310001728205us-gaap:EmployeeStockOptionMember2022-01-012022-12-310001728205us-gaap:EmployeeStockOptionMember2021-07-012021-12-310001728205us-gaap:EmployeeStockOptionMember2020-07-012021-06-300001728205us-gaap:RestrictedStockUnitsRSUMember2023-01-012023-12-310001728205us-gaap:RestrictedStockUnitsRSUMember2022-01-012022-12-310001728205us-gaap:RestrictedStockUnitsRSUMember2021-07-012021-12-310001728205us-gaap:RestrictedStockUnitsRSUMember2020-07-012021-06-300001728205us-gaap:PerformanceSharesMember2023-01-012023-12-310001728205us-gaap:PerformanceSharesMember2022-01-012022-12-310001728205us-gaap:PerformanceSharesMember2021-07-012021-12-310001728205us-gaap:PerformanceSharesMember2020-07-012021-06-300001728205us-gaap:ValuationAllowanceOfDeferredTaxAssetsMember2022-12-310001728205us-gaap:ValuationAllowanceOfDeferredTaxAssetsMember2021-12-310001728205us-gaap:ValuationAllowanceOfDeferredTaxAssetsMember2021-06-300001728205us-gaap:ValuationAllowanceOfDeferredTaxAssetsMember2020-06-300001728205us-gaap:ValuationAllowanceOfDeferredTaxAssetsMember2023-01-012023-12-310001728205us-gaap:ValuationAllowanceOfDeferredTaxAssetsMember2022-01-012022-12-310001728205us-gaap:ValuationAllowanceOfDeferredTaxAssetsMember2021-07-012021-12-310001728205us-gaap:ValuationAllowanceOfDeferredTaxAssetsMember2020-07-012021-06-300001728205us-gaap:ValuationAllowanceOfDeferredTaxAssetsMember2023-12-310001728205us-gaap:DomesticCountryMember2023-12-310001728205us-gaap:DomesticCountryMember2022-12-310001728205us-gaap:StateAndLocalJurisdictionMember2023-12-310001728205us-gaap:StateAndLocalJurisdictionMember2022-12-310001728205us-gaap:ForeignCountryMemberus-gaap:AustralianTaxationOfficeMember2023-12-310001728205us-gaap:ForeignCountryMemberus-gaap:AustralianTaxationOfficeMember2022-12-310001728205pll:ForeignTaxAuthorityOtherMemberus-gaap:AustralianTaxationOfficeMember2023-12-310001728205pll:ForeignTaxAuthorityOtherMemberus-gaap:AustralianTaxationOfficeMember2022-12-310001728205us-gaap:MiningPropertiesAndMineralRightsMember2023-12-310001728205us-gaap:MiningPropertiesAndMineralRightsMember2022-12-310001728205us-gaap:MineDevelopmentMember2023-12-310001728205us-gaap:MineDevelopmentMember2022-12-310001728205us-gaap:LandMember2023-12-310001728205us-gaap:LandMember2022-12-310001728205us-gaap:LeaseholdImprovementsMember2023-12-310001728205us-gaap:LeaseholdImprovementsMember2022-12-310001728205us-gaap:WellsAndRelatedEquipmentAndFacilitiesMember2023-12-310001728205us-gaap:WellsAndRelatedEquipmentAndFacilitiesMember2022-12-310001728205us-gaap:ConstructionInProgressMember2023-12-310001728205us-gaap:ConstructionInProgressMember2022-12-310001728205pll:SayonaMiningLimitedMember2021-06-300001728205pll:SayonaQuebecIncMember2021-06-300001728205pll:AtlanticLithiumMember2021-06-300001728205pll:VinlandLithiumMember2021-06-300001728205pll:AtlanticLithiumMember2021-07-012021-12-310001728205pll:SayonaMiningLimitedMember2021-07-012021-12-310001728205pll:SayonaQuebecIncMember2021-07-012021-12-310001728205pll:SayonaMiningAndSayonaQuebecMember2021-07-012021-12-310001728205pll:SayonaMiningLimitedMember2021-12-310001728205pll:SayonaQuebecIncMember2021-12-310001728205pll:AtlanticLithiumMember2021-12-310001728205pll:VinlandLithiumMember2021-12-310001728205pll:SayonaMiningLimitedMember2022-01-012022-12-310001728205pll:SayonaQuebecIncMember2022-01-012022-12-310001728205pll:SayonaMiningAndSayonaQuebecMember2022-01-012022-12-310001728205pll:AtlanticLithiumMember2022-01-012022-12-310001728205pll:SayonaMiningLimitedMember2022-12-310001728205pll:SayonaQuebecIncMember2022-12-310001728205pll:AtlanticLithiumMember2022-12-310001728205pll:VinlandLithiumMember2022-12-310001728205pll:VinlandLithiumMember2023-01-012023-12-310001728205pll:SayonaQuebecIncMember2023-01-012023-12-310001728205pll:AtlanticLithiumMember2023-01-012023-12-310001728205pll:SayonaMiningSayonaQuebecAndAtlanticLithiumMember2023-01-012023-12-310001728205pll:SayonaMiningLimitedMember2023-12-310001728205pll:SayonaQuebecIncMember2023-12-310001728205pll:AtlanticLithiumMember2023-12-310001728205pll:VinlandLithiumMember2023-12-310001728205pll:SayonaMiningLimitedMemberpll:SayonaQuebecIncMember2023-12-310001728205pll:NorthAmericanLithiumMiningMemberpll:SayonaQuebecIncMember2023-12-310001728205pll:SayonaQuebecIncMember2023-12-31utr:tiso4217:USDutr:t0001728205pll:NorthAmericanLithiumMiningMemberpll:SayonaQuebecIncMember2023-01-012023-12-310001728205pll:NorthAmericanLithiumMiningMemberpll:SayonaQuebecIncMember2023-12-31iso4217:USDpll:Tonne0001728205pll:AtlanticLithiumMember2023-12-310001728205pll:KillickLithiumMember2023-12-310001728205pll:SayonaMiningLimitedMember2023-01-012023-12-310001728205pll:SayonaQuebecIncMember2023-01-012023-12-310001728205pll:AtlanticLithiumMember2023-01-012023-12-310001728205pll:SayonaMiningLimitedMember2023-12-310001728205pll:SayonaQuebecIncMember2023-12-310001728205pll:AtlanticLithiumMember2023-12-310001728205pll:SayonaMiningLimitedMember2022-01-012022-12-310001728205pll:SayonaQuebecIncMember2022-01-012022-12-310001728205pll:AtlanticLithiumMember2022-01-012022-12-310001728205pll:SayonaMiningLimitedMember2022-12-310001728205pll:SayonaQuebecIncMember2022-12-310001728205pll:AtlanticLithiumMember2022-12-310001728205pll:SayonaMiningLimitedMember2021-07-012021-12-310001728205pll:SayonaQuebecIncMember2021-07-012021-12-310001728205pll:AtlanticLithiumMember2021-07-012021-12-310001728205pll:SayonaMiningLimitedMember2021-12-310001728205pll:SayonaQuebecIncMember2021-12-310001728205pll:AtlanticLithiumMember2021-12-310001728205pll:SayonaMiningLimitedMember2020-07-012021-06-300001728205pll:SayonaMiningLimitedMember2021-06-300001728205pll:GhanaProjectMember2023-12-31pll:phase0001728205pll:GhanaProjectPhaseOneMember2023-12-310001728205pll:GhanaProjectPhaseTwoMember2023-12-310001728205pll:EwoyaaProjectMember2023-12-310001728205pll:KillickLithiumMember2023-01-012023-12-310001728205pll:EwoyaaProjectMember2023-01-012023-12-310001728205pll:EwoyaaProjectMember2022-01-012022-12-310001728205pll:EwoyaaProjectMember2021-07-012021-12-31pll:option0001728205srt:MinimumMember2023-12-310001728205srt:MaximumMember2023-12-310001728205pll:PiedmontAustraliaMember2023-12-310001728205pll:PiedmontLithiumMember2021-05-1700017282052021-05-1600017282052021-05-170001728205pll:AdvanceOfFundingObligationsToKillickLithiumProjectMember2023-11-012023-11-300001728205pll:AdvanceOfFundingObligationsToKillickLithiumProjectMember2023-11-300001728205pll:VinlandLithiumMemberpll:AdvanceOfFundingObligationsToKillickLithiumProjectMember2023-11-012023-11-300001728205pll:LGChemMember2023-02-012023-02-280001728205pll:LGChemMember2023-02-280001728205pll:ShelfRegistrationProgramMember2022-03-012022-03-310001728205pll:ShelfRegistrationProgramMember2022-03-310001728205pll:USPublicOfferingProgramMember2022-03-012022-03-3100017282052021-09-240001728205pll:ShelfRegistrationProgramMember2023-12-310001728205pll:AustraliaSharePlacementsAndUSPublicOfferingsMember2020-08-012020-08-310001728205pll:AustraliaSharePlacementsAndUSPublicOfferingsMember2020-08-31iso4217:AUDxbrli:shares0001728205pll:AustraliaSharePlacementsAndUSPublicOfferingsMember2020-10-012020-10-310001728205pll:AustraliaSharePlacementsAndUSPublicOfferingsMember2020-10-3100017282052021-03-012021-03-3100017282052022-03-31pll:segment00017282052023-09-08pll:action00017282052023-05-3100017282052023-07-012023-07-3100017282052023-10-012023-10-3100017282052023-05-012023-05-310001728205pll:AtlanticLithiumMemberus-gaap:SubsequentEventMember2024-01-012024-02-270001728205pll:AtlanticLithiumMemberus-gaap:SubsequentEventMember2024-02-270001728205us-gaap:SubsequentEventMemberpll:SayonaMiningLimitedMember2024-01-012024-02-270001728205us-gaap:SubsequentEventMemberpll:SayonaMiningLimitedMember2024-02-270001728205us-gaap:SubsequentEventMemberpll:SayonaMiningLimitedMembersrt:MinimumMember2024-01-012024-02-270001728205us-gaap:SubsequentEventMemberpll:SayonaMiningLimitedMembersrt:MaximumMember2024-01-012024-02-270001728205us-gaap:SubsequentEventMemberpll:A2024CostSavingsPlanMember2024-02-012024-02-270001728205us-gaap:SubsequentEventMemberpll:A2024CostSavingsPlanMember2024-01-012024-02-270001728205us-gaap:SubsequentEventMemberpll:A2024CostSavingsPlanMemberus-gaap:EmployeeSeveranceMember2024-02-27
UNITED STATES
SECURITIES AND EXCHANGE COMMISSION
Washington, D.C. 20549
__________________________
FORM 10-K
________________________________
|
|
|
|
|
|
| ☒ |
ANNUAL REPORT PURSUANT TO SECTION 13 OR 15(d) OF THE SECURITIES EXCHANGE ACT OF 1934 |
For the fiscal year ended December 31, 2023
OR
|
|
|
|
|
|
| ☐ |
TRANSITION REPORT PURSUANT TO SECTION 13 OR 15(d) OF THE SECURITIES EXCHANGE ACT OF 1934 |
For the transition period from _______ to ________
Commission File Number 001-38427
___________________________________________________________
Piedmont Lithium Inc.
(Exact name of Registrant as specified in its Charter)
_________________________________________________________________________________________
|
|
|
|
|
|
| Delaware |
36-4996461 |
| (State or other jurisdiction of incorporation or organization) |
(I.R.S. Employer Identification No.) |
|
42 E Catawba Street
Belmont, North Carolina
|
28012 |
| (Address of principal executive offices) |
(Zip Code) |
Registrant’s telephone number, including area code: (704) 461-8000
Securities registered pursuant to Section 12(b) of the Act:
|
|
|
|
|
|
|
|
|
|
|
|
|
|
|
| Title of each class |
|
Trading Symbol |
|
Name of each exchange on which registered |
| Common stock, $0.0001 par value per share |
|
PLL |
|
The Nasdaq Capital Market |
Indicate by check mark if the registrant is a well-known seasoned issuer, as defined in Rule 405 of the Securities Act.
Indicate by check mark if the registrant is not required to file reports pursuant to Section 13 or Section 15(d) of the Act.
Indicate by check mark whether the registrant (1) has filed all reports required to be filed by Section 13 or 15(d) of the Securities Exchange Act of 1934 during the preceding 12 months (or for such shorter period that the registrant was required to file such reports), and (2) has been subject to such filing requirements for the past 90 days. Yes ☒ No ☐
Indicate by check mark whether the registrant has submitted electronically every Interactive Data File required to be submitted pursuant to Rule 405 of Regulation S-T (§ 232.405 of this chapter) during the preceding 12 months (or for such shorter period that the registrant was required to submit such files). Yes ☒ No ☐
Indicate by check mark whether the registrant is a large accelerated filer, an accelerated filer, a non-accelerated filer, smaller reporting company, or an emerging growth company. See the definitions of “large accelerated filer,” “accelerated filer,” “smaller reporting company,” and “emerging growth company” in Rule 12b-2 of the Securities Exchange Act.
|
|
|
|
|
|
|
|
|
|
|
|
|
|
|
|
|
|
| Large accelerated filer |
☒ |
Accelerated filer |
☐ |
Emerging growth company |
☐ |
|
|
|
|
|
|
| Non-accelerated filer |
☐ |
Smaller reporting company |
☐ |
|
|
☐ If an emerging growth company, indicate by check mark if the registrant has elected not to use the extended transition period for complying with any new or revised financial accounting standards provided pursuant to Section 13(a) of the Securities Exchange Act.
☒ Indicate by check mark whether the registrant has filed a report on and attestation to its management’s assessment of the effectiveness of its internal control over financial reporting under Section 404(b) of the Sarbanes-Oxley Act (15 U.S.C. 7262(b)) by the registered public accounting firm that prepared or issued its audit report.
☐ If securities are registered pursuant to Section 12(b) of the Act, indicate by check mark whether the financial statements of the registrant included in the filing reflect the correction of an error to previously issued financial statements.
☐ Indicate by check mark whether any of those error corrections are restatements that required a recovery analysis of incentive-based compensation received by any of the registrant’s executive officers during the relevant recovery period pursuant to §240.10D-1(b).
☐ Indicate by check mark whether the registrant is a shell company (as defined in Rule 12b-2 of the Securities Exchange Act).
As of June 30, 2023, the aggregate market value of voting and non-voting common stock held by non-affiliates of the registrant (based on the closing price of the registrant's common shares on the Nasdaq Stock Market for June 30, 2023) was approximately $1,107,794,754. For the purposes of the foregoing calculation only, all directors and executive officers of the registrant have been deemed affiliates.
As of February 23, 2024, there were 19,360,939 shares of the Registrant’s common stock outstanding.
Table of Contents
GLOSSARY OF TERMS AND DEFINITIONS
When the following terms and abbreviations appear in the text of this report, they have the meanings indicated below:
|
|
|
|
|
|
| 401(k) Plan |
Piedmont Lithium 401(k) Plan |
| ADS |
American depositary shares |
| Air Permit |
Conditional Major Non-Title V Construction and Operating Air Permit |
| Annual Report |
Annual Report on Form 10-K |
| ASC |
Accounting Standards Codification |
| ASX |
Australian Securities Exchange |
| Atlantic Lithium |
Atlantic Lithium Limited |
| Atlantic Lithium Ghana |
Atlantic Lithium’s Ghanaian-based lithium portfolio companies |
| ATVM |
Advanced Technology Vehicles Manufacturing |
| Authier |
Authier Lithium project |
| BAPE |
Bureau d’Audiences Publiques Sur l’Environnement |
| Carolina Lithium |
Carolina Lithium project |
| CDI |
CHESS Depository Interest |
| CERCLA |
Comprehensive Environmental Response, Compensation, and Liability Act |
| CIF |
cost, insurance and freight |
| CODM |
Chief Operating Decision Maker |
| COSO |
Committee of Sponsoring Organizations of the Treadway Commission |
| CWA |
Clean Water Act |
| DAP |
delivered at place |
| DEMLR |
Department of Energy, Mineral and Land Resources |
| DFS |
definitive feasibility study |
| dmt |
dry metric ton |
| DOE |
U.S. Department of Energy |
|
|
| EPA |
U.S. Environmental Protection Agency |
| EPC |
engineer, procure, and construct |
| ESG |
environmental, social and governance |
| Ewoyaa |
Ewoyaa Lithium project |
| Exchange Act |
Securities Exchange Act of 1934 |
| FCPA |
U.S. Foreign Corrupt Practices Act |
| FDIC |
Federal Deposit Insurance Corporation |
| FEED |
front-end engineering and design |
|
|
| FOB |
free on board |
| IRA |
Inflation Reduction Act of 2022 |
|
|
| JORC Code |
2012 Edition of the Australasian Code for Reporting of Exploration Results, Mineral Resources and Ore Reserves |
| Killick Lithium |
Killick Lithium Inc. |
| Lac Albert |
Lac Albert Lithium project |
| LCE |
lithium carbonate equivalent |
| LG Chem |
LG Chem, Ltd. |
Li2O |
lithium oxide |
LiOH·H2O |
lithium hydroxide monohydrate |
|
|
| MIIF |
Minerals Income Investment Fund of Ghana |
| Milestone PRAs |
PRAs that could be earned based upon achievement of certain specified milestones |
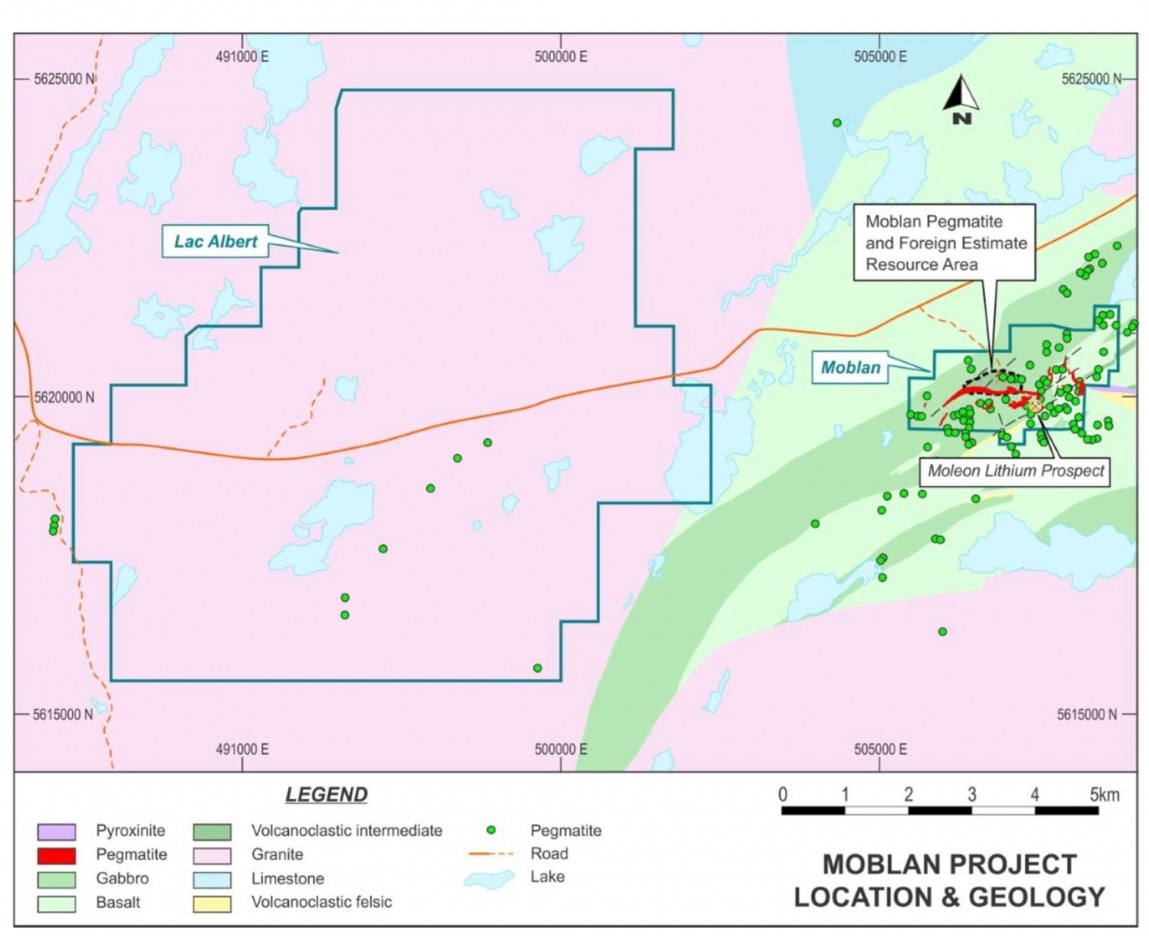
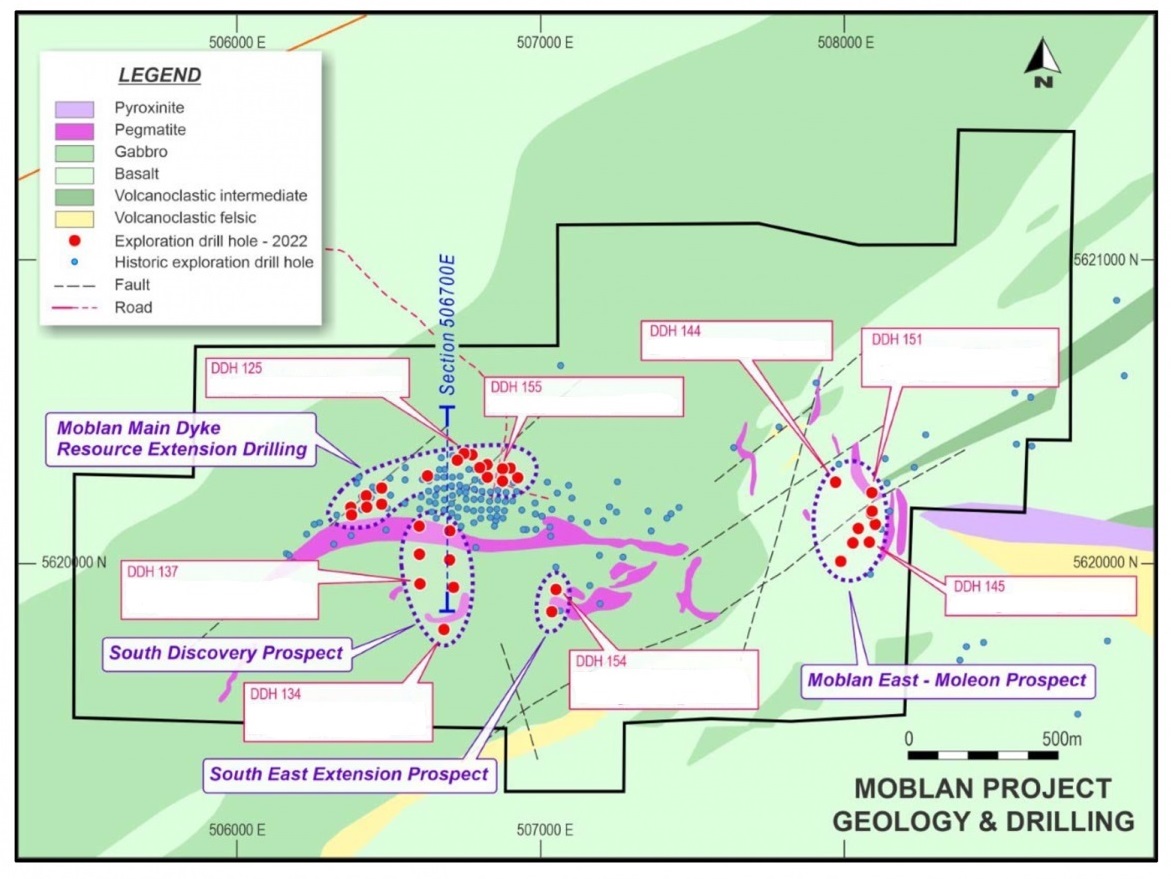
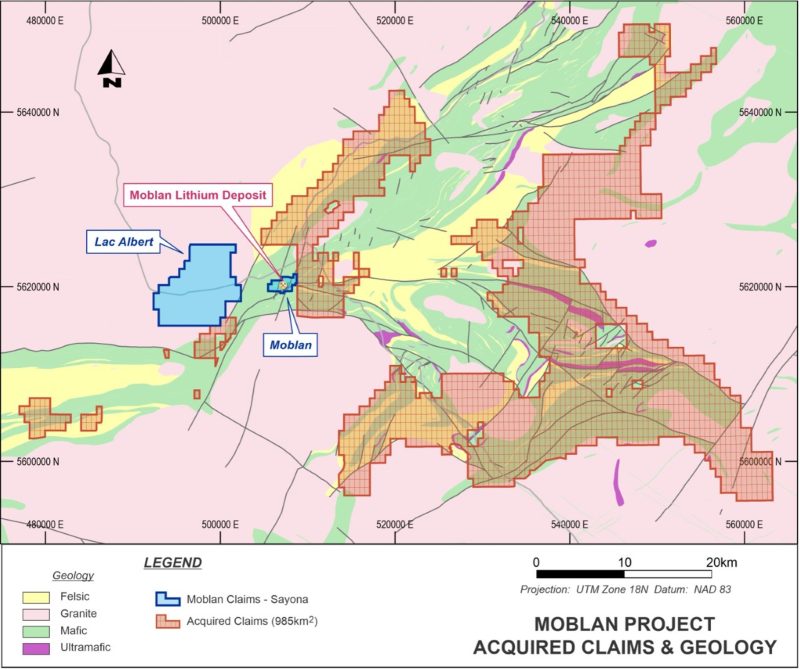
| Moblan |
Moblan Lithium project |
|
|
|
|
|
|
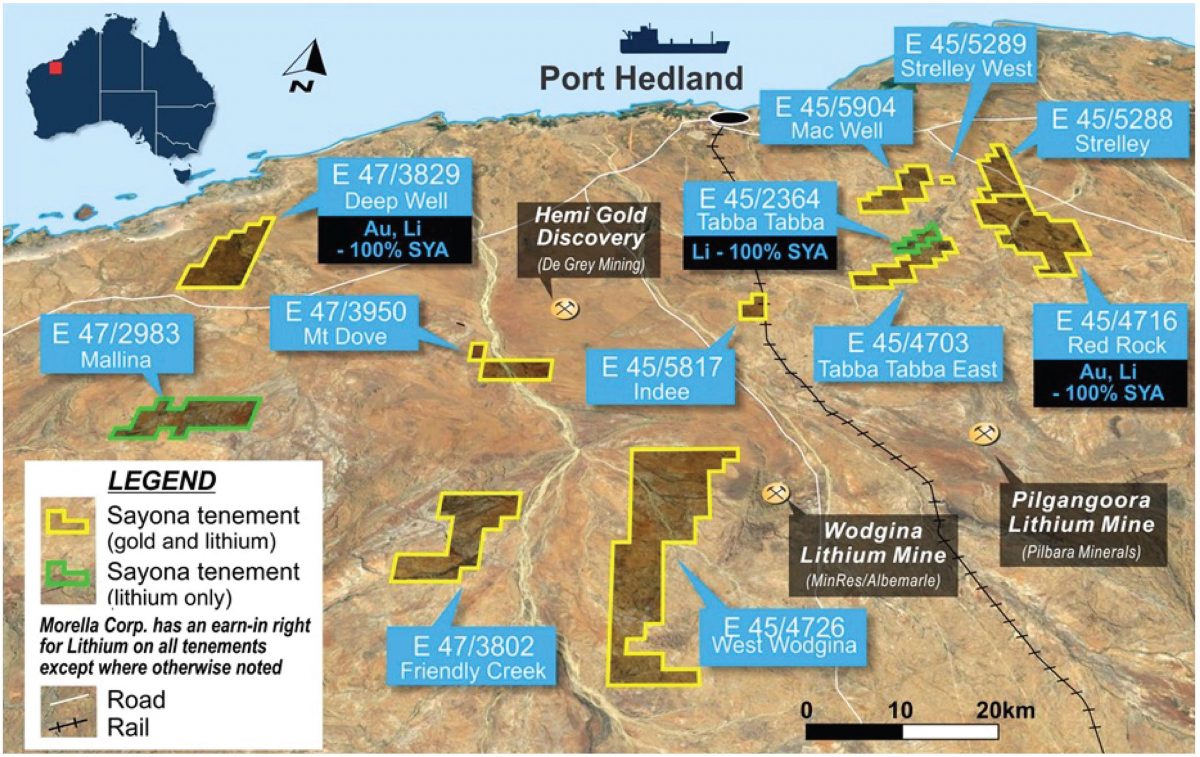
| Morella |
Morella Corporation Limited |
| MT |
million metric tons |
| NAL |
North American Lithium Inc. |
| Nasdaq |
Nasdaq Capital Market |
| NCDEQ |
North Carolina Department of Environmental Quality |
| NCDOT |
North Carolina Department of Transportation |
| NEPA |
National Environmental Protection Act |
| PFS |
prefeasibility study |
| Piedmont Australia |
Piedmont Lithium Pty Ltd (formerly named Piedmont Lithium Limited) |
|
|
| PRAs |
performance rights awards |
| Proxy Statement |
definitive Proxy Statement for our 2024 Annual Meeting of Stockholders to be held on or about June 14, 2024 |
| QP |
Qualified Person, as defined in Regulation S-K, Subpart 1300, under the Securities Act of 1933, as amended |
| RCRA |
Resource Conservation and Recovery Act |
| Ricca |
Ricca Resources Limited |
| ROU |
right-of-use |
| RSUs |
restricted stock units |
| Sayona Mining |
Sayona Mining Limited |
| Sayona Quebec |
Sayona Quebec Inc. |
| SEC |
Securities and Exchange Commission |
| SEH |
safety, environment and health |
| S-K 1300 |
Regulation S-K, Subpart 1300, under the Securities Act of 1933, as amended |
| spodumene concentrate |
spodumene concentrate or SC[X] where “X” represents the lithium content of the concentrate on an Li2O% basis |
| Stock Incentive Plan |
Piedmont Lithium Inc. Stock Incentive Plan adopted by our board in March 2021 |
| Tansim |
Tansim Lithium project |
| TDEC |
Tennessee Department of Environment and Conservation |
| Tennessee Lithium |
Tennessee Lithium project |
| Title V Permit |
Title V Prevention of Significant Deterioration Permit |
| TSR PRAs |
PRAs related to market goals based on a comparison of the Company's total shareholder return relative to the total shareholder return of a pre-determined set of peer group companies for the performance periods |
| U.S. |
United States of America |
| U.S. GAAP |
U.S. generally accepted accounting principles |
| Vallée |
Vallée Lithium project |
| Vinland Lithium |
Vinland Lithium Inc. |
Item 1. BUSINESS
Overview
Piedmont Lithium Inc. (“Piedmont Lithium,” “we,” “us,” “our,” “Company”) is a U.S.-based, development-stage company advancing a multi-asset, integrated lithium business in support of a clean energy economy and U.S. and global energy security. We plan to supply lithium hydroxide to the electric vehicle and battery manufacturing supply chains in North America by processing spodumene concentrate produced from assets we own or in which we have an economic interest.
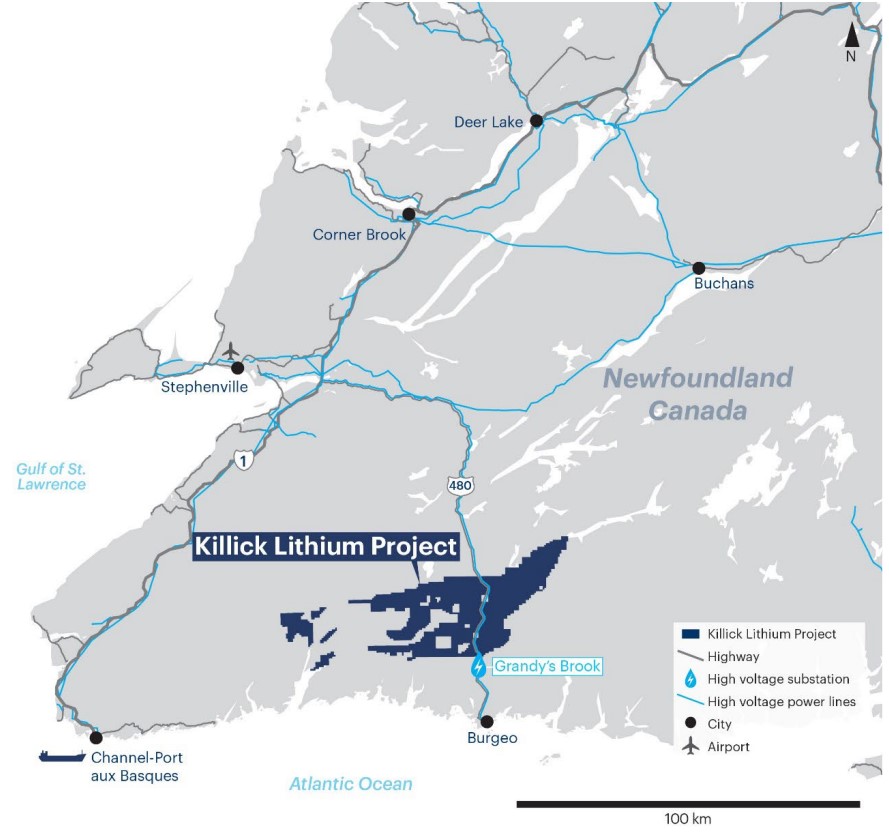
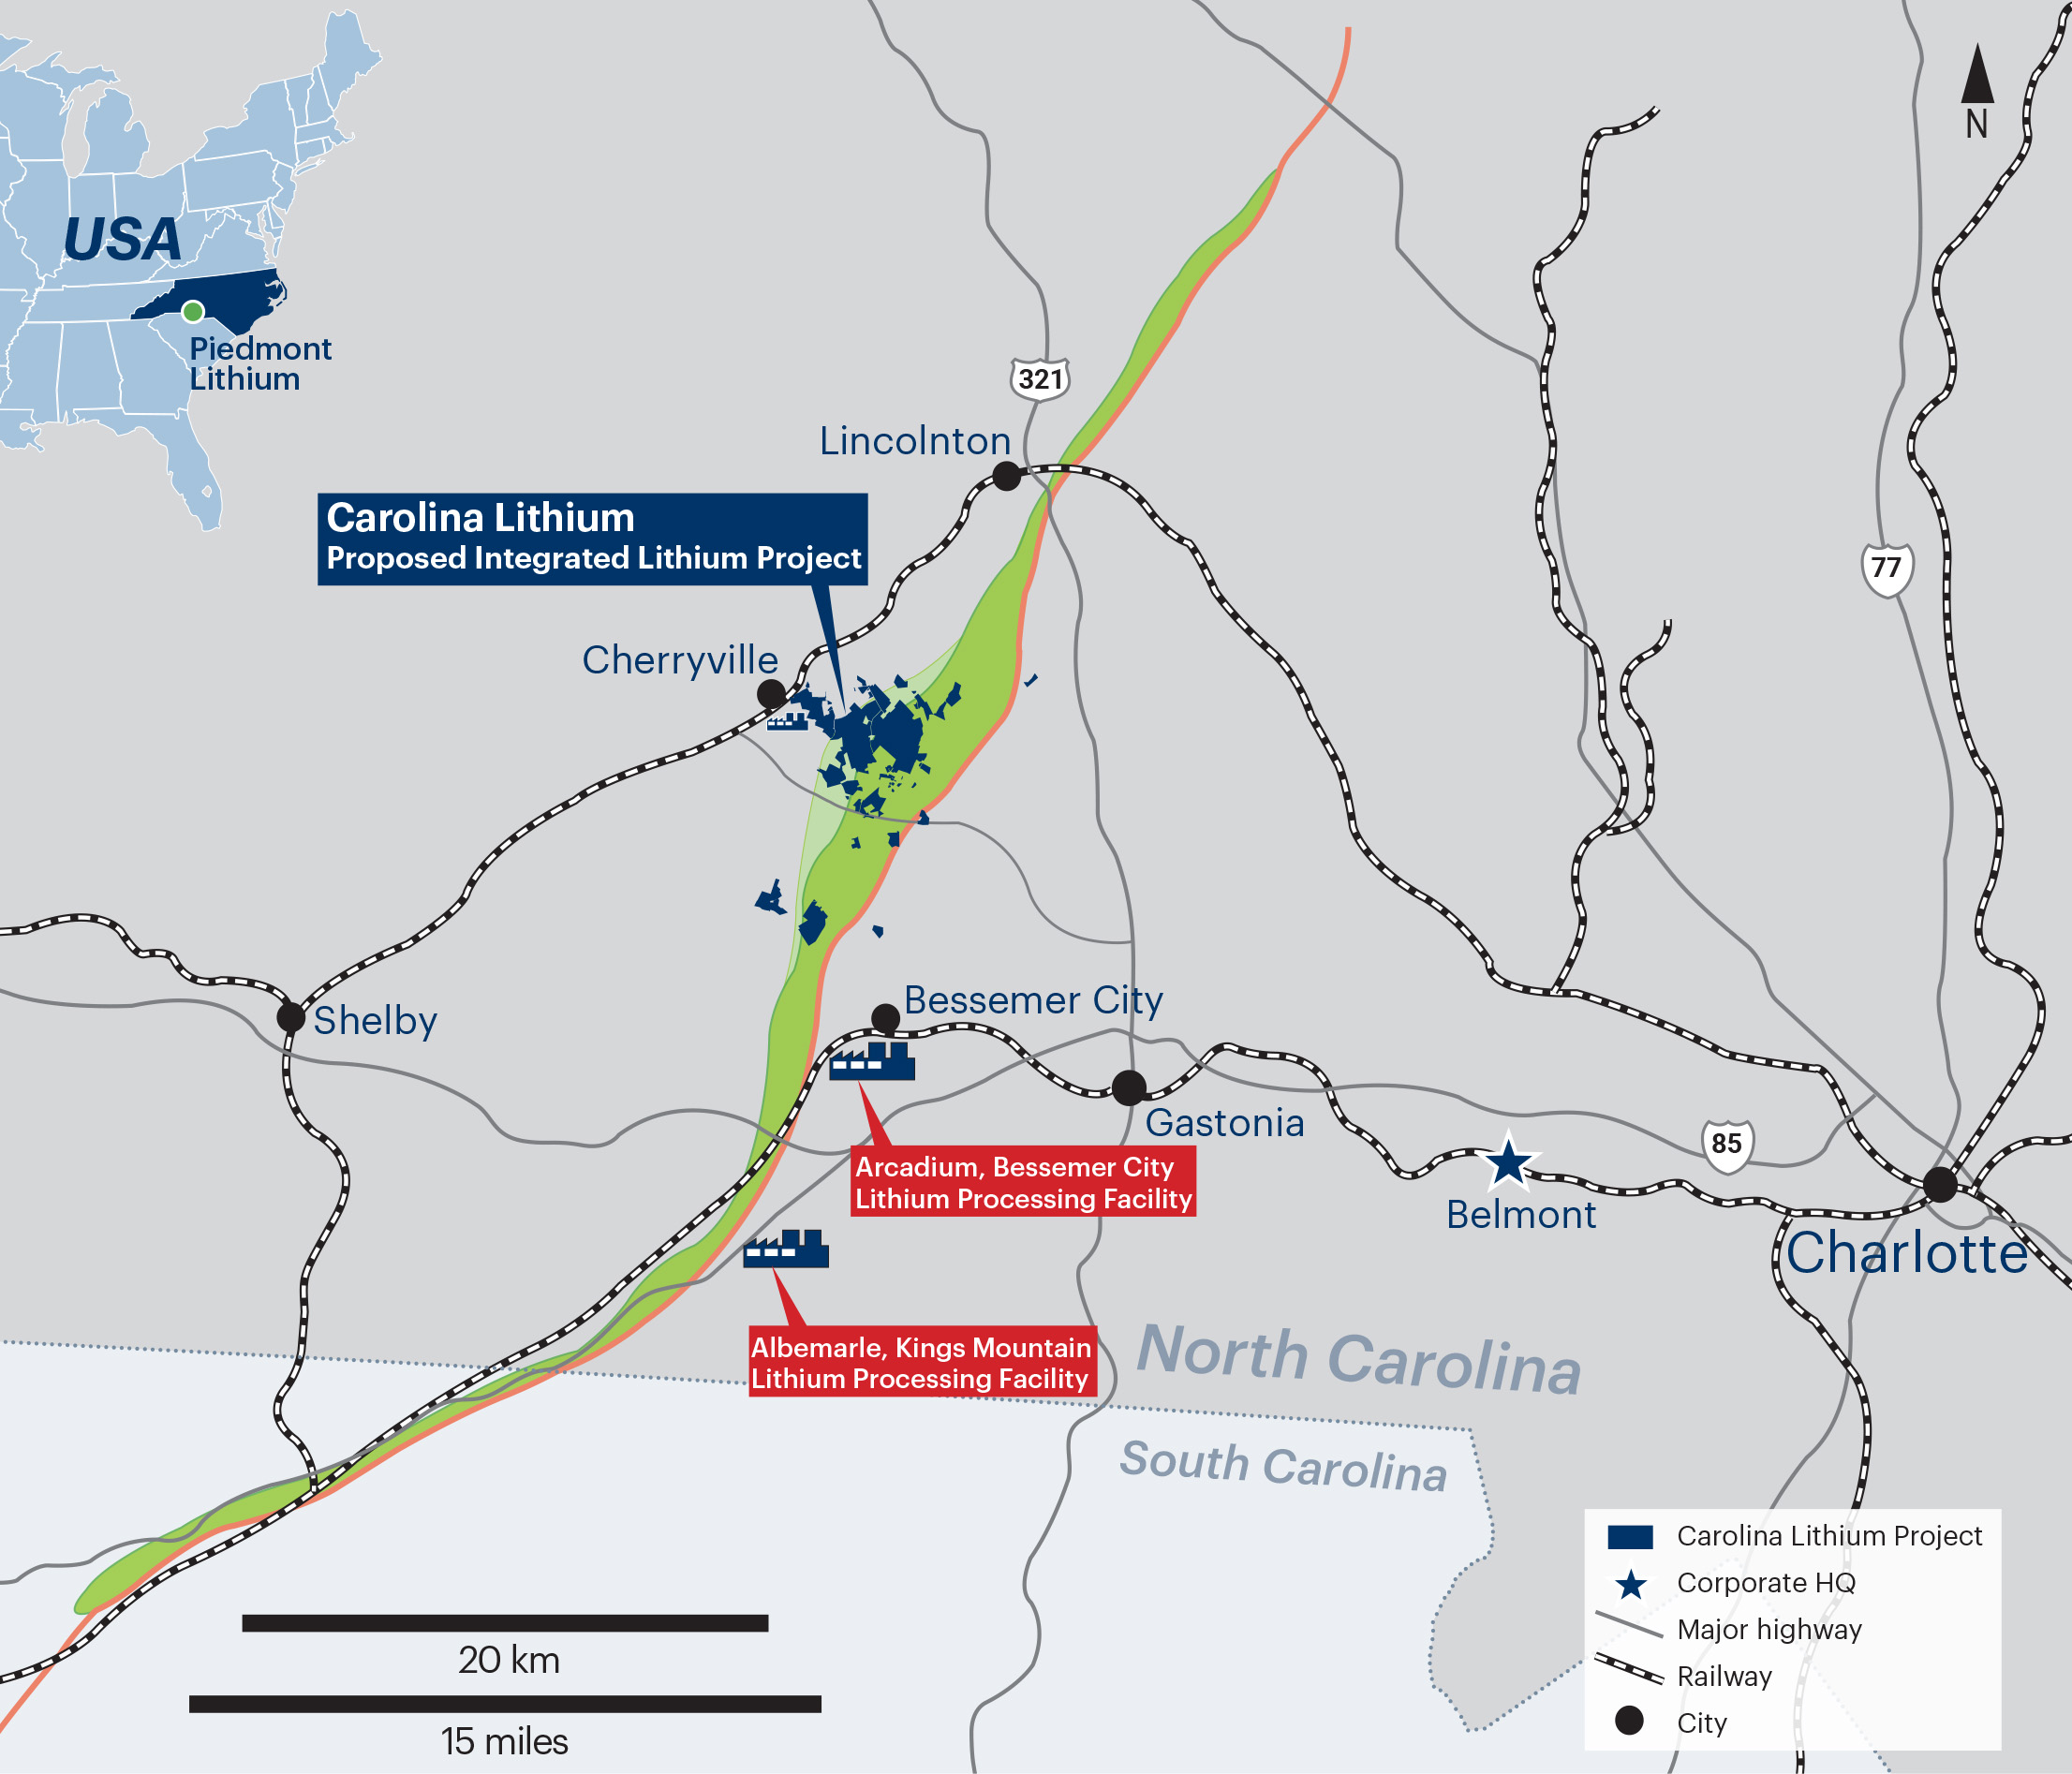
Our portfolio of wholly-owned projects includes Carolina Lithium, a proposed fully integrated spodumene ore-to-lithium hydroxide project in Gaston County, North Carolina, and Tennessee Lithium, a proposed merchant lithium hydroxide manufacturing plant in McMinn County, Tennessee. The balance of our project portfolio includes strategic investments in lithium assets in Quebec, Canada, including the now operating NAL mine; in Ghana, West Africa with Atlantic Lithium, including Ewoyaa; and in Newfoundland, Canada with Vinland Lithium, including the Killick Lithium project.
Piedmont Lithium is incorporated in the State of Delaware. We maintain executive offices at 42 E Catawba Street, Belmont, NC, 28012, and our telephone number is (704) 461-8000. Our website address is www.piedmontlithium.com. Shares of our common stock, par value $0.0001 per share, are traded on the Nasdaq under the symbol “PLL” and our CDIs, each representing 1/100th of a share of our common stock, are traded on the Australian Securities Exchange, also under the symbol “PLL.”
Foreign Currencies
Our consolidated financial statements have been presented in our reporting currency, U.S. dollars.
Gains and losses arising from translations or settlements of foreign currency denominated transactions or balances are included in the determination of income. Foreign currency translation adjustments resulting from the change in functional currency are included in “Other comprehensive income (loss), net of tax,” and gains and losses resulting from foreign currency transactions are presented in “(Loss) gain from foreign exchange” in the consolidated financial statements.
Unless otherwise indicated, all references to “$” are to U.S. dollars, all references to “AUD” are to Australian dollars, all references to “CAD” are to Canadian dollars, and all references to “GBP” are to Pound Sterling.
Our Segment
We have one operating segment, which is also our reportable segment. Our Chief Operating Decision Maker, who is also our CEO, manages our operations on a consolidated basis for purposes of allocating resources.
Strategy
Our strategic goal is to become a leading producer of lithium hydroxide in North America, supplied by geographically diverse and sustainable spodumene assets. North American demand for large vehicles and the custom of driving relatively long distances, combined with automakers’ plans for and commitments to electric vehicle production, should continue to expand the demand for North American manufactured lithium hydroxide. We believe our global portfolio of hard rock lithium assets should support a level of estimated lithium hydroxide production that will dramatically increase current production of lithium hydroxide in the United States.
Our plan is to produce battery-grade lithium hydroxide from spodumene concentrate. We believe spodumene concentrate represents the lowest-risk and most commercially scalable raw material source for the production of lithium hydroxide. Within our production process, we expect to use the innovative Metso:Outotec Pressure Leach Technology as well as a number of manufacturing processes commonly used in the lithium industry today. We plan, as part of our sustainability goals within our overall ESG strategy, to develop our greenfield operations in North Carolina and Tennessee as two of the most sustainable lithium hydroxide production operations in the world.
Our portfolio of projects and strategic equity investments are being developed on a measured timeline to optimize both near-term cash flow and long-term value maximization. At production, we expect to have an estimated lithium hydroxide manufacturing capacity of 60,000 metric tons per year, as compared to the current total estimated U.S. lithium hydroxide production capacity of approximately 20,000 metric tons per year. In support of our strategy, we continue to evaluate opportunities to further expand our resource base and production capacity.
Developing an Integrated Lithium Production Business—Key Projects
Quebec
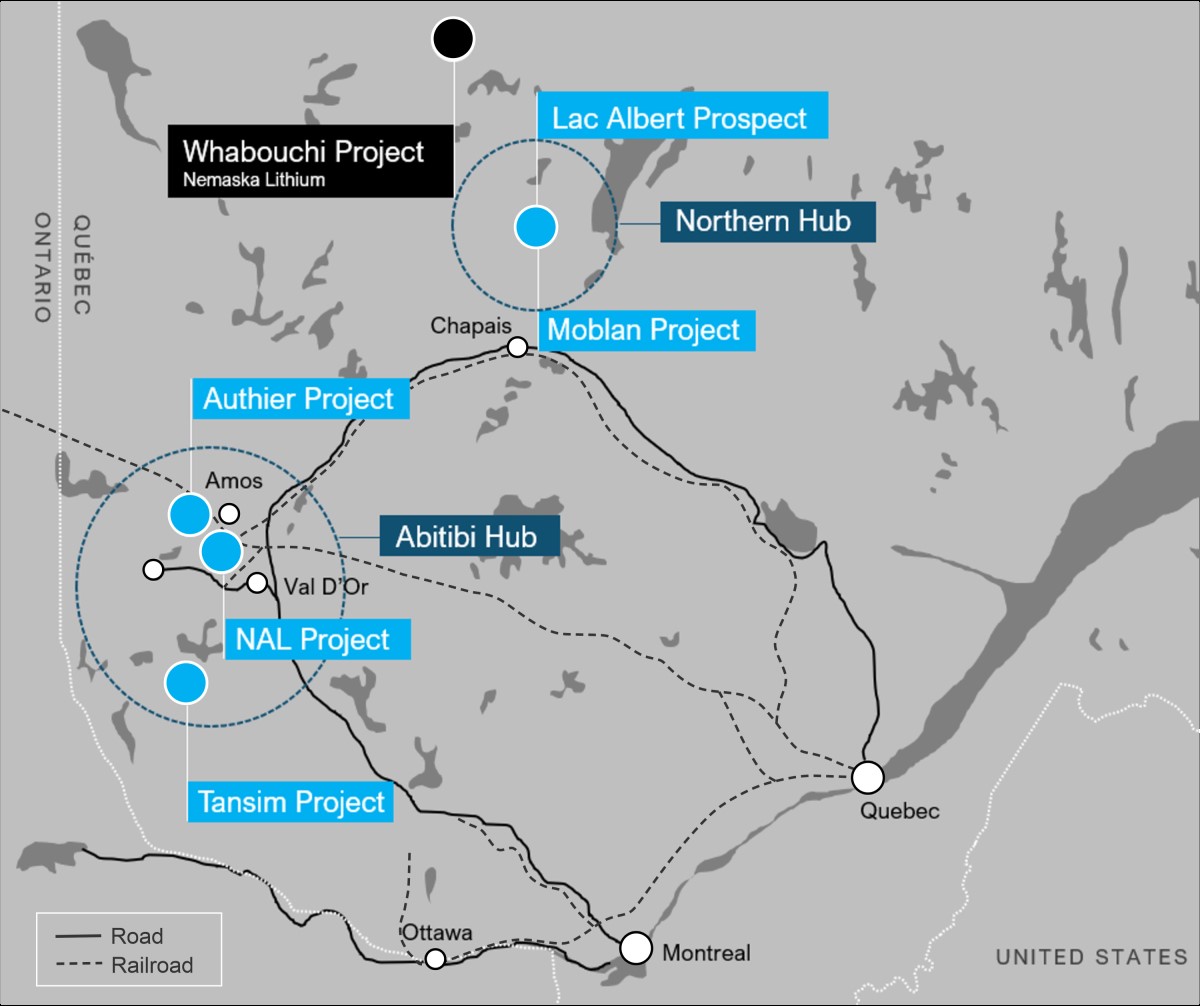
Piedmont Lithium owns an equity interest of 25% in Sayona Quebec, which owns full interests in the NAL, Authier, Tansim and Vallée properties. These projects are located in the Abitibi region of Quebec, Canada. Additionally, as of December 31, 2023, we owned an equity interest of approximately 12% in Sayona Mining, which owns 75% of Sayona Quebec. We also hold an offtake agreement with Sayona Quebec for the greater of 113,000 dmt per year or 50% of spodumene concentrate production at market prices, subject to a price floor of $500 per dmt and a price ceiling of $900 per dmt for 6.0% spodumene concentrate equivalent, on a life-of-mine basis.
NAL restarted production of spodumene concentrate in March 2023 and began delivering shipments in August 2023. From July 1, 2023, to December 31, 2023, NAL produced 65,723 dmt of spodumene concentrate, of which 43,200 dmt were delivered to Piedmont Lithium in accordance with our offtake agreement. We, in turn, shipped 43,200 dmt to our own customers whom we supply through offtake and purchase agreements, all of which contain market-based pricing mechanisms. A shipment of 13,104 dmt of spodumene concentrate was originally scheduled for late December 2023, but was delayed due to the effect of inclement weather on port logistics and did not ship until January 2024.
In October 2023, Sayona Mining provided a forecast for the one-year period July 1, 2023, through June 30, 2024, projecting production of 140,000 to 160,000 dmt and shipments of 160,000 to 180,000 dmt. This target assumes NAL reaches full production levels during the second quarter of 2024. NAL completed construction of its tailings storage facility in the first quarter of 2024 and plans to complete a new crushed-ore dome in the first half of 2024. The dome is expected to be key in achieving full run-rate production throughput at NAL, allowing for improved overall availability in the operation and resulting in meaningfully lower unit production costs.
In addition to spodumene mining and concentrate production, NAL’s complex also includes a partially completed lithium carbonate facility, which was developed by a prior operator of NAL. In the event both we and Sayona Mining decide to jointly construct and operate a lithium conversion plant through our jointly-owned entity, Sayona Quebec, then spodumene concentrate produced from NAL would be preferentially delivered to that conversion plant upon commencement of conversion operations. Any remaining spodumene concentrate not delivered to a jointly-owned conversion plant would first be delivered to Piedmont Lithium up to our offtake right and then to third parties.
In February 2024, we sold approximately 1,249.8 million shares of Sayona Mining for an average of $0.03 per share. The shares sold represented approximately 12% of Sayona Mining’s outstanding shares and resulted in approximately $41.4 million in net proceeds. The sale of these shares has no impact on Piedmont Lithium’s joint venture or offtake rights with Sayona Quebec. See Note 16—Subsequent Events to our Consolidated Financial Statements for additional information.
Ghana
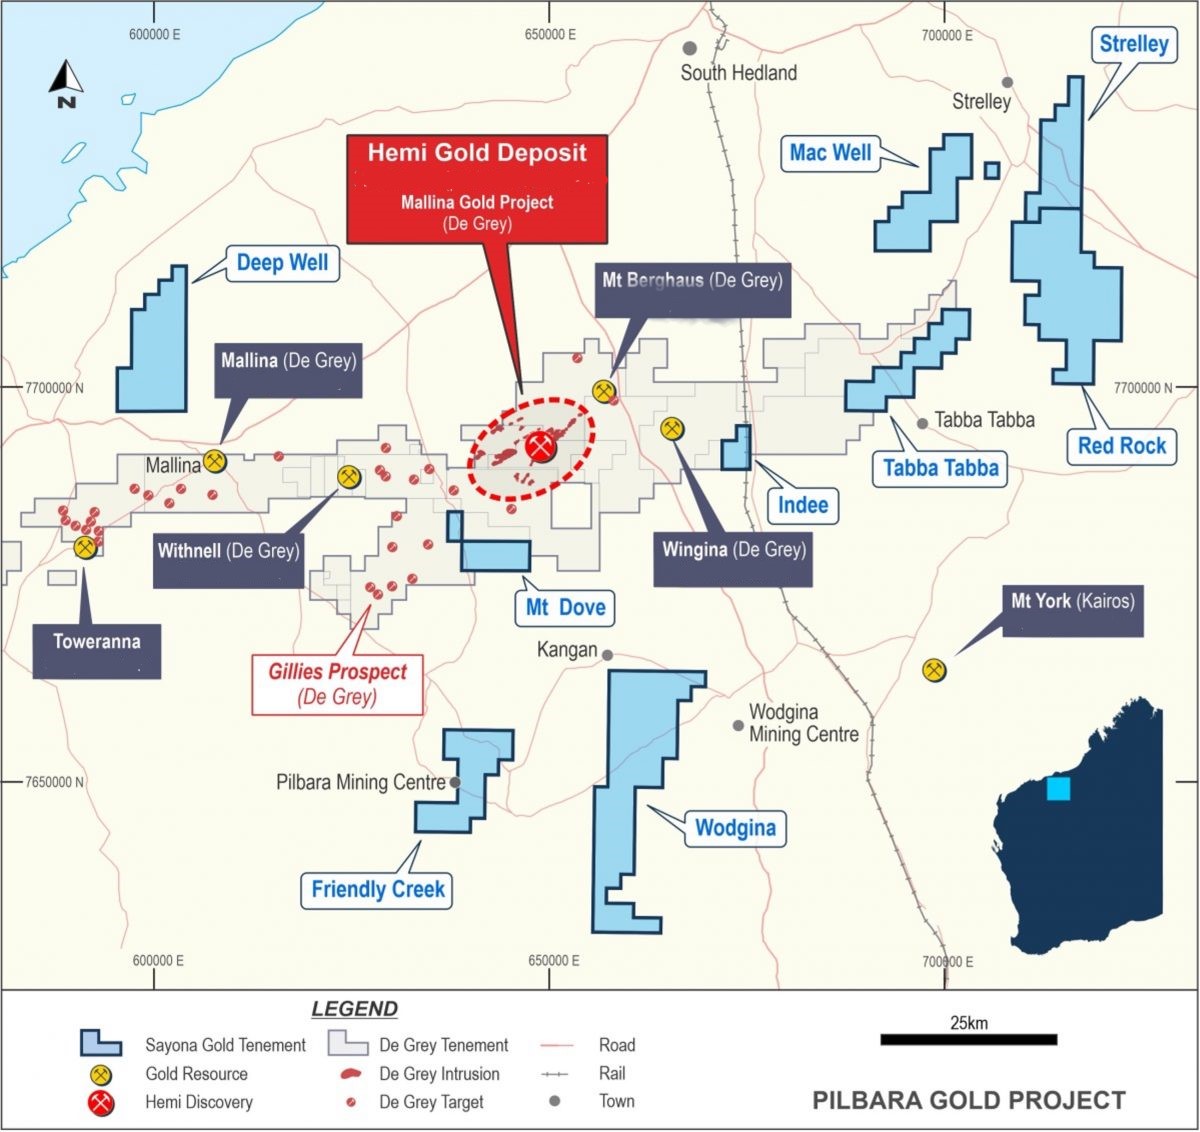
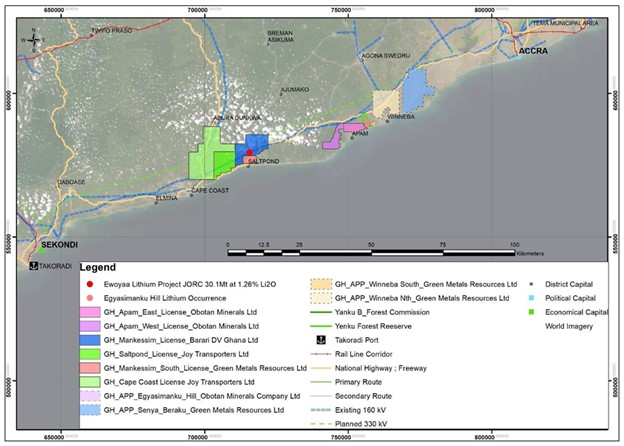
As of December 31, 2023, we owned an equity interest of approximately 9% in Atlantic Lithium and have the ability to earn a 50% equity interest in Atlantic Lithium Ghana. Additionally, we hold an offtake agreement for 50% of annual production of spodumene concentrate from Ewoyaa at market prices on a life-of-mine basis, subject to our satisfaction of certain development cost requirements. Ewoyaa is Atlantic Lithium’s flagship project in the Cape Coast region of Ghana and located approximately 70 miles from a major port via a national highway. We anticipate the development of the Ewoyaa project to be key for delivering spodumene concentrate to our planned Tennessee Lithium plant for conversion into lithium hydroxide.
In October 2023, Atlantic Lithium announced that Ghana’s Ministry of Lands and Natural Resources granted a mining lease for Ewoyaa. The mining lease provides exclusive rights to carry out lithium mining and commercial production activities for an initial 15-year period and is renewable in accordance with Ghanaian legislation. The issuance of the mining lease is subject to ratification by the Ghanaian parliament, approval by the Environmental Protection Agency of Ghana, and other statutory requirements. The mining lease provides the Government of Ghana a 13% free-carried interest and a 10% royalty in Ewoyaa. A final investment decision for Ewoyaa is anticipated upon receipt of the mining lease ratification and all environmental permits required for the construction and operation of Ewoyaa. Piedmont Lithium currently estimates these milestones will be achieved by 2025.
In September 2023, Atlantic Lithium announced that the Minerals Income Investment Fund of Ghana plans to invest (1) $27.9 million to acquire a 6% stake in Ewoyaa and (2) $5 million in Atlantic Lithium’s common stock to help further, in part, the development of Ewoyaa. MIIF completed the $5 million investment in Atlantic Lithium’s common stock in January 2024. As part of these investments, MIIF intends to fund 6% of all future exploration and development costs within Atlantic Lithium Ghana.
These funds are expected to equally reduce Piedmont Lithium’s and Atlantic Lithium’s capital expenditure contributions for Ewoyaa.
In August 2023, we exercised our option, subject to government approval, to acquire an initial 22.5% equity interest in Atlantic Lithium Ghana, which includes Ewoyaa. We expect to earn an additional 27.5% equity interest subject to funding the first $70 million of capital expenditures for Ewoyaa. Once our equity interests are acquired, and if both the mining lease is ratified and the agreement with MIIF is executed, Piedmont Lithium and Atlantic Lithium expect to each own 40.5% equity interest in Ewoyaa. As of December 31, 2023, we have not received any shares in Atlantic Lithium Ghana.
In February 2024, we sold 24.5 million shares of Atlantic Lithium, after which we retained shares representing approximately a 5% ownership interest. In connection with the sale of these shares, we no longer hold a board seat with Atlantic Lithium. See Note 16— Subsequent Events to our consolidated financial statements for additional information.
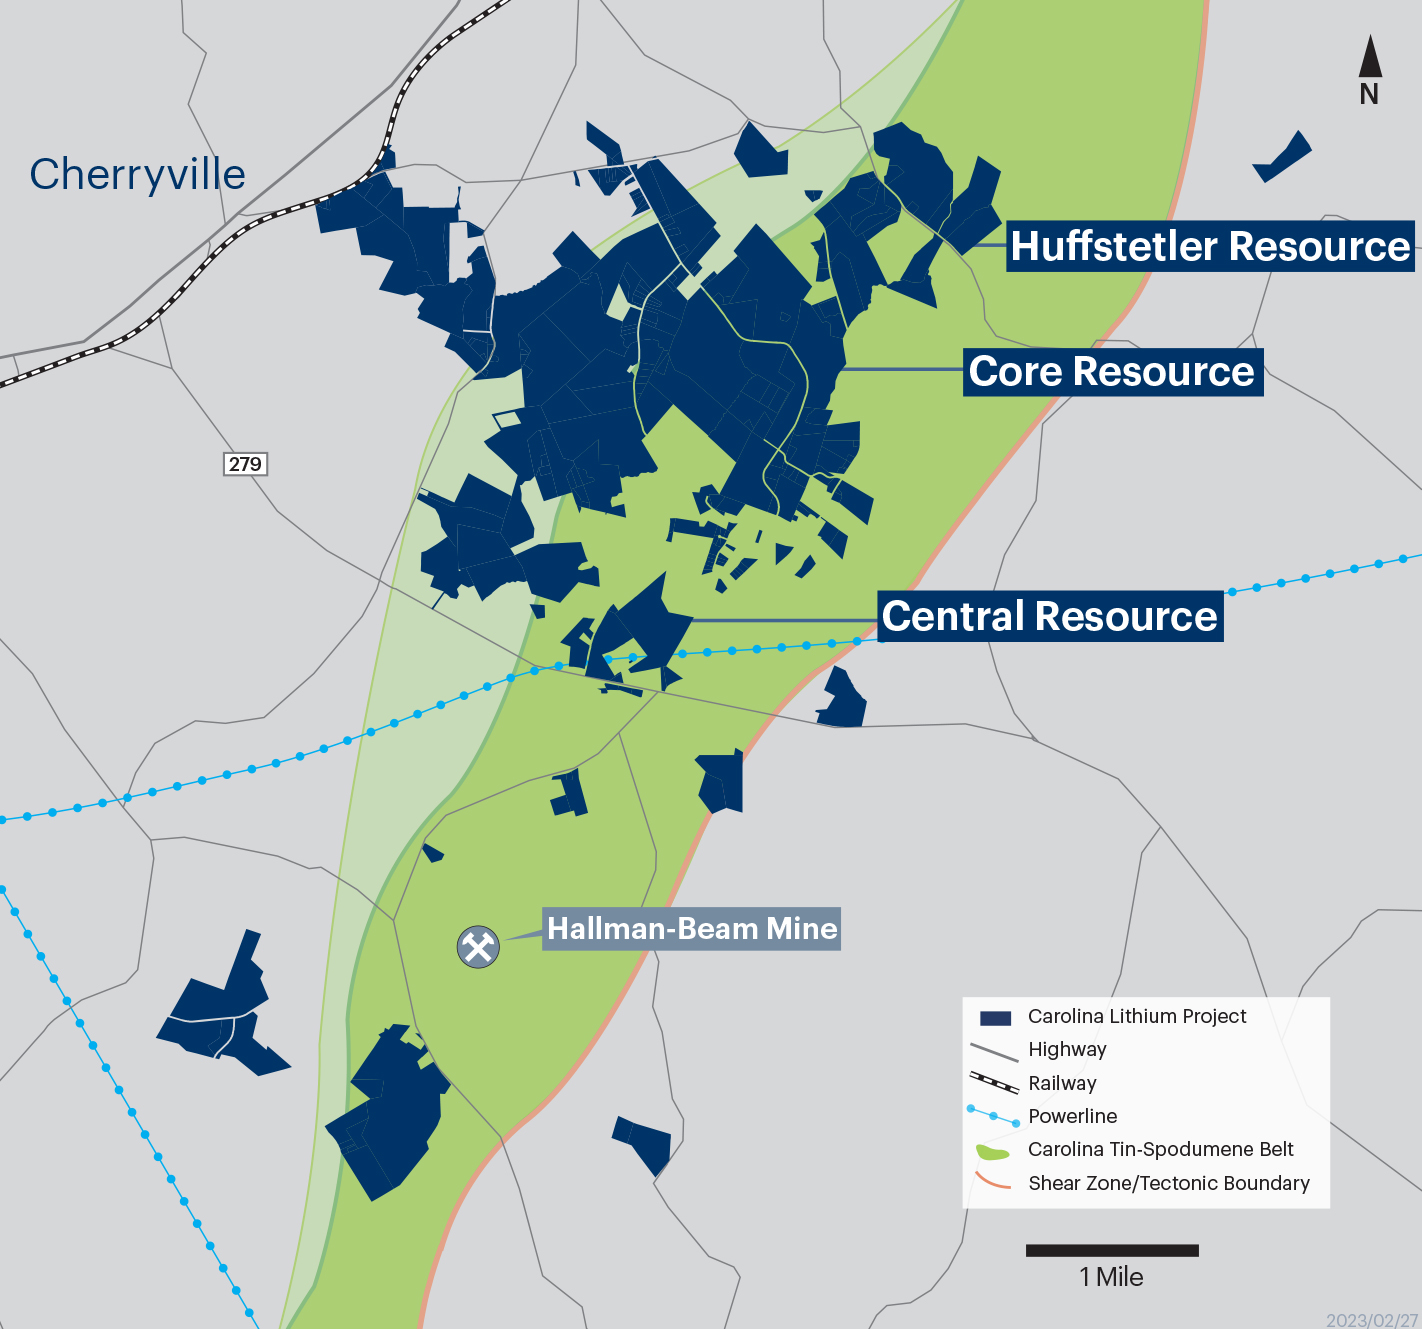
Carolina Lithium
Carolina Lithium is a development stage, hard rock lithium project located within the renowned Carolina Tin-Spodumene Belt of North Carolina and in close proximity to lithium markets. Carolina Lithium is expected to consist of a mining operation, a concentrator, and a lithium hydroxide conversion plant. In December 2021, we completed a DFS, inclusive of potential recovery of byproduct mineral resources, which estimated a project capital investment requirement of approximately $1 billion. The project is expected to produce 30,000 metric tons of lithium hydroxide per year at full capacity. Due to the expected quality of this hard rock lithium asset, integration of the operation, existing infrastructure, and proximity to lithium and byproduct markets, we believe Carolina Lithium will be one of the lowest cost lithium hydroxide manufacturing operations in the world.
We are currently engaged in permitting activities with state and local agencies for Carolina Lithium. In August 2021, we submitted a mining permit application to the NCDEQ’s DEMLR. Since our submission, we have responded to a series of additional information requests made by DEMLR. In February 2024, DEMLR issued their fourth Additional Information Request. We have 180 days in which to respond to this most recent information request. We estimate that we will submit our response by the end of the first quarter of 2024. A Prevention of Significant Deterioration – Title V Air Permit application has been submitted to the NCDEQ Division of Air Quality and was deemed complete in February 2023. Additionally, we continue to work with the North Carolina Division of Water Resources on our National Pollutant Discharge Elimination System permits for the site.
Our goal in 2024 is to obtain the necessary material state permits for Carolina Lithium. Thereafter, we expect to proceed with rezoning activities and anticipate construction to commence upon receipt of all required permits, rezoning, local approvals, and project financing activities.
Tennessee Lithium
Tennessee Lithium is a proposed merchant lithium hydroxide manufacturing plant located within McMinn County near Etowah, Tennessee. The plant is expected to produce 30,000 metric tons per year of lithium hydroxide, well surpassing the current estimated U.S. production capacity of 20,000 metric tons per year. The plant is expected to be one of the most sustainable lithium hydroxide operations in the world utilizing the innovative Metso:Outotec Pressure Leach Technology. Use of this technology is expected to reduce solid waste, create fewer emissions, lower carbon intensity, and improve capital and operating costs relative to incumbent technologies.
In July 2023, the Tennessee Department of Environment and Conservation issued a Conditional Major Non-Title V Construction and Operating Air Permit for Tennessee Lithium. As a result, we now have all material permits required to proceed with construction.
In 2023, we engaged advisors to support our funding strategy for the construction of Tennessee Lithium. In consultation with the DOE, we have decided to pursue an ATVM loan with the DOE’s Loan Programs Office, rather than complete the previously announced $141.7 million grant under the Bipartisan Infrastructure Law. The ATVM loan, if awarded, is expected to cover a significantly larger share of the capital required for the project, strengthening the opportunity for strategic parties to partner with us on the project. We expect the DOE and strategic funding processes to take several months to complete and is dependent on numerous factors, including prevailing market conditions.
In October 2023, we acquired a 132-acre disposal facility adjacent to the proposed Tennessee Lithium plant site for the purpose of disposing tailings from our operations if we do not establish a commercial plan to create value through the sale of this material. We maintain this facility in care and maintenance at this time. Additionally, we have entered into a purchase agreement to acquire an existing industrial facility in close proximity to our proposed Tennessee Lithium project site.
In December 2023, our option agreement to purchase the proposed site for Tennessee Lithium in the North Etowah Industrial Park in McMinn County, Tennessee expired. We are currently in discussions with county officials to extend the option.
Strengths
We believe that we are well-positioned to successfully execute our business strategies primarily due to our following competitive strengths:
•U.S.-based company—As a U.S. domiciled and listed company, Piedmont Lithium can benefit from U.S. policies aimed at supporting growth in the domestic battery supply chain and reducing reliance on foreign nations. These policies include the IRA’s Advanced Manufacturing Production Credit (Section 45X), which is available only to U.S. taxpayers and provides certain tax incentives for the production of applicable critical minerals. The IRA’s Clean Vehicle Tax Credit (Section 30D) for qualifying light electric vehicle purchases requires escalating usage of domestic critical minerals, which we expect to supply. These credits are in addition to the opportunities available through the DOE’s ATVM loan program.
•Revenue generation from NAL—We hold an offtake agreement with Sayona Quebec for the greater of 113,000 dmt per year or 50% of spodumene concentrate production from NAL at market prices, subject to a price floor of $500 per metric ton and a price ceiling of $900 per metric ton, on a life-of-mine basis. We, in turn, sell spodumene concentrate procured under our NAL offtake to Piedmont Lithium’s own customers at market-based prices. NAL remains a highly strategic asset as the only operating spodumene mine in all of North America.
•Scale and diversification of resources—We own or hold equity investments in three significant spodumene resources located in Quebec, Ghana, and North Carolina. Since January 2021, we have made investments in key spodumene resources and have established strategic partnerships with Sayona Mining and Atlantic Lithium. We continue to pursue opportunities to complement our business through additional acquisitions, joint ventures, strategic alliances, and investments.
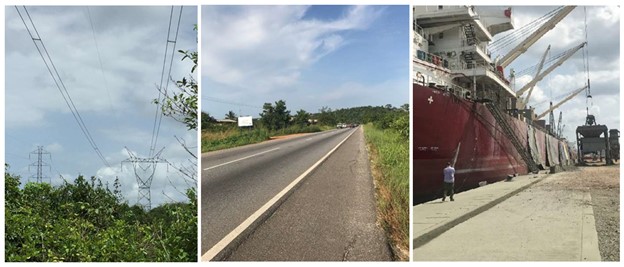
•Advantageous locations and infrastructure—NAL is located in a well-established mining district within the Abitibi region of Quebec, Canada. The region provides access to infrastructure and is geopolitically advantageous. NAL is near the major mining town of Val-d’Or, Quebec, with access to rail, hydropower, and a skilled labor workforce. NAL has a partially completed lithium carbonate facility on site, which was developed by a previous operator. Ewoyaa is located in the Cape Coast region of Ghana with available power infrastructure nearby and direct highway access to Accra, which is approximately 60 miles from Ewoyaa. Ewoyaa also is approximately 70 miles from the deep-water Port of Takoradi, providing reasonable transport of spodumene concentrate as the feedstock for our planned Tennessee Lithium operation. Carolina Lithium is well situated in a historical lithium region within the developing “Battery Belt.” The area features access to road and rail infrastructure, a highly skilled labor force, low-cost and low-carbon sources of baseload grid power, and research and development centers for lithium manufacturing. Tennessee Lithium is expected to be located within the North Etowah Industrial Park in McMinn County, Tennessee. The region is home to a manufacturing workforce as well as power infrastructure, rail, highways, and nearby riverways.
•Strategic funding—We are evaluating a variety of funding options to support development objectives aimed at maintaining shareholder value in the capital markets. In February 2023, we received $75 million from LG Chem in exchange for common shares in Piedmont Lithium in conjunction with a multi-year spodumene concentrate offtake agreement. In October of 2022, we were selected for a $141.7 million grant from the DOE to support construction at our planned Tennessee Lithium project. However, in consultation with the DOE, we have decided to pursue an ATVM loan for Tennessee Lithium with the DOE’s Loan Programs Office, rather than complete the previously announced grant. We also intend to pursue ATVM loan funding for Carolina Lithium. The ATVM loans, if awarded, are expected to cover a significant share of the capital required for each project, thereby strengthening the opportunity for strategic parties at each project. Strategic partnerships, offtake prepayments, mineral royalties, and other opportunities are being considered to support the development of our projects and equity investments.
•Greenfield opportunities—Carolina Lithium and Tennessee Lithium are being designed as new operations, which offer the opportunity to leverage modern technologies, systems, and procedures. We expect to utilize the innovative Metso:Outotec Pressure Leach Technology to convert spodumene concentrate to lithium hydroxide at both U.S. projects. This technology is expected to provide a relative advantage in capital and operating costs and supports our ESG strategy to create a more sustainable operating profile as compared to other hard rock lithium conversion methods.
•Highly experienced management team—Our leadership team includes professionals with core skills and experience in management, operations, sales, and marketing of lithium manufacturing. The team has broad backgrounds and a long history of acquiring, developing, financing, and operating mining, energy, lithium, and chemical projects.
Marketing, Sales, and Principal Markets
We have a strategic partnership with Ion Carbon & Mineral, LLC to form Pronto Minerals, LLC for the purpose of marketing and selling byproducts, specifically quartz, feldspar, and mica, produced by our proposed Carolina Lithium project. We continue to explore potential strategic partnership and sales, offtake, and marketing agreements that will benefit the development of the Company’s assets as well as the U.S. electric vehicle supply chain.
Customers
On January 2, 2023, we entered into an amended offtake agreement with Tesla, Inc. to supply 125,000 dmt of spodumene concentrate from NAL. The term of the agreement is three years, beginning on January 2, 2023, through the end of 2025. Pricing is determined by a market-based mechanism. The three-year term can be extended for an additional three years upon mutual agreement.
On February 16, 2023, we entered into a spodumene concentrate offtake agreement with LG Chem. In the contract, we agree to sell 200,000 dmt of spodumene concentrate from our NAL offtake agreement. The term of the agreement expires four years from the date of first shipment, or upon the delivery 200,000 dmt. Pricing is determined by a market-based mechanism.
In addition to our offtake customers, we have entered into a series of purchase agreements with a major international trading company to facilitate individual sales. These purchase agreements provided for the delivery of spodumene concentrate on an FOB vessel basis (Incoterms 2020) and included a partial prepayment convention.
Competition and Market Barriers
We compete with other mineral and chemical processing companies in connection with the acquisition of suitable exploration properties and the engagement of qualified personnel. Many of our competitors possess greater financial resources and technical facilities than Piedmont Lithium. Although we aspire to be a leading lithium hydroxide producer in North America, the lithium mining and chemical industries are fragmented. We are one of many participants in these sectors. Many of our competitors, as compared to us, have been in business longer, have established more strategic partnerships and relationships, and have greater financial accessibility.
While we compete with other exploration companies in acquiring suitable properties, we believe there will be readily available purchasers of lithium chemical products or other industrial minerals if they are produced from any of our owned or leased properties. The price of our planned products may be affected by factors beyond our control, including fluctuations in the market prices for lithium, supplies of lithium, demand for lithium, and mining activities of others.
If we identify lithium mineralization that is determined to be of economic grade and in sufficient quantity to justify production, additional capital would be required to develop, mine, and sell such production. Our strategic partners, in which we have equity investments, face similar challenges as discussed above.
Government Regulations
Overview
Exploration and development activities for our projects are subject to extensive laws and regulations, which are overseen and enforced by multiple U.S. federal, state, and local authorities as well as foreign jurisdictions. These applicable laws govern exploration, development, production, exports, various taxes, labor standards, occupational and mine health and safety, waste disposal, protection and remediation of the environment, protection of endangered and protected species, and other matters. Various permits from government bodies are required for drilling, mining, or manufacturing operations to be undertaken, and we cannot be assured such permits will be received. Environmental laws and regulations may also, in addition to other requirements;
•require notice to stakeholders of proposed and ongoing exploration, drilling, environmental studies, mining, or production activities;
•require the installation of pollution control equipment;
•restrict the types, quantities and concentrations of various substances that can be released into the environment in connection with exploration, drilling, mining, lithium hydroxide manufacturing, or other production activities;
•limit or prohibit drilling, mining, lithium manufacturing or other production activities on lands located within wetlands, areas inhabited by endangered species and other protected areas, or otherwise restrict or prohibit activities that could impact the environment, including water resources;
•impose substantial liabilities for pollution resulting from current or former operations on or for any preexisting environmental impacts from our projects;
•require significant reclamation obligations in the future as a result of our mining and chemical operations; and
•require preparation of an environmental assessment or an environmental impact statement.
Compliance with environmental laws and regulations may impose substantial costs on us, subject us to significant potential liabilities, and have an adverse effect on our capital expenditures, results of operations, and competitive position. Violations and liabilities with respect to these laws and regulations could result in significant administrative, civil, and criminal penalties, remedial clean-ups, natural resource damages, permit modifications and/or revocations, operational interruptions and/or shutdowns, and other liabilities, as well as reputational harm, including damage to our relationships with customers, suppliers, investors, governments and other stakeholders. The costs of remedying such conditions may be significant, and remediation obligations could adversely affect our business, results of operations, and financial condition. Federal, state, and local legislative bodies and agencies frequently revise environmental laws and regulations, and any changes in these regulations, or the interpretations thereof, could require us to expend significant resources to comply with new laws or regulations or changes to current requirements and could have a material adverse effect on our business operations. As of the date of this Annual Report, other than with respect to the permitting activities of Carolina Lithium and Tennessee Lithium, we have not been required to spend material amounts on compliance regarding environmental regulations.
Permits
Obtaining and renewing governmental permits are complex and time-consuming processes and involves numerous jurisdictions, public hearings, and possibly costly undertakings. The timeliness and success of permitting efforts are contingent upon many variables not within our control, including the interpretation of permit approval requirements administered by the applicable permitting authority. We may not be able to obtain or renew permits that are necessary for our planned operations, or the cost and time required to obtain or renew such permits may exceed our expectations. Any unexpected delays or costs associated with the permitting process could delay the exploration, development and/or operation of our projects. For additional information, refer to Part I, Item 1A, “Risk Factors—We will be required to obtain governmental permits in order to conduct development and mining operations, a process that is often costly and time-consuming. There is no certainty that all necessary permits and approvals for our planned operations will be granted.”
Carolina Lithium
In November 2019, we were granted a CWA Section 404 Standard Individual Permit from the U.S. Army Corps of Engineers for our integrated Carolina Lithium project. We received an updated preliminary jurisdictional determination in March 2022 based on updated footprint of the integrated site.
In July 2022, we received an updated Clean Water Act Section 401 Individual Water Quality Certificate from the NCDEQ Division of Water Resources for our Carolina Lithium project.
In August 2021, we submitted a mining permit application to the NCDEQ’s DEMLR. Since our submission, we have responded to a series of additional information requests made by DEMLR. On February 9, 2024, DEMLR issued their fourth Additional Information Request. We have 180 days to respond to this latest information request.
In September 2021, the Gaston County Board of Commissioners updated its Unified Development Ordinance which, in part, defines operational requirements for new mines and quarries in the county and provides the parameters for the requisite conditional district zoning. At this time, we remain in pre-application consultation with Gaston County staff members and have not submitted a conditional district rezoning application.
We hold a Synthetic Minor Construction and Operation Permit issued by the NCDEQ’s Division of Air Quality for our property in Kings Mountain, NC. In June 2022, we submitted an application to modify the received air permit to incorporate the use of Metso:Outotec’s Pressure Leach Technology. Our application is currently on hold as further refinements to the process are being made.
In January 2022, we submitted a determination request to NCDEQ’s Division of Air Quality in connection with Carolina Lithium. In March 2022, we received a response to this request informing us that Carolina Lithium would require a Title V Permit. In August 2022, we submitted our Title V Permit application, which was deemed complete in February 2023, and is subject to ongoing review.
In January 2022, we received guidance that Carolina Lithium was not eligible for a North Carolina General Stormwater Permit. After further evaluation and testing, it was determined that the site would be covered by a National Pollutant Discharge Elimination System permit. In December 2022, we submitted applications to the NCDEQ Division of Water Resources for two permits, one covering the mine and concentration operations, and one covering the lithium hydroxide conversion plant. Both permit applications are currently under review. In June 2023, we received an additional information request for both permits. We continue to work with the Division of Water Resources to provide thorough responses for these additional information requests.
Exploration and evaluation activities for our Carolina Lithium project included drilling, which is authorized under a general permit initially approved in 2017 by the NCDEQ and updated in April 2019, October 2019, and June 2021. We have reclamation obligations under this permit, requiring us to reclaim all disturbed drill pads and temporary roads to the approximate original contours, including the seeding of grass and straw to stabilize any disturbances. Generally, we are required to affect such reclamation within 14 days following drilling. We have concluded that this cost of reclamation obligations is immaterial.
We may be required to obtain additional permits and approvals for Carolina Lithium including, but not limited to, a municipal wastewater permit by the City of Gastonia Wastewater Treatment, a road abandonment approved by the NCDOT and Gaston County under North Carolina General Statute 136-63, an encroachment permit for an at-grade rail crossing issued by the NCDOT, various driveway permits issued by the NCDOT, a Gaston County Watershed Permit approved by the Gaston County Planning Department, various building permits approved by the Gaston County Planning Department, explosives permits approved by the U.S. Bureau of Alcohol, Tobacco, and Firearms, and hazardous chemical permits issued by Gaston County Fire Officials.
Tennessee Lithium
In July 2023, the TDEC issued a Conditional Major Non-Title V Construction and Operating Air Permit for Tennessee Lithium. As a result, we have now obtained all material permits required to begin construction. Prior to operation, additional permits for our Tennessee Lithium project will be required, including, but not limited to, a municipal wastewater permit by Etowah Utilities, various driveway permits issued by McMinn County, and waste disposal permits. The building permit process will include design reviews by the McMinn County Economic Development Authority.
In October 2023, we purchased a 132 acre disposal facility adjacent to the proposed Tennessee Lithium plant site for the placement of inert tailings produced as part of the innovative alkaline pressure leach process. We currently hold a Solid Waste Disposal Permit for this disposal facility.
U.S. Federal Legal Framework
Carolina Lithium and Tennessee Lithium will be required to comply with applicable environmental protection laws and regulations and licensing and permitting requirements. The material environmental, health, and safety laws and regulations that we must comply with include, among others, the following U.S. federal laws and regulations:
•NEPA, which requires careful evaluation of the environmental impacts of mining and lithium manufacturing operations that require federal approvals;
•Clean Air Act and its amendments, which governs air emissions;
•CWA, which governs discharges to and excavations within the waters of the U.S.;
•RCRA, which governs the management of solid waste;
•CERCLA, which imposes liability where hazardous substances have been released into the environment (commonly known as Superfund); and
•Federal Mine Safety and Health Act, which established the primary safety and health standards regarding working conditions of employees engaged in mining, related operations, and preparation and milling of the minerals extracted, as well as the Occupation Safety and Health Act, which regulates the protection of the health and safety of workers in lithium manufacturing operations.
Our operations will also be subject to state environmental laws and regulations, including, but not limited to, laws and regulations related to the reclamation of mined lands, which may require reclamation bonds to be acquired prior to the commencement of mining operations and may require substantial financial guarantees to cover the cost of future reclamation activities.
Solid and Hazardous Waste
RCRA, and comparable state statutes, affect our operations by imposing regulations on the generation, transportation, treatment, storage, disposal, and cleanup of hazardous wastes and on the disposal of non-hazardous wastes. Under the auspices of the EPA, individual states administer some or all of the provisions of RCRA, sometimes in conjunction with their own, more stringent requirements.
In addition, CERCLA can impose joint and several liability without regard to fault or legality of conduct on classes of persons who are statutorily responsible for the release of a hazardous substance into the environment. These persons can include the current and former owners, lessees, or operators of a site where a release occurs, and anyone who disposes or arranges for the disposal of a hazardous substance. Under CERCLA, such persons may be subject to strict, joint, and several liability for the entire cost of cleaning up hazardous substances that have been released into the environment and for other costs, including response costs, alternative water supplies, damage to natural resources and for the costs of certain health studies. Moreover, it is not uncommon for neighboring landowners, workers, and other third parties to file claims for personal injury and property damage allegedly caused by hazardous substances released into the indoor or outdoor environment. Each state also has environmental cleanup laws analogous to CERCLA. Hazardous wastes may have been previously handled, disposed of, or released on or under properties currently or formerly owned or leased by us or on or under other locations to which we sent waste for disposal. These properties and any materials disposed or released on them may subject us to liability under CERCLA, RCRA, and analogous state laws. Under such laws, we could be required to remove or remediate disposed wastes or property contamination, contribute to remediation costs, and perform remedial activities to prevent future environmental harm.
Air Emissions
The federal Clean Air Act and comparable state laws restrict the emission of air pollutants from numerous sources through the issuance of permits and the imposition of other requirements. Major sources of air pollutants are subject to more stringent, federally imposed permitting requirements. Air pollution regulations may require us to obtain pre-approval for the construction or modification of certain projects or facilities expected to produce or significantly increase air emissions, obtain air permits, and comply with stringent permit requirements or utilize specific equipment or technologies to control emissions of certain pollutants. The need to obtain permits has the potential to delay our operations, and we may be required to incur capital expenditures for air pollution control equipment or other air emissions related obligations. Administrative enforcement actions for failure to strictly comply with air pollution regulations or permits are generally resolved by payment of monetary fines and correction of any identified deficiencies. Alternatively, regulatory agencies could require us to forego construction, modification, or operation of certain air emission sources.
Clean Water Act
The CWA imposes restrictions and strict controls regarding the pollution of protected waters, including mineral processing wastes, into waters of the U.S., a term broadly defined to include, among other things, certain wetlands. Permits must be obtained to discharge pollutants into federal waters. The CWA provides for civil, criminal, and administrative penalties for unauthorized discharges, both routine and accidental, of pollutants. It imposes substantial potential liability for the costs of removal or remediation associated with discharges of oil or hazardous substances. State laws governing discharges to water also provide varying civil, criminal, and administrative penalties, and impose liabilities in the case of a discharge of petroleum or its derivatives, or other hazardous substances, into state waters. In addition, the EPA has promulgated regulations that require permits to discharge storm water runoff, including discharges associated with construction activities. In the event of an unauthorized discharge of waste, we may be liable for penalties and costs.
Pursuant to these laws and regulations, we may also be required to develop and implement spill prevention, control, and countermeasure plans in connection with on-site storage of significant quantities of oil. Some states also maintain groundwater protection programs that require permits for discharges or operations that may impact groundwater conditions. The CWA also prohibits the discharge of fill materials to regulated waters, including wetlands, without a permit from the U.S. Army Corps of Engineers.
In May 2015, the EPA issued a final rule that attempted to clarify the federal jurisdictional reach over waters of the U.S. The EPA repealed this rule in September 2019 and replaced it in April 2020 with the Navigable Water Protection Rule, which narrowed federal jurisdictional reach relative to the 2015 rule. The repeal and replacement of the 2015 rule is currently subject to litigation, and the scope of the jurisdictional reach of the CWA may, therefore, remain uncertain for several years, with a patchwork of legal guidelines applicable to various states potentially developing. We could incur increased costs and delays with respect to obtaining permits for dredge and fill activities in wetland areas to the extent they are required.
NEPA
NEPA requires federal agencies to evaluate major agency actions having the potential to significantly impact the environment. The NEPA process involves public input through comments, which can alter the nature of a proposed project either by limiting the scope of the project or requiring resource-specific mitigation. NEPA decisions can be appealed through the court system by process participants. This process may result in delaying the permitting and development of projects or increase the costs of permitting and developing some facilities.
Endangered Species Act
The federal Endangered Species Act restricts activities that may affect endangered and threatened species or their habitats. Some of our operations may be located in areas that are designated as habitats for endangered or threatened species. A critical habitat designation could result in further material restrictions to federal and private land use and could delay or prohibit land access or development. The U.S. Fish and Wildlife Service continues its effort to make listing decisions and critical habitat designations where necessary. To date, the Endangered Species Act has not had a significant impact on our operations. However, the designation of previously unprotected species as being endangered or threatened could cause us to incur additional costs or become subject to operating restrictions in areas where the species are known to exist.
Foreign Legal Framework
Our projects with Sayona Mining, Atlantic Lithium, and Vinland Lithium are required to comply with all environmental laws and regulations in Quebec, Canada, Ghana, West Africa, and Newfoundland, Canada, respectively.
U.S. Foreign Corrupt Practices Act
The U.S. Foreign Corrupt Practices Act generally prohibits U.S. companies and their intermediaries from making corrupt payments to foreign officials for the purpose of obtaining or keeping business or otherwise obtaining favorable treatment and requires companies to maintain appropriate record-keeping and internal accounting practices to accurately reflect the transactions of the company. The FCPA applies to companies, individual directors, officers, employees and agents. Under the FCPA, U.S. companies may be held liable for actions taken by agents or local partners or representatives. If we or our intermediaries fail to comply with the requirements of the FCPA or the anti-corruption laws of other countries, governmental authorities in the U.S. or other countries could seek to impose civil and criminal penalties, which could have a material adverse effect on our business.
Human Capital Management
Our employees are driven by our core values:
•Teamwork. We work collaboratively in a transparent manner with all stakeholders.
•Optimism. We believe in a better future and see opportunities to improve our communities and the world.
•Pride. We are proud of our people, our mission, our commitment to safety, environment, health, and the delivery of our products, and our support of the clean energy economy.
•Innovation. We continuously look for creative ways to improve our business and the solutions we offer customers.
•Care. We understand the inherent worth and dignity of all people and care deeply about our team members, our neighbors, and our impact on the environment.
By living our core values every day, we are working to create a culture of excellence that inspires our employees to achieve their full potential and drive the success of our organization.
Employees
As of December 31, 2023, we had 63 employees, all of which were located in the U.S. with the exception of two, who were located in Canada. None of our employees are subject to any union or collective bargaining agreement. We believe that we have a good relationship with our employees.
Contractors
We rely on specialized skills and knowledge to be able to gather, interpret and process geological and geophysical data; successfully permit, design, build, and operate production facilities; and engage in additional activities required as part of the mine-to-lithium hydroxide process. We have employed, and expect to continue to employ, a strategy of contracting consultants and other service providers who have specialized skills and knowledge to supplement the skills and knowledge of our permanent workforce to undertake our lithium operations effectively.
Safety, Environment, and Health
SEH is a cornerstone of Piedmont Lithium. Our commitment to the health and welfare of every person involved in our projects is built into every aspect of our organization and is engrained in our company’s culture. We endeavor to implement safety programs and develop risk management processes covering our project activities to promote a behavior-based safety culture, ensure compliance with applicable environmental regulations and international standards, and raise environmental awareness among our employees and partners. Our SEH vision is to conduct operations with safety and the environment as a top priority. We work to promote the “Piedmont Promise,” which recognizes our obligation to our employees, neighbors, stakeholders, and the communities in which we live, work, and play.
Diversity, Equity, and Inclusion
Diversity, equity, and inclusion are embedded in our values and integrated into our strategies. Our Business Code of Conduct and Ethics commits us to fair treatment and non-discrimination. Our policy is to treat each employee and job applicant without regard to race, color, age, sex, religion, national origin, citizenship, sexual orientation, gender identity, ancestry, veteran status, or any other category protected by law. We believe in allocating resources and establishing, in an equitable manner, policies and procedures that are fair, impartial, and just. We believe that we will become better and achieve growth by intentionally creating a culture through acquiring and retaining a diverse workforce. We recognize it takes unique gifts, talents, varied perspectives, backgrounds, and experiences to deliver innovative, high-quality products and services. To provide a diverse and inclusive workplace, we focus our efforts on creating a culture where all employees can contribute their skills and talents and be themselves. In furtherance of that mission, we adopted a DEI policy in 2023 to establish clear guidelines and expectations for promoting diversity, equity, and inclusion within our organization.
Compensation and Benefits
Our compensation and benefits program is designed to attract and retain talented employees in the industry by offering competitive compensation and benefits. We use a combination of fixed and variable compensation, which includes base salary, incentive bonuses with pay for performance elements, and merit increases. As part of our long-term incentive plan for executive management and certain key employees, we provide long-term equity awards tied to the value of our stock price, some of which are performance based and time based. Additionally, all employees are eligible for an annual discretionary cash bonus and a long-term equity grant. We are focused on the health and wellness of our employees. As such, we offer eligible employees comprehensive medical plans, dental and vision coverage, short-term and long-term disability insurance, term life insurance, flexible work schedules, an employee assistance program, remote and hybrid work options, paid time off, new parent leave, and a 401(k) plan with employer-matching contributions.
Commitment to Values and Ethics
In connection with our core values, we act in accordance with our Code of Business Conduct and Ethics, which requires a commitment from employees, officers, and directors of Piedmont Lithium to conduct business honestly and ethically. This code discusses the responsibility that team members have to each other, the Company, stakeholders, our customers, and communities in which we operate. We have an anonymous hotline for employees to call in the event of ethical concerns or suspected instances of misconduct.
Protecting the Rights of Workers
We are an Equal Opportunity Employer committed to providing our employees with a safe, non-discriminatory work environment that promotes open and honest communication and embraces dignity, respect, and diversity in all aspects of its business operations. We expect our partners, suppliers, and contractors to uphold these same commitments. We maintain policies designed to support the elimination of all forms of forced labor including prison labor, forcibly indentured labor, bonded labor, slavery, and servitude. We condemn all forms of child exploitation. We do not recruit child labor, and we support the standard covering the prohibition on child labor in accordance with the International Labor Organization Minimum Age Convention. We support laws enacted to prevent and punish the crime of sexual exploitation of children, and we will cooperate fully with law enforcement authorities in these matters.
We will work with our partners at Atlantic Lithium, Sayona Mining, and Vinland Lithium to ensure appropriate policies are in place within the businesses and projects in which we have invested.
Anti-Human Trafficking
We are committed to a work environment that is free from human trafficking and slavery, which includes forced labor and unlawful child labor. We will not tolerate or condone human trafficking or slavery in any part of our global organization.
Human Rights and Relationships with Indigenous People
We are committed to respecting human rights and providing a positive contribution in the communities where we operate and plan to operate. We expect our partners, suppliers, and contractors to uphold the same commitment. We respect the cultures, customs, and values of people in the communities where we operate and plan to operate and take into account their needs, concerns, and aspirations.
Equal Opportunity and Zero Discrimination
We recognize, respect, and embrace the cultural differences found in the worldwide marketplace. Our goal is to attract, develop, promote, and retain the best people from all cultures and segments of the population, based on ability. We maintain a policy of zero tolerance for discrimination or harassment of any kind. We have implemented policies regarding the reporting and investigation of discrimination, harassment, sexual harassment, retaliation, and abusive behavior and provide our employees training to foster full compliance with our policies.
Community Involvement
We are committed to making a measurable impact in the communities in which we operate and have project investments through our charitable giving. In December 2021, we created Piedmont Lithium Foundation – Power for Life, Inc., to provide scholarships to science, technology, engineering and mathematics students and financial support to our schools and communities.
We have devoted tremendous time and effort to engaging community stakeholders regarding Carolina Lithium and have begun similar engagement with stakeholders surrounding Tennessee Lithium.
Through in-person meetings, phone calls, social media, and information shared with the media via press releases and interviews, we work to keep the community residents and local businesses informed of our plans and activities. Our goal is to develop relationships with residents near the sites of Carolina Lithium and Tennessee Lithium and communicate our commitment to responsibly developing two of the world’s most sustainable lithium hydroxide operations. Further, we are committed to working with our investment partners, Sayona Mining, Atlantic Lithium, and Vinland Lithium, all of whom have several mechanisms in place for engaging with local communities regarding their projects, including addressing concerns and sharing information about employment opportunities.
Sustainability
We are committed to contributing to the transition to a net zero carbon world and the creation of a clean energy economy in North America through the products we sell and the way we produce products, operate our business, and work with our customers, vendors, and stakeholders. We are evaluating our emission profiles in a pre-operational state while establishing systems and tools to allow us to manage data easily and efficiently as we continue to grow.
We released our inaugural sustainability report in June 2023, affirming our commitment to being a responsible, respectful steward of the planet, people, and the communities where we plan to operate our wholly-owned projects, Carolina Lithium and Tennessee Lithium. A copy of our sustainability report can be found under the “Sustainability” tab of our website: www.piedmontlithium.com. The information on our website, including, without limitation, the information in our inaugural sustainability report, should not be deemed incorporated by reference into this Annual Report on Form 10-K or otherwise “filed” for purposes of Section 18 of the Exchange Act, as amended, or otherwise subject to the liabilities of that section.
Governance
Audit Committee
The primary responsibilities of our Audit Committee are to monitor the integrity of our consolidated financial statements, the independence and qualifications of our independent auditors, the performance of our accounting staff and independent auditors, our compliance with legal and regulatory requirements, supervising our cybersecurity policies, and the effectiveness of our internal controls. The Audit Committee is responsible for selecting, retaining (subject to stockholder approval), evaluating, setting the compensation of, and if appropriate, recommending the termination of our independent auditors.
Leadership and Compensation Committee
The primary purpose of our Leadership and Compensation Committee is to assist our Board in discharging its responsibilities related to the compensation of the Company’s executive officers and directors and overseeing the Company’s overall compensation philosophy, policies, and programs.
Nominating and Corporate Governance Committee
The primary purpose of our Nominating and Corporate Governance Committee is to identify individuals qualified to become members of the Company’s Board, make recommendations on candidates for election at the annual meeting of stockholders, and perform a leadership role in shaping the Company’s corporate governance, including the implementation of our ESG principles. The Nominating and Corporate Governance Committee is responsible for preparing the report required by the SEC for the Company’s annual proxy statement.
Corporate Information
Our principal executive offices are located at 42 E Catawba Street, Belmont, NC, 28012, and our telephone number is (704) 461-8000. We file electronically with the SEC our annual reports on Form 10-K and any amendments thereto, quarterly reports on Form 10-Q, current reports on Form 8-K, proxy statements and amendments to those reports filed or furnished pursuant to Section 13(a) or 15(d) of the Exchange Act. We make available on our website at www.piedmontlithium.com, under “Investors,” free of charge, copies of these reports as soon as reasonably practicable after filing or furnishing these reports to the SEC.
CAUTIONARY NOTE REGARDING FORWARD-LOOKING STATEMENTS
Our Annual Report contains forward-looking statements that involve risks and uncertainties and includes statistical data, market data and other industry data and forecasts, which we obtained from market research, publicly available information and independent industry publications and reports that we believe to be reliable sources.
Certain information included or incorporated by reference in our Annual Report may be deemed to be “forward-looking statements” within the meaning of applicable securities laws. Such forward-looking statements concern our anticipated results and progress of our operations in future periods, planned exploration and development of our properties, and plans related to our business and other matters that may occur in the future. These statements relate to analyses and other information that are based on forecasts of future results, estimates of amounts not yet determinable, and assumptions of management. All statements contained herein that are not clearly historical in nature are forward-looking, and the words “anticipate,” “believe,” “expect,” “estimate,” “may,” “might,” “will,” “could,” “can,” “shall,” “should,” “would,” “leading,” “objective,” “intend,” “contemplate,” “design,” “predict,” “potential,” “plan,” “target” and similar expressions are generally intended to identify forward-looking statements. Forward-looking statements are subject to a variety of known and unknown risks, uncertainties and other factors which could cause actual events or results to differ from those expressed or implied by the forward-looking statements. Forward-looking statements in our Annual Report include, but are not limited to, statements with respect to risks related to:
•our limited operating history in the lithium industry;
•our status as a development stage issuer, including our ability to identify lithium mineralization and achieve commercial lithium production;
•our reliance on the management teams of our equity method investments;
•mining, exploration and mine construction, if warranted, on our properties, including timing and uncertainties related to acquiring and maintaining mining, exploration, environmental and other licenses, permits, zoning, rezoning, access rights or approvals in Gaston County, North Carolina (including the Carolina Lithium project, as defined above), McMinn County, Tennessee (including the Tennessee Lithium project, as defined above), the Provinces of Quebec and Newfoundland and Labrador, Canada and Ghana, West Africa as well as properties that we may acquire or obtain an equity interest in the future;
•our ability to achieve and maintain profitability and to develop positive cash flows from our mining and processing activities;
•our exposure to cybersecurity threats and attacks;
•our estimates of mineral resources and whether mineral resources will ever be developed into mineral reserves;
•investment risk and operational costs associated with our exploration and development activities;
•our ability to develop and achieve production on our properties;
•our ability to enter into and deliver products under offtake agreements;
•the pace of adoption and cost of developing electric transportation and storage technologies dependent upon lithium batteries;
•our ability to access capital and the financial markets;
•recruiting, training, developing, and retaining employees, including our senior management team;
•possible defects in title of our properties;
•compliance with government regulations;
•environmental liabilities and reclamation costs;
•our operations being further disrupted and our financial results being adversely affected by public health threats, including the novel COVID-19 pandemic;
•estimates of and volatility in lithium prices or demand for lithium;
•our common stock price and trading volume volatility; and
•our failure to successfully execute our growth strategy, including any delays in our planned future growth.
All forward-looking statements reflect our beliefs and assumptions based on information available at the time the assumption was made. These forward-looking statements are not based on historical facts but rather on management’s expectations regarding future activities, results of operations, performance, future capital and other expenditures, including the amount, nature and sources of funding thereof, competitive advantages, business prospects, and opportunities. By its nature, forward-looking information involves numerous assumptions, inherent risks and uncertainties, both general and specific, known and unknown, that contribute to the possibility that the predictions, forecasts, projections, or other forward-looking statements will not occur. Although we have attempted to identify important factors that could cause actual results to differ materially from those described in forward-looking statements, there may be other factors that cause results not to be as anticipated, estimated, or intended. Should one or more of these risks or uncertainties materialize, or should underlying assumptions prove incorrect, actual results may vary materially from those anticipated, believed, estimated, or expected. We caution readers not to place undue reliance on any such forward-looking statements, which speak only as of the date made. Except as otherwise required by the securities laws of the U.S., we disclaim any obligation to subsequently revise any forward-looking statements to reflect events or circumstances after the date of such statements or to reflect the occurrence of anticipated or unanticipated events. We qualify all the forward-looking statements contained in our Annual Report by the foregoing cautionary statements.
CAUTIONARY NOTE REGARDING DISCLOSURE OF MINERAL PROPERTIES
We are subject to the periodic reporting requirements of both U.S. and Australian securities laws with respect to mining matters. In the U.S., we are governed by the Exchange Act, including S-K 1300 thereunder. In Australia, we are governed by the JORC Code. Both sets of reporting standards have similar goals in terms of conveying an appropriate level of confidence in the disclosures being reported but may at times embody different approaches or definitions.
On October 21, 2021, we announced an inaugural mineral resources estimate for our Carolina Lithium project. On December 14, 2021, we announced the completion of a DFS for our Carolina Lithium project, which included an initial estimation of mineral reserves. These estimates of mineral resources and mineral reserves are compatible with both S-K 1300 and JORC Code. A technical report summary with respect to our estimated mineral reserves was filed as an exhibit to our Transition Report on Form 10-KT for the period ending December 31, 2021. This technical report summary was amended to include certain information as required by S-K 1300. The amended technical report summary dated April 20, 2023, is included as Exhibit 96.1 and incorporated by reference to Exhibit 96.3 to our Annual Report on Form 10-K/A for the year ended December 31, 2022. Additionally, S-K 1300-compliant technical report summaries with respect to our estimated mineral resources and mineral reserves at Ewoyaa, NAL, and Authier are attached as Exhibits 96.2, 96.3, and 96.4, respectively, of this Annual Report.
Item 1A. RISK FACTORS.
You should carefully consider the risks, as described below, together with all the other information in our Annual Report. If any of the following risks occur, our business, financial condition, and results of operations could be seriously harmed, and you could lose all or part of your investment. Further, if we fail to meet the expectations of the public market in any given period, the market price of our common stock could decline. We operate in a competitive environment that involves significant risks and uncertainties, some of which are outside of our control. If any of these risks actually occurs, our business and financial condition could suffer, and the price of our stock could decline. We caution you that the risks, uncertainties and other factors referred to below and elsewhere in our Annual Report may not contain all the risks, uncertainties, and other factors that may affect our future results and operations. Our future results and operations could also be affected by factors, events, or uncertainties that are not presently known to us or that we currently do not consider to present a material risk. It is not possible for our management to predict all risks.
Business Risks
Our future performance is difficult to evaluate because we have a limited operating history in the lithium industry.
We began to implement our current business strategy in the lithium industry in 2016. Until the third quarter of 2023, we had yet to realize any revenues from the sale of lithium, and our operating cash flow needs have been financed primarily through issuances of common stock and not through cash flows derived from our operations. As a result, we have limited historical financial and operating information available to help you evaluate our performance.
There is no guarantee that our development will result in the commercial extraction of mineral deposits.
We are engaged in the business of exploring and developing mineral properties with the intention of locating economic deposits of minerals. We have declared mineral reserves on our development stage properties; however, we have yet to begin commercial extraction of minerals on these properties. Accordingly, we cannot assure you that we will realize profits in the medium to long term. Further, we cannot assure you that any of our property interests can be commercially mined or that our ongoing exploration programs will result in profitable commercial mining operations. The exploration and development of mineral deposits involve a high degree of financial risk over a significant period of time, which may or may not be reduced or eliminated through a combination of careful evaluation, experience, and skilled management. While discovery of additional ore-bearing deposits may result in substantial rewards, few properties that are explored are ultimately developed into producing mines. Major expenses may be required to construct mining and processing facilities and to establish additional reserves. The profitability of our operations will be, in part, directly related to the cost and success of our exploration and development programs, which may be affected by a number of factors. Additional expenditures are required to construct, complete, and install mining and processing facilities in those properties that are actually mined and developed.
Our exploration and development projects have no operating history upon which to base estimates of future operating costs and capital requirements. Exploration project items, such as any future estimates of reserves, metal recoveries, or cash operating costs will, to a large extent, be based upon the interpretation of geologic data, obtained from a limited number of drill holes and other sampling techniques as well as future feasibility studies. Actual operating costs and economic returns of any and all exploration projects may materially differ from the costs and returns estimated, and accordingly, our financial condition, results of operations, and cash flows may be negatively affected.
We do not control our equity method investments.
We apply the equity method of accounting to investments when we have the ability to exercise significant influence over the operational decision-making authority and financial policies of the investee but we do not exercise control. Our equity method investees are governed by their own board of directors, whose members have fiduciary duties to the investees’ shareholders. While we have certain rights to appoint representatives to the investees’ boards of directors, the interests of the investees’ shareholders may not align with our interests or the interests of our shareholders and strategic and contractual disputes may arise.
We are generally dependent on the management team of our investees to operate and control such projects or businesses. While we may exert influence pursuant to our positions, as applicable, on the boards of directors and through certain limited governance or oversight roles, such influence may be limited. The management teams of our investees may not have the level of experience, technical expertise, human resources, management, and other attributes necessary to operate their projects or businesses optimally, and they may not share our business priorities, including, but not limited to, those priorities that relate to desired production levels.
This could have a material adverse effect on the value of such investments as well as our growth, business, financial condition, results of operations, and prospects.
Some of our current or future properties may not contain any reserves, and any funds spent on exploration and evaluation may be lost.
We are a development stage mining company. We cannot assure you that our exploration programs will identify economically extractable mineralization, nor can we assure you about the quantity or grade of any mineralization we seek to extract. Our exploration prospects may not contain any reserves and any funds spent on evaluation and exploration may be lost. Even for the mineral reserves we have reported for our properties, any quantity or grade of reserves we indicate must be considered as estimates only until such reserves are actually mined. We do not know with certainty that economically recoverable lithium exists on our properties. In addition, the quantity of any reserves may vary depending on commodity prices. Any material change in the quantity or grade of reserves may affect the economic viability of our properties.
We face risks related to mining, exploration, mine construction, and plant construction, if warranted, on our properties.
Our level of profitability, if any, in future years will depend to a great degree on lithium prices and whether our exploration-stage properties can be brought into production. Exploration and development of lithium resources are highly speculative in nature, and it is impossible to ensure that current and future exploration programs and/or feasibility studies on our existing properties will establish reserves. Whether it will be economically feasible to extract lithium depends on a number of factors, including, but not limited to: the particular attributes of the deposit such as size, grade, and proximity to infrastructure; lithium prices; mining, processing and transportation costs; the willingness of lenders and investors to provide project financing; labor costs and possible labor strikes; and governmental regulations, including, without limitation, regulations related to prices, taxes, royalties, land tenure, land use, importing and exporting materials, foreign exchange, environmental protection, employment, worker safety, transportation, and reclamation and closure obligations. We could be adversely affected by a failure to complete our plant construction projects on time or on budget, and a substantial delay in the progress of construction due to adverse weather, work stoppages, shortages of materials, non-issuances of permits, nonperformance of suppliers or contractors, or other factors could result in a material increase in the overall cost of such projects. The exact effect of these factors cannot be accurately predicted, but the combination of these factors may result in us receiving an inadequate return on invested capital. In addition, we are subject to the risks normally encountered in the mining industry, such as:
•the discovery of unusual or unexpected geological formations;
•accidental fires, floods, earthquakes, severe weather, or other natural disasters;
•unplanned power outages and water shortages;
•construction delays and higher than expected capital costs due to, among other things, supply chain disruptions, higher transportation costs, and inflation;
•controlling water and other similar mining hazards;
•explosions and mechanical failure of equipment;
•operating labor disruptions and labor disputes;
•shortages in materials or equipment and energy and electrical power supply interruptions or rationing;
•seismic activity;
•the ability to obtain suitable or adequate machinery, equipment, or labor;
•our liability for pollution or other hazards; and
•other unknown risks involved in the conduct of exploration and operation of mines.
The nature of these risks is such that liabilities could exceed any applicable insurance policy limits or could be excluded from coverage. There are also risks against which we cannot insure or we may elect not to insure. The potential costs, which could be associated with any liabilities not covered by insurance or in excess of insurance coverage, or compliance with applicable laws and regulations may cause substantial delays and require significant capital outlays, adversely affecting our future earnings, competitive position, and potentially our financial viability.
Our long-term success will depend ultimately on our ability to generate revenues, achieve and maintain profitability, and develop positive cash flows from our mining activities.
Our ability to recover carrying values of our assets, acquire additional lithium projects, continue with exploration, development, commissioning, and mining, and manufacture lithium hydroxide, ultimately depends on our ability to generate revenues, achieve and maintain profitability, and generate positive cash flow from our operations. The economic viability of our future mining activities has many risks and uncertainties including, but not limited to;
•a significant, prolonged decrease in the market price of lithium or lithium hydroxide;
•difficulty in marketing and/or selling lithium or lithium hydroxide;
•significantly higher than expected capital costs to construct our mine or production facilities;
•significantly higher than expected extraction costs;
•significantly lower than expected lithium extraction;
•significant delays, reductions, or stoppages of lithium extraction activities;
•shortages of adequate and skilled labor or a significant increase in labor costs;
•the introduction of significantly more stringent regulatory laws and regulations; and
•delays in the availability of construction equipment.
We are concurrently overseeing the advancement of several major lithium projects, including Carolina Lithium, which is in the development planning stage, and Tennessee Lithium, which completed all FEED activities in 2023. Work to advance these projects requires the dedication of considerable time and resources by us and our management team. The advancement of several major resource projects concurrently brings with it the associated risk of strains on managerial, human, and other resources. Our ability to successfully manage each of these processes will depend on a number of factors, including, but not limited to, our ability to manage competing demands on time and other resources, financial or otherwise, and successfully retain personnel and recruit new personnel to support our growth and the advancement of our projects.
Our plan is to produce battery-grade lithium hydroxide from spodumene concentrate at Carolina Lithium and Tennessee Lithium using the innovative Metso:Outotec Pressure Leach Technology as well as a number of processes commonly used in the lithium industry today. We may encounter difficulties or unforeseen expenditures in integrating new, unproven technologies.
It is common for a new mining operation to experience unexpected costs, problems, and delays during construction, commissioning, and mine start-up. Most mining projects suffer delays during these periods due to numerous factors, including the factors listed above. Any of these factors could result in changes to economic returns or cash flow estimates of the project or have other negative impacts on our financial position. There is no assurance that our projects will commence commercial production on schedule, or at all, or will result in profitable mining operations. If we are unable to develop our projects into a commercial operating mine, our business and financial condition will be materially adversely affected. Moreover, even if the feasibility study continues to support a commercially viable project, there are many additional factors that could impact the project’s development, including terms and availability of financing, cost overruns, litigation or administrative appeals concerning the project, delays in development, and any permitting changes, among other factors.
Our future mining and lithium manufacturing activities may change as a result of any one or more of these risks and uncertainties. We cannot assure you that any ore body from which we extract mineralized materials will result in achieving and maintaining profitability and developing positive cash flows.
Our business is subject to cybersecurity risks.
Our operations depend on effective and secure information technology systems. Threats to information technology systems, such as cyberattacks and cyber incidents, continue to increase. Cybersecurity risks include, but are not limited to, malicious software, attempts to gain unauthorized access to our data and the unauthorized release, corruption or loss of our data and personal information, as well as interruptions in communication and operations.
It is possible that our business, financial, and other systems could be compromised, which could go unnoticed for a prolonged period of time. We have not experienced a material breach of our information technologies. Nevertheless, we continue to take steps to mitigate these risks by employing a variety of measures, including employee training, technical security controls, and maintenance of backup and protective systems.
Despite these mitigation efforts, cybersecurity attacks and other threats exist and continue to increase, any of which could have a material adverse effect on our business, results of operations, financial condition, and cash flows.
Our long-term success depends on our ability to enter into and deliver product under offtake agreements.
We may encounter difficulty entering and fulfilling offtake agreements for our products. We may fail to deliver the product required by such agreements or may experience production costs in excess of the price to be paid to us under such agreements. Failure to meet these specifications could result in price adjustments, the rejection of deliveries, or termination of the contracts. Our supply agreements contain force majeure provisions allowing temporary suspension of performance by us or the customer during specified events beyond the control of the affected party. As a result of these issues, we may not achieve the revenue or profit we expect to achieve from our offtake agreements. As of the date of this filing, we have entered into two offtake agreements for our lithium products.
On January 2, 2023, we entered into an amended offtake agreement with Tesla, Inc. to provide spodumene concentrate from NAL in Quebec. The agreement commits us to sell 125,000 dmt of spodumene concentrate from our offtake agreement with Sayona Quebec. The term of the agreement is three years, from January of 2023 until the end of 2025, and pricing is determined by a market-based mechanism. The three-year term can be extended for an additional three years upon mutual agreement.
On February 16, 2023, we entered into a spodumene concentrate offtake agreement with LG Chem, which commits us to sell 200,000 dmt of spodumene concentrate from our offtake agreement with Sayona Quebec. The term of the agreement is four years, beginning in the third quarter of 2023 until the third quarter of 2027 or until we have delivered 200,000 dmt of spodumene concentrate. Pricing is determined by a market-based mechanism.
Our business, results of operations, and financial condition may be materially and adversely affected if we are unable to enter into similar agreements with other buyers, deliver the products required by such agreements, or incur costs in excess of the price set forth in such agreements.
We depend on our ability to successfully access the capital and financial markets. Any inability to access the capital or financial markets may limit our ability to meet our liquidity needs and long-term commitments, fund our ongoing operations, execute our business plan or pursue investments that we may rely on for future growth.
We may continue to incur operating and investing net cash outflows associated with, but not limited to, maintaining and acquiring exploration properties, undertaking ongoing exploration activities, the development of our planned Carolina Lithium and Tennessee Lithium projects, and our funding obligations to develop the assets of our joint ventures with Sayona Mining, including NAL, and Atlantic Lithium’s Ewoyaa project. As a result, we rely on access to capital markets as a source of funding for our capital and operating requirements. We will require additional capital to meet our liquidity needs related to expenses for our various corporate activities, including costs related to our status as a publicly traded company, funding of our ongoing operations, exploring and defining lithium mineralization, and establishing any future mining or lithium manufacturing operations. We cannot assure you that such additional funding will be available to us on satisfactory terms, or at all.
To finance our future ongoing operations and future capital needs, we may require additional funds through the issuance of additional equity or debt securities. Depending on the type and terms of any financing we pursue, stockholders’ rights and the value of their investment in our common stock could be reduced. Any additional equity financing will dilute shareholdings. If the issuance of new securities results in diminished rights to holders of our common stock, the market price of our common stock could be negatively impacted. New or additional debt financing, if available, may involve restrictions on financing and operating activities. In addition, if we issue secured debt securities, the holders of the debt would have a claim to our assets that would be prior to the rights of stockholders until the debt is paid. Interest on such debt securities would increase costs and negatively impact operating results.
We have a shelf registration statement on file with the SEC to provide us with capacity to publicly offer common stock, preferred stock, warrants, debt, convertible or exchangeable securities, depositary shares, or units, or any combination thereof. We may, from time to time, raise capital under our shelf registration statement in amounts, at prices, and on terms to be announced when and if any securities are offered. As of December 31, 2023, we had $369.2 million remaining under our shelf registration statement, which expires on September 24, 2024.
If we are unable to obtain additional financing, as needed, at competitive rates, our ability to fund our current operations and implement our business plan and strategy will be affected. These circumstances may require us to reduce the scope of our operations and scale back our exploration, development and mining programs. There is, however, no guarantee that we will be able to secure any additional funding or be able to secure funding to provide us with sufficient funds to meet our objectives, which may adversely affect our business and financial position.
Certain market disruptions may increase our cost of borrowing or affect our ability to access one or more financial markets. Such market disruptions could result from, but are not limited to:
•adverse economic conditions;
•adverse general capital market conditions;
•poor performance and health of the lithium or mining industries in general;
•bankruptcy or financial distress of unrelated lithium companies or marketers;
•significant decrease in the demand for lithium products;
•significant decrease in the price of lithium products; or
•adverse regulatory actions that affect our exploration and construction plans or the use of lithium generally.
Our ability to manage growth will have an impact on our business, financial condition, and results of operations.
Future growth may place strains on our financial, technical, operational, and administrative resources and cause us to rely more on project partners and independent contractors, thus, potentially adversely affecting our financial position and results of operations. Our ability to grow will depend on a number of factors, including, but not limited to:
•our ability to purchase, obtain leases on, or obtain options on properties;
•our ability to identify and acquire new exploratory prospects;
•our ability to develop existing prospects;
•our ability to continue to retain and attract skilled personnel;
•our ability to maintain or enter into new relationships with project partners and independent contractors;
•the results of our exploration programs;
•the market price for lithium products;
•our ability to successfully complete construction projects on schedule, and within budget;
•our access to capital; and
•our ability to enter into agreements for the sale of lithium products.
We may not be successful in upgrading our technical, operational, and administrative resources or increasing our internal resources sufficiently to provide certain services currently provided by third parties. Our inability to achieve or manage growth may materially and adversely affect our business, results of operations, and financial condition.
We may acquire additional businesses or assets, form joint ventures, or make investments in other companies that may be unsuccessful and harm our operating results and prospects.
As part of our business strategy, we may pursue additional acquisitions of complementary businesses or assets or seek to enter into joint ventures. We may pursue strategic alliances, such as our Sayona Mining, Atlantic Lithium, and Vinland Lithium investments, in an effort to leverage our existing operations and industry experience, increase our product offerings, expand our distribution, and make investments in other companies.
The success of any acquisitions, joint ventures, strategic alliances, or investments, including our Sayona Quebec, Atlantic Lithium, and Vinland Lithium investments, will depend on our ability to identify, negotiate, complete and, in the case of acquisitions, integrate those transactions and, if necessary, obtain satisfactory debt or equity financing to fund those transactions. We may not realize the anticipated benefits of any acquisition, joint venture, strategic alliance or investment. We may not be able to integrate acquisitions successfully into our existing business, maintain the key business relationships of businesses we acquire, or retain key personnel of an acquired business. We could assume unknown or contingent liabilities or incur unanticipated expenses. Integration of acquired companies or businesses also may require management resources that otherwise would be available for ongoing development of our existing business. Any acquisitions or investments made by us could result in significant write-offs or the incurrence of debt and contingent liabilities, any of which could harm our operating results. If we choose to issue equity as consideration for any acquisition, our stockholders may experience dilution.
We are dependent upon key management employees.
The responsibility of overseeing the day-to-day operations and the strategic management of our business depends substantially on our senior management and key personnel. Loss of any such personnel may have an adverse effect on our performance. The success of our operations will depend upon numerous factors, many of which, in part, are beyond our control, including our ability to attract and retain additional key personnel in sales, marketing, technical support, and finance. Certain areas in which we operate are highly competitive and competition for qualified personnel is significant. We may be unable to hire suitable field personnel for our technical team or there may be periods of time where a particular position remains vacant while a suitable replacement is identified and appointed. We may not be successful in attracting and retaining the personnel required to grow and operate our business profitably.
Our growth will require new personnel, which we will be required to recruit, hire, train, and retain.
Members of our management team possess significant experience and have previously carried out or been exposed to exploration, development, and production activities. However, we have a limited operating history with respect to lithium projects and our ability to achieve our objectives depends on the ability of our directors, officers, and management to implement current plans and respond to any unforeseen circumstances that require changes to those plans. The execution of our exploration, development, and production plans will place demands on us and our management. Thus, our ability to recruit and assimilate new personnel will be critical to our performance. We will be required to recruit additional personnel and to train, motivate, and manage employees. Failure to meet these requirements may adversely affect our plans.
Lawsuits may be filed against us and an adverse ruling in any such lawsuit may adversely affect our business, financial condition, or liquidity or the market price of our common stock.
We may become involved in, named as a party to, or be the subject of various legal proceedings, including regulatory proceedings, tax proceedings, and legal actions related to personal injuries, property damage, property taxes, land rights, the environment, and contract disputes. For additional information, refer to Part I, Item 3, “Legal Proceedings.”
The outcome of outstanding, pending, or future proceedings cannot be predicted with certainty and may be determined adversely to us and as a result, could have a material adverse effect on our assets, liabilities, business, financial condition, or results of operations. Even if we prevail in any such legal proceeding, the proceedings could be costly, time-consuming, and may divert the attention of management and key personnel from our business operations, which could adversely affect our financial condition.
Our mineral properties may be subject to defects in title.
Title to the majority of our properties for Carolina Lithium are derived from option agreements with local landowners in North Carolina, which upon exercise, allow us to purchase, or in certain cases, long-term lease the real property and associated mineral rights from the local landowners. If we exercise the option to purchase a property, we will pay cash consideration, approximating the fair market value of the real property, excluding the value of any minerals, plus a premium based on a negotiated fixed price or percentage premium. If we exercise the option for a long-term lease, we will pay annual advanced royalty payments per acre. Some landowners also retain a production royalty payable on production of ore from the property.
The ownership and title to unpatented mining claims and concessions are often uncertain and may be contested. We may not have, or may not be able to obtain, all necessary rights to develop a property. Although we have obtained title opinions with respect to certain of our properties and have taken reasonable measures to ensure proper title to our properties, there is no guarantee that title to any of our properties will not be challenged or impugned. Title insurance is generally not available for mineral properties and our ability to ensure that we have obtained clear title to individual mineral properties or mining concessions may be severely constrained. Our mineral properties may be subject to prior unregistered agreements, transfers, or claims, and title may be affected by, among other things, undetected defects. We may incur significant costs related to defending the title to our properties. A successful claim contesting our title to a property may cause us to compensate other persons or perhaps reduce our interest in the affected property or lose our rights to explore and develop that property. This could result in our not being compensated for our prior expenditures related to the property. In any such case, the investigation and resolution of title issues would divert our management’s time from ongoing exploration and, if warranted, development programs. Any impairment or defect in title could negatively affect us.
Our directors and officers may be in a position of conflict of interest.
Some of our directors and officers currently serve as directors and officers of other companies involved in natural resource exploration, development, and production, and any of our directors and officers may serve in such positions in the future.
As of the date of this Annual Report, none of our directors or officers serves as an officer or director of a lithium exploration, development, or producing company nor possess a conflict of interests with our business, other than as follows: (i) pursuant to our agreements related to our Sayona Mining investment, Keith Phillips, our President and Chief Executive Officer, was appointed as a board member of Sayona Quebec, (ii) pursuant to our agreements related to our Atlantic Lithium investment, Patrick Brindle, our Executive Vice President and Chief Operating Officer, was appointed as a board member of Atlantic Lithium, a position he resigned from in 2024 upon Piedmont Lithium’s shareholding in Atlantic Lithium falling below the threshold required to appoint a director, and (iii) pursuant to our agreements related to our Vinland Lithium investment, Mr. Brindle was appointed as a board member of Vinland Lithium. However, there exists the possibility that they may be in a position of conflict of interest in the future. Any decision made by such persons involving us will be made in accordance with their duties and obligations to deal fairly and in good faith with us and such other companies. In addition, any such directors and officers will declare, and refrain from voting on, any matter in which such directors and officers may have a material interest.
In order to manage our growth effectively and support our future operations, we expect to improve our financial and operations systems.
To manage our growth and support our future manufacturing operations, we will periodically upgrade our operational and financial systems and procedures. This requires management time and may result in significant expense. We cannot be certain that we will institute in a timely or efficient manner, or at all, the improvements to our managerial, operational, and financial systems and procedures necessary to support our anticipated increased levels of operations. Problems associated with, or disruptions resulting from, any improvement or expansion of our operational and financial systems could adversely affect our relationships with our suppliers and customers, inhibit our ability to expand or take advantage of market opportunities, cause harm to our reputation, result in errors in our financial and other reporting, and adversely affect our ability to maintain an effective internal control environment and meet our external reporting obligations, any of which could harm our business and operating results and affect our stock price.
There is no assurance we will secure a loan from the Department of Energy’s Loan Programs Office.
We were previously selected to receive a $141.7 million grant under the Bipartisan Infrastructure Law to advance Tennessee Lithium; however, as our detailed engineering plans evolved and inflation across the capital equipment sector has grown, we decided to pivot away from the DOE grant to pursue an ATVM loan through the DOE’s Loan Programs Office. Similarly, we previously received a conditional invitation to due diligence for an ATVM loan for our Carolina Lithium project. As our Carolina Lithium project has not yet met the conditional criteria for the Loan Programs Office to start due diligence, we withdrew our application in 2023 with the intention to resubmit an application at a future date.
We are currently in the pre-application stage of the ATVM loan process for both Carolina Lithium and Tennessee Lithium. If and when we submit an application for an ATVM loan, the Loan Programs Office must make a finding that Carolina Lithium or Tennessee Lithium is both eligible and meets the viability thresholds specified under law. Thereafter, our application becomes subject to both preliminary and advanced-stage due diligence and the negotiation of preliminary terms and conditions. Should the Loan Programs Office issue a conditional commitment letter for either project, and should we satisfy all conditions precedent and requirements specified in the letter, we would become eligible to enter into a final loan agreement. Upon closing, the loan would remain subject to certain restrictive covenants and financial reporting requirements set forth in the final loan agreement. As a result, there can be no assurance that we will secure such loan from the DOE for either project within the expected timeframe, on terms that are acceptable to the Company, or at all.
The Company is dependent on a limited number of customers, which makes it vulnerable to the continued relationship with and financial health of those customers.
Three customers have accounted for 100% of our sales as of the date of this Annual Report. The Company’s future prospects may depend on the continued business of a limited number of key customers and on our continued status as a qualified supplier to such customers. The Company cannot guarantee that these key customers will continue to buy products from us at current levels. The loss of a key customer could have a material adverse effect on our business, financial condition, and results of operations.
If we are required to register as an investment company, we will be subject to a significant regulatory burden and our results of operations will suffer.
We are an operating company and believe we are not subject to regulation as an investment company under the U.S. Investment Company Act of 1940, as amended. However, if we were required to register as an investment company, our ability to use debt would be substantially reduced, and we would be subject to significant additional disclosure obligations and restrictions on our operational activities. Because of the additional requirements imposed on an investment company with regard to the distribution of earnings, operational activities and the use of debt, in addition to increased expenditures due to additional reporting responsibilities, our cash available for investments would be reduced.
The additional expenses would reduce income. These factors would adversely affect our business, financial condition, and the results of operations and cash flows.
Regulatory and Industry Risks
We will be required to obtain governmental permits and approvals in order to conduct development and mining operations, a process that is often costly and time-consuming. There is no certainty that all necessary permits and approvals for our planned operations will be granted.
We are required to obtain and renew governmental permits and approvals for our exploration and development activities, and prior to mining any mineralization we discover, we will be required to obtain additional governmental permits and approvals that we do not currently possess. Obtaining and renewing any of these governmental permits is a complex, time-consuming, and uncertain process involving numerous jurisdictions, public hearings, and possibly costly undertakings. The timeliness and success of permitting efforts are contingent upon many variables not within our control, including the interpretation of approval requirements administered by the applicable governmental authority.
We may not be able to obtain or renew permits or approvals that are necessary to our planned operations, or we may discover that the cost and time required to obtain or renew such permits and approvals exceeds our expectations. Any unexpected delays, costs or conditions associated with the governmental approval process could delay our planned exploration, development, and mining operations, which in turn could materially adversely affect our prospects, revenues, and profitability. In addition, our prospects may be adversely affected by the revocation or suspension of permits or by changes in the scope or conditions to use of any permits obtained.
For example, in addition to the permits that we have been issued to date, we are required to obtain other permits and approvals before construction or operations of Carolina Lithium, including approvals related to zoning, rezoning, mining, mineral concentration, and chemical manufacturing. Such permits include a state mining permit that would be issued by the North Carolina DEMLR, an air permit that would be issued by the Division of Air Quality and rezoning that would be approved by the Gaston County Board of Commissioners. The following permits have been submitted for Carolina Lithium: (i) Mine Permit to DEMLR on August 30, 2021, (ii) Prevention of Significant Deterioration Title V Air Permit to the Division of Air Quality on August 31, 2022, and (iii) National Pollutant Discharge Elimination System permits to the NCDEQ Division of Water Resources on December 28, 2022.
Private parties, such as environmental activist organizations, frequently attempt to intervene in the permitting process to persuade regulators to deny necessary permits or seek to overturn permits that have been issued. These third-party actions can materially increase the costs, cause delays in the permitting process, and could cause us to not proceed with the development or operation of a property. Our ability to successfully obtain key permits and approvals to explore for, develop, operate, and expand operations will likely depend on our ability to undertake such activities in a manner consistent with the creation of social and economic benefits in the surrounding communities, which may or may not be required by law. Our ability to obtain permits and approvals and to successfully operate in particular communities may be adversely affected by real or perceived detrimental events associated with our activities.
Certain members of the Gaston County Board have indicated opposition to granting the approvals necessary for Carolina Lithium. In September 2021, the Gaston County Board approved updates to the Gaston County Unified Development Ordinance, which in part, established certain operating limitations for new mines and quarries within the county and provides the parameters for requisite Conditional District zoning. While we have initiated a dialog with the Gaston County Board, we are unable to predict the duration, scope, result, or related costs or conditions associated with the Boards’ review, nor can we assure you that we will be successful in obtaining required local approvals.
Tennessee Lithium is being designed as a lithium hydroxide manufacturing facility in the City of Etowah, McMinn County, Tennessee. Similar to Carolina Lithium, we are required to obtain governmental permits and approvals prior to constructing and operating Tennessee Lithium. In July 2023, we received our Air Permit from TDEC, which was the final material permit necessary to commence construction given our previous receipt of our Construction Stormwater Permit in April 2023. In addition to the Air Permit and Construction Stormwater Permit, we will need to obtain additional permits including a municipal wastewater permit from the City of Etowah as well as permits for post construction stormwater controls.
Lithium and lithium byproduct prices are subject to unpredictable fluctuations which may greatly affect the value of our investment in our lithium assets and our ability to develop them successfully.
The prices of lithium and lithium byproducts may fluctuate widely and are affected by numerous factors beyond our control, including international, economic, and political trends, expectations of inflation, currency exchange fluctuations, interest rates, global and regional consumptive patterns, speculative activities, increased production due to new extraction developments and improved extraction and production methods and technological changes in the markets for the end products.
The effect of these factors on the prices of lithium and lithium byproducts, and therefore the economic viability of any of our exploration, development, and operational properties, cannot be accurately predicted and could have dramatic effects on the results of our operations and our ability to execute our business plan.
New production of lithium hydroxide or lithium carbonate from current or new competitors in the lithium markets could adversely affect prices. In recent years, new and existing competitors have increased the supply of lithium hydroxide and lithium carbonate, which has affected pricing. Further production increases could negatively affect prices. There is limited information on the status of new lithium hydroxide production capacity expansion projects being developed by current and potential competitors and, as such, we cannot make accurate projections regarding the capacities of possible new entrants into the market and the dates on which they could become operational. If these potential projects are completed in the short term, they could adversely affect market lithium prices, thereby resulting in a material adverse effect on the economic feasibility of extracting any mineralization we discover and reducing or eliminating any reserves we identify.
We may not be able to effectively mitigate pricing risks for our products. Depressed pricing for our products will affect the level of revenues expected to be generated by us, which, in turn, could affect our value, share price and the potential value of our assets. There can be no assurance that the price of lithium products will be such that it can be produced at a profit.
The proposed Carolina Lithium project will be subject to significant governmental regulations, including the U.S. Federal Mine Safety and Health Act.
Mining activities in the U.S. are subject to extensive foreign, federal, state, and local laws and regulations governing environmental protection, natural resources, prospecting, development, production, post-closure reclamation, taxes, labor standards, and occupational health and safety laws and regulations, including mine safety, toxic substances, and other matters. The costs associated with compliance with such laws and regulations are substantial. In addition, changes in such laws and regulations, or more restrictive interpretations of current laws and regulations by governmental authorities, could result in unanticipated capital expenditures, expenses, or restrictions on or suspensions of our operations and delays in the development of our properties.
The planned Tennessee Lithium project will be dependent upon our ability to source spodumene concentrate feedstock to be converted to lithium hydroxide at the facility.
Tennessee Lithium will be dependent upon the sourcing of spodumene concentrate to produce lithium hydroxide. We intend to provide spodumene concentrate to Tennessee Lithium from our international assets, primarily Ewoyaa in Ghana. While we do not have reason to believe that spodumene concentrate from Ewoyaa would not be available, we expect there to be options available for exploring alternative sources to feed Tennessee Lithium, if needed. However, we cannot guarantee our ability to source spodumene concentrate, and our inability to do so would negatively impact our ability to produce lithium hydroxide in Tennessee and could have an adverse effect on our business, results of our operations, and our financial condition.
Compliance with environmental regulations and litigation based on environmental regulations could require significant expenditures.
Environmental regulations mandate, among other things, the maintenance of air and water quality standards, land development, and land reclamation, and set forth limitations on the generation, transportation, storage, and disposal of solid and hazardous waste. Environmental legislation is evolving in a manner that may require stricter standards and enforcement, increased fines and penalties for non-compliance, more stringent environmental assessments of proposed projects, and a heightened degree of responsibility for mining companies and their officers, directors, and employees. In connection with our current exploration activities or in connection with our prior mining operations, we may incur environmental costs that could have a material adverse effect on the financial condition and results of our operations. Any failure to remedy an environmental problem could require us to suspend operations or enter into interim compliance measures pending completion of the required remedy.
Moreover, governmental authorities and private parties may bring lawsuits based upon damage to property and injury to persons resulting from the environmental, health, and safety impacts of prior and current operations, including operations conducted by other mining companies many years ago at sites located on properties that we currently own or formerly owned. These lawsuits could lead to the imposition of substantial fines, remediation costs, penalties, and other civil and criminal sanctions as well as reputational harm, including damage to our relationships with customers, suppliers, investors, governments, or other stakeholders. Such laws, regulations, enforcement, or private claims may have a material adverse effect on our financial condition, results of operations, or cash flows.
Changes in technology or other developments could adversely affect demand for lithium compounds or result in preferences for substitute products.
Lithium and its derivatives are preferred raw materials for certain industrial applications, such as rechargeable batteries. For example, current and future high energy density batteries for use in electric vehicles will rely on lithium compounds as a critical input. The pace of advancements in current battery technologies, development and adoption of new battery technologies that rely on inputs other than lithium compounds, or a delay in the development and adoption of future high nickel battery technologies that utilize lithium hydroxide could significantly impact our prospects and future revenues. Many materials and technologies are being researched and developed with the goal of making batteries lighter, more efficient, faster charging, and less expensive, some of which could be less reliant on lithium hydroxide or other lithium compounds. Some of these technologies, such as commercialized battery technologies that use no, or significantly less, lithium compounds, could be successful and could adversely affect demand for lithium batteries in personal electronics, electric and hybrid vehicles, and other applications. We cannot predict which new technologies may ultimately prove to be commercially viable and on what time horizon. In addition, alternatives to industrial applications dependent on lithium compounds may become more economically attractive as global commodity prices shift. Any of these events could adversely affect demand for and market prices of lithium, thereby resulting in a material adverse effect on the economic feasibility of extracting any mineralization we discover and reducing or eliminating any reserves we identify.
Our growth depends upon the continued growth in demand for electric vehicles with high performance lithium compounds.
We plan to be one of a few producers of performance lithium compounds that are a critical input in current and next generation high energy density batteries used in electric vehicle applications. Our growth is dependent upon the continued adoption of electric vehicles by consumers. If the market for electric vehicles does not develop as we expect, or develops more slowly than we expect, our business, prospects, financial condition, and results of operations will be affected. The market for electric vehicles is relatively new, rapidly evolving, and could be affected by numerous external factors, such as:
•government regulations and automakers’ responses to these regulations;
•tax and economic incentives;
•rates of consumer adoption, which is driven in part by perceptions about electric vehicle features (including range per charge), quality, safety, performance, cost, and charging infrastructure;
•competition, including from other types of alternative fuel vehicles, plug-in hybrid electric vehicles, and high fuel-economy internal combustion engine vehicles;
•volatility in the cost of battery materials, oil, and gasoline;
•rates of customer adoption of higher performance lithium compounds; and
•rates of development and adoption of next generation high nickel battery technologies.
Our operations may be further disrupted, and our financial results may continue to be adversely affected by the COVID-19 pandemic.
The COVID-19 pandemic, or a similar public health crisis, has the potential to continue to pose a material risk to our business and operations. If a significant portion of our workforce or consultants become unable to work or travel to our operations due to illness or state or federal government restrictions, we may be forced to reduce or suspend our exploration and development activities.
Although significant progress has been made in the development and distribution of vaccines, the future scope and duration of COVID-19’s impact may be difficult to assess or predict, and the virus has the potential to continue to negatively impact global economic conditions, which, in turn, could adversely affect our business, results of operations and financial condition. In addition, a recession or market correction resulting from a rise in COVID-19 infections could materially affect our business and the value of our common stock.
Our cash and cash equivalents could be adversely affected if the financial institutions in which we hold our cash and cash equivalents fail.
We maintain cash deposits in accounts that, at times may exceed the amount of insurance provided on such deposits by the FDIC. If one or more of the financial institutions in which we hold cash deposits fails, we could lose all or a portion of our uninsured cash balances. If access to our cash accounts in the future is impaired, whether temporarily or otherwise, we may be unable to pay our operational expenses such as payroll or make other payments. There can be no assurance that the FDIC will take actions to support deposits in excess of existing FDIC insured limits.
If banks and financial institutions enter receivership or become insolvent in the future, including the financial institutions in which we, our equity method investments, or our customers hold cash, our and their ability to access existing cash, cash equivalents, and investments may be threatened and could have a material adverse effect on our business and financial condition. In addition, there is a risk that one or more of our current service providers, financial institutions, and other partners may be adversely affected by the foregoing risks, which could directly affect our ability to conduct our business plans on schedule and on budget.
Risks Related to an Investment in Our Common Stock
The market price and trading volume of our common stock may be volatile and may be affected by economic conditions beyond our control.
The market price of our common stock may be highly volatile and subject to wide fluctuations. For instance, from January 1, 2023, through February 15, 2024, the closing price of our common stock on Nasdaq ranged from as high as $73.46 to as low as $12.38. In addition, the trading volume of our common stock may fluctuate and cause significant price variations to occur. If the market price of our common stock declines significantly, you may be unable to resell your shares of our common stock at or above the purchase price, if at all. We cannot assure you that the market price of our common stock will not fluctuate or significantly decline in the future.
Some specific factors that could negatively affect the price of our common stock or result in fluctuations in the price and trading volume include:
•actual or expected fluctuations in our prospects or operating results;
•changes in the demand for, or market price of lithium, lithium hydroxide, or lithium-ion batteries;
•additions to or departures of our key personnel;
•changes or proposed changes in laws and regulations;
•changes in trading volume of our common stock on Nasdaq or the ASX;
•sales or perceived potential sales of our common stock by us, our directors, senior management, or our stockholders in the future;
•announcement or expectation of additional financing efforts;
•conditions in the financial markets or changes in general economic and political conditions and events, including repercussions from the war in Ukraine and the escalating conflict in the Middle East;
•market conditions or investor sentiment in the broader stock market, or in our industry in particular;
•introduction of new products and services by us or our competitors;
•issuance of new or changed securities analysts’ reports or recommendations;
•litigation and governmental investigations; and
•changes in investor perception of our market position based on third-party information.
When the market price of a stock is volatile, certain holders of that stock may institute securities class action litigation against the company that issued the stock. If any of our stockholders brought a lawsuit against us, we could incur substantial costs defending the lawsuit or any future securities class litigation that may be brought against us.
We incur significant costs as a result of being publicly traded in the U.S. and Australia.
As a company whose common stock is publicly traded in both the U.S. and Australia, we incur significant legal, accounting, insurance, and other expenses related to compliance with applicable regulations. Our management and other personnel devote a substantial amount of time to these compliance initiatives, and we may need to continue to add additional personnel and build our internal compliance infrastructure.
Our common stock is publicly traded on the ASX in the form of CDIs. As a result, we must comply with the ASX Listing Rules. We have policies and procedures that we believe are designed to provide reasonable assurance of our compliance with the ASX Listing Rules. If, however, we do not follow those procedures and policies, or they are not sufficient to prevent non-compliance, we could be subject to liability, fines, and lawsuits. These laws, regulations, and standards are subject to varying interpretations, and as a result, their application in practice may evolve over time as new guidance is provided by regulatory and governing bodies. We intend to invest resources to comply with evolving laws, regulations, and standards, and this investment may result in increased selling, general and administrative expenses and a diversion of management’s time and attention from growth and revenue-generating activities to compliance activities.
If, notwithstanding our efforts to comply with new laws, regulations, and standards, we fail to comply, regulatory authorities may initiate legal proceedings against us, and our business may be harmed.
Some provisions of Delaware law and our certificate of incorporation and bylaws may deter third parties from acquiring us or limit our stockholders’ ability to obtain a favorable judicial forum for disputes with us or our directors, officers, or employees.
Our certificate of incorporation and bylaws provide for, among other things:
•a staggered board and restrictions on the ability of our stockholders to fill a vacancy on our Board;
•the authorization of undesignated preferred stock, the terms of which may be established and shares of which may be issued without stockholder approval;
•advance notice requirements for stockholder proposals;
•a requirement that, except as otherwise provided for or fixed with respect to actions required or permitted to be taken by holders of preferred stock, no action that is required or permitted to be taken by the stockholders may be affected by consent of stockholders in lieu of a meeting of stockholders;
•permit the Board to establish the number of directors;
•a provision that the Board is expressly authorized to adopt, amend, or repeal our amended and restated bylaws;
•a provision that stockholders can remove directors only for cause and only upon the approval of not less than 66 2/3% of all outstanding shares of our voting stock;
•a requirement that the approval of not less than 66 2/3% of all outstanding shares of our voting stock to adopt, amend, or repeal certain provisions of our bylaws and certificate of incorporation; and
•limit the jurisdictions in which certain stockholder litigation may be brought.
These anti-takeover defenses could discourage, delay, or prevent a transaction involving a change in control of our company. These provisions could also discourage proxy contests and make it more difficult for stockholders to elect directors of their choosing and cause us to take other corporate actions than desired.
Our amended and restated certificate of incorporation provides that the Court of Chancery of the State of Delaware is the sole and exclusive forum for any complaint asserting any internal corporate claims (including claims in the right of the Company that are based upon a violation of a duty by current or former director, officer, employee, or stockholder in such capacity, or as to which the Delaware General Corporation Law confers jurisdiction upon the Court of Chancery) or a cause of action arising under the Securities Act. This provision shall not apply to suits brought to enforce a duty or liability created by the Exchange Act. This choice of forum provision may limit a stockholder’s ability to bring a claim in a judicial forum that it finds favorable for disputes with us or our directors, officers, or other employees. If a court were to find the choice of forum provision contained in our amended and restated certificate of incorporation to be inapplicable or unenforceable in an action, we may incur additional costs associated with resolving such action in other jurisdictions, which could harm our business. For example, under the Securities Act, federal courts have concurrent jurisdiction over all suits brought to enforce any duty or liability created by the Securities Act, and investors cannot waive compliance with the federal securities laws and the rules and regulations thereunder.
We do not anticipate paying dividends in the foreseeable future.
We have not declared any dividends during the years ended December 31, 2023, or 2022, the six months ended December 31, 2021, or for the year ended June 30, 2021, and do not anticipate that we will do so in the foreseeable future. We currently intend to retain future earnings, if any, to finance the development of our business. Dividends, if any, on our outstanding shares of common stock will be declared by and subject to the discretion of the Board on the basis of our earnings, financial requirements, and other relevant factors. As a result, a return on your investment will only occur if our common stock price appreciates. We cannot assure you that our common stock will appreciate in value or even maintain the price at which you purchase shares of our common stock. You may not realize a return on your investment in our common stock, and you may even lose your entire investment in our common stock. Therefore, you should not rely on an investment in our common stock as a source for any future dividend income.
If U.S. securities or industry analysts do not publish research reports about our business, or if they issue an adverse opinion about our business, the market price and trading volume of our common stock could decline.
The trading market for our common stock will be influenced by the research and reports that U.S. securities or industry analysts publish about us and our business. Securities and industry analysts may discontinue research on us, to the extent such coverage currently exists, or in other cases, may never publish research on us. If no, or too few, U.S. securities or industry analysts commence coverage of our Company, the trading price for our common stock would likely be negatively affected. In the event securities or industry analysts initiate coverage, if one or more of the analysts who cover us downgrade our common stock or publish inaccurate or unfavorable research about our business, the market price of our common stock would likely decline. If one or more of these analysts cease coverage of us or fail to publish reports on us regularly, demand for our common stock could decrease, which might cause our price and trading volume to decline. In addition, research and reports that Australian securities or industry analysts publish about us, our business, or our common stock may impact the market price of our common stock.
Unstable market and economic conditions may have serious adverse consequences on our business and financial condition.
Global credit and financial markets have experienced extreme disruptions at various points over the last few decades, characterized by diminished liquidity and credit availability, declines in consumer confidence, declines in economic growth, increases in unemployment rates, and uncertainty about economic stability. If another such disruption in credit and financial markets and deterioration of confidence in economic conditions occurs, our business may be adversely affected. If the equity and credit markets were to deteriorate significantly in the future, it may make any necessary debt or equity financing more difficult to complete, more costly, and more dilutive. Failure to secure any necessary financing in a timely manner and on favorable terms could have a material adverse effect on our growth strategy, financial performance, and share price and could require us to delay or abandon development or commercialization plans. In addition, there is a risk that one or more of our service providers, manufacturers, or other partners would not survive or be able to meet their commitments to us under such circumstances, which could directly affect our ability to attain our operating goals on schedule and on budget.
Sales of our common stock, or the perception that such sales may occur, could depress the price of our common stock.
Sales of a substantial number of shares of our common stock in the public market, or the perception that such sales may occur, could depress the market price of our common stock. We have filed a registration statement registering under the Securities Act the shares of our common stock reserved for issuance under our Stock Incentive Plan, including shares issuable upon exercise of outstanding options. These shares can be freely sold in the public market upon issuance, subject to volume limitations applicable to affiliates. Further, as opportunities present themselves, we may enter into financing or similar arrangements in the future, including the issuance of debt or equity securities. If we issue common stock or securities convertible into our common stock, our common stockholders would experience additional dilution, and as a result, the price of our common stock may decline.
Item 1B. UNRESOLVED STAFF COMMENTS.
Not Applicable.
Item 1C. CYBERSECURITY.
Cybersecurity Risk Management and Strategy
We recognize the importance of developing, implementing, and maintaining robust cybersecurity measures to safeguard our information systems and protect the confidentiality, integrity, and availability of our data. As a result, we have integrated cybersecurity risk management into our broader risk management framework to promote a holistic approach toward assessing, identifying, and managing material risks associated with cybersecurity threats. This integration ensures that cybersecurity considerations are an integral part of the decision-making processes at every level of our organization.
Recognizing the complexity and evolving nature of cybersecurity threats, we have partnered with third-party cybersecurity agencies to leverage specialized knowledge and insights, ensuring our cybersecurity strategies and processes remain at the forefront of industry best practices. Our cybersecurity partners work to continuously scan and monitor our networks for threats and vulnerabilities and provide access to a 24/7 incident response team. Further, through our partnerships, we conduct annual security risk assessments, which are designed in alignment with the National Institute of Standards and Technology Cybersecurity Framework and perform annual penetration tests and breach and attack simulations to validate security controls. These partnerships are actively managed by members of our management team, together with our information technology department, to ensure effective implementation.
Additionally, to best position Piedmont Lithium to avoid cybersecurity incidents, we, among other things, conduct employee trainings and, where appropriate, utilize a coordinated procurement process to bring consistency, compliance, and interoperability to the hardware, software, and services we obtain from vendors and other business partners. This coordinated procurement process includes, in addition to other safeguards, review by our information technology and legal departments to address any security concerns before any vendor or business partner is granted access to our information systems.
As of the date of this Annual Report, we have not identified risks from cybersecurity threats, including as a result of any previous cybersecurity incidents, that have or are reasonably likely to materially affect us, including our operations, business strategy, results of operations, or financial condition. While we continually work to safeguard the information systems we use, and the proprietary, confidential and personal information residing therein, and mitigate potential risks, there can be no assurance that such actions will be sufficient to prevent cybersecurity incidents or mitigate all potential risks to such systems, networks and data or those of our third-party providers. For additional information, refer to Part I, Item 1A, “Risk Factors—Our business is subject to cybersecurity risks.”
Governance
Cybersecurity is an important part of our risk management processes and an area of focus for our Board and management team. Our Audit Committee is responsible for the Board-level oversight of risks from cybersecurity threats. Members of our Audit Committee receive updates from our management team regarding Company practices, programs, and other developments related to cybersecurity throughout the year, including quarterly updates from our Chief Legal Officer on cyber threats and our cybersecurity risk management and strategy program. Our Audit Committee is comprised of Board members with diverse expertise, including risk management and strategy, equipping each member to oversee cybersecurity risks effectively.
We maintain a Cybersecurity Incident Response Team composed of professionals across various functions, including information technology, legal, finance, accounting, and risk. This team is trained in managing cybersecurity incidents and is comprised of individuals with experience in various roles involving information technology, including, security, auditing, compliance, systems, and programming.
Item 2. PROPERTIES.
We lease our corporate headquarters in Belmont, North Carolina and lease additional office space in Cherryville, North Carolina. We own and lease properties in Gaston County, North Carolina, primarily for the principal use of current development activities for Carolina Lithium. We expect to further our principal use to include mining, development and production of lithium hydroxide and other lithium products and byproducts.
In August 2022, in connection with Tennessee Lithium, we signed an option to purchase land contract with the Industrial Development Board of the County of McMinn and the McMinn County of Economic Development Authority. In December 2023, this option agreement expired. We are currently in discussions with county officials to extend the option and have no ownership in the property at this time. The property is located in the North Etowah Industrial Park in the City of Etowah in McMinn County, Tennessee, which is approximately 62 miles southwest of Knoxville, Tennessee and 60 miles northeast of Chattanooga, Tennessee. If purchased, the property would be the site for our planned lithium hydroxide conversion plant as well as local office space. In October 2023, we purchased a 132-acre disposal facility adjacent to the proposed Tennessee Lithium plant site for the placement of inert tailings produced as part of the innovative alkaline pressure leach process. We currently hold a Solid Waste Disposal Permit for this disposal facility. In addition, we agreed to acquire a large industrial complex in close proximity to the Tennessee Lithium plant site and continue to work toward property closing.
Mineral Properties
The below table discloses, as of December 31, 2023, our relevant mineral properties categorized as wholly-owned, owned through direct investment, and owned through indirect investment only. We classify our mineral properties into three categories: “Production Properties,” “Development Properties,” and “Exploration Properties.” Production Properties are properties with material extraction of mineral reserves. Development Properties are properties that have mineral reserves disclosed but no material extraction. Exploration Properties are properties that have no mineral reserves disclosed. We currently categorize both Carolina Lithium and NAL as material individual properties under S-K 1300 and provide additional details accordingly under “Individual Material Properties.” For a discussion of our non-material properties associated with our equity method investments, see “Equity Method Investment Projects” and “Equity Method Investment Properties.”
|
|
|
|
|
|
|
|
|
|
|
|
|
|
|
|
|
|
|
|
|
|
|
|
|
|
|
|
|
|
|
|
|
|
|
|
|
|
|
|
|
Property |
|
Location |
|
Effective Ownership at 12/31/2023 |
|
Mineral/Extraction Type |
|
Operator |
|
Stage |
| Wholly-owned |
|
Carolina Lithium |
|
North Carolina |
|
100% |
|
Lithium/ Hard rock |
|
Piedmont Lithium Inc. |
|
Development |
| Effective Ownership Through Direct Investment |
|
Ewoyaa (1) |
|
Ghana |
|
9% |
|
Lithium/ Hard rock |
|
Atlantic Lithium |
|
Development |
|
NAL (2) |
|
Quebec |
|
34% |
|
Lithium/ Hard rock |
|
Sayona Quebec |
|
Production |
|
Authier (2) |
|
Quebec |
|
34% |
|
Lithium/ Hard rock |
|
Sayona Quebec |
|
Development |
|
Tansim (2) |
|
Quebec |
|
34% |
|
Lithium/ Hard rock |
|
Sayona Quebec |
|
Exploration |
|
Vallée (2) |
|
Quebec |
|
34% |
|
Lithium/ Hard rock |
|
Sayona Quebec |
|
Exploration |
|
Killick Lithium (3) |
|
Newfoundland |
|
20% |
|
Lithium/ Hard rock |
|
Sokoman Minerals and Benton Resources |
|
Exploration |
| Effective Ownership Through Indirect Investment |
|
Moblan (4) |
|
Quebec |
|
7% |
|
Lithium/ Hard rock |
|
Sayona Mining |
|
Exploration |
|
Lac Albert (5) |
|
Quebec |
|
12% |
|
Lithium/ Hard rock |
|
Sayona Mining |
|
Exploration |
|
Troilus Claims (5) |
|
Quebec |
|
12% |
|
Lithium/ Hard rock |
|
Sayona Mining |
|
Exploration |
|
Kimberly Graphite (5) |
|
Western Australia |
|
12% |
|
Graphite/ Hard rock |
|
Sayona Mining |
|
Exploration |
|
Pilbara Gold Tenements (5) |
|
Western Australia |
|
12% |
|
Gold/ Hard rock |
|
Sayona Mining |
|
Exploration |
|
Pilbara Lithium Tenements (6) |
|
Western Australia |
|
6% |
|
Lithium/ Hard rock |
|
Sayona Mining |
|
Exploration |
__________________________
(1)As of December 31, 2023, we owned an equity interest of approximately 9% in Atlantic Lithium. Atlantic Lithium owns a 100% ownership in Atlantic Lithium Ghana, which owns the Ewoyaa project. In August 2021, we entered into a project agreement with Atlantic Lithium, whereby we can acquire a 50% equity interest in Atlantic Lithium Ghana. In August 2023, we made the election to receive our initial 22.5% equity interest in Atlantic Lithium Ghana and currently await regulatory approvals of our ownership. Accordingly, as of the December 31, 2023, our effective ownership of the Ewoyaa project remained at approximately 9%. For additional information, please refer to “Equity Method Investment Projects - Atlantic Lithium” below in this Item 2.
(2)As of December 31, 2023, we owned an equity interest of approximately 12% in Sayona Mining, who owns a 75% interest in Sayona Quebec. We own the remaining 25% in Sayona Quebec. Sayona Quebec owns 100% of NAL, Authier, Tansim, and Vallée. The effective ownership displayed regarding Vallée does not include our interest in the property claims being jointly developed with Jourdan Resources Inc. Accordingly, as of December 31, 2023, our effective ownership for each was approximately 34%. For additional information, please refer to “Equity Method Investment Projects - Sayona Mining” below in this Item 2. In February 2024, we sold our 12% interest in Sayona Mining.
(3)As of December 31, 2023, we owned an equity interest of 19.9% in Vinland Lithium. Vinland Lithium owns a 100% interest in Killick Lithium. We have entered into an earn-in agreement with Vinland Lithium to acquire up to a 62.5% equity interest in Killick Lithium through staged-investments. As of December 31, 2023, we have not earned any additional interest in the Killick Lithium. Accordingly, our effective ownership in Killick Lithium is 19.9%. For additional information, please refer to “Equity Method Investment Projects - Vinland” below in this Item 2.
(4)As of December 31, 2023, we owned an equity interest of approximately 12% in Sayona Mining, who owns a 60% interest in Moblan. Accordingly, as of December 31, 2023, our effective ownership in Moblan was approximately 7%. For additional information, please refer to “Equity Method Investment Projects - Sayona Mining” below in this Item 2. In February 2024, we sold our 12% interest in Sayona Mining.
(5)As of December 31, 2023, we owned an equity interest of approximately 12% in Sayona Mining, who owns a 100% interest in Lac Albert, Troilus Claims, Pilbara Gold Tenements, and Kimberly Graphite. Accordingly, as of December 31, 2023, our effective ownership in each was approximately 12%. For additional information, please refer to “Equity Method Investment Projects - Sayona Mining” below in this Item 2. In February 2024, we sold our 12% interest in Sayona Mining.
(6)As of December 31, 2023, we owned an equity interest of approximately 12% in Sayona Mining, who owns a 49% interest the Pilbara Lithium Tenements. Accordingly, as of December 31, 2023, our effective ownership in each was approximately 6%. For additional information, please refer to “Equity Method Investment Projects - Sayona Mining” below in this Item 2. In February 2024, we sold our 12% interest in Sayona Mining.
Production Table
Our aggregate annual production, for the most recent three years, is shown in the table below.
|
|
|
|
|
|
|
|
|
|
|
|
|
|
|
|
|
|
|
Years Ended December 31, |
Lithium metal (1) (metric tons) |
2023 |
|
2022 |
|
2021 |
|
|
|
|
|
|
NAL(2) |
856 |
|
|
— |
|
|
— |
|
__________________________
(1)Lithium production shows as lithium metal. Conversion to LCE is 0.1878 metric ton of lithium metal to 1 metric ton of LCE.
(2)As of December 31, 2023, through our ownership in Sayona Mining and Sayona Quebec joint venture, we owned 34% of NAL. We are therefore reporting 34% of NAL’s production.
Summary Resources Table
The following table provides a summary of our mineral resources, exclusive of reserves as of December 31, 2023. Where applicable, the amounts represent our attributable portion based on ownership percentages previously noted. The relevant technical information supporting mineral resources for each material property is included in the “Material Individual Properties” section below. Relevant technical information supporting mineral resources for our non-material properties is included under the “Authier” and “Ewoyaa” sections below and in the technical report summaries attached as Exhibits 96.4 and 96.2 to this Annual Report.
|
|
|
|
|
|
|
|
|
|
|
|
|
|
|
|
|
|
|
|
|
|
|
|
|
|
|
|
|
|
|
|
|
|
|
|
|
|
|
|
|
|
|
|
|
|
|
|
|
Measured Mineral Resources |
|
Indicated Mineral Resources |
|
Measured and Indicated Mineral Resources |
|
Inferred Mineral Resources |
| (amounts in millions of metric tons) |
Amount |
|
Grade
(Li2O%) |
|
Amount |
|
Grade
(Li2O%) |
|
Amount |
|
Grade
(Li2O%) |
|
Amount |
|
Grade
(Li2O%) |
| Lithium - Hard Rock: |
|
|
|
|
|
|
|
|
|
|
|
|
|
|
|
| North America |
|
|
|
|
|
|
|
|
|
|
|
|
|
|
|
| Carolina Lithium |
— |
|
— |
|
9.96 |
|
1.14% |
|
9.96 |
|
1.14% |
|
15.93 |
|
1.02% |
NAL (1) |
0.24 |
|
1.00% |
|
2.22 |
|
1.15% |
|
2.47 |
|
1.14% |
|
11.22 |
|
1.23% |
Authier (1) |
0.08 |
|
0.80% |
|
1.08 |
|
0.98% |
|
1.16 |
|
0.97% |
|
2.16 |
|
0.98% |
| West Africa |
|
|
|
|
|
|
|
|
|
|
|
|
|
|
|
Ewoyaa (2) |
— |
|
— |
|
0.21 |
|
1.09% |
|
0.21 |
|
1.09% |
|
0.17 |
|
1.07% |
__________________________
(1)As of December 31, 2023, we owned 34% of NAL and Authier through ownership in Sayona Mining and our Sayona Quebec joint venture. We are therefore reporting 34% of NAL and Authier’s mineral resources.
(2)As of December 31, 2023, we owned 9% of Ewoyaa through our ownership in Atlantic Lithium. We are therefore reporting 9% of Ewoyaa’s mineral resources.
Summary Reserves Table
The following table provides a summary of our mineral reserves as of December 31, 2023. Where applicable, the amounts represent our attributable portion based on ownership percentages previously noted. The relevant technical information supporting mineral reserves for each material property is included in the “Material Individual Properties” section below. Relevant technical information supporting mineral reserves for our non-material properties is included under the “Authier” and “Ewoyaa” sections below and in the technical report summaries attached as Exhibits 96.4 and 96.2 to this Annual Report.
|
|
|
|
|
|
|
|
|
|
|
|
|
|
|
|
|
|
|
|
|
|
|
|
|
|
|
|
|
|
|
|
|
|
|
|
|
Proven Mineral Reserves |
|
Probable Mineral Reserves |
|
Total Mineral Reserves |
| (amounts in millions of metric tons) |
Amount |
|
Grade
(Li2O%) |
|
Amount |
|
Grade
(Li2O%) |
|
Amount |
|
Grade
(Li2O%) |
| Lithium - Hard Rock: |
|
|
|
|
|
|
|
|
|
|
|
| North America |
|
|
|
|
|
|
|
|
|
|
|
| Carolina Lithium |
— |
|
— |
|
18.26 |
|
1.10% |
|
18.26 |
|
1.10% |
NAL (1) |
0.11 |
|
1.43% |
|
6.88 |
|
1.08% |
|
7.00 |
|
1.09% |
Authier (1) |
2.11 |
|
0.93% |
|
1.73 |
|
1.00% |
|
3.84 |
|
0.96% |
| West Africa |
|
|
|
|
|
|
|
|
|
|
|
Ewoyaa (2) |
— |
|
— |
|
2.30 |
|
1.22% |
|
2.30 |
|
1.22% |
__________________________
(1)As of December 31, 2023, we owned 34% of NAL and Authier through our ownership in Sayona Mining and Sayona Quebec joint venture. We are therefore reporting 34% of NAL and Authier’s mineral reserves.
(2)As of December 31, 2023, we owned 9% of Ewoyaa through our ownership in Atlantic Lithium. We are therefore reporting 9% of Ewoyaa’s mineral reserves.
Equity Method Investment Projects
Sayona Mining
As of December 31, 2023, we owned an equity interest of approximately 12% in Sayona Mining. As of December 31, 2023, we have invested a total of $20.7 million in Sayona Mining.
Sayona Mining’s lithium assets in Quebec Canada include a 75% equity interest in Sayona Quebec, a 60% equity interest in Northern Hub’s Moblan project, a 100% equity interest in the Troilus Claims, and a 100% equity interest in Lac Albert. Sayona Mining also holds a 100% equity interest in assets in Western Australian, including the Pilbara Gold Tenements and Kimberley Graphite, and a 49% interest in the Pilbara Lithium Tenements.
Sayona Quebec
As of December 31, 2023, we owned a 25% equity interest in Sayona Quebec, with Sayona Mining holding the remaining 75% equity interest as discussed above. Sayona Quebec owns the now-producing NAL, the Authier Lithium project, and the Tansim Lithium project. Additionally, in November of 2022, Sayona Quebec, through NAL, entered into an acquisition and earn-in agreement with Jourdan Resources Inc. to purchase 20 claims of Vallée and to earn up to a 51% equity interest in the remaining 28 claims. As part of the agreement, NAL became a 9.99% equity holder of Jourdan Resources Inc.
Through our strategic partnership, Sayona Quebec is prioritizing the manufacturing of lithium products in Quebec and capitalizing on Quebec’s competitive advantages, which include access to skilled labor, strong infrastructure, governmental mining support and zero-carbon, low-cost hydropower. As of December 31, 2023, our investments in Sayona Quebec totaled $75.8 million.
Revenue and expenses of Sayona Quebec and Sayona Mining are not consolidated into our financial statements; rather, our proportionate share of the income or loss of each investee is reported as “Income (loss) from equity method investments” in our consolidated statements of operations.
Offtake Agreement
In January 2021, we entered into a long-term offtake agreement with Sayona Quebec. Under the terms of the offtake supply agreement, Sayona Quebec will supply Piedmont Lithium the greater of 113,000 dmt per year or 50% of Sayona Quebec’s spodumene concentrate production from the combination of NAL and the Authier project.
Under the agreement, spodumene concentrate is priced on a market price basis with a floor price of $500 per dmt and a ceiling price of $900 per dmt.
Atlantic Lithium
As of December 31, 2023, we owned an equity interest of approximately 9% in and have a strategic partnership with Atlantic Lithium. As of December 31, 2023, we have invested $15.5 million in Atlantic Lithium.
Atlantic Lithium owns a 100% ownership in Atlantic Lithium Ghana, which owns the Ewoyaa project in Ghana, Africa. Atlantic Lithium Ghana is consolidated by Atlantic Lithium. Revenue and expenses of Atlantic Lithium are not consolidated into our financial statements; rather, our proportionate share of the income or loss of Atlantic Lithium is reported as “Income (loss) from equity method investment” in our consolidated statements of operations.
Offtake and Project Agreement
In August 2021, we entered into a long-term offtake agreement for spodumene concentrate with Atlantic Lithium, whereby we can acquire a 50% equity interest in Atlantic Lithium Ghana, and the right to purchase 50% of Atlantic Lithium Ghana’s life-of-mine production of spodumene concentrate by funding over time the exploration and evaluation activities (Phase 1) and development activities (Phase 2) for the Ewoyaa project. We currently estimate our total funding requirement to be approximately $140 million through late 2025 or 2026, exclusive of any initial investment in Ewoyaa from MIIF and exclusive of any ongoing contributions made by Piedmont in excess of $17 million associated with the Phase 1 exploration activities or pre-development expenses for the Ewoyaa project. Our funding requirement in the Ewoyaa project is split between two phases:
•Phase 1—Our funding obligations under Phase 1 are now complete, as we have funded our share of exploration, evaluation and technical study expenditures. In August 2023, we made the election to proceed with Phase 2. As a result, we’ve satisfied all obligations to receive our initial 22.5% equity interest in Atlantic Lithium Ghana and currently await regulatory approvals of our ownership.
•Phase 2—We have the ability to acquire an additional 27.5% equity interest in Atlantic Lithium Ghana by funding our share of development expenditures, currently estimated to be $122 million. We will share equally with Atlantic Lithium any cost savings below $70.0 million and any cost overruns above $70.0 million.
As of December 31, 2023, cash payments to Atlantic Lithium for the Ewoyaa project totaled $26.4 million and are reported as “Other non-current assets” in the consolidated balance sheets (See Note 10—Other Assets and Liabilities).
Pricing for the offtake supply of spodumene concentrate will be at market rates at the time of purchase. Under the offtake agreement, spodumene concentrate is priced on a CIF, China market price basis less ocean freight and insurance on a net back basis to free on-board vessel (Incoterms 2020) at the Port of Takoradi, Ghana.
In September 2023, the Minerals Income Investment Fund of Ghana entered into a non-binding agreement with Atlantic Lithium to invest $27.9 million to acquire a 6% equity interest in Ewoyaa, with the investment earmarked for Ewoyaa’s project development costs, and to fund 6% of all future exploration and development costs within Atlantic Lithium’s Ghanaian portfolio. MIIF’s investment is expected to equally reduce Piedmont Lithium and Atlantic Lithium’s funding requirements for Ewoyaa. If executed, Piedmont Lithium and Atlantic Lithium would each own a 40.5% equity interest in Ewoyaa, net of the government’s free-carried interest. Piedmont Lithium would continue to maintain a 50% life-of-mine offtake right to future spodumene concentrate production from Atlantic Lithium Ghana under these agreements.
Vinland Lithium
As of December 31, 2023, we owned an equity interest of approximately 19.9% in Vinland Lithium, which is a Canadian-based entity jointly owned with Sokoman Minerals and Benton Resources. Vinland Lithium currently owns Killick Lithium, which owns a large exploration property prospective for lithium located in southern Newfoundland, Canada. As of December 31, 2023, we have invested $1.8 million in Vinland Lithium.
Offtake and Project Agreement
In October 2023, we entered into an earn-in agreement with Vinland Lithium to acquire up to a 62.5% equity interest in Killick Lithium through staged-investments. As part of our investment, we entered into a marketing agreement with Killick Lithium for 100% marketing rights and right of first refusal to purchase 100% of all lithium products produced by Killick Lithium on a life-of-mine basis at competitive commercial rates.
Equity Method Investment Properties
The information below specific to each property is derived from information publicly disclosed by each such investee company. Additionally, the disclosed mineral reserves estimates and mineral resources estimates of each NAL, Authier, and Ewoyaa are presented according to the following principals.
Mineral Reserves
A "mineral reserve” is an estimate of tonnage and grade or quality of indicated and measured mineral resources that, in the opinion of the QP, can be the basis of an economically viable project. Specifically, mineral reserve is the economically mineable part of a measured or indicated mineral resource. The term "economically viable,” as used in the definition of reserve, means that the QP has analytically determined that extraction of the mineral reserve is economically viable under reasonable investment and market assumptions.
The term "proven reserves” means the economically mineable part of a measured mineral resource and can only result from conversion of a measured mineral resource. The term "probable reserves” means mineral reserves for which quantity and grade are computed from information similar to that used for proven reserves, but the sites for sampling are farther apart or are otherwise less closely spaced. The degree of assurance, although lower than that for proven reserves, is high enough to assume continuity between points of observation.
Proven and probable mineral reserves are based on extensive drilling, sampling, mine modeling, and metallurgical testing from which we determined economic feasibility. The reference point for mineral reserves is the undiluted ore, excluding dilution material, delivered to our spodumene concentrator. The price sensitivity of mineral reserves depends upon several factors including grade, metallurgical recovery, operating cost, and waste-to-ore ratio. Each respective mineral reserves table in this Item 2 lists the estimated metallurgical recovery rate which includes the estimated recovery of both spodumene concentrate and conversion to lithium hydroxide. The cut-off grade, or lowest grade of mineralization considered economic to process, depends upon prevailing economic conditions, estimated mineability of our deposit, and amenability of the mineral reserve to spodumene concentration and conversion to lithium hydroxide.
The proven and probable reserve figures presented herein are estimates based on information available at the time of calculation. No assurance can be given that the estimated levels of metallurgical recovery of lithium minerals will be realized. Metric tons of ore containing lithium minerals included in the proven and probable reserves are those contained prior to losses during metallurgical treatment. Reserve estimates may require revision based on actual production. Market fluctuations in the price of spodumene concentrate, lithium hydroxide, or lithium carbonate, as well as increased production costs or reduced metallurgical recovery rates, could render certain proven and probable reserves containing higher cost reserves uneconomic to exploit and might result in a reduction of mineral reserves.
Mineral Resources
The mineral resource figures presented herein are estimates based on information available at the time of calculation and are exclusive of reserves. A “mineral resource” is a concentration or occurrence of solid material of economic interest in or on the Earth’s crust in such form, grade, or quality and quantity that there are reasonable prospects for eventual economic extraction. The location, quantity, grade or quality, continuity and other geological characteristics of a mineral resource are known, estimated or interpreted from specific geological evidence and knowledge, including sampling. The reference point for mineral resources is in situ. Mineral resources are subdivided in order of increasing geological confidence into inferred, indicated and measured categories. Metric tons of mineral resources containing spodumene, quartz, feldspar and mica, included in the measured, indicated, and inferred resources, are those contained prior to losses during metallurgical treatment. The terms “measured resource,” “indicated resource,” and “inferred resource” mean the part of a mineral resource for which quantity and grade or quality are estimated on the basis of geological evidence and sampling that is considered to be comprehensive, adequate, or limited, respectively.
Market fluctuations in the price of lithium hydroxide as well as increased production costs or reduced metallurgical recovery rates, could change future estimates of resources. We have reported mineral resources, prepared in accordance with S-K 1300, as part of our exploration and evaluation activities.
Quebec Properties
Sayona Quebec’s assets are comprised of four wholly-owned projects as follows: NAL, which restarted production in 2023, the Authier project, which is in the development stage, and Tansim and Vallée, which are both in the exploration stage. Additionally, Sayona Quebec entered into a joint-venture agreement with Jourdan Resources Inc. to jointly develop additional Vallée claims, which are also in the exploration stage.
Figure 1
North American Lithium
For a full discussion on NAL, please refer to “Material Individual Properties - NAL,” provided below.
Authier
Authier is located approximately 28 miles northwest of the city of Val-d’Or. Val-d’Or is located approximately 290 miles northwest of the city of Montreal. Authier is easily accessible by a rural road network that is connected to a national highway a few miles east of the project site. The project area comprises 24 mineral claims totaling 2,184 acres and directionally extends 2.6 miles east-west and 2.1 miles north-south. The mineral claims are located over Crown Lands, which is land owned by the Province of Quebec.
Figure 2
The deposit is hosted in a spodumene-bearing pegmatite intrusion. The deposit is 2,707 feet long, striking east-west, with an average thickness of 82 feet, minimum 13 feet and maximum 180 feet, dipping at 40 degrees to the north. The current pit optimization has the mineralization extending down to 656 feet depth, but the deposit remains open in all directions.
Authier has been subject to more than 19 miles of exploration drilling. Between 2010 and 2012 Glen Eagle, the previous tenement holder, completed approximately 6 miles of diamond drilling in 69 diamond drill holes of which 5 miles were drilled on the Authier deposit; 1,998 feet (five diamond drill holes) were drilled on the northwest and 1,384 feet on the south-southwest of the property. Sayona Quebec completed four phases of drilling totaling more than 8.7 miles in 94 diamond drill holes. All the holes completed by Sayona Quebec have used standard diamond drill hole diameter size, using a standard tube and bit.
Sayona Quebec continues to closely engage with all stakeholders concerning Authier’s development by, among other things, holding information sessions and consultations with local municipalities, landowners, First Nations communities, nongovernmental organizations and other stakeholders.
Environmental baseline studies including literature review, field works and laboratory analysis have been undertaken on the Authier project in 2012, and again from 2017-2022 by Sayona Quebec and the previous project owner. Sayona Quebec has progressed environmental studies on the project in accordance with Quebec’s regulatory requirements. In 2023, the Government of Quebec agreed with Sayona Quebec’s request to voluntarily submit the Authier project to the Quebec BAPE process. In line with its commitment to transparency and collaboration, Sayona’s request will allow citizens to get involved in the project’s development. The BAPE’s mission is to inform government decision-making by issuing findings and opinions that account for the public’s concerns and are based on the principles of the Sustainable Development Act.
A technical report summary with respect to our estimated resources and reserves at Authier is filed as an exhibit to this Annual Report as Exhibit 96.4. The Summary Resources Table and Summary Reserves Table located above in this Item 2 reflect only those resources and reserves attributable to our ownership or economic interest as of December 31, 2023, and such reported resources and reserves have been prepared in accordance with S-K 1300.
The following table details measured, indicated and inferred resources which have been prepared in accordance with S-K 1300 and are solely attributable to our ownership or economic interest as of December 31, 2023.
|
|
|
|
|
|
|
|
|
|
|
|
|
|
|
| Authier Mineral Resource Statement at Effective Date of October 6, 2021 based on a Spodumene Concentrate Price of $977/MT; Exclusive of Mineral Reserves and Attributable to Piedmont’s Economic Interest |
Cut-Off Grade (% Li2O) |
0.55% |
| Metallurgical Recovery Concentrator (%) |
78% |
| Mineral Reserves Category |
Ore
(MT)(1)
|
Grade
(Li2O%)
|
Li2O
(metric tons)
|
LCE
(metric tons) |
| Measured |
0.08 |
0.80% |
623 |
1,540 |
| Indicated |
1.08 |
0.98% |
10,579 |
26,162 |
| Measured + Indicated |
1.16 |
0.96% |
11,202 |
27,702 |
| Inferred |
2.16 |
0.98% |
21,155 |
52,316 |
|
|
|
|
|
(1) Mineral Resources are 100% attributable to the property. Values shown in the table are based on Piedmont Lithium’s economic interest in the Mineral Resource. Piedmont Lithium had a 34% economic interest in the Authier project as of December 31, 2023.
Mineral Reserves
Probable mineral reserves have been estimated and based on the consideration of pertinent modifying factors, inclusive of geological, environmental, regulatory and legal factors, in converting a portion of the mineral resources to mineral reserves. A cutoff grade of 0.55% Li2O based on metallurgical recovery limitations was used in creation of the block model. An open pit mining method was selected due to the depth of the ore body. No other mining method was evaluated as part of the mineral reserves estimation. Mine design parameters an overburden berm width of less than 1 foot, overburden bench face angle of 14 degrees, and a setback at the overburden fresh rock contact of 33 feet. Mine design parameters additionally include 20 foot bench heights, berm widths of 27 feet, inter ramp angles ranging from 156 - 189 feet and bench face angles ranging from 65-80 degrees. The single lane ramp width is 56 feet with the dual lane ramp measuring 76 feet with a maximum ramp grade of 10%. Mining ore losses have been estimated at 2.3%, and mine dilution of approximately 9%. To account for additional operational errors and re-handling an additional mine ore loss factor of 2.0% was applied. Process recovery for spodumene concentrate is estimated to be 73.6%.
The following table details proven and probable reserves reflecting only those reserves attributable to our ownership or economic interest as of December 31, 2023, and have been prepared in accordance with S-K 1300.
|
|
|
|
|
|
|
|
|
|
|
|
|
|
|
Authier – Estimate of Mineral Reserves (diluted) at Effective Date of December 31, 2023 based on a transfer price of C$120/t for run-of-mine ore between the Authier Project and North American Lithium(1) |
Cut-Off Grade (% Li2O) |
0.55% |
| Metallurgical Recovery Concentrator (%) |
73.6% |
| Mineral Reserves Category |
Ore
(MT) |
Grade
(Li2O%)
|
Li2O
(metric tons)
|
LCE
(metric tons) |
| Proven |
2.11 |
0.93% |
19,604 |
48,482 |
| Probable |
1.73 |
1.00% |
17,340 |
42,882 |
|
|
|
|
|
(1) Reserves are expressed as tonnages and grades reported as run-of-mine feed at the NAL crusher and account for mining dilution, geological losses, and operational mining loss factors. Pricing to support mineral reserve economics is based upon the sale of run-of-mine ore from the Authier project to North American Lithium at a transfer price of C$120/t. The selected optimized pit shell is based on a revenue factor of 0.86 applied to a base case selling price for spodumene concentrate of $850 per ton of SC6. Mineral reserves estimated are exclusive of the mineral resources.
Tansim
Tansim is situated 51 miles south-west of Authier. Tansim comprises 355 mineral claims spanning 50,749 acres and is prospective for lithium, tantalum, and beryllium.
Mineralization is hosted within spodumene-bearing pegmatite intrusions striking east-west, dipping to the north, and hosted by metasedimentary – metavolcanic rocks of the Pontiac sub-province. The main prospects are Viau-Dallaire, Viau and Vezina. The potential quantity and grade of the exploration target is uncertain as there has been insufficient exploration to estimate a mineral resource, and it is uncertain if further exploration will result in the estimation of a mineral resource.
Vallée
Vallée is located in Abitibi, Quebec, near the township of La Corne and comprises 48 claims covering approximately 4,934 acres, closely neighboring the NAL mine tenure with 20 claims located within 550 yards of the NAL mine boundary. See Figure 3 below.
Figure 3: Vallée
In November 2022, NAL acquired those 20 claims outright, which span approximately 1,866 acres. Such claims allow for potential future infrastructure expansion at the NAL mine and its processing facility. In December 2023, NAL earned its initial 25% stake in the remaining 28 claims and has the right to earn up to a 51% stake in total.
As of December 31, 2023, a total of 66 diamond drill holes measuring a total depth of approximately 10 miles has been completed at Vallée.
The project is situated within the heart of the southern portion of the Abitibi Greenstone Belt, some 62 miles northeast of the mining towns of Rouyn‐Noranda, 28 miles north of Val‐d’Or, 31 miles northeast of Malartic (home to the Canadian‐Malartic Mine), 19 miles southeast of Amos and contiguous and in proximity to RB Energy’s Quebec Lithium Property and adjacent to the NAL mine.
The mineralized spodumene pegmatite dykes that NAL has mined continue directly onto the claims of Vallée.
Northern Hub Properties
Sayona Mining’s Northern Hub assets include the jointly-owned Moblan project and wholly-owned Lac Albert project.
Figure 4
Moblan
Moblan is jointly-owned through a 60% equity interest by Sayona Mining and a 40% equity interest by SOQUEM Inc, a wholly-owned subsidiary of Investissement Québec. Moblan is in the development stage and is located in the Eeyou-Istchee James Bay region of northern Québec, a proven lithium mining province that hosts established, world-class lithium resources, including Nemaska Lithium’s Whabouchi Mine. The area is well serviced by key infrastructure and transport and has access to low-cost, environmentally friendly hydropower.
Moblan is host to high-grade spodumene mineralization in a well-studied proven deposit with more than 37 miles of diamond drilling. The project covers approximately 1,070 acres for a total of 20 claims. In January 2022, Sayona Mining announced the opportunity to expand the mineralization outside the existing proven resource envelope and the commencement of a major drilling program at the project in partnership with SOQUEM Inc. In April 2022, Sayona Mining announced the discovery of a significant new southern lithium pegmatite zone, the Moblan South Discovery. The following month Sayona Mining announced the discovery of multiple new mineralized lithium pegmatites at Moblan South, South East Extension, Moleon and extensions to the Main Moblan lithium deposit. Sayona Mining announced positive drilling results in July 2023 identifying an 820 yard extension to the flat lying South Pegmatite system, as well as new, near surface pegmatite identified in eastern step out drilling.
Figure 5
Troilus Claims
In November 2022, Sayona Mining acquired 1,824 claims comprising 243,397 acres from Troilus Gold Corp. The claims are located adjacent to Moblan (covering 1,062 acres) and extend over a major part of the Frotêt‐Evans Greenstone Belt. See Figure 6 below.
Figure 6: Troilus Claims location, showing proximity to Moblan.
The claims have not been extensively explored for lithium and offer potential for eastward extensions to the Moblan mineralization, as well as regional targets in the emerging lithium district. At more than 200 times the size of Moblan, the claims are considered an investment in future lithium production. As part of Sayona Mining’s agreement to acquire the claims, Troilus Gold Corp. will receive a 2% net smelter royalty on all mineral products derived from the acquired claims.
Lac Albert
In January 2022, Sayona Mining announced the acquisition of 121 new claims in the vicinity of Moblan known as Lac Albert, which is in the exploration stage. Located 2 miles west of the Moblan project and within the same proven lithium mining province, the new claims span 16,282 acres.
Past work has been limited and the geology of the new claim area at Lac Albert is poorly understood. Glacial moraines obscure a significant portion of the area. In May 2022, a till and soil sampling program was undertaken at Lac Albert and mapping of outcrops and boulders was completed. The identified pegmatite occurrences are located in an area with favorable access and proximity to the Route Du Nord, an all-weather regional highway. The area of the new claims is displayed in Figure 6 above.
Western Australia Properties
Sayona Mining owns a 100% economic interest in certain properties in Western Australia with the exception of the Pilbara Lithium Tenements described below, of which Sayona Mining owns a 49% economic interest. Sayona Mining’s leases in Western Australia cover 264,895 acres and comprise lithium, gold and graphite tenure in the Pilbara, Yilgarn and East Kimberley regions. All of Sayona Mining’s Western Australia projects are in the exploration stage.
The Pilbara projects comprise 12 lithium leases totaling 230,548 acres in the Pilgangoora lithium district of Western Australia, with 10 of the tenements also having associated gold rights. These are proximal to the De Grey Mining’s Mallina Gold project, which includes the Hemi gold discovery.
Of the 12 Pilbara tenements with lithium rights, nine are subject to an earn‐in agreement, whereby Morella Corporation Limited, listed on the Australian stock exchange and previously known as Altura Mining, is carrying out exploration to earn an equity interest. The three remaining tenements are held within Sayona Mining’s wholly-owned lithium exploration portfolio.
Figure 7
Pilbara Lithium Tenements
In 2021, Morella commenced an earn-in agreement with Sayona Mining covering eight tenements including the Mallina, Tabba East, and Strelley areas, all in the Pilgangoora lithium district, and two tenements in the South Murchison. As part of the earn-in agreement, Morella funded AUD $1.5 million for exploration activities and subsequently earned a 51% equity interest in the joint venture in 2023.
Mallina Project (E47/2983)—The Mallina Project is the most advanced of Sayona Mining’s Pilbara portfolio. Multiple zones of spodumene pegmatites have been identified within a 6,178 acre zone. The pegmatites occur in three main swarms: the western Discovery prospect, the central Area C prospect and the Eastern Group pegmatites. Mapping has confirmed the pegmatites can be extensive, with the Eastern No.2 pegmatite being over 4,265 feet in strike extent and up to 66 feet in thickness.
During Sayona Mining’s fiscal year ended June 30, 2022, Morella reported significant progress at the Mallina Project with the completion of a targeted deep drilling program. In total, three reverse circulation holes for 1,411 feet and four diamond core holes, including two core tail extensions to reverse circulation drilling, were completed for 2,728 feet. Fine grained spodumene quartz intergrowths within aplite intrusive intervals were observed in the drill core.
Reverse circulation chips and drill core were logged on site and samples have been prepared for mineralogical studies and geochemical assay work to be completed at a laboratory in Perth, Australia. Results are pending.
In 2023, Morella completed two drill campaigns, one of which totaled 66 reverse circulation drill holes totaling 2 miles in the Eastern Group pegmatites.
Mt. Edon Project (E59/2092)—The Mt. Edon Project is located in the South Murchison covers the southern portion of the Payne’s Find greenstone belt and hosts an extensive swarm of pegmatites. During Sayona Mining’s fiscal year ended June 30, 2022, Morella commenced exploration activities, mapping a total of 53 pegmatite outcrops. Rock chip assay results indicate the potential of the area for lithium mineralization.
Pilbara Gold Tenements
Sayona Mining’s Pilbara gold leases are prospective for intrusion related gold mineralization, similar in style to that identified at the Hemi gold discovery. This style of mineralization is hosted within altered late stage high‐magnesium diorites. Sayona Mining’s tenement portfolio remains effectively untested for its gold potential with large areas masked by superficial cover.
Figure 8
Mt. Dove Project (E47/3950)—The Mt. Dove project is within 3 miles of De Grey’s greater Hemi project area, a 19-mile trend which includes Hemi and adjacent intrusions. In 2022, airborne magnetic surveys and geological mapping were undertaken which identified magnetic features for drill testing and in 2023 a drill contract was executed for first pass aircore drilling. The timing for commencement of such drilling is under review by Sayona Mining.
Sayona Pilbara Lithium Exploration
Sayona Mining holds the lithium rights at the Deep Well, Tabba Tabba, and Red Rock tenements which cover a total of 82,533 acres.
Deep Well Project (E47/3829)—The Deep Well project covers an area of 29,405 acres to the west of Port Hedland. Interpretation of new high resolution geophysical data, covering the entire lease area, has identified 11 discrete magnetic anomalies. A 60-hole air-core drilling program, completed a total of 60 diamond drill holes for 5,502 feet. Drill samples have been submitted for gold, lithium and multi-element analysis. Results are pending. Drilling targeted magnetic features that display similarities to the Hemi style of intrusion-related gold mineralization.
The T1, T2, T3, T7, T12a and T12b targets were tested. Planning for follow up reverse circulation drilling is underway.
Tabba Tabba Project (E45/2364)—The Tabba Tabba project is located north of the Pilgangoora lithium mining area in a region of historic tin and tantalum mining. It comprises six tenements covering 145,297 acres, located 25 miles to the north of the Pilgangoora lithium mining area. The main Tabba Tabba tenement, E45/2364 (lithium rights only), is centered in an area of historic tin and tantalum mining. Spodumene pegmatite has been identified in adjacent tenure and the Tabba Tabba project provides exposure to the area’s emerging lithium prospectivity. Soil geochemistry and geological mapping has identified pegmatite and geochemical anomalies. Sayona Mining announced that a 77-hole aircore drill program for 1,571 yards was completed in December of 2023.
Red Rock Project, (E45/4716)—During Sayona Mining’s fiscal year ended June 30, 2022, a geological and regolith terrain mapping study was undertaken over the tenements area, identifying a north-east trading structural corridor extending from Pilgangoora in the south. As a first pass test for lithium and gold mineralization, a soil geochemical sampling program was completed over a 6 mile extent to this target zone. Once results are returned, they will be assessed for potential targets for drill testing.
Kimberley Graphite Project
Past exploration by Sayona Mining has identified graphite mineralization within a 16 mile strike extent of the Corkwood geochemical and geophysical anomaly. The target is structurally deformed, higher grade graphite portions of the stratigraphy with the potential to host coarse flake, high purity graphite mineralization.
Sayona Mining is planning further drill testing of the mineralization to obtain samples for metallurgical and beneficiation testwork.
Figure 9
Ghana
Ewoyaa
Ewoyaa is a development stage project for the mining, development and production of spodumene concentrate located on the south coast of Ghana and covers an area of approximately 348 square miles.
Ewoyaa includes the Ewoyaa, Abonko, and Kaampakrom deposits, and is located in Ghana, West Africa, approximately 60 miles southwest of the capital of Accra. The project area is immediately north of Saltpond, in the Central Region, and falls within the Mfantseman Municipality where Saltpond is the district capital. See Figure 10 below.
Access to the site from Accra is along the asphalt N1 Accra-Cape Coast-Takoradi Highway which runs along the southern coastal boundary of the project. Several laterite roads extend northwards from the highway and link communities in the project area. The deep-sea Port of Takoradi is within 70 miles west of the Ewoyaa site and accessible via the same highway. See Figure 10 below.
Figure 10: Ewoyaa location and tenure, showing proximity to Takoradi Port, highway and grid power.
The topography of the project varies with steep hills surrounding low-lying valleys throughout the proposed mining area. The terrain of the project area rises sharply from a narrow coastal plane to an undulating peneplane where elevation ranges from 66 feet to 394 feet above mean sea level.
Ghana is a republic within the Commonwealth. Ghana gained independence from colonial Britain in 1957, being the first sub-Saharan African country in colonial Africa to do so. Despite some turbulent history in the first decades following independence, Ghana has emerged since the 1990s as a stable, multi-party democracy.
Figure 11: High voltage power transmission lines, bitumen highway and deep-sea Takoradi port close to project site.
Ewoyaa covers two contiguous exploration licenses, the Mankessim (RL 3/55) and Mankessim South (RL PL3/109) licenses. The Mankessim is a joint-venture, with the license in the name of the joint-venture party, Barari DV Ghana; document number 0853652-18. The Mineral Prospecting License was renewed on July 27, 2021, for a further three-year period valid through July 26, 2024. Mankessim South is a wholly-owned subsidiary of Green Metals Resources. A Mineral Prospecting License was renewed on February 19, 2020, for a further three-year period through February 18, 2023. The tenement is in good standing with no known impediments.
In October 2023, Atlantic Lithium announced Ghana’s Ministry of Lands and Natural Resources granted a mining lease for Ewoyaa. The mining lease provides exclusive rights to carry out lithium mining and commercial production activities for an initial 15-year period and is renewable in accordance with Ghanaian legislation. The issuance of the mining lease is subject to ratification by the Ghanaian parliament, approval of the Environmental Protection Agency of Ghana, and other statutory requirements. The mining lease provides the Government of Ghana a 13% free-carried interest and a 10% royalty in Ewoyaa. A final investment decision for Ewoyaa is anticipated upon receipt of the mining lease ratification and all environmental permits required for the construction and operation of Ewoyaa.
A technical report summary with respect to our estimated resources and reserves at Ewoyaa is filed as an exhibit to this Annual Report as Exhibit 96.2.
The following table details indicated and inferred resources which have been prepared in accordance with S-K 1300 and are solely attributable to our ownership or economic interest as of December 31, 2023.
|
|
|
|
|
|
|
|
|
|
|
|
|
|
|
| Ewoyaa Mineral Resource Statement Effective as of January 2023 based on a Spodumene Concentrate Price of $1,587/MT; Exclusive of Mineral Reserves and Attributable to Piedmont’s Economic Interest |
Cut-Off Grade (% Li2O) |
0.50% |
Metallurgical Recovery Concentrator (%)(1) |
70% |
| Mineral Reserves Category |
Ore
(MT)(2)
|
Grade
(Li2O%)
|
Li2O
(metric tons)
|
LCE
(metric tons) |
| Measured |
— |
— |
— |
— |
| Indicated |
0.21 |
1.09% |
2,256 |
5,580 |
| Measured + Indicated |
0.21 |
1.09% |
2,256 |
5,580 |
| Inferred |
0.17 |
1.07% |
1,830 |
4,525 |
|
|
|
|
|
(1) The estimated metallurgical recovery of P1 Pegmatite when producing SC6 product.
(2) Mineral resources estimated exclusive of the mineral reserves.
Mineral Reserves
Probable mineral reserves have been estimated and based on the consideration of pertinent modifying factors, inclusive of geological, environmental, regulatory and legal factors, in converting a portion of the mineral resources to mineral reserves. A cutoff grade of 0.50% Li2O based on metallurgical using dense medium separation processing was used in creation of the block model. An open pit mining method was selected due to the depth of the ore body. No other mining method was evaluated as part of the mineral reserves estimation. Mine design parameters include a weathered zone berm width of 29 feet, weathered zone bench height of 32 feet with a bench face angle of 50 degrees. Mine design parameters in fresh rock include a maximum 66 foot bench height, berm widths of 26 feet, inter ramp angle of 60 degrees and bench face angle of 80 degrees. Overall pit wall slope angle ranges from 30 degrees in weathered material to 50.4 degrees in fresh rock. The single lane ramp width is 53 feet with the dual lane ramp measuring 82 feet with a maximum ramp grade of 10%. Mining ore losses have been estimated at 5%, and mine dilution of approximately 5%.
Process recovery for spodumene concentrate for pit optimization is based on 70% recovery for P1 pegmatites in fresh rock, 68% recovery for P1 pegmatites in transition materials, and 35% recovery for P2 pegmatites in all zones.
The following table details proven and probable reserves reflecting only those reserves attributable to our ownership or economic interest as of December 31, 2023, and have been prepared in accordance with S-K 1300.
|
|
|
|
|
|
|
|
|
|
|
|
|
|
|
| Ewoyaa Estimate of Mineral Reserves at Effective Date of June 16, 2023 based on a Spodumene Concentrate Price of $1,587/MT and Attributable to Piedmont’s Economic Interest |
Cut-Off Grade (% Li2O) |
0.50% |
Metallurgical Recovery Concentrator (%)(1) |
70% |
| Mineral Reserves Category |
Ore
(MT) |
Grade
(Li2O%)
|
Li2O
(metric tons)
|
LCE
(metric tons) |
| Proven |
— |
— |
— |
— |
| Probable |
2.30 |
1.22% |
28,109 |
69,513 |
|
|
|
|
|
(1) Metallurgical recovery of 70% was assumed in the pit optimization for P1 spodumene bearing pegmatites in fresh rock. Pit optimization assumes a 68% recovery for P1 pegmatites in transition material and 35% recovery for P2 pegmatite in all zones.
Newfoundland
Killick Lithium
Killick Lithium is an exploration stage project currently operated by Sokoman Minerals and Benton Resources that consists of 3,146 claims totaling approximately 234,748 acres, accessible by the Burgeo Highway in southwestern Newfoundland. See Figure 12 below.
Figure 12: Killick Lithium location, showing proximity to highway and grid power.
According to their data, Benton Resources and Sokoman Minerals completed 61 exploratory drill holes, 50 of which intersected spodumene-bearing pegmatites. Mineralization in surface trenching and drilling has been identified over a strike length of 1.5 miles. These early drilling results include multiple intercepts over 1.0% Li2O and demonstrate the potential for additional discoveries within the property. Their exploration work in 2023 identified numerous soil and geophysical anomalies, highlighting high-priority drill targets. The property features excellent infrastructure with close proximity to paved roadways, an electrical substation, and an ice-free, deepwater port.
Material Individual Properties
We categorize Carolina Lithium and NAL as material individual properties under S-K 1300.
Material Individual Property - Carolina Lithium
Overview
Carolina Lithium is a development stage project for the mining, development and production of lithium products. The property is located in a rural area of Gaston County, North Carolina, approximately 25 miles northwest of the City of Charlotte. The property is centered at approximately 35°23’20”N 81°17’20”W. The property currently has no known encumbrances. In addition to the information summarized below, you can learn more about Carolina Lithium by reading the technical report summary dated April 20, 2023, attached as Exhibit 96.1 and incorporated by reference to Exhibit 96.3 to the Company’s Annual Report on 10-K/A dated April 25, 2023.
Spodumene Concentrate Operation
The technical report summary for Carolina Lithium is based on a mine life of 11 years of mineral reserves, with an estimated average annual production of 242,000 metric tons of spodumene concentrate at steady-state operation.
We believe there is significant opportunity to increase the mineral reserve life of Carolina Lithium beyond 11 years by conversion of existing mineral resources to mineral reserves or by discovery of additional resources within the Carolina Tin-Spodumene Belt within a reasonable trucking or conveying distance to the proposed spodumene concentrator.
Lithium Hydroxide Conversion Operation
The technical report summary for Carolina Lithium assumes a lithium hydroxide conversion plant, also referred to as a chemical plant, that will be supported with spodumene concentrate produced from our mineral reserves. The lithium hydroxide chemical plant has an estimated production rate of 30,000 metric tons of lithium hydroxide per year.
Our business plan is, upon depletion of our mineral reserves, to continue lithium hydroxide production at Carolina Lithium using spodumene concentrate sourced from offtake agreements, which will allow us to secure spodumene concentrate from alternate sources or from our own mineral reserves if our estimation of mineral reserves was increased in the future.
Operating and Capital Costs
According to the technical report summary results, our integrated Carolina Lithium project is projected to have an average cash operating cost of approximately $4,844 per metric ton of lithium hydroxide at steady state during the first 10 years of operations, including royalties and exclusive of any byproduct credits, thereby potentially positioning Piedmont Lithium as one of the industry’s lowest-cost producers. The technical report summary estimates, in accordance with the Association the Advancement of Cost Engineering class 3 level of detail, total capital costs of approximately $1 billion for the construction of the fully integrated Carolina Lithium project, inclusive of potential recovery of byproduct mineral resources.
Ownership and Location
We hold a 100% interest in Carolina Lithium which is located approximately 25 miles northwest of Charlotte, North Carolina in the U.S.
History
Carolina Lithium lies within the Carolina Tin-Spodumene Belt. Mining in the belt began in the 1950s with the Kings Mountain Mine, currently owned by Albemarle Corporation, and the Hallman-Beam Mine near Bessemer City, North Carolina, which is currently owned by Martin Marietta Corporation. Both former mines are located within approximately 12 miles of Carolina Lithium to the south, near Bessemer City, North Carolina, and Kings Mountain, North Carolina, respectively. Portions of the project area were explored and excavated to shallow depths in the 1950s as the Murphy-Houser Mine, owned by the Lithium Corporation of America. In 2009, Vancouver based North Arrow Minerals Inc. commenced exploration at the property. In 2016, we began optioning surface and mineral rights at the property and subsequently commenced a renewed exploration effort at the site.
Present Condition, Work Completed, and Exploration Plans
General access to Carolina Lithium is via a network of primary and secondary roads. Interstate highway I‑85 lies 6 miles to the south of the project area and provides easy access to Charlotte Douglas International Airport, which is approximately 19 miles to the east. A rail line borders the property to the northwest. Transport links provide access to Charlotte, which is the largest city based on size and population in North Carolina, within approximately 25 miles from Carolina Lithium. Extensive exploration supports our resource estimate and is comprised of surface mapping and extensive subsurface drilling. Between 2017 and 2021, we completed five phases of exploratory drilling which included a total of 542 core holes amounting to approximately 50 miles to define the Core property deposit. The exploration of Carolina Lithium has been performed by professional geologists in adherence to established operating procedures that have been verified by the qualified person. Through the date of this report, exploration has been concentrated on the Core, Central, and Huffstetler deposit areas detailed in Figure 13 below.
Properties
Figure 13
As of December 31, 2023, Carolina Lithium, was comprised of real property and associated mineral rights totaling approximately 3,706 acres, of which approximately:
•225 parcels consisting of 2,928 acres are owned with a book value of $80.0 million;
•1 parcel consisting of 113 acres is subject to long-term leases with a book value of $0.2 million; and
•65 parcels consisting of 665 acres are subject to exclusive option agreements with a book value of $1.3 million. These exclusive option agreements, upon exercise, allow us to purchase or, in some cases, enter into long-term lease agreements for the real property and associated mineral rights. Our option agreements provide for annual option payments, bonus payments during periods when we conduct drilling, and royalty payments during periods when we conduct mining. Our option agreements generally provide us with an option to purchase the optioned property at a specified premium over fair market value. Upon exercise of our purchase option, our obligation to make annual option payments and bonus payments terminates.
We generally control all the surface and mineral rights for Carolina Lithium under applicable agreements. We also own real property totaling 5 acres in Bessemer City, North Carolina, where we lease a warehouse for core samples from Carolina Lithium, and 61 acres in Kings Mountain, North Carolina, where we hold a synthetic minor air permit, and which was the subject of prior technical studies for a planned lithium hydroxide conversion facility.
Figure 14
Mineral Reserves
As of December 31, 2023, we have reported no proven mineral reserves and 18.3 million metric tons of probable mineral reserves at a grade of 1.10% Li2O. We issued our first mineral resource estimate on October 21, 2021, and have not finalized any new estimates. The proven and probable reserve figures presented herein are estimates based on information available at the time of calculation.
A technical report summary with respect to our estimated mineral reserves was filed as an exhibit to our Transition Report on Form 10-KT for the six-month period ending December 31, 2021. This technical report summary was amended to include certain information as required by S-K 1300. The amended technical report study dated April 20, 2023, attached as Exhibit 96.1 for the period ending December 31, 2022. We publish reserves annually and will recalculate reserves if any new significant changes are expected, taking into account metal prices, changes, if any, to future production and capital costs, divestments and depletion as well as any acquisitions and additions during the period.
Probable mineral reserves have been estimated and based on the consideration of pertinent modifying factors, inclusive of geological, environmental, regulatory and legal factors, in converting a portion of the mineral resources to mineral reserves. All converted mineral resources were classified as probable mineral reserves. There were no measured mineral resources defined that could be converted into proven mineral reserves, and no inferred mineral resources were included in the estimation of mineral reserves. A cutoff grade of 0.4% Li2O was used in creation of the block model. An open pit mining method was selected due to the ore body outcropping in several places along the surface. No other mining method was evaluated as part of the mineral reserves estimation. Mine design parameters include overburden batter angle in unconsolidated material of 27 degrees, face batter angle of 75 degrees, inter-ramp slope of 57 degrees, overall slope of 51 degrees, berm width of 31 feet, berm height working 39 feet, berm height final wall of 78 feet, ramp width of 98 feet, ramp grade of 10%, mine dilution of 10%, process recovery for spodumene concentrate of 77%, and minimum mining width of 164 feet.
Operating costs were established using budget pricing from mining contractors based on a request for proposal issued by our third-party consultant, Marshall Miller and Associates, combined with first principles estimates for utilities including electrical service from Duke Energy. Royalties of $1.00 per run-of-mine metric ton are based on the average land option agreement.
Mineral reserves include tonnage estimates for Li2O and LCE, whereby one metric ton of Li2O is equivalent to 2.473 metric tons of LCE.
The following table details proven and probable reserves reflecting only those reserves attributable to our ownership or economic interest as of December 31, 2023, and have been prepared in accordance with S-K 1300.
|
|
|
|
|
|
|
|
|
|
|
|
|
|
|
|
|
|
|
|
|
| Carolina Lithium – Estimate of Mineral Reserves (undiluted) |
|
| Mineral Reserves Category |
Ore
(MT)(1)
|
Grade
(Li2O%)
|
Li2O
(metric tons)
|
LCE
(metric tons) |
Cut-Off Grade
(% Li2O)
|
Metallurgical Recovery Concentrator (%)(2) |
| Proven |
- |
- |
- |
- |
0.4 |
77 |
| Probable |
18.26 |
1.10 |
200,000 |
495,000 |
|
|
|
|
|
|
|
(1) Reserves are expressed as tonnages effectively delivered to a run-of-mine pad, prior to the application of losses and recovery factors (i.e., metallurgical recovery as expressed above) incurred during concentration and conversion. Pricing to support mineral reserve economics is based upon the sale of lithium hydroxide, after the processing of run-of-mine reserves in the Company’s planned spodumene concentrator and lithium hydroxide conversion facilities. Mineral reserves estimated exclusive of the mineral resources.
(2) Metallurgical recovery of 77-percent for lithium ore is associated with the production of a 6-percent spodumene concentrate.
Mineral Resources
As of December 31, 2023, we have reported 25.89 million metric tons of mineral resources, exclusive of mineral reserves, at a grade of 1.06% Li2O.
The resource figures presented herein do not include that part of our resources that have been converted to proven and probable reserves as shown above, as they are reported exclusive of reserves, and have been estimated based on information available at the time of calculation. Key assumptions and parameters relating to the mineral reserves and resources are discussed in Sections 1.9 and 1.10 of the Carolina Lithium project amended technical report summary attached as Exhibit 96.1.
Resource models are constrained by a conceptual pit shell derived from a Whittle optimization using estimated block value and mining parameters appropriate for determining reasonable prospects of economic extraction. These parameters include maximum pit slope of 51° and strip ratio of 12, mining cost of US$2.50/per ton, spodumene concentration cost of US$25/per ton, a commodity value of US$1,893/per ton of SC6 and with appropriate recovery and dilution factors.
The following table details indicated and inferred resources which have been prepared in accordance with S-K 1300 and are solely attributable to our ownership or economic interest as of December 31, 2023.
|
|
|
|
|
|
|
|
|
|
|
|
|
|
|
|
|
|
|
|
|
|
|
|
|
|
|
|
|
|
|
|
|
| Carolina Lithium – Summary of Mineral Resources Estimate Exclusive of Mineral Reserves |
|
Li2O% |
Quartz |
Feldspar |
Mica |
Cut-Off Grade (% Li2O)(1) |
0.4 |
0.4 |
0.4 |
0.4 |
Metallurgical Recovery (%) |
77(2) |
50.8 |
51.1 |
35.5 |
| Category |
Deposit |
MT(3) |
Grade (%) |
MT(3) |
Grade
(%) |
MT(3) |
Grade
(Li2O%)
|
MT(3) |
Grade
(%) |
MT(3) |
| Indicated |
All properties |
9.96 |
1.14 |
0.112 |
29.42 |
2.93 |
45.96 |
4.58 |
3.96 |
0.39 |
| Inferred |
All properties |
15.93 |
1.02 |
0.162 |
29.22 |
4.66 |
45.67 |
7.28 |
4.03 |
0.64 |
|
|
|
|
|
|
|
|
|
|
(1) Based on long-term pricing of $1,893/per ton of SC6, $101/per ton of quartz, $54/per ton of feldspar, and $80/per ton of mica. Byproduct mineral resources are estimated only from the spodumene bearing pegmatites which comprise the mineral resource estimate. The Carolina Lithium project does not have byproduct mineral reserves.
(2) The overall metallurgical recovery from spodumene concentration.
(3) Mineral resources estimated exclusive of the mineral reserve.
Comparison of Resources and Reserves as of December 31, 2023 and 2022
No mineral resource estimates and no mining operations at Carolina Lithium were conducted during the current reporting period. As a result, we are not providing an analysis of changes in mineral resources and mineral reserves for those periods.
Material Individual Property - NAL
Overview
NAL is comprised of 19 contiguous claims covering 1,438 acres and one mining lease covering approximately 1,729 acres. NAL is situated in La Corne township in Quebec’s Abitibi region. The project is located approximately 20 miles from Authier near Val-d’Or, a major mining city in Quebec.
NAL is a brownfield open pit mining operation with a concentrator and a carbonate plant and was acquired by Sayona Quebec in August 2021. Prior to acquisition by Sayona Quebec, more than CAD $400 million was invested in NAL. NAL receives most of its power from hydroelectricity and is well serviced by provincial highways and an all-weather secondary road. Production restarted in March of 2023 and the inaugural shipment of spodumene concentrate occurred in August 2023.
The 2023 drill campaign at NAL identified new, high-grade mineralized zones along the northwest margin of the NAL deposit, beyond the current NAL pit operations and the planned pit shell model. Additionally, mineralization from inside the pit shell model shows continuity and consistency in grade and thickness, providing the potential for mineral resource conversion within the pit shell model as well as definition below the existing pit. As of December 31, 2023, a total of 172 diamond drill holes measuring a total depth of approximately 28 miles were completed at NAL.
Mineral Reserves
As of December 31, 2023, we have reported 0.11 million metric tons of proven mineral reserves at a grade of 1.43% Li2O and 6.88 million metric tons of probable mineral reserves at a grade of 1.08% Li2O.
A technical report summary with respect to our estimated mineral reserves at NAL was filed as an exhibit to this Form 10-K as Exhibit 96.3. We publish reserves annually and will recalculate reserves if any new significant changes are expected, taking into account metal prices, changes, if any, to future production and capital costs, divestments and depletion as well as any acquisitions and additions during the period.
Proven and probable mineral reserves have been estimated and based on the consideration of pertinent modifying factors, inclusive of geological, environmental, regulatory and legal factors, in converting a portion of the mineral resources to mineral reserves. A diluted cutoff grade of 0.60% Li2O based inclusive of 16% life of mine dilution was used to establish the run-of-mine feed. An open pit mining method was selected due to the depth of the ore body. While underground mining alternatives have been evaluated in prior studies no measured or indicated mineral resources exist at a depth where underground mining is considered the most viable alternative, therefore the mineral reserves have been estimated on the basis of open pit mining only. Mine design parameters include a weathered zone berm width of 30 feet with a bench face angle of 26.6 degrees. Mine design parameters in fresh rock include a maximum 66 foot bench height, bench widths of 33 - 53 feet, inter ramp angles between 45.7 and 52.6 degrees and a bench face angle of 60 to 80 degrees. The overall single lane ramp width is 67 feet with the dual lane ramp measuring 92 feet with a maximum ramp grade of 10% for permanent roads and 12% for temporary roads. Mining ore losses have been estimated at 3%, and mine dilution of approximately 16%.
Mineral reserves include tonnage estimates for Li2O, and LCE, whereby one metric ton of Li2O is equivalent to 2.473 metric tons of LCE.
The following table details proven and probable reserves reflecting only those reserves attributable to our ownership or economic interest as of December 31, 2023, and have been prepared in accordance with S-K 1300.
|
|
|
|
|
|
|
|
|
|
|
|
|
|
|
| North American Lithium Estimate of Mineral Reserves at Effective Date of December 31, 2023 based on a Spodumene Concentrate Price of $1,352/MT and Attributable to Piedmont’s Economic Interest |
Cut-Off Grade (% Li2O)(1) |
0.60% |
Metallurgical Recovery Concentrator (%)(2) |
73.6% |
| Mineral Reserves Category |
Ore
(MT)(3)
|
Grade
(Li2O%)
|
Li2O
(metric tons)
|
LCE
(metric tons) |
| Proven |
0.10 |
1.40% |
1,428 |
3,531 |
| Probable |
6.87 |
1.08% |
74,490 |
184,213 |
|
|
|
|
|
(1) Reserves are expressed as tonnages effectively delivered to a run-of-mine pad, prior to the application of losses and recovery factors (i.e., metallurgical recovery as expressed above) incurred during concentration. A dilution factor of 16% is included in the ore tons delivered to the run-of-mine pad.
(2) Pricing to support mineral reserve economics is based upon the sale of spodumene concentrate at an average grade of 5.4% Li2O until 2027 after which the concentration grade is increased to 5.82%. Mineral reserves estimated exclusive of the mineral resources.
(3) The overall metallurgical recovery from spodumene concentrate.
Mineral Resources
As of December 31, 2023, we have reported 13.69 million metric tons of mineral resources at NAL, exclusive of mineral reserves, at a grade of 1.21% Li2O.
The resource figures presented herein do not include that part of our resources that have been converted to proven and probable reserves as shown above, as they are reported exclusive of reserves, and have been estimated based on information available at the time of calculation. Key assumptions and parameters relating to the mineral reserves and resources are discussed in Sections 1.7 and 1.8 of the North American Lithium project technical report summary filed as Exhibit 96.3 in this Form 10-K.
Resource models are constrained by a conceptual pit shell derived from a Whittle optimization using estimated block value and mining parameters appropriate for determining reasonable prospects of economic extraction. These parameters include: a constraining pit shell slope between 46 to 53 degrees, a concentrate selling price of $1,273 per metric ton for 5.4% Li2O product, mining costs of $5.12/ton mined, recovery of 73.6%, spodumene concentration cost of $23.44/ton, general and administrative expense of $6.00/ton processed, transportation costs of $118.39/ton concentrate, tailings management costs of $2.86/ton processed, and water treatment expenses of $0.18/ton processed with appropriate recovery and dilution factors.
The following table details indicated and inferred resources which have been prepared in accordance with S-K 1300 and are solely attributable to our ownership or economic interest as of December 31, 2023.
|
|
|
|
|
|
|
|
|
|
|
|
|
|
|
| North American Lithium Estimate of Mineral Resources at Effective Date of December 31, 2022 based on a Spodumene Concentrate Price of $1,273/MT and Attributable to Piedmont’s Economic Interest |
Cut-Off Grade (% Li2O) |
0.60% |
| Metallurgical Recovery Concentrator (%) |
73.6% |
| Mineral Reserves Category |
Ore
(MT) |
Grade
(Li2O%)
|
Li2O
(metric tons)
|
LCE
(metric tons) |
| Measured |
0.24 |
1.00% |
2,434 |
6,020 |
| Indicated |
2.22 |
1.15% |
25,695 |
63,545 |
| Measured + Indicated |
2.47 |
1.14% |
28,129 |
69,564 |
| Inferred |
11.22 |
1.23% |
138,006 |
341,289 |
|
|
|
|
|
Comparison of Resources and Reserves as of December 31, 2023 and 2022.
We did not previously disclose mineral resources estimates or mineral reserves estimates at NAL in a filing with the Commission. As a result, we are not providing an analysis of changes in estimates for mineral resources and mineral reserves for those periods.
Internal Controls
We have internal controls for reviewing and documenting the information supporting the mineral reserve and mineral resource estimates, describing the methods used, and ensuring the validity of the estimates. These internal control processes were not materially impacted by the adoption of S-K 1300. Information that is utilized to compile mineral reserves and mineral resources is prepared and certified by appropriate QPs and is subject to our internal review process, which includes review by a QP. The QP and management agree on the reasonableness of the criteria for the purposes of estimating resources and reserves. Calculations using these criteria are reviewed and validated by the QP. We recognize the risks inherent in mineral resource and reserve estimates, such as the geological complexity, interpretation and extrapolation of data, changes in operating approach, macroeconomic conditions and new data, among others. Overestimated resources and reserves resulting from these risks could have a material effect on future profitability.
Item 3. LEGAL PROCEEDINGS.
Information regarding legal proceedings is contained in Note 15—Commitments and Contingencies of the consolidated financial statements contained in this Annual Report and is incorporated herein by reference.
Item 4. MINE SAFETY DISCLOSURES.
Not applicable because we do not currently operate any mines subject to the U.S. Federal Mine Safety and Health Act of 1977.
Part II
Item 5. MARKET FOR REGISTRANT’S COMMON EQUITY, RELATED STOCKHOLDER MATTERS AND ISSUER PURCHASES OF EQUITY SECURITIES.
Market Information
Our common stock is traded on the Nasdaq under the symbol “PLL,” and our CDIs are listed on the ASX also under the symbol “PLL.”
Based on information known to us, as of February 23, 2024, we had outstanding 19,360,939 shares of our common. Of such shares 3,787,325 were held in Australia in the form of CDIs.
Holders of Record
As of February 23, 2024, there were 11 registered holders of record of our U.S. common stock. The actual number of stockholders is greater than this number of record holders and includes stockholders who are beneficial owners having shares that are held in street name by brokers and other nominees. This number of holders of record does not include stockholders whose shares may be held in trust by other entities.
Stock Performance Graph
The following graph depicts the total return to shareholders of PLL for the last three years to the performance of the Russell 2000 (“RUT-RUX”) and the Global X Lithium & Battery Tech ETF (“LIT”). The graph assumes an investment of $100 in our common stock and each index on December 31, 2020. The stock performance shown in the graph is not necessarily indicative of future price performance.
Equity Compensation Plans
See Part III, Item 12, “Security Ownership of Certain Beneficial Owners and Management and Related Shareholder Matters” for the information required in this Item 5 regarding equity compensation plans.
We issued 62,638 shares of common stock on November 20, 2023 as earn-in payments under our earn-in agreement with Vinland Lithium. The shares were issued pursuant to the exemption provided by Section 4(a)(2) of the Securities Act.
Dividends
We have not declared any dividends during the years ended December 31, 2023 or 2022, the six months ended December 31, 2021, or year ended June 30, 2021 and we do not anticipate that we will do so in the foreseeable future. We currently intend to retain future earnings, if any, to finance the development of our business. Dividends, if any, on outstanding shares of our common stock will be declared by and subject to the discretion of the Board on the basis of our earnings, financial requirements, and other relevant factors.
Equity Repurchases
We did not repurchase any of our equity securities during the three months ended December 31, 2023.
Item 6. [Reserved].
Not applicable.
Item 7. MANAGEMENT'S DISCUSSION AND ANALYSIS OF FINANCIAL CONDITION AND RESULTS OF OPERATIONS.
The following discussion and analysis of our financial condition and results of operations should be read in conjunction with our financial statements and related notes included elsewhere in our Annual Report. The following discussion contains forward-looking statements that reflect our plans, estimates, and beliefs. Our actual results could differ materially from those discussed in the forward-looking statements. Factors that could cause or contribute to these differences include those discussed below and elsewhere in our Annual Report particularly those in the sections entitled “Risk Factors,” “Cautionary Note Regarding Forward-Looking Statements,” and “Cautionary Note Regarding Disclosure of Mineral Properties.”
This management’s discussion and analysis is a supplement to our financial statements, including notes, referenced elsewhere in our Annual Report and is provided to enhance your understanding of our operations and financial condition. This discussion contains estimates and, due to rounding, may not sum or calculate precisely to the totals and percentages provided in the tables.
Cautionary Note to Investors
In the U.S., we are governed by the Exchange Act, including Regulation S-K 1300 thereunder. Sayona Mining and Atlantic Lithium, however, are not governed by the Exchange Act and from time-to-time report estimates of “measured,” “indicated,” and “inferred” mineral resources as such terms are used in the JORC Code. In March 2022, our partner, Atlantic Lithium, published a JORC Code mineral resource estimate update for Ewoyaa. Also in March 2022, our partner, Sayona Mining, published a JORC Code mineral resource estimate update for Authier and NAL. Although S-K 1300 and the JORC Code have similar goals in terms of conveying an appropriate level of confidence in the disclosures being reported, they at times embody different approaches or definitions. In February 2024, we commissioned S-K 1300-compliant technical report summaries for NAL, Authier and Ewoyaa. Those technical report summaries are attached as exhibits to this Annual Report. Consequently, investors are cautioned that public disclosures of measures prepared in accordance with the JORC Code may not be comparable to similar information made public by companies subject to S-K 1300 and the other reporting and disclosure requirements under the U.S. federal securities laws and the rules and regulations thereunder.
Executive Overview & Strategy
We are a U.S.-based development-stage company aiming to become one of the leading producers of lithium hydroxide in North America. As the world, the American government, and industries mobilize to support global decarbonization through the electrification of transportation, we are poised to become a critical contributor to the U.S. electric vehicle and battery manufacturing supply chains.
Since 2021, electric vehicle and battery companies have announced significant commitments to build new or expanded manufacturing operations across the U.S., which is expected to exponentially and rapidly drive the domestic demand for lithium over the next decade, far beyond current or projected capacity. Piedmont Lithium, as a U.S.-based company, is well positioned to benefit from federal policies and funding established to facilitate the expedited development of a robust domestic supply chain and clean energy economy, while strengthening national and global energy security. While manufacturing facilities for electric vehicles, batteries, and related components are typically constructed in two to three years, the development of lithium resources from exploration to production requires a much longer time frame.
We believe this prolonged time frame for resource development poses the greatest challenge to the emerging electrification industry and represents increased opportunity for lithium producers.
To support growing U.S. lithium demand, we have spent the past seven years developing a portfolio that now includes four key projects: wholly-owned Carolina Lithium and Tennessee Lithium, and strategic investments in Quebec, Canada, with Sayona Quebec’s NAL, and in Ghana with Atlantic Lithium’s Ewoyaa. NAL began supplying spodumene concentrate to the market in the third quarter of 2023. A final investment decision for Ewoyaa is anticipated in 2025. Carolina Lithium is being developed as a fully integrated spodumene ore-to-lithium hydroxide project designed to produce 30,000 metric tons of lithium hydroxide annually. We expect spodumene concentrate from Ewoyaa will serve as the primary feedstock for Tennessee Lithium. Tennessee Lithium is being designed to produce 30,000 metric tons of lithium hydroxide annually.
We currently plan to produce an estimated 60,000 metric tons per year of domestic lithium hydroxide, which would be significantly accretive to today’s total estimated U.S. annual production capacity of just 20,000 metric tons per year. Our lithium hydroxide capacity and revenue generation are expected to be supported by production of, or offtake rights to, approximately 525,000 dmt of spodumene concentrate annually.
Our projects and strategic investments are being developed on a measured timeline to provide the potential for near-term cash flow and long-term value maximization as we explore opportunities to grow our hard rock lithium base through other investments. The development timelines are subject to permitting, regulatory approvals, funding, successful project execution, and market dynamics. We also continue to evaluate opportunities to further expand our resource base and production capacity.
As we continue to advance our goal of becoming one of the leading manufacturers of lithium products in North America, we expect to capitalize on our competitive strengths, including our life-of-mine offtake agreement with Sayona Quebec, scale and diversification of lithium resources, advantageous locations of projects and assets, access to a variety of funding options, opportunities to leverage our greenfield projects, and a highly experienced management team. Advancements that have been made toward this effort are highlighted below.
Highlights of Corporate and Project Advancements
Piedmont Lithium
We continue to engage in activities to strengthen our financial position and business strategy, including support for the development and expansion of our portfolio of projects, strategic investments, and corporate operations.
Recent highlights include:
•During the first quarter of 2024, we sold approximately 1,249.8 million shares of Sayona Mining for an average of $0.03 per share. The shares sold represented approximately 12% of Sayona Mining’s outstanding shares and resulted in approximately $41.4 million in net proceeds. The sale of these shares has no impact on Piedmont Lithium’s joint venture or offtake rights with Sayona Quebec.
•During the first quarter 2024 and through the date of this filing, we sold approximately 24.5 million shares of Atlantic Lithium for an average of $0.32 per share. The shares sold represented approximately 4% of Atlantic Lithium’s outstanding shares and resulted in approximately $7.8 million in net proceeds. We retained approximately 32.5 million shares, representing approximately 5% ownership in Atlantic Lithium. In connection with the sale of these shares, we no longer hold a board seat with Atlantic Lithium. Our reduced ownership in Atlantic Lithium has no impact on our earn-in or offtake rights with Atlantic Lithium and the Ewoyaa project.
•In October 2023, we paid $1.5 million for a 19.9% equity interest in Vinland Lithium, which is a Canadian-based entity jointly owned with Sokoman Minerals and Benton Resources. Vinland Lithium currently owns the Killick Lithium Project, a large exploration property prospective for lithium located in southern Newfoundland, Canada. We have entered into an earn-in agreement with Vinland Lithium to acquire up to a 62.5% equity interest in Killick Lithium through staged-investments. As part of our investment, we entered into a marketing agreement with Killick Lithium for 100% marketing rights and right of first refusal to purchase 100% of all lithium products produced by Killick Lithium on a life-of-mine basis at competitive commercial rates.
•In February 2023, we received $75 million from LG Chem as part of their strategic investment in Piedmont Lithium. In exchange, LG Chem received 1,096,535 newly issued shares of Piedmont Lithium’s common stock at an approximate price of $68.40 share. Upon closing, LG Chem owned approximately 5.7% of Piedmont Lithium’s common shares.
Lithium Projects
Quebec
As of December 31, 2023, we owned equity interests of approximately 12% and 25% in Sayona Mining and Sayona Quebec, respectively. Sayona Mining owns the remaining 75% equity interest in Sayona Quebec. Sayona Quebec owns a portfolio of projects, which includes NAL, Authier, and Tansim. We hold a life-of-mine offtake agreement with Sayona Quebec for the greater of 113,000 dmt or 50% of spodumene concentrate production per year. Our purchases of spodumene concentrate are subject to a price floor of $500 per dmt and a price ceiling of $900 per dmt for 6.0% Li2O spodumene concentrate on a DAP North Carolina basis.
Recent highlights include:
•During the year ended December 31, 2023, NAL produced approximately 98,800 dmt of spodumene concentrate and shipped 72,100 dmt, of which 43,200 dmt were sold to Piedmont Lithium. We, in turn, generated $39.8 million of sales on those 43,200 dmt, with a realized sales price of $920 per dmt and a realized cost of sales of $789 per dmt, resulting in a gross profit margin of 14.3%.
•Ramp up continues on target at NAL, with 34,200 dmt of spodumene concentrate production in the fourth quarter of 2023 at an average grade of 5.5% Li2O, representing a 9% increase in production from the prior quarter. Operations achieved records in concentrate production (13,900 dmt), mill availability (80%), and global lithium recovery (66%) in December 2023.
•Cash operating costs at NAL are expected to improve upon completion of important capital projects expected in mid-2024. In particular, completion of the crushed-ore dome is expected to enable the operation to achieve full production rates and result in meaningfully lower unit production costs. Furthermore, mining costs are currently elevated with activity focused in the area of pre-existing underground mine works dating from the 1950s. Unit mining costs are expected to improve once operations have moved past the old mining works.
•Inclement weather and port congestion resulted in the delay of one of Piedmont Lithium’s planned 2023 shipments. The delay resulted in Piedmont Lithium shipping 14,200 dmt of spodumene concentrate in the fourth quarter of 2023 and 13,100 dmt shipping in mid-January 2024. We expect to begin deliveries under our long-term contracts in 2024 and reduce reliance on volatile spot market sales.
•In November 2023, Sayona released initial drill results from the 2023 drill campaign at NAL, identifying multiple thick, high-grade, spodumene-bearing pegmatites. Results of in-pit drilling indicate potential for further mineral resource conversion. Additional assay results are pending.
•In October 2023, Sayona Mining provided a forecast for the one-year period July 1, 2023, through June 30, 2024, projecting production of 140,000 to 160,000 dmt of spodumene concentrate and shipments of 160,000 to 180,000 dmt of spodumene concentrate at NAL. This production target assumes the NAL process plant reaches full production levels by the second quarter of 2024.
Ghana
As of December 31, 2023, we owned an equity interest of approximately 9% in Atlantic Lithium, and we have a right to acquire 50% equity interest in Atlantic Lithium Ghana, which includes Atlantic’s flagship Ewoyaa Lithium project located approximately 70 miles from the Port of Takoradi in Ghana, West Africa. We hold an offtake agreement with Atlantic Lithium for 50% of annual production of spodumene concentrate at market prices on a life-of-mine basis from Ewoyaa. As part of our strategy, we expect to transport our 50% offtake of spodumene concentrate from Ewoyaa to the U.S. to serve as the primary feedstock for lithium hydroxide conversion at Tennessee Lithium.
Recent highlights include:
•In January 2024, MIIF, Ghana’s sovereign wealth fund, commenced its funding of Atlantic Lithium with a $5 million subscription of Atlantic Lithium’s common stock. The funding is part of MIIF’s non-binding agreement with Atlantic Lithium to invest an additional $27.9 million to acquire a 6% equity interest in Ewoyaa, with the investment earmarked for Ewoyaa’s project development costs, and to fund 6% of all future exploration and development costs within Atlantic Lithium’s Ghanaian portfolio. MIIF’s investment in Ewoyaa is expected to equally reduce Piedmont Lithium and Atlantic Lithium’s funding requirements for Ewoyaa. If MIIF’s agreement is executed, and should Piedmont Lithium acquire a 50% equity interest in Atlantic Lithium Ghana, Atlantic Lithium Ghana will hold an 81% interest in the Ewoyaa project net of the interests which will be held by the Ghanaian government, resulting in an effective ownership interest of 40.5% in Ewoyaa, by Piedmont Lithium. Piedmont Lithium would continue to maintain a 50% life-of-mine offtake right to future spodumene concentrate production from Atlantic Lithium Ghana under these agreements.
•In October 2023, Ghana’s Ministry of Lands and Natural Resources granted a mining lease for Ewoyaa, subject to ratification by the Ghanaian Parliament. The mining lease includes a 13% free-carried interest in Ewoyaa for the Government of Ghana, and a 10% royalty.
•In August 2023, we exercised our option to acquire a 22.5% equity interest in Atlantic Lithium Ghana, subject to government approvals, as part of an earn-in agreement to acquire a 50% equity interest in Atlantic Lithium Ghana, excluding the MIIF investment and the government’s free-carried interest. Additionally, we have committed to fund the first $70.0 million of capital expenditures for the development of Ewoyaa, which will allow us to earn the remaining 27.5% equity interest in Atlantic Lithium Ghana. Additional capital costs for development will be shared equally with Atlantic Lithium. As of December 31, 2023, we have not received any shares in Atlantic Lithium Ghana.
Carolina Lithium
Carolina Lithium is located in the historic Carolina Tin-Spodumene Belt and is being designed as a fully integrated project with mining, spodumene concentrate production, and lithium hydroxide manufacturing on a single site in Gaston County, North Carolina. At full production, Carolina Lithium is expected to produce 30,000 metric tons per year of lithium hydroxide.
We are currently engaged in permitting activities with state and local agencies for Carolina Lithium. In August 2021, we submitted a mining permit application to the NCDEQ’s DEMLR. Since our submission, we have responded to a series of additional information requests made by DEMLR. On February 9, 2024, DEMLR issued their fourth Additional Information Request. We have 180 days in which to this most recent information request. We estimate that we will submit our response by the end of the first quarter of 2024. Our goal is to obtain all necessary material permits in 2024. If we receive a state mining permit, we expect to proceed with rezoning activities and anticipate construction will commence upon receipt of all required permits and local approvals and the completion of rezoning and project financing activities.
Tennessee Lithium
Tennessee Lithium is a proposed merchant lithium hydroxide manufacturing plant in America’s emerging “Battery Belt” and is expected to add 30,000 metric tons per year of lithium hydroxide production capacity to the U.S. supply chain. We expect the plant to be one of the most sustainable lithium hydroxide operations in the world and will utilize the Metso:Outotec Pressure Leaching Technology. Use of this technology is expected to reduce solid waste, create fewer emissions, and improve capital and operating costs relative to incumbent technologies.
Recent highlights include:
•In October 2023, we purchased a 132-acre disposal facility adjacent to the proposed Tennessee Lithium plant site for the placement of inert tailings produced as part of the innovative alkaline pressure leach process. In addition, we agreed to acquire a large industrial complex in close proximity to the proposed Tennessee Lithium plant site. These two acquisitions are expected to result in significant net economic benefits to the project.
•During the third quarter 2023, we engaged advisors to support our funding strategy for the construction of Tennessee Lithium. In consultation with the DOE, we have decided to pursue an ATVM loan under the DOE’s Loan Programs Office, rather than complete the previously announced $141.7 million grant under the Bipartisan Infrastructure Law. We expect that the ATVM loan, if awarded, would cover a significantly larger share of the capital required for the project, strengthening the opportunity for strategic parties to partner with us on the project.
•In July 2023, we received our Conditional Major Non-Title V Construction and Operating Air Permit for Tennessee Lithium from TDEC. With the receipt of the Air Permit for the planned 30,000 metric ton per year lithium hydroxide manufacturing plant, we now hold all the material permits required to begin construction at Tennessee Lithium.
Market Outlook
The demand for electric vehicles continues to grow as many jurisdictions around the world have legislated to shifting new car fleets away from internal combustion engines and toward electric vehicles. These electric vehicles will use batteries, nearly all of which are expected to be lithium-based batteries. Our strategy is to develop resources and processing capabilities that support the opportunity to meet the demands of our customers across the electric vehicle supply chain. Car manufacturers have committed significant capital investments totaling more than $1 trillion across the electric vehicle supply chain to electrify their fleets by 2030. Many of the major car manufacturers have plans to build facilities in the U.S. to produce both lithium-ion batteries and electric vehicles that will require a supply of lithium products.
Lithium products are expected to be in a supply deficit in the coming years due to the projected adaption to electric vehicles as presented in the graph below:
__________________________
Source: Benchmark Mineral Intelligence Q4 Forecast - January 2024.
The outlook for global sales of new electric vehicles (units in millions) and the global penetration rate of new electric vehicles sold compared to total new vehicles sold are presented in the table below:
|
|
|
|
|
|
|
|
|
|
|
|
|
|
|
|
|
|
|
|
|
|
|
|
|
|
|
|
|
|
|
|
|
|
|
|
|
|
|
|
|
|
|
|
|
|
|
|
|
|
|
|
|
|
|
|
|
|
|
|
|
|
|
|
|
2024 |
|
2025 |
|
2026 |
|
2027 |
|
2028 |
|
2029 |
|
2030 |
|
2031 |
|
2032 |
|
2033 |
| Sales of new electric vehicles |
|
18.0 |
|
22.2 |
|
27.0 |
|
31.5 |
|
36.1 |
|
40.5 |
|
45.9 |
|
50.7 |
|
55.4 |
|
59.1 |
| Penetration rate |
|
22% |
|
25% |
|
29% |
|
33% |
|
36% |
|
40% |
|
43% |
|
47% |
|
50% |
|
53% |
__________________________
Source: Rho Motion Electric Vehicle Battery Outlook as of January 2024.
Note: Periods in the tables above are calendar year periods.
Components of our Results of Operations
Revenue
We recognize revenue from product sales at a point in time when performance obligations are satisfied under the terms of contracts with our customers. A performance obligation is deemed to be satisfied when control of the product is transferred to our customer, which is typically upon delivery to the shipping carrier. Where a contract contains more than one distinct performance obligation, the transaction price is allocated to each performance obligation based on the standalone selling price of each performance obligation, although these situations do not occur frequently and are generally not built into our contracts. Revenue is measured as the amount of consideration expected to be received in exchange for transferring the goods. In the case of variable consideration arrangements, we estimate variable consideration as the revenue to which we expect to be entitled. Initial pricing is typically billed 5 days to 30 days after the departure of the shipment and paid between 15 days to 75 days. Final adjustments to prices may take longer to resolve. When the final price has not been resolved by the end of a reporting period, we estimate the expected sales price based on the initial price, market pricing and known quality measurements. We warrant to our customers that our products conform to mutually agreed product specifications.
Exploration Costs
We incur costs in resource exploration, evaluation, and development during the different phases of our resource development projects. Exploration costs incurred before the declaration of proven and probable mineral reserves, which primarily include exploration, drilling, engineering, metallurgical testwork, site-specific reclamation, and compensation for employees associated with exploration activities, are expensed as incurred. After proven and probable mineral reserves are declared, exploration and mine development costs necessary to bring the property to commercial capacity or increase the capacity or useful life are capitalized.
Selling, General and Administrative Expenses
Selling, general and administrative expenses relate to overhead costs, such as employee compensation and benefits for corporate management and office staff including accounting, legal, human resources, and other support personnel, professional service fees, insurance, and costs associated with maintaining our corporate headquarters. Included in employee compensation costs are cash and stock-based compensation expenses.
Income (Loss) From Equity Method Investments
Income (loss) from equity method investments reflects our proportionate share of the net income (loss) resulting from our investments in Sayona Mining, Sayona Quebec, Vinland Lithium and Atlantic Lithium. These investments are recorded under the equity method and adjusted each period, on a one-quarter lag, for our share of each investee’s income (loss). If a decline in the value of an equity method investment is determined to be other than temporary, we record any related impairment as a component of share of earnings or losses of the equity method investee in the current period. Our equity method investments are an integral and integrated part of our ongoing operations. We have determined this justifies a more meaningful and transparent presentation of our proportional share of income in our equity method investments as a component of our income (loss) from operations.
Other Income
Other income consists of interest income, interest expense, foreign currency exchange gain (loss), and gain (loss) on dilution of equity method investments. Interest income consists of interest earned on our cash and cash equivalents. Interest expense consists of interest incurred on long-term debt related to noncash acquisitions of mining interests financed by sellers for Carolina Lithium as well as interest incurred for lease liabilities. Foreign currency exchange gain (loss) relates to our foreign bank accounts denominated in Canadian dollars and Australian dollars and marketable securities denominated in Australian dollars.
Gain (loss) on dilution of equity method investments relates to our reduction in ownership of Sayona Mining and Atlantic Lithium due to their issuance of additional shares through public offerings and employee stock compensation grants.
Results of Operations
Year Ended December 31, 2023 Compared to Year Ended December 31, 2022
|
|
|
|
|
|
|
|
|
|
|
|
|
|
|
|
|
|
|
|
|
|
|
|
|
Years Ended
December 31, |
|
|
|
|
| (in thousands) |
2023 |
|
2022 |
|
$ Change |
|
% Change |
| Revenue |
$ |
39,817 |
|
|
$ |
— |
|
|
$ |
39,817 |
|
|
* |
| Costs of sales |
34,138 |
|
|
— |
|
|
34,138 |
|
|
* |
| Gross profit |
5,679 |
|
|
— |
|
|
5,679 |
|
|
* |
| Gross profit margin |
14.3 |
% |
|
— |
% |
|
|
|
|
| Exploration costs |
1,929 |
|
|
1,939 |
|
|
(10) |
|
|
(0.5)% |
| Selling, general and administrative expenses |
43,319 |
|
|
29,449 |
|
|
13,870 |
|
|
47.1% |
| Total operating expenses |
45,248 |
|
|
31,388 |
|
|
13,860 |
|
|
44.2% |
| Income (loss) from equity method investments |
194 |
|
|
(8,352) |
|
|
8,546 |
|
|
(102.3)% |
| Loss from operations |
(39,375) |
|
|
(39,740) |
|
|
365 |
|
|
(0.9)% |
| Other income |
20,704 |
|
|
29,904 |
|
|
(9,200) |
|
|
(30.8)% |
| Income tax expense |
3,106 |
|
|
3,139 |
|
|
(33) |
|
|
(1.1)% |
| Net loss |
$ |
(21,777) |
|
|
$ |
(12,975) |
|
|
$ |
(8,802) |
|
|
67.8% |
__________________________
* Not meaningful.
Revenue
Revenue was $39.8 million in the year ended December 31, 2023 from the sale of 43,200 dmt of spodumene concentrate from our purchase offtake agreement with Sayona Quebec. We had no sales in the year ended December 31, 2022. The realized price per dmt was $920 for the year ended December 31, 2023. Realized price is the average estimated price, net of certain distribution and other fees, for approximate 5.5% Li2O grade, which considers referenced pricing data up to December 31, 2023 for sales that are subject to a final adjustment. The final adjusted price may be higher or lower than the average estimated realized price based future market price movements. We have estimated the final sales pricing based on expected market conditions and known quality measurements. Any adjustments to the sales price will be reflected in subsequent periods.
Gross Profit and Gross Profit Margin
Gross profit was $5.7 million and gross profit margin was 14.3%, in the year ended December 31, 2023. Gross profit and gross profit margin were driven by our offtake supply agreement with Sayona Quebec. Our realized cost of sales was $789 per dmt in the year ended December 31, 2023. Realized cost of sales is the average cost of sales including Piedmont Lithium’s offtake pricing agreement with Sayona Quebec for the purchase of spodumene concentrate at a market price subject to a floor of $500 per metric ton and a ceiling of $900 per metric ton, with adjustments for product grade, freight, and insurance.
Exploration Costs
Exploration costs of $1.9 million were consistent for the year ended December 31, 2023 as compared to the year ended December 31, 2022.
Selling, General and Administrative Expenses
Selling, general and administrative expenses increased $13.9 million, or 47.1%, to $43.3 million in the year ended December 31, 2023 compared to $29.4 million in the year ended December 31, 2022. The increase in selling, general and administrative expenses was primarily due to increased professional fees, consulting fees, and increased employee compensation costs related to the hiring of additional management and support staff at our headquarters in Belmont, North Carolina during 2023. Stock-based compensation expense included in selling, general and administrative expenses was $9.4 million and $3.3 million in the years ended December 31, 2023 and 2022, respectively.
Income (Loss) from Equity Method Investments
Income (loss) from equity method investments increased $8.5 million, or 102.3%, to income of $0.2 million in the year ended December 31, 2023 compared to a loss of $8.4 million in the year ended December 31, 2022. The income reflects our proportionate share of the net income or loss resulting from our investments in Sayona Mining, Sayona Quebec, and Atlantic Lithium. The change was driven by income of $4.4 million from Sayona Quebec in the year ended December 31, 2023 compared to a loss of $2.5 million in the year ended December 31, 2022, and a decrease in losses from Sayona Mining and Atlantic Lithium of $2.8 million and $1.1 million, respectively. In addition, we recorded an other than temporary impairment charge of $2.2 million in the year ended December 31, 2023 due to a decline market value of Sayona Mining.
Other Income
Other income decreased $9.2 million, or 30.8%, to $20.7 million in the year ended December 31, 2023 compared to $29.9 million in the year ended December 31, 2022. The decrease was primarily due to our gain on dilution of equity method investments related to Sayona Mining of $17.0 million in the year ended December 31, 2023 compared to $29.0 million in the year ended December 31, 2022. Partially offsetting the decrease in other income was an increase related to net interest income of $2.8 million during the same comparable period.
Income Tax Expense
Income tax expense was $3.1 million in the years ended December 31, 2023 and December 31, 2022. Income tax expense in both periods is driven by the deferred tax effects of our equity method investment in Sayona Mining.
Liquidity and Capital Resources
Overview
As of December 31, 2023, we had cash and cash equivalents of $71.7 million compared to $99.2 million as of December 31, 2022. As of December 31, 2023, the vast majority of our cash balances were held in the U.S and covered by FDIC insured limits.
Our predominant source of cash to date has been generated through equity financing from issuances of our common stock. In February 2023, we issued 1,096,535 shares of our common stock at $68.40 per share to LG Chem for $75 million. We received cash proceeds of $71.1 million, which was net of $3.9 million in share issuance costs associated with the private placement. As of December 31, 2023, we had $369.2 million remaining under our shelf registration statement, which expires on September 24, 2024.
Our primary uses of cash during the year ended December 31, 2023 consisted of: (i) equity investments in Sayona Quebec mainly for the operational restart of NAL totaling $30.9 million; (ii) purchases of real property and associated mining interests of $25.4 million and development expenditures of $3.3 million associated with Carolina Lithium; (iii) capital expenditures primarily related to engineering costs of $27.7 million for Tennessee Lithium; and (iv) advances to Atlantic Lithium primarily for exploration and evaluation activities related to our investment in Ewoyaa totaling $9.4 million; and general and administrative costs related to our corporate expenses.
As of December 31, 2023, we had working capital of $34.8 million.
Liquidity Outlook
As a result of current lithium market conditions, we have taken certain actions during the first quarter of 2024 to reduce our overhead cost structure, strengthen our balance sheet, and bolster our cash position. Specifically, we:
•initiated a cost-savings plan to reduce operating spend mainly within our corporate overhead by $10 million annually, defer capital spending to 2025 and beyond, and limit cash investments in and advances to affiliates. We expect to recognize the majority of our cost savings in 2024. As part of our cost-savings plan, we reduced our workforce by 27% mainly within our corporate office staff. We will record approximately $1 million in severance and related costs in the first quarter of 2024; and raised net proceeds of approximately $49.1 million from the sale of our common stock holdings in Sayona Mining and a portion of our common stock holdings in Atlantic Lithium. The sale of these shares was part of our strategy to provide funding from non-core assets and protect shareholder value. We expect to pay approximately $3.1 million in taxes associated with these sales in the second quarter of 2024. The sale of these shares had no impact on our joint ventures or offtake rights with either Sayona Quebec and its NAL operations or the Ewoyaa project with Atlantic Lithium.
Our planned cash expenditures for the next twelve months primarily relate to: (i) continued equity investments in Sayona Quebec primarily for working capital of NAL; (ii) continued cash advances to Atlantic Lithium for Ewoyaa; (iii) real property and associated mineral rights acquisition costs and continued permitting, engineering and testing activities associated with Carolina Lithium; (iv) real property acquisition costs and engineering and permitting activities associated with Tennessee Lithium; (v) corporate costs; and (vi) working capital requirements.
In 2024, we plan to fund capital expenditures totaling $10 million to $14 million and investments in and advances to affiliates totaling $32 million to $38 million. The majority of our planned capital expenditures relate to Carolina Lithium and Tennessee Lithium. Investments in and advances to affiliates reflect cash contributions to Sayona Quebec and its NAL operations and advances to Atlantic Lithium for the Ewoyaa project. We expect funding for Ewoyaa to be minimal in 2024 and we are evaluating a range of options that would be non-dilutive to Piedmont Lithium’s shareholders to fund our share of project capital. Our outlook for planned capital expenditures and investments in and advances to affiliates is subject to market conditions.
We believe our current cash balances are sufficient to fund our cash requirements for at least the next 12 months. In the event costs
were to exceed our planned expenditures, we will reduce or eliminate current and/or planned discretionary spending. If further
reductions are required, we will reduce certain non-discretionary expenditures. We plan to meet our liquidity needs in 2024 through our available cash balances and other financing strategies involving non-core assets, as discussed above.
During the third quarter of 2023, we engaged advisors to support our funding strategy for the construction of Tennessee Lithium. In consultation with the DOE, we have decided to pursue an ATVM loan under the DOE’s Loan Programs Office rather than complete the previously announced $141.7 million grant under the Bipartisan Infrastructure Law. We expect that the ATVM loan, if awarded, would cover a significantly larger share of the capital required for the project, thereby strengthening the opportunity for strategic parties to partner with us on the project. We are also in the process of submitting an ATVM loan application for Carolina Lithium. Construction is not planned to commence for either Tennessee Lithium or Carolina Lithium until project financing has been finalized for the respective project.
As of December 31, 2023, we had entered into land acquisition contracts in North Carolina and Tennessee totaling $24.7 million, of which we expect to close and fund $10.8 million in 2024, $11.1 million in 2025, and $2.7 million in 2026. These amounts do not include closing costs such as attorneys’ fees, taxes, and commissions. We are not obligated to exercise our land option agreements, and we are able to cancel our land acquisition contracts, at our option with de minimis cancellation costs, during the contract due diligence period. Certain land option agreements and land acquisition contracts become binding upon commencement of construction for Carolina Lithium.
Currently, there are no plans for future cash distributions from any of our equity method investments.
Historically, we have been successful raising cash through equity financing. If we were to issue additional shares of our common stock, it would result in dilution to our existing shareholders. No assurances can be given that any additional financings would be available in amounts sufficient to meet our needs or on terms that would be acceptable to us. There are many factors that could significantly impact our ability to raise funds through equity and debt financing as well as influence the timing of future cash flows. See Part I, Item 1A, “Risk Factors” in this Form 10-K for the year ended December 31, 2023.
Cash Flows
The following table is a condensed schedule of cash flows provided as part of the discussion of liquidity and capital resources:
|
|
|
|
|
|
|
|
|
|
|
|
| (in thousands) |
Years Ended
December 31, |
| Net cash provided by (used in): |
2023 |
|
2022 |
|
|
|
|
| Operating activities |
$ |
1,570 |
|
|
$ |
(26,449) |
|
| Investing activities |
(99,323) |
|
|
(59,800) |
|
| Financing activities |
70,236 |
|
|
121,251 |
|
| Net (decrease) increase in cash and cash equivalents |
$ |
(27,517) |
|
|
$ |
35,002 |
|
Cash Flows from Operating Activities
Operating activities provided $1.6 million and used $26.4 million in the years ended December 31, 2023 and 2022, respectively, resulting in an increase in cash provided by operating activities of $28.0 million. The increase was primarily due to the receipt of prepayments for spodumene concentrate shipments that, as a result of declining lithium market prices after receipt, are recorded as current liabilities of $29.2 million as of December 31, 2023 and an increase in net income of $0.9 million, net of certain noncash items including gain on dilution, income (loss) from equity method investments, stock compensation expense, and deferred taxes.
Cash Flows from Investing Activities
Investing activities used $99.3 million and $59.8 million in the years ended December 31, 2023 and 2022, respectively, resulting in an increase in cash used in investing activities of $39.5 million. The increase was primarily due to an increase in capital contributions to equity investments of $12.2 million primarily relating to Sayona Quebec for additional investments to fund the NAL restart. Also contributing to the increase were increased capital expenditures of $25.9 million and $5.2 million for Tennessee Lithium and Carolina Lithium, respectively. These increases were partially offset by a decrease in cash advances of $3.6 million to Atlantic Lithium for Ewoyaa.
Cash Flows from Financing Activities
Financing activities provided $70.2 million and $121.3 million in the years ended December 31, 2023 and 2022, respectively, resulting in a decrease in cash provided of $51.0 million. The decrease in cash from financing activities was driven by a $51.3 million decrease in net cash proceeds from issuances of our common stock in the years ended December 31, 2023 compared to December 31, 2022. In February 2023, we received net proceeds of $71.1 million from LG Chem in exchange for 1,096,535 common shares in Piedmont Lithium in conjunction with a multi-year spodumene concentrate offtake agreement. In March 2022, we received net proceeds of $122.0 million by issuing 2,012,500 common shares under our automatic shelf registration.
Contractual Obligations and Other Commitments
The following table summarizes our contractual obligations as of December 31, 2023 that we believe will affect cash over the next five years and thereafter:
|
|
|
|
|
|
|
|
|
|
|
|
|
|
|
|
|
|
|
|
|
|
|
|
|
|
|
|
|
|
| (in thousands) |
Total |
|
Less than
1 year |
|
1–3 years |
|
3-5 years |
|
Thereafter |
| Contractual obligations |
|
|
|
|
|
|
|
|
|
| Long-term debt obligations |
$ |
163 |
|
|
$ |
149 |
|
|
$ |
14 |
|
|
$ |
— |
|
|
$ |
— |
|
| Lease liabilities |
1,801 |
|
|
439 |
|
|
597 |
|
|
569 |
|
|
196 |
|
|
$ |
1,964 |
|
|
$ |
588 |
|
|
$ |
611 |
|
|
$ |
569 |
|
|
$ |
196 |
|
Although we have entered into certain offtake supply agreements, purchase obligations from our customers are defined as purchase agreements that are enforceable and legally binding and specify all significant terms, including quantity, price, and the approximate timing of the transaction. Our obligations to fulfill supply agreements do not meet these criteria and are therefore not reflected in the table above.
In August 2022, we signed a $4.1 million contract option to purchase land with the Industrial Development Board of the County of McMinn and the McMinn County of Economic Development Authority. In December 2023, this option agreement expired. We are currently in discussions with county officials to extend the option.
Off-Balance Sheet Arrangements
In 2023, we purchased a 132 acre disposal facility adjacent to the proposed Tennessee Lithium plant site for the placement of inert tailings produced as part of the innovative alkaline pressure leach process. The Tennessee Department of Environment and Conservation requires that closure and post-closure obligations of the disposal facility be covered by a surety bond. Surety bonds securing closure and post-closure obligations at December 31, 2023 and December 31, 2022 totaled $3.2 million and $0, respectively.
Critical Accounting Policies and Estimates
Our management’s discussion and analysis of our financial condition and results of operations is based on our consolidated financial statements, which have been prepared in accordance with U.S. GAAP. The preparation of these consolidated financial statements requires us to make estimates and assumptions that affect the reported amounts of assets and liabilities and the disclosure of contingent assets and liabilities as of the date of the consolidated financial statements, as well as the reported expenses incurred during the reporting periods. Our estimates are based on our historical experience and on various other factors that we believe are reasonable under the circumstances, the results of which form the basis for making judgments about the carrying value of assets and liabilities that are not readily apparent from other sources. Actual results may differ from these estimates under different assumptions or conditions.
While our significant accounting policies are described in the notes to our consolidated financial statements included elsewhere in our Annual Report, we believe that the following critical accounting policies are most important to understanding and evaluating our reported financial results.
Revenue
For certain of our sales of spodumene concentrate, customer contracts allow for pricing based on a period of time subsequent to shipping, in most cases within the following four months. In such cases, revenue is recorded at a provisional price at the time of shipment. The provisionally priced sales are adjusted to reflect market prices at the end of each month until a final adjustment is made to the price of the shipments upon settlement with customers pursuant to the terms of the contract.
Stock-based Compensation
The Leadership and Compensation Committee generally grants stock-based awards in the first quarter of each year. The Leadership and Compensation Committee does not have any programs, plans, or practices of timing these awards in coordination with the release of material non-public information. We have never backdated, re-priced, or spring-loaded any of our stock-based awards.
Equity-settled, share-based payments are provided to officers, employees, consultants and other advisors. These share-based payments are measured at the fair value of the equity instrument at the grant date. Fair value of share options is determined using the Black-Scholes option pricing model, taking into account the terms and conditions upon which the instruments were granted, and are disclosed in Note 4—Stock-Based Compensation, to the audited consolidated financial statements appearing elsewhere in our Annual Report. Fair value of TSR PRAs is determined using a Monte Carlo simulation. The Monte Carlo simulation fair value model requires the use of highly subjective and complex assumptions, including the price volatility of the underlying stock. A Monte Carlo simulation model was used to determine the grant date fair value by simulating a range of possible future stock prices for the Company and each member of the peer group over the performance period is disclosed in Note 4—Stock-Based Compensation, to the audited consolidated financial statements appearing elsewhere in our Annual Report.
We record stock-based compensation expense within both exploration costs, and general and administrative expenses in the statements of operations. Costs are allocated among those receiving the benefit based upon job function. There are certain employees who serve both functions, and therefore, their stock-based compensation expense is split between both financial statement lines in the consolidated statements of operations.
Estimating fair value for share-based payment transactions requires determination of the most appropriate valuation model, which depends on the terms and conditions of the grant. This estimate also requires determination of the most appropriate inputs to the valuation model including the expected life of the share option, volatility, dividend yield and risk-free interest rate and making assumptions about them.
Changes to these inputs would impact the consequent valuation for each equity instrument valued in this manner, and consequently, the value of each grant would vary in a different manner depending on the change to the respective inputs.
The fair value determined at the grant date is expensed on a straight-line basis over the vesting period, based on our estimate of equity instruments that will eventually vest. At each reporting date, we revise our estimate of the number of equity instruments expected to vest. The impact of the revision of the original estimates, if any, is recognized in profit or loss over the remaining vesting period, with a corresponding adjustment to the share-based payments reserve.
Investments in Unconsolidated Entities
We strategically invest in unconsolidated entities that we believe will provide us access to hard rock lithium assets as well as projects with the potential for scale, low-cost, sustainable production practices and that are strategically located to our proposed lithium hydroxide manufacturing sites.
Our unconsolidated entities are accounted for by the equity method of accounting because we have a significant influence, but not control, in the investee. We record our investments in these entities in our consolidated balance sheets as “Equity investments in unconsolidated affiliates” and our pro-rata share of the entities’ earnings or losses in our consolidated statements of operations as “Gain (loss) from equity investments in unconsolidated affiliates.”
We look at specific criteria and use our judgment when determining if we have a controlling interest in a less than wholly-owned entity. Factors considered in determining whether we have significant influence, or we have control, include, but are not limited to, ownership percentage, the ability to appoint individuals to the investee’s board of directors, operational decision-making authority, and participation in policy-making decisions. The accounting policy relating to the use of the equity method of accounting is a critical accounting policy due to the judgment required in determining whether we have significant influence over the entity.
Item 7A. QUANTITATIVE AND QUALITATIVE DISCLOSURES ABOUT MARKET RISK.
Interest Rate Risk
Our exposure to the risk of changes in market interest rates relates primarily to our cash and short-term deposits with a floating interest rate. These financial assets do not expose us to material cash flow interest rate risk. All other financial assets and liabilities, in the form of payables, lease liabilities, and long-term debt, are fixed rate or non-interest bearing. As of December 31, 2023 and 2022, we had $71.7 million, and $99.2 million, respectively, of cash and short-term deposits. We currently do not engage in any hedging or derivative transactions to manage interest rate risk.
Foreign Currency Risk
Our provisional spodumene concentrate sales are calculated, in part, based on the foreign exchange rate between the U.S. dollar and the Chinese renminbi over applicable quotational periods, and therefore, we are exposed to currency volatility and devaluation risks. Geopolitical tensions between the U.S. and China may lead to increased tariffs, preferences for local producers, some of which may be government-supported, or other trade barriers. The economic impact of currency exchange rate movements is often linked to variability in real growth, inflation, interest rates, governmental actions and other factors. While foreign currency risk has not had a material impact on our results of operations, we will continue to evaluate our risk exposure going forward and may enter into hedging transactions to manage our exposure to fluctuations in foreign currency exchange rates.
Commodity Price Risk
Our results of operations are dependent upon the market prices of lithium products. These lithium products are not quoted on any major commodities market or exchange as these product’s attributes vary and demand is currently constrained to a relatively limited number of purchasers, a significant majority of which are based in China. The market prices published for lithium products can be volatile and are influenced by numerous factors, including international, economic, and political trends, expectations of inflation, currency exchange fluctuations, interest rates, global or regional consumptive patterns, speculative activities, increased production due to new extraction developments and improved extraction and production methods and technological changes in the markets for the end products.
We have not entered into any hedging transactions to manage our exposure to fluctuations in the market prices of lithium products. We will continue to evaluate our options moving forward as the futures market for lithium products further develops.
During the three months ending December 31, 2023, we received a provisional payment on sales of 14,000 dmt of spodumene concentrate under a provisional pricing arrangement. The price per metric ton is calculated based on multiple factors, including the average applicable market price index over the applicable quotational period. We recognize revenue from product sales at a point in time when performance obligations are satisfied under the terms of contracts with our customers. When the final price has not been resolved by the end of a reporting period, we estimate the expected sales price based on the initial price, market pricing and known quality measurements. Differences between payments received and the final estimated sales price, which results in a liability, are recorded as accrued provisional revenue adjustments.
We conduct a sensitivity analysis on our provisional concentrate sales still subject to final pricing to determine the potential impact to net income (loss) of a 10% change to the applicable market price index as compared to the applicable market price index as of December 31, 2023. Such a 10% change yields a potential impact of approximately $1.6 million to net income (loss).
Additionally, market prices of lithium products affect the economic feasibility of mining on our properties, the value of such properties and the potential timing of construction of Carolina Lithium and Tennessee Lithium.
Item 8. FINANCIAL STATEMENTS AND SUPPLEMENTARY DATA
See “Index to Consolidated Financial Statements” beginning on page F-1 of our Annual Report, which information is incorporated by reference into this Item 8.
Item 9. CHANGES IN AND DISAGREEMENTS WITH ACCOUNTANTS ON ACCOUNTING AND FINANCIAL DISCLOSURE.
None.
Item 9A. CONTROLS AND PROCEDURES.
Evaluation of Disclosure Controls and Procedures
Our management, under supervision and with the participation of our CEO (our Principal Executive Officer) and CFO (our Principal Financial Officer and Principal Accounting Officer), evaluated the effectiveness of our disclosure controls and procedures (as defined in Rules 13a-15(e) and 15d-15(e) of the Exchange Act) as of December 31, 2023. Based on the evaluation of our disclosure controls and procedures, our CEO and CFO have concluded that our disclosure controls and procedures were effective as of December 31, 2023.
Management’s Annual Report on Internal Control Over Financial Reporting
Our management is responsible for establishing and maintaining adequate internal control over financial reporting, as defined in Rules 13a-15(f) and 15d-15(f) under the Exchange Act. This rule defines internal control over financial reporting as a process designed by, or under the supervision of, a company’s CEO and CFO and effected by our board of directors, management and other personnel, to provide reasonable assurance regarding the reliability of financial reporting and the preparation of financial statements for external purposes in accordance with generally accepted accounting principles and includes those policies and procedures that (i) pertain to the maintenance of records that, in reasonable detail, accurately and fairly reflect the transactions and dispositions of the assets of the company; (ii) provide reasonable assurance that transactions are recorded as necessary to permit preparation of financial statements in accordance with generally accepted accounting principles, and that receipts and expenditures of the company are being made only in accordance with authorizations of management and directors of the company; and (iii) provide reasonable assurance regarding prevention or timely detection of unauthorized acquisition, use, or disposition of our assets that could have a material effect on the financial statements.
Management assessed the effectiveness of our internal control over financial reporting as of December 31, 2023. This assessment was performed under the direction and supervision of our CEO and CFO and based on criteria established in Internal Control-Integrated Framework (2013) issued by COSO. Our management’s assessment of the effectiveness of our internal control over financial reporting included testing and evaluating the design and operating effectiveness of our internal controls. Based on this assessment, management has concluded that we maintained effective internal control over financial reporting as of December 31, 2023, based on criteria established in the COSO 2013 framework.
Deloitte & Touche LLP, our independent registered public accounting firm, has issued an attestation report on the effectiveness of our internal control over financial reporting as of December 31, 2023. Their report is included below.
Inherent Limitations of Internal Controls
Our management, including our CEO and CFO, does not expect that our disclosure controls and procedures or our internal controls will prevent all errors and all fraud. A control system, no matter how well conceived and operated, can provide only reasonable, not absolute, assurance that the objectives of the control system are met. Because of the inherent limitations in all control systems, no evaluation of controls can provide absolute assurance that all control issues and instances of fraud, if any, within the Company have been detected. These inherent limitations include the realities that judgments in decision-making can be faulty, and that breakdowns can occur because of a simple error or mistake. Additionally, controls can be circumvented by the individual acts of some persons, by collusion of two or more people, or by management override of the control. The design of any system of controls also is based in part upon certain assumptions about the likelihood of future events, and we cannot assure you that any design will succeed in achieving its stated goals under all potential future conditions. Over time, controls may become inadequate because of changes in conditions, or the degree of compliance with the policies or procedures may deteriorate. Projections of any evaluation of effectiveness to future periods are subject to the risk that controls may become inadequate because of changes in conditions, or that the degree of compliance with the policies or procedures may deteriorate. Because of its inherent limitations, internal control over financial reporting may not prevent or detect misstatements due to error or fraud.
Changes in Internal Control over Financial Reporting
Section 404 of the Sarbanes-Oxley Act of 2002 requires us to evaluate annually the effectiveness of our internal controls over financial reporting as of the end of each fiscal year, and to include a management report assessing the effectiveness of our internal control over financial reporting in all annual reports. There were no changes in our internal control over financial reporting during the quarter ended December 31, 2023 that have materially affected, or are reasonably likely to materially affect, our internal control over financial reporting.
REPORT OF INDEPENDENT REGISTERED PUBLIC ACCOUNTING FIRM
To the Shareholders and the Board of Directors of Piedmont Lithium Inc.,
Opinion on Internal Control over Financial Reporting
We have audited the internal control over financial reporting of Piedmont Lithium Inc. and subsidiaries (the “Company”) as of December 31, 2023, based on criteria established in Internal Control—Integrated Framework (2013) issued by the Committee of Sponsoring Organizations of the Treadway Commission (COSO). In our opinion, the Company maintained, in all material respects, effective internal control over financial reporting as of December 31, 2023, based on criteria established in Internal Control—Integrated Framework (2013) issued by COSO.
We have also audited, in accordance with the standards of the Public Company Accounting Oversight Board (United States) (PCAOB), the consolidated financial statements as of and for the year ended December 31, 2023, of the Company and our report dated February 28, 2024, expressed an unqualified opinion on those financial statements.
Basis for Opinion
The Company’s management is responsible for maintaining effective internal control over financial reporting and for its assessment of the effectiveness of internal control over financial reporting, included in the accompanying Management’s Annual Report on Internal Control over Financial Reporting. Our responsibility is to express an opinion on the Company’s internal control over financial reporting based on our audit. We are a public accounting firm registered with the PCAOB and are required to be independent with respect to the Company in accordance with the U.S. federal securities laws and the applicable rules and regulations of the Securities and Exchange Commission and the PCAOB.
We conducted our audit in accordance with the standards of the PCAOB. Those standards require that we plan and perform the audit to obtain reasonable assurance about whether effective internal control over financial reporting was maintained in all material respects. Our audit included obtaining an understanding of internal control over financial reporting, assessing the risk that a material weakness exists, testing and evaluating the design and operating effectiveness of internal control based on the assessed risk, and performing such other procedures as we considered necessary in the circumstances. We believe that our audit provides a reasonable basis for our opinion.
Definition and Limitations of Internal Control over Financial Reporting
A company’s internal control over financial reporting is a process designed to provide reasonable assurance regarding the reliability of financial reporting and the preparation of financial statements for external purposes in accordance with generally accepted accounting principles. A company’s internal control over financial reporting includes those policies and procedures that (1) pertain to the maintenance of records that, in reasonable detail, accurately and fairly reflect the transactions and dispositions of the assets of the company; (2) provide reasonable assurance that transactions are recorded as necessary to permit preparation of financial statements in accordance with generally accepted accounting principles, and that receipts and expenditures of the company are being made only in accordance with authorizations of management and directors of the company; and (3) provide reasonable assurance regarding prevention or timely detection of unauthorized acquisition, use, or disposition of the company’s assets that could have a material effect on the financial statements.
Because of its inherent limitations, internal control over financial reporting may not prevent or detect misstatements. Also, projections of any evaluation of effectiveness to future periods are subject to the risk that controls may become inadequate because of changes in conditions, or that the degree of compliance with the policies or procedures may deteriorate.
/s/ DELOITTE & TOUCHE LLP
Charlotte, North Carolina
February 28, 2024
Item 9B. OTHER INFORMATION.
During the three months ended December 31, 2023, no director or officer of the Company adopted or terminated a “Rule 10b5-1 trading arrangement” or “non-Rule10b5-1 trading arrangement,” as each term is defined in item 408(a) of Regulation S-K.
Disclosure Pursuant to Item 2.01 of Form 8-K — Completion of Acquisition or Disposition of Assets
On February 26, 2024, we completed the sale of 1,249.8 million shares of Sayona Mining on market for an average of $0.03 per share. The shares sold represented approximately 12% of Sayona Mining’s outstanding shares and resulted in approximately $41.4 million in net cash proceeds.
As a result of the sale, Piedmont Lithium no longer holds shares of Sayona Mining and will record a loss on the sale of our investment in accordance with Accounting Standards Codification, or ASC 323-10-35-35, Investments - Equity Method and Joint Ventures.
We have included below the unaudited pro forma consolidated statement of operations for the year ended December 31, 2023 and the unaudited pro forma consolidated balance sheet as of December 31, 2023, which was derived from our consolidated balance sheet filed in this Annual Report on Form 10-K. The pro forma statements of operations give effect to the disposal as if it had occurred on January 1, 2023.
Disclosure Pursuant to Item 9.01 of Form 8-K — Financial Statements and Exhibits
PIEDMONT LITHIUM INC.
UNAUDITED PRO FORMA CONSOLIDATED STATEMENT OF OPERATIONS
YEAR ENDED DECEMBER 31, 2023
(In thousands)
|
|
|
|
|
|
|
|
|
|
|
|
|
|
|
|
|
|
|
|
|
|
|
|
|
|
|
|
|
|
|
|
|
|
|
|
|
|
Year Ended
December 31, 2023
|
|
Adjustments |
|
Notes |
|
Pro Forma |
| Revenue |
|
$ |
39,817 |
|
|
$ |
— |
|
|
|
|
$ |
39,817 |
|
| Costs of sales |
|
34,138 |
|
|
— |
|
|
|
|
34,138 |
|
| Gross profit |
|
5,679 |
|
|
— |
|
|
|
|
5,679 |
|
| Operating expenses: |
|
|
|
|
|
|
|
|
| Exploration costs |
|
1,929 |
|
|
— |
|
|
|
|
1,929 |
|
| Selling, general and administrative expenses |
|
43,319 |
|
|
— |
|
|
|
|
43,319 |
|
| Total operating expenses |
|
45,248 |
|
|
— |
|
|
|
|
45,248 |
|
| Income (loss) from equity method investments |
|
194 |
|
|
2,546 |
|
|
(a) |
|
2,740 |
|
| Loss from operations |
|
(39,375) |
|
|
2,546 |
|
|
|
|
(36,829) |
|
| Other income (expense): |
|
|
|
|
|
|
|
— |
|
| Interest income |
|
3,859 |
|
|
— |
|
|
|
|
3,859 |
|
| Interest expense |
|
(39) |
|
|
— |
|
|
|
|
(39) |
|
| (Loss) gain from foreign currency exchange |
|
(91) |
|
|
— |
|
|
|
|
(91) |
|
| Gain on dilution of equity method investments |
|
16,975 |
|
|
(16,850) |
|
|
(b) |
|
125 |
|
| Total other income (loss) |
|
20,704 |
|
|
(16,850) |
|
|
|
|
3,854 |
|
| Loss before taxes |
|
(18,671) |
|
|
(14,304) |
|
|
|
|
(32,975) |
|
| Income tax expense |
|
3,106 |
|
|
(3,106) |
|
|
(c) |
|
— |
|
| Net loss |
|
$ |
(21,777) |
|
|
$ |
(11,198) |
|
|
|
|
$ |
(32,975) |
|
PIEDMONT LITHIUM INC.
UNAUDITED PRO FORMA CONSOLIDATED BALANCE SHEET
AS OF DECEMBER 31, 2023
(In thousands, except per share amounts
|
|
|
|
|
|
|
|
|
|
|
|
|
|
|
|
|
|
|
|
|
|
|
|
|
|
|
|
|
|
|
|
|
|
|
|
|
|
December 31,
2023 |
|
Adjustments |
|
Notes |
|
Pro Forma |
| Assets |
|
|
|
|
|
|
|
|
| Cash and cash equivalents |
|
$ |
71,730 |
|
|
$ |
41,422 |
|
|
(d) |
|
$ |
113,152 |
|
| Accounts receivable |
|
595 |
|
|
— |
|
|
|
|
595 |
|
|
|
|
|
|
|
|
|
|
| Other current assets |
|
3,829 |
|
|
— |
|
|
|
|
3,829 |
|
| Total current assets |
|
76,154 |
|
|
41,422 |
|
|
|
|
117,576 |
|
| Property, plant and mine development, net |
|
127,086 |
|
|
— |
|
|
|
|
127,086 |
|
|
|
|
|
|
|
|
|
|
| Other non-current assets |
|
30,353 |
|
|
— |
|
|
|
|
30,353 |
|
| Equity method investments |
|
147,662 |
|
|
(59,494) |
|
|
(e) |
|
88,168 |
|
| Total assets |
|
$ |
381,255 |
|
|
$ |
(18,072) |
|
|
|
|
$ |
363,183 |
|
|
|
|
|
|
|
|
|
— |
|
| Liabilities and Stockholders’ Equity |
|
|
|
|
|
|
|
— |
|
|
|
|
|
|
|
|
|
|
|
|
|
|
|
|
|
|
|
| Accounts payable and accrued expenses |
|
11,754 |
|
|
— |
|
|
|
|
11,754 |
|
| Current portion of long-term debt |
|
149 |
|
|
— |
|
|
|
|
149 |
|
| Other current liabilities |
|
29,463 |
|
|
3,149 |
|
|
(f) |
|
32,612 |
|
| Total current liabilities |
|
41,366 |
|
|
3,149 |
|
|
|
|
44,515 |
|
| Long-term debt, net of current portion |
|
14 |
|
|
— |
|
|
|
|
14 |
|
| Operating lease liabilities, net of current portion |
|
1,091 |
|
|
— |
|
|
|
|
1,091 |
|
| Other non-current liabilities |
|
431 |
|
|
— |
|
|
|
|
431 |
|
| Deferred tax liabilities |
|
6,023 |
|
|
(6,023) |
|
|
(g) |
|
— |
|
| Total liabilities |
|
48,925 |
|
|
(2,874) |
|
|
|
|
46,051 |
|
| Commitments and contingencies (Note 15) |
|
|
|
|
|
|
|
|
| Stockholders’ equity: |
|
|
|
|
|
|
|
|
| Common stock; $0.0001 par value, 100,000 shares authorized; 19,272 and 18,073 shares issued and outstanding at December 31, 2023 and December 31, 2022, respectively |
|
2 |
|
|
— |
|
|
|
|
2 |
|
| Additional paid-in capital |
|
462,899 |
|
|
— |
|
|
|
|
462,899 |
|
| Accumulated deficit |
|
(126,844) |
|
|
(16,204) |
|
|
(h) |
|
(143,048) |
|
| Accumulated other comprehensive loss |
|
(3,727) |
|
|
1,006 |
|
|
(i) |
|
(2,721) |
|
| Total stockholders’ equity |
|
332,330 |
|
|
(15,198) |
|
|
|
|
317,132 |
|
| Total liabilities and stockholders’ equity |
|
$ |
381,255 |
|
|
$ |
(18,072) |
|
|
|
|
$ |
363,183 |
|
Notes to Unaudited Pro Forma Consolidated Financial Information
(a) Reflects the removal our $0.3 million loss from our equity method investment in Sayona Mining and $2.2 million loss on impairment of our investment in Sayona Mining
(b) Reflects the removal of the gain on dilution of our interest in Sayona Mining
(c) Reflects the income tax effects of the pro forma adjustments. The tax effect of the pro forma adjustments was calculated using the statutory rates in effect for the period presented.
(d) Reflects the total proceeds received for the sale of Sayona Mining stock in the first quarter of 2024
(e) Reflects the carrying amount of Sayona Mining as of the balance sheet date presented
(f) Reflects an estimated pro forma current tax liability arising as a result of the sale of the stock in Sayona Mining
(g) Reflects the reversal of the taxable temporary difference recorded with respect to the book-tax basis difference in our investment in Sayona Mining
(h) Reflects the estimated loss of approximately $16.2 million from the sale of Sayona Mining shares during the first quarter of 2024. This pro forma estimated loss was computed in accordance with ASC 323-10-35-35 as the difference between the selling price and the carrying amount of the stock sold as-of the date of the balance sheet, net of income tax effects as computed under ASC 740. The actual loss will be determined using our actual carrying amount of Sayona Mining on the dates of sale which will reflect our proportional share of income or loss for the first quarter of 2024, inclusive of activity not reflected due to our lag in accounting for equity method investee activity.
We are not able to estimate the actual loss until we determine the actual balances of our carrying amounts, which will be completed during the quarter ending March 31, 2024. The actual loss may differ materially from the pro forma estimated loss shown herein.
The computation of the pro forma estimated loss has not been reflected in the pro forma consolidated statement of operations because it is considered to be nonrecurring in nature.
The computation of the pro forma estimated loss was computed as follows (in thousands):
|
|
|
|
|
|
|
|
|
| Proceeds from sale of securities |
|
$ |
41,422 |
|
| Less: carrying amount of Sayona Mining |
|
(59,494) |
|
| Realized other comprehensive loss |
|
(1,228) |
|
| Pro forma estimated loss before tax |
|
(19,300) |
|
| Pro forma income tax benefit |
|
(3,096) |
|
| Pro forma estimated loss, net of tax |
|
$ |
(16,204) |
|
(i) This adjustment reflects the realization of our share of Sayona Mining’s adjustments for other comprehensive income and our cumulative translation loss on the investment in Sayona Mining.
Item 9C. DISCLOSURE REGARDING FOREIGN JURISDICTIONS THAT PREVENT INSPECTIONS.
None
PART III
Item 10. DIRECTORS, EXECUTIVE OFFICERS AND CORPORATE GOVERNANCE.
The information required by this item will be contained in the Proxy Statement and is incorporated herein by reference.
Item 11. EXECUTIVE COMPENSATION.
Our Board of Directors adopted a clawback policy in August 2023. That policy was filed as an exhibit to this Form 10-K as exhibit 97.1 All additional information required by this item will be contained in the Proxy Statement and is incorporated herein by reference.
Item 12. SECURITY OWNERSHIP OF CERTAIN BENEFICIAL OWNERS AND MANAGEMENT AND RELATED STOCKHOLDER MATTERS.
The information required by this item will be contained in the Proxy Statement and is incorporated herein by reference.
Item 13. CERTAIN RELATIONSHIPS AND RELATED TRANSACTIONS, AND DIRECTOR INDEPENDENCE.
The information required by this item will be contained in the Proxy Statement and is incorporated herein by reference.
Item 14. PRINCIPAL ACCOUNTING FEES AND SERVICES.
The information required by this item will be contained in the Proxy Statement and is incorporated herein by reference.
PART IV
Item 15. EXHIBITS.
1. Financial Statements
See “Index to Consolidated Financial Statements” beginning on page F-1 of our Annual Report, which information is incorporated by reference into this Item 15.
2. Financial Statement Schedules
Financial statement schedules have not been included because they are not applicable, or the information is included in financial statements or notes thereto.
3. Exhibits
The exhibits listed on the accompanying Exhibit Index are filed or incorporated by reference as part of our Annual Report and such Exhibit Index is incorporated herein by reference
Exhibit Index
|
|
|
|
|
|
Exhibit
Number |
Description |
|
Amended and Restated Certificate of Incorporation of Piedmont Lithium Inc. (incorporated by reference to Exhibit 3.1 to the Company’s Current Report on Form 8-K12B filed on May 18, 2021) |
|
Amended and Restated Bylaws of Piedmont Lithium Inc. (incorporated by reference to Exhibit 3.2 to the Company’s Current Report on Form 8-K12B filed on May 18, 2021) |
|
Description of Securities (incorporated by reference to Exhibit 4.1 the Company’s Annual Report on Form 10-K filed on September 24, 2021) |
|
Piedmont Lithium Inc. 2021 Stock Incentive Plan (incorporated by reference to Exhibit 10.1 to the Company’s Current Report on Form 8-K filed on May 18, 2021) |
|
Executive Employment Agreement, dated as of September 22, 2021, by and between Keith Phillips, Piedmont Lithium Inc. and Piedmont Lithium Carolinas, Inc. (incorporated by reference to Exhibit 10.2 to the Company’s Annual Report on Form 10-K filed on September 24, 2021) |
|
Executive Employment Agreement, dated as of June 4, 2021, by and between Michael White and Piedmont Lithium Inc. (incorporated by reference to Exhibit 10.1 to the Company’s Current Report on Form 8-K filed on June 4, 2021) |
|
Executive Employment Agreement, dated as of September 22, 2021, by and between Bruce Czachor and Piedmont Lithium Inc. and Piedmont Lithium Carolinas, Inc. (incorporated by reference to Exhibit 10.4 to the Company’s Annual Report on Form 10-K filed on September 24, 2021) |
|
Executive Employment Agreement, dated as of September 22, 2021, by and between Patrick Brindle and Piedmont Lithium Inc. and Piedmont Lithium Carolinas, Inc. (incorporated by reference to Exhibit 10.5 to the Company’s Annual Report on Form 10-K filed on September 24, 2021) |
|
Executive Employment Agreement, dated as of December 8, 2022, by and between Krishna Y. McVey and Piedmont Lithium Inc. and Piedmont Lithium Carolinas, Inc. (incorporated by reference to Exhibit 10.6 to the Company’s Annual Report on Form 10-K filed on March 1, 2023) |
|
Executive Employment Agreement, dated as of December 8, 2022, by and between Austin D. Devaney and Piedmont Lithium Inc. (incorporated by reference to Exhibit 10.7 to the Company’s Annual Report on Form 10-K filed on March 1, 2023) |
|
Subsidiaries of the Registrant |
|
Consent of Independent Registered Public Accounting Firm, Deloitte & Touche, LLP |
|
Consent of BDO Audit Pty Ltd |
|
Consent of Nexia Brisbane Audit Pty Ltd |
|
Consent of Qualified Person (Shaun Searle) (with respect to the Technical Report Summary of a Feasibility Study of the Ewoyaa Lithium Project in Ghana, dated February 26, 2024) |
|
Consent of Qualified Person (Harry Warries) (with respect to the Technical Report Summary of a Feasibility Study of the Ewoyaa Lithium Project in Ghana, dated February 26, 2024) |
|
Consent of Qualified Person (Keith Muller) (with respect to the Technical Report Summary of a Feasibility Study of the Ewoyaa Lithium Project in Ghana, dated February 26, 2024) |
|
Consent of Qualified Person (Noel O’Brien) (with respect to the Technical Report Summary of a Feasibility Study of the Ewoyaa Lithium Project in Ghana, dated February 26, 2024) |
|
|
|
|
|
|
|
Consent of Qualified Person (Lennard Kolff van Oosterwijk) (with respect to the Technical Report Summary of a Feasibility Study of the Ewoyaa Lithium Project in Ghana, dated February 26, 2024) |
|
Consent of Qualified Person (Sylvain Collard) (with respect to the North American Lithium Technical Report Summary, dated February 27, 2024) |
|
Consent of Qualified Person (Jarrett Quinn) (with respect to the North American Lithium Technical Report Summary, dated February 27, 2024) |
|
Consent of Qualified Person (Ehouman N’Dah) (with respect to the North American Lithium Technical Report Summary, dated February 27, 2024) |
|
Consent of Qualified Person (Philippe Chabot) (with respect to the North American Lithium Technical Report Summary, dated February 27, 2024) |
|
Consent of Qualified Person (Sylvain Collard) (with respect to the Authier Technical Report Summary, dated February 27, 2024) |
|
Consent of Qualified Person (Jarrett Quinn) (with respect to the Authier Technical Report Summary, dated February 27, 2024) |
|
Consent of Qualified Person (Maxime Dupere) (with respect to the Authier Technical Report Summary, dated February 27, 2024) |
|
Consent of Qualified Person (Philippe Chabot) (with respect to the Authier Technical Report Summary, dated February 27, 2024) |
|
Certification of Principal Executive Officer Pursuant to Section 302 of the Sarbanes-Oxley Act of 2002 |
|
Certification of Principal Financial Officer Pursuant to Section 302 of the Sarbanes-Oxley Act of 2002 |
|
Certification of Principal Executive Officer Pursuant to Section 906 of the Sarbanes-Oxley Act of 2002 |
|
Certification of Principal Financial Officer Pursuant to Section 906 of the Sarbanes-Oxley Act of 2002 |
|
Amended Technical Report Summary of the Carolina Lithium Project, dated April 20, 2023 (incorporated by reference to Exhibit 96.3 to the Company’s Annual Report on Form 10-K/A filed on April 24, 2023) |
|
Technical Report Summary of a Feasibility Study of the Ewoyaa Lithium Project in Ghana, dated February 26, 2024 |
|
North American Lithium Technical Report Summary, dated February 27, 2024 |
|
Authier Technical Report Summary, dated February 27, 2024 |
|
Clawback Policy |
|
Consolidated Financial Statements of Atlantic Lithium Lithium and its subsidiaries, for the year ended June 30, 2022 and 2021 (incorporated by reference to Exhibit 99.1 to the Company’s Annual Report on Form 10-K filed on March 1, 2023) |
|
Consolidated Financial Statements of Sayona Mining Limited and its controlled entities, for the year ended June 30, 2022 and 2021 (incorporated by reference to Exhibit 99.2 to the Company’s Annual Report on Form 10-K filed on March 1, 2023) |
|
Unaudited Consolidated Financial Statements of Atlantic Lithium and its subsidiaries, for the year ended June 30, 2023 and 2022 |
|
Consolidated Financial Statements of Sayona Mining Limited and its controlled entities, for the year ended June 30, 2023 and 2022 |
| 101.INS* |
XBRL Instance Document - - embedded within the Inline XBRL document |
| 101.SCH* |
XBRL Taxonomy Extension Schema Document |
| 101.CAL* |
XBRL Taxonomy Extension Calculation Linkbase Document |
| 101.DEF* |
XBRL Taxonomy Extension Definition Linkbase Document |
| 101.LAB* |
XBRL Taxonomy Extension Label Linkbase Document |
| 101.PRE* |
XBRL Taxonomy Extension Presentation Linkbase Document |
| 104* |
Cover page Interactive Data file (formatted as Inline XBRL and contained in Exhibit 101). |
__________________________
*Filed herewith.
+ Indicates management contract or compensatory plan.
Item 16. ANNUAL REPORT ON FORM 10-K SUMMARY.
None.
SIGNATURES
Pursuant to the requirements of Section 13 or 15(d) of the Securities Exchange Act of 1934, the Registrant has duly caused this report to be signed on its behalf by the undersigned thereunto duly authorized.
|
|
|
|
|
|
|
|
|
|
Piedmont Lithium Inc. |
|
(Registrant) |
|
|
|
| Date: February 28, 2024 |
By: |
/s/ Michael White |
|
|
Michael White |
|
|
Executive Vice President and Chief Financial Officer
(Principal Financial Officer and Principal Accounting Officer) |
Pursuant to the requirements of the Securities Exchange Act of 1934, the Registrant has duly caused this report to be signed on its behalf by the undersigned thereunto duly authorized.
|
|
|
|
|
|
|
|
|
| Name |
Title |
Date |
|
|
|
| /s/ Keith Phillips |
President and Chief Executive Officer |
February 28, 2024 |
| Keith Phillips |
(Principal Executive Officer) |
|
|
|
|
| /s/ Michael White |
Executive Vice President and
Chief Financial Officer |
February 28, 2024 |
| Michael White |
(Principal Financial Officer and Principal Accounting Officer) |
|
|
|
|
| /s/ Jeffrey Armstrong |
Chairman and Director |
February 28, 2024 |
| Jeffrey Armstrong |
|
|
|
|
| /s/ Jorge Beristain |
Director |
February 28, 2024 |
| Jorge Beristain |
|
|
|
|
| /s/ Claude Demby |
Director |
February 28, 2024 |
| Claude Demby |
|
|
|
|
| /s/ Christina Alvord |
Director |
February 28, 2024 |
| Christina Alvord |
|
|
|
|
| /s/ Michael Bless |
Director |
February 28, 2024 |
| Michael Bless |
|
|
|
|
|
|
|
| Index to Consolidated Financial Statements |
|
|
F-2 |
|
|
|
|
|
|
|
|
|
|
|
|
REPORT OF INDEPENDENT REGISTERED PUBLIC ACCOUNTING FIRM
To the shareholders and the Board of Directors of Piedmont Lithium Inc.,
Opinion on the Financial Statements
We have audited the accompanying consolidated balance sheets of Piedmont Lithium Inc. and subsidiaries (the "Company") as of December 31, 2023, and 2022, the related consolidated statements of operations, comprehensive loss, changes in equity, and cash flows, for each of the two years in the period ended December 31, 2023 and 2022, the six-month period ended December 31, 2021, and the year ended June 30, 2021, and the related notes (collectively referred to as the "financial statements"). In our opinion, the financial statements present fairly, in all material respects, the financial position of the Company as of December 31, 2023 and 2022, and the results of its operations and its cash flows for each of the years ended December 31, 2023 and 2022, the six months ended December 31, 2021, and the year ended June 30, 2021, in conformity with accounting principles generally accepted in the United States of America.
We have also audited, in accordance with the standards of the Public Company Accounting Oversight Board (United States) (PCAOB), the Company's internal control over financial reporting as of December 31, 2023, based on criteria established in Internal Control—Integrated Framework (2013) issued by the Committee of Sponsoring Organizations of the Treadway Commission and our report dated February 28, 2024, expressed an unqualified opinion on the Company's internal control over financial reporting.
Basis for Opinion
These financial statements are the responsibility of the Company's management. Our responsibility is to express an opinion on the Company's financial statements based on our audits. We are a public accounting firm registered with the PCAOB and are required to be independent with respect to the Company in accordance with the U.S. federal securities laws and the applicable rules and regulations of the Securities and Exchange Commission and the PCAOB.
We conducted our audits in accordance with the standards of the PCAOB. Those standards require that we plan and perform the audit to obtain reasonable assurance about whether the financial statements are free of material misstatement, whether due to error or fraud. Our audits included performing procedures to assess the risks of material misstatement of the financial statements, whether due to error or fraud, and performing procedures that respond to those risks. Such procedures included examining, on a test basis, evidence regarding the amounts and disclosures in the financial statements. Our audits also included evaluating the accounting principles used and significant estimates made by management, as well as evaluating the overall presentation of the financial statements. We believe that our audits provide a reasonable basis for our opinion.
Critical Audit Matters
The critical audit matters communicated below are matters arising from the current-period audit of the financial statements that were communicated or required to be communicated to the audit committee and that (1) relate to accounts or disclosures that are material to the financial statements and (2) involved our especially challenging, subjective, or complex judgments. The communication of critical audit matters does not alter in any way our opinion on the financial statements, taken as a whole, and we are not, by communicating the critical audit matters below, providing separate opinions on the critical audit matters or on the accounts or disclosures to which they relate.
Revenue Recognition – Provisional Revenue Adjustments – Refer to Notes 2 and 3 to the financial statements
Critical Audit Matter Description
The Company recognizes revenue from product sales at a point in time when performance obligations are satisfied under the terms of contracts with their customers. A performance obligation is deemed to be satisfied when control of the product is transferred to their customers, which is typically upon delivery to the shipping carrier. Revenue is measured as the amount of consideration expected to be received in exchange for transferring the goods. The Company is subject to provisional revenue adjustments associated with commodity price fluctuations for their spodumene concentrate sales, which are accounted for as variable consideration under ASC 606 – Revenue from Contracts with Customers. These adjustments require estimation until final settlement of the contract. When the final price has not been resolved by the end of a reporting period, the Company estimates the expected sales price based on the pricing terms within the relevant contract, current market pricing information, and known quality measurements, as applicable. Revenue is recognized to the extent it is probable a significant reversal of revenue will not occur when the final price is resolved.
Auditing the Company's estimates of variable consideration required extensive audit effort and a high degree of auditor judgment. For these reasons we identified the measurement of provisional revenue adjustments as a critical audit matter.
How the Critical Audit Matter Was Addressed in the Audit
Our audit procedures related to the measurement of provisional revenue adjustments included the following, among others:
•We evaluated the design and tested the operating effectiveness of controls the Company has in place relating to reviewing customer contracts to identify price adjustment clauses and estimating variable consideration.
•We evaluated the Company's accounting policy with respect to revenue recognition and variable consideration, as well as its process for identifying contracts that include potential price adjustment clauses.
•We selected all contracts with customers that included potential price adjustment clauses and performed the following:
•We read the customer contract to develop an understanding of clauses that could give rise to variable consideration and evaluated whether the Company's accounting conclusions with respect to those clauses were reasonable.
•We obtained and tested the mathematical accuracy of the Company's calculations of provisional adjustment. In making this evaluation we considered both the terms included in the customer contract and the Company's historical experience in estimating provisional adjustments.
•Evaluated the provisional adjustment estimate by developing a range of independent estimates and comparing our estimates to those used by management.
•Evaluated the appropriateness and consistency of the methods and assumptions used by management to develop the provisional adjustment estimate.
•We evaluated management’s footnotes disclosures regarding the Company’s accounting policies for provisional revenue adjustments and measuring variable consideration, and corresponding amounts recorded in the financial statements for the year ended December 31, 2023.
Accounting for Equity Method Investments – Refer to Notes 2 and 9 to the financial statements
Critical Audit Matter Description
The Company applies the equity method of accounting for investments in which they have significant influence as contemplated within Accounting Standards Codification (ASC) Topic 323 – “Investments – Equity Method and Joint Ventures.” Management has determined that they have significant influence over the Sayona Mining Limited, Sayona Quebec Inc., Atlantic Lithium Limited, and Vinland Lithium Inc. investments, and therefore have accounted for these investments in accordance with ASC Topic 323. The application of the accounting model under ASC Topic 323 requires an enhanced amount of professional judgment by management, including the initial determination and periodic reassessment of the ability to exert significant influence over the investee, evaluating the financial reporting impacts of foreign currency translation, changes in the value of the Company’s investments due to dilutive equity transactions by the investees, and the required financial statement disclosures. As of December 31, 2023, the Company has approximately $147.7 million recorded as investments in unconsolidated affiliates on its balance sheet, representing approximately 39% of total assets.
We identified the accounting for equity method investments as a critical audit matter due to the judgments made by management in applying the provisions of ASC 323 to investee-level transactions which impact either the ownership or valuation of its equity method investments. We performed audit procedures to evaluate the reasonableness of management’s conclusions based on current year facts and circumstances, which required a high degree of auditor judgment and an increased extent of effort, including the need to involve our equity method investment accounting specialists.
How the Critical Audit Matter Was Addressed in the Audit
Our audit procedures related to the accounting for equity method investments included the following, among others:
•We evaluated the design and tested the operating effectiveness of management’s controls over its equity method investments in unconsolidated affiliates during the year ended December 31, 2023.
•We evaluated the Company’s disclosures related to equity method investments, including a comparison of the footnote disclosures per the Form 10-K to other comparable disclosures in SEC filings.
•Performed substantive testing procedures as follows:
•Vouched additional contributions to cash paid to unconsolidated affiliates to amounts presented within the face of the financial statements and notes to the financial statements, and evaluated whether those additional contributions required reassessment of the Company’s significant influence over the investees.
•Evaluated the Company’s calculation of currency translation adjustments applicable to its equity method investments utilizing independently obtained third-party foreign exchange rates.
•Audited the Company’s calculation of the gains on dilution recorded during the year resulting from dilutive equity transactions by the investees, including agreeing information associated with those equity transactions to third-party statements where applicable, and to the amounts presented within the face of the financial statements and notes to the financial statements.
•We obtained representation from management asserting that the Company continues to account for certain investments under the equity method of accounting because the Company is able to exert significant influence, but not control, over the investees.
/s/ DELOITTE & TOUCHE LLP
Charlotte, North Carolina
February 28, 2024
We have served as the Company’s auditor since 2021.
PIEDMONT LITHIUM INC.
CONSOLIDATED STATEMENTS OF OPERATIONS
(In thousands, except per share amounts)
|
|
|
|
|
|
|
|
|
|
|
|
|
|
|
|
|
|
|
|
|
|
|
|
|
|
|
|
|
|
|
|
|
|
|
Years Ended
December 31, |
|
Six Months Ended
December 31, 2021 |
|
Year Ended
June 30, 2021 |
|
|
|
|
|
|
2023 |
|
2022 |
|
|
| Revenue |
|
|
|
|
|
$ |
39,817 |
|
|
$ |
— |
|
|
$ |
— |
|
|
$ |
— |
|
| Costs of sales |
|
|
|
|
|
34,138 |
|
|
— |
|
|
— |
|
|
— |
|
| Gross profit |
|
|
|
|
|
5,679 |
|
|
— |
|
|
— |
|
|
— |
|
|
|
|
|
|
|
|
|
|
|
|
|
|
| Exploration costs |
|
|
|
|
|
1,929 |
|
|
1,939 |
|
|
9,629 |
|
|
10,875 |
|
| Selling, general and administrative expenses |
|
|
|
|
|
43,319 |
|
|
29,449 |
|
|
10,956 |
|
|
8,861 |
|
| Total operating expenses |
|
|
|
|
|
45,248 |
|
|
31,388 |
|
|
20,585 |
|
|
19,736 |
|
| Income (loss) from equity method investments |
|
|
|
|
|
194 |
|
|
(8,352) |
|
|
(642) |
|
|
(65) |
|
| Loss from operations |
|
|
|
|
|
(39,375) |
|
|
(39,740) |
|
|
(21,227) |
|
|
(19,801) |
|
|
|
|
|
|
|
|
|
|
|
|
|
|
| Interest income |
|
|
|
|
|
3,859 |
|
|
1,153 |
|
|
— |
|
|
4 |
|
| Interest expense |
|
|
|
|
|
(39) |
|
|
(116) |
|
|
(113) |
|
|
(271) |
|
| (Loss) gain from foreign currency exchange |
|
|
|
|
|
(91) |
|
|
(88) |
|
|
(8) |
|
|
74 |
|
| Gain on dilution of equity method investments |
|
|
|
|
|
16,975 |
|
|
28,955 |
|
|
— |
|
|
— |
|
| Total other income (loss) |
|
|
|
|
|
20,704 |
|
|
29,904 |
|
|
(121) |
|
|
(193) |
|
| Loss before taxes |
|
|
|
|
|
(18,671) |
|
|
(9,836) |
|
|
(21,348) |
|
|
(19,994) |
|
| Income tax expense |
|
|
|
|
|
3,106 |
|
|
3,139 |
|
|
— |
|
|
— |
|
| Net loss |
|
|
|
|
|
$ |
(21,777) |
|
|
$ |
(12,975) |
|
|
$ |
(21,348) |
|
|
$ |
(19,994) |
|
|
|
|
|
|
|
|
|
|
|
|
|
|
|
|
|
|
|
|
|
|
|
|
|
|
|
| Basic and diluted net loss per weighted-average share |
|
|
|
|
|
$ |
(1.14) |
|
|
$ |
(0.74) |
|
|
$ |
(1.35) |
|
|
$ |
(1.48) |
|
|
|
|
|
|
|
|
|
|
|
|
|
|
|
|
|
|
|
|
|
|
|
|
|
|
|
| Basic and diluted weighted-average shares outstanding |
|
|
|
|
|
19,033 |
|
|
17,518 |
|
|
15,869 |
|
|
13,551 |
|
|
|
|
|
|
|
|
|
|
|
|
|
|
The accompanying notes are an integral part of these financial statements.
PIEDMONT LITHIUM INC.
CONSOLIDATED STATEMENTS OF COMPREHENSIVE LOSS
(In thousands)
|
|
|
|
|
|
|
|
|
|
|
|
|
|
|
|
|
|
|
|
|
|
|
|
|
|
|
|
|
|
|
|
|
|
|
Years Ended
December 31, |
|
Six Months Ended
December 31, 2021 |
|
Year Ended
June 30, 2021 |
|
|
|
|
|
|
2023 |
|
2022 |
|
|
| Net loss |
|
|
|
|
|
$ |
(21,777) |
|
|
$ |
(12,975) |
|
|
$ |
(21,348) |
|
|
$ |
(19,994) |
|
| Other comprehensive income (loss), net of tax: |
|
|
|
|
|
|
|
|
|
|
|
|
|
|
|
|
|
|
|
|
|
|
|
|
|
Foreign currency translation adjustment of equity method investments(1) |
|
|
|
|
|
1,570 |
|
|
(4,631) |
|
|
162 |
|
|
(31) |
|
| Other comprehensive income (loss), net of tax |
|
|
|
|
|
1,570 |
|
|
(4,631) |
|
|
$ |
162 |
|
|
(31) |
|
| Comprehensive loss |
|
|
|
|
|
$ |
(20,207) |
|
|
$ |
(17,606) |
|
|
$ |
(21,186) |
|
|
$ |
(20,025) |
|
__________________________
(1)Foreign currency translation adjustment of equity method investments is presented net of tax (expense) benefit of $(36) and $258 for the years ended December 31, 2023 and 2022, respectively. We did not reflect a tax expense during the six months ended December 31, 2021 and year ended June 30, 2021, because we had a full tax valuation allowance in impacted jurisdictions during these periods.
The accompanying notes are an integral part of these financial statements.
PIEDMONT LITHIUM INC.
CONSOLIDATED BALANCE SHEETS
(In thousands, except per share amounts)
|
|
|
|
|
|
|
|
|
|
|
|
|
|
|
|
|
December 31,
2023 |
|
December 31,
2022 |
| Assets |
|
|
|
| Cash and cash equivalents |
$ |
71,730 |
|
|
$ |
99,247 |
|
| Accounts receivable |
595 |
|
|
— |
|
|
|
|
|
| Other current assets |
3,829 |
|
|
2,612 |
|
| Total current assets |
76,154 |
|
|
101,859 |
|
| Property, plant and mine development, net |
127,086 |
|
|
71,541 |
|
|
|
|
|
| Other non-current assets |
30,353 |
|
|
18,873 |
|
| Equity method investments |
147,662 |
|
|
95,648 |
|
| Total assets |
$ |
381,255 |
|
|
$ |
287,921 |
|
|
|
|
|
| Liabilities and Stockholders’ Equity |
|
|
|
|
|
|
|
|
|
|
|
| Accounts payable and accrued expenses |
$ |
11,754 |
|
|
$ |
12,862 |
|
| Current portion of long-term debt |
149 |
|
|
425 |
|
| Other current liabilities |
29,463 |
|
|
124 |
|
| Total current liabilities |
41,366 |
|
|
13,411 |
|
| Long-term debt, net of current portion |
14 |
|
|
163 |
|
| Operating lease liabilities, net of current portion |
1,091 |
|
|
1,177 |
|
| Other non-current liabilities |
431 |
|
|
— |
|
| Deferred tax liabilities |
6,023 |
|
|
2,881 |
|
| Total liabilities |
48,925 |
|
|
17,632 |
|
| Commitments and contingencies (Note 15) |
|
|
|
| Stockholders’ equity: |
|
|
|
Common stock; $0.0001 par value, 100,000 shares authorized; 19,272 and 18,073 shares issued and outstanding at December 31, 2023 and December 31, 2022, respectively |
2 |
|
|
2 |
|
| Additional paid-in capital |
462,899 |
|
|
381,242 |
|
| Accumulated deficit |
(126,844) |
|
|
(105,658) |
|
| Accumulated other comprehensive loss |
(3,727) |
|
|
(5,297) |
|
| Total stockholders’ equity |
332,330 |
|
|
270,289 |
|
| Total liabilities and stockholders’ equity |
$ |
381,255 |
|
|
$ |
287,921 |
|
The accompanying notes are an integral part of these financial statements.
PIEDMONT LITHIUM INC.
CONSOLIDATED STATEMENTS OF CASH FLOWS
(In thousands)
|
|
|
|
|
|
|
|
|
|
|
|
|
|
|
|
|
|
|
|
|
|
|
|
|
Years Ended
December 31, |
|
Six Months Ended
December 31, 2021 |
|
Year Ended
June 30, 2021 |
|
2023 |
|
2022 |
|
|
| Cash flows from operating activities: |
|
|
|
|
|
|
|
| Net loss |
$ |
(21,777) |
|
|
$ |
(12,975) |
|
|
$ |
(21,348) |
|
|
$ |
(19,994) |
|
| Adjustments to reconcile net loss to net cash provided by (used in) operating activities: |
|
|
|
|
|
|
|
| Stock-based compensation expense |
9,516 |
|
|
3,490 |
|
|
2,003 |
|
|
1,319 |
|
| (Income) loss from equity method investments |
(194) |
|
|
8,352 |
|
|
642 |
|
|
65 |
|
| Gain on dilution of equity method investments |
(16,975) |
|
|
(28,955) |
|
|
— |
|
|
— |
|
| Deferred taxes |
3,106 |
|
|
3,139 |
|
|
— |
|
|
— |
|
| Depreciation and amortization |
272 |
|
|
74 |
|
|
9 |
|
|
12 |
|
| Noncash lease expense |
245 |
|
|
106 |
|
|
78 |
|
|
143 |
|
| Loss on sale of property, plant and mine development |
— |
|
|
12 |
|
|
— |
|
|
— |
|
| Unrealized loss on investment |
— |
|
|
30 |
|
|
— |
|
|
— |
|
| Changes in operating assets and liabilities: |
|
|
|
|
|
|
|
| Accounts receivable |
(595) |
|
|
— |
|
|
— |
|
|
— |
|
|
|
|
|
|
|
|
|
| Other assets |
(1,021) |
|
|
(201) |
|
|
(717) |
|
|
(1,385) |
|
| Operating lease liabilities |
(220) |
|
|
(97) |
|
|
(81) |
|
|
(144) |
|
| Accounts payable |
(1,281) |
|
|
1,413 |
|
|
(1,299) |
|
|
1,771 |
|
| Accrued expenses and other current liabilities |
30,494 |
|
|
(837) |
|
|
3,039 |
|
|
1,956 |
|
| Net cash provided by (used in) operating activities |
1,570 |
|
|
(26,449) |
|
|
(17,674) |
|
|
(16,257) |
|
| Cash flows from investing activities: |
|
|
|
|
|
|
|
|
|
|
|
|
|
|
|
| Capital expenditures |
(56,723) |
|
|
(25,732) |
|
|
(12,499) |
|
|
(18,207) |
|
| Advances to affiliates |
(9,361) |
|
|
(13,006) |
|
|
(4,310) |
|
|
— |
|
| Investments in equity method investments |
(33,239) |
|
|
(21,062) |
|
|
(43,604) |
|
|
(16,358) |
|
| Net cash used in investing activities |
(99,323) |
|
|
(59,800) |
|
|
(60,413) |
|
|
(34,565) |
|
| Cash flows from financing activities: |
|
|
|
|
|
|
|
| Proceeds from issuances of common stock, net of issuance costs |
71,084 |
|
|
122,059 |
|
|
— |
|
|
174,964 |
|
| Proceeds from exercise of stock options |
— |
|
|
279 |
|
|
557 |
|
|
349 |
|
| Principal payments on long-term debt |
(426) |
|
|
(1,087) |
|
|
(877) |
|
|
(696) |
|
Payments to tax authorities for employee stock-based
compensation |
(422) |
|
|
— |
|
|
— |
|
|
— |
|
| Net cash provided by (used in) financing activities |
70,236 |
|
|
121,251 |
|
|
(320) |
|
|
174,617 |
|
| Net (decrease) increase in cash |
(27,517) |
|
|
35,002 |
|
|
(78,407) |
|
|
123,795 |
|
| Cash and cash equivalents at beginning of period |
99,247 |
|
|
64,245 |
|
|
142,652 |
|
|
18,857 |
|
|
|
|
|
|
|
|
|
| Cash and cash equivalents at end of period |
$ |
71,730 |
|
|
$ |
99,247 |
|
|
$ |
64,245 |
|
|
$ |
142,652 |
|
|
|
|
|
|
|
|
|
| Supplemental disclosure of cash flow information: |
|
|
|
|
|
|
|
| Noncash capital expenditures in accounts payable and accrued expenses |
$ |
3,955 |
|
|
$ |
5,557 |
|
|
$ |
— |
|
|
$ |
— |
|
|
|
|
|
|
|
|
|
| Cash paid for interest |
39 |
|
|
115 |
|
|
113 |
|
|
289 |
|
| Stock issuance in lieu of cash |
1,837 |
|
|
— |
|
|
— |
|
|
— |
|
| Capitalized stock-based compensation |
233 |
|
|
282 |
|
|
— |
|
|
— |
|
| Noncash acquisitions of mining interests financed by sellers |
— |
|
|
— |
|
|
241 |
|
|
690 |
|
The accompanying notes are an integral part of these financial statements.
PIEDMONT LITHIUM INC.
CONSOLIDATED STATEMENTS OF CHANGES IN EQUITY
(In thousands)
|
|
|
|
|
|
|
|
|
|
|
|
|
|
|
|
|
|
|
|
|
|
|
|
|
|
|
|
|
|
|
|
|
|
|
|
|
Common Stock |
|
Additional
Paid-In
Capital |
|
Accumulated
Deficit |
|
Accumulated
Other
Comprehensive Loss |
|
Total
Stockholders’
Equity |
|
Shares |
|
Amount |
|
|
|
|
| June 30, 2020 |
10,357 |
|
|
$ |
1 |
|
|
$ |
76,188 |
|
|
$ |
(51,589) |
|
|
$ |
(797) |
|
|
$ |
23,803 |
|
| Issuance of common stock, net |
5,250 |
|
|
1 |
|
|
174,964 |
|
|
— |
|
|
— |
|
|
174,965 |
|
| Stock-based compensation, net of forfeitures |
— |
|
|
— |
|
|
1,319 |
|
|
— |
|
|
— |
|
|
1,319 |
|
| Shares issued for exercise/vesting of share-based compensation awards |
153 |
|
|
— |
|
|
349 |
|
|
— |
|
|
— |
|
|
349 |
|
| Expiration of stock options |
— |
|
|
— |
|
|
(248) |
|
|
248 |
|
|
— |
|
|
— |
|
|
|
|
|
|
|
|
|
|
|
|
|
| Conversion of performance rights |
5 |
|
|
— |
|
|
— |
|
|
— |
|
|
— |
|
|
— |
|
| Equity method investments adjustments in other comprehensive income (loss), net of tax |
— |
|
|
— |
|
|
— |
|
|
— |
|
|
(31) |
|
|
(31) |
|
| Net loss |
— |
|
|
— |
|
|
— |
|
|
(19,994) |
|
|
— |
|
|
(19,994) |
|
| June 30, 2021 |
15,765 |
|
|
2 |
|
|
252,572 |
|
|
(71,335) |
|
|
(828) |
|
|
180,411 |
|
|
|
|
|
|
|
|
|
|
|
|
|
| Stock-based compensation, net of forfeitures |
— |
|
|
— |
|
|
2,003 |
|
|
— |
|
|
— |
|
|
2,003 |
|
| Shares issued for exercise/vesting of stock-based compensation awards |
104 |
|
|
— |
|
|
557 |
|
|
— |
|
|
— |
|
|
557 |
|
|
|
|
|
|
|
|
|
|
|
|
|
|
|
|
|
|
|
|
|
|
|
|
|
| Conversion of performance rights |
25 |
|
|
— |
|
|
— |
|
|
— |
|
|
— |
|
|
— |
|
| Equity method investments adjustments in other comprehensive income (loss), net of tax |
— |
|
|
— |
|
|
— |
|
|
— |
|
|
162 |
|
|
162 |
|
| Net loss |
— |
|
|
— |
|
|
— |
|
|
(21,348) |
|
|
— |
|
|
(21,348) |
|
| December 31, 2021 |
15,894 |
|
|
2 |
|
|
255,132 |
|
|
(92,683) |
|
|
(666) |
|
|
161,785 |
|
| Issuance of common stock, net of issuance costs |
2,013 |
|
|
— |
|
|
122,059 |
|
|
— |
|
|
— |
|
|
122,059 |
|
| Stock-based compensation, net of forfeitures |
— |
|
|
— |
|
|
3,772 |
|
|
— |
|
|
— |
|
|
3,772 |
|
| Shares issued for exercise/vesting of stock-based compensation awards |
166 |
|
|
— |
|
|
279 |
|
|
— |
|
|
— |
|
|
279 |
|
|
|
|
|
|
|
|
|
|
|
|
|
|
|
|
|
|
|
|
|
|
|
|
|
|
|
|
|
|
|
|
|
|
|
|
|
| Equity method investments adjustments in other comprehensive income (loss), net of tax |
— |
|
|
— |
|
|
— |
|
|
— |
|
|
(4,631) |
|
|
(4,631) |
|
| Net loss |
— |
|
|
— |
|
|
— |
|
|
(12,975) |
|
|
— |
|
|
(12,975) |
|
| December 31, 2022 |
18,073 |
|
|
2 |
|
|
381,242 |
|
|
(105,658) |
|
|
(5,297) |
|
|
270,289 |
|
| Issuance of common stock, net of issuance costs |
1,160 |
|
|
— |
|
|
72,921 |
|
|
— |
|
|
— |
|
|
72,921 |
|
| Stock-based compensation, net of forfeitures |
— |
|
|
— |
|
|
9,749 |
|
|
— |
|
|
— |
|
|
9,749 |
|
| Expiration of stock options |
— |
|
|
— |
|
|
(591) |
|
|
591 |
|
|
— |
|
|
— |
|
| Shares issued for exercise/vesting of stock-based compensation awards |
50 |
|
|
— |
|
|
— |
|
|
— |
|
|
— |
|
|
— |
|
| Shares surrendered for tax obligations for stock-based transactions |
(11) |
|
|
— |
|
|
(422) |
|
|
— |
|
|
— |
|
|
(422) |
|
|
|
|
|
|
|
|
|
|
|
|
|
| Equity method investments adjustments in other comprehensive income (loss), net of tax |
— |
|
|
— |
|
|
— |
|
|
— |
|
|
1,570 |
|
|
1,570 |
|
| Net loss |
— |
|
|
— |
|
|
— |
|
|
(21,777) |
|
|
— |
|
|
(21,777) |
|
| December 31, 2023 |
19,272 |
|
|
$ |
2 |
|
|
$ |
462,899 |
|
|
$ |
(126,844) |
|
|
$ |
(3,727) |
|
|
$ |
332,330 |
|
The accompanying notes are an integral part of these financial statements.
PIEDMONT LITHIUM INC.
NOTES TO THE CONSOLIDATED FINANCIAL STATEMENTS
1.DESCRIPTION OF COMPANY
Nature of Business
Piedmont Lithium Inc. (“Piedmont Lithium,” “we,” “our,” “us,” or “Company”) is a U.S. based, development-stage, multi-asset, integrated lithium business in support of a clean energy economy and U.S. and global energy security. We plan to supply lithium hydroxide to the electric vehicle and battery manufacturing supply chains in North America by processing spodumene concentrate produced from assets we own or in which we have an economic interest.
Our portfolio of wholly-owned projects includes Tennessee Lithium, a proposed merchant lithium hydroxide manufacturing plant in McMinn County, Tennessee, and Carolina Lithium, a proposed, fully integrated spodumene ore-to-lithium hydroxide project in Gaston County, North Carolina. The balance of our project portfolio includes strategic investments in lithium assets in Quebec, Canada, including the operating NAL mine, in Ghana, West Africa with Atlantic Lithium, including Ewoyaa, and in Newfoundland, Canada with Vinland Lithium.
Basis of Presentation
Our consolidated financial statements and related notes have been prepared on the accrual basis of accounting in conformity with U.S. GAAP and in conformity with the rules and regulations of the SEC. The consolidated financial statements include the accounts of the Company and its wholly-owned subsidiaries. All intercompany accounts and transactions have been eliminated in consolidation. Our reporting currency is U.S. dollars, and we operate on a calendar fiscal year. These consolidated financial statements reflect all adjustments and reclassifications that, in the opinion of management, are considered necessary for a fair statement of the results of operations, financial position, and cash flows for the periods presented.
Use of Estimates
The preparation of consolidated financial statements in conformity with U.S. GAAP requires management to make estimates, assumptions, and allocations that affect amounts reported in the consolidated financial statements and related notes. Significant items that are subject to such estimates and assumptions include, but are not limited to, long-lived assets, fair value of stock-based compensation awards, income tax uncertainties, valuation of deferred tax assets, contingent assets and liabilities, legal claims, asset impairments, provisional revenue adjustments, collectability of receivables and environmental remediation. Actual results could differ due to the uncertainty inherent in the nature of these estimates.
We base our estimates and assumptions on current facts, historical experience, and various other factors that we believe to be reasonable under the circumstances, the results of which form the basis for making judgments about the carrying values of assets and liabilities and the accrual of costs and expenses that are not readily apparent from other sources. Actual results may differ materially and adversely from our estimates. To the extent there are material differences between estimates and actual results, future results of operations will be affected.
Risk and Uncertainties
We are subject to a number of risks similar to those of other companies of similar size in our industry, including, but not limited to, the success of our exploration and development activities, success of our equity method investments in international projects, permitting and construction delays, the need for additional capital or financing to fund operating losses, competition from substitute products and services, protection of proprietary technology, litigation, and dependence on key individuals.
We have accumulated deficits of $126.8 million and $105.7 million as of December 31, 2023 and December 31, 2022, respectively. We have cash available on hand and believe this cash will be sufficient to fund our operations and meet our obligations as they come due for at least one year from the date these consolidated financial statements are issued. In the event our cash requirements change during the next twelve months, management has the ability and commitment to make corresponding changes to our operating expenses, capital expenditures, and investments as necessary. We may continue to incur investing net cash outflows associated with, among other things, funding capital projects, development-stage technical studies, permitting activities associated with our projects, funding our expected commitments in Quebec and Ghana, maintaining and acquiring exploration properties and undertaking ongoing exploration activities. Our long-term success is dependent upon our ability to successfully raise additional capital or financing or enter into strategic partnership opportunities.
Our long-term success is also dependent upon our ability to obtain certain permits and approvals, develop our planned portfolio of projects, earn revenues, and achieve profitability.
Our consolidated financial statements have been prepared on a going-concern basis, which contemplates the realization of assets and the satisfaction of liabilities in the normal course of business.
2.SUMMARY OF SIGNIFICANT ACCOUNTING POLICIES
Revenue Recognition
We recognize revenue from product sales at a point in time when performance obligations are satisfied under the terms of contracts with our customers. A performance obligation is deemed to be satisfied when control of the product is transferred to our customer, which is typically upon delivery to the shipping carrier. Where a contract contains more than one distinct performance obligation, the transaction price is allocated to each performance obligation based on the standalone selling price of each performance obligation, although these situations do not occur frequently and are generally not built into our contracts. Revenue is measured as the amount of consideration expected to be received in exchange for transferring the goods. Initial pricing is typically billed 5 days to 30 days after the departure of the shipment and paid between 15 days to 75 days. Final adjustments to prices may take longer to resolve. When the final price has not been resolved by the end of a reporting period, we estimate the expected sales price based on the initial price, market pricing and known quality measurements. We warrant to our customers that our products conform to mutually agreed product specifications.
We have elected to account for shipping and handling costs for spodumene concentrate contracts as fulfillment activities and not as promised goods or services; therefore, these activities are not considered separate performance obligations. We have elected the practical expedient relating to significant financing components and as such will not consider the possibility of a contract having a significant financing component (which would effectively attribute a portion of the sales price to interest income) unless, if at contract inception, the expected payment terms (from time of delivery or other relevant criterion) are more than one year.
Our lithium products are sold to global and regional customers in the electric vehicle and electronics markets, among others. We currently work with end users in a number of markets to tailor our products to their specifications and will work with these end users as we add more products.
Exploration Costs
We incur costs in resource exploration, evaluation and development during the different phases of our resource development projects. Exploration costs incurred before the declaration of proven and probable resources, which primarily include exploration, drilling, engineering, metallurgical test-work, and compensation for employees associated with exploration activities, are expensed as incurred. After proven and probable resources are declared, exploration and mine development costs necessary to bring the property to commercial capacity or increase the capacity or useful life are capitalized.
Foreign Currencies
These consolidated financial statements have been presented in our reporting currency, U.S. dollars.
Gains and losses arising from translations or settlements of foreign currency denominated transactions or balances are included in the determination of income. Foreign currency translation adjustments resulting from the change in functional currency are included in “Other comprehensive income (loss), net of tax,” and gains and losses resulting from foreign currency transactions are presented in “(Loss) gain from foreign currency exchange” in in our consolidated financial statements.
Loss per Share
We compute loss per share in accordance with ASC Topic 260, “Earnings per Share.” Basic net loss per common share is computed by dividing net loss by the weighted-average number of shares of common shares outstanding during the period. Diluted net loss per share of common stock is computed by giving effect to all potential dilutive shares of common stock, including options, restricted stock units and performance awards. Basic and diluted net loss per share of common stock were the same for all periods presented as the impact of all potentially dilutive securities outstanding was anti-dilutive.
Stock-based Compensation
We record stock-based compensation in accordance with ASC Topic 718, “Stock Compensation.” Equity-settled stock-based payments are provided to directors, officers, employees, consultants and other advisors. These stock-based payments are measured at the fair value of the equity instrument at the grant date in accordance with ASC Topic 718. Fair value is determined using the Black-Scholes valuation model as well as the Monte Carlo simulation. We have applied a graded (tranche-by-tranche) attribution method and record stock-based compensation expense on an accelerated basis over the vesting period of the share award. Forfeitures are accounted for in the period incurred.
Fair Value of Financial Instruments
Fair value is the exchange price that would be received for an asset or paid to transfer a liability (exit price) in the principal or most advantageous market for the asset or liability in an orderly transaction between market participants on the measurement date.
We follow ASC Topic 820, “Fair Value Measurement and Disclosure,” which establishes a three-level valuation hierarchy for disclosure of fair value measurements. The valuation hierarchy categorizes assets and liabilities measured at fair value into one of three different levels depending on the observability of the inputs employed in the measurement. The three levels are defined as follows:
Level 1:Quoted prices (unadjusted) for identical assets or liabilities in active markets.
Level 2:Inputs other than quoted prices included within Level 1 that are either directly or indirectly observable for the asset or liability, including quoted prices for similar assets or liabilities in active markets, quoted prices for identical or similar assets or liabilities in inactive markets, inputs other than quoted prices that are observable for the asset or liability and inputs that are derived from observable market data by correlation or other means.
Level 3:Inputs for the asset or liability that are not based on observable market data (unobservable inputs).
The level within which the financial asset or liability is classified is determined based on the lowest level of significant input to the fair value measurement.
Measurement of Fair Value
Our material financial instruments consist primarily of cash and cash equivalents, investments in equity securities, trade and other payables, and long-term debt as follows:
•Long-term debt—As of December 31, 2023 and 2022, we had $0.2 million and $0.6 million, respectively, of principal debt outstanding associated with seller financed loans. The carrying value of our long-term debt approximates its estimated fair value.
•As of December 31, 2023 and 2022, we had $0.5 million and $0.5 million, respectively, of investments in equity securities which are recorded at fair value based on Level 3 inputs. See Note 10—Other Assets and Liabilities.
•Other financial instruments—The carrying amounts of cash and cash equivalents and trade and other payables approximate fair value due to their short-term nature.
Level 3 activity was not material for all periods presented.
Income Taxes
We account for income taxes using the asset and liability method. Under the asset and liability method, deferred tax assets and liabilities are recognized for the estimated future tax consequences attributable to differences between the financial statement carrying amounts of existing assets and liabilities and their respective tax bases. In addition, deferred tax assets are also recorded with respect to net operating losses and other tax attribute carryforwards. Deferred tax assets and liabilities are measured using enacted tax rates in effect for the year in which those temporary differences are expected to be recovered or settled. Valuation allowances are established when realization of the benefit of deferred tax assets is not deemed to be more likely than not. The effect on deferred tax assets and liabilities of a change in tax rates is recognized in income in the period that includes the enactment date.
We intend to continue maintaining a valuation allowance on our deferred tax assets if, in our judgement, it appears that it is more likely than not that all or some portion of the asset will not be realized. When assessing the need for a valuation allowance, we considered all available evidence, including all potential sources of taxable income, future reversals of taxable temporary differences, projections of taxable income, and income from tax planning strategies, as well as any other available and relevant information. Existing valuation allowances are re-examined each period. If it were determined that it is more likely than not that a deferred tax asset will be realized, the appropriate amount of the valuation allowance, if any, would be released in the period this determination is made.
We only recognize a tax benefit after concluding that it is more likely than not that the benefit will be sustained upon audit by the respective taxing authority based solely on the technical merits of the associated tax position. Once the recognition threshold is met, we recognize a tax benefit measured as the largest amount of the tax benefit that, in our judgment, is greater than 50% likely to be realized. Interest and penalties related to income tax liabilities are included in “Income tax expense” in our consolidated statements of operations.
Equity Method Investments
We apply the equity method of accounting for investments when we have significant influence, but not controlling interest in the investee. Judgment regarding the level of influence over each equity method investment includes key factors such as ownership interest, representation on the board of directors, participation in policy-making decisions, operational decision-making authority, and material intercompany transactions. In applying the equity method, we record the investment at cost and subsequently increase or decrease the carrying amount of the investment by our proportionate share of the net earnings or losses and other comprehensive income of the investee, adjusted for differences between their local GAAP and U.S. GAAP. Our investment balance is also adjusted for currency translation adjustments representing fluctuations between the functional currency of the investees. The carrying value of our equity method investments is reported as “Equity method investments”, adjustments related to foreign currency adjustments and our proportional shares of other comprehensive income (loss) is reported in “Accumulated other comprehensive loss” in our consolidated balance sheets. For all equity method investments, we record our share of an investee’s income or loss on a one quarter lag. We evaluate material events occurring during the quarter lag to determine whether the effects of such events should be disclosed in our financial statements. We classify distributions received from equity method investments using the cumulative earnings approach on our consolidated statements of cash flows. A change in our proportionate share of an investee’s equity resulting from issuance of common shares or in-substance common shares by the investee to third parties is recorded as a gain or loss in our consolidated statements of operations in accordance with ASC Topic 323, “Investments-Equity Method and Joint Ventures,” (Subtopic 10-40-1). We assess investments for impairment whenever events or changes in circumstances indicate that the carrying value of an investment may be impaired. If a decline in the value of an equity method investment is determined to be other than temporary, then we record a loss as a component of our share of earnings or losses of the equity method investee in the current period. There were $2.2 million in impairment losses for the year ended December 31, 2023. No impairment losses were recorded on equity method investments for any other period presented. See Note 9—Equity Method Investments for further information on our equity method investments.
Leases
We account for leases in accordance with ASC Topic 842, “Leases,” which requires lessees to recognize lease liabilities and ROU assets on the balance sheet for contracts that provide lessees with the right to control the use of identified assets. As part of this adoption, we made certain accounting policy elections which are detailed in the recently adopted accounting pronouncements sub-section in Note 12—Leases, to the consolidated financial statements in our Annual Report. We evaluate whether our contractual arrangements contain leases at the inception of such arrangements. Specifically, management considers whether we control the underlying asset and have the right to obtain substantially all of the economic benefits or outputs from the asset.
ROU lease assets represent our right to use an underlying asset for the lease term, and lease liabilities represent the obligation to make lease payments. Both the ROU lease asset and liability are recognized as of the lease commencement date based on the present value of the lease payments over the lease term. Our leases do not provide an implicit borrowing rate that can readily be determined. Therefore, we apply a discount rate based on the incremental borrowing rate, which is determined using our synthetic credit rating and other information available as of the lease commencement date. ROU lease assets also include any lease payments made before their contractual due dates and exclude any lease incentives.
Our lease agreements may include options to extend the lease term or to terminate the lease early. We include options to extend or terminate leases upon determination of the ROU lease asset and liability when we are reasonably certain we will exercise these options. Operating lease expense attributable to lease payments is recognized on a straight-line basis over the lease term and is included in “Selling, general and administrative expenses” in the consolidated statements of operations.
We evaluate ROU assets for impairment consistent under our impairment of long-lived assets policy. We had no sales-type or finance leases as of December 31, 2023 and 2022.
Cash and Cash Equivalents
We consider all highly liquid instruments with a maturity of three months or less at the time of issuance to be cash equivalents. We maintain cash deposits with high credit quality financial institutions. The deposits with these financial institutions may exceed the federally insured limits; however, these deposits typically are redeemable upon demand. We have not experienced any losses because of these deposits and do not expect to incur any losses in the future.
Long-Lived Assets
Mining Interests
Mining interests are recorded at cost and include land acquisition payments and land option payments to landowners, which include legal fees and other direct costs to enter into these contract agreements. We own land, specifically surface properties and the associated mineral rights, as part of Carolina Lithium in the U.S., specifically in North Carolina. We have entered into exclusive option agreements or land acquisition agreements, which upon exercise, allow us to purchase, or in some cases lease, surface properties and the associated mineral rights in North Carolina from landowners. For those properties under option, no liability is recorded until we are certain of exercising the option. Mining interests in the exploration and development stage are not amortized until the underlying property is converted to the production stage, at which point the mining interests are depleted over the estimated recoverable proven and probable reserves.
Development stage mining interests represent interests in properties under development that contain proven and probable reserves. Exploration stage mining interests represent interests in properties that are believed to potentially contain mineralized material consisting of: (i) mineralized material within pits; mineralized material with insufficient drill spacing to qualify as proven and probable reserves as well as and mineralized material in close proximity to proven and probable reserves; (ii) around-mine exploration potential not immediately adjacent to existing reserves and mineralization, but located within the immediate mine area; (iii) other mine-related exploration potential that is not part of current mineralized material and is comprised mainly of material outside of the immediate mine area; (iv) greenfield exploration potential that is not associated with any other production, development or exploration stage property, as described above; or (v) any acquired right to explore or extract a potential mineral deposit. The Company’s mineral rights generally are enforceable regardless of whether proven and probable reserves have been established.
Mine Development
Mine development assets include engineering and metallurgical test-work, drilling and other related costs to delineate an ore body, and the removal of overburden to initially expose an ore body at open pit surface mines. Costs incurred before mineral resources are classified as proven and probable reserves are expensed and recorded to “Exploration costs” in our statements of operations. Capitalization of mine development project costs begins once mineral resources are classified as proven and probable reserves. Drilling and related costs are capitalized for an ore body where proven and probable reserves exist and the activities are directed at obtaining additional information on the ore body or converting mineralized material to proven and probable reserves. All other drilling and related costs are expensed as incurred. The cost of removing overburden and waste materials to access the ore body at an open pit mine prior to the production phase are referred to as pre-stripping costs. Pre-stripping costs will be capitalized during the development of an open pit mine. The removal, production, and sale of de minimis salable materials may occur during the development phase of an open pit mine and are assigned incremental mining costs related to the removal of that material. Mine development assets will be depleted using the units-of-production method based on estimated recoverable metric tons in proven and probable reserves. To the extent that these costs benefit an entire ore body, they will be depleted over the estimated life of the ore body. As of December 31, 2023, we had no wholly owned projects in the production phase, and we did not record depletion expense for any of our mine development assets.
Property, Plant and Equipment
Property, plant and equipment is recorded at cost, net of accumulated depreciation and depletion. Depreciation is computed on a straight-line basis over the estimated useful lives.
Impairment of Long-Lived Assets
Assets that are subject to depreciation, depletion or amortization are reviewed for impairment whenever events or changes in circumstances indicate that the carrying amount of the asset may not be recoverable, or for non-depreciable assets in accordance with ASC Topic 360, “Property, Plant, and Equipment.” Circumstances which could trigger a review include, but are not limited to: significant decreases in the market price of the asset; significant adverse changes in the business climate or legal factors; accumulation of costs significantly in excess of the amount originally expected for the acquisition or construction of the asset; current period cash flow or operating loss combined with a history of losses or a forecast of continuing losses associated with the use of the asset; and current expectation that the asset will more likely than not be sold or disposed before the end of its estimated useful life.
Recoverability of assets is measured by a comparison of the carrying amount of an asset to estimated undiscounted future cash flows expected to be generated by an asset. If the carrying amount of an asset exceeds its estimated future undiscounted cash flows, an impairment charge is recognized at the amount by which the carrying amount exceeds the estimated fair value of the asset. The estimated fair value is determined using a discounted cash flow analysis. Any impairment in value is recognized as an expense in the period when the impairment occurs. We did not recognize impairment charges associated with long-lived assets for the years ended December 31, 2023 and 2022, the six months ended December 31, 2021 and the year ended June 30, 2021.
Asset Retirement Obligations
We follow the provisions of ASC Topic 410, “Asset Retirement and Environmental Obligations,” which establishes standards for the initial measurement and subsequent accounting for obligations associated with the sale, abandonment or other disposal of long-lived tangible assets arising from the acquisition, construction or development and for normal operations of such assets. We record the fair value of a liability for an asset retirement obligation as an asset and liability when there is a legal obligation associated with the retirement of a tangible long-lived asset and the liability can be reasonably estimated. The legal obligation to perform the asset retirement activity is unconditional, even though uncertainty may exist about the timing and/or method of settlement that may be beyond the entity’s control. See Note 15—Commitments and Contingencies.
Recently Issued and Adopted Accounting Pronouncements
We have considered the applicability and impact of accounting pronouncements that have been issued by the FASB and other standard setting organizations which are not yet effective and which we have not yet adopted. The impact on our financial position and results of operations from adoption of these standards is not expected to be material.
3.REVENUE
We recognize revenue from product sales at a point in time when performance obligations are satisfied under the terms of contracts with our customers. A performance obligation is deemed to be satisfied when control of the product is transferred to our customer, which is typically upon delivery to the shipping carrier. There currently are no contracts with multiple performance obligations and there have been no unsatisfied performance obligations. Revenue is measured as the amount of consideration expected to be received in exchange for transferring the goods. Initial pricing is typically billed 5 days to 30 days after the departure of the shipment and paid between 15 days to 75 days. Final adjustments to prices may take longer to resolve. When the final price has not been resolved by the end of a reporting period, we estimate the expected sales price based on the initial price, market pricing and known quality measurements. We warrant to our customers that our products conform to mutually agreed product specifications.
In the year ended December 31, 2023, three customers accounted for 100% of total revenue. All of the sales related to these three customers originated in North America. We evaluate the collectability of our accounts receivable on an individual customer basis. We had no reserve for uncollectible accounts as of December 31, 2023.
There are no contract assets or contract liabilities as of December 31, 2023.
Revenue for the year ended December 31, 2023 is reflected in the following table:
|
|
|
|
|
|
|
|
|
|
|
|
|
|
|
|
|
|
|
|
|
| (in thousands) |
|
|
|
|
|
|
| Spodumene concentrate sales |
|
|
|
|
|
$ |
54,898 |
|
| Provisional revenue adjustments |
|
|
|
|
|
(15,081) |
|
| Revenue |
|
|
|
|
|
$ |
39,817 |
|
We are subject to provisional revenue adjustments associated with commodity price fluctuations for our spodumene concentrate sales. These adjustments are unknown until final settlement.
There was no revenue during the year ended December 31, 2022, the six months ended December 31, 2021 or the year ended June 30, 2021.
4.STOCK-BASED COMPENSATION
Stock Incentive Plans
The Stock Incentive Plan authorized the grant of stock options, stock appreciation rights, restricted stock units and restricted stock, any of which may be performance-based. Our Leadership and Compensation Committee determines the exercise price for stock options and the base price of stock appreciation rights, which may not be less than the fair market value of our common stock on the date of grant. Generally, stock options or stock appreciation rights vest after three years of service and expire at the end of ten years. PRAs vest upon achievement of certain pre-established performance targets that are based on specified performance criteria over a performance period. As of December 31, 2023, 2,188,648 shares of common stock were available for issuance under our Stock Incentive Plan.
We include the expense related to stock-based compensation in the same financial statement line item as cash compensation paid to the same employee. As of December 31, 2023, we had remaining unvested stock-based compensation expense of $7.5 million to be recognized through December 2025. Additionally, and if applicable, we capitalize personnel expenses attributable to the development of our mine and construction of our plants, including stock-based compensation expenses. We recognize share-based award forfeitures as they occur.
Stock-based compensation related to all stock-based incentive plans is presented in the following table:
|
|
|
|
|
|
|
|
|
|
|
|
|
|
|
|
|
|
|
|
|
|
|
|
|
|
|
|
|
|
|
Years Ended
December 31, |
|
Six Months Ended
December 31, 2021 |
|
Year Ended
June 30, 2021 |
| (in thousands) |
|
|
|
|
2023 |
|
2022 |
|
|
| Components of stock-based compensation: |
|
|
|
|
|
|
|
|
|
|
|
| Stock-based compensation |
|
|
|
|
$ |
9,770 |
|
|
$ |
4,631 |
|
|
$ |
2,003 |
|
|
$ |
1,319 |
|
| Stock-based compensation forfeitures |
|
|
|
|
(21) |
|
|
(859) |
|
|
— |
|
|
— |
|
Stock-based compensation, net of forfeitures |
|
|
|
|
$ |
9,749 |
|
|
$ |
3,772 |
|
|
$ |
2,003 |
|
|
$ |
1,319 |
|
|
|
|
|
|
|
|
|
|
|
|
|
| Presentation of stock-based compensation in the consolidated financial statements: |
|
|
|
|
| Exploration costs |
|
|
|
|
$ |
154 |
|
|
$ |
161 |
|
|
$ |
688 |
|
|
$ |
495 |
|
| Selling, general and administrative expenses |
|
|
|
|
9,362 |
|
|
3,329 |
|
|
1,315 |
|
|
824 |
|
Stock-based compensation expense, net of forfeitures(1) |
|
|
|
|
9,516 |
|
|
3,490 |
|
|
2,003 |
|
|
1,319 |
|
Capitalized stock-based compensation(2) |
|
|
|
|
233 |
|
|
282 |
|
|
— |
|
|
— |
|
Stock-based compensation, net of forfeitures |
|
|
|
|
$ |
9,749 |
|
|
$ |
3,772 |
|
|
$ |
2,003 |
|
|
$ |
1,319 |
|
__________________________
(1)We did not reflect a tax benefit associated with stock-based compensation expense in the consolidated statements of operations because we had a full tax valuation allowance during these periods. As such, the table above does not reflect the tax impacts of stock-based compensation expense.
(2)These costs relate to direct labor costs associated with our Tennessee operations and Carolina Lithium projects and are included in “Property, plant and mine development, net” in our consolidated balance sheets.
Stock Option Awards
Stock options may be granted to employees, officers, non-employee directors and other service providers. For stock option awards, the fair value is estimated at the date of grant using the Black-Scholes valuation model and the expense is recognized over the option vesting period.
The following assumptions were used to estimate the fair value of stock options granted during the periods presented below:
|
|
|
|
|
|
|
|
|
|
|
|
|
|
|
|
|
|
|
Years Ended |
|
December 31,
2023 |
|
December 31,
2022 |
|
June 30,
2021 |
| Expected life of options (in years) |
6.2 - 6.4 |
|
5.3 - 6.4 |
|
5.3 - 6.3 |
| Risk-free interest rate |
3.9% - 4.2% |
|
1.1% - 3.4% |
|
0.9% - 1.2% |
| Assumed volatility |
40% |
|
50% |
|
50% |
| Expected dividend rate |
0% |
|
0% |
|
0% |
There were no stock options granted during the six months ended December 31, 2021.
Restricted Stock Unit Awards
RSUs are granted to employees and non-employee directors based on the market price of our common stock on the grant date and recognized as stock-based compensation expense over the vesting period, subject to the passage of time and continued service during the vesting period. In some instances, awards may vest concurrently with or following an employee’s termination.
Performance Rights Awards
As of December 31, 2023, there were approximately 22,000 unvested Milestone PRAs and 64,000 unvested TSR PRAs. The awards become eligible to vest only if the goals are achieved and will vest only if the grantee remains employed by the Company through each applicable vesting date, subject to certain accelerated vesting terms for qualified terminations. Each performance right converts into one share of common stock upon vesting of the performance right.
We determine the fair value of Milestone PRAs based upon the market price of our common stock on the grant date. Milestone PRAs are subject to certain milestones related to construction, feasibility studies, and offtake agreements, which must be satisfied in order for PRAs to vest.
We estimate the fair value of the TSR PRAs at the grant date using a Monte Carlo simulation. The Monte Carlo simulation fair value model requires the use of highly subjective and complex assumptions, including price volatility of the underlying stock. A Monte Carlo simulation model was used to determine the grant date fair value by simulating a range of possible future stock prices for the Company and each member of the peer group over the performance periods. Compensation expense is recognized based upon the assumption of 100% achievement of the TSR goal and is reflected over the service period of the award. Compensation expense will not be reversed even if the threshold level of TSR is never achieved. The number of shares that may vest ranges from 0% to 200% of the target amount. The awards, which range from 1 year to 3 years, provide for a partial payout based on actual performance at the conclusion of the performance period.
The following assumptions were used in the Monte Carlo simulation for TSR PRAs granted during the year ended December 31, 2023:
|
|
|
|
|
|
| Expected term (in years) |
1 - 3 |
| Risk-free interest rate |
4.9% |
| Assumed volatility |
60.0% |
| Expected dividend yield |
— |
A summary of activity relating to our share-based awards is reflected in the following table:
|
|
|
|
|
|
|
|
|
|
|
|
|
|
|
|
|
|
|
|
|
|
|
|
|
|
|
|
|
|
|
|
|
|
|
|
| (in thousands) |
Stock Option Awards |
|
Weighted-
Average
Exercise Price
(per share) |
|
Restricted Stock Units |
|
Weighted-
Average
Grant-Date
Fair Value
(per share) |
|
Performance Rights Awards |
|
Weighted-
Average
Grant-Date
Fair Value
(per share) |
| June 30, 2020 |
536 |
|
|
$ |
16.88 |
|
|
— |
|
|
$ |
— |
|
|
50 |
|
|
$ |
5.20 |
|
| Granted |
135 |
|
|
35.14 |
|
|
37 |
|
|
64.08 |
|
|
10 |
|
|
6.50 |
|
| Exercised or surrendered |
(15) |
|
|
12.38 |
|
|
— |
|
|
— |
|
|
— |
|
|
— |
|
| Expired/Vested |
(263) |
|
|
15.97 |
|
|
— |
|
|
— |
|
|
— |
|
|
— |
|
| June 30, 2021 |
393 |
|
|
21.16 |
|
|
37 |
|
|
64.08 |
|
|
60 |
|
|
5.42 |
|
| Granted |
— |
|
|
— |
|
|
14 |
|
|
59.17 |
|
|
— |
|
|
6.50 |
|
| Exercised or surrendered |
(120) |
|
|
13.93 |
|
|
— |
|
|
— |
|
|
— |
|
|
— |
|
| Forfeited |
— |
|
|
— |
|
|
— |
|
|
— |
|
|
(5) |
|
|
6.50 |
|
| Expired/Vested |
— |
|
|
— |
|
|
— |
|
|
— |
|
|
(25) |
|
|
5.20 |
|
| December 31, 2021 |
273 |
|
|
24.34 |
|
|
51 |
|
|
59.17 |
|
|
30 |
|
|
5.42 |
|
| Granted |
195 |
|
|
55.00 |
|
|
29 |
|
|
54.24 |
|
|
49 |
|
|
54.13 |
|
| Exercised or surrendered |
(183) |
|
|
14.92 |
|
|
(26) |
|
|
58.33 |
|
|
— |
|
|
— |
|
| Forfeited |
(20) |
|
|
38.74 |
|
|
(18) |
|
|
66.77 |
|
|
(35) |
|
|
12.20 |
|
| Expired/Vested |
— |
|
|
65.00 |
|
|
— |
|
|
— |
|
|
— |
|
|
— |
|
| December 31, 2022 |
265 |
|
|
52.23 |
|
|
36 |
|
|
57.12 |
|
|
44 |
|
|
54.27 |
|
| Granted |
72 |
|
|
67.50 |
|
71 |
|
|
60.94 |
|
|
69 |
|
|
100.57 |
|
| Exercised or surrendered |
(2) |
|
|
30.94 |
|
(25) |
|
|
58.65 |
|
|
(22) |
|
|
54.27 |
|
| Forfeited |
— |
|
|
— |
|
|
(2) |
|
|
51.81 |
|
|
(5) |
|
|
62.56 |
|
| Expired/Vested |
(40) |
|
|
30.94 |
|
|
— |
|
|
— |
|
|
— |
|
|
— |
|
| December 31, 2023 |
295 |
|
|
$ |
58.99 |
|
|
80 |
|
|
$ |
60.07 |
|
|
86 |
|
|
$ |
90.80 |
|
|
|
|
|
|
|
|
|
|
|
|
|
| Vested at December 31, 2023 |
76 |
|
|
$ |
58.65 |
|
|
|
|
|
|
|
|
|
|
|
|
|
|
|
|
|
|
|
|
|
|
|
|
|
|
|
|
|
|
|
|
|
|
|
|
|
|
|
|
|
|
|
|
|
|
|
|
|
|
|
|
|
|
December 31, 2023 |
| (in thousands) |
|
|
|
|
|
|
|
|
Option Shares Outstanding |
|
Option Shares Vested |
| Weighted average remaining contractual term (in years) |
|
|
|
6 |
|
8 |
| Aggregate intrinsic value of share options |
|
|
|
$ |
— |
|
|
$ |
— |
|
5.EMPLOYEE BENEFIT PLAN
Our employees may participate in the 401(k) Plan, a defined contribution plan which qualifies under Section 401(k) of the Internal Revenue Code. The 401(k) Plan was effective January 1, 2022. Participating employees may contribute up to 100% of their pre-tax earnings up to the statutory limit.
401(k) matching contribution expenses is included in “Selling, general and administrative expenses” in our consolidated statements of operations as follows:
|
|
|
|
|
|
|
|
|
|
|
|
|
|
|
|
|
|
|
|
|
|
|
|
|
|
|
|
|
|
|
|
|
Years Ended
December 31, |
|
Six Months Ended
December 31, 2021 |
|
Year Ended
June 30, 2021 |
| (in thousands) |
|
|
|
|
|
2023 |
|
2022 |
|
|
401(k) matching contribution expenses |
|
|
|
|
|
$ |
262 |
|
|
$ |
236 |
|
|
$ |
78 |
|
|
$ |
147 |
|
6.EARNINGS PER SHARE
We compute basic and diluted earnings per common share by dividing net earnings by the respective weighted average number of common shares outstanding for the periods presented. Our calculation of diluted earnings per common share also includes the dilutive effects for the assumed vesting of outstanding options, RSUs, and PRAs based on the treasury stock method. In computing diluted earnings per share, the average stock price for the period is used in determining the number of shares assumed to be purchased from the exercise of stock options. Diluted earnings per share excludes all dilutive potential shares if their effect is anti-dilutive.
Basic and diluted net loss per share is reflected in the following table:
|
|
|
|
|
|
|
|
|
|
|
|
|
|
|
|
|
|
|
|
|
|
|
|
|
|
|
|
|
|
|
Years Ended
December 31, |
|
Six Months Ended
December 31, 2021 |
|
Year Ended
June 30, 2021 |
| (in thousands, except per share amounts) |
|
|
|
|
2023 |
|
2022 |
|
|
| Net loss |
|
|
|
|
$ |
(21,777) |
|
|
$ |
(12,975) |
|
|
$ |
(21,348) |
|
|
$ |
(19,994) |
|
|
|
|
|
|
|
|
|
|
|
|
|
|
|
|
|
|
|
|
|
|
|
|
|
|
|
|
|
|
|
|
|
|
|
|
|
Weighted-average number of common shares used in calculating basic and dilutive loss per share |
|
|
|
|
19,033 |
|
|
17,518 |
|
|
15,869 |
|
|
13,551 |
|
| Basic and diluted net loss per weighted-average share |
|
|
|
|
$ |
(1.14) |
|
|
$ |
(0.74) |
|
|
$ |
(1.35) |
|
|
$ |
(1.48) |
|
|
|
|
|
|
|
|
|
|
|
|
|
Potentially dilutive shares were not included in the calculation of diluted net loss per share because their effect would have been anti-dilutive in those periods. PRAs were not included as their performance obligations had not been met. The potentially dilutive and anti-dilutive shares not included in diluted net loss per share are presented in the following table:
|
|
|
|
|
|
|
|
|
|
|
|
|
|
|
|
|
|
|
|
|
|
|
|
|
|
|
|
|
|
|
|
|
Years Ended
December 31, |
|
Six Months Ended
December 31, 2021 |
|
Year Ended
June 30, 2021 |
| (in thousands) |
|
|
|
|
|
2023 |
|
2022 |
|
|
| Stock options |
|
|
|
|
|
295 |
|
|
265 |
|
|
273 |
|
|
393 |
|
| RSUs |
|
|
|
|
|
80 |
|
|
36 |
|
|
51 |
|
|
37 |
|
| PRAs |
|
|
|
|
|
86 |
|
|
44 |
|
|
30 |
|
|
60 |
|
| Total potentially dilutive shares |
|
|
|
|
|
461 |
|
|
345 |
|
|
354 |
|
|
490 |
|
7. INCOME TAXES
Loss before income taxes and current and deferred income tax expense are composed of the following:
|
|
|
|
|
|
|
|
|
|
|
|
|
|
|
|
|
|
|
|
|
|
|
|
|
Years Ended
December 31, |
|
Six Months Ended
December 31, 2021 |
|
Year Ended
June 30, 2021 |
| (in thousands) |
2023 |
|
2022 |
|
|
| Loss before income taxes: |
|
|
|
|
|
|
|
| Domestic |
$ |
(30,116) |
|
|
$ |
(31,651) |
|
|
$ |
(20,657) |
|
|
$ |
(17,601) |
|
| Foreign |
11,445 |
|
|
21,815 |
|
|
(691) |
|
|
(2,393) |
|
| Total |
$ |
(18,671) |
|
|
$ |
(9,836) |
|
|
$ |
(21,348) |
|
|
$ |
(19,994) |
|
The reconciliation of the U.S. federal statutory tax rate to our effective income tax rate is as follows:
|
|
|
|
|
|
|
|
|
|
|
|
|
|
|
|
|
|
|
|
|
|
|
|
|
Years Ended
December 31, |
|
Six Months Ended
December 31, 2021 |
|
Year Ended
June 30, 2021 |
| (in thousands) |
2023 |
|
2022 |
|
|
| Pre-tax loss |
$ |
(18,671) |
|
|
$ |
(9,836) |
|
|
$ |
(21,348) |
|
|
$ |
(19,994) |
|
| Benefit at statutory rate (21%) |
(3,921) |
|
|
(2,065) |
|
|
(4,483) |
|
|
(4,199) |
|
| Foreign rate differential |
766 |
|
|
1,963 |
|
|
(62) |
|
|
(22) |
|
| Non-deductible transaction costs |
— |
|
|
— |
|
|
— |
|
|
300 |
|
| U.S. inclusion of foreign earnings |
265 |
|
|
— |
|
|
— |
|
|
— |
|
| Executive compensation |
1,022 |
|
|
421 |
|
|
143 |
|
|
— |
|
| Research and development tax credit |
(391) |
|
|
— |
|
|
— |
|
|
— |
|
| Permanent items |
298 |
|
|
(583) |
|
|
(246) |
|
|
141 |
|
| Foreign exchange differences |
— |
|
|
(840) |
|
|
17 |
|
|
— |
|
| Branch deferred taxes |
1,749 |
|
|
4,003 |
|
|
— |
|
|
— |
|
| State taxes |
960 |
|
|
511 |
|
|
509 |
|
|
(986) |
|
| Other adjustments |
— |
|
|
— |
|
|
290 |
|
|
— |
|
| Change in valuation allowance |
2,358 |
|
|
(271) |
|
|
3,832 |
|
|
4,766 |
|
| Income tax expense |
$ |
3,106 |
|
|
$ |
3,139 |
|
|
$ |
— |
|
|
$ |
— |
|
Tax expense for the years ended December 31, 2023 and 2022 related entirely to foreign deferred taxes.
Deferred income tax assets and liabilities recorded in the consolidated balance sheets consisted of the following:
|
|
|
|
|
|
|
|
|
|
|
|
| (in thousands) |
December 31,
2023 |
|
December 31,
2022 |
| Deferred tax assets |
|
|
|
| Accrued expenditures |
$ |
773 |
|
|
$ |
887 |
|
| Exploration expenditures |
363 |
|
|
168 |
|
| Stock-based compensation |
1,593 |
|
|
895 |
|
| Tax carryforwards |
26,693 |
|
|
21,851 |
|
| Other deferred tax assets |
1,556 |
|
|
1,432 |
|
| Gross deferred tax assets |
30,978 |
|
|
25,233 |
|
| Valuation allowance |
(19,791) |
|
|
(17,751) |
|
| Deferred tax assets |
$ |
11,187 |
|
|
$ |
7,482 |
|
| Deferred tax liabilities |
|
|
|
| Equity method investments |
$ |
(16,164) |
|
|
$ |
(9,440) |
|
| Other deferred tax liabilities |
(1,046) |
|
|
(923) |
|
| Deferred tax liabilities |
(17,210) |
|
|
(10,363) |
|
| Net deferred tax liability |
$ |
(6,023) |
|
|
$ |
(2,881) |
|
Net deferred tax liabilities increased $3.1 million in the year ended December 31, 2023 as compared to the year ended December 31, 2022. The increase was driven by the gain on dilution of equity method investments.
Changes in the balances of our deferred tax asset valuation allowance were as follows:
|
|
|
|
|
|
|
|
|
|
|
|
|
|
|
|
|
|
|
|
|
|
|
|
|
Years Ended
December 31, |
|
Six Months Ended
December 31, 2021 |
|
Year Ended
June 30, 2021 |
| (in thousands) |
2023 |
|
2022 |
|
|
| Beginning balance |
$ |
17,751 |
|
|
$ |
17,187 |
|
|
$ |
13,355 |
|
|
$ |
8,589 |
|
| Charged to other accounts |
(317) |
|
|
835 |
|
|
— |
|
|
— |
|
| Charged to income tax expense |
2,357 |
|
|
(271) |
|
|
3,832 |
|
|
4,766 |
|
| Ending balance |
$ |
19,791 |
|
|
$ |
17,751 |
|
|
$ |
17,187 |
|
|
$ |
13,355 |
|
Total net operating losses available were as follows:
|
|
|
|
|
|
|
|
|
|
|
|
|
|
|
|
|
|
| (in thousands) |
December 31,
2023 |
|
December 31,
2022 |
|
Begin to expire |
| U.S. - Federal |
$ |
14,833 |
|
|
$ |
9,597 |
|
|
2037 — Indefinite |
| U.S. - State |
— |
|
|
743 |
|
|
2032 |
| Australia - Federal |
3,923 |
|
|
3,697 |
|
|
Indefinite |
| Australia - Capital |
259 |
|
|
258 |
|
|
Indefinite |
| Total |
$ |
19,015 |
|
|
$ |
14,295 |
|
|
|
During the year ending December 31, 2023, we increased our reserve for uncertain income tax positions by $98 related to research and development tax credits. As of December 31, 2023, we accrued no interest or penalties, and no unrecognized net tax benefits that, if recognized, would affect our effective tax rate in any future period. We do not expect our unrecognized tax benefits will significantly change within the next twelve months. Interest and penalties related to income tax matters are classified as a component of income tax expense.
A reconciliation of the beginning and ending amounts of unrecognized tax benefits is as follows:
|
|
|
|
|
|
|
|
|
|
|
|
|
|
|
|
|
|
|
|
|
|
|
|
|
Years Ended
December 31, |
|
Six Months Ended
December 31, 2021 |
|
Year Ended
June 30, 2021 |
| (in thousands) |
2023 |
|
2022 |
|
|
| Beginning balance |
$ |
— |
|
|
$ |
— |
|
|
$ |
— |
|
|
$ |
— |
|
| Additions for tax positions related to prior years |
(60) |
|
|
— |
|
|
— |
|
|
— |
|
| Additions for tax positions related to current year |
(38) |
|
|
— |
|
|
— |
|
|
— |
|
| Ending balance |
$ |
(98) |
|
|
$ |
— |
|
|
$ |
— |
|
|
$ |
— |
|
We file income tax returns in the U.S. federal jurisdiction, various state jurisdictions, and in various international jurisdictions. Our tax filings remain subject to audits by applicable tax authorities for a certain length of time following the tax year to which those filings relate. Tax years 2017 and forward generally remain open for examination for federal and state tax purposes. Tax years 2009 and forward generally remain open for examination for foreign tax purposes.
8.PROPERTY, PLANT AND MINE DEVELOPMENT
Property, plant and mine development, net, is presented in the following table:
|
|
|
|
|
|
|
|
|
|
|
|
| (in thousands) |
December 31,
2023 |
|
December 31,
2022 |
| Mining interests |
$ |
81,481 |
|
|
$ |
56,120 |
|
| Mine development |
6,255 |
|
|
3,050 |
|
| Land |
3,259 |
|
|
720 |
|
| Leasehold improvements |
401 |
|
|
281 |
|
| Facilities and equipment |
916 |
|
|
675 |
|
| Construction in process |
35,101 |
|
|
10,780 |
|
| Property, plant and mine development |
127,413 |
|
|
71,626 |
|
| Accumulated depreciation |
(327) |
|
|
(85) |
|
| Property, plant and mine development, net |
$ |
127,086 |
|
|
$ |
71,541 |
|
Mining interests and mine development costs relate to Carolina Lithium. Our construction in process primarily relates to capitalized costs associated with Tennessee Lithium.
Depletion of mining interests and mine development assets does not commence until the assets are placed in service. As of December 31, 2023, we have not recorded depletion expense for any of our mining interests or mine development assets.
Depreciation expense is included in “Selling, general and administrative expenses” in our consolidated statements of operations as follows:
|
|
|
|
|
|
|
|
|
|
|
|
|
|
|
|
|
|
|
|
|
|
|
|
|
|
|
|
|
|
|
|
|
Years Ended
December 31, |
|
Six Months Ended
December 31, 2021 |
|
Year Ended
June 30, 2021 |
| (in thousands) |
|
|
|
|
|
2023 |
|
2022 |
|
|
| Depreciation expense |
|
|
|
|
|
$ |
241 |
|
|
$ |
74 |
|
|
$ |
9 |
|
|
$ |
12 |
|
9.EQUITY METHOD INVESTMENTS
We apply the equity method to investments when we have the ability to exercise significant influence over the operational decision-making authority and financial policies of the investee. We account for our existing investments in Sayona Mining, Sayona Quebec, Atlantic Lithium, and Vinland Lithium as equity method investments.
The following table summarizes the carrying amounts, including changes therein, of our equity method investments:
|
|
|
|
|
|
|
|
|
|
|
|
|
|
|
|
|
|
|
|
|
|
|
|
|
|
|
|
|
|
|
Year Ended December 31, 2023 |
| (in thousands) |
Sayona Mining |
|
Sayona Quebec |
|
Atlantic Lithium |
|
Vinland Lithium |
|
Total |
| Balance at June 30, 2021 |
$ |
11,195 |
|
|
$ |
5,068 |
|
|
$ |
— |
|
|
$ |
— |
|
|
$ |
16,263 |
|
Initial investment(1) |
— |
|
|
— |
|
|
15,970 |
|
|
— |
|
|
15,970 |
|
Additional investments(2) |
7,423 |
|
|
20,211 |
|
|
— |
|
|
— |
|
|
27,634 |
|
Return of capital(3) |
— |
|
|
— |
|
|
(514) |
|
|
— |
|
|
(514) |
|
| Loss from equity method investments |
(526) |
|
|
(62) |
|
|
(54) |
|
|
— |
|
|
(642) |
|
| Foreign currency translation adjustment of equity method investments |
164 |
|
|
— |
|
|
(2) |
|
|
— |
|
|
162 |
|
| Balance at December 31, 2021 |
18,256 |
|
|
25,217 |
|
|
15,400 |
|
|
— |
|
|
58,873 |
|
| Additional investments |
1,445 |
|
|
19,617 |
|
|
— |
|
|
— |
|
|
21,062 |
|
Gain (loss) on dilution of equity method investments(4) |
29,402 |
|
|
— |
|
|
(447) |
|
|
— |
|
|
28,955 |
|
| Loss from equity method investments |
(3,104) |
|
|
(2,500) |
|
|
(2,748) |
|
|
— |
|
|
(8,352) |
|
| Foreign currency translation adjustment of equity method investments |
(1,379) |
|
|
(2,571) |
|
|
(940) |
|
|
— |
|
|
(4,890) |
|
| Balance at December 31, 2022 |
44,620 |
|
|
39,763 |
|
|
11,265 |
|
|
— |
|
|
95,648 |
|
Initial investment(5) |
— |
|
|
— |
|
|
— |
|
|
1,746 |
|
|
1,746 |
|
| Additional investments |
552 |
|
|
30,900 |
|
|
41 |
|
|
— |
|
|
31,493 |
|
|
|
|
|
|
|
|
|
|
|
Gain on dilution of equity method investments(6) |
16,850 |
|
|
— |
|
|
125 |
|
|
— |
|
|
16,975 |
|
Impairment of equity method investment(7) |
(2,242) |
|
|
— |
|
|
— |
|
|
— |
|
|
(2,242) |
|
Income (loss) from equity method investments(8) |
(304) |
|
|
4,433 |
|
|
(1,693) |
|
|
— |
|
|
2,436 |
|
| Foreign currency translation adjustment of equity method investments |
18 |
|
|
1,456 |
|
|
87 |
|
|
45 |
|
|
1,606 |
|
| Balance at December 31, 2023 |
$ |
59,494 |
|
|
$ |
76,552 |
|
|
$ |
9,825 |
|
|
$ |
1,791 |
|
|
$ |
147,662 |
|
__________________________
(1)Initial investment includes transaction costs of $0.1 million for the six months ended December 31, 2021.
(2)Additional investment includes transaction costs of $0.2 million for the six months ended December 31, 2021.
(3)In December 2021, Atlantic Lithium demerged its gold business assets by exchanging them for shares in a newly formed company, Ricca Resources Limited. The shares in Ricca Resources Limited received were distributed to the shareholders of Atlantic Lithium and treated as a return of capital. (See Note 10—Other Assets and Liabilities).
(4)Gain (loss) on dilution of equity method investments relates to: (i) issuances of additional shares of Sayona Mining, as discussed above, which reduced our ownership interest in Sayona Mining, and as a result, we recognized a noncash gain of $29.4 million and (ii) the exercise of certain Atlantic Lithium stock options and share grants which resulted in a reduction of our ownership in Atlantic Lithium. Our ownership percentage for Sayona Mining and Atlantic Lithium may continue to be reduced by future stock issuances.
(5)Initial investment includes transaction costs of $0.3 million for the year ended December 31, 2023.
(6)Gain on dilution of equity method investments relates to issuances of additional shares of Sayona Mining and Atlantic Lithium, which reduced our ownership interest in both Sayona Mining and Atlantic Lithium.
(7) Impairment of equity method investment represents the difference between the carrying value, which includes $46.3 million in accumulated gains on dilution, and fair value of Sayona Mining as of December 31, 2023, and is included income (loss) from equity method investments in the accompanying consolidated statements of operations.
(8)Certain immaterial, out-of-period amounts, related to our proportionate share of the results of Sayona Mining and Sayona Quebec have been included in our current period results.
We continue to evaluate operational developments and the impact of the anticipated expansion of the operations of our existing equity method investees. Sayona Quebec’s restart of NAL and Atlantic Lithium’s completion of a technical study for Ewoyaa were impactful to the consideration of how we most appropriately reflect our proportional share of income (loss) from our equity method investments. We began supplying the market with spodumene concentrate from NAL in the third quarter of 2023. Upon completion of construction of Tennessee Lithium, spodumene concentrate from Ewoyaa is expected to supply the majority of the spodumene concentrate required by Tennessee Lithium for conversion to lithium hydroxide.
Our share of income (loss) from Sayona Mining, Sayona Quebec, Atlantic Lithium, and Vinland Lithium is recorded on a one-quarter lag in “Income (loss) from equity method investments” within “Loss from operations” in our consolidated statements of operations.
Below is a summary of our equity method investments as of December 31, 2023.
Sayona Mining
As of December 31, 2023, we owned an equity interest of approximately 12% in Sayona Mining, an Australian company publicly listed on the ASX, and have formed a strategic partnership with Sayona Mining to explore, evaluate, develop, mine, and produce spodumene concentrate in Quebec, Canada.
During the years ended December 31, 2023 and 2022, we reported the effects of Sayona Mining raising additional capital through share issuances of its common stock. We did not participate in these share issuances, which were issued at a valuation greater than the carrying value of our ownership interest. As a result, our ownership interest in Sayona Mining was diluted and declined. We recognized a noncash gain of $17.0 million and $29.0 million in the years ended December 31, 2023 and 2022, respectively, related to the dilution of our ownership interest. We recorded the gain within “Gain on dilution of equity method investments” in our consolidated statements of operations.
As of December 31, 2023, the market value of Sayona Mining was less than our carrying value. During the year ended December 31, 2023, we determined the decline was other than temporary and recorded a $2.2 million impairment charge as a component of income (loss) from equity method investments in the accompanying consolidated statements of operations. The fair value was based on the quoted market price of Sayona Mining at December 31, 2023, which is considered to be a Level 1 fair value measurement. See Note 16—Subsequent Events.
Sayona Quebec
We own an equity interest of 25% in Sayona Quebec for the purpose of furthering our investment and strategic partnership in Quebec, Canada. The remaining 75% equity interest is held by Sayona Mining. Sayona Quebec holds a 100% interest in NAL, which consists of a surface mine and a concentrator plant, as well as the Authier Lithium project and the Tansim Lithium project.
We hold a life-of-mine offtake agreement with Sayona Quebec for the greater of 113,000 metric tons or 50% of spodumene concentrate production per year. Our purchases of spodumene concentrate from Sayona Quebec are subject to market pricing with a price floor of $500 per metric ton and a price ceiling of $900 per metric ton for 6.0% spodumene concentrate on an FOB North Carolina basis.
In addition to lithium mining and concentrate production, NAL owns a partially completed lithium carbonate plant, which was developed by a prior operator of NAL. Sayona Quebec completed a preliminary technical study for the completion and restart of the NAL carbonate plant during the quarter ended June 30, 2023. If we decide to construct and operate a lithium conversion plant with Sayona Mining through our joint venture, Sayona Quebec, spodumene concentrate produced from NAL would be preferentially delivered to that conversion plant upon commencement of conversion operations. Any remaining spodumene concentrate not delivered the conversion plant would first be sold to us up to our offtake right and then to third parties. Any decision to construct jointly-owned lithium conversion capacity must be agreed upon by both parties.
During the year ended December 31, 2023, NAL produced approximately 98,800 dmt of spodumene concentrate and shipped 72,100 dmt, of which 43,200 dmt were sold to Piedmont Lithium. We, in turn, generated $39.8 million of sales on those 43,200 dmt, with a realized sales price of $920 per dmt and a realized cost of sales of $789 per dmt, resulting in a gross profit margin of 14.3%.
Atlantic Lithium
As of December 31, 2023, we owned an equity interest of approximately 9% in Atlantic Lithium, an Australian company publicly listed on the Alternative Investment Market of the London Stock Exchange and the ASX. We have a strategic partnership with Atlantic Lithium to explore, evaluate, mine, develop, and ultimately produce spodumene concentrate in Ghana. We have the right to acquire up to a 50% equity interest in Atlantic Lithium Ghana, a subsidiary of Atlantic Lithium that owns Ewoyaa, through current and future phased investments.
We have a long-term offtake agreement whereby Atlantic Lithium will sell 50% of spodumene concentrate produced in Ghana for the life of the mine to Piedmont Lithium at market prices. See Note 10—Other Assets and Liabilities.
Vinland Lithium
We own an equity interest of approximately 20% in Vinland Lithium, a Canadian-based entity jointly owned with Sokoman Minerals and Benton Resources. Vinland Lithium currently owns Killick Lithium, a large exploration property prospective for lithium located in southern Newfoundland, Canada. We have entered into an earn-in agreement with Vinland Lithium to acquire up to a 62.5% equity interest in Killick Lithium through current and future phased investments.
Summarized Financial Information
Our share of income (loss) is recorded on a one-quarter lag and is derived from the balances below, which have been compiled from information provided to us by each investee and is presented in accordance with U.S. GAAP.
Summarized financial information for the year ended and as of December 31, 2023:
|
|
|
|
|
|
|
|
|
|
|
|
|
|
|
|
|
|
|
|
| (in thousands) |
Sayona Mining |
|
Sayona Quebec |
|
Atlantic Lithium |
|
|
| Summarized statement of operations information: |
|
|
|
|
|
|
|
| Revenue |
$ |
43,925 |
|
|
$ |
58,514 |
|
|
$ |
— |
|
|
|
| Gross Profit |
11,912 |
|
|
16,580 |
|
|
— |
|
|
|
| Net loss from operations |
(456) |
|
|
17,733 |
|
|
(18,068) |
|
|
|
| Other comprehensive income (loss), net of tax |
2,405 |
|
|
— |
|
|
1,198 |
|
|
|
| Comprehensive loss |
1,949 |
|
|
17,733 |
|
|
(16,870) |
|
|
|
| Summarized balance sheet information: |
|
|
|
|
|
|
|
| Current assets |
240,101 |
|
|
116,446 |
|
|
8,901 |
|
|
|
| Non-current assets |
413,886 |
|
|
261,662 |
|
|
5,591 |
|
|
|
| Current liabilities |
58,577 |
|
|
38,581 |
|
|
3,724 |
|
|
|
| Non-current liabilities |
56,646 |
|
|
53,576 |
|
|
23,409 |
|
|
|
Summarized financial information for the year ended and as of December 31, 2022:
|
|
|
|
|
|
|
|
|
|
|
|
|
|
|
|
|
|
|
|
| (in thousands) |
Sayona Mining |
|
Sayona Quebec |
|
Atlantic Lithium |
|
|
| Summarized statement of operations information: |
|
|
|
|
|
|
|
| Revenue |
$ |
— |
|
|
$ |
— |
|
|
$ |
— |
|
|
|
| Net loss from operations |
(19,274) |
|
|
(9,996) |
|
|
(39,801) |
|
|
|
| Other comprehensive income (loss), net of tax |
10,424 |
|
|
179 |
|
|
(32) |
|
|
|
| Comprehensive loss |
(8,850) |
|
|
(9,817) |
|
|
(39,833) |
|
|
|
|
|
|
|
|
|
|
|
| Summarized balance sheet information: |
|
|
|
|
|
|
|
| Current assets |
122,253 |
|
|
24,869 |
|
|
19,394 |
|
|
|
| Non-current assets |
237,656 |
|
|
147,954 |
|
|
1,074 |
|
|
|
| Current liabilities |
5,299 |
|
|
3,195 |
|
|
3,896 |
|
|
|
| Non-current liabilities |
57,987 |
|
|
88,184 |
|
|
15,613 |
|
|
|
Summarized financial information for the six months ended and as of December 31, 2021:
|
|
|
|
|
|
|
|
|
|
|
|
|
|
|
|
|
|
|
|
| (in thousands) |
Sayona Mining |
|
Sayona Quebec |
|
Atlantic Lithium |
|
|
| Summarized statement of operations information: |
|
|
|
|
|
|
|
| Revenue |
$ |
— |
|
|
$ |
— |
|
|
$ |
— |
|
|
|
| Net loss from operations |
(2,692) |
|
|
(252) |
|
|
(540) |
|
|
|
| Other comprehensive income (loss), net of tax |
844 |
|
|
— |
|
|
(21) |
|
|
|
| Comprehensive loss |
(1,848) |
|
|
(252) |
|
|
(561) |
|
|
|
|
|
|
|
|
|
|
|
| Summarized balance sheet information: |
|
|
|
|
|
|
|
| Current assets |
18,302 |
|
|
712 |
|
|
24,332 |
|
|
|
| Non-current assets |
99,753 |
|
|
97,957 |
|
|
43,442 |
|
|
|
| Current liabilities |
2,071 |
|
|
917 |
|
|
3,354 |
|
|
|
| Non-current liabilities |
23 |
|
|
— |
|
|
— |
|
|
|
|
|
|
|
|
|
|
|
|
|
|
|
|
|
|
|
|
|
|
|
|
|
|
|
|
|
|
|
|
|
|
|
|
|
|
|
|
|
|
|
|
|
|
|
|
|
|
|
Summarized financial information for the year ended and as of June 30, 2021:
|
|
|
|
|
|
|
|
| (in thousands) |
Sayona Mining |
|
|
| Summarized statement of operations information: |
|
|
|
| Revenue |
$ |
— |
|
|
|
| Net loss from operations |
(325) |
|
|
|
| Other comprehensive income (loss), net of tax |
(157) |
|
|
|
| Comprehensive loss |
(482) |
|
|
|
|
|
|
|
| Summarized balance sheet information: |
|
|
|
| Current assets |
9,711 |
|
|
|
| Non-current assets |
17,719 |
|
|
|
| Current liabilities |
4,746 |
|
|
|
| Non-current liabilities |
24 |
|
|
|
|
|
|
|
|
|
|
|
|
|
|
|
|
|
|
|
|
|
|
|
|
|
|
|
For the years ended December 31, 2023 and 2022, Sayona Mining and Sayona Quebec met the conditions required to be significant at the 20% level under Rule 1-02(w) of Regulation S-X. Accordingly, as required by Rule 3-09 of Regulation S-X, we have included the consolidated audited financial statements of Sayona Mining, which include Sayona Quebec, as of and for their most recent fiscal year ended June 30, 2023, with a comparative period of 2022, as Exhibit 99.4 and for the year ended June 30, 2022, with a comparative period of 2021, as Exhibit 99.2 to this Annual Report on Form 10-K.
For the year ended December 31, 2023, Atlantic Lithium did not meet the conditions required to be significant at the 20% level under Rule 1-02(w) of Regulation S-X. For the year ended December 31, 2022, Atlantic Lithium did meet the conditions required to be considered significant at the 20% level under Rule 1-02(w) of Regulation S-X. Accordingly, as required by Rule 3-09 of Regulation S-X, we have included the consolidated audited financial statements of Atlantic Lithium as of and for the years ended June 30, 2022 and 2021, as Exhibit 99.1, and unaudited financial statements as of and for the years ended June 30, 2023 and 2022, as Exhibit 99.3 to this Annual Report on form 10-K. There is no audit opinion, or any other form of assurance provided by an independent auditor with respect to Atlantic Lithium’s financial statements as of and for the year ended June 30, 2023.
10.OTHER ASSETS AND LIABILITIES
Other current assets consisted of the following:
|
|
|
|
|
|
|
|
|
|
|
|
| (in thousands) |
December 31,
2023 |
|
December 31,
2022 |
| Prepaid and other current assets |
$ |
3,345 |
|
|
$ |
2,128 |
|
| Investments in equity securities |
484 |
|
|
484 |
|
| Total other current assets |
$ |
3,829 |
|
|
$ |
2,612 |
|
As of December 31, 2023, our investments in equity securities consisted of common shares in Ricca, which we acquired as part of a spin-out of Ricca from Atlantic Lithium. Ricca is a private company focused on gold exploration in Africa.
Other non-current assets consisted of the following:
|
|
|
|
|
|
|
|
|
|
|
|
| (in thousands) |
December 31,
2023 |
|
December 31,
2022 |
| Advances to affiliates |
$ |
28,189 |
|
|
$ |
17,316 |
|
| Operating lease right-of-use assets (Note 12) |
1,371 |
|
|
1,293 |
|
Asset retirement obligation, net1 (Note 15) |
414 |
|
|
— |
|
| Other non-current assets |
379 |
|
|
264 |
|
| Total other non-current assets |
$ |
30,353 |
|
|
$ |
18,873 |
|
__________________________
(1)Asset retirement obligation is net of accumulated amortization of $7 thousand and $0 as of December 31, 2023 and 2022, respectively.
Advances to affiliates relate to staged investments for future planned lithium projects. We have an earn-in agreement with Vinland Lithium to acquire up to a 62.5% equity interest in Killick Lithium as well as a strategic partnership with Atlantic Lithium that includes Atlantic Lithium Ghana. Under our partnership, we entered into a project agreement to acquire a 50% equity interest in Atlantic Lithium Ghana in two phases, each requiring us to make future staged investments in Ewoyaa over a period of time.
We recently completed phase 1, which allows us to acquire a 22.5% equity interest in Atlantic Lithium Ghana by funding Ewoyaa’s exploration and DFS costs and notifying Atlantic Lithium of our intention to proceed with additional funding required under phase 2. We completed funding of exploration and DFS costs, and Atlantic Lithium issued their DFS in June 2023. In August, we supplied Atlantic Lithium with notification of our intent to proceed with additional funding. Our future equity interest ownership under phase 1 remains subject to government approvals required under Ghana’s Mineral and Mining Act. Phase 2 allows us to acquire an additional 27.5% equity interest in Atlantic Lithium Ghana upon completion of funding $70 million for capital costs associated with the development of Ewoyaa. Any cost savings or cost overruns from the initial commitment will be shared equally between Piedmont Lithium and Atlantic Lithium. Upon completion of phases 1 and 2, we expect to have a total equity interest of 50% in Atlantic Lithium Ghana. Atlantic Lithium Ghana, in turn, will hold an 81% interest in the Ewoyaa project net of the interests which will be held by the Ghanaian government, resulting in an effective ownership interest of 40.5% in Ewoyaa, by Piedmont Lithium. Funding costs are included in “Other non-current assets” in our consolidated balance sheets as an advance on our future phased investments in Atlantic Lithium Ghana.
Our maximum exposure to a loss as a result of our involvement in Ewoyaa and Killick Lithium is limited to the total amount funded by Piedmont Lithium to Atlantic Lithium and Vinland Lithium. As of December 31, 2023, we did not own an equity interest in Atlantic Lithium Ghana or Killick Lithium. We have made advances to Vinland Lithium for Killick Lithium totaling $1.8 million for the year ended December 31, 2023, and have made advances to Atlantic Lithium for Ewoyaa totaling $9.4 million and $12.7 million during the years ended December 31, 2023 and 2022, respectively, and $4.3 million during the six months ended December 31, 2021.
Other current liabilities consisted of the following:
|
|
|
|
|
|
|
|
|
|
|
|
| (in thousands) |
December 31,
2023 |
|
December 31,
2022 |
| Accrued provisional revenue adjustment |
$ |
29,151 |
|
|
$ |
— |
|
| Operating lease liabilities (Note 12) |
312 |
|
|
124 |
|
| Total other current liabilities |
$ |
29,463 |
|
|
$ |
124 |
|
We recognize revenue from product sales at a point in time when performance obligations are satisfied under the terms of contracts with our customers. When the final price has not been resolved by the end of a reporting period, we estimate the expected sales price based on the initial price, market pricing and known quality measurements. Differences between payments received and the final estimated sales price, which results in a liability, are recorded as accrued provisional revenue adjustments.
Other non-current liabilities consisted of the following:
|
|
|
|
|
|
|
|
|
|
|
|
| (in thousands) |
December 31,
2023 |
|
December 31,
2022 |
| Asset retirement obligation liability (Note 15) |
$ |
431 |
|
|
$ |
— |
|
| Total other non-current liabilities |
$ |
431 |
|
|
$ |
— |
|
11.LONG-TERM DEBT
We have entered into long-term debt agreements to purchase surface properties and the associated mineral rights from landowners that form part of “Mining interests” on our consolidated balance sheets. These purchases were fully or partly financed by the seller of each of the surface properties. Our long-term debt is payable in monthly installments ranging from approximately $2,000 to $10,000 per month on terms ranging from 2 years to 5 years. Payments include an implied or stated interest rate of 10% and are secured by the respective real property.
The outstanding balances of our long-term debt agreements were as follows:
|
|
|
|
|
|
|
|
|
|
|
|
| (in thousands) |
December 31,
2023 |
|
December 31,
2022 |
| Current portion of long-term debt |
$ |
149 |
|
|
$ |
425 |
|
| Long-term debt, net of current portion |
14 |
|
|
163 |
|
| Total long-term debt |
$ |
163 |
|
|
$ |
588 |
|
We paid interest on our long-term debt as follows:
|
|
|
|
|
|
|
|
|
|
|
|
|
|
|
|
|
|
|
|
|
|
|
|
|
Years Ended
December 31, |
|
Six Months Ended
December 31, 2021 |
|
Year Ended
June 30, 2021 |
| (in thousands) |
2023 |
|
2022 |
|
|
| Interest paid |
$ |
39 |
|
|
$ |
115 |
|
|
$ |
113 |
|
|
$ |
271 |
|
Scheduled payments for the principal portion of our outstanding long-term debt are as follows:
|
|
|
|
|
|
| (in thousands) |
December 31,
2023 |
| 2024 |
$ |
149 |
|
| 2025 |
14 |
|
| 2026 |
— |
|
| 2027 |
— |
|
| Total |
$ |
163 |
|
12.LEASES
We lease certain equipment and office space. Leases with an initial term of 12 months or less are not recorded on the consolidated balance sheet.
Most leases include one or more options to renew, with renewal terms that can extend the lease term from one year to six years. The exercise of lease renewal options is at our sole discretion and we consider these options in determining the lease term used to establish our right-of-use assets and lease liabilities.
Lease presentation in our consolidated balance sheets, components of lease costs and other lease information are presented in the following table:
|
|
|
|
|
|
|
|
|
|
|
|
| (in thousands) |
December 31,
2023 |
|
December 31,
2022 |
| Assets: |
|
|
|
| Right-of-use assets - operating lease |
$ |
1,371 |
|
|
$ |
1,293 |
|
|
|
|
|
| Liabilities: |
|
|
|
| Current |
312 |
|
|
124 |
|
| Non-current |
1,091 |
|
|
1,177 |
|
| Operating lease liabilities |
$ |
1,403 |
|
|
$ |
1,301 |
|
|
|
|
|
|
|
|
|
|
|
|
|
|
|
|
|
|
|
|
|
|
|
|
|
|
Years Ended
December 31, |
|
Six Months Ended
December 31, 2021 |
|
Year Ended
June 30, 2021 |
| (in thousands) |
2023 |
|
2022 |
|
|
| Statements of operations: |
|
|
|
|
|
|
|
| Operating lease cost |
$ |
389 |
|
$ |
153 |
|
|
$ |
84 |
|
|
$ |
165 |
|
| Short-term lease cost |
168 |
|
106 |
|
|
67 |
|
|
79 |
|
Sublease income |
— |
|
51 |
|
|
62 |
|
|
121 |
|
|
|
|
|
|
|
|
|
| Other information: |
|
|
|
|
|
|
|
| Right-of-use assets obtained in exchange for new operating lease liabilities |
$ |
323 |
|
$ |
1,339 |
|
|
$ |
— |
|
|
$ |
15 |
|
| Cash paid for amounts included in the measurement of lease liabilities: |
|
|
|
|
|
|
|
| Operating cash flows from operating leases |
$ |
365 |
|
$ |
143 |
|
|
$ |
86 |
|
|
$ |
166 |
|
| Weighted-average remaining lease term (in months) |
60 |
|
80 |
|
3 |
|
11 |
| Weighted-average discount rate |
10% |
|
10% |
|
10% |
|
10% |
Maturities of lease payments under non-cancellable leases are as follows:
|
|
|
|
|
|
| (in thousands) |
December 31, 2023 |
| 2024 |
$ |
439 |
|
| 2025 |
325 |
|
| 2026 |
272 |
|
| 2027 |
280 |
|
| 2028 |
289 |
|
| Thereafter |
196 |
|
| Total future minimum lease payments |
1,801 |
|
| Interest included within lease payments |
(398) |
|
| Total operating lease liabilities |
$ |
1,403 |
|
13.EQUITY
Piedmont Lithium acquired all of the issued and outstanding ordinary shares of Piedmont Australia, our Australian predecessor and currently a wholly-owned subsidiary, pursuant to a Scheme of Arrangement under Australian law, which was approved by Piedmont Australia’s shareholders on February 26, 2021 and by the Supreme Court of Western Australia on May 5, 2021 (collectively referred to as “Redomiciliation”). As part of the Redomiciliation, we changed our place of domicile from Australia to the state of Delaware in the U.S., effective May 17, 2021.
Pursuant to the Redomiciliation, holders of Piedmont Australia’s ordinary shares received one (1) CDI in Piedmont Lithium Inc. for each ordinary share held in Piedmont Australia on the Redomiciliation record date; and holders of ADSs in Piedmont Australia received one (1) share of common stock of Piedmont Lithium Inc. for each ADS held in Piedmont Australia on the Redomiciliation record date with each ADS representing 100 Piedmont Australia ordinary shares.
All issued and outstanding shares of our common stock and per share amounts have been retroactively adjusted in these consolidated financial statements to reflect the 100:1 ratio and share consolidation. Shares of our common stock issued in connection with the Redomiciliation trade on Nasdaq under the symbol “PLL.”
On the effective date of the Redomiciliation, the number or ordinary outstanding shares was reduced from 1,574,597,320 to 15,764,533 shares of common stock. All share and per share amounts in these consolidated financial statements and related notes for periods prior to the Redomiciliation have been retroactively adjusted to reflect the effect of the exchange ratio.
We are authorized to issue up to 100,000,000 shares of common stock, par value $0.0001 per share, and 10,000,000 shares of preferred stock, par value $0.0001 per share. We have no outstanding shares of preferred stock.
Equity Transactions During the Year Ended December 31, 2023
In November 2023, we issued a total of 62,638 shares with an issue price of $29.32 per share as an advance of our funding obligations to the Killick Lithium project. There were no share issuance costs associated with the issuance and the value of the shares were treated as an advance within our earn-in agreement with Vinland Lithium to acquire up to a 62.5% equity interest in Killick Lithium through staged-investments.
In February 2023, we received $75 million from LG Chem in exchange for 1,096,535 common shares in Piedmont Lithium at an approximate price of $68.40 per share and in conjunction with a multi-year spodumene concentrate offtake agreement. Share issuance costs associated with the subscription totaled $3.9 million and were accounted for as a reduction in the proceeds from share issuances in the consolidated balance sheets.
Equity Transactions During the Year Ended December 31, 2022
In March 2022, we issued 2,012,500 shares under our $500 million automatic shelf registration with an issue price of $65.00 per share to raise gross proceeds of $130.8 million. Share issuance costs associated with the U.S. public offering totaled $8.8 million and were accounted for as a reduction in the proceeds from share issuances in the consolidated balance sheets.
Equity Transactions During the Six Months Ended December 31, 2021
On September 24, 2021, we filed a $500 million shelf registration statement with the SEC to provide us with capacity to publicly offer, common stock, preferred stock, warrants, debt, convertible or exchangeable securities, depositary shares, or units, or any combination thereof. We may from time to time raise capital under our shelf registration statement in amounts, at prices, and on terms to be announced when and if any securities are offered. As of December 31, 2023 we have $369.2 million remaining under our shelf registration statement, which expires on September 24, 2024.
Equity Transactions During the Year Ended June 30, 2021
In August 2020, we issued 1,200,000 shares at a weighted-average issue price of AUD 9.00(1). In October 2020, we issued 2,300,000 shares with a weighted-average issue price of $25.00. In March 2021, we issued 1,750,000 shares with a weighted-average issue price of $70.00. Share issuance costs associated with the Australia share placements and U.S. public offering totaled $12.8 million and were accounted for as a reduction in the proceeds from share issuances in the consolidated balance sheets.
___________________________________________________________________________
(1)The weighted-average issue price in Australian dollars (AUD) were on share issuances that were initiated in Australian dollars and translated into U.S. dollars at historical rates.
14.SEGMENT REPORTING
We report our segment information in the same way management internally organizes the business in assessing performance and making decisions regarding allocation of resources in accordance with ASC Topic 280, “Segment Reporting.” We have a single reportable operating segment that operates as a single business platform. In reaching this conclusion, management considered the definition of the CODM, how the business is defined by the CODM, the nature of the information provided to the CODM, how the CODM uses such information to make operating decisions, and how resources and performance are assessed. The results of operations provided to and analyzed by the CODM are at the consolidated level, and accordingly, key resource decisions and assessment of performance are performed at the consolidated level. We have a single, common management team and our cash flows are reported and reviewed at the consolidated level only with no distinct cash flows at an individual business level.
15.COMMITMENTS AND CONTINGENCIES
Legal Proceedings
We are involved from time to time in various claims, proceedings, and litigation. We establish reserves for specific legal proceedings when we determine that the likelihood of an unfavorable outcome is probable, and the amount of loss can be reasonably estimated.
On July 5, 2022, Brad Thomascik, a purported shareholder of the Company’s equity securities, filed a shareholder derivative lawsuit in the U.S. District Court for the Eastern District of New York. On behalf of the Company, the lawsuit purports to bring claims against certain of the Company’s officers and directors. The complaint alleges that the defendants breached their fiduciary duties in connection with the Company’s statements regarding the timing and status of government permits for Carolina Lithium in North Carolina at various times between March 16, 2018 and July 19, 2021. No litigation demand was made to the Company in connection with this action. The lawsuit focuses on the same public statements as the shareholder derivative suit described below. In September 2022, the parties agreed to a stipulation to stay the proceeding pending resolution of the motion to dismiss in the securities law matters described in the second paragraph of this section, and the Court ordered the case stayed in October 2022. We intend to vigorously defend against these claims. Although there can be no assurance as to the outcome, we do not believe these claims have merit. The potential monetary relief, if any, is not probable and cannot be estimated at this time; accordingly, we have not recorded a liability for this matter.
On October 14, 2021, Vincent Varbaro, a purported holder of Piedmont Australia’s American Depositary Shares and the Company’s equity securities, filed a shareholder derivative suit in the U.S. District Court for the Eastern District of New York, purporting to bring claims on behalf of the Company against certain of the Company’s officers and directors. The complaint alleges that the defendants breached their fiduciary duties in connection with the Company’s statements regarding the timing and status of government permits for Carolina Lithium in North Carolina, at various times between March 16, 2018 and July 19, 2021. No litigation demand was made to the Company in connection with this action. In December 2021, the parties agreed to a stipulation to stay the proceeding pending resolution of the motion to dismiss in the securities law matters described in the immediately preceding paragraph, and the Court ordered the case stayed. We intend to vigorously defend against these claims. Although there can be no assurance as to the outcome, we do not believe these claims have merit. The potential monetary relief, if any, is not probable and cannot be estimated at this time; accordingly, we have not recorded a liability for this matter.
On September 8, 2023, the parties in the Thomascik and Varbaro cases stipulated to consolidate the two actions. That stipulation has not yet been acted on by the court.
In July 2021, a class of putative plaintiffs filed a lawsuit against us in the U.S. District Court for the Eastern District of New York claiming violations of the Exchange Act. The complaint alleged, among other things, that we made false and/or misleading statements and/or failed to make disclosure relating to proper and necessary permits. In February 2022, the Court appointed a lead plaintiff in this action, and the lead plaintiff filed an amended complaint in April 2022. On July 18, 2022, we moved to dismiss the amended complaint. On September 1, 2022, the lead plaintiff filed his Memorandum of Law in Opposition to our Motion to Dismiss. On October 7, 2022, we filed our Reply Memorandum in support of our Motion to Dismiss. On January 18, 2024, the Court granted our Motion to Dismiss the amended complaint. The lead plaintiff’s deadline to appeal the decision of the Court expired. As of the date of this Annual Report, the lead plaintiff did not appeal the decision of the Court.
On February 6, 2024, the SEC issued an investigative subpoena to the Company primarily seeking documents and information relating to the Company’s mining-related investments and operations outside of the United States. The Company is cooperating with the SEC to respond to the subpoena in a timely manner.
Asset Retirement Obligations
In 2023, we recognized an asset retirement obligation of $0.4 million related to the acquisition of a disposal facility in Etowah, Tennessee, for Tennessee Lithium. In determining the asset retirement obligation, we calculated the present value of the estimated future cash flows required to reclaim the disturbed areas and perform any required monitoring.
Other Commitments and Contingencies
In May 2023, we entered into a community development agreement with the City of Cherryville, North Carolina, whereby we committed to fund $11.0 million as follows: (i) $1.0 million to support certain parks and recreation projects and the reestablishment of a department of recreation, of which $0.5 million was paid in July 2023 and $0.5 million was paid in October 2023, and (ii) $10.0 million to be paid in annual installments of $0.5 million over a 20-year period commencing upon the first shipment of lithium hydroxide from Carolina Lithium. As part of the agreement, the City of Cherryville relinquished extraterritorial zoning jurisdiction over certain real property owned by Piedmont Lithium to Gaston County, North Carolina.
16.SUBSEQUENT EVENTS
During the first quarter 2024, through the date of this filing, we sold approximately 24.5 million shares of Atlantic Lithium for an average of $0.32 per share. The shares sold represented approximately 4% of Atlantic Lithium’s outstanding shares and resulted in approximately $7.8 million in net proceeds. We retained approximately 32.5 million shares, representing approximately 5% ownership in Atlantic Lithium. In connection with the sale of these shares, we no longer hold a board seat with Atlantic Lithium. Our reduced ownership in Atlantic Lithium has no impact on our earn-in or offtake rights with Atlantic Lithium and the Ewoyaa project.
During the first quarter of 2024, we sold approximately 1,249.8 million shares of Sayona Mining for an average of $0.03 per share. The shares sold represented approximately 12% of Sayona Mining’s outstanding shares and resulted in approximately $41.4 million in net proceeds. Our cost basis and book basis of Sayona Mining was approximately $20.9 million and $59.5 million, respectively. The difference between cost basis and book basis of our investment is primarily related to the non-cash accumulated gains on dilution of $46.3 million, partially offset by our proportional share of losses during the period we’ve held the shares. The sale of these shares is estimated to result in a loss, net of tax, of between $12 million and $16 million, pending the inclusion of our proportional share of income (loss), including the quarter lag true-up, of Sayona through the date of sale. See Note 9—Equity Method Investments, for further discussion of our accounting for equity method investments.
Piedmont Lithium no longer holds shares of Sayona Mining. The sale of these shares has no impact on Piedmont Lithium’s joint venture or offtake rights with Sayona Quebec.
In February 2024, we initiated a cost-savings plan to reduce operating expenses and certain capital expenditures. We expect to achieve approximately $10 million in annual cash savings associated with a reduction in our operating expenses. As part of our cost-savings plan, we reduced our workforce by 27% mainly within our corporate office staff and will record approximately $1 million in severance and severance related costs in the first quarter of 2024. We expect to recognize the majority of our cost savings in 2024.
EX-21.1
2
ex211-subsidiaries.htm
EX-21.1
ex211-subsidiaries

List of Subsidiaries – 12/31/2023 Name Jurisdiction Ownership Percentage Piedmont Lithium Carolinas, Inc. North Carolina 100% Piedmont Lithium Cayman Inc. Cayman Islands 100% Piedmont Lithium Finland Holdings, LLC Delaware 100% Piedmont Lithium Finland Oy Finland 100% Lasec Exploration Canada Inc. Ontario 100% LASEC Group, LLC Delaware 100% LithCo Holdings, LLC Delaware 100% Piedmont Lithium International Canada BC ULC British Columbia 100% Piedmont Lithium International US, LLC Delaware 100% Piedmont Lithium Newfoundland Holdings, LLC Delaware 100% Piedmont Lithium PTY LTD Australia 100% Piedmont Lithium Quebec Holdings, LLC Delaware 100% PLNC Holdings, LLC Delaware 100% PLNC Land, LLC Delaware 100% PLTN Holdings, LLC Delaware 100% PLTN Land, LLC Delaware 100% PLTN Real Estate, LLC Delaware 100% Sayona Mining Limited Australia 25% Sayona Quebec Inc. Quebec 12% Exhibit 21.1
EX-23.1
3
ex231deloitteconsent.htm
EX-23.1
Document
Exhibit 23.1
CONSENT OF INDEPENDENT REGISTERED PUBLIC ACCOUNTING FIRM
We consent to the incorporation by reference in Registration Statement No. 333-256454 on Form S-8, and Registration Statement No. 333-259798 on Form S-3, as amended, of our reports dated February 28, 2024, relating to the consolidated financial statements of Piedmont Lithium Inc. and subsidiaries, and the effectiveness Piedmont Lithium Inc.’s internal control over financial reporting, appearing in this Annual Report on Form 10-K for the year ended December 31, 2023.
/s/DELOITTE & TOUCHE LLP
Charlotte, North Carolina
EX-23.2
4
ex232_bdoxconsentxfinal.htm
EX-23.2
Document
CONSENT
Board of Directors
Piedmont Lithium Inc.
Belmont, North Carolina
We hereby consent to the incorporation by reference in the Registration Statement on Form S-8 (No. 333- 256454) of Piedmont Lithium Inc. of our report dated 23 February 2023, relating to the consolidated financial statements of Atlantic Lithium Limited which appears in this Annual Report on Form 10-K by Piedmont Lithium Inc. Our report contains an explanatory paragraph regarding Atlantic Lithium Limited’s ability to continue as a going concern.
BDO Audit Pty Ltd
/s/ Richard Swaby
Richard Swaby
Brisbane, Queensland, February 27, 2024
BDO Audit Pty Ltd ABN 33 134 022 870 is a member of a national association of independent entities which are all members of BDO Australia Ltd ABN 77 050 110 275, an Australian company limited by guarantee. BDO Audit Pty Ltd and BDO Australia Ltd are members of BDO International Ltd, a UK company limited by guarantee, and form part of the international BDO network of independent member firms.
EX-23.3
5
ex233_nexiaconsent.htm
EX-23.3
Document
CONSENT
Board of Directors
Piedmont Lithium Inc.
Belmont, North Carolina
We hereby consent to the incorporation by reference in the Registration Statements on Form S-3 (No. 333-259798) and Form S-8 (No. 333-256454) of Piedmont Lithium Inc. of our report dated February 26, 2023, relating to the consolidated financial statements of Sayona Mining Limited for the years ended June 30, 2021 and 2022 which appears in the Annual Report on Form 10-K filed by Piedmont Lithium Inc. for the year ended December 31, 2022, and our report dated February 22, 2024, relating to the consolidated financial statements of Sayona Mining Limited for the years ended June 30, 2022 and 2023, which appears in this Annual Report on Form 10-K by Piedmont Lithium Inc. for the year ended December 31, 2023.
/s/ Nexia Brisbane Audit Pty Ltd.
EX-23.4
6
ex234-qpssearlexewoyaa.htm
EX-23.4
Document
Exhibit 23.4
Consent of Qualified Person
In accordance with the requirements of Regulation S-K 1300 Modernization of Property Disclosures §229.1302(b)(4)(iv)
Report Description
Report titled “Technical Report Summary of a Definitive Feasibility Study of the Ewoyaa Lithium Project”
(“Report”)
Piedmont Lithium Inc.
(“Company”)
Ewoyaa Lithium Project
(“Deposit”)
February 26, 2024
(“Date of Report”)
Statement
I, Shaun Searle, of Ashmore Advisory Pty Ltd.., confirm that:
•In connection with any Securities Act filings or Exchange Act report and any amendment, supplement, or exhibit thereto, I consent to:
oThe filing and use of the Technical Report Summary titled “Technical Report Summary of a Definitive Feasibility Study of the Ewoyaa Lithium Project in Ghana” (“TRS – Definitive Feasibility Study”) in connection with the Company’s 10-K filing with an approximate filing date of February 28, 2024; and,
oThe use of the Ashmore Advisory Pty Ltd. name, including our status as an expert or Qualified Person (as defined in Subpart 1300 of Regulation S-K promulgated by the Securities and Exchange Commission) in connection with the TRS – Definitive Feasibility Study; and,
oThe information derived, summarized, quoted or reference from the TRS – Definitive Feasibility Study, or portions thereof, that were prepared by us, that we supervised the preparation of and/or that was reviewed or approved by us, that is reported or incorporated by reference into a Security Act filing.
•I have read and understood the requirements of the Regulation S-K 1300 Modernization of Property Disclosures.
•I am a “Qualified Person” as defined by Regulation S-K, and to the activity for which I am accepting responsibility.
•I have reviewed the Technical Report Summary to which this Consent Statement applies.
•I am a full-time employee of Ashmore Advisory Pty Ltd. who has been engaged by Atlantic Lithium Limited. to prepare the documentation for the Ewoyaa Lithium Project on which the Report is based, for the period ended on December 31, 2023.
I verify that the Report is based on and fairly and accurately reflects in the form and context in which it appears, the information in our supporting documentation relating to:
oSection 1 – Executive Summary
oSection 6 – Geological Setting, Mineralization, and Deposit
oSection 8 - Sample Preparation, Analysis and Security
oSection 9 - Data Verification
oSection 11 - Mineral Resource Estimates
oSection 22.1 – Interpretation and Conclusions - Mineral Resource
oSection 23.1 – Recommendations - Mineral Resource
oSection 24.1 – References - Geology
oSection 25 – Reliance on Information Provided by the Registrant
CONSENT
I consent to the filing of the Technical Report Summary by Piedmont Lithium Inc. (“Reporting Company”)
Additional Reports related to the Deposits for which the Qualified Person signing this form is accepting responsibility:
•The Reporting Company’s Annual Reports (10-K) for the next 12 months;
•The Reporting Company’s Quarterly Reports for the next 12 months;
•The Reporting Company’s Investor Presentations for the next 12 months;
•The Reporting Company’s future press releases for the next 12 months, until such time that the Report is superseded or this consent is otherwise withdrawn;
•The Reporting Company’s exhibition booths at any conferences for the next 12 months; and
•Any other releases, presentations and promotional material made by the Reporting Company during the next 12 months, until such time that the exploration target included in the Report is superseded or this consent is otherwise withdrawn.
|
|
|
|
|
|
|
|
|
|
|
|
| /s/ Shaun Searle |
|
February 27, 2024 |
| Signature of Competent Person |
|
Date |
|
|
|
| Australian Institute of Geoscientists (AIG) |
|
2866 |
| Professional Membership |
|
Membership Number |
|
|
|
| /s/ Kate Searle |
|
Kate Searle |
| Signature of Witness |
|
Print Witness Name |
|
|
|
EX-23.5
7
ex235-qphwarriesxewoyaa.htm
EX-23.5
Document
Exhibit 23.5
Consent of Qualified Person
In accordance with the requirements of Regulation S-K 1300 Modernization of Property Disclosures §229.1302(b)(4)(iv)
Report Description
Report titled “Technical Report Summary of a Definitive Feasibility Study of the Ewoyaa Lithium Project”
(“Report”)
Piedmont Lithium Inc.
(“Company”)
Ewoyaa Lithium Project
(“Deposit”)
February 26, 2024
(“Date of Report”)
Statement
I, Harry Warries, of Mining Focus Consultants Pty Ltd., confirm that:
•In connection with any Securities Act filings or Exchange Act report and any amendment, supplement, or exhibit thereto, I consent to:
oThe filing and use of the Technical Report Summary titled “Technical Report Summary of a Definitive Feasibility Study of the Ewoyaa Lithium Project in Ghana” (“TRS – Definitive Feasibility Study”) in connection with the Company’s 10-K filing with an approximate filing date of February 28, 2024; and,
oThe use of the Mining Focus Consultants Pty Ltd. name, including our status as an expert or Qualified Person (as defined in Subpart 1300 of Regulation S-K promulgated by the Securities and Exchange Commission) in connection with the TRS – Definitive Feasibility Study; and,
oThe information derived, summarized, quoted or reference from the TRS – Definitive Feasibility Study, or portions thereof, that were prepared by us, that we supervised the preparation of and/or that was reviewed or approved by us, that is reported or incorporated by reference into a Security Act filing.
•I have read and understood the requirements of the Regulation S-K 1300 Modernization of Property Disclosures.
•I am a “Qualified Person” as defined by Regulation S-K, and to the activity for which I am accepting responsibility.
•I have reviewed the Technical Report Summary to which this Consent Statement applies.
•I am a full-time employee of Mining Focus Consultants Pty Ltd. who has been engaged by Atlantic Lithium Limited. to prepare the documentation for the Ewoyaa Lithium Project on which the Report is based, for the period ended on December 31, 2023.
I verify that the Report is based on and fairly and accurately reflects in the form and context in which it appears, the information in our supporting documentation relating to:
oSection 1 – Executive Summary
oSection 12 – Ore Reserve Estimates
oSection 13 – Mining Methods
oSection 22.2 – Interpretation and Conclusions - Mining
oSection 23.2 – Recommendations - Mining
oSection 24.2 – References - Mining
oSection 25 – Reliance on Information Provided by the Registrant
CONSENT
I consent to the filing of the Technical Report Summary by Piedmont Lithium Inc. (“Reporting Company”)
Additional Reports related to the Deposits for which the Qualified Person signing this form is accepting responsibility:
•The Reporting Company’s Annual Reports (10-K) for the next 12 months;
•The Reporting Company’s Quarterly Reports for the next 12 months;
•The Reporting Company’s Investor Presentations for the next 12 months;
•The Reporting Company’s future press releases for the next 12 months, until such time that the Report is superseded or this consent is otherwise withdrawn;
•The Reporting Company’s exhibition booths at any conferences for the next 12 months; and
•Any other releases, presentations and promotional material made by the Reporting Company during the next 12 months, until such time that the exploration target included in the Report is superseded or this consent is otherwise withdrawn.
|
|
|
|
|
|
|
|
|
|
|
|
| /s/ Harry Warries |
|
February 26, 2024 |
| Signature of Competent Person |
|
Date |
|
|
|
| FAusIMM |
|
111318 |
| Professional Membership |
|
Membership Number |
|
|
|
| /s/ R. Warries |
|
R. Warries |
| Signature of Witness |
|
Print Witness Name |
|
|
|
EX-23.6
8
ex236-qpkmullerxewoyaa.htm
EX-23.6
Document
Exhibit 23.6
Consent of Qualified Person
In accordance with the requirements of Regulation S-K 1300 Modernization of Property Disclosures §229.1302(b)(4)(iv)
Report Description
Report titled “Technical Report Summary of a Definitive Feasibility Study of the Ewoyaa Lithium Project”
(“Report”)
Piedmont Lithium Inc.
(“Company”)
Ewoyaa Lithium Project
(“Deposit”)
February 26, 2024
(“Date of Report”)
Statement
I, Keith Muller, of Atlantic Lithium Ltd., confirm that:
•In connection with any Securities Act filings or Exchange Act report and any amendment, supplement, or exhibit thereto, I consent to:
oThe filing and use of the Technical Report Summary titled “Technical Report Summary of a Definitive Feasibility Study of the Ewoyaa Lithium Project in Ghana” (“TRS – Definitive Feasibility Study”) in connection with the Company’s 10-K filing with an approximate filing date of February 28, 2024; and,
oThe use of the Atlantic Lithium Ltd. name, including our status as an expert or Qualified Person (as defined in Subpart 1300 of Regulation S-K promulgated by the Securities and Exchange Commission) in connection with the TRS – Definitive Feasibility Study; and,
oThe information derived, summarized, quoted or reference from the TRS – Definitive Feasibility Study, or portions thereof, that were prepared by us, that we supervised the preparation of and/or that was reviewed or approved by us, that is reported or incorporated by reference into a Security Act filing.
•I have read and understood the requirements of the Regulation S-K 1300 Modernization of Property Disclosures.
•I am a “Qualified Person” as defined by Regulation S-K, and to the activity for which I am accepting responsibility.
•I have reviewed the Technical Report Summary to which this Consent Statement applies.
•I am a full-time employee of Atlantic Lithium Ltd. who has been engaged by Piedmont Limited. Inc. to prepare the documentation for the Ewoyaa Lithium Project on which the Report is based, for the period ended on December 31, 2023.
I verify that the Report is based on and fairly and accurately reflects in the form and context in which it appears, the information in our supporting documentation relating to:
oSection 1 – Executive Summary
oSection 2 – Introduction
oSection 3 – Property Description
oSection 4 – Accessibility, Climate, Local Resources, Infrastructure, Physiography
oSection 15 – Infrastructure
oSection 16 - Market Studies
oSection 17 – Environmental Studies and Permitting
oSection 18 – Capital and Operating Costs
oSection 19 - Economic Model and Sensitivity Analysis
oSection 20 – Adjacent Properties
oSection 21 - Other Relevant Data and Information
oSection 22 - Interpretation and Conclusions
oSection 22 – Interpretation and Conclusions
oSection 23 – Recommendations
oSection 24 – References
oSection 25 – Reliance on Information Provided by the Registrant
CONSENT
I consent to the filing of the Technical Report Summary by Piedmont Lithium Inc. (“Reporting Company”)
Additional Reports related to the Deposits for which the Qualified Person signing this form is accepting responsibility:
•The Reporting Company’s Annual Reports (10-K) for the next 12 months;
•The Reporting Company’s Quarterly Reports for the next 12 months;
•The Reporting Company’s Investor Presentations for the next 12 months;
•The Reporting Company’s future press releases for the next 12 months, until such time that the Report is superseded or this consent is otherwise withdrawn;
•The Reporting Company’s exhibition booths at any conferences for the next 12 months; and
•Any other releases, presentations and promotional material made by the Reporting Company during the next 12 months, until such time that the exploration target included in the Report is superseded or this consent is otherwise withdrawn.
|
|
|
|
|
|
|
|
|
|
|
|
| /s/ Keith Muller |
|
February 27, 2024 |
| Signature of Competent Person |
|
Date |
|
|
|
| FAusImm |
|
314908 |
| Professional Membership |
|
Membership Number |
|
|
|
| /s/ Michael Bourguignon |
|
Michael Bourguignon |
| Signature of Witness |
|
Print Witness Name |
|
|
|
EX-23.7
9
ex237-qpnobrienxewoyaa.htm
EX-23.7
Document
Exhibit 23.7
Consent of Qualified Person
In accordance with the requirements of Regulation S-K 1300 Modernization of Property Disclosures §229.1302(b)(4)(iv)
Report Description
Report titled “Technical Report Summary of a Definitive Feasibility Study of the Ewoyaa Lithium Project”
(“Report”)
Piedmont Lithium Inc.
(“Company”)
Ewoyaa Lithium Project
(“Deposit”)
February 26, 2024
(“Date of Report”)
Statement
I, Noel O'Brien, of Trinol Pty Ltd., confirm that:
•In connection with any Securities Act filings or Exchange Act report and any amendment, supplement, or exhibit thereto, I consent to:
oThe filing and use of the Technical Report Summary titled “Technical Report Summary of a Definitive Feasibility Study of the Ewoyaa Lithium Project in Ghana” (“TRS – Definitive Feasibility Study”) in connection with the Company’s 10-K filing with an approximate filing date of February 28, 2024; and,
oThe use of the Trinol Pty Ltd.. name, including our status as an expert or Qualified Person (as defined in Subpart 1300 of Regulation S-K promulgated by the Securities and Exchange Commission) in connection with the TRS – Definitive Feasibility Study; and,
oThe information derived, summarized, quoted or reference from the TRS – Definitive Feasibility Study, or portions thereof, that were prepared by us, that we supervised the preparation of and/or that was reviewed or approved by us, that is reported or incorporated by reference into a Security Act filing.
•I have read and understood the requirements of the Regulation S-K 1300 Modernization of Property Disclosures.
•I am a “Qualified Person” as defined by Regulation S-K, and to the activity for which I am accepting responsibility.
•I have reviewed the Technical Report Summary to which this Consent Statement applies.
•I am a full-time employee of Trinol Pty Ltd. who has been engaged by Piedmont Limited. Inc. to prepare the documentation for the Ewoyaa Lithium Project on which the Report is based, for the period ended on December 31, 2023.
I verify that the Report is based on and fairly and accurately reflects in the form and context in which it appears, the information in our supporting documentation relating to:
oSection 1 – Executive Summary
oSection 10 - Mineral Processing and Metallurgical Testing
oSection 14 - Processing and Recovery Methods
oSection 22.3 - Interpretation and Conclusions - Metallurgy Testing
oSection 22.4 – Interpretation and Conclusions - Recovery Methods
oSection 23.3 – Recommendations - Metallurgy Testing / Recovery Methods
oSection 25 – Reliance on Information Provided by the Registrant
CONSENT
I consent to the filing of the Technical Report Summary by Piedmont Lithium Inc. (“Reporting Company”)
Additional Reports related to the Deposits for which the Qualified Person signing this form is accepting responsibility:
•The Reporting Company’s Annual Reports (10-K) for the next 12 months;
•The Reporting Company’s Quarterly Reports for the next 12 months;
•The Reporting Company’s Investor Presentations for the next 12 months;
•The Reporting Company’s future press releases for the next 12 months, until such time that the Report is superseded or this consent is otherwise withdrawn;
•The Reporting Company’s exhibition booths at any conferences for the next 12 months; and
•Any other releases, presentations and promotional material made by the Reporting Company during the next 12 months, until such time that the exploration target included in the Report is superseded or this consent is otherwise withdrawn.
|
|
|
|
|
|
|
|
|
|
|
|
/s/ Noel O'Brien |
|
February 27, 2024 |
| Signature of Competent Person |
|
Date |
|
|
|
| Fellow of AusIMM |
|
226758 |
| Professional Membership |
|
Membership Number |
|
|
|
| /s/ Justin Veenendaal |
|
Justin Veenendaal |
| Signature of Witness |
|
Print Witness Name |
|
|
|
EX-23.8
10
ex238-qplkolffxewoyaa.htm
EX-23.8
Document
Exhibit 23.8
Consent of Qualified Person
In accordance with the requirements of Regulation S-K 1300 Modernization of Property Disclosures §229.1302(b)(4)(iv)
Report Description
Report titled “Technical Report Summary of a Definitive Feasibility Study of the Ewoyaa Lithium Project”
(“Report”)
Piedmont Lithium Inc.
(“Company”)
Ewoyaa Lithium Project
(“Deposit”)
February 26, 2024
(“Date of Report”)
Statement
I, Lennard Kolff van Oosterwijk, of Atlantic Lithium Ltd., confirm that:
•In connection with any Securities Act filings or Exchange Act report and any amendment, supplement, or exhibit thereto, I consent to:
oThe filing and use of the Technical Report Summary titled “Technical Report Summary of a Definitive Feasibility Study of the Ewoyaa Lithium Project in Ghana” (“TRS – Definitive Feasibility Study”) in connection with the Company’s 10-K filing with an approximate filing date of February 28, 2024; and,
oThe use of the Atlantic Lithium Ltd. name, including our status as an expert or Qualified Person (as defined in Subpart 1300 of Regulation S-K promulgated by the Securities and Exchange Commission) in connection with the TRS – Definitive Feasibility Study; and,
oThe information derived, summarized, quoted or reference from the TRS – Definitive Feasibility Study, or portions thereof, that were prepared by us, that we supervised the preparation of and/or that was reviewed or approved by us, that is reported or incorporated by reference into a Security Act filing.
•I have read and understood the requirements of the Regulation S-K 1300 Modernization of Property Disclosures.
•I am a “Qualified Person” as defined by Regulation S-K, and to the activity for which I am accepting responsibility.
•I have reviewed the Technical Report Summary to which this Consent Statement applies.
•I am a full-time employee of Atlantic Lithium Ltd. who has been engaged by Piedmont Limited. Inc. to prepare the documentation for the Ewoyaa Lithium Project on which the Report is based, for the period ended on December 31, 2023.
I verify that the Report is based on and fairly and accurately reflects in the form and context in which it appears, the information in our supporting documentation relating to:
oSection 1 – Executive Summary
oSection 5 - History
oSection 7 - Exploration
oSection 25 – Reliance on Information Provided by the Registrant
CONSENT
I consent to the filing of the Technical Report Summary by Piedmont Lithium Inc. (“Reporting Company”)
Additional Reports related to the Deposits for which the Qualified Person signing this form is accepting responsibility:
•The Reporting Company’s Annual Reports (10-K) for the next 12 months;
•The Reporting Company’s Quarterly Reports for the next 12 months;
•The Reporting Company’s Investor Presentations for the next 12 months;
•The Reporting Company’s future press releases for the next 12 months, until such time that the Report is superseded or this consent is otherwise withdrawn;
•The Reporting Company’s exhibition booths at any conferences for the next 12 months; and
•Any other releases, presentations and promotional material made by the Reporting Company during the next 12 months, until such time that the exploration target included in the Report is superseded or this consent is otherwise withdrawn.
|
|
|
|
|
|
|
|
|
|
|
|
/s/Lennard Kolff van Oosterwijk |
|
February 28, 2024 |
| Signature of Competent Person |
|
Date |
|
|
|
| Australian institute of Geoscientists |
|
4509 |
| Professional Membership |
|
Membership Number |
|
|
|
| /s/ Steven Cancio-Newton |
|
Steven Cancio-Newton |
| Signature of Witness |
|
Print Witness Name |
|
|
|
EX-23.9
11
ex2309-qpscollardxnal.htm
EX-23.9
Document
Exhibit 23.9
Consent of Qualified Person
In accordance with the requirements of Regulation S-K 1300 Modernization of Property Disclosures §229.1302(b)(4)(iv)
Report Description
Report titled “North American Lithium DFS Technical Report Summary - Quebec, Canada”
(“Report”)
Piedmont Lithium Inc.
(“Company”)
North American Lithium Project
(“Deposit”)
February 27, 2024
(“Date of Report”)
Statement
I, Sylvain Collard, P. Eng, of Sayona Quebec, Inc., confirm that:
•In connection with any Securities Act filings or Exchange Act report and any amendment, supplement, or exhibit thereto, I consent to:
oThe filing and use of the Technical Report Summary titled “North American Lithium DFS Technical Report Summary - Quebec, Canada” (“TRS – Definitive Feasibility Study”) in connection with the Company’s 10-K filing with an approximate filing date of February 28, 2024; and,
oThe use of the Sayona Quebec, Inc. name, including our status as an expert or Qualified Person (as defined in Subpart 1300 of Regulation S-K promulgated by the Securities and Exchange Commission) in connection with the TRS – Definitive Feasibility Study; and,
oThe information derived, summarized, quoted or reference from the TRS – Definitive Feasibility Study, or portions thereof, that were prepared by us, that we supervised the preparation of and/or that was reviewed or approved by us, that is reported or incorporated by reference into a Security Act filing.
•I have read and understood the requirements of the Regulation S-K 1300 Modernization of Property Disclosures.
•I am a “Qualified Person” as defined by Regulation S-K, and to the activity for which our firm is accepting responsibility.
•I have reviewed the Technical Report Summary to which this Consent Statement applies.
•I am an authorized representative and full-time employee of Sayona Quebec Inc. who has been engaged by Piedmont Lithium Inc. to prepare the documentation for the North American Lithium Project on which the Report is based, for the period ended December 31, 2023.
I am responsible for (chapters) titled "North American Lithium DFS Technical Report Summary - Quebec, Canada," with specific responsibility for the following sections of this report::
oSection 1 – Executive Summary
oSection 2 – Introduction
oSection 15 – Project Infrastructure
oSection 16 - Market Studies and Contracts
oSection 17 – Environmental Studies and Permitting
oSection 18 – Capital and Operating Costs
oSection 19 - Economic Analysis
oSection 21 - Other Relevant Data and Information
oSection 22 – Interpretation and Conclusions
oSection 23 – Recommendations
oSection 24 – References
oSection 25 – Reliance on Information Provided by the Registrant
CONSENT
I consent to the filing of the Technical Report Summary by Piedmont Lithium Inc. (“Reporting Company”)
Additional Reports related to the Deposits for which the Qualified Person signing this form is accepting responsibility:
•The Reporting Company’s Annual Reports (10-K) for the next 12 months;
•The Reporting Company’s Quarterly Reports for the next 12 months;
•The Reporting Company’s Investor Presentations for the next 12 months;
•The Reporting Company’s future press releases for the next 12 months, until such time that the Report is superseded or this consent is otherwise withdrawn;
•The Reporting Company’s exhibition booths at any conferences for the next 12 months; and
•Any other releases, presentations and promotional material made by the Reporting Company during the next 12 months, until such time that the exploration target included in the Report is superseded or this consent is otherwise withdrawn.
|
|
|
|
|
|
|
|
|
|
|
|
| /s/ Sylvain Collard |
|
February 27, 2024 |
| Signature of Competent Person |
|
Date |
|
|
|
| Ordre des Géologues du Québec |
|
139697 |
| Professional Membership |
|
Membership Number |
|
|
|
| /s/ Philippe Chabot |
|
Philippe Chabot |
| Signature of Witness |
|
Print Witness Name |
|
|
|
EX-23.10
12
ex2310-qpjquinnxnal.htm
EX-23.10
Document
Exhibit 23.10
Consent of Qualified Person
In accordance with the requirements of Regulation S-K 1300 Modernization of Property Disclosures §229.1302(b)(4)(iv)
Report Description
Report titled “North American Lithium DFS Technical Report Summary - Quebec, Canada”
(“Report”)
Piedmont Lithium Inc.
(“Company”)
North American Lithium Project
(“Deposit”)
February 27, 2024
(“Date of Report”)
Statement
I, Jarrett Quinn, P. Eng, of Synectiq Inc., confirm that:
•In connection with any Securities Act filings or Exchange Act report and any amendment, supplement, or exhibit thereto, I consent to:
oThe filing and use of the Technical Report Summary titled “North American Lithium DFS Technical Report Summary - Quebec, Canada” (“TRS – Definitive Feasibility Study”) in connection with the Company’s 10-K filing with an approximate filing date of February 28, 2024; and,
oThe use of the Synectiq Inc. name, including our status as an expert or Qualified Person (as defined in Subpart 1300 of Regulation S-K promulgated by the Securities and Exchange Commission) in connection with the TRS – Definitive Feasibility Study; and,
oThe information derived, summarized, quoted or reference from the TRS – Definitive Feasibility Study, or portions thereof, that were prepared by us, that we supervised the preparation of and/or that was reviewed or approved by us, that is reported or incorporated by reference into a Security Act filing.
•I have read and understood the requirements of the Regulation S-K 1300 Modernization of Property Disclosures.
•I am a “Qualified Person” as defined by Regulation S-K, and to the activity for which our firm is accepting responsibility.
•I have reviewed the Technical Report Summary to which this Consent Statement applies.
•I am an authorized representative and full-time employee of Synectiq Inc. who has been engaged by Piedmont Lithium Inc. to prepare the documentation for the North American Lithium Project on which the Report is based, for the period ended December 31, 2023.
I am responsible for (chapters) titled "North American Lithium DFS Technical Report Summary - Quebec, Canada," with specific responsibility for the following sections of this report::
oSection 1 – Executive Summary
oSection 3 – Property Description
oSection 4 – Accessibility, Climate, Local Resources, Infrastructure, Physiography
oSection 10 – Mineral Processing and Metallurgical Testing
oSection 14 – Processing and Recovery Methods
oSection 20 – Adjacent Properties
oSection 21 - Other Relevant Data and Information
oSection 22 – Interpretation and Conclusions
oSection 23 – Recommendations
oSection 24 – References
oSection 25 – Reliance on Information Provided by the Registrant
CONSENT
I consent to the filing of the Technical Report Summary by Piedmont Lithium Inc. (“Reporting Company”)
Additional Reports related to the Deposits for which the Qualified Person signing this form is accepting responsibility:
•The Reporting Company’s Annual Reports (10-K) for the next 12 months;
•The Reporting Company’s Quarterly Reports for the next 12 months;
•The Reporting Company’s Investor Presentations for the next 12 months;
•The Reporting Company’s future press releases for the next 12 months, until such time that the Report is superseded or this consent is otherwise withdrawn;
•The Reporting Company’s exhibition booths at any conferences for the next 12 months; and
•Any other releases, presentations and promotional material made by the Reporting Company during the next 12 months, until such time that the exploration target included in the Report is superseded or this consent is otherwise withdrawn.
|
|
|
|
|
|
|
|
|
|
|
|
| /s/ Jarrett Quinn |
|
February 27, 2024 |
| Signature of Competent Person |
|
Date |
|
|
|
| Ordre des Géologues du Québec |
|
5018119 |
| Professional Membership |
|
Membership Number |
|
|
|
| /s/ Sylvain Collard |
|
Sylvain Collard |
| Signature of Witness |
|
Print Witness Name |
|
|
|
EX-23.11
13
ex2311-qpendahxnal.htm
EX-23.11
Document
Exhibit 23.11
Consent of Qualified Person
In accordance with the requirements of Regulation S-K 1300 Modernization of Property Disclosures §229.1302(b)(4)(iv)
Report Description
Report titled “North American Lithium DFS Technical Report Summary - Quebec, Canada”
(“Report”)
Piedmont Lithium Inc.
(“Company”)
North American Lithium Project
(“Deposit”)
February 27, 2024
(“Date of Report”)
Statement
I, Ehouman N'Dah, P. Geo., of Sayona Quebec, Inc., confirm that:
•In connection with any Securities Act filings or Exchange Act report and any amendment, supplement, or exhibit thereto, I consent to:
oThe filing and use of the Technical Report Summary titled “North American Lithium DFS Technical Report Summary - Quebec, Canada” (“TRS – Definitive Feasibility Study”) in connection with the Company’s 10-K filing with an approximate filing date of February 28, 2024; and,
oThe use of the Sayona Quebec, Inc. name, including our status as an expert or Qualified Person (as defined in Subpart 1300 of Regulation S-K promulgated by the Securities and Exchange Commission) in connection with the TRS – Definitive Feasibility Study; and,
oThe information derived, summarized, quoted or reference from the TRS – Definitive Feasibility Study, or portions thereof, that were prepared by us, that we supervised the preparation of and/or that was reviewed or approved by us, that is reported or incorporated by reference into a Security Act filing.
•I have read and understood the requirements of the Regulation S-K 1300 Modernization of Property Disclosures.
•I am a “Qualified Person” as defined by Regulation S-K, and to the activity for which our firm is accepting responsibility.
•I have reviewed the Technical Report Summary to which this Consent Statement applies.
•I am an authorized representative and full-time employee of Sayona Quebec Inc. who has been engaged by Piedmont Lithium Inc. to prepare the documentation for the North American Lithium Project on which the Report is based, for the period ended on December 31, 2023.
I am responsible for (chapters) titled "North American Lithium DFS Technical Report Summary - Quebec, Canada," with specific responsibility for the following sections of this report::
oSection 1 – Executive Summary
oSection 5 – History
oSection 6 – Geological Setting, Mineralization, and Deposit
oSection 7 - Exploration
oSection 8 - Sample Preparation, Analyses and Security
oSection 9 - Data Verification
oSection 11 - Mineral Resources
oSection 21 - Other Relevant Data and Information
oSection 22 – Interpretation and Conclusions
oSection 23 – Recommendations
oSection 24 – References
oSection 25 – Reliance on Information Provided by the Registrant
CONSENT
I consent to the filing of the Technical Report Summary by Piedmont Lithium Inc. (“Reporting Company”)
Additional Reports related to the Deposits for which the Qualified Person signing this form is accepting responsibility:
•The Reporting Company’s Annual Reports (10-K) for the next 12 months;
•The Reporting Company’s Quarterly Reports for the next 12 months;
•The Reporting Company’s Investor Presentations for the next 12 months;
•The Reporting Company’s future press releases for the next 12 months, until such time that the Report is superseded or this consent is otherwise withdrawn;
•The Reporting Company’s exhibition booths at any conferences for the next 12 months; and
•Any other releases, presentations and promotional material made by the Reporting Company during the next 12 months, until such time that the exploration target included in the Report is superseded or this consent is otherwise withdrawn.
|
|
|
|
|
|
|
|
|
|
|
|
| /s/ Ehouman N'Dah |
|
February 27, 2024 |
| Signature of Competent Person |
|
Date |
|
|
|
| Ordre des Geologues du Quebec |
|
0734 |
| Professional Membership |
|
Membership Number |
|
|
|
| /s/ Maxime Dupere |
|
Maxime Dupere |
| Signature of Witness |
|
Print Witness Name |
|
|
|
EX-23.12
14
ex2312-qpxpchabotxnal.htm
EX-23.12
Document
Exhibit 23.12
Consent of Qualified Person
In accordance with the requirements of Regulation S-K 1300 Modernization of Property Disclosures §229.1302(b)(4)(iv)
Report Description
Report titled “North American Lithium DFS Technical Report Summary - Quebec, Canada”
(“Report”)
Piedmont Lithium Inc.
(“Company”)
North American Lithium Project
(“Deposit”)
February 27, 2024
(“Date of Report”)
Statement
I, Philippe Chabot, P. Eng., of Sayona Quebec, Inc., confirm that:
•In connection with any Securities Act filings or Exchange Act report and any amendment, supplement, or exhibit thereto, I consent to:
oThe filing and use of the Technical Report Summary titled “North American Lithium DFS Technical Report Summary - Quebec, Canada” (“TRS – Definitive Feasibility Study”) in connection with the Company’s 10-K filing with an approximate filing date of February 28, 2024; and,
oThe use of the Sayona Quebec, Inc. name, including our status as an expert or Qualified Person (as defined in Subpart 1300 of Regulation S-K promulgated by the Securities and Exchange Commission) in connection with the TRS – Definitive Feasibility Study; and,
oThe information derived, summarized, quoted or reference from the TRS – Definitive Feasibility Study, or portions thereof, that were prepared by us, that we supervised the preparation of and/or that was reviewed or approved by us, that is reported or incorporated by reference into a Security Act filing.
•I have read and understood the requirements of the Regulation S-K 1300 Modernization of Property Disclosures.
•I am a “Qualified Person” as defined by Regulation S-K, and to the activity for which our firm is accepting responsibility.
•I have reviewed the Technical Report Summary to which this Consent Statement applies.
•I am an authorized representative and full-time employee of Sayona Quebec Inc. who has been engaged by Piedmont Lithium Inc. to prepare the documentation for the North American Lithium Project on which the Report is based, for the period ended December 31, 2023.
I am responsible for (chapters) titled "North American Lithium DFS Technical Report Summary - Quebec, Canada," with specific responsibility for the following sections of this report::
oSection 1 – Executive Summary
oSection 12 – Ore Reserve Estimates
oSection 13 – Mining Methods
oSection 21 - Other Relevant Data and Information
oSection 22 – Interpretation and Conclusions
oSection 23 – Recommendations
oSection 24 – References
oSection 25 – Reliance on Information Provided by the Registrant
CONSENT
I consent to the filing of the Technical Report Summary by Piedmont Lithium Inc. (“Reporting Company”)
Additional Reports related to the Deposits for which the Qualified Person signing this form is accepting responsibility:
•The Reporting Company’s Annual Reports (10-K) for the next 12 months;
•The Reporting Company’s Quarterly Reports for the next 12 months;
•The Reporting Company’s Investor Presentations for the next 12 months;
•The Reporting Company’s future press releases for the next 12 months, until such time that the Report is superseded or this consent is otherwise withdrawn;
•The Reporting Company’s exhibition booths at any conferences for the next 12 months; and
•Any other releases, presentations and promotional material made by the Reporting Company during the next 12 months, until such time that the exploration target included in the Report is superseded or this consent is otherwise withdrawn.
|
|
|
|
|
|
|
|
|
|
|
|
| /s/ Philippe Chabot |
|
February 27, 2024 |
| Signature of Competent Person |
|
Date |
|
|
|
| Ordre des Geologues du Quebec |
|
139359 |
| Professional Membership |
|
Membership Number |
|
|
|
| /s/ Jarrett Quinn |
|
Jarrett Quinn |
| Signature of Witness |
|
Print Witness Name |
|
|
|
EX-23.13
15
ex2313-qpscollardxauthier.htm
EX-23.13
Document
Exhibit 23.13
Consent of Qualified Person
In accordance with the requirements of Regulation S-K 1300 Modernization of Property Disclosures §229.1302(b)(4)(iv)
Report Description
Report titled “Authier Lithium DFS Technical Report Summary - Quebec, Canada”
(“Report”)
Piedmont Lithium Inc.
(“Company”)
North American Lithium Project
(“Deposit”)
February 27, 2024
(“Date of Report”)
Statement
I, Sylvain Collard, P.Eng., of Sayona Quebec Inc., confirm that:
•In connection with any Securities Act filings or Exchange Act report and any amendment, supplement, or exhibit thereto, I consent to:
oThe filing and use of the Technical Report Summary titled “Authier Lithium DFS Technical Report Summary - Quebec, Canada” (“TRS – Definitive Feasibility Study”) in connection with the Company’s 10-K filing with an approximate filing date of February 28, 2024; and,
oThe use of the Sayona Quebec Inc. name, including our status as an expert or Qualified Person (as defined in Subpart 1300 of Regulation S-K promulgated by the Securities and Exchange Commission) in connection with the TRS – Definitive Feasibility Study; and,
oThe information derived, summarized, quoted or reference from the TRS – Definitive Feasibility Study, or portions thereof, that were prepared by us, that we supervised the preparation of and/or that was reviewed or approved by us, that is reported or incorporated by reference into a Security Act filing.
•I have read and understood the requirements of the Regulation S-K 1300 Modernization of Property Disclosures.
•I am a “Qualified Person” as defined by Regulation S-K, and to the activity for which I am accepting responsibility.
•I have reviewed the Technical Report Summary to which this Consent Statement applies.
•I am a full-time employee of Sayona Quebec Inc. who has been engaged by Piedmont Lithium Inc. to prepare the documentation for the North American Lithium (NAL) Project on which the Report is based, for the period ended on December 31, 2023.
I am responsible for the preparation of the report (chapters) titled “Authier Lithium DFS Technical Report Summary – Quebec, Canada,” with specific responsibility for the following sections of this report:
oSection 1 – Executive Summary
oSection 2 – Introduction
oSection 3 – Property Description
oSection 4 – Accessibility, Climate, Local Resources, Infrastructure, Physiography
oSection 15 – Infrastructure
oSection 16 - Market Studies and Contracts
oSection 17 – Environmental Studies and Permitting
oSection 18 – Capital and Operating Costs
oSection 19 - Economic Analysis
oSection 21 - Other Relevant Data and Information
oSection 22 – Interpretation and Conclusions
oSection 23 – Recommendations
oSection 24 – References
oSection 25 – Reliance on Information Provided by the Registrant
CONSENT
I consent to the filing of the Technical Report Summary by Piedmont Lithium Inc. (“Reporting Company”)
Additional Reports related to the Deposits for which the Qualified Person signing this form is accepting responsibility:
•The Reporting Company’s Annual Reports (10-K) for the next 12 months;
•The Reporting Company’s Quarterly Reports for the next 12 months;
•The Reporting Company’s Investor Presentations for the next 12 months;
•The Reporting Company’s future press releases for the next 12 months, until such time that the Report is superseded or this consent is otherwise withdrawn;
•The Reporting Company’s exhibition booths at any conferences for the next 12 months; and
•Any other releases, presentations and promotional material made by the Reporting Company during the next 12 months, until such time that the exploration target included in the Report is superseded or this consent is otherwise withdrawn.
|
|
|
|
|
|
|
|
|
|
|
|
| /s/ Sylvain Collard |
|
February 27, 2024 |
| Signature of Competent Person |
|
Date |
|
|
|
| Ordre des Géologues du Québec |
|
139697 |
| Professional Membership |
|
Membership Number |
|
|
|
| /s/ Philippe Chabot |
|
Philippe Chabot |
| Signature of Witness |
|
Print Witness Name |
|
|
|
EX-23.14
16
ex2314-qpjquinnxauthier.htm
EX-23.14
Document
Exhibit 23.14
Consent of Qualified Person
In accordance with the requirements of Regulation S-K 1300 Modernization of Property Disclosures §229.1302(b)(4)(iv)
Report Description
Report titled “Authier Lithium DFS Technical Report Summary - Quebec, Canada”
(“Report”)
Piedmont Lithium Inc.
(“Company”)
North American Lithium Project
(“Deposit”)
February 27, 2024
(“Date of Report”)
Statement
I, Jarrett Quinn, P.Eng., of Synectiq Inc., confirm that:
•In connection with any Securities Act filings or Exchange Act report and any amendment, supplement, or exhibit thereto, I consent to:
oThe filing and use of the Technical Report Summary titled “Authier Lithium DFS Technical Report Summary - Quebec, Canada” (“TRS – Definitive Feasibility Study”) in connection with the Company’s 10-K filing with an approximate filing date of February 28, 2024; and,
oThe use of the Synectiq Inc. name, including our status as an expert or Qualified Person (as defined in Subpart 1300 of Regulation S-K promulgated by the Securities and Exchange Commission) in connection with the TRS – Definitive Feasibility Study; and,
oThe information derived, summarized, quoted or reference from the TRS – Definitive Feasibility Study, or portions thereof, that were prepared by us, that we supervised the preparation of and/or that was reviewed or approved by us, that is reported or incorporated by reference into a Security Act filing.
•I have read and understood the requirements of the Regulation S-K 1300 Modernization of Property Disclosures.
•I am a “Qualified Person” as defined by Regulation S-K, and to the activity for which I am accepting responsibility.
•I have reviewed the Technical Report Summary to which this Consent Statement applies.
•I am a full-time employee of Synectiq Inc. who has been engaged by Piedmont Lithium Inc. to prepare the documentation for the North American Lithium (NAL) Project on which the Report is based, for the period ended on December 31, 2023.
I am responsible for the preparation of the report (chapters) titled “Authier Lithium DFS Technical Report Summary – Quebec, Canada,” with specific responsibility for the following sections of this report:
oSection 1 – Executive Summary
oSection 10 - Mineral Processing and Metallurgical Testing
oSection 14 - Processing and Recovery Methods
oSection 20 – Adjacent Properties
oSection 21 - Other Relevant Data and Information
oSection 22 – Interpretation and Conclusions
oSection 23 – Recommendations
oSection 24 – References
oSection 25 – Reliance on Information Provided by the Registrant
CONSENT
I consent to the filing of the Technical Report Summary by Piedmont Lithium Inc. (“Reporting Company”)
Additional Reports related to the Deposits for which the Qualified Person signing this form is accepting responsibility:
•The Reporting Company’s Annual Reports (10-K) for the next 12 months;
•The Reporting Company’s Quarterly Reports for the next 12 months;
•The Reporting Company’s Investor Presentations for the next 12 months;
•The Reporting Company’s future press releases for the next 12 months, until such time that the Report is superseded or this consent is otherwise withdrawn;
•The Reporting Company’s exhibition booths at any conferences for the next 12 months; and
•Any other releases, presentations and promotional material made by the Reporting Company during the next 12 months, until such time that the exploration target included in the Report is superseded or this consent is otherwise withdrawn.
|
|
|
|
|
|
|
|
|
|
|
|
| /s/ Jarrett Quinn |
|
February 27, 2024 |
| Signature of Competent Person |
|
Date |
|
|
|
| Ordre des Géologues du Québec |
|
5018119 |
| Professional Membership |
|
Membership Number |
|
|
|
| /s/ Sylvain Collard |
|
Sylvain Collard |
| Signature of Witness |
|
Print Witness Name |
|
|
|
EX-23.15
17
ex2315-qpmduperexauthier.htm
EX-23.15
Document
Exhibit 23.15
Consent of Qualified Person
In accordance with the requirements of Regulation S-K 1300 Modernization of Property Disclosures §229.1302(b)(4)(iv)
Report Description
Report titled “Authier Lithium DFS Technical Report Summary - Quebec, Canada”
(“Report”)
Piedmont Lithium Inc.
(“Company”)
North American Lithium Project
(“Deposit”)
February 27, 2024
(“Date of Report”)
Statement
I, Maxime Dupéré, P.Geo., of SGS Canada Inc. - Geological Services, confirm that:
•In connection with any Securities Act filings or Exchange Act report and any amendment, supplement, or exhibit thereto, I consent to:
oThe filing and use of the Technical Report Summary titled “Authier Lithium DFS Technical Report Summary - Quebec, Canada” (“TRS – Definitive Feasibility Study”) in connection with the Company’s 10-K filing with an approximate filing date of February 28, 2024; and,
oThe use of the SGS Canada Inc. - Geological Services. name, including our status as an expert or Qualified Person (as defined in Subpart 1300 of Regulation S-K promulgated by the Securities and Exchange Commission) in connection with the TRS – Definitive Feasibility Study; and,
oThe information derived, summarized, quoted or reference from the TRS – Definitive Feasibility Study, or portions thereof, that were prepared by us, that we supervised the preparation of and/or that was reviewed or approved by us, that is reported or incorporated by reference into a Security Act filing.
•I have read and understood the requirements of the Regulation S-K 1300 Modernization of Property Disclosures.
•I am a “Qualified Person” as defined by Regulation S-K, and to the activity for which I am accepting responsibility.
•I have reviewed the Technical Report Summary to which this Consent Statement applies.
•I am a full-time employee of SGS Canada Inc. - Geological Services who has been engaged by Piedmont Lithium Inc. to prepare the documentation for the North American Lithium (NAL) Project on which the Report is based, for the period ended on December 31, 2023.
I am responsible for the preparation of the report (chapters) titled “Authier Lithium DFS Technical Report Summary – Quebec, Canada,” with specific responsibility for the following sections of this report:
oSection 1 – Executive Summary
oSection 5 – History
oSection 6 – Geological Setting, Mineralization, and Deposit
oSection 7 - Exploration
oSection 8 - Sample Preparation, Analyses and Security
oSection 9 - Data Verification
oSection 11 - Mineral Resources
oSection 21 - Other Relevant Data and Information
oSection 22 – Interpretation and Conclusions
oSection 23 – Recommendations
oSection 24 – References
oSection 25 – Reliance on Information Provided by the Registrant
CONSENT
I consent to the filing of the Technical Report Summary by Piedmont Lithium Inc. (“Reporting Company”)
Additional Reports related to the Deposits for which the Qualified Person signing this form is accepting responsibility:
•The Reporting Company’s Annual Reports (10-K) for the next 12 months;
•The Reporting Company’s Quarterly Reports for the next 12 months;
•The Reporting Company’s Investor Presentations for the next 12 months;
•The Reporting Company’s future press releases for the next 12 months, until such time that the Report is superseded or this consent is otherwise withdrawn;
•The Reporting Company’s exhibition booths at any conferences for the next 12 months; and
•Any other releases, presentations and promotional material made by the Reporting Company during the next 12 months, until such time that the exploration target included in the Report is superseded or this consent is otherwise withdrawn.
|
|
|
|
|
|
|
|
|
|
|
|
| /s/ Maxime Dupéré |
|
February 27, 2024 |
| Signature of Competent Person |
|
Date |
|
|
|
| Ordre des Géologues du Québec |
|
501 |
| Professional Membership |
|
Membership Number |
|
|
|
| /s/ Ehouman N'Dah |
|
Ehouman N'Dah |
| Signature of Witness |
|
Print Witness Name |
|
|
|
EX-23.16
18
ex2316-qppchabotxauthier.htm
EX-23.16
Document
Exhibit 23.16
Consent of Qualified Person
In accordance with the requirements of Regulation S-K 1300 Modernization of Property Disclosures §229.1302(b)(4)(iv)
Report Description
Report titled “Authier Lithium DFS Technical Report Summary - Quebec, Canada”
(“Report”)
Piedmont Lithium Inc.
(“Company”)
North American Lithium Project
(“Deposit”)
February 27, 2024
(“Date of Report”)
Statement
I, Philippe Chabot, P.Eng., of Sayona Quebec Inc., confirm that:
•In connection with any Securities Act filings or Exchange Act report and any amendment, supplement, or exhibit thereto, I consent to:
oThe filing and use of the Technical Report Summary titled “Authier Lithium DFS Technical Report Summary - Quebec, Canada” (“TRS – Definitive Feasibility Study”) in connection with the Company’s 10-K filing with an approximate filing date of February 28, 2024; and,
oThe use of the Sayona Quebec Inc. name, including our status as an expert or Qualified Person (as defined in Subpart 1300 of Regulation S-K promulgated by the Securities and Exchange Commission) in connection with the TRS – Definitive Feasibility Study; and,
oThe information derived, summarized, quoted or reference from the TRS – Definitive Feasibility Study, or portions thereof, that were prepared by us, that we supervised the preparation of and/or that was reviewed or approved by us, that is reported or incorporated by reference into a Security Act filing.
•I have read and understood the requirements of the Regulation S-K 1300 Modernization of Property Disclosures.
•I am a “Qualified Person” as defined by Regulation S-K, and to the activity for which I am accepting responsibility.
•I have reviewed the Technical Report Summary to which this Consent Statement applies.
•I am a full-time employee of Sayona Quebec Inc. who has been engaged by Piedmont Lithium Inc. to prepare the documentation for the North American Lithium (NAL) Project on which the Report is based, for the period ended on December 31, 2023.
I am responsible for the preparation of the report (chapters) titled “Authier Lithium DFS Technical Report Summary – Quebec, Canada,” with specific responsibility for the following sections of this report:
oSection 1 – Executive Summary
oSection 12 – Ore Reserve Estimates
oSection 13 – Mining Methods
oSection 21 - Other Relevant Data and Information
oSection 22 – Interpretation and Conclusions
oSection 23 – Recommendations
oSection 24 – References
oSection 25 – Reliance on Information Provided by the Registrant
CONSENT
I consent to the filing of the Technical Report Summary by Piedmont Lithium Inc. (“Reporting Company”)
Additional Reports related to the Deposits for which the Qualified Person signing this form is accepting responsibility:
•The Reporting Company’s Annual Reports (10-K) for the next 12 months;
•The Reporting Company’s Quarterly Reports for the next 12 months;
•The Reporting Company’s Investor Presentations for the next 12 months;
•The Reporting Company’s future press releases for the next 12 months, until such time that the Report is superseded or this consent is otherwise withdrawn;
•The Reporting Company’s exhibition booths at any conferences for the next 12 months; and
•Any other releases, presentations and promotional material made by the Reporting Company during the next 12 months, until such time that the exploration target included in the Report is superseded or this consent is otherwise withdrawn.
|
|
|
|
|
|
|
|
|
|
|
|
| /s/ Philippe Chabot |
|
February 27, 2024 |
| Signature of Competent Person |
|
Date |
|
|
|
| Ordre des Ingenieurs du Quebec |
|
139359 |
| Professional Membership |
|
Membership Number |
|
|
|
| /s/ Jarrett Quinn |
|
Jarrett Quinn |
| Signature of Witness |
|
Print Witness Name |
|
|
|
EX-31.1
19
ex311-10k_2023.htm
EX-31.1
Document
Exhibit 31.1
I, Keith D. Phillips, certify that:
1.I have reviewed this Annual Report on Form 10-K of Piedmont Lithium Inc. (the “Company”);
2.Based on my knowledge, this report does not contain any untrue statement of a material fact or omit to state a material fact necessary to make the statements made, in light of the circumstances under which such statements were made, not misleading with respect to the period covered by this report;
3.Based on my knowledge, the financial statements, and other financial information included in this report, fairly present in all material respects the financial condition, results of operations and cash flows of the Company as of, and for, the periods presented in this report;
4.The Company’s other certifying officer and I are responsible for establishing and maintaining disclosure controls and procedures (as defined in Exchange Act Rules 13a-15(e) and 15d-15(e)) and internal control over financial reporting (as defined in Exchange Act Rules 13a-15(f) and 15(d)-15(f)) for the Company and have:
(a)Designed such disclosure controls and procedures, or caused such disclosure controls and procedures to be designed under our supervision, to ensure that material information relating to the Company, including its consolidated subsidiaries, is made known to us by others within those entities, particularly during the period in which this report is being prepared;
(b)Designed such internal control over financial reporting, or caused such internal control over financial reporting to be designed under our supervision, to provide reasonable assurance regarding the reliability of financial reporting and the preparation of financial statements for external purposes in accordance with generally accepted accounting principles;
(c)Evaluated the effectiveness of the Company’s disclosure controls and procedures and presented in this report our conclusions about the effectiveness of the disclosure controls and procedures, as of the end of the period covered by this report based on such evaluation; and
(d)Disclosed in this report any change in the Company’s internal control over financial reporting that occurred during the most recent fiscal quarter that has materially affected, or is reasonably likely to materially affect, the Company’s internal control over financial reporting; and
5.The Company’s other certifying officer and I have disclosed, based on our most recent evaluation of internal control over financial reporting, to the Company’s auditors and the audit committee of the Company’s board of directors (or persons performing the equivalent functions):
(a)All significant deficiencies and material weaknesses in the design or operation of internal control over financial reporting which are reasonably likely to adversely affect the Company’s ability to record, process, summarize and report financial information; and
(b)Any fraud, whether or not material, that involves management or other employees who have a significant role in the Company’s internal control over financial reporting.
|
|
|
|
|
|
|
|
|
| Date: |
February 28, 2024 |
|
|
|
|
| By: |
/s/ Keith D. Phillips |
|
| Name: |
Keith D. Phillips |
|
| Title: |
President and Chief Executive Officer
(Principal Executive Officer) |
|
EX-31.2
20
ex312-10k_2023.htm
EX-31.2
Document
Exhibit 31.2
I, Michael White, certify that:
1.I have reviewed this Annual Report on Form 10-K of Piedmont Lithium Inc. (the “Company”);
2.Based on my knowledge, this report does not contain any untrue statement of a material fact or omit to state a material fact necessary to make the statements made, in light of the circumstances under which such statements were made, not misleading with respect to the period covered by this report;
3.Based on my knowledge, the financial statements, and other financial information included in this report, fairly present in all material respects the financial condition, results of operations and cash flows of the Company as of, and for, the periods presented in this report;
4.The Company’s other certifying officer and I are responsible for establishing and maintaining disclosure controls and procedures (as defined in Exchange Act Rules 13a-15(e) and 15d-15(e)) and internal control over financial reporting (as defined in Exchange Act Rules 13a-15(f) and 15(d)-15(f)) for the Company and have:
(a)Designed such disclosure controls and procedures, or caused such disclosure controls and procedures to be designed under our supervision, to ensure that material information relating to the Company, including its consolidated subsidiaries, is made known to us by others within those entities, particularly during the period in which this report is being prepared;
(b)Designed such internal control over financial reporting, or caused such internal control over financial reporting to be designed under our supervision, to provide reasonable assurance regarding the reliability of financial reporting and the preparation of financial statements for external purposes in accordance with generally accepted accounting principles;
(c)Evaluated the effectiveness of the Company’s disclosure controls and procedures and presented in this report our conclusions about the effectiveness of the disclosure controls and procedures, as of the end of the period covered by this report based on such evaluation; and
(d)Disclosed in this report any change in the Company’s internal control over financial reporting that occurred during the most recent fiscal quarter that has materially affected, or is reasonably likely to materially affect, the Company’s internal control over financial reporting; and
5.The Company’s other certifying officer and I have disclosed, based on our most recent evaluation of internal control over financial reporting, to the Company’s auditors and the audit committee of the Company’s board of directors (or persons performing the equivalent functions):
(a)All significant deficiencies and material weaknesses in the design or operation of internal control over financial reporting which are reasonably likely to adversely affect the Company’s ability to record, process, summarize and report financial information; and
(b)Any fraud, whether or not material, that involves management or other employees who have a significant role in the Company’s internal control over financial reporting.
|
|
|
|
|
|
|
|
|
| Date: |
February 28, 2024 |
|
|
|
|
| By: |
/s/ Michael White |
|
| Name: |
Michael White |
|
| Title: |
Executive Vice President and Chief Financial Officer
(Principal Financial Officer and Principal Accounting Officer) |
EX-32.1
21
ex321-10k_2023.htm
EX-32.1
Document
Exhibit 32.1
CERTIFICATION PURSUANT TO 18 U.S.C. SECTION 1350,
AS ADOPTED PURSUANT TO
SECTION 906 OF THE SARBANES OXLEY ACT OF 2002
In connection with the Annual Report of Piedmont Lithium Inc. (the “Company”) on Form 10-K for the year ended December 31, 2023 (the “Report”) as filed with the Securities and Exchange Commission on the date hereof, I, Keith D. Phillips, Chief Executive Officer of the Company, certify pursuant to 18 U.S.C. Section 1350, as adopted pursuant to Section 906 of the Sarbanes-Oxley Act of 2002, that to my knowledge:
1.the Report fully complies with the requirements of Section 13(a) or 15(d) of the Exchange Act, as amended; and
2.the information contained in the Report fairly presents, in all material respects, the financial condition and results of operations of the Company.
|
|
|
|
|
|
|
|
|
| Date: |
February 28, 2024 |
|
|
|
|
| By: |
/s/ Keith D. Phillips |
|
| Name: |
Keith D. Phillips |
|
| Title: |
President and Chief Executive Officer
(Principal Executive Officer) |
|
EX-32.2
22
ex322-10k_2023.htm
EX-32.2
Document
Exhibit 32.2
CERTIFICATION PURSUANT TO 18 U.S.C. SECTION 1350,
AS ADOPTED PURSUANT TO
SECTION 906 OF THE SARBANES OXLEY ACT OF 2002
In connection with the Annual Report of Piedmont Lithium Inc. (the “Company”) on Form 10-K for the year ended December 31, 2023 (the “Report”) as filed with the Securities and Exchange Commission on the date hereof, I, Michael White, Chief Financial Officer of the Company, certify pursuant to 18 U.S.C. Section 1350, as adopted pursuant to Section 906 of the Sarbanes-Oxley Act of 2002, that to my knowledge:
1.the Report fully complies with the requirements of Section 13(a) or 15(d) of the Exchange Act, as amended; and
2.the information contained in the Report fairly presents, in all material respects, the financial condition and results of operations of the Company.
|
|
|
|
|
|
|
|
|
| Date: |
February 28, 2024 |
|
|
|
|
| By: |
/s/ Michael White |
|
| Name: |
Michael White |
|
| Title: |
Executive Vice President and Chief Financial Officer
(Principal Financial Officer and Principal Accounting Officer) |
EX-96.2
23
ex962-atlanticfeb26.htm
EX-96.2
ex962-atlanticfeb26

www.atlanticlithium.com.au Prepared For: Piedmont Lithium Inc. Prepared By: Atlantic Lithium Limited 1 Ashmore Advisory Pty Ltd 2 Mining Focus Consultants Pty Ltd 3 Trinol Pty Ltd 4 Authors: 1 Keith Muller 1 Lennard Kolff 2 Shaun Searle 3 Harry Warries 4 Noel O’Brien T R S EWOYAA LITHIUM PROJECT Exhibit 96.2 TECHNICAL REPORT SUMMARY EWOYAA LITHIUM PROJECT Page 2 of 368 STATEMENT OF USE AND PREPARATION This Technical Report Summary (TRS) with an effective date of December 31, 2023, and was prepared by Atlantic Lithium (AIM: ALL, ASX: A11, OTCQX: ALLIF, “Atlantic Lithium”, ALL or the “Company”) for the sole use of Piedmont Lithium Inc. (“Piedmont” or “Registrant”) and its affiliated and subsidiary companies and advisors. Copies or references to information in this report may not be used without the written permission of Atlantic Lithium Ltd or Piedmont Lithium Inc. This report includes methodologies behind the derivation of mineral resources and ore reserves, as defined under the United States Securities and Exchange Commission (SEC) and Joint Ore Reserve Committee (JORC), through the consideration of geological, mining and environmental factors. Certain information set forth in this report contains “forward-looking information”, including production of reserves, associated productivity rates, operating costs, capital costs, sales prices, and other assumptions. These statements are not guarantees of future performance and undue reliance should not be placed on them. The assumptions used to develop the forward-looking information and the risks that could cause the actual results to differ materially are detailed in the body of this report. By definition, “Indicated” and “Probable” terminology carries a lower level of geological and engineering confidence than that which would be reflected through the derivation of “Measured” resources and “Proved” reserves. Indicated definitions provide a confidence level to support broad estimates of Mineral Resource quantity and grade adequate for long-term mine planning to support Probable Reserve definitions. Resource and reserve estimations, and their impacts on production schedules, processing recoveries, saleable product tonnages, costs, revenues, profits, and other results presented in this TRS align with the definition and accuracy of Indicated Mineral Resources and Probable Ore Reserves. Through future exploration campaigns, geological and engineering studies, Atlantic Lithium desires to elevate classifications of resources and reserves in due time. The statement is based on information provided by Atlantic Lithium and reviewed by various professionals and Competent/Qualified Persons from Ashmore Advisory Pty Ltd., Trinol Pty Ltd. and Mining Focus Consultants Pty Ltd. Competent/Qualified professionals who contributed to the drafting and review of this report meet the definition of Qualified Persons (QPs), consistent with the requirements of the SEC and Competent Persons consistent with the requirements of JORC. The information in this TRS related to ore resources and mineral reserves is based on, and fairly represents, information compiled by the QPs as of the effective date of the report. REPORT DATE This Report entitled “Technical Report Summary of a Feasibility Study of the Ewoyaa Lithium Project in Ghana”, issue date February 26, 2024, was prepared and signed by the following Authors and based on contributions, reports and reviews by QPs for which consent forms have been provided. TECHNICAL REPORT SUMMARY EWOYAA LITHIUM PROJECT Page 3 of 368 TABLE OF CONTENTS 1.0 EXECUTIVE SUMMARY 16 1.1 INTRODUCTION 16 1.2 PROPERTY DESCRIPTION 19 1.3 ACCESSIBILITY, CLIMATE, LOCAL RESOURCES, INFRASTRUCTURE AND PHYSIOGRAPHY 21 1.4 HISTORY 22 1.5 GEOLOGICAL SETTINGS, MINERALISATION AND DEPOSIT 22 1.6 EXPLORATION 23 1.7 SAMPLE PREPARATION, ANALYSIS AND SECURITY 23 1.8 DATA VERIFICATION 24 1.9 METALLURGICAL TESTING AND MINERAL PROCESSING 25 1.10 MINERAL RESOURCES ESTIMATE 26 1.11 ORE RESERVE ESTIMATES 27 1.12 MINING 29 1.13 PROCESSING AND RECOVERY METHODS 35 1.14 INFRASTRUCTURE 38 1.15 MARKET ANALYSIS 41 1.16 ENVIRONMENTAL STUDIES, SOCIAL AND PERMITTING 42 1.17 CAPITAL AND OPERATING COSTS 45 1.18 ECONOMIC MODEL AND SENSITIVITY ANALYSIS 49 1.19 OTHER RELEVANT INFORMATION 53 1.20 RISK AND OPPORTUNITY 56 1.21 INTERPRETATION AND CONCLUSIONS 58 1.22 RECOMMENDATIONS 59 2.0 INTRODUCTION 60 2.1 PROJECT BACKGROUND 60 2.2 AUTHORS AND SITE INSPECTIONS 60 2.3 STUDY PARTICIPANTS AND RESPONSIBILITIES 63 2.4 ABBREVIATIONS, ACRONYMS AND UNITS OF MEASURE 63 2.5 SCOPE OF WORK 74 2.6 UPDATES TO PREVIOUS TRS 74 3.0 PROPERTY DESCRIPTION 75 3.1 LOCATION 75 3.2 TITLES, CLAIMS OR LEASES 76 3.3 MINERAL RIGHTS 76 TECHNICAL REPORT SUMMARY EWOYAA LITHIUM PROJECT Page 4 of 368 3.4 ENCUMBRANCES 84 3.5 OTHER RISKS 84 4.0 ACCESSIBILITY, CLIMATE, LOCAL RESOURCES, INFRASTRUCTURE AND PHYSIOGRAPHY 85 4.1 TOPOGRAPHY, ELEVATION, AND VEGETATION 85 4.2 ACCESS AND TRANSPORT 85 4.3 POPULATION AND ECONOMY 86 4.4 CLIMATE AND LENGTH OF OPERATING SEASON 86 4.5 INFRASTRUCTURE 86 5.0 HISTORY 87 5.1 PREVIOUS LITHIUM MINING IN THE REGION 87 5.2 PREVIOUS EXPLORATION 87 6.0 GEOLOGICAL SETTINGS, MINERALISATION AND DEPOSIT 88 6.1 REGIONAL, LOCAL AND PROPERTY GEOLOGY 88 6.2 WEATHERING AND OXIDATION 96 6.3 STRUCTURE AND ALTERATION 96 6.4 MINERALISATION 99 7.0 EXPLORATION 101 7.1 NATURE AND EXTENT OF EXPLORATION 101 7.2 DRILLING PROCEDURES 106 8.0 SAMPLE PREPARATION, ANALYSIS AND SECURITY 108 8.1 SAMPLING 108 8.2 BLANKS 108 8.3 FIELD DUPLICATES 109 8.4 CERTIFIED REFERENCE MATERIAL 110 8.5 UMPIRE LABORATORY CHECK ASSAY 110 8.6 DATA QUALITY ASSESSMENT 111 8.7 DENSITY 111 9.0 DATA VERIFICATION 113 9.1 PROCEDURES OF QUALIFIED PERSON 113 9.2 LIMITATIONS 114 9.3 OPINION OF QUALIFIED PERSON 114 10.0 MINERAL PROCESSING AND METALLURGICAL TESTING 115 10.1 SAMPLE SELECTION 115 10.2 MINERALOGY 121

TECHNICAL REPORT SUMMARY EWOYAA LITHIUM PROJECT Page 5 of 368 10.3 COMMINUTION 121 10.4 PARTICLE SIZE DISTRIBUTIONS 122 10.5 HEAVY LIQUID SEPARATION (HLS) 124 10.6 DENSE MEDIA SEPARATION 130 10.7 RHEOLOGY 132 10.8 THICKENING 133 10.9 RECOVERY SUMMARY 133 10.10 OPPORTUNITIES & BY-PRODUCT POTENTIAL 134 11.0 MINERAL RESOURCE ESTIMATES 138 11.1 GEOLOGICAL MODELLING 138 11.2 STATISTICAL AND GEOSTATISTICAL ANALYSIS 143 11.3 BLOCK MODELLING 156 11.4 MINERAL RESOURCE REPORTING 164 11.5 CLASSIFICATION 165 11.6 REASONABLE PROSPECTS FOR ECONOMIC EXTRACTION 168 11.7 MINERAL RESOURCE ESTIMATE 168 11.8 QUALIFIED PERSON’S OPINION 173 12.0 ORE RESERVE ESTIMATES 174 12.1 QUALIFIED PERSON’S ESTIMATES 175 12.2 QUALIFIED PERSON’S OPINION 176 13.0 MINING METHODS 177 13.1 INTRODUCTION 177 13.2 MINING OPERATION BASIS 178 13.3 HYDROLOGY AND HYDROGEOLOGY 178 13.4 GEOTECHNICAL DATA 186 13.5 PIT OPTIMISATION 188 13.6 MINE DESIGN 189 13.7 MINE PRODUCTION SCHEDULE 192 13.8 MINING COST ESTIMATION 194 14.0 PROCESSING AND RECOVERY METHODS 196 14.1 KEY PROCESS DESIGN CRITERIA 196 14.2 PROCESS PLANT 196 14.3 PROCESS PLANT LAYOUT 203 14.4 PRE-PRODUCTION PROCESSING 204 15.0 INFRASTRUCTURE 208 TECHNICAL REPORT SUMMARY EWOYAA LITHIUM PROJECT Page 6 of 368 15.1 SITE DEVELOPMENT 208 15.2 SITE WATER MANAGEMENT 208 15.3 WATER BALANCE 210 15.4 WATER SUPPLY 212 15.5 TAILINGS STORAGE AND MANAGEMENT 215 15.6 ROADS 220 15.7 PLANT SITE DEVELOPMENT 221 15.8 POWER 222 15.9 COMMUNICATIONS SYSTEMS INFRASTRUCTURE 224 15.10 PLANT AREA BUILDINGS AND FACILITIES 224 15.11 OTHER SUPPORT FACILITIES 226 15.12 WORKFORCE ACCOMMODATION 226 15.13 FUEL STORAGE 227 15.14 PORT INFRASTRUCTURE AND TRANSPORT LOGISTICS 227 16.0 MARKET STUDIES 232 16.1 MARKETING 232 16.2 MARKETING STRATEGY 233 16.3 PRODUCT PRICING 233 16.4 MATERIAL CONTRACTS 233 17.0 ENVIRONMENTAL STUDIES, SOCIAL AND PERMITTING 235 17.1 INTRODUCTION 235 17.2 ENVIRONMENTAL PERMITTING 235 17.3 LEGAL AND REGULATORY FRAMEWORK 236 17.4 PERMITTING PROCESS 245 17.5 EXISTING ENVIRONMENTAL CONTEXT 251 17.6 EXISTING SOCIAL CONTEXT 258 17.7 BIOPHYSICAL DATA 260 17.8 SOCIO-ECONOMIC DATA 274 17.9 PRELIMINARY IDENTIFICATION OF POTENTIAL IMPACTS 275 17.10 ENVIRONMENT, SOCIAL, HEALTH AND SAFETY MANAGEMENT SYSTEM (ESHMS) 277 17.11 STAKEHOLDER ENGAGEMENT 282 17.12 GRIEVANCE MECHANISM 282 17.13 COMMUNITY DEVELOPMENT 283 17.14 REHABILITATION AND CLOSURE 284 18.0 CAPITAL AND OPERATING COSTS 285 TECHNICAL REPORT SUMMARY EWOYAA LITHIUM PROJECT Page 7 of 368 18.1 CAPITAL COST (CAPEX) INTRODUCTION 285 18.2 CAPEX SUMMARY 285 18.3 CAPEX BASIS OF ESTIMATES 285 18.4 SITE GENERAL & INFRASTRUCTURE 289 18.5 MINING 290 18.6 PROJECT INDIRECTS 291 18.7 OWNER’S COSTS 292 18.8 EARLY PHASE PRODUCTION PLANT 294 18.9 CONTINGENCY 294 18.10 DEFERRED AND SUSTAINING CAPITAL 295 18.11 OPERATING COSTS LOM SUMMARY 296 18.12 OPEX BASIS OF ESTIMATE 296 18.13 MINING OPERATING COSTS 297 18.14 OPERATING COSTS 297 18.15 PRE-PRODUCTION MODULAR DMS PLANT OPERATING COSTS 302 19.0 ECONOMIC MODEL AND SENSITIVITY ANALYSIS 304 19.1 INTRODUCTION 304 19.2 FINANCIAL MODEL BASIS AND INPUTS 304 19.3 FINANCIAL MODEL RESULTS 306 19.4 SENSITIVITY ANALYSIS 308 20.0 ADJACENT PROPERTIES 310 21.0 OTHER RELEVANT DATA AND INFORMATION 311 21.1 PROJECT IMPLEMENTATION 311 21.2 ORGANISATION 331 22.0 INTERPRETATION AND CONCLUSIONS 349 22.1 MINERAL RESOURCE 349 22.2 MINING 349 22.3 METALLURGY TESTING 349 22.4 RECOVERY METHODS 350 22.5 RISK & OPPORTUNITY EVALUATION 350 23.0 RECOMMENDATIONS 365 23.1 MINERAL RESOURCE 365 23.2 MINING 365 23.3 METALLURGY TESTING / RECOVERY METHODS 365 TECHNICAL REPORT SUMMARY EWOYAA LITHIUM PROJECT Page 8 of 368 24.0 REFERENCES 366 24.1 GEOLOGY 366 24.2 MINING AND GEOTECHNICAL 366 24.3 METALLURGICAL TESTWORK 366 24.4 INFRASTRUCTURE 366 24.5 ENVIRONMENTAL, SOCIAL AND PERMITTING 367 25.0 RELIANCE ON INFORMATION PROVIDED BY THE REGISTRANT 368 LIST OF TABLES TABLE 1-1 EWOYAA LITHIUM PROJECT FS KEY METRICS (100% PROJECT BASIS) 16 TABLE 1-2 SUBSIDIARY COMPANIES PROPERTY RIGHTS 20 TABLE 1-3 EWOYAA LITHIUM PROJECT MINERAL RIGHTS 21 TABLE 1-4 SUMMARY OF DRILLING USED FOR THE EWOYAA RESOURCE ESTIMATE 23 TABLE 1-5 ORE PHYSICAL PARAMETERS SUMMARY 25 TABLE 1-6 FINAL DMS RECOVERIES BY SC GRADE AND % OF ORE TYPE 26 TABLE 1-7 EWOYAA MRE BY DEPOSIT AND JORC CLASSIFICATION (0.5% LI2O CUT-OFF, ABOVE 190 M RL) 26 TABLE 1-8 SOURCE MODIFYING FACTORS USED FOR ORE RESERVE DETERMINATION 27 TABLE 1-9 SUMMARY OF MODIFYING FACTORS FOR ORE RESERVE DETERMINATION 28 TABLE 1-10 ORE RESERVES AS AT 16 JUNE 2023 29 TABLE 1-11 SUMMARY OF KEY PIT OPTIMISATION INPUT PARAMETERS 30 TABLE 1-12 SUMMARY OF PIT DESIGN PARAMETERS 32 TABLE 1-13 COMPARISON PIT DESIGN VERSUS PIT OPTIMISATION SHELL 33 TABLE 1-14 MINE PRODUCTION SCHEDULE SUMMARY 34 TABLE 1-15 PROJECT PRODUCT PRICING FORECAST, USD, FOB GHANA 42 TABLE 1-16 CAPITAL ESTIMATE SUMMARY (USD, Q2 2023, -15% + 15%) 45 TABLE 1-17 SOURCE OF CAPITAL COST PRICING 46 TABLE 1-18 SUSTAINING AND CLOSURE CAPITAL COSTS, LOM 46 TABLE 1-19 LOM OPERATING COSTS 47 TABLE 1-20 SUMMARY OF DMS OPERATING COST (USD, Q2 2023, -15% + 15%) 48 TABLE 1-21 PRE-PRODUCTION OPEX SUMMARY 48 TABLE 1-22 KEY FINANCIAL MODEL INPUTS 49 TABLE 1-23 PROJECT PRODUCT PRICING FORECAST, USD, FOB GHANA 50 TABLE 1-24 CASH FLOW MODEL KEY RESULTS 51 TABLE 1-25 PROJECT SCHEDULE MILESTONES 54 TABLE 1-26 FELDSPAR ESTIMATES 57 TABLE 1-27 POTENTIAL FLOTATION PLANT FEEDSTOCK PER ANNUM 58

TECHNICAL REPORT SUMMARY EWOYAA LITHIUM PROJECT Page 9 of 368 TABLE 2-1 QUALIFIED PERSONS AND RESPONSIBILITIES 60 TABLE 2-2 REPORT CONTRIBUTORS 63 TABLE 2-3 ABBREVIATIONS, ACRONYMS AND UNITS OF MEASURE 63 TABLE 3-1 CORPORATE STRUCTURE AND IDENTIFIERS 79 TABLE 3-2 ELP MINERAL RIGHTS 79 TABLE 3-3 SUBSIDIARY COMPANIES PROPERTY RIGHTS 79 TABLE 3-4 ANNUAL MINERAL RIGHTS FEES 82 TABLE 3-5 GHANIAN DOUBLE TAXATION AGREEMENTS 83 TABLE 7-1 SCALE OF THE AWUAYA – OKWESIKROM PEGMATITES (EWOYAA AND ABONKO) 102 TABLE 7-2 GRADE OF THE AWUAYA – OKWESIKROM PEGMATITES (EWOYAA AND ABONKO) 102 TABLE 7-3 SUMMARY OF DRILLING AT THE ELP 107 TABLE 8-1 CERTIFIED STANDARD SUMMARY FOR LI (PPM) 110 TABLE 8-2 BULK DENSITY STATISTICS 112 TABLE 9-1 DRILL HOLE COLLAR VERIFICATION 113 TABLE 10-1 SUMMARY OF TEST WORK COMPOSITES 117 TABLE 10-2 MASTER COMPOSITE HEAD ASSAYS 119 TABLE 10-3 HEAD SAMPLE XRD RESULTS FOR THE T3141 COMPOSITE SAMPLES 121 TABLE 10-4 SUMMARY OF COMMINUTION DATA 121 TABLE 10-5 T3141 CRUSHING WORK AND ABRASIVE INDEX 122 TABLE 10-6 COMPARISON OF HLS PERFORMANCE FOR ALL DEPOSITS (-10+0.5MM) 124 TABLE 10-7 PROCESS SIZE FRACTIONS 127 TABLE 10-8 SCREENING RESULTS 129 TABLE 10-9 DMS-250 RESULTS BEFORE MIDDLINGS RE-CRUSH TO 6.3MM 131 TABLE 10-10 DMS-250 RESULTS AFTER MIDDLINGS RE-CRUSH TO 6.3MM 131 TABLE 10-11 FINAL DMS RECOVERIES BY SC GRADE AND % OF ORE TYPE 134 TABLE 10-12 ESTIMATE OF POTENTIAL ADDITIONAL PRODUCTS 134 TABLE 10-13 SUMMARY OF THE MAGNETIC SEPARATION TO REMOVE IRON 135 TABLE 10-14 FELDSPAR PRODUCTION USING ORE SORTER 136 TABLE 10-15 LOSS OF LITHIUM TO GRAVITY MIDDLINGS 136 TABLE 10-16 FLOTATION FEED PREP 137 TABLE 11-1 LI2O 1M COMPOSITE STATISTICS FOR MINERALISED LODES 144 TABLE 11-2 LI2O 1M COMPOSITE STATISTICS FOR MINERALISED LODES (CONT.) 145 TABLE 11-3 LI2O 1M COMPOSITE STATISTICS FOR MINERALISED LODES (CONT.) 146 TABLE 11-4 LI2O 1M COMPOSITE STATISTICS FOR MINERALISED LODES (CONT.) 147 TABLE 11-5 LI2O 1M COMPOSITE STATISTICS FOR MINERALISED LODES (CONT.) 147 TABLE 11-6 DOMAIN 1 CORRELATION MATRIX 148 TECHNICAL REPORT SUMMARY EWOYAA LITHIUM PROJECT Page 10 of 368 TABLE 11-7 KRIGING PARAMETERS – DOMAIN 1 152 TABLE 11-8 OK ESTIMATION PARAMETERS – MINERALISED DOMAINS (LI2O) 157 TABLE 11-9 BULK DENSITY STATISTICS (T/M3) 159 TABLE 11-10 AVERAGE COMPOSITE INPUT V BLOCK MODEL OUTPUT – SEPARATED BY WEATHERING (CONT.) 160 TABLE 11-11 EWOYAA LITHIUM PROJECT MARCH 2023 MINERAL RESOURCE ESTIMATE BY DEPOSIT (0.5% LI2O CUT-OFF, ABOVE -190MRL) 170 TABLE 11-12 MATERIAL TYPES, RECOVERIES AND CONCENTRATE GRADES (AT -10+0.5MM CRUSH AND LABORATORY SETTING) 172 TABLE 12-1 SUMMARY OF MODIFYING FACTORS FOR ORE RESERVE DETERMINATION 174 TABLE 12-2 EWOYAA LITHIUM PROJECT – ESTIMATE OF ORE RESERVES AS OF 16 JUNE 2023 175 TABLE 13-1 SUMMARY OF BOREHOLE INFORMATION 179 TABLE 13-2 PUMPING TEST RESULTS 181 TABLE 13-3 PIT SLOPE DESIGN PARAMETERS 186 TABLE 13-4 SUMMARY OF KEY PIT OPTIMISATION INPUT PARAMETERS 188 TABLE 13-5 PIT DESIGN PARAMETERS SUMMARY 189 TABLE 13-6 PIT DESIGN BREAKDOWN SUMMARY 190 TABLE 13-7 COMPARISON OF PIT DESIGN VS. PIT OPTIMISATION SHELL 191 TABLE 13-8 SUMMARY MINE PRODUCTION SCHEDULE 193 TABLE 13-9 LOM MINING OPERATING COSTS 195 TABLE 14-1 PLANT SCHEDULE - DESIGN CRITERIA 196 TABLE 14-2 KEY DESIGN CRITERIA 205 TABLE 14-3 PRE-PRODUCTION CRUSHING AND MODULAR DMS PLANT OVERVIEW 205 TABLE 15-1 WATER BALANCE ASSUMPTIONS AND VARIABLES 211 TABLE 15-2 SITE WATER DEMAND 212 TABLE 15-3 AVERAGE AND MAXIMUM RAINFALL DATA 215 TABLE 15-4 TAILINGS FEED CHARACTERISTICS TEST RESULTS 216 TABLE 15-5 TAILINGS SETTLEMENT PARAMETERS 216 TABLE 15-6 PRODUCT LOGISTICS COSTS 229 TABLE 16-1 PROJECT PRODUCT PRICING FORECAST, USD, FOB GHANA 233 TABLE 17-1 RELEVANT GHANAIAN LEGISLATION 236 TABLE 17-2 THE EQUATOR PRINCIPLES IV (2020) 242 TABLE 17-3 REQUIREMENTS OF IFC PS AND GUIDELINES 243 TABLE 17-4 MONTHLY RAINFALL (MM) 2010 TO 2018 251 TABLE 17-5 MONTHLY RECORDED WIND DIRECTION IN THE ELP AREA (2019-2023) 262 TABLE 17-6 CONCENTRATION LEVELS OF WATER SAMPLES FROM SURFACE WATER SOURCES 266 TABLE 17-7 CONCENTRATION LEVELS IN WATER SAMPLED FROM BOREHOLE SOURCES 269 TABLE 17-8 CONCENTRATION LEVELS IN WATER SAMPLED FROM DUGOUT SOURCES 270 TECHNICAL REPORT SUMMARY EWOYAA LITHIUM PROJECT Page 11 of 368 TABLE 17-9 MEAN AIR QUALITY BASELINE RESULTS OF THE ELP AREA (JUNE 2021 – MARCH 2022) 272 TABLE 17-10 MEAN NOISE LEVEL BASELINE RESULTS OF THE ELP AREA (JUNE 2021 – MARCH 2022) 273 TABLE 17-11 ESTIMATED 2020 POPULATION OF ELP COMMUNITIES 274 TABLE 17-12 SUMMARY OF POTENTIAL IMPACTS PRELIMINARILY IDENTIFIED 276 TABLE 17-13 PROJECT ENVIRONMENTAL, SOCIAL, HEALTH AND SAFETY MANAGEMENT SYSTEM DOCUMENTS 278 TABLE 17-14 LIST OF ENVIRONMENTAL MONITORING PARAMETERS FOR EMP 281 TABLE 18-1 CAPITAL COST ESTIMATE SUMMARY (US$, Q2 2023, -15% + 15%) 285 TABLE 18-2 SOURCE OF CAPITAL COST PRICING 286 TABLE 18-3 PROCESS PLANT CAPITAL COST SUMMARY (US$ M) 287 TABLE 18-4 EQUIPMENT AND BULK MATERIALS 287 TABLE 18-5 ESTIMATE GROWTH FACTORS 289 TABLE 18-6 SITE GENERAL AND INFRASTRUCTURE COSTS 289 TABLE 18-7 PROJECT INDIRECT COST SUMMARY 291 TABLE 18-8 CONTRACTOR PRELIMINARY & GENERAL COSTS 292 TABLE 18-9 OWNER’S COSTS SUMMARY 292 TABLE 18-10 OWNER’S TEAM COSTS 293 TABLE 18-11 SUSTAINING CAPITAL ESTIMATE SUMMARY (Q2 2023, -15% + 15%) 295 TABLE 18-12 LOM C1 OPERATING COSTS 296 TABLE 18-13 EXCHANGE RATE SUMMARY 296 TABLE 18-14 OVERALL OPEX SUMMARY (USD, 2Q23, -15% + 15%) 298 TABLE 18-15 LABOUR HEADCOUNT AND ANNUAL COSTS (EXCL. MINING CONTRACTOR) 299 TABLE 18-16 COST SUMMARY FOR REAGENTS 299 TABLE 18-17 ANNUAL POWER COSTS 299 TABLE 18-18 ANNUAL MAINTENANCE MATERIALS COSTS 300 TABLE 18-19 SUMMARY OF CONCENTRATE TRANSPORT COSTS 300 TABLE 18-20 GENERAL & ADMINISTRATION COSTS 301 TABLE 18-21 OVERALL PRE-PRODUCTION MODULAR PLANT OPEX SUMMARY 302 TABLE 19-1 KEY FINANCIAL MODEL PHYSICALS AND INPUTS 304 TABLE 19-2 PROJECT PRODUCT PRICING FORECAST, USD, FOB GHANA 306 TABLE 19-3 PROJECT CASH FLOW MODEL RESULTS 306 TABLE 19-4 PROJECT CASH FLOW MODEL RESULTS 308 TABLE 21-1 PROJECT MILESTONES 312 TABLE 21-2 PROJECT DEVELOPMENT RESPONSIBILITIES 314 TABLE 21-3 PROJECT BATTERY LIMITS 321 TABLE 21-4 WORK BREAKDOWN STRUCTURE 321 TABLE 21-5 ATLANTIC LITHIUM OPERATIONS LABOUR LIST 331 TECHNICAL REPORT SUMMARY EWOYAA LITHIUM PROJECT Page 12 of 368 TABLE 21-6 SUMMARY OF ROSTERS 336 TABLE 22-1 FINAL DMS RECOVERIES BY SC GRADE AND % OF ORE TYPE 350 TABLE 22-2 RISK LIKELIHOOD OF OCCURRENCE 351 TABLE 22-3 RISK CONSEQUENCE RATING 352 TABLE 22-4 RISK RANKING MATRIX 353 TABLE 22-5 PROJECT RISK REGISTER 354 TABLE 22-6 FELDSPAR ESTIMATES 364 TABLE 22-7 POTENTIAL FLOTATION PLANT FEEDSTOCK PER ANNUM 364 LIST OF FIGURES FIGURE 1-1 SITE OVERVIEW LOOKING NORTHEAST, YEAR 1 OPERATION 16 FIGURE 1-2 PROJECT LOCATION AND EXPLORATION PERMITS 19 FIGURE 1-3 ALL CORPORATE STRUCTURE 20 FIGURE 1-4 EWOYAA LITHIUM PROJECT PIT LAYOUT 30 FIGURE 1-5 PIT OPTIMISATION RESULTS TOTAL RESOURCE 32 FIGURE 1-6 TOTAL MATERIAL MOVEMENT BY CUTBACK 35 FIGURE 1-7 PROCESSING PLANT AND INFRASTRUCTURE VIEWED FROM THE WEST 35 FIGURE 1-8 OVERALL SIMPLIFIED PROCESS FLOWSHEET 37 FIGURE 1-9 MINING SERVICES, ADMIN, SERVICES, WORKSHOP AND WAREHOUSE FACILITIES 41 FIGURE 1-10 LOM CONCENTRATE PRODUCTION 51 FIGURE 1-11 EWOYAA LITHIUM PROJECT MARGIN 52 FIGURE 1-12 CASH FLOW SENSITIVITIES GRAPH, NPV8 BASIS 53 FIGURE 1-13 ESTIMATED EMPLOYMENT FOR LOM 56 FIGURE 3-1 EWOYAA LITHIUM PROJECT LOCATION 75 FIGURE 3-2 ALL CORPORATE STRUCTURE 78 FIGURE 6-1 REGIONAL GEOLOGY MAP SHOWING THE POSITION OF THE MANKESSIM LICENCE AREA EDGED IN RED 89 FIGURE 6-2 INTERPRETED GEOLOGY OF THE MANKESSIM & MANKESSIM SOUTH PL AREAS 90 FIGURE 6-3 EXTRACT OF REGIONAL STRUCTURAL INTERPRETATION BY GHANA GEOLOGICAL SURVEY (HUGHES & FARRANT, 1963) SUPERIMPOSED OVER CURRENTLY KNOWN PEGMATITES IN THE IMMEDIATE ELP AREA 91 FIGURE 6-4 DEPOSIT AND PROSPECT NAMES AT THE EWOYAA LITHIUM PROJECT 92 FIGURE 6-5 ABONKO TREND 93 FIGURE 6-6 EWOYAA TREND 94 FIGURE 6-7 TYPICAL P1 COARSE GRAINED SPODUMENE (>20MM ACROSS) IN PEGMATITE IN WHOLE AND CUT CORE 95 FIGURE 6-8 TYPICAL P2 FINER GRAINED SPODUMENE (<20MM ACROSS) IN PEGMATITE CORE 96 FIGURE 6-9 K-FELDSPAR AND SECONDARY MUSCOVITE ALTERATION OF P1 SPODUMENE PEGMATITE FROM EWOYAA MAIN. INTENSE CHLORITE ALTERATION PROXIMAL TO SOME FRACTURES 98

TECHNICAL REPORT SUMMARY EWOYAA LITHIUM PROJECT Page 13 of 368 FIGURE 6-10 SPODUMENE CRYSTAL EXHIBITING CHLORITE ALTERATION ALONG ITS PERIMETER AND ALONG CLEAVAGE AND FRACTURE PLANES 99 FIGURE 7-1 LEFT: IDEALISED ZONED PEGMATITE FIELD AROUND A SOURCE GRANITE. 104 FIGURE 7-2 CAPE COAST BATHOLITH MARGIN AND PROSPECTIVE TARGETS DEFINED FROM GEOLOGICAL SETTING AND GOOGLE EARTH GROUND FEATURES (AREA 1 BEING THE EWOYAA DISCOVERY LOCATION). 104 FIGURE 7-3 EARLY DUE-DILIGENCE ROCK-CHIP AND TRENCH SAMPLING RESULTS 105 FIGURE 8-1 QA/QC PERFORMANCE OF BLANK MATERIAL IN LI ASSAY 109 FIGURE 8-2 QA/QC PERFORMANCE OF FIELD DUPLICATE SAMPLES IN LI ASSAY 109 FIGURE 8-3 UMPIRE CHECK ANALYSIS LI 111 FIGURE 10-1 EWOYAA METALLURGICAL SAMPLE LOCATIONS AND COMPOSITES 120 FIGURE 10-2 PARTICLE SIZE DISTRIBUTIONS FOR CRUSHED COMPOSITES 123 FIGURE 10-3 MASS AND LITHIUM DEPORTMENT AT DIFFERENT BOTTOM SIZES FOR DMS FEED 124 FIGURE 10-4 GRADE RECOVERY CURVES FOR ALL HLS TESTS 126 FIGURE 10-5 GRADE RECOVERY CURVES, ISOLATED TO P1 AND P2. P1 (GREY), P2 (TURQOISE) 127 FIGURE 10-6 HLS RECOVERY VARIABILITY OF SAMPLES WITH RESPECT TO P1, P2 AND BLENDS 128 FIGURE 10-7 GRADE VS RECOVERY CURVE FOR FRACTIONAL HLS RESULTS 130 FIGURE 11-1 LOG HISTOGRAM AND LOG PROBABILITY PLOTS OF THE RAW ASSAYS AT ELP 138 FIGURE 11-2 PLAN VIEW OF EWOYAA WIREFRAMES AND DRILLING 140 FIGURE 11-3 LONG SECTION Z-Z’ OF EWOYAA MAIN WIREFRAMES AND DRILLING 141 FIGURE 11-4 CROSS-SECTION A-A’ OF EWOYAA WIREFRAMES AND DRILLING 142 FIGURE 11-5 SAMPLE LENGTHS INSIDE WIREFRAMES 143 FIGURE 11-6 LI2O STATISTICAL PLOTS FOR DOMAIN 1 144 FIGURE 11-7 SCATTER PLOTS FOR DOMAIN 1 149 FIGURE 11-8 LI2O VARIOGRAMS FOR DOMAIN 1 150 FIGURE 11-9 BLOCK SIZE ANALYSIS CHART – DOMAIN 1 153 FIGURE 11-10 NUMBER OF SAMPLES ANALYSIS CHART – DOMAIN 1 154 FIGURE 11-11 SEARCH DISTANCE ANALYSIS CHART – DOMAIN 1 155 FIGURE 11-12 BLOCK DISCRETISATION ANALYSIS CHART – DOMAIN 1 156 FIGURE 11-13 CROSS-SECTION OF BLOCK MODEL LI2O GRADES ON SECTION A-A 158 FIGURE 11-14 VALIDATION BY 20M NORTHING AND 10M EASTING AND 10M ELEVATION – DOMAIN 1 BELOW TOFR; LI2O (BLUE=DECLUSTERED MEAN, BLACK=OK) 164 FIGURE 11-15 MINERAL RESOURCE CLASSIFICATION OBLIQUE VIEW – EWOYAA MAIN (FACING NE) 166 FIGURE 11-16 MINERAL RESOURCE CLASSIFICATION PLAN VIEW 167 FIGURE 11-17 ELP TONNAGE AND GRADE 10M BENCH LEVEL 172 FIGURE 11-18 ELP GRADE – TONNAGE CURVE 173 FIGURE 13-1 EWOYAA LITHIUM PROJECT PIT LAYOUT 177 FIGURE 13-2 LOCATION OF COMMUNITY BOREHOLES (SOURCE: ESS, 2021) 179 TECHNICAL REPORT SUMMARY EWOYAA LITHIUM PROJECT Page 14 of 368 FIGURE 13-3 MONITORING BOREHOLES LOCATED WITHIN THE EWOYAA PROJECT 180 FIGURE 13-4 PASSIVE INFLOWS TO PITS (LIFE OF MINE) 182 FIGURE 13-5 TOTAL PASSIVE INFLOW VS. TOTAL RESIDUAL INFLOW 184 FIGURE 13-6 POTENTIAL DEWATERING WELLS 185 FIGURE 13-7 DRAWDOWN 186 FIGURE 13-8 TOTAL RESOURCE PIT OPTIMISATION RESULTS 189 FIGURE 13-9 TOTAL MATERIAL MOVEMENT BY PIT 194 FIGURE 14-1 BLOCKFLOW DIAGRAM - CRUSHING CIRCUIT 197 FIGURE 14-2 BLOCKFLOW DIAGRAM - DMS PLANT 198 FIGURE 14-3 PROCESS PLANT AND INFRASTRUCTURE VIEWED FROM THE WEST 204 FIGURE 15-1 UPSTREAM CATCHMENT VOLUMES 209 FIGURE 15-2 SITE AVERAGE WATER BALANCE WITH FISSURE PIT INFLOWS 213 FIGURE 15-3 WSD LOCATION 214 FIGURE 15-4 WSD EMBANKMENT TYPICAL CROSS-SECTION 214 FIGURE 15-5 IWLTSF GENERAL ARRANGEMENT (PLAN) 218 FIGURE 15-6 IPTSF GENERAL ARRANGEMENT (PLAN) 218 FIGURE 15-7 IWLTSF DEVELOPMENT PROFILE 219 FIGURE 15-8 IPTSF DEVELOPMENT PROFILE 220 FIGURE 15-9 POWERLINE RELOCATION ROUTE 223 FIGURE 15-10 MINING SERVICES, ADMINISTRATION, WORKSHOP AND WAREHOUSE FACILITIES 225 FIGURE 15-11 TAKORADI PORT CONFIGURATION AND INDICATIVE STOCKPILING OPTIONS 230 FIGURE 15-12 INDICATIVE INLAND PORT LOCATION AND PORT ACCESS ROUTE 231 FIGURE 16-1 PEV SALES FORECASTS (S&P, JUNE 2023) 232 FIGURE 17-1 MINING LEASE PROCESS (SOURCE: MINERALS COMMISSON) 246 FIGURE 17-2 ENVIRONMENTAL PERMIT ACQUISITION PROCESS FLOW CHART (SOURCE: GHANA EPA) 247 FIGURE 17-3 SALTPOND MONTHLY RAINFALL, MM 252 FIGURE 17-4 AVERAGE MONTHLY TEMPERATURE AND RAINFALL FOR SALTPOND, WATERSHED 462 GHANA (1991-2016) 252 FIGURE 17-5 SPATIAL DISTRIBUTION OF THE ELP SITE VULNERABILITY 253 FIGURE 17-6 REGIONAL HYDROGEOLOGICAL MAP 255 FIGURE 17-7 EXPLORATION AREA SHOWING POTENTIAL AND ACTUAL NATURAL SURFACE DRAINAGE 256 FIGURE 17-8 GEOLOGY OF THE MFANTSEMAN MUNICIPALITY AND ITS ADJOINING MUNICIPALITIES 257 FIGURE 17-9 MONTHLY AVERAGE RAINFALL AND HUMIDITY OF THE ELP AREA (2019-2023) 261 FIGURE 17-10 MONTHLY TEMPERATURE, DEW POINT AND PAR OF THE ELP AREA (2019-2023) 261 FIGURE 17-11 AVERAGE MONTHLY WIND SPEED OF ELP AREA (2019-2023) 262 FIGURE 17-12 PROJECT AREA HYDROLOGY AND WATER MONITORING LOCATIONS 265 TECHNICAL REPORT SUMMARY EWOYAA LITHIUM PROJECT Page 15 of 368 FIGURE 17-13 DUGOUT AT MPESIADUADZE (RHS) AND DOMESTIC BOREHOLE WITH SANITARY CONCRETE SEAL AT EWOYAA (LHS) 268 FIGURE 17-14 AIR QUALITY AND NOISE BASELINE DATA LOCATIONS FOR ELP 272 FIGURE 17-15 VISUAL REPRESENTATION OF ESHS MANAGEMENT SYSTEM 280 FIGURE 17-16 PROJECT ORGANISATIONAL STRUCTURE FOR ESHS GOVERNANCE AND MANAGEMENT 281 FIGURE 17-17 ALL GRIEVANCE MECHANISM FLOWCHART 283 FIGURE 19-1 UNDISCOUNTED (FREE CASH) POST-TAX PROJECT CASHFLOWS - – YEARLY 307 FIGURE 19-2 CASHFLOW SENSITIVITIES, NPV8 BASIS 309 FIGURE 21-1 PROJECT ORGANISATIONAL STRUCTURE – ENGINEERING AND PROCUREMENT 327 FIGURE 21-2 PROJECT ORGANISATIONAL STRUCTURE –CONSTRUCTION 328 FIGURE 21-3 PROJECT ORGANISATIONAL STRUCTURE –COMMISSIONING 328 FIGURE 21-4 OVERALL ATLANTIC ORGANISATIONAL STRUCTURE 343 FIGURE 21-5 MANAGEMENT STRUCTURE 344 FIGURE 21-6 MINING AND TECHNICAL SERVICES DEPARTMENTS 344 FIGURE 21-7 PROCESSING DEPARTMENT 345 FIGURE 21-8 ADMINISTRATION DEPARTMENT 346 FIGURE 21-9 HEALTH SAFETY & SECURITY DEPARTMENT 347 FIGURE 21-10 ENVIRONMENT AND SOCIAL DEPARTMENT 347 FIGURE 21-11 CONTRACTOR ORGANISATIONAL CHART 348 TECHNICAL REPORT SUMMARY EWOYAA LITHIUM PROJECT Page 16 of 368 1.0 EXECUTIVE SUMMARY 1.1 INTRODUCTION Atlantic Lithium has undertaken a Feasibility Study (“FS”) for the development of the Ewoyaa Lithium Project (“Ewoyaa” or the “Project”) in Ghana, West Africa. The FS builds upon previous studies completed in 2021 and 2022. The Project development involves open cut mining of several lithium-bearing pegmatite deposits, conventional Dense Media Separation (“DMS”) processing and supporting infrastructure to target the production of spodumene concentrate and secondary product by Q2 2025 (Figure 1-1). The development timeline is contingent on the permitting schedule as outlined in Section 1.19.1. FIGURE 1-1 SITE OVERVIEW LOOKING NORTHEAST, YEAR 1 OPERATION Initial processing of approximately 450,000 t of ore will be carried out over the first nine months, starting Q2 2025, in an early production processing plant fed from Ewoyaa South 2 and Ewoyaa Main starter pits, prior to processing through the main 2.7 Mtpa processing facility from Q1 2026 for 11 years. Over the life of mine (“LOM”), the Project is estimated to produce 3.37 Mt of 6% (SC6) and 5.5% (SC5.5) grade spodumene concentrates, as well as 4.45 Mt of secondary product, which have been identified to be saleable given current and forecast lithium demand projections. Key Project metrics from the FS are listed in, demonstrating robust Project financial outcomes and metrics. TABLE 1-1 EWOYAA LITHIUM PROJECT FS KEY METRICS (100% PROJECT BASIS) Item Units FS Result Mine Life Years 12 Ore Reserves (Probable) Mt @ % 25.6 Mt @ 1.22% Li2O Total Material Movement LOM Mt 401

TECHNICAL REPORT SUMMARY EWOYAA LITHIUM PROJECT Page 17 of 368 Item Units FS Result Mined Waste Mt 375.3 Mined Crusher Feed Material Mt 25.6 Strip Ratio W:O 14.8 Processed Crusher Feed Material, LOM Mt 25.6 DMS Plant Feed Rate Mtpa 2.7 Li2O Head Grade (average) % 1.22 Average Whole of Ore Recovery SC6 % 62.1 Average Whole of Ore Recovery SC5.5 % 67.2 Secondary Product Mass Yield (% of ROM Feed) % 17.0 SC6 Produced LOM, t 1,682,792 SC5.5 Produced LOM, t 1,678,396 Secondary Product Produced LOM, t 4,448,661 Project Total Upfront Capital Cost US$M 185 SC6 Sell Price, LOM Average, FOB Ghana US$/t 1,709 SC5.5 Sell Price, LOM Average, FOB Ghana US$/t 1,490 Secondary Product Sell Price, LOM Average, FOB Ghana US$/t 187 Revenue (all products) US$M 6,212 Post-tax IRR % 94.5 C1 Cash Cost, after secondary product credits US$/t 402 All In Sustaining Cost (AISC) US$/t 708 Surplus Cashflow, Post Tax US$M 1,921 NPV8 Post Tax US$M 1,219 Payback Months 13.8 NPAT, LOM US$M 1,819 1 Whilst the asset is currently wholly owned by Atlantic Lithium Ltd, Piedmont Lithium Inc. can earn up to half of the Company’s ownership in the Project through its funding agreement where Piedmont will sole fund the first US$70M, and 50% of additional costs thereafter, of the total US$185M development expenditure indicated in the DFS for the Project. The Government of Ghana has the right to a 13% free carry once in production and the Minerals Income Investment Fund has agreed Heads of Terms with the Company, which will see it earn a 6% contributing interest in the Project. 2 Mr S. Searle of Ashmore Advisory Pty Ltd for Mineral Resources and Mr H. Warries of Mining Focus Consultants Pty Ltd for Ore Reserves. For full Competent Persons statements, refer to Table 1-7 and TECHNICAL REPORT SUMMARY EWOYAA LITHIUM PROJECT Page 18 of 368 Table 11-11. TECHNICAL REPORT SUMMARY EWOYAA LITHIUM PROJECT Page 19 of 368 1.2 PROPERTY DESCRIPTION 1.2.1 Location The Project area is immediately north of Saltpond in the Central Region of Ghana and falls within the Mfantseman Municipality where Saltpond is the district capital (Figure 1-2). The site is approximately 100 km southwest of the capital city of Accra. FIGURE 1-2 PROJECT LOCATION AND EXPLORATION PERMITS 1.2.2 Titles, Claims or Leases ALL does not currently own or hold any titles or claims over the area in which mineral rights are currently granted. Section 3.3 outlines key legislative details and the ALL-company structures pertaining to the mineral rights held. At the time of writing, the Company has been awarded a Mining lease to exploit the minerals in the licence area and are awaiting parliamentary ratification of this grant. For the properties hosting the MRE in this report, ALL or its subsidiaries will control 100% of the surface and mineral rights. The Competent/Qualified Persons have not carried out a separate title verification for the property and neither company has verified leases, deeds, surveys, or other property control instruments pertinent to the subject resources. TECHNICAL REPORT SUMMARY EWOYAA LITHIUM PROJECT Page 20 of 368 ALL has represented to its Competent/Qualified Persons that it controls the mining rights to the resources as shown on its property maps, and both Ashmore and MFC have accepted these as being a true and accurate depiction of the mineral rights controlled by ALL. The TRS assumes the Property is developed under responsible and experienced management. The project central point is: 579,550 N 716,035 E located within the Ewoyaa NE Deposit. 1.2.3 Mineral Rights Atlantic Lithium holds 100% ownership over IronRidge Resources Singapore Pte Ltd, and IronRidge Resources Singapore Pte Ltd holds both 100% ownership of Green Metals Resources Ltd (“GMR”) and 81% ownership in Barari Development Ghana Ltd (“BDV”) once the Project is in production. The inter-corporate relationship is depicted in Figure 1-3. FIGURE 1-3 ALL CORPORATE STRUCTURE The subsidiary companies and related tenement/mineral right to which this FS relates is summarised in Table 1-2. TABLE 1-2 SUBSIDIARY COMPANIES PROPERTY RIGHTS Subsidiary Identifying Number Incorporated Location and Date Percentage Holding Activity IronRidge Resources Singapore Pte Ltd UEN 201829622K Incorporated in Singapore on 29 August 2018 Atlantic Lithium Limited owns 100% Holder of shares in Barari DV Ghana Ltd & Green Metals Resources Ltd Green Metals Resources Limited CS080712016 Incorporated in Ghana on 10 May 2016 IronRidge Resources Singapore Pte Ltd owns 100% Owns assets being the tenements / mineral rights #PL3/109 Barari DV Ghana Ltd CS134902018 Incorporated in Ghana on 27 April 2011 IronRidge Resources Singapore Pte Ltd owns 90% Owns assets being the tenements / mineral rights #ML3/239

TECHNICAL REPORT SUMMARY EWOYAA LITHIUM PROJECT Page 21 of 368 Atlantic Lithium holds rights to a mining lease described in the following table, which is host to the current Project site. TABLE 1-3 EWOYAA LITHIUM PROJECT MINERAL RIGHTS Number Tenement name Size (km2) Minerals Holder Date of grant Renewal date Expiry date Term ML3/239 Barari ML 42.63 Lithium, Feldspar, other minerals Barari DV Ghana Ltd 20 Oct 2023 N/A 19 Oct 2038 15 yrs Key legislation relevant to the Project is the Minerals and Mining Act, 2006, (Act 703) as amended and the Minerals and Mining Regulations passed under the Act. Together, these instruments regulate mine development and operation in Ghana. The Ministry of Lands and Natural Resources, and the Minerals Commission, are primarily responsible for the administration of mining activity in Ghana. Operating Companies are required to obtain a Mining Lease to exploit minerals in the licence area. Mining companies are also required under the Environmental Protection Agency Act, 1994 (Act 490) to obtain an environmental permit from the EPA before commencing exploration and mining operations. All taxes, royalties, fees, charges, and costs applicable to the Project in accordance with Ghanaian legislation have been identified. These elements are implemented in the financial model for assessment of post-tax financial performance. 1.3 ACCESSIBILITY, CLIMATE, LOCAL RESOURCES, INFRASTRUCTURE AND PHYSIOGRAPHY 1.3.1 Site Access Site access is from the sealed N1 Accra-Cape Coast-Takoradi highway, which runs along the southern coastal boundary of the Project and links Accra and the deep-sea port of Takoradi approximately 110 km west of the site. Several unsealed roads extend northwards from the highway and link communities within the Project area. A new site access road will be developed to join to existing roads and to the highway. 1.3.2 Climate The climate around Cape Coast is typical of the dry equatorial region of Ghana, characterised by an average temperature of 24°C and relative humidity of 70%. There are double rainfall peaks with a pronounced rainfall increase during May-June and a lesser rainfall peak sometimes occurring around September-October. Mean annual rainfall ranges from 730 mm to 1,230 mm along the coast and up to 1,600 mm inland, and dry seasons extend from December to February and from July to September. 1.3.3 Topography, Elevation, and Vegetation The topography of the Project area varies with steep hills surrounding low-lying valleys throughout the proposed mining area. The terrain of the Project area rises sharply from a narrow coastal plane to an undulating peneplane where elevation ranges from 20 m to 120 m above mean sea level. 1.3.4 Population and Economy The project area is in Mfantseman Municipality, which falls under the local governance of the Mfantseman Municipal Assembly which also falls under the Central Regional Coordinating Council. TECHNICAL REPORT SUMMARY EWOYAA LITHIUM PROJECT Page 22 of 368 The Municipality has a projected population of 176,288 representing 6.6% of the Central Region. Mfantseman is largely an agrarian economy with 27% of the economically active population employed in mainstream agriculture. Industrial activity occurs in the various market centres at Anomabo, Biriwa, and Yamoransa, with Mankessim as the commercial hub. The three major industries of employment in the municipality include agriculture/forestry/fishing (37%), wholesale/retail trade/auto repairs (23.7%) and manufacturing (8.4%). 1.3.5 Infrastructure The existing, sealed N1 Accra-Cape Coast-Takoradi highway provides access to Accra and the Takoradi port. Several HV powerlines traverse or run nearby to the project site, facilitating connection to the existing power grid and access to existing power supply. Relocation of some HV powerlines within planned mining areas will be required and forms part of the project scope. No water supply for the operation currently exists but will be sourced from a combination of pit dewatering, site water capture and pumped supply from a nearby reservoir for makeup water. Connection to existing communications infrastructure for internet and telephony will also be possible. Existing port facilities are available at Takoradi approximately 110 km west of the site and at Tema, 25 km east of Accra for project construction and operations logistics requirements. The nearest international airports are the Kotoka International Airport in Accra and Sekondi-Takoradi Airport Port in Takoradi; thus, no site airstrip will be required. 1.4 HISTORY Historical trenching and mapping were completed by the Ghana Geological survey during the 1960’s. But for some historical Geological Survey archive reports and referenced bulk sampling results from trenching, none of the surface plan data or precise locational data from this work was located. Many of the historical trenches were located, cleaned and re-logged. No historical drilling was completed at the Ewoyaa project. No previous mining of pegmatites is known in the areas of interest of the Company’s mineral right. 1.5 GEOLOGICAL SETTINGS, MINERALISATION AND DEPOSIT The regional geology of western Ghana is characterised by a thick sequence of steeply dipping metasediments, alternating with metavolcanic units of Proterozoic age. The sequences belong to the Birimian Supergroup and extend for approximately 200 km along strike in several parallel north-easterly trending volcano-plutonic belts and volcano- sedimentary basins, of which the Kibi-Winneba Belt and Cape Coast Basin extend through the region in the Company’s Mankessim licence area. The mineralised pegmatite intrusions generally occur as sub-vertical bodies with two dominant trends as briefly outlined earlier: either striking north-northeast (Ewoyaa Main) and dipping sub-vertically to moderately southeast to east-southeast, or striking west-northwest to east-west (Abonko, Kaampakrom, Anokyi, Okwesi, Grasscutter and Ewoyaa NE) dipping sub-vertically to moderately northeast or north. Pegmatite thickness varies across the Project, with thinner mineralised units intersected at Abonko and Kaampakrom between 4 m and 12 m; and thicker units intersected at Ewoyaa Main between 30 m and 60 m, and up to 100 m at surface. The mineralisation at Ewoyaa has been confirmed to be associated with spodumene-bearing pegmatite as the main lithium bearing mineral. No petalite or lepidolite have been observed in any of the resource RC and diamond core drill logging. The pegmatites are predominantly quartz-albite-muscovite +/- microcline and spodumene in composition with accessory blue-green apatite, and less common colourless to light blue beryl, barite and secondary Fe-Mn-Li bearing phosphates. TECHNICAL REPORT SUMMARY EWOYAA LITHIUM PROJECT Page 23 of 368 The Project has two clearly defined geometallurgical domains or material types of spodumene bearing lithium mineralisation. ALL has termed these material types as Pegmatite Type (“P1”) and Pegmatite Type (“P2”): • P1: Coarse grained spodumene material (>20 mm), the dominant spodumene-bearing pegmatite encountered to date, exhibiting very coarse to pegmatoidal, euhedral to subhedral spodumene crystals composing 20 to 40% of the rock and • P2: Medium to fine grained spodumene material (<20 mm), where abundant spodumene crystals of a medium crystal size dominates. The spodumene is euhedral to subhedral and can compose up to 50% of the rock. The spodumene can be bimodal with some larger phenocrysts entrained within the medium grained spodumene bearing matrix. There are indications of very minor occurrences of other lithium bearing phases present. The vast majority of the finer grained spodumene P2 ore is found within the Ewoyaa Main pegmatite bodies and preferentially occurring towards the footwall contact of the Ewoyaa Main pegmatites, but with some exceptions. Any finer grained spodumene P2 pegmatite material occurring in the Abonko trending pegmatite bodies are generally rare and of limited extent. 1.6 EXPLORATION Drilling programs undertaken at the Project site used reverse circulation (“RC”) drill rigs and a portion using diamond core (“DD”) drill rigs. Over several drilling phases to date a total of 137,153 m in 1,025 holes were drilled (Table 1-4). Drilling at the deposit extends to a maximum drill depth of 386 m. Earlier phase RC drilling was completed on a nominal 100 m by 50 m grid pattern, with subsequent phases of RC and DD reducing the wide spacing to 80 m by 40 m and down to 40 m by 40 m during infill drilling phases. TABLE 1-4 SUMMARY OF DRILLING USED FOR THE EWOYAA RESOURCE ESTIMATE Hole Type In Database In Mineral Resource Drill holes Drill holes Intersection Number Metres Number Metres Metres RCH 11 1,100 RC 878 119,745 616 88,967 16,959 RCD 35 4,998 32 4,568 733 DD 101 11,310 93 10,159 4,987 Total 1,025 137,153 741 103,694 22,679 1.7 SAMPLE PREPARATION, ANALYSIS AND SECURITY RC drill chips were collected, and riffle spilt (Phases 1 and 2) or cone spit on rig cyclone (Phases 3-6) at 1-metre intervals producing an assay sample of nominally between 4 kg and 5 kg. A retention sample is also produced by riffle split or cone split which are archived at Atlantic’s Mankessim facility. Diamond drill core recoveries are always determined at the rig site by ALL personnel. On each core run the drill core is removed from the core barrel into a v-rail and each core run was reassembled and measured with a tape measure, assessing recovery against core block depth measurements and recording any measured core loss for each core run. Drill core is carefully conveyed to the core facility where it is geologically logged, and the sampling procedures ensures that ½ and further ¼ core is cut where possible and that minimum and maximum sample lengths are 0.3 m and 1 m respectively but cut to geological boundaries. A ¼ core is dispatched to the assay laboratory. A minimum ¼ core sample is retained for reference at all times. TECHNICAL REPORT SUMMARY EWOYAA LITHIUM PROJECT Page 24 of 368 RC and DD sampling have quality control (“QC”) samples consisting of standards or certified reference materials (“CRM”), coarse blank and field duplicates were inserted nominally every 35th to 50th sample. Since December 2018, samples were sent to Intertek Laboratory in Tarkwa for sample prep and a representative pulp sample is sent to Intertek Laboratory in Perth for analysis (FP6/MS/OES). Analysis is conducted by Inductively Coupled Plasma Mass Spectrometry (“ICP-MS”). Prior to December 2018, Phase 1 samples were submitted to SGS Johannesburg and later SGS Vancouver for analysis (ICP90A). All phase 1 SGS pulps were subsequently sent to Intertek Laboratory Perth for re-analysis (FP6/MS/OES) and included in the resource estimate. The coarse blank material used is building aggregate sourced from a granitic quarry near Dominase (771400 E 606900 N UTM Z30 N) in the Gomoa East area, some 62 km to the east of the ELP area. Blank sample performance at the assay labs indicates good laboratory performance overall, with only rare assay spikes in the data from 1,174 blank samples inserted into the assay stream. Check sampling was performed to determine whether the sampling procedure was producing assay subsamples that were representative of the original sample. A total of 486 field duplicates were split using a riffle splitter and results indicate good repeatability of the original sample. ALL utilised a suite of lithium standards sourced from Geostats and AMIS, which assessed lithium assays. A total of 3,319 field standards were inserted in the ALL drilling. Monitoring of standards and field duplicates was undertaken by ALL geologists. There was a significant accuracy issue with the first batch of sample submissions for assaying completed at SGS Laboratory in Johannesburg and Vancouver. As a result, ALL changed laboratories to Intertek Laboratory in Perth as well as re-assaying the affected samples. Subsequent standards analysis demonstrates a marked improvement in the performance of standards. An umpire laboratory check assaying program was conducted by ALL whereby a total of 155 samples were analysed at ALS Laboratory in Perth and compared to the original assays that were analysed at Intertek Laboratory in Perth. The results indicate that there is very good repeatability between the two laboratories. Bulk density measurements were completed on selected intervals of diamond core drilled at the deposit. The measurements were conducted at ALL’s Mankessim core processing facility using the water immersion/Archimedes method on all materials. The weathered samples were coated in paraffin wax to account for porosity of the weathered samples. The average density for each weathering types and lithology was applied to the corresponding coded domains in the block model. A total of 13,901 measurements were conducted on the ELP mineralisation, with samples obtained from oxide, transitional and fresh material. 1.8 DATA VERIFICATION Ashmore Advisory Pty Ltd.’s QP Shaun Searle visited the site during February 2019 to review exploration sites, drill core and work practices. Visual validation of mineralisation against assay results was undertaken for several holes. All drill hole data was imported into Surpac software version 2019 and data validation then completed. Sufficient data have been obtained through various exploration and sampling programs to support the geological interpretations at the Property. The data are of sufficient quantity and reliability to reasonably support the lithium resource estimates in this TRS.

TECHNICAL REPORT SUMMARY EWOYAA LITHIUM PROJECT Page 25 of 368 1.9 METALLURGICAL TESTING AND MINERAL PROCESSING Testwork was conducted at the Nagrom Laboratories in Western Australia under the supervision of Trinol Pty Ltd and included specific gravity, uniaxial compressive strength (“UCS”), abrasion index (“Ai”), crushing work index (“CWi”), Bond ball plant work index (“BBWi”), size by analysis, crush size establishment, variability heavy liquid separation (“HLS”) testing, DMS-100 and DMS-250 pilot scale testing, and sighter flotation tests. 1.9.1 Metallurgical Testwork Over 30 diamond drill holes generating more than 375 pegmatite samples were used to develop a total of 69 composite pegmatite samples across the Ewoyaa and Abonko trends. Before core composites were crushed, key physical parameters were tested from five deposits as summarised in Table 1-5. The CWi and UCS values confirm the P1 ore is more crystalline and easier to crush than P2. TABLE 1-5 ORE PHYSICAL PARAMETERS SUMMARY Parameter Unit Deposit Ewoyaa Starter Ewoyaa Main Anokyi Comp ID Comp 17 Comp 5 Comp 10 Comp 16 Comp 31 Lithology P1 fresh P2 fresh P1 fresh P2 fresh P1 fresh BCWi kWh/t 10.9 11 7.8 10.5 8.4 UCS MPa 84 124 82 127 105 BBMWi kWh/t 21.39 18.06 20.19 19.72 21.43 The crushing facility has been designed with a target crushed product top-size of 10 mm, which, based on crushing simulation modelling conducted, should provide a particle size distribution P80 of approximately 7.0 mm. Sixty-nine composites were made up from 15 of the identified deposits at Ewoyaa. All the composites were crushed to 10 mm and screened at 0.5 mm for HLS comparisons in order to benchmark the deposits. The results demonstrate variable recovery response of 50% to 80% for gravity processing of P1 ores (with the exception of Ewoyaa South 1 and Ewoyaa NW Sill). P1 ore makes up over 80% of the MRE. A feature of the testwork has been the consistently good quality of lithium concentrates produced via DMS only testing. In the main, the results show the iron content of the concentrates, as expressed by % Fe2O3, as being consistently below 1% and total alkalis (Na2O + K2O) to be less than 3%. Coupled with the coarse size of the concentrates, these are desirable properties for off-takers. 1.9.2 Recovery The recoveries for P1 and P2 materials were based on HLS and DMS-250 test results and on calculation of assumed additional recovery from middlings. Laboratory tests were performed on -10 +0.5 mm material, the bottom size being finer than the proposed plant flowsheet bottom size of 0.85 mm. Recoveries for P1 material into primary concentrate at a 10 mm crush were 50-80% from the HLS test work with an average 68% recovery for weathered and 70% for the fresh. Ore recoveries for the DMS plant for both 5.5% and 6.0% spodumene and % of ore type are summarised in Table 1-6, include a factor for expected increased fines generated in full scale crushing, increases to the DMS bottom size (for both 1 mm and 0.85 mm), HLS to DMS effects, and the use split size fractions, as well as the minimum benefit from re- crushing. TECHNICAL REPORT SUMMARY EWOYAA LITHIUM PROJECT Page 26 of 368 TABLE 1-6 FINAL DMS RECOVERIES BY SC GRADE AND % OF ORE TYPE Concentrate Grade Ore Type HLS Recovery Plant Recovery Plant Recovery (% Li2O) (% Li2O) (% Li2O) (% Li2O) -10 +0.5 mm -10 +0.85 mm -10 +1.0 mm 5.50% >90% P1 74.4% 67.2% 64.9% >80% P2 25.0% 14.9% 12.6% 6.00% >90% P1 69.6% 62.1% 59.8% >80% P2 17.5% 7.0% 4.7% There is significant indicated recovery improvement for a bottom size of 0.85 mm compared to 1 mm and on the basis that the plant design can accommodate the finer bottom size, these numbers have been adopted for plant financial modelling and plant design. 1.10 MINERAL RESOURCES ESTIMATE An updated JORC (2012) compliant Mineral Resource Estimate (“MRE”) was prepared by Ashmore Advisory Pty Ltd using analytical data from a total of 741 drillholes totalling 103,694 m and ordinary kriging methods for resource estimation. The MRE is based on a 0.5% reporting cut-off grade (constrained to above -190 m RL), within a 0.4% Li2O wireframed pegmatite body. The MRE was classified as Measured, Indicated and Inferred Mineral Resource based on data quality, sample spacing, and lode continuity. The Measured Mineral Resource was confined to fresh rock within areas drilled at 20 m by 15 m along with robust continuity of geology and Li2O grade. The Indicated Mineral Resource was defined within areas of close spaced drilling of less than 40 m by 40 m, and where the continuity and predictability of the lode positions was good. In addition, Indicated Mineral Resource was classified in weathered rock overlying fresh Measured Mineral Resource. The Inferred Mineral Resource was assigned to transitional material, areas where drill hole spacing was greater than 40 m by 40 m, where small, isolated pods of mineralisation occur outside the main mineralised zones and to geologically complex zones. TABLE 1-7 EWOYAA MRE BY DEPOSIT AND JORC CLASSIFICATION (0.5% LI2O CUT-OFF, ABOVE 190 M RL) Cape Coast Lithium Project - By Deposit (Internal), 0.4% Wireframes (Exclusive of Reserves) January 2023 Mineral Resource Estimate (0.5% Li2O Cut-off) Classification Tonnage Li2O Cont. Lithium Oxide Mt % t Measured 0.0 - - Indicated 2.3 1.09 24,700 Total Measured and Indicated 2.3 1.09 24,700 Inferred 1.9 1.07 20,700 COMPETENT PERSONS NOTE: The Mineral Resource has been compiled under the supervision of Mr. Shaun Searle who is a director of Ashmore Advisory Pty Ltd and a Registered Member of the Australian Institute of Geoscientists. Mr. Searle has sufficient experience that is relevant to the style of mineralisation and type of deposit under consideration and to the activity that he has undertaken to qualify as a Competent Person as defined in the JORC Code. Mr Searle consents to the inclusion in the report of the matters based on his information in the form and context in which it appears. TECHNICAL REPORT SUMMARY EWOYAA LITHIUM PROJECT Page 27 of 368 All Mineral Resources figures reported in the table above represent estimates at January 2023. Mineral Resource estimates are not precise calculations, being dependent on the interpretation of limited information on the location, shape and continuity of the occurrence and on the available sampling results. The totals contained in the above table have been rounded to reflect the relative uncertainty of the estimate. Rounding may cause some computational discrepancies. Mineral Resources are reported in accordance with the Australasian Code for Reporting of Exploration Results, Mineral Resources and Ore Reserves (The Joint Ore Reserves Committee Code – JORC 2012 Edition). 1.11 ORE RESERVE ESTIMATES 1.11.1 Introduction This section describes the methodology used and the economic criteria applied to derive at the Ore Reserves as defined in the ‘Australasian Code for Reporting of Mineral Resources and Ore Reserves’ of December 2012 (“JORC Code”) as prepared by the Joint Ore Reserves Committee of the Australasian Institute of Mining and Metallurgy and S-K 1300. The Ore Reserves were determined as part of the mine planning work that MFC undertook for Atlantic Lithium as part of the Company’s Feasibility Study. Mining will be undertaken by conventional open pit methods of drill and blast, followed by load and haul. Processing incorporates well-tested technology and uses conventional dense media separation techniques to produce SC6.0 and SC5.5 concentrate products and a secondary product of fines material (-0.85 +0.053 mm). 1.11.2 Modifying Factors The term ‘Modifying Factors’ is defined to include mining, metallurgical, economic, marketing, legal, environmental, social and governmental considerations. The sources for the Modifying Factors are summarised in Table 1-8. TABLE 1-8 SOURCE MODIFYING FACTORS USED FOR ORE RESERVE DETERMINATION Item Source Commodity price Atlantic Lithium Royalty, insurance and marketing Atlantic Lithium Processing and administration cost Atlantic Lithium, Primero Ltd Mining costs RFQ submissions Other miscellaneous costs Atlantic Lithium Mine planning MFC Metallurgy and processing Primero Ltd, Trinol Pty Ltd, Nagrom Capital costs Atlantic Lithium, Primero Ltd General site infrastructure Atlantic Lithium, Primero Ltd Geotechnical investigation SRK Consulting Hydrogeology SRK Consulting South Africa & Ghana Tailings storage facility Geocrest & REC Mining dilution and recovery MFC Social and Environmental NEMAS Consult Limited and Environmental and Social Sustainability (ESS) Legal tenure Atlantic Lithium TECHNICAL REPORT SUMMARY EWOYAA LITHIUM PROJECT Page 28 of 368 Item Source Government Atlantic Lithium The Ore Reserves as determined for the Project were based on the Modifying Factors as summarised in Table 1-9. All currencies are denominated in United States of America dollars, unless specifically stated otherwise. TABLE 1-9 SUMMARY OF MODIFYING FACTORS FOR ORE RESERVE DETERMINATION Item Unit Value P1 Pegmatite P2 Pegmatite Plant throughput Mtpa 2.7 Spodumene price (SC6.0 and SC5.5 product) $/t 1,587 Concentrate grade - SC6.0 Product (50% of total production) - SC5.5 Product (50% of total production) % 6.0 5.5 Concentrate produced (SC5.5 + SC6) Mt 3.36 Secondary product price $/t 186 Secondary product recovery (of total crusher feed) % 17 Secondary product produced Mt 4.45 Royalty % 6.0 Processing recovery SC6.0 SC5.5 % 62.1 67.2 NA 14.9 Processing Cost $/t processed 7.77 General and Administration (Incl. Marketing and insurance) $/t processed 6.18 Lithium Concentrate Transport Costs SC6.0 and SC5.5 Secondary product $/t conc. 29.81 32.65 Average Mining Cost (Contract mining) $/t mined 3.82 Mining recovery % 95 Mining dilution % 5 Overall Pit Wall Slope Angle (inclusive of a ramp system) Degree Ranging from 30.0° (Oxide) to 50.4° (Fresh) Capital expenditure $M 185.2 Sustaining capital $M 112.2 Discount rate % 8 1.11.3 Ore Reserve Summary ALL developed a cash flow model based exclusively on Measured and Indicated Resources. This cash flow model indicated that the Project is financially robust when all Inferred Resources plant feed is treated as waste with the All- In-Sustaining Cost (AISC) margin greater than 50%. BASED ON THE DATA PROVIDED IN TABLE 1-9, ORE RESERVES WERE DECLARED FOR THE PROJECT.

TECHNICAL REPORT SUMMARY EWOYAA LITHIUM PROJECT Page 29 of 368 Table 1-10 provides a summary of the Ore Reserves as of 16 June 2023 that were determined for the Project. TABLE 1-10 ORE RESERVES AS AT 16 JUNE 2023 Classification Ore Reserve (0.5% Li2O Cut-off) Tonnes (Mt) Li2O Grade (%) Probable 25.6 1.22 COMPETENT PERSONS NOTE: All stated Ore Reserves are completely included within the quoted Mineral Resources and are quoted in dry tonnes. The reported Ore Reserves have been compiled by Mr Harry Warries. Mr Warries is a Fellow of the Australasian Institute of Mining and Metallurgy and an employee of Mining Focus Consultants Pty Ltd. He has sufficient experience, relevant to the style of mineralisation and type of deposit under consideration and to the activity he is undertaking, to qualify as a Competent Person as defined in the ‘Australasian Code for Reporting of Mineral Resources and Ore Reserves’ of December 2012 (“JORC Code”) as prepared by the Joint Ore Reserves Committee of the Australasian Institute of Mining and Metallurgy, the Australian Institute of Geoscientists and the Minerals Council of Australia. Mr Warries gives Atlantic Lithium Limited consent to use this reserve estimate in reports. 1.12 MINING 1.12.1 Overview and Mining Methods Mining Focus Consultants Pty Ltd were engaged to undertake a mining study for the FS. The scope of works included Pit Optimisations, Mine pit design and scheduling, Mining Cost development and preparation of an Ore Reserve statement. The Project comprises eight main deposits including Ewoyaa, Okwesi, Anokyi, Grasscutter, Abonko, Kaampakrom and Sill (Figure 1-4). Deposits are broadly 4 km apart, spread out over approximately 8 km2. Two waste dumps will be constructed west and northeast of Ewoyaa Main pit. Conventional open pit mining methods of drill and blast followed by load and haul will be employed at the Project. Drilling and blasting will be performed on benches between 5 m and 10 m high. Mining equipment will likely consist of 100 t to 200 t hydraulic excavators and 90 t to 150 t off-highway dump trucks, supported by standard open-cut drilling and auxiliary equipment. A contract mining model will be employed under the supervision of an Atlantic Lithium mining management team. Mining operations are scheduled to work 365 days a year, less unscheduled delays such as high rainfall events. The mine workforce will operate on a two shift, three panel roster, seven days a week, in two 12-hour working shifts. TECHNICAL REPORT SUMMARY EWOYAA LITHIUM PROJECT Page 30 of 368 FIGURE 1-4 EWOYAA LITHIUM PROJECT PIT LAYOUT 1.12.2 Pit Optimisation Mine pit optimisation works were undertaken based on the updated MRE (Section 11.7) and using WHITTLE™ Four-X optimisation software using the Lerchs-Grossmann algorithm. Optimisations were carried out on two scenarios: 1. The total MRE; and 2. The Measured and Indicated resource only. The supplied resource model was re-blocked from a sub-blocked model to a regular parent block size of 10 m E x 10 m N x 10 m RL, which is considered a reasonable selective mining unit for the size of mining equipment envisaged for the Project. The key economic input parameters used for the pit optimisation are shown in Table 1-11. TABLE 1-11 SUMMARY OF KEY PIT OPTIMISATION INPUT PARAMETERS Item Unit Value P1 Pegmatite P2 Pegmatite Plant throughput Mtpa 2.0 TECHNICAL REPORT SUMMARY EWOYAA LITHIUM PROJECT Page 31 of 368 Item Unit Value P1 Pegmatite P2 Pegmatite Spodumene price $/t 1,500 Concentrate grade % 6 Royalty % 6.2 Marketing and insurance (% of gross sales) % 1 Processing recovery Transition Fresh % % 68 70 35 35 Processing cost $/t processed 13.50 General and administration $/t processed 3.20 Land freight $/t conc. 25.00 Average mining cost (contract mining) $/t mined 3.61 Rehandle cost (P2 pegmatite only) $/t 0.54 Sustaining capital $/t processed 0.44 Closure cost $/t processed 0.64 Mining recovery % 95 Mining dilution % 5 Overall pit wall slope angle (inclusive of a ramp system) Degree Ranging from 30.0° (Oxide) to 50.4° (Fresh) Pit optimisation results for the Total Resource scenario are presented below (Figure 1-5). TECHNICAL REPORT SUMMARY EWOYAA LITHIUM PROJECT Page 32 of 368 FIGURE 1-5 PIT OPTIMISATION RESULTS TOTAL RESOURCE 1.12.3 Mine Design and Scheduling Pit shell 29, based on the total MRE pit optimisation was selected as the basis for the life of mine detailed pit design. Pit design parameters for the FS are based on established mining practices and parameters detailed in Table 1-12. TABLE 1-12 SUMMARY OF PIT DESIGN PARAMETERS Pit Design Parameter Pit Wall Parameters As per Section 13.4 Haul Road Design Width - Dual Lane - Single Lane 25 m 16 m Gradient 10% Working width Minimum pit base width (goodbye cut) 10 m Minimum cutback width 20 m Comparison of the LOM pit design to the Whittle optimised shell is provided in Table 1-13.

TECHNICAL REPORT SUMMARY EWOYAA LITHIUM PROJECT Page 33 of 368 TABLE 1-13 COMPARISON PIT DESIGN VERSUS PIT OPTIMISATION SHELL Item Total Material Waste* Strip Ratio Plant Feed Concentrate Sub-grade Material [Mt] [Mt] [w:o] Tonnes Li2O Grade [kt] Tonnes Li2O Grade [Mt] [%] [Mt] [%] Shell 29 370.7 339.9 11.0 30.8 1.21 4,146 5.9 0.27 LOM Pit 412.7 381.7 12.3 31.1 1.21 4,163 5.9 0.26 Variance [%] 11.3 11.7 11.3 0.8 -0.2 0.6 *Inclusive of sub-grade material (< 0.5% Li2O) that is shown as plant feed in the optimisation results. Variances between pit design and the Whittle shell are a function of applying ramp design parameters and detailed slope design parameters to the pit design, using actual batter and berm values compared to initial estimates of the overall slope angle (inclusive of a ramp system) used for the pit optimisation. Waste Dumps The mine generates 382 Mt of waste or about 195 Mm3 at a swell factor of 25%. Two waste dumps with a total capacity of about 190 Mm3 have been designed, with some waste to be backfilled into the southern end of the Ewoyaa Main pit. The Western waste dump reaches a maximum height of 70 m RL, covers about 34 Ha and has a capacity of approximately 6.5 Mm3. The North-eastern waste dump reaches a maximum height of 95 m RL, covers about 340 Ha and has a capacity of approximately 182.4 Mm3. Three to five years’ worth of tailings will be stored in an Integrated Waste Landform Tailings Storage Facility (IWLTSF) within the north-eastern waste dump. Stockpiling and ROM A stockpiling strategy has been adopted where P1 Pegmatite is being preferentially processed, with P2 Pegmatite limited to 10% of the ore blend where possible. A ROM area adjacent to the crushing plant will accommodate about 500 kt of stockpiling, with two additional stockpile areas identified some 600 m NE of the ROM pad. Haul Roads Mine Roads will be designed to allow all-weather trafficability. This will include regular spreading and compaction of suitable crushed rock road base material. A total of six major haul road segments that connect pits with the ROM/crusher and waste dumps. Most roads traverse over moderately sloping terrain and do not require any major cut and fill, other than the main road connecting the pits with the ROM/crusher will traverse through some steeper terrain and will require cut and fill. By the end of Year 10, an alternative road to the crusher needs to be developed and a preliminary design has been completed in the study. 1.12.4 Mine Production Schedule Subsequent to the pit design work, pits with 100% of plant feed classified as Inferred Resources were removed from FS mine schedule. Five pits were removed, namely both Bypass pits, Anokyi South, Abonko East and Kaampakrom Far East pits. Further, no inferred material was included in subsequent production schedules, and instead sent to waste. The mine production schedule was developed in monthly increments and is based on a total material movement of 406 Mt, comprising 380 Mt of waste and 25.6 Mt of ore at 1.21% Li2O, for a 14.8:1 waste to ore strip ratio. TECHNICAL REPORT SUMMARY EWOYAA LITHIUM PROJECT Page 34 of 368 Staged development of the pits is driven by the desire to maximise the grade of the initial plant feed, minimise waste pre-stripping and the requirement for consistent total material movement. In addition, four constraints were imposed on the mine production schedule as listed below: • First access to mining areas: mining commences in Ewoyaa South-2 pit whilst removal of existing HV powerlines traversing the Ewoyaa main pit location occurs; • Processing rate: The Early Production Phase targets 50 kt per month of crusher feed with the first year of full production targeting 2 Mt, increasing to an annual crusher feed rate of 2.7 Mt per annum thereafter; • P2 ore limit: % of P2 in the ore blend is limited to 10% where possible; and • All inferred material is categorised as waste. During the Early Production Phase, the total material movement is 6.1 Mt, including a total of 453 kt of ore that is processed by early production DMS plant. Total material movement increases to 18 Mt in the first year of the fixed process plant operation and thereafter gradually increases on account of higher mining strip ratios. Stockpile tonnages fluctuate significantly, reaching about 0.1 Mt at the end of Year 1 (Early Production Phase), increasing to 0.7 Mt and 0.9 Mt at the end of Year 2 and Year 3 respectively, after which it decreases to about 30 kt in Year 4 to then increase to about 500 kt in Year 5 with a maximum reached in Year 6 (1.0 Mt). TABLE 1-14 MINE PRODUCTION SCHEDULE SUMMARY 1(1) 6.1 5.5 9.4 0.6 1.37 0.1 1.14 0.5 1.43 2 18.2 15.6 6.1 2.5 1.27 0.7 1.21 2.0 1.29 3 24.8 21.9 7.4 2.9 1.25 0.9 1.15 2.7 1.27 4 38.6 36.8 20.2 1.8 1.07 0.03 0.99 2.7 1.09 5 41.1 38.0 12.0 3.2 1.20 0.5 0.96 2.7 1.24 6 39.5 36.6 12.4 2.9 1.35 1.0 1.26 2.4 1.31 7 43.6 41.3 17.8 2.3 1.23 0.9 1.30 2.4 1.22 8 45.3 43.1 18.9 2.3 0.7 0.7 1.24 2.4 1.22 9 48.9 47.2 27.6 1.7 1.15 0.03 1.30 2.4 1.17 10 48.7 46.4 20.1 2.3 1.12 0 2.3 1.12 11 43.9 41.5 17.0 2.4 1.25 0.3 1.21 2.1 1.26 12 7.2 6.6 11.0 0.6 1.24 0 0.9 1.23 Total 406.0 380.3 14.8 25.6 1.22 25.6 1.22 *Early production phase, which covers 14 months. Year Total Material Waste Strip Ratio Crusher Feed Mined Stockpile (End of Year) Ore processed Tonnes Li2O Tonnes Li2O Tonnes Li2O [Mt] [Mt] [w:o] [Mt] [%] [Mt] [%] [Mt] [%] TECHNICAL REPORT SUMMARY EWOYAA LITHIUM PROJECT Page 35 of 368 FIGURE 1-6 TOTAL MATERIAL MOVEMENT BY CUTBACK 1.13 PROCESSING AND RECOVERY METHODS 1.13.1 Overview The processing facility (Figure 1-7) has been designed in accordance with accepted industry practice and the flowsheet incorporates unit operations that are well proven in the industry and commensurate with the test work conducted and results achieved to date. The test work supports a flowsheet that utilises conventional DMS processing to recover spodumene to a saleable concentrate. The plant layout provides ease of access to all equipment for operating and maintenance requirements while maintaining a compact footprint to minimise construction costs. FIGURE 1-7 PROCESSING PLANT AND INFRASTRUCTURE VIEWED FROM THE WEST The key Project and ore specific design criteria for the processing facility design are as follows: TECHNICAL REPORT SUMMARY EWOYAA LITHIUM PROJECT Page 36 of 368 • 2.7 Mtpa of Run-of-Mine (“ROM”) ore through the crushing plant operating at 70% utilisation (6,132 hr/y); • DMS plant utilisation of 85% (7,446 hr/y) supported by crushed ore storage and standby equipment in critical areas; and • Sufficient automated plant control to minimise the need for continuous operator interface and allow manual override and control if and when required. 1.13.2 Plant Flowsheet The overall process flowsheet is depicted in Figure 1-8. ROM feed is direct-tipped or loaded by front-end loader into a ROM feed bin. Material is then subjected to three stages of crushing through separate crushing circuits to produce a +10 mm top size material ready for feed to a conventional DMS beneficiation circuit. The feed material is separated into three size fractions to maximise DMS efficiency, namely Coarse (-10 +5.6 mm), Fines (-5.6 +2.8 mm) and Ultrafines (-2.8 +0.85 mm) fractions. Each fraction is then processed in a two stage DMS circuit. A review of the metallurgy and testwork to date indicates that a bottom size fraction of 0.85 mm is preferential to overall recovery than the 1.0 mm design, and the plant design and equipment will be able to meet capacity at the 0.85 mm bottom size. In each two stage DMS circuit, the Primary DMS sinks are upgraded in the secondary stage. Secondary sinks from each size fraction are combined to produce a DMS concentrate product. To improve recovery, coarse DMS floats are fed to a recrush circuit. The recrush circuit crushes the material to -4 mm and the recrush DMS circuit recovers liberated spodumene.

TECHNICAL REPORT SUMMARY EWOYAA LITHIUM PROJECT Page 37 of 368 FIGURE 1-8 OVERALL SIMPLIFIED PROCESS FLOWSHEET The screened -0.85 mm fraction is pumped to the fines dewatering circuit. Dewatered fines material is stacked in a fines stockpile. The material will be sold as a secondary product. In the future it is expected this material may be processed through a flotation circuit. The dewatering cyclone overflow or slimes fraction is sent to the thickener and is pumped to tailings storage facility. There are no toxic chemicals used in the DMS circuit and therefore the tailings themselves are chemically and biologically inert. The design includes all associated utilities, including water services, compressed air and reagents. 1.13.3 Pre-Production Processing Atlantic Lithium has identified an opportunity to conduct early processing operations using a modular DMS processing plant and contract crushing services. The early production will precede the primary processing plant by nine months. The pre-production flowsheet design criteria are as follows: • 600,000 tpa ore processed, with the DMS plant treating 375,000 tpa after fines are removed; and • The modular DMS plant will be operating at 80% utilisation for a feed rate of 50 tph. The contract crushing provider will crush ore to a top size of 10 mm. The DMS feed material will be screened at 3 mm to produce DMS feed (-10 mm +3 mm) and a fines stream (-3 mm). The DMS plant will produce a spodumene concentrate, along with the deslimed fines as a secondary product for sale. TECHNICAL REPORT SUMMARY EWOYAA LITHIUM PROJECT Page 38 of 368 The DMS plant will be a two-stage single size fraction process all using conventional DMS equipment. Grits and fines generated in the process will be thickened and filtered to produce dry tailings which will be stockpiled along with the middlings. The crushing contractor will provide an all-inclusive crushing service. The Modular DMS plant provider will supply experienced labour to commission and operate the processing plant for the first three months. A small team of Atlantic Lithium operations personnel will be recruited for the operation of this plant to be trained and become familiar with DMS operation and will later transition to the primary processing plant when the primary plant begins production. 1.14 INFRASTRUCTURE 1.14.1 Overview Existing infrastructure supporting the site includes: • Sealed N1 highway running to the south of the site; • Existing unsealed roads traversing the site; • HV powerlines in the vicinity of and traversing the site; • Ports of Takoradi, approximately 110 km to the west of site, and Tema, 140 km to the east; and • Airports at Accra and Takoradi. Infrastructure required to be developed or modified to support the site includes: • Water supply and sources including a water storage dam (WSD); • Power supply from the existing grid and existing electrical powerlines relocation for mine development; • Integrated Waste Landform Tailings Storage Facility (IWLTSF); • Plant site access road; • Buildings and facilities; • Fuel supply and storage; and • Communications. Given the proximity and road quality to Accra and Takoradi, no airstrip is required to support the site. 1.14.2 Site Access Access to the site from Accra is along the existing sealed N1 Accra-Cape Coast-Takoradi highway which runs along the southern boundary of the Project. Several existing unsealed roads extend northwards from the highway and link communities in the Project area. 1.14.3 Transport, Logistics and Port Facilities The deep-sea port of Takoradi is 110 km west of the site and accessible via the N1 highway. Travel time from Project site to port will be less than four hours, even during peak times. Products from the operation are stockpiled on site and loaded by front end loader onto 35-t tipper trucks for offsite transport. Based on annual product export volumes and loading only on day shift, a trucking fleet of fifty 35-t tipper trucks and two front end loaders will be required to maintain average 15-minute cycle times. Assistance was sought from established freight forwarding and transport companies established at the port to provide a product transport solution on an FOB Incoterms basis. Transport companies will provide all equipment under contracted services to the operation, eliminating the need to purchase equipment. A combination of warehousing and outdoor storage be used near the port to manage product volumes prior to ship loading. 1.14.4 Water Supply and Sources TECHNICAL REPORT SUMMARY EWOYAA LITHIUM PROJECT Page 39 of 368 Raw water supply for the Project will be from passive inflows to mine pits, runoff inflows to the water storage dam (“WSD”) and tailings storage facility (“TSF”) and augmented via a pump and pipeline from Lake Agege, 7 km north of the WSD. An overall site water balance was completed for the Project, predicting life-of-mine average raw water makeup volumes of 8.6 m3/h. Groundwater inflows to mine pits were modelled for the FS, with combined inflows from all pits gradually increasing from 184 m³/d during pre-production to a peak of 10,585 m3/d, meaning the reliance on the external Lake Agege water supply to the operation is expected to be short-term. Given the relatively low pit inflows, additional active dewatering from ex-pit boreholes is considered unnecessary. Once additional geological structural information is available and exposed in pits, horizontal drain holes targeting the structures from inside the pit could be used to manage inflows into Ewoyaa Main and North-East pits. Although the zone of drawdown does not extend a large distance from the mining area, there are some settlements near the mining area. There is a risk, although deemed low, of some reduction in water levels. Atlantic Lithium has installed monitoring bores for mapping these impacts. 1.14.5 Power Site power supply is from the electricity grid in Ghana at an average operating cost of $US0.14/kWh. Installed power to the operation is estimated at 8,500 kW and an average continuous load of 4,270 kW. The Ghana Grid Company Ltd (GRIDCo) owns the National Interconnected Transmission System in Ghana and Volta River Authority (VRA) is the primary energy provider in Ghana, augmented by other IPP power generation companies providing alternative sources of energy which can be wheeled through the grid. Ghana currently has 12 commercial power generation facilities with total installed capacity of 4,210 MW. The makeup of generation capacity is based on 56% from three hydro power plants at Akosombo, Kpong and Bui, 44% from an array of thermal plants including combined cycle gas turbines, simple cycle gas turbines and diesel generators and less than 0.1% from solar power. The preferred option for providing power to the Project is to construct a 34.5 kV single circuit transmission line approximately 3 km from a 161/34.5 kV substation at Saltpond to a new substation constructed at the Project site, that in turn distributes power to site electrical substations. Two existing transmission lines traverse the planned mining areas and will be diverted prior to mining commencement. The revised line route length will be approximately 15 km and require 30 km of new transmission line construction and a major shutdown to decommission existing lines and connect the new lines. 1.14.6 Tailings Management An integrated waste landform TSF (“IWLTSF”) will be constructed in two stages to take advantage of the proposed integrated waste dump and the natural landforms. The facility will be operational for the first three years. The third stage of tailings storage comprises of an IPTSF (In Pit Tailings Facility) within the Ewoyaa South 2 Pit. The WSD comprises of a low permeability face situated on the western face of the Waste Dump East Stage 1. The embankments of the IWLTSF are proposed to be constructed using excavated and borrowed low permeability material and waste rock, with borrowed material to be used to construct the WSD. The operation of these facilities is based on an anticipated high-water recovery, at least 50% of the slurry water volume entering the TSF. The decant pumping system (return water pumps and pipelines) must be designed to accommodate a water return of up to 65% of the tailings slurry water to the process plant. The results of high-water recovery can be directly attributed to a small decant pond, high in-situ dry density of the deposited tailings and minimal seepage losses. TECHNICAL REPORT SUMMARY EWOYAA LITHIUM PROJECT Page 40 of 368 The designs of the TSFs assume an average dry density of 1.5 t/m3 for operation which will provide 0.5 Mm3 of storage capacity for 0.75 Mt of tailings in the IWLTSF and 0.97 Mm3 of storage capacity for 1.46 Mt of tailings in the IPTSF. The WSD can provide a water storage capacity of 187,500 m3. In accordance with the DMP Code of Practice (CoP) (DMP, 2013), the IWLTSF is assessed as ‘Medium’ with a classification of ‘Category 2’, with the IPTSF as a ‘Low’ and ‘Category 3’ and the WSD as ‘Low’ and ‘Category 2’. Construction work must be undertaken in accordance with drawings and earthworks specifications. Furthermore, operation of the facilities must be executed in accordance with the design intent and Operating Manual (OM). The IWLTSF and WSD each have capacity for a 1:200-year annual exceedance probability (AEP) 72-hour storm event in accordance with GISTM requirements, Government of Ghana and DMP required freeboard. The design objectives were developed to ensure both IWLTSF and WSD are decommissioned and rehabilitated in an ecologically sustainable manner and in accordance with both DMIRS principal closure objectives for rehabilitated mines and EPA objectives for rehabilitation and decommissioning. 1.14.7 Site Roads A range of road types will be required for both site internal and access roads to meet a wide range of duties. The hierarchy of road types includes dedicated mine haul roads, the main access roads, general access roads and minor use roads and tracks. Some roads will border service corridors, e.g., raw water supply pipelines, or tailings pump line access. Hence, road alignments also need to consider service routes in addition to transport requirements. The road widths and construction details have been selected to match the required duties. The main haul road will intersect the existing dirt road that connects the Ewoyaa village to the main highway. 1.14.8 Buildings and facilities The Project will develop several buildings and facilities to support the operation, including: • Administration building housing management and administrative personnel; • Services building to house medical, training and other support facilities; • Workshop and warehouse; • Reagent storage sheds; • Worker changeroom, ablutions building; and • Site access building and access turnstile gate. Mining services facilities will be provided by the mining contractor under their contracted works.

TECHNICAL REPORT SUMMARY EWOYAA LITHIUM PROJECT Page 41 of 368 FIGURE 1-9 MINING SERVICES, ADMIN, SERVICES, WORKSHOP AND WAREHOUSE FACILITIES 1.14.9 Accommodation Accommodation for most of the workforce is proposed utilising the available accommodation in the region. Accommodation for senior management, visitors and dignitaries will be provided at a nearby resort facility, which is currently under care and maintenance and will require minor upgrade works and maintenance to be operational. A contract to operate the resort will be let to a suitable provider, inclusive of resort management, cleaning, maintenance and provision of all meals and accommodation requirements. 1.14.10 Fuel Storage and Distribution Fuel storage and distribution will be provided and controlled by the mining contractor as the main user of fuels and lubricants at the site. Atlantic Lithium will make use of locally available services for maintenance of light vehicles, and to support the basic administrative supplies requirements for the operation. 1.14.11 Communications Site communications, consisting of phone, internet, and a communications tower, will be established for the site and connected to nearby existing Internet Service providers in the vicinity of the N1 highway. 1.15 MARKET ANALYSIS 1.15.1 Lithium Supply and Demand Outlook Spodumene concentrate demand is underpinned by associated lithium demand for the manufacture of lithium-ion batteries that are expected to play a critical role in decarbonising energy production and achieving global net zero aims by 2050 via global automotive fleet electrification and renewable-generated energy storage. Existing reliance on China dominated battery manufacturing supply chains has prompted a global response in terms of critical minerals policy development, legislation and incentives to encourage development of global battery manufacturing capability, particularly in the US and the EU. TECHNICAL REPORT SUMMARY EWOYAA LITHIUM PROJECT Page 42 of 368 Lithium supply is therefore rising in response to growing demand, policy settings and incentives. The market is expected to remain in deficit after 2025 based not only on demand but on timelines to develop projects introduce new supply, which themselves are at risk based on cost pressures, jurisdictional and permitting challenges and growing ESG requirements. Therefore, lithium demand profiles and supply deficits and challenges provide the fundamentals to underpin product pricing to support project development. 1.15.2 Spodumene Concentrate Pricing Spodumene concentrate pricing is based on a consensus SC6 forecast provided by ALL. This Pricing has been used for the component of SC6 produced on the Project. SC5.5 pricing is calculated with a 5% discount to the SC6.0 Li2O unit pricing and factored by a ratio of the product grades, i.e., SC5.5 price = (5.5/6) *SC6 Price*0.95. Secondary product pricing is calculated with a 45% discount to the SC6.0 Li2O pricing and factored by a ratio of the product grade. The pricing basis for the discount is from preliminary discussions between ALL and potential offtakers for the material. TABLE 1-15 PROJECT PRODUCT PRICING FORECAST, USD, FOB GHANA Year 2025 2026 2027 2028 2029 2030 2031 2032 2033 2034 2035 2036 FS SC6.0 (median consensus), US$ 3,000 2,557 2,000 1,841 1,770 1,666 1,560 1,452 1,410 1,410 1,410 1,410 FS SC5.5 (calculated), US$ 2,613 2,227 1,742 1,603 1,541 1,451 1,359 1,264 1,228 1,228 1,228 1,228 Secondary Product (calculated), US$ 375 286 222 176 191 189 163 155 144 139 154 152 1.15.3 Product Sales The Project will be funded under a co-development agreement with Piedmont Lithium Inc. (“Piedmont", “PLL” or “Registrant”), where Piedmont has the right to earn up to 50% at the Project level and 50% of the total spodumene concentrate (SC6) offtake at market rates by funding US$17M towards studies and exploration and US$70M towards the development. Any cost overruns or savings for the Project (i.e., where development costs are more or less than the funding in the agreement) will be shared equally between Atlantic Lithium and PLL. The Company will sell the remaining 50% of total spodumene concentrate product and other secondary products via offtake agreements to be investigated and negotiated after Decision to Mine and granting of Mining license. 1.16 ENVIRONMENTAL STUDIES, SOCIAL AND PERMITTING 1.16.1 Introduction Under Ghanaian environmental and social legislation, all undertakings, including mining and allied activities, must be compliant with the Environmental Protection Agency Act 1994, Act 490, and the Environmental Assessment Regulations 1999 (LI 1652). In addition to these two key national legislations, there are over 40 other environmental and social related legislations that any undertaking must be compliant with, depending on the nature, scope, and location of the undertaking. The project has adopted critical international environmental and social guiding principles and benchmarks, including: • Equator Principles (EP); EP3 – EP10; • International Finance Corporation Performance Standards (IFC PS); PS1 – PS6 and PS8; • WB EHS Guidelines (General) (2007) and WB EHS Guidelines (Mining) (2007); and TECHNICAL REPORT SUMMARY EWOYAA LITHIUM PROJECT Page 43 of 368 • International Labour Organisation (ILO) Conventions. 1.16.2 Regulatory Framework and Approvals Process The Ghana Environmental Protection Agency (EPA) is the legally authorised body for granting of Environmental Permits to undertakings in country. Ghanaian environmental approval requirements for mining require a full Environmental and Social Impact Assessment (ESIA). The ESIA and permitting process commence with project registration with the EPA, who then screen the application and decides on the need for further study based on the project scope, potential environmental and social impacts, and the consent and support of various stakeholders in the Project footprint. After this is a scoping stage once EPA has requested the conduct of a detailed ESIA study. A Scoping Report will be developed and submitted to the EPA for review and approval. The report will also be made publicly available and will include Terms of Reference for the ESIA, a description of any issues raised during the consultation process and how they will be addressed in the ESIA. The ESIA study will cover potential positive and negative impacts on environmental, social, economic, and cultural aspects in relation to the different project phases, including transboundary impacts. Upon completion of the study, a draft Environmental Impact Statement (EIS) will be developed and submitted to the EPA for review and approval. EIS Approval by the EPA will be premised on satisfaction with the identified impacts and mitigation and management measures outlined in the EIS. The EPA may also recommend amendments to the report or the conduct of further studies to warrant approval of the EIS. Once the EPA is satisfied and approves the EIS, an Environmental Permit will be issued for the Project. 1.16.3 Existing Environmental Setting Topography and Geology Generally, the Project area landscape is undulating with isolated hills at different locations with an elevation of between 15 m to 110 m above sea level. The area geologically lies within the Birimian Supergroup, a Proterozoic volcano- sedimentary basin located in western Ghana. The site is also classed as B and C under the Euro Code 8 seismic site classification for soil which consists of outcrop rock masses or very rigid soils and medium-dense sand, gravel, or stiff clay respectively. Analyses of ground vibration data within the Project area indicate that generally the peak particle velocity (PPV) recorded do not pose an elevated seismic vulnerability risk. Climate The Ewoyaa area experiences mild temperatures averaging between 24 and 28 degrees Celsius all year round and relative humidity of about 70% due to its proximity to the ocean. The area experiences double maximum rainfall with peaks in May-June and October. Annual total rainfall ranges between 90 cm and 110 cm in coastal savannah areas and between 110 cm and 160 cm in the interior close to the margin of the forest zone. Dry seasons usually occur from December to February and from July to September. Hydrology and Hydrogeology The natural drainage in the Project area indicates the possibility of several streams and rivers existing or flowing through the area. Nonetheless, very few surface water bodies are encountered on the ground, with the majority being dugouts or water holding areas that temporarily dry out during the dry season. Water from dugout sources normally is a mixture of surface runoff and groundwater mostly from the unsaturated zone. No perennial streams or rivers occur within the immediate Project area. Typical borehole yields are from 0.1 to 0.5 l/sec. Surveys conducted in the Project area indicate that the water chemistry is predominantly alkaline, with elevated fluoride levels which is normal for basement geology, and high nitrate levels which indicate contamination from human and animal waste. TECHNICAL REPORT SUMMARY EWOYAA LITHIUM PROJECT Page 44 of 368 Air Quality and Noise Results of air quality monitoring conducted in the Project area since 2021 to date revealed that prevailing air quality of the Project area generally falls within the recommended Ghana EPA and WHO levels. Noise levels in some areas monitored exceed Ghana EPA and IFC/WHO recommended levels, attributed mainly to the proximity of the communities/ sampling areas to the Accra-Cape Coast Highway (N1) which is a significant source of noise pollution. Long-term Environmental Monitoring The Project has gathered extensive environmental baseline data from 2019 to date, which provides a snapshot of the quality and nature of the environment. Additionally, the Project has instituted and is implementing a long-term environmental monitoring program (exploration phase through to closure phase) which will afford prompt detection of deteriorating and/or improving environmental conditions within the Project area to enable appropriate action to be taken where required. 1.16.4 Existing Social Setting Traditional Ownership of Land The Project communities where land ownership is likely to be affected are Abonko, Anokyi, Ewoyaa, Krofu, Krampakrom and Lower Saltpond. Land title in these communities is predominantly held by families rather than chiefs and stools, as is common in Ghana. Family lands, implicitly inferred by the 1992 Constitution as private property, are devoid of extensive government regulatory mechanisms compared to stool or skin lands. Traditional authorities however have played a key role in resolving and/or mediating conflicts arising in land ownership. Population A 2020 survey conducted on communities within a 2km radius from active areas of mineralisation estimated that over 3,562 people were living within the survey area. The surveyed communities included Abonko, Anokyi, Ewoyaa, Krofu, Krampakrom, Ansaadze, and Afrangua. Cultural Heritage and Archaeology Cultural heritage and archaeological studies conducted in the Project area revealed 33 archaeological and heritage resources. These resources are shrines believed to be a link between the living and dead. All shrines in these communities are networked and rituals for one can be performed at another. Almost all shrines share common ritual items, functions and taboos. Some of these resources may need to be relocated, which will be done in consultation with the various Deity-Heads to avoid social disruption and prevent potential non-cooperation. 1.16.5 Health, Safety, Environment and Communities Management System (HSECMS) The Project has developed several mechanisms to facilitate sustainable and effective management of HSEC concerns within its footprint. This includes documented plans, agreements, toolkits, and registers that provide the framework to manage the HSEC management system of the Project. • Stakeholder Engagement Plan (SEP): Describes the applicable regulatory and/or other requirements for disclosure, consultation and ongoing engagement with the Project’s stakeholders, and provides the framework to build a two-way communication between the Project, the potentially affected communities and other project stakeholders through a clear, simple and effective communication strategy. • Community Development Plan (CDP): Aimed at ensuring inclusive decision-making with host communities, supporting environmental and socio-economic development, enhancing community wellbeing, and expanding the capabilities of communities to effectively engage with the Project, government, and Community-Based Organisations (CBOs) on development issues that concern the communities. • Emergency Response Plan (ERP): Identifies potential emergency scenarios likely to occur in association with the Project, their likely consequences, preventive strategies, response procedures and corresponding responsible

TECHNICAL REPORT SUMMARY EWOYAA LITHIUM PROJECT Page 45 of 368 parties/persons, resource requirements for efficient emergency response, response timing, reporting channels and procedures. • HSEC Risk Register: Details all the identified risks of the Project (Exploration Phase), the potential impacts or consequences of those risks occurring, control and management measures for each identified risk and responsible parties for managing the risks. • Baseline Exceedance Level Tracking: Serves as a proactive monitoring tool to identify deteriorating or improving environmental conditions (air and water quality, and noise levels) within the Project footprint based on data from monthly environmental monitoring. 1.17 CAPITAL AND OPERATING COSTS 1.17.1 Capital Costs The Project capital cost estimate was compiled based on input from the following key contributors: • Primero: process plant, bulk earthworks and various infrastructure costs; • Geocrest Group / REC for Tailings and water storage dam earthworks; • ECG Engineering for HV powerline relocation and power supply connection costs; and • Atlantic Lithium for owner’s costs, land and resettlement costs and sustaining costs. The upfront capital cost estimate is based on the scope described in this report and has been peer reviewed for acceptance by the study team. All costs are expressed in United States Dollars (US$) unless otherwise stated, with an estimate basis date of Q2 2023. The estimate has been developed in accordance with Primero’s capital cost estimating procedures, with an accuracy of ±15%. The upfront capital cost estimate summary is presented in Table 1-16. Mining costs are discussed in Section 4.0 and have been included directly into the financial model. TABLE 1-16 CAPITAL ESTIMATE SUMMARY (USD, Q2 2023, -15% + 15%) WBS Area US$M % of Total Site General and Infrastructure 23.5 12.7 Process Plant - DMS 73.2 39.5 Project Indirects 27.6 14.9 Owners Costs 33.4 18.0 Modular Plant - DMS 15.3 8.3 Subtotal 173.0 93.4 Contingency 12.2 6.6 Total 185.2 100.0 Estimate Basis The estimate has been presented in United States dollars as at Q2 2023. Prices obtained in other currencies have been converted to US$ using agreed Project exchange rates. The estimate build-up is based on FS level of engineering and design across most scope areas to size equipment and prepare material quantities. Quantity information was derived from a combination of sources and categorised to reflect design information maturity: • Study engineering including quantities derived from Project specific engineering, equipment lists, drawings and 3D modelled facilities; TECHNICAL REPORT SUMMARY EWOYAA LITHIUM PROJECT Page 46 of 368 • Reference projects with quantities drawn from previously constructed projects or detailed designs, adjusted to suit (where required) this Project works scope; • Estimates that include quantities derived from sketches or redline mark-ups of previous Project drawings and data, compiled by estimating; and • Factored quantities derived from percentages applied to previous Project estimates. Estimate pricing was derived from a combination of the following sources: • Priced: Market pricing solicited specifically for the Project estimate from enquiry to reputable suppliers, fabricators and construction contractors in Ghana and internationally; • Estimated: Historical database quantities or pricing older than six months, with some use of priced information (above) such as unit rates for cost build ups; and • Allowance: Cost allowances based on Project team experience, benchmarking. The breakdown of estimate pricing source (excluding contingency) is shown in Table 1-17. TABLE 1-17 SOURCE OF CAPITAL COST PRICING Source of Pricing US$M % of Total Priced 136.6 79.0 Estimated 27.4 15.8 Allowance 9.0 5.2 Total 173.0 100.0 The capital cost estimate excludes sunk costs, corporate costs, company overheads, exploration costs, Project financing costs, taxes, duties, working capital, exchange rate variations and escalation. Deferred and Sustaining Capital Additional capital expenditure over the life of operation (Table 1-18) to sustain mining and processing operations has been prepared and included in the financial model. TABLE 1-18 SUSTAINING AND CLOSURE CAPITAL COSTS, LOM Cost Item US$ M Land Access and Resettlement Costs 98.9 Sustaining capital TSF Development Stages 2 and 3 0.8 New Tailings Line to Ewoyaa Pit 0.9 New Water Line from Ewoyaa Pit to Plant 0.5 Sediment Control Structures 3-5 0.1 Sustaining capital Plant and Buildings 7.0 Vehicle and Fleet Replacements 1.1 Sustaining Capital Infrastructure and Equipment: 2.9 Rehabilitation and Closure Costs 45.8 Total 158.0 The costs exclude expenditure for new or expanded process plant and infrastructure. TECHNICAL REPORT SUMMARY EWOYAA LITHIUM PROJECT Page 47 of 368 1.17.2 Operating Costs LOM Operating Costs The Project has an estimated C1 cash cost, FOB Ghana detailed in Table 1-19 below. TABLE 1-19 LOM OPERATING COSTS Operating Cost $ M (LOM) Unit of measure Unit cost by activity $/dmt concentrate Mining Contractor 1,529,673 $/t mined 3.81 455 Atlantic Mine Management 38,785 $/t mined 0.10 12 Processing 202,169 $/t processed 7.88 60 General and Administration 168,758 $/dmt concentrate 50.15 50 Spodumene Selling 100,195 $/dmt concentrate 29.81 30 Secondary Product Selling Costs 145,242 $/dmt secondary product 32.65 43 Secondary Product Credits -834,681 $/dmt concentrate -248 Total Operating Cost 1,349,946 $/dmt concentrate 402 C1 operating cost are defined as direct cash operating costs of production FOB, Ghana Port. Direct cash operating costs include mining, processing, transport, and general and administration costs, net the credit from secondary product sales. Secondary product credits do not include Feldspar sales. The operating cost estimates are detailed below. Mining Costs Estimation of direct mining costs was developed on the basis of a mining contractor operation, under the management of the Atlantic Lithium site operations team. Mining costs were based on: • Contract mining costs established via a request for quotation (“RFQ”) process involving eight established mining contractors active in the region for the full scope of contract mining services, excluding grade control drilling. Contract grade control costs were provided by the exploration drilling company that conducted the resource drilling at the Project (Geodrill Limited); • Capital works related to mobilising and establishing mining operations were included in the RFQ process; and • Owner’s operations mining management team costs were estimated by ALL and included in the OPEX. Contract mining quotes were obtained from eight mining contractors experienced in the region. For conforming contractor quotes, unit mining costs excluding site establishment, mobilisation and de-mobilisation ranged from $3.21/t to $4.60/t mined based on material movement for the first seven years of mine life. Mining costs were estimated at $3.82/t mined, over the life of mine, inclusive of contractor mobilisation, establishment, pre-production mining and demobilisation. DMS Processing Costs Process operating costs have been developed on an annualised basis and using the parameters specified in the plant process design criteria for the main plant operation. The operating cost estimate includes all owner management, administration and processing costs to process 2.7 Mtpa of ore annually to produce spodumene concentrate and secondary product. Operating costs are expressed in United States Dollars (US$) unless otherwise stated, with an estimate basis date of Q2 2023, and are summarised in Table 1-20. TECHNICAL REPORT SUMMARY EWOYAA LITHIUM PROJECT Page 48 of 368 TABLE 1-20 SUMMARY OF DMS OPERATING COST (USD, Q2 2023, -15% + 15%) Item $M/year $/t Crusher Feed $/t Product Labour (Processing and Maintenance) 6.8 2.51 11.61 Reagents and Operating Consumables 2.2 0.82 3.77 Maintenance Materials 3.6 1.34 6.18 Power 3.0 1.11 5.11 Labour (Atlantic Lithium) 3.4 1.24 5.75 Labour (General and Administration) 5.4 2.01 9.27 General and Administration Expenses 9.3 3.44 15.90 General and Administration Power 0.3 0.11 0.50 Material Handling 1.9 0.71 3.30 Early Production Plant Operating Cost Operating costs for the smaller pre-production Modular DMS processing plant (Table 1-21) were prepared on an annualised basis for the period of operation prior to the main plant coming online. Costs were developed with the same basis as the main processing plant operating cost, apart from labour requirements being reduced appropriately, higher reagent consumptions applied, and diesel costs calculated for associated power consumption given the permanent power supply will not be online. TABLE 1-21 PRE-PRODUCTION OPEX SUMMARY Item $M/year $/t Crusher Feed $/t Product Crushing 6.2 10.31 22.30 Labour (Processing and Maintenance) 2.2 3.65 7.90 Reagents and Operating Consumables 0.7 1.11 2.40 Maintenance Materials 1.7 2.83 6.13 Diesel 2.0 3.28 7.12 Labour (Atlantic Lithium) 1.8 3.00 6.50 Labour (General and Administration) 1.7 2.80 6.07 General and Administration Expenses 2.7 4.40 9.52 Material Handling 0.4 0.64 1.39 Estimate Basis Labour costs were developed based on the operations team (position and headcount) defined in the operations organisation chart and the expected cost of salaries, allowances, statutory charges and costs for each position. Reagents and operating consumables costs were calculated based on expected consumption rates either from process design criteria information, benchmarking against similar operations or operational experience, and applied to unit rate pricing for each reagent and consumable item. Power costs are based on unit rate power costs advised by ECG and applied to expected power consumption for the plant and operation.

TECHNICAL REPORT SUMMARY EWOYAA LITHIUM PROJECT Page 49 of 368 General and administrative costs include priced costs for contracted services such as the metallurgical laboratory, site security, site medical etc. as well as costs such as insurances, legal and accounting fees, training, general stationery and supplies, annual permits and licensing fees, consultant fees, travel and expenses, social and community expenditure. Product transportation and logistics costs are based on unit costs for the complete transport and logistics chain between site and product loading onto ships at Takoradi port, applied to the calculated annual product tonnages. Waste material handling costs are based on mining contractor waste haulage rates. The OPEX excludes exchange rate and inflation variations from date of estimate, Project financing costs and interest charges, corporate overheads, VAT, Royalties, mining contractor costs (included directly in the financial model) and exploration costs. 1.18 ECONOMIC MODEL AND SENSITIVITY ANALYSIS 1.18.1 Model Inputs and Basis A financial model has been prepared to collate the study results to estimate and evaluate Project cash flows and economic viability. The model is based on the following key inputs and assumptions. TABLE 1-22 KEY FINANCIAL MODEL INPUTS Model Parameter Basis Basis Value/Input Capital Funding Base Case: 100% Equity, 0% Debt Equity Discount rate % per annum 8.0 Royalties Govt. % 10.0 Royalties 3rd Party % 1.0 Royalties 3rd Party %, capped at $2m total 1.0 Royalties - Growth and Sustainability 1% levy % 1.0 DMS Recovery P1 SC6.0 62.1% DMS Recovery P1 SC5.5 67.2% DMS Recovery P2 5.5 14.9% DMS Modular Recovery SC5.5 34.0% Li Product Moisture Content % 5.0 Secondary Product Moisture Content % 15.0 Corporate Tax Rate % 35 GET FUND Paid in year after cost incurred % of goods and services cost 2.5 NHIL FUND Paid in year after cost incurred % of goods and services cost 2.5 CDA FUND Paid in year after cost incurred % of earnings/profit (NPAT) 1.0 VAT Rate % of goods and services cost 15.0 Return Frequency for VAT (post Construction) Quarters 2.00 COVID 19 HRL - levy on non-exempt goods and services Paid in year after cost incurred 1% TECHNICAL REPORT SUMMARY EWOYAA LITHIUM PROJECT Page 50 of 368 Model Parameter Basis Basis Value/Input Goods and Services Costs estimate based on % of Opex 17% Import duties on op consumables 5% Marketing Costs % 3 Environmental Bond first year payment US$ 4,522,995 Annual Premium as % Insurance Bond 0% With-holding Tax Rate on non-resident services 20% Withholding Tax Rate on Interest and dividends 8% Import Duties on Op Consumables (incl. ECoWAS and Proc) 5% Carried forward losses in Ghana Years 4 Refining Costs % 0.00 Governments Free Carry Requirement % 13 1.18.2 Spodumene Concentrate Pricing Basis Spodumene concentrate pricing is based on a consensus SC6 forecast (Table 1-23). This Pricing has been used for the component of SC6 produced on the Project. SC5.5 pricing is calculated with a 5% discount to the SC6.0 Li2O unit pricing and factored by a ratio of the product grades, i.e., SC5.5 price = (5.5/6)*SC6 Price*0.95. Secondary product pricing is calculated with a 45% discount to the SC6.0 Li2O pricing and factored by a ratio of the product grade. The pricing basis for the discount is from preliminary discussions with offtakers for the material. TABLE 1-23 PROJECT PRODUCT PRICING FORECAST, USD, FOB GHANA Year 2025 2026 2027 2028 2029 2030 2031 2032 2033 2034 2035 2036 FS SC6.0 (median consensus), US$ 3,00 0 2,557 2,000 1,841 1,770 1,666 1,560 1,452 1,410 1,410 1,410 1,410 FS SC5.5 (calculated), US$ 2,61 3 2,227 1,742 1,603 1,541 1,451 1,359 1,264 1,228 1,228 1,228 1,228 Secondary Product (calculated), US$ 375 286 222 176 191 189 163 155 144 139 154 152 1.18.3 Spodumene Concentrate Production Figure 1-10 depicts spodumene concentration production over Life of Mine. The Modular DMS units will deliver early production during the first year. An uptick in production is anticipated in the second year, running at 75% of the nominal capacity on an annualised basis, which factors in both the commissioning and ramp-up stages. Year 4 production considers a higher volume of P2 ore processed. TECHNICAL REPORT SUMMARY EWOYAA LITHIUM PROJECT Page 51 of 368 FIGURE 1-10 LOM CONCENTRATE PRODUCTION STATEMENT: The estimated Ore Reserves and Inferred Resources underpinning the production target in Figure 1-10 have been prepared by a Competent Persons in accordance with the requirement in Appendix 5A (JORC Code). 1.18.4 Project Funding The Project will be funded under a co-development agreement with Piedmont, where Piedmont has the right to earn up to 50% at the Project level and 50% of the total spodumene concentrate (SC6) offtake at market rates by funding US$17M towards studies and exploration and US$70M towards the development. Any cost overruns or savings for the Project (i.e., where development costs are more or less than the funding in the agreement) will be shared equally between Atlantic Lithium and PLL. The Minerals Income Investment Fund of Ghana (“MIIF”) has agreed non-binding Heads of Terms with the Company to invest a total of US$32.9M in the Company to support the development of the project. This will be done by acquiring 6% contributing interest of the Project for US$27.9M as well as a US$5M investment into Atlantic Lithium. Project funding has been included on the premise that all Project development requirements will be funded by the PLL agreement, with additional funding required by Atlantic Lithium to be sourced from cash or equity. 1.18.5 Project Financial Results Key financial model outputs are shown in Table 1-24. The Project demonstrates robust financial metrics and rapid payback. TABLE 1-24 CASH FLOW MODEL KEY RESULTS Item Units FS Result Revenue (all products) US$M 6,212 Spodumene Revenue US$M 5,378 Secondary Product Revenue US$M 835 TECHNICAL REPORT SUMMARY EWOYAA LITHIUM PROJECT Page 52 of 368 Item Units FS Result NPV8 Post Tax US$M 1,219 IRR % 94.5 Payback Months 13.8 EBITDA US$M 3,101 EBIT US$M 2,759 NPAT, LOM US$M 1,819 Surplus Cashflow, Post Tax US$M 1,921 C1 Cash Cost (net by-product credit) US$/t 402 All In Sustaining Cost (AISC) US$/t 708 All-In Sustaining Costs (AISC) are defined as Operating Costs plus 3rd party royalties, government royalties and sustaining capital. AISC are calculated and reported from commencement of commercial production. AISC exclude Non- Sustaining Capital expenditure. The FS illustrates that the Project has strong operating margins. The realised concentrate price (FOB) is derived from the concentrate pricing in Figure 1-11, adjusted for the product mix. FIGURE 1-11 EWOYAA LITHIUM PROJECT MARGIN 1.18.6 Cash Flow Sensitivities Sensitivities are applied to key Project estimates and assumptions. Favourable and unfavourable movements relative to Post-Tax NPV8 are illustrated in Figure 1-12 below.

TECHNICAL REPORT SUMMARY EWOYAA LITHIUM PROJECT Page 53 of 368 FIGURE 1-12 CASH FLOW SENSITIVITIES GRAPH, NPV8 BASIS Project cash flows are most sensitive to changes in concentrate selling price, where a 10% change in price resulted in a 17.3% change to the Post-Tax NPV8. This was closely followed by sensitivity to changes in head grade (14.9%) and recovery at (14.2%). Sensitivity adjustments of Project expenses demonstrated that mining costs, which made up the largest portion of operating expenditure, resulted in the most significant movements in Project NPV8 followed by concentrate transport, processing. The Project is insensitive to changes in capital cost. 1.19 OTHER RELEVANT INFORMATION 1.19.1 Project Implementation Implementation Basis The overall Project objective is to design, fabricate, build and commission a successful lithium mine, concentrate production facility and associated infrastructure to a high safety standard whilst meeting all statutory laws and regulations and minimising impact to local communities. The execution strategy to meet the Project objective will be to employ an Engineering, Procurement and Construction Management) (“EPCM”) methodology, whereby EPCM contractors will provide the engineering, procurement, construction management and commissioning support services necessary for delivery of the process plant, associated infrastructure and services works scopes. The EPCM approach is commonly employed in mining projects in the region and allows Atlantic Lithium to monitor and control the budget, schedule and quality of the end product through all stages of project development and execution. EPCM contractors will provide management, engineering, design and procurement services for their work packages aligned with a “fit for purpose” approach to design, tender, evaluate, recommend for award, purchase and expedite all required equipment and materials for the Project. EPCM contractors will manage their teams and report to Atlantic Lithium’s management structure, who will be supported by a Project Team staffed to the meet Project objectives and manage any owner-led work packages. TECHNICAL REPORT SUMMARY EWOYAA LITHIUM PROJECT Page 54 of 368 EPCM contractors will establish construction management teams to manage and supervise on-site contractor construction progress, quality of workmanship, safety and environmental compliance. The Project will maximise the use of majority Ghanaian owned contractors and suppliers of key bulk materials and services in accordance with recently legislated requirements. Over 400 personnel are expected on-site during the peak construction phase. Equipment fabricated outside of Ghana will be imported through the ports of Tema and Takoradi and transported by road to site. A transport and logistics (TandL) contractor (freight forwarder) with local and international presence will oversee all TandL requirements under EPCM contractor supervision. EPCM contractors will manage and complete the commissioning of plant and infrastructure and perform handover to the Atlantic Lithium team for production ramp up once the agreed acceptance requirements are achieved. The Project has completed FEED work packages for the process plant design and for the HV powerline relocation and Project power supply works package. These works expedite readiness for long lead equipment item selection and purchase and de-risk the overall Project schedule. The balance of the detailed design will be completed after Decision to Mine (“DTM”). Project Schedule A detailed Project implementation schedule has been developed based on inputs from the Atlantic Lithium team and all FS and FEED consultants. The schedule outlines a 30-month duration from FS completion until introduction of first ore into the main process plant in January 2026. The schedule has zero float and is contingent upon the following assumptions and basis: • Atlantic Lithium will use the FS and completed FEED works for its preliminary Mining Lease application to the Minerals Commission of Ghana with receipt in Q3 2023; • In parallel, internal assessment with Project JV partners for a DTM; • Following FID, access to agreed funds based on JV partner Project investment agreements and projected cashflow requirements identified in the FS to commence; • Engineering detailed design and procurement of long lead capital items; • Design, supply and execute works scope for the relocation of existing HV powerlines that traverse the Project site; • Carrying out ESIA works, application for environmental permits and developing the RAP requirements and implementation plant; • The critical path relates to the activities and durations associated with completing ESIA and RAP works to apply for and receive an environmental permit; • After ratification of the Mining Lease application, implementation of Phase 1 RAP activities will commence ahead of construction works (breaking ground) and mining contractor mobilisation for site establishment and mine pre- stripping; • Concurrent mine development and construction of processing facilities and infrastructure; and • Development of an early production DMS plant ahead of completion of the main process plant, for early production of spodumene products for early revenue streams, as well as training of operators and developing co- ordination between mining and operations departments. The key milestones for the Project are outlined in Table 1-25. TABLE 1-25 PROJECT SCHEDULE MILESTONES Project Milestone Start Finish Complete FS Jun-23 Process Plant Engineering and Procurement of Vendor Data Award Jul-23 Commence Commercial Negotiations (LLI) Aug-23 Process Plant Procurement Package Award Sep-23 TECHNICAL REPORT SUMMARY EWOYAA LITHIUM PROJECT Page 55 of 368 Project Milestone Start Finish Ghana Presidential and Parliamentary Election Canvasing Commences (12m ahead) Dec-23 Complete EIA and RAP and Submit to EPA Mar-24 Permit Application Process (Opp to expedite) Mar-24 Environmental Permit Granted (EIA and RAP) (Independent of ML Ratification) Jun-24 Parliamentary Ratification of Mining Lease (Obtain 6 months post ML Application) Jul-24 2024 Wet Season May-24 Sep-24 Earthworks Contractor Mobilisation to Site for Process Plant Construction Sep-24 Phase 1.1 Commence Process Plant Construction (Break Ground) Sep-24 Ghana Presidential and Parliamentary Election Dec-24 First Ore Available Early Production Plant Mar-25 First Product (Early Production plant) Apr-25 Commence Mining for Process Plant feed May-25 2025 Wet Season May-25 Sep-25 Power Feed Line to Process Plant Complete Sep-25 Power On Date Sep-25 First Ore Available Process Plant Oct-25 Process Plant Construction Complete Nov-25 First Ore Through Plant (SC6) Jan-26 First Shipment of Concentrate (SC6) Feb-26 1.19.2 Operations Ghana has an established mining industry with several currently operating gold, bauxite and manganese mines. It has established supporting industries and supply chains for mining operations as well as a skilled and experienced workforce for mining and plant operations, albeit without experience with lithium mining and processing in the country. The overall organisational structure of the operation has been developed with a breakdown of each department and function with associated headcount, position level and identification of expatriates, local workforce and contractors. More than 800 direct jobs will be created at the Project across security, medical, mining, processing and laboratory functions. The structure has also been used to develop labour costs in the operating cost estimate. A structured recruitment procedure will be carried out to identify and employ suitable candidates for all required positions and in the identified timeframes prior to productions and operation to ensure all training and other operational readiness requirements are implemented. Wherever possible, the operation will employ experienced Ghanaian management and supervision personnel, supplemented by a small number of expatriates with specific expertise in lithium production. Expatriates will be critical for operational readiness, local workforce training, guidance and management for successful operations startup, plant commissioning and ramp-up. Some expatriates will remain with the operation for one to three years, after which time it is anticipated that the operation can employ 100% Ghanaian personnel. TECHNICAL REPORT SUMMARY EWOYAA LITHIUM PROJECT Page 56 of 368 The Project will implement a hire local philosophy. This will provide contributions to economic growth and stability at the local level in the community. Atlantic Lithium will encourage its staff to live and work in the region and, by employing locally, the Company can be a more active part of the community and provide residents with an opportunity to access the jobs Atlantic Lithium creates. FIGURE 1-13 ESTIMATED EMPLOYMENT FOR LOM 1.20 RISK AND OPPORTUNITY The study undertook analysis at two levels: • Hazards identification associated with the plant operation (“HAZID”); and • Project development risk and opportunity analysis 1.20.1 HAZID A HAZID was undertaken focusing on design and operational elements that have the potential to cause significant personal injury or environmental damage, to allow these to be addressed early in the detailed design. The HAZID was carried out for the FS in a workshop setting with attendees from Atlantic Lithium and Primero and facilitated by an independent representative. The results of the assessment constitute the HAZID risk register, into which subsequent HAZID reviews were then conducted to complete the analysis. Overall, no hazards (uncontrolled) were classified as extreme, and only two hazards were classified as high, related to interactions of personnel with vehicles and mobile plant. With future implementation of industry standard design practices and operational controls, the residual risk ratings for these items are all low. All other hazards have both uncontrolled and residual risk lower ratings to either medium or low. 1.20.2 Project Risk Assessment A risk assessment was undertaken to assess the impact of uncertainties on the objective of delivering and operating the Project within budget and on schedule. The risks identified related to Compliance, Electrical supply, Environmental

TECHNICAL REPORT SUMMARY EWOYAA LITHIUM PROJECT Page 57 of 368 and approvals, Health and Safety, Human Resources, Infrastructure, logistics, water modelling and owner’s risks, Metallurgy, Geology, Mining, Processing, Security and Tailings and water dams. A standard Risk Assessment procedure was used for the Project Risk Review, which categorises risks by project development area. This allows specific risks and their impacts to be identified, along with current control measures. A severity of consequence and a likelihood of occurrence was assigned to rate risks and allow the effects of further control actions to be considered to arrive at a residual risk rating. The Project risk assessment was carried out for the FS in a workshop setting with attendees from Atlantic Lithium and all consultants and facilitated by an independent representative. The results of the assessment constitute the Project risk register, into which further reviews were then conducted by individual teams to complete risk works for their areas of study scope, including assignment of actions and risk owners for ongoing risk management. The results of the workshops are presented in the Project Risk Register. In the categories studied, one risk (uncontrolled) was classified as EXTREME, related to risk of obtaining and keeping an environmental permit (EP) required to conduct construction and operations. Long Project delays and delays to revenues would result. Mitigation actions relate to developing a strong understanding of the requirements to obtain and maintain the EP and carrying out the planned ESIA and RAP readiness works for the EP application in parallel to engineering and design works during 2023-24, leading to a residual risk rating of MEDIUM. Several risks were classified as HIGH, however with ongoing or future mitigation actions, all residual risk ratings lower to either MEDIUM or LOW. 1.20.3 Project Opportunities The Project has opportunities to capture further value from plant streams and to upgrade secondary products to generate additional revenue. These opportunities will need to be investigated in future further studies and testwork programs to assess their feasibility. Feldspar Product Feldspar recovery consists of an additional DMS circuit and WHIMS iron removal stage treating the DMS rejects stream. A high-quality feldspar concentrate could be produced with greater than 10% alkalis, and less than 0.1% Fe2O3. Potential production qualities are shown in the table below. TABLE 1-26 FELDSPAR ESTIMATES Product % of plant feed tonnage Quantity est. tpa Size range (mm) Grade % Li2O Feldspar (future product) ~20% - 40% 500 - 1,000ktpa -10+1 n/a Flotation Another opportunity for the Project includes processing fines (<0.85 mm) and middlings streams through a flotation plant. Preliminary flotation sighter testwork performed indicates encouraging flotation stage recovery and achievement of >5% Li2O concentrate grades. The fines and middlings streams making up the proposed flotation feed represent approximately 1.1 Mtpa feed stream with an estimated grade of 0.7% Li2O. Preliminary calculations for concentrate production are in the range of 80,000 tpa for a >5% Li2O concentrate which represents an opportunity to increase Project value. The flotation concentrate product would replace the current (lower grade) secondary product and would be a higher value, lower volume product. The opportunity has potential to de-risk the Project in the event that low-grade lithium bearing products market is adversely affected in the future. TECHNICAL REPORT SUMMARY EWOYAA LITHIUM PROJECT Page 58 of 368 TABLE 1-27 POTENTIAL FLOTATION PLANT FEEDSTOCK PER ANNUM Stream Quantity float feed est. tpa % Li2O Fines 450,000 1.2 DMS Middlings 650,000 0.4 Total 1,100,000 0.7 1.21 INTERPRETATION AND CONCLUSIONS The following main interpretation and conclusions are summarised below: 1.21.1 Mineral Resource • Sufficient data have been obtained through various exploration and sampling programs to support the geological interpretations of the lithium-bearing pegmatite deposit on the Property. The data are of sufficient quantity and reliability to reasonably support the resource estimates in this TRS. • The geology of the Project area and controls to mineralisation are well-understood. Exploration techniques employed on the Project are appropriate and data derived from them are of sufficient quality to support the modelling of Mineral Resources in accordance with the JORC Code. • Based on an assessment of available QA/QC data, the entire lithium and whole-rock drill core assay dataset is acceptable for resource estimation with assaying posing minimal risk to the overall confidence level of the MRE. • Sufficient data are available to generate reliable mineral grade estimates using the ordinary kriging method for the ALL properties. • The depth, geometry, and grade of pegmatites on the properties make them amenable to exploitation by open cut mining methods. • For the Ewoyaa Lithium Project, this study has defined (at a 0.5% Li2O reporting cut-off) a global Indicated and Inferred MRE of 4.2 Mt at 1.08% Li2O, containing 45,400 t of lithium oxide with an effective date of March 2023. 1.21.2 Mining • The depth, geometry, and grade of pegmatites on the properties make them amenable to exploitation by open cut mining methods. • Inferred resources may be converted to indicated resources with future infill drilling. 1.21.3 Metallurgy and Recovery • A total of approximately 370 pegmatite drill core samples were taken from across the Ewoyaa deposits. These samples captured the varying mineralisation and levels of weathering, including “P1" coarse and “P2” fine mineralogy types from weathered ‘transitional’ and unweathered ‘fresh’ domains. From these samples, sixty- nine (69) drill hole composite samples were created and used for testing and represented a combination of variability and composite samples. • Heavy Liquid Separation (HLS) and Dense Medium Separation (DMS) were undertaken on variability and production composites. Recoveries attributable to P1 material and P2 material were partly based on HLS and DMS-250 test results and partly on calculation of assumed additional recovery from middlings. • The recovery of lithium from ore to final product has been achieved through a DMS concentration stage. • The DMS technology for the recovery of spodumene is a widely used technology for beneficiation of spodumene and therefore considered low risk technology. • Testwork confirming the technologies applicability was undertaken across samples considered representative of the ore zones. • Concentrate grades of 5.5-6.0% Lithia were achieved, making a saleable product. TECHNICAL REPORT SUMMARY EWOYAA LITHIUM PROJECT Page 59 of 368 • The average spodumene recovery for each ore type is shown below. • The production schedule for the project is based on processing 2.7 Mtpa of ROM ore to produce a nominal 215 kt per annum of concentrate (6% Li2O). • Coarse rejects from the DMS plant will be hauled to the waste rock dump. • Wet tailings from the plant are pumped to a TSF integrated into the waste rock dump area/ landform. 1.22 RECOMMENDATIONS Specific recommendations for the Ewoyaa Lithium project are summarised below for the project areas. 1.22.1 Mineral Resource ALL is continuing to work both internally and with outside assistance to continue to further define their Resource Base and to Optimise the proposed LOM Plan. • Additional drilling along strike, up-dip and down-dip to extend known mineralisation. • Conduct infill drilling within non-mineralised pegmatite domains, where grade is more than 0.5% Li2O, in order to wireframe these zones within the mineralised domains. • Review four blanks from the 2022 drilling that appear to have been mis-labelled. 1.22.2 Mining The following mining related work is recommended to be investigated or progressed. • Appointment of the preferred bidder for contract mining, after final contract negotiations. • Short-term mine planning work including, but not limited to the following: • Review of pit staging. • Review of waste dump location / design • Review of potential for additional pit backfill. • More detailed designs on pit development works, including access roads and short-term mine production schedules for the first two years. • Detailed ROM pad design and assessment of potential long-term stockpile requirements and location. • Increase UCS database to improve drill and blast analysis. • Pegmatites are notoriously hard and baseline penetration rates using blast hole drilling trials are recommended. • Undertake infill drilling in order to convert in-pit Inferred Resources to at least Indicated. • Optimise waste dumping strategy. • Assess possibility of relaxing the vibration limit from 2mm/s to the more world-wide accepted standard of 5 mm/s. 1.22.3 Metallurgy Testing / Recovery Methods It is recommended to complete on-going testwork programs which will be completed H2 2023 and 2024: • Recrushing DMS testing. • Flotation testing of P1 and P2 ores. It is also recommended to further explore: • Flotation testing specifically with site water. ALL is continuing to work both internally and externally to continue to further refine their process and technology selections. TECHNICAL REPORT SUMMARY EWOYAA LITHIUM PROJECT Page 60 of 368 2.0 INTRODUCTION 2.1 PROJECT BACKGROUND Atlantic Lithium Ltd (AIM: ALL, ASX: A11, the Company, “ALL”, Owner, Client) has undertaken a Feasibility Study (FS) for the development of the Ewoyaa Lithium Project (the Project, “ELP”) in Ghana, West Africa. The FS builds upon previous scoping and pre-feasibility studies completed in 2021 and 2022. The project development involves open cut mining of several lithium bearing pegmatite deposits, conventional dense media separation (DMS) processing and supporting infrastructure to target production of spodumene concentrates and secondary product by Q2 2025. The development timeline is contingent on receipt of an environmental permit and ratified Mining License (ML) by Q3 2024. Initial processing of approximately 450,000 tonnes of ore will be carried out over the first 9 months starting Q2 2025 in an early production processing plant fed from Ewoyaa South 2 pit, prior to processing through the main 2.7 Mtpa processing facility from Q1 2026 for 11 years. Over the LOM, the project is estimated to produce 3.36 Mt of 6% (SC6) and 5.5% (SC5.5) grade lithium spodumene concentrates, as well as 4.45 Mt of secondary product which have been identified to be saleable given current and forecast lithium demand projections. Residue from the operation will be stored within various TSFs that take advantage of an integrated waste dump design approach and input tailings storage. The Project will be self-sufficient, with all necessary supporting infrastructure and ancillary equipment included in the Project Development plan. The Project will operate in a safe, responsible and technically efficient manner to the benefit of all stakeholders including the government of Ghana, the owners, shareholders, employees, and local communities. 2.2 AUTHORS AND SITE INSPECTIONS The details of the Qualified Persons (QP) and the sections of the report for which they are responsible are provided in Table 2-1. TABLE 2-1 QUALIFIED PERSONS AND RESPONSIBILITIES Report Section Title Qualified Person Section 1: Executive Summary All Section 2: Introduction Keith Muller Section 3: Property Description Keith Muller Section 4: Accessibility, Climate, Local Resources, Infrastructure and Physiography Keith Muller Section 5: History Lennard Kolff Section 6: Geological Setting, Mineralisation and Deposit Shaun Searle Section 7: Exploration Lennard Kolff Section 8: Sample Preparation, Analysis and Security Shaun Searle Section 9: Data Verification Shaun Searle Section 10: Mineral Processing and Metallurgical Testing Noel O’Brien Section 11: Mineral Resource Estimates Shaun Searle Section 12: Ore Reserve Estimates Harry Warries

TECHNICAL REPORT SUMMARY EWOYAA LITHIUM PROJECT Page 61 of 368 Report Section Title Qualified Person Section 13: Mining Methods Harry Warries Section 14: Processing and Recovery Methods Noel O’Brien Section 15: Infrastructure Keith Muller Section 16: Market Studies Keith Muller Section 17: Environmental Studies, Social and Permitting Keith Muller Section 18: Capital and Operating Costs Keith Muller Section 19: Economic Model and Sensitivity Analysis Keith Muller Section 20: Adjacent Properties Keith Muller Section 21: Other Relevant Data and Information Keith Muller Section 22: Interpretation and Conclusions Keith Muller Section 22.1: Mineral Resource Shaun Searle Section 22.2: Mining Harry Warries Section 22.3: Metallurgy Testing Noel O’Brien Section 22.4: Recovery Methods Noel O’Brien Section 23: Recommendations Keith Muller Section 23.1: Mineral Resource Shaun Searle Section 23.2: Mining Harry Warries Section 23.3: Metallurgy Testing / Recovery Methods Noel O’Brien Section 24: References Keith Muller Section 24.1: Geology Shaun Searle Section 24.2: Mining and Geotechnical Harry Warries Section 24.3: Metallurgical Testwork Noel O’Brien Section 25: Reliance on Information Provided by the Registrant All Mr Keith Muller is a mining engineer with a BEng in Mining Engineering and a MMinEng in Mine Management. He has over 20 years of experience in mine planning, mine operations and management and project evaluation for different commodities (Li, Au, Cu, REE). As a mining engineer, he has worked at pegmatite projects producing Lithium for 5 years and evaluated several lithium pegmatite projects. He is a Qualified Person as defined by Subpart 1300 of Regulation S-K promulgated by the Securities and Exchange Commission. Mr. Muller has acted as Chief Executive Officer for Atlantic Lithium during preparation of this report. Mr Lennard Kolff is a geologist with a Masters of Economic Geology, BSc (Hons, ARSM) in Geology and a graduate of the Australian Institute of Company Directors. He has over 25 years of grassroots and brownfields exploration and project studies for lithium, iron ore, copper-gold, base metals, gold, PGMs and diamonds, and mine geology experience for iron ore and copper-gold mineralised systems. Mr Kolff has over 7 years of direct lithium experience and was instrumental in the discovery and evaluation of the Ewoyaa lithium project. He has sufficient experience, relevant to the style of mineralisation and type of deposit under consideration and to the activity he is undertaking, to qualify as a Competent Person as defined in the ‘Australasian Code for Reporting of Exploration Results’ of December 2012 (“JORC Code”) as prepared by the Joint Ore Reserves Committee of the Australasian Institute of Mining and Metallurgy, the Australian Institute of Geoscientists and the Minerals Council of Australia. Mr Kolff is a member of the Australian Institute of Geoscientists, a member of the Society of Economic Geologists, an Associate of the Royal School of Mines, Imperial College London. Mr Kolff has acted in the position of Head Business Development and Chief Geologist in the preparation of this report. TECHNICAL REPORT SUMMARY EWOYAA LITHIUM PROJECT Page 62 of 368 Mr Noel O’Brien is a metallurgist with a BE in Metallurgical Engineering and an MBA. He is also a Fellow with the Australasian Institute of Mining and Metallurgy and managing director or Trinol Pty Ltd. Mr. O’Brien has extensive experience in working with processing of minerals including gold, base metals, ferroalloys and ores, lithium and diamonds. He has sufficient experience, relevant to the style of mineralisation and type of deposit under consideration and to the activity he is undertaking, to qualify as a Competent Person as defined in the ‘Australasian Code for Reporting of Mineral Resources and Ore Reserves’ of December 2012 (“JORC Code”) as prepared by the Joint Ore Reserves Committee of the Australasian Institute of Mining and Metallurgy, the Australian Institute of Geoscientists and the Minerals Council of Australia. He is a Qualified Person as defined by Subpart 1300 of Regulation S-K promulgated by the Securities and Exchange Commission. Mr Shaun Searle is a geologist with a BSc (Hons) in Applied Geology. He has 20 years of experience as a geologist in resource evaluation, mining and Mineral Resource estimation consulting for various commodities (lithium, graphite, iron ore, gold, nickel and base metals). Mr. Shaun Searle is a director of Ashmore Advisory Pty Ltd and a Registered Member of the Australian Institute of Geoscientists. Mr. Searle has sufficient experience that is relevant to the style of mineralisation and type of deposit under consideration and to the activity that he has undertaken to qualify as a Competent Person as defined in the ‘Australasian Code of Reporting of Mineral Resources and Ore Reserves’ of December 2012 (“JORC Code”) as prepared by the Joint Ore Reserves Committee of the Australian Institute of Mining and Metallurgy, the Australian Institute of Geoscientists and the Minerals Council of Australia. He is a Qualified Person as defined by Subpart 1300 of Regulation S-K promulgated by the Securities and Exchange Commission. Mr Harry Warries is a mining engineer with a MS Mining, he has over 30 years of experience in mine planning, mine operations, project evaluation and consulting, for different commodities (Li, Fe, Au, base metals, uranium, graphite). Mr Warries is a Fellow of the Australasian Institute of Mining and Metallurgy and an employee of Mining Focus Consultants Pty Ltd. He has sufficient experience, relevant to the style of mineralisation and type of deposit under consideration and to the activity he is undertaking, to qualify as a Competent Person as defined in the ‘Australasian Code for Reporting of Mineral Resources and Ore Reserves’ of December 2012 (“JORC Code”) as prepared by the Joint Ore Reserves Committee of the Australasian Institute of Mining and Metallurgy, the Australian Institute of Geoscientists and the Minerals Council of Australia. He is a Qualified Person as defined by Subpart 1300 of Regulation S-K promulgated by the Securities and Exchange Commission. The qualified persons responsible for the development of this TRS have visited the subject site as summarised below. Ashmore Advisory Pty Ltd (Ashmore): Ashmore Advisory Pty Ltd’s QP Shaun Searle visited the site during February 2019 to review exploration sites, drill core and work practices. Visual validation of mineralisation against assay results was undertaken for several holes. All drill hole data was imported into Surpac software version 2019 and data validation then completed. Sufficient data have been obtained through various exploration and sampling programs to support the geological interpretations at the Property. The data are of sufficient quantity and reliability to reasonably support the lithium resource estimates in this TRS. Mining Focus Consultants Pty Ltd (MFC): MFC Qualified Person, Harry Warries, visited site between 21 to 25 November 2022. Trinol Pty Ltd. (Trinol): Trinol Qualified Person, Noel O’Brien, visited site in November 2022, for general orientation, discussions of site layout and inspection of port facilities for export of concentrate. Atlantic Lithium Limited: Atlantic Qualified Persons Keith Muller and Len Kolff have conducted numerous site visits. TECHNICAL REPORT SUMMARY EWOYAA LITHIUM PROJECT Page 63 of 368 2.3 STUDY PARTICIPANTS AND RESPONSIBILITIES The following individuals and organisations have contributed to this document: TABLE 2-2 REPORT CONTRIBUTORS Area Contribution By Geology & Resources Atlantic Lithium Mineral Resources Ashmore Advisory Mine Geotechnical, Hydrology & Hydrogeology SRK Consulting Mine Engineering Mining Focus Consultants Pty Ltd Metallurgical Testwork Trinol Pty Ltd (supervision) and NAGROM (laboratory) Metallurgy Trinol Pty Ltd Site Geotechnical Geocrest & Associates, REC Engineering Tailings Storage Facility Geocrest & Associates, REC Engineering Water Storage Dam Geocrest & Associates, REC Engineering ESIA Study NEMAS Ghana Process Plant Engineering Primero Power Supply ECG Engineering Infrastructure Geocrest, REC Engineering, PPS/SRK, Atlantic Lithium Project Implementation Primero, Atlantic Lithium Operating Cost Primero, Atlantic Lithium, ACC Logistics, Bolloré Africa, Glen Falloch Consulting Capital Cost Primero, Atlantic Lithium, ECG, REC Engineering Risks and Opportunities Atlantic Lithium, Increva Financial Analysis Aspire Solutions 2.4 ABBREVIATIONS, ACRONYMS AND UNITS OF MEASURE 2.4.1 Units and Currency Unless stated otherwise Le Système International d'Unités (SI) units have been used throughout the reports. Some more commonly used non-metric units may have been retained for ease of understanding. Currencies used in the report are US in dollars, unless noted otherwise. Conversion rates from local or other currencies to US dollars used in cost estimates or financial analyses are reported in Section 18.0. 2.4.2 Abbreviations and Acronyms TABLE 2-3 ABBREVIATIONS, ACRONYMS AND UNITS OF MEASURE Abbreviation Description $ United States Dollars (unless otherwise noted) % Percentage TECHNICAL REPORT SUMMARY EWOYAA LITHIUM PROJECT Page 64 of 368 Abbreviation Description ~ Symbol for “Approximately” °C Degree Celsius µm Microns 3D Three Dimensional a Annum A Amperes AA Ashmore Advisory AEP Annual Exceedance Probability Ai Abrasion Index AIM Alternative Investment Market (London Stock Exchange) AISC All In Sustaining Cost ALL Atlantic Lithium ANCOLD Australian National Committee on Large Dams AS Australian Standard AS Australian Standard ASX Australian Stock Exchange Atlantic Atlantic Lithium PLC or Atlantic Lithium Limited Atlantic Lithium PLC Atlantic Lithium PLC or Atlantic Lithium Limited AUD Australian Dollars AUS Australia BBMWi Bond Ball Mill Work Index bcm, BCM Bank Cubic Metres BDV Barari Developments Limited Ghana (CS134902018 ) BOQ Bill Of Quantities CAPEX Capital Expenditure CBO Community Based Organisation

TECHNICAL REPORT SUMMARY EWOYAA LITHIUM PROJECT Page 65 of 368 Abbreviation Description CCLP Cape Coast Lithium Portfolio CCM Compacted Cubic Metre CCTV Closed Circuit Television CDF Community Development Fund CDP Community Development Plan CEPS Customs Excise and Preventive Service CFP Chance Find Procedure CHPS Community-based Health Planning and Services CIF Cost, Insurance and Freight CIT Corporate Income Tax CM Construction Management CMP Contractor Management Plan COG Cut-Off Grade CRM Certified Reference Materials Cwi Crushing Work Index DCF Discounted Cash Flow DCP Dynamic Cone Penetrometer DD Diamond Drill deg. Degrees DGPS Differential Global Positioning System DMIRS Department of Mines, Industry Regulation and Safety DMS Dense Media Separation dmt Dry Metric Tonne (i.e., exclusive of water content) DSIMS Dynamic Secondary Ion Mass Spectrometry DTM Decision to Mine EBITDA Earnings Before Interest, Tax, Depreciation and Amortisation TECHNICAL REPORT SUMMARY EWOYAA LITHIUM PROJECT Page 66 of 368 Abbreviation Description ECG ECG Engineering and Consultants Group Pty Ltd EIA Environmental Impact Assessment EIC Electrical, Instrumentation and Controls EIS Environmental Impact Statement ELP Ewoyaa Lithium Project ELP, "the Project" Ewoyaa Lithium Project EOI Expressions of Interest EP Equator Principles EPA Environmental Protection Agency EPCM Engineering, Procurement & Construction Management ERP Emergency Response Plan ESG Environmental and Social Governance ESHS Environment, Social, Health, and Safety ESIA Environmental and Social Impact Assessment EW East-West EWY Ewoyaa Excl Excluding FEED Front-End Engineering and Design FEL Front End Loader FeSi Ferrosilicon FIDIC International Federation of Consulting Engineers FIP Fire Indication Panel FOB Free On Board FS Feasibility Study FX Foreign Exchange G&A General and Administration TECHNICAL REPORT SUMMARY EWOYAA LITHIUM PROJECT Page 67 of 368 Abbreviation Description g/t Grams per Metric Tonne GBC George Boucher Consulting GBIF Global Biodiversity Information Facility GHCN Global Historical Climatology Network GHS Ghanaian Cedi GIIP Good International Industry Practice GISTM Global Industry Standard on Tailings Management GM General Manager GMR Green Metal Resources GOG Government of Ghana GPHA Ghana Port and Harbour Authority GPO General Purpose Outlet (power point) GRA Ghana Revenue Authority GRI Global Reporting Initiative GridCo Ghana Grid Company GSL Growth and Sustainability Levy Ha Hectares HAZID Hazard Identification HDPE High Density Polyethylene HLS Heavy Liquid Separation HQ 63.5mm Drill Core HR Human Resources HS&S Health, Safety & Security HSE Health, Safety and Environment HSECMG Health, Safety, Environment and Communities Management Guidelines HSECMS Health, Safety, Environment and Communities Management System TECHNICAL REPORT SUMMARY EWOYAA LITHIUM PROJECT Page 68 of 368 Abbreviation Description HV High Voltage IA Investment Agreement ICMM International Council on Mining & Metals ICP Inductively Coupled Plasma ID Identification IESC Independent Environmental and Social Consultant IFC Issued for Fabrication ILO International Labour Organisation Incl Including IRA Inter-ramp Slope Angle IRR Internal Rate of Return IT Information Technology IWL Integrated Waste Landform IWLTSF Integrated Waste Landform Tailings Storage Facility JHS Junior High School JORC Joint Ore Reserves Committee reporting standard JV Joint Venture kg Kilograms km Kilometres KNA Kriging Neighbourhood Analysis KSA Kinematic Stability Analyses kt Thousand metric tonnes kV Kilovolt kVA Kilo-Volt Amperes kWh Kilowatt hours LAN Local Area Network

TECHNICAL REPORT SUMMARY EWOYAA LITHIUM PROJECT Page 69 of 368 Abbreviation Description LCM Loose Cubic Metre LEA Limit Equilibrium Analysis Li Chemical Symbol for Lithium Li2O Chemical Symbol for Lithium Dioxide LLI Long Lead Items LOM Life of Mine LV Low Voltage m Metres MAR Market Abuse Regulation MCC Motor Control Centre MCRP Mine Closure and Rehabilitation Plan MEL Mechanical Equipment List MFC Mining Focus Consultants Pty Ltd mg/L Milligrams per Litre MIF Measured, Indicated and Inferred Mincom Minerals Commission of Ghana ML Mining License MLNR Ministry of Lands and Natural Resources Mm3 Millions of cubic metres MMF Monthly Management Fee MRE Mineral Resource Estimate MS Mass Spectrometry MSA Mine Services Area Mt Million metric tonnes Mtpa, Mt/y Million tonnes per annum MW Mega-Watts TECHNICAL REPORT SUMMARY EWOYAA LITHIUM PROJECT Page 70 of 368 Abbreviation Description NAF Non-Acid Forming Nagrom Nagrom the Mineral Processor (testwork laboratory) NAV Net Asset Value NE Northeast NHIL National Health Insurance levy NPAT Net profit After Tax NPI Non-Process Infrastructure NPV Net Present Value NS North-South NVTI National Vocational Training Institute NW Northwest ø Diameter OASL Office of the Administrator of Stool Lands OES Optical Emission Spectrometry OH&S, OHS Occupational Health & Safety OHL Overhead Line OK Ordinary Kriging OPEX, Opex Operational Expenditure Owner Atlantic Lithium Ltd including subsidiary companies P1 Material type 1 - characterised by coarse grained spodumene P2 Material type 2 - characterised by medium grained spodumene P80 Percentage passing 80% PAR Photosynthetically Active Radiation PAYE Pay-As-You-Earn PDC Process Design Criteria PFD Process Flow Diagram TECHNICAL REPORT SUMMARY EWOYAA LITHIUM PROJECT Page 71 of 368 Abbreviation Description PFS Pre-Feasibility Study PLL Piedmont Lithium Inc. PLT Point Load Tests POP Procurement Operating Plan PPE Personal Protective Equipment ppm Parts per Million PPV Peak Particle Velocity PQ 85.0mm Drill Core PRI Principles for Responsible Investment Project, "Ewoyaa" Ewoyaa Lithium Project, Ghana PSD Particle Size Distribution PVC Poly Vinyl Chloride QA Quality Assurance QAQC Quality Assurance Quality Control QC Quality Control RAP Resettlement Action Plan RC Reverse Circulation RCD RC with DD Tails RD Relative Density REC REC Resource Engineering Consultants RFQ Request For Quotation RL Relative Level RO Reverse Osmosis ROM Run of Mine RQD Rock Quality Designation RSA Republic of South Africa TECHNICAL REPORT SUMMARY EWOYAA LITHIUM PROJECT Page 72 of 368 Abbreviation Description RWD Return Water Dam SA South Africa SC6 Spodumene Concentration 6% Li2O SCADA Supervisory Control and Data Acquisition SCS Sediment Control Structure SDG Sustainable Development Goals SEM Scanning Electron Microscopy SEP Stakeholder Engagement Plan SG Specific Gravity SG or SGs Specific Gravity, Specific Gravities SMP Structural, Mechanical and Piping SMU Selective Mining Unit Spod Spodumene SRK SRK Consulting SSNIT Social Security and National Insurance Trust Surpac GEOVIA Surpac™ geology and mine planning software SWF Slotted With Flow SWMM Storm Water Management Model t Metric Tonne t/m3 Tonnes per Cubic Metre TDS Total Dissolved Solids TMP Transport Management Plan TOFR Top Of Fresh Rock ToR Terms of Reference TP Test Pit TSF Tailings Storage Facility

TECHNICAL REPORT SUMMARY EWOYAA LITHIUM PROJECT Page 73 of 368 Abbreviation Description UCF Undiscounted Cashflow UCS Unconfined Compressive Strength UHF Ultra-High Frequency UK United Kingdom UNEP United Nations Environment Programme UNGP UN Guiding Principles on Business and Human Rights UPS Uninterruptible Power Supply US United States USCS Unified Soil Classification System UST Unidirectional Solidification Texture V Volt VAT Value Added Tax VPSHR Voluntary Principles on Security and Human Rights VRA Volta River Authority VRPO VAT Relief Purchase Order VSD Variable Speed Drives w/w Weight Percentage as Fraction of Total Solution Weight W:O, w:o Waste to Ore mine stripping ratio WAN Wide Area Network WB World Bank WBS Work Breakdown Structure WHGMS Wet High Gradient Magnetic Separator WHIMS Wet High Intensity Magnetic Separator WHO World Health Organisation WHT Withholding Tax wmt Wet Metric Tonne (i.e., inclusive of water content) TECHNICAL REPORT SUMMARY EWOYAA LITHIUM PROJECT Page 74 of 368 Abbreviation Description WRD, WRD's Waste Rock Dump(s) WSD, WSF Water Storage Dam / Facility XLPE Cross-linked Polyethylene XRD X-Ray Diffraction XRT X-Ray Transmission y or yr Year(s) ZAR South African Rand 2.5 SCOPE OF WORK The scope of work for the study was to deliver an overall report summarising the associated technical scopes of work, CAPEX and OPEX estimates of ±15% accuracy, an economic assessment and risk assessment. The study considers the technical, engineering and cost elements of the project for the mine, concentrator and infrastructure facilities and was undertaken by the study contributors described in Section 2.1. The final report compiled by Primero. 2.6 UPDATES TO PREVIOUS TRS No previous Technical Report Summary (TRS) for the project has been submitted. TECHNICAL REPORT SUMMARY EWOYAA LITHIUM PROJECT Page 75 of 368 3.0 PROPERTY DESCRIPTION 3.1 LOCATION The Project area is immediately north of Saltpond in the Central Region of Ghana and falls within the Mfantseman Municipality where Saltpond is the district capital (Figure 3-1). The site is approximately 100 km southwest of the capital city of Accra. Site access is from the sealed N1 Accra-Cape Coast-Takoradi highway, which runs along the southern coastal boundary of the Project and links Accra and the deep- sea port of Takoradi approximately 110 km west of the site. Several unsealed roads extend northwards from the highway and link communities within the Project area. A new site access road will be developed to join existing roads and to the highway. FIGURE 3-1 EWOYAA LITHIUM PROJECT LOCATION TECHNICAL REPORT SUMMARY EWOYAA LITHIUM PROJECT Page 76 of 368 3.2 TITLES, CLAIMS OR LEASES ALL does not currently own or hold any titles or claims over the area in which mineral rights are currently granted. Section 3.3 outlines key legislative details and the ALL company structures pertaining to the mineral rights held. At the time of writing, the Company has been awarded a Mining lease to exploit the minerals in the licence area and are awaiting parliamentary ratification of this grant. For the properties hosting the MREs in this report, ALL or its subsidiaries will control 100% of the surface and mineral rights. The Competent/Qualified Persons have not carried out separate title verification for the property and neither company has verified leases, deeds, surveys, or other property control instruments pertinent to the subject resources. ALL has represented to its Competent/Qualified Persons that it controls the mining rights to the resources as shown on its property maps, and both Ashmore and MFC have accepted these as being a true and accurate depiction of the mineral rights controlled by ALL. The TRS assumes the Property is developed under responsible and experienced management. 3.3 MINERAL RIGHTS This section outlines key legislative details and the ALL company structure that pertains to the mineral rights held. 3.3.1 Legislation The key pieces of local legislation that exist that are particularly relevant to the Project are the Minerals and Mining Act, 2006, (Act 703) as amended and the Minerals and Mining Regulations passed under the Act. Together, these instruments regulate mine development and operation in Ghana. The Ministry of Lands and Natural Resources, and the Minerals Commission, are primarily responsible for the administration of mining activity in Ghana. The principal legal instruments relevant to the Project include the following: • Minerals and Mining Act, 2006, (Act 703) (as amended) by the Minerals and Mining (Amendment) Act, 2015 (Act 900) and the Minerals and Mining (Amendment) Act, 2019 (Act 995); • Minerals and Mining (General) Regulations, 2012, (L.I. 2173); • Minerals and Mining (Support Services) Regulations, 2012, (L.I. 2174); • Minerals and Mining (Compensation and Resettlement) Regulations, 2012, (L.I. 2175); • Minerals and Mining (Licensing) Regulations, 2012, (L.I. 2176); • Minerals and Mining (Explosives) Regulations, 2012, (L.I. 2177); • Minerals and Mining (Health, Safety and Technical) Regulations, 2012 (L.I. 2182); • Minerals and Mining (Ground Rent) Regulations, 2018, (L.I. 2357); • Minerals and Mining (Mineral Operations –Tracking of Earth Moving and Mining Equipment) Regulations, 2020, (L.I. 2404); • Minerals and Mining (Local Content and Local Participation) Regulations, 2020, (L.I. 2431); • Minerals Commission Act, 1993(Act 450); • Minerals Income Investment Fund, 2018 (Act 978) • Environmental Protection Agency Act, 1994 (Act 490); • Environmental Assessment Regulations, 1999 (L.I 1652) (“L.I. 1652”); and • 1992 Constitution of the Republic of Ghana. 3.3.2 Legal Framework The Government of Ghana has established regulators and government agencies to assist private investors in the mining sector. These structures include:

TECHNICAL REPORT SUMMARY EWOYAA LITHIUM PROJECT Page 77 of 368 • Ministry of Lands and Natural Resources (MLNR); • Minerals Commission (MinCom); • Environmental Protection Agency (EPA); • Ghana Revenue Authority; and • The Ghana Investment Promotion Centre. Mineral Rights The following types of mineral rights are available in Ghana: mining lease, prospecting licence and reconnaissance licence. Other variations of leases and licences include restricted reconnaissance licences, restricted prospecting licences and restricted mining leases for mining industrial minerals. For the purposes of this Feasibility Study, the focus will be on the mining lease held by Barari DV Ghana LTD (the “Operating Company”). Operating Companies are required to obtain a mining lease in order to exploit the minerals in the licence area. A holder of a reconnaissance licence or a prospecting licence may, prior to the expiration of the licence, apply for one (1) or more mining leases in respect of all or any of the minerals the subject of the licence and in respect of all or any one or more of the blocks which constitutes the licence area. A prospecting licence entitles the holder to prospect for specified minerals for periods of up to three (3) years over a concession which does not exceed seven hundred and fifty (750) contiguous blocks. A prospecting licence may be extended for up to three (3) years. Upon the extension of the prospecting licence, the holder of the licence is required to surrender not less than half the number of blocks of the prospecting area so long as, inter alia, a minimum of one hundred and twenty-five (125) blocks remain subject to the licence. Under the Minerals and Mining Act, 2006, (Act 703) as amended, the grant of a prospecting licence confers on the holder the right to carry on prospecting in the area covered by the mineral right. This would operate to preclude the grant of a mineral right for the same mineral to anyone other than the licence holder in the prospecting area. The holder of a prospecting licence must commence operations within three (3) months from the date of the issue of the licence, or such other time specified by the Minister. The holder of a prospecting licence may, at any time but not later than three (3) months before the expiration of the initial term of the licence, apply for an extension of the term of the prospecting licence for a further period of not more than three (3) years. Pursuant to regulation 6(1) of the Minerals and Mining - Health, Safety and Technical Regulations, 2012 (L.I. 2182), the holder of a prospecting licence is required to obtain an exploration operating permit from the Inspectorate Division of the Minerals Commission prior to commencement of any exploration operations. The exploration operating permits are renewable annually. Mining companies are required under the Environmental Protection Agency Act, 1994 (Act 490) to obtain an environmental permit from the EPA before commencing exploration and mining operations. An environmental permit is valid for eighteen (18) months, effective from the date of the issue of the permit. In accordance with regulation 22(1) of the Environmental Assessment Regulations, 1999 (L.I 1652). Where an undertaking in respect of which a preliminary environmental report or an environmental impact statement is approved, and the operation commences activities after obtaining an environmental permit, it is required to obtain an environmental certificate within twenty-four (24) months of the date of the commencement of operations. The Government of Ghana will be entitled to a ten percent (10%) royalty on revenue. Two additional private royalties of one percent (1%) on revenue with one capped at US$2m with all royalties payable once exploitation of the minerals begins. TECHNICAL REPORT SUMMARY EWOYAA LITHIUM PROJECT Page 78 of 368 Economic, Financial and Fiscal Conditions The Ghana Revenue Authority implements a comprehensive taxation regime including with respect to the legislation below. Further detail is provided in Section 3.3.5. • Minerals and Mining Act, 2006, (Act 703) as amended; • Income Tax Act, 2015 (Act 896) as amended and its related regulations (L.I.2244); • Customs Act, 2015 (Act 891) as amended; • Value Added Tax Act, 2013 (Act 870), as amended and its related regulations (L.I.2243); • National Health Insurance Levy Act, 2012 (Act 852) as amended; • Ghana Education Trust Fund Levy Act, 2000 (Act 581) as amended; • COVID-19 Health Recovery Levy Act, 2021 (Act 1068); • Stamp Duty Act, 2005, Act (Act 689); • Ghana Revenue Authority Practice Notes on Withholding Tax under the Income Tax Act, 2015 (Act 896) DT/2016/001, 6th October 2016; • Growth and Sustainability Levy Act, 2023 (Act 1095); and • Revenue Administration Act, 2016 (Act 915) as amended. 3.3.3 Owner and Operator The Operating Company which holds the mineral right is a Ghanaian incorporated subsidiary with its registered office in Ghana. 3.3.4 Corporate Structure Figure 3-2 depicts the inter-corporate relationships amongst ALL and its subsidiaries, including a summary of tenement holdings. The Operating Company is ninety percent (90%) owned by IronRidge Resources Singapore Pte Ltd. IronRidge Resources Singapore Pte Ltd in turn is hundred percent (100%) owned by ALL. FIGURE 3-2 ALL CORPORATE STRUCTURE The Corporate Structure including identifying numbers are summarised in Table 3-1. Atlantic Lithium Limited IronRidge Resources Singapore Pte Ltd Barari DV Ghana Ltd Green Metals Resources Limited Charger Minerals Singapore Pte Ltd Joy Transporters Ltd Moda Minerals Singapore Pte Ltd Moda Minerals Ltd TECHNICAL REPORT SUMMARY EWOYAA LITHIUM PROJECT Page 79 of 368 TABLE 3-1 CORPORATE STRUCTURE AND IDENTIFIERS TABLE 3-2 ELP MINERAL RIGHTS Number Tenement name Size (km2) Minerals Holder Date of grant Renewal date Expiry date Term ML3/239 Barari ML 42.63 Lithium, Feldspar, other minerals Barari DV Ghana Ltd 20 Oct 2023 N/A 19 Oct 2038 15 yrs The Large-Scale Mining Lease Concession was granted on 20 October 2023 and has an area of 42.63 km2. The subsidiary companies and related tenement / mineral right for the FS is summarised in Table 3-3. TABLE 3-3 SUBSIDIARY COMPANIES PROPERTY RIGHTS Subsidiary Identifying Number Incorporated Location and Date Percentage Holding Activity IronRidge Resources Singapore Pte Ltd UEN 201829622K Incorporated in Singapore on 29 August 2018 Atlantic Lithium Limited owns 100% Holder of shares in Barari DV Ghana Ltd and Green Metals Resources Ltd Green Metals Resources Limited CS080712016 Incorporated in Ghana on 10 May 2016 IronRidge Resources Singapore Pte Ltd owns 100% Owns assets being the tenements / mineral rights #PL3/109 Barari DV Ghana Ltd CS134902018 Incorporated in Ghana on 27 April 2011 IronRidge Resources Singapore Pte Ltd owns 90% Owns assets being the tenements / mineral rights #ML3/239 3.3.5 Tax Regulation This section summarises the taxes, royalties, fees, charges, etc. applicable to the ELP in accordance with Ghanaian legislation as listed in Section 3.3.1. These elements have been accounted for in the Financial Analysis (Section 19.0). Subsidiary Identifying Number Incorporated Location and Date Percentage Holding Activity IronRidge Resources Singapore Pte Ltd UEN 201829622K Incorporated in Singapore on 29 August 2018 Atlantic Lithium Limited owns 100% Holder of 90% of the shares in Barari DV Ghana Ltd and 100% of the shares in Green Metals Resources Ltd Barari DV Ghana Ltd CS134902018 Incorporated in Ghana on 27 April 2011 IronRidge Resources Singapore Pte Ltd owns 90% Owns assets being the tenements / mineral rights #ML3/239 TECHNICAL REPORT SUMMARY EWOYAA LITHIUM PROJECT Page 80 of 368 General Tax Regime Mining companies are required to pay Corporate Income Tax (“CIT”) of thirty-five percent (35%). Companies are permitted deductions of outgoings incurred wholly, exclusively, and necessarily to produce income. These outgoings include: • A minimum chargeable income of five percent (5%) of turnover where the business has been declaring losses for the previous five years of assessment. This does not apply to a person within the first five (5) years of commencement of operations and farming business. Tax paid under the minimum chargeable income will not be a tax-deductible expense; • Royalties paid to the government; • Interest expenses incurred on borrowing used to produce income (subject to the thin-capitalisation rules discussed below); • Capital allowances on depreciable assets used for the mineral operation; • Foreign exchange losses on discharge of a debt claim or obligation or foreign currency holding (foreign exchange losses of a capital nature are not deductible, unrealised foreign exchange loss shall not be allowed as a deduction; and foreign exchange loss arising from a transaction between two resident persons shall not be deductible); • Repair of plant, machinery, premises or fixtures employed to produce income provided the amount do not exceed five percent (5%) of net book value of the related asset; • Health and safety costs; • Costs incurred for the training of Ghanaians; • Contributions and other expenses incurred in respect of approved rehabilitation fund; • Rent incurred on property used to produce income; and • Costs incurred for the purposes of reclamation, rehabilitation, and closure of mine site. Tax losses can be carried forward for five (5) years. Exploration companies can carry forward its losses for five (5) years or less and use these losses when it is formally confirmed as commercial mining operation. Property Plant and Equipment and Development Costs Depreciation of depreciable assets of a business is not a permissible deduction in deriving taxable profits. In its stead, capital allowance is granted at a flat rate of twenty percent (20%) on the cost base of a qualifying depreciable mining asset. Costs are to be capitalised as part of a separate mineral operation before the commencement of commercial production for the purpose of claiming capital allowance. Exploration companies capitalise its exploration and development expenditure and claim capital allowance thereon when it commences mining operations. Mining Fees and Charges The annual mineral right fee is charged per cadastral unit as summarised in

TECHNICAL REPORT SUMMARY EWOYAA LITHIUM PROJECT Page 81 of 368 Table 3-4. Ground rent is payable annually in respect of a cadastral unit of land as summarised below: • Exploration or mining rights with respect to mining lease and restricted mining lease – GHS778.38 per cadastral unit; • Exploration or mining rights with respect to Small Scale mining Licence – GHS31.50 per cadastral unit; and • Exploration right with respect to Reconnaissance Licence, Restricted Reconnaissance Licence, Prospecting Licence and Restricted Prospecting Licence – GHS6.75 per cadastral unit. Royalties are payable at a rate of five percent (5%) on the total revenue earned from minerals obtained at ELP. TECHNICAL REPORT SUMMARY EWOYAA LITHIUM PROJECT Page 82 of 368 TABLE 3-4 ANNUAL MINERAL RIGHTS FEES Mineral Right Year 1 Year 2 Reconnaissance Licence US$16 US$20 Year 1 - 3 Year 4 – 6 Year 7 - 9 Prospecting Licence US$32 US$50 US$70 Year 1 - 2 Year 3 – 30 Mining Lease US$700 US$1,000 Value Added Tax (VAT) Construction Purchases and Import Duties The Mining List provides a list of mining machinery, equipment and consumables agreed upon by the Minerals Commission, Ghana Revenue Authority, Value Added Tax Service and the Ghana Chamber of Mines to be exempted or charged concessionary rate for customs import duties and value added tax. Mining companies can also apply to the Ministry of Finance for further exemptions from payment of import duty in respect of plant, machinery, equipment and accessories imported specifically and exclusively for the mining operation. At the time of writing, ALL had commenced the process required for making this application. An Import Duty exemption application letter is required for submission to Ministry of Finance for approval to be exempted for payment of duties on importation of mining machinery and equipment. VAT and Levies on Sales and Purchase Once in Operation Domestic sales of precious metals are subject to fifteen percent (15%) Value Added Tax (VAT), two-point five percent (2.5%) National Health Insurance Levy (NHIL), two-point five percent (2.5%) Ghana Education Trust Fund Levy and one percent (1.0%) COVID-19 Health Recovery Levy. The VAT rate of fifteen percent (15%) is expressed on the value of the item plus the levies. The export of precious minerals attracts VAT and levies at zero percent. Where the Operating Company receives imported services such as management services, the Operating Company will be required to self-assess their VAT on the gross value of the services received and pay the VAT to the GRA within twenty-one (21) days after the period in which the services were imported. Following the month of payment, the Operating Company will be entitled to a credit for the VAT paid. The Operating Company will be entitled to claim VAT incurred on imports and local purchases if they are incurred wholly, exclusively and necessarily for the furtherance of its business. The Operating Company is not entitled to input VAT deduction in the following cases: • Input VAT on purchases or imports in respect of exempt supplies; • Input VAT on vehicles (other than motor cars) and spare parts purchased or imported; • Input VAT on motor cars except where the motor car is used wholly, exclusively and necessarily for the business; • Input VAT on entertainment (restaurant, meals, hotel expenses, etc.); and • Input VAT not supported by an original VAT Invoice unless the Commissioner-General confirms that the input tax claim is correct and is satisfied that the Operating Company has taken all reasonable steps to acquire the tax invoice and the failure to acquire was not the fault of the Operating Company. VAT Credit / Refunds TECHNICAL REPORT SUMMARY EWOYAA LITHIUM PROJECT Page 83 of 368 As an exporter, the Operating Company can apply for a refund of the excess tax. An application for a refund must be supported with the completed refund or credit forms (VAT Form 35) and the relevant tax invoices. Typically, refunds are preceded by tax verification to confirm the VAT credit. In view of the fact that the suppliers of the Operating Company will attract VAT and levies at zero percent (0%), it is expected that the Operating Company will receive VAT credits. To help prevent the Operating Company from locking its capital in VAT refunds, the Operating Company can apply to the Commissioner-General to be granted use of the VAT Relief Purchase Order (VRPO). VRPO is used by many Ghana mining companies with a mining lease to procure goods and services without payment of VAT and levies. VAT and Levies on Sales and Purchase Before Operation VAT and levies incurred prior to the commencement of production is capitalised as part of the exploration and development costs and as such will represent a capital cost to the Operating Company. Capital allowance is claimable on the VAT and levies inclusive of capitalised cost. Electronic Transfer Levy The Electronic Transfer Levy Act, 2022 (Act 1075) imposes a one percent (1%) tax on electronic transfers such as bank transfers on an instant pay digital platform or application originating from a bank account belonging to the Operating Company. Growth and Sustainability Levy (GSL) Act, 2023 (ACT 1095) The Growth and Sustainability Levy imposes a tax of one percent (1%) on gross production of mining companies. The levy is payable quarterly and due on 31 March, 30 June, 30 September and 31 December annually. The levy is not an allowable deduction under the Income Tax Act, 2015. It is expected to be in force for the 2023 to 2025 years of assessment. Withholding Tax (WHT) A company is required to withhold tax from payments to resident and non-resident persons for the supply of goods, works and services unless those payments are exempt from withholding taxes. The applicable withholding rates are as follows: The withholding tax on Resident persons is: • Supply of goods - 3% • Supply of works - 5% • Supply of services - 7.5% The withholding tax on non-resident persons is: • Withholding tax rate applicable for payment to non-resident persons is twenty percent (20%). The withholding tax applies whether or not the non-resident persons carried out the services outside Ghana. • The rates may, however, be reduced by a Double Tax Treaty entered into with Ghana with other contracting states as listed in Table 3-5. TABLE 3-5 GHANIAN DOUBLE TAXATION AGREEMENTS Countries Belgium Italy South Africa Denmark Mauritius Switzerland France Netherlands United Kingdom TECHNICAL REPORT SUMMARY EWOYAA LITHIUM PROJECT Page 84 of 368 Germany Singapore Taxes on Dividends Dividends paid to both non-resident and resident entities attract a final withholding tax of eight percent (8%). This means that the taxpayer will not be liable to any further taxes on the same income after incurring the eight percent (8%) withholding tax. Tax on Realisation of Assets and Liabilities A person who realises an asset or liability shall, within thirty (30) days, file a return to the Commissioner-General. A resident person that pays consideration to another person with respect to the realisation of an asset or liability (which does not fall under withholding tax on investment returns) must withhold at the rate of three percent (3%) where a recipient is a resident person or ten percent (10%) where the recipient is a non-resident. Employment Taxes The remuneration paid to the employees of the Operating Company (both expatriate and local staff) for exercising their employment in Ghana is subject to tax in Ghana. In addition, any benefits in kind provided to employees for their employment relationship with the Operating Company is also subject to tax in Ghana. The tax rate applicable to the income derived by the employees depends on their tax residency status. Generally, an individual is considered resident in Ghana if present in Ghana for at least one hundred and eighty-three (183) days in a given year. Thus, for non-resident employees i.e., employees who are present in Ghana for less than one hundred and eighty-three (183) days in any twelve-month period, their income earned in Ghana will be subject to twenty percent (20%) final withholding tax. Resident employees will be subject to tax using the graduated Pay-As-You-Earn (PAYE) rates. The highest bracket attracts a thirty-five percent (35%) tax. Pension Companies are required to be registered with the Social Security and National Insurance Trust (SSNIT). Requisite details of all persons in the employment of a company are required to be registered with SSNIT and approved Trustees for a privately managed pension scheme for payment of monthly contributions of employees to the mandatory occupational pension scheme. Rehabilitation Funds Mining companies are eligible for upfront deductions to rehabilitation payments into an approved rehabilitation fund. The EPA requires mining companies that have been granted mining leases to provide security for any default on reclamation or rehabilitation of disturbed land. The security is commonly provided by way of a reclamation bond in the form of a performance bond, mining bond or rehabilitation bond or funds set aside in a reputable bank. The terms of such security are agreed upon between the EPA and the Operating Company under the terms of a reclamation security agreement. In accordance with an environmental permit, the reclamation bond must be established prior to commencing mining operations. 3.4 ENCUMBRANCES All held tenements are in good standing with no known impediments. 3.5 OTHER RISKS There is always risk involved in property control. ALL has had its legal teams examine the deeds and title control in order to minimise the risk.

TECHNICAL REPORT SUMMARY EWOYAA LITHIUM PROJECT Page 85 of 368 4.0 ACCESSIBILITY, CLIMATE, LOCAL RESOURCES, INFRASTRUCTURE AND PHYSIOGRAPHY 4.1 TOPOGRAPHY, ELEVATION, AND VEGETATION The topography of the Project area varies with steep hills surrounding low-lying valleys throughout the proposed mining area. The terrain of the Project area rises sharply from a narrow coastal plane to an undulating peneplane where elevation ranges from 20 m to 120 m above mean sea level. 4.2 ACCESS AND TRANSPORT The Project area is immediately north of Saltpond in the Central Region of Ghana and falls within the Mfantseman Municipality where Saltpond is the district capital. FIGURE 4-1 PROJECT LOCATION The site is approximately 100 km southwest of the capital city of Accra. Site access is from the sealed N1 Accra-Cape Coast-Takoradi highway, which runs along the southern coastal boundary of the Project and links Accra and the deep- sea port of Takoradi approximately 110 km west of the site. Several unsealed roads extend northwards from the highway and link communities within the Project area. A new site access road will be developed to join existing roads and to the highway. TECHNICAL REPORT SUMMARY EWOYAA LITHIUM PROJECT Page 86 of 368 4.3 POPULATION AND ECONOMY The project area is in Mfantseman Municipality, which falls under the local governance of the Mfantseman Municipal Assembly which also falls under the Central Regional Coordinating Council. The Municipality has a projected population of 176,288 representing 6.6% of the Central Region. Mfantseman is largely an agrarian economy with 27% of the economically active population employed in mainstream agriculture. Industrial activity occurs in the various market centres at Anomabo, Biriwa, and Yamoransa, with Mankessim as the commercial hub. The three major industries of employment in the municipality include agriculture/forestry/fishing (37%), wholesale/retail trade/auto repairs (23.7%) and manufacturing (8.4%). 4.4 CLIMATE AND LENGTH OF OPERATING SEASON The climate around Cape Coast is typical of the dry equatorial region of Ghana, characterised by an average temperature of 24°C and relative humidity of 70%. There are double rainfall peaks with a pronounced rainfall increase during May-June and a lesser rainfall peak sometimes occurring around September-October. Mean annual rainfall ranges from 730 mm to 1,230 mm along the coast and up to 1,600 mm inland, and dry seasons extend from December to February and from July to September. It is anticipated that year-round mining is achieved based on the experience of the gold mining sector in the north of the country. Exploration activities were largely year-round but can be interrupted by short-term rainfall events. To ensure access during the wet season, well-formed and drained roads will need to be constructed. 4.5 INFRASTRUCTURE The existing, sealed N1 Accra-Cape Coast-Takoradi highway provides access to Accra and the Takoradi port. A new access road will be built to the facility from existing road infrastructure. Several HV powerlines traverse or run near to the project site, facilitating connection to the existing power grid and access to existing power supply. Relocation of some HV powerlines within planned mining areas will be required and forms part of the project scope. No water supply for the operation currently exists but will be sourced from a combination of pit dewatering, site water capture and pumped supply from a nearby reservoir for makeup water. Connection to existing communications infrastructure for internet and telephony will also be possible. Existing port facilities are available at Takoradi approximately 110 km west of the site and at Tema, 25 km east of Accra for project construction and operations logistics requirements. The nearest international airports are the Kotoka International Airport in Accra and Sekondi-Takoradi Airport Port in Takoradi; thus, no site airstrip will be required. TECHNICAL REPORT SUMMARY EWOYAA LITHIUM PROJECT Page 87 of 368 5.0 HISTORY 5.1 PREVIOUS LITHIUM MINING IN THE REGION No previous mining of pegmatites is known in the area of interest of the Company’s mineral rights. 5.2 PREVIOUS EXPLORATION Historical trenching and mapping were completed by the Ghana Geological survey during the 1960’s. But for some poorly referenced historical maps, none of the technical data from this work was located. Many of the historical trenches were located in the field, cleaned and re-logged. No historical drilling was completed at the Ewoyaa project, but for some historical Geological Survey archive reports and referenced bulk sampling results from trenching, none of the surface plan data or precise locational data from this work was located. TECHNICAL REPORT SUMMARY EWOYAA LITHIUM PROJECT Page 88 of 368 6.0 GEOLOGICAL SETTINGS, MINERALISATION AND DEPOSIT 6.1 REGIONAL, LOCAL AND PROPERTY GEOLOGY 6.1.1 Regional Geology The regional geology of western Ghana is characterised by a thick sequence of steeply dipping metasediments, alternating with metavolcanic units of Proterozoic age (2.2-2.3 Ga). These sequences, belonging to the Birimian Supergroup, extend for approximately 200 km along strike in a number of parallel north-easterly trending volcano- plutonic belts and volcano-sedimentary basins, of which the Kibi-Winneba Belt and the Cape Coast Basin extend through the region around the Mankessim licence area. The rocks of the “Volcanic Belts” are diverse, however, most are dominantly made up of low-grade metamorphic tholeiitic basalt intercalated with volcaniclastics as well as andesitic and felsic flow rocks with local development of chemical sediments. Volcanic rocks in most of these belts are intruded by coeval, co-magmatic, synvolcanic tonalite- trondhjemite-granodiorite granitoid plutons (mainly tonalite and granodiorite). Rocks of the “Sedimentary Basins” are typically low-grade metamorphosed, tightly to isoclinally folded sediments comprising volcaniclastics, volcaniclastic wackes and argillite. The rocks of the volcano-plutonic belts and the volcano-sedimentary basins appear to represent partly contemporaneous lateral facies equivalents, as most of the sediments appear to be derived from the adjacent volcanic belts. Starting sometime between 2120 Ma and 2115 Ma, the whole region is affected by crustal shortening and associated regional metamorphism associated with the Eburnean tectono-thermal event. This orogeny is responsible for the folding and metamorphism of the Paleoproterozoic rocks and at the same time the development of high-strain zones along the Birimian belt/basin boundaries. At this time the Birimian basins were preferentially intruded by extensive, late and syn-kinematic, frequently peraluminous granitoids (locally some volcano-plutonic belts were also intruded) of the Eburnean Plutonic Suite. These plutonic rocks exhibit crystallisation ages between 2116 Ma and 2088 Ma, and probably originated from the partial melting of the Birimian basin sediments. The last manifestation of the Eburnean plutonism is the pegmatite veining which has been dated to 2072 Ma. The Eburnean Cape Coast Granitoid pluton is extensive and is the dominant geological feature of this region and is typically an undifferentiated biotite granitoid. The pluton extends for 80 km to the west and north of the project area, and the Eburnean pegmatite exploration targets appear spatially associated with a portion of the pluton’s margin (Figure 6-1). A number of northerly and east-northeast trending mafic dykes (dolerite) cut through the sequence. These dykes are probably of Mesozoic age and appear related to offshore transform structures related to the breakup of Gondwana and the formation of the Atlantic Ocean.

TECHNICAL REPORT SUMMARY EWOYAA LITHIUM PROJECT Page 89 of 368 1 Geological map is from 1:1,000,000 m scale Ghana Geological Survey, 2009 FIGURE 6-1 REGIONAL GEOLOGY MAP SHOWING THE POSITION OF THE MANKESSIM LICENCE AREA EDGED IN RED 6.1.2 Local Geology Outcrop in the local area is extremely sparse and much of the geological interpretation is based on lithologies encountered where excavations (roadcuts, exploration pitting and trenching) have been made through the alluvial and lateritic cover in deeply weathered material. Any outcrop or float is invariably of more durable granitic lithologies and not of the Birimian metasediments. In general, the licence area is largely underlain by rocks of the Birimian Supergroup, dominated by volcano-sedimentary lithologies of the Cape Coast Basin, situated on the southeast margin of the extensive Cape Coast Granitoid (Figure 6-1). Three forms of schist are developed in the area; mica schist, staurolite schist and garnet schist, all of which are a blue-grey colour when fresh weathering to a brown colour. All the schist appears to be quartz-biotite rich and are well foliated. The staurolite occurs as 2 mm to 20 mm porphyroblasts, while the garnets are generally small 0.5-2 mm and could be almandine or possibly at times spessartine within the quartz- mica schist. Several, presumably Eburnean aged, granitoids intrude the basin metasediments as small bosses and plugs. These granitoids range in composition from intermediate granodiorite (often medium grained) to felsic leucogranites (coarse to pegmatoidal grainsize), both sometimes in close association with pegmatite veins and bodies. Several roughly N-S trending dolerite dykes cut through the Birimian schist and the later granitic and pegmatite intrusions and are presumably of Miocene age. The dolerite dykes are some 5-30 m wide and are easily mapped using the airborne magnetic data, and also outcrop in places as rounded float and boulders. A single dolerite dyke cuts TECHNICAL REPORT SUMMARY EWOYAA LITHIUM PROJECT Page 90 of 368 through the Abonko area, skirting the east side of the aggregate quarry. In the extreme west of the tenement area a number of subparallel dolerite dykes extend from the coast northwards through and past the large Afrangwa granitic boss. This “N-S trending structural corridor” of parallel dolerite dykes appears to host roughly N-S trending elongate granitic intrusive bodies and pegmatites as well as the dolerite dykes. Within the mineralised Ewoyaa Lithium Project (‘ELP’) pegmatites, there are broadly two dominant pegmatite trends which have been observed; the roughly N-S en-echelon pegmatite array of the “Ewoyaa trend” and the roughly WNW- ESE intrusive swarm arrays of the “Abonko trend”(Figure 6-5 and Figure 6-6). It is not clearly understood what the dominant controls on pegmatite orientation are, however, mapping and regional structural interpretation completed by the Ghana Geological Survey (Hughes & Farrant, 1963) provides some likely structural controls on pegmatite orientation. Regional structural interpretation completed by Hughes & Farrant has been digitised and projected to fit the Ghana coastline as best possible, with all currently known pegmatites and granite bosses superimposed (Figure 6-3). FIGURE 6-2 INTERPRETED GEOLOGY OF THE MANKESSIM & MANKESSIM SOUTH PL AREAS TECHNICAL REPORT SUMMARY EWOYAA LITHIUM PROJECT Page 91 of 368 FIGURE 6-3 EXTRACT OF REGIONAL STRUCTURAL INTERPRETATION BY GHANA GEOLOGICAL SURVEY (HUGHES & FARRANT, 1963) SUPERIMPOSED OVER CURRENTLY KNOWN PEGMATITES IN THE IMMEDIATE ELP AREA The Abonko trend pegmatites appear to be emplaced along NW-SE orientated faults which show offsets within the Amisian coastal sediments. The Ewoyaa trend pegmatites however appear to be emplaced along N-S accommodation faults occurring in-between the NW-SE trending faults immediately within the Ewoyaa lithium project area. Both structural settings represent lines of weakness for the pegmatites to exploit, whilst the N-S faults provide a better dilational setting for the en-echelon Ewoyaa pegmatites to propagate along. TECHNICAL REPORT SUMMARY EWOYAA LITHIUM PROJECT Page 92 of 368 FIGURE 6-4 DEPOSIT AND PROSPECT NAMES AT THE EWOYAA LITHIUM PROJECT

TECHNICAL REPORT SUMMARY EWOYAA LITHIUM PROJECT Page 93 of 368 6.1.3 Deposit Geology and Mineralisation The mineralised pegmatite intrusions generally occur as sub-vertical bodies with two dominant trends as briefly outlined earlier: either striking north-northeast (Ewoyaa Main) and dipping sub-vertically to moderately southeast to east-southeast, or striking west-northwest to east-west (Abonko, Kaampakrom, Anokyi, Okwesi, Grasscutter and Ewoyaa NE) dipping sub-vertically to moderately northeast or north. Pegmatite thickness varies across the project, with thinner mineralised units intersected at Abonko and Kaampakrom between 4 m and 12 m; and thicker units intersected at Ewoyaa Main between 30 m and 60 m, and up to 100 m at surface (Figure 6-5 and Figure 6-6). The project has two clearly defined geometallurgical domains or material types of spodumene bearing lithium mineralisation. Atlantic have termed these material types as Pegmatite Type (“P1”) and Pegmatite Type (“P2”): • P1: Coarse grained spodumene material (>20 mm), the dominant spodumene bearing pegmatite encountered to date, exhibiting very coarse to pegmatoidal, euhedral to subhedral spodumene crystals composing 20 to 40% of the rock (Figure 6-7). • P2: Medium to fine grained spodumene material (<20 mm), where abundant spodumene crystals of a medium crystal size dominates. The spodumene is euhedral to subhedral and can compose up to 50% of the rock. The spodumene can be bimodal with some larger phenocrysts entrained within the medium grained spodumene bearing matrix (Figure 6-8). There are indications of very minor occurrences of other lithium bearing phases present. There are therefore four main geometallurgical domains; coarse grained type P1 and finer grained type P2 pegmatites and their weathered equivalents. It is noted that metallurgical recoveries differ between the four material types, which is discussed later in this report. The vast majority of the finer grained spodumene P2 ore is found within the Ewoyaa Main pegmatite bodies and preferentially occurring towards the footwall contact of the Ewoyaa Main pegmatites, but with some exceptions. Any finer grained spodumene P2 pegmatite material occurring in the Abonko trending pegmatite bodies are generally rare and of limited extent. FIGURE 6-5 ABONKO TREND TECHNICAL REPORT SUMMARY EWOYAA LITHIUM PROJECT Page 94 of 368 FIGURE 6-6 EWOYAA TREND TECHNICAL REPORT SUMMARY EWOYAA LITHIUM PROJECT Page 95 of 368 FIGURE 6-7 TYPICAL P1 COARSE GRAINED SPODUMENE (>20MM ACROSS) IN PEGMATITE IN WHOLE AND CUT CORE TECHNICAL REPORT SUMMARY EWOYAA LITHIUM PROJECT Page 96 of 368 FIGURE 6-8 TYPICAL P2 FINER GRAINED SPODUMENE (<20MM ACROSS) IN PEGMATITE CORE 6.2 WEATHERING AND OXIDATION This region of West Africa has been subjected to prolonged tropical weathering, which is an important process in stripping lithium from spodumene mineralisation in the pegmatite at or near surface. The vertical extent of oxidation due to surface weathering ranges from near surface, where some relatively rare almost fresh outcrops are exposed, to complete oxidation approaching depths of 25 m. Generally, however, the depth of complete oxidation ranges from 5- 15 m and the depth to fresh rock ranges from 5 m up to 50 m in the most extreme localised cases. Within strongly weathered and saprolitic material the identification of spodumene in pegmatite is extremely difficult, with the mineral decomposing completely outside a thin less weathered transitional envelope very close to the fresh rock contact. This physical leaching of the spodumene crystals is accompanied by near complete chemical leaching of the weathered mineral of Lithium in assay results. 6.3 STRUCTURE AND ALTERATION The pegmatite intrusions at Ewoyaa commonly trend either north-northeast (Ewoyaa Main, Ewoyaa North, Ewoyaa West, Ewoyaa South) or northwest (Ewoyaa NW, Dogleg) and dip sub-vertically to moderately southeast to northeast. The overall strike continuity of the combined pegmatite bodies is in excess of 2 km. At the Abonko, Ewoyaa NE, Anokyi, Okwesi and Kaampakrom prospects, the pegmatite intrusions predominantly trend east-west, and are sub-vertical or dip steeply to the northeast. The Abonko NW pegmatite is notable in that it dips relatively shallowly at 40-45° to the northeast, as does a portion of the Ewoyaa NW pegmatite called Ewoyaa Sill. The other exception to the subvertical attitude is the Kaampakrom West pegmatite which strikes northeast-southwest and dips at a relatively shallow angle of +/-45° to the northwest. The large pegmatites of Ewoyaa South I and Ewoyaa South II appear to follow the apparent boundary of the mapped granitoid outcrops in a curved, or stepped manner – raising the question as to whether the pegmatites are intruding in places of competency contrasts or pressure shadows between the granite stock and the surrounding schist, or whether this is a function of proximity due to a genetic relationship.

TECHNICAL REPORT SUMMARY EWOYAA LITHIUM PROJECT Page 97 of 368 The surface widths of the pegmatite veins, including lenses of schist and granite interburden, range from 1 to 150 m based on the results of the trenching. This variability is also observed in drilling, with true widths ranging from less than 1 m to approximately 100 m. In the more continuous sections of the Ewoyaa Main (north of 579,000 m N), the pegmatite thickness is typically 30 to 60 m. Folding is observed in outcrop of the encompassing schist. Folding has not been clearly identified in the pegmatite, however float samples of pegmatite veins in the form of fold hinges have been observed, although this maybe a result of the intrusions mimicking their emplacement void rather than any subsequent deformation. Narrow structurally controlled lithia grade destructive alteration of the pegmatite was originally observed in the RC drilling and has been confirmed by the diamond drilling, where narrow conduit structures are associated with K- feldspar and secondary muscovite alteration envelopes and in some cases later chlorite alteration. This potassic alteration observed in the diamond drilling is associated with one or more narrow fractures or shear zones which are often orientated sub parallel to core axis and exhibit a broader outer K-feldspar alteration envelope often pink coloured, and in many cases an inner narrow secondary muscovite alteration immediately adjacent the conduit structure. The secondary muscovite alteration is invariably intense and texture destructive and results in total replacement of any spodumene and the loss of lithia grade, while the K-feldspar flooding can leave spodumene relatively unaffected where alteration is less intense but also associated with lower lithia assays when more intense (Figure 6-9). The same alteration fluid conduit structures are in many cases the focus of a later Fe-Mg rich fluid responsible for a chloritic alteration where, depending on intensity, the chlorite completely or partially replaces any spodumene crystals, and again results in lithia grade destruction. Spodumene is totally or partially altered to chlorite proximal to the source structure, with varying intensity of chlorite alteration observed along spodumene crystal rims and cleavage/fracture planes (Figure 6-10). This chlorite alteration appears to be a later event overprinting the earlier K-feldspar and secondary muscovite alteration. TECHNICAL REPORT SUMMARY EWOYAA LITHIUM PROJECT Page 98 of 368 FIGURE 6-9 K-FELDSPAR AND SECONDARY MUSCOVITE ALTERATION OF P1 SPODUMENE PEGMATITE FROM EWOYAA MAIN. INTENSE CHLORITE ALTERATION PROXIMAL TO SOME FRACTURES TECHNICAL REPORT SUMMARY EWOYAA LITHIUM PROJECT Page 99 of 368 FIGURE 6-10 SPODUMENE CRYSTAL EXHIBITING CHLORITE ALTERATION ALONG ITS PERIMETER AND ALONG CLEAVAGE AND FRACTURE PLANES 6.4 MINERALISATION The mineralisation at Ewoyaa has been confirmed to be associated with spodumene bearing pegmatite as the main lithium bearing mineral. No petalite or lepidolite have been observed inresource RC and diamond core drill logging. The pegmatites are predominantly quartz-albite-muscovite +/- microcline and spodumene in composition with accessory blue-green apatite, and less common colourless to light blue beryl, barite and secondary Fe-Mn-Li bearing phosphates largely. The muscovite is typically silvery with slight yellowish/greenish shades with mica books up to 10 cm by 10 cm. Spodumene can be white or off-white to pale green or khaki with individual crystals up to 1 m in length and 20 cm diameter observed at Abonko. Preliminary mineralogical characterisation studies were completed on selected surface samples from across the deposit including petrography, X-Ray Diffraction (“XRD”), Scanning Electron Microscopy (“SEM”) and Dynamic Secondary Ion Mass Spectrometry (“DSIMS”) confirm spodumene as the dominant lithium phase with minor accessory beryl, tantalite-columbite and apatite detected. This was further verified by semi-quantitative XRD analysis that was undertaken on 25 metallurgical samples submitted to Microanalysis Australia, (a commercial materials characterisation consulting laboratory); at the direction of NAGROM metallurgy laboratory. This analysis reported approximate mineral assemblages of the sink concentrate comprising; dominant spodumene, quartz, muscovite, apatite, albite, lepidolite, amblygonite, microcline, clinochlore, triphylite, eucryptite, vivianite, lithiophorite, phlogopite, beryl, biotite, fluorapatite, pyrite, and amphibole. These results confirmed simple mineralogy across both the sink and flotation; feldspar and muscovite for waste and ore material, with no deleterious elements reported. TECHNICAL REPORT SUMMARY EWOYAA LITHIUM PROJECT Page 100 of 368 The grain size of the pegmatites ranges from aplitic, where spodumene crystals are typically 1 to 2 mm in size, to pegmatitic, where localised unidirectional solidification texture (“UST”) zones can contain megacrysts of spodumene greater than 80 cm in length. Good examples of this coarser-grained UST pegmatite are exposed in the wall of a quarry at Abonko, immediately east of Ewoyaa, or outcropping around hole GRC0004 within Ewoyaa Main. Grainsize change can be abrupt, commonly coarsening from margin inwards in larger zoned pegmatites with well-developed cores. Grain size zonation on a decimetre scale (outcrop and core), and on tens of metres scale are observed. Megacrysts of feldspar, with or without quartz intergrowth, and spodumene occur as individual crystals up to several decimetre in size. Atlantic has defined two geometallurgical domains - at Ewoyaa, P1-type pegmatitic coarse grained spodumene; and P2-type medium to fine-grained spodumene, and where testwork by NAGROM indicates favourable recoveries using conventional DMS processing with P1 & P2-type spodumene pegmatites. P1 pegmatitic spodumene occurs in outcrop as long laths up to 20-40 cm in length and is the dominant spodumene bearing pegmatite encountered to date, exhibiting very coarse to pegmatoidal euhedral to subhedral spodumene crystals comprising between 20 and 40% of the core (Figure 6-9). P2 contains spodumene crystals of a medium to fine crystal size (up to 0.5-1 cm laths), the spodumene is euhedral to subhedral and can comprise up to 50% of the core (Figure 6-10). The spodumene can be bimodal with some larger phenocrysts entrained within the medium grained spodumene bearing matrix. Other lithium bearing phases may be present in insignificant very low abundance.

TECHNICAL REPORT SUMMARY EWOYAA LITHIUM PROJECT Page 101 of 368 7.0 EXPLORATION 7.1 NATURE AND EXTENT OF EXPLORATION 7.1.1 1916 > 1956: Early exploration: Geological Survey of the Gold Coast, during colonial era Early mapping by the ARGS (Geological Survey of the Gold Coast) during British colonial rule identified pegmatites in the area in 1916, with follow-up mapping in 1919 and 1939 recognizing spodumene potential. Pegmatites with kaolin, tinstone and gold potential and subsequently Nb-Ta, Be and lithium (spodumene) potential in beach exposures along the Cape Coast at Abadzi Point (Kitson, 1916 & 1919). Further mapping by Junner (1939) further confirmed columbite- tantalum, beryl and spodumene potential in the same area. 7.1.2 1957 > 1965: Early Exploration: Ghana Geological survey, post-colonial era Between 1960 to 1965 the newly named Ghana Geological Survey post-independence from British colonial rule on 6 March 1957 completed extensive mapping and sampling, first referring to what is now known as the Ewoyaa lithium deposit. A small spodumene bearing pegmatite was located in association with kaolinized pegmatite at the Saltpond by-pass pegmatite (now named Sub-Station pegmatite) and is suspected that it may have been derived, or be a weathering product, from an original pegmatite rich in spodumene as all other outcropping pegmatites in the immediate area were reported to be heavily kaolinised (Berry and Mason, 1959). It wasn’t until 1960 that the current Ewoyaa-Abonko deposit (then called Awuaya – Okwesikrom) was discovered in mapping and assessed by the Geological survey by trenching and bulk sampling (with a failed attempt at drilling 2 holes) between 1963 to 1965. Hughes & Farrant (1960) reported the discovery of the Awuaya-Okwesikrom spodumene bearing pegmatite (this being the present-day location of the Ewoyaa Project, named after a village over the deposit footprint now no longer there) and additional pegmatites inland from the coastline. Hughes & Farrant also noted a zonation in pegmatite mineralogy away from the Cape Coast Batholith, with those on the extreme outer fringe of the known pegmatite field being more prospective with regards economic mineralogy, zonation, pods and albitisation. This work formed part of a regional assessment for beryl, columbite-tantalum, tin, kaolin, lithium and other economic minerals associated with pegmatites along the contact margin of the Cape Coast Batholith as part of Ghana’s Development Plan. A two-year investigation of the pegmatites of Field Sheet No. 26 (a 15-minute Field Sheet located in the Central Region of Southern Ghana along the coastline of the Gulf of Guinea which extends eastward from Cape Coast to a point just beyond Saltpond) was completed by the Ghana Geological Survey between June 1963 to July 1965 with a special emphasis on locating and mapping pegmatites containing minerals suitable for ceramics (McKinney & Luxner, 2003). The below extract key observations from this report: The spodumene bearing pegmatites of the Awuaya - Okwesikrom area are not economic deposits. The pegmatites of this area are deeply weathered and contain a very high percentage of the kaolin polymorph minerals (principally halloysite). The pegmatites of this area were found to extend to depths greater than 40 feet as proven by trenching methods, but the total depth of weathering of these pegmatites is not known. An extensive drilling program in this area to depths greater than 40 feet may uncover rich deposits of the mineral spodumene, but it is extremely doubtful that an economic deposit exists at depth if the process of weathering of feldspar and spodumene, as occurs in the tropics is considered in its true chemical - physical environment. Scale and grade observations by the Ghana Geological Survey are listed in Table 7-1 and Table 7-2 below. TECHNICAL REPORT SUMMARY EWOYAA LITHIUM PROJECT Page 102 of 368 Work subsequently focussed on the Egyasimanku Hill pegmatites 40 km to the east with drilling completed there, however, given the Countries abundance of gold and the small market for lithium at the time, no further work was undertaken other than academic interest. TABLE 7-1 SCALE OF THE AWUAYA – OKWESIKROM PEGMATITES (EWOYAA AND ABONKO) TABLE 7-2 GRADE OF THE AWUAYA – OKWESIKROM PEGMATITES (EWOYAA AND ABONKO) TECHNICAL REPORT SUMMARY EWOYAA LITHIUM PROJECT Page 103 of 368 7.1.3 1971: A-Amoako-Mensah Master’s Thesis, University of Leeds A master’s thesis by titled “Mineralogy and Geochemistry of Spodumene Pegmatites with Particular Reference to Spodumene Occurrences at Saltpond, Ghana” by S-Amoako-Mensah (1971) provided further evidence for lithium potential within the District. The thesis included a historic summary geology map by the Geological Survey of Ghana from the Archive Report #31, allowing the Company to better focus ground reconnaissance mapping to ultimately locate the spodumene bearing pegmatites. 7.1.4 1959 > 1962 & 1980’s: Ashanti Gold Fields Ashanti Goldfields explored the Winneba region as part of their gold exploration of the Winneba-Kibi volcanic belt, and undertook regional stream sediment geochemical sampling, some soil geochemical sampling, pitting trenching and some banka and diamond drilling. Very little detail of this work is available, although the old trenches are discernible northwest of the village of Makwadzi. The drill core from this exploration campaign is believed to have been destroyed (vandalised) and details unavailable. Ashanti Goldfields revisited the region during the 1980’s but no details of this work was found. 7.1.5 2003 > 2007: Leo Shield Exploration LeoShield Exploration entered into a JV with Obotan Minerals over the Apam East-Mankwadzi area in the southern end of the Winnaba-Kibi belt to evaluate the alluvial and elluvial tantalum and tin potential of the area. Soil geochemistry was undertaken along with systematic pitting and trenching. An area of 330,000 m² was identified where enrichment of Ta and Sn occurs. 7.1.6 2016 – Now: IronRidge Resources (now Atlantic Lithium Limited) IronRidge recognises the potential for the Birimian of West Africa to host lithium pegmatites after the discovery of the Goulamina deposit in Mali. The Company focused its efforts within the Birimian terrain of West Africa, which has seen extensive gold exploration, however, is underexplored for lithium yet has the potential to host large-scale spodumene pegmatite deposits as proven by the Goulamina discovery (now 103 Mt at 1.34% Li2O). Desk-top review including literature and internet sources initially highlighted the historical Egyasimanku Hill deposit (1.48 Mt at 1.67% Li2O) drilled by the Ghana Geological Survey during the 1960s. This resulted in a closer review of the margins of the Cape Coast Batholith as a prospective zone for fractionated Li enriched pegmatites from parental granites as per the Cěrný model (Cěrný, 1989) (Table 7-2 and Table 7-3). TECHNICAL REPORT SUMMARY EWOYAA LITHIUM PROJECT Page 104 of 368 FIGURE 7-1 LEFT: IDEALISED ZONED PEGMATITE FIELD AROUND A SOURCE GRANITE. THE MAXIMUM DISTANCE OF PEGMATITES FROM THE SOURCE GRANITE IS ON THE ORDER OF KILOMETRES OR, AT MOST, TENS OF KILOMETRES. MODIFIED FROM CĚRNÝ (1989) RIGHT: OROGENIC SETTING LCT PEGMATITE FORMATION IN PLUTON-UNRELATED AND PLUTON-RELATED SETTINGS (MULLER ET AL 2017). FIGURE 7-2 CAPE COAST BATHOLITH MARGIN AND PROSPECTIVE TARGETS DEFINED FROM GEOLOGICAL SETTING AND GOOGLE EARTH GROUND FEATURES (AREA 1 BEING THE EWOYAA DISCOVERY LOCATION). The Company secured the Apam and Winneba JVs with local company Obotan Minerals and Merlink Resources as well as applied for Senya Beraku license (announced September 2016). Multiple visits were made to the Geological Survey in Accra and through the help of Dr Annum, further historical reports were recovered, in-particular Archive Report #31 (McKinney & Luxner, 2003) titled “Pegmatite Investigations in Field Sheet 26 With Particular Reference To Spodumene And Kaolin Bearing Pegmatites”. This report was part of Ghana’s efforts to capture and digitise historical Geological Survey reports that were largely in hard-copy format and

TECHNICAL REPORT SUMMARY EWOYAA LITHIUM PROJECT Page 105 of 368 focused on the two-year evaluation programme completed between 1963 to 1965 on pegmatites in Map Sheet 26; the current location of the Ewoyaa discovery. The Company secured a JV with local company Barari Developments Ltd to secure the Mankessim license (announced in October 2016); the license which hosts the Ewoyaa Lithium deposit. All Africa Minerals Explorer (‘AAME’) was engaged in October 2016 to commence reconnaissance mapping and sampling over the Apam and Mankessim licenses. 2016 - 2017 Fieldwork commenced over the Apam East and West licenses without any significant discoveries other than confirming the Makuba (Rasta Man) Hill and northern Nb-Ta pegmatite drilled by Ashanti Goldfields Company and subsequently Leo Shield. The other focus in this area was the first mover access rights Apam East afforded to the historic Egyasimanku Hill deposit directly east. Ongoing line cutting and mapping over the Egyasimanku Hill area located the lithium occurrence (1.48 Mt @ 1.67% Li2O) with associated trenching and spodumene outcrops which was announced to market in June 2017. Fieldwork commenced in the Mankessim license (now the ML) during November 2016 with initial rock-chip sampling completed between Jan-Feb 2017 over the outcropping portion of the Ewoyaa deposit. However, initial results were disappointing due to small sample size of surficial weathered materials (Li depleted due to weathering) and lab QAQC failures at SGS South Africa. It was decided to re-open historic trenches as well as dig new trenches to get bigger and fresher samples for analysis. Surface rock chips that had previously returned 100-300 ppm Li2O now returned results at 1-2% Li2O (5,000 – 10,000 ppm Li2O) over the same area in deeper trenching. Initial high-grade trenching results were announced to market in May 2017 and the historical named Okwesikrom deposit (now called the Ewoyaa deposit) had been re-discovered (Figure 7-3). FIGURE 7-3 EARLY DUE-DILIGENCE ROCK-CHIP AND TRENCH SAMPLING RESULTS AAME continued fieldwork under supervision of IronRidge to advance the Ewoyaa project to drill ready status. The surface geology interpretation went through several iterations as our understanding improved from observations in pitting, trenching and road cuttings through transported and weathered cover. Further high-grade trenching results were announced in November 2017. TECHNICAL REPORT SUMMARY EWOYAA LITHIUM PROJECT Page 106 of 368 2018 Phase 1 exploration drilling: 8,210 m of RC drilling for 58 holes completed between 28/4/2018 to 30/6/2018 with discovery drill holes GRC0004 128 m @ 1.21% Li2O from 3 m and GRC0027: 111 m @ 1.35% Li2O from 3 m announced on 28/08/2023 Aug 2018. 2019 Phase 2 exploration drilling: 4,738 m of RC drilling for 44 holes and 1,117.2 m of DD drilling for 9 holes for a total of 5,855.2 m of drilling in 53 holes completed between 24/11/2018 to 26/02/2019. Phase 3 resource drilling programme: 12,615 m of RC drilling for 96 holes and 349.5 m of DD drilling for 2 holes for a total of 12,964.5 m of drilling in 98 holes completed between 1/8/2019 to 30/10/2019. 2020 Maiden MRE of 14.5 Mt @ 1.31% Li2O announced on 28/01/2020 . 2021 Positive Scoping Study announced on 19/01/2021. Phase 4 resource drilling programme: 24,874 m of RC drilling for 198 holes completed between 11/1/2021 to 8/7/2021. MRE upgrade to 21.3 Mt @ 1.31% Li2O announced on 01/12/2021. Positive Scoping Study announced on 07/12/2021. 2022 Phase 5 resource drilling programme: 26,551 m of RC drilling for 212 holes, 10,753.4 m of DD drilling for 89 holes and 1,100 m of hydro monitoring drilling in 11 holes for a total of 38,404.4 m of drilling in 312 holes completed between 10/6/2021 to 22/11/2021. MRE upgrade to 30.1 Mt @ 1.26% Li2O announced on 24/03/2023. Positive Pre-feasibility study announced on 22/09/2023. Phase 6 resource drilling programme: 41,304 m of RC drilling for 270 holes, 3,910.6 m of DD drilling for 36 holes and 924 m of hydro monitoring drilling in 9 holes for a total of 46,138.6 m of drilling in 315 holes completed between 19/03/2022 to 19/09/2022. 2023 MRE upgrade to 35.3 Mt @ 1.26% Li2O announced on 01/02/2023. Positive definitive-feasibility study announced on 22/03/2023. Phase 7 resource drilling programme: 25,295 m of RC drilling for 147 holes, 1,309.5 m of DD drilling for 8 holes and 210 m of hydro monitoring drilling in 2 holes for a total of 26,811.5 m of drilling in 1480 holes completed between 13/04/2023 to 15/12/2023. Maiden Feldspar Mineral Resource Estimate announced on 12/12/2023. 7.2 DRILLING PROCEDURES Most of the drilling undertaken at the ELP has been undertaken using reverse circulation (‘RC’) drill rigs and a portion using diamond core (‘DD’) drill rigs, where drilling was undertaken with each rig operating on a double shift with a 9-3 or 12-4 work-rest roster. At the time of the MRE upgrade, drilling at ELP has to date been carried out by Geodrill Ghana Ltd. with a total of 878 RC holes completed for 119,745 m, 101 DD collars for 11,310 m, 35 combined RC with DD tails TECHNICAL REPORT SUMMARY EWOYAA LITHIUM PROJECT Page 107 of 368 (‘RCD’) for 4,998 m and 11 dedicated hydro monitoring holes for 1,100 m for a grand total of 137,153 m in 1,025 holes, refer Table 7-3. TABLE 7-3 SUMMARY OF DRILLING AT THE ELP Hole Type In Database In Mineral Resource Drill holes Drill holes Intersection Number Metres Number Metres Metres RCH 11 1,100 RC 878 119,745 616 88,967 16,959 RCD 35 4,998 32 4,568 733 DD 101 11,310 93 10,159 4,987 Total 1,025 137,153 741 103,694 22,679 All hole collar locations have been professionally surveyed on completion of drilling and down-hole survey equipment has been used from the commencement of drilling by the drill contractor. The first 10 drill holes were surveyed down the hole every 6 m using an EZ TRAC 1.5 (single shot), and subsequent holes up to GRC0083 used Reflex GYRO tool every 6 m. All drill holes from GRC0084 onwards utilised the more efficient Reflex SPRINT tool with routine down hole surveys every 3-4 m (measurements taken by the instrument on journey down and up the hole) during the end-of-hole survey. The RC holes were completed using a combination of 5.25” and 5.75” face sampling hammers and the core drilling using a combination of PQ and HQ sized coring equipment. RC drill chips were collected, and riffle spilt (Phases 1 and 2) or cone spit on rig cyclone (Phases 3-6) at 1-metre intervals. Diamond holes were collared from surface with PQ (85 mm core diameter) to maximise recovery in the weathered rock and reduced to HQ (63.5 mm core diameter) as soon as ground conditions improved in competent rock to end of hole. During phase 5 and 6 diamond drilling the use of PQ through the weathered rock was replaced with HQ triple tube due to improved core recovery and productivity, before switching to conventional HQ in fresh rock. All diamond holes were drilled in conjunction with the Reflex ACT II orientation tool; to provide an accurate determination of the bottom-of-core orientation for further geological, structural, and geotechnical logging. Phase 1 RC holes were completed on a nominal 100 m by 50 m grid pattern, targeting the Ewoyaa Main mineralised system. Phases 2 to 5 of both RC and DD reduced the wide spacing to 80 m by 40 m and down to 40 m by 40 m in the well drilled portions of the Project. Phase 5 and 6 was a major infill drilling program down to 40 m by 40 m over most of the Project. Phase 6 included extensional drilling in areas of open mineralisation, as well as close spaced infill drilling in portions of the Ewoyaa deposit. Twenty-two DD twins of RC holes were completed. Collar positions have been surveyed to centimetre accuracy using differential GPS (“D-GPS”) survey equipment. Once validated, the survey data was uploaded into the DataShed electronic database. Most of the holes drilled were dry with only a few exhibiting minor surficial water usually at the base of the near surface laterite/alluvial sediments (perched aquifer), often little more than a trickle and not enough to justify flow tests. The high air pressure maintained during RC drilling ensured samples collected remained dry and sampling procedures were unaffected by water ingress. TECHNICAL REPORT SUMMARY EWOYAA LITHIUM PROJECT Page 108 of 368 8.0 SAMPLE PREPARATION, ANALYSIS AND SECURITY The following sections outline the sampling techniques, procedures and QA/QC controls related for the project. 8.1 SAMPLING RC drill chips were collected, and riffle spilt (Phases 1 and 2) or cone spit on rig cyclone (Phases 3-6) at 1-metre intervals producing an assay sample of nominally between 4 kg and 5 kg. A retention sample is also produced by riffle split or cone split which are archived at Atlantic’s Mankessim facility. Diamond drill core recoveries are always determined at the rig site by ALL personnel. On each core run the drill core is removed from the core barrel into a v-rail and each core run was reassembled and measured with a tape measure, assessing recovery against core block depth measurements and recording any measured core loss for each core run. Drill core is carefully conveyed to the core facility where it is geologically logged, and the sampling procedures ensures that ½ and further ¼ core is cut where possible and that minimum and maximum sample lengths are 0.3 m and 1 m respectively but cut to geological boundaries. A ¼ core is dispatched to the assay laboratory. A minimum ¼ core sample is retained for reference at all times. RC and DD sampling have quality control (“QC”) samples consisting of standards or certified reference materials (“CRM”), coarse blank and field duplicates were inserted nominally every 35th to 50th sample. Since December 2018, samples were sent to Intertek Laboratory in Tarkwa for sample prep and a representative pulp sample is sent to Intertek Laboratory in Perth for analysis (FP6/MS/OES). FP6/MS/OES is an analysis for lithium and a suite of 21 other elements. Detection limits for lithium range between 5 ppm and 20,000 ppm. The sodium peroxide fusion (in nickel crucibles) is completed with hydrochloric acid to dissolve the sub-sample and is considered a total dissolution. Analysis is conducted by Inductively Coupled Plasma Mass Spectrometry (“ICP-MS”). Prior to December 2018, Phase 1 samples were submitted to SGS Johannesburg and later SGS Vancouver for analysis (ICP90A). ICP90 is a 28-element combination Na2O2 fusion with ICP-OES. ICP-MS was added to some submissions for additional trace element characterisation purposes. All phase 1 SGS pulps were subsequently sent to Intertek Laboratory Perth for re-analysis (FP6/MS/OES) and included in the resource estimate. All laboratories, including Intertek Perth and ALS Brisbane are ISO 17025 accredited. All laboratories used for the technical report are independent of Atlantic Lithium and provide commercial services to the company pursuant to arm’s length service contracts. 8.2 BLANKS The coarse blank material used is building aggregate sourced from a granitic quarry near Dominase (771400 E 606900 N UTM Z30 N) in the Gomoa East area, some 62 km to the east of the ELP area. Blank sample performance at the assay labs indicates good laboratory performance overall, with only rare assay spikes in the data from 1,174 blank samples inserted into the assay stream (Figure 8-1). The assay spikes can be attributed to laboratory contamination or the possible low level Li mineralisation naturally occurring in the granitic rock used as a blank.

TECHNICAL REPORT SUMMARY EWOYAA LITHIUM PROJECT Page 109 of 368 FIGURE 8-1 QA/QC PERFORMANCE OF BLANK MATERIAL IN LI ASSAY 8.3 FIELD DUPLICATES Check sampling was performed to determine whether the sampling procedure was producing assay subsamples that were representative of the original sample. A total of 486 field duplicates were split using a riffle splitter and results indicate good repeatability of the original sample (Figure 8-2). FIGURE 8-2 QA/QC PERFORMANCE OF FIELD DUPLICATE SAMPLES IN LI ASSAY TECHNICAL REPORT SUMMARY EWOYAA LITHIUM PROJECT Page 110 of 368 8.4 CERTIFIED REFERENCE MATERIAL ALL utilised a suite of lithium standards sourced from Geostats and AMIS, which assessed lithium assays. A total of 3,319 field standards were inserted in the ALL drilling. A summary table of standards is shown in Table 8-1. TABLE 8-1 CERTIFIED STANDARD SUMMARY FOR LI (PPM) Std_ID Count Average Assay Min Assay Max Assay Std Value Std Min Std Max GTA-01 47 3371.85 3,045 3,694 3,132 2,745 3,519 GTA-02 60 1818.78 1,609 1,992 1,715 1,523 1,907 GTA-03 60 8036.77 1,773 9,091 7,782 7,257 8,307 GTA-04 57 9589.09 8,834 10,367 9,275 8,636 9,914 AMIS0339 18 21277.28 1,651 23,238 22,700 21,700 23,700 AMIS0341 43 4822.09 4,518 5,121 4,733 4,328 5,138 AMIS0342 49 1666.18 1,505 1,776 1,612 1,445 1,779 AMIS0682 221 8525.16 3,586 9,281 8,407 7,953 8,861 AMIS0683 222 1984.53 59 2,603 2,023 1,822 2,224 AMIS0684 220 4599.62 3,405 5,546 4,594 4,238 4,950 BLK 607 40.33 0 1,002 0 0 100 Monitoring of standards and field duplicates was undertaken by ALL geologists. There was a significant accuracy issue with the first batch of sample submissions for assaying completed at SGS Laboratory in Johannesburg and Vancouver. As a result, ALL switched laboratories to Intertek Laboratory in Perth, as well as re-assaying the affected samples. Subsequent standards analysis demonstrates a marked improvement in the performance of the standards. 8.5 UMPIRE LABORATORY CHECK ASSAY To analyse the validity of assay values between laboratories, an umpire laboratory check assaying program was conducted by ALL whereby a total of 155 samples were analysed at ALS Laboratory in Perth and compared to the original assays that were analysed at Intertek Laboratory in Perth. The results shown in Figure 8-3 indicate that there is very good repeatability between the two laboratories. TECHNICAL REPORT SUMMARY EWOYAA LITHIUM PROJECT Page 111 of 368 FIGURE 8-3 UMPIRE CHECK ANALYSIS LI 8.6 DATA QUALITY ASSESSMENT Programmes of QAQC have been carried out throughout the ELP drilling by ALL. Early in the Project’s history, a significant issue existed at SGS Laboratory in Johannesburg and Vancouver, which resulted in ALL switching laboratories and re-assaying the affected samples. Subsequent standards and blanks showed improved performance. Industry certified standards were inserted at regular intervals and results have, in the main, accurately reflected the original assays and expected values. Field duplicates were collected from the riffle splitter and show repeatable results. A recognised laboratory has been used for analysis of samples. Twin hole DD drilling conducted shows slightly higher grades of lithium compared to RC drilling, giving confidence that RC drilling has not over estimated lithium grades. Significant Fe contamination of the samples results from the RC method and if an accurate Fe estimate is required, adjustment to the Fe data derived from RC drilling should be conducted. However, test work conducted on the Ewoyaa samples indicates that the Fe levels are inconsequential to the lithium concentrate process. Overall, the QAQC data does not indicate any bias and supports the assay data used in the Mineral Resource. 8.7 DENSITY Bulk density measurements were completed on selected intervals of diamond core drilled at the deposit. The measurements were conducted at ALL’s Mankessim core processing facility using the water immersion/Archimedes method on all materials. The weathered samples were coated in paraffin wax to account for porosity of the weathered samples. The average density for each weathering types and lithology was applied to the corresponding coded domains in the block model. A total of 13,901 measurements were conducted on the ELP mineralisation, with samples obtained from oxide, transitional and fresh material. Statistics for the various lithologies and weathering types are shown in Table 8-2. TECHNICAL REPORT SUMMARY EWOYAA LITHIUM PROJECT Page 112 of 368 TABLE 8-2 BULK DENSITY STATISTICS Domain All fr_gtd tr_gtd ox_gtd fr_sed tr_sed ox_sed fr_peg tr_peg ox_peg fr_res tr_res ox_res Samples 13,901 587 16 8 6,196 1,094 525 770 742 271 3,392 20 280 Minimum 1.05 1.21 1.61 1.84 1.13 1.30 1.05 1.44 1.35 1.36 1.08 1.66 1.06 Maximum 3.55 2.94 2.69 2.30 3.39 2.93 2.93 3.48 2.89 2.73 3.55 2.87 3.17 Mean 2.62 2.68 2.40 1.98 2.78 2.23 1.91 2.69 2.06 1.92 2.73 2.18 2.56 Std Dev 0.32 0.08 0.37 0.16 0.09 0.39 0.26 0.12 0.30 0.20 0.13 0.41 0.27 CV 0.12 0.03 0.16 0.08 0.03 0.18 0.14 0.04 0.15 0.11 0.05 0.19 0.11 Variance 0.10 0.01 0.14 0.02 0.01 0.16 0.07 0.01 0.09 0.04 0.02 0.16 0.07 10% 1.97 2.63 1.65 1.84 2.71 1.75 1.69 2.60 1.73 1.70 2.62 1.68 2.23 20% 2.60 2.66 2.12 1.86 2.74 1.83 1.73 2.63 1.79 1.78 2.65 1.75 2.44 30% 2.66 2.67 2.17 1.89 2.76 1.90 1.76 2.65 1.86 1.83 2.68 1.86 2.54 40% 2.70 2.68 2.25 1.91 2.77 2.01 1.79 2.66 1.92 1.85 2.70 1.90 2.59 50% 2.74 2.68 2.66 1.91 2.78 2.16 1.83 2.68 1.98 1.90 2.72 1.97 2.63 60% 2.76 2.69 2.67 1.92 2.79 2.42 1.88 2.70 2.07 1.95 2.74 2.43 2.66 70% 2.78 2.69 2.68 1.94 2.80 2.56 1.94 2.73 2.18 1.98 2.76 2.50 2.70 80% 2.80 2.70 2.68 2.02 2.82 2.65 2.03 2.76 2.36 2.04 2.79 2.54 2.72 90% 2.83 2.71 2.68 2.16 2.85 2.74 2.31 2.80 2.57 2.15 2.84 2.67 2.77 95% 2.87 2.74 2.68 2.23 2.88 2.79 2.53 2.84 2.64 2.29 2.91 2.69 2.81 97.50% 2.91 2.77 2.69 2.26 2.90 2.86 2.67 2.94 2.68 2.46 2.99 2.78 2.85 99% 2.96 2.81 2.69 2.29 2.93 2.90 2.69 3.01 2.73 2.66 3.26 2.83 2.92

TECHNICAL REPORT SUMMARY EWOYAA LITHIUM PROJECT Page 113 of 368 9.0 DATA VERIFICATION 9.1 PROCEDURES OF QUALIFIED PERSON Ashmore Advisory Pty Ltd’s QP Shaun Searle visited the site during February 2019 to review exploration sites, drill core and work practices. Visual validation of mineralisation against assay results was undertaken for several holes. 9.1.1 Data Import and Validation All drill hole data was imported into Surpac software version 2019. Validation of the data was then completed which included checks for: • Down-hole survey depths did not exceed the hole depth as reported in the collar table. • Hole dips were within the range of 0° and -90°. • Visual inspection of drill hole collars and traces in Surpac. • Assay values did not extend beyond the hole depth quoted in the collar table. • Assay and survey information was checked for duplicate records. • The database was well organised with no errors. Drill hole relative location was checked by Ashmore when on-site in February 2019 by locating 12 drill holes with a hand-held GPS. The recorded positions were then compared with the surveyed co-ordinates in the database (Table 9-1). Although the handheld GPS lacks precision, the holes are located correctly in relation to each other which increases confidence that no data entry mix-ups have occurred when loading collar co-ordinates into the database. TABLE 9-1 DRILL HOLE COLLAR VERIFICATION Original Survey Check Survey Hole ID East North East North GRC0018 715,365.508 578,590.935 715,366 578,591 GDD0008 715,368.510 578,589.350 715,370 578,587 GRC0022 715,383.949 578,698.875 715,385 578,697 GRC0023 715,424.196 578,671.855 715,424 578,671 GRC0004 715,572.560 579,052.946 715,574 579,051 GDD0001 715,576.290 579,049.040 715,577 579,049 GRC0078 715,833.463 579,683.545 715,834 579,682 GRC0077 715,863.498 579,656.011 715,864 579,656 GRC0095 715,873.958 579,657.329 715,876 579,656 GRC0076 715,895.419 579,632.872 715,896 579,632 GRC0060 717,143.324 579,161.435 717,145 579,161 GRC0061 717,174.474 579,193.490 717,175 579,192 TECHNICAL REPORT SUMMARY EWOYAA LITHIUM PROJECT Page 114 of 368 9.2 LIMITATIONS As with any exploration program, localised anomalies cannot always be discovered. The greater the density of the samples taken, the less the risk. Once an area is identified as being of interest for inclusion in the mine plan, additional samples are taken to help reduce the risk in those specific areas. 9.3 OPINION OF QUALIFIED PERSON Sufficient data have been obtained through various exploration and sampling programs to support the geological interpretations at the Property. The data are of sufficient quantity and reliability to reasonably support the lithium Mineral Resource estimates in this TRS. TECHNICAL REPORT SUMMARY EWOYAA LITHIUM PROJECT Page 115 of 368 10.0 MINERAL PROCESSING AND METALLURGICAL TESTING Metallurgical testwork was conducted under the supervision of Trinol Pty Ltd at Nagrom from 2019, with the majority of the work being conducted between Q1 2022 to Q2 2023. The results of this series are reported in Nagrom Reports T3020, T3020B, and T3141. Testwork conducted by Nagrom included: • Specific gravity of drill core; • Head Assays of each composite; • Unconfined Compressive Strength (UCS); • Abrasion Index (Ai); • Crushing Work Index (CWi); • Bond Ball Mill Work Index (BBMWi); • Heavy Liquid Separation (HLS) at various crush sizes; • Pilot Dense Media Separation with 100 mm diameter cyclone (DMS-100); • Pilot Dense Medium Separation with 250 mm diameter cyclone (DMS-250); and • Sighter flotation tests. Relevant reports for testwork conducted by vendors other than Nagrom are also appended to this section. Other testwork conducted included: • Rheology testwork by Slurry Systems Engineering; • Thickener and Filtration testwork by Fremantle Metallurgy; and • XRD and optical mineralogy by Microanalysis. Earlier studies (PFS) had proposed flowsheets consisting of three-stage crushing to produce a -10 mm feed for the DMS plant. The proposed DMS flowsheet consisted of a rougher (primary) and cleaner (secondary) stage, treating an entire size fraction (-10 +0.8 mm). A Feldspar DMS circuit was included in the flowsheet to recover Feldspars from the primary DMS floats. A recrush circuit was included to provide further liberation of the secondary floats before they were recirculated back into the plant feed. Changes to the flowsheet and project since the PFS include increasing overall plant throughput from 2.0 Mtpa to 2.7 Mtpa. The current flowsheet retains the three-stage crushing circuit (albeit with larger equipment) and retains the 10 mm crushed top size. The DMS plant flowsheet has also been developed further. The DMS feed is split into three size fractions (coarse, fines and ultrafines). The DMS feed bottom close size has been increased from 0.8 mm to 1 mm. The recrush circuit is still included however it now feeds a dedicated recrush DMS circuit. The test work conducted has been summarised by Primero in this report, in conjunction with Atlantic Lithium for the benefit of Atlantic Lithium. Atlantic Lithium retains sole responsibility for the quality and accuracy of its test work and reporting. 10.1 SAMPLE SELECTION Atlantic Lithium are progressing the development of the Ewoyaa Lithium Project on the Cape Coast of Ghana near the Port of Takoradi. The Company has identified a number of discrete pegmatite dikes and sills in the Project area. Earlier studies (PFS) have identified that the mineralogy across these deposits can generally be split into P1 (coarse lithology) and P2 (finer lithology) with each consisting of weathered and fresh domains. The deposits on the north- south trend (Ewoyaa South, Ewoyaa Main and Ewoyaa North) appear to contain significant quantities of the finer P2 mineralisation, whereas on the east-west trend the deposits (Anokyi, Abonko, Okwesi, Ewoyaa NE, and Grasscutter) contain predominantly the coarser P1 type mineralisation. TECHNICAL REPORT SUMMARY EWOYAA LITHIUM PROJECT Page 116 of 368 Drill core samples were collected from the respective deposits at the Ewoyaa project and sent to Nagrom Laboratories (Nagrom) in Western Australia for metallurgical testwork. The samples aimed to represent domains from each of the satellite deposits and to capture areas of varying mineralisation (P1 & P2) and weathering. A total of approximately 370 pegmatite drill core samples were taken from across the Ewoyaa deposits. These samples captured the varying mineralisation and levels of weathering, including “P1" coarse and “P2” fine mineralogy types from weathered ‘transitional’ and unweathered ‘fresh’ domains. From these samples, sixty-nine (69) drill hole composite samples were created and used for testing. Samples were selected for multi-elemental analysis before the remaining half PQ and HQ core was utilised for metallurgical sampling. The sample intervals were nominally based on the original primary sample intervals. Sample lengths were nominally one metre and varied depending on the metallurgical domains, oxidisation state, grain size, contacts, and grade. The sample intervals had a mean length of 1.20 m with a minimum of 0.15 m and maximum of 3.4 m. The mean sample weight was 4.45 kg. Half of the cut core was placed in clean individual calico sample bags with a unique sample ID and appropriate sample tag. The sample weights were captured. All samples were double bagged for shipping; the samples were packed into plastic drums for air freight via DHL to the Nagrom laboratory in Perth, Western Australia. Testwork has been ongoing since 2019, and the results reported in this section cover all test work to date. A total of approximately 1,700 kg of drill core was shipped to Nagrom. Two (2) transition samples were shipped; however, they were not used for test work as the grade was below the resource cut off. The metallurgical samples were given the unique ID ‘GMS’: • Phase 1 GMS0001 – GMS0095 – Scoping Study; and • Phase 2 GMS0110 – GMS0506 – PFS. Samples were logged with the following details and a composite ID was added: • Drill hole details; • Hole ID; • Depth from and to; • Sample type; • Sample purpose; • Sample description; • Weight; • Metallurgical characteristics; • Met Lithology; • Lith Modifier; • Weathering; and • Deposit. The sixty-nine (69) composites, representing subdomains of each of the deposits identified to date, were prepared for sighter HLS testing and selected composites were used for measurement of physical properties. At the time the testwork was undertaken, it was expected that Ewoyaa Starter, Ewoyaa Main and Anokyi would be the first three deposits to be developed, mined and processed and it was also decided to prepare bulk composites from each for testing at an advanced level in a DMS-250 pilot plant. The Ewoyaa Starter pit is within the Ewoyaa Main pit. T3141 Comp 1 was intended to represent the expected properties of the first material presented to the process plant from the Ewoyaa starter pit. After testing had started on the composite, the material used for the composite was re- examined and found to not have the expected geometallurgical properties required to match the intended mine plan. Higher quantities of P2 and transitional material were included in the composite than originally intended.

TECHNICAL REPORT SUMMARY EWOYAA LITHIUM PROJECT Page 117 of 368 The test work programme conducted for this study was conducted on the following composites, with sample details recorded in Table 10-1 and Table 10-2. TABLE 10-1 SUMMARY OF TEST WORK COMPOSITES Test Series Comp ID Deposit Geology Domain Weathering Head Grade Head Grade (% P1, balance P2) (% Fresh, balance transitional) (% Li2O) (%Fe2O3) T3020 Comp 1 EWY_Starter 100% 0% 1.25 0.45 T3020 Comp 2 EWY_Starter 100% 100% 1.04 0.28 T3020 Comp 3 EWY_Starter 100% 100% 1.57 0.37 T3020 Comp 4 EWY_Starter 0% 82% 1.70 0.40 T3020 Comp 5 EWY_Starter 0% 100% 1.14 0.35 T3020 Comp 6 EWY_Starter 46% 100% 1.53 0.29 T3020 Comp 7 EWY_Starter 56% 100% 1.18 0.37 T3020 Comp 8 EWY_Starter 27% 43% 1.24 0.42 T3020 Comp 9 EWY_Starter 100% 54% 1.91 0.37 T3020 Comp 10 EWY_Starter 100% 100% 1.27 0.39 T3020 Comp 11 EWY_Starter 0% 0% 0.28 0.46 T3020 Comp 12 EWY_Starter 0% 100% 1.07 0.31 T3020 Comp 13 EWY_Starter 84% 100% 1.87 0.40 T3020 Comp 14 EWY_Starter 100% 100% 2.70 0.50 T3020 Comp 15 EWY_Starter 0% 100% 1.56 0.38 T3020 Comp 16 EWY_Starter 15% 92% 1.22 0.34 T3020 Comp 17 EWY_Starter 91% 51% 1.36 0.52 T3020 Comp 18 EWY_Starter 53% 100% 1.50 0.27 T3020 Comp 19 EWY_Starter 18% 100% 1.06 0.53 T3020 Comp 20 Ewoyaa South 2 0% 100% 1.10 0.35 T3020 Comp 21 Ewoyaa South 2 0% 100% 1.86 0.31 T3020 Comp 22 Ewoyaa South 2 66% 100% 1.65 0.31 T3020 Comp 23 Ewoyaa South 2 48% 100% 0.70 0.61 T3020 Comp 24 Ewoyaa South 2 0% 100% 1.85 0.38 TECHNICAL REPORT SUMMARY EWOYAA LITHIUM PROJECT Page 118 of 368 Test Series Comp ID Deposit Geology Domain Weathering Head Grade Head Grade (% P1, balance P2) (% Fresh, balance transitional) (% Li2O) (%Fe2O3) T3020 Comp 25 Ewoyaa South 2 44% 100% 1.12 0.54 T3020 Comp 26 Ewoyaa South 2 24% 100% 1.47 0.39 T3020 Comp 27 Ewoyaa South 1 100% 100% 1.25 0.35 T3020 Comp 28 Ewoyaa South 1 0% 44% 1.46 0.50 T3020 Comp 29 Ewoyaa South 1 52% 71% 1.02 0.32 T3020 Comp 30 EWY_NE 100% 0% 2.41 0.49 T3020 Comp 31 Anokyi Main 100% 100% 1.77 0.49 T3020 Comp 32 Anokyi Main 86% 100% 2.10 0.38 T3020 Comp 33 Anokyi Main 67% 0% 1.70 0.44 T3020 Comp 34 Anokyi Main 13% 0% 0.76 0.41 T3020 Comp 35 Anokyi Main 100% 100% 1.70 0.42 T3020 Comp 36 Ewoyaa Main 0% 100% 1.22 0.35 T3020 Comp 37 Ewoyaa Main 65% 100% 1.47 0.37 T3020 Comp 38 Ewoyaa Main 100% 0% 1.12 0.37 T3020 Comp 39 Ewoyaa Main 6% 100% 1.26 0.46 T3020 Comp 40 Ewoyaa Main 92% 100% 1.91 0.42 T3020 Comp 41 Ewoyaa Main 81% 100% 1.33 0.41 T3020 Comp 42 Ewoyaa Main 56% 100% 1.53 0.39 T3020 Comp 43 Ewoyaa Main 17% 100% 1.32 0.39 T3020 Comp 44 Ewoyaa Main 16% 100% 1.16 0.41 T3020 Comp 45 Ewoyaa Main 76% 100% 1.80 0.41 T3020 Comp 46 Ewoyaa Main 58% 100% 1.24 0.30 T3020 Comp 47 Ewoyaa Main 52% 0% 1.49 0.44 T3020 Comp 48 Ewoyaa Main 89% 100% 1.45 0.38 T3020 Comp 49 Ewoyaa Main 83% 100% 0.91 0.33 T3020 Comp 50 Ewoyaa Main 46% 100% 0.57 0.29 TECHNICAL REPORT SUMMARY EWOYAA LITHIUM PROJECT Page 119 of 368 Test Series Comp ID Deposit Geology Domain Weathering Head Grade Head Grade (% P1, balance P2) (% Fresh, balance transitional) (% Li2O) (%Fe2O3) T3020 Comp 51 EWY NE 100% 100% 1.54 0.40 T3020 Comp 52 EWY NE 0% 100% 1.26 0.37 T3020 Comp 53 EWY NE 100% 100% 1.35 0.28 T3020 Comp 54 EWY NE 0% 100% 1.78 0.38 T3020 Comp 55 EWY NE 100% 100% 1.64 0.44 T3020 Comp 56 EWY NE 53% 100% 0.10 0.43 T3020 Comp 57 Grasscutter E 100% 100% 1.45 0.38 T3020 Comp 58 Grasscutter E 100% 100% 1.98 0.31 T3020 Comp 59 Okwesi North 100% 100% 1.48 0.41 T3020 Comp 60 Okwesi South 100% 100% 1.47 0.39 T3020 Comp 61 Abonko NW 100% 100% 1.73 0.48 T3020 Comp 62 Abonko Quarry 100% 100% 1.95 0.44 T3020 Comp 63 EWNW North 100% 100% 1.51 0.22 T3020 Comp 64 EWNW North 52% 100% 1.52 0.23 T3141 Comp 3 Ewoyaa Main _Start 100% 0% 1.09 0.33 T3141 Comp 8 Ewoyaa Main _Sth 1 100% 100% 0.77 0.29 T3141 Comp 9 Ewoyaa NW Sill 100% 100% 0.90 0.24 TABLE 10-2 MASTER COMPOSITE HEAD ASSAYS Test Series Comp ID Drill Hole ID(s) Deposit Geology Domain Weathering Head Grade Head Grade (% P1, balance P2) (% Fresh, balance transitional) (% Li2O) (%Fe2O3) T3020 Ewoyaa Starter Comp 3, 6, 9, 12, 13, 18, 39, 40, 45, 48 - - - 1.72 0.42 T3141 Comp 1 GDD0068, 69, 70, 71, 73, 75, 77, 79, 83, 86, 87 Ewoyaa Main _Start 78% 93% 1.39 0.34 Figure 10-1 shows the location of drill hole core used to develop metallurgical composites. TECHNICAL REPORT SUMMARY EWOYAA LITHIUM PROJECT Page 120 of 368 FIGURE 10-1 EWOYAA METALLURGICAL SAMPLE LOCATIONS AND COMPOSITES

TECHNICAL REPORT SUMMARY EWOYAA LITHIUM PROJECT Page 121 of 368 10.2 MINERALOGY Semi-quantitative X-Ray Diffraction (XRD) mineralogy was conducted on the T3141 composites. The summary of the primary minerals detected in each composite is shown in Table 10-3. The results show the typical pegmatite minerals, with the samples consisting primarily of Albite (Na-Feldspar), Spodumene, Quartz, and Microcline (K-Feldspar), with small amounts of Muscovite (Mica) and some Kaolinite present in Comp 3. The XRD results show the primary lithium bearing mineral is spodumene. XRD did not detect lepidolite or petalite which was sometimes reported in earlier XRD results. The XRD shows a very clean felsic mix of minerals with no typical mafic host rock gangue minerals such as tourmaline, biotite or amphiboles. TABLE 10-3 HEAD SAMPLE XRD RESULTS FOR THE T3141 COMPOSITE SAMPLES Comp1 Comp 3 Comp 8 Comp 9 Mineral % % % % Albite 33 37 42 38 Quartz 31 19 26 29 Spodumene 20 23 12 11 Microcline 15 11 20 20 Muscovite 2 2 1 3 Kaolinite - 2 - - 10.3 COMMINUTION The Ewoyaa processing plant is intended to be supplied with crushed ore from a fixed plant crushing circuit, that processes ROM ore hauled from the surrounding deposits. Before the core composites were crushed, key physical parameters of five samples were measured (Test series T3020 results in (Table 10-4). The Crushing Index (CWi) and Unconfined Compressive Strength (UCS) values confirm that the coarser P1 ore is more crystalline and easier to crush. This trend is confirmed in the more recent CWi tests conducted as part of the T3141 test work series (Table 10-4). The results also indicate that transitional/weathered ore has a lower CWi, which is to be expected. The Ball Milling Work Index (BBMWi) suggests the ore is hard and that the P1 ore, being coarser grained, contains components that will be harder to mill. This information will be considered if a flotation circuit is added to the process flowsheet in the future. TABLE 10-4 SUMMARY OF COMMINUTION DATA Parameter Unit Deposit Ewoyaa Starter Ewoyaa Main Anokyi Comp ID Comp 17 Comp 5 Comp 10 Comp 16 Comp 31 Lithology P1 fresh P2 fresh P1 fresh P2 fresh P1 fresh TECHNICAL REPORT SUMMARY EWOYAA LITHIUM PROJECT Page 122 of 368 Parameter Unit Deposit Ewoyaa Starter Ewoyaa Main Anokyi CWi kWh/t 10.9 11 7.8 10.5 8.4 UCS MPa 84 124 82 127 105 BBMWi kWh/t 21.39 18.06 20.19 19.72 21.43 Table 10-5 shows the crushing work and abrasion index for some additional samples tested in the T3141 testwork series. The average abrasive index is 0.32, which is about equivalent to granite. It should be noted that comparable operating spodumene processing plants which treat relatively coarse (>0.5 mm) spodumene bearing pegmatites have been found to be extremely abrasive and the plant design should allow for higher levels of abrasivity. TABLE 10-5 T3141 CRUSHING WORK AND ABRASIVE INDEX Sample Core Length Lithology BCWi Ai EWOYAA MAIN _Start GDD0071 13-22m P1 fresh 13.4 0.33 GDD0073 17-26m P1/P2 fresh 13.2 0.30 GDD0072A 26.4-32.5m P2 transitional 11.3 0.23 GDD0079 23.5-30.3m P1 transitional 10.3 0.20 GDD0075 55-64m P1/P2 fresh 15.8 0.37 GDD0078 55-61m P2 Fresh 20.6 0.44 EWOYAA MAIN GDD0046 39-47m P1 Fresh 14.8 0.38 GDD0036 39-47m P1 Fresh 12.1 0.36 GDD0046 63-66m P1 Fresh 16.0 0.40 EWOYAA MAIN _Sth 2 GDD0007 49-55m P1 Fresh 11.8 0.30 EWOYAA NE GDD0041 29-33.4m P1 Fresh 10.7 0.25 10.4 PARTICLE SIZE DISTRIBUTIONS Twelve (12) composites from the first three deposits to be mined, were crushed to 10 mm and 6.3 mm to compare the HLS results. Size by size assay analysis was conducted on the lab crushed composites. The resulting particle size distributions from crushing are shown in Figure 10-2. TECHNICAL REPORT SUMMARY EWOYAA LITHIUM PROJECT Page 123 of 368 FIGURE 10-2 PARTICLE SIZE DISTRIBUTIONS FOR CRUSHED COMPOSITES The important aspect of the crushed product size distribution to consider for DMS processing is the amount of -1 mm fines generated. DMS processing is limited to processing of relatively coarse particles, and any additional fines generated during crushing are not treated by DMS. It should be noted that lab crushing tests often underestimate the fines generated by full scale crushing. The result is that total plant DMS recovery may be lower than laboratory test work demonstrates if lithium losses due to increased fines production are not considered in recovery predictions. Figure 10-3 shows the average Mass and Lithium deportment for the crushed composites specifically looking at the fines particles sizes to present the lithium deportation for a given close screen size. The sizes focus on 0.5 mm, 0.85 mm, and 1 mm as they were size fractions considered in the flowsheet design. TECHNICAL REPORT SUMMARY EWOYAA LITHIUM PROJECT Page 124 of 368 FIGURE 10-3 MASS AND LITHIUM DEPORTMENT AT DIFFERENT BOTTOM SIZES FOR DMS FEED 10.5 HEAVY LIQUID SEPARATION (HLS) Heavy Liquid Separation (HLS) tests were conducted on 69 composite samples which were made up from fifteen (15) of the identified deposits at Ewoyaa. All composites were crushed to 10 mm and screened at 0.5 mm for the HLS comparisons. The results of all these HLS tests, grouped by deposit and lithology are summarised in Table 10-6. TABLE 10-6 COMPARISON OF HLS PERFORMANCE FOR ALL DEPOSITS (-10+0.5MM) Deposit P1 content (balance P2) Lithology Primary Concentrate Grade Overall Lithium Recovery Overall Mass % Li2O % Fe2O3 Yield Ewoyaa Starter 69% P1 F ave 6.42 0.81 59.3% 16.1% P1 T ave 6.71 0.73 47.4% 9.5% P2 F ave 5.52 0.86 20.4% 4.4% P2 T ave 5.69 0.82 14.8% 4.0% Ewoyaa Main 56% P1 F ave 6.39 0.81 56.8% 10.9% P2 F ave 5.60 0.91 24.9% 4.6%

TECHNICAL REPORT SUMMARY EWOYAA LITHIUM PROJECT Page 125 of 368 Deposit P1 content (balance P2) Lithology Primary Concentrate Grade Overall Lithium Recovery Overall Mass % Li2O % Fe2O3 Yield Ewoyaa NE 94% P1 F ave 6.53 0.89 70.9% 17.5% P1 T ave 6.90 0.66 79.3% 28.6% P2 F ave 5.16 0.83 13.8% 4.5% Ewoyaa South 2 93% P1 F ave 6.02 1.15 52.6% 12.5% P2 F ave 5.78 0.71 21.2% 4.3% Ewoyaa South 1 51% P1 F ave 5.89 0.66 44.2% 8.7% P1 T ave 5.41 0.69 16.6% 4.7% Anokyi Main 98% P1 F ave 6.25 0.78 65.4% 21.1% P1 T ave 6.51 0.73 39.0% 7.1% Grasscutter E 100% P1 F ave 5.90 0.60 56.6% 16.6% Okwesi N 100% P1 F 6.69 0.92 55.7% 13.6% Okwesi S 100% P1F 5.59 0.78 54.0% 16.6% Abonko NW 90% P1F 6.77 0.72 80.6% 25.6% Abonko Quarry 100% P1F 6.75 0.88 79.4% 26.8% EWNW North 100% P1F 5.74 0.37 57.3% 14.6% P2F 5.02 0.56 16.5% 5.1% Ewoyaa Main Start 100% P1T 7.20 0.77 24.4% 3.7% Ewoyaa Main Sth 1 100% P1F ave 6.33 0.78 31.4% 3.8% Ewoyaa NW Sill 100% P1F ave 5.89 0.59 13.8% 2.1% These results demonstrate variable recovery response of 50 - 80% Li2O for HLS processing for P1 fresh ores (with the exception of Ewoyaa South 1 and Ewoyaa NW Sill), with P1 Fresh ore making up over 80% of the total resource. It should be noted that the recovery figures shown in Table 10-6 were not normalised to 6% Li2O concentrates, and that concentrate grades for tests on P1 material were in excess of 6% on most results. The implication of high +6% Li2O concentrate grades is that the corresponding recoveries at 6% Li2O for P1 material may improve significantly. The results of all the HLS tests are plotted as grade recovery curves (Figure 10-4 and Figure 10-5) where the cumulative recovery is on the x-axis and cumulative grade is on the y-axis. Figure 10-5 shows composites separated into two sample groups. The first group contain composites with greater than 90% P1 material (shown as shades of grey). The second TECHNICAL REPORT SUMMARY EWOYAA LITHIUM PROJECT Page 126 of 368 group, contain composites with greater than 80% P2 material (turquoise shades). This grouping of high purity P1 and P2 samples highlights the significantly different HLS performance of the two ore types. Recovery performance is summarised in Section 10.9. FIGURE 10-4 GRADE RECOVERY CURVES FOR ALL HLS TESTS TECHNICAL REPORT SUMMARY EWOYAA LITHIUM PROJECT Page 127 of 368 FIGURE 10-5 GRADE RECOVERY CURVES, ISOLATED TO P1 AND P2. P1 (GREY), P2 (TURQOISE) It should be noted that these results are HLS laboratory results on -10 +0.5 mm material, the bottom size is finer than the proposed flowsheet bottom size of 1 mm. Also, unlike DMS, HLS separation efficiency is not affected by particle size and so conducting bulk separation across the entire size fraction of -10 +0.5 mm should be expected to always yield best case separation results for the given level of liberation. Processing a wide range of particle sizes together also reduces the separation efficiency expected from a DMS cyclone. Due to these factors, the selected flowsheet splits feed into three size fractions, to maximise the possible separation efficiency from DMS cyclones. The three size fractions selected are specified in Table 10-7. TABLE 10-7 PROCESS SIZE FRACTIONS Stream Size range Coarse -10 +5.6 mm Fines -5.6 +2.8 mm Ultrafines -2.8 +1.0 mm TECHNICAL REPORT SUMMARY EWOYAA LITHIUM PROJECT Page 128 of 368 The HLS results also do not demonstrate the expected increase to recovery that is possible from re-crushing the middlings and re-treating the crushed middlings product. Re-crushing is likely to have the biggest impact on P2 ore, which has finer mineralisation and is likely to be less liberated at these size ranges. The alternative to processing P2 by gravity DMS is to use flotation to process P2 ore. Alternatives are discussed as opportunities in Section 22.5. Figure 10-6 shows the current laboratory process performance of the P1 & P2 ore types isolated into groups and plotted as a box plot. The results show that there is a clear distinction between high percentage P1 and P2. The results show that further work is required if the recovery of composites with mixtures of P1 & P2 is to be predicted with a high degree of confidence. FIGURE 10-6 HLS RECOVERY VARIABILITY OF SAMPLES WITH RESPECT TO P1, P2 AND BLENDS

TECHNICAL REPORT SUMMARY EWOYAA LITHIUM PROJECT Page 129 of 368 10.5.1 Fractional HLS Tests Fractional HLS tests were conducted to provide more incremental data on the gravity splits by size fraction. Ewoyaa Starter was chosen for this exercise because the sample was developed to represent the first deposit to be processed. The sample with a head grade of 1.72% Li2O, was crushed to 10 mm, then screened at 4 mm, 2 mm, 1 mm and 0.5 mm. The individual size fractions were then split by HLS at 9 different SG fractions. TABLE 10-8 SCREENING RESULTS Fraction Mass % Grade Deportment % Li2O % Fe2O3 Li2O Fe2O3 +4 mm 64.0 1.59 0.34 62.9% 59.5% +2 mm 15.6 1.77 0.37 17.2% 15.7% +1 mm 7.4 1.68 0.34 7.7% 6.8% +0.5 mm 5.0 1.77 0.39 5.4% 5.3% -0.5 mm 8.0 1.39 0.59 6.9% 12.8% The wet screening highlights two features of the crushed material: • Lithium and iron show very little preferential deportment – both generally split according to the mass split; and • 64% of the mass is +4 mm which means a lot of the material is grouped in the +4 mm fraction. Future tests will look at 5-, 6- and 8-mm sizes to obtain more detail at the coarser fractions. The individual size fractions from wet screening were then split by HLS at nine different SGs; results are shown summarised as a chart in Figure 10-7. This data confirms that both grade and recovery improve at the finer fractions. This indicates improving mineral liberation as the particle sizes decrease. The +4 mm fraction produces a cumulative 6% concentrate at a recovery of ~53%, the +2 mm fraction at ~81% recovery, the +1 mm fraction at ~90% recovery, and the +0.5 mm fraction at ~92% recovery. It should be noted that that the Ewoyaa Starter sample was an exceptional sample in terms of both grade and recovery performance. The head grade of 1.72% was significantly higher than the average resource grade of 1.3% Li2O. Also, none of the composite samples which constitute the Ewoyaa Starter sample were able to achieve the same performance as Ewoyaa Starter fractional HLS. TECHNICAL REPORT SUMMARY EWOYAA LITHIUM PROJECT Page 130 of 368 FIGURE 10-7 GRADE VS RECOVERY CURVE FOR FRACTIONAL HLS RESULTS 10.6 DENSE MEDIA SEPARATION Bulk composites from Ewoyaa Starter, Ewoyaa Main and Anokyi were prepared for processing through a pilot scale DMS plant utilising a 250 mm diameter DMS cyclone (DMS-250). The samples were crushed to 10 mm and screened at 1 mm. A second sample of Ewoyaa Starter was screened at 0.5 mm for comparison. The composites were made up with the amount of P2 thought to be in each deposit at the time; 10% P2 for Ewoyaa Starter; Nil for Anokyi and 34% P2 for Ewoyaa Main. These percentages were subsequently revised to 31% for Ewoyaa Starter; 2% for Anokyi and 44% for Ewoyaa Main. These percentages represent the deposit life of mine throughputs, however, the actual quantity of P2 expected in feed to the DMS feed is possible to be controlled further by the mine plan. The plant was run at media densities to provide cut points at SG 2.6, 2.7, 2.8, and 2.9. On each test, the middlings (or 2.8 and 2.9 floats) were re-crushed at 6.3 mm, screened at 1 mm and re-run at SGs of 2.7 and 2.9. The results of these bulk tests are presented in full in the Nagrom report T3020, and the following Table 10-9 and Table 10-10 provide a summary. TECHNICAL REPORT SUMMARY EWOYAA LITHIUM PROJECT Page 131 of 368 TABLE 10-9 DMS-250 RESULTS BEFORE MIDDLINGS RE-CRUSH TO 6.3MM Deposit Size range (mm) Fraction Mass Yield Deportment Grade (%) Li2O Fe2O3 K2O Na2O Li2O Fe2O3 (K2O +Na2O) Ewoyaa Starter 90% P1 + 10% P2 Head 1.73 0.39 -1 Fines 16.3% 14.8% 22.0% 14.9% 17.1% 1.57 0.52 -10+1 Feldspar 9.1% 1.0% 2.8% 20.9% 11.3% 0.19 0.12 10.00 -10+1 Concentrate 16.4% 59.5% 33.1% 4.4% 3.0% 6.20 0.77 1.31 -10+1 Middlings 58.2% 24.8% 42.1% 59.8% 68.6% 0.53 0.28 Ewoyaa Starter 90% P1 + 10% P2 Head 1.74 0.37 -0.5 Fines 10.4% 8.8% 17.0% 9.6% 10.9% 1.39 0.58 -10+0.5 Feldspar 10.3% 0.9% 3.1% 22.7% 12.8% 0.15 0.12 10.05 -10+0.5 Concentrate 16.9% 62.5% 39.2% 4.6% 3.4% 6.31 0.94 1.41 -10+0.5 Middlings 62.4% 27.8% 40.6% 63.2% 72.9% 0.76 0.26 Anokyi Main 100% P1 Head 1.94 0.40 -1 Fines 13.1% 10.0% 17.4% 11.0% 14.3% 1.48 0.53 -10+1 Feldspar 31.5% 2.3% 9.3% 56.9% 43.2% 0.14 0.12 9.22 -10+1 Concentrate 21.9% 67.7% 43.1% 5.7% 4.5% 5.86 0.81 1.36 -10+1 Middlings 33.5% 19.9% 30.2% 26.4% 38.0% 1.12 0.37 Ewoyaa Main 66% P1 + 34% P2 Head 1.18 0.30 -1 Fines 14.7% 15.5% 21.9% 14.2% 14.0% 1.18 0.48 -10+1 Feldspar 41.5% 5.4% 17.6% 60.5% 50.9% 0.16 0.14 9.21 -10+1 Concentrate 9.4% 45.1% 23.4% 2.8% 1.7% 5.73 0.81 1.59 -10+1 Middlings 34.4% 34.0% 37.2% 22.5% 33.4% 1.18 0.35 TABLE 10-10 DMS-250 RESULTS AFTER MIDDLINGS RE-CRUSH TO 6.3MM Deposit Size range (mm) Fraction Mass Yield Deportment Grade (%) Li2O Fe2O3 K2O Na2O Li2O Fe2O3 (K2O + Na2O) Ewoyaa Starter 90% P1 + 10% P2 Head 1.83 0.40 -1 Fines 19.6% 15.9% 26.9% 20.7% 19.3% 1.49 0.55 -10+1 Feldspar 35.6% 3.7% 11.6% 54.9% 49.4% 0.19 0.13 8.55 -10+1 Concentrate 21.4% 66.3% 41.7% 7.4% 5.6% 5.68 0.78 1.73 -6.3+1 Rejects 23.4% 14.1% 19.8% 17.1% 25.7% 1.10 0.34 Ewoyaa Starter Head 1.79 0.40 TECHNICAL REPORT SUMMARY EWOYAA LITHIUM PROJECT Page 132 of 368 90% P1 +10% P2 -0.5 Fines 13.2% 9.5% 19.9% 12.1% 13.9% 1.30 0.60 -10+0.5 Feldspar 42.0% 4.5% 12.1% 65.0% 55.5% 0.19 0.11 8.62 -10+0.5 Concentrate 22.1% 71.2% 48.9% 7.5% 6.0% 5.75 0.88 1.82 -6.3+0.5 Rejects 22.8% 14.8% 19.2% 15.5% 24.6% 1.16 0.34 Anokyi Main 100% P1 Head 1.97 0.42 -1 Fines 16.9% 12.2% 22.2% 15.6% 16.9% 1.42 0.55 -10+1 Feldspar 44.3% 3.9% 14.3% 67.7% 44.3% 0.17 0.14 8.45 -10+1 Concentrate 26.7% 75.3% 50.3% 8.4% 26.7% 5.54 0.79 1.65 -6.3+1 Rejects 12.1% 8.6% 13.1% 8.3% 12.1% 1.40 0.46 Ewoyaa Main 66% P1 + 34% P2 Head 1.21 0.33 -1 Fines 18.7% 19.4% 27.9% 16.0% 17.7% 1.25 0.49 -10+1 Feldspar 56.0% 10.0% 25.7% 72.2% 67.7% 0.21 0.15 8.60 -10+1 Concentrate 12.5% 54.9% 30.1% 4.7% 3.1% 5.28 0.79 2.14 -6.3+1 Rejects 12.8% 15.8% 16.3% 7.22% 11.5% 1.49 0.42 The first observation from the DMS-250 tests is the beneficial effect of a finer bottom size. Screening the Ewoyaa Starter ore at 0.5 mm compared to 1 mm has produced better grade (6.31% vs 6.20%), better stage mass yield (16.9% vs 16.4%) and better recovery (62.5% vs 59.5%). However, like fine crushing, there are practical limitations on fine screening, and equipment requirements increase significantly, hence a more practical bottom size of around 0.8-1 mm felt to be more appropriate for plant design. The second observation is the apparent deleterious effect on concentrate grade of re-crushing middlings – see Table 10-10. In all tests, the grades have dropped off significantly after re-crushing whereas mass yield and recovery have increased. This suggests that either the tests should have been run at a higher medium SG or contaminants such as mica have been released by further crushing. Time did not allow for either possible cause to be examined in more detail. Regardless, the benefits of re-crushing middlings have been ably demonstrated in a number of other projects. The final observation is the potential quantity of feldspar that may be produced from the different deposits. This varies from 9% to ~40% before re-crushing middlings and from ~30% to ~50% after re-crushing. This property of the ore will be studied in more detail in the next test series as feldspar production could be an important revenue stream for the life of the mine. Ongoing geological exploration and ore identification work on site is leading to a better understanding of the nature and content of the deposits. It is evident that P1 Fresh type ore is becoming more dominant to an extent that it may well be feasible to not treat any altered or P2 ore through the DMS plant. Current estimates are that P1Fresh ore will make up well over 80% of the total ore inventory. The implication of this is that lithium recovery from non-P1F ore will be by flotation (inferring a flotation plant is built), thus improving overall recovery. The response of non-P1F ores to flotation will be tested extensively in the next test series planned for H2 2023. 10.7 RHEOLOGY

TECHNICAL REPORT SUMMARY EWOYAA LITHIUM PROJECT Page 133 of 368 Test work to determine tailings rheology was conducted on a tailings sample formulated by Nagrom in the laboratory using selected composite samples. The tailings sample was created from the composites in the T3141 testwork series. The sample was created by sieving samples at 0.053 mm and 0.3 mm and combining the fractions at the following ratio: • -0.3 +0.053 mm (17% dry weight equivalent) • -0.053 mm (83% dry weight equivalent) The sample was used for both rheology and thickener testwork. The results from the rheology test work show no unusual behaviour, and unlikely to pose any difficulties in the event of a restart of the tailings line. The pumpability results also show the sample is very amenable to pumping at the target 55% solids tailings density. 10.8 THICKENING Due to thickener selection and sizing preceding test work completion in the project schedule, nominal values for settling rates were assumed for initial equipment selection. Test work indicated that the tailings’ settling rate is faster than estimated, as such, the tailings thickener sizing and selection is conservative. If left as is the extra thickener capacity should provide additional capacity which is likely to be beneficial throughout the life of the project. Settling tests identified the material had a relatively fast settling rate, however the recommendation was a higher thickener feed % solids than initially proposed (12% recommended vs 5% proposed). The risk of operating at lower thickener feed densities is reduced flocculation efficiency. The result of this is the plant design will have to allow for the thickener underflow recirculation pump to have capacity to provide enough recirculated material to achieve the required feed density. 10.9 RECOVERY SUMMARY The performance at key concentrate grades have been summarised from the test work data and are shown in Table 10-11 below. For the purpose of this document, recoveries attributable to P1 material and P2 material were partly based on HLS and DMS-250 test results and partly on calculation of assumed additional recovery from middlings. It should be noted that the HLS recovery represents the lab testwork using feed material from -10 +0.5 mm. The Plant Recoveries, account for increased fines generated in full scale crushing, increases to the DMS bottom size (1 mm and 0.85 mm), HLS to DMS efficiency and the use split size fractions, as well as (the minimum) expected benefit from re- crushing. TECHNICAL REPORT SUMMARY EWOYAA LITHIUM PROJECT Page 134 of 368 TABLE 10-11 FINAL DMS RECOVERIES BY SC GRADE AND % OF ORE TYPE Concentrate Grade Ore Type HLS Recovery Plant Recovery Plant Recovery (% Li2O) (% Li2O) (% Li2O) (% Li2O) -10+0.5 mm -10+0.85 mm -10+1.0 mm 5.50% >90% P1 74.4% 67.2% 64.9% >80% P2 25.0% 14.9% 12.6% 6.00% >90% P1 69.6% 62.1% 59.8% >80% P2 17.5% 7.0% 4.7% There is significant indicated recovery improvement for a bottom size of 0.85 mm compared to 1 mm and on the basis that the plant design can accommodate the finer bottom size, these numbers have been adopted for plant financial modelling and plant design. 10.9.1 Concentrate Quality A feature of both series of testwork has been the consistently good quality of concentrates produced. In the main, the DMS-250 results show the iron content of the concentrates, as expressed by % Fe2O3, as being regularly below 1% and total alkalis (Na2O + K2O) to be less than 3%. Coupled with the coarse size of the concentrates, these are desirable properties for offtakers. 10.10 OPPORTUNITIES & BY-PRODUCT POTENTIAL 10.10.1 Secondary Products Due to the current lithium market conditions, considerable interest has been shown from potential offtakers in direct shipping ore and secondary streams of lower grade materials from the plant. Based on work done to date and indicated by the DMS-250 results, potential sales volumes of suitable materials are shown in Table 10-12. TABLE 10-12 ESTIMATE OF POTENTIAL ADDITIONAL PRODUCTS Product % of plant feed tonnage Size range (mm) Grade % Li2O P2 type ore (direct shipped) n/a not linked -125 1.1 - 1.2 Feldspar (future product) ~20% - 40% -10+1 n/a The implications of being able to sell such products directly are significant in terms of: • Plant capacity; • Space required for tailings/waste disposal; • The need to build, or timing of building, a flotation plant; and • Potential early/additional cashflow. TECHNICAL REPORT SUMMARY EWOYAA LITHIUM PROJECT Page 135 of 368 10.10.2 Feldspar It had previously been recognised that the Ewoyaa ores contain significant quantities of feldspar – feldspar being defined as aluminosilicates containing a combined alkali content (Na2O + K2O) of greater than 10%. Table 10-12 outlines the quantities of feldspar that may be produced from the Project, and this is confirmed by the quantity of product produced in the DMS-250 runs. The current thinking is to install an additional feldspar DMS circuit to improve the grade of the DMS first phase floats to ensure the grade is consistently greater than 10% K2O+Na2O. The feldspar products from the DMS-250 runs were nominally high in iron content at 0.12-0.15% Fe2O3 – good feldspar should contain less than 0.1% Fe2O3. Hence a test was done to determine if iron could be removed by either tabling or high intensity magnetic separation (WHGMS). A sample of feldspar from the Ewoyaa Starter run containing 0.13% Fe2O3 was crushed to 0.5 mm and split into two parts. One part was passed over a vibrating table and a nominal amount of iron removal resulted. The other part was processed through a WHGMS at 17000 gauss and the iron content was lowered to 0.04% for the loss of only 3.1% mass. The feldspar grade, measured by the combined alkalis, increased from 10.1% to 10.2%. TABLE 10-13 SUMMARY OF THE MAGNETIC SEPARATION TO REMOVE IRON Sample Summary Assay (%) Mass Yield % Deportment Li2O Fe2O3 K2O + Na2O Li2O Fe2O3 Head 0.151 0.133 10.134 100 100 100 Magnetics 1.395 2.922 7.651 3.11 28.75 68.58 Non-magnetics 0.11 0.043 10.21 96.89 71.25 31.42 The positive results are summarised in Table 10-13 and demonstrated low iron products could be produced where required. Samples before and after magnetic separation were prepared and sent to a potential offtaker in Europe for initial assessment. The feedback was that the feldspar from Ewoyaa was considered very acceptable material. A feldspar marketing study was commissioned, and negotiations are continuing with offtakers for price and quantity indications for the material. 10.10.3 Ore Sorting to Recover Feldspar A sighter ore sorting test was done at Tomra to see if a saleable feldspar product could be produced cheaply. The machine was set up to try and optically discriminate between feldspar and pegmatite using an X-Ray Transmission (XRT) sensor. At the time composites of what were thought to be P1 type ore were used, but subsequent re-classification during the test programme meant that a mixture of P1 and P2 was used from Ewoyaa deposit, and this may have influenced the result. The results obtained are tabulated below. The core was crushed to 20 mm and screened at 10 mm. The -20 +10 mm fraction (59% of the mass) was processed through the ore sorter. TECHNICAL REPORT SUMMARY EWOYAA LITHIUM PROJECT Page 136 of 368 TABLE 10-14 FELDSPAR PRODUCTION USING ORE SORTER Fraction Li2O K2O Na2O Mass % % Deportment % Deportment % Deportment Feed 1.28 100% 3.21 100% 4.10 100% 100% Feldspar Product 0.51 10% 8.09 64% 3.09 19% 25% Lithium Product 1.54 90% 1.55 36% 4.45 81% 75% The results were encouraging from several aspects: • 90% of the lithium reported to a lithium product in 75% of the mass and an upgrade from 1.3% to 1.5% Li2O was achieved; and • A feldspar product was achieved in 25% of the mass containing 64% of the potassium and improving the combined alkalis (K2O + Na2O) from 7.3% in the feed to 11.2% in the feldspar fraction. Although not immediately applicable to the current flow sheet, this technique may be further considered for either removing feldspar as a primary upgrade technique for low grade ores prior to treatment in the DMS. 10.10.4 Flotation The DMS-250 tests reported in DMS section 10.6 show the overall rejects after re-crushing, represent a significant loss of lithium units. Results are reiterated below in Table 10-15. TABLE 10-15 LOSS OF LITHIUM TO GRAVITY MIDDLINGS Sample % P2 Fraction Mass % Grade % Li2O Lithium Deportment Ewoyaa Starter 10 DMS Reject 23.4 1.10 14.1% Anokyi 0 DMS Reject 12.1 1.40 8.6% Ewoyaa Main 34 DMS Reject 12.8 1.49 15.8% Sighter flotation tests were conducted on each of the three reject fractions and the results are reported in Nagrom T3020B.The flotation procedure involved the following steps: • Grind to the nominated size fraction – p80 = 106 microns in this case. • Deslime at 20 microns using a wet screen. It is necessary to deslime to prevent excess reagent usage and uncontrolled deportment of very fine material to the concentrate. • Magnetic separation of the +20µm fraction to remove high iron minerals. • The deslimed, non-magnetic fraction was then used for flotation. However, there was a loss of lithium units associated with the slime and magnetic fractions removed. See last column of Table 10-16 below – this amounts to 17–19%.

TECHNICAL REPORT SUMMARY EWOYAA LITHIUM PROJECT Page 137 of 368 TABLE 10-16 FLOTATION FEED PREP Sample Desliming Magnetic Separation To Flotation Grade Deportment Grade Deportment Mass Lithium Li2O % Mass % Li2O % Li2O % Mass % Li2O % % % Ewy Starter Head 1.11 Head 1.51 -20um 0.93 16.2 13.6 Mags 3.47 2.1 6.2 +20um 1.15 83.8 86.4 N-mags 1.11 97.9 93.8 82.1 81.0 Anokyi Head 1.38 Head 1.48 -20um 1.13 16.8 13.8 Mags 4.05 2.0 5.5 +20um 1.43 83.2 86.2 N-Mags 1.43 98.0 94.5 81.5 81.5 Ewy Main Head 1.51 Head 1.67 -20um 1.16 18.0 13.8 Mags 4.19 1.8 4.4 +20um 1.59 82.0 86.2 N-Mags 1.62 98.2 95.6 80.6 82.4 The tests performed were sighter flotation tests and do not represent an optimised set of conditions. Lithium recoveries for the spodumene flotation stage of 97% to 98.3% were recorded to rougher concentrate, with tails of 0.03% to 0.07% Li2O being achieved. Concentrate grades were low at 3-4% Li2O, however these were only rougher tests. Re-cleaner tests were then completed to gauge the grade improvement and effect on mass yield. Grades improved to 4.2% to 5.3% Li2O at mass yields of 27% to 31% and lithium recoveries for the spodumene flotation stage of 96-98%. When coupled with the loss due to slimes and the magnetic fraction, overall testwork recoveries in the order of 78- 80% Li2O of lower grade concentrate (~5% Li2O) might be expected. However, slimes losses via a cyclone rather than a wet screen are expected to be higher (~20%). Also, spodumene flotation may not perform as well in recirculated site process water compared to laboratory testwork. As such, recoveries in the order of 60-68% Li2O might be reasonably expected from a flotation plant. These results are considered highly encouraging and, in all likelihood, would support the design of a flotation plant to treat fines and middlings from the gravity plant if direct sales of these products did not eventuate. As part of the ongoing metallurgical test programme, further flotation tests are underway to further understand the opportunity to utilise flotation as part of future processing opportunities. TECHNICAL REPORT SUMMARY EWOYAA LITHIUM PROJECT Page 138 of 368 11.0 MINERAL RESOURCE ESTIMATES 11.1 GEOLOGICAL MODELLING 11.1.1 Overview Geological and resource modelling was undertaken by Shaun Searle, Director of Ashmore Advisory Pty Ltd (“Ashmore”). Ashmore operates as an independent technical consultant providing Mineral Resource evaluation services to the resources industry. Shaun Searle is a Member of the Australian Institute of Geoscientists. Mr Searle has sufficient experience to qualify as a Qualified Person as defined in S-K 1300. 11.1.2 Software and Preliminary Statistical Assessment Wireframes were created in Surpac software by Ashmore. The lithium mineralisation is confined to pegmatite geology. A statistical analysis of the assay values indicated a natural cut-off of approximately 0.4% Li2O (Figure 11-1). Therefore, Ashmore created mineralisation wireframes within the pegmatite units at a 0.4% Li2O cut-off and a minimum down-hole intersection of 2 to 3 m. No edge dilution was incorporated into the lithium mineralisation wireframes, with some thin internal dilution incorporated to maintain continuity of the wireframes. FIGURE 11-1 LOG HISTOGRAM AND LOG PROBABILITY PLOTS OF THE RAW ASSAYS AT ELP 11.1.3 Mineralisation, Lithology, Weathering, Structure and Alteration Wireframes were created in Surpac software by Ashmore. Pegmatite wireframes were created based on geological logging, with a total of 48 pegmatite domains (‘ewoyaa_peg_202211.dtm’). Additional lithium mineralisation wireframes were created within the pegmatite units, with a total of 87 lithium domains (‘ewoyaa_0pt4_res_202211.dtm’). The wireframes were created and used to select the sample data to be used for grade estimation, and to constrain the block model for estimation purposes. The mineralisation wireframes were treated as hard boundaries for all estimation purposes, that is, only assays from within each wireframe were used to estimate blocks within that wireframe. TECHNICAL REPORT SUMMARY EWOYAA LITHIUM PROJECT Page 139 of 368 The Surpac Object numbers within the pegmatites were labelled domains 101 to 153 (excluding 111, 113 and 124) and the lithium Surpac Object numbers were labelled domains 1 to 88 (excluding 75). A plan view of the Ewoyaa mineralisation and drilling is shown below in Figure 11-2; a long section and cross section of the wireframes and drilling are shown in Figure 11-3 and Figure 11-4 respectively. In addition to the pegmatite wireframes, granitoid wireframes were created (‘ewoyaa_gtd_ 202211.dtm’). Blocks outside the pegmatite and granitoid wireframes were assumed to be pelitic schist. Weathering surfaces were prepared by Ashmore using the geological logging data. Surfaces were created for the base of transported cover ‘ewoyaa_botr_202211.dtm’, base of complete oxidation ‘ewoyaa_boco_202211.dtm’ and top of fresh rock ‘ewoyaa_tofr_202211.dtm’. As lithium is a mobile element during weathering processes, Ashmore restricted the coding of the mineralisation domains to the transitional and fresh material types. In addition, the top of fresh rock surface was used as a hard boundary for the interpolation. A topographic surface was generated from a LiDAR survey. The supplied data was renamed by Ashmore to ‘ewoyaa_topo_202202.dtm’ TECHNICAL REPORT SUMMARY EWOYAA LITHIUM PROJECT Page 140 of 368 FIGURE 11-2 PLAN VIEW OF EWOYAA WIREFRAMES AND DRILLING (Solid Colours = Resource Wireframes, Wireframe Edges = Pegmatite Wireframes)

TECHNICAL REPORT SUMMARY EWOYAA LITHIUM PROJECT Page 141 of 368 FIGURE 11-3 LONG SECTION Z-Z’ OF EWOYAA MAIN WIREFRAMES AND DRILLING (View towards 300°; Solid Colours = Resource Wireframes, Wireframe Edges = Pegmatite Wireframes) TECHNICAL REPORT SUMMARY EWOYAA LITHIUM PROJECT Page 142 of 368 FIGURE 11-4 CROSS-SECTION A-A’ OF EWOYAA WIREFRAMES AND DRILLING TECHNICAL REPORT SUMMARY EWOYAA LITHIUM PROJECT Page 143 of 368 11.2 STATISTICAL AND GEOSTATISTICAL ANALYSIS 11.2.1 Data Coding and Composite Length Selection The wireframes of the mineralised zones were used to define the mineralised intersections. These were coded into the ‘res_zone’ table within the database. Samples from within the wireframes were used to conduct a sample length analysis within the mineralised lodes. The majority of samples were 1 m in length. FIGURE 11-5 SAMPLE LENGTHS INSIDE WIREFRAMES Surpac software was then used to extract ‘fixed length’ 1 m down-hole composites within the intervals coded as resource intersections. The composites were checked for spatial correlation with the objects, the location of the rejected composites and zero composite values. Individual composite files were created for each of the individual domains in the wireframe models. 11.2.2 Statistical Analysis The composite data was imported into Supervisor software for analysis. There were 87 lodes in the resource wireframes. The Li2O statistics are shown in Table 11-1 to Table 11-5 and Li2O statistical plots for the largest unit, Domain 1 are shown in Figure 11-6. Analysis of the statistics indicates that the composite data has low CVs for the vast majority of elements, therefore high-grade cuts were not warranted. TECHNICAL REPORT SUMMARY EWOYAA LITHIUM PROJECT Page 144 of 368 FIGURE 11-6 LI2O STATISTICAL PLOTS FOR DOMAIN 1 TABLE 11-1 LI2O 1M COMPOSITE STATISTICS FOR MINERALISED LODES Domain 1 2 3 4 5 6 7 8 9 10 11 12 13 14 15 Samples 3,247 2,060 1,040 546 343 425 812 650 220 137 123 469 73 239 164 Minimum 0.02 0.03 0.04 0.03 0.06 0.07 0.01 0.07 0.09 0.11 0.07 0.05 0.11 0.25 0.05 Maximum 5.85 2.96 3.64 2.92 5.40 2.82 5.03 4.14 3.41 3.41 2.03 4.44 3.24 3.65 4.24 Mean 1.37 1.20 1.15 1.06 1.31 1.42 1.48 1.48 1.22 1.12 0.90 1.34 1.24 1.31 1.42 Std Dev 0.65 0.51 0.56 0.53 0.67 0.48 0.72 0.62 0.63 0.61 0.42 0.73 0.58 0.56 1.00 CV 0.47 0.43 0.49 0.50 0.51 0.34 0.48 0.42 0.51 0.54 0.47 0.54 0.47 0.43 0.71 Variance 0.42 0.26 0.31 0.28 0.45 0.23 0.51 0.38 0.39 0.37 0.18 0.53 0.34 0.32 1.01 10% 0.47 0.47 0.34 0.35 0.42 0.73 0.44 0.63 0.28 0.41 0.32 0.36 0.50 0.60 0.29

TECHNICAL REPORT SUMMARY EWOYAA LITHIUM PROJECT Page 145 of 368 20% 0.81 0.74 0.54 0.54 0.74 1.03 0.87 1.00 0.55 0.57 0.49 0.58 0.62 0.74 0.43 30% 1.03 0.94 0.82 0.71 0.94 1.23 1.14 1.22 0.87 0.72 0.63 0.91 0.80 0.94 0.66 40% 1.22 1.10 1.06 0.87 1.09 1.38 1.35 1.40 1.11 0.91 0.79 1.21 1.05 1.14 0.89 50% 1.38 1.23 1.24 1.08 1.28 1.51 1.55 1.54 1.32 1.09 0.90 1.42 1.19 1.27 1.25 60% 1.53 1.35 1.36 1.21 1.43 1.60 1.69 1.65 1.48 1.25 1.03 1.58 1.40 1.45 1.45 70% 1.68 1.48 1.50 1.33 1.64 1.70 1.83 1.78 1.61 1.37 1.16 1.73 1.53 1.59 1.90 80% 1.87 1.62 1.63 1.50 1.80 1.79 2.00 1.91 1.75 1.53 1.26 1.93 1.76 1.76 2.26 90% 2.16 1.80 1.81 1.76 2.09 1.93 2.27 2.15 1.97 1.85 1.49 2.21 1.94 2.04 2.94 95% 2.41 1.98 1.98 1.95 2.40 2.05 2.53 2.40 2.10 2.07 1.58 2.42 2.16 2.25 3.43 97.50% 2.71 2.20 2.11 2.09 2.65 2.26 2.98 2.62 2.26 2.57 1.71 2.75 2.22 2.52 3.52 99% 3.01 2.43 2.34 2.32 3.15 2.49 3.37 3.22 2.41 2.86 1.72 3.17 2.49 2.65 4.04 TABLE 11-2 LI2O 1M COMPOSITE STATISTICS FOR MINERALISED LODES (CONT.) Domain 16 17 18 19 20 21 22 23 24 25 26 27 28 29 30 Samples 177 19 163 90 66 78 30 38 42 85 38 33 18 19 10 Minimum 0.04 0.44 0.21 0.11 0.19 0.21 0.29 0.10 0.05 0.08 0.13 0.14 0.44 0.43 0.14 Maximum 4.45 3.10 2.79 3.55 2.75 2.72 1.84 3.69 2.83 2.45 2.38 2.18 2.56 2.21 3.42 Mean 1.31 1.72 1.48 1.44 1.14 1.38 1.05 1.61 1.01 1.04 0.80 1.15 1.17 1.03 1.14 Std Dev 0.73 0.77 0.52 0.72 0.56 0.72 0.47 0.90 0.73 0.56 0.52 0.52 0.71 0.51 1.05 CV 0.55 0.44 0.35 0.50 0.49 0.52 0.45 0.56 0.72 0.53 0.66 0.46 0.61 0.50 0.91 Variance 0.53 0.59 0.27 0.51 0.31 0.52 0.22 0.81 0.53 0.31 0.27 0.28 0.51 0.26 1.09 10% 0.34 0.92 0.69 0.45 0.37 0.30 0.37 0.42 0.07 0.29 0.22 0.31 0.44 0.54 0.14 20% 0.62 1.11 1.02 0.71 0.57 0.56 0.57 0.85 0.26 0.47 0.31 0.57 0.48 0.57 0.25 30% 0.84 1.20 1.27 0.89 0.81 1.00 0.70 1.06 0.47 0.69 0.35 0.90 0.58 0.67 0.45 40% 1.09 1.30 1.42 1.21 0.96 1.16 0.84 1.21 0.67 0.86 0.54 1.07 0.73 0.77 0.71 50% 1.30 1.55 1.53 1.43 1.18 1.38 0.98 1.27 0.94 1.00 0.70 1.19 0.76 0.87 0.93 60% 1.52 1.72 1.61 1.63 1.25 1.60 1.17 1.78 1.12 1.15 0.81 1.39 1.11 0.94 0.95 TECHNICAL REPORT SUMMARY EWOYAA LITHIUM PROJECT Page 146 of 368 70% 1.69 1.80 1.79 1.83 1.42 1.87 1.29 2.19 1.28 1.31 1.05 1.49 1.58 1.07 0.96 80% 1.87 2.31 1.93 1.97 1.65 2.10 1.53 2.35 1.61 1.50 1.21 1.59 1.88 1.38 1.04 90% 2.16 3.00 2.05 2.37 1.77 2.31 1.68 2.69 2.01 1.76 1.52 1.70 2.14 1.69 2.59 95% 2.51 3.02 2.20 2.61 1.93 2.36 1.78 3.07 2.15 2.04 1.60 1.81 2.26 2.07 3.00 97.50% 2.78 3.06 2.43 2.77 2.13 2.55 1.81 3.15 2.52 2.26 1.67 1.89 2.41 2.14 3.21 99% 2.96 3.08 2.68 2.98 2.45 2.67 1.83 3.48 2.70 2.40 2.09 2.06 2.50 2.18 3.33 TABLE 11-3 LI2O 1M COMPOSITE STATISTICS FOR MINERALISED LODES (CONT.) Domain 31 32 33 34 35 36 37 38 39 40 41 42 43 44 45 Samples 60 26 38 52 6 22 34 29 8 49 19 99 5 51 10 Minimum 0.13 0.34 0.47 0.09 0.21 0.20 0.02 0.12 0.39 0.07 0.02 0.07 0.51 0.10 0.18 Maximum 3.72 2.59 3.28 1.82 1.83 2.62 1.73 2.00 1.69 1.78 1.42 3.13 1.39 3.76 4.23 Mean 1.47 1.19 1.43 0.92 0.79 0.93 0.86 0.88 1.00 0.71 0.54 1.11 0.88 1.39 1.95 Std Dev 0.57 0.54 0.73 0.50 0.60 0.63 0.47 0.49 0.46 0.48 0.43 0.67 0.44 0.78 1.42 CV 0.38 0.45 0.51 0.54 0.76 0.68 0.54 0.56 0.46 0.68 0.80 0.60 0.50 0.56 0.73 Variance 0.32 0.29 0.54 0.25 0.36 0.39 0.22 0.24 0.21 0.23 0.19 0.44 0.19 0.61 2.02 10% 0.77 0.46 0.61 0.21 0.21 0.23 0.13 0.28 0.39 0.17 0.05 0.32 0.51 0.39 0.18 20% 1.01 0.78 0.77 0.40 0.22 0.40 0.38 0.36 0.39 0.21 0.09 0.52 0.51 0.50 0.39 30% 1.25 0.86 0.94 0.54 0.26 0.54 0.62 0.50 0.56 0.31 0.21 0.70 0.52 1.00 0.84 40% 1.40 0.98 1.03 0.71 0.38 0.64 0.69 0.67 0.83 0.42 0.33 0.85 0.53 1.30 0.89 50% 1.50 1.03 1.19 0.99 0.56 0.70 0.87 0.78 0.91 0.56 0.43 1.02 0.59 1.41 1.94 60% 1.58 1.29 1.48 1.17 0.74 0.83 1.02 0.99 1.17 0.90 0.52 1.22 0.65 1.48 2.10 70% 1.65 1.52 1.69 1.24 0.89 1.11 1.10 1.13 1.26 1.04 0.73 1.39 0.99 1.66 2.24 80% 1.77 1.60 1.97 1.38 0.97 1.23 1.21 1.18 1.30 1.19 0.83 1.59 1.33 1.88 2.58 90% 1.98 1.78 2.40 1.56 1.33 1.82 1.46 1.50 1.40 1.37 1.14 1.97 1.36 2.27 4.09 95% 2.21 1.91 2.97 1.65 1.58 2.04 1.61 1.69 1.54 1.45 1.24 2.21 1.37 2.80 4.16 97.50% 2.58 2.18 3.05 1.72 1.70 2.31 1.71 1.84 1.62 1.49 1.33 2.95 1.38 3.01 4.19 TECHNICAL REPORT SUMMARY EWOYAA LITHIUM PROJECT Page 147 of 368 99% 3.20 2.43 3.19 1.78 1.78 2.50 1.73 1.94 1.66 1.65 1.38 2.99 1.39 3.40 4.21 TABLE 11-4 LI2O 1M COMPOSITE STATISTICS FOR MINERALISED LODES (CONT.) Domain 46 47 48 49 50 51 52 53 54 55 56 57 58 59 60 Samples 21 24 5 8 8 5 4 90 85 34 32 21 29 6 7 Minimum 0.33 0.17 0.55 0.75 0.31 0.25 0.48 0.22 0.17 0.15 0.19 0.19 0.15 0.41 0.99 Maximum 2.32 2.13 2.59 2.25 1.27 2.91 1.77 2.78 3.20 2.77 2.67 2.55 2.87 1.99 3.70 Mean 0.99 1.04 1.79 1.49 0.71 1.07 1.24 1.26 1.38 1.33 0.97 1.15 0.93 1.35 2.30 Std Dev 0.51 0.59 0.78 0.52 0.37 1.06 0.62 0.53 0.67 0.68 0.65 0.60 0.70 0.62 1.05 CV 0.51 0.57 0.44 0.35 0.52 0.99 0.50 0.42 0.48 0.51 0.67 0.52 0.75 0.46 0.46 Variance 0.26 0.35 0.61 0.27 0.14 1.12 0.38 0.28 0.44 0.46 0.42 0.36 0.49 0.38 1.11 10% 0.42 0.25 0.55 0.75 0.31 0.25 0.48 0.50 0.51 0.52 0.27 0.41 0.16 0.41 0.99 20% 0.47 0.42 0.55 0.81 0.37 0.25 0.48 0.75 0.70 0.62 0.44 0.62 0.21 0.50 1.14 30% 0.57 0.56 1.14 1.02 0.44 0.40 0.58 0.97 0.99 0.89 0.55 0.74 0.43 0.75 1.37 40% 0.80 0.75 1.73 1.33 0.48 0.54 0.80 1.21 1.15 1.01 0.66 0.85 0.65 1.02 1.40 50% 0.89 1.00 1.77 1.51 0.48 0.63 1.01 1.28 1.37 1.24 0.77 1.00 0.76 1.31 1.98 60% 1.03 1.18 1.81 1.64 0.62 0.73 1.29 1.37 1.59 1.46 1.03 1.15 0.86 1.57 2.59 70% 1.16 1.44 2.05 1.69 0.79 0.82 1.57 1.50 1.70 1.69 1.05 1.37 1.11 1.76 2.75 80% 1.36 1.56 2.29 1.80 1.01 0.92 1.72 1.65 1.89 1.94 1.44 1.68 1.36 1.77 3.10 90% 1.60 1.75 2.44 2.00 1.23 1.92 1.74 1.84 2.19 2.24 1.84 1.94 1.82 1.86 3.44 95% 1.68 1.96 2.52 2.13 1.25 2.41 1.76 2.08 2.48 2.34 2.23 1.99 2.20 1.93 3.57 97.50% 1.98 2.05 2.56 2.19 1.26 2.66 1.76 2.24 2.65 2.47 2.65 2.26 2.40 1.96 3.63 99% 2.18 2.10 2.58 2.23 1.27 2.81 1.77 2.48 2.80 2.65 2.66 2.44 2.68 1.98 3.67 TABLE 11-5 LI2O 1M COMPOSITE STATISTICS FOR MINERALISED LODES (CONT.) Domain 61 62 63 64 65 66 67 68 69 70 71 72 73 74 Samples 7 76 9 8 36 26 152 53 18 10 13 14 35 23 Minimum 0.54 0.18 0.30 0.25 0.27 0.25 0.04 0.27 0.27 0.38 0.50 0.39 0.06 0.21 Maximum 3.47 3.74 1.39 1.69 2.49 2.33 5.20 2.66 2.54 1.88 3.16 1.89 4.13 2.18 TECHNICAL REPORT SUMMARY EWOYAA LITHIUM PROJECT Page 148 of 368 Mean 1.78 1.50 0.85 0.78 1.32 1.39 1.49 1.36 1.01 0.95 1.39 0.97 1.02 0.96 Std Dev 1.20 0.80 0.41 0.49 0.60 0.69 0.84 0.61 0.72 0.56 0.97 0.49 0.98 0.60 CV 0.67 0.53 0.49 0.63 0.45 0.49 0.56 0.45 0.72 0.59 0.70 0.51 0.96 0.63 Variance 1.44 0.63 0.17 0.24 0.36 0.47 0.70 0.37 0.52 0.31 0.94 0.24 0.96 0.36 10% 0.54 0.50 0.30 0.25 0.48 0.48 0.36 0.47 0.30 0.38 0.54 0.41 0.10 0.25 20% 0.54 0.73 0.34 0.29 0.76 0.71 0.66 0.75 0.38 0.42 0.67 0.47 0.17 0.35 30% 0.57 0.86 0.43 0.37 1.02 0.86 0.99 0.96 0.47 0.48 0.69 0.51 0.23 0.40 40% 0.67 1.18 0.56 0.49 1.12 1.01 1.27 1.16 0.55 0.55 0.72 0.60 0.36 0.75 50% 1.31 1.40 0.82 0.64 1.21 1.31 1.56 1.42 0.79 0.59 0.83 0.84 0.69 0.88 60% 2.04 1.69 1.05 0.73 1.45 1.64 1.71 1.56 0.95 0.84 1.10 1.13 0.99 1.01 70% 2.45 1.90 1.12 0.83 1.55 1.99 1.85 1.70 1.10 1.23 1.29 1.19 1.29 1.15 80% 2.68 2.19 1.16 1.05 1.81 2.17 2.05 1.85 1.30 1.45 2.29 1.33 1.85 1.45 90% 3.00 2.54 1.24 1.37 2.12 2.27 2.48 2.12 2.18 1.64 2.88 1.56 2.22 1.83 95% 3.24 2.73 1.32 1.53 2.36 2.29 2.75 2.35 2.51 1.76 2.98 1.74 2.53 2.00 97.50% 3.36 3.16 1.35 1.61 2.43 2.31 3.17 2.56 2.53 1.82 3.07 1.81 3.03 2.08 99% 3.43 3.36 1.38 1.66 2.47 2.32 3.53 2.61 2.54 1.85 3.12 1.86 3.69 2.14 11.2.3 Correlation Analysis Correlation matrices for the largest lithium domain are shown below in Table 11-6. The Li2O has little correlation with any of the other elements presented in the table, apart from weak negative correlations with caesium and potassium. Scatter plots for Domain 1 are shown in Figure 11-7. TABLE 11-6 DOMAIN 1 CORRELATION MATRIX li2o_pt ta_ppm fe_pct nb_ppm sn_ppm cs_ppm k_pct al_pct s_ppm si_pct p_pct li2o_pct 1.00 ta_ppm -0.04 1.00 fe_pct -0.08 -0.01 1.00 nb_ppm -0.04 0.64 0.07 1.00 sn_ppm 0.41 0.25 0.08 0.35 1.00 cs_ppm -0.30 0.02 0.53 0.01 0.07 1.00 k_pct -0.38 -0.14 -0.11 -0.22 -0.38 0.45 1.00 al_pct 0.29 -0.01 -0.11 0.07 0.21 -0.05 0.02 1.00

TECHNICAL REPORT SUMMARY EWOYAA LITHIUM PROJECT Page 149 of 368 s_ppm -0.15 -0.02 0.69 0.01 -0.02 0.39 0.00 -0.09 1.00 si_pct 0.26 0.02 -0.36 -0.02 0.06 -0.42 -0.22 -0.12 -0.29 1.00 p_pct -0.12 0.02 0.11 0.19 -0.08 0.04 0.07 -0.22 0.05 -0.04 1.00 FIGURE 11-7 SCATTER PLOTS FOR DOMAIN 1 11.2.4 Geostatistical Analysis Variography Mineralisation continuity was examined via variography. Variography examines the spatial relationship between composites and seeks to identify the directions of mineralisation continuity and to quantify the ranges of grade continuity. Variography was also used to determine the random variability or ‘nugget effect’ of the deposit. The results provide the basis for determining appropriate kriging parameters for estimation. Variography was conducted on Domains 1, 2, 3, 4, 7 and 8. The 1-m composite data was imported into Supervisor software for analysis. A two-structured nested spherical model was found to model the experimental variogram reasonably well, although the variogram structure was reasonably poor. The down-hole variogram provides the best estimate of the true nugget value. TECHNICAL REPORT SUMMARY EWOYAA LITHIUM PROJECT Page 150 of 368 The orientation of the plane of mineralisation was aligned with the interpreted wireframe for the main domain. The experimental variograms were calculated with the first aligned along the main mineralisation continuity while the second was aligned in the plane of mineralisation at 90° to the first orientation. The third was orientated perpendicular to the mineralisation plane, across the width of the mineralisation. The directional variograms for Li2O for Domain 1 is shown in Figure 11-8. FIGURE 11-8 LI2O VARIOGRAMS FOR DOMAIN 1 Kriging Parameters The Li2O (%), Ta (ppm), Fe (%), Nb (ppm), Sn (ppm), Cs (ppm), K (%), Al (%), Si (%), P (%) and S (ppm) grades were interpolated into a Surpac block model using Ordinary Kriging (“OK”) using the nugget, sill values and ranges determined from the variogram models discussed in the previous section. The ranges obtained from the variogram models were used as a guide in the search ellipse parameters used in the estimate. Search ellipse parameters varied for all other lodes and were orientated to align with the strike and dip of their respective wireframe orientation. The kriging parameters for Domain 1 are summarised in TECHNICAL REPORT SUMMARY EWOYAA LITHIUM PROJECT Page 151 of 368 Table 11-7. Parameters for sulphur were derived from iron due to the high correlation between these elements. TECHNICAL REPORT SUMMARY EWOYAA LITHIUM PROJECT Page 152 of 368 TABLE 11-7 KRIGING PARAMETERS – DOMAIN 1 Assay Major Direction Co Structure 1 Structure 2 C1 A1 Maj/ Semi Maj/ Min C2 A2 Maj/Sem i Maj/ Min Li2O 00->030 0.14 0.43 13 1.44 3.25 0.43 61 2.03 4.07 Ta -38->018 0.13 0.37 41 3.73 5.86 0.50 158 4.05 3.29 Fe -28->019 0.11 0.67 50 0.94 1.09 0.22 117 1.23 1.58 Nb -19->025 0.19 0.24 25 3.57 3.57 0.57 142 3.84 3.09 Sn 00->030 0.16 0.36 22 4.40 5.50 0.48 92 1.08 1.61 Cs 00->030 0.12 0.26 60 0.81 4.29 0.62 190 1.36 1.74 K 00->040 0.20 0.39 11 0.85 2.20 0.41 38 1.65 2.24 Al -20-->036 0.15 0.48 15 1.88 2.14 0.37 40 1.14 1.82 11.2.5 Kriging Neighbourhood Analysis Kriging neighbourhood analysis (“KNA”) is conducted to minimise the conditional bias that occurs during grade estimation as a function of estimating block grades from point data. Conditional bias typically presents as overestimation of low-grade blocks and underestimation of high-grade blocks due to use of non-optimal estimation parameters and can be minimised by optimising parameters such as: • block size; • size of sample search neighbourhood; • number of informing samples; and • block discretisation. The degree of conditional bias present in a model can be quantified by computing the theoretical regression slope and kriging efficiency of estimation at multiple test locations within the region of estimation. These locations are selected to represent portions of the deposit with excellent, moderate and poor drill (sample) coverage. Block Size To test the optimal block size for existing drilling at the deposit, KNA was conducted within Supervisor for Domain 1. A range of block sizes were assessed for regression slope and kriging efficiency and are summarised in Figure 11-9. Analysis of the results shows that estimation quality declines with block sizes larger than run five. Ashmore selected the 10 m (X) by 10 m (Y) by 5 m (Z) block size to provide sufficient resolution of grades in the semi-major and minor directions and in consideration of two predominant mineralisation orientations of 30° and 100 to 120°.

TECHNICAL REPORT SUMMARY EWOYAA LITHIUM PROJECT Page 153 of 368 FIGURE 11-9 BLOCK SIZE ANALYSIS CHART – DOMAIN 1 Number of Informing Samples To test the optimal number of samples to be used in the kriging estimations, blocks within Domain 1 were assessed. Regression slope and kriging efficiency was poor at less than 8 samples and no significant improvement was measured at greater than 16 samples, so these values were selected as minimum and maximum samples in the estimate. Results are shown in Figure 11-10. TECHNICAL REPORT SUMMARY EWOYAA LITHIUM PROJECT Page 154 of 368 FIGURE 11-10 NUMBER OF SAMPLES ANALYSIS CHART – DOMAIN 1 Search Distance To test the optimal search distance, blocks within Domain 1 were assessed using the minimum and maximum samples determined in step two. A range of search radii were assessed for regression slope and kriging efficiency and are summarised in Figure 11-11. There was little difference in measured quality in the various search distances. Therefore, the search range selected was 50 m. TECHNICAL REPORT SUMMARY EWOYAA LITHIUM PROJECT Page 155 of 368 FIGURE 11-11 SEARCH DISTANCE ANALYSIS CHART – DOMAIN 1 Block Discretisation To test the optimal block discretisation at the deposit, blocks within Domain 1 were assessed. A range of discretisation parameters were assessed for regression slope and kriging efficiency and are summarised in Figure 11-12. The results above indicate that block discretisation has little effect on the conditional bias of the estimate. Ashmore adopted a block discretisation of 2 m (X) by 4 m (Y) by 2 m (Z) for the estimate. TECHNICAL REPORT SUMMARY EWOYAA LITHIUM PROJECT Page 156 of 368 FIGURE 11-12 BLOCK DISCRETISATION ANALYSIS CHART – DOMAIN 1 11.3 BLOCK MODELLING 11.3.1 Basis The Ordinary Kriging (“OK”) algorithm was used for grade interpolation and the wireframes were used as a hard boundary for grade estimation of each domain. OK was selected as it allows the measured spatial variation to be included in the estimate and results in a degree of smoothing which is appropriate for the nature of the mineralisation. Any blocks outside the pegmatite wireframes were set to zero grade. Additionally, the top of fresh rock was used as a hard boundary in the interpolation due to the mobile nature of lithium in the weathering process. As Domain 105 was intersected by a single drill hole, average lithium grades were applied to this domain.

TECHNICAL REPORT SUMMARY EWOYAA LITHIUM PROJECT Page 157 of 368 11.3.2 Search Parameters An orientated search ellipse with an ‘ellipsoid’ search was used to select data for interpolation. Each ellipse was oriented based on kriging parameters and were consistent with the interpreted geology. Differences between the kriging parameters and the search ellipse may occur in order to honour both the continuity analysis and the mineralisation geometry. Search neighbourhood parameters were based on the KNA. Up to three interpolation passes were used for the interpolation. More than 97% of the blocks were filled in the first two passes for the mineralised domains. Kriging parameters are listed in Table 11-8. TABLE 11-8 OK ESTIMATION PARAMETERS – MINERALISED DOMAINS (LI2O) Parameter Pass 1 Pass 2 Pass 3 Search Type Ellipsoid Ellipsoid Ellipsoid Bearing 0° to 350° Dip 70° to -85° Plunge 0° to -10° Major-Semi Major Ratio 1.4 to 1.5 Major-Minor Ratio 2.0 to 3.0 Search Radius 50 100 200 Minimum Samples 8 4 2 Maximum Samples 16 16 16 Max. Sam. per Hole 4 4 4 Block Discretisation 2 X by 4 Y by 2 Z Percentage Blocks Filled 73% 24% 3% A cross-section showing block grades on section A-A’ is shown in Figure 11-13. TECHNICAL REPORT SUMMARY EWOYAA LITHIUM PROJECT Page 158 of 368 FIGURE 11-13 CROSS-SECTION OF BLOCK MODEL LI2O GRADES ON SECTION A-A 11.3.3 Bulk Density and Material Type Bulk density has been assigned in the block model as discussed in Section 8.7. The values shown in Table 11-9 were assigned in the block model. Ashmore recommends that ALL continues to obtain bulk density measurements for the various material types from core drilled at the deposit, where one measurement is obtained for each sampled assay interval. TECHNICAL REPORT SUMMARY EWOYAA LITHIUM PROJECT Page 159 of 368 Weathering codes were assigned in the ‘type’ attribute within the block model. Codes of “ob” were assigned to transported overburden, “ox” were assigned for oxide, “tr” for transitional and “fr” for fresh material. TABLE 11-9 BULK DENSITY STATISTICS (T/M3) Domain All fr_gtd tr_gtd ox_gtd fr_sed tr_sed ox_sed fr_peg tr_peg ox_peg fr_res tr_res ox_res Samples 13,901 587 16 8 6,196 1,094 525 770 742 271 3,392 20 280 Minimum 1.05 1.21 1.61 1.84 1.13 1.30 1.05 1.44 1.35 1.36 1.08 1.66 1.06 Maximum 3.55 2.94 2.69 2.30 3.39 2.93 2.93 3.48 2.89 2.73 3.55 2.87 3.17 Mean 2.62 2.68 2.40 1.98 2.78 2.23 1.91 2.69 2.06 1.92 2.73 2.18 2.56 Std Dev 0.32 0.08 0.37 0.16 0.09 0.39 0.26 0.12 0.30 0.20 0.13 0.41 0.27 CV 0.12 0.03 0.16 0.08 0.03 0.18 0.14 0.04 0.15 0.11 0.05 0.19 0.11 Variance 0.10 0.01 0.14 0.02 0.01 0.16 0.07 0.01 0.09 0.04 0.02 0.16 0.07 10% 1.97 2.63 1.65 1.84 2.71 1.75 1.69 2.60 1.73 1.70 2.62 1.68 2.23 20% 2.60 2.66 2.12 1.86 2.74 1.83 1.73 2.63 1.79 1.78 2.65 1.75 2.44 30% 2.66 2.67 2.17 1.89 2.76 1.90 1.76 2.65 1.86 1.83 2.68 1.86 2.54 40% 2.70 2.68 2.25 1.91 2.77 2.01 1.79 2.66 1.92 1.85 2.70 1.90 2.59 50% 2.74 2.68 2.66 1.91 2.78 2.16 1.83 2.68 1.98 1.90 2.72 1.97 2.63 60% 2.76 2.69 2.67 1.92 2.79 2.42 1.88 2.70 2.07 1.95 2.74 2.43 2.66 70% 2.78 2.69 2.68 1.94 2.80 2.56 1.94 2.73 2.18 1.98 2.76 2.50 2.70 80% 2.80 2.70 2.68 2.02 2.82 2.65 2.03 2.76 2.36 2.04 2.79 2.54 2.72 90% 2.83 2.71 2.68 2.16 2.85 2.74 2.31 2.80 2.57 2.15 2.84 2.67 2.77 95% 2.87 2.74 2.68 2.23 2.88 2.79 2.53 2.84 2.64 2.29 2.91 2.69 2.81 97.50% 2.91 2.77 2.69 2.26 2.90 2.86 2.67 2.94 2.68 2.46 2.99 2.78 2.85 99% 2.96 2.81 2.69 2.29 2.93 2.90 2.69 3.01 2.73 2.66 3.26 2.83 2.92 ox=oxide, tr=transitional, fr=fresh; peg=barren pegmatite, gtd=granitoid, sed=sediment, res=mineralised pegmatite 11.3.4 Geometallurgy A high-level estimate for the two main geometallurgical domains (as discussed in Section 6.4); the coarse grained P1 material and the finer grained P2 material was conducted using an indicator approach. A series of ‘zero’s’ were assigned to P2 material and a series of ‘one’s’ were assigned to the P1 material within the database. These indicators were extracted into new composite files denoted ‘gm_compxx.str’, where xx = the domain number. The indicators were interpolated into the mineralised domains within the ‘gm_indicator’ block attribute using the lithium kriging and search parameters. To assign the geometallurgical domains for the block model, estimated indicator values of less than or equal to 0.5 were assigned as ‘gm_domain’ = P2 and values greater than 0.5 were assigned as ‘gm_domain’ = P1. The geometallurgical domains are utilised in the Mineral Resource reporting as they have different metallurgical characteristics. TECHNICAL REPORT SUMMARY EWOYAA LITHIUM PROJECT Page 160 of 368 11.3.5 Model Validation A three-step process was used to validate the Mineral Resource estimate. Firstly, a qualitative assessment was completed by slicing sections through the block model in positions coincident with drilling. Overall, the assessment indicated that the trend of the modelled grade was consistent with the drill hole grades. A quantitative assessment of the estimate was completed by comparing the average declustered grades of the sample file input against the block model output for all the lodes. The comparative results are tabulated in Table 11-10. To check that the interpolation of the block model correctly honoured the drilling data, validation was carried out by comparing the interpolated blocks to the sample composite data within strike panels and elevation (swath plots). Validation results for Domain 1 are summarised in Figure 11-14, and presented in the Ashmore report. The validation plots show good correlation between the composite grades and the block model grades for the comparison by strike panel and elevation. The trends shown by the composite data are honoured by the OK estimate. The comparisons show the effect of the interpolation, which results in smoothing of the block grades, compared to the composite grades. TABLE 11-10 AVERAGE COMPOSITE INPUT V BLOCK MODEL OUTPUT – SEPARATED BY WEATHERING (CONT.) ELP Validation by Wireframe - Lithium Pegmatite Not Separated Domain Block Model Composites Resource Li2O Pct Number of Li2O Pct BM V Comp Volume Comps Li2O % 1 1,670,797 1.33 3,247 1.34 -0.69% 2 1,888,102 1.15 2,060 1.17 -1.83% 3 917,633 1.14 1,041 1.13 1.45% 4 848,688 1.03 546 1.03 0.47% 5 432,992 1.32 343 1.28 3.07% 6 515,273 1.34 425 1.39 -3.38% 7 709,305 1.48 812 1.45 2.00% 8 860,703 1.46 651 1.45 0.67% 9 185,289 1.14 220 1.21 -6.45% 10 124,859 1.14 137 1.11 2.80% 11 115,547 0.91 123 0.90 1.46% 12 403,609 1.33 469 1.34 -0.83% 13 132,977 1.13 73 1.18 -4.79% 14 295,867 1.26 239 1.25 1.13%

TECHNICAL REPORT SUMMARY EWOYAA LITHIUM PROJECT Page 161 of 368 ELP Validation by Wireframe - Lithium Pegmatite Not Separated Domain Block Model Composites Resource Li2O Pct Number of Li2O Pct BM V Comp Volume Comps Li2O % 15 156,914 1.37 164 1.37 -0.32% 16 246,828 1.36 177 1.28 6.51% 17 30,977 1.64 19 1.66 -0.79% 18 235,305 1.47 163 1.44 2.16% 19 62,422 1.44 90 1.41 2.00% 20 93,508 1.10 66 1.13 -2.76% 21 90,961 1.46 78 1.37 6.64% 22 25,648 1.02 30 1.05 -2.17% 23 46,352 1.40 38 1.54 -9.70% 24 22,172 0.92 42 0.94 -1.42% 25 125,523 0.99 85 1.05 -5.95% 26 34,367 0.81 38 0.83 -1.43% 27 37,039 1.12 33 1.20 -6.78% 28 27,461 1.11 18 1.10 1.02% 29 23,172 1.10 19 1.00 9.04% 30 12,148 1.39 10 1.40 -0.30% 31 78,328 1.41 60 1.41 -0.21% 32 26,188 1.16 26 1.12 3.37% 33 51,797 1.36 38 1.35 0.83% 34 27,109 0.86 52 0.84 2.45% 35 5,867 0.65 6 0.78 -20.36% 36 24,711 1.00 22 0.98 2.42% 37 23,313 0.91 34 0.85 6.86% 38 21,391 0.87 29 0.85 2.09% TECHNICAL REPORT SUMMARY EWOYAA LITHIUM PROJECT Page 162 of 368 ELP Validation by Wireframe - Lithium Pegmatite Not Separated Domain Block Model Composites Resource Li2O Pct Number of Li2O Pct BM V Comp Volume Comps Li2O % 39 10,219 0.92 8 0.90 2.14% 40 31,016 0.70 49 0.74 -5.84% 41 13,227 0.52 19 0.56 -7.49% 42 167,172 1.08 111 1.10 -1.65% 43 10,398 0.84 5 0.88 -5.17% 44 38,945 1.32 51 1.31 0.58% 45 10,828 1.85 10 1.83 1.32% 46 27,656 1.07 21 0.98 8.02% 47 88,398 0.83 24 0.99 -18.75% 48 4,148 1.76 5 1.74 1.35% 49 10,328 1.41 8 1.45 -2.81% 50 10,148 0.75 8 0.69 8.18% 51 10,742 0.73 5 1.00 -37.22% 52 10,813 1.19 4 1.20 -1.21% 53 157,117 1.23 90 1.21 1.26% 54 146,094 1.38 85 1.34 2.97% 55 43,727 1.27 34 1.26 1.25% 56 29,461 1.02 32 0.98 4.14% 57 49,945 1.12 21 1.15 -2.50% 58 58,047 1.03 29 1.00 2.45% 59 14,461 1.27 6 1.26 0.54% 60 21,609 2.37 7 2.14 9.72% 61 9,477 1.72 7 1.74 -1.60% 62 79,039 1.40 76 1.43 -1.78% TECHNICAL REPORT SUMMARY EWOYAA LITHIUM PROJECT Page 163 of 368 ELP Validation by Wireframe - Lithium Pegmatite Not Separated Domain Block Model Composites Resource Li2O Pct Number of Li2O Pct BM V Comp Volume Comps Li2O % 63 21,320 0.80 9 0.80 -0.40% 64 16,547 0.72 8 0.74 -2.39% 65 66,508 1.35 36 1.31 3.24% 66 46,078 1.42 26 1.35 5.18% 67 118,688 1.41 152 1.45 -2.23% 68 64,531 1.33 53 1.30 2.27% 69 20,086 0.93 18 0.98 -5.44% 70 7,430 0.89 10 0.96 -7.59% 71 18,180 1.36 13 1.36 -0.06% 72 9,391 0.92 14 0.90 2.14% 73 39,930 1.04 35 1.11 -6.51% 74 24,828 0.92 23 0.98 -5.53% 76 78,023 0.99 68 1.08 -9.20% 77 14,867 1.76 10 1.80 -2.16% 78 183,227 1.07 133 1.05 1.90% 79 53,352 0.86 41 0.90 -5.33% 80 16,063 0.94 14 0.89 5.03% 81 18,000 1.04 16 1.03 1.08% 82 58,320 1.63 72 1.61 1.51% 83 16,195 0.59 24 0.66 -10.37% 84 11,563 1.01 9 1.01 0.72% 85 125,539 1.17 88 1.21 -2.65% 86 39,664 1.28 25 1.30 -1.50% 87 51,469 0.86 39 0.83 3.32% TECHNICAL REPORT SUMMARY EWOYAA LITHIUM PROJECT Page 164 of 368 ELP Validation by Wireframe - Lithium Pegmatite Not Separated Domain Block Model Composites Resource Li2O Pct Number of Li2O Pct BM V Comp Volume Comps Li2O % 88 9,805 0.84 12 0.90 -7.82% Total 12,813,761 1.24 13,386 1.26 -1.10% FIGURE 11-14 VALIDATION BY 20M NORTHING AND 10M EASTING AND 10M ELEVATION – DOMAIN 1 BELOW TOFR; LI2O (BLUE=DECLUSTERED MEAN, BLACK=OK) 11.4 MINERAL RESOURCE REPORTING Drilling at the deposit extends to a maximum drill depth of 386 m and the mineralisation was modelled from surface to a depth of approximately 360 m below surface. The estimate is based on good quality reverse circulation (“RC”) and diamond core (“DD”) drilling data. Drill hole spacing is as close as 20 m by 15 m in some portions of the Ewoyaa

TECHNICAL REPORT SUMMARY EWOYAA LITHIUM PROJECT Page 165 of 368 deposit; then spacing is predominantly 40 m by 40 m across the Project and up to 80 m by 80 m in parts of lesser- known mineralisation. The Mineral Resource estimate is based on analytical data from a total of 741 drillholes (totalling 103,694 m) of which 616 (88,967 m) were drilled by reverse circulation (“RC”), 93 (10,159 m) drilled using diamond core drilling (“DD”) and 32 (4,493 m) using a combination of both methods (“RCD”), in which holes were drilled using RC to a target depth, then cored through the target. 11.5 CLASSIFICATION The Mineral Resource has been classified in accordance with guidelines specified in the JORC Code and with definitions specified in SEC Regulation S-K 1300. The classification level is primarily based upon an assessment of the validity and robustness of input data and the estimator’s judgment with respect to the proximity of resource blocks to sample locations and confidence with respect to the geological continuity of the pegmatite interpretations and grade estimates. The Ewoyaa lithium deposits show good continuity of the main mineralised units which allowed drill hole intersections to be modelled into coherent, geologically robust domains. Consistency is evident in the structure thickness, and grade distribution appears to be reasonable along and across strike. The ELP Mineral Resource was classified as Measured, Indicated and Inferred Mineral Resource based on data quality, sample spacing, and lode continuity. The Measured Mineral Resource was confined to fresh rock within areas drilled at 20 m by 15 m along with robust continuity of geology and Li2O grade. The Indicated Mineral Resource was defined within areas of close spaced drilling of less than 40 m by 40 m, and where the continuity and predictability of the lode positions was good. In addition, Indicated Mineral Resource was classified in weathered rock overlying fresh Measured Mineral Resource. The Inferred Mineral Resource was assigned to transitional material, areas where drill hole spacing was greater than 40 m by 40 m, where small, isolated pods of mineralisation occur outside the main mineralised zones, and to geologically complex zones. The block model has an attribute “class” for all blocks within the mineralisation wireframes coded as either “ind” for Indicated “inf” for Inferred. The Mineral Resource classification is shown in Figure 11-15 and Figure 11-16. The extrapolation of the lodes along strike and down-dip have been limited to distances of 40 m. Zones of extrapolation are classified as Inferred Mineral Resource. The JORC Code (2012) describes a number of criteria which must be addressed in the documentation of Mineral Resource estimates prior to public release of the information. The criteria provide a means of assessing whether or not parts of or the entire data inventory used in the estimate are adequate for that purpose. The Mineral Resources stated in this document are based on the criteria set out in Table 1 of that Code. These criteria are listed in Appendices 4.1 of the Cape Coast Mineral Resources Estimate ALL 202301. TECHNICAL REPORT SUMMARY EWOYAA LITHIUM PROJECT Page 166 of 368 FIGURE 11-15 MINERAL RESOURCE CLASSIFICATION OBLIQUE VIEW – EWOYAA MAIN (FACING NE) TECHNICAL REPORT SUMMARY EWOYAA LITHIUM PROJECT Page 167 of 368 FIGURE 11-16 MINERAL RESOURCE CLASSIFICATION PLAN VIEW TECHNICAL REPORT SUMMARY EWOYAA LITHIUM PROJECT Page 168 of 368 11.6 REASONABLE PROSPECTS FOR ECONOMIC EXTRACTION SEC Regulations S-K 1300 require that all reports of Mineral Resources must have reasonable prospects for eventual economic extraction regardless of the classification of the resource. The depth, geometry, and grade of pegmatites at the Project make them amenable to exploitation by open cut mining methods. Inspection of drill core from the Ewoyaa Lithium Project properties and the close proximity of open pit mines in similar rock formations indicate that ground conditions are suitable for this mining method. Mineral Resources at the Project are reported above a cut-off of 0.5% Li2O cut-off which approximates cut-off grades used at comparable spodumene-bearing pegmatite deposits exploited by open pit mining. Mineral Resources at the Project are amenable to exploitation by a mining and processing operation with an open pit mine and concentrator supplying spodumene concentrate to JV partners or global commodity markets. This study envisions a 12-year mine life and the application of conventional mining and processing technology. The resource model is constrained by a conceptual pit shell derived from a Whittle optimisation using estimated block value and mining parameters appropriate for determining reasonable prospects of economic extraction. These are outlined in Section 13.3. It is the QP’s opinion that the Mineral Resource block model is representative of the informing data and that the data is of sufficient quality to support the Mineral Resource Estimate to the reported confidence levels. 11.7 MINERAL RESOURCE ESTIMATE Results of the independent Mineral Resource estimate by Ashmore for Cape Coast are tabulated in the Statement of Mineral Resources in

TECHNICAL REPORT SUMMARY EWOYAA LITHIUM PROJECT Page 169 of 368 Table 11-11. The Statement of Mineral Resources is reported in line with requirements of the 2012 JORC Code and is therefore suitable for public reporting. Mineral Resources are not Mineral Reserves and do not necessarily demonstrate economic viability. There is no certainty that all or any part of this Mineral Resource will be converted into Mineral Reserve. Inferred Mineral Resources are too speculative geologically to have economic considerations applied to them to enable them to be categorised as mineral reserves. Mineral Resource estimates may be materially affected by the quality of data, natural geological variability of mineralisation and / or metallurgical recovery and the accuracy of the economic assumptions supporting reasonable prospects for economic extraction including metal prices, and mining and processing costs. The following risks were identified: • Simplistic interpretations have been made based on logged weathering codes. It is likely that differential weathering has occurred between the weathering resistant granitic rocks and the more readily weathered metasediments. • The grade domains are based on cut-off grade and geological trends. The mineralisation occurs within spodumene bearing pegmatite that can show variation in thickness and geometry within the pegmatite intrusives. There is a risk that the mineralisation will not be continuous as modelled in areas of wider spaced drilling. • There is less drill coverage in some of the shallow, up-dip projections of the mineralisation, away from the Measured Mineral Resource. Further drilling is required for an adequate estimate in these areas of the deposit. • Once a plan is defined and implemented to address the aforementioned points, it will be possible to evaluate the recategorisation of part of the Mineral Resources from Inferred to Indicated. TECHNICAL REPORT SUMMARY EWOYAA LITHIUM PROJECT Page 170 of 368 TABLE 11-11 EWOYAA LITHIUM PROJECT MARCH 2023 MINERAL RESOURCE ESTIMATE BY DEPOSIT (0.5% LI2O CUT-OFF, ABOVE - 190MRL) Cape Coast Lithium Project - By Deposit (Internal), 0.4% Wireframes (Exclusive of Reserves) January 2023 Mineral Resource Estimate (0.5% Li2O Cut-off) Indicated Deposit Tonnage Li2O Cont. Lithium Oxide Mt % t Abonko 0.01 1.17 100 Abonko NW 0.03 0.83 300 Anokyi 0.2 1.12 2,500 Anokyi South 0.01 1.15 100 Ewoyaa Main 0.4 0.96 4,100 Ewoyaa NE 0.2 1.22 2,100 Ewoyaa NE Ext 0.03 1.33 400 Ewoyaa NW 0.2 1.05 2,000 Ewoyaa South 1 0.01 1.28 100 Ewoyaa South 2 0.01 1.38 100 Grasscutter 0.05 1.39 700 Grasscutter East 0.01 1.45 100 Grasscutter North 0.1 1.04 1,500 Grasscutter NW 0.1 0.93 500 Grasscutter West 0.7 1.09 7,600 Kaampakrom 0.1 1.28 1,300 Kaampakrom Corridor 0.03 0.92 200 Kaampakrom West 0.04 1.57 600 Okwesikrom 0.003 1.13 40 Sill 0.03 1.05 400 Total 2.3 1.09 24,700 Inferred Deposit Tonnage Li2O Cont. Lithium Oxide Mt % t Abonko 0.1 1.26 1,000 Abonko NE 0.1 0.77 600 Anokyi 0.004 1.09 40 TECHNICAL REPORT SUMMARY EWOYAA LITHIUM PROJECT Page 171 of 368 Anokyi South 0.1 1.08 800 Anokyi West 0.004 1.21 50 Bypass 0.004 0.92 40 Bypass East 0.02 0.72 100 Dogleg 0.1 0.90 1,000 Ewoyaa Main 0.1 0.68 900 Ewoyaa NE 0.1 1.06 500 Ewoyaa NW 0.1 0.98 1,200 Ewoyaa South 1 0.1 1.10 1,300 Ewoyaa South 2 0.01 1.41 200 Grasscutter 0.6 1.13 6,500 Grasscutter NW 0.02 0.82 200 Grasscutter West 0.4 1.18 4,400 Kaampakrom 0.01 1.42 200 Kaampakrom Corridor 0.02 0.88 100 Kaampakrom East 0.02 0.97 200 Kaampakrom West 0.01 1.03 100 Okwesikrom 0.1 1.36 900 Sill 0.02 1.64 300 Total 1.9 1.07 20,700 NOTE: The Mineral Resource has been compiled under the supervision of Mr. Shaun Searle who is a director of Ashmore Advisory Pty Ltd and a Registered Member of the Australian Institute of Geoscientists. Mr. Searle has sufficient experience that is relevant to the style of mineralisation and type of deposit under consideration and to the activity that he has undertaken to qualify as a Competent Person as defined in the JORC Code. All Mineral Resources figures reported in the table above represent estimates at January 2023. Mineral Resource estimates are not precise calculations, being dependent on the interpretation of limited information on the location, shape and continuity of the occurrence and on the available sampling results. The totals contained in the above table have been rounded to reflect the relative uncertainty of the estimate. Rounding may cause some computational discrepancies. Mineral Resources are reported in accordance with the Australasian Code for Reporting of Exploration Results, Mineral Resources and Ore Reserves (The Joint Ore Reserves Committee Code – JORC 2012 Edition). There are four main geometallurgical domains at Ewoyaa Lithium Project. Their relative abundances, metallurgical recoveries and concentrate grades are shown in Table 11-12. TECHNICAL REPORT SUMMARY EWOYAA LITHIUM PROJECT Page 172 of 368 TABLE 11-12 MATERIAL TYPES, RECOVERIES AND CONCENTRATE GRADES (AT -10+0.5MM CRUSH AND LABORATORY SETTING) Cape Coast Lithium Project - By Geomet, 0.4% Wireframes January 2023 Mineral Resource Estimate (0.5% Li2O Cut-off) Weathered Geomet Type Tonnage Li2O Cont. Lithium Oxide Recovery Mt % t P1 0.02 0.67 100 75 P2 0.001 0.93 10 61 Total 0.02 0.69 100 Primary Geomet Type Tonnage Li2O Cont. Lithium Oxide Recovery Mt % t P1 3.6 1.11 39,600 76 P2 0.6 0.93 5,700 47 Total 4.2 1.08 45,300 To show the tonnage and grade distribution throughout the entire deposit, a bench breakdown has been prepared using a 10 m bench height which is shown graphically in Figure 11-17. FIGURE 11-17 ELP TONNAGE AND GRADE 10M BENCH LEVEL The grade tonnage curve for the Cape Coast Mineral Resource is shown in Figure 11-18.

TECHNICAL REPORT SUMMARY EWOYAA LITHIUM PROJECT Page 173 of 368 FIGURE 11-18 ELP GRADE – TONNAGE CURVE 11.8 QUALIFIED PERSON’S OPINION Based on the data review, the attendant work done to verify the data integrity and the creation of an independent geologic model, Ashmore Advisory believes this is a fair and accurate representation of ALL’s lithium resources. TECHNICAL REPORT SUMMARY EWOYAA LITHIUM PROJECT Page 174 of 368 12.0 ORE RESERVE ESTIMATES Ore Reserves were determined from the mine planning work undertaken by MFS for this study and in accordance with the Australasian Code for Reporting of Mineral Resources and Ore Reserves of December 2012 (“JORC Code”) as prepared by the Joint Ore Reserves Committee of the Australasian Institute of Mining and Metallurgy and S-K 1300. The term ‘Modifying Factors’ is defined to include mining, metallurgical, economic, marketing, legal, environmental, social and governmental considerations. Ore reserves were prepared based on the modifying factors in Table 12-1. TABLE 12-1 SUMMARY OF MODIFYING FACTORS FOR ORE RESERVE DETERMINATION Mill throughput Mtpa 2.7 Spodumene price (SC6.0 and SC5.5 product) $/t 1,587 Concentrate grade - SC6.0 Product (50% of total production) - SC5.5 Product (50% of total production) % 6.0 5.5 Secondary product price $/t 186 Secondary product recovery (of total crusher feed) % 17 Royalty % 6.0 Processing recovery SC6.0 SC5.5 % 62.1 67.2 NA 14.9 Processing Cost $/t milled 7.77 General and Administration (Incl. Marketing and insurance) $/t milled 6.18 Lithium Concentrate Transport Costs SC6.0 and SC5.5 Secondary product $/t conc. 29.81 32.65 Average Mining Cost (Contract mining) $/t mined 3.82 Mining recovery % 95 Mining dilution % 5 Overall Pit Wall Slope Angle (inclusive of a ramp system) Degree Ranging from 30.0o (Oxide) to 50.4o (Fresh) Capital expenditure $M 185.2 Sustaining capital $M 112.2 Discount rate % 8 Based on the above economic input parameters the theoretical cutoff is about 0.1% Li2O for P1 material and 0.2% Li2O for P2 material. However, with the resource model being based on 0.4% Li2O pegmatite body wireframes, the calculated economic cutoff is redundant. Regardless, metallurgical test work indicated that, in order to produce 5.5% and 6% concentrate, the feed grade needed to be about 1.2% Li2O. A grade tonnage evaluation of the life of mine pit indicated that a cutoff of 0.5% would achieve a feed grade of about 1.2% Li2O. As such, the Ore Reserves were based on a 0.5% Li2O cutoff. Item Unit Value P1 Pegmatite P2 Pegmatite TECHNICAL REPORT SUMMARY EWOYAA LITHIUM PROJECT Page 175 of 368 Mining will be undertaken by conventional open pit methods of drill and blast, followed by load and haul. Processing incorporates well-tested technology and utilises conventional dense media separation techniques to produce SC6.0 and SC5.5 concentrate products, as well as a secondary product that comprises fines material (-0.85 +0.053 mm). ALL developed a cash flow model that indicated that the project is financially robust with the All-In-Sustaining Cost (AISC) margin greater than 50%. Notwithstanding the above, the intricacies of processing two material types (P1 and P2) at different ratios, as well as processing different size fractions leads to a variance in processing recoveries that can be reasonably large. So, whilst the global average recoveries that were adopted are considered reasonable there will be variances from time to time dependent of the composition of the feed and, as such, any Measured Resources were converted to Probable Ore Reserves. Based on the above, Probable Ore Reserves were declared for the Project and shown in Table 12-2. All stated Probable Ore Reserves are completely included within the quoted Mineral Resources and are quoted in dry tonnes. Probable Ore Reserves were declared based on the Measured and Indicated Mineral Resources only contained within the pit designs. TABLE 12-2 EWOYAA LITHIUM PROJECT – ESTIMATE OF ORE RESERVES AS OF 16 JUNE 2023 COMPETENT PERSONS NOTE: All stated Ore Reserves are completely included within the quoted Mineral Resources and are quoted in dry tonnes. The reported Ore Reserves have been compiled by Mr Harry Warries. Mr Warries is a Fellow of the Australasian Institute of Mining and Metallurgy and an employee of Mining Focus Consultants Pty Ltd. He has sufficient experience, relevant to the style of mineralisation and type of deposit under consideration and to the activity he is undertaking, to qualify as a Competent Person as defined in the ‘Australasian Code for Reporting of Mineral Resources and Ore Reserves’ of December 2012 (“JORC Code”) as prepared by the Joint Ore Reserves Committee of the Australasian Institute of Mining and Metallurgy, the Australian Institute of Geoscientists and the Minerals Council of Australia. Mr Warries gives Atlantic Lithium Limited consent to use this reserve estimate in reports. 12.1 QUALIFIED PERSON’S ESTIMATES Ore Reserve tonnage estimates provided herein report Ore Reserves derived from in-situ Mineral Resource estimate tonnes presented in Section 11.0, and not in addition to Mineral Resources. Probable Ore Reserves were derived from the defined resource considering relevant mining, processing, infrastructure, economic (including estimates of capital, revenue, and cost), marketing, legal, environmental, socio-economic and regulatory factors. The Ore Reserves, as shown in Table 12-2, are based on a technical evaluation of the geology and a feasibility study of the deposits. The extent to which the Ore Reserves may be affected by any known environmental, permitting, legal, title, socio-economic, marketing, political, or other relevant issues has been reviewed rigorously. Similarly, the extent to which the estimates of Ore Reserves may be materially affected by mining, metallurgical, infrastructure and other relevant factors has also been considered. Classification Ore Reserve Tonnes (Mt) Li2O Grade (%) Probable 25.6 1.22 TECHNICAL REPORT SUMMARY EWOYAA LITHIUM PROJECT Page 176 of 368 12.2 QUALIFIED PERSON’S OPINION The estimate of Ore Reserves was determined in accordance with the SEC S-K 1300 and JORC standards. The Qualified and Competent Persons responsible for the derivation of Probable Ore Reserves have considered pertinent modifying factors, inclusive of geological, environmental, regulatory, and legal factors, in converting a portion of the Mineral Resource to Mineral Reserve. Probable Ore Reserves, derived from previously stated Measured and Indicated Mineral Resources, incorporate reasonable expectations of costs and performance. The Qualified and Competent Persons have considered the rules and regulations promulgated by the Joint Ore Reserve Committee and US Securities and Exchange Commission in estimating Ore Reserves. The Qualified and Competent Persons find the assumptions and modifying factors utilised in the FS to be sufficient and satisfactory in the delineation of Probable Ore Reserves based upon JORC and S-K 1300 regulations. Effective date: 1st February 2023

TECHNICAL REPORT SUMMARY EWOYAA LITHIUM PROJECT Page 177 of 368 13.0 MINING METHODS 13.1 INTRODUCTION Mining Focus Consultants Pty Ltd were engaged to undertake a mining study for the FS, with a scope of work including Pit Optimisations, Mine pit design and production scheduling, Mining Cost development and preparation of an Ore Reserve statement. The Project comprises eight main deposits including Ewoyaa, Okwesi, Anokyi, Grasscutter, Abonko, Kaampakrom and Sill (Figure 13-1). Deposits are broadly 4km apart, spread out over approximately 8 km2. Two waste dumps will be constructed west and northeast of Ewoyaa Main pit. FIGURE 13-1 EWOYAA LITHIUM PROJECT PIT LAYOUT TECHNICAL REPORT SUMMARY EWOYAA LITHIUM PROJECT Page 178 of 368 13.2 MINING OPERATION BASIS The Project comprises eight main deposits, broadly 4 km apart, spread out over approximately 8 km2. Two waste dumps will be constructed west and northeast of Ewoyaa Main pit. Mining operations are scheduled to work 365 days a year, less unscheduled delays such as high rainfall events. The mine workforce will operate on a two shift, three panel roster, seven days a week, in two 12-hour working shifts. Initially, vegetation will be cleared and grubbed prior to topsoil stripping and later used to cover the topsoil stockpiles. Topsoil will be stockpiled around the open pits. Conventional open pit mining methods of drill and blast followed by load and haul will be employed. Drilling and blasting will be performed on benches between 5 m and 10 m high. Based on drill core and visual inspection, overburden and 50% of oxide material (12% of total volume) will not require drill and blast (designated as free dig) whilst transition and fresh materials will require 100% blasting. Mining equipment will likely consist of 100 t to 200 t hydraulic excavators and 90 t to 150 t off highway dump trucks, supported by standard open-cut drilling and auxiliary equipment. A contract mining model will be employed under the supervision of an ALL mining management team. Ore will be hauled to a single ROM pad located southwest of the main pit area or to stockpile. The bulk of the waste will be dumped to the west and northeast of the pit areas with some backfill in the southern end of the Ewoyaa Main pit. The operation will employ a strategy of partial direct tipping, with approximately 60% of crusher feed from rehandling ROM material. Lower recovery/grade long term stockpiles, predominantly comprising P2 material, will be rehandled and fed after P1 materials have been processed, or when ore supply interruptions are experienced. In-pit water management will primarily consist of runoff control and sumps, with high lift pumps operated on pontoons to allow draw from sump waters to pump water to the Water Storage Dam for use in plant operations as well as dust suppression and plant washdown. Grade control drilling will be contracted to a suitable drilling contractor and samples will be assayed in the site laboratory under the laboratory services contract. Key rehabilitation activities will involve shaping of waste dumps into suitable landforms, placing of stockpiled topsoil on the final surfaces plus construction of an abandonment bund around the pit. 13.3 HYDROLOGY AND HYDROGEOLOGY 13.3.1 Hydrogeological setting The hydrogeological description for the area is low to moderate groundwater potential with local highs. Specifically, groundwater yields are poor except where there is thick weathering of the basement rocks or veins, such as pegmatites allowing groundwater flow. Typical borehole yields are from 0.1 L/s to 0.5 L/s. (https://www2.bgs.ac.uk/africagroundwateratlas). A census conducted in the region (reported by ESS, 2021) indicated that 10 boreholes were in use by local communities (Figure 13-2). Many of the surrounding communities rely on dugouts and stream flows for their water. It is probable there is increased groundwater associated with pegmatites. The identified main hydrogeological units are: • Weathered zone with low to medium permeability; • Unweathered basement with low permeability; and • Pegmatites with medium to high permeability. TECHNICAL REPORT SUMMARY EWOYAA LITHIUM PROJECT Page 179 of 368 FIGURE 13-2 LOCATION OF COMMUNITY BOREHOLES (SOURCE: ESS, 2021) 13.3.2 Monitoring Boreholes Following the desktop review of ESS in 2021, Sahara Natural Resources Limited in 2022 drilled 11 monitoring boreholes (Table 13-1). Measurable yields were observed at boreholes EM0001, EM0002, EM0003 and EWE001, with yields between 0.07 L/s and 0.6 L/s (Figure 13-3). TABLE 13-1 SUMMARY OF BOREHOLE INFORMATION Borehole ID Location Borehole Depth Water Strike (m) Blow Yield (L/s) Latitude Longitude (m) EM001 5.240382 -1.055426 100 22 – 24 0.22 EM002 5.239241 -1.051912 100 44 – 45 0.67 EM003 5.239740 -1.052569 100 - 0.07 EM004 5.231079 -1.058548 100 - - EM005 5.230430 -1.053445 100 - - EM006 5.252423 -1.057733 100 - - EWE001 5.238912 -1.047953 100 23 – 31 0.60 EWG001 5.245195 -1.047555 100 - - AB004 5.238627 -1.040613 100 - - TECHNICAL REPORT SUMMARY EWOYAA LITHIUM PROJECT Page 180 of 368 Borehole ID Location Borehole Depth Water Strike (m) Blow Yield (L/s) Latitude Longitude (m) AKY180H 5.234667 -1.049356 100 - - AKYS001 5.230415 -1.048476 100 - - FIGURE 13-3 MONITORING BOREHOLES LOCATED WITHIN THE EWOYAA PROJECT 13.3.3 Hydraulic Conductivity Pump tests were conducted by Sahara Natural Resources Limited on the 4 wet monitoring boreholes to determine the hydraulic characteristics of the underlying aquifer and the yield capacity of the boreholes. The tests were conducted a week after borehole drilling and construction. Step Drawdown Tests (SDT) were conducted at boreholes EM0002 and EWE0001, each with two steps ranging between 1 and 4 hours per step. Constant Discharge Tests (CDT) were conducted at all boreholes. The tests involved pumping at a constant predetermined rate for 6 hours and thereafter measuring water level recovery beginning immediately after the pump is turned and ending 3 hours later. The discharge rates ranged from 0.2 L/s to 0.6 L/s. The pumping test data was analysed by SRK using the Cooper & Jacob (1946) and Theis Recovery (1935) solutions to determine the transmissivity of the aquifers. The hydraulic conductivity (K) values were thereafter calculated using the transmissivity values and assumed aquifer thickness. K values ranged from 4.82 x10⁻³ m/day to 1.39x10⁻² m/day, which is characterised as a very low to low hydraulic conductivity. The results of the pumping test are summarised in Table 13-2.

TECHNICAL REPORT SUMMARY EWOYAA LITHIUM PROJECT Page 181 of 368 A radial flow regime is observed in the shallow weathered horizon, and this implies a homogenous behaviour in this horizon. The deeper weathered horizon is characterised by bi-linear and linear flow. Linear flow is generally observed in geological structures with either finite conductivity or embedded in a low conductivity matrix. Bi-linear flow occurs when the matrix within which the feature is embedded is permeable enough to produce and superimpose upon the linear flow, a perpendicular flow. TABLE 13-2 PUMPING TEST RESULTS 13.3.4 Numerical Modelling of Groundwater Make A 3D groundwater flow model was constructed using the finite element code MINEDW (Azrag et al., 1998) in August 2022(SRK 582606, 2022). The groundwater model was developed and updated to predict pit inflows, assist with water security and ensure that the capacity of water storage facilities is sufficient. The model was designed with the following assumptions: • Major geological feature - faults and lithological variation; • Recharge; and • A nominal progression of the pits. The numerical groundwater flow model is a useful tool for the optimisation of water management strategy, which will be re-calibrated and updated as more information becomes available throughout the life of the mine. 13.3.5 Passive Groundwater Pit Inflow Simulations The inflow over the life of each pit, to inform water management and overall site water balance, was determined. Figure 13-4 shows the sum of inflows from all the pits. Inflows into the Ewoyaa Main pit and the Ewoyaa NE pit are the highest, with a maximum passive inflow of 1,992 m³/d and 1,350 m³/d respectively. Groundwater inflows are predicted within the second month of mining in the Ewoyaa Main pit. Ewoyaa Main and Ewoyaa NE pits establish early in mining, this creates a hydraulic gradient towards these pits. Inflows into the outer pits are relatively low at less than 1,000 m³/d. The combined groundwater inflow for all the pits gradually increases from 275 m³/d in the 4th month of operation to a peak of 4,944 m³/d in the final year of operation. The inflows into the pit are primarily associated with the weathered zone. It is also crucial to emphasise that the estimated inflows are based on the test data available from the fieldwork carried out in 2021 and limited hydro stratigraphic information. Hole ID Static Water Level (mbgl) Pump Depth (mbgl) Average Yield (m3/hr) Water Level After Test (mbgl) Aquifer Thickness Average K (m/day) Geology EM002 20.2 80 2.124 25.76 59.8 1.39E-02 Slightly weathered grey mica schist EM003 13.73 80 0.823 14.44 66.27 3.80E-03 Moderately Weathered Grey Schist EWE001 17.58 80 1.44 18.95 62.42 3.77E-03 Slightly Weathered Biotite Schist EM001 24.73 85 0.612 25.17 60.27 4.82E-03 Completely Weathered Creamy Grey Mica-Schist; Slightly weathered biotite schist TECHNICAL REPORT SUMMARY EWOYAA LITHIUM PROJECT Page 182 of 368 FIGURE 13-4 PASSIVE INFLOWS TO PITS (LIFE OF MINE) 13.3.6 Surface Water The surface water management of the ELP allows for the provision of suitable surface water control measures in order to reduce impacts to downstream environments for all aspects of the Project, from initial development through to completion of rehabilitation. As part of the civil geotechnical engineering design works, surface water drainage infrastructure has been designed across the site by REC. This has included the design of culverts to re-direct stormwater flows away from process and non-process infrastructure. For the plant site and surrounding areas infrastructure, drainage has been designed such that all flows collected report to a sediment pond before environmental release. Drainage paths and catchments have considered worst case conditions (1:50 and 1:100 storm event), whereby it is assumed that open pit development works are staged, and culverts must accommodate their respective catchment areas. The main goals of the Ewoyaa surface water management plan is to: • Reduce the impact of the proposed mining activities on the quality and quantity of surface water, thereby limiting disruption of natural drainage (runoff) patterns to natural catchments at the various Project sites. • Reduce sediment discharge from the site to the environment by entrapping and retaining eroded sediment as close as possible to disturbed areas. • Integrate surface water and sediment control measures with project development and operations plans. • Protect internal infrastructure and personnel from the uncontrolled effects of surface water runoff during storm events, thereby enhancing the safety of Project personnel, reducing maintenance costs associated with certain mining infrastructure items and reducing capital and maintenance costs for reclaiming mined out areas. • Provide long-term post-mining erosion and sediment control measures, including where practical the establishment of fully stabilised and protected final reclaimed surfaces that require minimal maintenance. TECHNICAL REPORT SUMMARY EWOYAA LITHIUM PROJECT Page 183 of 368 The sedimentation dams, diversion drains, and associated culvert and underground drainage lines have been sized to accommodate the changed flow regimes of the water streams during mine operation. As engineered diversions, erosion is minimised, and the suspended solids generated during stream flow will be reduced. Water Quality Maintenance of surface water and groundwater quality during and after mining operations is a key operational concern and will be detailed further in the Water Management Plan as the project documents progress. The management plan will specify wastewater release thresholds and criteria and ensure compliance with license conditions regarding site discharges. Groundwater and surface water quality monitoring at the mine site will be carried out in accordance with relevant local and global water quality legislation and industry best practice. Details of monitoring installations and monitoring frequency will be defined and documented in the Water Management Plan. Water quality monitoring data must be supplied to the Catchment Council throughout the life of the mine. They may also require continued monitoring for a specified period after closure to assess potential ongoing impacts. The water quality monitoring program shall be developed to: • Support operational control; • Verify compliance with targets and legal requirements; • Update onsite water balances and off-site catchment models; • Assess impact on the environment; • Assess cumulative impacts of the operation on the catchment and other users; and • Meet reporting requirements. SRK have completed extensive investigation into the effects of mining on the groundwater. 13.3.7 Groundwater Pegmatite intrusions host the lithium orebody and generally occur as sub-vertical dykes. The ore will be exploited from 23 pits. Generally, poorly developed aquifers form in the surrounding schist, however, there may be increased groundwater associated with pegmatites and granitoids. The identified main hydrogeological units are: • Weathered zone with low to medium permeability; • Unweathered basement with low permeability; and • Pegmatites with medium to high permeability. To minimise inflows, reduce pore pressure and thus reduce the likelihood of slope failures, it is occasionally necessary to implement a Groundwater Management System (GWMS) before mining commences. The GWMS will include dewatering boreholes, sumps and an ongoing monitoring program. The recommendation to implement a dewatering system is based on the data available with respect to the influence that the geological structures and weathered zone have on the overall groundwater flow. The recommendations apply to the envisaged ‘worst-case scenario’; however, these recommendations can be refined once additional hydraulic tests and monitoring data are available. Pit Dewatering The predicted inflows into the pits are not high and may not require active dewatering unless pore pressure and slope stability are an issue. A dewatering strategy was developed to reduce overall inflows into the pit and to provide an indication of the potential reduction in flow. The proposed strategy includes the installation of dewatering boreholes to deplete groundwater storage and lower groundwater levels ahead of mining. A predictive simulation was run to evaluate the response of the groundwater system to abstraction via a series of dewatering boreholes installed at the perimeter of the pits and to a depth of 200 m. The simulation included 11 TECHNICAL REPORT SUMMARY EWOYAA LITHIUM PROJECT Page 184 of 368 dewatering boreholes (Figure 13-6). The dewatering boreholes are assumed to be pumping from the beginning of mining to allow dewatering to progress ahead of mining. The numerical model results indicate that the installation and pumping from the 11 boreholes would reduce residual passive inflows into the pit (Figure 13-5), provided the holes are optimally constructed and operated. Once additional geological structural information is available and these are exposed in the pit, horizontal drain holes targeting these structures from inside the pit could be used to manage inflows into pits in place of ex-pit boreholes. Drawdown A zone of drawdown will develop around the pits (Figure 13-7). The full extent of the zone after 11 years of mining is 4.6 km from east to west and 5 km from north to south across the pit area. Although the zone of drawdown does not extend a large distance from the mining area, there are some settlements near the mining area. There is a risk, although deemed low, of some reduction in water levels. Water level monitoring will be important to alert the mine of any significant impact. FIGURE 13-5 TOTAL PASSIVE INFLOW VS. TOTAL RESIDUAL INFLOW

TECHNICAL REPORT SUMMARY EWOYAA LITHIUM PROJECT Page 185 of 368 FIGURE 13-6 POTENTIAL DEWATERING WELLS TECHNICAL REPORT SUMMARY EWOYAA LITHIUM PROJECT Page 186 of 368 FIGURE 13-7 DRAWDOWN 13.4 GEOTECHNICAL DATA 13.4.1 Pit Slope Geotechnical Assessment Geotechnical assessment of the pit wall slope design parameters was developed by SRK Consulting Ghana Ltd (SRK) and reported in November 2022 as part of the pre-feasibility study. Based on the available information and analysis, the recommended slope angles for the proposed open pits along both the NS and EW trending orebodies are as shown in Table 13-3. TABLE 13-3 PIT SLOPE DESIGN PARAMETERS Design Element Hanging wall Footwall Maximum Slope height (m) 120 120 Weathered Zone Bench height (m) 10 10 Batter angle (°) 50 50 Berm width (m) 8.9 5.9 Inter-ramp slope angle (°) 30.0 35.0 Inter-ramp slope height (m) 30 20 TECHNICAL REPORT SUMMARY EWOYAA LITHIUM PROJECT Page 187 of 368 Design Element Hanging wall Footwall Transition Zone Bench height (m) 10 10 Batter angle (°) 60 60 Berm width (m) 4.3 4.3 Inter-ramp slope angle (°) 44.8 44.8 Inter-ramp slope height (m) 20 20 Fresh Zone Bench height (m) 20 20 Batter angle (°) 80 60 Berm width (m) 8.0 8.6 Inter-ramp slope angle (°) 60.0 44.8 Inter-ramp slope height (m) 70 80 The recommended slope design configuration in the table has adequate FoS against shear (circular) failure. However, structurally controlled bench-scale and inter-ramp instabilities may still be possible at some sectors of the HW and FW slopes. No geotechnical assessment was undertaken for the waste dumps. An overall slope angle of 20° was adopted for the waste dump design based on Western Australia Department of Minerals and Energy 1996 guidelines. 13.4.2 Plant & Infrastructure Geotechnical Geotechnical investigations and study engineering were undertaken by REC/Geocrest during the FS. Based on the results of the initial desktop study and the expected subsurface conditions, the proposed fieldwork comprised of: • Test Pits (TP) –76 total to a depth of 5 m or refusal, whichever occurs first. The TP locations are: • Haul Roads. • Access Roads. • Process Plant. • Sediment Control Structures. • Explosive Magazine. • Water Storage Dam. • Dynamic Cone Penetrometer (DCP) testing adjacent to the test pits to depths of approximately 4 m, unless refused prior (blow count > 10 for 100 mm). The DCP shall be conducted along the proposed access road at a pre- defined interval approximately 100 m apart. • Boreholes (BH) – 5 boreholes were drilled at designated locations to a depth of 21.0 m. All boreholes were logged and photographed by the Supervising Geotechnical Engineer. • Process Plant – 2 off. • Overpass Tunnel – 1 off. • IWLTSF – 1 off. • Eastern Waste dump - 1 off. • Collection of geotechnical samples for geotechnical laboratory testing. TECHNICAL REPORT SUMMARY EWOYAA LITHIUM PROJECT Page 188 of 368 13.5 PIT OPTIMISATION Mine pit optimisation works were undertaken based on the updated MRE (Section 11.7) and separately using the Measured and Indicated Resources only. Optimisations were performed using WHITTLE™ Four-X optimisation software that uses the Lerchs-Grossmann algorithm. The resource model was re-blocked from a sub-blocked model to a regular parent block size of 10 m E x 10 m N x 10 m RL, which is considered a reasonable selective mining unit for the size of mining equipment envisaged for the Project. The key economic input parameters used for the pit optimisation are shown in Table 13-4. TABLE 13-4 SUMMARY OF KEY PIT OPTIMISATION INPUT PARAMETERS Spodumene concentrate pricing was based on a consensus SC6 price deck supplied by ALL (refer to Section 16.3). Pit optimisation results show that for both scenarios the optimum pit shell based on the maximum undiscounted operating cash flow is pit shell 29 (Figure 13-8), comprising 20 pits and about 85% of the total mill feed contained within eight pits. Pit shell 29 (all pits combined) contains 29.0 Mt of mill feed at 1.09% Li2O for 3,512 kt of spodumene concentrate. Approximately 284 Mt of waste equating to a waste to ore stripping ratio of 9.8:1 and average cash operating cost, inclusive of royalty, of $601/t of concentrate. Item Unit Value P1 Pegmatite P2 Pegmatite Plant throughput Mtpa 2.0 Spodumene price $/t 1,500 Concentrate grade % 6 Royalty % 6.2 Marketing and insurance (% of gross sales) % 1 Processing recovery Transition Fresh % 68 70 35 35 Processing cost $/t milled 13.50 General and administration $/t milled 3.20 Land freight $/t conc. 25.00 Average mining cost (contract mining) $/t mined 3.61 Rehandle cost (P2 pegmatite only) $/t 0.54 Sustaining capital $/t milled 0.44 Closure cost $/t milled 0.64 Mining recovery % 95 Mining dilution % 5 Overall pit wall slope angle (inclusive of a ramp system) Degree Ranging from 30.0o (Oxide) to 50.4o (Fresh

TECHNICAL REPORT SUMMARY EWOYAA LITHIUM PROJECT Page 189 of 368 FIGURE 13-8 TOTAL RESOURCE PIT OPTIMISATION RESULTS The pit shell versus cash flow curve is relatively flat at the apex of the curve, which allows a range of pit shells to be considered depending on the corporate strategic plan. The choice of shell will be a function of the corporate risk appetite and required mine life versus maximising cash flow. 13.6 MINE DESIGN 13.6.1 Pit Design Pit shell 29, based on the total MRE pit optimisation was selected as the basis for the life of mine (LOM), detailed pit design. Pit design parameters for the FS are based on established mining practices and parameters detailed in Table 13-5. Subsequent to pit optimisation works, ALL advised that material lower than 0.5% Li2O was to be treated as waste. TABLE 13-5 PIT DESIGN PARAMETERS SUMMARY The Whittle analysis was used to provide an indication as to potential pit staging. Staged mining has generally a positive impact on the project NPV by reducing the duration of the pre-production phase, bringing forward higher-grade material and reducing the strip ratio in the early years of production. Pit Design Parameters Pit Wall Parameters As per Section 13.4 Haul Road Design Width - Dual Lane - Single Lane Gradient 25m 16m 10% Working width Minimum pit base width (goodbye cut) 10m TECHNICAL REPORT SUMMARY EWOYAA LITHIUM PROJECT Page 190 of 368 Notwithstanding the above, MFC determined that the number of cutbacks that could be practically implemented is limited with a starter pit developed for the Ewoyaa Main Pit only. The mill feed and waste tonnage contained within each pit design are presented in Table 13-6. TABLE 13-6 PIT DESIGN BREAKDOWN SUMMARY Cutback Total Material Waste Strip Ratio Measured & Indicated Inferred Total Mill Feed (Measured, Indicated & Inferred) [Mt] [Mt] [w:o] Tonnes Li2O Grade Tonnes(1) Li2O Grade Tonnes Li2O Grade [Mt] [%] [Mt] [%] [Mt] [%] Ewoyaa Main - Starter 25.0 18.4 2.8 6.3 1.26 0.2 0.98 6.6 1.25 -Final 49.0 45.1 11.5 3.2 1.03 0.7 1.05 3.9 1.04 Sub Total 74.0 63.5 6.1 9.6 1.18 0.9 1.03 10.5 1.17 Ewoyaa South 1 4.3 3.7 6.5 0.4 1.02 0.2 0.82 0.6 0.94 Ewoyaa South 2 7.4 6.5 7.6 0.2 1.20 0.7 1.24 0.9 1.23 Ewoyaa North 36.1 33.1 11.3 2.3 1.10 0.6 1.00 2.9 1.08 Ewoyaa NE 48.6 44.9 12.4 3.2 1.35 0.4 1.17 3.6 1.33 Okwesi – West Pod 1.1 1.0 8.3 0.1 1.41 0.01 1.46 0.1 1.42 Okwesi – East Pod 4.0 3.6 9.6 0.2 1.44 0.2 1.42 0.4 1.43 Okwesi North 3.4 3.2 29.1 0.1 1.32 0.02 1.23 0.1 1.31 Anokyi 40.6 37.7 12.7 2.6 1.38 0.3 1.11 3.0 1.35 Anokyi South Pit 1.5 1.5 46.4 - 0.03 1.23 0.03 1.23 Grasscutter Main Pit 110.5 106.4 25.9 3.6 1.09 0.5 1.34 4.1 1.12 Grasscutter North Pod 5.7 5.4 18.1 0.3 1.20 0.03 1.30 0.3 1.21 Grasscutter East Pod 13.0 11.9 10.5 0.9 1.37 0.2 1.31 1.1 1.35 Grasscutter East Pit 2.0 2.0 44.7 0.03 1.42 0.02 1.15 0.0 1.33 Abonko Main 21.8 20.4 14.8 0.9 1.21 0.5 1.23 1.4 1.22 Abonko North 2.1 2.0 10.7 0.2 1.51 0.02 0.83 0.2 1.43 Abonko East 0.3 0.3 14.0 - 0.02 0.74 0.0 0.74 Kaampakrom North 4.5 4.3 16.3 0.1 0.85 0.2 1.02 0.3 0.96 Kaampakrom West 1 7.9 7.4 16.3 0.4 1.50 0.1 0.94 0.5 1.40 Kaampakrom West 2 5.1 4.9 24.0 0.1 1.35 0.1 1.04 0.2 1.18 Kaampakrom Central 6.5 6.3 26.1 0.2 1.35 0.1 1.34 0.2 1.35 Kaampakrom Far East 0.4 0.4 68.2 - 0.01 1.12 0.0 1.12 Sill 8.2 7.8 18.9 0.4 1.32 0.1 1.41 0.4 1.33 Bypass North 0.9 0.8 11.2 - 0.1 1.02 0.1 1.02 TECHNICAL REPORT SUMMARY EWOYAA LITHIUM PROJECT Page 191 of 368 Cutback Total Material Waste Strip Ratio Measured & Indicated Inferred Total Mill Feed (Measured, Indicated & Inferred) [Mt] [Mt] [w:o] Tonnes Li2O Grade Tonnes(1) Li2O Grade Tonnes Li2O Grade [Mt] [%] [Mt] [%] [Mt] [%] Bypass South 2.9 2.7 16.8 - 0.2 0.95 0.2 0.95 Grand Total(2) 412.7 381.7 12.3 25.6 1.22 5.4 1.14 31.1 1.21 Comparison of the LOM pit design to the Whittle optimised shell is provided in Table 13-7. TABLE 13-7 COMPARISON OF PIT DESIGN VS. PIT OPTIMISATION SHELL NOTE: 1. Inclusive of sub-grade material (< 0.5% Li2O) that is shown as mill feed in the optimisation results. The above variances between design and Whittle shell are a function of applying the ramp design parameters, as well as the detailed slope design parameters to the pit design, using actual batter and berm values compared to initial estimate of the overall slope angle (inclusive of a ramp system) used for the pit optimisation. 13.6.2 Mine Waste The mine generates 382 Mt of waste or about 195 Mm3 at a swell factor of 25%. Two waste dumps with a total capacity of about 190 Mm3 have been designed, with some waste to be backfilled into the southern end of the Ewoyaa Main pit. The Western waste dump reaches a maximum height of 70 m RL, covers about 34 Ha and has a capacity of approximately 6.5 Mm3. The North-eastern waste dump reaches a maximum height of 95 m RL, covers about 340 Ha and has a capacity of approximately 182.4 Mm3. Three to five years’ worth of tailings will be stored in an Integrated Waste Landform Tailings Storage Facility (IWLTSF) within the northeastern waste dump, with the remainder of the tailings over the LOM stored in the Ewoyaa South 2 pit void after it is mined. 13.6.3 Stockpiling A stockpiling strategy has been adopted where P1 Pegmatite is being preferentially processed, with P2 Pegmatite limited to 10% of the ore blend where possible. The maximum stockpile capacity required over LOM is about 1.0 Mt in Year 6. A ROM area adjacent to the crushing plant will accommodate about 500 kt of stockpiling, with two additional stockpile areas identified some 600 m NE of the ROM pad. Item Total Material Waste(1) Strip Ratio Plant Feed Concentrate Sub-grade Material [Mt] [Mt] [w:o] Tonnes Li2O Grade [kt] Tonnes Li2O Grade [Mt] [%] [Mt] [%] Shell 29 370.7 339.9 11.0 30.8 1.21 4,146 5.9 0.27 LOM Pit 412.7 381.7 12.3 31.1 1.21 4,163 5.9 0.26 Variance [%] 11.3 11.7 11.3 0.8 -0.2 0.6 TECHNICAL REPORT SUMMARY EWOYAA LITHIUM PROJECT Page 192 of 368 13.6.4 Haul Roads Mine Roads will be designed to allow all-weather trafficability. This will include regular spreading and compaction of suitable crushed rock road base material. A total of six major haul road segments connect the pits with the ROM/crusher and waste dumps. Most roads traverse over moderately sloping terrain and do not require any major cut and fill, other than the main road connecting the pits with the ROM/crusher will traverse through some steeper terrain and will require cut and fill. The initial haul road to the ROM crosses the location of the Ewoyaa South 1 pit, which will be developed in Year 10. By the end of Year 10 an alternative road to the crusher needs to be developed and a preliminary design has been completed in the study. 13.7 MINE PRODUCTION SCHEDULE 13.7.1 Production Schedule and Constraints Subsequent to the pit design work, pits with 100% of mill feed classified as Inferred Resources were removed from FS mine schedule. Five pits were removed, namely both Bypass pits, Anokyi South pit, Abonko East pit and Kaampakrom Far East. The mine production schedule was developed in monthly increments based on total material movement of 406 Mt, comprising 380.3 Mt of waste and 25.6 Mt of ore at 1.22% Li2O of mill feed, for a 14.8 :1 waste to ore strip ratio. Staged development of the pits is driven by the desire to maximise the grade of the initial plant feed, minimise waste pre-stripping and the requirement for consistent total material movement. In addition, four constraints were imposed on the mine production schedule as listed below. • First access to mining areas: mining commences in Ewoyaa South 2 pit whilst removal of existing HV powerlines traversing the Ewoyaa main pit location occurs. • Milling rate: The Early Production Phase targets 50 kt per month of crusher feed with the first year of full production targeting 2 Mt, increasing to an annual crusher feed rate of 2.7 Mt per annum thereafter. • P2 ore limit: % of P2 in the ore blend is limited to 10% where possible. • All Inferred material categorised as waste. 13.7.2 Pre-production ALL have adopted a strategy for early cash flow generation by implementing an early production phase, which utilises a modular DMS plant to produce a spodumene product. This phase runs for 14 months, comprising a 5-month pre- production period from mining contractor mobilisation, followed by nine months of crushing 50 kt per month to feed the modular DMS plant. The pre-production period mines a total of 786,000 bcm of waste and 167 kt at 1.29% Li2O of crusher feed. 13.7.3 Pit Sequencing Mining starts in Ewoyaa South 2 in November 2024, followed by the Ewoyaa Main starter pit in January 2025. The Ewoyaa Main pit final cutback commences in Year 3 (2027), Ewoyaa NE and Anokyi in Year 4 (2028), Okwesi in Year 5 (2029) and Ewoyaa North in Year 6 (2030). In Year 7 (2031) the Grasscutter Main Pit is commenced, followed by Abonko Main and Abonko North in Year 8 (2032) and Kaampakrom and Sill in Year 10 (2034). All other pits start in Year 11 (2035). Year 11 sees ten pits in total being mined, most of which are relatively small and (very) high strip ratio pits. Mining ceases at the end of Qtr 3, Year 12. 13.7.4 Production Schedule Results

TECHNICAL REPORT SUMMARY EWOYAA LITHIUM PROJECT Page 193 of 368 During the Early Production Phase, the total material movement is 6.1 Mt, including a total of 453 kt of ore that is processed by early production DMS plant. Total material movement increases to 18 Mt in the first year of the fixed process plant operation and thereafter gradually increases on account of higher mining strip ratios. Stockpile tonnages fluctuate significantly, reaching about 0.1 Mt at the end of Year 1 (Early Production Phase), increasing to 0.7 Mt and 0.9 Mt at the end of Year 2 and Year 3 respectively, after which it decreases to about 30 kt in Year 4 to then increase to about 500 kt in Year 5 with a maximum reached in Year 6 (1.0 Mt). TABLE 13-8 SUMMARY MINE PRODUCTION SCHEDULE Year Total Material Waste Strip Ratio Crusher Feed Mined Stockpile (End of Year) Ore processed Tonnes Li2O Tonnes Li2O Tonnes Li2O [Mt] [Mt] [w:o] [Mt] [%] [kt] [%] [Mt] [%] 1(1) 6.1 5.5 9.4 0.6 1.37 0.1 1.14 0.5 1.43 2 18.2 15.6 6.1 2.5 1.27 0.7 1.21 2.0 1.29 3 24.8 21.9 7.4 2.9 1.25 0.9 1.15 2.7 1.27 4 38.6 36.8 20.2 1.8 1.07 0.03 0.99 2.7 1.09 5 41.1 38.0 12.0 3.2 1.20 0.5 0.96 2.7 1.24 6 39.5 36.6 12.4 2.9 1.35 1.0 1.26 2.4 1.31 7 43.6 41.3 17.8 2.3 1.23 0.9 1.30 2.4 1.22 8 45.3 43.1 18.9 2.3 0.7 0.7 1.24 2.4 1.22 9 48.9 47.2 27.6 1.7 1.15 0.03 1.30 2.4 1.17 10 48.7 46.4 20.1 2.3 1.12 0 2.3 1.12 11 43.9 41.5 17.0 2.4 1.25 0.3 1.21 2.1 1.26 12 7.2 6.6 11.0 0.6 1.24 0 0.9 1.23 Total 406.0 380.3 14.8 25.6 1.22 25.6 1.22 NOTE: 1. Early production phase, which covers 14 months. A summary of annual total material movements by pit area is represented graphically in Figure 13-9. TECHNICAL REPORT SUMMARY EWOYAA LITHIUM PROJECT Page 194 of 368 FIGURE 13-9 TOTAL MATERIAL MOVEMENT BY PIT 13.8 MINING COST ESTIMATION 13.8.1 Contract Mining Costs Estimation of direct mining costs was developed on the basis of a mining contractor operation, under the management of the ALL-site operations team. Mining costs were based on: • Contract mining costs established via a request for quotation (“RFQ”) process involving eight established mining contractors active in the region for the full scope of contract mining services, excluding grade control drilling. Contract grade control costs were provided by the exploration drilling company that conducted the resource drilling at the Project (Geodrill); • Capital works relating to mobilising and establishing mining operations were requested as part of the RFQ process; and • Owner’s operations mining management team costs were estimated by ALL and are included in the OPEX. Contract mining quotes were obtained from eight mining contractors experienced in the region. For conforming contractor quotes, unit mining costs excluding site establishment, mobilisation and de-mobilisation. Unit costs ranged from US$3.21/t to US$4.60/t mined based on material movement for the first seven years of mine life. An average mining cost of US$3.75/t mined was adopted for the study. LOM Mining costs were estimated at $3.82/t mined, inclusive of all costs for contractor mobilisation, site establishment, pre-production mining and demobilisation. 13.8.2 LOM Mining Costs LOM mining costs (Table 13-9) include pre-production, contractor mobilisation, site establishment, grade control, ore rehandle and contractor demobilisation costs and are included in the financial model. TECHNICAL REPORT SUMMARY EWOYAA LITHIUM PROJECT Page 195 of 368 TABLE 13-9 LOM MINING OPERATING COSTS 13.8.3 Mining CAPEX LOM rehabilitation and closure costs (US$45.8M) have been estimated as part of sustaining and closure costs for the operation as described in Section 18.10 and are included in the financial model. LOM Total (US$ M) Waste & Ore Mining $ 1,531.2 Grade Control $ 11.3 Ore Rehandle $ 6.7 Demobilisation $ 1.1 TOTAL MINING COSTS $ 1,550.2 TECHNICAL REPORT SUMMARY EWOYAA LITHIUM PROJECT Page 196 of 368 14.0 PROCESSING AND RECOVERY METHODS 14.1 KEY PROCESS DESIGN CRITERIA The plant is designed to process 2.7 Mtpa of Run-of-Mine (ROM) at 85% utilisation through the DMS plant and 70% utilisation through the Comminution Circuit. The comminution circuit has been designed to minimise fines production so that most of the ROM feed will report to the DMS Circuit. The DMS circuit is multistage and treating separate size fractions to produce a spodumene concentrate. TABLE 14-1 PLANT SCHEDULE - DESIGN CRITERIA Crushing Plant Operating Schedule Throughput dry t/annum 2,700,000 Crushing Circuit Overall Availability % 70.0% Total Operating Hours Per Year h 6,132 Feed Rate (Dry) dry t/h 440 Feed Rate (Wet) wet t/h 459 Wet Plant Operating Schedule Throughput dry t/annum 2,700,000 DMS Circuit Overall Availability % 85.0% Total Operating Hours Per Year h 7,446 Feed Rate (Dry) dry t/h 363 Feed Rate (Wet) wet t/h 378 DMS Concentrate Production at 5.5% Li2O Source Coarse, Re-crush, Fine and Ultrafine DMS Sinks Target DMS Concentrate Grade % Li2O 5.5 Target DMS Recovery % Li2O 61.4% Mass Split to DMS Concentrate % Plant Feed 9.3 - 13.9 Mass Split to DMS Concentrate % Plant Feed 13.6% DMS Concentrate Production tph 49.4 14.2 PROCESS PLANT ROM Feed material will either be direct tipped or loaded by front-end loader (FEL) into the ROM feed bin. ROM feed bin material is withdrawn by an apron feeder and scalped on a vibrating grizzly. The oversize reports to the primary jaw crusher. The jaw crusher product is combined with the grizzly undersize and conveyed to the secondary crusher circuit. Magnetic tramp material is removed from the conveyed material by a head end magnet. Primary crusher product is screened on the secondary screen. The screen oversize is conveyed to the secondary crusher. The secondary crusher operates in open circuit, and the discharge is then screened on the tertiary crushing screen. The tertiary screen oversize feeds two tertiary crushers operating in parallel, and closed circuit with the tertiary crushing screen.

TECHNICAL REPORT SUMMARY EWOYAA LITHIUM PROJECT Page 197 of 368 The tertiary screen undersize is combined with the secondary screen undersize and conveyed to the crushed ore bin. The blockflow (Figure 14-1) summarises the comminution circuit configuration. FIGURE 14-1 BLOCKFLOW DIAGRAM - CRUSHING CIRCUIT Crushed ore feed is processed through a two-stage Dense Media Separation (DMS) beneficiation process. The feed material is separated into three size fractions to ensure DMS separation efficiency, the size fractions are Coarse (-10 +5.6 mm), Fines (-5.6 +2.8 mm) and Ultrafines (-2.8 +1.0 mm). It should be noted that the FEED process design criteria used a 1 mm close size for the ultrafines stream. However, upon review of the metallurgy and testwork to date, the preference is to instead utilise a bottom size fraction of 0.85 mm. The process plant design and equipment have sufficient capacity to adjust the bottom size to 0.85 mm, there however a risk that the ultrafines prep screening efficiency reduces slightly, resulting in increased grits in the dense media. The remainder of the circuit design has sufficient capacity for increased material to the ultrafines and the nominal media to ore ratios will remain greater than six. Each two stage DMS consists of a Primary and a Secondary circuit. The Primary DMS sinks are upgraded in the Secondary stage, this is essentially a roughing and cleaning process. Secondary sinks from each size fraction are combined to produce a DMS Concentrate product. To improve recovery of unliberated spodumene in the Coarse DMS floats, the fraction is fed to the Recrush circuit. The Recrush circuit crushes the material to -4 mm and the Recrush DMS sinks is stockpile as a separate Recrush DMS Concentrate product. The Primary Fines and Ultrafines DMS floats report to the DMS Rejects bin as a dewatered tailings product. The -1.0 mm fraction is pumped to the fines dewatering circuit. The dewatering cyclone overflow or slimes fraction is sent to the thickener, and the thickener underflow is pumped to tailings storage facility. The dewatering cyclone underflow fraction is then further dewatered by a dewatering screen and conveyed and stacked in a Fines stockpile. The material will be sold as a Secondary product. The blockflow diagram (Figure 14-2) summarises the DMS Plant configuration. TECHNICAL REPORT SUMMARY EWOYAA LITHIUM PROJECT Page 198 of 368 FIGURE 14-2 BLOCKFLOW DIAGRAM - DMS PLANT The process plant flowsheet consists of the following unit processes and facilities: • ROM Feed, Primary & Secondary Crushing • Tertiary Crushing • DMS Plant Feed Circuit • DMS Feed Prep Circuit • Primary Coarse & Fines DMS Circuits • Primary DMS FeSi Circuit • Secondary Coarse & Fines DMS Circuit • Secondary DMS FeSi Circuit • Recrushing Circuit • Recrush DMS Circuit • Recrush FeSi Circuit • DMS & Recrush Products • DMS Rejects & Middlings • Dewatering Circuit • Tails Thickener • Plant Reagents • Process and Potable Water • Raw Water • Tails Boosters & TSF • Primary & Secondary Ultrafines DMS Circuits • Primary & Secondary Ultrafines FeSi Circuits TECHNICAL REPORT SUMMARY EWOYAA LITHIUM PROJECT Page 199 of 368 14.2.1 ROM Feed & Primary Crushing ROM feed is direct tipped or loaded by front-end loader (FEL) into the ROM feed bin. The bin is fitted with a static grizzly to protect the circuit from oversize. Material is withdrawn at a controlled feed rate with an apron feeder onto the vibrating grizzly. The grizzly oversize is fed to the primary jaw crusher. The jaw crusher product is combined with the grizzly undersize and apron feeder dribble material and conveyed to the secondary screen feed conveyor. The secondary screen feed conveyor is fitted with a self-cleaning belt magnet. The ROM feed bin allows for direct truck tipping as well as front-end loader tipping. The capacity of the bin has been designed to allow for two CAT777 truck loads. The bin is fitted with a static grizzly to protect the downstream processes from oversize. A top size of 1,000 mm is catered for in the primary crusher. No ROM rock breaker has been allowed and the oversize is to be removed by front- end loader. A rock breaker has been allowed for above the jaw crusher. 14.2.2 Secondary Crushing The primary crushed product is conveyed to the Secondary Crushing Screen. Material from the top (+36 mm) and bottom screen decks (+10 mm) is conveyed to the secondary crusher. The conveyor is fitted with a metal detector. The secondary crusher product is conveyed to the tertiary screen vibrating feeder which feeds onto the tertiary crushing screen. 14.2.3 Tertiary Crushing Tertiary Screen Vibrating Feeder controls feed onto the tertiary crushing screen. oversize from the top (+20 mm) and bottom decks (+10 mm) is conveyed to the tertiary crusher feed bins. The conveyor also has a metal detector. Vibrating feeders ensure choke feed conditions to the two tertiary crushers. tertiary crushed product combines with the secondary crushed product and reports back to the tertiary crushing screen. The undersize (-10 mm) is conveyed to the crushed ore bin. There is the option to stack crushed ore via diverting the crushed ore stream to the crushed ore radial stacker. The tertiary crusher circuit is designed to minimise fines (-1 mm) generation to minimise fines bypass in the DMS circuit and reduction in lithium recovery to DMS products. 14.2.4 DMS Plant Feed Circuit Crushed ore (nominally -10 mm) is withdrawn from the Crushed Ore Bin at a controlled feed rate via the Reclaim Feeder 1. Material is then conveyed by Reclaim Feeder 2 and DMS Feed Conveyor to the DMS Prep Circuit. The feed conveyor is fitted with a cross belt sampler for metallurgical control and accounting purposes. 14.2.5 DMS Feed Prep Circuit DMS Feed is discharged onto the Coarse Prep Screen. Pulping and spray water is added to the screen to assist with the screening process. The screen oversize reports to Primary Coarse DMS circuit. The screen undersize (-5.6 mm slurry) is pumped to the Fines Prep Screen which also uses spray water to assist screening. The screen oversize reports to the Primary Fines DMS circuit. The Fines Prep Screen undersize is pumped to the Ultrafines Prep Screen. Spray water is used to assist screening. The screen oversize reports to the Primary Ultrafines DMS Circuit. Screen undersize is pumped to the Dewatering Circuit. TECHNICAL REPORT SUMMARY EWOYAA LITHIUM PROJECT Page 200 of 368 The three DMS size fractions provide the flexibility to change the screen panels if the feed PSD varies from design, for example with different ore zones in the pit. 14.2.6 Primary Coarse & Fines DMS Circuits The Coarse Prep Screen oversize (-10 +5.6 mm) is discharged into the primary coarse mixing box. The mixing box combines the ore with ferrosilicon (FeSi) medium at the correct density before it is pumped to the primary coarse cyclone. In the cyclone the higher density particles (spodumene rich stream) are concentrated to the cyclone underflow. The less dense particles are concentrated to the cyclone overflow. Similarly, the Fine Prep Screen oversize (-5.6 +2.8 mm) is discharged into the primary fines mixing box. Same as the coarse circuit, the ore and FeSi slurry is pumped to the two primary fines DMS cyclones. Both the coarse and fines cyclone overflows discharge on to the primary coarse & fines floats screen. The floats material drains freely on the first half of the screen (drainage section) and is then washed to remove any remaining medium in the second half of the screen (rinse section). Half the drained medium returns directly to the primary dense medium tank, with the other half draining to the primary densifier feed hopper; while the rinsed medium reports to the primary dilute medium tank. The rinsed solids discharge from the screen and are conveyed to the DMS rejects bin. Both the coarse and fines cyclone underflows discharge into separate partitions on the primary coarse & fines sinks screen. Drained medium returns to the primary dense medium tank, while the rinsed medium reports to the primary dilute medium tank. The rinsed sinks discharge from their screen partitions into separate chutes into their respective, coarse/fine DMS mixing box. The DMS will typically operate at medium densities 2.20-2.60 t/m3 and will therefore be operated on a FeSi only dense medium. Primero chose to remove static drain screens from the DMS circuit design, in favour of larger area vibrating screens. This decision is based on Primero experience which has shown static screens have higher wear rate, significantly increased pegging, and are more difficult to troubleshoot and maintain than vibrating equivalents. 14.2.7 Primary DMS Fesi Circuit The function of the FeSi circuit is to recover FeSi from the dilute medium and to increase density of the dense medium to the target medium density. Dilute medium from the rinse sections of the DMS screens drains to the primary dilute medium tank and is pumped to the primary DMS magnetic separator which recovers the magnetic FeSi from the dilute medium stream. The recovered FeSi is returned to the primary dense medium tank. The dense medium from the drain sections of the DMS screens is split, with the sinks partitioned drain section reporting to the dense medium tank. The floats partition of the drain section of the screen reports to the primary densifier feed hopper and pumped to the primary tube densifiers. Densifier underflow reports to the Primary dense medium tank and overflow to the dilute medium tank. The primary dense medium pumps (coarse and fines) pump FeSi at target density to the primary dense medium header box which supplies dense medium to the mixing boxes. 14.2.8 Secondary Coarse & Fines DMS Circuit The primary DMS sinks discharge into the two mixing boxes, coarse and fines and pump to the secondary coarse cyclone and the secondary fines cyclone.

TECHNICAL REPORT SUMMARY EWOYAA LITHIUM PROJECT Page 201 of 368 Both the coarse and fines cyclone overflows discharge into separate partitions on the secondary coarse & fines floats screen. The coarse floats are sent to the recrush circuit, whilst the secondary fine floats are conveyed to the middlings bin. Both the coarse and fines cyclone underflows are combined on the secondary coarse & fines sinks screen. Secondary sinks are conveyed and stacked on the DMS product stockpile. The operating density of the circuit will be higher than the primary circuit density and will be operated with a FeSi only medium. 14.2.9 Secondary DMS FeSi Circuit Similar to the Primary FeSi circuit, dilute medium from the rinse sections of the DMS screens drains to the secondary dilute medium tank and is pumped to the Secondary DMS magnetic separator which recovers the magnetic FeSi from the dilute medium stream. The FeSi is returned to the secondary dense medium tank. The dense medium from the drain sections of the sinks screens reports to the dense medium tank. The floats screen drains report to the secondary densifier feed hopper and pumped to the secondary tube densifiers. Densifier underflow reports to the dense medium tank and the overflow to the dilute medium tank. The secondary dense medium pumps (coarse and fines) pump FeSi at target density to the secondary dense medium header box which supplies dense medium to the mixing boxes. 14.2.10 Recrushing Circuit Secondary coarse floats are conveyed to the recrush crusher feed bin. A metal detector is located on the feed conveyor and if metal is detected, the recrush feed stream is bypassed to the middlings. Material is withdrawn from the bin and fed to the recrush crusher. Crushed product discharges onto the recrush prep screen, where pulping and spray water is used to screen the material at 1 mm. Oversize enters the recrush DMS circuit. Undersize material is pumped to the ultrafines prep screen underflow hopper to be transported to the dewatering circuit. 14.2.11 Recrush DMS Circuit Feed from the Recrush Prep Screen discharges from the screen into the recrush DMS mixing box, is mixed with dense medium and pumped to the recrush DMS cyclone. DMS cyclone underflow and overflow discharge onto the recrush DMS screen. Sinks discharge to the recrush product conveyor and to product handling. Floats discharge on to recrush DMS floats & degrits conveyor and transferred to the middlings product bin. 14.2.12 Recrush FeSi Circuit As with the other FeSi circuits, dilute medium from the rinse sections of the DMS screen drains to the recrush dilute medium hopper and is pumped to the recrush magnetic separator to recover FeSi from the dilute medium. The dense medium from the drain sections of the sinks screens reports to the dense medium hopper. The floats screen drains report to the recrush densifier feed hopper and pumped to the tube densifiers. Densifier underflow reports to the dense medium hopper and densifier overflow to the dilute medium hopper. The recrush dense medium pump supplies FeSi at target density to the recrush dense medium header box which supplies dense medium to the mixing boxes. 14.2.13 DMS Products TECHNICAL REPORT SUMMARY EWOYAA LITHIUM PROJECT Page 202 of 368 Secondary coarse & fines sinks are discharged onto the DMS product conveyor from the secondary coarse & fines sinks screen. The DMS product conveyor also collects the secondary ultrafines sinks which are transferred from the ultrafines product transfer conveyor. The combined product is stacked on the DMS product stockpile. Recrush sinks are conveyed from the recrush screen discharge to the recrush product stockpile stacker and deposited on the recrush DMS concentrate stockpile. The product stockpiles are concrete lined allowing for run-off water to be collected and pumped back to the processing facility. The product and discard conveyors are fitted with samplers as well as weightometers for metallurgical control and accounting purposes. 14.2.14 DMS Rejects & Middlings Recrush floats discharge on to recrush DMS floats & degrits conveyor. The secondary coarse & fines floats are conveyed via the secondary middlings conveyor and are combined with both the recrush and secondary ultrafines floats on the middlings transfer conveyor. The combined floats are discharged into the middlings bin. 14.2.15 Dewatering Circuit The -1 mm material from the ultrafines prep screen undersize and recrush prep screen undersize are pumped to the dewatering cyclone cluster. The dewatered and deslimed underflow is further dewatered by the dewatering screen. Dewatered material is conveyed and stacked on the fines stockpile. The overflow (and slimes) from the dewatering cyclones report to the thickener via the safety screen as tailings and is pumped to the thickener feed box. The dewatered grits will either be sold as a secondary product or alternatively kept on a separate stockpile for future processing. 14.2.16 Tails Thickener The safety screen underflow is fed to the tails thickener and combined with thickener underflow recycle and is mixed with flocculant to assist the settling process. The thickener underflow is pumped to the first tails hopper and the thickener overflow reports to the Process Water Tank. The tailings disposal system consists of several two-stage pumping and booster stations. The first two stages of tailings pumps station are located at the thickener. 14.2.17 Plant Reagents Two compressors are included in the design, both units are operational. Air from the compressors is dried and filtered to provide the air required for actuated and control valves as well as pneumatic actuators. The DMS medium will be made up manually in the FeSi mixing circuit. Once the medium is made up to the correct density and sufficient mixing has occurred, the medium is distributed to the DMS circuits. An automated flocculant plant will make up flocculant to the required strength and dosed at a controlled rate to the thickener. 14.2.18 Process and Potable Water Process water is pumped from the process water tank to various process water distribution points. Raw water is added to the process water tank. TECHNICAL REPORT SUMMARY EWOYAA LITHIUM PROJECT Page 203 of 368 Potable water for eye wash stations and other non-process infrastructure is pumped from the potable water tank to the various users. Potable water make-up comes from the potable water treatment unit which will treat water supplied from an external source. The treatment plant produces brine waste, which is sent to the thickener via the safety screen. 14.2.19 Raw Water The raw water storage tank includes fire water supply reserve. The firewater draws from the bottom of the tank and raw water suction is midway up the tank, leaving reserve for firewater. Raw water is pumped from the raw water storage tank to the raw water distribution points. This includes raw water for gland service water and MSA water supply. Raw water make-up is added to the raw water tank from the raw water dam. 14.2.20 Tails Boosters & TSF The first tailings pumping station consists of a hopper and two stage pump arrangement and transfers tailings to the TSF via two booster pump stations. Decant water is pumped from the TSF back to the Raw water dam which supplies raw water to the processing plant and allows for controlled discharge of water. Primary & Secondary Ultrafines DMS Circuit Feed from the ultrafines prep screen discharges the screen into the primary ultrafines DMS (UFDMS) mixing box and is mixed with dense medium and pumped to the primary ultrafines DMS cyclones. The primary UFDMS cyclone underflow and overflow discharge onto the primary ultrafines screen. Sinks discharge into the secondary ultrafines mixing box. Floats discharge on to DMS rejects conveyor and transferred to the DMS rejects bin. Ultrafines DMS circuits required a standalone FeSi circuits due to physical limitations and proximity to the primary and secondary coarse and fines DMS circuits. Primary & Secondary Ultrafines FeSi Circuits As with the other FeSi circuits, the ultrafine (primary and secondary) circuits dilute medium from the rinse sections of the DMS screen drains to the circuits dilute medium hopper and is pumped to the magnetic separator to recover FeSi from the dilute medium. The dense medium from the drain sections of the sinks screens reports to the dense medium hoppers. The floats screen drains sections report to the densifier feed side of the respective dense medium hoppers, and from there is pumped to the tube densifiers. Densifier underflow reports to the dense medium hopper and densifier overflow to the dilute medium hopper. The ultrafines dense medium pumps supplies FeSi at target density to the dense medium header boxes which supply dense medium to the mixing boxes. 14.3 PROCESS PLANT LAYOUT 14.3.1 Plant Layout and Blockplan The plant was placed on the provided terraces with the primary crusher positioned to the northeast to best present this section to the mining operations. The product stockpiles have been placed to the southeast to provide easy access through to the national road network. The plant blockplan seeks to keep the traffic to the periphery of the plant to minimise interaction with operators in the DMS plant. The process plant layout is depicted in Figure 14-3. TECHNICAL REPORT SUMMARY EWOYAA LITHIUM PROJECT Page 204 of 368 FIGURE 14-3 PROCESS PLANT AND INFRASTRUCTURE VIEWED FROM THE WEST 14.3.2 Maintenance Access The plant design assumes the use of telehandlers and mobile cranes to assist with the rigging and fitting of mechanical equipment. Pumps in the DMS are located outboard of the plant to provide access for a telehandler and crawl beams within the structure assist regular maintenance. 14.3.3 Plant Electrical Distribution Electrical power is to be received from the mine’s consumer substation and distributed to the various electrical substations around the plant. The substation construction is envisioned as prefabricated structures mounted on steel support frames. Power to equipment drive motors will be provided from the Motor Control Centres (MCC) located in the substations. 14.3.4 Plant Infrastructure Plant stores, offices and a plant workshop will also be required to support plant operations, refer to Section 15.10. 14.4 PRE-PRODUCTION PROCESSING 14.4.1 Key Design Criteria ALL has identified an opportunity to conduct early processing operations using a modular DMS processing plant and contract crushing services. The early production will precede the primary processing plant by nine months, allowing earlier mining to commence, early training of operations team and early cash flow. The design criteria and mass flows are summarised in Table 14-2 and Table 14-3.

TECHNICAL REPORT SUMMARY EWOYAA LITHIUM PROJECT Page 205 of 368 TABLE 14-2 KEY DESIGN CRITERIA Modular Plant Design Criteria Quantity Units Crushing Plant Design Throughput 603,389 tonne/yr DMS Plant Feed Throughput 375,629 tonne/yr Crushing Plant Feed Throughput 86 tonne/hr DMS Plant Feed Throughput 54 tonne/hr Plant Utilisation 80 % Operating Hours 7,008 hrs/yr TABLE 14-3 PRE-PRODUCTION CRUSHING AND MODULAR DMS PLANT OVERVIEW Plant Feed Secondary Fines DMS Feed DMS Product Sec Floats Prim Floats TSF Throughput (tph) 86.1 32.5 53.6 6.4 9.7 34.0 3.6 % Li2O 1.20% 1.16% 1.22% 5.41% 1.52% 0.36% 1.16% Li2O Distribution 100% 37% 63% 33% 14% 12% 4% 14.4.2 Crushing Summary The modular DMS plant will be fed by ore crushed by a contract crushing service provider. Ore feed material will be crushed through a multistage mobile crushing plant targeting a product with top size of 10 mm. 14.4.3 Modular DMS Plant The following process plant description is from the modular DMS plant vendor proposal. The plant consists of the following modules to treat pre-crushed ore (-10 mm P100): • One primary sizing and screening module with a head capacity of 86.0 tph • Two stage dense medium separation (DMS) plants namely: 50 tph Primary DMS; and 17 tph Secondary DMS. • Effluent treatment: Thickening; Pressure filtration for zero effluent discharge; and Water reticulation. 14.4.4 Sizing and De-Sliming The crushed ore (crusher product) is fed into a 50-ton surge bin via a loader or conveyor. The crushed product is then withdrawn via a vibratory pan feeder and conveyed to the wet primary sizing screen feed chute. The sizing screen uses pulping water to screen the crusher product at 3 mm. The DMS feed range is -10 mm to +3 mm. The -3 mm ore is then pumped to the desliming and dewatering circuit. TECHNICAL REPORT SUMMARY EWOYAA LITHIUM PROJECT Page 206 of 368 The desliming circuit has a desliming cyclone which removes the -45-micron material as the cyclone overflow and the -3 mm +45 micron material as the underflow. The cyclone underflow is deposited on a dewatering screen which produces a low moisture cake for stockpile. The DMS feed bin will have a design capacity of 25 tons. The bin will be equipped with a level transmitter, to prevent overfeeding / over filling. DMS feed Material (-10 mm +3 mm) is extracted from the DMS bin via the DMS pan feeder and conveyed to the Primary DMS Feed preparation screen for further treatment. 14.4.5 Primary DMS The primary DMS feed conveyor discharges onto the primary DMS feed preparation screen via the feed preparation screen feed chute. The ore is pulped using the magsep effluent. The feed preparation screen plays a dual role namely, de-sliming and 1st stage grit removal (-3.0 mm). The +3.0 mm ore is discharged into the mixing box where the ore is mixed with FeSi medium at the correct density, supplied from the correct medium tank. The ore / medium mixture in the mixing box is pump fed to the cyclone via the cyclone feed pump. The DMS cyclone separates incoming ore into a high-density concentrate (sinks) fraction and low-density tailings (floats) fraction. The density separation takes place due to the centrifugal forces generated inside the cyclone. Due to the modular nature and capacity of the DMS plants, the use of combined floats/sinks screens are possible. This assists with a compact design as well as capital cost reduction. The cyclone overflow (float/tailings) from DMS Cyclone is laundered to the DMS floats drain and rinse side on the combined sinks/floats screen. Ferrosilicon medium is removed, from the floats stream, using the drain (feed) end of the combined sinks/floats screen, on the floats side. The ferrosilicon medium removed via the drain end of the floats side on the combined sinks/floats screen is laundered to the correct medium sump, via the drain section of the screen underpan. The remaining medium is “rinsed” on the rinse end of the floats side of the combined sinks/floats screen using medium pressure process water spray bars as well as magsep effluent. The Primary DMS floats reports to the Primary Floats conveyor and then to the Primary Floats stockpile. The cyclone underflow (sinks/concentrate) from the DMS Cyclone is laundered to DMS sinks side of the combined DMS sinks/floats screen. Ferrosilicon medium is drained using the drain (feed) end of the sink side on the combined floats/sinks screen. Adhering medium is washed off towards the rinse (discharge) side of the sinks screen using medium pressure spray water supplied by the process water pump as well spillage from within the DMS area. The ferrosilicon medium removed from the drain side of sinks screen is laundered to the correct medium sump. The rinsed medium reports to the dilute medium sump. The sinks/concentrate discharged from sinks screen, is discharged onto a vibrating feeder and then conveyed to the secondary DMS mixing box via the secondary DMS feed conveyor, as feed into the Secondary DMS. The medium collected in the correct medium sump is pumped to the mixing box using the correct medium pump. Correct medium is also pumped to a single tube densifier. The tube densifier is used to separate the medium into an over-dense fraction. TECHNICAL REPORT SUMMARY EWOYAA LITHIUM PROJECT Page 207 of 368 Medium density control is performed by the addition of process water using the density control valve directly into the correct medium sump, in response to the output from a non-nuclear density transmitter fitted to the correct medium feed pump delivery line. Dilute medium collected in the dilute medium sump is pumped to the magnetic separator using the dilute medium pump. The over dense medium recovered by the magnetic separator is collected in the magnetic separator over dense discharge chute. Over dense medium is then laundered to over dense splitter box via the demagnetising coil. The over dense medium then reports to correct medium sump or dilute medium sump. The effluent from the magnetic separators is separated into clean and dirty effluent in the magnetic separator underpan. Clean effluent gravitates to the drain and rinse screen flood boxes for use as low-pressure flood water to rinse FeSi through the various screens. Dirty effluent is used to pulp DMS feed on the Primary DMS feed preparation screen. 14.4.6 Secondary DMS The secondary DMS operates on the same principles as the primary DMS. Differences between the primary and secondary DMS include: • Secondary DMS receives primary DMS sinks and is used for concentrate grading (DMS middling and concentrate). Thus, it operates at a higher medium density than the primary DMS. • Final feed preparation has already been conducted on the primary DMS Feed preparation screen therefore it does not have a feed preparation screen on the Secondary DMS. • Secondary DMS floats reports to the middling’s conveyor. • Secondary DMS sinks reports to the Concentrate conveyor. 14.4.7 Tailings Treatment and Water Reticulation The cyclone overflow from desliming gravitates to the thickener feed box whereby flocculant and effluent are mixed to form a settling slurry. The flocculated slurry feeds a high-rate thickener. The settling slurry separates into a thickened solids fraction and clear supernatant stream. The supernatant exits the thickener as “overflow” and the thickened solids as “underflow”. The underflow is fed to a pressurised Plate and Frame filter press. The use of a filter press provides a zero effluent discharge philosophy and dry tailings cake stacking. The filtrate is recirculated back to the thickener feed box. Filter cake removal is by front end loader. TECHNICAL REPORT SUMMARY EWOYAA LITHIUM PROJECT Page 208 of 368 15.0 INFRASTRUCTURE 15.1 SITE DEVELOPMENT 15.1.1 Introduction Existing infrastructure that will support the site includes: • The sealed N1 highway running to the south of the site. • Existing unsealed roads traversing the site. • HV powerlines in the vicinity of and traversing the site. • Ports of Takoradi approx. 110 km to the west of site and Tema, 25 km east of Accra. • Airports at Accra and Takoradi. Infrastructure required to be developed or modified to support the site includes: • Water supply and sources including a water storage dam (WSD). • Power supply from the existing grid and existing electrical powerline infrastructure relocation for mine development. • Integrated Waste Landform Tailings Storage Facility (IWLTSF). • Plant site access road. • Buildings and facilities, including the Mine Services Area. • Fuel supply & storage. • Communications. Given the proximity and road quality to Accra and Takoradi, no airstrip is required to support the site. 15.2 SITE WATER MANAGEMENT 15.2.1 Overview The Ewoyaa project area requires raw water and process water for exploration, construction, exploration, plant operations, mining and dust suppression. Water sources include rainfall, groundwater, local reservoirs, and rivers. A water balance has been developed to determine the water demand through construction and as the operations ramp- up. The water balance is used to develop the site Water Management Plan, including dams, pumps and pipelines, drainage. The associated water infrastructure has been designed and costed in the FS estimate. The site is located downstream of a large catchment area to the East of the project which flows towards the Ewoyaa Main Pit. SRK has identified the extent of this catchment zone along with the remaining minor catchment zones affecting the overall mining area which are shown below in Figure 15-1. SRK has developed a conceptional SWMS in PCSWMM and created a dynamic rainfall runoff simulation model based on the SCS method. The model was set up to calculate 1:50-year and 1:100-year flood peaks. Based on average conditions including fissure water from the pits, the modelling indicates the following: • Make-up water demand specifically for the plant averages 1,036 m³/day. The remainder of the water used in the plant is received in the ROM feed (~463 m³/day) and recycled from the tailing (~229 m³/day). • The largest TSF recycle and process water shortfalls occur in March during average climatic conditions, as under average climatic conditions there is minimal rainfall from December to February.

TECHNICAL REPORT SUMMARY EWOYAA LITHIUM PROJECT Page 209 of 368 FIGURE 15-1 UPSTREAM CATCHMENT VOLUMES The water balance is sensitive to runoff coefficients and base flow rates as well as the variability of these parameters as a function of rainfall. As more site data becomes available, the mine’s water balance should be updated to understand the response to climatic variations, improve certainty on the makeup water requirements, and excess water generation and identify water conservation and water demand management measures. 15.2.2 Permits and Approvals The two acts of legislation that are most relevant to surface water in general and surface water and groundwater at mines are the Water Act, and the Mines and Minerals Act. The Water Act provides for the establishment and determination of powers of the catchment and subcatchment councils, the granting of permits for water use, the protection of the environment and the prevention and control of water pollution. It also provides for the approval of water schemes and for matters relating to dam works. In effect the act delegates approvals for abstraction from surface and groundwater, and resources for mining purposes to the local Catchment Council, The Mines and Minerals act directs that the use of public water for any purpose other than primary purpose is regulated by the water act. Section 195 in effect states that the rights to dewatering water and contained stormwater, that would normally run to waste and is used in that or another nearby mining process, is vested in the holder. In all other circumstances relating to water, discharge or pollution the rights and responsibilities of miners and prospectors shall be in accordance with the Water Act. In terms of current legislation relating to water management at the ELP site, the following permits are required: TECHNICAL REPORT SUMMARY EWOYAA LITHIUM PROJECT Page 210 of 368 • Water use permit (For Water Dam / Reservoir) • Water use Permit (For Groundwater / Boreholes) • Dam Construction Approval • Dam Safety Licence • Dam Operations & Maintenance Manual • Dam Emergency Preparedness & Response Plan • Water Supply Installation Permit and Certification of Completion • Sewer Permit • Approval to pump from the Municipal Dam at Baafikrom 15.2.3 Environmental Considerations Groundwater and surface water quality monitoring will be carried out during construction and mining operations, and through closure for an agreed period according to industry standards and best practice. Details of monitoring installations and monitoring frequency will be defined and documented in the Water Management Plan which will be further refined in future stages of Project development and as the detailed designs progress. An Erosion and Sediment Control Plan will be prepared as part of the Project Execution Plan to detail the minimum requirements for sediment control and the construction of sediments ponds used in conjunction with diversion drains and surface water management. The Erosion and Sediment Control Plan and should include: • Measures for the interception, diversion and reduction of runoff from exposed soil surfaces, tailings dams and waste rock dumps. • Consideration of soil stabilisation methods, including both vegetative and non-vegetative methods • Sediment control structures (such as detention dams) should be provided where necessary to remove sediment before release to the environment. All sediment control and retention facilities should be properly maintained. 15.2.4 Closure At mine closure, clean water runoff from the rehabilitated spoil areas that meet with the discharge water quality criteria will be released back into natural creeks. The landform will be amended as part of rehabilitation works, to make natural drainage possible. Water from rehabilitated areas will be released once rehabilitation success criteria and the water quality are met the government standard. Closure of the mines water management system elements considered below include Water Storage Facilities and all associated pumping and control systems, open pits and sedimentation dams, Tailings Storage Facilities including management of post closure seepage. Pits, dams and other water management ponds may be reshaped, backfilled with waste rock or left to fill naturally with ground and surface water ingress. In many cases these water storage bodies can add valuable water sources for local communities and native wildlife. The sedimentation dams will likely be retained in their final form to assist with post closure environmental control. The rate of silting will reduce significantly after mining operations have ceased, and the open pit lakes will intercept all but minor quantities of the sediment load. Ultimately the sediment load carried into the downstream river systems will equal or better than those of pre-mining levels. 15.3 WATER BALANCE Data from the site was used to define the behaviour of the model and the boundaries defined. The boundaries have been defined according to the following: • Pit Mining Area; TECHNICAL REPORT SUMMARY EWOYAA LITHIUM PROJECT Page 211 of 368 • Plant; • Tailings Storage Facilities (IWLTSF and IPTSF); and • Water Storage Dam (WSD). A daily water balance was set up in Goldsim and the water balance reads the daily rainfall and evaporation. The water use indicated in the water balance is estimated by calculation or assigned as a constant design value provided in the TSF scoping study. These assumptions/constants can be modified at any stage, and the resulting water balance would be automatically updated. Dewatering of the pit is modelled in the water balance using data obtained from the groundwater model. The average rainfall conditions are also automatically updated as more rainfall data is added to the existing record. The assumptions implemented in the water balance modelling are presented in Table 15-1. The process flow diagram indicating the various locations used in the water balance is presented in Figure 15-2. The TSF area, plant water demand and plant production were dynamically simulated over the life of mine. TABLE 15-1 WATER BALANCE ASSUMPTIONS AND VARIABLES The TSF area was set up to change over time based on the development of the TSF. At design capacity the processing plant would require water volumes close to 1,370 m³/day. Operating at the planned 85% utilisation and excluding the water in the ROM product and recycled water, the annual plant water consumption is around 321 GL/year. Based on average conditions including rain and fissure water from the pits, the modelling indicates the following: • Make-up water demand specifically for the plant averages 1,036 m³/day. • The TSF recycle water to the plant averages 230 m³/day. • The moisture in the ROM product, entering the plant is approximately 465 m³/day. The model also makes allowance for the daily water demand required for site dust suppression based on the area of haul roads and the daily evaporation rates. For the purposes of estimation in pit and high use haul roads are allocated twice the application of low use haul roads. In general, dust suppression volumes range between 500 m³/day and 1,900 m³/day are expected to be required depending on mining stage and variance in the annual weather conditions. The washdown facilities located at the workshop and service bays have been estimated to require a total combined amount of 150 m³/day of raw water on average. There are however several factors which could increase predicted draw on the dam supply. These include: • Reduced Tailings Return Water. • Increased draw for dust suppression. • Extended dry periods or lack of local rainfall reducing rainfall runoff contributions into the open pits and dams. Table 15-2 summarises the daily average site water demand. Figure 15-2 illustrates the average site water balance, with fissure water inflows. Variable Value Unit Percentage of the TSF that is estimated as a pool where water ponds 5 % Percentage of the TSF that is Wet as the slurry flows to the pool 35 % Percentage of the TSF that is Dry 60 % Interstitial Storage (percentage of tonnage) 0.25 Slurry Density 1.3 Tonne/m3 Tonnage 2 700 000 Tonne/annum TECHNICAL REPORT SUMMARY EWOYAA LITHIUM PROJECT Page 212 of 368 TABLE 15-2 SITE WATER DEMAND 15.4 WATER SUPPLY 15.4.1 Water Supply Sources The primary source of raw water to the proposed WSD is via pit dewatering sources. A numerical groundwater model was developed by SRK to simulate the inflows into the various pits. The modelled hydraulic conductivities for the weathered zones were derived from pumping tests undertaken on monitoring wells installed close to the Ewoyaa Main pit. Passive inflows into the Ewoyaa Main and Ewoyaa South 2 pits are the greatest, with a maximum inflow of 1,995 m³/day and 1,652 m³/day respectively. Inflows into the outer pits are relatively low at less than 1,000 m³/day. The combined groundwater inflow from all the pits gradually increases from 275 m³/day to a peak of 4,944 m³/day by year 11 of operation. The Project design includes a water storage dam (WSD) of capacity 184,000 m³. Ground water flowing into the pits will be pumped to the WSD to maximise re-use of water in the Project area. The Project estimate for make-up water to the plant is 100 m³/d for the initial startup and first two years of operation. It is proposed, subject to approvals, to pump make-up water to the WSD from the municipal dam (Agage Lake) at Baafikrom approximately 7 km away. In proceeding years, the storage capacity of the TSF, and water in-flows to the pits are estimated to reduce make-up water demands to the point where in year 3 of operation the Project should become self-sufficient, without pumping from the dam. Estimates are based on average rainfall. Source Demand (Average) Comments Processing Plant 1,730 m3/day Based on 85% utilisation Dust Suppression 1,500 m3/day Model based on climatic history Wash Down 150 m3/day Based on times of peak plant usage Irrigation 100 m3/day Revegetation and agriculture TOTAL 3,480 m3/day

TECHNICAL REPORT SUMMARY EWOYAA LITHIUM PROJECT Page 213 of 368 FIGURE 15-2 SITE AVERAGE WATER BALANCE WITH FISSURE PIT INFLOWS 15.4.2 Water Storage Dam The WSD comprises of a low permeability design situated on the southwestern face of the proposed waste dump of 184,000 m³ approximate capacity. The WSD will collect rainfall runoff from a relatively small catchment, however the bulk of fill water will originate from pit water inflows and supplemented from the nearby municipal dam at Baafikrom some 7 km away. TECHNICAL REPORT SUMMARY EWOYAA LITHIUM PROJECT Page 214 of 368 The proposed location for the WSD is shown in Figure 15-3. The basin area will be cleared, grubbed, topsoil stripped, and a 300 mm thick compacted soil liner constructed over the entire basin area, comprising either reworked in-situ material or imported low permeability material. The WSD embankment is proposed to be constructed using borrow low permeability material. A typical section of the proposed WSD embankment configuration is shown Figure 15-4. An operational emergency spillway will be installed to convey any emergency flow in a controlled manner and to protect the integrity of the constructed embankments in the event of overflow. A decant system for water abstraction will be used throughout the operation. The decant system will consist of a submersible pump floating decant, pumping to the plant for use in the process circuits. FIGURE 15-3 WSD LOCATION FIGURE 15-4 WSD EMBANKMENT TYPICAL CROSS-SECTION 15.4.3 Tailings Return TECHNICAL REPORT SUMMARY EWOYAA LITHIUM PROJECT Page 215 of 368 The amount of water returned from the reject’s disposal area controls the overall site water balance on site and the need or otherwise to import either raw or mine water to supplement available site reserves. Return water volumes will be further modelled in future stages of Project development and will need to be monitored closely during mining operations to ensure site water balance is achieved and maintained. Tailings seepage and decant has been modelled by SRK and forms an important component of the plant water supply. The decant will be returned directly to the plant after settling. It forms an important component of the water supply to the plant and is expected to average approximately 230 m³/day. A further 465 m³/day is received by the plant in the ROM product moisture. 15.4.4 Rainfall and Pit Dewatering Annual rainfall data has been obtained from the nearest weather station to the project site, located in Saltpond. The long-term rainfall data obtained from the Saltpond weather station is summarised below in Table 15-3 and has been used in conjunction with the more recent data taken from the weather station which have been established on the mine site. Annual totals range between 0.9 m and 1.1 m in the coastal savannah areas and up to 1.6 m in the interior close to the margin of the forest zone. The dry season is typically observed during the summer months, December to February and again during late Winter from July to September. The wet and dry average rainfall periods have been factored into the supply and demand calculations for the overall site water balance. TABLE 15-3 AVERAGE AND MAXIMUM RAINFALL DATA Mine pit inflows have been investigated by SRK and are summarised further in Section 13.3.5. Collection of water in the pits shall consist of all ground water seepage and surface water and rain fall runoff. Total water volumes collecting at the base of the open pits have been estimated to begin around 200 m³/day during the early phase of mining and increase gradually to a peak of over 4,500 m³/day by year 11 of operation. Water collected in the open pits will collect in purpose-built sumps at the lowest point of the pits and be pumped directly into the Water Storage Dam for use in plant operations as well as dust suppression and plant washdown. 15.4.5 Contingency Including contingency for operational and climate conditions, the maximum annual water demand from the dam is estimated to be 350,000 m³. Although initial modelling shows that the mine should be self-sufficient with regard to water supply, it is envisaged that pumping from the dam at Baafikrom could take place (pending approvals) for 6 months each year during the wet season when additional storage in the WSD is required due to factors such as reduced tailings return, lack of local rainfall or periods of extended drought and additional dust suppression requirements. 15.5 TAILINGS STORAGE AND MANAGEMENT 15.5.1 Tailings Properties and Testing Preliminary representative primary tailings samples were obtained for laboratory testwork. A sample were provided to Fremantle Metallurgy laboratory in Fremantle, Western Australia, for Dynamic Thickener Test work. A second sample were provided to Slurry Systems Engineering in Perth, Western Australia for rheology tests and assessment of pumpability. The laboratory test schedule for the tailings samples included: • Dynamic Thickener Test Work Rainfall Units Jan Feb Mar Apr May Jun Jul Aug Sep Oct Nov Dec Total Mean mm 16.6 22.5 71.7 96.8 207.5 222.3 65.5 25.9 43.6 103.6 53 27.3 950.5 Highest mm 73.4 91 250.4 222.9 433.8 471.8 286.8 80.5 125.5 211.2 160.5 113.1 1,541 TECHNICAL REPORT SUMMARY EWOYAA LITHIUM PROJECT Page 216 of 368 • Settling Test Work • Filtration Test Work • Rheology Test Work • Rheology and Pumpability Test Work • Physical Properties of Sample • Slurry Rheology • Settling Test Work • Assessment of Pumpability Based on the tailings testing completed, an overall deposited tailings in-situ dry density of 1.5 t/m3 is considered appropriate for design purposes. The results of the PSD, and AL testing for the primary ore tailings are presented in Table 15-4. TABLE 15-4 TAILINGS FEED CHARACTERISTICS TEST RESULTS Settling tests (undrained and drained) have been executed at 55% concentration of solids. The settling test results reveal no unusual settling behaviour. The objective of a settling test is to monitor the tailings settlement and the development of clear supernatant water in both undrained and drained conditions. For the drained settling test, water is removed through the base of the test cylinder and measured on top of the tailings where supernatant water developed. These measurements provide an indication of how much water will be available for recovery and the speed at which this water is released. The results of the settling and air-drying tests are summarised in Table 15-5. The laboratory results show water available as a percentage of water mass in the sample as presented in the table. TABLE 15-5 TAILINGS SETTLEMENT PARAMETERS Based on the preliminary tailings testing memorandum, the design slurry density of 55% was adopted. The points to note from the laboratory results, on the basis of calculating water return as a percentage of water mass, are: • Supernatant water available for recovery from the undrained settling test (i.e., no underdrainage installed) for slurry densities of 55% solids is approximately 21% within 24 hours; • The dry density at the completion of the undrained test is 1.25 t/m³ for 55% solids. In the tropical environment of the Project location, it is likely that very little water would be recovered after 24-hours, given the moderate to high humidity; Parameter Tailings % finer than 600 μm 100% Specific Gravity 2.71 Liquid Limit (%) 38% Plastic Limit (%) 24% Plasticity Index (%) 14% Parameter Tailings Undrained - Supernatant Water 21.8% Undrained - Density 1.25 t/m3 Drained - Supernatant Water 29.3% Drained - Underdrainage Water 31.2% Drained - Density 1.38 t/m3

TECHNICAL REPORT SUMMARY EWOYAA LITHIUM PROJECT Page 217 of 368 • Supernatant water available for recovery from the drained settling test (i.e., underdrainage installed) for slurry densities of 55% solids is approximately 29% for within 24 hours; • The dry density at the completion of the drained settling test is 1.38 t/m³ for 55% solids. In the topical environment of the project location, it is likely that very little water would be recovered after 24-hours, given the moderate to high humidity; and • Underdrainage water from the drained settling test, available for recovery for 55% solids, within 24-hours, is approximately 31%. It should be noted that for both tests, supernatant water can flow down the inside of the cylinder after approximately 24 hours. This does not mean that additional water would be recovered from the underdrainage beyond this time, as the cylinder provides a flow path which would not exist in operation. The test results indicate that both the tailings settle moderately. The settled dry densities are high and are likely to be exceeded during operation of the IWLTSF. This system is expected to be designed to recover up to half of the total water recovered from the IWLTSF. Additionally, the results indicate that any water recovered at the plant by means of thickening will be offset by a reduction in the volume of water available for recovery at the decant pond. However, it is noted that the laboratory testing of tailings was executed under ideal conditions and is only a guide to actual performance since the supernatant water is decanted in the field, allowing the tailings to drain. 15.5.2 Tailings Geochemical Characteristics No further works for Tailing Geochemical Characteristics was identified during the FS study phase. For completeness we have included the findings below as per the PFS. Representative tailings slurry samples derived from the Ewoyaa Main Composite and the Anokyi Main Composite mineralisation have been geochemically characterised by Graeme Campbell and Associates in Perth, Western Australia. The Ewoyaa Main Composite and the Anokyi Main Composite tailings both classify as Non-Acid Forming (NAF), reflective of negligible sulphides. The tailings solids are enriched in lithium associated chiefly with residual spodumene with a slight to moderate enrichment of bismuth and tin. The tailings-slurry-water sample was neutral-to-alkaline (pH 7-8), and of low salinity. The concentrations of minor- elements were generally below, or near, the respective analytical detection-limits (0.1-10 μg/L range typically). 15.5.3 Waste Rock Geochemistry Preliminary geochemical characterisation of ore and waste rock materials was conducted as part of the exploration activities. ALL routinely conduct geochemistry testing on average 1 m interval drill samples as part of the exploration function. Assays are primarily focused on the ore material; however, the Company routinely assays between 4 m to 12 m into the waste lithologies in addition to a limited number of whole of drill hole intervals in the earlier years of resource drilling. Average ore and waste rock geochemistry was interpreted to be Non-Acid Forming (NAF) based on very low maximum potential acidity values and moderate acid neutralising values resulting in a predicted negative net acid producing result. The testing also returned generally neutral pH values. It should be noted that the majority of samples provided for testing comprised pegmatite, which was typically logged as comprising spodumene, quartz and mica in varying proportions but sulphides were only very rarely noted. The concentrations of uranium and thorium are below trigger- levels where radiometric testing is typically recommended. Minor sulphides were more commonly logged within the waste lithologies, and within schist more so than granite waste lithologies, however generally associated with localised cross-cutting fault structures. Average whole rock geochemistry of waste lithologies show very low sulphide content overall with minor contact enrichment in Li2O interpreted to be NAF. Further testwork to determine the overall acid generating potential of the waste and element enrichments will be conducted during execution phase of the project, with no known risk to the project. TECHNICAL REPORT SUMMARY EWOYAA LITHIUM PROJECT Page 218 of 368 15.5.4 Tailings Storage Design The objectives of the design of the TSFs are to optimise tailings storage capacity, maximise tailings density, achieve water recovery in the range of at least 65% of the slurry water, reduce seepage and minimise the environmental and societal impact. The IWLTSF embankments are proposed to be constructed using excavated material for Stage 1 and mine waste material as part of the proposed waste dump for Stage 2. The proposed IWLTSF (at the completion of Stage 2) and IPTSF configurations relative to the Waste Dump East Stage 1 are shown in Figure 15-5 and Figure 15-6 respectively. FIGURE 15-5 IWLTSF GENERAL ARRANGEMENT (PLAN) FIGURE 15-6 IPTSF GENERAL ARRANGEMENT (PLAN) Tailings are expected to be delivered from the Plant at a production rate of approximately 177 kt of solids per annum (ktpa) for 13 years. At times throughout the mine plan, the rate of deposition may increase or decrease. TECHNICAL REPORT SUMMARY EWOYAA LITHIUM PROJECT Page 219 of 368 The solids content (% solids) is expected to be approximately 55%. Tailings will be deposited using sub-aerial deposition techniques from multi spigot locations on the perimeter deposition embankments for the operation of the IWLTSF and from a single spigot for the operation of the IPTSF. Tailings spigotting or deposition within the IWLTSF and IPTSF is to be executed in thin layers of not more than 300 mm to ensure a uniform tailings beach falling towards the rock ring and opposing end of the pit respectively, is developed. The spigotting sequence for the IWLTSF is to be formulated such that the supernatant water pond is always maintained around a decant structure. Tailings deposition for the IWLTSF will occur from the perimeter embankment with spigot intervals of 20 m. Conductor pipes laid on old conveyor belt pieces are recommended to ensure that tailings discharged from the perimeter are deposited onto the tailings beach with minimal potential for erosion of the adjacent embankment. The diameter of the conductor pipe must be designed to suit the tailings distribution pipeline size and the conveyor matting, to be placed down the embankment, also must be adjusted to suit the size of the conductor pipe. Some operations may require not less than three (3) pieces of conveyor matting in the vicinity of the conductor pipe to provide sufficient erosion protection to the adjacent embankment. Development (filling) of the IWLTSF and IPTSF are shown graphically on Figure 15-7 and Figure 15-8 in terms of storage volume and tailings surface area. FIGURE 15-7 IWLTSF DEVELOPMENT PROFILE TECHNICAL REPORT SUMMARY EWOYAA LITHIUM PROJECT Page 220 of 368 FIGURE 15-8 IPTSF DEVELOPMENT PROFILE 15.6 ROADS 15.6.1 Road types A range of road types will be required to and within the Project site to meet a wide range of duties. The hierarchy of road types includes dedicated mine haul roads, main access roads, general access roads and minor use roads and tracks. Some of the roads will border service corridors, e.g., raw water supply pipelines, or tailing pump line access. Hence, road alignments also need to consider service routes in addition to transport requirements. The road widths and construction details have been selected to match the required duties. Road design parameters were determined by REC. The estimated total lengths of the main road types are: • Main access road - 1 km • Mine haul roads - 8 km total (by mining contractor) • Explosives Magazine access road - 1.8 km • Plant roads total - 0.5 km • Secondary roads/tracks - 3 km Roads will generally follow existing tracks or contours where no direct route can be achieved with the aim to minimise disruption to local villages and crop fields. Laterite gravel material to form the base course for minor roads and the sub-base for heavy use roads will be sourced from borrow pits. Further investigation planned during the next phase of the Project will identify gravel borrow areas. 15.6.2 Main Public Access Road The main access from Accra to the Project site is by 100 km of public primary sealed road. The condition of the road is generally fair, with some areas of the road requiring rehabilitation. Well defined drainage ditches are inconsistent. The road crosses numerous water courses by concrete flood ways or box culverts which may cut off traffic during heavy rainstorms in the wet season, but this risk is low. The road to the site will carry a wide range of vehicles, including fuel delivery, reagents and spares deliveries in semi- trailers, concentrate export tipper trucks, as well as light vehicles and buses for personnel movements.

TECHNICAL REPORT SUMMARY EWOYAA LITHIUM PROJECT Page 221 of 368 15.6.3 Mine haul roads Mine haul roads will be designed and constructed by the mining contractor to access the pits, waste dumps and ROM pad, as well as the mining services facilities. A haul road to the tailings storage facility (IWLTSF) for transporting mine waste for embankment construction will be installed in the future. 15.6.4 General Access Roads The general access roads are relatively short in length and provide access from the public road to the plant facilities, mine contractor facilities, etc. These roads will be between 4 m and 7 m wide depending upon traffic type and density. 15.6.5 Plant Roads Plant site roads are internal roads providing access between the administration area and plant site facilities. These roads will be 4 m to 7 m wide depending upon traffic type and hierarchy. The roads will be constructed flush with the bulk earthworks pad to ensure that storm water sheet flow is achieved across the site, avoiding the need for deep surface drains and culvert crossings within this area. 15.6.6 Access Tracks A number of new tracks will be constructed to access infrastructure. The access tracks will be cleared and graded natural earth tracks that will generally follow the associated pipeline routes. 15.7 PLANT SITE DEVELOPMENT 15.7.1 Plant Earthworks The proposed plant site and ROM pad area is located approximately 1.0 km west of the most southern pit with the southern edge of the plant site approximately 1.0 km from the existing main road. The plant is located in a valley with a natural slope towards the southwestern edge. The plant facilities will be established on a large earthworks pad and, where possible, will tie into existing natural surface levels. The cross slope of the pad will follow the natural contours draining towards the south at an approximate 2% grade. A cut / fill balance design approach will be adopted for the site, to minimise any surplus materials. Any surplus cut material can be utilised around the site for formation of the access road from the national freeway or hauled to the TSF for embankment construction. The ROM pad will be located approximately 200 m to the northwest of the plant site. This will require a sizeable quantity of fill material to establish the pad and will be undertaken by the mining contractor using mine waste. 15.7.2 Ground Conditions Geotechnical Investigations will be carried out in the next design phase to determine ground conditions and material properties for various components of the proposed infrastructure. Preliminary site investigations carried out by Geocrest indicate near surface soils are anticipated to comprise lateritic gravel and residual clay. The Geocrest site investigation generally intersected organic material to 0.2 m and variations outside this depth range may be present over the site. The organic material is not suitable for use as structural filling. It is only suitable for rehabilitation purposes. Based on these estimated ground conditions, it is considered likely that the plant site structures can be founded on raft and spread footings and the use of piling will not be required. Furthermore, there are no excessive loading conditions expected from the plant equipment components, with the primary crusher being the largest facility in the design, and no major process equipment (i.e. grinding mills or CIL tanks as would be typical in a gold operation). TECHNICAL REPORT SUMMARY EWOYAA LITHIUM PROJECT Page 222 of 368 15.8 POWER 15.8.1 Electrical Power Supply The installed load for the project will be 8.7 MW with average continuous demand of 5.67 MW. A power supply study was conducted for the Project by ECG Engineering. Given the low power requirements for the mine and the relatively short life of mine, a 161 kV power supply from the grid is uneconomical. The best grid option available would be to utilise a 34.5 kV supply from the Electrical Several power supply options have been evaluated by ECG. These are: • Grid power supply to the mine site. • An onsite self-generating power station. • An onsite power station provided by an Independent Power Producer. 15.8.2 Electrical Distribution The preferred option for providing power to the ELP is to construct a 34.5 kV single circuit transmission line from the Ewoyaa plant site to Saltpond Substation where there is a 161/34.5 kV substation. The transmission line length would be approximately 3 km. The electrical system for the Project is based on 34.5 kV distribution and 415 V working voltage. 15.8.3 Powerline Relocation One 161 kV and one 330 kV transmission lines pass through the mining area and will need to be diverted around the planned mining areas. Figure 15-9 shows the proposed relocation route of the two transmission lines. The revised route will be approximately 15 km in length, requiring 30 km of new transmission lines. TECHNICAL REPORT SUMMARY EWOYAA LITHIUM PROJECT Page 223 of 368 FIGURE 15-9 POWERLINE RELOCATION ROUTE 15.8.4 Electrical Buildings The Main HV Switchboard and one LV 415 V MCC will be installed inside the switchroom building at the ground level proximate to the plant. Plant electrical buildings will be prefabricated transportable containerised switchroom buildings. These electrical buildings will be installed with air-conditioners and sealed to prevent ingress of dust. 15.8.5 Earth Fault Protection Earth leakage protection will be applied to circuits with GPOs (General Purpose Outlets) and for lighting circuits. 15.8.6 Fire Protection The switchrooms and the plant control room will be provided with fire detection systems. Signals from the fire detection system will be wired to the respective fire indication panel (FIP) in the switchrooms and all signals will be monitored by a master fire detection panel (MFIP) in the plant control room. Each FIP will also be wired to a local siren with beacon to warn staff of the fire detection. The same fire and smoke activation alarm signals detected by the fire detection system will be monitored in the plant control room. 15.8.7 Cable Ladders Cable ladders will generally be laid horizontally, with vertical ladders used in areas where spillage may occur. Hot dip galvanised / epoxy painted type cable ladder will be used. Cables of different voltage groups will be installed on separate ladders. If they need to be installed on the same ladder, then complete segregation of ladders will be provided. Ladder routes will follow the structural pipe racks. TECHNICAL REPORT SUMMARY EWOYAA LITHIUM PROJECT Page 224 of 368 15.8.8 Cables Direct buried cables will be provided with armouring. Cables up to 16 mm2 will be PVC insulated and bigger cables will be XLPE insulated. Variable speed drive cables will be multiple core 3 x phase and 3 x earth cables symmetrically laid out within an overall shielded cable. Cables within the plant area will be installed above ground, on cable ladders and follow the mechanical pipe racks wherever possible. 15.9 COMMUNICATIONS SYSTEMS INFRASTRUCTURE The Communication System Infrastructure will establish critical and typical services to the mine site. The key points addressed in the estimate allowance for same include: • Satellite communications infrastructure and services; • Communications infrastructure; • Network cabling infrastructure; • Data communications (LAN / WAN); • Communications tower; • Telephone systems; and • Two-way radio systems. Wireless access point devices conforming to relevant specifications will be utilised to provide wireless point-to-many network connectivity within selected buildings, e.g. administration, for data and voice services. The 3G/4G network in the region is reasonably reliable and mobile phone usage will be utilised where practicable. For long term system reliability, as well as continuing service availability, uninterruptible power supplies (UPS) will be provided for the majority of the communications and network equipment. A digital trunked voice radio system will be installed at the mine radio communications tower providing 2-way voice radio communications for site operations and will be designed with consideration for permanent operations, mining and maintenance requirements. The system will comprise hand-held radios, heavy and light vehicle radios, consoles and base stations. A communications tower will be installed adjacent to the plant. The tower will transmit and receive the UHF voice mobile radio around most of the processing and mining areas. An access control system comprising turnstile gates and card access/control systems are proposed for employee and contractor access and egress. 15.10 PLANT AREA BUILDINGS AND FACILITIES 15.10.1 General The project will develop several buildings and facilities to support the operation, including: • Administration building housing management and administrative personnel; • Services building to house medical, training and other support facilities; • workshop and warehouse; • reagent storage sheds; • worker changeroom, ablutions building; and • site access building and access turnstile gate.

TECHNICAL REPORT SUMMARY EWOYAA LITHIUM PROJECT Page 225 of 368 FIGURE 15-10 MINING SERVICES, ADMINISTRATION, WORKSHOP AND WAREHOUSE FACILITIES 15.10.2 Mine Services Area Facilities The mine services facilities will be provided entirely by the mining contractor under their contracted works; however, power, water and sewage systems will be supplied to these facilities from site-based services. 15.10.3 Administrative and Support Facilities The administrative and support facilities include the administration office, clinic and security buildings and staff amenities. The buildings will all be constructed as concrete slab on ground, walls will be constructed with block work with metal deck roofing on steel trusses. The main buildings include the following: • Plant and administration building, including reception; • Support services building, including clinic and security; • Mining office for the Owner’s mine management staff; • Plant chop house, including dining hall for on-site meals; and • Plant ablutions and change house. 15.10.4 Process Plant Support Facilities The process plant support facilities will generally be industrial type structures. Most will be constructed of a concrete slab on ground with structural steel frame and metal cladding, and include: • Control Room; • Compressor house; • Reagents storage shed; • Laboratory; and • Workshop and Warehouse. TECHNICAL REPORT SUMMARY EWOYAA LITHIUM PROJECT Page 226 of 368 15.11 OTHER SUPPORT FACILITIES 15.11.1 Sewage Collection and Treatment Effluent from all water fixtures in the plant and administration areas will drain to a gravity sewerage system. This system will be comprised of a graded PVC pipe system connecting to all sources within the plant. The gravity sewerage system for each area will drain to a sewer pump station from where it will discharge via a pressure main to the sewage treatment plant located at the eastern perimeter of the plant site. The pump stations will include duty and standby pump and some overflow storage capacity to provide short term protection against power failures. A packaged sewage treatment plant system will be installed to treat the sewage. The plant will be a proprietary supplied unit specified to comply with performance-based criteria. The criteria will be drawn from the Project discharge requirements. 15.11.2 Water Services Raw water for the Project will be pumped to the plant site from the Water Storage Dam and will discharge into the process water pond or raw water tank as required. The process water pond in the process plant will have sufficient capacity to minimise the impact of short-term supply interruptions. Duty / stand-by pumps will be provided for water distribution to the plant. Fire water for the process plant will be drawn from the raw water tank. Suctions for other water services fed from the process water pond will be at an elevated level to ensure a fire water reserve always remains. The fire water pumping system will contain an electric jockey pump to maintain fire ring main pressure, an electric fire water delivery pump to supply fire water at the required pressure and flowrate and a diesel driven fire water pump that will automatically start if power is not available for the electric fire water pump or that the electric pump fails to maintain pressure in the fire water system. Fire hydrants and hose reels will be placed throughout the process plant, fuel storage and plant offices at intervals that ensure complete coverage in areas where flammable materials are present. Raw water will be supplied directly from bores to the plant potable water treatment plant. The water treatment facility will include sand filtration, micro filtration, ultra-violet sterilisation and chlorination. Potable water will be stored in the plant potable water tank and will be reticulated to the plant building, site ablutions, safety showers and other potable water outlets. Additional ultra-violet sterilisation units will be installed on outgoing potable water distribution headers. All tanks, pumps and treatment facilities will be located to the northern edge of the process water pond area, with the exception of the sewage treatment plant which is located at the eastern perimeter. 15.12 WORKFORCE ACCOMMODATION Prior to establishment of a dedicated accommodation facility for staff, accommodation will be sourced in nearby towns as is the current practice of the Company. Accommodation for most of the workforce is proposed utilising the available accommodation in the region. Accommodation for senior management, visitors and dignitaries will be provided at a nearby resort facility, which is currently under care and maintenance and will require minor upgrade works and maintenance to be operational. A contract to operate the resort will be let to a suitable provider, inclusive of resort management, cleaning, maintenance and provision of all meals and accommodation requirements. TECHNICAL REPORT SUMMARY EWOYAA LITHIUM PROJECT Page 227 of 368 Construction staff will generally be accommodated within nearby towns and their accommodation will be the general responsibility of the local construction contractors. The workforce is estimated to peak at 800 personnel during the construction of the Project. 15.13 FUEL STORAGE Fuel storage and distribution will be provided and controlled by the mining contractor as the main user of fuels and lubricants at the site. Regular fuel supply into Ghana is provided by numerous international companies (e.g. Vivo, Total and Puma), however the Minerals Commission has ruled that any fuel supplier to the mining industry must be a wholly owned Ghanaian entity with only Ghanaian Directors. Local Ghanaian companies now supplying the mining industry successfully and current mining sector suppliers include: • ZEN Petroleum Ltd: market leader (in mining), has in-house bulk distribution capacity and a Takoradi depot; • GASO Petroleum with a depot in Takoradi; and • GIOL (Ghana Oil - state owned oil marketing company): has a JV depot in Takoradi but at the time of writing was not operational. The existing fuel storage facility at the Company’s exploration facility will service the construction early works. 15.14 PORT INFRASTRUCTURE AND TRANSPORT LOGISTICS 15.14.1 Ports Overview Ghana has two bulk commodity import and export seaports, the Port of Tema and the Takoradi Port, both of which are currently managed by the Ghana Ports and Harbors Authority, a state-owned port authority (GPHA). 85% of Ghana’s trade enters through the ports with shipping routes and vessel calls to and from all continents through both direct and transhipment services. Both ports are almost equidistant from the proposed Ewoyaa project site. Product would be loaded onto trucks and transported directly to either Tema or Takoradi Ports. The Port of Tema is the largest port in Ghana and situated 30 km east of Accra. It is a deep-water port that handles the majority of Ghana's containerised cargo, general cargo, and bulk cargo. In 2021, the Takoradi Port handled 25% of Ghana’s seaborne traffic, 61% of Ghana’s seaborne exports and 18% of Ghana’s seaborne imports. Major commodities handled through the Port are manganese, bauxite, clinker, wheat, bulk and bagged cocoa, quicklime, containerised cargo, equipment for the mining and oil/gas industry. Imports and exports through Takoradi Port have tripled since 2000. 15.14.2 Port Logistics Assessment Freighting (trucking) product from Ewoyaa Project to Tema Port will be impacted by significant congested traffic, resulting in significant delays, as all routes from the mine to the Tema Port require direct access through Accra. The average daytime speed for the final 30 km haulage will be ~10 km/h. As such, the port of Takoradi is the preferred export port for the Ewoyaa products. Unlike Tema, Takoradi Port has suitable land for both on-shore and in-land stockpiling and has berth and ship loading capacity. It currently handles bulk commodities, including bauxite and manganese. Access to the Port through Takoradi will be impacted by traffic congestion, however, the delays are not of the same scale as Accra, and there is a ring-road, reducing the congestion zone to less than 10 km. As such, Takoradi Port has been selected as the preferred export port. The product will either be stockpiled on-port, with a dedicated ship loading conveyor, or stockpiled off-port at an inland location and campaign trucked to a smaller port stockpile, for ship loading. TECHNICAL REPORT SUMMARY EWOYAA LITHIUM PROJECT Page 228 of 368 15.14.3 Product Export & Port Logistics Trucking to Port The mode of transport proposed from the Ewoyaa mine to the Takoradi Port Stockpile will be via a fleet of trucks. The distance to the Takoradi Port is approximately 110 km. There are three routes available to access the port, from the east of Takoradi. The options assessed during FS for road transportation included: • 24-hour vs. daylight-only road transportation. • Insourcing vs. Outsourcing of trucks and recovery vehicles. • Purchase vs. Lease of transport equipment. • Maintenance of trucks and recovery vehicles. • Truck capacity for transportation – 35T and 70T payload (assuming a 25T tare truck weight/trailer (see example picture below). Expressions of Interest (EOI) were sought during the FS phase from five (5) market participants for product road transport services. The EOI was structured to ascertain the most suitable (and then possible alternate scenarios) supply chain solutions for moving mining finished product – with consideration of the following: • Truck configuration (axle loads, trailers, covered loads and containerisation) and indicative fleet numbers. • On-port or inland-port handling options. • Equipment required at a stockpile location e.g. Wheel loaders. • Maintenance strategy and location. • Experience, costs, insurances and age of equipment. • Safety performance. The EOI process identified suitably experienced and commercially competitive alternatives for transport of the products from the mine to the port. Ship Loading All lithium concentrates and secondary fines products will be transported from the plant site to Takoradi port for short term storage at a dedicated warehousing facility. The ELP is approximately 110 km from Tema port accessible on a fully sealed road. It is of importance not to contaminate the product with other bulk minerals currently being handled by Tema port, and procedural and QA/QC systems must be in place to control the products. A Port EOI was prepared and released to the market in January/February 2023 to further develop market options and understand more refined costs in relation to Port Operations (including Port stockpile management). Two potential port operators were approached. The GPHA is able to offer port operations services (port stockpile leasing, conveyor operations and stevedoring). The port configuration and indicative stockpiling locations is shown in Figure 15-11. Four port access options were assessed through DPS, including road haulage from the mine and: • Stockpiling at the Port of Takoradi, front-end loading into an existing hopper and conveying directly to the ship’s hull. • Stockpiling at the Port of Takoradi, front-end loading into a new dedicated hopper and conveying directly to the ship’s hull. • Stockpiling at an inland port location, and shuttling the product to the port, when the ship is in berth, for loading. The advantage of this option would be to avoid the high congestion time in Takoradi. An indicative “brownfields” inland port location and shuffle-route is shown in Figure 15-12 below. • Loading into containers at the mine, transporting containers to the port, storing in the containers at the port and loading onto the ship via a retainer.

TECHNICAL REPORT SUMMARY EWOYAA LITHIUM PROJECT Page 229 of 368 Logistics Costs The costs developed for DPS in US$/t, to be further optimised in early project execution are detailed in Table 15-6. The preferred option for FS was to truck concentrate via 50-T pay load rear-dump trucks to the Port of Takoradi, stockpiled at the port and loaded onto a ship, via a dedicated conveyor. TABLE 15-6 PRODUCT LOGISTICS COSTS Product Transport Costs SC6 Spodumene Moisture Content 5% Stockpiling on mine site $0.96 Loading & trucking to Brownfields stockpile (off-port) $12.05 Storage at off-port stockpile location $0.69 Re-loading and shuttle to Ship $4.53 Sampling at Port $0.22 Loading onto Ship $6.92 Port charges $3.02 TOTAL (excluding moisture content) $28.39 TOTAL (including moisture content) $29.81 TECHNICAL REPORT SUMMARY EWOYAA LITHIUM PROJECT Page 230 of 368 FIGURE 15-11 TAKORADI PORT CONFIGURATION AND INDICATIVE STOCKPILING OPTIONS TECHNICAL REPORT SUMMARY EWOYAA LITHIUM PROJECT Page 231 of 368 FIGURE 15-12 INDICATIVE INLAND PORT LOCATION AND PORT ACCESS ROUTE TECHNICAL REPORT SUMMARY EWOYAA LITHIUM PROJECT Page 232 of 368 16.0 MARKET STUDIES 16.1 MARKETING 16.1.1 Lithium Demand and Supply Outlook Spodumene concentrate demand is underpinned by associated lithium demand for the manufacture of lithium-ion batteries that are expected to play a critical role in global automotive fleet electrification and renewable-generated energy storage that are required to decarbonise energy production and achieve global net zero aims by 2050. Passenger electric vehicle (PEV) demand is expected to grow substantively in the years ahead (Figure 16-1). FIGURE 16-1 PEV SALES FORECASTS (S&P, JUNE 2023) Currently, lithium refining and battery manufacture are based heavily in China, however there is growing understanding of the need to mitigate risk with reliance on these exiting supply chains via policies and direct investment in upstream supply of critical minerals for battery manufacture. Government policies and legislation in both the US and EU incentivise both demand and supply side response for the development of new projects and underpin lithium product pricing expectations.

TECHNICAL REPORT SUMMARY EWOYAA LITHIUM PROJECT Page 233 of 368 Further, battery manufacturers, automotive OEMs and other end users increasingly understand that direct investment in upstream supply chains is critical to securing sustainable supply of low carbon intensity materials to meet the rising demand. Lithium supply is therefore rising in response to growing demand. Current commissioning of several greenfield lithium projects as well as several mines expected to come online over the next two years will help balance the market and moderate prices, however in the longer-term additional supply will be required. The market is expected to remain in deficit after 2025. Several supply side risks add to the challenge to meet rising demand and reduce deficits. Project development and lithium production delivery timelines are increasingly challenged by project cost pressures, regulatory considerations and permitting timelines and growing ESG requirements. Several countries have also prohibited the sale of unprocessed lithium ore to capture more value domestically, which may impact forecast timelines for additional supply to enter the market. Additionally, many governments are demanding increased value from their critical minerals, via free carry requirements and proposed changes to their royalty and taxation regimes. Nonetheless, the demand profiles and supply deficits and challenges provide the fundamentals to underpin product pricing to support project development. 16.2 MARKETING STRATEGY The Project will be funded under a co-development agreement with Piedmont Lithium Inc (“PLL"), where Piedmont has the right to earn up to 50% at the project level and 50% of the total spodumene concentrate (SC6) offtake at market rates by funding US$17M towards studies and exploration and US$70M towards the development capex. The Company will sell the remaining 50% of total spodumene concentrate and other secondary products via offtake agreements to be investigated and negotiated after DTM and granting of Mining license. ALL has already had preliminary engagement with several offtakers and interested parties for the sale of this production component. 16.3 PRODUCT PRICING The project has considered pricing for all spodumene and secondary products for use in financial modelling as outlined in Section 19. Spodumene concentrate pricing is based on a consensus SC6 pricing forecast supplied by ALL. SC5.5 pricing is calculated with a 5% discount to the SC6.0 Li2O unit pricing and factored by a ratio of the product grades. E.g. SC5.5 price = (5.5/6)*SC6 Price*0.95. Secondary product pricing is calculated with a 45% discount to the SC6.0 Li2O pricing and factored by a ratio of the product grade. The pricing basis for the discount is from preliminary discussions between ALL and potential offtakers for the material listed in Table 16-1. TABLE 16-1 PROJECT PRODUCT PRICING FORECAST, USD, FOB GHANA 16.4 MATERIAL CONTRACTS Year 2025 2026 2027 2028 2029 2030 2031 2032 2033 2034 2035 3036 FS SC6.0 (median consensus), US$ 3,000 2,557 2,000 1,841 1,770 1,666 1,560 1,452 1,410 1,410 1,410 1,410 FS SC5.0 (calculated), US$ 2,613 2,227 1,742 1,603 1,541 1,451 1,359 1,264 1,228 1,228 1,228 1,228 Secondary Product (calculated), US$ 375 286 222 176 191 189 163 155 144 139 154 152 TECHNICAL REPORT SUMMARY EWOYAA LITHIUM PROJECT Page 234 of 368 Material contracts have not been negotiated for the PLL project. Contracts will be necessary for successful marketing of the spodumene concentrate and secondary products. Material contracts required will likely include: • Transportation – The business will contract with requisite truck transportation companies to transport the spodumene concentrate to the port of Takoradi for sale on a FOB Incoterms basis. • Sales – Sales contracts are a mix of spot and pre-negotiated long-term purchase arrangements. • Mining – As expressed in this TRS, contractual mining arrangements will be utilised. • Utilities – Contractual agreements pertaining to utilities, including electricity and fuel supply will be material to the operation. Water extraction permit will also be required for water intake requirements. • HV Powerline relocation and site power supply - design and construction including permitting. • Construction/Development – Prior to mine development, material contracts related to the construction of plant, infrastructure and earthwork will be required. TECHNICAL REPORT SUMMARY EWOYAA LITHIUM PROJECT Page 235 of 368 17.0 ENVIRONMENTAL STUDIES, SOCIAL AND PERMITTING 17.1 INTRODUCTION ALL is in the final stages of delineating its core area of interest ahead of applying for a mining lease through the Ghanaian Minerals Commission. ALL has appointed a team to manage the Project’s Environment, Social, Health, and Safety (ESHS) responsibilities and obligations. This section aims to provide a comprehensive overview of the environmental permitting requirements and applicable local and international legislation and guidelines that the Project will follow to ensure compliance with the requirements of relevant authorities, stakeholders and shareholders with regards to environmental protection, social responsibility, and sustainable development. To provide a holistic understanding of the Project's context, the existing environmental and social setting of the project region and area have been presented in this section, encompassing the physical and biological attributes of the environment, as well as the socio-economic aspects of the local communities and stakeholders who may be affected by or have an interest in or influence over the project. In addition, the data of the biophysical and socio-economic surveys which have been carried out in the project area to date is presented in this section. This baseline data contributes to the project's understanding of the pre-mining environment, supports the identification of potential impacts and risks, and informs the formulation and implementation of mitigation measures. Lastly, this section addresses the current and planned environmental and social management systems for implementation throughout the project lifecycle. These systems are designed to avoid, and where avoidance is not possible, minimise and manage potential environmental and social impacts and risks, ensuring responsible and sustainable mining practices. 17.2 ENVIRONMENTAL PERMITTING According to Ghanaian regulations, industrial mining is classified as a large-scale operation that is included in Schedule II of the Environmental Assessment Regulations (1999). As per this schedule, the project’s planned mining activity necessitates that an Environmental Impact Assessment (EIA) is conducted, also referred to as Environmental and Social Impact Assessment (ESIA), and the subsequent preparation of an Environmental Impact Statement (EIS). The issuance of an Environmental Permit by the Environmental Protection Agency (EPA) required to start construction of the mining operation is contingent upon the completion of the EIA and the submission for evaluation and approval of the EIS. ALL has an in-house team of environmental and social specialists dedicated to developing and implementing the Project’s Environment, Social, Health and Safety Management Systems (ESHS MS) that ensure that the company and project remain compliant with applicable international and national regulations and international good practices in mining (see Section 9.101 for current management system and documentation developed the Project). Additionally, ALL has engaged the services of a Ghanaian environmental and social consulting company, to collect baseline data on air quality, noise and water quality within the project footprint area for one year. Other baseline data that have been gathered for the project since June 2021 for the purpose of environmental permitting include data on biodiversity, ground vibration and seismic vulnerability, climate and hydrogeology. Baseline data are used to inform environmental monitoring that will continue throughout the exploration, development, and mining phases of the Project in addition to monitoring of social impacts and risks generated by the project. ALL conducted socio-economic surveys in the communities situated within the project area in both 2020 and 2021 to improve the company’s understanding of the project context. Additionally, there are plans to conduct further socio- economic surveys in these communities as part of the preparation of the EIA and Resettlement Action Plan (RAP). These surveys align with the data collection requirements for the EIA and the environmental permitting process mandated by the EPA and good international industry practice (GIIP). ALL will initiate the environmental permitting process with EPA once a Mining Lease covering the ELP concession has been approved in principle by the Minerals Commission. TECHNICAL REPORT SUMMARY EWOYAA LITHIUM PROJECT Page 236 of 368 17.3 LEGAL AND REGULATORY FRAMEWORK 17.3.1 Applicable Legislation Table 17-1 below sets out the relevant Ghanaian legislation pertaining to environmental and social risk and impact management, minerals and mining, land access, livelihoods and agriculture, health and safety, labour and business registration. TABLE 17-1 RELEVANT GHANAIAN LEGISLATION 0BTitle of Legislation 1B1Year 2BOverview of Remit Environment Environmental Protection Agency Act, 1994, Act 490 1994 Amends and consolidates the laws relating to environmental protection, pesticide control, and regulations for related purposes. This Act ensures compliance with the environmental impact assessment procedures in the planning and execution of development projects, including compliance in respect of existing projects. Environmental Assessment Regulations, 1999 (LI 1652) & Fees and Charges (Amendment) Instrument 2015 (LI 2228) 1999 Ensures that environmental considerations and alternatives are addressed as early as possible, with consideration of economic and social factors in policy, plan, or programme development. stipulates the fees and charges to be paid by the project proponent with respect to environmental permits and certificates. Land Use and Spatial Planning Regulations, 2019 (LI 2384) 2019 Establishes processes to regulate national, regional, district and local spatial planning, and generally to provide for spatial aspects of socio-economic development. It provides a framework for orderly land use planning, guiding the allocation and utilisation of land resources in a manner that balances economic activities, environmental considerations, and societal needs. Ghana Water and Sewerage Corporation Act, 1965 (Act 310) 1965 Regulates the establishment, operation, and control of sewerage systems. Water and Sewerage Regulations, 1979 (LI 1233) 1979 Sets forth regulatory provisions for the management and provision of water supply and sewerage services in the country. The regulation establishes standards for water quality, operation and maintenance of water and sewerage systems, tariff structures, and licensing requirements for water and sewerage service providers. The regulations are relevant for the project’s water supply installation permit and certificate of completion. Water Resources Commission Act, 1996 (Act 552) 1996 Establishes the Water Resource Commission and regulates and manages Ghana’s water resources. The Act obligates mining firms to seek approvals from the Commission for their operations to reduce the impact of their operations on both surface water and groundwater. Water Use Regulations, 2001 (LI 1692) 2001 Lists activities for which a water use permit is required and includes domestic, commercial, municipal, industrial (including mine) water use among others. Environmental Quality guidelines, 2000 2000 Lists environmental quality guidelines to assist in measuring air quality, noise, hazardous chemicals, soil, and groundwater. Environmental Sanitation Policy 2010 2010 Provides policy directions on nationally accepted sanitation actions to promote a clean national environment devoid of open defecation, generation of e-waste, improper disposal of waste, and indiscriminate littering of streets and the environment. Rivers Act, 1903 1903 Regulates the use of certain rivers, including a license to undertake certain activities like dredging and diverting waterways. It also establishes penalties and fees for undertaking prohibited actions underlined within the Act. Wild Animals Preservation Act 1961 1961 This Act aims to protect and conserve the country's wildlife through regulation and control of activities related to wild animals and their habitats. It prohibits

TECHNICAL REPORT SUMMARY EWOYAA LITHIUM PROJECT Page 237 of 368 0BTitle of Legislation 1B1Year 2BOverview of Remit unauthorised hunting, capturing, and trading of protected species while promoting sustainable use for scientific, educational, and economic purposes. Wildlife Conservation Regulations, 1971 (LI 685) 1971 Enacted to provide legal protection and management guidelines for the country's wildlife resources. The regulations aim to regulate activities related to wildlife hunting, trading, and conservation, as well as establish penalties for offenses against wildlife and conservation laws. Timber Resources Management Act, 1997 (Act 547) and Timber Resources Management Regulations, 1998 (LI 1649) 1998 Consolidates and amends the law relating to the use and management of timber resources and in particular for the proposed project, conflict on use of public land. The Act and Regulations are also relevant because the company will need to obtain a Tree Felling Permit and notify the Forestry Commission whenever construction activities require the felling of trees. Drilling License and Groundwater Development Regulations, 2006 (L.I. 1827) 2006 Requires that a drilling license should be granted for groundwater monitoring or abstraction during mineral operations. In an environmentally sustainable manner, it regulates the development of groundwater resources in Ghana. Forestry Commission Act, 1999 (Act 571) 1999 Establishes the Forestry Commission which oversees the protection, development, management and regulation of forests and wildlife resources of Ghana. Mining companies intending to operate within Forest Reserves are obligated by the Act to obtain approval from the Forestry Commission. This requirement aims to minimise the impact of their activities on the flora and fauna within the host community and the country as a whole. Hazardous and Electronic Waste Control and Management Act 2016, Act 917 2016 Regulates the management of harmful hazardous waste, and other waste products associated with electronic waste. The Act ensures that these waste elements are captured and processed safely to preserve critical ecological components such as the soil, groundwater, flora and fauna. Energy Commission Act, 1997, (Act 541) and Electricity Regulations (LI 1973) 1997 Establishes the Energy Commission as a regulatory body responsible for the regulation, development, and efficient use of energy resources in the country. The Act empowers the Energy Commission to oversee the planning, coordination, and promotion of energy efficiency, renewable energy, and other energy-related initiatives to ensure sustainable energy development in Ghana. The Act is relevant for the Siting Permit that the project will need to obtain for the new path for the transmission lines and the Construction Permit that will be required for the decommissioning and relocation of pylons. Socio-Economic Context National Museums Regulation, 1973 (EI 29) 1973 Provides a regulatory framework for the management, preservation, and protection of national museums and cultural heritage sites. The regulation outlines guidelines for the establishment, operation, and administration of museums, including provisions for artifact preservation, exhibition management, and visitor engagement. This act is relevant for the project’s chance find procedure. Persons with Disability Act, 2006 (Act 715) 2006 Covers key thematic provisions such as rights, accessibility, employment and education for persons with disability. Public Health Act, 2012 (Act No. 851 of 2012) 2012 Consolidates the law relating to public health to prevent disease, promote, safeguard, maintain and protect the health of humans and animals and to provide for related matters. The act provides guidance for incorporating specific health and safety components into the environmental management and monitoring programs of the proposed development. This includes addressing health and safety aspects both on the project site itself and within the neighbouring communities. Right to Information Act, 2019 (Act 989) 2019 Recognises the constitutional right of all citizens of Ghana to information about the mining sector. It also requires that the right of all persons be respected by providing the necessary information on the governance of mineral operations to stakeholders to foster a culture of transparency and accountability in related activities. TECHNICAL REPORT SUMMARY EWOYAA LITHIUM PROJECT Page 238 of 368 0BTitle of Legislation 1B1Year 2BOverview of Remit The National Development Planning (System) Act 480, 1994. of Stool Lands Act, 1994 (Act 481) 1994 Establishes the Office of the Administrator of Stool Lands that is tasked to establish and manage stool land revenues. It also asks for the consultation of traditional authorities on issues regarding the administration and development of stool lands. Local Government Act, 1993 (Act 462) [as amended by Local Governance Act, 2016 (Act 936)] 2016 Specifies local governance and matters of local development and planning in Ghana. Under this Act, it is required that all local or community-level development plans and activities align with the development plans of the Local Assemblies. Local Governance Act of 2016, Act 936, and By-laws of Mfantseman Municipal Assembly 2016 The Local Governance Act of 2016, Act 936 establishes a legal framework for decentralised governance, defining the roles and powers of local government authorities while encouraging citizen participation and accountability. It enables local government bodies to address environmental and social concerns, promoting sustainability, community development, and social well-being through governance and planning functions. The Act and By-laws are relevant for the Business Operating Permit that the company will need to obtain from Ayawaso West Municipal Assembly and the Mfantseman Municipal Assembly. The National Development Planning (System) Act 480, 1994. 1994 Establishes a framework for national development planning and coordination. The Act outlines the structures and processes for formulating, implementing, monitoring, and evaluating development plans in order to promote sustainable economic, social, and environmental progress in the country. Ghana Highway Authority Act 1997 1997 Grants the Ghana Highway Authority the power to oversee the administration, control, development and maintenance of trunk roads in the country. The Act requires that any form of developmental activity to be conducted on a trunk road must seek prior approval/consent from the Ghana Highway Authority. Minerals and Mining Minerals and Mining Act, 2006 (Act 703) 2006 The Act (as amended in 2015 and 2019) is the principal legal framework regulating mining activities in Ghana. It stipulates, among other things, the ownership of minerals, mining rights, royalties, dispute resolution, licensing and compensation. The Act obligates payment of compensation for the use of land and destruction of crops to the landowner because of mining activities and stipulates the employment of local people by mining companies to a maximum extent. The 2015 and 2019 Amendment Acts present the offences and penalties regarding mining in Ghana. Minerals and Mining (General) Regulations, 2012 (L.I. 2173) 2012 The Regulations prescribe the general provisions concerning mineral rights and staffing. It also sets out the requirements and guidelines regarding reconnaissance, prospecting and mining operations. Minerals and Mining (Support Services) Regulations, 2012 (L.I. 2174) 2012 Regulates entities that provide auxiliary services to the mining industry. The regulations are relevant to the operation of Mine Laboratory and Certification of Mining Support Services. Minerals and Mining (Licensing) Regulations, 2012 (LI 2176) 2012 The Regulations prescribe the general provisions concerning mineral rights and staffing. It also sets out the requirements and guidelines regarding mining operations. Relates to awarding of Ministerial and Parliamentary Mining Lease. Minerals Commission Act, 1993 (Act 450) 1993 The Act establishes the Minerals Commission which is responsible for regulating and managing the utilisation of mineral resources and coordinating mineral sector policies. The Minerals Commission monitors the operations of all mineral bodies or establishments. Minerals Income Investment Fund Act, 2018 (Act 978) 2018 The Act establishes a Fund to manage the equity interests and receive mineral royalties and other related income for Ghana. The Fund also manages and invests the mining royalties of Ghana for the benefit of its people. TECHNICAL REPORT SUMMARY EWOYAA LITHIUM PROJECT Page 239 of 368 0BTitle of Legislation 1B1Year 2BOverview of Remit Minerals Development Fund Act, 2016 Act 912 2016 Establishes the Minerals Development Fund to provide financial resources for the benefit of mining communities, traditional and local and local government authority within mining areas, and institutions responsible for the development of mining. It also establishes the Mining Community Development Scheme for each mining community tasked to facilitate the socio-economic development of communities in which mining activities are undertaken and that are affected by mining operations. The act stipulates the source of funds for the Fund, management and disbursement of the funds. Minerals and Mining (Explosives) Regulations, 2012 (L.I. 2177) 2012 Stipulates the requirements and procedures for the acquisition, transport, storage, use and disposal of explosives in the mining sector. These Regulations are relevant for the Operating Licence to Store Explosives that the company will need. Ghana Geological Survey Authority Act, 2016 (Act 928) 2016 Establishes the Ghana Geological Survey Authority to promote effective dissemination of information on geological hazards to guarantee effective exploration and exploitation of mineral resources in Ghana. Mining firms, especially underground mining firms, are obligated to maintain geological balance and avoid disasters through earth tremors/quakes. Minerals and Mining (Ground Rent) Regulations, 2018 (L.I. 2357) 2018 Stipulates the ground rent payable by a mineral right holder to the Office of the Administrator of Stool Lands in respect of a cadastral unit of land and provides the schedule of payment per the type of mineral right held. Land Access Minerals and Mining (Compensation and Resettlement) Regulations, 2012 (L.I. 2175) 2012 Present the requirements for compensation for any land affected by minerals operations in Ghana. While Regulation 1 demands fair and adequate compensation in mineral operations, Regulation 3 necessitates that compensation needs should consider the impact on crops and deprivation of use of land. The amount of compensation, subject to approval by the Land Valuation Board, is determined by agreement between the parties concerned. The regulations also provide for the physical resettlement of affected persons who lose their residential and/or commercial structures and support to restore their affected livelihoods. Land Act, 2020 (Act 1036) This Act is relevant for the Title Certificate and Clearance Form that the company will need to obtain. Land Title Registration Regulations, 1986 (LI 1341). 1986 Outlines the procedures and requirements for the registration of land titles. The regulations govern the process of recording land ownership, transfers, and other transactions to ensure clarity, security, and legal protection of land rights. National Museum Act 1969 (NLCD 387) as amended, 1969 The Act is relevant for the Permit to Disturb and Relocate Cultural Sites that the company will need to obtain. Livelihoods / Agriculture Economic Plants Protection Act, 1979 1979 Provides for the prohibition of the destruction of specified plants of eco-nomic value and for related matters. Fisheries Act, 2002 2002 Consolidates the laws on fisheries, to provide for the regulation and management of fisheries, for the development of the fishing industry and the sustainable exploitation of fishery resources and for related matters. This Act is relevant for the potential impacts on the aquatic population of the water reservoir. Pesticides Control and Management Act 1996, Act 528 1996 Sets out controls for the import, marketing, storage, use etc. of pesticides. Health and Safety TECHNICAL REPORT SUMMARY EWOYAA LITHIUM PROJECT Page 240 of 368 0BTitle of Legislation 1B1Year 2BOverview of Remit Minerals and Mining (Health, Safety and Technical) Regulations, 2012 (L.I. 2182) 2012 Regulates the health, safety and technical operation parameters in the mining sector. It helps in creating a safe working environment for workers by providing the necessary procedures, personal protective equipment and safety facilities to prevent accidents and injuries. Dam Safety Regulations (LI 2236 of 2016) 2016 Establishes a set of guidelines and standards for ensuring the safety and proper management of dams in the country. The regulations cover aspects such as dam construction, inspection, maintenance, emergency preparedness, and risk assessment, with the aim of safeguarding public safety, protecting the environment, and promoting effective dam operation and maintenance practices. The company will need to obtain a dam construction approval prior to its construction, as well as a dam safety licence. Atomic Energy Commission Act 1963 (Act 204) 1963 Provides the legal framework for the establishment and functions of the Atomic Energy Commission (AEC). The Act empowers the AEC to regulate and oversee the peaceful use of atomic energy, including the licensing and inspection of nuclear facilities, radiation safety, and the promotion of research and development in the field of atomic energy. Radiation Protection Instrument, 1993 (LI 1559) 1993 Establishes rules and regulations for various aspects of radiation protection. It covers matters such as board membership, functions, and meetings, control and use of radiation sources, licensing procedures, duties of licensees, and penalties for offenses related to radiation safety. This instrument is relevant for the Licence to own, import, and use Radioactive Source or Equipment that the company will need to obtain. Nuclear Regulatory Authority Act, 2015 (Act 895) 2015 Establishes the Nuclear Regulatory Authority (NRA) as an independent regulatory body for the peaceful and safe use of nuclear energy. The Act empowers the NRA to regulate and oversee nuclear activities, including the licensing, inspection, and enforcement of safety and security measures in nuclear facilities, radiation protection, and the transport of radioactive materials. Ghana National Fire Service Act,1997 1997 Re-establishes the Ghana National Fire Service and makes provisions for the management of undesired fires and related matters to maintain and improve on public safety from fires and related emergencies. Fire Precaution (Premises) Regulations, 2003 LI 1724) 2003 Makes it obligatory for premises, such as mining plant sites, to have fire permit and certificates to meet fire safety standards. National Building Regulations 1996 (LI 1630) 1996 Ensures that building work satisfies the minimum constructional standards and energy conservation requirements. It also ensures the health and safety of people that occupy or operate such buildings. Ghana Building Code 2018 (GS1207:2018) 2018 Provides a comprehensive set of regulations and standards for the construction industry in Ghana, covering aspects such as building design, materials, safety, and accessibility. It aims to ensure the construction of safe, resilient, and sustainable buildings while promoting uniformity, quality, and compliance with established codes and practices. The project will need to obtain a building permit in line with this code. Mining Health Areas Act, 1925 1925 Makes provision relating to the health and housing of mine labourers and the general sanitation of mining areas. Labour Regulations, 2007 (L.I. 1833) 2007 Obliges the employer to ensure health, safety and welfare of persons at workplace by minimising the causes of hazards inherent in the working environment. Labour Labour Act 2003 (Act No. 651) 2003 Stipulates the general conditions of employment, protection of employment (rights and duties of employers and workers, contract of employment, grounds for termination, etc.), employment of persons with disabilities, women and young persons, unfair labour practices, and special provisions relating to temporary workers and casual workers.

TECHNICAL REPORT SUMMARY EWOYAA LITHIUM PROJECT Page 241 of 368 0BTitle of Legislation 1B1Year 2BOverview of Remit It also provides guidelines on the creation, registration, protection against discrimination, and federation of trade unions and employers' organisation. Minerals and Mining (Local Content and Local Participation) Regulations, 2020 (L.I. 2431) 2020 Makes provision for entities holding reconnaissance, prospecting, and mining lease to recruit and train locals/Ghanaians in their operations. It further stipulates provisions on the number of expatriate staff relative to the total number of senior staff. The act elaborates on gender inclusive recruitment and stipulates penalties for non- compliance with the provisions. The Children’s Act, 1998 (as amended, 2016) 1998 Regulates among many things, child labour, exploitation, and apprenticeship. Business Registration Companies Act 2019, (Act 992) 2019 This Act is relevant for the Business Registration Certificate (Certificate of Incorporation, Form 3, Company Regulation.) that the company will need to obtain. 17.3.2 International Guidelines International guidelines and reference frameworks for managing environmental and social impacts, risks, health and safety, and labour pertaining to mining projects serve a crucial role in promoting responsible and sustainable practices within the mining industry on a global scale. These guidelines provide a set of established principles, standards, and best practices that help mining companies and stakeholders navigate the complex challenges associated with mining operations. By adhering to these international standards, mining operations can effectively mitigate environmental and social impacts and manage associated risks, enhance the health and safety of workers and communities, and ensure fair and equitable labour practices. The advantage of adopting such guidelines lies not only in fostering a more transparent, accountable, and socially responsible approach to mining, leading to improved outcomes for both the mining industry and the communities affected by these projects. They also allow to proactively manage the expectations of future clients and their investors. Besides the relevant Ghanaian legislation, the following standards form the reference framework for GIIP for the Project: • Equator Principles IV (2020); • International Finance Corporation (IFC) Performance Standards on Environmental and Social Sustainability (IFC PS) (2012); • World Bank Environmental, Health and Safety General Guidelines (WB EHS Guidelines) (2007); • World Bank Group EHS Guidelines for Mining (2007); • International Council on Mining & Metals (ICMM), United Nations Environment Programme (UNEP) and Principles for Responsible Investment (PRI), Global Industry Standard on Tailings Management (2020), as adopted by the Ghana EPA; and • International Labour Organisation (ILO) Conventions as financiers typically require investees to apply the “fundamental” Conventions of the ILO. Other key standards, frameworks, guidelines, principles, and conventions that the project may align with or be subject to include. • ISO Standards and Guidance; • Global Reporting Initiative (GRI) Standards; • OECD Guidelines for Multinational Enterprises; • Sustainable Development Goals (SDGs); • UN Guiding Principles on Business and Human Rights (UNGPs); • UN-Supported Principles for Responsible Investment (PRI); and TECHNICAL REPORT SUMMARY EWOYAA LITHIUM PROJECT Page 242 of 368 • Voluntary Principles on Security and Human Rights (VPSHR). 17.3.3 Equator Principles The Equator Principles (EP IV) are applicable to a project throughout its exploration, development, production, and closure phases. EP IV are a financial industry benchmark for taking social responsibilities and environmental management into account. The ten basic principles are provided in Table 17-2. The project will align its activities to ensure that these requirements are respected, and to report in such a way as to assist investors, potential buyers and their investors in their own monitoring and reporting obligations in accordance with the EP IV. TABLE 17-2 THE EQUATOR PRINCIPLES IV (2020) Principle Brief Description Principle 1 – Review and categorisation The Equator Principles Financial Institution (EPFI) must categorise the project based on the magnitude of its potential risks and impacts. Such screening is based on the environmental and social criteria of the IFC PS. The Ewoyaa project is classified as a category A project. Principle 2 – Environmental and social assessment The EPFI must require the client (i.e., project proponent in the case of the project) to assess the environmental and social impacts and to propose relevant management and mitigation measures for reducing the impacts to an acceptable level. Principle 3 – Applicable environmental and social standards Environmental and social performance must be evaluated according to the IFC Performance Standards and the WB EHS Guidelines, as well as the host country laws. Principle 4 – Environmental and Social Management System and Equator Principles Action Plan The client must develop and/or maintain an Environmental and Social Management System and an Environmental and Social Management Plan for all Category A and applicable Category B projects. Where gaps are identified, the client and EPFI agree an action plan outlining gaps and commitments to meet applicable standards. Principle 5 – Stakeholder engagement For all Category A and B projects, the client is required to demonstrate effective stakeholder engagement with affected communities, workers and other stakeholders. The client must conduct an informed consultation and participation process beforehand, facilitate the communities’ informed participation, and make the assessment documents and action plan publicly available in a culturally appropriate manner. Principle 6 – Grievance mechanism As part of the Environmental and Social Management System, the client must establish a grievance mechanism and inform the affected communities about it. Principle 7 – Independent review An Independent Environmental and Social Consultant (IESC) must carry out a review of the assessment, action plan and stakeholder engagement process to assess Equator Principles compliance. Principle 8 – Covenants The client must covenant, in the financing documentation, to comply with the host country requirements, to implement the action plan, to provide periodic reports on the project’s social and environmental performance, and to decommission and dismantle the facilities where applicable. Principle 9 – Independent monitoring and reporting All Category A projects are required to have independent monitoring and reporting (i.e. by the IESC). Principle 10 – Reporting and transparency For all Category A projects, the client will: Ensure that, at minimum, a summary of the ESIA is accessible and available online and that it includes a summary of human rights and climate change risks and impacts when relevant. Report publicly, on an annual basis, GHG emission levels (combined Scope 1 and Scope 2 Emissions, and, if appropriate, the GHG efficiency ratio) during the TECHNICAL REPORT SUMMARY EWOYAA LITHIUM PROJECT Page 243 of 368 Principle Brief Description operational phase for Projects emitting over 100,000 tonnes of CO2 equivalent annually. The EPFI will encourage the client to share commercially non-sensitive Project- specific biodiversity data with the Global Biodiversity Information Facility (GBIF) and relevant national and global data repositories, using formats and conditions to enable such data to be accessed and re-used in future decisions and research applications. EPFIs must report annually on their Equator Principles implementation processes and experience. 17.3.4 INTERNATIONAL FINANCE CORPORATION GUIDELINES The following IFC PS, their guidance notes and guidelines are relevant to the Project in its exploration, development, production and closure phases: • PS1 on Assessment and Management of Environmental and Social Risks and Impacts, PS2 on Labour and Working Conditions, PS3 on Resource Efficiency and Pollution Prevention, PS4 on Community Health, Safety and Security, PS5 on Land Acquisition and Involuntary Resettlement, PS6 on Biodiversity Conservation and Sustainable Management of Living Natural Resources and PS8 on Cultural Heritage 1; • Stakeholder Engagement: A good practice handbook for companies doing business in emerging markets (IFC, 2007); • Addressing Grievances from Project-Affected Communities (IFC, 2009); and • Further details on the PS and guidelines are provided for reference in Table 17-3. TABLE 17-3 REQUIREMENTS OF IFC PS AND GUIDELINES PERFORMANCE STANDARD Brief Description PS1: Assessment and Management of Environmental and Social Risks and Impacts Identify and evaluate environmental and social risks and impacts of the project; Adopt a mitigation hierarchy to anticipate and avoid, or where avoidance is not possible, minimise, and where residual impacts remain, compensate/offset for risks and impacts to workers, Affected Communities, and the environment; Promote improved environmental and social performance of clients through the effective use of management systems; Ensure that grievances from Affected Communities and external communications from other stakeholders are responded to and managed appropriately; and Promote and provide means for adequate engagement with Affected Communities throughout the project cycle on issues that could potentially affect them and to ensure that relevant environmental and social information is disclosed and disseminated. PS2: Labour and Working Conditions Promote the fair treatment, non-discrimination, and equal opportunity of workers; Establish, maintain, and improve the worker-management relationship; Promote conformance with national employment and labour laws; Protect workers, including vulnerable categories of workers such as children, migrant workers, workers engaged by third parties, and workers in the client’s supply chain; Promote safe and healthy working conditions, and the health of workers; and Avoid the use of forced labour. PS3: Resource Efficiency and Pollution Reduction Avoid or minimise adverse impacts on human health and the environment by avoiding or minimising pollution from project activities; Promote more sustainable use of resources, including energy and water; and Reduce project related GHG emissions. PS4: Community Health, Safety and Security Anticipate and avoid adverse impacts on the health and safety of the Affected Community during the project life from both routine and non-routine circumstances; and TECHNICAL REPORT SUMMARY EWOYAA LITHIUM PROJECT Page 244 of 368 PERFORMANCE STANDARD Brief Description Ensure that the safeguarding of personnel and property is carried out in accordance with relevant human rights principles and in a manner that avoids or minimizes risks to the Affected Communities. PS5: Land Acquisition and Involuntary Resettlement Avoid, and when not possible, minimise, displacement by exploring alternative project designs; Avoid forced eviction; Anticipate and avoid, or where avoidance is not possible, minimise adverse social and economic impacts from land acquisition or restrictions on land use by (i) providing compensation for loss of assets at replacement cost and (ii) ensuring that resettlement activities are implemented with appropriate disclosure of information, consultation, and the informed participation of those affected; Improve, or restore, the livelihoods and standards of living of displaced persons; and Improve living conditions among physically displaced persons through the provision of adequate housing with security of tenure at resettlement sites. PS6: Biodiversity Conservation and Sustainable Management of Living Natural Resources Protect and conserve biodiversity; Maintain the benefits from ecosystem services; and Promote the sustainable management of living natural resources through the adoption of practices that integrates conservation needs and development priorities. PS8: Cultural Heritage Protect cultural heritage from the adverse impacts of project activities and support its preservation; Promote the equitable sharing of benefits from the use of cultural heritage. PS7 on Indigenous Peoples is not applicable to the project as there are no Indigenous Peoples (either classified as such previously or self-identifying as indigenous peoples) in the Project area. 17.3.5 World Bank Group Environmental, Health and Safety Guidelines The World Bank Group (WB) EHS Guidelines (hereafter WB EHS Guidelines) are relevant to the Project in its exploration, development, production and closure phases. WB EHS Guidelines are technical reference documents with general and industry-specific examples of GIIP, as defined in IFC PS3. The WB EHS Guidelines are used as a technical source of information during financial institution project appraisal activities, as well as by project proponents in applying GIIP in their activities. The following WB EHS Guidelines apply to the Project: • WB EHS Guidelines (General) (2007); and • WB EHS Guidelines (Mining) (2007). Project owners need to ensure that the requirements of the applicable WB EHS are integrated into project design and their management systems, and appropriately monitored throughout the Project lifecycle. 17.3.6 International Labour Organisation (ILO) Conventions International labour standards are legal instruments drawn up by the ILO's constituents (governments, employers and workers) which set out basic principles and rights at work. The standards are either Conventions (also called Protocols), which are legally binding international treaties that may be ratified by member states, or Recommendations, which serve as non-binding guidelines. The ILO Governing Body has identified eight “fundamental” Conventions. The Republic of Ghana is signatory to all eight conventions. The conventions are as follows: • Freedom of Association and Protection of the Right to Organise Convention, 1948 (No. 87); • Right to Organise and Collective Bargaining Convention, 1949 (No. 98);

TECHNICAL REPORT SUMMARY EWOYAA LITHIUM PROJECT Page 245 of 368 • Forced Labour Convention, 1930 (No. 29) (and its 2014 Protocol); • Abolition of Forced Labour Convention, 1957 (No. 105); • Minimum Age Convention, 1973 (No. 138); • Worst Forms of Child Labour Convention, 1999 (No. 182); • Equal Remuneration Convention, 1951 (No. 100); and • Discrimination (Employment and Occupation) Convention, 1958 (No. 111). Project proponents need to ensure that the requirements of the ILO Conventions are followed throughout the project lifecycle, integrated into their (labour) management systems, and appropriately monitored and reported to stakeholders. 17.4 PERMITTING PROCESS To begin construction activities a mining company needs to obtain or undertake the following in accordance with the Minerals and Mining Act, 2006 (Act 703), and L.I. 2182: 1. Mining Lease: The ELP is classified as a large-scale operation (above 25 acres) and requires mineral rights as per Section 9 of the Mineral and Mining Act 2006 (Act 703) for all mineral operations, including reconnaissance, prospecting, and mining. A Mining Lease, initially granted for 30 years, can be renewed for an additional 30 years by the Minerals Commission. The process to obtain a Mining Lease is presented in the figure below. The Mining Lease allows the holder to conduct mineral operations, establish infrastructure, dispose of mined material, and manage waste as approved in the holder's EIS, provided all other permits and approvals have been obtained. 2. An environmental permit from EPA and other permits as discussed below. 3. A Mine Operating Plan. 4. An Emergency Response Plan. 5. A Mining Operating Permit from the Inspectorate Division of the Minerals Commission: the holder needs to provide their Environmental Permit, Mining Lease, Mine Operating Plan, and Emergency Response Plan for the permit. 6. Post environmental bonds before commencing mining operations. The figure below presents an overview of the process for the acquisition of a Mining Lease. TECHNICAL REPORT SUMMARY EWOYAA LITHIUM PROJECT Page 246 of 368 FIGURE 17-1 MINING LEASE PROCESS (SOURCE: MINERALS COMMISSON) 1 The granting of a Mining Lease requires Parliamentary ratification. The procedure for Ratification of Mining Lease implies the following: 1. The holder of the Mining Lease submits appropriate copies of the Mining Lease agreement to the Minerals Commission (MinCom); 2. MinCom compiles a brief on each Mining Lease, attaches copies of the Mining Lease agreements, and prepares a draft cabinet memo to the Minister; 3. The Minister submits the request for ratification to the Cabinet for review; 4. After the Cabinet approval the Minister submits the request to Parliament; 5. The Mines and Energy Committee considers the request: the Ministry and MinCom appear before the Committee to provide clarifications; and 6. Finally, Parliament ratifies the agreements. 17.4.1 Environmental Permit The EPA is the authorised body responsible for granting environmental permits (EP) in the country. Mining operations in Ghana require that a full-scale EIA that meets environmental requirements be conducted and approved. The EP process flow chart provided by EPA summarises the EP acquisition process. TECHNICAL REPORT SUMMARY EWOYAA LITHIUM PROJECT Page 247 of 368 FIGURE 17-2 ENVIRONMENTAL PERMIT ACQUISITION PROCESS FLOW CHART (SOURCE: GHANA EPA) Screening An essential aspect of conducting an EIA is to determine the level of impact of the proposed project, development or initiative. The impacts of the project could change over time. Thus, during the screening step as well as the whole EIA process, impacts are considered over the lifetime of the project, from the construction phase through to operations and after closing. TECHNICAL REPORT SUMMARY EWOYAA LITHIUM PROJECT Page 248 of 368 The Proponent is required to submit application forms to EPA, after which EPA decides on screening and EIA based on the Environmental Assessment Regulations (1999). Schedule II of the regulation lists the activities that require a full EIA, of which mining is included. EPA will determine the need for further study and the level of details required. Proponent's screening documentation needs to include: • Details on the proposed activity (including a description of waste generation); • The proposed location (location, zoning, site description, land cover and topography); • Infrastructure and utilities; • Environmental impacts (air quality, biological resources, cultural resources, water quality and hydrology, noise, other impacts); • Health and safety impacts; • Management of impacts (air quality, biological resources, cultural resources, water quality and hydrology, noise, etc.); • Alternatives to the establishment of the activity; and • List of stakeholders consulted (including evidence). Upon submission, EPA should within 25 days request the proponent to conduct a detailed EIA study to understand fully the environmental, social, economic and cultural impacts of the proposed operations and how impacts would be mitigated. EPA may also request to conduct an inspection of the proposed site and issue a report (screening report) which is presented to a cross-sectoral technical committee (the EIA Technical Review Committee) for a decision on the application. Scoping Next, the proponent must produce a Scoping Report, which includes the Terms of Reference for the EIA (EIA ToR). The EPA reviews the Scoping Report with the assistance of the EIA Technical Review Committee. The EPA has 25 days to review and approve the Scoping Report and EIA ToR. EPA approval of the Scoping Report is required before proceeding with the EIA and the Scoping Report is made available to the public. During scoping, the proponent needs to publish a notice concerning the project in at least one national newspaper and a local newspaper for at least 21 days and consult affected parties. The public may express their view to the managing director of the proposed activity and the executive director of EPA. The Scoping Report needs to contain a description of any issues raised during the consultation process and how these will be addressed in the EIA. Furthermore, the proponent needs to give notice of the proposed undertaking to the relevant Ministries, government departments and organisations and the relevant Metropolitan, Municipal or District Assembly. The Regulations stipulate the contents of the EIA ToR as follows: • A description of the activity; • The need for the activity; • Alternatives (including a 'no-build' alternative, and site-alternatives); • Site selection; • The current environmental, social and economic situation; • Potential impacts; • The potential impact on health; • Mitigation measures; • Monitoring; • Contingency plans; • Public consultation; • Illustrative materials; • An environmental and social management plan;

TECHNICAL REPORT SUMMARY EWOYAA LITHIUM PROJECT Page 249 of 368 • Financial compensation for possible damage; and • Transboundary impacts. There are no methodological requirements, but the regulation does require that the assessment covers potential positive and negative impacts on environmental, social, economic and cultural aspects and in relation to the different phases of development of the activity and transboundary impacts. Impact Assessment, Mitigation and EIS The impact assessment includes a detailed evaluation of the environmental, social, economic and cultural impacts of the planned project and identified alternatives, compared to the baseline conditions. This includes qualitative descriptions such as measuring high, medium and low impacts, and quantitative descriptions, such as indicating the water withdrawn, noise produced, or land cleared. This is done for the planned project as well as the identified alternatives, allowing for comparisons. Once the detailed assessment is complete, measures to avoid or mitigation measures to reduce impacts are identified. Overall, mitigation measures are a response to the findings of impact assessment, and they need to cover all the areas identified. The key focus of mitigation actions is on: • Preventive measures that avoid the occurrence of impacts and thus avoid harm or even produce positive outcomes. • Measures that focus on limiting the severity and the duration of the impacts. • Compensation mechanisms for those impacts that are unavoidable and cannot be reduced further. Upon the completion of the impact assessment and identification of suitable mitigation measures, the project proponent is required to compile a Draft Environmental Impact Statement (EIS) for submission to EPA. The Draft EIS serves as a detailed report outlining the identified project impacts and the corresponding mitigation measures that will be implemented by the proponent to effectively manage these impacts. The Draft EIS must contain information on direct and indirect impacts of the undertaking on the environment at the pre-construction, construction, operation, decommissioning and post-decommissioning phases, including at a minimum: • Concentrations of pollutants in the environment; • Direct ecological changes; • Alteration in the ecological processes; • Consequences such as direct destruction of existing habitats; • Impact on surface and groundwater; • Noise and vibration levels; • Odour; • Traffic generation and potential increase of road accidents; • Changes in social, cultural and economic patterns; • Health impacts; and • Mine closure and reclamation planning. The Draft EIS must be clear and include a non-technical summary. The EPA, along with the cross-sectoral technical committee (Committee), reviews the Draft EIS within a maximum of 50 days. They provide a summary of strengths, weaknesses, further study needs, impact monitoring requirements, and potential terms and conditions. The EPA and Committee decide if a revision is necessary or if approval can be granted. Once accepted, the Draft EIS is finalised, and the EPA publishes a notice of the issued environmental permit within 3 months. The Environmental Permit should be issued within 15 days after the finalisation of the EIS. The review and licensing are the final check on the quality of the EIS submitted to obtain a project license. Once the EIS is submitted, designated authorities will usually go through it thoroughly, weighing the methods used, data, interpretations, measures, and conclusions to assess the impacts of the planned development. Their review will TECHNICAL REPORT SUMMARY EWOYAA LITHIUM PROJECT Page 250 of 368 determine whether the project adequately addresses major environmental, social, economic and cultural impacts and risks, and whether to grant a licence to the project proponent, or to request project changes. This means that a decent quality EIA might still lead to the planned development not being permitted to go ahead based on the identified impacts. Often, the review process leads to a requirement for additional information on potential impacts, mitigation measures or other aspects. The EPA publishes a notice in the Gazette and through mass media that the environmental permit has been issued. This is done within 3 months of the date of the issuance of the permit. After finalisation of the EIS report, the Environmental Permit should be issued within a maximum of 15 days. Public concerns are crucial during the screening and impact assessment stage of the EIA process. Interested and affected parties should be consulted at each stage. The public may make comments on the scoping report, make field visits, comment on the Draft EIS and, if a public hearing is deemed necessary, be involved in the public hearing. While collecting baseline data for the assessment, a public information program must be initiated by the proponent aiming to fully inform the local residents about the potential impacts of the undertaking. The draft EIS must be published for 21 days so that the public can express their concerns. During the review process, EPA can decide to hold a public hearing in the following cases: • The expected environmental impacts are considered extensive and far reaching; • There is great adverse public reaction to a proposal; and/or • There will be relocation/resettlement of communities, as is expected to be the case for the Ewoyaa project. The EPA will then appoint a panel of three to five persons to gather information on the public concerns and how these could be addressed. At least two-thirds of the panel members must be residents of the geographic area where the activity will be undertaken. The stakeholders to be involved are: • General public; • Relevant governmental agencies; • NGOs; • Metropolitan, Municipal and District Assemblies; and • Local communities. A 21-day public disclosure period is mandatory. If a public hearing takes place, the panel must provide written recommendations to the EPA within 15 days from the start of the hearing. The proponent's intention, scoping report, draft EIS, and EPA's decision on the environmental permit should be accessible to the public. 17.4.2 Other Approvals Other institutions are involved in the permitting process by providing additional approvals prior to proceeding with project construction, including but not limited to the following: • The Water Resource Commission ensures mineral operations do not impact water bodies or buffer zones. Where necessary, a Mining Lease holder must obtain water use permits for mineral operations, as well as dam safety licence, and dam construction approval. They will also be responsible for approving the project’s dam operation and maintenance plan, and dam emergency preparedness and response plan. • The Forest Commission ensures that mineral rights or mineral operations do not affect forest reserves. An application for mineral rights that impacts a forest reserve must be supported by a Forest Entry Permit granted by the Forestry Commission. • The Office of the Administrator of Stool Lands (OASL) collects ground rent on behalf of traditional chieftaincies or local land-owning authorities, known as "stools". TECHNICAL REPORT SUMMARY EWOYAA LITHIUM PROJECT Page 251 of 368 • The Land Commission is responsible for the stamping of mineral right agreements and Land Valuation for compensation. • Local Government through District Assemblies is involved in the publication of mineral right applications and gazetting. They will also issue business operating permits, building and development permits, and land use permits to the project. • Ghana Highway Authority oversees the design and construction of highway junctions, including their access points to ensure among other things, public safety and traffic management. • Ghana National Fire Service assess all buildings and infrastructure designed for construction and grant permits for compliance with the national fire safety regulations and standards. • Ghana Museums and Monuments Board is entrusted with responsibility of issuing Permits to Disturb and Relocate Cultural Sites, ensuring the proper protection and preservation of Ghana's rich cultural heritage. 17.5 EXISTING ENVIRONMENTAL CONTEXT 17.5.1 Location The ELP area falls within the Mfantseman Municipality in the Central Region of Ghana, east of Cape Coast, the Regional Capital. The Project exploration license area stretches across from Mankessim to Abandze along the West African Trans Continental Highway. 17.5.2 Climate The ELP area enjoys mild temperatures ranging from 24°C to 28°C throughout the year, with a relative humidity of approximately 70% due to its proximity to the ocean. The area experiences two peak periods of rainfall, typically in May-June and October. Annual rainfall ranges from 90 cm to 110 cm in the coastal savannah areas and 110 cm to 160 cm in the interior near the forest zone. Dry seasons usually occur from December to February and from July to September. Table 17-4 and the graphs in the figures thereunder provide the monthly rainfall data for the Ghana Meteorological Agency owned Saltpond meteorological station, which is closest to Ewoyaa, over a 10-year period, with an average annual rainfall of 900 mm. TABLE 17-4 MONTHLY RAINFALL (MM) 2010 TO 2018 Yr/Mth Jan Feb Mar Apr May Jun Jul Aug Sep Oct Nov Dec 2010 4.6 36.9 38.1 38.2 233.6 259.1 52.2 39.3 67.2 62.3 116.7 44.5 2011 0.0 13.7 0.5 204.1 165.5 263.4 129.7 50.6 46.2 99.6 2.3 53.2 2012 1.3 1.8 13.0 45.7 247.5 193.4 36.9 24.5 23.8 184.9 13.5 16.3 2013 31.6 14.3 89.7 52.3 172.5 165.0 40.8 1.9 52.9 63.3 30.6 15.8 2014 56.3 73.0 68.1 82.3 379.2 229.6 69.1 54.4 37.3 64.5 63.0 34.5 2015 13.5 66.0 116.0 59.8 178.3 353.6 43.4 5.3 2.4 203.8 113.1 2.8 2016 0.0 1.3 250.4 58.2 103.1 226.8 39.6 36.7 50.2 99.5 3.3 3.4 2017 73.4 28.1 28.3 114.2 158.3 297.7 52.3 38.5 92.1 131.7 110.4 113.1 2018 0.0 25.2 0.0 40.5 197.0 251.6 6.4 26.1 75.0 160.2 62.3 24.0 Total 180.7 260.3 604.1 695.3 1835.0 2240.2 470.4 277.3 447.1 1069.8 515.2 307.6 Max 73.4 73.0 250.4 204.1 379.2 353.6 129.7 54.4 92.1 203.8 116.7 113.1 Mean 20.1 28.9 67.1 77.3 203.9 248.9 58.0 30.8 49.7 118.9 57.2 34.2 Min 0.0 1.3 0.0 38.2 103.1 165.0 6.4 1.9 2.4 62.3 2.3 2.8 SOURCE: (NEMAS CONSULT 2019) TECHNICAL REPORT SUMMARY EWOYAA LITHIUM PROJECT Page 252 of 368 FIGURE 17-3 SALTPOND MONTHLY RAINFALL, MM FIGURE 17-4 AVERAGE MONTHLY TEMPERATURE AND RAINFALL FOR SALTPOND, WATERSHED 462 GHANA (1991-2016)

TECHNICAL REPORT SUMMARY EWOYAA LITHIUM PROJECT Page 253 of 368 (SOURCE : HTTPS://CLIMATEKNOWLEDGEPORTAL.WORLDBANK.ORG/WATERSHED/462/CLIMATE-DATA-HISTORICAL) 17.5.3 Geology The Project area has an undulating landscape with hills ranging from 15 m to 110 m above sea level. Geologically, it lies within the Birimian Supergroup, a Proterozoic volcano-sedimentary basin in western Ghana. It consists of metamorphosed schist and intruding granitoids near the Cape Coast batholith. The site is classified as B and C under Euro Code 8 seismic site classification. Baseline studies conducted in September 2021 assessed ground vibration and seismic vulnerability in various areas. Overall, the recorded peak particle velocity (PPV) does not pose a significant risk. Table 17-5 shows the seismic vulnerability of the ELP area. FIGURE 17-5 SPATIAL DISTRIBUTION OF THE ELP SITE VULNERABILITY (SOURCE: UNIVERSITY OF MINES AND TECHNOLOGY (UMAT), 2022)) 17.5.4 Hydrology The Mfantseman Municipality, located about 60 metres above sea level, is drained by several rivers and streams, including the Nkasaku and Aworaba. These rivers flow into lagoons such as the Atufa lagoon in Saltpond and the Etsi lagoon in Great Kormantse. Other lagoons in the vicinity include the Eko near Anomabo, the Egya at Egyaa, and the Kwasinzema at Kormantse, which receive water from smaller streams and rivulets (MOFEP, 2021). Within the ELP area, there is a potential presence of various streams and rivers based on the natural drainage pattern. However, on TECHNICAL REPORT SUMMARY EWOYAA LITHIUM PROJECT Page 254 of 368 the ground, only a few surface water bodies are found, primarily consisting of temporary dugouts or water holding areas that dry up during the dry season. TECHNICAL REPORT SUMMARY EWOYAA LITHIUM PROJECT Page 255 of 368 Table 17-6 illustrates the exploration area overlaid on the 2020 assessment of natural surface drainage. There are no permanent streams or rivers within the immediate project area. FIGURE 17-6 REGIONAL HYDROGEOLOGICAL MAP (SOURCE: HTTPS://WWW2.BGS.AC.UK/AFRICAGROUNDWATERATLAS) TECHNICAL REPORT SUMMARY EWOYAA LITHIUM PROJECT Page 256 of 368 FIGURE 17-7 EXPLORATION AREA SHOWING POTENTIAL AND ACTUAL NATURAL SURFACE DRAINAGE (SOURCE: KLM CONSULTING SERVICES PTY LTD / ESS, 2020) 17.5.5 Hydrogeology The Mfantseman Municipality falls within the Birimian basin and the Kibi belt and is underlain mainly by the Precambrian Birimian intruded by Cape Coast-type, granitoid and pegmatites (Yidana, 2010). The groundwater occurs within the fractures, veins and faults of these rocks. These rocks are crisscrossed by mafic dykes (dolerite) which was inferred from aeromagnetic data and regional mapping. Also occurring in the Mfantseman Municipality are tertiary rocks very close to the coast (Table 17-8). Most boreholes in the municipality were drilled for domestic water supply and these boreholes are usually fitted with hand-pumps. Their depths are dictated by their purpose. Most groundwater projects terminate drilling when sufficient water is obtained for domestic water delivery. Depths of boreholes drilled through rocks of the Birimian Systems range between 35 m and 62 m with an average of 42 m (Agyekum, 2004). Aquifer transmissivity of the productive zones of the Birimian Systems ranges between 0.2 m2/day and 119 m2/day, with an average of 7.4 m2/day. In these aquifers, storability ranges between 0.003 and 0.008 (Ayimah, 2014). Transmissivity within the regolith is slightly higher than that observed in the integrated aquifer system, and ranges between 4 m2/day and 40 m2/day with an average of about 10 m2/day. For the integrated aquifer systems in the Birimian System, borehole yields are generally low and range from 0.48 m3/h to 36.4 m3/h with a mean yield of 7.6 m3/h.

TECHNICAL REPORT SUMMARY EWOYAA LITHIUM PROJECT Page 257 of 368 Differences in the degree of weathering within the granitoids probably account for the lower yields observed in these rocks (Yidana et al., 2008). FIGURE 17-8 GEOLOGY OF THE MFANTSEMAN MUNICIPALITY AND ITS ADJOINING MUNICIPALITIES (SOURCE: AYIMAH, 2014) Groundwater chemistry in Mfantseman area varies, but most areas have desirable or permissible drinking water based on total dissolved solids (TDS) content. The pH ranges from 6 to 11, averaging 6.7 for most boreholes. The groundwater is generally fresh, but some areas are brackish due to high levels of Ca2+ and HCO3- from granite weathering. The concentration of fluoride in groundwater is uneven and influenced by the presence of fluorine-bearing minerals and leaching activities. Trace metals like manganese and iron are widely distributed, often occurring at elevated levels from mineral and soil weathering (Ayimah, 2014). 17.5.6 Flora and Vegetation According to Hall and Swaine (1981), the Project area is situated in the Southern Marginal Forest zone, adjacent to a dry semi-deciduous subtype. The current landscape consists of thicket, farmlands, secondary forests, wetlands, and derived savanna, with some forest remnants on rocky hills. The concession area contains numerous sacred groves and traditional sites, ranging TECHNICAL REPORT SUMMARY EWOYAA LITHIUM PROJECT Page 258 of 368 from individual tree shrines to dense groves. During heavy rain, accessing internal unpaved roads between communities in the concession becomes challenging. The project site is located in active farming areas where crops like cassava, maize, plantain, and vegetables are cultivated, while slash and burn practices are employed for charcoal production. Areas not actively farmed mostly consist of thickets and fallow lands dominated by elephant grass, with some Lantana camara, Azadirachta indica, and a few palm trees in certain locations. The Project obtained drone imagery of the area from Rocketmine (Delta Drone Group), captured in June 2022 with a resolution of 0.5 m. The imagery revealed dense vegetation and trees interspersed with small fields and drainage patterns, indicating evidence of land clearing for fuel purposes. 17.5.7 Fauna and Habitat The Mfantseman Municipal area includes different species of animals including duiker, antelope, bush buck, monkeys, deer, porcupines, grasscutters, birds, reptiles, and snakes. Although the area is well drained by rivers and streams (most of which are seasonal), the biodiversity values of the few perennial rivers have not been well studied and/or documented yet. All the rivers are known to be freshwater fisheries, particularly Ciclids and Clarids, for riverine communities (GEF Small Grants Programme, 2012). 17.5.8 Air quality and noise There is no official municipal data on air quality and noise levels. The results of ALL/GMR's baseline data collection for air quality and noise within the project footprint can be found in Section 17.7.4 of the Biophysical Baseline Surveys. 17.6 EXISTING SOCIAL CONTEXT 17.6.1 Regional and Local Governance The project area is governed by the Mfantseman Municipal Assembly, which is one of the twenty-two MMDA’s under the Central Regional Coordinating Council. The General Assembly has a total membership of 54 people, including elected members, government appointees, the Municipal Chief Executive, and the Member of Parliament. There are seven zonal councils within the Assembly, namely Saltpond, Mankessim, Yamoransa, Nsanfo, Dominase, Anomabo, and Abandze. The Assembly's day-to-day administration involves various decentralised departments, such as Central Administration, Directorate of Agriculture, Physical Planning, Social Welfare and Community Development, and Works Department. Politically, the municipality has one constituency made up of 36 electoral areas. There are four traditional paramountcy in the Mfantseman Municipality: Abeadze-Dominase, Nkusukum, Anomabo, and Mankessim. These paramountcies serve as custodians of tradition, culture, and local customs, actively preserving and promoting the heritage of their communities. They play essential roles in community development by providing leadership, arbitration, and representation in local governance matters. Collaborating closely with the Mfantseman Municipal Assembly, they contribute to socio-economic advancement, infrastructure development, and key sectors such as education and healthcare. Additionally, the paramountcies organise cultural events and festivals that foster community cohesion, preserve cultural heritage, and attract tourism, adding vibrancy to the municipality's overall growth. 17.6.2 Population and Demographics The Municipality has an estimated population of 176,288, with females representing 55% of the population and males 45% of the population, indicating a higher male out-migration. The population growth rate is 2%, and the average household size is 3.8 persons. About 64.9% of the population is urban, while 35.1% is rural, making the municipality more urbanised than the region as a whole (PHC, 2010). TECHNICAL REPORT SUMMARY EWOYAA LITHIUM PROJECT Page 259 of 368 According to the latest data available, the Municipality hosts approximately 95 settlements with 39,386 households in 23,770 houses (PHC, 2010). Major settlements include Yamoransa, Saltpond, Mankessim, Anomabo, and Dominase. The project area is near or located in communities such as Mankessim, Saltpond, Ewoyaa, Krofu, Krampakrom, Anokyi, Afrangua, Abonko, and Ansaadze. 17.6.3 Land Ownership The 1992 Constitution vests all public land and all minerals in the State, held in trust for the Ghanaian people. It further distinguishes between public lands that are governed by customary tenure and those that fall exclusively under state authority (GOG Constitution 1992). All customary holdings are vested in stools, skins, or appropriate families or clans (USAID, LandLinks). The Constitution allows foreigners to lease land for terms of up to 50 years (USAID, LandLinks; GOG Constitution 1992). In the Ghanaian traditional context, chiefs, clan, lineage and family heads (predominantly male lineage heads) hold the allodial and sub-allodial title to land. Chiefs generally allocate land through physical inspection processes, supported with allocation notes (a form of occupancy certificate granted by the stool/skin/landowners as proof of allocation of a land parcel to an individual, group or corporate entity). Allocation notes often bear the totem of the allocating authority and include date of allocation, terms, land description, signature of transacting parties and, in some cases, a site plan. Nonetheless, the fluidity of tenure assurance can occur when a new chief is enstooled and the chief refuses to uphold the grant agreements made by predecessors. Land title in the communities that are likely to be affected by the project is predominantly held by families, rather than chiefs and stools, as is common in Ghana. Family lands, implicitly inferred by the 1992 Constitution as private property, are devoid of extensive government regulatory mechanisms compared to stool or skin lands. Traditional Authorities and family heads of the Project communities historically have provided land for community development projects (infrastructure), when relevant. Traditional authorities also play a key role in resolving and/or mediating conflicts that arise in land ownership. 17.6.4 Land Use and Livelihoods The economy of the Mfantseman Municipality is primarily agrarian, with 81% of the economically active population engaged in agriculture (51% fishing and 30% farming). Communities in the Municipality can have access to around 4,900 hectares of arable land and a 49-kilometer coastline for fishing. Agricultural activities include crop farming, tree cultivation, livestock rearing, and fishing. Key crops grown are pineapples, oranges, plantain, maize, cassava, cocoyam, and coconut. Cash crops like cocoa and oil palm are also cultivated. The municipality has a significant livestock population, including poultry, cattle, goats, and sheep. Industrial activity is concentrated in market centres like Anomabo, Biriwa, and Yamoransa, with Mankessim serving as the commercial hub. According to the MMA MTDP 2022-2025 the three main employment sectors are: • Agriculture, forestry and fishing; • Wholesale, retail trade and auto repairs; and • Manufacturing. 17.6.5 Education The Municipality has both private and public educational facilities including Nursery/Kindergarten, Primary, Junior and Senior Secondary schools. Mfantseman Girls Senior High School in Saltpond, Kwegiri Aggrey Senior High/Technical Schools at Anomabo and Biriwa National Vocational Training Institute (NVTI) are notable high school educational institutions offering vocational, technical, and commercial skills training within the Municipality. Among individuals aged 11 years and above, 77.4% are literate, while 22.6% are illiterate. The percentage of children attending kindergarten increased from 37.9% in 2019 to 58.8% in 2020. Similarly, primary school enrolment rose from 84.7% to 98% in 2020, and Junior High School (JHS) enrolment increased from 72.9% to 75.6% in 2020 (MMA MTDP 2022-2025). TECHNICAL REPORT SUMMARY EWOYAA LITHIUM PROJECT Page 260 of 368 However, gender parity at the JHS level declined from a ratio of 1:1 in 2019 to 1:0.85 in 2020. The performance of students in the 2020 Basic Education Certificate Examination (BECE) was slightly lower than that of 2019. In 2019, the performance rate was 59.44%, whereas in 2020, it dropped to 52.88% (MMA MTDP 2022-2025). 17.6.6 Road Network and other Social Amenities The Municipality is primarily connected by second- and third-class roads, including the Accra-Takoradi Highway, which facilitates trade and economic activities. Many towns and villages have access to pipe-borne water or boreholes, while some rely on alternative water sources. Additionally, almost all settlements in Mfantseman are connected to the national electricity grid. Communication infrastructure includes limited post office access but widespread telecommunication coverage, with cellular phone service from various providers. Banking and financial institutions are present in urban areas, with some emerging in rural areas due to the population's economic activities. In 2020, the number of health facilities in the municipality increased to 36, with 3 hospitals, 4 health centres, 24 functional Community-based Health Planning and Services (CHPS) facilities, and 3 private clinics (MMA MTDP 2022-2025). Within the municipality, there are two distinct high voltage lines owned by the Ghana Grid Company Limited (GRIDCo) that pass through the Project area and surrounding communities including Mankessim, Abonko, Ewoyaa, and Afrangua Junction. These are a 161 kV transmission line running from Winneba to Cape Coast and a 330 kV transmission line running from Aboadze in the Western Region to Pokuase in Accra. 17.7 BIOPHYSICAL DATA This section presents the meteorological data in addition to data on hydrology, hydrogeology, air quality and noise collected on the project to date. Further baseline data will be collected for the purpose of informing the EIA. 17.7.1 Meteorology The weather station located in the project area collects detailed minute-by-minute weather data, including rainfall, wind direction and speed, humidity, temperature, dew point, and photosynthetically active radiation (PAR). This station has been gathering climatic data since April 2019. The figures and tables below provide a summary of the average monthly climatic conditions in the project area from 2019 to 2023. The data reveals that the months of May-June and October experience the highest rainfall in the area. Wind speed shows significant variation throughout the year, with the highest speeds occurring in the March-April and August- September periods. The prevailing wind direction is generally southwestern with some minor variations. Photosynthetically active radiation, an important factor for agriculture, reaches its peak in March-June and November, while January sees the lowest levels of radiation in the project area.

TECHNICAL REPORT SUMMARY EWOYAA LITHIUM PROJECT Page 261 of 368 FIGURE 17-9 MONTHLY AVERAGE RAINFALL AND HUMIDITY OF THE ELP AREA (2019-2023) (Source: ALL Weather Station, Ewoyaa) FIGURE 17-10 MONTHLY TEMPERATURE, DEW POINT AND PAR OF THE ELP AREA (2019-2023) (Source: ALL Weather Station, Ewoyaa) TECHNICAL REPORT SUMMARY EWOYAA LITHIUM PROJECT Page 262 of 368 FIGURE 17-11 AVERAGE MONTHLY WIND SPEED OF ELP AREA (2019-2023) (Source: ALL Weather Station, Ewoyaa) TABLE 17-5 MONTHLY RECORDED WIND DIRECTION IN THE ELP AREA (2019-2023) MONTH JAN FEB MAR APR MAY JUN JUL AUG SEPT OCT NOV DEC GENERAL WIND DIRECTION SSW WSW WSW WSW WSW WSW W WNW W W SW SW 17.7.2 Hydrology In 2020, ESS (Environmental and Social Sustainability Consultancy) conducted an initial hydrological study for the project area on behalf of ALL. Additional studies were carried out by SRK Consulting in 2022 and 2023. NEMAS Consult, contracted by ALL/GMR, has been collecting baseline data on water quality in the project footprint since July 2021 as part of the EIA requirements for an Environmental Permit from the EPA. The various study results revealed that the mining area generally drains towards the southeast. The Amissah Okye and Egoso rivers are the primary watercourses in the area, flowing southward into a coastal wetland estuary covering approximately 1.4 km2 as presented in the map below. The Egoso river catchment area is about 5 km² with a gradient of approximately 1/100. While sections of the river may not have continuous flow throughout the year, the channel morphology indicates seasonal flow and the presence of underflow in weathered geology. Intercepting the underflow upstream of planned pits can be achieved through trenches and scavenger boreholes. The main sources of water within the Project area include larger ponds, smaller ponds, and dugouts. These sources, along with groundwater from boreholes, are relied upon by most communities for domestic use in addition to piped water. Surface water quality testing was carried out for the Egoso (EGO) river, Amissah Okye river, and other streams TECHNICAL REPORT SUMMARY EWOYAA LITHIUM PROJECT Page 263 of 368 in the project area. The locations of the samples are indicated in Figure 17-12, and detailed concentration levels are provided in TECHNICAL REPORT SUMMARY EWOYAA LITHIUM PROJECT Page 264 of 368 Table 17-6. The water quality of both the Egoso and Amissah Okye rivers, per the results in

TECHNICAL REPORT SUMMARY EWOYAA LITHIUM PROJECT Page 265 of 368 Table 17-6, suggests generally favourable conditions. The pH values at all locations are within the acceptable range, indicating a neutral to slightly alkaline nature. Electrical conductivity levels indicate a moderate presence of dissolved salts, while total dissolved solids concentrations suggest a moderate amount of dissolved solids. Total suspended solids show relatively low values, with some increase during the wet season. Alkalinity remains within acceptable limits. Turbidity levels vary, with higher values observed during the wet season. Nitrate and phosphate concentrations are generally low. Metal concentrations, including iron, manganese, chromium, copper, zinc, cadmium, arsenic, and mercury, are mostly below the recommended guidelines, indicating limited contamination. These findings suggest that the water quality of both rivers meets acceptable standards. FIGURE 17-12 PROJECT AREA HYDROLOGY AND WATER MONITORING LOCATIONS TECHNICAL REPORT SUMMARY EWOYAA LITHIUM PROJECT Page 266 of 368 TABLE 17-6 CONCENTRATION LEVELS OF WATER SAMPLES FROM SURFACE WATER SOURCES No. Parameters amo1 amo2 amo3 ego1 ego2 sw14 am02 Guidelines Dry Season Wet Season WHO Std GSA 1 pH 7.28 7.66 8.2 7.99 8.14 6.53 6.26 6.5-8.5 6.5-8.5 2 EC 143.9 247.5 19835 982.5 4120 565 109 500-700 500 3 TDS 71.9 123.7 9920 491.3 2060 282.6 54.53 1000 -- 4 TSS 19 35 8 104 13 11* 82* 5 -- 5 Alkalinity 82 40 40 312 350 200 150 200 -- 6 Turbidity 6.3 61 8.6 108 11.8 2 58* 5 5 7 Colour 105 690 125 2400 220 250* 550* 25 5 8 Fluoride 0.18 0.47 0.74 0.48 0.01 3.5* 4.18* 1.5 1.5 9 Chloride 71.33 111.6 85.65 111.5 87.33 0.6 1 250 250 10 Sodium 12.44 24.26 42.48 119.2 50.01 0 9.8 200 -- 11 Potassium 12.05 18.11 54.32 14.59 15.66 5 12 30 -- 12 T. Hardness 130 135 430 340 430 150 300 500 500 13 Nitrate 5.98 10.44 53.09 11.8 31.2 4.33 4.49 45 50 14 Phosphate 0.29 1.3 0.08 1.74 0.11 0.3 0 5 -- 15 Sulphate 1 14 164 2 40 10 0 250-400 250 16 COD 8.22 10.43 20.44 7.12 6.22 120 80 250 -- 17 BOD 4.11 4.22 14.21 4.62 3.24 2 13 50 -- 18 Calcium 8.734 9.618 126.8 30.7 198.6 0 60 200 -- 19 Magnesium 5.32 5.759 11.03 10.45 9.001 50 40 150 -- 20 C.Hardness 68.5 68.2 218.6 170.9 210.8 0 130 - 21 Iron 1.31 0.59 0.127 1.809 0.061 1.9* 2.3* 0.3 0.3 22 Manganese <0.001 <0.001 0.026 1.299 3.014 0.25* 0.17* 0.05 0.05 23 Chromium 0.03 0.039 0.046 0.048 0.03 0.9* 0.3* 0.05 0.05 24 Copper 0.002 <0.01 0.089 0.048 <0.001 1 1.8* 1 2 25 Zinc 0.018 0.013 <0.001 <0.001 0.014 0.1 0.02 3 -- TECHNICAL REPORT SUMMARY EWOYAA LITHIUM PROJECT Page 267 of 368 No. Parameters amo1 amo2 amo3 ego1 ego2 sw14 am02 Guidelines Dry Season Wet Season WHO Std GSA 26 Cadmium <0.001 <0.001 <0.001 <0.001 <0.001 0.008* 0.006* 0.003 0.003 27 Arsenic 0.001 <0.001 <0.001 <0.001 0.001 <0.001 0.001 0.01 0.01 28 Mercury <0.001 <0.001 <0.001 <0.001 <0.001 <0.001 0.001 0.006 0.001 NOTE: An asterisk indicates the analysis results that exceed recommended limits. 17.7.3 Hydrogeology The hydrogeological assessment conducted by the British Geological Survey (BGS), 2009, indicates that the groundwater potential in the project area is generally low to moderate, with some localised areas of higher potential. Groundwater yields are typically poor, except in locations where there is significant weathering of the basement rocks, allowing for groundwater flow. Borehole yields in the area range from 0.1 to 0.5 Liters per second. An example of a domestic borehole with a concrete seal and a dugout at Mpesiaduadze is shown in Figure 17-13. Water quality analysis of the sampled boreholes and dugouts is presented in TECHNICAL REPORT SUMMARY EWOYAA LITHIUM PROJECT Page 268 of 368 Table 17-7 and Table 17-8. Table 17-8 specifically focuses on the quality of groundwater from dugout sources, which is typically a combination of surface runoff and groundwater from the unsaturated zone. It provides insights into the soil composition and information on anthropogenic activities. FIGURE 17-13 DUGOUT AT MPESIADUADZE (RHS) AND DOMESTIC BOREHOLE WITH SANITARY CONCRETE SEAL AT EWOYAA (LHS)

TECHNICAL REPORT SUMMARY EWOYAA LITHIUM PROJECT Page 269 of 368 TABLE 17-7 CONCENTRATION LEVELS IN WATER SAMPLED FROM BOREHOLE SOURCES NOTE: AN ASTERIX INDICATES THE ANALYSIS RESULTS THAT EXCEED RECOMMENDED LIMITS. SOURCE: NEMAS CONSULT (2021-2022). The groundwater quality in the tested boreholes in No. Parameters bh1 bh6 bh11 bh23 bh1 bh5 bh6 bh11 bh23 Guidelines dry season wet season who std gsa 1 pH 6.74 7.65 7.72 7.87 5.65 6.24* 6.27* 6.46 6.5 6.5-8.5 6.5-8.5 2 EC 329.4 1580* 2277* 3001* 268 785* 1460* 2442* 2051* 500-700 500 3 TDS 164.7 789.7 1138* 1501* 134 392 731 1221* 1026* 1000 -- 4 TSS 1 3 4 1 1 3* 1 0 2 5 -- 5 Alkalinity 39 125 188 312* 0 250* 100 300* 400* 200 -- 6 Turbidity 0 4 0 0 0 1.19 1.23 0 0.23 5 5 7 Colour 0 15* 0 0 0 0 0 0 0 25 5 8 Fluoride 0.93 0.37 0.63 0.02 0.3 2.6* 4.3* 3.8* 4.0* 1.5 1.5 9 Chloride 133.4 156.9 177.9 111.1 0 2.3 0 0.7 1.6 250 250 10 Sodium 30.6 104.1 145.2 39.9 19.2 38.9 79.1 82.5 75.9 200 -- 11 Potassium 14.3 10.91 12.37 208* 180* 4 1 30 50* 30 -- 12 T. Hardness 120 441 458 448 15 350 400 400 500* 500 500 13 Nitrate 25.5 10.57 120.5* 273.6* 87.2* 4.45 54* 8.45 73.5* 45 50 14 Phosphate 2.1 0.04 0.34 1.71 0 0.1 0 0 3 5 -- 15 Sulphate 18 30 100 134 0 60 0 90 0 250-400 250 16 COD 11.2 6.22 14.22 54.2 160 40 220 220 124 250 -- 17 BOD 5.1 3.22 5.24 24.2 6 2 6 18 4 50 -- 18 Calcium 4.6 71.84 32.17 146.6 4 80 40 40 200* 200 -- 19 Magnesium 7.5 9.56 10.25 11.1 2 110 50 50 30 150 -- 20 C. Hardness 58.9 220 214.2 220.6 8 180 80 80 200 - 21 Iron 0.06 0.15 0.01 0.3* 0 0.7* 3* 0.9* 1.0* 0.3 0.3 22 Manganese 0.01 1.215* 0.01 0.01 0.36* 0.09* 1.66* 0.65* 0.07* 0.05 0.05 23 Chromium 0.052* 0.017 0.014 0.056* 0.05* 0.40* 0.70* 0.60* 4.00* 0.05 0.05 24 Copper 0.011 0.008 0.01 0.01 0 0 0.6 0 0 2 2 25 Zinc 0.039 0.142 0.035 0.068 4.5* 0.75 0.75 0.62 0.14 3 -- 26 Cadmium <0.001 <0.001 <0.001 <0.001 0.026* 0 0.011* 0.006* 0.008* 0.003 0.003 27 Arsenic <0.001 0.001 0.001 <0.001 0.02* 0.01 0.008 0.011* 0.004 0.01 0.01 28 Mercury <0.001 <0.001 <0.001 <0.001 0.011* 0 0.004 0.002 0.002 0.006 0.001 TECHNICAL REPORT SUMMARY EWOYAA LITHIUM PROJECT Page 270 of 368 Table 17-7, shows varying characteristics. pH levels across the boreholes are generally within acceptable limits. Electrical conductivity values suggest moderate to high mineral content in some of the boreholes. Total dissolved solids concentrations vary, with some boreholes showing relatively high values during both dry and wet seasons. Total suspended solids remain generally low, with slightly higher values observed in some boreholes during the wet season. Alkalinity levels are within acceptable limits. Turbidity values are generally low, indicating clear groundwater. Metal concentrations, including iron, manganese, chromium, copper, zinc, cadmium, arsenic, and mercury, mostly fall below the recommended guidelines, suggesting limited contamination. Nitrate concentrations are relatively low, except for elevated levels in a few boreholes during the wet season. The phosphate concentration is generally low in most boreholes. Other parameters, such as chloride, sodium, potassium, total hardness, sulphate, chemical oxygen demand (COD), biochemical oxygen demand (BOD), calcium, magnesium, and hardness, show variable values across the boreholes. TABLE 17-8 CONCENTRATION LEVELS IN WATER SAMPLED FROM DUGOUT SOURCES No. Parameters dg2 dg10 dg17 dg2 dg4 dg8 dg10 dg13 dg17 Guidelines dry season wet season who std gsa 1 pH 7.9 7.63 8.13 5.98* 6.23* 6.15* 6.14* 6.4* 6.28* 6.5-8.5 6.5-8.5 2 EC 430 261.8 424.6 216.2* 70.6 134.5 164.5 78.25 243.9 500-700 500 3 TDS 214.9 130.9 212.3 108.2 35.3 67.29 82.31 39.13 122 1000 -- 4 TSS 16* 85* 72* 163* 43* 40* 180* 332* 38* 5 -- 5 Alkalinity 388* 80 340* 200* 100 400* 450* 300* 200 200 -- 6 Turbidity 13.1* 122* 104* 180* 54* 57* 123* 463* 23* 5 5 7 Colour 200* 1700* 1030* 1500* 300* 950* 1550* 5600* 450* 25 5 8 Fluoride 0.48 0.81 0.24 4.0* 4.0* 2.0* 2.0* 2.1* 3.5* 1.5 1.5 9 Chloride 62.92 151.4 49.63 0 0 1 1.8 0.6 0.5 250 250 10 Sodium 13.99 15.45 31.81 11.2 0 0.003 0.004 0.003 18.7 200 -- 11 Potassium 45.97* 13.11 16.3 9 40* 20 20 5 19 30 -- 12 T. Hardness 245 130 255 50 50 100 350 150 50 500 500 13 Nitrate 4.17 11.69 2.78 46* 53.6* 55* 3.5 4.5 4.81 45 50 14 Phosphate 1.73 0.31 0.49 0 0 0.3 0 1.1 0 5 -- 15 Sulphate 36 4 4 0 0 0 0 30 0 250-400 250 16 COD 8.22 6.11 10.22 270* 220 240 120 240 160 250 -- 17 BOD 3.22 4.24 5.22 28 24 12 8 24 6 50 -- 18 Calcium 52.37 16.17 36.12 80 0 0 0 400* 20 200 -- 19 Magnesium 9.994 8.494 5.894 130 40 50 7 0 40 150 -- 20 C. Hardness 120.5 60.8 125.6 190 10 0 0 800 40 - 21 Iron 0.1 4.85* 0.592* 2.9* 1.7* 3.7* 5.9* 17.6* 1.5* 0.3 0.3 22 Manganese <0.01 0.454* <0.01 0.13* 0.19* 0.27* 1.21* 0.48* 0.31* 0.05 0.05 23 Chromium 0.03 0.062* 0.005 0.5* 0.5* 0.6* 0.8* 0.2* 0.1* 0.05 0.05 TECHNICAL REPORT SUMMARY EWOYAA LITHIUM PROJECT Page 271 of 368 NOTE: An asterisk indicates the analysis results that exceed recommended limits. SOURCE: NEMAS CONSULT (2021-2022). The analysis of pond and dugout water quality shows variations in parameters, indicating influences from runoff, sedimentation, and agricultural activities. Elevated electrical conductivity and total dissolved solids during the wet season suggest runoff and leaching. High suspended solids indicate sedimentation and turbidity. Alkalinity levels vary, potentially from agricultural runoff and organic matter decomposition. Intense colour in some ponds may indicate organic matter or contaminants. Elevated fluoride levels could be from geological factors or human inputs. 17.7.4 Air Quality and Noise NEMAS Consult is contracted by ALL/GMR to collect baseline data on air quality and noise levels within the project footprint since July 2021 as part of EIA requirements. Air and noise baseline data is collected across 17 locations in the project area. Figure 17-14 presents the sampling locations across the project area. Air quality baseline parameters that are collected cover particulate matter, gases, and heavy metals as follows: • Total Suspended Particles (TSP) - Lead (Pb) • Particulate Matter 10 (PM10) - Mercury (Hg) • Particulate Matter 2.5 (PM2.5) - SO2 • Arsenic (As) - CO • Cadmium (Cd) - NO2 Noise level covered: • LAeq - LA10 • LA90 - Lamin • LAmax No. Parameters dg2 dg10 dg17 dg2 dg4 dg8 dg10 dg13 dg17 Guidelines dry season wet season who std gsa 24 Copper 0.017 0.02 0.039 0 0.6 0.8 2.8* 0.8 0 2 2 25 Zinc 0.054 0.055 0.019 1.5 1.3 0.45 0.38 0.52 0.16 3 -- 26 Cadmium <0.001 <0.001 <0.001 0.008* 0 0.006* 0.003 0.016 0.001 0.003 0.003 27 Arsenic <0.001 <0.001 <0.001 0.009 0 <0.001 <0.001 0.009 0.002 0.01 0.01 28 Mercury <0.001 <0.001 <0.001 0.004 0 <0.001 <0.001 0.008* 0.001 0.006 0.001 TECHNICAL REPORT SUMMARY EWOYAA LITHIUM PROJECT Page 272 of 368 FIGURE 17-14 AIR QUALITY AND NOISE BASELINE DATA LOCATIONS FOR ELP Table 17-9 presents mean results of monthly air quality data collection undertaken from June 2021 to March 2022 in the project area. The results reveal that prevailing air quality of the project area generally falls within the recommended Ghana EPA and WHO levels. TABLE 17-9 MEAN AIR QUALITY BASELINE RESULTS OF THE ELP AREA (JUNE 2021 – MARCH 2022) Sampling stations tsp (μg/m3) PM10 (μg/m3 PM2.5 (μg/m3 As10 (μg/m3 Cd (μg/m3 Hg (μg/m3 pb (μg/m3 NO (μg/m3) SO2 (μg/m3) tsp (μg/m3) ANOKYI 56.58 24.04 11.27 0.012 0.025 0.007 36.2 19.48 17.58 2.52 ABONKO 61.01 26.16 14.02 0.013 0.039 0.007 48.2 24.16 18.63 0.64 EWOYAA 45.71 18.49 8.74 0.010 0.026 0.010 34.5 19.54 0.26 0.23 KROFU 49.23 21.28 10.63 0.007 0.059 0.008 49.3 16.38 6.13 3.72 KRAMPAKROM 53.52 18.76 10.34 0.011 0.033 0.014 57.6 21.76 4.14 0.32 AFRANGUA 47.10 18.31 9.86 0.012 0.050 0.013 31.7 18.29 4.45 0.23 ANSANDZE 43.11 18.04 10.51 0.006 0.024 0.006 59.1 23.59 0.41 1.81

TECHNICAL REPORT SUMMARY EWOYAA LITHIUM PROJECT Page 273 of 368 SOURCE: NEMAS CONSULT (2021-2022) Table 17-10 presents the mean results of monthly noise level data collection undertaken from June 2021 to March 2022 in the project area. The results demonstrate that noise levels in some of the areas monitored exceed Ghana EPA and IFC/WHO recommended levels. This observation has been attributed to the fact that some of the communities and sampling areas are close to the Accra-Cape Coast Highway (N1) which is a significant source of noise pollution. TABLE 17-10 MEAN NOISE LEVEL BASELINE RESULTS OF THE ELP AREA (JUNE 2021 – MARCH 2022) Sampling stations tsp (μg/m3) PM10 (μg/m3 PM2.5 (μg/m3 As10 (μg/m3 Cd (μg/m3 Hg (μg/m3 pb (μg/m3 NO (μg/m3) SO2 (μg/m3) tsp (μg/m3) NKWANTA 54.38 23.80 12.18 0.016 0.034 1.008 40.4 27.90 13.77 3.06 NANANOM 52.08 22.31 11.99 0.007 0.038 0.009 27.5 13.58 4.48 3.82 EWOYAA JUNCTION 58.60 22.69 13.29 0.012 0.030 0.015 43.2 32.28 21.24 2.98 KANKA BOOMU 57.49 19.60 12.19 0.007 0.051 0.008 39.6 18.46 20.66 5.10 CONCESSION AREA 1 30.31 13.74 8.48 0.008 0.054 0.006 31.3 6.11 3.13 0.13 CONCESSION AREA 2 28.17 11.14 5.67 0.010 0.039 0.006 49.0 5.93 2.33 0.18 GMR 1 37.73 11.43 6.23 0.001 0.001 0.001 1.0 6.68 0.53 0.10 GMR 2 39.03 23.08 11.60 0.001 0.005 0.002 2.2 17.55 3.20 1.38 GMR 3 35.98 16.53 8.65 0.001 0.001 0.002 0.7 19.13 0.10 0.33 EPA RECOMMENDED LEVELS 150 70 35 15 20 1,000 2,500 60 100 10 WHO RECOMMENDED LEVELS 150 50 25 6,000 5,000 1,000 500 40 80 10 NOISE LEVEL Dba – DAYTIME (0600-2200) NOISE LEVEL Dba – NIGHTTIME (2200-0600) Sampling stations LAeq LA90 la10 LAmin LAmax LAeq LA90 L10 LAmin LAmax ANOKYI 55.22 49.30 56.81 44.41 91.33 51.56 48.62 53.08 46.08 82.77 ABONKO 59.28 49.56 63.86 44.94 91.76 58.08 50.32 59.92 45.81 86.66 EWOYAA 53.90 47.57 56.41 44.17 91.52 49.18 46.33 49.17 43.62 85.52 KROFU 56.92 49.30 57.84 50.14 97.53 52.02 49.26 52.70 47.46 83.47 KRAMPAKROM 54.76 48.58 58.18 44.91 88.01 48.18 45.98 48.89 44.42 75.52 AFRANGUA 51.60 45.14 55.34 42.32 94.04 47.88 44.04 47.77 43.11 77.42 TECHNICAL REPORT SUMMARY EWOYAA LITHIUM PROJECT Page 274 of 368 17.8 SOCIO-ECONOMIC DATA This section presents the socio-economic data on the communities in the project area collected by the company to date. This includes data on population, cultural heritage and archaeology. Further socio-economic data will be collected to inform and conduct the social impact assessment for the EIA and prepare the Resettlement Action and Livelihood Restoration Plan for the project. 17.8.1 Population In 2020 NEMAS Consult conducted a survey on behalf of ALL on the communities that lie within a 2 km radius from the anticipated mining lease boundary. These are expected to be directly or indirectly affected by the mine operation. The survey estimated that over 3,562 people were living within the 2 km boundary of the anticipated mining lease. Table 17-11 presents the estimated population of the communities in 2020. TABLE 17-11 ESTIMATED 2020 POPULATION OF ELP COMMUNITIES NOISE LEVEL Dba – DAYTIME (0600-2200) NOISE LEVEL Dba – NIGHTTIME (2200-0600) Sampling stations LAeq LA90 la10 LAmin LAmax LAeq LA90 L10 LAmin LAmax ANSANDZE 51.23 46.18 56.48 39.44 92.60 46.49 44.99 48.52 42.62 84.30 NKWANTA 56.40 48.42 58.41 44.81 92.67 53.37 49.06 54.44 46.07 81.57 NANANOM 52.87 48.57 55.80 45.76 88.86 49.76 47.24 49.61 45.53 81.00 EWOYAA JUNCTION 57.13 49.24 60.51 45.69 92.36 55.74 49.86 56.24 48.41 81.56 KANKA BOOMU 55.07 46.74 59.34 43.43 95.22 52.37 45.91 55.56 43.82 81.36 CONCESSION AREA 1 47.54 43.37 50.54 39.66 82.90 46.04 45.20 48.44 42.02 74.41 CONCESSION AREA 2 48.80 42.84 50.34 37.47 86.49 46.77 43.26 46.47 39.04 77.74 GMR 1 51.15 45.38 57.05 41.30 87.35 47.80 45.38 50.00 43.00 72.05 GMR 2 52.03 47.73 55.05 45.45 91.70 47.98 46.13 54.38 45.23 73.73 GMR 3 53.30 43.25 60.25 38.18 92.78 49.53 46.75 56.25 46.25 74.23 EPA RECOMMENDED LEVELS 55 - - - - 48 - - - - IFC/WHO RECOMMENDED LEVELS 55 - - - - 45 - - - - S/N Community Projected 2020 Population 1 Aboño 1381 TECHNICAL REPORT SUMMARY EWOYAA LITHIUM PROJECT Page 275 of 368 17.8.2 Cultural Heritage and Archaeology Cultural heritage and archaeological studies conducted in the project area (Abonko, Anokyi, Ewoyaa, Krofu, and Krampakrom communities) reveal that 33 archaeological and heritage resources are located in the project area. These heritage resources are shrines believed to be a link between the living and dead, suggesting that the spirits of deceased members of the communities intervene in the daily lives of the living. The shrines are said to function as a network of spirits attending to the needs of these communities, in respect of provision, protection, and healing. Some are believed to function in ensuring rainfall and good yield of crops, others help with childbirth, prevention of evil, and contagious diseases. All the shrines in these communities are thought to be spiritually interconnected in that rituals for one can be performed at another, with the calling of the spirit of that shrine to one at which the ritual is performed. Almost all the shrines share common ritual items, functions, and taboos. It is certain that the people hold very highly the shrines and their roles in the daily lives of community members. Evidence of ritual items at many of the shrine premises are testament to their active use. There may be a need to relocate some of these resources. This will be done in consultation with the various Deity- Heads to avoid social disruption and negative influence of community-company relations. 17.9 PRELIMINARY IDENTIFICATION OF POTENTIAL IMPACTS An EIA study (including specialist studies) will be commissioned by ALL/GMR to identify and assess all the potential environmental and social impacts associated with the Project, and also make appropriate recommendations to avoid, mitigate and manage those identified impacts of the Project. A summary overview of potential impacts that have been identified to date is presented in the table below. S/N Community Projected 2020 Population 2 Anokyi 407 3 Ewoyaa 363 4 Krofu 600 5 Krampakrom 115 6 Ansaadze 70 7 Afrangua 626 TOTAL 3,562 TECHNICAL REPORT SUMMARY EWOYAA LITHIUM PROJECT Page 276 of 368 TABLE 17-12 SUMMARY OF POTENTIAL IMPACTS PRELIMINARILY IDENTIFIED POTENTIAL IMPACTS CAUSE MANAGEMENT TOOL Surface Water Degradation of surface water quality Reduction in water quantity in streams and water bodies. Impacts to human health. Contamination of surface water as a result of release of pollutants (e.g., sediment, hydrocarbons, hazardous materials). Sedimentation caused by flooding in the project area and erosion on excavated/cleared areas, ponding of water in infrastructure areas. Reduction in surface water volume to non- perennial streams due to diversion of runoff and water harvesting. Development of a Water Resources Management Plan to address environmental, drainage and social impacts and the key management and monitoring procedures to mitigate significant impacts. Standard industry management measures to address potential surface water impacts. Surface Water Degradation of surface water quality Reduction in water quantity in streams and water bodies. Impacts to human health. Contamination of surface water as a result of release of pollutants (e.g., sediment, hydrocarbons, hazardous materials). Sedimentation caused by flooding in the project area and erosion on excavated/cleared areas, ponding of water in infrastructure areas. Reduction in surface water volume to non- perennial streams due to diversion of runoff and water harvesting. Development of a Water Resources Management Plan to address environmental, drainage and social impacts and the key management and monitoring procedures to mitigate significant impacts. Standard industry management measures to address potential surface water impacts. Air Quality, Noise and Vibration Impacts to human health. Damage to infrastructure. Mobile equipment emissions from engine exhausts, including carbon monoxide, carbon dioxide, nitrous oxides. Generation of dust from clearing and exposure of soils, mining operations, vehicle movement on unsealed roads and material transfer operations. Generation of noise from vehicles, plant and equipment. Noise and vibration caused by blasting activities. Implementation of adequate buffer zones around project infrastructure. Air and noise issues can be managed through standard industry management measures and monitoring. Blasting impacts to be managed through standard industry management measures and monitoring, implementation of buffer zones. Land, Structures, Livelihoods and Heritage: Social impacts associated with resettlement of communities and taking of agricultural land. Alteration of the sense of place in the project area. Relocation of culturally significant sites. Reduction in crops/food/livelihood from loss of farmland. Access to land for mining that is currently occupied by residential and other structures, and/or used for agriculture (including stock grazing and/or crop cultivation) and/or has cultural value (including plants with cultural significance and/or medicinal value). Disruption of extended family homesteads and way of life related to agriculture or subsistence. Introduction of large-scale heavy industrial activity into the area. Development of exclusion zones and use of local roads for mining purposes. A Resettlement Action and Livelihood Restoration Plan will be developed to address losses associated with land use and occupancy by local communities, including exclusion of locals to certain mine areas. The plan will also address Livelihood Restoration. A Community Development Plan has been compiled and will continue to undergo iterative development as the project progresses. A Mine Closure Plan will be developed and will address post mining land use and occupancy issues. Community Health and Safety: Increase in cost of living in mining area, which could in turn exacerbate food insecurity issues. Increase in communicable diseases (e.g. sexually transmitted infections, TB, malaria, cholera, respiratory illness). Community use of mine transport corridors / mine use of public roads – increased degradation of road Influx of cash-remunerated workers associated with the mine drives up costs of living. Groundwater contamination from mining activities. Air quality impacts caused by mining related traffic dust. Increased traffic volume due to construction and operations. Safety risks along roads between mine infrastructure, as well as the highway A Community Health & Safety Management Plan will be developed. Water Resources Management Plan will be developed to plan for sustainable water use strategy. A Traffic Management Plan will be developed. Development and enforcement of exclusion zones during operations to minimise entry of people and livestock into potentially hazardous areas. Consideration of public safety in the Mine Closure Plan.

TECHNICAL REPORT SUMMARY EWOYAA LITHIUM PROJECT Page 277 of 368 17.10 ENVIRONMENT, SOCIAL, HEALTH AND SAFETY MANAGEMENT SYSTEM (ESHMS) 17.10.1 Overview The Project has developed several mechanisms to facilitate the sustainable and effective management of ESHS impacts and risks within its footprint. This includes documented plans, agreements, toolkits, and registers that provide the framework for the management of ESHS impacts and risks of the Project. The table below presents the list of ESHSMS documents and toolkits that have been developed for the project to date, while the figure below provides a visual representation of a typical ESHSMS, which will be further developed as the project progresses. POTENTIAL IMPACTS CAUSE MANAGEMENT TOOL infrastructure and potential for traffic accidents. Public access to potentially hazardous mining areas. Increase in transience and urban social problems such as violent crime, theft, drug abuse, etc.). Changes in family and social structures, leading to increased prostitution, single parent families, leading to the social problems described above. leading to Takoradi Port, presenting risks to people and domesticated animals. Safety issue at mine pits and other mine infrastructure as these will contain water for at least some time of the year. Potential issue if illegal artisanal miners move into the area and commence unapproved mining. Influx of jobseekers and a potential influx of artisanal and small-scale mine workers. Considered low risk as minerals mined represent a bulk commodity with low intrinsic value per kilogram. Influx of male workers, many without their families and female partners, leading to disruption of social dynamics, creating a market for prostitution, illicit substances, etc. Local Employment and Content Plans will be developed to prioritise employment of locals and discourage influx. An Artisanal Mining Management Plan will be developed if it becomes necessary. Work with local institutional stakeholders to identify the most effective program of social infrastructure enhancement and provide resources (investment, facilities and resources as appropriate for the scale of agreed programme). Security: Potential for increased risk of theft in and around project area. Associated with illegal artisanal mining activities. Potential disruption of social structure and demographics in the project area, leading to increased criminal activity in the area. Development of infrastructure/roads may result in artisanal mine workers accessing the Project area. A Security Management Plan will be developed. Security measures need to be considered to ensure access to the Project by artisanal miners is restricted. Mine Closure: Reclamation and re-establishment of sustainable land uses following completion of mining. Making completed mine workings and landforms safe and stable. Altered landforms. Degraded/altered soils. Potentially contaminated areas. Wind and water erosion of disturbed areas. Disruption to or poor re-establishment of drainage channels. Safety risks associated with abandoned infrastructure and the mine workings. A Mine Closure Plan will be developed to address decommissioning and rehabilitation measures for and an Increase in communicable diseases (e.g. sexually transmitted infections, TB, malaria, cholera, respiratory illness). Community use of mine transport corridors / mine use of public roads – increased degradation of road infrastructure and potential for traffic accidents. Public access to potentially hazardous mining areas. Increase in transience and urban social problems such as violent crime, theft, drug abuse, etc.). Changes in family and social structures, leading to increased prostitution, single parent families, leading to the social problems described above. sustainable post-closure land use. TECHNICAL REPORT SUMMARY EWOYAA LITHIUM PROJECT Page 278 of 368 TABLE 17-13 PROJECT ENVIRONMENTAL, SOCIAL, HEALTH AND SAFETY MANAGEMENT SYSTEM DOCUMENTS NAME OF DOCUMENT PURPOSE OF THE DOCUMENT 1 Stakeholder Engagement Plan (SEP) (230530-ALL-PLN-008-REV2 SEP) Describes the applicable regulatory and/or other requirements for disclosure, consultation and ongoing engagement with the Project’s stakeholders. It provides the framework to build a two-way communication between ALL/GMR, the potentially affected communities and other project stakeholders through a clear, simple and effective communication strategy. It also outlines the framework to ensure that communities and other stakeholders potentially affected by the Project are well informed of and consulted on the Project, its potential environmental and social impacts, and proposed management measures. It further provides for the resolution of conflict for employees and subcontractors, as well as communities and other stakeholders, through the Grievance Mechanism. 2 Community Development Plan (CDP) (230530-ALL-PLN-09-REV1_CDP) Aimed at ensuring inclusive decision-making with host communities, supporting environmental and socio-economic development, enhancing community wellbeing, and expanding the capabilities of communities to effectively engage with ALL/GMR, government, and Community-Based Organisations (CBOs) on development issues that concern the communities. The document provides strategies and processes for ALL/GMR’s community development and presents priorities and resources needed for community development. Further, the CDP seeks to create a transparent and participatory system to build trust between ALL/GMR, the potentially affected communities and other project stakeholders through an effective and consultative strategy. 3 Draft Community Development Agreement (CDA) (221013-ALL-PLN-010-REV0 Comm Dev Agreement) The CDA describes the roles and responsibilities of all stakeholders in promoting community development within the Project’s catchment area and provides strategies and processes for ALL/GMR’s community development. 4 Emergency Response Plan (ERP) (220713-ALL-PLN-001-REV0 Emergency Response Plan) While a Risk Register is in place, unforeseeable circumstances, equipment/engineering failure and human factor could result in lapses in preventive and/or control mechanisms put in place to curtail ESHS risks leading to incidents that cause injury, loss of life, and/or damage to property. In such cases, the ERP serves to guide the response to the incident or risk factor to minimise its impacts. The ERP identifies potential emergency scenarios likely to occur in association with the ELP and their likely consequences and categorises the risks. The ERP also defines preventive strategies, response procedures for emergencies, and corresponding responsible parties/persons, including resource requirements for efficient emergency response and response timing and reporting channels and procedures. 5 Atlantic Lithium Project Risk Register (230516-ALL-RSK-REG-001-REV0 Atlantic Lithium Project Risk Register) The ESHS Risk Register is periodically updated and details all the identified risks of the ELP and the potential impacts or consequences of those risks occurring. The document also categorises each risk based on its likelihood of occurrence and severity of impact. It furthermore outlines control and management measures for each identified risk, and the responsible parties for managing those risks. 6 Baseline Exceedance Level Tracking (230531-ALL-REP-001-REV0 Baseline Exceedance Level Tracking) This document serves as a proactive monitoring tool to identify deteriorating or improving environmental conditions (air and water quality, and noise levels) within the ELP footprint based on data from monthly environmental monitoring. 7 Ongoing Environmental Monitoring Plan (EMP) (220729-ALL-PLN-002-REV0 Environmental Monitoring Plan) A long-term monitoring programme that enables prompt detection of deteriorating and/or improving environmental conditions within the ELP area to enable appropriate action to be taken where required. The EMP identifies critical environmental parameters that are monitored throughout the exploration phase of the Project, including underlining justification for monitoring those parameters. It also details the sampling locations and protocols within the ELP area for each listed parameter and sets out the logistics, equipment, and staffing required to implement monitoring. 8 Health, Safety Environment and Communities Policy (230228-ALL-POL-001-REV0 ESHS Policy) The HSEC Policy has been established to serve as ALL’s comprehensive policy for managing ESHS matters related to the ELP. TECHNICAL REPORT SUMMARY EWOYAA LITHIUM PROJECT Page 279 of 368 NAME OF DOCUMENT PURPOSE OF THE DOCUMENT 9 Human Resources Policy (230320-ALL-POL-002-REV0 Human Resources Policy The company’s HR Policy aims to comply with HR laws, maintain fair practices, prevent illegal activities, handle grievances, communicate with staff, provide training, assess risks, encourage participation, monitor performance, and integrate HR into business strategy. 10 Professional Ethics Policy (230505-ALL-POL-008-REV1 Professional Ethics Policy) The purpose of this Professional Ethics Policy (the “Policy”) is to provide a framework for appropriate operational behaviour and professional conduct for any person engaged by ALL. The Policy underpins our commitment to a duty of care to all staff and stakeholders who are either affecting or are being affected by mining operations within the Ewoyaa mining enclave. The Policy sets out the principles covering appropriate conduct in a variety of contexts and outlines the expected minimum standard of behaviour. 11 Contractor Management Plan (221213-ALL-PLN-003-OHS-REV0 Contractor Management Plan) The Contractor Management Plan (CMP) outlines processes, roles, responsibilities, and standards for contractors’ health, safety, environment, and community (HSEC) management. It ensures compliance, sets training requirements, establishes a grievance mechanism, monitors performance, and facilitates issue resolution. 12 Health, Safety, Environment and Communities Management Guidelines (230330-ALL-PLN-004-OHS-REV0 - ESHSMG) The HSECMG sets out all the procedures and requirements to be followed by all employees and contractors relating to ESHS management. It details the roles and responsibilities of all employees working on behalf of ALL on the Project, the high-level management measures to be implemented, requirements for contractors during the procurement process, and the plans, procedures and templates that are to be used for ESHS management. 13 Local Content Plan (230228-ALL-PLN-005-REV0 Local Content Plan The Local Content Plan defines the procedures that are followed by ALL and its sub- contractors to maximise employment and procurement opportunities and benefits for local stakeholders. 14 Transport Management Plan (230526-ALL-PLN-007-REV0 Transport Management Plan) The TMP prescribes procedures for the management and safe operation of ALL`s company vehicles and mobile operational machinery throughout all the mine`s development phases (exploration, construction, operation and decommissioning). The TMP aims to provide best practices and control measures required to be applied to help reduce ESHS risks related with the use of vehicles and machinery. 15 Occupational Health and Safety Management Plan (230426-ALL-PLN-006-REV0 OHS Management Plan) The OHSMP is to prevent accidents and injuries, protect employees from harm and promote a culture of safety and health within the company. The Plan aims to identify and assess hazards, implement controls to eliminate or minimise those hazards and ensure that all employees are trained and competent in performing their work safely. Additionally, the Plan seeks to comply with legal and regulatory requirements, industry standards and best practices and continuously improve our company health and safety performance through ongoing monitoring, evaluation and improvement. 16 ESHS Screening Procedure (230222-ALL-PRC-001-REV0 ESHS Screening. This document serves as a guideline for screening health, safety, environment, and community risks associated with activities conducted by ALL or its contractors that may cause disturbance to the land or receiving environment. These activities include but are not limited to clearing, digging, excavation, backfilling, landfills, and dredging. 17 Incident Investigation Procedure (230228-ALL-PRC-002-REV0B Incident Investigation) The Incident Investigation Procedure ensures the Project can identify and take correct measures for any incidents that might occur due to the Project’s activities. It also provides guidance in monitoring corrective actions that will prevent the recurrence of an incident while improving working conditions on and off-site for workers. 18 Chance Find Procedure (230228-ALL-PRC-003-REV0 Chance Find Procedure) Serves as a comprehensive framework, providing guidelines to effectively handle encounters with cultural heritage objects, with the aim of ensuring their accurate identification, minimising impacts, and promoting preservation. The primary objectives of the CFP encompass identifying valuable cultural and historic objects, implementing a designated chance find process to manage unexpected discoveries, establishing clear roles and responsibilities when encountering a resource, minimising disruptions to culturally or archaeologically significant environments, and preserving cultural heritage artifacts for the benefit of future generations. 19 Employees’ Grievance Mechanism (230319-ALL-PRC-004-OHS-REV0 Employees' Grievance Mechanism Meant to provide a structured and timely approach for employees and contractors to raise issues (if necessary, anonymously or via third parties) without fear of discrimination or retaliation, expediting the resolution of grievances and facilitating a harmonious working TECHNICAL REPORT SUMMARY EWOYAA LITHIUM PROJECT Page 280 of 368 FIGURE 17-15 VISUAL REPRESENTATION OF ESHS MANAGEMENT SYSTEM 17.10.2 ESHS Management The Environment and Social Manager (E&S Manager) assumes the central role in overseeing the management of ESHS within the organisation. The E&S Manager leads a dedicated team responsible for key functions, including Land Access and Resettlement, Social and Communities Management, Environmental Management, and Health and Safety Management. Administrative support and oversight for the E&S Manager are provided by both the Project Manager and the Chief Operating Officer. Together, this collaborative structure ensures effective ESHS management, with clear lines of responsibility and accountability throughout the organisation. Figure 17-16 presents the Project’s ESHS management structure. The E&S Manager also serves as the main point of contact for consultants and any third parties involved in ESHS assignments on behalf of ALL. NAME OF DOCUMENT PURPOSE OF THE DOCUMENT environment. This document provides a systematic approach to addressing grievances that is consistent, transparent and accessible to all employees.

TECHNICAL REPORT SUMMARY EWOYAA LITHIUM PROJECT Page 281 of 368 FIGURE 17-16 PROJECT ORGANISATIONAL STRUCTURE FOR ESHS GOVERNANCE AND MANAGEMENT 17.10.3 Environmental Monitoring ALL/GMR has developed an Environmental Monitoring Plan (EMP) set out to guide long-term monitoring of key environmental parameters/conditions within the ELP footprint. This EMP will assist the Project to proactively identify, plan, respond, and manage changing environmental conditions within its footprint. Table 17-14 presents environmental parameters/conditions that ALL/GMR currently monitors within the ELP area. TABLE 17-14 LIST OF ENVIRONMENTAL MONITORING PARAMETERS FOR EMP AIR QUALITY MONITORING Particulate Matter 2.5 & 10 (PM2.5 & PM10), Sulphur dioxide (SO2), Nitrogen dioxide (NO2), and Carbon monoxide (CO). NOISE MONITORING Daytime and Night-time LAeq, LA90, LA10 , LAmin, and LAmax WATER QUALITY MONITORING Temperature, pH, Electrical Conductivity (EC), Total Dissolved Solids (TDS), Total Suspended Solids (TSS), Turbidity, Colour, Chloride, Sodium, Phosphate, Sulphate, COD, BOD, Magnesium, Iron, Zinc, Manganese, Cadmium, Chromium, Total Coliform, and Faecal Coliform. TECHNICAL REPORT SUMMARY EWOYAA LITHIUM PROJECT Page 282 of 368 17.11 STAKEHOLDER ENGAGEMENT ALL/GMR has committed to maintaining an open dialogue with its stakeholders as the Project progresses. Throughout the exploration phase of the ELP, ALL/GMR has been consistently engaging with local and national institutional stakeholders, and community-based stakeholders on various subjects depending on stakeholder interests and roles on the project. The project has held several engagements with traditional authorities, landowners, and farmers from communities within the project footprint. These engagements have addressed matters including permission to undertake exploration activities in and around their communities, lands and farms, crop compensation, community development initiatives, and Project status updates. ALL/GMR under the ELP has likewise engaged with institutional stakeholders like the Mfantseman Municipal Assembly, Forestry Commission, Minerals Commission, and Ministry of Lands and Natural Resources among others. ALL/GMR has developed a Stakeholder Engagement Plan (SEP) for the ELP which sets out the information disclosure and stakeholder consultation strategy over the life of the Project. It provides the context and strategy for engaging with stakeholders in a culturally appropriate and consultative manner during the various Project phases, including the EIA processes. ELP’s SEP has been aligned with the approach to stakeholder engagement promulgated by the IFC in the 2012 IFC Performance Standards and the 2007 IFC Stakeholder Engagement Good Practice Handbook. It is also in conformity to Ghana’s Minerals and Mining Act, 2006 (Act 703) (as amended in 2015 and 2019), which stipulates guidelines and regulations regarding compensation for affected stakeholders, dispute resolution and socio- economic development of affected communities. These frameworks are intended to support companies to establish and maintain positive relationships with stakeholders (i.e., individuals, communities, local government authorities, and other interested and affected parties) over the life of the Project. An overview of the various Project stakeholders who are categorised according to their influence over and interest in the Project is contained in the SEP. Also indicated are the forms of engagement deemed most appropriate to each stakeholder, as well as the frequency and timing needed for fruitful engagement. Further to the objective of fostering harmonious community relations, ALL/GMR has undertaken to establish various committees to oversee the inclusive management of various community related issues. At a minimum, committees will be established for involving the various stakeholders on issues regarding land access, resettlement and livelihood restoration, community development and grievance management. 17.12 GRIEVANCE MECHANISM Proactive interaction with communities affected by the Project is integral to the long-term investment of ALL/GMR in both the region and in Ghana as a whole. Ongoing consultations with communities include formal and informal meetings to provide Project updates to the diverse community stakeholders, with the intention of establishing and maintaining an open dialogue between the Project and the community-based stakeholders. Ongoing consultations also serve as avenue for the Project to collect inputs, concerns, and proposals from stakeholders. AIR QUALITY MONITORING CLIMATE MONITORING Evapotranspiration, Rainfall, Wind Directions and Speed, Humidity, Temperature, Dew Point, and Photosynthetically Active Radiation VIBRATION MONITORING Ambient ground vibration TECHNICAL REPORT SUMMARY EWOYAA LITHIUM PROJECT Page 283 of 368 ALL/GMR has compiled a Community Grievance Mechanism Procedure to provide an open and transparent channel for communication between the community and the company and provides a framework for stakeholders to raise questions or concerns with the company and have them addressed promptly. Figure 17-17 provides a high-level overview of the grievance redress process. FIGURE 17-17 ALL GRIEVANCE MECHANISM FLOWCHART 17.13 COMMUNITY DEVELOPMENT In addition to the community development that will be funded by the royalties paid by ALL/GMR (as required by the Minerals and Mining Act), ALL/GMR plans to allocate resources for the development of the affected communities. Human and financial resources will be allocated for the implementation, monitoring and evaluation of the community development projects. Assessment is currently underway by ALL/GMR as to how best to institute a dedicated fund (Community Development Fund) for the implementation of the CDP, with a sustainability mechanism identified. Approval will be needed for annual budgets for the implementation of the CDP by the ALL Board. ALL/GMR will disclose the financial status of the fund to stakeholders through regular updates. A Stakeholder Capacity Development Plan will be developed to support these goals. The Project, considering the roles and responsibilities of Local Governance and Regional Coordinating Council structures, undertook various levels of engagements in the development of a Draft Community Development Plan (CDP) for the ELP communities. The CDP identifies stakeholders with clearly defined roles in the planning, design, implementation, closing out and post-closing out phases of community development projects. As part of the development processes for the CDP, consultations and engagement were held with stakeholders (including ELP Communities) from 27th to 29th October 2020 and from 29th September 2021 to 4th October 2021. The stakeholders identified and prioritised their development needs and projects and have indicated intention to contribute to the implementation of most aspects of the community development projects. These needs have been organised under thematic areas, capacity, and resources required, and are presented in the CDP. TECHNICAL REPORT SUMMARY EWOYAA LITHIUM PROJECT Page 284 of 368 17.14 REHABILITATION AND CLOSURE Provisions for the Project’s rehabilitation and closure obligations will be further defined during the EIA process. The principle of progressive rehabilitation will be followed to the extent possible during the mine’s operational phase. In Ghana, mines are legally required to have a Mine Closure and Rehabilitation Plan (MCRP) in place prior to operation. The MCRP will be produced as part of EIA study. The Plan will be iteratively refined as the mine develops through to closure. The Plan will include: • Surface and groundwater management; • Soil and rock management and rehabilitation planning, including rehabilitation of potential soil impacts; • Backfilling, revegetation and slope stabilisation measures; • Reclamation measures, if any; • Waste management; • Management and fate of site facilities and infrastructure including Process Plant, TSF, waste rock dumps, open pits, etc.; and • End use of site (to be defined later in Project life). The ELP Project will consult with the EPA, other Ghanaian governmental institutions and stakeholders and local communities to determine the post-mining land use. In Ghana, for mine closure activities, the funding method involves utilising reclamation security agreements, bank- guaranteed bonds, and restricted cash. The primary goal is to ensure that the company acquires sufficient funds to successfully complete the final closure and reclamation of the project. To ensure adequate financial coverage, a reclamation reserve fund will be established. This fund will be allocated to cover concurrent reclamation activities throughout the project's operational phase. The accumulation of cash within the reclamation reserve fund will commence once production begins. However, before operations commence, an initial deposit will be made into the account. The specific amount of this deposit will be determined through negotiations between the company and the Environmental Protection Agency (EPA) subsequent to the conclusion of construction activities. The estimation of the closure fund will be incorporated into the Environmental Impact Statement (EIS), which will be prepared and submitted to the EPA.

TECHNICAL REPORT SUMMARY EWOYAA LITHIUM PROJECT Page 285 of 368 18.0 CAPITAL AND OPERATING COSTS 18.1 CAPITAL COST (CAPEX) INTRODUCTION The Ewoyaa Lithium Project upfront capital cost estimate was compiled by Primero based on input from the following key contributors: • Primero: process plant, bulk earthworks and various infrastructure costs; • Geocrest Group / REC for Tailings and water storage dam earthworks; • ECG Engineering for HV powerline relocation and power supply connection costs, and • Atlantic Lithium for Owners costs, land and resettlement costs, sustaining costs. The upfront capital cost estimate for the development of the project is based on the scope as described in this report and has been peer reviewed for acceptance by the study team. All costs are expressed in United States Dollars (US$) unless otherwise stated, with an estimate basis data of Q2 2023. The estimate has been developed in accordance with Primero’s capital cost estimating procedures and is deemed to have an accuracy of +15% / -15%. The work breakdown structure (WBS) list adopted for the estimate is provided in Section 21.0. 18.2 CAPEX SUMMARY The upfront capital cost estimate summary is presented in Table 18-1. TABLE 18-1 CAPITAL COST ESTIMATE SUMMARY (US$, Q2 2023, -15% + 15%) WBS Area US$M % of Total 1000 - Site General & Infrastructure $23.5 12.7% 3000 - Process Plant - DMS $73.2 39.5% 4000 - Project Indirects $27.6 14.9% 5000 - OWNERS COSTS $33.4 18.0% 6000 - Modular Plant - DMS $15.3 8.3% Subtotal $173.0 93.4% 9000 - Contingency $12.2 6.6% Total $185.2 100.0% 18.3 CAPEX BASIS OF ESTIMATES The capital cost estimate was prepared in accordance with Primero’s standard estimating procedures and practices. The estimate basis and methodology are summarised in the sections outlining each area WBS capital costs below. The estimate build-up is based on a FS level of engineering and design across scope areas to size and specify equipment and materials and prepare material quantities. Quantity information was derived from a combination of sources and categorised to reflect the maturity of design information: • Study engineering including quantities derived from project specific engineering, equipment lists, drawings and 3D modelled facilities; TECHNICAL REPORT SUMMARY EWOYAA LITHIUM PROJECT Page 286 of 368 • Reference projects with quantities drawn from previously constructed projects or detailed designs, adjusted to suit (where required) this project works scope; • Estimates that include quantities derived from sketches or redline mark-ups of previous project drawings and data, compiled by estimating; and • Factored quantities derived from percentages applied to previous project estimates. Estimate pricing was derived from a combination of the following sources: • Priced – Market pricing solicited specifically for the project estimate for equipment, bulk materials, construction installation and indirect costs and transportation costs, sourced from enquiry to reputable suppliers, fabricators and construction contractors in Ghana and internationally; • Estimated – Historical database quantities or pricing older than six months, with some use of priced information (above) such as unit rates for cost build ups; and • Allowance – cost allowances based on project team experience, benchmarking. The breakdown of estimate pricing source (excluding contingency) is shown in Table 18-2. TABLE 18-2 SOURCE OF CAPITAL COST PRICING Source of Pricing US$M % of Total Priced or Database $136.6 79.0% Estimated $27.4 15.8% Allowance $9.0 5.2% Total $173.0 100.0% 18.3.1 Qualifications and Assumptions The following qualifications and assumptions are applicable to the capital cost estimate: • The estimate is presented in US Dollars and the estimate basis data is Q2 2023. • All pricing received has been entered into the estimate using native currency. Prices of materials and equipment with an imported content have been converted to US$ at the rates of exchange stated in. • Prices of materials and equipment with an imported content have been converted to US$ at the exchange rates stated previously in this document. • Contractor preliminaries include for mobilisation / demobilisation, recurring costs, indirect labour, construction equipment, construction cranes up to 50 t, materials, materials handling and offloading, temporary storage, construction facilities, off-site costs, insurances, flights, construction fuel, tools, consumables, meals and PPE. • Contractor direct rates include construction accommodation. • The bulk commodity works that include imported material assume that suitable construction / fill materials will be available from borrow pits within 1,000 m of the work fronts. Concrete installation contractor rates include for concrete imported materials. • Contractors are provided free, unrestricted access and single mobilisation / demobilisation. • Services (power and water) are available at the work area for construction. • No provisions have been made for stand-down, demobilisation and remobilisation of the construction workforce resulting from cyclones, floods, fires, other extreme weather-related events or industrial relations or political related work stoppages. • The site has competent geotechnical conditions that require no specialised preparation. TECHNICAL REPORT SUMMARY EWOYAA LITHIUM PROJECT Page 287 of 368 • Engineering quantities for the TSF, WSD and SCS’s have been provided by Geocrest, and appropriate rates have been applied to complete the capital cost of these items. Design and project management fees for Geocrest’s engineering sub-consultant, Resource Engineering Consultants, are included. • There is no allowance for unforeseen blasting in the bulk earthworks. • The estimate basis assumes the supply of structural steel and platework from Ghana. • Building and facilities costs include for internal fit out. Additional costs have been allowed for building and facilities detailed design, project management, perimeter fencing, security access and connections to site-based power supply, water supply and sewerage network. • Permits and licences fees up to first production of spodumene concentrate are included in the capital estimate. 18.3.2 Direct Estimate Preparation The direct capital cost estimate for the 2.7 Mtpa Process Plant and associated infrastructure was developed by Primero. The estimate summary by plant area is shown in Table 18-3. TABLE 18-3 PROCESS PLANT CAPITAL COST SUMMARY (US$ M) Plant Area US$ M 3000 - Process Plant – DMS $0.1 3100 - Rom Feed And Crushing Circuit $19.7 3200 - Feed Prep Circuit $2.6 3300 - DMS Plant $13.7 3400 - Degrit Circuit $1.7 3500 - Thickener and Tails Circuit $5.4 3600 - Middlings Circuit $4.6 3700 - Plant Services $1.2 3900 - Plant Infrastructure $24.1 Total $73.2 The plant 3D layout was produced based on the agreed plant flowsheets, engineering design criteria and documents and with sufficient detail to permit the assessment of the engineering quantities for earthworks, concrete, steelwork, piping and electrical cabling. Plant costs have been built up based on costs for the supply, installation and transport to site of all equipment and bulk materials as outlined in Table 18-4. TABLE 18-4 EQUIPMENT AND BULK MATERIALS Discipline Basis of Estimate Plant Site Bulk Earthworks Earthworks Quantities determined with reference to the existing ground model and new plant 3D model. Construction labour priced based on Local Subcontractor budget quotations received. Detailed Earthworks Excavation and backfill quantities for concrete footings calculated from the in-ground footing types. Includes backfill and compaction behind ROM wall. Allowances for trenching associated with electrical and piping installation calculated from 3D layout model. TECHNICAL REPORT SUMMARY EWOYAA LITHIUM PROJECT Page 288 of 368 Discipline Basis of Estimate Civil & Concrete Quantities from Primero design and engineering with reference to both the 3D model and similar designed and constructed reference projects where appropriate. Direct labour per m³ based on project specific subcontract budget quotations sourced during the FEED study phase. Structural Steelwork quantities established using the 3D model and using Japanese profile sections JIS to facilitate offshore supply. Structural quantities include fasteners, surface, protection, Handrail, Grating & Treads, Guarding and other accessories. Construction labour priced based on Local Subcontractor budget quotations received. Mechanical Mechanical equipment identified in the Mechanical Equipment List (MEL). Budget quotations received for all mechanical packages. A combined technical and commercial assessment has been completed for all packages with a preferred vendor recommendation provided and included in the estimate. Construction labour based on Local Subcontractor budget quotations received. Platework Quantities from Mechanical Equipment List, 3D-model and Primero Design and Engineering. Lining type and quantities established based on the application and the size of the piece of platework. Construction labour priced based on Local Subcontractor budget quotations received. Piping Quantities built up based on piping line list, manual valve list, control valve list and special piping items list. Overland piping for tailings line and decant return lines are included in MTO & estimate. Piping MTOs prepared and include fittings and couplings, stud bolts, gaskets, pipe supports, insulation etc. Supply basis for material to site pre-spooled and/or onsite welding and pipe spooling. Construction labour priced based on Local Subcontractor budget quotations received. Electrical & Instrumentation Quantities established using plant design 3D model, equipment lists, instrument list and cable schedules produced during the study phase. DCS hardware list has been developed based on IO counts from preliminary PIDs. Construction labour priced based on Local Subcontractor budget quotations received. Field Erected Tanks Quantities using the 3D model and Primero design/engineering. Field erected tank supply and installation has been quoted as a subcontract package, to be managed by Construction Management team. Freight Freight list developed within the value engineering assessment defining the port of origin, weight and volume of all equipment package, steelwork and platework. Pricing obtained for freight list including forwarding of offshore fabricated steel, platework and piping. Quoted market rates for in-gauge and oversize road transport from the port of Takoradi to site. PCC local freight priced at 20% of material supply

TECHNICAL REPORT SUMMARY EWOYAA LITHIUM PROJECT Page 289 of 368 Local sub-contractor directs and indirects rates for civil, structural, mechanical, piping and electrical have been provided to PCC for verification. PCC are a professional quantity surveying and contract management services company with access to local rates and norms having experience on estimating studies and projects. In general, consideration has been given to satisfying local content requirements, with preferred supplier and subcontractors selected based on consideration of the level of Ghanaian participation in terms of ownership, management and employment. Growth allowance for package, commodity, labour or other design growth has been included in the capital cost estimate detailed in Table 18-5. TABLE 18-5 ESTIMATE GROWTH FACTORS Commodity Growth factor (%) Earthworks 0% Concrete 5% Structural Steel 5% Platework & Tanks 5% Piping & Valves 5% Electrical 5% Instrumentation 10% 18.4 SITE GENERAL & INFRASTRUCTURE Site general and infrastructure costs (US$23.5M) are outlined in Table 18-6. TABLE 18-6 SITE GENERAL AND INFRASTRUCTURE COSTS Infrastructure area US$ M 1100 - Process Plant Site Development $0.0 1200 - Tailings and Water Dams $4.5 1300 - Non-Process Site Development $0.2 1500 - Power Generation/Supply $15.9 1600 - Site Raw Water Supply $1.5 1700 - Reticulation of Services $0.2 1800 - Site Communications $0.6 1900 - Port & Storage $0.6 Subtotal $23.5 18.4.1 Site Development Costs TECHNICAL REPORT SUMMARY EWOYAA LITHIUM PROJECT Page 290 of 368 Site development costs include for fencing of access gate security area, workshop/warehouse and admin and services building areas. 18.4.2 Tailings (TSF) and Water Dams (WSD) Costs for construction of the TSF, WSD, plant tailings pipeline (and pumps) and water return pipeline (US$4.5M) to plant are based on: • TSF and WSD: earthworks costs obtained for site bulk earthworks activities and applied to quantities in a BOQ developed by Geocrest. The costs in the upfront capital cost are for Stage 1 embankment construction, with costs for TSF lifts (2 stages) included in the Sustaining Capital Cost Estimate; and • Tailings pipeline and water return pipeline: costs for equipment, piping, valves and electrical developed according to process plant cost development for the same disciplines. 18.4.3 Non-Process Site Development Non-process site development costs relate to development of sediment control structures and culvert installations as part of upfront construction and capital spend for site drainage management. 18.4.4 Power Supply Costs for power supply and HV transmission line relocation costs (US$15.9M) were estimated by ECG based on material and equipment quantities developed for the scope of work and a combination of budget quotations and database information for construction of similar works in Ghana. 18.4.5 Site Raw water supply Costs for the construction of a pipeline and pumps (US$1.5M) to transfer water from a nearby reservoir to the WSD have been included in the estimate, based on estimate of the required piping quantities and pumps required. 18.4.6 Reticulation of services Additional piping and electrical cost allowances (US$0.2M) have been made to provide power, water and sewerage services to buildings and facilities. 18.4.7 Site communications Site communications costs (US$0.6M) were provided by ALL from budget quotations received and include for the supply of a communication tower and associated infrastructure to provide suite wide telephone, internet and two-way radio coverage and connectivity. 18.4.8 Port & Storage Costs allowances have been made (US$0.6M) for upgrades to facilities at the Takoradi port for the offload, storage and handling of spodumene concentrate products. 18.4.9 Buildings Buildings and facilities costs are contained within the plant area costs. 18.5 MINING Mining costs were supplied by the mining consultant and the basis of these costs is provided in Section 13.8. LOM mining costs have been input directly into the financial model according to the mining schedule and mining contractor unit rates developed for the FS. TECHNICAL REPORT SUMMARY EWOYAA LITHIUM PROJECT Page 291 of 368 18.6 PROJECT INDIRECTS Project Indirects are shown in Table 18-7. TABLE 18-7 PROJECT INDIRECT COST SUMMARY Cost Item US$ M 4100 - Feed Project Services $0.0 4200 - EPCM Project Services $12.0 4300 - Construction Personnel Accommodation $1.7 4500 - Other Indirect Site Services $1.1 4600 - Contractors Preliminary & General $12.7 Subtotal $27.6 18.6.1 FEED Project Services Project sunk costs on FEED works (US$1.2M) during 2023 are excluded from the estimate and have been included as sunk costs in the financial model. 18.6.2 EPCM Services The project implementation strategy is outlined in Section 21.1. Delivery of work packages for the process plant, power supply and powerline relocation and TSF/WSD will be implemented using an EPCM model, whereby the EPCM contractors will provide design, procurement and construction management services on behalf of ALL and based on the Project Schedule. EPCM project services costs (US$12.0M) consist of: • Process Plant EP Services (US$5.0M) estimated by Primero for home office-based services to manage and execute the detailed engineering phase; • Process Plant CM Services (US$4.9M) estimated by Primero for the site-based team managing construction and commissioning of the plant and associated infrastructure. Costs include site establishment and both site and offsite management costs; • Power Supply & HV Transmission Line EPCM Services (US$1.2M) estimated by ECG for detailed design, procurement and project management services for the works scope to provide power to the site and to relocate HV transmission lines in the project area; • Infrastructure EP Services (US$0.7M) include cost estimates by REC for the design and procurement scopes related to the TSF, allowances for site buildings and facilities design and allowances for site water supply pipeline design; and • Infrastructure CM Services (US$0.3M) include cost allowances for project management and supervision costs for TSF and site buildings and facilities construction. 18.6.3 Construction Accommodation Construction accommodation costs (US$1.7M) have been estimated by Primero based on construction team size and expected rosters aligned with the construction schedule duration. 18.6.4 Other Indirects Other project indirect costs (US$1.1M) include: • Site Survey services based on quotations received by ALL to verify construction progress and contractor claims; TECHNICAL REPORT SUMMARY EWOYAA LITHIUM PROJECT Page 292 of 368 • Medical services for the supply of a clinic, doctor and nursing services during construction and based on quotations received by ALL; and • Security services for the supply of security personnel and site access control during construction period and based on quotations received by ALL. 18.6.5 Contractor Preliminaries Contractor preliminaries and general costs (US$12.7M) were obtained from pricing schedules submitted to suitable Ghanaian based contractors and shown in Table 18-8. The costs include mobilisation and demobilisation, contractor indirect labour, supervision and management costs, temporary works and site establishment, construction fuels and lubricants, construction mobile equipment, plant and contractor overheads and Profit. TABLE 18-8 CONTRACTOR PRELIMINARY & GENERAL COSTS Contractor P&G Cost US$M 4610 - Buildings P & Gs $0.5 4620 - TSF & WSD P & Gs $0.7 4630 - Earthworks Contractor P&Gs $2.1 4640 - Civil Contractor P&Gs $1.4 4650 - SMP Contractor P&Gs $4.0 4660 - E&I Contractor P&Gs $4.0 Subtotal $12.7 18.7 OWNER’S COSTS Owner’s costs (US$42.8M) are outlined in Table 18-9. TABLE 18-9 OWNER’S COSTS SUMMARY Owner’s Cost Item US$M 5100 - Fees and Charges $2.3 5200 - Insurance Premiums $0.9 5300 - Owner's Team $15.6 5400 - Consultants $1.0 5600 – Pre-production $2.2 5800 - Environmental, Social & Community $11.5 Subtotal $33.4 18.7.1 Fees and Charges Fees and charges (US$2.3M) consist of permit costs and import duties. Permit costs are based on a list of permits required to develop the project as supplied by ALL, which include both upfront and ongoing (annual) cost components. Annual permit costs are included in the capital costs for the period up to production of first spodumene concentrate. Import duties of 5% have been applied to imported items such as plant mechanical equipment. The project will apply for import duty exemptions as a cost reduction opportunity. The capital estimate excludes government taxes and charges.

TECHNICAL REPORT SUMMARY EWOYAA LITHIUM PROJECT Page 293 of 368 18.7.2 Insurance Premiums Cost allowances have been included for several project insurances such as construction, plant & equipment, third party and marine insurance. 18.7.3 Owner’s Team Atlantic Lithium will provide the Owner’s project management and construction team to manage all aspects of the project and interact closely with operations management personnel recruited during the construction phase. The Owner’s team makeup and duties are described in Section 21.2. Owner’s team costs (US$15.6M) include for the labour, expenses, flights and training for both the owner’s project management and construction team and for the operations team for the period in which they are employed prior to first production of spodumene concentrate. The cost inclusions and basis are summarised in Table 18-10. TABLE 18-10 OWNER’S TEAM COSTS Owner’s Cost Item US$M 5310 - Operations Staffing & Indirects $ 4.9 5320 - Project Staffing & Indirects $ 8.5 5330 – Owner’s Indirects (e.g., software) $ 0.6 5340 - Travel & Off-Site Accommodation $ 1.3 5350 - Training $ 0.3 Subtotal $ 15.6 Operations staffing costs (US$4.9M) are based on labour costs capitalised in the pre-production period prior to first spodumene concentrate production. Costs include salaries for the operations, owner mining and management personnel during this period, G&A costs and power costs. Project Staffing costs ($8.5M) are based on the labour costs for the owner’s project management team and the environment, social and permitting team that will be undertaking ESIA and RAP activities required for project permitting and subsequent RAP implementation. Owner’s indirects (US$0.6M) are based on costs for the purchase of IT hardware and software licenses required by the owner’s project and operations teams to manage the project and in support of operational readiness. Owner’s travel and accommodation costs (US$1.3M) are based on expected travel requirements for the owner’s project teams based on required visits to the project site and rostered time on site. Training costs (US$0.3M) are based on cost allowances to provide training and skills necessary for operational readiness, such as plant operator training, first aid, isolation and permitting and software specific training. 18.7.4 Consultants Consultant costs (US$1M) have been included for consultant services fees required to support the project during the development phase up to production of first concentrate. Costs include for: • Mining Consultants; • Accounting costs; • Legal costs; • Community Consultants; • ESG Related Consultants; • Cybersecurity Consultant; TECHNICAL REPORT SUMMARY EWOYAA LITHIUM PROJECT Page 294 of 368 • Water Management Consultants; and • Operations Readiness Support. 18.7.5 Preproduction Costs Pre-production costs (US$2.2M) other than those for operational labour that are capitalised prior to first concentrate production are included in the estimate and calculated in operating cost estimate based on key process design criteria and costs obtained. The costs include: • First fills and opening stocks of reagents, consumables and other items necessary start of operations readiness based on 30-60 days of production requirements; • Equipment spares identified for the selected mechanical equipment; • Vendor commissioning costs, based on assessment of equipment vendor representatives required for commissioning of key equipment, vendor labour costs, commissioning durations, and flight allowances, and; • First aid and medical equipment, consumables and pharmaceuticals to equip the clinic and medical services provided during the construction phase. 18.7.6 Environmental, Social & Community Costs Environmental, Social & Community costs (US$11.5M) were developed by ALL for the initial phase of managing and implementing land acquisition, resettlement, livelihood restoration requirements associated with areas affected by process plant construction and initial mine development. Future phases of expenditure associated with access to further areas for mine and waste dump development were also supplied by ALL and are contained in the sustaining capital costs (Section 18.10). 18.8 EARLY PHASE PRODUCTION PLANT Costs for the early phase production plant (US$15.3M) include: • Crushing circuit costs (US$3.8M) based on quotations obtained by ALL for a scope of work for the mobilisation and site establishment of a crushing plant. Contractor unit rate crushing costs have been included in the operating costs for the early phase production plant; • DMS production plant costs (US$10.0M) based on quotations obtained by ALL for a works package including plant design, supply, delivery, installation, commissioning and 3 months of plant operational support; and • Tailings line supply and installation (US$1.5M) cost allowances. 18.9 CONTINGENCY Contingency has been provided in the estimate to cover anticipated variances between the specific items allowed in the estimate and the final total installed Project cost. The contingency does not cover project scope changes, design growth, or the listed qualifications and exclusions. A contingency analysis was undertaken by the study team that considers level of scope definition for equipment and materials supply and installation costs by discipline. Additionally, the risk of schedule delays of up to 3 months were considered. The analysis outlined a probability of occurrence of each item and cost variance range to consider as part of a Monte Carlo simulation. The Monte Carlo simulation was then conducted, resulting in an assessment of P80 likely contingency. The resultant overall project capital cost contingency is US$12.2M. It is expected that any further project development costs, if required, can be funded out of free cash flow during the period in which the early production plant is operational and the completion of the main process plant and operation. TECHNICAL REPORT SUMMARY EWOYAA LITHIUM PROJECT Page 295 of 368 18.10 DEFERRED AND SUSTAINING CAPITAL Additional capital to be expended over the life of operation to sustain mining and processing operations has been prepared and included in the financial model. The costs are presented in Table 18-11. TABLE 18-11 SUSTAINING CAPITAL ESTIMATE SUMMARY (Q2 2023, -15% + 15%) Cost Item US$ M Land Access & Resettlement Costs 98.9 Sustaining capital TSF Development Stages 2 & 3 0.8 New Tailings Line to Ewoyaa Pit 0.9 New Water Line from Ewoyaa Pit to Plant 0.5 Sediment Control Structures 3-5 0.1 Sustaining capital Plant & Buildings 7.0 Vehicle & Fleet Replacements 1.1 Sustaining capital infrastructure & equipment: 2.9 Rehabilitation & Closure Costs 45.8 Grand Total 158.0 The costs include: • Costs for land acquisition, land and crop compensation, resettlement and livelihood restoration, aligned with the mining schedule and plan for the progressive development of mining pits within the mining lease. Costs were provided by ALL; • Two stages of TSF dam wall lifts to final wall height. Costs were estimated with the same basis as the stage 1 TSF costs outlined in Section 18.4.2; • Construction of sediment control structures for mine waste sediment containment, developed in alignment with mine waste dump development; • Plant and infrastructure capital replacement costs; based on expenditure of 1% of plant capital value per annum for the process plant and 2% for infrastructure; • Rehabilitation and closure costs, estimated based on mining schedule waste tonnes and a unit rate per tonne cost developed during the PFS; and • Vehicle and Fleet replacements progressively over the life of operation. The costs exclude capital expenditure for the expansion of the process plant or installation of additional processing routes to develop additional spodumene product. 18.10.1 Working Capital No allowance for working capital has been made in the capital estimate but has been assessed in the financial model. It is expected that working capital requirements can be funded out of free cash flow during the period in which the early production plant is operational and the completion of the main process plant and operation. TECHNICAL REPORT SUMMARY EWOYAA LITHIUM PROJECT Page 296 of 368 18.10.2 Escalation No allowance for Project escalation has been made in the capital estimate. 18.10.3 Exclusions The following items are specifically excluded from the capital cost estimates: • Additional study development costs and associated drilling and further metallurgical testwork; • Any additional cost resulting in a pandemic outbreak, in Ghana or any part of the world.; • Excavation of non-rippable rock; • Mobile equipment purchase; • Working capital; • Project sunk costs; • Corporate costs and overheads; • Project financing costs; • Exploration Costs (included directly in the financial model); • Taxes and duties (included directly in the financial model); • Exchange rate variations; and • Escalation. 18.11 OPERATING COSTS LOM SUMMARY LOM operating costs for the project have been developed based on mining contractor operating costs and all other operating costs developed on an annualised basis and using the parameters specified in the plant process design criteria for the main plant operation. C1 Operating costs are presented in Table 18-12. TABLE 18-12 LOM C1 OPERATING COSTS Operating Cost US$ M (LOM) Unit of measure Unit cost by activity $/dmt concentrate Mining Contractor 1,529,673 $/t mined 3.81 455 Atlantic Mine Management 38,785 $/t mined 0.10 12 Processing 202,169 $/t processed 7.88 60 General and Administration 168,562 $/dmt concentrate 50.15 50 Spodumene Selling 100,195 $/dmt concentrate 29.81 30 Secondary Product Selling Costs 145,242 $/dmt secondary product 32.65 43 Secondary Product Credits -834,681 $/dmt concentrate -248 Total Operating Cost 1,349,946 $/dmt concentrate 402 18.12 OPEX BASIS OF ESTIMATE The estimate basis and detailed cost breakdown for each major cost centre are presented in the sections below. The operating cost estimate is expressed in USD based on prices and market conditions current in the second quarter of 2023 (2Q23). Exchange rates used in the estimate compilation are shown in Table 18-13. TABLE 18-13 EXCHANGE RATE SUMMARY Currency FX Rate Assumption (USD = 1.00) Australian Dollar AUD 1.49

TECHNICAL REPORT SUMMARY EWOYAA LITHIUM PROJECT Page 297 of 368 Euro Euro 0.92 British Pound GBP 0.81 Canadian Dollar CAD 1.35 Chinese Yuan (Renminbi) CNY 6.86 Ghanaian Cedi GHS 11.66 South African Rand ZAR 17.79 Thailand Bhat THB 34.07 The estimate has been developed from costs sourced by Primero and ALL and are based on quotations, database and/or benchmarking information and other allowances. 18.12.1 Exclusions • Contingency; • Exchange rate variations; • Escalation / Inflation from the date of estimate; • Project financing costs and interest charges; • Corporate head office costs and overheads; • Exploration costs; • VAT, corporate and withholding taxes – included in the financial analysis (Section 19.0); and • Royalties and other government levies - included in the financial analysis (Section 19.0). 18.13 MINING OPERATING COSTS Estimation of direct mining costs were developed on the basis of a mining contractor operation, under the management of the Atlantic Lithium site operations team. Mining costs were based on: • Contract mining costs established via a request for quotation (“RFQ”) process involving eight established mining contractors active in the region for the full scope of contract mining services, excluding grade control drilling. Contract grade control costs were provided by the exploration drilling company that conducted the resource drilling at the Project (Geodrill Limited); • Capital works relating to mobilising and establishing mining operations were requested as part of the RFQ process; and • Owner’s operations mining management team costs were estimated by ALL and are included in the OPEX. Contract mining quotes were obtained from eight mining contractors experienced in the region. For conforming contractor quotes, unit mining costs excluding site establishment, mobilisation and de-mobilisation ranged from $3.21/t to $4.60/t mined based on material movement for the first seven years of mine life. Mining costs were estimated at $3.82/t mined, over the life of mine, inclusive of contractor mobilisation, establishment, pre-production mining and demobilisation. 18.14 OPERATING COSTS TECHNICAL REPORT SUMMARY EWOYAA LITHIUM PROJECT Page 298 of 368 Annual operating costs include all management, administration and processing costs to process 2.7 Mtpa of ore annually to produce DMS spodumene concentrate and secondary fines products. Owner management costs also include the ALL mining team that manage the mining contractor. Operating costs are expressed in United States Dollars (US$) unless otherwise stated, with an estimate basis date of 2Q23, and are summarised in Table 18-14. TABLE 18-14 OVERALL OPEX SUMMARY (USD, 2Q23, -15% + 15%) Item $M/year $/t Feed $/t Product Labour (Processing & Maintenance) $ 6.8 $ 2.51 $ 11.61 Reagents & Operating Consumables $ 2.2 $ 0.82 $ 3.60 Maintenance Materials $ 3.6 $ 1.34 $ 6.18 Power $ 3.0 $ 1.11 $ 5.11 Labour (Atlantic Mining) $ 3.4 $ 1.24 $ 5.75 Labour (General & Administration) $ 5.4 $ 2.01 $ 9.27 General & Administration Expenses $ 9.3 $ 3.44 $ 15.90 General & Administration Power $ 0.3 $ 0.11 $ 0.50 Fines and Waste Handling $ 1.9 $ 0.71 $ 3.30 Product Transportation and Logistics $ 23.1 $ 8.55 $ 39.54 TOTAL $ 69.0 $ 21.8 $ 100.9 18.14.1 Labour Labor costs have been developed based on the organisational structure, headcount, rosters and work hours shown in Section 21.2. Costs are included for ALL mining management, administration, operations, and maintenance personnel. The labour costs exclude ALL corporate and head office personnel and mining contractor labour costs, which are included in the mining contractor costs. Labour cost buildups are based on identified base salaries, applicable overheads and annual bonuses for each role and position to calculate the total cost to company for each position. Expatriate staff overhead costs include allowances for medical and dental insurance and rostered travel. Expatriate personnel will be accommodated in a nearby resort and are not paid any accommodation costs. Catering and accommodation costs have been included under camp services contract costs in General and Administration. Local staff salary and wage overhead costs include allowances in accordance with Mine Workers Union advice for overtime, shift allowance, travel allowances, rent subsidy, mid shift meal allowance, Medical, Provident fund, social security, education assistance; and Death & Disability insurance. Local salaried personnel will source their own local accommodation. Allowances have been included in the General & Administration costs for first aid and medical costs, safety clothing, entertainment and training for all personnel. These costs are therefore excluded from the labour costs. TECHNICAL REPORT SUMMARY EWOYAA LITHIUM PROJECT Page 299 of 368 TABLE 18-15 LABOUR HEADCOUNT AND ANNUAL COSTS (EXCL. MINING CONTRACTOR) Department No. of Positions Total Cost (USD M) Admin 49 $ 2.2 Environment & Social 21 $ 2.1 Management 2 $ 0.4 Mining 32 $ 2.9 OHS 8 $ 0.6 Processing 122 $ 6.8 Tech Services 2 $ 0.4 Total 236 $ 15.6 18.14.2 Reagents and Consumables Reagent and consumables costs are presented in Table 18-16. Reagent consumptions have been derived from recent metallurgical testwork and benchmarking against similar operations. Generally, reagent unit costs were obtained from relevant suppliers on an CIF Ghana, Tema basis. Additional costs for transport to site were added on the basis of a land transport cost of $400 per container from Tema Port to ELP site. TABLE 18-16 COST SUMMARY FOR REAGENTS Item Total Cost ($/y) Total Cost ($/t feed) FeSi $1,700,097 $0.63 Flocculant $42,448 $0.02 Screen Panels $453,613 $0.17 Raw Water Abstraction $6,450 $0.00 Total $2,202,607 $0.82 18.14.3 Power Cost Power consumption has been estimated based on installed and operating loads in the electrical load list. A unit power cost of $0.14/kWh was supplied by ECG Engineering and applied to the annual power consumption. TABLE 18-17 ANNUAL POWER COSTS Area Description Total Cost ('000 USD/y) Total Cost ($/t feed) ROM Feed and Crushing Circuit $ 910 $ 0.34 Feed Prep Circuit $ 107 $ 0.04 Primary DMS $ 366 $ 0.14 TECHNICAL REPORT SUMMARY EWOYAA LITHIUM PROJECT Page 300 of 368 Secondary DMS $ 264 $ 0.10 Recrush DMS $ 172 $ 0.06 Primary Ultrafines $ 251 $ 0.09 Secondary Ultrafines $ 104 $ 0.04 Degrit Circuit $ 78 $ 0.03 Thickener and Tails Circuit $ 76 $ 0.03 Internal Water Reticulation $ 366 $ 0.14 Product and Tails Handling Circuit $ 19 $ 0.01 Substations and LV Reticulation $ 273 $ 0.10 NPI & External Services $ 289 $ 0.11 TOTAL POWER CONSUMPTION $ 3,275 $ 1.21 ANNUAL SERVICE CHARGE (FIXED COST) $ 50 $ 0.02 TOTAL POWER COST $ 3,325 $ 1.23 18.14.4 Maintenance Materials Maintenance material costs comprise maintenance consumables for each plant area and have been estimated as a percentage of the direct installed capital cost and based on data and benchmarking from similar operations. TABLE 18-18 ANNUAL MAINTENANCE MATERIALS COSTS Area Description Total Cost ('000 $/y) Total Cost ($/t feed) ROM Feed and Crushing Circuit $ 865 $ 0.32 Feed Prep Circuit $ 612 $ 0.23 Primary DMS $ 989 $ 0.37 Secondary DMS $ 105 $ 0.04 Recrush DMS $ 239 $ 0.09 Primary Ultrafines $ 285 $ 0.11 Secondary Ultrafines $ 160 $ 0.06 Degrit Circuit $ 53 $ 0.02 Thickener and Tails Circuit $ 126 $ 0.05 Internal Water Reticulation $ 104 $ 0.04 Product and Tails Handling Circuit $ 15 $ 0.01 Substations and LV Reticulation $ 55 $ 0.02 TOTAL $ 3,609 $ 1.34 18.14.5 Concentrate Selling Costs Concentrate selling costs and their breakdown are shown in Table 18-19. TABLE 18-19 SUMMARY OF CONCENTRATE TRANSPORT COSTS Product transport costs DMS Con ($/t) Fines ($/t) Stockpiling on the mine site $0.96 $0.96

TECHNICAL REPORT SUMMARY EWOYAA LITHIUM PROJECT Page 301 of 368 Loading & trucking to Brownfield’s stockpile (off-port) $12.05 $12.05 Storage at off-port stockpile location $0.69 $0.69 Re-loading and shuttle to Ship $4.53 $4.53 Sampling at port $0.22 $0.22 Loading onto Ship $6.92 $6.92 Port Charges $3.02 $3.02 Total (excluding moisture) $28.39 $28.39 18.14.6 General and Administration Annual General and administration costs (Table 18-20) have been based on a range of quotations, cost allowances and benchmarking to other projects. TABLE 18-20 GENERAL & ADMINISTRATION COSTS G&A Cost Item Total Cost ('000 USD/y) Site Office Administration $ 237 Software $ 306 Consultants $ 662 Financial & Legal Costs $ 69 Insurances $ 706 Personnel Costs $ 871 Contracts $ 1,132 General Expenses $ 344 Permits, Licenses and Fees $ 54 Mobile Equipment Maintenance $ 1,541 Laboratory Operations $ 2,998 NPI Maintenance and Expenses $ 365 Total $ 9,284 Site office administration costs include cost allowance for internet, telecommunications, postage, courier and light freight, stationery & office supplies, computer supplies & support and office equipment. Software costs cover license costs for key business enterprise, mining and office software requirements. Consultant cost allowances are for annual site services support for a range of support across Safety, Environmental, Engineering, Accounting and Tailings (Engineer of Record) audits. Financial & Legal costs cover annual accounting/audit, legal and banking costs for the operations. Insurance cost allowances cover a range of annual insurance premiums for the operation such as Medical, Light Vehicle Insurance, Workers Compensation, Third Party Liability, Marine Transit, Damage, Breakdown, Business Interruption, Corporate Travel and Political Risk Insurance. Personnel costs include allowances for costs not included in labour costs and related to recruitment and relocation, visas and passports, professional memberships, external training, business travel, PPE and first aid costs. Contract costs cover services contracts to the operation including IT Services, Accommodation resort rental, catering and cleaning, security, medical and pest control. The project will lease a resort in Saltpond for the accommodation of TECHNICAL REPORT SUMMARY EWOYAA LITHIUM PROJECT Page 302 of 368 senior management and visitors. Operation and management of the resort will be via a contract inclusive of all catering, cleaning, laundry, maintenance and management. Site based security services will be provided under a contract and based on quoted costs from a Ghana based company, who will provide personnel and facilities to manage site access control, site security and monitoring and prevent and deter damage or attacks to company employees and assets. Medical services will be provided under a contract and based on quoted costs from International SOS. The services include medical staffing, Emergency Medical Response, and Medivac. Additional costs have been allowed to stock and maintain first aid and medical supplies and consumables. General expenses cover costs such as Community relations projects and expenditure, scholarships, community office rental, medical supplies and consumables and allowances for miscellaneous costs. Costs have also been included for annual fees related to permits and licenses required to run the operation. A list of permits and fees and their costs was supplied by ALL. Vehicle and mobile equipment required for the operation have been identified based on similar projects. Costs for fuel consumption and maintenance requirements has been included. The intent is to make use of locally available mechanical workshops for the maintenance of light vehicles. Mining contractor fleet, vehicles and mobile equipment costs are excluded from the operating costs but are covered under the mining services contract and mining costs. This includes mobile plant working on the ROM for ore feed and re-handle. Laboratory costs have been developed on the basis of a contracted laboratory services arrangement and based on identified plant, mine grade control and shipment sample and assay quantities and estimates for the project. Mine grade control assay costs are included in laboratory costs, whereas grade control drilling costs are included in mining contractor costs in Mining operating costs. Costs for the laboratory services were obtained from quotations from established laboratory services suppliers for the design, supply, commissioning and ongoing operation of a full equipped laboratory, which will be constructed by ALL under the provider’s supervision. Costs for maintenance and expenses related to non-process infrastructure are included in G&A costs and not processing maintenance costs. The costs include for maintenance of the TSF, facilities, substations, water and sewage treatment plants and sediment control structures. 18.15 PRE-PRODUCTION MODULAR DMS PLANT OPERATING COSTS The operating cost summary for the pre-production period of operation of the processing plant is shown in Table 18-21. Costs for the pre-production processing plant are based on the same cost basis and estimates used in the primary processing plant operating cost breakdown, with the exception that higher reagent consumptions have been applied, and labour has been scaled back appropriately. The modular plant will operate from diesel powered generators and an estimate for fuel consumption has been made based on an estimate for the power draw. TABLE 18-21 OVERALL PRE-PRODUCTION MODULAR PLANT OPEX SUMMARY Item $/year $/t Crusher Feed $/t Product Operating Costs Modular DMS Contractor $1,000,000 $1.66 $3.58 Crushing $6,220,838 $10.31 $22.30 Labour (Processing & Maintenance) $2,204,180 $3.65 $7.90 Reagents & Operating Consumables $669,537 $1.11 $2.40 Maintenance Materials $1,709,813 $2.83 $6.13 Diesel $1,986,336 $3.29 $7.12 Labour (Atlantic Mining) $1,812,108 $3.00 $6.50 Labour (General & Administration) $1,692,326 $2.80 $6.07 TECHNICAL REPORT SUMMARY EWOYAA LITHIUM PROJECT Page 303 of 368 General & Administration Expenses $2,653,316 $4.40 $9.52 Fines and Waste Handling $387,681 $0.64 $1.39 Product Transportation and Logistics $8,962,899 $14.85 $32.13 TOTAL $29,302,035 $48.56 $105.03 TECHNICAL REPORT SUMMARY EWOYAA LITHIUM PROJECT Page 304 of 368 19.0 ECONOMIC MODEL AND SENSITIVITY ANALYSIS 19.1 INTRODUCTION A financial model has been prepared to collate the study physicals, cost estimates, revenue assumptions and project fiscal regime to estimate and evaluate project cash flows and economic viability. The model physicals are based on the mining and production schedules and LOM costs presented in Section 13.0, as well as the detailed capital and operating cost estimates in section 18.0. Approximately 450,000 tonnes of ore will be processed over the first 9 months starting Q2 2025 in an early production processing plant prior to processing through the main 2.7 Mtpa processing facility from Q1 2026 for 11 years. The Project funding basis is for all project development requirements to be funded by equity via an off-take agreement, which will have no interest cost or repayment schedule. Piedmont and ALL have entered into a binding offtake agreement for 50% of the Project’s life of mine spodumene concentrate, with offtake pricing being linked to the prevailing price of lithium products. Piedmont has committed CAPEX of US$70M to the Project with any additional costs being shared equally with ALL. It is expected that all lithium production will be sold offshore and approval for retention of funds offshore (foreign exchange accounts) will be sought for the entire Project cash flows to minimise exposure to fluctuating exchange rates for payments to suppliers and shareholders. 19.2 FINANCIAL MODEL BASIS AND INPUTS 19.2.1 Project Physicals Key model physicals are listed in Table 19-1. TABLE 19-1 KEY FINANCIAL MODEL PHYSICALS AND INPUTS Model Parameter Basis Basis Value/Input Capital Funding Base Case: 100% Equity, 0% Debt Equity Discount rate % per annum 8.0% Royalties Govt. % 10.0% Royalties 3rd Party % 1.0% Royalties 3rd Party %, but capped at $2m total 1.0% Royalties - Growth and Sustainability 1% levy New % 1.0% DMS Recovery P1 SC6.0 62.1% DMS Recovery P1 SC5.5 67.2% DMS Recovery P2 5.5 14.9% DMS Modular Recovery 5.50% 34.0% DMS Recovery Lab to Field Discount % n/a Li Product Moisture Content % 5.0% Feldspar Moisture Content % n/a Secondary Product Moisture Content % 15.0%

TECHNICAL REPORT SUMMARY EWOYAA LITHIUM PROJECT Page 305 of 368 Model Parameter Basis Basis Value/Input Corp Tax Rate % 35% GET FUND Paid in year after cost incurred % of goods & services cost 2.5% NHIL FUND Paid in year after cost incurred % of goods & services cost 2.5% CDA FUND Paid in year after cost incurred % of earnings/profit (NPAT 1.0% VAT Rate % of goods & services cost 15.0% Return Frequency for VAT (post Construction) Quarters 2.00 COVID 19 HRL - levy on non-exempt goods and services Paid in year after cost incurred 1% Goods & Services Costs estimate based on % of Opex 17% Import duties on op consumables 5% Marketing Costs % 3% Environmental Bond first year payment US$ $4,522,995 Annual Premium as % Insurance Bond 0% With-holding Tax Rate on non-resident services 20% Withholding Tax Rate on Interest and dividends 8% Import Duties on Op Consumables (incl. ECoWAS & Proc) 5% Carried forward losses in Ghana Years 5 Refining Costs % 0.00% Governments Free Carry Requirement % 13% 19.2.2 Revenue Basis Revenue is derived from the sale of Spodumene concentrates (SC6 and SC5.5) and secondary fines products. Over the LOM, the project is estimated to produce 3.36 Mt of 6% (SC6) and 5.5% (SC5.5) grade lithium spodumene concentrates, as well as 4.45 Mt of secondary products. Unit rate pricing (US$/t) for each product over the LOM is presented in Table 19-2 and applied to the annual production rate of each product. Pricing incoterms basis is FOB Port of Takoradi, Ghana. Spodumene concentrate pricing is based on a consensus SC6 pricing forecast supplied by ALL. SC5.5 pricing is calculated with a 5% discount to the SC6.0 Li2O unit pricing and factored by a ratio of the product grades, i.e., SC5.5 price = (5.5/6)*SC6 Price*0.95. Secondary product pricing is calculated with a 45% discount to the SC6.0 Li2O pricing and factored by a ratio of the product grade. The pricing basis for the discount is from preliminary discussions between ALL and potential offtakers for the material listed in Table 19-2. TECHNICAL REPORT SUMMARY EWOYAA LITHIUM PROJECT Page 306 of 368 TABLE 19-2 PROJECT PRODUCT PRICING FORECAST, USD, FOB GHANA The product pricing and annual production of each product result in total Project revenue of $6.23 billion for the Life of Mine production of 3.36 Mt of saleable grade lithium concentrate and 4.45 Mt of Secondary product. 19.2.3 Project Funding The Project will be funded under a co-development agreement with Piedmont Lithium Inc (“PLL"), where Piedmont has the right to earn up to 50% at the project level and 50% of the total spodumene concentrate (SC6) offtake at market rates by funding US$17M towards studies and exploration and US$70M towards the development capex. Any cost overruns or savings for the project (i.e. where development costs are more or less than the funding in the agreement) will be shared equally between the Company and PLL. The Minerals Income Investment Fund of Ghana (“MIIF”) has agreed non-binding Heads of Terms with the Company to invest a total of US$32.9M in the Company to support the development of the project. This will be done by acquiring 6% contributing interest of the Project for US$27.9M as well as a US$5M investment into Atlantic Lithium. Project funding has been included on the premise that all Project development requirements will be funded by the PLL agreement, with additional funding required by ALL to be sourced from cash or equity. 19.2.4 Other Cost Inputs Operating costs for processing and administration, including product transportation costs are based on annual operating costs provided by Primero and incorporated into the financial model as either fixed annual costs or variable unit costs applied to production schedule rates. MFC provided LOM mining and processing schedules and associated LOM mining costs in Section 13.8 and based on the contractor mining RFQ process. The project development capital cost estimate of US$185.2 million (Section 18.0) is included into the financial model based on an expenditure schedule developed for the FS. Similarly, sustaining capital cost and rehabilitation and closure capital cost expenditure schedules were also included into the model. 19.3 FINANCIAL MODEL RESULTS 19.3.1 Summary The Project financial analysis is summarised in Table 19-3. TABLE 19-3 PROJECT CASH FLOW MODEL RESULTS Item Units FS Result Revenue All Products US$M 6,213 Spodumene Revenue US$M 5,378 Year 2025 2026 2027 2028 2029 2030 2031 2032 2033 2034 2035 3036 FS SC6.0 (median consensus), US$ 3,000 2,557 2,000 1,841 1,770 1,666 1,560 1,452 1,410 1,410 1,410 1,410 FS SC5.0 (calculated), US$ 2,613 2,227 1,742 1,603 1,541 1,451 1,359 1,264 1,228 1,228 1,228 1,228 Secondary Product (calculated), US$ 375 286 222 176 191 189 163 155 144 139 154 152 TECHNICAL REPORT SUMMARY EWOYAA LITHIUM PROJECT Page 307 of 368 Secondary Product Fines Revenue US$M 835 NPVs Post Tax US$M 1,219 IRR % 94.5 Payback Months 13.8 EBITDA US$M 3,101 EBIT US$M 2,759 NPAT, LOM US$M 1,819 Surplus Cashflow, Post Tax US$M 1,921 C1 Cash Cost (net by-product credit) US$M 402 All in Sustaining Cost (ASIC) US$M 708 All-In Sustaining Costs (AISC) are defined as Operating Costs plus 3rd party royalties, government royalties and sustaining capital. AISC are calculated and reported from commencement of commercial production. AISC exclude Non- Sustaining Capital expenditure. The project demonstrates robust financial metrics and rapid payback. The analysis produces a post-tax cash flow of US$1.921B, and a post-tax NPV of US$1.219B with an IRR of 94.5% and payback of 13.8 months. Average C1 cash costs are US$402 per tonne of SC6 after secondary product credits of US$248/t, and all in sustaining costs (AISC) of US$708/t. FIGURE 19-1 UNDISCOUNTED (FREE CASH) POST-TAX PROJECT CASHFLOWS - – YEARLY TECHNICAL REPORT SUMMARY EWOYAA LITHIUM PROJECT Page 308 of 368 Year Revenue OPEX CAPEX Financing Post Tax Cash Flow Cumulative Cash Flow (Post Tax) 2023 - - (27) 91 63 63 2024 - (11) (97) 88 (20) 44 2025 171 (90) (102) 5 (16) 28 2026 787 (414) (2) (13) 358 386 2027 823 (451) (12) (14) 347 733 2028 483 (340) (3) (14) 126 859 2029 708 (454) (6) (0) 248 1,107 2030 634 (430) (2) - 201 1,308 2031 552 (394) (2) - 156 1,464 2032 519 (377) (3) - 139 1,602 2033 482 (367) (9) - 106 1,709 2034 440 (348) (1) - 91 1,800 2035 456 (346) (12) - 98 1,898 2036 158 (108) (39) - 11 1,909 2037 - 13 - - 13 1,921 2038 - - - - - 1,921 2039 - - - - - 1,921 2040 - - - - - 1,921 TABLE 19-4 PROJECT CASH FLOW MODEL RESULTS 19.4 SENSITIVITY ANALYSIS Sensitivity analysis was performed to assess the impact on the on the post tax project NPV (US$1.219B) by adjusting various model input parameters by (±25%) as outlined in Figure 19-2.

TECHNICAL REPORT SUMMARY EWOYAA LITHIUM PROJECT Page 309 of 368 FIGURE 19-2 CASHFLOW SENSITIVITIES, NPV8 BASIS Project cash flows are most sensitive to changes in concentrate selling price, where a 10% change in price resulted in a 17.3% change to the Post-Tax NPV. This was closely followed by sensitivity to changes in grade (14.9%) and recovery at (14.2%). Sensitivity adjustments of project expenses demonstrated that mining costs, which made up the largest portion of operating expenditure, resulted in the most significant movements in project NPV followed by concentrate transport, processing. The project is insensitive to changes in capital cost. TECHNICAL REPORT SUMMARY EWOYAA LITHIUM PROJECT Page 310 of 368 20.0 ADJACENT PROPERTIES No specific mineral resource related information was found for adjacent properties on mineral right tenures. TECHNICAL REPORT SUMMARY EWOYAA LITHIUM PROJECT Page 311 of 368 21.0 OTHER RELEVANT DATA AND INFORMATION This section describes the project implementation and the organisation of the operations. 21.1 PROJECT IMPLEMENTATION The Project consists of the following major areas: • Mine development, including haul roads, magazine, pit dewatering, in-pit crushing and ore overland conveyor; Lithium Spodumene concentrate process facility. • Infrastructure to support construction, mining and processing operations. 21.1.1 Implementation Objectives The overall project objective is to design, fabricate, build and commission a successful lithium mine, concentrate production facility and associated infrastructure to a high safety standard whilst meeting all statutory laws and regulations and minimising impact to local communities. The strategy will maximise the use of Ghana owned contractors and suppliers of key materials and services in accordance with recently legislated requirements and employ up to 600 personnel during the peak construction phase. Further, the use of other skilled resources familiar with working in Ghana will be employed to de-risk execution performance, safety and quality objectives. The plan seeks to balance ALL control with work scopes managed by both the EPCM and other contractor managed packages that are outlined in further detail below. The design and implementation of the Project will conform to all statutory laws and regulations. Where Ghanaian laws and regulations do not cover a specific situation, equivalent world standards will apply. All Project personnel will be required to adhere to defined safety standards developed by ALL specifically for the Project. 21.1.2 Strategic Objectives The overall Project objective is to design, fabricate, build and commission a successful DMS lithium mine and concentrate production facility to a high safety standard whilst remaining cognisant and respectful of local communities. The strategic objectives for the Project development are summarised as follows: • zero lost time and medical treatment injuries; • zero major environmental incidents; • 100% compliance with all approvals; • maintain positive community relations; • early application for a mining license, and corresponding ESIA submission, in order to achieve a faster track development timeline; • deliver an early production plant to generate early revenue, develop mining and processing operations co- ordination and capability; and • achieve target safety, budget, schedule and quality measures. 21.1.3 Project Implementation Schedule A detailed project implementation schedule has been developed with Primavera P6. based on inputs from the ALL team and all FS and FEED consultants. The schedule outlines a 30-month duration from FS completion until introduction of first ore into the main process plant in January 2026. The schedule has zero float and is contingent upon the following assumptions and basis: TECHNICAL REPORT SUMMARY EWOYAA LITHIUM PROJECT Page 312 of 368 • ALL will use the FS for its mining license application to the Minerals Commission of Ghana and, together with the FEED package information and costs, for internal assessment with project JV partners for a Decision to mine. • The FS works and schedule outline the timeline and works activities necessary to develop and submit a project ESIA submission and a resettlement action plan (RAP), as well as a timeline to apply or and prepare all requirements of the list of permits required. • A front-end engineering design (FEED) program has been conducted in parallel with the FS to progress design activities for the process plant and for the relocation of an existing electrical transmission line currently traversing the project site and development area. • The FEED period has identified likely suppliers of long lead equipment and commenced conforming of contracts for award early in the detailed design. • The proposed project investment available to ALL by its 50% off-take partner, Piedmont Lithium (PLL), ensures up to US$70 million of mine CAPEX is secured, with any additional cost shared equally between ALL and PLL. • Early, strategic deployment of funds is required to support the implementation plan. A project cashflow, aligned with the implementation schedule, has been developed to demonstrate the project capital requirements to fund: • engineering design and procurement of long lead capital items. • relocation of existing HV powerlines that traverse the Project site. • carrying out ESIA works, application for environmental permits and developing the RAP requirements and implementation plant. • After ratification of the mining license application, RAP Implementation of Phase 1 resettlement, compensation and livelihood restoration requirements ahead of process plant and mining area development. • Concurrent mine development and construction of processing facilities and infrastructure. • The development of a small scale modular DMS plant ahead of completion of the main process plant, to realise early production of spodumene products for early revenue streams, as well as training of operators and developing coordination between mining and operations departments. The schedule critical path relates to activities and durations associated with completing ESIA and RAP related works scopes to apply for and receive the Environmental Permit. Other key aspects of the schedule development and optimisation include: • Staged earthworks work fronts release to allow for progressive construction works; • Multiple work fronts to facilitate expedited delivery of works; • plant pad for early civil concrete works; • Progressive delivery of fabricated items for construction; and • Early detailed engineering and design to de-risk the construction phase of works. A summary of the key milestones within the implementation schedule are shown in Table 21-1. TABLE 21-1 PROJECT MILESTONES Project Milestone Start Finish Complete FS Jun-23 Process Plant Engineering and Procurement of Vendor Data Award Jul-23 Commence Commercial Negotiations (LLI) Aug-23 Process Plant Procurement Package Award Sep-23 Ghana Presidential and Parliamentary Election Canvasing Commences (12m ahead) Dec-23 Complete EIA and RAP and Submit to EPA Mar-24 Permit Application Process (Opp to expedite) Mar-24

TECHNICAL REPORT SUMMARY EWOYAA LITHIUM PROJECT Page 313 of 368 Environmental Permit Granted (EIA and RAP) (Independent of ML Ratification) Jun-24 Parliamentary Ratification of Mining Lease (Obtain 6 months post ML Application) Jul-24 2024 Wet Season May-24 Sep-24 Earthworks Contractor Mobilisation to Site for Process Plant Construction Sep-24 Phase 1.1 Commence Process Plant Construction (Break Ground) Sep-24 Ghana Presidential and Parliamentary Election Dec-24 First Ore Available Early Production Plant Mar-25 First Product (Early Production plant) Apr-25 Commence Mining for Process Plant feed May-25 2025 Wet Season May-25 Sep-25 Power Feed Line to Process Plant Complete Sep-25 Power On Date Sep-25 First Ore Available Process Plant Oct-25 Process Plant Construction Complete Nov-25 First Ore Through Plant (SC6) Jan-26 First Shipment of Concentrate (SC6) Feb-26 The project development schedule demonstrates a 30-month schedule from FS completion until introduction of first ore into the main process plant in January 2026. The first phase of the schedule involves schedule critical project permitting and approvals works and activities as well as detailed engineering, and placement of long lead equipment orders. Relocation of the 161 kV and 330 kV Transmission lines will also occur ahead of mine development and site construction activities. A 14–15-month construction and commissioning program is expected for the main process plant and infrastructure commencing from the date site access is granted in Q3 2024. This also facilitates key earthworks and civil construction works during the dry season. The mining contractor will also access Mine Services Areas at this time to commence site facilities establishment and mine pre-stripping activities. A smaller modular turnkey processing facility will be delivered to Ewoyaa Lithium project, for early production of spodumene concentrate and secondary product and installed to commence early production from Q1 2025 for a period of 9 months. 21.1.4 Project Execution Model The execution strategy to meet the project objective will be to employ an EPCM methodology, whereby EPCM Contractors will provide the engineering, procurement, construction management and commissioning support services necessary for delivery of the process plant, associated infrastructure and services works scopes. The EPCM approach is commonly employed in mining projects in the region and allows ALL to monitor and control the budget, schedule and quality of the end product through all stages of project development and execution. Other execution approaches (such as EPC / Lump Sum) were considered and subsequently discarded for the overall management, however, may be employed for specific subcontractor packages such as bulk earthworks and HV powerline relocation works. The EPCM basis is that a single organisation (the EPCM Contractor) will provide the EPCM services necessary for the process plant and adjacent infrastructure and services, with the assistance of specialist sub-consultants as required for TECHNICAL REPORT SUMMARY EWOYAA LITHIUM PROJECT Page 314 of 368 the balance of non-process infrastructure. The EPCM contract will include the already executed FEED and future EPCM implementation scopes. The EPCM Contract will include industry standard requirements to meet agreed plant performance standards and targets; e.g., throughput, overall plant availability, etc. Performance testing will form part of the EPCM services delivery to demonstrate the process plant meets agreed design criteria and parameters. Following the award of the EPCM contract, an updated execution plan will be prepared outlining the overall management methodology for the delivery of the Project including all EPCM, ALL Managed activities and commissioning works and handover. The plan will include strategies for all aspects of project management and control across all project implementation functions and phases. ALL will be responsible for managing specific works as outlined in Table 21-2, relying on some assistance from the EPCM Contractor as required. The development methodology for the design and construction of the Project is summarised in the below table, outlining the roles and responsibilities of various stakeholders, contractors and the ALL Project Management Team (also referred to as ALL Project Team). TABLE 21-2 PROJECT DEVELOPMENT RESPONSIBILITIES Function Responsibility Overall Project Execution − Managed by the ALL Team, relying on the various disciplinary skills furnished by the individual consultants and contractors in their field of expertise, as listed below. − The Process Plant EPCM Contractor will support ALL in the overall management of the project development, and ALL will be reliant on them to fill any gaps in the ALL team. Mine Design − ALL Mining Department, supported by expert consultants ESIA − ALL ESG Team supported by experienced Ghanaian and regional environmental and social consultants Metallurgy − ALL consultant metallurgist, working closely with the EPCM Contractor Process Plant − EPCM Contractor with direct experience in the region and hard rock Lithium experience Bulk Earthworks − Engineering by a recognised Engineering company for the process plant − Construction by a suitable contractor − Managed by ALL Project Team IWLTSF, WSD and SCS Design − Engineering by a recognised Engineering company − Construction by a suitable contractor − Managed by ALL Project Team Non-process infrastructure − Design and Construction contractor − Managed by ALL Project Team Mining Infrastructure − Provided by the Mining Contractor − Managed by the ALL Mining Department HV Powerline − Engineering by a recognised engineering company working closely with GRIDCo and in accordance with their standards. − Construction by a suitable contractor approved by GridCo Managed by Powerline Engineering Consultant and owner’s team oversight. TECHNICAL REPORT SUMMARY EWOYAA LITHIUM PROJECT Page 315 of 368 Accommodation (Owner) − Managed by ALL Project Management Team, utilising accommodation available local to the site Construction, Commissioning and Handover − Managed by ALL Project Team − Executed by the EPCM Contractor Following the implementation decision to proceed, the Project is planned to be implemented in seven inter- connected phases: • Setup and Mobilisation • Detailed Design and Procurement • Fabrication • Delivery to Site • Construction • Commissioning and Handover • Project Closeout 21.1.5 EPCM Scope of Services Process Plant Following DTM and a decision to proceed by ALL, the EPCM Contractor would be engaged to execute the Project. The EPCM Contractor will provide the bulk of management resources to supplement the ALL Project Team as required. The EPCM Contractor will be selected from a competitive tender process and based on its ability to progress the completed FEED works into full EPCM execution. The option to select an alternative contractor to the FEED contractor will remain at the discretion of ALL, however could result in schedule delays associated with tome for familiarisation with the project design. The EPCM Contractor reports directly to the ALL Project Manager and will provide EPCM services associated with the development of the process plant and associated infrastructure and services, including the following: • Process engineering; • Design engineering and drafting for earthworks, civil works, structural steel and plate, (plant) electrical instrumentation and control, etc.; • Project management services including cost control, scheduling, reporting, claims processing and document control; • Procurement - including tender enquiry, evaluation, inspection of materials and equipment, expediting and contract administration. Purchasing of equipment will be done by ALL; • Logistics (transport) coordination - including an overview of all aspects of logistics services; • Construction management - including site management, control and inspection of all construction activities and safety management; and • Commissioning - including pre-commissioning and testing, dry commissioning, wet commissioning, operator training and operational assistance until handover. Infrastructure and other Owners Scope The ALL team will manage scopes and works packages outside of and in parallel to the process plant and infrastructure works above, using specialist consultants for engineering design and site-based construction and commissioning support. These work packages include: • site buildings and infrastructure; • IWLTSF, WSD and SCS; TECHNICAL REPORT SUMMARY EWOYAA LITHIUM PROJECT Page 316 of 368 • access roads; and • HV overhead line diversion. The ALL Project Team would be the point of contact for the other consultants and solely responsible for interfacing with the public, communities and government authorities. The EPCM Contractor will identify long lead items as part of the FEED. These items will be ordered in advance to ensure the overall Project timeline is not at risk, subject to funding approval. Powerline relocation and site supply The capital cost estimate assumes the implementation of the HV powerline relocation and site supply powerline works based on an EPCM contracting strategy, using a specialist engineering design consultant and an installation contractor with experience in the region. The Project will draw its power from the Grid for all operations as outlined in Section 15.8. 21.1.6 Project Implementation Project Setup and Mobilisation A Project Team drawn from EPCM staff and reporting to the EPCM Project Manager will be assembled to implement the Project. The EPCM team will comprise sufficient and suitably skilled engineers and project support staff to execute the Project successfully. The EPCM Project Manager will manage the EPCM personnel and report to the ALL management structure through the appointed ALL Project Manager. An ALL Project Team will support the ALL Project Manager. The ALL Project Team and EPCM personnel will work together as one Project Team to ensure relevant interfaces between disciplines are managed to implement the Project successfully. During Project setup, the following will be finalised and approved: • Procurement Operating Procedure; • Project Execution Plan; • Project Quality Plan; • Project Safety Management Plan; and • Project Cost Control Procedure. As outlined in Table 21-2, specialist consultants and contractors will be engaged by ALL under the direct cost budget to provide the following services: • EPCM services associated with the IWLTSF, including the WSD; • Power line solution and overhead powerlines relocation; • Transport and Logistics; • Surveying services during construction; and • Vendor services for construction and commissioning. Detailed Design Development The EPCM Contractor will provide engineering services to design the plant and utilise specifications for the equipment aligned with a “fit for purpose” approach. It is intended that the design function will be carried out at the EPCM Contractor’s offices. Drawings will be stored electronically using EPCM contractor standard electronic systems, cloud storage for drawing review and approval, and a Project SharePoint site, which will serve as the repository for information. All drawings and equipment lists required to complete the construction of the plant will be completed during this phase.

TECHNICAL REPORT SUMMARY EWOYAA LITHIUM PROJECT Page 317 of 368 Engineering calculations will be completed and carried out by the agreed design criteria, standards and good practice. The key deliverables of the detailed design phase are: • Process Flow Diagrams; • Piping and Instrument Diagrams; • Final Mechanical Equipment List; • Functional Specification; • Issued for construction Civil Engineering drawings; • Issued for fabrication Platework drawings / 3D Models; • Issued for fabrication Structural Steel drawings / 3D Model; • Issued for Architectural construction drawings; • Issued for fabrication Piping Isometric drawings; • Issued for construction Mechanical General Arrangement drawings / 3D Model; • Issued for construction Electrical Single Line Diagram; • Final Electrical Load List; • Lighting Drawings; • Instrumentation List; • Control System Architecture; and • Loop diagrams. Procurement During the FEED, a Project Procurement Operating Plan (POP) will be defined, detailing the processes to be followed for the procurement of goods and services by ALL. The EPCM Contractor will work closely with the ALL Project Team to define these processes, which will also be adopted for all other EPCM packages to achieve consistency across the Project. Using the agreed specifications and competitive tendering, the procurement of equipment will commence at the start of this phase. All the packages required to complete the process plant and infrastructure will be listed in the POP, which will serve as a project control for the procurement process. It is intended that the project team will place orders to secure the supply of goods and services for the project using the FIDIC suite of contracts (or acceptable equivalent). Fabrication Mechanical and Electrical Equipment Following the conclusion of contracts with the selected suppliers, fabrication of the equipment required for the project will commence. The project intends only to use proven equipment, and no novel technology is envisioned. Regarding the Project Quality Plan, quality and expediting inspections will be carried out throughout the fabrication process. The vendor’s QA procedures will be used, providing they meet the project's requirements. In addition to the vendor’s QA inspectors, inspection for Quality Assurance and expediting purposes will be carried out by Inspectors in the Project team or a Third-Party Inspector. Steelwork, Platework and Flooring Tenders for the supply and fabrication of the steelwork and platework items will be issued to selected contractors satisfying requirements for majority Ghanaian ownership and with suitable capability and facilities within Ghana. The works scope will include materials supply, shop detailing from the Engineer’s 3D Model, trial assembly, packing and marking for delivery to site. TECHNICAL REPORT SUMMARY EWOYAA LITHIUM PROJECT Page 318 of 368 Following the contract negotiations, the tenderer chosen will be provided with the Issued for Fabrication (IFC) Drawings. Steelwork and platework will be fabricated from the issued drawings in compliance with the design criteria, project specifications and project quality plan. Steel and plate may be alternatively sourced from other sources and issued to the contractor for use. Offsite pre-assembly of conveyor sections in the Takoradi area will be further investigated as an opportunity to minimise site-based installation hours and laydown requirements. The ALL Project Team will provide suitable resources to supervise contractor progress and work quality via regular inspections of contractor works within the contractor’s facility. Rebar Concrete reinforcement will be sourced locally, bent off-site according to the Engineer’s specification and supply schedule and transported to the site for fixing. Piping Piping will be fabricated on the same basis as the steelwork and erected on site by the piping contractor. HDPE and small-bore site run piping would be procured locally. Instrumentation and Control Instrumentation will be purchased per the Project requirements and dispatched to the site for incorporation into the plant. The EPCM’s control system engineers will program the Control PLC and SCADA systems to conform to the requirements of the functional specification and the control system architecture. Shipping and Transportation Equipment fabricated outside of Ghana is planned to be imported through the ports of Tema and Takoradi and transported by road to the site. A route survey of the roads to the site for abnormal loads will be completed during the implementation phase and completed before shipping by the freight agent. However, these are established routes, and it is not envisaged that the Project will require specialist permits for grossly over height or over width loads. ALL will partner with reputable freight and clearing agents with well-established routes and resources across Africa and local capabilities in Ghana. Control of goods receiving on site will be the responsibility of the ALL Project Materials Controller, who will work with the Construction Management Team and the general contractors to manage the materials on site. Construction of Plant and Supporting Infrastructure The EPCM contractor will establish a Construction Management Team to manage and supervise the on-site construction progress, quality of workmanship, safety and environmental compliance of all in-plant works, excluding bulk earthworks and non-processing infrastructure. The EPCM team will be led by a Construction Manager who, along with the assigned construction management team, will be responsible for managing the site and ensuring compliance with the Project safety requirements. The Project team will, through the project construction management structure, manage all site establishment activities for the execution of the Project. Construction will be executed using reputable third-party contractors with experience in the region, with preference showed to Ghanaian companies to perform the work. TECHNICAL REPORT SUMMARY EWOYAA LITHIUM PROJECT Page 319 of 368 The Project Team, including construction management, will, with the input from relevant associated entities, management contractors/consultants and the ALL Project Team, provide constructability and maintainability input in all areas of effort such as plant layout out, construction planning, site establishment activities etc. Discipline Supervisors will assist the Construction Manager in ensuring that the plant is built as per the engineered drawings and specifications in the time allowed by the Project program. Where a contractor requires clarification of the drawings or specifications, this will be provided by the relevant engineer, possibly acting through the supervisor, QC inspector or expeditor. Frequent site inspections by design verification engineers and continuous interaction between the site staff, contractors and engineers during project execution are to assist with this process and ensure the Project is delivered on time to the ascribed quality. Changes to the design are to be approved in accordance with a change management procedure. The EPCM Engineers and Construction Management staff will be accommodated in hotels near the site and rental accommodation, respectively. It is planned that expatriate labour will work on a fly-in / fly-out basis using a rotation cycle aligned with industry norms. The Project will provide vehicles for the ALL Project Team, but all contractors will be self-sufficient in this regard. All vehicles and equipment mobilising to the site will be subject to prior inspection by the HSE manager to ensure it meets acceptable standards of safety and reliability. The project will be aligned with the requirements of the approved ESIA. The Construction Manager will be issued a copy of the ESIA report to ensure compliance with its requirements and correct any possible deviations. Construction management will be guided by the Construction Management Plan, which is to be agreed upon and approved before construction commencement. Cold Commissioning and Hot Commissioning of the plant will be conducted under the control of an appointed Commissioning Manager, after which the plant will be handed over to the Operations Staff to complete the ramp-up of the plant to full production. Refer to the following section for more detail. Plant Commissioning and Handover EPCM Contractors will manage and complete the commissioning of the plant and hand it over to the ALL Project Team for production ramp up once the agreed acceptance requirements are achieved. The commissioning of the plant will include testing the individual pieces of equipment, following which the cold commissioning of sections of the plant can commence. Cold commissioning of the plant will test the plant and its systems using water as a fluid medium and running material handling equipment without load. Hot commissioning of the plant would see the introduction of ore into the plant and the addition of chemical reagents to the process. The plant will then be tested in accordance with the agreed performance criteria. Following hot commissioning, the EPCM project team will ensure: • All punch lists are complete; • Close out of all contracts for the project, ensuring the vendors sign acceptance of full and final settlement; • Return of bonds/guarantees at the end of the defect liability phase; and • A final project close-out report is issued. On handover, the operation and maintenance of the mine will become the responsibility of ALL. The Project Team is to ensure that handover is concluded in such a way as to optimise operability, safety and maintainability. TECHNICAL REPORT SUMMARY EWOYAA LITHIUM PROJECT Page 320 of 368 Project Closeout The Project will be closed out after successful commissioning and handover to operations. The close-out process provides for the following as-built information to be transferred to ALL: • As built drawings, including 3D model; • Piping and instrumentation diagrams; • Electrical drawings; • Instrumentation drawings; • Commissioning data and records; • Requirements for the discharge of bank guarantees and warranty administration; • Project close out report; • Quality records; • Administrative closure documentation; • Contractual close out report; and • Project Retrospective and lessons learned. 21.1.7 Interfaces and Battery Limits The execution will involve interfacing between various stakeholders. Key Stakeholders identified include: • ALL Shareholders; • ALL Management; • Residents of the surrounding towns and villages; • Government of Ghana; • Consultants and contractors engaged on the Project; • GRIDCo and ECG(Ghana); and • Local road authorities. The EPCM Consultants would report to an ALL representative during the implementation of the Project. The Project Manager will be the primary point of contact for the ALL Project Team The ALL Project Team would be the point of contact for integrating the various consultants’ work and would be solely responsible for interfacing with the public and governmental authorities. The proposed strategy is that different EPCM Consultants / Contractors will be appointed to manage the engineering and construction of the following: • Mining design and development; • Bulk infrastructure and mining services; • Process plant design and construction; • Tailings storage facilities design and construction; and • HV power supply and associated works. Following the commissioning of the plant and mining infrastructure, the EPCM Consultants and Contractors will hand over the plant to ALL or the appointed operational contractors. Battery Limits The Plant EPCM Contractor will interface with the various other consultants and ALL with respect to the following battery limits.

TECHNICAL REPORT SUMMARY EWOYAA LITHIUM PROJECT Page 321 of 368 TABLE 21-3 PROJECT BATTERY LIMITS Interface Discipline / Process Stream Battery Limit Mining / Process ROM Feed ROM received at the top of the Primary Crusher Feed Bin ALL / Plant EPCM Water Pump Suction at the wall of the Water Storage Dam ALL / Plant EPCM Tailings (+1mm) The underside of the Tailing Buffer Bin / Top of truck ALL / Plant EPCM Slimes (-1mm) Fence line at IWLTSF ALL/ Plant EPCM Grits Grits Stockpile ALL / Plant EPCM Feldspar Product Product Stockpile All / Plant EPCM Li2O Product Product Stockpile Infrastructure EPCM / Plant EPCM Earthworks Top of Terrace; Retaining Wall at Primary Crusher Infrastructure EPCM / Plant EPCM / Mining Contractor Roads / Haul Roads Top of Terrace; NGL. GRIDCo / EPCM Electrical Power 33kV / 11kV Breaker at Mine Consumer Substation The battery limits reflect the arrangements at the end of the FS and may be updated and revised during project implementation. 21.1.8 Work Breakdown Structure The Project Work Breakdown structure (WBS) defines the Project in terms of activity levels that can be clearly defined, managed and controlled. The WBS will represent the total scope of the Project work, and the way in which the work is to be performed, in a uniform, consistent and logical manner. The WBS is shown in Table 21-4. TABLE 21-4 WORK BREAKDOWN STRUCTURE LEVEL 1 LEVEL 2 LEVEL 3 Description 1000 1000 1000 Site General & Infrastructure 1000 1100 1100 Process Plant Site Development 1000 1100 1110 Bulk Earthworks 1000 1100 1120 Site Drainage Infrastructure 1000 1100 1130 Internal Process Plant Roads 1000 1100 1140 Fencing 1000 1100 1150 Pipe Racks 1000 1200 1200 Tailings and Water Dams 1000 1200 1210 Bulk Earthworks 1000 1200 1220 IWLTSF 1000 1200 1230 WSD 1000 1200 1240 Tailings pipeline and pumping 1000 1200 1250 WSD pipelines and pumping 1000 1300 1300 Non-Process Site Development 1000 1300 1310 Bulk Earthworks 1000 1300 1320 Site Drainage Infrastructure TECHNICAL REPORT SUMMARY EWOYAA LITHIUM PROJECT Page 322 of 368 LEVEL 1 LEVEL 2 LEVEL 3 Description 1000 1300 1330 Sediment Control Structures 1000 1300 1340 Waste Management 1000 1400 1400 Site Roads 1000 1400 1410 Main Access Roads 1000 1400 1410 Secondary roads 1000 1400 1411 Overpass (bridge) 1000 1400 1420 Haul Roads 1000 1400 1440 Fencing 1000 1500 1500 Power Generation/Supply 1000 1500 1510 Power line relocation 1000 1500 1520 Power line from Saltpond to Ewoyaa 1000 1500 1530 Decommissioning of existing power line 1000 1500 1540 Electrical Power Distribution 1000 1600 1600 Site Raw Water Supply 1000 1600 1610 Water Supply Bores 1000 1600 1620 Water Supply Pipeline and pumps 1000 1600 1630 RO plant and pumps and pumps, tanks 1000 1600 1640 Potable water waste system 1000 1700 1700 Reticulation of Services 1000 1700 1710 Electrical Power Distribution (Site) 1000 1700 1720 Water Pipelines 1000 1700 1730 Sewage Pipelines 1000 1800 1800 Site Communications 1000 1800 1810 Communications Towers 1000 1800 1820 Site Wide Fibre Optic Network 1000 1800 1830 Corporate Admin LAN Communications 1000 1800 1840 Process LAN Communications 1000 1800 1850 Site Two-Way Communications 1000 1800 1860 CCTV 1000 1900 1900 Port & Storage 1000 1900 1900 Upgrade Facilities 2000 2000 2000 Mining Costs 2000 2100 2100 Mining Contractor 2000 2100 2110 Contractor Mobilisation 2000 2100 2120 Site establishment 2000 2200 2200 Mining Facilities TECHNICAL REPORT SUMMARY EWOYAA LITHIUM PROJECT Page 323 of 368 LEVEL 1 LEVEL 2 LEVEL 3 Description 2000 2200 2210 Bulk Explosives and Accessories 2000 2200 2220 Fuel Storage & Distribution 2000 2300 2230 Mine Services & Infrastructure 2000 2300 2300 Mining Preproduction 3000 3000 3000 Process Plant - DMS 3000 3100 3100 Rom Feed and Crushing Circuit 3000 3100 3110 Secondary Crushing Circuit 3000 3100 3120 Secondary Crushing Circuit 3000 3100 3140 Tertiary Crusher Screening Circuit 3000 3100 3160 Tertiary Crushing 3000 3100 3180 Ore Storage and Reclaiming 3000 3200 3200 Feed Prep Circuit 3000 3300 3300 DMS Plant 3000 3300 3310 Primary DMS 3000 3300 3320 Feldspar DMS 3000 3300 3340 Secondary DMS 3000 3300 3360 Recrushing DMS 3000 3300 3370 Ultrafines Feed Prep Circuit 3000 3300 3380 Primary Ultrafines 3000 3300 3390 Secondary Ultrafines 3000 3400 3400 Degrit Circuit 3000 3400 3400 Spiral Plant 3000 3500 3500 Thickener and Tails Circuit 3510 3500 3510 Thickener and Tails Circuit 3000 3500 3520 Internal Water Reticulation 3000 3500 3530 Booster Pumps 3000 3600 3600 Middlings Circuit 3000 3600 3620 Product and Tails handling Circuit 3000 3700 3700 Plant Services 3000 3700 3710 Compressed Air 3000 3700 3711 Compressor Building 3000 3700 3720 FeSi And Magnetite Makeup 3000 3700 3730 Floc Make-up 3000 3700 3740 Pipe Racks 3000 3900 3900 Plant Infrastructure 3000 3900 3910 Bulk Earthworks TECHNICAL REPORT SUMMARY EWOYAA LITHIUM PROJECT Page 324 of 368 LEVEL 1 LEVEL 2 LEVEL 3 Description 3000 3900 3920 Water Services 3000 3900 3920 Fire Water 3000 3900 3920 Raw Water 3000 3900 3920 Process Water 3000 3900 3920 Demineralised Water 3000 3900 3920 Potable Water 3000 3900 3920 Wastewater Treatment 3000 3900 3930 Electrical MV Reticulation 3000 3900 3935 OHL To Raw Water Dam 3000 3900 3936 Power line to reservoir pumps 3000 3900 3940 Substations and LV Reticulation 3000 3900 3950 Plant Control Systems 3000 3900 3960 Waste Handling and Sewage Treatment 3000 3900 3970 Workshops 3000 3900 3971 Warehouse 3000 3900 3972 Reagent Storage 3000 3900 3990 Offices, Security and Sundry Building 3000 3900 3991 Admin Office Building 3000 3900 3992 Plant Change Room 3000 3900 3993 Laboratory 3000 3900 3994 Services Building 3000 3900 3995 Clinic 3000 3900 3996 Plant Gate House/ Security 3000 3900 3997 Control Room 4000 4000 4000 Project Indirects 4000 4200 4200 EPCM Project Services 4000 4200 4210 Process Plant EPCM Services 4000 4200 4220 EP Services Process Plant 4000 4200 4230 CM Services Process Plant 4000 4200 4240 Transmission Line EPCM Services 4000 4200 4250 EP Services Power Supply 4000 4200 4260 CM Services Power Supply 4000 4200 4270 Infrastructure EPCM Services 4000 4200 4280 EP Services Infrastructure 4000 4200 4290 CM Services Infrastructure 4000 4300 4300 Construction Personnel Accommodation

TECHNICAL REPORT SUMMARY EWOYAA LITHIUM PROJECT Page 325 of 368 LEVEL 1 LEVEL 2 LEVEL 3 Description 4000 4300 4310 Accommodation 4000 4300 4320 Messing 4000 4300 4330 Flights 4000 4400 4400 Construction Services 4000 4400 4410 Mobilisation - Plant & Equipment 4000 4400 4420 Site Establishment 4000 4400 4430 Site Management 4000 4400 4440 Site Support - Indirects 4000 4400 4450 Demobilisation & Site Clean-up 4000 4400 4460 Site Support - Direct 4000 4400 4470 Plant & Equipment 4000 4400 4480 Tools & Consumables 4000 4500 4500 Other Indirect Site Services 4000 4500 4510 Site Survey 4000 4500 4520 Medical Services 4000 4500 4530 Security Services 4000 4600 4600 Contractors Preliminary & General 4000 4600 4610 Buildings P & Gs 4000 4600 4620 IWLTSF & WSD P & Gs 4000 4600 4630 Earthworks Contractor P&Gs 4000 4600 4640 Civil Contractor P&Gs 4000 4600 4650 SMP Contractor P&Gs 4000 4600 4660 E&I Contractor P&Gs 5000 5000 5000 OWNERS COSTS 5000 5100 5100 Fees And Charges 5000 5100 5110 Permits 5000 5100 5120 Bonds 5000 5100 5130 Duties 5000 5100 5140 Taxes 5000 5100 5150 Tenure 5000 5100 5160 Royalties 5000 5200 5200 Insurance Premiums 5000 5300 5300 Owner's Team 5000 5300 5310 Operations Staffing & Indirects 5000 5300 5320 Project Staffing & Indirects 5000 5300 5330 Owners Indirects (e.g., software) TECHNICAL REPORT SUMMARY EWOYAA LITHIUM PROJECT Page 326 of 368 LEVEL 1 LEVEL 2 LEVEL 3 Description 5000 5300 5340 Travel & Off-Site Accommodation 5000 5300 5350 Training 5000 5400 5400 Consultants 5000 5400 5410 Technical Specialists 5000 5400 5420 Legal 5000 5400 5430 Community Relations 5000 5400 5440 Environmental 5000 5500 5500 Future Capital 5000 5500 5510 Sustaining Capital 5000 5500 5520 Working Capital 5000 5500 5530 Deferred Capital 5000 5500 5540 Closure Capital 5000 5600 5600 Pre-production Costs 5000 5600 5610 First Fills & Opening Stocks 5000 5600 5620 Spares 5000 5600 5630 Vendor Commissioning 5000 5600 5640 Mobile Equipment 5000 5600 5650 First Aid & Medical Equipment 5000 5700 5700 Construction Personnel Accommodation 5000 5700 5710 Owners Team 5000 5700 5720 EPCM Accommodation 5000 5700 5730 EPCM Travel 5000 5800 5800 Environmental, Social & Community 5000 5800 5810 ESG Costs 6000 6000 6000 Modular Plant - DMS 6000 6100 6100 Crushing Circuit 6000 6200 6200 DMS Plant 9000 9000 9000 Provisions 9000 9100 9100 Growth Allowance 9000 9200 9200 Forex 9000 9300 9300 Escalation / Inflation per annum 9000 9400 9400 Management Reserve 9000 9500 9500 Risk 9000 9900 9900 Contingency In order to achieve uniformity, to enable meaningful project monitoring and reporting and to facilitate communication among Project team members, the same basic structure will be used for all facets of the Project. This includes definition of work, cost estimates, budget allocation, cost monitoring and control, change management, time TECHNICAL REPORT SUMMARY EWOYAA LITHIUM PROJECT Page 327 of 368 estimates, planning and scheduling, resource allocation, productivity, progress measurement and earned value management. The WBS will also facilitate efficient electronic migration of data between cost estimates, cost control budgets, project cost forecasts, project schedules and progress measurement, and the corresponding management reports developed from this data. 21.1.9 Project Organisation and Responsibilities ALL will assemble a Project Management team. The team will comprise sufficient and suitably skilled engineers and project support staff to execute the project successfully. The Project Manager will lead the team, with key resources reporting directly to the CEO. The Country Manager will ensure compliance with the required legislation in Ghana. Indicative organisational charts have been developed, encompassing all phases of Project execution: • Engineering / Design and Project Management; • Construction; and • Commissioning. FIGURE 21-1 PROJECT ORGANISATIONAL STRUCTURE – ENGINEERING AND PROCUREMENT TECHNICAL REPORT SUMMARY EWOYAA LITHIUM PROJECT Page 328 of 368 FIGURE 21-2 PROJECT ORGANISATIONAL STRUCTURE –CONSTRUCTION FIGURE 21-3 PROJECT ORGANISATIONAL STRUCTURE –COMMISSIONING

TECHNICAL REPORT SUMMARY EWOYAA LITHIUM PROJECT Page 329 of 368 21.1.10 Project Team Following the positive outcome from the FS and associated deliverables including a final capital cost estimate, a decision to implement the Project can be concluded (DTM). A Project Team drawn from EPCM staff and reporting to an EPCM Project Manager will be intended to implement the Project. The EPCM team will comprise sufficient and suitably skilled engineers and project support staff to execute the project successfully. The EPCM Project Manager will manage the EPCM personnel and report to the ALL management structure through the appointed ALL Project Manager. The ALL Project Manager will be supported by an ALL Project Team staffed to meet project objectives. The ALL Project Team and EPCM personnel are to work together as one Project Team to implement and deliver the Project successfully. The EPCM Contractor will establish a Construction Management Team on-site to manage and supervise the construction progress, quality of workmanship, safety and environmental compliance. The site team will be led by a Construction Manager who, along with the assigned construction management team, will be responsible for the management of the site and ensuring compliance with the Project Safety requirements. The Project Team will, through the project construction management structure, manage all site establishment activities for the execution of the Project. Construction will be executed using third-party Ghanaian contractors to perform the work, as all the required skills are already well established in Ghana. 21.1.11 Procurement and Contracts Main Contracts The Project will place several main contracts for the construction of works on site, namely contracts for: • Construction of civil engineering works, including plant, IWLTSF, WSD and access roads; • Fabrication of steelwork and platework; • The Erection of steelwork and platework and installation of mechanical equipment (SMP); • Fabrication and erection of piping; and • Installation of the electrical, instrumentation and controls equipment (EIC). The scope of work for these contracts will be split among several contractors depending on the team’s assessment of the contractor’s capacity. Mechanical and electrical equipment purchased for installation into the works will be free issued to the SMP and EIC contractors for them to include in the results. If brickwork is utilised as a method of construction, contracts for the construction of brick buildings will be concluded with local companies, the scope assigned will depend on an assessment of the contractor’s capacity. Under local content legislative requirements, majority Ghanian owned contractors will be identified and awarded works scopes for Steel, Mechanical, Platework, Piping and Electrical supply, fabrication and erection contracts. The study assumes that the civil engineering works, including the supply of cement and rebar, will also be constructed by local contractors. Supply Contracts The EPCM will purchase mechanical and electrical equipment on behalf of the ALL on terms which ALL will provide the EPCM Engineer. The equipment supply will be tendered to the agreed vendors based on competitive tendering. Instrumentation and minor components of a standardised nature will be procured by the EPCM on behalf of the ALL, ALL will place the order on all vendors, using the agreed short form of contract or on the supplier terms if acceptable. Supply Contractors will deliver the goods to a designated warehouse for consolidation and shipping to Ghana. TECHNICAL REPORT SUMMARY EWOYAA LITHIUM PROJECT Page 330 of 368 Transport and Logistics A logistics contractor (freight forwarder) with local and international representation will be engaged and managed by the EPCM Contractor specifically for the Project. Local goods purchased in Ghana will be loaded ex-works and transported by road to the site. Imported equipment and materials will be containerised and transported by liner services to either the port of Tema or Takoradi. The logistics contractor will arrange for customs clearances, storage, consolidation, and road transport to site. All equipment and materials will be stored on-site in laydown areas or the plant warehouse prior to installation. Erection contractors will be responsible for offloading and rehandling. Construction Management and Commissioning Plan Process Plant The EPCM will manage and complete the commissioning of the plant and hand over to ALL Operations Team for Production Ramp up once the agreed acceptance requirements are achieved. The commissioning of the plant will include the testing of the individual pieces of equipment, following which the cold commissioning of sections of the plant can commence. Cold Commissioning of the plant will be the testing of the plant and its systems using water as a fluid medium and running material handling equipment without load. Hot commissioning of the plant would see the introduction of ore into the plant and the addition of chemical reagents to the process. The plant will then be tested in accordance with the agreed performance criteria. Operational Readiness ALL will be responsible for developing and implementing operational readiness plans, procedures and documentation to ensure efficient plant ramp up. The Engineer will supervise initial commissioning runs to prove that the plant performs in accordance with the specified design / performance criteria and to provide such additional supervision and expertise as is required to rectify any defects and thereby to enable the plant to operate at its specified parameters. The Operational Readiness Plan will be drafted in the next phase of development by ALL. Cost allowances have been made in the capital cost estimate for ALL to engage suitable consultants to assist with developing operational readiness activities and documentation. 21.1.12 Project Closeout Following hot commissioning, the EPCM project team will ensure: • All punch lists are complete; • Close-out of all contracts for the project, ensuring the vendor’s sign acceptance of full and final settlement; • Return of bonds/guarantees at the end of the defect liability phase; and • A final project close-out report is issued. On handover, the operation and maintenance of the mine will become the responsibility of ALL. The Project team is to ensure that handover is done in such a way as to optimise operability, safety and maintainability, and in alignment with the ALL-operational readiness plan. TECHNICAL REPORT SUMMARY EWOYAA LITHIUM PROJECT Page 331 of 368 21.2 ORGANISATION 21.2.1 Introduction Unlike the many gold projects in Ghana, the ELP is located close to the coast in a semi-urban location. Therefore, the Project will not need to be as self-sufficient as would be the case in a remote location. It is expected that the local Ghanaian workforce will have previous mining and plant operation experience, likely from similar sized gold operations in the region, however ELP is likely to be the first lithium production operation in the country. The operation will seek to predominantly employ a core group of experienced Ghanaian management and supervision, supplemented by a small number of expatriates with specific expertise in lithium production which will be critical for the initial training and management of the operation. A contractor mining strategy will be employed, providing opportunity to the various Ghanaian companies successfully operating in this field. As a result, ALL’s focus will be on the process plant and infrastructure. A small ALL expatriate team of nominal seven senior personnel has been included for start-up, commissioning, operational readiness and establishment of steady- state production. The expatriates are expected to remain with the operation for one to three years, after which time it is anticipated that the operation will employ 100% Ghanaian personnel, with the possible exception of some senior contract mining management. Ghanaian plant operating personnel will be provided with pre-operations training from experienced expatriates to become familiar with DMS operating procedures and problem-solving techniques in advanced stages of commissioning. This will be followed by on-the-job experience operating the plant during testing, commissioning and ramp-up to nameplate production rates. Economic development will be encouraged within the local community and the region in general. Local contracts will be let where possible, and ALL will work actively with existing and emerging companies in Ghana to achieve this aim. 21.2.2 Manning Buildup & Basis The operations management together with the key local personnel will identify and employ all required personnel in conjunction with initiating training programmes. The operations team labour list is provided in Table 21-5. The key personnel will be employed sufficiently early to enable their involvement in the development of operating and training programmes and procedures. All other personnel will be employed early enough to allow completion of initial training prior to commissioning. Preproduction employment will depend on whether the positions are required for preproduction operation. Labour allocations have been made considering the likelihood of preproduction processing occurring. TABLE 21-5 ATLANTIC LITHIUM OPERATIONS LABOUR LIST Role Department Subdepartment Positions Home Base Accommodation Process Manager Processing Processing 1 SA Resort Plant Production Administrator Processing Plant Production 1 Ghana Local Metallurgy Superintendent Processing Metallurgy 1 Ghana Local Senior Metallurgist Processing Metallurgy 1 Ghana Local Plant Metallurgist Processing Metallurgy 4 Ghana Local Metallurgical Technicians Processing Metallurgy 4 Ghana Local Production Superintendent Processing Plant Production 1 Ghana Local Plant Production Training Officer Processing Plant Production 1 Ghana Local TECHNICAL REPORT SUMMARY EWOYAA LITHIUM PROJECT Page 332 of 368 Role Department Subdepartment Positions Home Base Accommodation Plant Production Training Officer Assistant Processing Plant Production 1 Ghana Local Shift Supervisor Processing Plant Production 4 Ghana Local Process 2IC Processing Plant Production 4 Ghana Local Control Room Operator Processing Plant Production 4 Ghana Local Crushing Operator Processing Plant Production 12 Ghana Local DMS Operator Processing Plant Production 16 Ghana Local Water & Tailings Operator Processing Plant Production 4 Ghana Local Thickening & Services Operator Processing Plant Production 4 Ghana Local Operator Technicians Processing Plant Production 16 Ghana Local Shipping Coordinator Processing Shipping 1 Ghana Local Shipping Officer Processing Shipping 2 Ghana Local Maintenance Superintendent Processing Maintenance 1 Ghana Local Maintenance Training Officer Processing Maintenance 1 Ghana Local Plant Maintenance Planner Processing Maintenance 2 Ghana Local Plant Maintenance Administrator Processing Maintenance 1 Ghana Local Mechanical Reliability Engineer Processing Maintenance 1 Ghana Local Electrical Engineer Processing Maintenance 1 Ghana Local Mechanical Coordinator Processing Maintenance 1 Ghana Local Mechanical Leading Hand Processing Maintenance 1 Ghana Local Fitters Processing Maintenance 4 Ghana Local Boilermakers Processing Maintenance 2 Ghana Local Mechanical Trades Assistants Processing Maintenance 6 Ghana Local Mechanical Apprentice Processing Maintenance 2 Ghana Local Electrical Coordinator Processing Maintenance 1 Ghana Local Electrical Leading Hand Processing Maintenance 1 Ghana Local Electrical Technician Processing Maintenance 4 Ghana Local Instrument Technician Processing Maintenance 4 Ghana Local Electrical Trades Assistant Processing Maintenance 4 Ghana Local Electrical Apprentice Processing Maintenance 2 Ghana Local Crane Driver Processing Maintenance 1 Ghana Local Technical Services Manager Tech Services Tech Services 1 SA Resort Geometallurgist Tech Services Tech Services 1 Ghana Local Mining Manager Mining Mining 1 SA Resort Mining Superintendent Mining Mining 1 SA Resort Geology Superintendent Mining Mining 1 Ghana Local

TECHNICAL REPORT SUMMARY EWOYAA LITHIUM PROJECT Page 333 of 368 Role Department Subdepartment Positions Home Base Accommodation Mining Administrator Mining Mining 1 Ghana Local Senior Planning Engineer Mining Mine Planning 1 Ghana Local Planning Engineer Mining Mine Planning 3 Ghana Local Mine Surveyor Mining Mine Planning 2 Ghana Local Surveyor Assistants Mining Mine Planning 4 Ghana Local Production Superintendent Mining Mine Operations 1 Ghana Local Production Engineer Mining Mine Operations 2 Ghana Local Pit Supervisor Mining Mine Operations 4 Ghana Local Drill & Blast Specialist Mining Mine Operations 1 SA Resort Drill & Blast Compliance Officer Mining Mine Operations 2 Ghana Local Senior Resource Geologist Mining Geology 1 Ghana Local Senior Mine Geologist Mining Geology 1 Ghana Local Mine Geologist Mining Geology 2 Ghana Local Pit Technician Mining Geology 4 Ghana Local GM Operations / Registered Manager Management Management 1 AUS Resort Personal Assistant Management Management 1 Ghana Local Admin Secretary Admin Admin 1 Ghana Local Driver/Courier Admin Admin 2 Ghana Local Administration Manager Admin Admin 1 Ghana Local Financial Coordinator Admin Finance 1 Ghana Local Senior Accountant Admin Finance 1 Ghana Local Accounts Clerk Admin Finance 1 Ghana Local Payroll Clerk Admin Finance 1 Ghana Local Accountant Admin Finance 1 Ghana Local Operational Technology Coordinator Admin Operational Technology 1 Ghana Local IT Officer Admin Operational Technology 2 Ghana Local Administration Coordinator Admin Administration Services 1 Ghana Local Camp Chef Admin Administration Services 1 Ghana Local Camp Cooks Admin Administration Services 2 Ghana Local Camp Wait Staff/Kitchen Hand Admin Administration Services 2 Ghana Local Camp Cleaning/Laundry Crew Admin Administration Services 2 Ghana Local TECHNICAL REPORT SUMMARY EWOYAA LITHIUM PROJECT Page 334 of 368 Role Department Subdepartment Positions Home Base Accommodation Site Cleaners Admin Administration Services 3 Ghana Local Bus Drivers Admin Administration Services 8 Ghana Local Senior HR Officer Admin Human Resources 1 Ghana Local HR Officer Admin Human Resources 1 Ghana Local HR Clerk Admin Human Resources 3 Ghana Local Supply and Logistics Coordinator Admin Supply & Logistics 1 Ghana Local Purchasing Officer Admin Supply & Logistics 2 Ghana Local Expeditor Clerk Admin Supply & Logistics 1 Ghana Local Storeman Admin Supply & Logistics 1 Ghana Local Warehouse Labour Admin Supply & Logistics 8 Ghana Local OH&S & Security Manager OHS OHS 1 Ghana Local OH&S Coordinator OHS OHS 1 Ghana Local OH&S Trainer OHS OHS 1 Ghana Local Health & Safety Officers OHS OHS 4 Ghana Local Security Supervisor OHS OHS 1 Ghana Local Environmental & Social Manager Environment & Social Environment & Social 1 AUS Resort Environmental Superintendent Environment & Social Environment 1 Ghana Local Social Performance Superintendent Environment & Social Social 1 Ghana Local Database and Mapping Specialist Environment & Social Social 1 Ghana Local Data Entry Officer Environment & Social Social 1 Ghana Local Administrative and Logistics Coordinator Environment & Social Social 1 Ghana Local Community and Livelihood Restoration Supervisor Environment & Social Social 1 Ghana Local Community Development and Livelihoods Officer Environment & Social Social 1 Ghana Local Senior Community Relations Officer Environment & Social Social 1 Ghana Local Community Relations Officer Environment & Social Social 1 Ghana Local Complaints & Grievance Officer Environment & Social Social 1 Ghana Local TECHNICAL REPORT SUMMARY EWOYAA LITHIUM PROJECT Page 335 of 368 Role Department Subdepartment Positions Home Base Accommodation Environmental Monitoring Officer Environment & Social Environment 4 Ghana Local Senior Land Access and Resettlement Officer Environment & Social Social 1 Ghana Local Land Access and Resettlement Officer Environment & Social Social 1 Ghana Local Community Guides Environment & Social Social 2 Ghana Local Field Support Staff Environment & Social Social 2 Ghana Local TOTAL LABOUR 236 Recruitment Recruitment of personnel required by the operation will be initiated in adequate time to meet the manning build-up schedule. Each position will be advertised locally and will include a full job description and the necessary qualifications. Applicants will be screened to ensure that they have the required experience and capabilities and will follow pre- employment policy procedures to ensure that the best-fit person is selected for each position. Priority will be given to applicants from local towns and villages near the mine site. It has been assumed that certain posts requiring specific skills or experience will be filled initially by expatriates. In addition to performing their job function, expatriate personnel will transfer knowledge and expertise to develop the capabilities of the local staff and support the long-term ALL objective of a 100% Ghanaian workforce within three years of startup. Staff Staff have been divided into five categories based on their skill level and place of residence. • Expatriate (Overseas and African) management and senior technical staff who will live in company provided camp accommodation and will fly into Accra. • Local management who will live in local towns and villages and will drive to site. • Local shift senior staff who will live in local towns and villages. • Local worker staff who will live in the local towns and villages and bus to site, working day and continuous shift roles. • Local day and continuous shift junior staff who will live in the local towns and villages. It is expected the local management and senior staff will be recruited from Accra or other regional centres and staff will relocate for work or commute on time off. All local staff have a 20% of base salary rental allowance included as part of their salary package to assist with local accommodation expenses. Expatriate Overseas Expatriate and senior staff personnel will be recruited from their home base (likely to be Australia, UK, or North America) on a fly in/fly out basis. Personnel will be rostered five weeks on, two weeks off and will work both day and continuous shift rosters depending on their job requirements. Expatriate staff will live in company provided accommodation and be bussed to and from the site. TECHNICAL REPORT SUMMARY EWOYAA LITHIUM PROJECT Page 336 of 368 These personnel will fly in and out of Ghana from their home base and will be bussed to and from the site at the beginning and end of their roster from the international airport at Accra. Return flights to their home base will be provided during the rostered off time. Expatriate Africa As with expatriate overseas senior staff, expatriate African staff will be recruited from their home base in Africa (likely to be South Africa or neighbouring West African countries) on a fly in/fly out basis. Expatriate staff will live in company provided camp accommodation and be bussed to and from the site. These personnel will fly in and out of Ghana from their home base and will be bussed to and from the camp at the beginning and end of their roster from the international airport at Accra. Return flights to their home base will be provided during the rostered off time. Local Management and Non-Shift Senior Staff Local management and senior staff will be recruited from towns and cities throughout Ghana. These personnel will source their own accommodation in local towns and villages during their rostered-on time. Local Junior Staff Local junior staff will be recruited from local villages and will work both day and continuous shift rosters depending on their job requirements. Junior staff will source their own accommodation in the local villages. Local Worker Local workers will be recruited from local villages and will work both day and continuous shift rosters depending on their job requirements. Worker staff will source their own accommodation in the local villages. 21.2.3 Work Rosters The plant will operate continuously (24 hours per day, seven days per week). In developing the work rosters, consideration has been given to the time that workers will spend travelling to and from their homes in the surrounding villages. The work rosters have been divided into four types, as summarised in Table 21-6 with further explanations in the sub-sections that follow. TABLE 21-6 SUMMARY OF ROSTERS Roster # 1 2 3 4 Roster Details 5 weeks on, 2 off (6 days per week) 4 weeks A/L 6-day week 1 long W/E per month 4 weeks A/L 3 weeks on, 1 off 4 weeks A/L 4 panel roster, 3 weeks on, 1 off 4 weeks A/L Cycles per Year 7.4 13 13 13 Hours per Cycle 171 168 168 168 Hours per Year 2,229 2,184 2,184 2,184 Roster 1 – Expat Roster Personnel will be rostered five weeks on, two weeks off. This will consist of 6 days on 1 day off for the five weeks on site. The expectation is most expats will be dayshift only and work 10-12 hours a day. Roster 2 – Ghanaian Local The expectation is that Ghanaian Management and senior technical personnel will work a dayshift only roster. Personnel will be rostered six days on, one day off, with one 4-day long weekend off per month. This roster is designed for maximum coverage and suited for employees originally from the local Ewoyaa surrounds.

TECHNICAL REPORT SUMMARY EWOYAA LITHIUM PROJECT Page 337 of 368 Roster 3 – Ghanaian Non-Local This roster is a variation of Roster 2 and is used interchangeably. This roster is ‘3 weeks on, 1 week off’ roster, and is more suited to Ghanaians who have relocated from outside the Ewoyaa vicinity, to allow them a 1-week window to return to their home base between swings. Roster 4 - Continuous Shift Roster Four crews (panels) will be required to cover continuous operation positions. Continuous shift staff will work an 8-hour shift. The slow rotating schedule uses four teams and three 8-hour shifts to provide 24/7 coverage. Each team rotates through the following sequence every 28 days: 7-dayshifts, followed by 24 hours off; 7 swing shifts followed by 24 hours off; 7 nightshifts followed by 7 days off. The roster effectively provides a ‘3 weeks on, and 1 week off’ arrangement so non-locals can return to their home base for a 7-day period between their final nightshift and first dayshift. Senior and junior staff will work the continuous shift roster. A number of relief staff will be included in the continuous shift crews to cover absenteeism arising from training, annual leave, sick leave or other reasons. Roster Remarks Dayshift staff will work dayshifts only. Production critical staff will work the continuous shift roster. Additionally, an overtime allowance has been included in labour costs for all Ghanaian positions. The allowance is equivalent of working 10-hour days instead of 8-hour days, across 80% of the working days. Travel & Bussing ALL will not operate a bus service to transport staff between the site and local villages. A travel subsidy is included in the travel allowance as part of the labour cost, for daily travel to site. By not purchasing and operating buses it allows an opportunity for local entrepreneurs and already established businesses to provide transport as a service and keep jobs in the local communities. 21.2.4 Training and Development Pre-Employment Procedures A structured recruitment procedure will be adopted to ensure prospective employees are suitable for appropriate employment. Inductions All new personnel will be integrated into the organisation in a logical and coordinated manner to ensure they are aware of both their own and the operating company's responsibilities and values. Inductions will be performed for the following areas: • General Site Induction; • Admin & Support Services; • Mining (including ROM); • Tailings Area; • Process Plant Area; • Maintenance Area; • Stores Area; and • Port Area. TECHNICAL REPORT SUMMARY EWOYAA LITHIUM PROJECT Page 338 of 368 Training Strategy The beneficial impact that a well-trained operating crew can have on the safety and economics of a project is recognised and, as such, a structured training programme will be established which will address all aspects of the operation: • General principles for stages and unit processes; • Standard operating procedures; • Safe work procedures; • Emergency procedures; • First aid training; • Confined space & working at heights training; • Emergency response training; • Leadership training; • Health and nutrition training; and • Environmental and social policies. Training will commence in advance of commissioning and will form part of ongoing operations. Training will take place both in the classroom and in a hands-on manner, to ensure theory is reinforced by practical application. Training will be carried out by persons experienced in training staff in mining and plant operations and maintenance. There will also be opportunity for some of the plant operations team to have hands on experience in operating and learning to operate a DMS plant during the preproduction period. The vendor will supply operational labour for 3 months which will allow ALL staff to get familiar with the equipment at a smaller scale. In the process plant, senior technical staff will run training sessions that cover the theory of the operations as well as safe work procedures and plant operating methods. 21.2.5 Health and Safety Implementation of Safety Policy All employees will be provided with a safe and healthy workplace environment. To achieve this policy, the following objectives have been set: • Ensure compliance with statutory regulations and maintain active awareness of new and changing regulations; • Aim to eliminate or control safety and health hazards in the working environment to achieve the highest possible standards for occupational safety in the mining industry; • Ensure prospective employees’ suitability for appropriate employment through a structured recruitment procedure; • Provide relevant occupational health and safety information and training to all personnel; • Develop and constantly review safe work practices and job training; • Conduct regular departmental safety meetings and provide an open forum for input from employees; • Provide effective emergency arrangements for the protection of employees and the public; • Proactively pursue good morale and safety awareness through regular employee interface, assessment and counselling; • Ensure contracting companies while engaged in work on site adopt this policy and objectives and maintain the safety standards of the operation for their employees and sub-contractors; and • Develop public awareness of the safety standards and objectives at ELP. In conjunction with this policy, a series of policy statements on specific individual safety and health matters will be maintained covering the following areas. TECHNICAL REPORT SUMMARY EWOYAA LITHIUM PROJECT Page 339 of 368 Language and Communication Misunderstanding arising from language difficulties has been considered and as such, employees will be encouraged to speak and read English, particularly for OH&S requirements. Since it is unlikely that any of the expatriates will be competent in local languages, recruitment of senior staff will be strategic to provide multilingual personnel are deployed on each shift. In addition, safety training curricula will include an emphasis on communication across language barriers to ensure clear understanding, especially relating to safety issues and stakeholder engagement. Industrial Relations Wherever possible, a multi-skilling approach to operations and maintenance will be adopted. All applicable industrial relations laws will be adhered to. Rates of pay will include all applicable statutory allowances such as overtime, leave, accommodation, education, compensation insurance, health insurance, etc. Because of the number of people living in relatively close proximity to the operations area, maintenance of good relations with the local community will be an important aspect of the operations. For this reason, a community relations department is proposed with ten full-time community relations personnel who will report to the environment and community relations manager. This department’s tasks will include assisting local businesses to supply services and fresh produce to the mining operations. 21.2.6 Inventories & Logistics The site is located in a semi-urban area adjacent to a major highway and there is extensive in-country support for vehicles or equipment. The major ports of Takoradi and Tema are within a day’s drive from the site via paved roads. It is envisaged that light vehicle maintenance and supply of industrial parts can be serviced locally. Major and specialist mining and plant equipment spares will need to be sourced from overseas, but the operation intends to make full use of local availability where possible. Catastrophic failure of a major part cannot be provided for by normal spare parts inventory. Such failures may be handled by a temporary repair if possible while urgent measures are taken to obtain replacement parts. The proposed design allows for the bypass of most mechanical equipment and warehouse spares to minimise the potential for downtime from failures. Equipment suppliers will assist in identifying critical equipment parts to be included in the start-up spares inventory. As a general practice, an important consideration in the selection of, and negotiations with, equipment suppliers will be their ability to supply minor spare parts and consumables on a consignment basis. Allowance has been made in the capital cost estimate to purchase critical spares holdings as well as the initial stocks of wear parts, reagents and consumables. These are generally based on 90 days stocks or the normal transport quantity fitting in a container. The stocks will gradually be built up following handover using working capital if consignment stocks cannot be contracted. Warehousing and inventory control will adopt systems that have previously been installed in similar locations to ensure that records are kept of warehouse stocks and that replacements are ordered in sufficient time to ensure delivery well before they are required. 21.2.7 Organisational Structure The overall structure of the operations will be as outlined in Figure 21-4. The entire operations workforce will be under the control of a general manager who will be supported by six main departments each with a manager heading the department: • Mining; TECHNICAL REPORT SUMMARY EWOYAA LITHIUM PROJECT Page 340 of 368 • Technical Services; • Processing; • Health Safety & Security; • Administration; and • Environment and Social. Mining Department The mining department is responsible for overseeing mining activities and the mining contractor, with the structure shown in Figure 21-6. The mining department is split into smaller sub departments: A contract mining company will be used to mine the pits and conduct equipment maintenance. The mining contractor will also maintain haul roads and feed ore to the processing plant. The mining manager will be responsible for the department and will be assisted by the Mining Superintendent, Production Superintendent and Geology Superintendent. Exploration Department The exploration department will be a function of the group office, working across all of Atlantic’s exploration projects and with the Exploration Manager reporting directly to the COO. As a result, an exploration department has not been included in the Ewoyaa organisation structure. Technical Services Department The technical services department is responsible for bridging the mining and processing departments and working on geometallurgical outcomes to optimise both mining and processing. The team structure is shown in Figure 21-6alongside the mining structure. Process Department The process department is responsible for the day-to-day operation of the processing plant to ensure both budgeted throughput tonnage and concentrate production are achieved. The Process department consists of the following subdepartments, and the Processing team structure is shown in Figure 21-7. • Metallurgy; • Shipping; • Plant Production; • Maintenance; and • Contract Analytical Laboratory. The process manager will be responsible for the department and will be assisted operationally by the Plant Production Superintendent, Metallurgy Superintendent and the Maintenance Superintendent. The Plant Production and Metallurgy Superintendent will co-ordinate the activities of the processing plant and analytical laboratory. Included in Plant Production are the process plant ancillary circuit operations; tailings management, water services, plant maintenance. It is expected that operators will be trained and competent to operate the processing plant as well, and there will be personnel rotation through all areas of the processing plant and supporting services to ensure the operator crews have comprehensive understanding of the processing area. Reporting to the Metallurgy Superintendent is a shipping team who organise bulk loading and export of material from site and port and liaise with the logistics and haulage company and port authority.

TECHNICAL REPORT SUMMARY EWOYAA LITHIUM PROJECT Page 341 of 368 Plant maintenance and planning will be carried out by the plant maintenance team. The maintenance team will be responsible for maintaining the equipment on site in safe and good working order and will implement maintenance planning procedures including preventative maintenance. The maintenance department staffing levels will be deployed to handle most repairs and rebuild tasks; however, for major tasks additional resources may be required. Maintenance costs include for engaging suitable contractors or employing additional casual labour to work under the direction of maintenance supervisors for major repairs. Ongoing training of plant and maintenance personnel will be carried out by process and maintenance training officers to ensure continual improvement in operator skill and safety levels. Administration Department Administration functions will be provided by the following subdepartments: • Finance and Accounting; • Human Relations; • Operational Technology; • Supply & Logistics; and • Administration. The finance and accounting functions will include payroll and accounts. The HR team will be responsible for all human resources, employee relations and personnel activities including recruitment, relocation, and education. The Operational Technology team will address information technology (IT), communications, and process control systems and support. The Supply and Logistics team will be responsible for all supply and logistics functions including purchasing and inventory control of plant consumables and warehousing. Administration will look after camp, site transport, travel, and cleaning. The administration manager will be responsible to the general manager for all the above functions. The structure of the administration department is shown in Figure 21-8. Health Safety & Security The HS&S department structure is shown in Figure 21-9. The HS&S department will be responsible for all aspects of health and safety including supply of on-site medical first-aid (including access to a doctor), emergency medical response requirements, OH&S training, and inductions. The medical and first aid services will be contracted to a medical services provider during construction and continue in operation. The security responsibility will be contracted to a local security service contractor. The contractor is responsible for the loss control and security for the Project. Within the Mining License area, security functions will include supervision of all security equipment including cameras, sensors and other instruments and control of entry to the site. The security team will also provide background checks for all employees and contractors as required and assess risks and threats in the local area through gathering of local intelligence. A Security Management Plan will be prepared as part of the project’s Operational Readiness. The Health Safety & Security Manager is responsible for the above functions. Environment and Social Department The structure of the Environment and Social department is shown in Figure 21-10. The Environment and Social manager will have responsibility for all aspects of relations with the local community, as well as the environment. TECHNICAL REPORT SUMMARY EWOYAA LITHIUM PROJECT Page 342 of 368 A Social Performance Superintendent will be appointed who is familiar with the region and local customs to ensure that the impact of the project on the local community is managed in such a way as to gain maximum support. The Social Performance Superintendent will be supported by a team of community relations officers, specialists and clerical staff. The Environmental Superintendent will control all matters relating to the environment and reporting requirements. General labourers will be employed as required to assist with environmental tasks. TECHNICAL REPORT SUMMARY EWOYAA LITHIUM PROJECT Page 343 of 368 FIGURE 21-4 OVERALL ATLANTIC ORGANISATIONAL STRUCTURE TECHNICAL REPORT SUMMARY EWOYAA LITHIUM PROJECT Page 344 of 368 FIGURE 21-5 MANAGEMENT STRUCTURE FIGURE 21-6 MINING AND TECHNICAL SERVICES DEPARTMENTS

TECHNICAL REPORT SUMMARY EWOYAA LITHIUM PROJECT Page 345 of 368 FIGURE 21-7 PROCESSING DEPARTMENT TECHNICAL REPORT SUMMARY EWOYAA LITHIUM PROJECT Page 346 of 368 FIGURE 21-8 ADMINISTRATION DEPARTMENT TECHNICAL REPORT SUMMARY EWOYAA LITHIUM PROJECT Page 347 of 368 FIGURE 21-9 HEALTH SAFETY & SECURITY DEPARTMENT FIGURE 21-10 ENVIRONMENT AND SOCIAL DEPARTMENT TECHNICAL REPORT SUMMARY EWOYAA LITHIUM PROJECT Page 348 of 368 FIGURE 21-11 CONTRACTOR ORGANISATIONAL CHART

TECHNICAL REPORT SUMMARY EWOYAA LITHIUM PROJECT Page 349 of 368 22.0 INTERPRETATION AND CONCLUSIONS The project supports conventional and proven open pit mining and spodumene concentration technology. The spodumene bearing ore will be extracted from open pits with drill and blast and load and haul mining methods. Open pit waste rock will be disposed of in waste dumps, that incorporate an integrated tailings storage facility for process plant tailings. The project investment will provide positive social, economic and material supply strategic impacts locally and nationally, including job creations, training, procurement and business opportunity throughout the region, from construction through operations. 22.1 MINERAL RESOURCE Sufficient data have been obtained through various exploration and sampling programs to support the geological interpretations of the lithium-bearing pegmatite deposit on the Property. The data are of sufficient quantity and reliability to reasonably support the resource estimates in this TRS. The geology of the Project area and controls to mineralisation are well-understood. Exploration techniques employed on the Project are appropriate and data derived from them are of sufficient quality to support the modelling of Mineral Resources in accordance with the JORC Code. Based on an assessment of available QA/QC data, the entire lithium and whole-rock drill core assay dataset is acceptable for resource estimation with assaying posing minimal risk to the overall confidence level of the MRE. Sufficient data are available to generate reliable mineral grade estimates using the ordinary kriging method for the ALL properties. The depth, geometry, and grade of pegmatites on the properties make them amenable to exploitation by open cut mining methods. For the Ewoyaa Lithium Project, this study has defined (at a 0.5% Li2O reporting cut-off) a global Indicated and Inferred MRE of 4.2 Mt at 1.08% Li2O, containing 45,400 t of lithium oxide with an effective date of March 2023. 22.2 MINING The following summaries of interpretation and conclusion associated with the project are primarily focused on the mine plan and mining-specific issues. • The depth, geometry, and grade of pegmatites on the properties make them amenable to exploitation by open cut mining methods. • Inferred resources may be converted to indicated resources with future infill drilling. 22.3 METALLURGY TESTING Metallurgical testwork was conducted at Nagrom from 2019 with the majority of the work being conducted between Q1 2022 to Q2 2023, under the supervision of Trinol Pty ltd. A total of approximately 370 pegmatite drill core samples were taken from across the Ewoyaa deposits. These samples captured the varying mineralisation and levels of weathering, including “P1" coarse and “P2” fine mineralogy types from weathered ‘transitional’ and unweathered ‘fresh’ domains. From these samples, sixty-nine (69) drill hole composite samples were created and used for testing and represented a combination of variability and composite samples. See section 10.0. TECHNICAL REPORT SUMMARY EWOYAA LITHIUM PROJECT Page 350 of 368 Heavy Liquid Separation (HLS) and Dense Medium Separation (DMS) were undertaken on variability and production composites. Recoveries attributable to P1 material and P2 material were partly based on HLS and DMS-250 test results and partly on calculation of assumed additional recovery from middlings. More details can be found in Section 10.9. 22.4 RECOVERY METHODS • The recovery of lithium from ore to final product has been achieved through a DMS concentration stage. • The DMS technology for the recovery of spodumene is a widely used technology for beneficiation of spodumene and therefore considered low risk technology. • Testwork confirming the technologies applicability was undertaken across samples considered representative of the ore zones. • Concentrate grades of 5.5-6.0% Lithia were achieved, making a saleable product. • The average spodumene recovery for each ore type is shown below. TABLE 22-1 FINAL DMS RECOVERIES BY SC GRADE AND % OF ORE TYPE Concentrate Grade Ore Type HLS Recovery Plant Recovery Plant Recovery (% Li2O) (% Li2O) (% Li2O) (% Li2O) -10+0.5mm -10+0.85mm -10+1.0mm 5.50% >90% P1 74.4% 67.2% 64.9% >80% P2 25.0% 14.9% 12.6% 6.00% >90% P1 69.6% 62.1% 59.8% >80% P2 17.5% 7.0% 4.7% • The production schedule for the project is based on processing 2.7 Mtpa of ROM ore to produce a nominal 215 ktpa of concentrate (6% Li2O). • Coarse rejects from the DMS plant will be hauled to the waste rock dump. • Wet tailings from the process plant are pumped to a TSF integrated into the waste rock dump area and landform. 22.5 RISK & OPPORTUNITY EVALUATION 22.5.1 Introduction The study undertook risk analysis at two levels: • Hazards identification associated with the plant operation (“HAZID”); and • Project development risk and opportunity analysis Both work streams were prepared in accordance with the methodology outlined below. 22.5.2 Methodology A standard Risk Assessment procedure was used for the Project and in accordance with the methodology described in AS/NZS ISO 31000 Risk management — Principles and guidelines. The context is an assessment of the risks associated with the development of the Project and incorporation of actions, where appropriate, into the Study. During the Study risk treatment, actions that could be incorporated into the Study were identified, together with other actions that would be more appropriately managed during future stages of Project development. Risk analysis involves developing an understanding of the risk and involves consideration of the causes and sources of a risk, their positive and negative consequences, and the likelihood that those consequences will occur. Factors that TECHNICAL REPORT SUMMARY EWOYAA LITHIUM PROJECT Page 351 of 368 affect consequences and likelihood should be identified. An event can have multiple consequences and can affect multiple objectives. Existing controls and their effectiveness and efficiency should also be considered. Implementation of further or future control actions can also be to be considered, with a subsequent reassessment of likelihood and consequence ratings to determine at a residual risk rating after controls. Table 22-2 and Table 22-3 below outline the ratings that were applied when assessing the severity of a risk. TABLE 22-2 RISK LIKELIHOOD OF OCCURRENCE Rating Description Frequency Almost certain -Can be expected to occur in most circumstances -More than 75% chance of occurring -Complex process with minimal checks & balances More than once per year Likely -Will probably occur in most circumstances -50–75% chance of occurring -Complex process with some checks & balances At least once in 2 years Possible -Might occur at some time -25–50% chance of occurring -Previous audits/reports indicate non-compliance -Complex process with extensive checks & balances At least once in 5 years Unlikely -Could occur at some time -Less than 25% chance of occurring -Non-complex process &/or existence of checks and balances At least once in 10 years Rare -May only occur in exceptional circumstances -Simple process -No previous incidence of non-compliance Less than once in 100 years Risks will be analysed on the basis that management controls had been implemented. The matrix and numbering shown in Table 22-4 below was used to rank each risk as Extreme (E), High (H), Moderate (M) or Low (L) using the given descriptors of likelihood and consequence. TECHNICAL REPORT SUMMARY EWOYAA LITHIUM PROJECT Page 352 of 368 TABLE 22-3 RISK CONSEQUENCE RATING Extreme 10m–20m 10m–20m Fatality or multiple serious (permanent) disabling injuries that are life threatening Very serious, long-term environmental impairment of ecosystem function Serious social impacts. Significant, medium-term damage to structures/ items of cultural significance Serious public or media outcry (international coverage) Multiple significant breaches of laws. Suspension of licence to operate Major 2m–10m 2m–10m Lost Time Injury (LTI) Serious medium term environmental effects Ongoing serious social issues. Significant, damage to structures/ items of cultural significance Significant adverse national media/public/NGO attention Single significant breach of laws which may result in prosecution Moderate 200k–2m 200k–2m Medically Treated Injury (MTI) Moderate, short-term effects but not affecting ecosystem function Ongoing social issues. Permanent damage to structures/ items of cultural significance Attention from media and/or heightened concern by local community. Criticism by NGOs Minor breach of laws which may result in prosecution. Failure to meet standard audit Minor 50k–200k 50k–200k Minor injury – no disabling impact Minor effects on biological or physical environment Minor medium-term impacts on local population. Mostly repairable Minor, adverse local public or media attention and complaints Multiple minor breaches of standards or guidelines requiring rectification Insignificant <50k <50k No harm or injury to personnel No environmental damage Low-level repairable damage to commonplace structures Public concern restricted to local complaints Single minor breach of standards or guidelines (internal) Rating Financial Implementation Total Financial Operations Annual Health & Safety Environment Social/Cultural Heritage Reputation Compliance

TECHNICAL REPORT SUMMARY EWOYAA LITHIUM PROJECT Page 353 of 368 TABLE 22-4 RISK RANKING MATRIX 5X5 Risk Matrix Likelihood Almost certain Likely Possible Unlikely Rare Consequences Extreme 1 2 5 6 14 Major 3 4 7 8 15 Moderate 9 10 11 16 17 Minor 12 13 18 19 20 Insignificant 21 22 23 24 25 22.5.3 HAZID A HAZID was undertaken focusing on design and operational elements that have the potential to cause significant personal injury or environmental impact, to allow these to be addressed early in the detailed design. The HAZID was carried out for the FS in a workshop setting with attendees from Atlantic Lithium and Primero and facilitated by an independent representative. The results of the assessment constitute the HAZID register (Appendix 15.1), into which subsequent HAZID reviews were then conducted to complete the analysis. Overall, no hazards (uncontrolled) were classified as extreme, and only two hazards were classified as high, related to interactions of personnel with vehicles and mobile plant. With future implementation of industry standard design practices and operational controls, the residual risk ratings for these items are all low. All other hazards have both uncontrolled and residual risk lower ratings to either medium or low. 22.5.4 Project Risk Assessment Introduction A risk assessment was undertaken to assess the impact of uncertainties on the objective of delivering and operating the Project within budget and on schedule. The risks identified related to Compliance, Electrical supply, Environmental and approvals, Health and Safety, Human Resources, Infrastructure, logistics, water modelling and owner’s risks, Metallurgy, Geology, Mining, Processing, Security and Tailings and water dams. The Project risk assessment was carried out for the FS in a workshop setting with attendees from Atlantic Lithium and all consultants and facilitated by an independent representative. The results of the assessment constitute the Project risk register, into which further reviews were then conducted by individual teams to complete risk works for their areas of study scope, including assignment of actions and risk owners for ongoing risk management. Results The results of the workshops are presented in the Project Risk Register (Appendix 15.2). Table 22-5 outlines the risks (uncontrolled) listed as Extreme or High, together with the management or mitigating actions and residual risk ratings. In the categories studied, one risk (uncontrolled) was classified as Extreme, related to risk of obtaining and keeping an environmental permit (EP) required to conduct construction and operations. Long Project delays and delays to revenues would result. Mitigation actions relate to developing a strong understanding of the requirements to obtain and maintain the EP and carrying out the planned ESIA and RAP readiness works for the EP application in parallel to engineering and design works during 2023-24, leading to a residual risk rating of Medium. Several risks were classified as HIGH, however with ongoing or future mitigation actions, all residual risk ratings lower to either Medium or Low. TECHNICAL REPORT SUMMARY EWOYAA LITHIUM PROJECT Page 354 of 368 TABLE 22-5 PROJECT RISK REGISTER Risk Item Impact Risk Rating Current and Proposed Controls Residual Risk Rating EIS renewal / applications required. Expiration of the environmental permit and delay or withholding of the grant of an extension by the EPA. Financial 1- Extreme Permit timelines integrated into project schedule and renewal responsibilities clear for operations. Mobilisation of owners team to undertake all required ESIA and RAP definition works after DTM to meet timelines for permit submission. Keep commitment register and company-wide alignment on contents. 5-Medium Project transportation vehicle (trucks and passenger vehicles) accidents with community infrastructure, members and or livestock may affect the safety of the community. Health & Safety 2-High Impact study needed. Installation of in-vehicle speed and fatigue monitoring as contract condition with trucking company, and in all company vehicles. Training of drivers and preference for hiring female drivers. 5-Medium HV power line - grid connection delay / construction and delay start up. Financial 2-High Compensation provided to PAPs affected by powerline. Agree MoU with GridCo to align on approach and responsibilities to relocate powerlines, engage stakeholders and compensate PAPs and sharing survey and valuation data. ECG Engineering, a consultant boasting 25+ years of dealing with the Ghana power authorities, engaged for FEED works and to be engaged for detailed design after DTM. Early commitment to powerline relocation works after DTM to de-risk schedule. 8-Medium Lack of adequate power through the grid may result in increased costs for the project due to the need to self-generate power on site. Financial 2-High Considered a risk in PFS but not deemed a high risk after ECG works during FEED phase. 16-Low VRA power load shed > 20% will result in reduced throughput. Plan currently assumes 10 M Watts. Financial 2-High Considered a risk in PFS but not deemed a high risk after ECG works during FEED phase. 16-Low Loss of biodiversity including protected fauna and flora, ecosystems, endemic plant species due to vegetation clearing Environment 2-High Revegetating cleared land. ESIA study to be commissioned. Best practice to be implemented pending ESIA conditions to be received. As part of the ESIA: 11- Medium TECHNICAL REPORT SUMMARY EWOYAA LITHIUM PROJECT Page 355 of 368 Risk Item Impact Risk Rating Current and Proposed Controls Residual Risk Rating • undertake baseline biodiversity study including terrestrial and aquatic ecology to establish sensitive biodiversity areas and species. • Use the information for infrastructure placements alternative assessment. • Undertake an impact assessment to assess impacts and develop mitigation and management measures. • Develop a Biodiversity Action Plan that sets out how these measures will be implemented. Crushing circuit production rate does not feed DMS plant at required rate; throughputs and recoveries not achieved. Financial 2-High DMS testwork conducted before and during the PFS provide indication that recoveries may vary greatly between P1 and P2 material. Provision of recrush in DMS circuit. Additional metallurgical samples have been collected for further testing. Option of downstream additional processing via spirals and/or future flotation circuit has potential to upgrade product recovery and specification. 7-Medium Site Pedestrian access may result in injury Health & Safety 2-High High berms, signage, camera both ways on haul roads, Radio communication, sentry security guards. Facilitate underpass for community use (village traffic) if required. Height restriction booms and height markers. 16-Low Community access or interaction with construction and operations areas Health & Safety 2-High Gate house located closer to main road to control site access. Plant buildings and administration areas fenced off to control access compound/fuel. Review overall fencing and security in detailed design, especially with respect to insurance requirements. Communication in communities prior to construction and operations phases. 5-Medium Extensive and unsafe rural road use by ALL vehicles exceeds community expectations and damages roads. Financial 3-High In-vehicle speed monitoring, driver training and awareness, follow-up with drivers in case of speeding, financing of road maintenance and reparation by company, 11- Medium TECHNICAL REPORT SUMMARY EWOYAA LITHIUM PROJECT Page 356 of 368 Risk Item Impact Risk Rating Current and Proposed Controls Residual Risk Rating careful assessment of company-community-government responsibilities with regards to road maintenance, limit use of community roads, if possible, establish community crossing points where company vehicles need to stop. Conduct an evaluation on daylight operations only. Integrate road use into the community engagement programmes. Community consultation via the ESIA process for the road to avoid towns and villages. Consider need for community road fund and community escorts. Assess need to avoid road use and/or reduce speed limit at certain times of day. Loss of agricultural and grazing lands due to mine and mine infrastructure placement. Social/Cultural Heritage 3-High As part of the ESIA, identify potential land that will be affected, and identify the communities / community members who will be affected. Subsequently, develop a RAP, containing a Livelihood Restoration Plan, to set the basis for negotiating the compensation requirements and rates and livelihood restoration support that will need to be applied. Identify and secure agricultural replacement land. Land access and construction starts when required land has been fully compensated for as per legal requirement. ESIA study to ensure potential affected lands are mapped with owners identified where possible and captured in a register for reference purposes. 11- Medium Influx of workers and opportunity seekers causing increased pressure on existing social infrastructure such as medical, sanitation and hygiene facilities in the wider project area, partially due to lack of worker accommodation provided by the Company. Social/ Cultural Heritage 3-High As part of the ESIA, undertake an influx risk and impact assessment to determine all potential social impacts, assess the carrying capacity of current community infrastructure, evaluate potential pressure and develop mitigation and management measures to be implemented to try and reduce the severity of the social impacts. Identify relevant stakeholders and include them in the Stakeholder Engagement Plan and stakeholder database and undertake ongoing engagement and consultation with these stakeholders. 10- Medium

TECHNICAL REPORT SUMMARY EWOYAA LITHIUM PROJECT Page 357 of 368 Risk Item Impact Risk Rating Current and Proposed Controls Residual Risk Rating Assess the opportunity to provide worker accommodation and make budget provision to support local government in meeting increased demand for health, sanitation, education and other social services. ESIA study to be commissioned. Best practice to be implemented pending ESIA conditions to be received. Increase in social problems, decline of social cohesion and inflation of prices of basic goods and services due to influx of job seekers. Social/Cultural Heritage 3-High As part of the ESIA, undertake a socio-economic baseline study and impact assessment to determine all potential social impacts and develop mitigation and management measures to be implemented to try and reduce the severity of the social impacts. Subsequently, develop an Influx Management Plan setting out how influx will be managed. ESIA study to be commissioned. Best practice to be implemented pending ESIA conditions to be received. 11- Medium Inability to achieve average speeds / cycle time in the road truck operation, due to road conditions, third-party use. Financial 4-High FS will use assumptions and designs commensurate with the study accuracy requirements. Ensure truck lead times are understood and truck capacity is evaluated during project ramp up. 16-Low Ewoyaa township effected by mining operations and may need to resettle. Social/Cultural Heritage 3-High Ensure mining operations don't affect the village (noise and dust modelling, blast radius) Develop mitigations once noise modelling results are available, including noise reduction in vehicles, complaint management, reversing alarms connected to radio and not audible outside, community engagement. 7-Medium Project delays damage reputation with local communities, in part due to set expectations. Social/Cultural Heritage 4-High Continued regular community engagement and management of expectations. Ensure community messaging is centrally controlled and managed across all stakeholder groups. 11- Medium Inability to achieve ore feed specifications Financial 4-High Prepares Geological Model (production vs resource model) Production Scheduling - consider review of mine planning and articulate production processes to achieve level of selection, through sampling, blast hole analysis, reconciliation and stockpiling) Articulate next steps and scope in FEED. 7-Medium TECHNICAL REPORT SUMMARY EWOYAA LITHIUM PROJECT Page 358 of 368 Risk Item Impact Risk Rating Current and Proposed Controls Residual Risk Rating Future Controls: Grade Control, Blasting Optimisation, Ongoing model reconciliation, Segregated stockpiles for blending Illegitimate compensation claims. Financial 4-High A current land use map of affected communities should be prepared using photogrammetry data, including communities’ activities located in the affected area and affected by the Project. This will require updated mine and infrastructure plans to limit the areas of investigation. Physical verification to some extent should also be undertaken. Information on the project design and footprint needs to be kept highly confidential and managed accordingly until the cut-off date is declared. Physical verification of identified communities and facilities must be completed by tagging or marking each affected facility with an easily identifiable writing in paint specific to the identification and verification process. 7-Medium Customs delays for imported materials and equipment for construction and operations. Financial 4-High Realistic procurement schedules built into the FS. Develop in country processes and permits and install focus team. Engage experienced freight forwarding agent with knowledge of port processes and logistics. Integrate a customs team within the project team 11- Medium Non-compliance with legislative requirements and agreements, or perceived insufficiencies, with regard to the employment of local and national staff, including labourers and professional staff. Social/Cultural Heritage 4-High Local content, procurement, employment and contractor management plans agreed with local stakeholders and implemented for development. Communicate and manage stakeholder expectations around employment opportunities. Ensure that the Local Content Plan is updated regularly and implemented, especially prior to construction. 11- Medium Environmental obligation from ESIA particularly after the government has reviewed and given feedback (added more commitments) are highly onerous and much more expensive than planned. Environment 4-High Ensure ESIA scoping is comprehensive and ESIA Terms of Reference are clear. Ensure sufficient time is scheduled for comprehensive ESIA process. ESIA costs have been factored into the Project costs. Make sufficient budget provision for ESMP implementation and refine budget after permitting. 7-Medium TECHNICAL REPORT SUMMARY EWOYAA LITHIUM PROJECT Page 359 of 368 Risk Item Impact Risk Rating Current and Proposed Controls Residual Risk Rating Ensure schedule alignment and major contracts are not committed to until full confidence in schedule and ESIA process is underway. Pandemic (e.g. COVID-19) significantly impacts project development activities through direct health impacts or through travel restrictions. Financial 4-High Occupational health protocols – Vaccinations - Health cover - Access to hospitals. Track record of relatively effective management of disease outbreak in cities. ALL will have direct control of how mitigation controls are implemented at site. Implement health services contract (staffing) to support construction and operations phases. Utilise adaptive management measures to maintain relevant Covid-19 safety protocols: • Seek to prioritise vaccines to staff. • Establish operating structure that minimises travel including Video Conferencing. Follow Covid-19 rules. 8-Medium Lack of company commitment to and alignment with international E&S standards may influence financiers' willingness to provide loans until additional environmental and social measures have been undertaken. Financial 4-High Align ESIA and all feasibility studies to IFC Performance Standards and other relevant standards, frameworks and guidelines as far as practicable. Board to confirm commitment to follow IFC performance standards and equator principles. Inquire about expected E&S standards early in process of engaging investors. ESS consistently review all ESIA related study methodologies and principles, reports, findings, and recommendations and certifies that adequate considerations are made to ensure compliance with international best practices. 11- Medium Dust generation due to construction and operations that can negatively impact human health and the surrounding biodiversity. Social/Cultural Heritage 4-High As part of the ESIA, undertake an air quality baseline assessment to determine current ambient conditions. thereafter undertake modelling to determine potential dust impacts and define adequate buffer areas around project components and potential exceedances in permissible levels to determine where mitigation / management measures will need to be applied including plan for suppression and relocating major dust generating equipment and activities (e.g. potentially waste rock dumps). 11- Medium TECHNICAL REPORT SUMMARY EWOYAA LITHIUM PROJECT Page 360 of 368 Risk Item Impact Risk Rating Current and Proposed Controls Residual Risk Rating Contractor must use dust suppression rig/equipment for exploration activities, and provision of PPE to workers. Intensify awareness of workers and locals on the health risks of the dust and the need to use PPE. Health and Safety Officer recruited by ALL to ensure adherence to PPE use and availability. ESIA study to be commissioned but baseline data collection ongoing since July 2021. Best practice to be implemented pending ESIA conditions to be received. Noise pollution as a result of exploration, construction and mining activities and transportation of personnel and materials. Social/Cultural Heritage 4-High As part of the ESIA, undertake a baseline noise study to determine ambient conditions. Thereafter, undertake noise modelling and define adequate noise buffers with clear indication of land use restrictions, carefully consider location of project infrastructure and distance to settlements, and develop other appropriate mitigation and management measures such as the implementation of technology to reduce noise generated by equipment, berms and noise walls. Plan drill activities that are in close proximity to communities to be carried out in a short period of time to minimise the inconvenience caused. Simulate noise impacts using modelling and determine mitigation / management measures. ESIA study to be commissioned but baseline data collection ongoing since July 2021. Best practice to be implemented pending ESIA conditions to be received. Drill rigs are currently far from settlements and thus the noise generated is not significant to cause problems for them. Vehicles used for transportation are not heavy trucks hence does not create too much nuisance. 11- Medium Reduction in and loss of groundwater for communities due to dewatering activities and/or water use by exploration, construction and mine operation. Social/Cultural Heritage 4-High As part of the ESIA, undertake a baseline water study to define the area of influence, identify downstream communities and determine the ambient water quality, flow patterns and availability. Determine the mine water requirements including dewatering. Determine the potential impacts. Optimise water use designs and implement additional mitigation and management measures where applicable. 23-Low

TECHNICAL REPORT SUMMARY EWOYAA LITHIUM PROJECT Page 361 of 368 Risk Item Impact Risk Rating Current and Proposed Controls Residual Risk Rating Subsequently, develop a Water Management Plan that sets out how the mitigation / management measures will be implemented. Desalination Plant Study. ESIA study to be commissioned. Initial baseline studies conducted with further baseline studies contracted to complement existing data since July 2021. Best practices to be implemented pending ESIA conditions to be received. Deterioration of staff (office and field) health due to poor workplace ergonomics and repetitive/monotonous tasks including, lifting of heavy equipment and material. Health & Safety 4-High Undertake scheduled review of staff workload, task implementation, and working tools to ensure appropriate ergonomic considerations have been made. Undertake training for workers on how to work ergonomically, taking breaks, and using tools and equipment properly to avoid stress and injury. Training on how to properly lift equipment. SOPs for (Mechanical Auger Drilling). 11- Medium Vibration impacts associated with drilling and blasting activities, including vehicle and equipment vibration. Social/Cultural Heritage 4-High Define adequate buffer areas around planned infrastructure in line with regulatory requirements and define land use restrictions for buffer areas. Currently vibration caused by vehicles and equipment within the exploration area is not significant to cause a nuisance to nearby community and the environment. As part of the ESIA, undertake a vibration impact assessment to determine the potential sources and potential sphere of impact. Sphere of impact will inform additional studies that may include vibration crack assessment of community houses. Subsequently, develop an Air quality, Noise and Vibration Management Plan that sets out how these measures will be implemented. Conduct community level ground vibration monitoring and structural assessment before and after blasting within defined perimeter. UMaT contracted to undertake exploration Vibration Impact Assessment within the project footprint and make appropriate mitigatory recommendations. Recommendations and best practices to be implemented by ALL pending final via report from UMaT. 11- Medium TECHNICAL REPORT SUMMARY EWOYAA LITHIUM PROJECT Page 362 of 368 Risk Item Impact Risk Rating Current and Proposed Controls Residual Risk Rating Deterioration of air quality due to particulate matter and GHG emissions emanating from drilling rig operations, construction and mining activities, including development of the waste rock dumps. Health & Safety 4-High Installing dust and GHG trapping mechanisms on drilling rigs to minimise gaseous and particulate emissions, conduct air quality modelling to define adequate location of project infrastructure and environmental buffer areas around each infrastructure with clear land use restrictions to minimise impacts. 7-Medium TECHNICAL REPORT SUMMARY EWOYAA LITHIUM PROJECT Page 363 of 368 22.5.5 Project Opportunities The Project has several opportunities to capture further value from the planned operation and derisk the project implementation as outlined below. SPODUMENE AND PRODUCT PRICING Project revenue and financial upside is possible from higher realised product prices than those used in this study and as demonstrated in the sensitivity analysis in Section 19.0. Higher prices may be realised via offtake pricing agreements for sale of the balance of products not part of the JV agreement with PLL. INFERRED MATERIAL CONVERSION As outlined in Section 11.7, 21% of the MRE is classified as Inferred material, however none of this material is included in the production schedule over the LOM. Conversion of material currently classified as Inferred in the MRE into the measured or indicated categories will de-risk the production schedule in later years and has the potential to increase the size of the mined resource, with subsequent increased life of mine, longer production schedule, smaller stockpiling requirements and increased spodumene and secondary products produced. Conversion of Inferred material can be achieved by infill drilling programs prior to and during mining operations to further identify ore and waste zones within the existing planned mining areas. IMPLEMENTATION STRATEGIES The project has several opportunities to de-risk the project schedule or to realise cost savings to ensure project development plans are met. • Development of a detailed earthworks cut and fill balance to optimise earthwork quantities and cost for the bulk earthworks scope. • Pre-assembly of conveyor sections in fabrication yards around Takoradi prior to transport to site, to reduce site- based installation hours. • Purchase or hire of the Sisimbo resort as soon as possible to ensure the accommodation in ready for construction kick-off, but also to make use of the site for laydown or pre-assembly activities. • International supply of structural steel, platework, electrical bulks and piping materials to realise improved cost or schedule or de-risk the reliance on locally based contractors. FELDSPAR PRODUCT Potential local markets exist for the sale of feldspar products, which can be recovered from waste streams from the process plant. Feldspar can be used for many applications such as in construction of building materials, as a flux in ceramics and glassmaking, in pottery and porcelain making and as abrasives in manufacturing and polishing. Feldspar recovery consists of an additional DMS circuit and WHIMS iron removal stage treating the DMS rejects stream. A high-quality feldspar concentrate could be produced with greater than 10% alkalis, and less than 0.1% Fe2O3. Potential production qualities are shown in Table 22-6. TECHNICAL REPORT SUMMARY EWOYAA LITHIUM PROJECT Page 364 of 368 TABLE 22-6 FELDSPAR ESTIMATES Product % of plant feed tonnage Quantity est. tpa Size range (mm) Grade % Li2O Feldspar (future product) ~20% - 40% 500 - 1,000ktpa -10+1 n/a Market studies will be required to understanding the potential market size (demand) and requirements for feldspar materials. Further, engineering studies and representative testwork programs will be required to assess the feasibility of producing feldspar products that will be saleable in these markets. FLOTATION Another opportunity for the Project includes processing fines (<0.85 mm) and middlings streams through a flotation plant. Preliminary flotation sighter testwork performed indicates encouraging flotation stage recovery and achievement of >5% Li2O concentrate grades. The fines and middlings streams making up the proposed flotation feed represent approximately 1.1 Mtpa feed stream with an estimated grade of 0.7% Li2O. Preliminary calculations for concentrate production are in the range of 80,000 tpa for a >5% Li2O concentrate which represents an opportunity to increase Project value. The flotation concentrate product would replace the current (lower grade) secondary product and would be a higher value, lower volume product. The opportunity has potential to de-risk the Project in the event that low-grade lithium bearing products market is adversely affected in the future. TABLE 22-7 POTENTIAL FLOTATION PLANT FEEDSTOCK PER ANNUM Stream Quantity float feed est. tpa % Li2O Fines 450,000 1.2 DMS Middlings 650,000 0.4 Total 1,100,000 0.7

TECHNICAL REPORT SUMMARY EWOYAA LITHIUM PROJECT Page 365 of 368 23.0 RECOMMENDATIONS Specific recommendations for the Ewoyaa Lithium project are summarised below for the project areas. 23.1 MINERAL RESOURCE ALL is continuing to work both internally and with outside assistance to continue to further define their Resource Base and to Optimise the proposed LOM Plan. • Additional drilling along strike, up-dip and down-dip to extend known mineralisation. • Conduct infill drilling within non-mineralised pegmatite domains, where grade is more than 0.5% Li2O, in order to wireframe these zones within the mineralised domains. • Review four blanks from the 2022 drilling that appear to have been mis-labelled. 23.2 MINING The following mining related work is recommended to be investigated or progressed. • Appointment of the preferred bidder for contract mining, after final contract negotiations. • Short-term mine planning work including, but not limited to the following: - • Review of pit staging. • Review of waste dump location / design • Review of potential for additional pit backfill. • More detailed designs on pit development works, including access roads and short-term mine production schedules for the first two years. • Detailed ROM pad design and assessment of potential long-term stockpile requirements and location. • Increase UCS database to improve drill and blast analysis. • Pegmatites are notoriously hard and baseline penetration rates using blast hole drilling trials are recommended. • Undertake infill drilling in order to convert in-pit Inferred Resources to at least Indicated. • Optimise waste dumping strategy. • Assess possibility of relaxing the vibration limit from 2 mm/s to the more world-wide accepted standard of 5 mm/s. 23.3 METALLURGY TESTING / RECOVERY METHODS It is recommended to complete on-going testwork programs which will be completed H2 2023 and 2024: • Recrushing DMS testing. • Flotation testing of P1 and P2 ores. It is also recommended to further explore: • Flotation testing specifically with site water. ALL is continuing to work both internally and externally to continue to further refine their process and technology selections. TECHNICAL REPORT SUMMARY EWOYAA LITHIUM PROJECT Page 366 of 368 24.0 REFERENCES 24.1 GEOLOGY Ashmore Advisory Pty Ltd Report, Ewoyaa Lithium Project Mineral Resource Estimate, January 25, 2023. Joint Ore Reserves Committee (2012). “Australasian Code for Reporting of Exploration Results, Mineral Resources and Ore Reserves. The JORC Code, 2012 Edition”. Prepared by: The Joint Ore Reserves Committee of The Australasian Institute of Mining and Metallurgy, Australian Institute of Geoscientists and Minerals Council of Australia (JORC). 24.2 MINING AND GEOTECHNICAL Mining Focus Consultants Pty Ltd Report, Atlantic Lithium Limited Ewoyaa Lithium Project Mining Study – 27 June 2023 George Boucher Consulting Report, Drilling and Blasting Analyses FS Level Review Ewoyaa Lithium Project. 24.3 METALLURGICAL TESTWORK Nagrom Metallurgical Report, T3020 - Flotation Testwork, May 27, 2022 Nagrom Metallurgical Report, T3020 - Comminution and Density Testwork, April 14, 2022 Nagrom Metallurgical Report, T3141 - DFS Testwork, March 31, 2023 Fremantle Metallurgy Report, Dynamic Thickener Testwork, May 2023 Slurry Systems Engineering Pty Ltd Report, RHEOLOGY TESTS AND PUMPABILITY ASSESSMENT T3141 COMP 1/3/8/9 TAILS THICKENER FEED COMPOSITE SAMPLE, 24 April 2023 24.4 INFRASTRUCTURE REC/Geocrest Report, Tailings Storage Facility and Water Storage Dam Front-End Engineering Design Report, Ewoyaa Lithium Project, Ghana, Atlantic Lithium Ltd, Rev B, 18 April 2023 REC/Geocrest Report, Civil Geotechnical FEED Design Report, Ewoyaa Lithium Project, Ghana, Atlantic Lithium Ltd, Rev A, 18 April 2023 SRK Report, Ewoyaa Lithium Project – Water Balance Mankessim, Ghana, July 2023 SRK Report, Ewoyaa Lithium Project, Mankessim, Ghana –Hydrological Water Supply Report, July 2023 SRK Report, Ewoyaa Lithium Project Mankessim, Ghana Updated Numerical Groundwater Model, July 2023 ECG Engineering Report, EWO-0001-G-FS-0001 Rev B - Power Supply Study DFS, 7 June 2023. TECHNICAL REPORT SUMMARY EWOYAA LITHIUM PROJECT Page 367 of 368 24.5 ENVIRONMENTAL, SOCIAL AND PERMITTING Affam, M. and Ewusi A. (2022). Vibration Impact Assessment Studies for the Ewoyaa Lithium Project. Atlantic Lithium Limited. Ayimah, J. Y. (2014). Hydrogeochemical Studies Of Groundwater in the Southwestern Coastal Districts of the Central Region, Ghana. University of Ghana – UG Space. http://ugspace.ug.edu.gh/bitstream/handle/123456789/7907/Jerry?sequence=1 ESS. (2020). Hydrology and Hydrogeology Conceptual Model Report. Atlantic Lithium Limited. ESS. (2022). Draft Community Development Agreement - Ewoyaa Lithium Project, Ghana. Atlantic Lithium Limited. ESS. (2022). Draft Community Development Plan - Ewoyaa Lithium Project, Ghana. Atlantic Lithium Limited. ESS. (2022). Ewoyaa Lithium Project: Draft Emergency Response Plan. Atlantic Lithium Limited. ESS. (2022). Exploration Phase Environmental Monitoring Plan: Ewoyaa Lithium Project. Atlantic Lithium Limited. ESS. (2022). Draft Stakeholder Engagement Plan: Ewoyaa Lithium Project, Ghana. Atlantic Lithium Limited. Ghana Statistical Service (GSS). (2014). Population and Housing Census District Analytical Report: Mfantseman District. https://www2.statsghana.gov.gh/docfiles/2010_District_Report/Central/MFANTSEMAN.pdf Mfansteman Municipal Assembly (MMA). (2022). Medium-Term Development Plan 2022-2025. National Development Planning Commission. http://www.mfantsemanma.gov.gh/wp- content/uploads/2021/10/MFANTSEMAN-MTDP-2022-2025-DRAFT.pdf NEMAS Consult. (2019). Preliminary Environmental Baseline Assessment: Wet Season Report. Atlantic Lithium Limited. NEMAS Consult. (2020). Preliminary Environmental Baseline Assessment: Dry Season Report. Atlantic Lithium Limited. NEMAS Consult. (2021). Ewoyaa Lithium Project Biodiversity Survey: High-Level Assessment Report, Wet Season. Atlantic Lithium Limited. Yidana, S. M. (2010). Hydrochemical Characterisation of Aquifers Using Sequential Multivariate Analyses and Geographic Information Systems in a Tropical Setting. American Society of Civil Engineers. Yidana, S. M., Ophori, D. and Banoeng-Yakubo, B. (2008). Hydrogeological and Hydrochemical Characterisation of the Voltaian Basin: the Afram Plains area, Ghana. Environmental Geology 53: 1213-1223. TECHNICAL REPORT SUMMARY EWOYAA LITHIUM PROJECT Page 368 of 368 25.0 RELIANCE ON INFORMATION PROVIDED BY THE REGISTRANT The Qualified Persons responsible for the development of this TRS have not relied upon any information provided by Piedmont Lithium Inc.
EX-96.3
24
ex963dfs-nal22724.htm
EX-96.3
ex963dfs-nal22724

North American Lithium DFS Technical Report Summary – Quebec, Canada Exhibit 96.3 North American Lithium DFS Technical Report Summary – Quebec, Canada 2 DATE AND SIGNATURE PAGE This Technical Report Summary is effective as of the 31st of December 2023. Name: Sylvain Collard, P.Eng. Signature: [Signed and Sealed] Date: February 27, 2024 Name: Jarrett Quinn, P.Eng. Signature: [Signed and Sealed] Date: February 27, 2024 Name: Ehouman N’Dah, P.Geo. Signature: [Signed and Sealed] Date: February 27, 2024 Name: Philippe Chabot, P.Eng. Signature: [Signed and Sealed] Date: February 27, 2024 North American Lithium DFS Technical Report Summary – Quebec, Canada 3 TABLE OF CONTENTS DATE AND SIGNATURE PAGE .............................................................................................................. 2 1. Executive Summary ............................................................................................................................ 24 1.1 Introduction ................................................................................................................................ 24 1.2 Forward Looking Notice .............................................................................................................. 24 1.3 Background ................................................................................................................................. 25 1.4 Property Description and Ownership ......................................................................................... 26 1.4.1 Surface Rights ...................................................................................................................... 28 1.4.2 Property History .................................................................................................................. 28 1.5 Geology and Mineralization ........................................................................................................ 29 1.5.1 Geology ............................................................................................................................... 29 1.5.2 Mineralization ..................................................................................................................... 30 1.6 Exploration Status ....................................................................................................................... 31 1.6.1 Historical Drilling ................................................................................................................. 31 1.6.2 Quality Assurance and Quality Control (QA/QC) ................................................................ 32 1.7 Mineral Reserve Estimates ......................................................................................................... 32 1.8 Mineral Resource Estimate ......................................................................................................... 33 1.9 Material Development and Operations ...................................................................................... 35 1.10 Mine Design ................................................................................................................................ 36 1.11 Recovery Methods ...................................................................................................................... 38 1.11.1 Metallurgical Testing ........................................................................................................... 38 1.12 Project Infrastructure .................................................................................................................. 39 1.13 Capital and Operating Cost Estimates ........................................................................................ 40 1.13.1 Capital Costs ........................................................................................................................ 40 1.13.2 Operating Costs ................................................................................................................... 40 1.14 Market Studies ............................................................................................................................ 41 1.14.1 Price Forecast ...................................................................................................................... 41 1.14.2 Spodumene Price Forecast ................................................................................................. 42 North American Lithium DFS Technical Report Summary – Quebec, Canada 4 1.14.3 Carbonate Price Forecast .................................................................................................... 42 1.15 Environmental, Social and Permitting ........................................................................................ 43 1.15.1 Environmental Studies ........................................................................................................ 43 1.15.2 Status of Negotiations with Shareholders .......................................................................... 43 1.15.3 Permitting ........................................................................................................................... 43 1.15.4 Reclamation and Closure .................................................................................................... 44 1.16 Economic Analysis ....................................................................................................................... 44 1.17 Conclusions and QP Recommendations ..................................................................................... 45 1.17.1 Key Outcomes ..................................................................................................................... 46 1.17.2 QP Recommendations ........................................................................................................ 48 1.18 Revision Notes ............................................................................................................................ 48 2. Introduction ....................................................................................................................................... 49 2.1 Terms of Reference and Purpose of the Report ......................................................................... 49 2.2 Qualifications of Qualified Persons/Firms .................................................................................. 50 2.2.1 Contributing Authors .......................................................................................................... 50 2.2.2 Site Visit ............................................................................................................................... 51 2.3 Source of information ................................................................................................................. 53 2.4 Units of Measure & Glossary of Terms ....................................................................................... 53 3. Property Description .......................................................................................................................... 59 3.1 Property Location, Country, Regional and Government Setting ................................................ 59 3.2 Mineral Tenure, Agreement and Royalties ................................................................................. 62 3.2.1 Surface Rights ...................................................................................................................... 62 3.2.2 Mineral Rights and Permitting ............................................................................................ 64 3.2.3 Agreements and Royalties .................................................................................................. 65 3.3 Environmental Liabilities and Other Permitting Requirements .................................................. 65 3.4 Mineral and Surface Purchase Agreements ................................................................................ 66 3.5 Other Significant Factors and Risks ............................................................................................. 67 4. Accessibility, Climate, Physiography, Local Resources, and Infrastructure ....................................... 68 4.1 Accessibility ................................................................................................................................. 68 4.2 Topography, Elevation, Vegetation and Climate ........................................................................ 69

North American Lithium DFS Technical Report Summary – Quebec, Canada 5 4.2.1 Physiography ....................................................................................................................... 69 4.2.2 Climate ................................................................................................................................ 73 4.2.3 Vegetation ........................................................................................................................... 73 4.3 Local Infrastructure and Resources ............................................................................................ 74 4.3.1 Airports, Rail Terminals, and Bus Services .......................................................................... 74 4.3.2 Local Workforce .................................................................................................................. 74 4.3.3 Additional Support Services ................................................................................................ 74 5. History ................................................................................................................................................ 76 5.1 General ........................................................................................................................................ 76 5.2 Historical Exploration and Drill Programs ................................................................................... 78 5.3 Historical Production .................................................................................................................. 79 5.3.1 Ownership and Activities .................................................................................................... 79 5.3.2 Historical Production........................................................................................................... 80 5.3.3 2021 Acquisition to Present ................................................................................................ 83 6. Geological Setting, Mineralization and Deposit ................................................................................. 84 6.1 Regional Geology ........................................................................................................................ 84 6.2 Local Geology .............................................................................................................................. 84 6.2.1 Malartic and Kinojevis Groups – Basaltic Lavas .................................................................. 84 6.2.2 Kewagama Group – Biotite Schist ....................................................................................... 86 6.2.3 Metaperidotite .................................................................................................................... 86 6.2.4 La Corne pluton ................................................................................................................... 87 6.2.5 Proterozoic Gabbro / Diabase Dykes .................................................................................. 89 6.2.6 Manneville Fault.................................................................................................................. 89 6.3 Property Geology ........................................................................................................................ 89 6.3.1 Volcanics ............................................................................................................................. 90 6.3.2 Granodiorite ........................................................................................................................ 91 6.3.3 Pegmatite Dykes ................................................................................................................. 91 6.4 Mineralization ............................................................................................................................. 94 6.5 Deposit Types .............................................................................................................................. 96 6.5.1 Rare-Element Pegmatites of the Superior Province ........................................................... 96 North American Lithium DFS Technical Report Summary – Quebec, Canada 6 6.5.2 La Corne Pluton Rare-Element Pegmatites ......................................................................... 97 7. Exploration ......................................................................................................................................... 99 8. Sample Preparation, Analyses and Security ..................................................................................... 100 8.1 Reverse Circulation Procedures, Sample Preparation and Analyses ........................................ 100 8.1.1 Sampling and Preparation Procedures ............................................................................. 100 8.1.2 Laboratories Procedures ................................................................................................... 100 8.2 QA / QC Procedures and Results ............................................................................................... 100 8.3 Core Logging and Handling, Sample Shipment and Security .................................................... 101 8.3.1 Historical Data (Pre-1965) ................................................................................................. 102 8.3.2 2009 Canada Lithium Corp. ............................................................................................... 102 8.3.3 2010 Canada Lithium Corp. ............................................................................................... 102 8.3.4 2011 Canada Lithium Corp. ............................................................................................... 102 8.3.5 2016 North American Lithium Corp. ................................................................................. 103 8.3.6 2019 North American Lithium Corp. ................................................................................. 103 8.4 Specific Gravity Measurements ................................................................................................ 105 8.5 Historic Drill Holes ..................................................................................................................... 105 8.5.1 Pre-1985 ............................................................................................................................ 105 8.5.2 Canada Lithium Corp. ........................................................................................................ 106 8.5.3 North American Lithium Corp. .......................................................................................... 107 8.5.4 Drilling Procedure ............................................................................................................. 109 8.5.5 Sampling Procedure .......................................................................................................... 110 8.5.6 Qualified Person’s Opinion ............................................................................................... 114 9. Data Verification............................................................................................................................... 115 9.1 Site Visit..................................................................................................................................... 115 9.2 Quality Control Program ........................................................................................................... 117 9.2.1 Drilling and Sampling Procedure ....................................................................................... 117 9.2.2 Log and Core Box Validation ............................................................................................. 117 9.3 Verification of QC Program ....................................................................................................... 118 9.3.1 Sample Preparation Review .............................................................................................. 118 9.3.2 Drillhole Database Check .................................................................................................. 118 North American Lithium DFS Technical Report Summary – Quebec, Canada 7 9.3.3 Qualified Person’s Opinion ............................................................................................... 120 10. Mineral Processing and Metallurgical Testing .............................................................................. 121 10.1 InTRODUCTION ......................................................................................................................... 121 10.2 North American Lithium – Historical Process Plant Operations ............................................... 121 10.2.1 Québec Lithium Concentrator Operations 2013-2014 ..................................................... 121 10.2.2 North American Lithium – Operations 2017-2019 ........................................................... 122 10.3 Metallurgical Laboratory TestWork Program ........................................................................... 124 10.3.1 North American Lithium Testwork Review ....................................................................... 124 10.3.2 Optical Ore Sorting Test Program – 2011 ......................................................................... 126 10.3.3 Historical Plant Operating Data – 2014 ............................................................................. 127 10.4 NAL 2016 Re-start Metallurgical Testing .................................................................................. 128 10.5 Authier Metallurgical Testwork Review .................................................................................... 130 10.5.1 Historical Authier Testwork .............................................................................................. 130 10.5.2 Feasibility-level Authier Testwork (2018) ......................................................................... 132 10.6 Blended Ore (NAL and Authier) Testwork review ..................................................................... 141 10.6.1 Preliminary Testwork (2019) ............................................................................................. 141 10.7 Qualified Person’s Opinion ....................................................................................................... 159 11. Mineral Resource Estimates ......................................................................................................... 160 11.1 Data Used for Ore Grade Estimation ........................................................................................ 161 11.2 Resource Estimate Methodology, Assumptions and Parameters ............................................ 162 11.2.1 Geological Interpretation and Modelling.......................................................................... 162 11.2.2 Exploration Data Analysis.................................................................................................. 164 11.3 Mineral Grade Estimation ......................................................................................................... 172 11.3.1 Block Model ...................................................................................................................... 172 11.3.2 Estimation Methodology................................................................................................... 173 11.3.3 Block Model Statistical Validation ..................................................................................... 178 11.4 Mineral Resource Classification ................................................................................................ 182 11.5 Classified Mineral Resource Estimates ..................................................................................... 183 11.5.1 Mineral Resource Statement ............................................................................................ 184 11.6 Potential Risks in Developing the Mineral Resource ................................................................ 186 North American Lithium DFS Technical Report Summary – Quebec, Canada 8 12. Mineral Reserves Estimates .......................................................................................................... 187 12.1 Reserve Estimate Methodology, Assumptions, and Parameters.............................................. 187 12.2 Mine and Plant Production Scenarios ....................................................................................... 189 12.2.1 Pit Optimization Methodology .......................................................................................... 189 12.2.2 Pit Optimization Parameters ............................................................................................. 189 12.2.3 Analysis of Pit Optimization Results .................................................................................. 191 12.2.4 Mine Design and Production ............................................................................................. 195 12.2.5 Plant Production ............................................................................................................... 200 12.3 Mineral Reserve Estimate ......................................................................................................... 201 12.4 Permitting & Environmental Constraints .................................................................................. 203 12.5 Assumptions and Reserve Estimate Risks ................................................................................. 203 12.6 Material Development and Operations .................................................................................... 204 13. Mining Methods ............................................................................................................................ 205 13.1 Mine Design .............................................................................................................................. 205 13.1.1 Pit Phasing Strategy .......................................................................................................... 205 13.1.2 LOM Production Plan ........................................................................................................ 209 13.2 Geotechnical and Hydrological Considerations ........................................................................ 215 13.3 Mine Operating Strategy ........................................................................................................... 215 13.4 Mining Fleet and Manning ........................................................................................................ 217 13.4.1 Mine Equipment and Operations ...................................................................................... 217 13.4.2 Mine Personnel Requirements ......................................................................................... 218 13.5 Mine Plan and Schedule ............................................................................................................ 218 14. Processing and Recovery Methods ............................................................................................... 220 14.1 Process Design Criteria ............................................................................................................. 220 14.2 Process Flowsheet and Description .......................................................................................... 221 14.2.1 Concentrator Production Schedule ................................................................................... 221 14.2.2 Concentrator Operating Design Parameters .................................................................... 222 14.2.3 Concentrator Facilities Description ................................................................................... 222 14.2.4 Concentrator Consumables .............................................................................................. 227 14.2.5 Concentrator Process Water ............................................................................................. 228

North American Lithium DFS Technical Report Summary – Quebec, Canada 9 14.2.6 Concentrator Personnel .................................................................................................... 228 14.2.7 Utilities .............................................................................................................................. 229 14.3 Products and Recoveries ........................................................................................................... 230 14.4 Recommendations .................................................................................................................... 230 15. Infrastructure ................................................................................................................................ 232 15.1 Access Roads ............................................................................................................................. 233 15.1.1 Public Roads ...................................................................................................................... 233 15.1.2 Site Roads .......................................................................................................................... 234 15.1.3 Private Radio Antenna ...................................................................................................... 234 15.1.4 Rail ..................................................................................................................................... 235 15.2 Electrical Power Supply and Distribution .................................................................................. 235 15.2.1 Site Electrical Utility Supply .............................................................................................. 235 15.2.2 Site Electrical Distribution ................................................................................................. 235 15.2.3 Emergency Power Supply .................................................................................................. 235 15.3 Fuel Storage .............................................................................................................................. 236 15.4 Natural Gas And Propane.......................................................................................................... 236 15.5 Water Supply ............................................................................................................................. 236 15.5.1 Water Reclaim System and TSF Level Control .................................................................. 236 15.5.2 Water for Fire Protection .................................................................................................. 237 15.5.3 Potable Water ................................................................................................................... 237 15.5.4 Sewage and Waste ............................................................................................................ 237 15.6 ON/OFF and ROM Pads ............................................................................................................. 237 15.7 Tailings Storage/Disposal .......................................................................................................... 238 15.7.1 Tailings Storage Facility No. 2 (TSF-2) ............................................................................... 238 15.7.2 Waste rock pile 3 and Overburden Stockpiles .................................................................. 247 15.7.3 Site Water Management ................................................................................................... 249 15.8 Communications ....................................................................................................................... 256 15.9 Security and Access Point ......................................................................................................... 256 15.10 On-Site Infrastructure ........................................................................................................... 257 15.10.1 General, Green, And Regulated Waste Management ...................................................... 257 North American Lithium DFS Technical Report Summary – Quebec, Canada 10 15.10.2 Explosives Magazines ........................................................................................................ 257 15.10.3 Administration Office ........................................................................................................ 257 15.10.4 Mine Garage ...................................................................................................................... 257 15.10.5 Process Plant Building ....................................................................................................... 258 15.10.6 Assay Lab ........................................................................................................................... 258 15.10.7 Filtration building .............................................................................................................. 258 15.11 Risks and Uncertainties ......................................................................................................... 259 15.11.1 Tailings .............................................................................................................................. 259 15.11.2 Site Water Management ................................................................................................... 259 16. Market Studies and Contracts....................................................................................................... 260 16.1 Market Balance ......................................................................................................................... 260 16.2 Product Pricing .......................................................................................................................... 261 16.2.1 Spodumene Price Forecast ............................................................................................... 261 16.2.2 Carbonate Price Forecast .................................................................................................. 262 16.2.3 Spodumene Price forecast – Relatively to carbonate price .............................................. 263 16.3 Contract Sales ........................................................................................................................... 264 16.3.1 Other Contracts ................................................................................................................. 265 16.4 Market Analysis ......................................................................................................................... 265 16.4.1 Refined Lithium Demand by Product ................................................................................ 265 16.4.2 Refined Lithium Demand by End Use Segment ................................................................ 266 16.4.3 Type of Ore Processed from Hard Rock to Supply Lithium ............................................... 267 16.4.4 Refined Production Capacity by Final Product .................................................................. 268 16.4.5 Refined Production by Raw Materials .............................................................................. 269 16.5 Packaging and Transportation .................................................................................................. 270 16.6 Risks and Uncertainties ............................................................................................................. 271 16.7 Opportunities ............................................................................................................................ 271 17. Environmental Studies, Permitting, Social or Community Impacts .............................................. 272 17.1 Environmental Baseline and Impact Studies ............................................................................ 272 17.1.1 Physical Environment ........................................................................................................ 272 17.1.2 Biological Environment ..................................................................................................... 275 North American Lithium DFS Technical Report Summary – Quebec, Canada 11 17.1.3 Social Considerations ........................................................................................................ 277 17.2 Project Permitting ..................................................................................................................... 279 17.2.1 Ministry of Environment, Fight Against Climate Change, Fauna, and Parks (MELCCFP) .. 279 17.2.2 Ministry of Natural Resources and Forests (MRNF) - Lands Sector .................................. 280 17.2.3 Ministry of Natural Resources and Forests (MRNF) - Forestry Sector .............................. 280 17.2.4 Department of Fisheries and Oceans of Canada (DFO) .................................................... 280 17.3 Other Environmental Concerns ................................................................................................ 281 17.3.1 Waste Rock, Tailings and Water Management ................................................................. 281 17.3.2 Regulatory Context ........................................................................................................... 281 17.4 Social and Community Impacts ................................................................................................. 284 17.4.1 Consultation Activities ...................................................................................................... 284 17.4.2 Monitoring Committee ..................................................................................................... 284 17.5 Mine Closure and Reclamation Plan ......................................................................................... 285 17.5.1 Financial Commitment for Mine Closure .......................................................................... 286 18. Capital and Operating Costs .......................................................................................................... 287 18.1 Summary of Capital Cost Estimate ............................................................................................ 287 18.2 Mine Capital Expenditure ......................................................................................................... 289 18.2.1 Mine Equipment Capital Cost ........................................................................................... 289 18.2.2 Mine Development Capital ............................................................................................... 289 18.3 Plant Capital Expenditure.......................................................................................................... 289 18.4 Infrastructure Capital Cost ........................................................................................................ 289 18.4.1 Pre-Approved Projects ...................................................................................................... 289 18.4.2 Estimated Projects ............................................................................................................ 290 18.4.3 Direct Costs ....................................................................................................................... 290 18.4.4 Indirect Costs .................................................................................................................... 295 18.4.5 Closure and Rehabilitation ................................................................................................ 296 18.5 Summary of Operating Cost Estimate ....................................................................................... 297 18.6 Mine Operating Cost ................................................................................................................. 299 18.7 Plant Operating Cost ................................................................................................................. 300 18.7.1 Personnel .......................................................................................................................... 301 North American Lithium DFS Technical Report Summary – Quebec, Canada 12 18.7.2 Power ................................................................................................................................ 301 18.7.3 Grinding Media ................................................................................................................. 301 18.8 G&A ........................................................................................................................................... 304 18.9 Product Transport and Logistics ............................................................................................... 304 19. Economic Analysis ......................................................................................................................... 305 19.1 Economic Inputs, Assumptions & Key Metrics ......................................................................... 305 19.2 Products Considered in the Cash Flow Analysis ........................................................................ 309 19.2.1 Spodumene Concentrate Production ............................................................................... 309 19.3 Taxes, Royalties and Other Fees ............................................................................................... 310 19.3.1 Royalties ............................................................................................................................ 310 19.3.2 Working Capital ................................................................................................................. 310 19.3.3 Salvage Value .................................................................................................................... 310 19.3.4 Taxation ............................................................................................................................. 310 19.4 Contracts ................................................................................................................................... 311 19.5 Indicative Economics, Base Case Sensitivity Analysis ............................................................... 312 19.5.1 Positive Financials ............................................................................................................. 312 19.5.2 Sensitivity Analysis ............................................................................................................ 312 19.6 Alternative Cases / Sensitivity Models ...................................................................................... 314 20. Adjacent Properties ...................................................................................................................... 315 21. Other Relevant Data and Information .......................................................................................... 317 21.1 Execution Plan ........................................................................................................................... 317 21.1.1 Completion of Crushed Ore Dome .................................................................................... 317 21.1.2 Additional Waste and Tailings Management Facilities ..................................................... 318 21.1.3 Project Organization Going Forward ................................................................................ 319 21.2 Project Risks .............................................................................................................................. 320 21.3 Project Opportunities................................................................................................................ 322 22. Interpretation and Conclusions .................................................................................................... 324 22.1 Project Summary ....................................................................................................................... 324 22.1.1 Key Outcomes ................................................................................................................... 324 22.2 Geology and Resources ............................................................................................................. 324

North American Lithium DFS Technical Report Summary – Quebec, Canada 13 22.2.1 Geology ............................................................................................................................. 324 22.3 Mining and Reserves ................................................................................................................. 325 22.3.1 Reserves ............................................................................................................................ 325 22.3.2 Mining ............................................................................................................................... 325 22.4 Metallurgy and Processing ........................................................................................................ 326 22.5 Infrastructure and Water Management ................................................................................... 327 22.6 Market Studies .......................................................................................................................... 327 22.7 Project Costs and Financial Evaluation ..................................................................................... 328 22.7.1 Capital Costs ...................................................................................................................... 328 22.7.2 Operating Costs ................................................................................................................. 328 22.7.3 Project Economics ............................................................................................................. 330 23. Recommendations ........................................................................................................................ 332 23.1 Project Summary ....................................................................................................................... 332 23.2 Geology and Resources ............................................................................................................. 332 23.3 Mining and Reserves ................................................................................................................. 333 23.4 Metallurgy and Processing ........................................................................................................ 334 23.5 Infrastructure ............................................................................................................................ 334 23.6 Market Studies .......................................................................................................................... 335 23.7 Environmental and Social Recommendations .......................................................................... 335 23.8 Project Costs and Financial Evaluation ..................................................................................... 336 24. References .................................................................................................................................... 337 24.1 General Project ......................................................................................................................... 337 24.2 Geology and Resources ............................................................................................................. 338 24.3 Mining ....................................................................................................................................... 340 24.4 Mineral Resources and Metallurgy ........................................................................................... 340 25. Reliance on Information supplied by Registrant ........................................................................... 342 25.1 General ...................................................................................................................................... 342 25.2 Mineral Claims and Surface Rights............................................................................................ 342 North American Lithium DFS Technical Report Summary – Quebec, Canada 14 LIST OF TABLES Table 1-1 – Mining titles list and details. .................................................................................................... 27 Table 1-2 – NAL Mineral Reserve Statement at effective date of December 31, 2023 based on USD $1,352/t Li₂O. ............................................................................................................................................................. 33 Table 1-3 – NAL Mineral Resource statement at effective date of December 31, 2022 based on USD $1,273/t Li₂O, inclusive of Mineral Reserves. ............................................................................................. 34 Table 1-4 – NAL Mineral Resource statement at effective date of December 31, 2022 based on USD $1,273/t Li₂O exclusive of Mineral Reserves. ............................................................................................. 35 Table 1-5 – Capital costs summary by major area. ..................................................................................... 40 Table 1-6 – Operating cost summary by area. ............................................................................................ 41 Table 1-7 – NAL operation including Authier ore supply – Financial analysis summary. ........................... 45 Table 1-8 – Major plant upgrades. .............................................................................................................. 47 Table 2-1 – Chapter responsibility. ............................................................................................................. 50 Table 2-2 – List of Abbreviations and Units of Measurement. ................................................................... 54 Table 3-1 – Mining titles list and details. .................................................................................................... 63 Table 3-2 – NAL Public land leases. ............................................................................................................. 67 Table 5-1 – Summary of ownership and historic activities. ........................................................................ 76 Table 5-2 – Details of historic drilling. ........................................................................................................ 78 Table 5-3 – Mine production statistics. ...................................................................................................... 81 Table 8-1 – Specific gravity used for the MRE. ......................................................................................... 105 Table 8-2 – Summary of Canada Lithium Corp. drillholes. ........................................................................ 106 Table 8-3 – Summary of North American Lithium Corp holes. ................................................................. 107 Table 9-1 – Geological intervals inspected during site visit. ..................................................................... 118 Table 9-2 – Percentage of certificates received by drilling campaigns. .................................................... 119 Table 9-3 – Drilling data used in the new geological model and current MRE. ........................................ 120 Table 10-1 – Example mineralogy of NAL host rock types........................................................................ 125 Table 10-2 – Example assays of NAL host rock types. .............................................................................. 125 Table 10-3 – Recent Authier metallurgical testing programs. .................................................................. 131 North American Lithium DFS Technical Report Summary – Quebec, Canada 15 Table 10-4 – Chemical compositions of the pilot plant feed samples. ..................................................... 133 Table 10-5 – Semi-quantitative XRD results (Rietveld analysis). .............................................................. 133 Table 10-6 – Summary of grindability results. .......................................................................................... 134 Table 10-7 – Reagent dosages for selected batch tests............................................................................ 136 Table 10-8 – Reagent dosages for the locked-cycle batch tests. .............................................................. 138 Table 10-9 – Reagent dosages for selected pilot plant tests. ................................................................... 139 Table 10-10 – Assays of ore samples tested. ............................................................................................ 142 Table 10-11 – Overview of feed samples tested. ...................................................................................... 143 Table 10-12 – Final spodumene concentrate grade (3-stages of cleaning). ............................................. 144 Table 10-13 – Assays of the pegmatite and host rock samples. ............................................................... 144 Table 10-14 – Mineralogy of the pegmatite and host rock samples. ....................................................... 145 Table 10-15 – Blended ore assays. ............................................................................................................ 146 Table 10-16 – Reagent dosages for optimized tests. ................................................................................ 146 Table 10-17 – Final spodumene concentrate assays. ............................................................................... 147 Table 10-18 – Composite sample assays of the pegmatite and host rock samples. ................................ 149 Table 10-19 – Mineralogy of the pegmatite and host rock samples. ....................................................... 150 Table 10-20 – Blended feed assays. .......................................................................................................... 151 Table 10-21 – Variability sample description. ........................................................................................... 152 Table 10-22 – NAL Variability sample assays: pegmatite and host rock. .................................................. 152 Table 10-23 – NAL Variability sample mineralogy: pegmatite and host rock. .......................................... 153 Table 10-24 – NAL blended variability sample assays. ............................................................................. 153 Table 10-25 – Final spodumene concentrate assays. ............................................................................... 155 Table 10-26 – Variability test conditions. ................................................................................................. 156 Table 10-27 – Final spodumene concentrate assays. ............................................................................... 157 Table 10-28 – Testwork conditions. .......................................................................................................... 158 Table 11-1 – Basic statistics of the raw data – Li2O. ................................................................................. 164 Table 11-2 – Basic statistics of composites used for estimation – Li2O. .................................................. 167 Table 11-3 – Search ellipsoids. .................................................................................................................. 172 Table 11-4 – Variogram parameters used for each dyke. ......................................................................... 172 North American Lithium DFS Technical Report Summary – Quebec, Canada 16 Table 11-5 – Block model parameters used in Leapfrog Edge™. .............................................................. 173 Table 11-6 – Summary of the suggested parameters from the KNA analysis. ......................................... 173 Table 11-7 – Summary of parameters used for Li2O grade interpolation. ............................................... 174 Table 11-8 – Comparison of global grades for estimation method by mineralized zones. ...................... 181 Table 11-9 – Reasonable extraction factors. ............................................................................................ 183 Table 11-10 – NAL Mineral Resource statement at effective date of December 31, 2022 based on USD $1,273/t Li₂O, inclusive of Mineral Reserves. ........................................................................................... 184 Table 11-11 – NAL Mineral Resource statement at effective date of December 31, 2023 based on USD $1,273/t Li₂O exclusive of Mineral Reserves. ........................................................................................... 185 Table 12-1 – Deswik.SO input parameters. .............................................................................................. 188 Table 12-2 – Open pit optimization parameters (base case). ................................................................... 190 Table 12-3 – Pit optimization results (blue line is maximum NPV pit, brown line is RF=1.0 pit). ............. 193 Table 12-4 – Discounted Cash Flows. ........................................................................................................ 194 Table 12-5 – Ultimate pit design parameters. .......................................................................................... 198 Table 12-6 – Haul Road design criteria. .................................................................................................... 198 Table 12-7 – COG calculation parameters. ............................................................................................... 201 Table 12-8 – NAL Mineral Reserve Statement at effective date of December 31, 2023 based on USD $1,352/t Li₂O. ............................................................................................................................................ 202 Table 12-9 – Environmental and/or permitting constraints affecting mineral reserves. ......................... 203 Table 13-1 – Material quantities by phase1. ............................................................................................. 206 Table 13-2 – LOM production plan and material movement. .................................................................. 210 Table 13-3 – Typical blast patterns. .......................................................................................................... 216 Table 13-4 – Mining equipment description and maximum number of units. ......................................... 218 Table 14-1 – Grade and recoveries over LOM. ......................................................................................... 221 Table 14-2 – General process design criteria – concentrator. .................................................................. 222 Table 14-3 – Concentrator reagents. ........................................................................................................ 227 Table 14-4 – Grinding media. .................................................................................................................... 227 Table 14-5 – Concentrator salaried manpower. ....................................................................................... 228 Table 14-6 – Concentrator hourly manpower. ......................................................................................... 229 Table 14- – Grade and recoveries over LOM. ........................................................................................... 230

North American Lithium DFS Technical Report Summary – Quebec, Canada 17 Table 15-1 – Tailings yearly production and filling rate. ........................................................................... 241 Table 15-2 – Summary of the tailings storage facility capacity (tailings and waste rock). ....................... 243 Table 15-3 – Shear strength parameters used in slope stability analysis. ................................................ 246 Table 15-4 – Factor of safety of slope stability analysis. .......................................................................... 247 Table 15-5 – Waste storage capacity. ....................................................................................................... 248 Table 15-6 – Storage capacity detailed per waste dump. ......................................................................... 248 Table 15-7 – Crest elevations. ................................................................................................................... 252 Table 15-8 – Typical cross-section to be used for the TSF-2 ditches. ....................................................... 253 Table 15-9 – Typical cross-section to be used for the WRP-3 ditches. ..................................................... 253 Table 15-10 – Typical cross-section to be used for WRP-2 and OBP-2 (in progress). ............................... 253 Table 15-11 – Typical dimensions of pumping basins. ............................................................................. 254 Table 15-12 – OURANOS projections for temperature and precipitation. ............................................... 256 Table 17-1 – Provincial and federal acts and regulations. ........................................................................ 282 Table 18-1 – Capital cost estimate contributors. ...................................................................................... 287 Table 18-2 – Capital costs summary by major area ($M CAD). ................................................................ 287 Table 18-3 – Capital costs over LOM ($M CAD). ....................................................................................... 288 Table 18-4 – Design growth. ..................................................................................................................... 293 Table 18-5 – Labor rate summary (Phase 2). ............................................................................................ 294 Table 18-6 – Labor productivity factors (Phase 2). ................................................................................... 294 Table 18-7 – NAL Operating Costs per year ($M CAD) .............................................................................. 298 Table 18-8 – General rate assumptions. ................................................................................................... 299 Table 18-9 – Mine operating costs. .......................................................................................................... 299 Table 18-10 – Concentrator operating costs. ........................................................................................... 300 Table 18-11 – Average LOM media wear and consumption rates. .......................................................... 302 Table 18-12 – Tailings operating costs. ..................................................................................................... 303 Table 19-1 – NAL operation including Authier ore supply – Financial analysis summary. ....................... 307 Table 19-2 – NAL operation including Authier ore supply – Cashflow over LOM. ................................... 308 Table 21-1 – Major activities for the Project. ........................................................................................... 317 Table 21-2 – Project risks. ......................................................................................................................... 320 North American Lithium DFS Technical Report Summary – Quebec, Canada 18 Table 21-3 – Project opportunities. .......................................................................................................... 322 Table 22-1 – Major plant upgrades. .......................................................................................................... 326 Table 22-2 – Projected metallurgical recoveries. ..................................................................................... 327 Table 22-3 – NAL CAPEX Summary. .......................................................................................................... 329 Table 22-4 – Operating cost summary by area. ........................................................................................ 329 Table 22-5 – NAL operation including Authier ore supply - Financial analysis summary. ........................ 329 North American Lithium DFS Technical Report Summary – Quebec, Canada 19 TABLE OF FIGURES Figure 1-1 – Map showing NAL mineral titles. ............................................................................................ 28 Figure 1-2 – Multiple exposure of pegmatite dykes in the pit (face looking west). ................................... 30 Figure 1-3 – North American Lithium ultimate pit design – Plan view. ...................................................... 37 Figure 2-1 – View of the open pit visited during the site tour. ................................................................... 51 Figure 2-2 – Core storage facility at the Project site. .................................................................................. 51 Figure 2-3 – Core review at the core storage facility. ................................................................................. 52 Figure 3-1 – NAL property location coordinates (Source: Google Earth). .................................................. 59 Figure 3-2 – Approximate Property Location. ............................................................................................. 60 Figure 3-3 – Property Overview Map. ......................................................................................................... 61 Figure 3-4 – Map showing NAL mineral titles. ............................................................................................ 64 Figure 4-1 – Location of the NAL Property (Source: Google Earth). ........................................................... 69 Figure 4-2 – General arrangement of existing and planned infrastructure at the mine site. .................... 70 Figure 4-3 – View looking northwesterly across the plant and mine site................................................... 71 Figure 4-4 – View looking southeasterly showing the plant facilities in the foreground of the tailings impoundment area. .................................................................................................................................... 72 Figure 5-1 – Québec Lithium Project open pit mine operations at peak in 20145452. .............................. 82 Figure 6-1 – Local geology map. ................................................................................................................. 85 Figure 6-2 – Stratigraphy of the NAL Project. ............................................................................................. 86 Figure 6-3 – History of La Motte and La Corne plutons (Modified from Mulja et al., 1995b). ................... 88 Figure 6-4 – Property geology map. ............................................................................................................ 90 Figure 6-5 – General geological cross-section looking northwest. ............................................................. 91 Figure 6-6 – Coarse-grained pegmatitic dyke in hole NAL-16-16. .............................................................. 93 Figure 6-7 – Spodumene megacrystals perpendicular to PEG2 contact zone in hole QL-S09-026. ........... 93 Figure 6-8 – Preferential orientation of spodumene crystals in hole NAL-16-024. .................................... 94 Figure 6-9 – Multiple exposure of pegmatite dykes in the pit (face looking west). ................................... 95 Figure 6-10 – Coarse- to fine-grained spodumene mineralization in hole NAL-16-024. ............................ 95 Figure 6-11 – Pegmatitic dyke zoning and alteration in hole NAL-16-036. ................................................ 96 North American Lithium DFS Technical Report Summary – Quebec, Canada 20 Figure 6-12 – Chemical evolution of lithium-rich pegmatites over distance (London, 2008). ................... 98 Figure 8-1 – Core logging facilities at RNC exploration office in Amos, a 35 km drive to the mine site. . 104 Figure 8-2 – Core storage sheds and facilities at the NAL’s mine site. ..................................................... 104 Figure 8-3 – Infill and extension drilling campaign (late 2016). ................................................................ 108 Figure 8-4 – Drillholes plan view (2009 to 2019). ..................................................................................... 110 Figure 9-1 – View of the open pit visited during the site tour. ................................................................. 115 Figure 9-2 – Core storage facility at the Project site. ................................................................................ 116 Figure 9-3 – Core review at the core storage facility. ............................................................................... 116 Figure 10-1 – Monthly spodumene concentrate production. .................................................................. 123 Figure 10-2 – Concentrate grade and lithium recovery (monthly averages). ........................................... 123 Figure 10-3 – Ore sorting test program material (pegmatite upper left, granodiorite upper right, basalt lower). ....................................................................................................................................................... 126 Figure 10-4 – Example images of sorted products. .................................................................................. 127 Figure 10-5 – Magnetic and non-magnetic fractions from test conducted at 8,000 gauss. ..................... 127 Figure 10-6 – Iron rejection and Li loss to magnetic concentrate for pegmatite with 10% granodiorite (left) and 10% basalt (right). .............................................................................................................................. 129 Figure 10-7 – Optimized flotation test results. ......................................................................................... 129 Figure 10-8 – Drillhole locations for the various metallurgical testing samples....................................... 132 Figure 10-9 – Optimized batch flowsheet. ................................................................................................ 135 Figure 10-10 – Batch test grade-recovery curves. .................................................................................... 137 Figure 10-11 – Locked-cycle flowsheet (Composite 1). ............................................................................ 138 Figure 10-12 – Pilot plant flowsheet (PP-06). ........................................................................................... 140 Figure 10-13 – Grade – recovery curves. .................................................................................................. 142 Figure 10-14 – Fe2O3 vs. Li2O in the concentrate. ..................................................................................... 143 Figure 10-15 – Grade – recovery curves. .................................................................................................. 147 Figure 10-16 – Comparison of WHIMS performance with basalt vs. granodiorite host rock. .................. 148 Figure 10-17 – Composite samples – Effect of grind size. ........................................................................ 154 Figure 10-18 – Effect of collector (FA-2) dosage on flotation performance. ............................................ 155 Figure 10-19 – Example of the impact of dilution on flotation performance. .......................................... 156

North American Lithium DFS Technical Report Summary – Quebec, Canada 21 Figure 10-20 – Example of the impact of dilution on flotation performance. .......................................... 157 Figure 10-21 – Testwork analysis: grade-recovery correlation................................................................. 158 Figure 11-1 – 2023 MRE mineralized zone locations. ............................................................................... 160 Figure 11-2 – 3D view looking north of the pegmatite dykes and drillhole. ............................................ 161 Figure 11-3 – 3D Interpretation of pegmatite dyke. ................................................................................. 163 Figure 11-4 – Lithology model. ................................................................................................................. 163 Figure 11-5 – Historical mining voids adjusted to fit pegmatite dykes, shown with semi-transparent pegmatite dykes. ....................................................................................................................................... 164 Figure 11-6 – Distribution of the length before (left) and after (right) compositing. ............................... 167 Figure 11-7 – Capping analysis for Dyke A; capping at 2.3% Li2O. ............................................................ 169 Figure 11-8 – Variography study in Edge (example from one zone). ....................................................... 170 Figure 11-9 – Variography study in Supervisor (example from one zone). .............................................. 171 Figure 11-10 – Visual inspection on a cross-section looking to the west. Note that discrepancy between drillholes intercepts and modelled dykes are due to the 50 m clipping of the section view; all intercepts are snapped to drillholes. ......................................................................................................................... 179 Figure 11-11 – Swath plot for mineralized dyke A - direction Y. .............................................................. 180 Figure 11-12 – Classification distribution on a longitudinal section looking northwest. Connecting blue and red blocks mathematically meet 80 m and 150 m drill spacings, respectively. The blue and red outlines represent the manual classification. ......................................................................................................... 182 Figure 12-1 – Cross section illustrating stope solids in various geological settings. ................................. 188 Figure 12-2 – Cross-section view – 10 m envelope surrounding underground workings for pit optimization. Topography shown as green line, stopes and workings as dark shaded area, 10 m offset as yellow polylines. .................................................................................................................................................................. 191 Figure 12-3 – Pit optimization results. ...................................................................................................... 195 Figure 12-4 – Single-lane in-pit haul ramp design. ................................................................................... 199 Figure 12-5 – Dual-lane in-pit haul ramp design. ...................................................................................... 199 Figure 12-6 – Ultimate pit – plan view. ..................................................................................................... 200 Figure 13-1 – Isometric view of Phase 1. .................................................................................................. 206 Figure 13-2 – Isometric view of Phase 2. .................................................................................................. 207 Figure 13-3 – Isometric view of Phase 3. .................................................................................................. 207 Figure 13-4 – Isometric view of Phase 4. .................................................................................................. 208 North American Lithium DFS Technical Report Summary – Quebec, Canada 22 Figure 13-5 – Isometric view of Phase 5. .................................................................................................. 208 Figure 13-6 – Isometric view of Phase 6. .................................................................................................. 209 Figure 13-7 – LOM Summary. ................................................................................................................... 211 Figure 13-8 – 2023 mined area isometric view. ........................................................................................ 212 Figure 13-9 – 2024 mined areas isometric view. ...................................................................................... 212 Figure 13-10 – 2025 mined areas isometric view. .................................................................................... 213 Figure 13-11 – 2030 mined areas isometric view. .................................................................................... 213 Figure 13-12 – 2035 mined areas isometric view. .................................................................................... 214 Figure 13-13 – 2040 mined areas isometric view. .................................................................................... 214 Figure 13-14 – Ultimate Pit isometric view. .............................................................................................. 215 Figure 13-15 – Section view of mining method. ....................................................................................... 217 Figure 14-1 – Simplified process flowsheet – concentrator. .................................................................... 223 Figure 15-1 – NAL Projected project site layout at end of life of mine. ................................................... 233 Figure 15-2 – Tailings Storage Facility No. 2 (TSF-2) layout. ..................................................................... 239 Figure 15-3 – Illustration of tailings production assumptions. ................................................................. 240 Figure 15-4 – General cross-section of the tailings and waste rock facility.............................................. 242 Figure 15-5 – Critical section for slope stability analysis – Profile 1 (TSF-2). ............................................ 244 Figure 15-6 – Critical section for slope stability analysis – Profile 2 (Basin BO-13). ................................. 245 Figure 15-7 – Critical section for slope stability analysis – Profile 3 (Basin BO-12). ................................. 246 Figure 15-8 – Project watersheds under present conditions.................................................................... 251 Figure 15-9 – Project watersheds in updated conditions. ........................................................................ 252 Figure 15-10 – Flow Diagram at NAL site – current operating conditions. ............................................... 255 Figure 16-1 – et balance (supply vs demand) for battery grade lithium, 2020-2040 (Source: Lithium-Price- Forecast-Q4-2022-Benchmark-Mineral-Intelligence, PwC Analysis). ....................................................... 260 Figure 16-2 – Spodumene concentrate price forecast 2020-2040. .......................................................... 262 Figure 16-3 – Battery-Grade Lithium Carbonate Price Forecast 2022-2040. ........................................... 263 Figure 16-4 – Spodumene price forecast (as % of carbonate price) 2020-2040. ..................................... 264 Figure 16-5 – Refined demand by product, 2020-2040 (Source: Lithium-Price-Forecast-Q4-2022- Benchmark-Mineral-Intelligence, PwC Analysis). ..................................................................................... 266 North American Lithium DFS Technical Report Summary – Quebec, Canada 23 Figure 16-6 – Lithium demand by end use, 2020-2040 (Sources: Lithium-Price-Forecast-Q4-2022- Benchmark-Mineral-Intelligence, PwC Analysis). ..................................................................................... 267 Figure 16-7 – Mine capacity by type, 2020-2040 (kt LCE) (Sources: Lithium-Price-Forecast-Q4-2022- Benchmark-Mineral-Intelligence, PwC Analysis). ..................................................................................... 268 Figure 16-8 – Refined production capacity by product, 2020-2040 (kt LCE) (Sources: Lithium-Price- Forecast-Q4-2022-Benchmark-Mineral-Intelligence, PwC Analysis). ....................................................... 269 Figure 16-9 – Refined Production by Raw Material, 2020-2040 (kt LCE) (Sources: Lithium-Price-Forecast- Q4-2022-Benchmark-Mineral-Intelligence, PwC Analysis). ...................................................................... 270 Figure 18-1 – Concentrator operating costs. ............................................................................................ 301 Figure 18-2 – Tailings operating cost breakdown. .................................................................................... 304 Figure 19-1 – Production of spodumene concentrate of the LOM........................................................... 309 Figure 19-2 – NAL open pit production profile and Authier ore supply. .................................................. 310 Figure 19-3 – Average annual spodumene price sensitivities. ................................................................. 313 Figure 19-4 – DFS Sensitivity analysis on NPV @ 8%. ............................................................................... 313 Figure 20-1 – Local metallic deposits and showings. ................................................................................ 315 Figure 20-2 – Claim map of adjacent properties (Supplied by Sayona, March 27, 2023). ....................... 316 North American Lithium DFS Technical Report Summary – Quebec, Canada 24 1. EXECUTIVE SUMMARY 1.1 INTRODUCTION This S-K §229.1304 compliant Technical Report Summary (the Report) was prepared at the request of Piedmont Lithium Inc (Piedmont) by Sayona Quebec, based on an existing Technical Report compiled according to the Canadian Institute of Mining, Metallurgy and Petroleum (CIM) reporting guidelines as used in National Instrument 43-101 standards (NI 43-101), which has been previously published and filed by Sayona Mining Limited (Sayona Mining or Sayona). The North American Lithium (NAL) property is wholly owned and operated by Sayona Quebec Inc (Sayona Quebec), with Sayona owning 75% and Piedmont 25% of Sayona Quebec in a Joint Venture agreement. Sayona, the registrant of the original NI 43-101 compliant Technical Report, engaged the services of BBA Inc., Synectiq Inc. and SGS Canada Inc., supporting qualified firms staffed with professional engineers, geologists, and process engineers, to prepare the Technical Report at the Definitive Feasibility Study (DFS) level; using data gathered by the Qualified Persons (QPs) to the disclosure requirements for the Canadian Institute of Mining, Metallurgy and Petroleum (CIM) reporting guidelines as used in National Instrument 43-101 standards (NI 43-101) to compile said report. Piedmont serves as the registrant of this S-K §229.1304 compliant Technical Report Summary. The statement is based on information provided by Sayona Quebec and reviewed by various professionals and Qualified Persons from Sayona Quebec, or references to information in this Report may not be used without the written permission of Sayona Quebec. Qualified professionals who contributed to the drafting of this report meet the definition of Qualified Persons (QPs), consistent with the requirements of the SEC. The information in this Report related to ore resources and mineral reserves is based on, and fairly represents, information compiled by the QPs as of the effective date of the report. The NAL property is considered material to Piedmont. This report has an effective date of December 31, 2023. The NAL project is being mined through surface mining methods by the sole proprietor, Sayona Quebec. 1.2 FORWARD LOOKING NOTICE Sections of the report contain estimates, projections and conclusions that are forward-looking information within the meaning of applicable securities laws. Forward-looking statements are based upon the responsible QP’s opinion at the time that they are made but, in most cases, involve significant risk and

North American Lithium DFS Technical Report Summary – Quebec, Canada 25 uncertainty. Although the responsible QP has attempted to identify factors that could cause actual events or results to differ materially from those described in this report, there may be other factors that cause events or results to not be as anticipated, estimated, or projected. None of the QPs undertake any obligation to update any forward-looking information. There can be no assurance that forward-looking information in any section of the report will prove to be accurate in such statements or information. Accordingly, readers should not place undue reliance on forward-looking information. This report also includes methodologies behind the derivation of mineral resources and ore reserves, as defined under the United States Securities and Exchange Commission (SEC), through the consideration of geological, mining, and environmental factors. Probable ore reserves, derived from an indicated resource, both of which are assessed in this report, ultimately contribute to revenues and profits in a hypothetical business plan which aligns with Sayona Quebec’s mining plan of the subject property as of December 31, 2023, the effective date of this report. Certain information set forth in this report contains “forward- looking information”, including production of reserves, associated productivity rates, operating costs, capital costs, sales prices, and other assumptions. These statements are not guarantees of future performance and undue reliance should not be placed on them. The assumptions used to develop the forward-looking information and the risks that could cause the actual results to differ materially are detailed in the body of this report. By definition, “Indicated” and “Probable” terminology carries a lower level of geological and engineering confidence than that which would be reflected through the derivation of “Measured” resources and “Proven” reserves. “Indicated” definitions provide a confidence level to support broad estimates of Mineral Resource quantity and grade adequate for long-term mine planning to support “Probable” Reserve definitions. Resource and reserve estimations, and their impacts on production schedules, processing recoveries, saleable product tonnages, costs, revenues, profits, and other results presented in this report align with the definition and accuracy of indicated resources and probable reserves. Through future exploration campaigns, geological and engineering studies, Sayona Quebec desires to elevate classifications of resources and reserves in due time. 1.3 BACKGROUND Sayona Quebec Inc. (Sayona Quebec) a joint venture between Sayona Mining Limited (ASX code: SYA; OTCQB: SYAXF) (75%) and Piedmont Lithium Inc. (Nasdaq: PLL, ASX: PLL) (25%) acquired the North American Lithium Inc. (NAL) mine and concentrator in La Corne, Québec, in August 2021. The operation, which was placed on care and maintenance in 2019, and has restarted since Fall 2022, includes an open pit hard rock mine, exploiting lithium-bearing pegmatite dykes, with mineral processing and lithium carbonate production facilities. This report (the Report) has been prepared at the request of Piedmont, the registrant, to present the Definitive Feasibility study (DFS) outcomes for the North American Lithium Project (NAL). North American Lithium DFS Technical Report Summary – Quebec, Canada 26 The Project’s property (the “Property”) has seen historic production from an underground mine (1950s- 1960s) with production of spodumene concentrate and lithium chemicals. More recently the mine and concentrator operated under Québec Lithium (2013-2014) and North American Lithium (2017-2019). Since acquisition August 26, 2021, Sayona Quebec has undertaken considerable work in an effort to resume open-pit mining and restart concentrator operations, which occurred respectively in Fall 2022 and Q1-2023. 1.4 PROPERTY DESCRIPTION AND OWNERSHIP The Property is situated in La Corne Township in the Abitibi-Témiscamingue region, approximately 38 km southeast of Amos, 15 km west of Barraute and 60 km north of Val-d’Or, in Québec, Canada. It is accessible by provincial highway 111, connecting Val-d’Or and Amos, or, alternatively, by provincial highway 397, connecting Val-d’Or and Barraute. Val-d’Or and Rouyn-Noranda are serviced daily by regional air carriers; the closest all-weather landing strip and helipad is located at Amos. A Canadian National (CN) railway line runs through Barraute, a CN section town, and passes approximately 11 km to the north of the Property, but there is no spur line running to the site. On August 26, 2021, Sayona Québec (“Sayona”), a subsidiary company of Sayona Mining Ltd., acquired NAL. At the time, all claims (19) were registered in the name of NAL for a total area of 583.51 ha. The mining lease (BM1005) is also under NAL’s name and covers an area of 116.4 Ha. Since the acquisition of the Project, NAL acquired 20 claims spanning roughly 750 ha from Resources Jourdan Inc. and two claims with a total area of 42.3 ha from Lise Daigle. Refer Table 1-1. The author has not verified the legal titles to the Property or any underlying agreement(s) that may exist concerning the licenses or other agreement(s) between third parties. There are no royalties applicable to any mineral substances extracted from the lands subject to the aforementioned mining titles. The author did not verify the legality or terms of any underlying agreement(s) that may exist concerning the Project ownership, permits, offtake agreements, license agreements, royalties, or other agreement(s) between NAL / Sayona Québec and any third parties. Table 1-1 and Figure 1-1 present the mining titles of interest. North American Lithium DFS Technical Report Summary – Quebec, Canada 27 Table 1-1 – Mining titles list and details. Claim Name Claim Status Issue Date Anniversary Date Area (ha) Owner Work Required for Renewal BM 1005 Active May 29, 2012 May 28, 2032 116.39 Lithium Amérique du Nord Inc. 100% $0 CDC 2145325 Active Mar 17, 2008 Nov 24, 2024 31.25 Lithium Amérique du Nord Inc. 100% $2,500 CDC 2145326 Active Mar 17, 2008 Nov 24, 2024 32.12 Lithium Amérique du Nord Inc. 100% $2,500 CDC 2145327 Active Mar 17, 2008 Nov 24, 2022 42.85 Lithium Amérique du Nord Inc. 100% $2,500 CDC 2145328 Active Mar 17, 2008 Nov 24, 2024 41.64 Lithium Amérique du Nord Inc. 100% $2,500 CDC 2145329 Active Mar 17, 2008 Nov 24, 2024 16.76 Lithium Amérique du Nord Inc. 100% $1,000 CDC 2145330 Active Mar 17, 2008 Nov 24, 2024 23.81 Lithium Amérique du Nord Inc. 100% $1,000 CDC 2145331 Active Mar 17, 2008 Nov 24, 2024 15.29 Lithium Amérique du Nord Inc. 100% $1,000 CDC 2145332 Active Mar 17, 2008 Nov 24, 2024 22.75 Lithium Amérique du Nord Inc. 100% $1,000 CDC 2145333 Active Mar 17, 2008 Nov 24, 2024 46.94 Lithium Amérique du Nord Inc. 100% $2,500 CDC 2145334 Active Mar 17, 2008 Nov 24, 2024 17.59 Lithium Amérique du Nord Inc. 100% $1,000 CDC 2145335 Active Mar 17, 2008 Nov 24, 2024 1.53 Lithium Amérique du Nord Inc. 100% $1,000 CDC 2145336 Active Mar 17, 2008 Nov 24, 2024 35.92 Lithium Amérique du Nord Inc. 100% $2,500 CDC 2154760 Active May 26, 2008 May 25, 2023 41.71 Lithium Amérique du Nord Inc. 100% $2,500 CDC 2154761 Active May 26, 2008 May 25, 2023 41.64 Lithium Amérique du Nord Inc. 100% $2,500 CDC 2154987 Active May 26, 2008 Feb 2, 2023 42.15 Lithium Amérique du Nord Inc. 100% $2,500 CDC 2154988 Active May 26, 2008 Feb 2, 2023 42.15 Lithium Amérique du Nord Inc. 100% $2,500 CDC 2154989 Active May 26, 2008 Feb 2, 2023 42.68 Lithium Amérique du Nord Inc. 100% $2,500 CDC 2154990 Active May 26, 2008 Feb 2, 2023 42.65 Lithium Amérique du Nord Inc. 100% $2,500 CDC 2154991 Active May 26, 2008 Feb 2, 2023 42.67 Lithium Amérique du Nord Inc. 100% $2,500 CDC 2154992 Active May 26, 2008 Feb 2, 2023 21.45 Lithium Amérique du Nord Inc. 100% $1,000 CDC 2154993 Active May 26, 2008 Feb 2, 2023 21.31 Lithium Amérique du Nord Inc.100% $1,000 CDC 2167933 Active Jul 28, 2008 Jul 27, 2023 43.07 Lithium Amérique du Nord Inc.100% $2,500 CDC 2167934 Active Jul 28, 2008 Jul 27, 2023 42.63 Lithium Amérique du Nord Inc.100% $2,500 CDC 2167935 Active Jul 28, 2008 Jul 27, 2023 42.67 Lithium Amérique du Nord Inc.100% $2,500 CDC 2167936 Active Jul 28, 2008 Jul 27, 2023 42.71 Lithium Amérique du Nord Inc.100% $2,500 CDC 2167937 Active Jul 28, 2008 Jul 27, 2023 42.71 Lithium Amérique du Nord Inc.100% $2,500 CDC 2167938 Active Jul 28, 2008 Jul 27, 2023 42.71 Lithium Amérique du Nord Inc.100% $2,500 CDC 2444462 Active May 11, 2016 May 10, 2023 21.66 Lithium Amérique du Nord Inc.100% $500 CDC 2444463 Active May 11, 2016 May 10, 2023 13.53 Lithium Amérique du Nord Inc.100% $500 CDC 2490652 Active Apr 25, 2017 Apr 24, 2024 4.21 Lithium Amérique du Nord Inc.100% $500 CDC 2490653 Active Apr 25, 2017 Apr 24, 2024 10.67 Lithium Amérique du Nord Inc. 100% $500 CDC 2490654 Active Apr 25, 2017 Apr 24, 2024 37.72 Lithium Amérique du Nord Inc. 100% $1,200 CDC 2490655 Active Apr 25, 2017 Apr 24, 2024 26.5 Lithium Amérique du Nord Inc. 100% $1,200 CDC 2490656 Active Apr 25, 2017 Apr 24, 2024 44.59 Lithium Amérique du Nord Inc. 100% $1,200 CDC 2520959 Active Jul 19, 2018 Jul 18, 2023 42.99 Lithium Amérique du Nord Inc. 100% $1,200 CDC 2521244 Active Jul 20, 2018 Jul 19, 2023 57.2 Lithium Amérique du Nord Inc. 100% $1,200 CDC 2521245 Active Jul 20, 2018 Jul 19, 2023 57.2 Lithium Amérique du Nord Inc. 100% $1,200 CDC 2521246 Active Jul 20, 2018 Jul 19, 2023 57.2 Lithium Amérique du Nord Inc. 100% $1,200 CDC 2521247 Active Jul 20, 2018 Jul 19, 2023 37.03 Lithium Amérique du Nord Inc. 100% $1,200 CDC 2569722 Active Jun 23, 2020 Jun 22, 2023 20.53 Lithium Amérique du Nord Inc. 100% $500 CDC 2569723 Active Jun 23, 2020 Jun 22, 2023 21.78 Lithium Amérique du Nord Inc. 100% $500 Total 1,492.56 $68,100 North American Lithium DFS Technical Report Summary – Quebec, Canada 28 Figure 1-1 – Map showing NAL mineral titles. 1.4.1 Surface Rights The NAL property consists of a contiguous group of 42 mineral titles (41 claims, 1 mining lease). The mining lease was granted to Quebec Lithium Corp. (QLI) on 29 May 2012, on the basis of a PFS filed at the time in support of the application to be granted such a lease. The mining lease has an initial term of 20 years, expiring on 28 May 2032. 1.4.2 Property History The original discovery of spodumene-bearing pegmatite on the Property was made in 1942; the site was first put into production in 1955 by QLI, who had acquired the Property in 1954. At the end of 1955, two stopes were in operation that contained approximately 136,000 metric tonnes of ore grading 1.2% Li2O. The original mine ran from 1955 until 1959, and intermittently after that until 1965, with altogether 938,292 t of ore milled from 1,084,738 t mined from underground operations. In the first few years of

North American Lithium DFS Technical Report Summary – Quebec, Canada 29 operation, QLI sold spodumene concentrate to Lithium Corporation of America Inc., but by mid-1959, this contract had been cancelled and refining facilities were built and operated at site, producing lithium chemicals, including lithium carbonate, lithium hydroxide monohydrate and lithium chloride; however, owing to the combination of a strike and depressed market conditions, the operation was finally shut down in 1965, but not for a lack of resources. The Property underwent a number of changes in ownership, but in 1987, Cambior Inc. acquired all assets of QLI. Through 1990-1991 the site underwent rehabilitation, and the mining facilities were once again sold. In May 2008, Canada Lithium Corp. (CLC) acquired the Property. Under their ownership, a program of metallurgical testwork was completed to produce battery-grade lithium carbonate and in 2010, a pre- feasibility study was completed for the development of an open-pit mine and lithium carbonate plant that was intended to operate for 15 years. In December 2010, CLC issued a feasibility study to further advance the Project, with a decision taken to proceed to construction that would begin in September 2011. The Project operated from late 2012 until September 2014, when it faced commissioning issues and mounting commercial and financial difficulties. The plant was placed on care and maintenance in November 2014 and remained so until July 2016, when it was acquired by NAL, who proceeded to carry out additional infill diamond drilling and updated studies, along with engineering works to recommission the Project to resume production in 2017. NAL operated from 2017 to 2019 and was put on care and maintenance in March 2019 due to poor market conditions. Following Sayona’s acquisition of the NAL project in La Corne, Québec, in August 2021, historical geological, mining and process data was reviewed to fully evaluate the project. The data review process allowed for the update of the Ore Reserves Estimate and increased concentrator mill throughput, from 3,800 tonnes per day (tpd) to 4,200 tpd to produce a 6% Li2O spodumene concentrate. 1.5 GEOLOGY AND MINERALIZATION 1.5.1 Geology The Property is comprised of granodiorite of the Lacorne batholith, volcanics and some biotite schists as well as the pegmatite dykes that mainly intrude the granodiorite and the volcanics. Volcanic rocks on the Property are represented by dark green mafic metavolcanics and medium-grey silicified intermediate volcanics. Both mafic and intermediate volcanic rocks are affected by moderate- North American Lithium DFS Technical Report Summary – Quebec, Canada 30 to-strong pervasive silicification, minor chloritization and patchy-to-pervasive lithium alteration. There is alteration of the green hornblende in proximity to the spodumene pegmatite. Locally, granodiorite contains fragments of the same composition, or that are slightly enriched in muscovite. It contains patchy-to-pervasive lithium and/or chlorite alteration, weak epidote alteration and locally pervasive potassic alteration. Over 49 spodumene-bearing dykes have been interpreted on the Property, some of which were successfully traced in surface exposures over more than 700 m along strike and nearly 70 m vertically down pit walls. The dykes intrude the granodiorite from the La Corne batholith and the mafic volcanics. They are dominantly bearing south-easterly and dipping steeply to the SW with splays, splits and bends that were observed, mapped, and correlated from bench to bench in the pit. This main structural trend is locally confronted with a secondary structural orientation striking east westerly with dykes and splays developing as conjugated sets. The dykes were found to be geometrically relatively continuous once exposed over long distances and across several benches in the pit. Figure 1-2 shows dykes exposed in the pit. The spodumene dykes can vary in width from tens of centimeters, up to 90 m and are interpreted to extend for several hundred meters in length. Most of the dykes greater than approximately 3 m in width are spodumene-bearing. Occurrences of spodumene are widely, yet variably, spread throughout the dykes in swarms, displaying faint greenish shades, when present, and sometimes locally revealing large centimetric to decimetric crystal gradation in clusters. Figure 1-2 – Multiple exposure of pegmatite dykes in the pit (face looking west). 1.5.2 Mineralization Over 49 spodumene-bearing dykes have been interpreted on the Property, some of which were successfully traced in surface exposures over more than 700 m along strike and nearly 70 m vertically North American Lithium DFS Technical Report Summary – Quebec, Canada 31 down pit walls. The dykes intrude the granodiorite from the La Corne batholith and the mafic volcanics. They are dominantly bearing south easterly and dipping steeply to the SW with splays, splits and bends that were observed, mapped, and correlated from bench to bench in the pit. This main structural trend is locally confronted with a secondary structural orientation striking east westerly with dykes and splays developing as conjugated sets. The dykes were found to be geometrically relatively continuous once exposed over long distances and across several benches in the pit. The current interpreted mineralized system extends more than 2 km in the NW-SE direction, over a width of approximately 800 m, and remains largely open at depth. There appears to be one persistent subset of dykes that strike obliquely, east westerly, to this main orientation. 1.6 EXPLORATION STATUS 1.6.1 Historical Drilling The Project database is current, as of December 31, 2022, and consists of 600 surface-collared and 652 underground-collared diamond drillholes (DDH) with a cumulative length of 119,328 m. A subset of 247 DDH were used to build the model, and includes drillhole information from the 2009, 2010, 2011, 2016 and 2019 diamond drilling programs. Historical underground drillholes and previous historical drilling programs were used for reference purposes only as they were missing critical information and/or the level of confidence in the data quality was insufficient. Sayona Quebec has not completed any drilling on the Project at the time of the release of the DFS but carried out a sampling program of historical core in 2002. The purpose of the program was to: • Sample intervals falling within the new 3D modelled pegmatite dykes. In most cases, the core had been described as pegmatite, but had not been sampled • Sample pegmatite intervals to obtain a valid Fe content database for pegmatites. • Sample host rock intervals to obtain a valid Fe content database for each host rock lithologies (Granodiortie, Volcanics, Gabbro). • Sample all lithologies (Pegmatite, Granodiorite, Volcanics, Gabbro) to obtain a valid density database. • Chosen core samples were invariably sawn in half, with one half of the sample interval submitted for lithium, iron and density analysis, and the remainder kept for future testing and/or reference. Lengths were adjusted as necessary to reflect geological and/or mineralization contacts. For Li2O % and Fe %, a total of 574 core samples were collected from 129 drillholes. For density measurements, a total of 600 core samples were collected from 97 drillholes. Samples were delivered by Sayona Quebec personnel to SGS Laboratories, for sample preparation and primary analysis. Coarse rejects were returned to the mine site for storage and reference. North American Lithium DFS Technical Report Summary – Quebec, Canada 32 Since the publication of the DFS, a drilling campaign has been conducted by Sayona (Section see 7.0) It is the QP’s opinion that the drilling and logging procedures put in place by Canada Lithium Corp., North American Lithium Corp., and Sayona Quebec met acceptable industry standards at the time of sampling and that the information can be used for geological and resource modelling. 1.6.2 Quality Assurance and Quality Control (QA/QC) Quality assurance and quality control (QA/QC) procedures that conform to current industry standards were developed and implemented for the drilling programs from 2016 to 2019 and QA/QC data were reviewed by the QP. The QP reviewed the sample preparation, analytical and security procedures, as well as insertion rates and the performance of blanks, standards, and duplicates for historical drilling program and the 2022 sampling programs and concluded that the observed failure rates are within expected ranges and that no significant assay biases are present. The overall assay results of the drill programs are valid and could be relied upon for geological modelling and mineral resource estimation or other purposes. 1.7 MINERAL RESERVE ESTIMATES The North American Lithium (NAL) Mineral Reserves have been estimated for a total of 20.4 Mt of Proven and Probable Mineral Reserves at an average grade of 1.10% Li2O, which is comprised of 0.3 Mt of Proven Mineral Reserves at an average grade of 1.40% Li2O and 20.2 Mt of Probable Mineral Reserves at an average grade of 1.08% Li2O. The Mineral Reserve Estimate considers the open-pit constrained portion of the Mineral Resources. Table 1-2 below presents the NAL Mineral Reserve Estimate. In addition to the 20.4 Mt of ore, a total of 172.3 Mt of waste and 7.1 Mt of overburden must be mined, resulting in an overall LOM strip ratio of 8.3.

North American Lithium DFS Technical Report Summary – Quebec, Canada 33 Table 1-2 – NAL Mineral Reserve Statement at effective date of December 31, 2023 based on USD $1,352/t Li₂O. North American Lithium Project Ore Reserve Estimate (0.60% Li2O cut-off grade) Category Tonnes (Mt) Grades (%Li2O) Cut-off Grade % Li2O Met Recovery % Proven Ore Reserves 0.3 1.40 0.60 73.6 Probable Ore Reserves 20.2 1.08 0.60 73.6 Total Ore Reserves 20.4 1.10 0.60 73.6 1. Ore Reserves are measured as dry tonnes at the crusher above a diluted cut-off grade of 0.60% Li2O. 2. Mineral Reserves result from a positive pre‐tax financial analysis based on a variable 5.4% to 5.82% Li2O spodumene concentrate average selling price of US$1,352/t and an exchange rate of 0.75 US$:1.00 C$. The selected optimized pit shell is based on a revenue factor of 0.6 applied to a base case selling price of US$1,352/tonne of concentrate. 3. Topographic surface as of December 31, 2022, and mining forecast and ramp-up data was used to adjust for December 31, 2023. 4. The reference point of the Mineral Reserves Estimate is the NAL crusher feed. 5. In-situ mineral resources are converted to Mineral Reserves based on pit optimization, pit design, mine scheduling and the application of modifying factors, all of which support a positive LOM cash flow model. According to SEC Definition Standards on Mineral Resources and Reserves, Inferred Resources cannot be converted to Mineral Reserves. 6. The waste and overburden to ore ratio (strip ratio) is 8.3. 7. The Mineral Reserves for the Project was originally estimated by Mélissa Jarry, P.Eng. OIQ #5020768, and subsequently reviewed by Philippe Chabot, P.Eng., who serves as the QP under S-K §229.1304. 8. Mineral Reserves are valid as of December 31, 2023. 9. Totals may not add up due to the rounding of significant figures. The Mineral Reserves Estimates have been classified according to the underlying classification of the Mineral Resource Estimates and the status of the Modifying Factors. The status of the Modifying Factors is generally considered sufficient to support the classification of Proven Mineral Reserves when based upon Measured Mineral Resources, and Probable Mineral Reserves when based upon Indicated Mineral Resources. 1.8 MINERAL RESOURCE ESTIMATE The Mineral Resource Estimate (MRE) was originally prepared by BBA Inc and subsequently reviewed by Ehouman N’Dah, P.Geo., who serves as the QP for this report. The effective date for the MRE is 31 December 2022. The Mineral Resource Estimate, which is inclusive of the mineral reserves, has been tabulated in Table 1-3. North American Lithium DFS Technical Report Summary – Quebec, Canada 34 Table 1-3 – NAL Mineral Resource statement at effective date of December 31, 2022 based on USD $1,273/t Li₂O, inclusive of Mineral Reserves. NAL – Open-pit Constrained Mineral Resource Statement Category Tonnes (MT) Grade (% Li2O) Cut-Off Grade % Li2O Met Recovery % Measured 1 1.19 0.60 73.6 Indicated 24 1.23 0.60 73.6 Measured and Indicated 25 1.23 0.60 73.6 Inferred 22 1.20 0.60 73.6 NAL – Underground Constrained Mineral Resource Statement Category Tonnes (Mt) Grade (% Li2O) Cut-Off Grade % Li2O Met Recovery % Measured - - 0.60 73.6 Indicated - - 0.60 73.6 Measured and Indicated - - 0.60 73.6 Inferred 11 1.30 0.80 73.6 NAL – Total Open Pit and Underground Constrained Mineral Resource Statement Category Tonnes (Mt) Grade (% Li2O) Cut-Off Grade % Li2O Met Recovery % Measured 1 1.19 0.60 73.6 Indicated 24 1.23 0.60 73.6 Measured and Indicated 25 1.23 0.60 73.6 Inferred 33 1.20 0.67 73.6 1. The Mineral Resource was originally estimated by Pierre-Luc Richard, P.Geo., and subsequently reviewed by Ehouman N’Dah, P.Geo., who serves as the Qualified Person under S-K §229.1304 and assumes responsibility. The effective date of the estimate in the report remains December 31, 2022. 2. The Mineral Resource Estimate is inclusive of Mineral Reserves. 3. Mineral Resources are 100% attributable to the property. Sayona Quebec has 100% interest in North American Lithium. 4. These mineral resources are not mineral reserves as they do not have demonstrated economic viability. The quantity and grade of reported Inferred resources in this MRE are uncertain in nature and there has been insufficient exploration to define these resources as Indicated or Measured; however, it is reasonably expected that the majority of Inferred Mineral Resources could be upgraded to Indicated Mineral Resources with continued exploration. 5. Resources are presented undiluted, pit constrained and within stope shapes, and are considered to have reasonable prospects for eventual economic extraction. Although the calculated cut-off grade is 0.15% Li2O for open pit, a cut-off grade of 0.60% Li2O was used for the MRE due to processing limitations. The pit optimization was done using Deswik mining software. The constraining pit shell was developed using pit slopes of 46 to 53 degrees. The open-pit cut-off grade and pit optimization were calculated using the following parameters (amongst others): 5.40% Li2O concentrate price = $1,273 USD per tonne; CAD:USD exchange rate = 1.32; Hard Rock and Overburden Mining cost = $5.12/t mined; Mill Recovery of 73.6%; Processing cost = $23.44/t processed; G&A = $6.00/t processed; Transportation cost = $118.39/t conc; Tailing Management Cost = $2.86/t processed, and Water treatment $0.18/t processed. The cut-off grade for underground resources was calculated at 0.62% Li2O but rounded to 0.60% Li2O; it used identical costs and recoveries, except for mining costs being at $100/t. Cut-off grades will be re-evaluated in light of future prevailing market conditions and costs. 6. The MRE was prepared using Leapfrog Edge™ and is based on 247 surface drillholes. The resource database was validated before proceeding to the resource estimation. Grade model resource estimation was interpolated from drillhole data using OK and ID2 interpolation methods within blocks measuring 5 m x 5 m x 5 m in size and subblocks of 1.25 m. North American Lithium DFS Technical Report Summary – Quebec, Canada 35 7. The model comprises 49 mineralized dykes (which have a minimum thickness of 2 m, with rare exceptions between 1.5 m and 2 m). 8. High-grade capping was done on the composited assay data. Capping grades was fixed at 2.3% Li2O. A value of zero grade was applied in cases where core was not assayed. 9. Fixed density values were established on a per unit basis, corresponding to the median of the SG data of each unit ranging from 2.70 g/cm3 to 3.11 g/cm3. A fixed density of 2.00 t/m3 was assigned to the overburden. 10. The MRE presented herein is categorized as Measured, Indicated and Inferred Resources. The Measured Mineral Resource is limited to 10 m below the current exposed pit. The Indicated Mineral Resource is defined for blocks that are informed by a minimum of two drillholes where drill spacing is less than 80 m. The Inferred Mineral Resource is defined where drill spacing is less than 150 m. Where needed, some materials have been either upgraded or downgraded to avoid isolated blocks and spotted-dog effects. 11. The number of tonnes (metric) and contained Li2O tonnes were rounded to the nearest hundred thousand. *Rounded to the nearest thousand. Table 1-4 is presented to display the NAL Mineral Resource Statement exclusive of Mineral Reserves. Table 1-4 – NAL Mineral Resource statement at effective date of December 31, 2022 based on USD $1,273/t Li₂O exclusive of Mineral Reserves. NAL – Total Open Pit and Underground Constrained Mineral Resource Statement Category Tonnes (Mt) Grade (% Li2O) Cut-Off Grade % Li2O Met Recovery % Measured 0.7 1.00 0.6 73.6 Indicated 6.5 1.15 0.6 73.6 Measured and Indicated 7.3 1.14 0.6 73.6 Inferred 33.0 1.23 0.6 73.6 1.9 MATERIAL DEVELOPMENT AND OPERATIONS NAL's mining site restarted the pit operations with a first mass blasting in November 2022. The process plant did start-up in March 2023. As of December 31, 2023, production targets have been met. A drilling campaign was carried out in 2023 inside of the current pit with the aim of transferring the resources from the Inferred Category to the Indicated one. This zone has the potential to upgrade the current mineral resource estimate, however, with assay results still pending at the effective date of this report, this does not affect the current mineral resource estimate. However, ramp-up mining operations have affected the mineral reserve estimate and this is reflected in the updated mineral reserve estimate presented in this Report as compared to the original DFS Reserve Statement. North American Lithium DFS Technical Report Summary – Quebec, Canada 36 1.10 MINE DESIGN The pit will be mined using two or three flitches per 10-metre bench for ore (depending on the heave height after blasting) and full 10-metre benches for waste. This methodology gives reasonable production efficiency while keeping dilution to a minimum. The proposed pit has been designed based on the geotechnical requirements and recommendations prepared by Golder – WSP Associates. The design outlines a pit of ~1,375 m in length, an average of 850 m width and down to a final pit depth of 240 m. Figure 1-3 present a plan view of the NAL pit. Mining will be undertaken using phases, commencing with the development of the actual Phase 1 at the southeast limit of the deposit, advancing to the north and in depth in six phases to reach the ultimate designed pit. A minimum mining width of 40 m has been applied in most areas and 20 m in some specific areas. Working widths are reduced in select instances, such as the final pit benches. A 60 m layback has been considered between the final pit and Lac Lortie. The pit design is not limited to the existing mining lease boundary. During the first three years of the LOM, mining will occur within the existing mining lease. All mine waste rock will be dumped external to the pit. Previously mined-out workings from the historical underground operation exist on the site and mining in these areas will take place in the near term, requiring particular consideration in detailed mine planning and operations. Based on the current understanding of the geometries and locations of the existing underground (U/G) openings in relation to the planned pit design, all of the U/G openings will be within the pit, i.e., will not intercept the final pit wall.

North American Lithium DFS Technical Report Summary – Quebec, Canada 37 Figure 1-3 – North American Lithium ultimate pit design – Plan view. Local modifications to the short-term design will be required for safe and stable excavations in areas where stopes intersect the pit phases wall or floor, or drifts run parallel to the pit wall. Slopes in these areas should be developed with care to ensure the safety of personnel and prevent equipment damage due to collapsing stopes and drifts. Investigation and evaluation of hazards relating to those underground workings should be initiated during the detailed engineering design phase of the project and continued through the operating life of the mine. The total volume of the underground stopes, drifts and shaft is less than 1% of the total final pit volume, so these historical workings affect a relatively small portion of the overall operation. North American Lithium DFS Technical Report Summary – Quebec, Canada 38 1.11 RECOVERY METHODS Sayona Quebec has recently restarted the concentrator operation. The plant will first process the ore from the NAL deposit and, when the Authier mine comes into operation, a blend of ore from both deposits will be processed to produce a 5.82% Li2O spodumene concentrate. The feed will be composed of a 33% Authier and a 67% NAL ROM ore blend, with an average head grade of 1.04% Li2O (including dilution). The crushing plant has a design production throughput of 4,588 tpd of blended ore. The crushing plant will process approximately 1.56 Mtpy of ROM ore and the concentrator will process approximately 1.43 Mtpy of ore at the rod mill. The optical sorters will reject roughly 132,000 tpy of waste material. The crushing circuit availability is estimated at 65%, while concentrator availability is estimated at 93%. Several changes and improvements have either been made or are in progress to improve the treatment of NAL and Authier ore. Modifications include the following: • Modifications to the dump pocket and installation of an apron feeder ahead of the primary crusher. • Addition of an optical sorter in parallel to the existing secondary sorter. • Installation of two (2) additional stack sizer screens. • Installation of a low-intensity magnetic separator (LIMS). • Addition of a second wet high-intensity magnetic separator (WHIMS). • Upgrade of the existing high-density conditioning tank. • Installation of a higher capacity spodumene concentrate filter. • The addition of a crushed ore storage dome to increase ore retention capacity. The designed concentrate production is estimated to be 184,511 tpy (dry) at 5.82% Li2O, or the equivalent of 22.65 tph. The lithium recovery is estimated to be 66.3%. Concentrate will be trucked to Val-d’Or; from there it will be transloaded onto rail cars and transported by train to the Port of Québec, where it will be stored prior to being sold. 1.11.1 Metallurgical Testing In recent history, the NAL concentrator operated from March 2013 to September 2014 (Québec Lithium Inc.), and June 2017 to March 2019 (North American Lithium Inc.). Extensive metallurgical testwork has been undertaken on ore from the NAL deposit since 2008. More recent testwork (2016) focused on the impact of host rock type and the impact of dilution on metallurgical performance. North American Lithium DFS Technical Report Summary – Quebec, Canada 39 Historical metallurgical testwork for the Authier project was undertaken as part of feasibility studies carried out for the mine and concentrator project in 2018 and 2019. Once the Authier mine begins production, the NAL concentrator will be fed with blended ore comprising 33% Authier and 67% NAL run-of-mine (ROM) ore. Recent metallurgical testing has investigated the processing of blended feed combining the two ore types. As part of the DFS, two composite samples and five variability samples were tested. The variability samples were selected from NAL drill core (quarter core). The samples were selected to represent early years of production (years 1-10) and to include each major type of host rock (i.e., granodiorite, gabbro and volcanics). The NAL concentrator mass balance was produced based on historical production data, testwork results, and the selected flowsheet with recent upgrades. 1.12 PROJECT INFRASTRUCTURE The NAL property is located in an established mining district and supported by the city of Val d’Or (60 km to the south) and the city of Amos (35 km to the northwest). The project is readily accessible by the national highway and a high-quality rural road network. Other infrastructure in close proximity to the project includes: • The Canadian National Railway has an extensive rail network throughout Canada. The rail network connects to Montréal and Québec City, and to the west through the Ontario Northland Railway and North American rail system. • Québec is a major producer of electricity, as well as one of the largest hydropower generators in the world. Green and renewable energy is well distributed through a reliable power network. • Val-d’Or is serviced several times daily by various airlines from Montréal. Current site infrastructure includes: • Open pit; • Processing plant; • ROM ore pad; • Waste stockpile; • Conventional tailings pond; • Overburden stockpile; • Administration facility, including offices and personnel changing area (dry); • Workshop, tyre change, warehouse and storage areas; • Fuel, lube, and oil storage facility; and North American Lithium DFS Technical Report Summary – Quebec, Canada 40 • Reticulated services, including power, lighting and communications, raw water and clean water for fire protection, process water and potable water, potable water treatment plant, sewage collection, treatment, and disposal. Proposed new site infrastructure includes: • Expansion of the open pit. • Upgrade to the processing plant, including additional ore sorter, crushed ore dome, crushing circuit upgrade, dedusting, additional WHIMS, and more. • Additional tailings management facilities including dry-stacked tailings area and tailings filter plant. • Additional waste stockpile area. • Relocation of the fuel, lube, and oil storage facility. 1.13 CAPITAL AND OPERATING COST ESTIMATES 1.13.1 Capital Costs The total estimated capital cost (-20% / +20%) of the Project facilities, including funding of closure and rehabilitation activities, is estimated at $363.5M CAD. This estimate includes the addition of required indirect costs and contingencies. Closure and Rehabilitation activities are estimated to total $34.9M CAD. Table 1-5 provides the capital cost summary by major area. Table 1-5 – Capital costs summary by major area. Cost Item Capital Expenditures ($M) Mining Equipment $105.6 Dry Stack Mobile Equipment $19.6 Pre-Approved Projects $26.9 Tailings Filtration Plant and access Roads $80.6 Various Civil Infrastructures $37.6 Tailings Storage Facilities $53.4 Truck Shop Expansion $4.9 Reclamation & Closure $34.9 Total CAPEX $363.5 1.13.2 Operating Costs The NAL DFS is based on an annual ore feed of circa 1.4 Mtpy to the process plant to deliver average annual output (steady state) of 184,511 tonnes annually of spodumene concentrate containing 5.82%

North American Lithium DFS Technical Report Summary – Quebec, Canada 41 Li2O. The current LOM plan is based on a multi-stockpile strategy (low-grade, high-grade and Authier) to enable optimal blending of ore. The operating cost is $597 CAD/t concentrate for a total of $2,268M CAD excluding the cost of ore purchased from Authier. A memorandum of understanding (MOU) has been concluded between the Authier operation and NAL, in which NAL agrees to buy 100% of the Authier ore material at a selling price of $120/t CAD of ore mined, delivered to the NAL ore pad area. Authier ore purchased amounts to $293/t CAD concentrate for a total of $1,220M CAD over the mine life. Table 1-6 provides the operating cost summary by major area. Table 1-6 – Operating cost summary by area. Operating Expenditures C$ M C$/t conc. Open-pit Mining - Owner $649 $171 Open-pit Mining - Contractor $307 $81 Mineral Processing $829 $218 Water Treatment $9 $2 Tailings Transport and Placement $79 $21 General and Administration (G&A) $395 $104 Total On-site Operating Costs $2,268 $597 1.14 MARKET STUDIES According to Wood Mackenzie, the total lithium supply is projected to grow at a CAGR of 14% from 2020 to 2030. Although lepidolite production will increase from 2020 to 2025 and new processes such as jadarite, clay and zinnwaldite will be introduced starting in 2023, spodumene concentrate will remain the dominant mineral concentrate output. Depending on the period, spodumene concentrate is expected to account for 73% to 87% of the total capacity of the mine. Lithium carbonate and lithium hydroxide will dominate refined production for lithium products. From 2020 to 2040, lithium hydroxide and lithium carbonate are projected to grow at a CAGR of 16% and 11% respectively. 1.14.1 Price Forecast In 2021 Sayona Quebec and Piedmont Lithium entered into an offtake agreement where Piedmont holds the right to purchase the greater of 50% of spodumene concentrate for 113,000 tpy from North American Lithium at a floor price of $500/t and a ceiling price of $900/t (6.0% Li2O equivalent) on a life-of-mine basis. North American Lithium DFS Technical Report Summary – Quebec, Canada 42 For purposes of financial modeling and the Technical Report Summary sales from 2023 to 2026 are based on the greater of 113 kt of spodumene concentrate or 50% of spodumene concentrate sales at the Piedmont Lithium contract price and the remaining concentrate sales at BMI Q4 2022 spodumene market prices. From 2027 onwards, the entire concentrate sales are settled at BMI Q4 2022 spodumene market prices. For the contracted volume to Piedmont Lithium, a price of $810 USD/t (from the reference of $900 USD/t @ 6.0% Li2O to adjusted value of $810 USD/t assuming 5.4% Li2O and applied 10% price discount from $900 USD/t for lower grade) assumed over 2023-26, while the remainder of the concentrate production uses market prices. From 2027 and beyond, Sayona Quebec is reverting back to market prices for the entire production as it seeks to pursue a lithium transformation project on-site, leveraging prior investments, in line with its commitments with the Government of Québec related to its acquisition of NAL. The construction or completion of conversion facilities owned by Sayona Quebec remains subject to the approval of both Sayona and Piedmont and therefore the associated pricing assumptions used in this TRS for Piedmont’s allocation of spodumene concentrate should be considered illustrative only. 1.14.2 Spodumene Price Forecast The prices for spodumene concentrate and battery-grade lithium are expected to remain high relative to historic prices, driven mainly by the demand for lithium for EV batteries. According to BMI, the price of spodumene concentrate (6.0%) is expected to increase significantly from 2020 to 2024, reaching a peak of $5,525 USD/t. However, by 2026, the market price of spodumene is expected to decrease to below $2,000 USD/t, and gradually stabilize at a long-term price of $1,050 USD/t from 2033 onwards. 1.14.3 Carbonate Price Forecast According to BMI, the price for battery grade carbonate is expected to jump in 2023, driven by the fast growth of the EV industry. BMI price expectations imply a peak of $75,475 USD/t in 2024. After 2025, supply increase is projected to meet market demand, bringing down prices gradually through to 2032. From 2033 onwards, BMI projects an average carbonate price of $20,750 USD/t. North American Lithium DFS Technical Report Summary – Quebec, Canada 43 1.15 ENVIRONMENTAL, SOCIAL AND PERMITTING While the mine site was under care and maintenance, a skeleton staff remained to ensure integrity of the assets and protection of the environment. Over the past few years, environmental studies were conducted, and regulatory monitoring of operations was instituted. 1.15.1 Environmental Studies Results from the geochemical studies showed that waste rocks are not acid rock drainage (ARD) or metals leaching (ML). Therefore, no special requirements are required by the Ministry of Environment, Fight Against Climate Change, Fauna, and Parks (MELCCFP) for stockpiling and water management. In fact, MELCCFP also allows use of waste rocks for mine construction purposes (road, lay-down areas, etc.). At the end of 2017 and the beginning of 2018, only seven samples of tailings produced by the spodumene concentrate production have been analyzed. The results showed that tailings from spodumene concentrate production are not ARD nor ML. 1.15.2 Status of Negotiations with Shareholders As part of the Monitoring Committee, over 15 meetings have been held since 2012. Discussions resumed in 2017 with the Lac-Simon and Pikogan communities for the ratification of an Impact Benefit Agreement (IBA). 1.15.3 Permitting Sayona Quebec plans to restart NAL mining and ore treatment operations in accordance with existing approvals by provincial and federal authorities. The concentrator has approval for throughput of 3,800 tpd. A planned increase to 4,500 tpd has been submitted to the authorities for approval in January 2023. The proposed increase will not trigger federal or provincial environmental examination procedures. At the provincial level, permits have been obtained for most project components. Some original permits were transferred to North American Lithium following acquisition of the site in 2017 and transferred again to Sayona Quebec following acquisition in 2021. North American Lithium DFS Technical Report Summary – Quebec, Canada 44 1.15.4 Reclamation and Closure As of June 20, 2014, the total commitment was estimated by MERN at $25,608,740 CAD. Sayona Quebec has already filled the guarantee fund for this estimated cost. The Closure and reclamation costs have been reviewed as part of the DFS. 1.16 ECONOMIC ANALYSIS The project shows positive financials, the evaluation is as follows: • The DFS’s NPV and IRR were calculated based on the production of spodumene concentrate at a grade of 5.4% Li2O over the first four years, then at 5.82% Li2O for the following 16 years, for a 20‐year life‐of‐mine. • Pre-tax NPV (8% discount) estimated at $2,001M CAD with pre-tax IRR of 4,701 %. • Post-tax NPV (8% discount) estimated at $1,367M CAD with post-tax IRR of 2,545 %. The major inputs and assumptions used for the development of the financial model and the results of the economic analysis are presented in Table 1-7.

North American Lithium DFS Technical Report Summary – Quebec, Canada 45 Table 1-7 – NAL operation including Authier ore supply – Financial analysis summary. Item Unit Value (US$) Value (C$) Mine life year 20 Strip Ratio waste t: ore t 8 Total NAL Mined Tonnage Mt 201 Total Crusher Feed Tonnage, including Authier Mt 31 Total Crusher Feed Grade, including Authier % 1.04 Revenue Average Concentrate Selling Price $/t conc. 1,352 1,803 Exchange Rate C$:US$ 0.75 Selling Cost Product Transport and Logistic Costs $/t conc. 26 34 Project Costs Open Pit Mining $/t conc. 189 252 Mineral Processing $/t conc. 164 218 Water Treatment, Management and Tailings $/t conc. 2 2 General and Administration (G&A) $/t conc. 78 104 Authier Ore Purchase $/t conc. 220 293 Project Economics Gross Revenue $M 5,114 6,818 Authier Ore Purchased Cost $M 834 1,114 Total Selling Cost Estimate $M 98 130 Total Operating Cost Estimate $M 1,701 2,268 Total Sustaining Capital Cost $M 281 363 Undiscounted Pre‐Tax Cash Flow $M 2,225 2,966 Discount Rate % 8 8 Pre‐tax NPV @ 8% $M 1,500 2,001 Pre‐tax Internal Rate of Return (IRR) % 4,701 4,701 After‐tax NPV @ 8% $M 1,026 1,367 After‐tax IRR % 2,545 2,545 Cash Cost, including Authier ore purchase $/t conc. 691 817 All‐In Sustaining Costs, excluding Authier $/t conc. 740 987 1.17 CONCLUSIONS AND QP RECOMMENDATIONS The study is based on an optimized mine plan and operations plan that will initially see the production and sale of lithium spodumene concentrate. The study indicates that the Project is technically feasible and commercially viable based on a selling price of agreement stated in Section 1.13. An analysis of the results of the investigations has identified a series of risks and opportunities associated with each of the technical aspects considered for the development of the Project. The key risks include the following: • The distribution of iron in the country rock could be improved in the block model as currently averages of a limited number of samples are applied for each lithological units without taking into consideration possible local variations. • Considerable emphasis has been placed in recent work on reducing mine dilution, while also developing processing strategies for optimizing the spodumene concentrate grade from the concentrator, including ore sorting, improvements around the flotation process and the North American Lithium DFS Technical Report Summary – Quebec, Canada 46 installation of a WHIMS unit. The expectation is that a concentrate grade of 5.82% Li2O can be realized. • Complicating TSF water management is the fact that the water contained in the TSF had been contaminated with concentrations of dissolved solids that rendered it toxic to certain aquatic life and potentially problematic for use in the concentrator’s flotation circuit. Risk mitigation efforts have focused on developing methods for treating the water for either return to the process or release to the environment, while also developing the means of gradually recovering the dissolved solids from the pond water. The key opportunities include: • Converting Inferred resources into indicated resources, particularly through additional drilling under the existing workings. • Further optimizing the mine site layout, including placement of waste rock dumps and the tailings, should lead to reduced operating costs; the possibility of an Owner-operated mine fleet should also be investigated. • Developing methods for increasing lithium recoveries. Suggested ways of achieving this include developing specialized mining techniques to set aside and sort off-line the marginal material that might otherwise simply go to waste, e.g., material with small veins. 1.17.1 Key Outcomes 1.17.1.1 Mining Key mining outcomes include: • The North American Lithium (NAL) Mineral Reserves have been estimated for a total of 20.4 Mt of Proven and Probable Mineral Reserves at an average grade of 1.10% Li2O, which is comprised of 0.3 Mt of Proven Mineral Reserves at an average grade of 1.40% Li2O and 20.2 Mt of Probable Mineral Reserves at an average grade of 1.08% Li2O. • Development of a mine plan that provides sufficient ore to support an annual production rate of approximately 912kt at the rod mill coming from NAL. The remaining portion comes from Authier, at approximately 530kt, for a total annual feed to the NAL Rod Mill of 1,425kt on average. • Development of a dilution model to ensure that potential run-of-mine (ROM) ore feed respects final product specifications. • Detailed mine designs, including pit phasing and waste pile plans. • Development of a life-of-mine (LOM) plan that results in a positive cash flow for the Project, which permits conversion of resources to reserves. North American Lithium DFS Technical Report Summary – Quebec, Canada 47 1.17.1.2 Mineral Processing Significant capital upgrades have been undertaken for the restart of the NAL concentrator and are detailed in the Table 1-8. Table 1-8 – Major plant upgrades. Major Upgrades Results Modifications to the dump pocket and installation of an apron feeder ahead of the primary crusher. Implementation of more robust equipment to ensure a stable feed to the primary crusher. Addition of an optical sorter in parallel to the existing secondary sorter. Ore sorting is critical to remove waste rock from the pegmatite ore. In addition to meeting capacity requirements, the addition of a third sorter should allow for higher separation efficiency. Installation of two additional stack sizer screens. Testwork showed metallurgical performance is sensitive to grind size. Historical operational data showed screen overloading, resulting in high bypass of fines to the ball mill, which leads to a reduction in grinding rates. The addition of the two new screens will provide better separation. Addition of a low-intensity magnetic separator (LIMS) prior to wet high-intensity magnetic separation (WHIMS). There was no LIMS in the previous flowsheet. To remove grinding media chips to protect the downstream WHIMS. Addition of a second WHIMS in series with the existing unit prior to flotation. Magnetic separation is a critical step in the process to reject iron-bearing silicate minerals. In addition to meeting capacity requirements, a second WHIMS will allow for higher removal of iron prior to flotation. Upgrade of the existing high-density conditioning tank. Improve conditioning, thus flotation performance. Installation of a higher capacity spodumene concentrate filter. Increased concentrate filtration capacity will meet throughput requirements. The addition of a crushed ore storage dome to increase ore retention capacity. Increase ore retention capacity. The crushed ore pile will feed the rod mill feed conveyor during periods of crushing circuit maintenance. 1.17.1.3 Marketing and Sales According to BMI, starting in 2028, lithium supply is projected to fall short of demand. Lithium market demand is expected to grow largely due to the increase in battery production from a global standpoint. Spodumene and lithium carbonate prices are expected to reach their highest price in 2024 and decline gradually to reach a steady state by 2033 of $1,050 USD/t of spodumene and $20,750 USD/t of lithium carbonate. For the purpose of this Project, sales from 2023 to 2026 are based on the greater of 113 kt of spodumene concentrate or 50% of spodumene concentrate sales at the Piedmont Lithium contract price and the remaining concentrate sales at BMI Q4 2022 spodumene market prices. From 2027 onwards, the entire concentrate sales are settled at BMI Q4 2022 spodumene market prices. 1.17.1.4 Capital Cost The total capital expenditure (CAPEX) proposed for the project was estimated at $363.5M CAD. It includes capital upgrades such as the filtration plant and dry stacking facilities. The present costs estimate North American Lithium DFS Technical Report Summary – Quebec, Canada 48 pertaining to this study qualifies as Class 3 – Feasibility Study Estimate, as per AACE recommended practice R.P.47R-11. The accuracy of this CAPEX estimate has been assessed at ±20%. 1.17.1.5 Operating Cost • Mining costs for combined ore and waste are $4.75 CAD /t mined. • The total on-site operating cost to produce spodumene concentrate is estimated to be $27.00 CAD/t crushed ($220.27 CAD/t concentrate). • Authier ore purchased for the process plant is $269.82 CAD/t concentrate. • Selling costs, which are the Transport and Logistics of concentrate costs, are $102.44 CAD/t concentrate. 1.17.1.6 Project Economics Positive DFS shows value of NAL operation, confirming technical and financial viability over the 20-year life of mine. • The DFS’s NPV and IRR were calculated based on the production of spodumene concentrate at a grade of 5.4% Li2O over the first four years, then at 5.82% for the following 16 years, for a 20‐year life‐of‐mine. • Pre-tax net present value (NPV) (8% discount) estimated at $2,001M CAD with pre-tax internal rate of return (IRR) of 4,701%. • Post-tax NPV (8% discount) estimated at $1,367M CAD with post-tax IRR of 2,545%. 1.17.2 QP Recommendations Given the technical feasibility and positive economic results of this Report, it is recommended to continue to operate the North American Lithium mine complex. 1.18 REVISION NOTES This individual Technical Report is the initial report to be issued under the S-K §229.1300 regulations, therefore, no revision note is attached to this individual Technical Report.

North American Lithium DFS Technical Report Summary – Quebec, Canada 49 2. INTRODUCTION 2.1 TERMS OF REFERENCE AND PURPOSE OF THE REPORT This S-K §229.1304 compliant Technical Report Summary (the Report) was prepared at the request of Piedmont Lithium Inc (Piedmont) by Sayona Quebec, based on an existing Technical Report compiled according to the Canadian Institute of Mining, Metallurgy and Petroleum (CIM) reporting guidelines as used in National Instrument 43-101 standards (NI 43-101), which has been previously published and filed by Sayona Mining Limited (Sayona Mining or Sayona). This DFS Report was prepared to present the Definitive Feasibility study (DFS) outcomes for the North American Lithium Project (NAL). The North American Lithium (NAL) property is wholly owned and operated by Sayona Quebec Inc (Sayona Quebec), with Sayona owning 75% and Piedmont 25% of Sayona Quebec in a Joint Venture agreement. Sayona, the registrant of the original NI 43-101 compliant Technical Report, engaged the services of BBA Inc. and Synectiq Inc., supporting qualified firms staffed with professional engineers, geologists, and process engineers, to prepare the Technical Report at the Definitive Feasibility Study (DFS) level; using data gathered by the Qualified Persons (QPs) to the disclosure requirements for the Canadian Institute of Mining, Metallurgy and Petroleum (CIM) reporting guidelines as used in National Instrument 43-101 standards (NI 43-101) to compile said report. Piedmont serves as the registrant of this S-K §229.1304 compliant Technical Report Summary. The statement is based on information provided by Sayona Quebec and reviewed by various professionals and Qualified Persons from Sayona Quebec and Synectic or references to information in this Report may not be used without the written permission of Sayona Quebec. The purpose of this DFS was to present the Mineral Resources Estimate and Mineral Reserves Estimate, the concentrator metallurgical recoveries, and evaluate the impacts of the lithium market conditions to the Project’s economics. The DFS Report was based upon developing the Project over a 20-year production period, using a conventional open-pit truck and shovel operation and concentration of the ore in the NAL concentrator facility that was re-started in March 2023 with substantial upgrades to produce a spodumene concentrate (5.40% to 5.82% Li2O). The DFS Report includes the concentration of the Authier site ore material. The Authier run-of-mine (ROM) ore will be transported to the NAL site, blended with the NAL ore material, and fed to the crusher. In order to get the best overview of the integrated Authier/NAL, it is recommended to review the Updated Feasibility Study Report for the Authier Lithium Project (BBA, 2023). North American Lithium DFS Technical Report Summary – Quebec, Canada 50 2.2 QUALIFICATIONS OF QUALIFIED PERSONS/FIRMS 2.2.1 Contributing Authors Table 2-1 presents the Qualified Persons (QPs) responsible for each chapter of this Report. The QPs of this Report are in good standing with the appropriate professional institutions. The QPs have supervised the preparation of this Report and take responsibility for the contents of the Report as set out in Table 2-1. Each QP has also contributed relevant figures, tables, and written information for Chapters 1 (Executive Summary), 21 (Other Relevant Data and Information), 22 (Interpretation and Conclusions), 23 (Recommendations), and 24 (References), 25 (Reliance on Information Supplied by the Registrant). Table 2-1 – Chapter responsibility. UDFS CHAPTERS Qualified Persons 1 Executive Summary All 2 Introduction Sylvain Collard, P.Eng. 3 Project Property Description Jarrett Quinn, P.Eng. 4 Accessibility, Climate, Local Resources, Infrastructure, Physiography Jarrett Quinn, P.Eng. 5 History Ehouman N'Dah, P.Geo. 6 Geological Setting and Mineralization and Deposit Types Ehouman N'Dah, P.Geo. 7 Exploration Ehouman N'Dah, P.Geo. 8 Sample Preparation, Analyses and Security Ehouman N'Dah, P.Geo. 9 Data Verification Ehouman N'Dah, P.Geo. 10 Mineral Processing and Metallurgical Testing Jarrett Quinn, P.Eng. 11 Mineral Resource Estimates Ehouman N'Dah, P.Geo. 12 Mineral Reserve Estimates Philippe Chabot, P.Eng. 13 Mining Methods Philippe Chabot, P.Eng. 14 Processing and Recovery Methods Jarrett Quinn, P.Eng. 15 Project Infrastructure Sylvain Collard, P.Eng. 16 Market Studies and Contracts Sylvain Collard, P.Eng. 17 Environmental Studies, Permitting, and Social or Community Impact Sylvain Collard, P.Eng. 18 Capital and Operating Costs Sylvain Collard, P.Eng. 19 Economic Analysis Sylvain Collard, P.Eng. 20 Adjacent Properties Jarrett Quinn, P.Eng. 21 Other Relevant Data and Information All 22 Interpretation and Conclusions All 23 Recommendations All 24 References All 25 Reliance on Information Supplied by the Registrant All North American Lithium DFS Technical Report Summary – Quebec, Canada 51 2.2.2 Site Visit During the initial DFS, the original QP visited the Project and its existing installations on July 18 and July 25, 2022, as part of its mandate. The 2022 site visits included a field tour of the main geological features visible in the current open pit (Figure 2-1), a tour of the core storage facility (Figure 2-2), visual inspections of drill cores (Figure 2-3), and discussions with geologists and engineers of Sayona Quebec. Figure 2-1 – View of the open pit visited during the site tour. Figure 2-2 – Core storage facility at the Project site. North American Lithium DFS Technical Report Summary – Quebec, Canada 52 Figure 2-3 – Core review at the core storage facility. Selected drillhole collars in the field were also validated. The site visits also included a review of the sampling and assay procedures, QA/QC program, downhole survey methodologies, and the descriptions of lithologies, alteration and structures (Figure 2-3). These site visits allowed the QP to make certain recommendations, mainly the need for a resampling program to obtain additional data (Li2O% assays, Fe% content, density measurements) that was immediately initiated and included in the current database. In relation to the current TRS, the QP’s listed in Table 2-1 are responsible for the content of this Report. The QP’s for the TRS reviewed all data from the DFS upon which the TRS is based and amended, altered, or updated the data for the purposes of currency and accuracy. All listed QP’s are employees of Sayona Quebec or Synectiq. The Sayona QP’s visit frequently and work at the NAL site. They have actively participated in the design of the mine plan, geological monitoring, ore processing operations, budget and forecast. They are in constant communication with the DFS QP and as such they are involved in and around the property as part of their duties and therefore no specific site visit date is considered relevant.

North American Lithium DFS Technical Report Summary – Quebec, Canada 53 2.3 SOURCE OF INFORMATION The reports and documentation listed in Chapters 24 and 25 were used to support the preparation of the DFS Report on which the Technical Report is based. Additional information was sought from NAL personnel, where required. Sections from reports authored by other consultants may have been directly quoted or summarized in this Report and are so indicated, where appropriate. The Report has been completed using the aforementioned sources of information as well as available information contained in, but not limited to, the following reports, documents, and discussions: • Technical discussions with NAL and Sayona Quebec personnel; • Technical information provided by NAL and Sayona Quebec personnel; • Economic analysis provided by Philippe Pourreaux, PricewaterhouseCooper (PwC); • DFS Authors’ personal inspections of the Property; • Internal unpublished reports received from NAL; • Additional information from public domain sources. 2.4 UNITS OF MEASURE & GLOSSARY OF TERMS Unless otherwise specified or noted, this Report uses the following assumptions and units: • All measurements are in metric units. • Currency is in Canadian dollars (CAD or $). • Metal prices are expressed in Canadian dollars (CAD or $); selling prices are in USD. This Report includes technical information that required subsequent calculations to derive subtotals, totals, and weighted averages. Such calculations inherently involve a degree of rounding and consequently introduce a margin of error. Where these occur, the authors consider them immaterial. North American Lithium DFS Technical Report Summary – Quebec, Canada 54 Table 2-2 – List of Abbreviations and Units of Measurement. Abbreviations and Units of Measurement Abbreviation Description 3D Three dimensional AACE Association for the Advancement of Cost Engineering ActLabs Techni-Lab SGB Ag Silver AGAT AGAT Laboratories Ltd. Ai Abrasion index AISC All-in sustaining cost ALS ALS Laboratory Group AMC AMC Mining Consultants (Canada) Ltd. ARD Acid Rock Drainage ASX Australian Securities Exchange Ltd. BBA BBA Engineering Inc. BFA Bench face angles Bi Bismuth BM Block model BMI Benchmark Minerals Intelligence BO3 Borate BWi Ball mill work index CAD Canadian Dollar CAGR compound annual growth rate C-ALS Cavity autoscanning laser system Cambior Cambior Inc. CAPEX Capital expenditure CDA Canadian Dam Association CEAA Canadian Environmental Assessment Agency CIM Canadian Institute of Mining, Metallurgy and Petroleum CLC Canada Lithium Corp. CN Cyanide CN Canadian National COG Cut-off grade CRM Certified reference materials Cs Cesium CV Coefficient of variation CWI Crushing work index North American Lithium DFS Technical Report Summary – Quebec, Canada 55 DCF Discounted cash flow DDH Diamond drillhole DFO Department of Fisheries and Oceans of Canada DFS Definitive Feasibility Study DIL Diluvio deposit DMS Dense media separation DTM Digital terrain model EBITDA Earnings Before Interest, Taxes, Depreciation, and Amortization EDF Environmental Design Flood EFE Exceptional forest ecosystem EGM Engineering geology model EOY End of year EPCM Engineering, procurement and construction management EQA Environment Quality Act ESIA Environmental and Social Impact Assessment ESR Excellence in Social Responsibility ESS Energy storage systems EVs Electric vehicles Fe Iron FEL Front-end loader FOB Freight-on-board FOS Factor of safety FoS Factor of stability FS Feasibility Study FY Fiscal year G&A General and Administration Geo Labs Geoscience Laboratories GET Ground engaging tools GHG Greenhouse gas Golder Golder Associates GSC Geological Survey of Canada Hbl Hornblende HDPE High-density polyethylene H2O Water HLS Heavy-liquid separation IBA Impact Benefit Agreement ICP-AES Inductively coupled plasma – atomic emission spectroscopy North American Lithium DFS Technical Report Summary – Quebec, Canada 56 ICP-OES Inductively coupled plasma – optical emission spectrometry ID Inverse distance ID2 Inverse distance squared ID3 Inverse distance cubed InnovExplo InnovExplo Inc. IRA Inter-ramp angles IRR Internal rate of return IW Independent witness JBNQA James Bay and Northern Quebec Agreement JORC Joint Ore Reserves Committee JV Joint venture KE Kriging efficiency KNA Kriging neighbourhood analysis KPI Key production indicator kt LCE thousand tonnes lithium carbonate equivalent LAN Lithium Amérique du Nord LCE Lithium carbonate equivalent LCT Li-Cs-Ta (Lithium, cesium, tantalum) LG Low grade Li Lithium LIMS Low-intensity magnetic separator Li2O Lithium oxide LiOH.H2O Lithium hydroxide monohydrate LLDPE Linear low-density polyethylene LOM Life of mine LSB Loi sur la sécurité des barrages (The Dam Safety Law applied in Québec) LV Low voltage m.a.s.l. Metres above sea level MDMER Metal and Diamond Mining Effluent Regulations MELCC Ministère de l’Environnement, et de la Lutte contre les changements climatiques, (now MELCCFP) MELCCFP Ministère de l’Environnement, de la Lutte contre les changements climatiques,de la Faune et des Parcs (formerly MELCC) MFFP Ministry of Forest, Fauna and Parks MIBC Methyl isobutyl carbinol ML Metals leaching Mo Molybdenum. MRE Mineral resource estimate

North American Lithium DFS Technical Report Summary – Quebec, Canada 57 MRNF Ministère des Resources naturelles et des Forêts (formerly MERN) MSO Mine stope optimization MSSO MineSight Schedule Optimizer MTOs Material take-offs MV Medium voltage Na2CO3 Soda ash NAD North American Datum NAG Non-acid Generating NAL North American Lithium NaOH Sodium hydroxide Nb-Y-F (or NYF) Niobium-yttrium-fluorine NCF Net cash flow NIR Near infrared NN Nearest neighbour NPV Net present value NSR Net smelter return OBP-2 Overburden pile 2 OK Ordinary kriging OPEX Operational expenditure PCBs Polychlorinated biphenyls PEA Preliminary economic assessment PFS Pre-feasibility study PGA Potential gravity acceleration PMF Probable maximum flood PO4 Phosphate ion POV Pre-operational verification PwC PricewaterhouseCoopers Q1 First quarter Q2 Second quarter Q3 Third quarter Q4 Fourth quarter QA/QC Quality Assurance / Quality Control QLC Quebec Lithium Corporation Rb Rubidium REE Rare earth elements RNC Royal Nickel Corporation RNC Media Radio Nord Communications Inc. North American Lithium DFS Technical Report Summary – Quebec, Canada 58 ROM Run of mine ROMPad Run of Mine pad RPA Roscoe, Postle & Associates RQD Rock quality designation RSB Régulation sur la sécurité des barrages RTK Real time kinematic SAD Abitibi RCM’s territory development and activities plan Sayona Sayona Québec SD Standard deviation SEC Study of the environmental character SG Specific gravity SGS SGS Lakefield Sn Tin Spd Spodumene SNC Surveyor, Nenniger et Chênevert Inc. std Standard ST-H High-grade standard ST-L Low-grade standard TMF Tailings management facility TSF Tailings storage facility TSF-1 Tailings Storage Facility 1 (Conventional tailings pond) TSF-2 Tailings Storage Facility 2 (Dry-stacked tailings area) TSS Total suspended solids UFCF Unlevered free cash flow U/G Underground URSTM Unité de Recherche et de Service en Technologie Minérales USD United States dollar WBS Work breakdown structure WHIMS Wet high-intensity magnetic separation WMP Water Management Plan WRP-2 Waste rock pile 2 WRP-3 Waste rock pile 3 XRD X-ray diffraction North American Lithium DFS Technical Report Summary – Quebec, Canada 59 3. PROPERTY DESCRIPTION 3.1 PROPERTY LOCATION, COUNTRY, REGIONAL AND GOVERNMENT SETTING The Property is situated in La Corne Township in the Abitibi-Témiscamingue region, approximately 38 km southeast of Amos, 15 km west of Barraute and 60 km north of Val-d’Or in the Province of Québec, Canada (Figure 3-2). The site is approximately 550 km north of Montréal and is serviced by road, rail, and air. As of March 27, 2023, the North American Lithium (NAL) Property consists of a contiguous group of 42 mineral titles including 1 mining lease and 41 claims, covering 1,492.56 ha. The Property is centered near coordinates 291,964 m E and 5,365,763 m N (48°24'24"N, 77°49'50W, see Figure 3-1), Zone 18N as located on the NTS map sheet 32C5 (Figure 3-3). Figure 3-1 – NAL property location coordinates (Source: Google Earth). North American Lithium DFS Technical Report Summary – Quebec, Canada 60 Figure 3-2 – Approximate Property Location.

North American Lithium DFS Technical Report Summary – Quebec, Canada 61 Figure 3-3 – Property Overview Map. North American Lithium DFS Technical Report Summary – Quebec, Canada 62 Canada is a North American country with its center of government in Ottawa located in the Province of Ontario. Canada is a constitutional monarchy which forms part of the British Commonwealth, and it is ruled by a parliamentary democratic government. The Crown assumes the roles of the executive, as the Crown-in-Council; the legislative, as the Crown-in-Parliament; and the judicial, as the Crown-on-the- Bench. The country is politically stable, comprised of ten provinces and three territories, of which Québec is one. The Canadian Federation is currently governed by the elected Liberal Party of Canada, while the province of Québec is governed by the Coalition Avenir Québec. 3.2 MINERAL TENURE, AGREEMENT AND ROYALTIES 3.2.1 Surface Rights In the province of Québec, the Mining Act governs the management of mineral resources and the granting of exploration rights for mineral substances during the exploration phase. It also deals with the granting of rights pertaining to the use of these substances during the mining phase. Finally, the act establishes the rights and obligations of the holders of mining rights to ensure maximum development of Québec’s mineral resources. Claim status was verified using GESTIM, the Québec government’s online claim management system. As of March 27, 2023, the North American Lithium (NAL) Property consists of a contiguous group of 42 mineral titles (41 claims, 1 mining lease (Table 3-1 and Figure 3-4) covering 1,492.56 ha. On August 26, 2021, Sayona Québec, a joint-venture of subsidiary company of Sayona Mining Limited (75%) and Piedmont Lithium Inc. (25%) Ltd., acquired NAL. At the time, all claims (19) were registered in the name of NAL for a total area of 583.51 ha. The mining lease (BM1005) is also under NAL’s name and covers an area of 116.4 Ha. The mining lease was granted to Québec Lithium on May 29, 2012, on the basis of a prefeasibility study (PFS) pit filed at the time in support of the application to be granted such a lease. The mining lease has an initial term of 20 years, expiring on May 28, 2032. Since the acquisition of the Project, NAL acquired 20 claims spanning roughly 750 ha from Resources Jourdan Inc. and two claims with a total area of 42.3 ha from Lise Daigle. A detailed list of the NAL mining titles is presented in Table 3-1. The author has not verified the legal titles to the Property or any underlying agreement(s) that may exist concerning the licenses or other agreement(s) between third parties. North American Lithium DFS Technical Report Summary – Quebec, Canada 63 Table 3-1 – Mining titles list and details. Claim Name Claim Status Issue Date Anniversary Date Area (ha) Owner Work Required for Renewal BM 1005 Active May 29, 2012 May 28, 2032 116.39 Lithium Amérique du Nord Inc. 100% $0 CDC 2145325 Active March 17, 2008 November 24, 2024 31.25 Lithium Amérique du Nord Inc. 100% $2,500 CDC 2145326 Active March 17, 2008 November 24, 2024 32.12 Lithium Amérique du Nord Inc. 100% $2,500 CDC 2145327 Active March 17, 2008 November 24, 2024 42.85 Lithium Amérique du Nord Inc. 100% $2,500 CDC 2145328 Active March 17, 2008 November 24, 2024 41.64 Lithium Amérique du Nord Inc. 100% $2,500 CDC 2145329 Active March 17, 2008 November 24, 2024 16.76 Lithium Amérique du Nord Inc. 100% $1,000 CDC 2145330 Active March 17, 2008 November 24, 2024 23.81 Lithium Amérique du Nord Inc. 100% $1,000 CDC 2145331 Active March 17, 2008 November 24, 2024 15.29 Lithium Amérique du Nord Inc. 100% $1,000 CDC 2145332 Active March 17, 2008 November 24, 2024 22.75 Lithium Amérique du Nord Inc. 100% $1,000 CDC 2145333 Active March 17, 2008 November 24, 2024 46.94 Lithium Amérique du Nord Inc. 100% $2,500 CDC 2145334 Active March 17, 2008 November 24, 2024 17.59 Lithium Amérique du Nord Inc. 100% $1,000 CDC 2145335 Active March 17, 2008 November 24, 2024 1.53 Lithium Amérique du Nord Inc. 100% $1,000 CDC 2145336 Active March 17, 2008 November 24, 2024 35.92 Lithium Amérique du Nord Inc. 100% $2,500 CDC 2154760 Active May 26, 2008 May 25, 2023 41.71 Lithium Amérique du Nord Inc. 100% $2,500 CDC 2154761 Active May 26, 2008 May 25, 2023 41.64 Lithium Amérique du Nord Inc. 100% $2,500 CDC 2154987 Active May 26, 2008 February 2, 2023 42.15 Lithium Amérique du Nord Inc. 100% $2,500 CDC 2154988 Active May 26, 2008 February 2, 2023 42.15 Lithium Amérique du Nord Inc. 100% $2,500 CDC 2154989 Active May 26, 2008 February 2, 2023 42.68 Lithium Amérique du Nord Inc. 100% $2,500 CDC 2154990 Active May 26, 2008 February 2, 2023 42.65 Lithium Amérique du Nord Inc. 100% $2,500 CDC 2154991 Active May 26, 2008 February 2, 2023 42.67 Lithium Amérique du Nord Inc. 100% $2,500 CDC 2154992 Active May 26, 2008 February 2, 2023 21.45 Lithium Amérique du Nord Inc. 100% $1,000 CDC 2154993 Active May 26, 2008 February 2, 2023 21.31 Lithium Amérique du Nord Inc.100% $1,000 CDC 2167933 Active July 28, 2008 July 27, 2023 43.07 Lithium Amérique du Nord Inc.100% $2,500 CDC 2167934 Active July 28, 2008 July 28, 2023 42.63 Lithium Amérique du Nord Inc.100% $2,500 CDC 2167935 Active July 28, 2008 July 29, 2023 42.67 Lithium Amérique du Nord Inc.100% $2,500 CDC 2167936 Active July 28, 2008 July 30, 2023 42.71 Lithium Amérique du Nord Inc.100% $2,500 CDC 2167937 Active July 28, 2008 July 31, 2023 42.71 Lithium Amérique du Nord Inc.100% $2,500 CDC 2167938 Active July 28, 2008 August 1, 2023 42.71 Lithium Amérique du Nord Inc.100% $2,500 CDC 2444462 Active May 11, 2016 May 10, 2023 21.66 Lithium Amérique du Nord Inc.100% $500 CDC 2444463 Active May 11, 2016 May 10, 2023 13.53 Lithium Amérique du Nord Inc.100% $500 CDC 2490652 Active April 25, 2017 April 24, 2024 4.21 Lithium Amérique du Nord Inc.100% $500 CDC 2490653 Active April 25, 2017 April 24, 2024 10.67 Lithium Amérique du Nord Inc. 100% $500 CDC 2490654 Active April 25, 2017 April 24, 2024 37.72 Lithium Amérique du Nord Inc. 100% $1,200 CDC 2490655 Active April 25, 2017 April 24, 2024 26.5 Lithium Amérique du Nord Inc. 100% $1,200 CDC 2490656 Active April 25, 2017 April 24, 2024 44.59 Lithium Amérique du Nord Inc. 100% $1,200 CDC 2520959 Active July 19, 2018 July 18, 2023 42.99 Lithium Amérique du Nord Inc. 100% $1,200 CDC 2521244 Active July 20, 2018 July 18, 2023 57.2 Lithium Amérique du Nord Inc. 100% $1,200 CDC 2521245 Active July 20, 2018 July 18, 2023 57.2 Lithium Amérique du Nord Inc. 100% $1,200 CDC 2521246 Active July 20, 2018 July 18, 2023 57.2 Lithium Amérique du Nord Inc. 100% $1,200 CDC 2521247 Active July 20, 2018 July 18, 2023 37.03 Lithium Amérique du Nord Inc. 100% $1,200 CDC 2569722 Active June 23, 2020 June 22, 2023 20.53 Lithium Amérique du Nord Inc. 100% $500 CDC 2569723 Active June 23, 2020 June 22, 2023 21.78 Lithium Amérique du Nord Inc. 100% $500 Total 1,492.56 $68,100 North American Lithium DFS Technical Report Summary – Quebec, Canada 64 Figure 3-4 – Map showing NAL mineral titles. 3.2.2 Mineral Rights and Permitting Permits are required for any exploration program that involves tree cutting (to create access roads or drill pads or, in preparation for mechanical outcrop stripping, for example). Permits are issued by the Ministère des Resources naturelles et des Forêts (MRNF). Permitting timelines are typically three to four weeks. Additional permitting requirements are needed when drilling on the historical tailings sites. Permits are also necessary for the exploitation of the mine. NAL operations have obtained all necessary permits from government agencies to allow for surface drilling on the NAL Property. All necessary regulatory permits required for the operation of the NAL mine since its construction are listed below. Major existing permits and authorizations include: • Ore treatment plant (concentrator) and refinery. • Construction of tailings accumulation areas. • Overburden stockpile #2. • Operation of a spodumene surface mine in La Corne.

North American Lithium DFS Technical Report Summary – Quebec, Canada 65 • Operation of the concentrator and the refinery. • Wastewater treatment system. • Open pit mining. A complete list of permits and authorizations for the Project can be found in Chapter 17. 3.2.3 Agreements and Royalties There are no royalties applicable to any mineral substances extracted from the lands subject to the aforementioned mining titles. The author did not verify the legality or terms of any underlying agreement(s) that may exist concerning the Project ownership, permits, offtake agreements, license agreements, royalties, or other agreement(s) between NAL / Sayona Québec and any third parties. 3.3 ENVIRONMENTAL LIABILITIES AND OTHER PERMITTING REQUIREMENTS The author is not aware of any environmental liabilities, other than those mentioned here, to which the Property is subject, other than the normal licensing and permitting requirements that must be made prior to undertaking certain operations and environmental restrictions as set forth in the Provincial Mining Act and Regulations. There were no outstanding liabilities on the old mining site prior to the resumption of operations in 2013 as a previous owner of the claims, Cambior Inc., had completed the full rehabilitation to the satisfaction of the MRNF and in conformity with provincial safety standards, as well as received confirmation from the authorities for the completion of the work. Such rehabilitation of the mine site included the complete removal of all underground and surface plant and equipment, the mine’s head frame, the railway spur connecting to the Canadian National (CN) railway line, and all office buildings and other structures, which was completed from 1975 through 2001. The crown pillar was fenced off and all openings sealed. Old tailings were stored within two dams located to the north of the mine area in a west-east trending valley between Lac Lortie and Lac Roy. There is an estimated 700,000-750,000 t of material stored there, mostly quartz and feldspar sand (Karpoff, 1993). Tailings rehabilitation included covering them with soil and vegetation. In 2009, a study of the environmental character (SEC) of the Property was initiated by Genivar Inc. of Amos, Québec, which was then pursued and completed by Project personnel prior to resuming production mid-2013. The objective of the SEC was to outline all environmental concerns and constraints for the proposed development of an open-pit mining operation. North American Lithium DFS Technical Report Summary – Quebec, Canada 66 An environmental baseline study for the Project, begun in October 2009, was incorporated into the final SEC report. This was the first step towards obtaining the permits and authorizations from regulatory authorities to permit the construction of new infrastructure and pre-stripping of the deposit in 2012. New office buildings, sheds, warehouse, and a processing plant, all located about 1 km west of the mining pit area, were permitted and constructed prior to launching open-pit operations in mid-2013. A tailings storage facility (TSF) with a five-year storage capacity was constructed some 500 m south of the processing plant, which now has approximately a year left of capacity in its actual state for the storage of Spodumene tailings. TSF-1 is scheduled to be raised to elevation 407 m in Year 0. The membrane will be raised to an elevation of 403.5 m during this period. This represents 2.5 Mm3 of tailings storage capacity being created or two and a half (2.5) years of storage capacity for concentrator tailings at elevation 403.5. The membrane can further be raised to 407 m to accommodate an additional 2 years of deposition. Although not forming part of this feasibility study, should a conversion plant be planned, the lined facility could be used for the storage of conversion plant residues at the start of Year 1, providing sufficient LOM capacity in TSF-1 for conversion plant residues. This notwithstanding a second TSF will be required in the short- to medium- term for the storage of LOM concentrator tailings. NAL also has two planned waste rock piles, currently located 1.5 km and 2.5 km from the pit. Both piles, as well as the dykes surrounding the TSF-2, have the capacity to store the required 172.7 Mt of waste rock over the LOM in their final expansion stage. Waste Rock Piles 2 and 3 expansions have been designed to reach the final required capacity and are currently undergoing the permitting process. The only environmental liabilities are known contaminated soils. The other infrastructures are covered by the restoration plan and the financial guarantee deposited with the MRNF. 3.4 MINERAL AND SURFACE PURCHASE AGREEMENTS In addition to the mining rights described above, NAL holds five surface leases on lands of the domain of the State (referred to below as Public Land Leases), which it rents or plans to rent from the Ministère des Resources naturelles et des Forêts (MRNF) for the utilization and rights shown in Table 3-2. A request for an extension of the leases for the waste stockpile 2 and the waste stockpile 3 has been sent to the MRNF as well as a request for a new lease for the future TSF 2. North American Lithium DFS Technical Report Summary – Quebec, Canada 67 Table 3-2 – NAL Public land leases. MRNF Lease # Land Lease Description Area (ha) 82373700 Public Land Lease – Surface Infrastructures 43.2 824391/41818908 Public Land Lease – Waste Stockpile 3 118.6 82439000 Public Land Lease – Overburden stockpile 30.8 82439400 Public Land Lease – Access Road and Mineral stockpile 96.3 82439200 Public Land Lease – TSF1 104.9 82438600 Public Land Lease – Lac Lortie North well (OW-11-03) 1.0 Total 394.8 3.5 OTHER SIGNIFICANT FACTORS AND RISKS To the author’s knowledge, there are no significant factors, risks or legal issues that may affect access, title, the right, or ability to perform work on the Property. North American Lithium DFS Technical Report Summary – Quebec, Canada 68 4. ACCESSIBILITY, CLIMATE, PHYSIOGRAPHY, LOCAL RESOURCES, AND INFRASTRUCTURE 4.1 ACCESSIBILITY The Property is located approximately 60 km north of Val-d’Or, Québec, and 38 km southeast of Amos, Québec, and is accessible by provincial Highway 111, connecting Val-d’Or and Amos, or alternatively by provincial Highway 397, connecting Val-d’Or and Barraute (Figure 4-1). An all-weather secondary road, known as Route du Lithium, connecting the site to the Val-d’Or – Amos highway, which was used to traverse the Property and factually caused constraint to the pit operations, has now been relocated to avoid the mining area. The site is also accessible from Mont-Vidéo, through an all-weather road that connects further east to the Val-d’Or – Barraute highway. Val-d’Or and Rouyn-Noranda are serviced daily by regional air carriers, while small craft landing areas are also located in these towns and nearby Amos. The closest all-weather landing strip and helipad is located at Amos now that the small aircraft landing strip, once located at Mont-Vidéo to the east of the Property, was converted into the new all-weather gravel road circumventing the mine site.

North American Lithium DFS Technical Report Summary – Quebec, Canada 69 Figure 4-1 – Location of the NAL Property (Source: Google Earth). 4.2 TOPOGRAPHY, ELEVATION, VEGETATION AND CLIMATE 4.2.1 Physiography The Property contains small hills and is located at a mean elevation of 400 masl, but the topography is generally flat with swamps, sand plains and an esker along its edge. Granitic intrusions, which are part of the La Corne pluton, underlie nearly all of the hilly area (Figure 4-2 and Figure 4-3; Tremblay 1950). The volcanic rocks adjacent to this pluton have been altered to hornblende (Hbl) schists, which are very resistant to weathering and now form the highest hills (Figure 4-4; Tremblay 1950). In the early 1950s, the hills were covered with dense forest growth consisting mainly of hardwoods (Dawson 1966). Most of the outcrops of spodumene-bearing (Spd) pegmatite occur on the top of a ridge that rises to an elevation of approximately 150 ft (~45 m) above Lac Lortie. This ridge can be traced for approximately 2,000 ft (~610 m) in an east-west direction. The eskers were originally covered by dense stands of jack pine with some areas of hardwoods (Dawson 1966). The lowlands represent a very gently rolling landform with relief that rarely reaches 100 ft (~30 m) above the adjoining waterways (Dawson 1966). They are dissected by shallow stream valleys and contain North American Lithium DFS Technical Report Summary – Quebec, Canada 70 large muskegs where drainage is poor (Dawson 1966). Due to its even surface and clay bottom, this plain is a good farming area (Tremblay 1950). The lowlands were originally covered with dense stands of softwoods. Outcrops are very scarce as the showing is almost entirely covered by a thick growth of timber and a light mantle of sand and gravel (Tremblay, 1950). The region's landscape typically features mixed forest to the south, while boreal forest covers the northern section, notably along the Amos – La Sarre corridor. Wholesale timber logging activities took place locally during the ‘50s and ‘60s, until the ‘80s, when reforestation was undertaken. As the mine is a recently reclaimed site and also because all timber had been cut earlier, vegetation is limited to spruce with jack pine and alders in regrowth near the site. Figure 4-2 shows the main existing and planned site infrastructure for the Project. The highlighted features include the fully developed open pit, the existing and expanded tailings storage facilities, the waste rock, and overburden piles, as well as various other pads associated with the life of mine (LOM) pit plan, plant facilities, as well as the neighboring infrastructure, landscape, and roads. Figure 4-2 – General arrangement of existing and planned infrastructure at the mine site. North American Lithium DFS Technical Report Summary – Quebec, Canada 71 Figure 4-3 and Figure 4-4 show the relief and vegetation of the property adjacent to the mine site, as well as the location of the mine and tailings facility in relation to the processing plant. Figure 4-3 – View looking northwesterly across the plant and mine site. North American Lithium DFS Technical Report Summary – Quebec, Canada 72 Figure 4-4 – View looking southeasterly showing the plant facilities in the foreground of the tailings impoundment area.

North American Lithium DFS Technical Report Summary – Quebec, Canada 73 4.2.2 Climate The Val-d’Or area experiences a subarctic continental sub-humid climate, characterized by short, cool summers and long, cold winters. The nearest weather monitoring station with data on climate normals maintained by Environment Canada (climat.meteo.gc.ca) is the Amos station, approximately 38 km northwest of the Property. According to the available data collected at this weather station from 1981- 2010, the average daily temperature for January was -17.2 °C and the daily average temperature in July was 17.4 °C. The record low during this period was -52.8 °C, and the record high was 37.2 °C. Data collected from the Amos weather station from 1981 to 2010 indicates that the total annual precipitation was 929.0 mm, with peak rainfall occurring during July (112.1 mm average), August (98.3 mm average) and September (106.7 mm average). Snowfall is light to moderate, with an annual average of 253.3 cm. Snow typically accumulates from October to April, with a peak snowfall occurring in November (45.0 cm average), December (58.5 cm average) and January (55.6 cm average); during this period, snowpack averages 39 cm depth, with a maximum depth of approximately 142 cm. On average, the Property is frost-free for 97 days, though discontinuous permafrost exists in the area. Hours of sunlight vary from 15.5 hours at the summer solstice in June to 8.1 hours at the winter solstice in December. The climatic conditions at the Property do not significantly impede the Project or hinder exploration or mining activities, beyond seasonal consideration for certain works (e.g., drilling muskeg swamps during winter freeze). 4.2.3 Vegetation The regional study zone is located within the western balsam fir-yellow birch bioclimatic domain. The forest landscape is dominated by stands of pine and white spruce, intermingling with white birch trees. The regional study zone includes several open environments, e.g., farmer’s fields, non-forest wetlands, recent logging areas, etc., but is nonetheless primarily comprised of forest. Conifer stands predominate, followed by mixed stands. Hardwood or deciduous stands are less frequent and consist almost solely of young stands or trees undergoing regeneration. The numerous disturbances of the late ‘70s, e.g., epidemics, logging, plantations, and windfall, all resulted in major occurrences of these types of stands. According to the Centre de données sur le patrimoine naturel du Québec (CDPNQ), the sector concerned by the Project does not include any plant species designated as threatened, vulnerable or likely to be thus designated. Any special-status species have been observed in the ESIA baseline studies. The sector contains no exceptional forest ecosystems (EFEs), forest stands with a phytosociological interest or biological refuges. Furthermore, the past few years have seen considerable logging activity. North American Lithium DFS Technical Report Summary – Quebec, Canada 74 4.3 LOCAL INFRASTRUCTURE AND RESOURCES 4.3.1 Airports, Rail Terminals, and Bus Services The town of Val-d’Or, with a population of approximately 33,870 residents (Statistics Canada, 2016), is located 60 km south of the Property, along the provincial Highway 111. Since Val-d’Or was founded in the 1920s, it has been a mining service centre. Val-d’Or is one of the largest communities in the Abitibi region and has all major services, including an airport with scheduled service from Montréal. Canadian National (CN) railway line is about 49 km east of the Property, connecting east through to Montréal and west to the North American rail network. Val-d’Or is a 6-hour drive from Montréal, and there are daily bus services between Montréal and the other cities and towns in the Abitibi region. The town of Amos, with a population of roughly 13,000 residents, is located roughly 40 km northwest of the NAL site. Amos is served by highways 109, 111, and 395 and the Amos/Magny airport. 4.3.2 Local Workforce According to the 2016 census prepared by Statistics Canada, the population of the MRC of La Vallée-de- l’Or was 43,226 people, with 66% of the residents aged 15-64, and an average of 41 years old. Male population accounts for 51% of the population, 49% is female, and 8.5% is Aboriginal. In 2016, 64.4% of the population participated in the labor force, with 14.2% of the labor force employed in the “mining, quarrying, and oil and gas extraction” category. This portion of the workforce is experienced in mining operations, as they are currently employed at exploration and gold mines located elsewhere in the Abitibi region. Local resources also include commercial laboratories, drilling companies, exploration service companies, engineering consultants, construction contractors and equipment suppliers. 4.3.3 Additional Support Services Additional services within the town of Val-d’Or include the Val-d’Or Hospital, grocery stores, fuel stations, financial institutions, and hotels. Val-d’Or has a Canada Post office and additional shipping/freight services by several providers. Landline telephone, mobile service, high-speed internet, and satellite internet are available in town and the vicinity. A high-voltage power line (120 kV) passes approximately 2 km to the west of the Property and a 25 kV electric line, running along the Route du Lithium, services the Mont-Vidéo ski and recreation area. An Astral Media Inc. radio tower was relocated off-property in 2012. North American Lithium DFS Technical Report Summary – Quebec, Canada 75 The Lac Lortie, located immediately to the north of the pit area, has provided some water for drilling, and was once considered for use as a primary water source for the Project; however, most of the water for use for production purposes is now planned to be recycled from the TSF. North American Lithium DFS Technical Report Summary – Quebec, Canada 76 5. HISTORY 5.1 GENERAL There is a large amount of historical information relating to the exploration and mining activities on the Property, which has been summarized in the following reports: • Stone, M. and Selway, J., Technical Report of December 2009. • Stone, M. and Ilieva, T., Technical Report of April 2010. • Lavery, M.E. and Stone, M., Technical Report of November 2010. • Hardy, C.A. and al., Technical Report of August 2017 (unpublished). The compilation work was assisted by published reports, internal reports, drill logs and available assessment files from the Ministère des Ressources naturelles et des Fôrets (MRNF). Historic annual mine reports are missing for the period of 1958 to 1962. Drilling information for all historic underground and some surface holes are incomplete or missing. Table 5-1 summarizes ownership and historic exploration completed on the Property. A qualified person has not done sufficient work to classify the historical estimates or to verify their accuracy as presented in Table 5-1. Table 5-1 – Summary of ownership and historic activities. Year Company/Ownership Main Activity/Event Main Result 1942 Sullivan Prospecting. Discovery of spodumene pegmatite. 1942- 1943 Dumont Diamond drilling. 17 holes (3,598.9 ft). 1946 Nepheline Products Ltd. and Great Lakes Carbon Corporation Prospecting, trenching, diamond drilling bulk sampling. Sufficient material discovered for mining, 6 holes (2,088 ft) - results encouraging. 1947 La Corne Lithium Mines Ltd. Company was established. 1950 Lakefield Research Ltd. Nepheline Products Ltd. Changed name to Lakefield Research Ltd. 1952- 1953 La Corne Lithium Mines Ltd. Diamond drilling. +30,000 ft drilled; several spodumene pegmatites intersected. 1954 Québec Lithium Corp. Acquires the Property, surface diamond drilling, shaft sinking mine and mill development. 1955 Québec Lithium Corp. Mine and mill development. Shaft completed to 560 ft depth. Three underground levels (150 ft, 275 ft and 400 ft). Underground drilling. 118 drillholes (+22,000 ft). 1956 Québec Lithium Corp. Mining, underground drilling. 1,100 tons/d (~1,000 t/d); 325 drillholes totalling +53,000 ft (+16,150 m). 1957 Québec Lithium Corp. Mining, surface diamond drilling totalling 58,920 ft. 1,250 tons/d (1,135 t/d), total 513,403 tons (465,750 t). 1959 Québec Lithium Corp. Construction of lithium refinery commences.

North American Lithium DFS Technical Report Summary – Quebec, Canada 77 Year Company/Ownership Main Activity/Event Main Result 1960 Québec Lithium Corp. Refinery operational. 1963 Québec Lithium Corp. Production of lithium hydroxide begins. 1963- 1964 Québec Lithium Corp. Mining and refining. 76,856 tons (69,722 t) of ore hoisted; year-end reserves of broken ore were 198,998 tons (180,528 t). 1965- 1966 Québec Lithium Corp. Mining and refining. 62,479 tons (56,680 t) of ore hoisted; year-end reserves of broken ore were 249,842 tons (226,653 t). 1974 Sullivan Mining Group FS on the re-opening of the Québec Lithium mine prepared, mining, processing, historic resource estimate. LOM is 2 1/2 years at 1,000 t/d, 2,100 ft (640 m) of cross-cutting and 3,500 ft (1,067 m) of drifting, 17,347,000 t of ore estimated at 1.14% Li2O. 1977 Sullivan Mining Group 1974 resource confirmed. 1979 Sullivan Mining Group Diamond drilling. 7 holes (5,320 ft (1,621 m)). 1985 Sullivan Mining Group Diamond drilling. 2 holes (504 ft (154 m)). 1987 Cambior Acquired the Property. 1990- 1991 Cambior Mining facilities sold. Site rehabilitated. 1993 Cambior Report summarizing historic mining activities (Karpoff, 1993). 2000 Cambior Report approving the rehabilitation. 2001 Cambior Grab samples. 2008 Canada Lithium Corp. Metallurgical testwork to produce battery grade lithium carbonate. Drilling 8 holes. Metallurgical testing results encouraging. 2009 Canada Lithium Corp. Mine data digitally compiled, diamond drilling program, twinning and infill. A first in-house resources estimate from historical compilation; 30-40 Mt at 1.1-1.2% Li2O. Twinning and infill; 38 drillholes (9,648 m). 2010 Canada Lithium Corp. New resource estimate by Caracle Creek, diamond drilling program. Metallurgical testwork; 67 drillholes (1,010 m); Infill and extension drilling 45 drillholes (6,938 m); A new resource model and estimate is announced (CCIC): Measured & Indicated: 46.6 Mt at 1.19% Li2O. 2011 Canada Lithium Corp. PFS, diamond drilling program, RPA conduct independent review of the resources. RPA downgrades the resources estimate; Infill and extension drilling 63 drillholes (12,003 m); AMC report updated resource estimate: Measured & Indicated: 32.24 Mt at 1.19% Li2O. 2012 Canada Lithium Corp. FS completed, construction of mine and plant commences and production launched late 2012. Production: 20,600 t at 1.07% Li2O mined; 1,316 t milled. 2013 Canada Lithium Corp. Commissioning and ramp up in production. Production: 303,200 t at 0.99% Li2O mined; 259,834 t milled. 2014 Canada Lithium Corp. (Restructured) Project delivery delays and financial difficulties; Ownership change: CLQ is restructured and becomes Québec Lithium Corp. (QLI); placed on care and maintenance. Production: 349,000 t at 0.99% Li2O mined and 278,922 t milled; halts production in September 2014. 2015 Québec Lithium Corp. (Restructured) Ownership change; company restructuring; engineering studies. Property placed in receivership; Interim production plan: Two years start-up pit plan; Project scheduling. 2016 North American Lithium Corp. New ownership and Project management; Infill drilling launched; engineering studies; mill recommissioning. Interim in-house resources estimate from new model and data; M+I: 34.4 Mt at 1.22% Li2O. Additional infill drilling: 46 (+4 re-drill) drillholes (8,910.5 m). 2017 North American Lithium Corp. Recommissioning of concentrator; engineering studies; Geotechnical drilling campaign. Phase 1 hot commissioning and ramp-up started June 2, 2017. 22 geotechnical drillholes (956 m). 2019 North American Lithium Corp. Drilling, exploration work and production shutdown. 42 drillholes (11,487 m) to define Phase 2 of the pit; Shutdown of production on February 19, 2019; Stripping work in summer 2019 permitted surface mapping of the dykes. 2021 Sayona Québec Ownership change: Sayona Québec acquires North American Lithium Inc. on August 26, 2021. Updated Resources were published on March 1, 2022. North American Lithium DFS Technical Report Summary – Quebec, Canada 78 5.2 HISTORICAL EXPLORATION AND DRILL PROGRAMS Diamond drilling was carried out by several operators over time. This activity has also been summarized in the earlier technical reports and is reproduced in Table 5-2, showing the total meters drilled. Table 5-2 – Details of historic drilling. Year Company Hole Hole name Metres (1) Surface Diamond Drillholes 1942/43 Dumont 17 S-1 to S-14 1,097 1946 Nepheline Products Ltd. and Great Lakes Carbon Corporation 6 1 to 6 636 1952 Lithium Exploration Company Ltd. 5 SB-15 to SB-19 152 1952 Québec Lithium Corp. 60 LV1 to LV-60 8,964 1952 Québec Lithium Corp. 14 SB-20 to SB-30, SB-32 to SB-34 1,096 1953 Québec Lithium Corp. 40 SB-47 to SB-86 5,323 1953 Québec Lithium Corp. 8 LB-1 to LB-8 1,182 1955 Tide Lake Lithium Mining Corp. Ltd. 18 T-1 to T-18 3,485 1956 Québec Lithium Corp. 10 LV61 to LV-70 646 1958 Québec Lithium Corp. 3 LV-71 to LV-73 46 1979 Sullivan Mining Group 7 LV-74 to LV-81 1,622 1985 Sullivan Mining Group 2 QL-85-1 and QL-85-2 154 Total 190 24,403 Underground Diamond Drillholes Level 1 v Québec Lithium Corp. 52 1-1 to 1-12, 1-14 to 1-20, 1-23 to 1-58 2,885 1956 Québec Lithium Corp. 190 1-58 to 1-246 8,612 1957 Québec Lithium Corp. 145 1-245 to 1-389 6,398 Level 2 1955 Québec Lithium Corp. 64 2-1 to 2-19, 2-21 to 2-26, 2-28 to 2-38, 2- 44 to 2-72 3,580 1956 Québec Lithium Corp. 135 2-72 to 2-206 7,604 1957 Québec Lithium Corp. 71 2-204, 2-207 to 2-276 2,944 Level 3 1955 Québec Lithium Corp. 2 3-1 and 3-2 267 Total 659 32,290 Recent Surface Diamond Drillholes 2008 Canada Lithium Corp. 8 Metallurgical sampling -N/A 2009 Canada Lithium Corp. 39 Twinning and infill 9,294 2010 Canada Lithium Corp. 51 Metallurgical and infill 7,489 2010 Canada Lithium Corp. 8 Geotech drilling environment 1,158 2011 Canada Lithium Corp. 63 Infill and extension 12,025 2016 North American Lithium 50 Infill and extension (incl. re-drills) 8,911 2019 North American Lithium 42 Infill and extension 11,487 Total 261 50,364 (1) The number of meters is rounded to the nearest hundred. Any discrepancies are due to rounding. North American Lithium DFS Technical Report Summary – Quebec, Canada 79 5.3 HISTORICAL PRODUCTION 5.3.1 Ownership and Activities The original discovery of spodumene-bearing pegmatite on the Property was made in 1942, when three main spodumene dykes were intersected, along with several thinner ones. The owner at that time was Sullivan Mining Group and the Property went through several owners before being acquired by Québec Lithium Corporation (QLC) in 1954. QLC put the operation into production in 1955, after sinking a three- compartment shaft and establishing three working levels at 150 ft, 275 ft, and 400 ft. At the end of 1955, two stopes were in operation, which contained approximately 136,000 tons of ore grading 1.2% Li2O. In mid-1959, the contract for the sale of spodumene concentrate by QLC to Lithium Corporation of America Inc. was terminated. A refinery capable of producing lithium carbonate, lithium hydroxide monohydrate, and lithium chloride was constructed in Barraute and was operational by 1960. Production of lithium hydroxide monohydrate (LiOH.H2O) began in June 1963. In October 1965, operations were suspended on account of a strike and due to unfavorable market conditions. Altogether, from 1955 until 1965, a total of 938,292 t of ore were milled from 1,084,738 t mined from underground operations at the site. The production profile for the mine is presented in Section 5.3.2. In 1974, the Sullivan Mining Group acquired the Property and contracted Surveyor, Nenniger et Chênevert Inc. (SNC), an engineering consulting firm, to table a feasibility report on the rehabilitation of the Québec Lithium mine (SNC, 1974). They investigated market conditions, alternative mining methods and metallurgical processes. They also recalculated the mining and property Li2O reserves. In October 1987, Cambior Inc. (Cambior) acquired all assets of QLC. In 1990-1991, the mining facilities were sold, infrastructures were demolished, and the site was completely levelled and rehabilitated (Karpoff, 1993). In May 2008, Canada Lithium Corp. (CLC) acquired the Property and began a metallurgical testing program to produce spodumene concentrate and battery-grade lithium carbonate. In 2009, the historic mine data was digitally compiled and a 29-30 Mt exploration target for lithium, with a grade range of 1.1% - 1.2% Li2O, was estimated. This potential tonnage was verified and expanded upon through a number of drill programs completed in 2009 and 2010. In October 2010, the mineral resource was updated to a Measured and Indicated resource of 46.6 Mt at 1.19% Li2O. In April 2010, CLC completed a prefeasibility study for the development of a battery-grade lithium carbonate mining and processing operation that would produce approximately 19,000 tpy of lithium carbonate equivalent (LCE) over a 15-year mine life. The feasibility study was completed in December 2010. North American Lithium DFS Technical Report Summary – Quebec, Canada 80 On February 28, 2011, CLC announced the appointment of Roscoe, Postle & Associates (RPA) to undertake an independent review of the mineral resource estimate of October 2010, following an internal review that indicated a material reduction in the resources. In March 2011, CLC announced that RPA had confirmed that there were significant issues with the geological modelling that had produced the mineral resource estimate announced on October 28, 2010. CLC then appointed AMC Mining Consultants (Canada) Ltd. (AMC) to independently conduct a resource estimate of the Project and expeditiously prepare a new technical report in accordance with NI 43-101. AMC completed the first updated resource estimate in May 2011, filed on SEDAR on June 8, 2011 (Shannon et al., 2011). Between June and August 2011, a 63-hole infill drilling program was carried out at the Project under CLQ, comprising 12,003 m of diamond core drilling. AMC subsequently carried out an updated mineral resource estimate using a rebuilt mineralized domain model, which incorporated the latest drilling data, in addition to data from CLQ’s 2009 and 2010 drill programs, which included a certain amount of historical data. This updated resource estimate, dated December 5, 2011, reported a Measured and Indicated resource of 33.24 Mt at 1.19% Li2O, on which BBA estimated a pit reserve of 17.1 Mt at 0.94% Li2O (Shannon et al., 2011). CLC completed a feasibility study in January 2011 (Hardie et al., 2011) and commenced construction of the Project in September 2011and its successor, Quebec Lithium Corp. (QLC), went on to operate the mine from late 2012 until September 30, 2014, extracting 676,800 t at 0.99% Li2O from the pit. The concentrator processed some 551,695 t of ore at 1.03% Li2O. Under CLC, the Project faced commissioning issues and mounting financial difficulties; it finally closed in November 2014 and went into receivership in January 2014. The Project remained under care and maintenance until July 2016, when it was acquired by North American Lithium Inc., which proceeded to carry out additional infill diamond drilling and produced internal studies to recommission the Project. Plant upgrades were undertaken, and the mine and concentrator resumed operation in 2017. During 2018, the concentrator produced roughly 114,000 t of spodumene concentrate that averaged roughly 5.6% Li2O. Due to financial difficulties, the mine and concentrator ceased operations in April 2019. The concentrator was put into care and maintenance. 5.3.2 Historical Production Historical underground mine production lasted 10 years from 1955 to 1965 and peaked at 247,000 t hoisted in 1957; however, production was intermittent after 1959, when the contract for the sale of spodumene concentrate to Lithium Corporation of America Inc. was terminated. Mine production statistics can be seen in Table 5-3.

North American Lithium DFS Technical Report Summary – Quebec, Canada 81 Table 5-3 – Mine production statistics. Year Tonnes of ore hoisted Tonnes of ore milled 1955 10,537 9,570 1956 240,732 216,190 1957 246,946 205,816 1958 170,739 142,511 1959 183,769 150,858 1960 4,765 3,351 1961 21,237 23,013 1962 16,566 12,825 1963 63,044 60,710 1964 69,723 63,614 1965 56,680 49,834 Total 1,084,738 938,292 While it is not known if there were some tonnage reconciliation adjustments contributing to the numbers above, it is noted that hand sorting activities were employed to remove non-dyke material and upgrade the mill feed during the course of historical operations. The total figures above suggest a difference of 13.5%, but it is postulated that sorting removed about 10% of the hoisted material. 5.3.2.1 2012 – 2014 Production Open pit mining operations (Figure 5-1) took place from late 2012 until September 30, 2014, extracting 676,800 t at 0.99% Li2O from the pit, while processing some 551,695 t at 1.03% Li2O through the concentrator. Planned reserves that were mined were 540,072 t at 1.0% Li2O while the concentrator reported 551,695 t at 1.03% Li2O. Mine operational staff were mindful of grade and quality control, but overall dilution was relatively high at 28%. CLC officially started concentrator production in November 2012, ramping-up from a modest 20,600 t in late 2012 to 349,000 t in 2014, until September 30, 2014. The process plant never reached nameplate capacity. The concentrator struggled to meet concentrate specification and typically produced concentrate grading between 3% and 4% Li2O with iron typically ranging from 2% to 3%. The conversion plant operated intermittently and in batch mode during 2014 and produced a total of roughly 100 t of lithium carbonate. Based on the 2012-2014 operation, major challenges included: • Higher-than-planned dilution in run-of-mine ore. • Mining cost were higher than anticipated due to the narrow vein nature of the deposit. • High levels of dilution led to processing issues and production of low-quality concentrate. • Competition for skilled labor with other mines in the Abitibi-Témiscamingue region. North American Lithium DFS Technical Report Summary – Quebec, Canada 82 Figure 5-1 – Québec Lithium Project open pit mine operations at peak in 20145452. 5.3.2.2 2017 – 2019 Operations Plant upgrades were undertaken prior to restarting the mining and concentrator operation in 2017. Major plant upgrades included installation of a second ore sorter, modifications to the crushed ore silo, and addition of a wet high-intensity magnetic separator. Efforts were made to improve operational procedures to better understand and manage dilution in the run-of-mine ore. Mining and processing worked closely together to establish upper specification limits on iron content in the feed to the mill. Geology, mining, and process teams worked in collaboration both on understanding sources of dilution and on aligning key production indicator (KPI) for operations. The NAL mine and concentrator operated from June 2017 to March 2019. The aim was to maintain host rock dilution below 20%. During operation, roughly 1.5 Mt of ore was fed to the plant. The concentrator produced roughly 166,000 t of spodumene concentrate, typically ranging in grade from 5.5% to 6.0% Li2O and 0.9% to 1.6% Fe. The plant never achieved nameplate capacity (3,800 tpd) and due to depressed spodumene concentrate prices, the plant was put into care and maintenance in April 2019. North American Lithium DFS Technical Report Summary – Quebec, Canada 83 5.3.3 2021 Acquisition to Present Sayona Québec acquired the NAL project in August 2021. A prefeasibility study was completed in May 2022 for the restart of mining and concentrator operations. Significant process plant upgrades were implemented to ensure production of high-quality chemical-grade spodumene concentrate at nameplate capacity. Mining operations at NAL commenced in November 2022. Operation of the concentrator commenced in February 2023. North American Lithium DFS Technical Report Summary – Quebec, Canada 84 6. GEOLOGICAL SETTING, MINERALIZATION AND DEPOSIT 6.1 REGIONAL GEOLOGY The Archean Preissac-La Corne batholith is a syn- to post-tectonic intrusion that was emplaced in the Southern Volcanic Zone of the Abitibi Greenstone Belt of the Superior Province of Québec. The batholith intruded along the La Pause anticline into the ultramafic to mafic lavas of the Kinojevis (2,718 Ma; Corfu 1993) and Malartic groups, and biotite schist of the Kewagama Group. The batholith is bounded to the north by the Manneville fault and to the south by the Cadillac fault and the eastward extension of the Porcupine-Destor fault. The batholith is a composite body comprising early metaluminous gabbro, diorite, monzonite, and granodiorite (ca. 2,650-2,760 Ma: Steiger and Wasserburg 1969, Feng and Kerrich 1991) and four late peraluminous monzogranitic plutons (Preissac, Moly Hill, La Motte and La Corne) and associated pegmatites and quartz veins (ca. 2,621-2,655 Ma: Gariépy and Allègre 1985, Feng and Kerrich 1991). The final intrusive activity in the area was the Proterozoic diabase dykes. The regional metamorphic grade is greenschist facies and close to the batholith is hornblende hornfels facies contact metamorphism. 6.2 LOCAL GEOLOGY The geology of La Corne and Fiedmont Townships has been discussed in reports by Tremblay 1950, Dawson 1966 and Mulja et al., 1995, and is shown on the Geological Survey of Canada (GSC) map 999A (Tremblay, 1950) and GSC map 1179A (Dawson, 1966). The regional structure and the stratigraphic units are discussed below. The stratigraphy is discussed from oldest to youngest and Figure 6-1 shows a map of the local geology. Figure 6-2 illustrates the stratigraphic column of the local geology. 6.2.1 Malartic and Kinojevis Groups – Basaltic Lavas The volcanic rocks are generally fine-grained and medium to dark green on fresh surfaces. The units are massive or locally exhibit structures such as pillows, flow breccia or amygdule. Under the microscope, the volcanic rocks are mainly green hornblende, plagioclase with minor amounts of quartz, epidote, biotite, and chlorite. The accessory minerals include titanite, apatite, magnetite, pyrite and an alteration product of ilmenite, leucoxene. The abundant green hornblende shows incipient alteration to chlorite or partial replacement by holmquistite.

North American Lithium DFS Technical Report Summary – Quebec, Canada 85 Figure 6-1 – Local geology map. North American Lithium DFS Technical Report Summary – Quebec, Canada 86 Figure 6-2 – Stratigraphy of the NAL Project. 6.2.2 Kewagama Group – Biotite Schist The biotite schists are conformably interbedded with the basaltic lavas. The schists are mainly sedimentary in origin, derived from greywacke, sandstone, and conglomerate. The biotite schist beds are up to 40 cm thick, fine-grained and are grey to black on fresh surfaces. They are foliated with the foliation parallel with either the contact or the foliation in the outcrops of the Preissac-La Corne batholith. Under the microscope, the biotite schist consists mainly of quartz, plagioclase, and biotite. Hornblende and chlorite are major components in a few beds. The common accessory minerals are apatite, epidote, tourmaline, pyrite, and magnetite. 6.2.3 Metaperidotite The metaperidotite is interbedded with basaltic lavas and, less commonly, with biotite schists. Metaperidotite is fine-grained and black or dark green in color. The weathered surface is typically brown and exhibits a variety of textures, including polygonal fracture systems, pseudo-pillow structures and a North American Lithium DFS Technical Report Summary – Quebec, Canada 87 platy structure, which is likely komatiite. The metaperidotite consists mainly of felted aggregates of chlorite flakes, acicular to prismatic actinolite, fibrous serpentine and talc flakes with accessory magnetite, carbonate, and pyrite. The platy structure consists of planar concentrations of chlorite and serpentine, alternating with similarly shaped concentrations of actinolite and magnetite. Primary olivine and/or pyroxene relicts are pseudomorphed by aggregates of chlorite, serpentine, talc, magnetite, and carbonate. 6.2.4 La Corne pluton The La Corne pluton has been described by Mulja et al. (1995a). It is dominated by biotite monzogranite, which gives way inward to two-mica and muscovite monzogranite. The geology of the La Corne pluton is similar to that of the rest of the Preissac-La Corne batholith and shown diagrammatically in Figure 6-3 and explained briefly below: A. Early side-wall crystallization produces marginal biotite monzogranite and less dense crystal-layer melts, which ascend to the roof of the magma chamber. B. Fractional crystallization continues to form successive two-mica and muscovite monzogranite layers from more differentiated melts. C. Expulsion of pegmatite-forming, volatile-rich magma from the chamber due to fluid overpressure, results in the emplacement of the beryl pegmatite in the overlying monzogranite. D. Later contraction of the pluton on cooling reactivates fractures in the country rock and produces new fractures, into which the more evolved melts are intruded. This gives rise to the spodumene- beryl and spodumene pegmatites. North American Lithium DFS Technical Report Summary – Quebec, Canada 88 Figure 6-3 – History of La Motte and La Corne plutons (Modified from Mulja et al., 1995b).

North American Lithium DFS Technical Report Summary – Quebec, Canada 89 6.2.5 Proterozoic Gabbro / Diabase Dykes There are post-batholithic gabbro/diabase dykes that outcrop in the batholith and nearby as tabular bodies up to 60 m wide and several kilometers long, striking either N25º E or N40º E and dipping vertically. The gabbro is fine- to medium-grained and tends to be ophitic. 6.2.6 Manneville Fault The Manneville fault, which is a major strike fault, is occasionally exposed in the basaltic lava outcrops along the north side of the batholith. As a result of the strike of N80º W, the distance between the fault and the batholith varies from approximately 3.2 km north of Preissac to less than 1.6 km at Lac Roy. It contains some base metal sulfides, locally. The Manneville fault is believed to be a dip-slip fault, because the biotite schist band east of Lac Roy shows slight evidence of strike-slip displacement. Many of the lithium-bearing dykes occur less than 2.5 km SW of, and roughly parallel with, the Manneville fault zone. 6.3 PROPERTY GEOLOGY A few spodumene pegmatites are exposed on the property following stripping work in 2019, but most of the information on the spodumene dykes was initially acquired by diamond drilling. Two of the spodumene dykes exposed in the trenches on the hill south of the old mine are considered as the original mineralized showing on the Property. Mining on the Property commenced in 1955 and, although the three-dimensional nature of the dykes became more evident, the characteristics originally identified during early exploration remained more or less the same; the rocks are split between granodiorite of the La Corne batholith, volcanics and some biotite schists, as well as the pegmatite dykes that mainly intrude the granodiorite and the volcanics. The principal units are discussed below, but a more complete description can be found in Lavery, M.E. and Stone, M. (2010). Figure 6-4 shows the Property geology displaying the surface projection of spodumene-bearing dykes as interpreted in that report. Figure 6-5 is a generalized geological cross-section of the Project. North American Lithium DFS Technical Report Summary – Quebec, Canada 90 Figure 6-4 – Property geology map. 6.3.1 Volcanics Volcanic rocks on the Property are represented by dark green mafic metavolcanics and medium grey silicified intermediate volcanics. The mafic metavolcanic rocks are medium grey to dark grey green color and cryptocrystalline to very fine grained. The metavolcanic rocks are predominantly massive, but locally exhibit compositional banding, in which the amphibole is slightly coarser grained. Some mafic volcanic rocks are weakly to moderately foliated, with minor dark green amphibole-dominant bands and irregular patches that mainly follow the foliation. Overall, the mafic volcanic rocks are very hard to scratch and locally magnetic. Both mafic and intermediate volcanic rocks are affected by moderate to strong pervasive silicification, minor chloritization and patchy to pervasive lithium alteration. There is alteration of the green hornblende in proximity to the spodumene pegmatite. There are also fine-grained, weakly foliated and dark green amphibolites. A salt-and-pepper appearance occurs locally where plagioclase is more dominant, and the amphibolite is hard to scratch. Amphibolites are affected by strong pervasive potassic alteration, visible as biotitization and pervasive or patchy lithium alteration. North American Lithium DFS Technical Report Summary – Quebec, Canada 91 Figure 6-5 – General geological cross-section looking northwest. 6.3.2 Granodiorite The granodiorite is massive, coarse-grained to porphyritic, medium grey to greenish grey in color and exhibits a salt-and-pepper appearance. Granodiorite locally contains fragments of the same composition or that are slightly enriched in muscovite. The main mineral constituents of granodiorite are light grey to greenish white plagioclase (40-45 vol%), dark green to black amphibole, most likely hornblende (15-20 vol%), mica (20 vol%), represented by biotite and muscovite, grey quartz (10-15 vol%) and minor epidote, chlorite and disseminated sulfides. The grain size ranges from 0.5 mm to 5 mm. Granodiorite has patchy to pervasive lithium and/or chlorite alteration, weak epidote alteration, and locally pervasive potassic alteration. 6.3.3 Pegmatite Dykes Three different types or facies of pegmatite dykes have been identified based on mineralogy and textures: PEG1, PEG2 and PEG3, which are described below. The main differences between the three types of North American Lithium DFS Technical Report Summary – Quebec, Canada 92 pegmatite dykes are the amount of spodumene, feldspar and quartz, the texture of the pegmatite and the presence or absence of zoning. PEG1 dykes are zoned. Five mineralogical/textural zones have been identified and are described as intersected in drill core from stratigraphic top to bottom: 1. Border zone: 2 cm to 10 cm of medium-grained white to pale grey pegmatite, mainly composed of plagioclase and quartz without spodumene. 2. Spodumene zone: Medium- to coarse-grained pegmatite, with 35-40 vol% quartz and 40-45 vol% plagioclase, and white to pale yellowish-green interstitial crystals of spodumene (5-20 vol%). Spodumene crystals are typically perpendicular to the dyke walls but can be randomly oriented. Spodumene content increases towards the center of the dyke. The width of the zone varies from several centimeters up to 25 m. Rocks with a medium-grained, more aplitic appearance are included in this spodumene-bearing zone; however, this aplitic rock could be a different generation of vein. 3. Quartz core: 5 cm to 50 cm zone of massive, medium- to coarse-grained grey quartz, with very rare plagioclase or spodumene crystals. Spodumene near the quartz core is white, elongated, and crystals up to 10 cm long and 1 cm wide were observed in the outcrop. 4. Spodumene zone: Medium- to coarse-grained pegmatite, 35-40 vol% quartz, 40-50 vol% plagioclase, with white euhedral and pale yellowish green interstitial crystals of spodumene (5 20 vol%) and rare aggregates of mica (biotite). The size of the spodumene crystals varies from 0.2 cm to 14 cm. 5. Border zone: 1 cm to 10 cm fine-grained aplitic zone. Distinct change in grain size and color. The pegmatite becomes fine-grained and uniformly grey, mainly composed of quartz-plagioclase-K- feldspar. Spodumene grain size can be highly variable within a zone and overall, through the entire intersection. PEG2 dykes are not zoned and are coarse- to medium-grained, light grey and with pale yellowish-green crystals of spodumene (5-15 vol%), grey quartz (35-40 vol%), white megacrystals of plagioclase and K- feldspar (40-50 vol% and, most likely, albite and orthoclase), occasional millimeter-sized garnets, light colored mica that is possibly lepidolite, flakes of biotite, specks of molybdenite, very rare chalcopyrite surrounded by brownish anhedral mineral with resinous luster that is possibly sphalerite. The spodumene mineralization occurs from contact to contact with no apparent zonation; concentration varies from 2-3 vol% to approximately 20 vol%. Spodumene crystals can be both tabular and needle-shaped within the same intersection. Euhedral crystals are common, while preferred orientations are exhibited by some spodumene crystals and can form both the matrix or fill the interstices between larger quartz, plagioclase, and K-feldspar grains, as observed in the 2016 drilling campaign and shown in Figure 6-6. In Figure 6-7, spodumene megacrystals in PEG2 are shown oriented perpendicular to the contact in drillhole QL-S09-026. Observed locally, Figure 6-8 shows a preferential orientation for spodumene crystalline clusters.

North American Lithium DFS Technical Report Summary – Quebec, Canada 93 PEG3 dykes are quartz dominant and contain less than 1% spodumene. They are medium- to coarse- grained, light pink grey to medium grey creamy pink color, with black or grey patches of mica, i.e., biotite and muscovite. Megacrystals of mica form up to 40% of the rock locally. PEG3 dykes are variable in width from 0.4 m to 8.0 m, contain small vugs and are very hard to scratch and cut. Figure 6-6 – Coarse-grained pegmatitic dyke in hole NAL-16-16. Figure 6-7 – Spodumene megacrystals perpendicular to PEG2 contact zone in hole QL-S09-026. North American Lithium DFS Technical Report Summary – Quebec, Canada 94 Figure 6-8 – Preferential orientation of spodumene crystals in hole NAL-16-024. 6.4 MINERALIZATION Over 49 spodumene-bearing dykes have been interpreted on the Property, some of which were successfully traced in surface exposures over more than 700 m along strike and nearly 70 m vertically down pit walls. The dykes intrude the granodiorite from the La Corne batholith and the mafic volcanics. They are dominantly bearing south easterly and dipping steeply to the SW with splays, splits and bends that were observed, mapped, and correlated from bench to bench in the pit. This main structural trend is locally confronted with a secondary structural orientation striking east westerly with dykes and splays developing as conjugated sets. The dykes were found to be geometrically relatively continuous once exposed over long distances and across several benches in the pit. Figure 6-9 shows dykes exposed in the pit. The spodumene dykes can vary in width from tens of centimeters, up to 90 m and are interpreted to extend for several hundred meters in length. Most of the dykes greater than approximately 3 m in width are spodumene-bearing. Occurrences of spodumene are widely, yet variably, spread throughout the dykes in swarms, displaying faint greenish shades, when present, and sometimes locally revealing large centimetric to decimetric crystal gradation in clusters (Figure 6-10). North American Lithium DFS Technical Report Summary – Quebec, Canada 95 Figure 6-9 – Multiple exposure of pegmatite dykes in the pit (face looking west). Figure 6-10 – Coarse- to fine-grained spodumene mineralization in hole NAL-16-024. In 1955, Karpoff, chief engineer and geologist for the Québec Lithium mine, stated that almost all of the complex pegmatites display zoning: 1) border zone; 2) wall zone; and 3) intermediate or inner zone, but this zoning is so insignificant and is not always completely revealed that he considered, for mining purposes, that the pegmatite dyke is spodumene-bearing from wall to wall. It was reported in later drilling programs that dykes showed variation in zoning (Figure 6-11). North American Lithium DFS Technical Report Summary – Quebec, Canada 96 Figure 6-11 – Pegmatitic dyke zoning and alteration in hole NAL-16-036. The current interpreted mineralized system extends more than 2 km in the NW-SE direction, over a width of approximately 800 m, and remains largely open at depth. There appears to be one persistent subset of dykes that strike obliquely, east westerly, to this main orientation. 6.5 DEPOSIT TYPES 6.5.1 Rare-Element Pegmatites of the Superior Province Rare-element Li-Cs-Ta (LCT) pegmatites may host several types of minerals with potential economic significance, such as columbite-tantalite (tantalum and niobium minerals), tin (Sn) (cassiterite), lithium (Li) (ceramic-grade spodumene and petalite), rubidium (Rb) (lepidolite and K-feldspar), and cesium (Cs) (pollucite), collectively known as rare elements, strategic and energetic metals (Selway et al., 2005). Two families of rare-element pegmatites are common in the Superior Province: LCT enriched, and niobium- yttrium-fluorine (Nb-Y-F or NYF) enriched. LCT pegmatites are associated with S-type, peraluminous (aluminum-rich), quartz-rich granites referred to as two-mica granites. S-type granites crystallize from a magma produced by partial melting of pre-existing sedimentary source rock. They are characterized by the presence of biotite and muscovite, and the absence of hornblende. NYF pegmatites are enriched in rare earth elements (REE), uranium and thorium, in addition to Nb, Y, and F, and are associated with A- type, subaluminous to metaluminous (aluminum-poor), quartz-poor granites or syenites (Černý, 1991). Rare-element pegmatites derived from a fertile granite intrusion are typically distributed over a 10 km2

North American Lithium DFS Technical Report Summary – Quebec, Canada 97 to 20 km2 area within 10 km of the fertile granite (Breaks and Tindle, 1997). A fertile granite is the parental granite to rare-element pegmatite dykes. The granitic melt first crystallizes several different granitic units, e.g., biotite granite to two-mica granite to muscovite granite, due to an evolving melt composition within a single parental fertile granite pluton. The residual melt enriched in incompatible elements, e.g., Rb, Cs, Nb, Ta, Sn, and volatiles, e.g., H2O, Li, F, BO3, and PO4, and from such a pluton can then migrate into the host rock and crystallize pegmatite dykes (Figure 6-12). Volatiles promote the crystallization of a few large crystals from a melt and increase the ability of the melt to travel greater distances. This results in pegmatite dykes with coarse-grained crystals occurring in country rocks considerable distances from their parent granite intrusions. Figure 6-12 shows the chemical evolution of lithium-rich pegmatites with distance from the granitic source (London, 2008). 6.5.2 La Corne Pluton Rare-Element Pegmatites The rare-element pegmatites associated with the La Corne pluton are LCT pegmatites, because they are enriched in Li and Ta, and they are associated with the S-type La Corne pluton, i.e., biotite to two-mica to muscovite monzogranite. The La Corne pluton is the fertile parental granite from which the pegmatites were derived. The presence of garnet, molybdenite, columbite-tantalite and sphalerite in the muscovite monzogranite indicates that the La Corne pluton is fertile granite rather than barren granite (Mulja et al. 1995a). The pegmatites are regionally zoned from the La Corne pluton outwards: beryl pegmatites to spodumene- beryl pegmatites, spodumene pegmatites to molybdenite-bearing albitite to molybdenite-quartz veins. These rare-element pegmatites show features like other rare-element pegmatites of the Superior Province: • The pegmatites occur within the Abitibi Greenstone Belt near the contact with the Pontiac sub province. Many of the lithium dykes lie less than 2.5 km SW of, and approximately parallel to, the Manneville fault zone. • The regional metamorphic grade is greenschist facies. • The pegmatites are genetically derived from the fertile La Corne pluton. • The pegmatites are hosted within mafic metavolcanic rocks, i.e., basaltic lavas of Kinojevis group. • The mafic metavolcanic rocks have been metasomatized to produce Holmquistite along the contact with the La Corne pluton. • The dominant lithium-bearing mineral is spodumene and the dominant tantalum-bearing mineral is columbite-tantalite. Cesium-bearing-minerals have not yet been found in pegmatites. • The columbite-tantalite crystals occur in the albite. North American Lithium DFS Technical Report Summary – Quebec, Canada 98 Figure 6-12 – Chemical evolution of lithium-rich pegmatites over distance (London, 2008). North American Lithium DFS Technical Report Summary – Quebec, Canada 99 7. EXPLORATION From April to November 2023, Sayona carried out a surface drilling campaign on NAL property. In total 172 holes have been drilled, totaling over 45,535 meters. The objective of this drilling campaign was to increase the resources on the entire NAL property and more particularly to convert the inferred mineral resources into indicated mineral resources. The campaign targeted both the lateral and depth extensions of the known pegmatite dike swarms on the NAL deposit, to define extensions and perform infill holes. Logging and sampling have been completed. Lithium assay results are underway. The campaign was supervised by the geological team of Sayona Exploration’s. The results of this campaign have not been incorporated into the resources model as of the effective date of this report. North American Lithium DFS Technical Report Summary – Quebec, Canada 100 8. SAMPLE PREPARATION, ANALYSES AND SECURITY 8.1 REVERSE CIRCULATION PROCEDURES, SAMPLE PREPARATION AND ANALYSES 8.1.1 Sampling and Preparation Procedures BBA produced a list of core intervals needed to be sampled. The sampling procedure was supervised by Mr. Roger Moar, P.Geo. for PLR, and sampling was completed by a technician. Chosen core samples were invariably sawn in half, with one half of the sample interval submitted for lithium analysis and the remainder kept for future testing and/or reference. The core was sawn in half with a diamond saw along its length. One half was put into a plastic sample bag and the other half was retained and kept in the core box for later reference. A sample assay tag was placed in the plastic sample bag and the bag tied off. 8.1.2 Laboratories Procedures The laboratory was SGS, an independent entity from North American Lithium Corp. The samples were delivered to the lab where they were prepared and analyzed using a Fusion Method with ICP-AES finish (GO-ICP90) to determine the lithium content of the pulverized core samples. Preparation of samples was performed at the SGS Lakefield site, Ontario. Samples were then sent to SGS Burnaby site, British Columbia for assaying. SGS is independent of North American Lithium Corp. Samples were analyzed using a four-acid digestion with ICP-AES finish, Na2O2 Fusion and HNO3 to determine %Li and Fe% content of the pulverized core samples. Coarse rejects and pulps were returned to the NAL mine site for storage and reference. 8.2 QA / QC PROCEDURES AND RESULTS Quality assurance and quality control (QA/QC) procedures that conform to current industry standards were developed and implemented by NAL for the drilling programs from 2016 to 2019 and QA/QC data were reviewed as part of the development of the resource model. Despite a relatively small number of adverse check results, earlier conclusions about the satisfactory nature of the QA/QC programs, that were carried out previously, are supported. The sample preparation, security, analytical procedures, and results appear reasonable, executed diligently and in keeping with the industry-accepted practices (Prefeasibility Study Report for the North American Lithium Project, 2022).

North American Lithium DFS Technical Report Summary – Quebec, Canada 101 A total of five low-grade (A), five medium grade (B), five high-grade (C) and five very high-grade (D) standards were submitted, along with 12 blanks, as part of the QA/QC program. The results are summarized below. Using the determined standard A low value of 0.488% Li2O, with an SD of 0.009% Li2O, all samples were within the tolerance specification. A control chart was not generated, as five samples do not constitute a large enough sample population to accurately chart the statistics. The determined standard B medium value of 1.03% Li2O, with an SD of 0.003% Li2O was used. A control chart was not generated, as five samples do not constitute a large enough sample population to accurately chart the statistics. The determined standard C high-grade value of 1.52% Li2O, with a standard deviation of 0.016% Li2O was used. A control chart was not generated, as five samples do not constitute a large enough sample population to accurately chart the statistics. The determined standard D very high-grade value of 2.21.03% Li2O, with a standard deviation of 0.034% Li2O was used. A control chart was not generated, as five samples do not constitute a large enough sample population to accurately chart the statistics. Additionally, 12 blanks were dispersed throughout the sample stream. All samples returned values at or below detection limit. A control chart was not generated, as five samples do not constitute a large enough sample population to accurately chart the statistics. 8.3 CORE LOGGING AND HANDLING, SAMPLE SHIPMENT AND SECURITY Sample preparation, analysis and security for core produced by previous operators has been described in previous technical reports, most recently in McCracken et al., (2022). Since acquiring the project, Sayona Quebec has not drilled the Project. However, in 2022, Sayona Quebec carried out a sampling program of historical core. The purpose of the sampling program was to: • Sample intervals falling within the new 3D modelled pegmatite dykes. In most cases, the core had been described as pegmatite, but had not been sampled. • Sample pegmatite intervals to obtain a valid Fe content database for pegmatites. • Sample host rock intervals to obtain a valid Fe content database for each host rock lithologies (Granodiortie, Volcanics, Gabbro). • Sample all lithologies (Pegmatite, Granodiorite, Volcanics, Gabbro) to obtain a valid density database. For %Li2O and %Fe, a total of 574 core samples were collected from 129 drillholes. For density measurements, a total of 600 core samples were collected from 97 drillholes. Samples were delivered by North American Lithium DFS Technical Report Summary – Quebec, Canada 102 Sayona Quebec personnel to SGS Laboratories, for sample preparation and primary analysis. Coarse rejects were returned to the mine site for storage and reference. 8.3.1 Historical Data (Pre-1965) There is no record in the available historical information that is specific to the sampling method of the underground or surface drillholes. A review of the drill logs indicates that sample intervals ranged from approximately 3 cm to 31 m, with an average value of approximately 2.4 m. 8.3.2 2009 Canada Lithium Corp. The following is a summary of the logging procedure used by Canada Lithium Corp.: • Sample security and chain of custody started with the removal of core from the core tube and boxing of drill core at the drill site; • Core was laid in wooden core boxes at the drill site, sealed with a lid and strapped with plastic bindings. The core was transported from the drill site by either the drill contractor or CLQ personnel to CLQ’s core facility in Val-d’Or; • The drill core was washed, photographed and logged prior to sampling; • Core logging was carried out by consulting geologists, one of whom was responsible for managing and supervising the 2009 on-site drill program. Geological geotechnical information was recorded directly into Coreview v.5.0.0 software (Visidata Pty Ltd.), which was exported and backed up nightly on a secure data server. 8.3.3 2010 Canada Lithium Corp. Canada Lithium Corp. built a new core facility in Val-d’Or in 2010 and all logging, sawing and storage equipment was moved to the new facility. The 2010 logging and sampling was supervised again by a CCIC senior geologist, with logging undertaken by two CCIC geologists. The same protocols for logging used during the 2009 drill program were repeated during the 2010 program. 8.3.4 2011 Canada Lithium Corp. The core shack in Val-d’Or was utilized during the 2011 program and all of the logging was completed at this facility. All of the core from the 2011 program that was stored with the previous years’ core at the C- North American Lithium DFS Technical Report Summary – Quebec, Canada 103 Lab core storage facility in Val-d’Or has now been transferred to NAL’s core storage facilities at the mine site. The 2011 logging was supervised by M.E. Lavery, P. Geo., and logging was completed by two independent contract geologists. The same protocols for logging used in the 2009 and 2010 drill programs were used in 2011. 8.3.5 2016 North American Lithium Corp. North American Lithium Corp. rented well-equipped, yet currently unused, core logging and sampling facilities from Royal Nickel Corporation (RNC), a local exploration company with a regional base of operations. Once geologists had logged and sampled the drill core, boxes were brought back to the mine site for long-term storage on sheltered racks. Core samples were placed in wooden boxes, respecting the drilling sequence, with wooden markers indicating depth. Once filled, lids were sealed on the boxes, which the contractors then delivered to North American Lithium Corp. personnel for transportation to the core shack located at Amos. The RNC core shack in Amos was utilized during the 2016 drilling program and all logging and sawing of core was completed at this facility (Figure 8-1). All core from the 2016 program is now stored at the mine site (Figure 8-2), along with core from previous years that was brought back from the C-Lab core storage facility located in Val-d’Or. The 2016 logging was supervised by Mr. R. Asselin, chief geologist for North American Lithium Corp. Logging was completed by two independent contract geologists using the Geotic data recording software. Protocols for the logging used in 2016 were consistent with the 2009 and 2010 drill programs, yet were more systematic and uniform, having adopted MERN geological rock coding. Photographs of the core were taken systematically after core boxes were opened and laid out on the platform and, prior to any marking or cutting taking place, rock quality designation (RQD) measurements were generally taken at regular intervals of 6 m, with the fracturing and recovery data being recorded. 8.3.6 2019 North American Lithium Corp. North American Lithium Corp. logged core on benches set up outside at mines’ core storage area Once geologists had logged and sampled the drill core, boxes were placed on sheltered racks. North American Lithium DFS Technical Report Summary – Quebec, Canada 104 Figure 8-1 – Core logging facilities at RNC exploration office in Amos, a 35 km drive to the mine site. Figure 8-2 – Core storage sheds and facilities at the NAL’s mine site.

North American Lithium DFS Technical Report Summary – Quebec, Canada 105 Core samples were placed in wooden boxes, respecting the drilling sequence, with wooden markers indicating depth. Once filled, lids were sealed on the boxes, which the contractors then delivered to North American Lithium Corp. personnel. The 2019 logging was supervised by Mr. R. Asselin, chief geologist for North American Lithium Corp. Logging was completed by independent contract geologists using the Geotic data recording software. Protocols for the logging used in 2019 were consistent with the 2016 drill programs. Photographs of the core were taken systematically after core boxes were opened and laid out on the platform and, prior to any marking or cutting taking place, RQD measurements were generally taken at regular intervals of 6 m, with the fracturing and recovery data being recorded. 8.4 SPECIFIC GRAVITY MEASUREMENTS Specific Gravity (SG) is an important parameter used to estimate tonnage. According to North American Lithium’s (NAL) previous reports, most of the SG measurements at the NAL pit were made during drilling campaigns. However, the raw data of these measurements were not provided to BBA. In 2022, a list of 600 representative samples were selected to establish a specific gravity for the different type of rock on the project. The sample list was prepared by the QP, collected by Sayona Quebec, and sent to SGS Laboratories to take density measurement. Table 8-1 lists the median values used for each lithology. Table 8-1 – Specific gravity used for the MRE. Rock Type Count Min (g/cm3) Max (g/cm3) Median (g/cm3) Gabbro 35 2.85 3.20 3.11 Granodiorite 30 2.63 3.16 2.77 Pegmatite 482 2.56 2.93 2.70 Volcanic 53 2.83 3.19 3.01 8.5 HISTORIC DRILL HOLES 8.5.1 Pre-1985 Several drilling programs on surface and underground have taken place between 1942 and 1985 by various operators. A summary of the drilling is included in Chapter 5 of this Report. These holes were not used in the mineral resource estimation disclosed in Chapter 11 of this Report. North American Lithium DFS Technical Report Summary – Quebec, Canada 106 8.5.2 Canada Lithium Corp. Three programs of exploration and resource definition drilling (2009, 2010, 2011) have been completed by Canada Lithium Corp. (CLQ) Metallurgical and geotechnical drilling had also been completed in the years prior to the commencement of open pit operations in mid-2013 and are briefly discussed in Chapter 5. Drilling carried out by Canada Lithium Corp. is summarized in Table 8-2. Table 8-2 – Summary of Canada Lithium Corp. drillholes. Year Period No. of Holes Metres Comments 2008 June 8 Unknown Metallurgical samples 2009 October-December 38 9,646 Twinning and infill 2009-10 December-January 67 1,010 Metallurgical samples 2010 April-June 45 6,938 Infill and extension 2011 June-August 63 12,003 Infill and extension Total 221 29,597 8.5.2.1 2009 Drilling Program In the 2009 drilling program, six main spodumene dykes were tested, and their locations confirmed. Information obtained in this program was used to support the historical resource estimate, the geological model, and the conceptual target. Part of the program was specifically designed to twin old (LV) holes. The descriptions of the rock types and the spodumene mineralization intersected by the 2009 drillholes have been summarized in Chapter 6 of this Report. This program consisted of 38 NQ-sized diamond drillholes (DDH) and one wedge. Approximately 9,646 m were drilled, surveyed, and sampled. Nine holes were abandoned because of technical difficulties or inappropriate downhole deviation and were re-drilled (~ 470 m). The holes were drilled on eight sections intersecting spodumene pegmatite dykes, approximately perpendicular to their strike; overall NW-SE, hole bearings were typically 18° or 45°. The dykes generally dip 70° to 75° toward the south or southwest. There were no drilling, sampling or recovery factors that materially impacted the accuracy and reliability of the results. Twenty-four holes were drilled by Orbit Garant Drilling Inc. of Val-d’Or, QC and 14 holes were completed by Major Drilling of Val-d’Or, QC. North American Lithium DFS Technical Report Summary – Quebec, Canada 107 8.5.2.2 2010 Drilling Program The 2010 drilling program consisted of 45 NQ-sized DDH. Approximately 6,938 m were drilled, surveyed, and sampled during the second quarter of 2010. Additionally, eight geotechnical drillholes were drilled, surveyed, and sampled during the course of the summer. The holes were drilled on 15 sections intersecting spodumene pegmatite dykes, approximately perpendicular to their strike (overall NW-SE); hole bearings were approximately 45°. The dykes generally dip 70° to 75° toward the south or southwest. Holes were again angled typically at -45° to cut the interpreted true width of the dyke. Major Drilling of Val-d’Or, QC was hired as the drilling contractor. There were no drilling, sampling or recovery factors that materially impacted the accuracy and reliability of the results. 8.5.2.3 2011 Drilling Program The 2011 drilling program consisted of 63 NQ-sized diamond drillholes totaling 12,003 m. The holes were drilled on 14 sections intersecting spodumene pegmatite dykes, approximately perpendicular to their strike (overall NW-SE); hole bearings were approximately 45°. The dykes generally dip 65° to 75° toward the south or southwest. Holes were again angled typically at around -45° to cut the interpreted true width of the dyke. Forage Roullier of Amos, QC was hired as the drilling contractor. There were no drilling, sampling or recovery factors that materially impacted the accuracy and reliability of the results. 8.5.3 North American Lithium Corp. Two programs of exploration and resource definition drilling (2016 and 2019) were completed by North American Lithium Corp. (Table 8-3). Table 8-3 – Summary of North American Lithium Corp holes. Year Period No. of Holes Metres Comments 2016 October-December 46 8,911 Infill and extension 2019 May-July 42 11,487 Infill and extension Total 88 20,398 North American Lithium DFS Technical Report Summary – Quebec, Canada 108 8.5.3.1 2016 Drilling Program Upon gaining ownership of the Property, North American Lithium Corp. launched an infill and extension drilling program in the fall of 2016. Forage Hebert Drilling, from Amos, QC, was hired as the drilling contractor, and mobilized two rigs on October 11, 2016, pulling out in December 2016 after completing the program (Figure 8-3). Figure 8-3 – Infill and extension drilling campaign (late 2016). Starting in October 2016 and ending shortly before the year end, this program consisted of 46 NQ-sized diamond drillholes, including four redrills, totaling approximately 8,911 m. The holes were drilled along nine sections targeting the Naud dyke, a new body of mineralization first encountered during the excavation of the pit in 2012-2014, and along 13 sections targeting dyke extensions to the eastern fringe of the deposit, where the pit could likely expand. Most holes intersected mineralization except for two drillholes designed as condemnation drillholes placed to test the southernmost portion of the system under a waste pile on the southern edge of the pit. The drillholes intersected several spodumene pegmatite dykes, which largely confirmed the revised interpretation, giving further credence and support to the geological model. The holes were invariably drilled on bearings of 45° and approximately perpendicular to the general strike and dip of the mineralized dyke bodies; overall NW-SE and generally dipping 70° to 75° south or southwest.

North American Lithium DFS Technical Report Summary – Quebec, Canada 109 There were no drilling, sampling or recovery factors that materially impacted the accuracy and reliability of the results. 8.5.3.2 2019 Drilling Campaign North American Lithium Corp. launched a drilling campaign in May 2019 to define Phase 2 of the open pit. Orbit-Garant of Val-d’Or, QC was hired as the drilling contractor. The program consisted of 42 NQ-sized diamond drillholes totaling 11,487 m, shown on the plan in Figure 8-4. Of the 1,487 m drilled, surveyed, and logged, 3,976 samples, totaling approximately 4,471 m, were collected. Due to financial constraints only 308 samples were sent for analysis. The most recent geological model was, largely, well supported by the results of the 2019 drilling. The deposit comprises a series of steeply-dipping, spodumene-bearing pegmatite dykes that bifurcate and coalesce in a pattern locally suggesting a broad conjugate fracture system. Dyke true thicknesses were found to range from decimetric to decametric as observed in outcrops and in the pit, where they were mapped systematically. Dyke bodies and intercepts less than 2 m wide were generally ignored in the interpretation and in resource estimation. There were no drilling, sampling or recovery factors that materially impacted the accuracy and reliability of the results. 8.5.4 Drilling Procedure 8.5.4.1 Collar Survey Canada Lithium Corp. and North American Lithium Corp. used a similar procedure for locating the drill collars. The casings were left in place and were capped to allow for future downhole testing and/or extension. GPS coordinates of all collar locations were recorded and tied into the exploration grid. Starting in 2011, all land surveys were completed by personnel working for J.L. Corriveau & Associates. 8.5.4.2 Downhole Survey Canada Lithium Corp. and North American Lithium Corp. used a similar procedure for downhole survey. In 2009, Major Drilling used a Reflex EZ-Shot while Orbit use the Flexit single shot. From 2010 to 2012, the drilling contractors used the Reflex EZ-Shot. North American Lithium DFS Technical Report Summary – Quebec, Canada 110 Figure 8-4 – Drillholes plan view (2009 to 2019). In 2016 and 2019, the downhole survey was measured by the drill operators, approximately every 15 m, using a Flexit testing instrument while the hole was being drilled. Upon completion of the hole, Multishot tests were recorded every 3 m down the hole. Readings were recorded by the driller and included the depth, azimuth (magnetic north), inclination, magnetic tool face angle, magnetic field strength, and temperature. 8.5.5 Sampling Procedure 8.5.5.1 Historical Data (Pre-1985) There is no record in the available historical information that is specific to the sampling method of the underground or surface drillholes, nor the analytical method used to determine the Li2O content. A review North American Lithium DFS Technical Report Summary – Quebec, Canada 111 of the drill logs indicates that sample intervals ranged from approximately 3 cm to 31 m, with an average value of approximately 2.4 m. Assay values in %Li2O are reported, typed, or handwritten on drill logs, but no original assay certificates are available to confirm these grades. A total of 806 assays are reported in 61 of the surface drillholes; some reported grades appear to be composites. There is no grade information available for the underground drilling. 8.5.5.2 2009 Canada Lithium Corp. Core samples were sawn in half; one half of the sampled interval was submitted for analysis and the remainder was retained in the core box for reference and future testing and/or verification. The nominal sample interval was 1 m, or less, if the pegmatite was less than 1 m in width. Lengths were adjusted as necessary to reflect geological and/or mineralization contacts. Pegmatite veins that were 0.4 m to 1 m in thickness were also sampled if spodumene was visible. Longer sample lengths were taken of strongly sheared core or sections with poor core recoveries. A total of 2,342 core samples were collected from 38 drillholes. After cutting, the core samples were sealed with a plastic cable tie in labelled plastic bags with their corresponding sample tag. The plastic sample bags were placed in large rice sacks and secured with tape and a plastic cable tie for shipping to the laboratory. The drillhole and sample numbers were also labelled on the outside of each rice sack and checked against the contents, prior to sealing the sacks. Standards and blanks were inserted into the sample sequence prior to shipping. Samples from individual holes constitute individual batches of samples sent to the laboratory. 8.5.5.3 2010 Canada Lithium Corp. Core samples were sawn in half. One half of the sampled interval was submitted for lithium analysis. The nominal sample interval was 1 m with more than 99.7% of the samples being 1 m or less. Lengths were adjusted as necessary to reflect geological and/or mineralization contacts, which created the samples of less than 1 m length. A total of 1,454 core samples were collected from 41 drillholes. Core recovery was reportedly excellent for both programs and typically over 95%. In 2010, due to a change of primary laboratory, samples were delivered by Canada Lithium Corp. personnel to the ALS Laboratory Group (ALS) preparation facility in Val-d’Or. After cutting, the core samples were sealed with a plastic cable tie in labelled plastic bags with their corresponding sample tag. The plastic sample bags were placed in large rice sacks and secured with tape and a plastic cable tie for shipping to the laboratory. The drillhole and sample numbers were also labelled on the outside of each rice sack and checked against the contents, prior to sealing the sacks. Standards North American Lithium DFS Technical Report Summary – Quebec, Canada 112 and blanks were inserted into the sample sequence prior to shipping. Samples from individual holes constitute individual batches of samples sent to the laboratory. 8.5.5.4 2011 Canada Lithium Corp. The core shack in Val-d’Or was utilized during the 2011 program and all the sawing of core was completed at this facility. All the core from the 2011 program that was stored with the previous years’ core at the C- Lab core storage facility in Val d’Or has now been transferred to NAL’s core storage facilities at the mine site. The 2011 sampling was supervised by M.E. Lavery, P. Geo., and sampling was completed by two independent contract geologists. The same protocols for core cutting and sampling used in the 2009 and 2010 drill programs were used in 2011. Core samples were sawn in half. One half of the sampled interval was submitted for lithium analysis. The nominal sample interval was 1 m with more than 93% of the samples being 1 m or less. Lengths were adjusted as necessary to reflect geological and/or mineralization contacts, which created samples of less than 1 m in length. A total of 3,167 core samples were collected from 53 drillholes. In 2011, samples were delivered by Canada Lithium Corp. personnel to the ALS facility in Val-d’Or and the samples were then shipped to ALS facilities in either Timmins or Thunder Bay for preparation; prepared samples were then shipped to Vancouver, British Columbia, for analysis. 8.5.5.5 2016 North American Lithium Corp. The 2016 sampling was supervised by Mr. R. Asselin, chief geologist for North American Lithium Corp., and sampling was completed by two independent contract geologists. Protocols for the core cutting and sampling that were used in 2016 were consistent with the 2009 and 2010 drill programs. Chosen core samples were invariably sawn in half, with one half of the sample interval submitted for lithium analysis and the remainder kept for future testing and/or reference. The nominal sample interval was 1 m. Lengths were adjusted as necessary to reflect geological and/or mineralization contacts, which created the samples of less than 1 m length. Sample tags were fixed to core boxes. In 2016, to better quantify the background values, samples of the host rocks that were immediately adjacent to the contact with pegmatite dykes were collected systematically, as samples separate from the pegmatite. A total of 2,367 core samples were collected from 46 completed drillholes. Samples were delivered by North American Lithium Corp. personnel to the Techni-Lab SGB (ActLabs) laboratory facility in Sainte- Germaine-Boulé, Québec, for sample preparation and primary analysis. Coarse rejects were returned to

North American Lithium DFS Technical Report Summary – Quebec, Canada 113 the mine site for storage and reference, while the ALS Laboratory Group of Vancouver, British Columbia, was contracted for duplicate analyses of chosen pulp and rejects. 8.5.5.6 2019 North American Lithium Corp. The 2019 sampling was for North American Lithium Corp., and sampling was completed by independent contract geologists. Protocols for the core cutting and sampling that were used in 2019 were consistent with the 2016 drill program. Chosen core samples were invariably sawn in half, with one half of the sample interval submitted for lithium analysis and the remainder kept for future testing and/or reference. The nominal sample interval was 1 m. Lengths were adjusted as necessary to reflect geological and/or mineralization contacts, which created the samples of less than 1 m length. A total of 3,976 core samples were collected from 37 drillholes. Samples were delivered by North American Lithium Corp. personnel to the ActLabs laboratory facility in Sainte-Germaine-Boulé, Québec, for sample preparation and primary analysis. Coarse rejects were returned to the mine site for storage and reference, while the ALS of Vancouver, British Columbia, was contracted for duplicate analyses of chosen pulp and rejects. Due to financial constraints, not all pegmatite intervals were sampled in 2019. These samples were sampled in 2022 (see section below). 8.5.5.7 2022 Sayona Quebec Sampling Program In 2022, Sayona Quebec carried out a sampling program of historical core. The purpose of the program was to: • Sample intervals falling within the new 3D modelled pegmatite dykes, In most cases, the core had been described as pegmatite, but had not been sampled. • Sample pegmatite intervals to obtain a valid Fe content database for pegmatites. • Sample host rock intervals to obtain a valid Fe content database for each host rock lithologies (Granodiortie, Volcanics, Gabbro). • Sample all lithologies (Pegmatite, Granodiorite, Volcanics, Gabbro) to obtain a valid density database. Chosen core samples were invariably sawn in half, with one half of the sample interval submitted for lithium, iron and density analysis, and the remainder kept for future testing and/or reference. Lengths were adjusted as necessary to reflect geological and/or mineralization contacts. North American Lithium DFS Technical Report Summary – Quebec, Canada 114 For Li2O % and Fe %, a total of 574 core samples were collected from 129 drillholes. For density measurements, a total of 600 core samples were collected from 97 drillholes. Samples were delivered by Sayona Quebec personnel to SGS Laboratories, for sample preparation and primary analysis. Coarse rejects were returned to the mine site for storage and reference. 8.5.6 Qualified Person’s Opinion It is the QP’s opinion that the drilling and logging procedures put in place by Canada Lithium Corp., North American Lithium Corp., and Sayona Quebec met acceptable industry standards at the time of sampling and that the information can be used for geological and resource modelling. North American Lithium DFS Technical Report Summary – Quebec, Canada 115 9. DATA VERIFICATION The Mineral Resource Estimate (MRE) disclosed in this Report is based on drilling data from 2009 to 2022. The last drillholes on the Project were drilled in 2019, but additional sampling was conducted in 2022. For the purpose of this MRE, BBA, under the supervision of the QP, performed a verification on the entire Project database. All data were provided by Sayona Quebec in UTM NAD 83 zone 18N. The Project database contains 1,252 drillholes. Of these 1,252 drillholes, a subset of 247 holes, which cut across the mineralized zones, was used for geological modelling and to produce the MRE presented in this Report. The last drillhole included in the resource database is hole NAL-19-038. 9.1 SITE VISIT The QP’s for the original NI43-101 Report, upon which this Report is based, visited the Project and its existing installations on July 18 and July 25, 2022, as part of the current mandate. The 2022 site visits included a field tour of the main geological features visible in the current open pit (Figure 9-1), a tour of the core storage facility (Figure 9-2), visual inspections of drill cores (Figure 9-3), and discussions with geologists and engineers of Sayona Quebec. Selected drillhole collars in the field were also validated. The site visits also included a review of the sampling and assay procedures, QA/QC program, downhole survey methodologies, and the descriptions of lithologies, alteration and structures (Figure 9-3). Figure 9-1 – View of the open pit visited during the site tour. North American Lithium DFS Technical Report Summary – Quebec, Canada 116 Figure 9-2 – Core storage facility at the Project site. Figure 9-3 – Core review at the core storage facility.

North American Lithium DFS Technical Report Summary – Quebec, Canada 117 These site visits allowed the QP to make certain recommendations, mainly the need for a resampling program to obtain additional data (%Li2O assays, %Fe content, density measurements) that was immediately initiated and included in the current database. The QP’s as listed in Table 2-1 are responsible for the content of this Report. The QP’s for this Report reviewed all data from the Report upon which this Report is based and amended, altered or updated the data for the purposes of currency and accuracy. All listed QP’s are employees of Sayona Quebec. As such they are involved in and around the property as part of their duties and therefore no specific site visit date is considered relevant 9.2 QUALITY CONTROL PROGRAM 9.2.1 Drilling and Sampling Procedure Sayona Quebec’s procedures are described in Chapter 8 of the current Report. Core review and discussions held with on-site geologists allowed to confirm said procedures were generally well applied. The QP reviewed several sections of mineralized cores while visiting the Project. All core boxes were labelled and properly stored outside. Sample tags were present in the boxes, and it was possible to validate sample numbers and confirm the presence of mineralization in witness half-core samples from the mineralized zones (Figure 9-2). Drilling was not underway during the QP’s site visits, it was however possible to follow the entire path of the drill core, from the drill rig to the logging and sampling facility and finally to the laboratory and database by reviewing historical reports. Some historical collars were surveyed by a handheld GPS and compared to the database. No issues were noted. 9.2.2 Log and Core Box Validation During the site visit, the author and BBA’s representatives looked at 11 specific geological intervals in drillhole from 2009, 2010, 2011, 2016 and 2019 (Table 9-1). With the help of Sayona Quebec’s team, core boxes were pulled out of the core rack and aligned on the ground allowing to review the selected intervals. These specific intervals were meticulously chosen and looked at to validate and/or update the geological model, increase the knowledge of the deposit, and review sampling methodology used over the years. North American Lithium DFS Technical Report Summary – Quebec, Canada 118 Table 9-1 – Geological intervals inspected during site visit. BHID Depth (m) From To QL-S09-016 260 323 QL-S09-027 392 435 QL-S10-009 130 210 Ql-S10-048 75 170 QL-S11-06 163 177 QL-S11-08 9 86 QL-S11-45 84 126 NAL-16-045 84 160 NAL-19-034 156 216 NAL-19-037 257 345 9.3 VERIFICATION OF QC PROGRAM 9.3.1 Sample Preparation Review Sampling procedures employed on the Project are described in Chapter 8 of this Report. Discussions held with on-site personnel confirmed that said procedures were applied. While reviewing several sections of core boxes, the QP was able to confirm that all core boxes were labelled and properly stored. Sample tags were present in the boxes, and it was possible to validate sample numbers and visually confirm the presence of spodumene mineralization in the remaining half- core. 9.3.2 Drillhole Database Check The current mineral resource modelling and estimation mandate prompted a database verification exercise, including revisiting and validating all drillhole intercepts. The main source of drillhole information was in the form of Excel files with multiple worksheets. The database used in the interpolation includes drillhole information from the 2009, 2010, 2011, 2016, and 2019 campaigns. 9.3.2.1 Drillhole Location For the 2016 and 2019 surface drilling campaigns, all drill collars were surveyed by external contractors. Collars were surveyed in real time kinematic mode (RTK). The author compared the drillhole location from NAL’s database with the data provided by the surveyors for 100% of both campaigns. No discrepancies were noted. North American Lithium DFS Technical Report Summary – Quebec, Canada 119 9.3.2.2 Downhole Survey Pierre-Luc Richard, QP, and BBA’s team checked the consistency of the entire downhole survey database by visually searching for unrealistic hole traces and by automatically checking for significant variations of dip or azimuth in Excel. Downhole surveys from the Geotic database were verified for consistency. False measurements were tagged by NAL geologists with different codes in the database. These were validated in Excel and, visually, in Leapfrog. Measurements that were either visually or statistically incorrect were removed and not used. 9.3.2.3 Assays Access to the original assay certificates was granted directly from ActLab and the other assay certificates from SGS and ALS were provided by the client under pdf and csv format. Table 9-2 shows the percentages of certificates received. Approximately 90% of the assay results for drillholes that were drilled since 2012 were validated. Previous data was validated in previous technical reports. The assays recorded in the database were compared to the original certificates from the different laboratories and the author noted no significant discrepancies. In the assay table, the Li2O calculated field gave a priority 1 to a Li2O (%) result; in priority 2, a result of Li (%) was multiplied by 2.153 to obtain a Li2O (%) value and in priority 3, a Li (ppm) result was multiplied by 0.0002153 to obtain the Li2O (%) value. Following the author’s recommendations, the values lower than the detection limits were set to half the detection limit. Table 9-2 – Percentage of certificates received by drilling campaigns. Campaign % of received certificates 2,009 1% 2,010 6% 2,011 0% 2,016 86% 2,019 92% Environment 14% Géotechnique-2017 0% Jourdan 0% LV 0% SB-LB-E-CL-S Divers 0% Grand Total 38% Recent data 90% North American Lithium DFS Technical Report Summary – Quebec, Canada 120 Table 9-3 summarizes the drilling data that was duly recompiled and used in the generation of a new geological and resource model for the Project. Table 9-3 – Drilling data used in the new geological model and current MRE. Available Data Data Used in the New Model Drilling Type Number of Holes Campaign Grade Interpolation Underground 652 Historical → 0 Surface 21 Historical Jourdan 0 81 Historical (LV) → 0 119 Historical (SB-LB-E-CL-S) → 0 53 Environment and GT → 11 39 2,009 → 38 51 2,010 → 51 63 2,011 → 63 50 2,016 → 46 22 Geotech 2017 → 0 59 Contour de fosse 2018 → 0 42 2,019 → 38 Total 1,232 → 247 9.3.3 Qualified Person’s Opinion The QP is of the opinion that the drilling, sampling, and assaying protocols in place are adequate. The drillhole database provided by Sayona Quebec is of good overall quality and suitable for use in the estimation of mineral resources.

North American Lithium DFS Technical Report Summary – Quebec, Canada 121 10. MINERAL PROCESSING AND METALLURGICAL TESTING 10.1 INTRODUCTION This chapter summarizes testwork results, plant operating data, and other relevant information that has led to the identification of process improvement opportunities and form the basis for process design for the North American Lithium (NAL) spodumene concentrator. In recent history, the NAL concentrator operated from March 2013 to September 2014 (Québec Lithium Inc.), and June 2017 to March 2019 (North American Lithium Inc.). Extensive metallurgical testwork has been undertaken on ore from the NAL deposit since 2008. More recent testwork has focused on the impact of host rock type and the impact of dilution on metallurgical performance. Historical metallurgical testwork for the Authier Project was undertaken as part of feasibility studies undertaken for the mine and concentrator project in 2018 and 2019. Recent metallurgical testing has investigated the processing of blended feed combining NAL and Authier ore. 10.2 NORTH AMERICAN LITHIUM – HISTORICAL PROCESS PLANT OPERATIONS 10.2.1 Québec Lithium Concentrator Operations 2013-2014 The Québec Lithium Project operated from March 2013 until September 2014. The concentrator never reached nameplate capacity and was unable to produce chemical grade spodumene concentrate. The major issue encountered during operation was higher than expected dilution from the mine. The waste rock contained iron-bearing silicate minerals that could not be adequately rejected in the concentrator flowsheet. The result was the production of low-grade spodumene concentrate (ca. 3% to 4% Li2O) with high iron concentrations (ca. 2% to 3% Fe). Process plant design was based on testwork operated on samples with little to no dilution. During operation, typical levels of dilution in run of mine (ROM) ore were roughly 20%. Major process plant deficiencies that limited throughput and concentrate quality included: • Higher than anticipated dilution in ROM ore; • Design flaws in the crushing circuit (e.g., materials handling issues, material freezing, inadequate dust collection); • Limited buffer capacity in the crushed ore silo; North American Lithium DFS Technical Report Summary – Quebec, Canada 122 • Inadequate iron-bearing mineral rejection in the flowsheet; • Inadequate high-intensity conditioning ahead of flotation. 10.2.2 North American Lithium – Operations 2017-2019 Prior to NAL concentrator restart in 2017, several plant upgrades were implemented including: • Installation of a secondary optical near-infrared (NIR) ore sorter; • Modifications to the crushed ore silo; • Installation of a wet high-intensity magnetic separator (WHIMS) ahead of the flotation circuit; • Modifications to the high-intensity conditioning tank. The NAL concentrator operated from June 2017 until March 2019. The concentrator never reached nameplate capacity and typically produced spodumene concentrate ranging in grade from 5.5% to 6.0% Li2O. Figure 10-1 shows monthly spodumene concentrate production. During 2018 and 2019, monthly production ranged from roughly 4,500 t to 13,250 t. At the time, nameplate capacity was roughly 15,900 t of 5.8% Li2O concentrate. Figure 10-2 shows monthly averages of spodumene concentrate lithia (Li2O) and iron grades and lithium recovery. After initial plant start-up in 2017, concentrate grades ranged from 5.4% to 6.0% Li2O and from 0.9% to 1.6% Fe. Lithium recovery ranged from roughly 55% to 70% for the same period. Several plant improvement projects were identified which would be required to reach plant nameplate capacity and ensure production of chemical grade spodumene concentrate: • Modifications to the primary crusher dump hopper and feeder; • Improvements in the crushing circuit (e.g., materials handling, dust collection); • Increased crushed ore buffer capacity; • Installation of a third ore sorter (in parallel to the existing secondary sorter); Increased screening capacity in the ball mill circuit; • Improved magnetic separation (installation of a low-intensity magnetic separator (LIMS) and a second WHIMS); • Installation of a new high-intensity conditioning tank ahead of flotation; • Increase spodumene concentrate filter capacity. North American Lithium DFS Technical Report Summary – Quebec, Canada 123 Figure 10-1 – Monthly spodumene concentrate production. Figure 10-2 – Concentrate grade and lithium recovery (monthly averages). North American Lithium DFS Technical Report Summary – Quebec, Canada 124 10.3 METALLURGICAL LABORATORY TESTWORK PROGRAM 10.3.1 North American Lithium Testwork Review A large number of metallurgical studies have been undertaken on samples from the NAL deposit since 2008. In 2008, SGS Canada Inc., in Lakefield, Ontario operated a development testwork program which included a flotation pilot plant. Variability testwork was undertaken to evaluate the impact of head grades on performance. The testwork was used to produce engineering data for plant design and produce marketing samples. Two composite samples were used for a series of grindability tests. Dense media separation (DMS) and batch flotation tests were undertaken. During the initial feasibility study, further batch-scale optimization tests were carried out as well as locked-cycle flotation tests and pilot-scale tests. Testwork results are documented in the NI 43-101 Prefeasibility Technical Report (2010) and the updated Feasibility Technical Report (2011). The process flowsheet was developed based on projected recoveries that were determined from the testwork program and a plant throughput of 3,800 tpd (rod mill feed). It should be noted that all tests carried out during the prefeasibility and feasibility studies were conducted on relatively clean pegmatite ore with little ore dilution. There were indications in early testing that ore dilution may negatively impact flotation performance; however, the extent of ore dilution was not well defined, and its impact was not thoroughly tested. The use of optical ore sorting to remove waste material in the crushing circuit was investigated during the feasibility study but was not tested and was not included in the final feasibility study flowsheet. Optical ore sorting was tested during detailed engineering and an optical ore sorter was installed after plant start-up to sort +3” material after primary crushing and screening. The ore sorter did not operate in the winter months and only operated for a short period before the plant was put on care and maintenance in 2014. A second ore sorter was installed prior to plant restart in 2017. WHIMS tests were carried out on the final flotation concentrate during prefeasibility and feasibility study testwork. WHIMS was performed to lower iron content of the final concentrate to meet concentrate specifications. During testing, relatively clean pegmatite ore (low levels of dilution) was tested. As such, iron was present in the spodumene crystal structure and WHIMS was not effective. As a result, WHIMS was not included in the original flowsheet. The NAL pegmatite dykes are hosted in two host rock types: granodiorite or volcanics. Mine operations since 2013 have primarily focused on the granodiorite zones. The two host rock types have differences in terms of mineralogy, specifically related to presence of iron-bearing silicate minerals. Table 10-1 and Table 10-2 show examples host rock mineralogy and elemental composition from testwork undertaken in 2022. The analyses show magnesio-hornblende concentrations to be significantly higher in the basalt sample (53.2%) as compared to the granodiorite sample (11.4%). Iron concentration in the volcanics sample was 9.72% as compared to 2.87% in the granodiorite sample.

North American Lithium DFS Technical Report Summary – Quebec, Canada 125 Table 10-1 – Example mineralogy of NAL host rock types. Mineral Granodiorite Volcanics wt % Albite 50.8 23.8 Magnesio-hornblende 11.4 53.2 Quartz 14.4 1.0 Microcline 9.6 0.9 Chlorite 1.6 2.6 Muscovite 3.4 4.5 Holmquistite 4.3 5.6 Biotite 2.7 1.7 Diopside 1.7 6.2 Rutile 0.1 0.5 Total 100 100 Table 10-2 – Example assays of NAL host rock types. Component Granodiorite Volcanics wt % Li 0.1 0.1 Li2O 0.2 0.2 Al 8.7 5.8 Ca 3.3 7.3 Fe 2.9 9.7 Na 3.4 1.9 K 2.0 0.6 Mg 1.4 4.9 Mn 1.4 0.2 Si 29.7 23.7 Two process plant upgrades are being undertaken to effectively reject iron-bearing silicate minerals in the flowsheet. The first is the installation of a third ore sorter in the crushing circuit to reject host rock dilution. The second is the installation of a second WHIMS in the flowsheet to further reject iron-bearing silicate minerals prior to flotation. A LIMS will also be installed ahead of the WHIMS units to remove abraded steel from the mills, which can have a negative impact on WHIMS performance. Recent metallurgical testing has focused on controlling iron in the flowsheet using WHIMS and the effect of the quantity and type of host rock dilution. North American Lithium DFS Technical Report Summary – Quebec, Canada 126 10.3.2 Optical Ore Sorting Test Program – 2011 In 2011, during detailed engineering, optical sorting tests were undertaken at the TOMRA (previously Commodas Ultrasort GmbH) test facility in Wedel, Germany, using commercial-scale optical sorting units. The material provided for the test program was a mixture of pegmatite, granodiorite, and basalt. Figure 10-3 shows example images of the three rock types tested. Figure 10-3 – Ore sorting test program material (pegmatite upper left, granodiorite upper right, basalt lower). The material provided was screened into four size fractions: -60 mm / + 40 mm, -40 mm / +20 mm, -20 mm / +12 mm, and -12 mm / +8 mm. Each size fraction was tested with 20% and 40% waste of either granodiorite or basalt and was tested with a range of sorting parameters. The sorting parameters can be set to minimize loss of lithium or maximize rejection of waste. These tests demonstrated waste rejection rates as high as 95% with corresponding lithium loss of 6% or less. Example images of sorted products from the testwork are shown in Figure 10-4. North American Lithium DFS Technical Report Summary – Quebec, Canada 127 Figure 10-4 – Example images of sorted products. 10.3.3 Historical Plant Operating Data – 2014 Initially, WHIMS testing was carried out at the process plant using lab scale equipment (Eriez model L-20 WHIMS). Tests were carried out on the de-sliming cyclone underflow feeding the flotation circuit and on the spodumene concentrate product. The objective was to remove amphiboles (hornblende) either from the flotation feed or the concentrate. Figure 10-5 shows the magnetic and non-magnetic fractions when the WHIMS unit was operated at 8,000 gauss (G) on the de-sliming cyclone underflow. Figure 10-5 – Magnetic and non-magnetic fractions from test conducted at 8,000 gauss. North American Lithium DFS Technical Report Summary – Quebec, Canada 128 The tests were also run on a range of magnetic intensities. Visually, the best results on the cyclone underflow appeared to be at about 12,000 G. Vendor testing was subsequently undertaken. A WHIMS (Eriez WHIMS SSS-I-3000 1.0-1.3 T) was installed in the NAL process plant in 2016-17. The WHIMS is located ahead of spodumene conditioning in the flowsheet. 10.4 NAL 2016 RE-START METALLURGICAL TESTING In 2016, a testwork program was undertaken at SGS Canada Inc. in Lakefield, Ontario. The program included: • Hardness characterization of pegmatite, granodiorite, basalt, and composite samples; • WHIMS testing on pegmatite samples with varying levels of dilution containing granodiorite or basalt host rock; • Flotation tests on samples processed through the WHIMS unit. The results of the grindability tests showed that the Bond work indices of the sample mixtures and in-situ samples were all below the work indices used in the 2012 design criteria for sizing of the rod and ball mills. Therefore, the presence of mine dilution should not negatively impact the mill throughput capacity. For the WHIMS testing, the magnetic intensity was varied between 5,000 G and 15,000 G for various mixtures of pegmatite ore with granodiorite or basalt. Results indicated that the ideal magnetic intensity to reject iron, while minimizing lithium loss, was in the range of 10,000 G to 13,000 G. Figure 10-6 shows iron rejection and lithium loss to the magnetic concentrate at various magnetic intensities for an ore sample containing 10% granodiorite (left) and 10% basalt (right). Related to the host rock composition and mineralogy, magnetic separation performance is quite different in the two samples. At 12,000 G, both samples show roughly 4.8% lithium loss with the granodiorite sample showing 47% iron rejection and the basalt sample showing 80% rejection. The feed grades of the granodiorite and basalt samples were 1.16% Li2O and 0.95% Fe2O3, and 1.20% Li2O and 1.74% Fe2O3, respectively. Batch flotation tests were undertaken on the non-magnetic fractions after magnetic separation at 15,000 G. Figure 10-7 shows the grade-recovery curves for the optimized conditions for test F3 (pegmatite with 10% basalt) and test F4 (pegmatite with 10% granodiorite). Spodumene flotation was operated at pH 8.5 using 675 g/t of FA-2 collector with a rougher-scavenger and three stages of cleaning. The final spodumene concentrates assayed between 1.05% and 1.10% Fe2O3. Lithium recovery at 6% Li2O ranged from roughly 80% to 83% (interpolated).

North American Lithium DFS Technical Report Summary – Quebec, Canada 129 Figure 10-6 – Iron rejection and Li loss to magnetic concentrate for pegmatite with 10% granodiorite (left) and 10% basalt (right). Figure 10-7 – Optimized flotation test results. North American Lithium DFS Technical Report Summary – Quebec, Canada 130 10.5 AUTHIER METALLURGICAL TESTWORK REVIEW 10.5.1 Historical Authier Testwork Initial testwork on the Authier deposit was undertaken by the Québec Department of Natural Resources in 1969. Flotation tests were carried out on a bulk composite sample prepared from split drill core. Results confirmed the ore was amenable to concentration by flotation and the tests produced spodumene concentrates assaying between 5.13% and 5.81% Li2O with lithium recovery ranging from 67% to 82%. In 1991, Raymor Resources Ltd. conducted bench-scale metallurgical testing on mineralized pegmatite samples from the Property. An 18.3 kg sample grading 1.66% Li2O was tested at the Centre de Recherche Minérale (CRM, now COREM) in Québec City. The testwork produced a spodumene concentrate grading 6.30% Li2O with lithium recovery of 73%. In 1997, Raymor Resources Ltd. completed testing at CRM on two samples from a pegmatite dyke on the Property: 1) 18 t sample grading 1.32% Li2O and 2) 12 t grading 1.10% Li2O. Metallurgical testing on the first sample produced a concentrate grading 5.61% Li2O with 61% lithium recovery. Magnetic separation was used in the testing to remove iron-bearing silicate minerals. The second sample returned a final concentrate grade of 5.16% Li2O with 58% recovery. In 1999, metallurgical testing was conducted at COREM on a 40-t mineralized pegmatite sample from the main intrusion at the Authier property. The testing program was conducted as part of a prefeasibility study. Results showed spodumene concentrate grades ranging from 5.78% to 5.89% Li2O with lithium recoveries ranging from 68% to 70% from a sample with head grade of 1.14% Li2O. A sample with head grade of 1.35% Li2O produced a 5.96% Li2O concentrate at 75% recovery. Glen Eagle Resources Inc. undertook a testing program in 2012 on a 270 kg sample as part of a Preliminary Economic Assessment (PEA) of the Project. Batch testwork produced a concentrate grading 6.09% Li2O with 88% lithium recovery after two stages of cleaning (without the use of mica pre-flotation). After four stages of cleaning and passing the concentrate through a WHIMS at 15,000 G a concentrate grading 6.44% Li2O was produced at 85% recovery. In 2016, Sayona Québec completed a metallurgical testing program using drill core from 23 historical holes totaling 430 kg, representing the entire deposit geometry (including 5% mine ore dilution). Concentrate grades varied from 5.38% to 6.05% Li2O with a lithium recovery ranging from 71% to 79%. Results indicated that ore dilution had a negative impact on flotation performance. North American Lithium DFS Technical Report Summary – Quebec, Canada 131 In 2017, two representative samples were prepared, and flotation testing was undertaken to examine the impact of the presence of dilution material and the use of site water. Testwork demonstrated the ability to produce concentrate grading 6.0% Li2O with lithium recovery greater than 80%. The majority of the testing for the Project has focused on spodumene recovery by froth flotation. Recently (2016-17), Sayona Quebec performed several heavy-liquid separation (HLS) test programs to assess the viability of producing a coarse spodumene concentrate using dense media separation. Testwork and economic analysis showed that dense media separation was not a viable process option for the Authier deposit. Table 10-3 gives an overview of recent metallurgical testing programs operated by SGS Canada Inc. at their facilities in Lakefield, Ontario. Figure 10-8 shows the locations in the pit from which the historical metallurgical testing samples were taken. Table 10-3 – Recent Authier metallurgical testing programs. Year Owner Sample Size Testwork 2,012 Glen Eagle 270 kg Flotation testing 2,016 Sayona Québec 430 kg HLS and flotation testing 2,017 52 kg HLS and flotation testing 66 kg sample HLS and flotation testing 120 kg sample HLS 2,018 5 t sample Pilot plant program 2,019 Pilot plant sample Batch optimization testing North American Lithium DFS Technical Report Summary – Quebec, Canada 132 Figure 10-8 – Drillhole locations for the various metallurgical testing samples. 10.5.2 Feasibility-level Authier Testwork (2018) A pilot plant testwork program was undertaken in 2018 at SGS Canada Inc. as part of the feasibility study. The aim of the testwork was to confirm the spodumene concentration flowsheet, operational parameters, efficiencies, and consumptions. Roughly 5 t of drill core was used to prepare two composite samples representing: 1) years 0-5, and 2) years 5+ of operation. Testwork included batch, locked cycle, and continuous piloting. 10.5.2.1.1 Feed Characterization Chemical analysis of the two composite pilot plant feed samples is shown in Table 10-4. The head grades of the two composite samples were 1.01% Li2O and 1.03% Li2O, respectively. The only significant differences in chemical composition were slightly elevated concentrations of iron and magnesium in Composite 1. Samples of each composite were analyzed by X-ray diffraction (XRD). Results of semi- quantitative mineralogical analysis are shown in Table 10-5. Feldspars (albite and microcline), quartz and

North American Lithium DFS Technical Report Summary – Quebec, Canada 133 spodumene are the major constituents in the samples. The presence of hornblende/ clinochlore and elevated concentrations of biotite in Composite 1 correspond to elevated concentrations of iron and magnesium in the sample Table 10-4. Table 10-4 – Chemical compositions of the pilot plant feed samples. Analysis Composite 1 Composite 2 Years 0-5 Years 5+ Li 0.5 0.5 Li2O 1.0 1.0 SiO2 73.5 74.9 Al2O3 15.6 15.6 Fe2O3 0.8 0.6 MgO 0.4 0.1 CaO 0.3 0.2 Na2O 4.7 4.6 K2O 2.7 3.0 P2O5 0.0 0.0 MnO 0.1 0.1 Cr2O3 0.0 0.0 sg 2.7 2.7 Table 10-5 – Semi-quantitative XRD results (Rietveld analysis). Mineral Composite 1 Composite 2 wt % Albite 36.2 33.9 Quartz 31.1 34.8 Spodumene 11.3 9.7 Microcline 9.6 11.0 Muscovite 4.0 9.3 Hornblende 3.4 - Biotite 1.6 1.2 Clinochlore 2.7 - Total 100 100 10.5.2.1.2 Grindability Table 10-6 summarizes the grindability testwork results obtained during the pilot plant program. Bond low-energy impact crushing work index (CWI) ranged from 12.1 kWh/t to 19.5 kWh/t (moderately soft to medium range). Bond ball mill work index (BWI) ranged from 12.7 kWh/t to 15.8 kWh/t with an average of 14.6 kWh/t, ranking the samples as moderately soft to moderately hard. The abrasion index (AI) ranged North American Lithium DFS Technical Report Summary – Quebec, Canada 134 from 0.806 g to 1.009 g. The material tested was highly abrasive and fell in the 95-98th percentile in the SGS abrasion index database. Table 10-6 – Summary of grindability results. Sample Hole no. CWI BWI AI (kWh/t) (kWh/t) (g) 1 AL-17-034 47-49 m 13.0 12.7 0.912 2 AL-17-034 54-56 m 14.7 14.5 0.806 3 AL-17-037 167-171 m 12.1 15.8 0.953 4 AL-17-036 81-83 m 15.8 15.8 1.009 5 AL-17-036 102-104 m 19.5 15.2 1.005 6 AL-17-038 53-54 m 15.0 14.9 0.962 PP1 Composite 1 - Yr 0-5 - 13.7 - PP2 Composite 2 - Yr 5+ - 14.1 - 10.5.2.1.3 Bench-scale Flotation Tests Over forty bench-scale batch flotation tests were operated to confirm and optimize the flowsheet and reagent schemes prior to piloting. Batch tests were undertaken on each composite and included: stage- grinding, magnetic separation (5,000 G and 10,000 G), de-sliming, mica flotation, and spodumene flotation. The batch tests investigated a number of variables (e.g., feed particle size, flowsheet configuration, reagents schemes, spodumene conditioning) to optimize metallurgical performance. The optimized flowsheet that was developed, which was used in tests F37 to F43, is presented in Figure 10-9. North American Lithium DFS Technical Report Summary – Quebec, Canada 135 Figure 10-9 – Optimized batch flowsheet. For the optimized tests, sub-samples of Composite 1 or 2 were stage-ground to 100% passing 180 µm. The stage-ground feed was scrubbed in a Denver D12 4 L flotation cell for 3 min. The scrubbed material North American Lithium DFS Technical Report Summary – Quebec, Canada 136 was de-slimed by settling and decanting in a cylinder. De-slimed material was processed through an Eriez model L-4-20 laboratory-scale WHIMS. The material was processed sequentially at 5,000 G and 10,000 G. The non-magnetic material was transferred to a 4 L Denver D12 flotation cell for mica conditioning. Sodium hydroxide (NaOH) was added to raise the pH to ~10.5 and Armac T (mica collector) and methyl isobutyl carbinol (MIBC) were added. Mica rougher and scavenger flotation was performed, and products were filtered and dried. The mica scavenger tailings were scrubbed at high density (~65% w/w solids) in a Denver D12 flotation machine for ten minutes. The scrubbed material was de-slimed by settling and decanting. The de-slimed material was conditioned in a 4 L Denver D12 flotation cell at a pulp density of roughly 65% w/w solids. Sylfat FA-2 (spodumene collector) was added and the slurry and conditioned for five minutes. Rougher and scavenger flotation were undertaken followed by three stages of cleaning. pH was controlled at 8.5 with soda ash (Na2CO3) addition. Reagent dosages for the optimized batch tests operated on Composite 1 or Composite 2 are shown in Table 10-7. Armac T dosage ranged from 100 g/t to 110 g/t and FA-2 dosage ranged from 780 g/t to 1,080 g/t. The feed samples for the tests shown in Table 10-7 were stage-ground to 100% passing 180 µm. Table 10-7 – Reagent dosages for selected batch tests. Feed Test Dosage (g/t) NaOH Na2CO3 Armac T F100 FA-2 Na Silicate Composite 1 F34 250 300 110 250 1,080 0 F37 388 150 110 250 1,080 0 F40 312 125 110 250 780 0 Composite 2 F30 275 175 100 250 1,080 25 F42 375 162 110 250 980 0 F43 450 512 110 250 980 0 Figure 10-10 shows the grade-recovery curves for selected batch tests. The results show that 80% lithium recovery was achieved at a concentrate grade of 6.0% Li2O for both composite samples. Iron concentrations in the spodumene concentrate ranged from 1.0% to 1.6% Fe2O3.

North American Lithium DFS Technical Report Summary – Quebec, Canada 137 Figure 10-10 – Batch test grade-recovery curves. 10.5.2.1.4 Locked Cycle Tests A locked-cycle test was performed on each composite sample. The conditions for the tests were based on batch tests F41 and F43. The flowsheet for the locked-cycle tests in shown in Figure 10-11. Feed samples were stage-ground to 100% passing 180 µm. Reagent dosages for the tests are given in Table 10-8. The only differences in the test conditions were the slight increase in Armac T dosage from 110 g/t (Composite 1) to 120 g/t (Composite 2) and the addition of MIBC (10 g/t) ahead of mica flotation for Composite 2. Locked-cycle flotation test results on Composite 1 and Composite 2 showed an average concentrate grade of 5.85% Li2O at 84% lithium recovery, and 5.86% Li2O at 83% recovery, respectively. Iron concentration in the spodumene concentrate was 1.81% Fe2O3 for Composite 1 and 1.09% Fe2O3 for Composite 2. North American Lithium DFS Technical Report Summary – Quebec, Canada 138 Figure 10-11 – Locked-cycle flowsheet (Composite 1). Table 10-8 – Reagent dosages for the locked-cycle batch tests. Feed Dosage (g/t) NaOH Na2CO3 Armac T MIBC F100 FA-2 Composite 1 150 600 110 0 250 1,035 Composite 2 150 600 120 10 250 1,035 North American Lithium DFS Technical Report Summary – Quebec, Canada 139 10.5.2.1.5 Continuous Pilot Plant The concentrator pilot plant was operated by SGS in a series of 13 campaigns during April 2018. Three feed samples were tested: a low-grade commissioning sample, Composite 1 and Composite 2. The commissioning sample was initially fed to the pilot plant to confirm mechanical reliability, robust operating procedures, and analytical laboratory capabilities. Once commissioning was complete, the two composite pilot plant samples were processed through the plant. The plant operated for over 100 h and processed over 5 t of feed material. The flowsheet for continuous pilot plant testing campaign PP06 is shown in Figure 10-12. The circuit was fed at a rate of 50 kg/h of crushed ore (-3.36 mm) to a rod mill in closed-circuit with a 180 µm vibrating screen. The flowsheet included: grinding, multiple stages of de- sliming, magnetic separation, mica flotation, and spodumene flotation. Reagent dosages for the optimized pilot plant campaigns are shown in Table 10-9. For the optimized conditions, Armac T dosage ranged from 112 g/t to 220 g/t and FA-2 dosage ranged from 656 g/t to 1,106 g/t. Pilot plant mass balance data was reconciled using Bilmat software. For the optimized flowsheets, pilot plant operation on Composite 1 produced concentrate ranging from 5.9% to 6.0% Li2O with recoveries ranging from 67% to 71%. Fe2O3 content in the spodumene concentrates ranged from 1.70% to 1.89%. For Composite 2, the concentrate grade ranged from 5.8% to 6.2% Li2O with lithium recovery from 73% to 79%. Fe2O3 content in the spodumene concentrates ranged from 0.96% to 1.16%. Continuous pilot plant operation produced roughly 400 kg of spodumene concentrate. Historical Authier testwork results were used for plant design in the 2018 feasibility study and 2019 updated feasibility study for the Project. Table 10-9 – Reagent dosages for selected pilot plant tests. Test Feed P80 (µm) Dosage (g/t) Na2CO3 Armac T MIBC F100 FA-2 PP-11S Composite 1 188 576 130 21 254 693 PP-11F 188 576 130 21 254 693 PP-12F 189 543 220 21 266 656 PP06 Composite 2 180 402 112 19 242 1,065 PP-07S1 182 600 121 19 264 1,106 PP-07S2 182 600 212 19 264 1,106 North American Lithium DFS Technical Report Summary – Quebec, Canada 140 Figure 10-12 – Pilot plant flowsheet (PP-06).

North American Lithium DFS Technical Report Summary – Quebec, Canada 141 10.6 BLENDED ORE (NAL AND AUTHIER) TESTWORK REVIEW 10.6.1 Preliminary Testwork (2019) Initial testwork on blended NAL and Authier samples was undertaken in 2019 at SGS Canada Inc. in Lakefield, Ontario. The Authier sample tested was material from the 2018 pilot plant and was a blend of Composite 1 and Composite 2 material. The NAL samples (pegmatite, granodiorite and volcanics) were hand-picked from ROM stockpiles located at the NAL site in November 2019. The blend ratio tested was 75% NAL ore and 25% Authier ore. Based on historical data, dilution in the NAL mine plan was expected to be roughly 18%. By contrast, and due to the nature of the deposit and the mining strategy, the Authier mine plan was expected to include less than 5% dilution in ROM ore. Assays of the various feed samples are shown in Table 10-10. The Authier pegmatite sample had a grade of 1.05% Li2O. The NAL pegmatite sample was high-grade at 1.57% Li2O. The NAL granodiorite (4.1% Fe2O3) and the volcanics samples (13.1% Fe2O3) had relatively high iron content as compared to the pegmatite samples (0.82% and 0.49%, respectively). Table 10-11 shows the composition of the feed blends tested. Test procedures included: crushing, grinding, de-sliming, WHIMS and spodumene flotation. Reagent dosages were chosen based on historical testwork and NAL operating experience. Figure 10-13 shows the grade-recovery curves for the four tests. Figure 10-14 shows the relationship between Fe2O3 and Li2O concentrations in the concentrates. For test F3, the concentrate produced from the blended sample containing basalt was unable to achieve 6% Li2O (5.87% Li2O at 80% recovery). The final concentrate also contained a relatively high level of iron (1.96% Fe2O3). Results for test F4 showed that the concentrate produced from the blended sample containing granodiorite achieved 6% Li2O at 85% recovery. Iron levels in the final concentrate were slightly high at 1.33% Fe2O3. Test F5 on NAL pegmatite (no dilution) performed well, achieving 6% Li2O at roughly 90% recovery. Iron in the 6% Li2O concentrate was roughly 1.2% Fe2O3. Test F6 on a blend of Authier and NAL pegmatite (no dilution) performed well, achieving 6% Li2O at roughly 90% recovery. Iron in the 6% Li2O concentrate was roughly 1.2% Fe2O3. North American Lithium DFS Technical Report Summary – Quebec, Canada 142 Table 10-10 – Assays of ore samples tested. Analysis Authier NAL Composite Pegmatite Granodiorite Volcanics Li 0.49 0.73 0.14 0.09 Li2O 1.05 1.57 0.30 0.19 SiO2 73.50 74.00 62.70 48.90 Al2O3 15.60 15.70 16.70 8.95 Fe2O3 0.82 0.49 4.10 13.10 MgO 0.26 0.02 2.30 11.80 CaO 0.21 0.24 4.59 10.50 Na2O 4.75 3.39 4.48 1.46 K2O 2.80 2.33 2.24 1.23 Figure 10-13 – Grade – recovery curves. The pegmatite sample tested from NAL was relatively high-grade compared to the expected life-of-mine average. All samples tested produced concentrate with Fe2O3 concentrations exceeding 1%. The sample tested containing basalt produced a concentrate of 5.87% Li2O (slightly below 6%), which contained a relatively high concentration of iron (1.96% Fe2O3). North American Lithium DFS Technical Report Summary – Quebec, Canada 143 Table 10-11 – Overview of feed samples tested. Test Authier NAL Composite Pegmatite Granodiorite Volcanics Composition, % F3 25 67.5 - 7.5 F4 25 67.5 7.5 - F5 - 100.0 - - F6 25 75.0 - - Figure 10-14 – Fe2O3 vs. Li2O in the concentrate. North American Lithium DFS Technical Report Summary – Quebec, Canada 144 Table 10-12 – Final spodumene concentrate grade (3-stages of cleaning). Test Li2O Fe2O3 % F3 5.87 1.96 F4 6.05 1.33 F5 6.54 1.29 F6 6.24 1.18 10.6.1.1 Prefeasibility study testwork (2021-22) Testwork on blended NAL and Authier ore was undertaken in 2021-22 at SGS Canada Inc. in Lakefield, Ontario. Both samples were selected from drill core. The main objectives of the testwork were: • To test a blended feed sample (64% NAL and 36% Authier); • Test the impact of basalt waste rock dilution on performance; • Examine the impact of two-stages of WHIMS on concentrate quality. Pegmatite and host rock samples were analyzed separately. Table 10-13 and Table 10-14 show assays and mineralogy of the components. Table 10-13 – Assays of the pegmatite and host rock samples. Component NAL Authier Pegmatite Basalt Granodiorite Pegmatite Basalt Composition, wt % Li 0.67 0.08 0.11 0.68 0.10 Li2O 1.44 0.17 0.24 1.46 0.22 Al 8.42 5.77 8.73 8.42 9.21 Ca 0.23 7.29 3.32 0.12 3.51 Fe 0.15 9.72 2.87 0.26 7.76 Na 3.32 1.92 3.41 3.23 3.30 K 2.16 0.62 2.00 2.40 0.59 Mg 0.02 4.94 1.39 0.04 5.62 Mn 0.10 0.16 0.05 0.09 0.22 Si 34.20 23.70 29.70 34.50 22.20 Based on previous studies and NAL operational data, the NAL testwork feed sample comprised 10% basalt dilution (to simulate feed to the mill after ore sorting). The feed samples were blended at a ratio of 64%

North American Lithium DFS Technical Report Summary – Quebec, Canada 145 NAL ore and 36% Authier ore (to simulate rod mill feed). Table 10-15 shows the assays of the blended ore sample. The feed grade of the blended sample was 1.14% Li2O and 1.56% Fe2O3. The samples were stage-crushed and stage-ground to a target P80 of 200 µm. The samples were scrubbed and de-slimed, underwent WHIMS, de-slimed and conditioned prior to spodumene rougher and scavenger flotation followed by three stages of cleaning. The testwork was designed to mimic the NAL flowsheet. Table 10-16 shows reagent dosages for the optimized tests. For the optimized tests, FA-2 fatty acid collector dosage ranged from 780 g/t to 1,080 g/t. Figure 10-15 shows the grade-recovery curves for the three optimized tests. Final spodumene concentrate grades in the three tests were roughly 6% Li2O. Lithium recovery ranged from 60% to 66%. Table 10-14 – Mineralogy of the pegmatite and host rock samples. Mineral NAL Authier Pegmatite Basalt Granodiorite Pegmatite Basalt Composition, wt % Albite 39.50 23.80 50.80 37.40 40.00 Magnesio-hornblende - 53.20 11.40 - 36.80 Quartz 25.10 1.00 14.40 26.70 - Microcline 12.40 0.90 9.60 11.50 - Chlorite - 2.60 1.60 - 15.90 Muscovite 3.00 4.50 3.40 4.50 4.10 Holmquistite - 5.60 4.30 - - Biotite 0.80 1.70 2.70 0.90 0.90 Diopside - 6.20 1.70 - 0.40 Rutile - 0.50 0.10 - 0.30 Calcite 0.50 - - 0.50 - Beryl 0.20 - - 0.20 - Total 100 100 100 100 100 North American Lithium DFS Technical Report Summary – Quebec, Canada 146 Table 10-15 – Blended ore assays. Component NAL/Authier Blend Composition, % Li 0.53 Li2O 1.14 Al2O3 15.40 CaO 0.98 Fe2O3 1.56 Na2O 4.40 K2O 2.51 MgO 0.73 MnO 0.15 SiO2 72.50 Table 10-16 – Reagent dosages for optimized tests. Test P100 (µm) Dosage (g/t) Na2CO3 NaOH F100 F220 FA-2 F6 300 225 75 250 - 780 F9 300 225 75 250 - 1,080 F16 300 201 75 - 250 780 North American Lithium DFS Technical Report Summary – Quebec, Canada 147 Figure 10-15 – Grade – recovery curves. Table 10-17 shows the final concentrate grades which ranged from 6.01% to 6.05% Li2O and 0.78% to 1.05% Fe2O3. Table 10-17 – Final spodumene concentrate assays. Test Li2O Fe2O3 % F6 6.01 1.05 F9 6.01 0.98 F16 6.05 0.78 Figure 10-16 compares the performance of the WHIMS when processing ore containing basalt versus granodiorite host rock (10% dilution in all tests shown). The data points are taken from several testwork programs on NAL ore and blended ore. The results show higher mass pulls, iron rejection and lithium North American Lithium DFS Technical Report Summary – Quebec, Canada 148 losses for the basalt tests. This is due to the higher concentrations of iron-bearing silicate minerals in the basalt samples. Figure 10-16 – Comparison of WHIMS performance with basalt vs. granodiorite host rock. 10.6.1.2 Tailings Filtration The target moisture content that forms the basis of assessment and filter sizing was 15%. During the test program, the effects of cake thickness and drying time on filter cake moisture and the production rate were examined. In 2022, ten pressure filtration tests were conducted by Pocock Laboratories on combined tailings samples. Two pressure filtration methods were tested: 1) air blowing only and 2) membrane squeeze with air blow. The design conditions simulated the filtration of tailings with an average 56% solids feed density. The pressure for all ten air blow procedures was maintained at 552 kPa. However, combined tailings material in four out of ten tests were subjected to an additional pressure of 690 kPa for the initial membrane squeeze procedure, which was raised to 1,600 kPa for the final 30 seconds of air blow. The test results and the simulations yielded the production of a tailings cake with satisfactory discharge as well as stacking properties reaching their target values in a cycle time that would require one operating and one stand-by pressure filter configuration, the specifications for which are provided in Chapter 14.

North American Lithium DFS Technical Report Summary – Quebec, Canada 149 10.6.1.3 Feasibility Study Testwork (2022-23) Testwork on blended NAL and Authier ore was undertaken in 2022-23 at SGS Canada Inc. in Lakefield, Ontario. Two composite and five variability samples were tested. The main objectives of the testwork were to: • Test blended feed samples (64% NAL and 36% Authier); • Test the impact of granodiorite, gabbro, and volcanics waste rock dilution on metallurgical performance; • Mimic the NAL flowsheet. 10.6.1.4 Composite Samples The NAL pegmatite sample was collected in 2022 by operations geologists from run-of-mine ore remaining in the pit from previous mining operations in 2019. The material was selected to represent average-grade material. The NAL volcanics and granodiorite samples used were material remaining from the PFS testwork program. The Authier pegmatite sample was taken from a test pit onsite. The Authier host rock (ultramafic) sample was from the PFS testwork program. Pegmatite and host rock samples were analyzed separately. Table 10-18 and Table 10-19 show assays and mineralogy of the components. The NAL and Authier pegmatite samples graded 1.12% and 1.05% Li2O, respectively. The host rock samples contained low levels of lithium, ranging from 0.17% to 0.24% Li2O. A major difference between the host rock samples was the varying iron concentrations which ranged from 4.10% to 13.9% Fe2O3. Table 10-18 – Composite sample assays of the pegmatite and host rock samples. Component NAL Authier Pegmatite Volcanics Granodiorite Pegmatite Ultramafic Composition, wt % Li 0.52 0.08 0.11 0.49 0.10 Li2O 1.12 0.17 0.24 1.05 0.22 Al2O3 15.60 10.90 16.49 15.60 17.40 CaO 0.37 10.20 4.65 0.14 4.91 Fe2O3 0.32 13.90 4.10 0.42 11.10 Na2O 4.57 2.59 4.60 4.42 4.45 K2O 2.61 0.75 2.41 2.86 0.71 MgO 0.05 8.19 2.31 0.05 9.32 MnO 0.10 0.21 0.06 0.13 0.28 SiO2 74.30 50.10 63.50 74.40 47.50 North American Lithium DFS Technical Report Summary – Quebec, Canada 150 The NAL and Authier pegmatite samples contained 14.7% and 12,9% spodumene. The major difference between the host rock types was the varying amounts of magnesio-hornblende which ranged from 11.4% to 53.2%. The volcanics and granodiorite samples contained holmquistite which correlates with the presence of lithium in the samples. Table 10-19 – Mineralogy of the pegmatite and host rock samples. Mineral NAL Authier Pegmatite Volcanics Granodiorite Pegmatite Ultramafic Composition, wt % Spodumene 14.7 - - 12.9 - Albite 38.8 23.8 50.8 38.5 40.0 Magnesio-hornblende - 53.2 11.4 - 36.8 Quartz 27.9 1.0 14.4 29.3 - Microcline 15.8 0.9 9.6 15.2 - Chlorite - 2.6 1.6 - 15.9 Muscovite 2.2 4.5 3.4 3.6 4.1 Holmquistite - 5.6 4.3 - - Biotite - 1.7 2.7 - 0.9 Diopside - 6.2 1.7 - 0.4 Rutile - 0.5 0.1 - 0.3 Petalite 0.4 - - 0.5 - Total 100 100 100 100 100 The samples were blended at a ratio of 64% NAL ore and 36% Authier ore (to simulate rod mill feed composition). Based on previous studies, mine plans, and NAL operational data, the NAL testwork feed samples comprised 9% dilution (medium dilution). The Authier portion of the sample contained 1.7% dilution. Two samples were prepared, one containing volcanics and one containing granodiorite. Table 10-20 shows the assays of the blended composite samples. The feed grade of composite 1 (volcanics) was 1.12% Li2O and 1.29% Fe2O3, and composite 2 (granodiorite) was 1.12% Li2O and 0.68% Fe2O3. North American Lithium DFS Technical Report Summary – Quebec, Canada 151 Table 10-20 – Blended feed assays. Component Composite 1 (Volcanics) Composite 2 (Granodiorite) Composition, % Li 0.5 0.5 Li2O 1.1 1.1 Al2O3 15.2 15.7 CaO 0.9 0.6 Fe2O3 1.3 0.7 Na2O 4.4 4.6 K2O 2.6 2.8 MgO 0.6 0.3 MnO 0.6 0.3 SiO2 72.5 73.4 10.6.1.5 Variability Samples Five variability samples were selected from NAL drill core samples (quarter core). The samples were selected to represent early years of production (years 1-10) and to include each major type of host rock (i.e., granodiorite, gabbro and volcanics). Table 10-21 gives a brief description of each of the five variability samples. Pegmatite and host rock samples from each drillhole were grouped separately. Pegmatite and host rock sample composites were analyzed for chemical composition and mineralogy. Table 10-22 shows the chemical composition of the pegmatite and host rock for each variability sample. Pegmatite grades ranged from 0.88% to 1.25% Li2O and from 0.15% to 0.79% Fe2O3. Host rock sample grades ranged from 0.19% to 0.47% Li2O and from 4.1% to 12.1% Fe2O3. Spodumene content of the pegmatite samples ranged from 10.8% to 15.4%. Muscovite content ranged from 2.0% to 4.5%. Low levels of spodumene are seen in the host rock samples (1.1% to 2.4%). Holmquistite is present in all host rock samples ranging from 2.0% to 6.8%. Large variations in magnesio- hornblende content (3.3% to 63.2%) can be seen in the various host rock types. Similar to the composite samples, NAL variability testwork feed samples comprised 9% dilution while the Authier portion (composite samples) contained 1.7% dilution. The samples were blended at a ratio of 64% NAL ore and 36% Authier ore (to simulate rod mill feed composition). North American Lithium DFS Technical Report Summary – Quebec, Canada 152 Table 10-21 – Variability sample description. Variability Sample Years of Production Host Rock Type Hole ID Dykes 1.0 Years 1-2 Volcanics / Granodiorite NAL-19-008 B NAL-19-008 N NAL-19-019 B NAL-19-023 B2 2.0 Years 1-2 Granodiorite NAL-16-005 CT_S-K NAL-16-012 CT_S-K NAL-16-028 CT_K NAL-19-010 B2 3.0 Years 3-5 Volcanics / Granodiorite NAL-16-035 P NAL-16-036 N NAL-19-020 B NAL-19-026 B 4.0 Years 3-5 Gabbro NAL-19-011 CT_V2 NAL-19-031 N2 NAL-19-034 CT_V2 NAL-19-036 CT_S-K 5.0 Years 5-10 Gabbro / Granodiorite NAL-19-021 A NAL-19-024 B NAL-19-036 CT_V Table 10-22 – NAL Variability sample assays: pegmatite and host rock. Component Pegmatite Composition, wt % Host Rock, Composition, wt % Var 1 Var 2 Var 3 Var 4 Var 5 Var 1 Var 2 Var 3 Var 4 Var 5 Li 0.57 0.41 0.57 0.50 0.58 0.14 0.10 0.22 0.09 0.15 Li2O 1.23 0.88 1.23 1.08 1.25 0.30 0.21 0.47 0.19 0.32 Al2O3 15.50 15.80 15.70 14.90 15.30 15.30 16.40 14.00 8.80 8.90 CaO 0.38 0.86 0.48 0.39 0.36 8.40 4.41 7.67 12.10 11.80 Fe2O3 0.15 0.79 0.28 0.26 0.23 8.24 4.11 9.70 11.90 11.20 Na2O 4.79 4.85 4.79 4.50 4.38 2.54 4.45 2.99 1.51 1.62 K2O 1.95 2.70 2.22 2.49 2.45 1.07 2.36 1.44 0.72 0.65 MgO 0.04 0.40 0.12 0.11 0.10 5.49 2.32 6.50 9.89 9.69 MnO 0.15 0.10 0.16 0.16 0.16 0.17 0.08 0.17 0.20 0.19 SiO2 74.90 72.60 73.40 75.60 75.40 55.50 62.70 53.90 52.10 52.70

North American Lithium DFS Technical Report Summary – Quebec, Canada 153 Table 10-23 – NAL Variability sample mineralogy: pegmatite and host rock. Mineral Pegmatite Composition, wt % Host Rock Composition, wt % Var 1 Var 2 Var 3 Var 4 Var 5 Var 1 Var 2 Var 3 Var 4 Var 5 Spodumene 14.7 10.8 15.4 13.5 14.9 2.1 1.1 2.4 1.3 2.4 Quartz 29.3 24.1 27.6 30.4 30.3 10.0 13.4 4.5 5.2 6.1 Plagioclase 42.3 45.7 43.3 40.8 39.2 36.5 47.7 36.6 14.1 19.8 Magnesio-hornblende - 0.8 - - - 24.5 3.3 26.3 63.2 47.3 K-feldspar 10.4 11.9 10.4 13.1 13.1 1.5 10.5 2.4 1.8 2.0 Phlogopite - - - - - 7.5 6.6 9.1 3.4 3.5 Epidote - - - - - 4.9 4.7 4.8 3.3 5.9 Holmquistite - 0.7 - - - 3.8 3.9 6.8 2.0 4.5 Muscovite 2.0 4.5 3.3 2.2 2.4 - - - - - Diopside - - - - - 4.2 2.9 2.5 2.7 3.3 Clinochlore - 1.3 - - - 1.7 3.0 1.9 0.8 1.3 Schorl 1.3 - - - - 1.9 1.9 0.9 1.0 1.3 Other - 0.2 - - - 1.0 0.4 1.0 1.0 1.9 Total 100 100 100 100 100 100 100 100 100 100 Table 10-24 – NAL blended variability sample assays. Component Composition, wt % Var 1 Var 2 Var 3 Var 4 Var 5 Li 0.52 0.46 0.52 0.48 0.53 Li2O 1.12 0.99 1.12 1.03 1.14 Al2O3 15.60 15.70 15.60 14.00 15.60 CaO 0.81 0.84 0.83 0.97 0.68 Fe2O3 0.81 0.93 1.05 1.13 0.95 Na2O 4.51 4.67 4.56 4.32 4.54 K2O 2.20 2.73 2.39 2.41 2.67 MgO 0.43 0.46 0.52 0.65 0.36 MnO 0.15 0.10 0.15 0.15 0.16 SiO2 73.70 72.20 72.30 69.60 73.40 10.6.1.6 Composite Sample Testwork Results The composite samples were stage-crushed and stage-ground to P100 values between 212 µm and 300 µm. The samples were scrubbed and de-slimed, underwent two stages of magnetic separation (WHIMS), de-slimed and conditioned prior to batch spodumene rougher and scavenger flotation followed by three stages of cleaning. The batch tests were designed to mimic the NAL flowsheet with recent 2023 circuit modifications. North American Lithium DFS Technical Report Summary – Quebec, Canada 154 Initial testwork examined the impact of grind size on flotation performance. Samples were stage-ground and screened. Tests were operated on each composite at -300 µm (tests F2 and F5) and -250 µm (tests F7 and F8) as shown in Figure 10-17. The finer grind (-250 µm) showed improved performance. Based on the results, all further testing was undertaken at a grind size of -250 µm. Tests were operated with a 250 g/t dosage of F220 dispersant and total dosage of FA-2 collector of 780 g/t. Figure 10-17 – Composite samples – Effect of grind size. Tests were undertaken to examine the effect of collector dosage of flotation performance. Figure 10-18 shows an example for composite 1. Tests were undertaken using 680 g/t, 780 g/t and 980 g/t of FA-2 collector. There was a slight improvement in performance at the highest collector dosage. North American Lithium DFS Technical Report Summary – Quebec, Canada 155 Figure 10-18 – Effect of collector (FA-2) dosage on flotation performance. Tests were undertaken to examine the impact of host rock dilution on flotation performance. The amount of NAL volcanics (host rock) included in the feed sample was varied: low (4.5%), medium (9%), and high (11%). Figure 10-19 shows grade-recovery curves for the three batch flotation tests. The low dilution sample showed the best performance which was largely attributed to lower lithium losses during magnetic separation (5.8% lithium loss as compared to 8.5% and 8.6% for the medium and high dilution samples, respectively). Table 10-25 shows final spodumene concentrate assays for the tests. The low dilution sample showed the highest lithia grade and lowest iron content. Table 10-25 – Final spodumene concentrate assays. Test Li2O Fe2O3 % F22 (Low Dilution) 5.58 1.26 F11 (Medium Dilution) 5.27 1.76 F23 (High Dilution) 5.30 1.43 North American Lithium DFS Technical Report Summary – Quebec, Canada 156 Figure 10-19 – Example of the impact of dilution on flotation performance. 10.6.1.7 Variability Sample Testwork Results The variability samples were tested using the same flowsheet (mimicking the NAL flowsheet) as the composite samples. All variability tests were operated under the same conditions as shown in Table 10-26. Table 10-25 shows final concentrate assays for each test. For variability samples 1, 3, 4, and 5 grades ranged from 5.47% to 6.03% Li2O, and from 0.92% to 1.19% Fe2O3. Final lithium recovery for these samples ranged from 77.6% to 82.3%. Variability sample 2 performed poorly and only achieved 4.80% Li2O and 1.87% Fe2O3 with lithium recovery of 72.2%. Further testing is planned for variability sample 2 to investigate the impact of finer grand sine and varying collector dosage. Table 10-26 – Variability test conditions. Test P100 (µm) Dosage (g/t) Na2CO3 NaOH F220 FA-2 Variability 250 88 200 250 780

North American Lithium DFS Technical Report Summary – Quebec, Canada 157 Figure 10-20 – Example of the impact of dilution on flotation performance. Table 10-27 – Final spodumene concentrate assays. Variability Sample Li2O Fe2O3 % 1 (grano./volcanics) 5.47 1.19 2 (grano.) 4.80 1.87 3 (grano./volcanics) 5.60 0.98 4 (gabbro) 5.73 1.05 5 (gabbro) 6.03 0.92 10.6.1.8 Testwork Analysis Optimized testwork data was selected and analyzed to support the process mass balance. The majority of the tests selected to be used in the analysis were from the DFS testwork program (one test from the PFS testwork program was included). All tests analyzed were from testing on composite samples. Table 10-28 outlines the testwork conditions for the optimized tests. Two fatty acid collectors were tests: Sylfat North American Lithium DFS Technical Report Summary – Quebec, Canada 158 FA-2 and Arrmaz Custofloat 7080. Custofloat 7080 is currently being employed at the NAL concentrator. All tests were operated with two stages of wet high-intensity magnetic separation at 13,000 gauss. Table 10-28 – Testwork conditions. Test P100 (µm) Dosage (g/t) Na2CO3 NaOH F100 F220 FA-2 CF 7080 F7 (DFS) 250 250 NM 0 250 780 0 F8 (DFS) 250 200 NM 0 250 780 0 F18 (DFS) 250 200 88 0 250 0 780 F19 (DFS) 250 200 88 0 250 0 780 F21 (DFS) 250 200 88 0 250 780 0 F22 (DFS) 250 200 88 0 250 780 0 F23 (DFS) 250 188 88 0 250 780 0 F24 (DFS) 250 225 100 0 250 0 780 F9 (PFS) 300 225 75 250 0 1,080 0 NM = Not Measured Table 10-28 shows the grade-recovery data point for the selected tests. The red curve is the correlation through all the datapoints which was used to support the recovery assumptions in the process mass balance (see Chapter 14). Figure 10-21 – Testwork analysis: grade-recovery correlation. North American Lithium DFS Technical Report Summary – Quebec, Canada 159 10.7 QUALIFIED PERSON’S OPINION The QP is of the opinion that the feasibility-level testwork performed and methodologies applied are relevant and of adequate nature for the treatment of both NAL and Authier ore at the NAL treatment plant. North American Lithium DFS Technical Report Summary – Quebec, Canada 160 11. MINERAL RESOURCE ESTIMATES During the DFS, BBA was retained by Sayona Quebec to complete a mineral resource estimate (MRE) of the North American Lithium Project (NAL Project). Mr. Pierre-Luc Richard, from PLR Resources Inc., and sub-contracted by BBA, acted as the QP and completed the MRE following the Canadian Institute of Mining, Metallurgy and Petroleum (CIM) Estimation of Mineral Resources and Mineral Reserves Best Practice Guidelines (CIM, 2019). For the filing of this S-K §229.1304 compliant report, the original MRE was reviewed by Ehouman N’Dah, P.Geo., whom is the responsible QP for this report. The resource area measures approximately 1,600 m along strike, 900 m in width and 900 m depth. The current MRE covers the entire Project (Figure 11-1). Figure 11-1 – 2023 MRE mineralized zone locations.

North American Lithium DFS Technical Report Summary – Quebec, Canada 161 11.1 DATA USED FOR ORE GRADE ESTIMATION The Project database is current, as of December 31, 2022, and consists of 600 surface-collared and 652 underground-collared diamond drillholes (DDH) with a cumulative length of 119,328 m (Figure 11-2). A subset of 247 DDH was used to build the model. The drillhole database was validated before proceeding to the resource estimation phase, and the validation steps are detailed in Chapter 9. The main source of drillhole information was in the form of Excel files with multiple sheets, and includes drillhole information from the 2009, 2010, 2011, 2016 and 2019 diamond drilling programs completed on the Project. Historical underground drillholes and previous historical drilling programs were used for reference purposes only as they were missing critical information and/or the level of confidence in the data quality was insufficient. The QP believes that the database is appropriate for the purposes of mineral resource estimation and the sample density allows a reliable estimate of the tonnage and grade of the mineralization in accordance with the level of confidence established by the mineral resource categories as defined in the CIM Guidelines. Figure 11-2 – 3D view looking north of the pegmatite dykes and drillhole. North American Lithium DFS Technical Report Summary – Quebec, Canada 162 11.2 RESOURCE ESTIMATE METHODOLOGY, ASSUMPTIONS AND PARAMETERS The 3D geological wireframes, mineralized intercepts, composites, block modelling, interpolation, classification, and reporting were all constructed using Seequent Leapfrog Geo™ and Leapfrog Edge™ version 2022.1. Statistical studies were undertaken using Excel and Snowden Supervisor version 8.14 (Supervisor). Deswik version 2022.2 was used for the pit shell optimization and potentially mineable stopes used to constrain the mineral resources. The methodology for the estimation of the current mineral resources involved the following steps: • Database verification and validation; • 3D interpretation and modelling; • Drillholes intercept and capture of samples within domains; • Basic statistics and composite generation for each pegmatite zone; • Capping analysis; • Geostatistical analysis including variography; • Block modelling and grade interpolation using dynamic anisotropy; • Density coding in the block model; • Iron content coding in the block model; • Block model validation; • Removal of mined volumes; • Mineral resource classification; • Determining reasonable prospects for eventual economic extraction; • Mineral resource statements. 11.2.1 Geological Interpretation and Modelling The 3D interpretation of pegmatite dyke (Figure 11-3) is based on drillhole descriptions. A total of 49 pegmatitic dykes were created. The geological model was developed by the BBA’s geological team under the supervision of the QP. The main lithological units are pegmatitic dykes, granodiorite, volcanic rocks, and gabbro (Figure 11-4). Historical mining voids from past production work are included in the model (Figure 11-5). The location, dimensions and content of the historical void shapes are not sufficiently precise, therefore their location and volume were adapted and slightly modified to fit the pegmatitic dykes. North American Lithium DFS Technical Report Summary – Quebec, Canada 163 Figure 11-3 – 3D Interpretation of pegmatite dyke. Figure 11-4 – Lithology model. North American Lithium DFS Technical Report Summary – Quebec, Canada 164 Figure 11-5 – Historical mining voids adjusted to fit pegmatite dykes, shown with semi-transparent pegmatite dykes. 11.2.2 Exploration Data Analysis 11.2.2.1 Raw Assays All raw assay data intersecting the mineralized zones (dykes) were assigned individual mineralization codes using Leapfrog Geo™. A total of 8,093 records of Li2O assays with an average sample length of 0.88 m were used in the MRE. Grade varies from 0.001% to 3.81% Li2O with a global average of 0.93% Li2O. Table 11-1 summarizes the basic statistics for the raw assays for each of the 49 mineralized zones. Table 11-1 – Basic statistics of the raw data – Li2O. Zone Field # of Samples Minimum Maximum Mean Variance COV A Length (m) 611 0.01 1.50 0.90 0.10 0.35 Li2O (%) 611 0.00 3.06 1.24 0.40 0.61 A1 Length (m) 181 0.01 1.50 0.84 0.12 0.41 Li2O (%) 181 0.00 2.76 0.93 0.45 0.80 A2 Length (m) 68 0.01 3.12 0.69 0.25 0.72 Li2O (%) 68 0.00 2.01 0.79 0.44 0.99 A3 Length (m) 24 0.02 1.15 0.84 0.07 0.33 Li2O (%) 24 0.00 2.37 1.30 0.29 0.53 B Length (m) 1,060 0.01 4.30 0.99 0.10 0.33 Li2O (%) 1,060 0.00 3.60 1.25 0.44 0.58 B1 Length (m) 482 0.01 1.50 1.01 0.12 0.34

North American Lithium DFS Technical Report Summary – Quebec, Canada 165 Zone Field # of Samples Minimum Maximum Mean Variance COV Li2O (%) 482 0.00 3.21 1.08 0.53 0.73 B2 Length (m) 68 0.01 1.50 0.82 0.13 0.44 Li2O (%) 68 0.00 2.69 0.81 0.46 0.97 B3 Length (m) 26 0.01 1.45 0.70 0.20 0.63 Li2O (%) 26 0.00 1.87 0.91 0.39 1.05 BN Length (m) 69 0.03 1.10 0.75 0.06 0.32 Li2O (%) 69 0.00 2.82 0.75 0.45 0.87 C Length (m) 348 0.01 1.70 1.08 0.11 0.31 Li2O (%) 348 0.00 2.95 1.45 0.36 0.48 CT_D Length (m) 58 0.14 1.40 0.74 0.06 0.33 Li2O (%) 58 0.00 2.34 1.07 0.49 0.72 CT_D2 Length (m) 112 0.01 1.15 0.75 0.09 0.40 Li2O (%) 112 0.00 2.37 0.72 0.41 0.98 CT_D3 Length (m) 44 0.01 1.05 0.73 0.06 0.34 Li2O (%) 44 0.00 2.43 0.90 0.52 0.89 CT_D33 Length (m) 27 0.01 4.12 1.10 1.15 0.98 Li2O (%) 27 0.00 2.37 0.69 0.69 1.01 CT_DD Length (m) 56 0.15 1.05 0.77 0.06 0.31 Li2O (%) 56 0.00 2.19 0.84 0.40 0.73 CT_EE Length (m) 199 0.01 1.40 0.82 0.06 0.31 Li2O (%) 199 0.00 3.81 1.07 0.50 0.72 CT_EEE Length (m) 17 0.02 4.98 1.04 1.17 1.04 Li2O (%) 17 0.00 2.22 0.51 0.46 1.22 CT_K Length (m) 117 0.05 4.70 0.79 0.20 0.56 Li2O (%) 117 0.00 2.80 0.83 0.55 0.85 CT_NAUD Length (m) 86 0.30 1.25 0.83 0.05 0.26 Li2O (%) 86 0.03 3.55 1.43 0.43 0.49 CT_S Length (m) 114 0.01 1.56 0.67 0.13 0.55 Li2O (%) 114 0.00 2.37 1.00 0.56 0.99 CT_S-K Length (m) 712 0.01 4.50 0.83 0.09 0.37 Li2O (%) 712 0.00 3.60 1.20 0.47 0.65 CT_T Length (m) 123 0.01 4.80 0.76 0.25 0.65 Li2O (%) 123 0.00 2.40 0.82 0.39 0.87 CT_U Length (m) 262 0.01 1.20 0.72 0.11 0.46 Li2O (%) 262 0.00 3.38 0.99 0.48 0.85 CT_V Length (m) 255 0.01 7.37 0.87 0.30 0.62 Li2O (%) 255 0.00 2.72 0.98 0.48 0.80 CT_V2 Length (m) 149 0.01 1.50 0.91 0.11 0.37 Li2O (%) 149 0.00 2.76 1.24 0.43 0.63 D Length (m) 36 0.50 1.20 0.89 0.04 0.22 Li2O (%) 36 0.00 1.83 0.25 0.23 1.70 D1 Length (m) 53 0.30 1.10 0.74 0.04 0.27 Li2O (%) 53 0.01 1.57 0.36 0.20 1.29 K Length (m) 55 0.01 1.50 0.93 0.14 0.41 Li2O (%) 55 0.00 3.05 1.02 0.54 0.85 M Length (m) 68 0.01 1.55 0.79 0.14 0.47 Li2O (%) 68 0.00 1.53 0.42 0.25 1.34 N Length (m) 365 0.01 16.30 0.87 0.73 0.98 Li2O (%) 365 0.00 2.45 0.65 0.40 0.96 N1 Length (m) 24 0.01 1.10 0.81 0.07 0.33 Li2O (%) 24 0.00 1.21 0.22 0.12 1.65 N2 Length (m) 27 0.01 1.50 0.97 0.19 0.45 Li2O (%) 27 0.00 2.48 0.72 0.37 0.96 NAUD2 Length (m) 10 0.50 1.00 0.77 0.04 0.25 Li2O (%) 10 0.03 2.39 1.17 0.52 0.67 NAUD3_test Length (m) 125 0.01 1.30 0.72 0.10 0.44 Li2O (%) 125 0.00 2.22 0.81 0.37 0.90 NAUD4 Length (m) 45 0.01 1.05 0.66 0.07 0.39 Li2O (%) 45 0.00 2.05 0.79 0.49 1.02 O Length (m) 86 0.02 1.75 0.80 0.07 0.34 North American Lithium DFS Technical Report Summary – Quebec, Canada 166 Zone Field # of Samples Minimum Maximum Mean Variance COV Li2O (%) 86 0.00 2.28 0.67 0.41 1.00 P Length (m) 243 0.01 1.50 0.90 0.10 0.36 Li2O (%) 243 0.00 2.80 0.91 0.49 0.84 P1 Length (m) 95 0.01 1.50 0.86 0.16 0.47 Li2O (%) 95 0.00 2.04 0.50 0.34 1.25 Q Length (m) 742 0.01 1.80 1.02 0.15 0.37 Li2O (%) 742 0.00 3.56 1.18 0.48 0.67 Q1 Length (m) 33 0.02 1.45 1.06 0.18 0.40 Li2O (%) 33 0.00 2.53 1.44 0.33 0.49 Q2 Length (m) 35 0.01 1.50 0.98 0.08 0.29 Li2O (%) 35 0.00 2.24 0.82 0.40 0.81 Q3 Length (m) 60 0.01 1.50 1.01 0.21 0.45 Li2O (%) 60 0.00 2.41 1.16 0.48 0.74 Q4 Length (m) 19 0.15 1.90 1.14 0.12 0.31 Li2O (%) 19 0.00 2.15 1.18 0.54 0.67 R Length (m) 248 0.01 1.50 1.17 0.10 0.27 Li2O (%) 248 0.00 3.02 1.23 0.44 0.58 R2 Length (m) 16 0.70 1.40 1.09 0.04 0.18 Li2O (%) 16 0.74 2.44 1.62 0.30 0.32 Z Length (m) 200 0.01 1.65 1.01 0.15 0.39 Li2O (%) 200 0.00 2.71 1.01 0.54 0.81 Z1 Length (m) 147 0.03 7.80 1.09 0.47 0.63 Li2O (%) 147 0.00 2.70 1.07 0.50 0.73 Z2 Length (m) 56 0.03 1.50 1.00 0.15 0.39 Li2O (%) 56 0.00 2.41 0.88 0.38 0.82 Z3 Length (m) 37 0.10 1.50 0.83 0.13 0.44 Li2O (%) 37 0.00 2.37 0.48 0.38 1.41 11.2.2.2 Compositing Compositing of drillhole samples was conducted to homogenize the resource database to remove any bias associated with sample length in the original database. The compositing length was determined taking into consideration the original sample length statistics and other factors, to have a reasonable length of support to estimate the NAL deposit. A total of 5,540 composites were generated in the dykes with a length of 1.5 m, ranging from 0.003 m to 1.5 m when necessary. Figure 11-6 shows the distribution of the length before and after compositing. Compositing was done within each zone (dyke), and composite samples do not cross domain boundaries. Table 11-2 shows composite statistics within the mineralized zones used for estimation. 11.2.2.3 Grade Capping An outlier is an observation that appears to be inconsistent with most of the data in the same statistical population. It is common practice to statistically examine the higher grades within a population and to trim the outliers to a lower-grade value, commonly referred to as capping. North American Lithium DFS Technical Report Summary – Quebec, Canada 167 Figure 11-6 – Distribution of the length before (left) and after (right) compositing. Table 11-2 – Basic statistics of composites used for estimation – Li2O. Zone Field # of Samples Minimum Maximum Mean Variance COV A Length (m) 394 0.02 1.50 1.39 0.10 0.23 Li2O (%) 394 0.00 2.65 1.19 0.33 0.48 A1 Length (m) 125 0.03 1.50 1.23 0.21 0.38 Li2O (%) 125 0.00 2.73 0.88 0.34 0.67 A2 Length (m) 44 0.05 1.50 1.09 0.27 0.48 Li2O (%) 44 0.00 1.85 0.69 0.37 0.88 A3 Length (m) 15 0.52 1.50 1.34 0.09 0.22 Li2O (%) 15 0.39 2.00 1.27 0.21 0.36 B Length (m) 754 0.02 1.50 1.39 0.10 0.23 Li2O (%) 754 0.00 3.54 1.21 0.37 0.50 B1 Length (m) 354 0.04 1.50 1.37 0.11 0.24 Li2O (%) 354 0.00 3.01 1.05 0.45 0.64 B2 Length (m) 44 0.30 1.50 1.26 0.13 0.29 Li2O (%) 44 0.00 2.12 0.72 0.37 0.84 B3 Length (m) 16 0.25 1.50 1.15 0.23 0.41 Li2O (%) 16 0.01 1.87 0.93 0.33 0.62 BN Length (m) 42 0.20 1.50 1.23 0.20 0.36 Li2O (%) 42 0.01 1.89 0.72 0.33 0.80 C Length (m) 267 0.05 1.50 1.40 0.09 0.21 Li2O (%) 267 0.02 2.68 1.41 0.31 0.39 CT_D Length (m) 34 0.01 1.50 1.26 0.19 0.35 Li2O (%) 34 0.00 1.98 1.02 0.36 0.59 CT_D2 Length (m) 65 0.15 1.50 1.29 0.13 0.28 Li2O (%) 65 0.02 2.10 0.71 0.32 0.80 CT_D3 Length (m) 27 0.05 1.50 1.19 0.22 0.40 Li2O (%) 27 0.01 2.41 0.92 0.39 0.68 CT_D33 Length (m) 33 0.15 1.50 1.31 0.14 0.29 Li2O (%) 33 0.01 1.79 0.81 0.35 0.73 CT_DD Length (m) 122 0.10 1.50 1.34 0.14 0.28 Li2O (%) 122 0.01 3.13 1.04 0.39 0.61 CT_EE Length (m) 14 0.15 1.50 1.08 0.24 0.45 Li2O (%) 14 0.00 1.63 0.62 0.38 1.00 CT_EEE Length (m) 76 0.10 1.50 1.18 0.20 0.38 Li2O (%) 76 0.00 1.92 0.79 0.39 0.80 CT_K Length (m) 52 0.40 1.50 1.38 0.10 0.23 Li2O (%) 52 0.14 2.66 1.38 0.26 0.37 CT_NAUD Length (m) 68 0.02 1.50 1.12 0.22 0.42 Li2O (%) 68 0.00 2.23 0.91 0.48 0.76 North American Lithium DFS Technical Report Summary – Quebec, Canada 168 Zone Field # of Samples Minimum Maximum Mean Variance COV CT_S Length (m) 434 0.08 1.50 1.36 0.11 0.25 Li2O (%) 434 0.00 2.48 1.17 0.38 0.53 CT_S-K Length (m) 76 0.07 1.50 1.23 0.18 0.34 Li2O (%) 76 0.00 1.96 0.80 0.29 0.67 CT_T Length (m) 152 0.03 1.50 1.28 0.17 0.33 Li2O (%) 152 0.00 3.38 0.97 0.38 0.64 CT_U Length (m) 171 0.03 1.50 1.28 0.17 0.32 Li2O (%) 171 0.00 2.26 0.93 0.38 0.66 CT_V Length (m) 104 0.03 1.50 1.30 0.17 0.32 Li2O (%) 104 0.02 2.61 1.16 0.36 0.51 CT_V2 Length (m) 14 0.06 1.50 1.27 0.22 0.37 Li2O (%) 14 0.01 2.06 1.09 0.49 0.64 D Length (m) 25 0.25 1.50 1.27 0.12 0.27 Li2O (%) 25 0.00 1.83 0.31 0.28 1.74 D1 Length (m) 32 0.05 1.50 1.23 0.18 0.34 Li2O (%) 32 0.01 1.29 0.32 0.13 1.12 K Length (m) 40 0.10 1.50 1.28 0.18 0.33 Li2O (%) 40 0.01 2.39 0.95 0.41 0.67 M Length (m) 48 0.05 1.50 1.11 0.26 0.46 Li2O (%) 48 0.00 1.53 0.40 0.21 1.15 N Length (m) 236 0.05 1.50 1.32 0.14 0.29 Li2O (%) 236 0.00 2.21 0.64 0.32 0.88 N1 Length (m) 17 0.04 1.50 1.15 0.30 0.48 Li2O (%) 17 0.00 0.90 0.19 0.06 1.29 N2 Length (m) 21 0.30 1.50 1.25 0.18 0.34 Li2O (%) 21 0.07 1.76 0.73 0.30 0.76 NAUD2 Length (m) 7 0.55 1.50 1.10 0.17 0.37 Li2O (%) 7 0.27 2.11 1.09 0.34 0.54 NAUD3_test Length (m) 76 0.01 1.50 1.21 0.23 0.40 Li2O (%) 76 0.00 2.12 0.79 0.30 0.70 NAUD4 Length (m) 27 0.30 1.50 1.11 0.18 0.38 Li2O (%) 27 0.01 1.75 0.72 0.40 0.87 O Length (m) 59 0.05 1.50 1.16 0.21 0.39 Li2O (%) 59 0.01 2.05 0.63 0.30 0.87 P Length (m) 170 0.00 1.50 1.29 0.15 0.30 Li2O (%) 169 0.00 2.73 0.86 0.40 0.74 P1 Length (m) 69 0.10 1.50 1.18 0.22 0.40 Li2O (%) 69 0.00 1.88 0.46 0.29 1.17 Q Length (m) 535 0.10 1.50 1.42 0.07 0.18 Li2O (%) 535 0.00 2.62 1.15 0.40 0.55 Q1 Length (m) 28 0.25 1.50 1.25 0.16 0.32 Li2O (%) 28 0.00 2.53 1.43 0.34 0.41 Q2 Length (m) 29 0.10 1.50 1.18 0.26 0.43 Li2O (%) 29 0.01 2.04 0.78 0.33 0.74 Q3 Length (m) 48 0.10 1.50 1.26 0.20 0.36 Li2O (%) 48 0.00 2.27 1.09 0.44 0.61 Q4 Length (m) 17 0.20 1.50 1.27 0.15 0.31 Li2O (%) 17 0.00 2.06 1.25 0.50 0.57 R Length (m) 212 0.20 1.50 1.37 0.10 0.23 Li2O (%) 212 0.00 2.58 1.19 0.37 0.51 R2 Length (m) 14 0.15 1.50 1.25 0.23 0.38 Li2O (%) 14 0.74 2.32 1.55 0.19 0.28 Z Length (m) 151 0.05 1.50 1.34 0.13 0.27 Li2O (%) 151 0.01 2.67 0.97 0.46 0.70 Z1 Length (m) 113 0.35 1.50 1.36 0.10 0.23 Li2O (%) 113 0.00 2.63 1.07 0.39 0.58 Z2 Length (m) 44 0.10 1.50 1.27 0.15 0.30 Li2O (%) 44 0.00 2.28 0.88 0.30 0.63 Z3 Length (m) 24 0.10 1.50 1.28 0.20 0.35 Li2O (%) 24 0.00 2.12 0.43 0.31 1.29

North American Lithium DFS Technical Report Summary – Quebec, Canada 169 A capping analysis was performed by searching for abnormal breaks or changes of slope on the grade distribution probability plot while making sure that the coefficient of variation (COV) of the capped data was ideally lower than, or around 2.00, and no more than 10% of the total contained metal was enclosed within the first 1% of the highest-grade samples. This analysis was performed on the six main dykes (A, B, B1, CT_S-K, Q and Z). The study concluded that capping is warranted on the entire set of composites at 2.3 Li2O (%), see Figure 11-7. Figure 11-7 – Capping analysis for Dyke A; capping at 2.3% Li2O. 11.2.2.4 Variography and Search Ellipsoids A semi-variogram is a common tool used to measure the spatial variability within specific mineralized zones. Typically, samples taken far apart will vary more than samples taken close to each other. A variogram gives a measure of how much two samples taken from the same mineralized zone will vary in grade depending on the distance and spatial orientation between those samples. North American Lithium DFS Technical Report Summary – Quebec, Canada 170 Variography was done in both Leapfrog Edge™ (Figure 11-8) and Supervisor (Figure 11-9). Well-structured variogram models were obtained for 20 pegmatite domains; these were estimated using ordinary kriging (OK), using Leapfrog Edge™. The remaining 29 pegmatite domains did not yield well-structured variograms and therefore were estimated using Inverse Distance Square (ID2), also using Leapfrog Edge™. Figure 11-8 – Variography study in Edge (example from one zone). Three oriented search ellipsoids were used to select data and interpolate Li2O grades in successively less restrictive passes. The ellipse sizes and anisotropies were based on variography, drillhole spacing, and pegmatite geometry. The ellipsoids are 40 m x 30 m x 14 m, 80 m x 60 m x 28 m, and 160 m x 120 m x 60 m. A minimum of three and a maximum of 10 composites were selected during interpolation. A minimum of two holes were needed to interpolate during the first two passes (see Table 11-3). Spatial anisotropy of the dykes is respected during estimation using Leapfrog Edge™ Variable Orientation tool. Variable Orientation tool uses the central reference plane from each individual pegmatite dyke to select the locally appropriate anisotropy orientation and to orient the search ellipse for selection of North American Lithium DFS Technical Report Summary – Quebec, Canada 171 composites and determination of kriging weights. Table 11-4 shows variogram parameters used for each dyke. Figure 11-9 – Variography study in Supervisor (example from one zone). North American Lithium DFS Technical Report Summary – Quebec, Canada 172 Table 11-3 – Search ellipsoids. Pass Ellipse (m) Composites Max per Hole 1 40 x 30 x 14 44,995 2 2 80 x 60 x 28 44,995 2 3 160 x 120 x 60 44,995 None Table 11-4 – Variogram parameters used for each dyke. Dyke Direction Nugget Structure 1 Structure 2 Dip Dip Azimuth Pitch Sill Major Semi- Major Minor Sill Major Semi- Major Minor A 72 229 18 0.12 0.46 89 50 14 0.42 172 133 19 A1 59 221 173 0.15 0.52 33 34 4 0.33 110 88 15 B 50 227 72 0.10 0.66 75 75 12 0.24 162 145 20 B1 52 218 164 0.10 0.20 108 120 25 0.70 184 144 28 C 45 236 62 0.11 0.45 29 32 10 0.44 120 118 11 CT_EE 74 209 16 0.09 0.21 90 14 10 0.70 145 80 11 CT_NAUD 66 221 142 0.19 0.39 58 40 8 0.42 112 92 10 CT_S-K 58 201 117 0.08 0.48 59 91 11 0.44 175 123 12 CT_U 64 202 175 0.08 0.31 20 28 7 0.61 114 55 7 CT_V 59 236 68 0.06 0.60 22 44 11 0.34 57 55 12 D1 69 214 60 0.12 0.50 13 105 11 0.38 105 105 11 K 61 222 72 0.14 0.52 15 5 6 0.34 72 55 6 M 66 225 84 0.10 0.27 120 90 4 0.63 160 150 11 N 67 214 118 0.08 0.47 63 19 6 0.45 126 103 12 O 60 217 28 0.08 0.32 65 50 2 0.60 103 82 7 P 55 223 40 0.08 0.37 103 100 5 0.55 155 142 9 P1 56 222 17 0.12 0.47 43 30 6 0.41 81 50 11 Q 56 217 48 0.12 0.44 57 62 26 0.44 110 77 30 R 54 216 128 0.10 0.56 76 80 6 0.34 145 132 14 Z 50 219 109 0.07 0.59 73 28 14 0.34 76 74 20 11.3 MINERAL GRADE ESTIMATION 11.3.1 Block Model Block models were generated and estimated in Leapfrog Edge™ for each of the wireframed dykes. Parent cells of 5 m x 5 m x 5 m were sub-blocked four times in each direction (minimum sub-block of 1.25 m in each direction). Sub-blocks are triggered by both the geological model and mining voids, for precise depletion. This model has proportional sub-blocks to cover the spaces inside the solid boundaries and to honour the wireframe volumes. The size of the sub-blocking was chosen to best match the thickness of the

North American Lithium DFS Technical Report Summary – Quebec, Canada 173 mineralized dykes and the complexity of the geological model. The block model parameters are shown in Table 11-5. Table 11-5 – Block model parameters used in Leapfrog Edge™. Properties X (column) Y (row) Z (level) Origin of coordinates 293,200 5,363,800 600 Number of blocks 325 650 150 Block size (m) 5 5 5 Minimum sub-block size(m) 1 1 3 Rotation -50 11.3.2 Estimation Methodology The block model was estimated using OK and Variable Orientation search algorithm fully implemented in Leapfrog Edge™. Variable Orientation allows the orientation of the ellipsoid and variograms to be used for each block individually based on local characteristics. The remaining XX domains were estimated using Inverse Distance Squared (ID2), also using the Variable Orientation search tool. ID2 and nearest neighbor (NN) were used for validation and comparison purposes. Kriging neighborhood analysis (KNA) was performed to assist with the selection of the estimation parameters. KNA provides a quantitative method of testing different estimation parameters, such as block size, number of samples, optimum search radius, and discretization by assessing their impact on the quality of the resultant estimates in terms of kriging efficiency and slope of regression. This study is dependent on several factors, including the inherent deposit variability, the grade continuity, anisotropy, and the data spacing. The variogram mathematically represents these factors and is critical for a KNA. Table 11-6 summarizes all the suggested parameters of the KNA analysis. Table 11-6 – Summary of the suggested parameters from the KNA analysis. Properties Global Optimum Block sizes (m) 5x5x5 Sample ranges 45,061 Search ranges (m) 180, 60, 60 Discretization 3, 3, 3 The interpolation was performed with three search passes. For instance, the first pass is interpolated using one-time variogram ranges(1x) while two times(2x) is for pass 2 and three times(3x) for pass 3. A minimum and a maximum number of composites were required in each pass, as well as a maximum number of composites by drillhole to satisfy the estimation criteria, as shown in Table 11-7. North American Lithium DFS Technical Report Summary – Quebec, Canada 174 Table 11-7 – Summary of parameters used for Li2O grade interpolation. Dyke Interpolation Method Pass Ellipsoid Ranges (m) Number of Samples Drillhole Limit Max Inter-mediate Min Max Min Max Samples/Hole A OK P1 40 30 14 3 10 3 A OK P2 80 60 28 3 10 3 A OK P3 160 120 60 3 10 - A1 ID2 P1 40 30 14 3 10 3 A1 ID2 P2 80 60 28 3 10 3 A1 ID2 P3 160 120 60 3 10 - A1 OK P1 40 30 14 3 10 3 A1 OK P2 80 60 28 3 10 3 A1 OK P3 160 120 60 3 10 - A2 ID2 P1 40 30 14 3 10 2 A2 ID2 P2 80 60 28 3 10 2 A2 ID2 P3 160 120 60 3 10 - A2 OK P1 40 30 14 3 10 2 A2 OK P2 80 60 28 3 10 2 A2 OK P3 160 120 60 3 10 - A3 ID2 P1 40 30 14 3 10 3 A3 ID2 P2 80 60 28 3 10 2 A3 ID2 P3 160 120 60 3 10 - A3 OK P1 40 30 14 3 10 2 A3 OK P2 80 60 28 3 10 2 A3 OK P3 160 120 60 3 10 - B ID2 P1 40 30 14 3 10 3 B ID2 P2 80 60 28 3 10 3 B ID2 P3 160 120 60 3 10 - B OK P1 40 30 14 3 10 3 B OK P2 80 60 28 3 10 3 B OK P3 160 120 60 3 10 - B1 ID2 P1 40 30 14 3 10 3 B1 ID2 P2 80 60 28 3 10 3 B1 ID2 P3 160 120 60 3 10 - B1 OK P1 40 30 14 3 10 3 B1 OK P2 80 60 28 3 10 3 B1 OK P3 160 120 60 3 10 - B2 ID2 P1 40 30 14 3 10 3 B2 ID2 P2 80 60 28 3 10 2 B2 ID2 P3 160 120 60 3 10 - B2 OK P1 40 30 14 3 10 2 B2 OK P2 80 60 28 3 10 2 B2 OK P3 160 120 60 3 10 - B3 ID2 P1 40 30 14 3 10 3 B3 ID2 P2 80 60 28 3 10 2 B3 ID2 P3 160 120 60 3 10 - B3 OK P1 40 30 14 3 10 2 B3 OK P2 80 60 28 3 10 2 B3 OK P3 160 120 60 3 10 - C ID2 P1 40 30 14 3 10 3 C ID2 P2 80 60 28 3 10 3 C ID2 P3 160 120 60 3 10 - C OK P1 40 30 14 3 10 3 C OK P2 80 60 28 3 10 3 C OK P3 160 120 60 3 10 - CT_D ID2 P1 40 30 14 3 10 3 CT_D ID2 P2 80 60 28 3 10 2 CT_D ID2 P3 160 120 60 3 10 - CT_D OK P1 40 30 14 3 10 2 CT_D OK P2 80 60 28 3 10 2 North American Lithium DFS Technical Report Summary – Quebec, Canada 175 Dyke Interpolation Method Pass Ellipsoid Ranges (m) Number of Samples Drillhole Limit Max Inter-mediate Min Max Min Max Samples/Hole CT_D OK P3 160 120 60 3 10 - CT_D2 ID2 P1 40 30 14 3 10 3 CT_D2 ID2 P2 80 60 28 3 10 2 CT_D2 ID2 P3 160 120 60 3 10 - CT_D2 OK P1 40 30 14 3 10 2 CT_D2 OK P2 80 60 28 3 10 2 CT_D2 OK P3 160 120 60 3 10 - CT_D3 ID2 P1 40 30 14 3 10 3 CT_D3 ID2 P2 80 60 28 3 10 2 CT_D3 ID2 P3 160 120 60 3 10 - CT_D3 OK P1 40 30 14 3 10 2 CT_D3 OK P2 80 60 28 3 10 2 CT_D3 OK P3 160 120 60 3 10 - CT_DD ID2 P1 40 30 14 3 10 2 CT_DD ID2 P2 80 60 28 3 10 2 CT_DD ID2 P3 160 120 60 3 10 - CT_DD OK P1 40 30 14 3 10 2 CT_DD OK P2 80 60 28 3 10 2 CT_DD OK P3 160 120 60 3 10 - CT_EE ID2 P1 40 30 14 3 10 3 CT_EE ID2 P2 80 60 28 3 10 3 CT_EE ID2 P3 160 120 60 3 10 - CT_EE OK P1 40 30 14 3 10 3 CT_EE OK P2 80 60 28 3 10 3 CT_EE OK P3 160 120 60 3 10 - CT_K ID2 P1 40 30 14 3 10 2 CT_K ID2 P2 80 60 28 3 10 2 CT_K ID2 P3 160 120 60 3 10 - CT_K OK P1 40 30 14 3 10 2 CT_K OK P2 80 60 28 3 10 2 CT_K OK P3 160 120 60 3 10 - CT_NAUD ID2 P1 40 30 14 3 10 3 CT_NAUD ID2 P2 80 60 28 3 10 3 CT_NAUD ID2 P3 160 120 60 3 10 - CT_NAUD OK P1 40 30 14 3 10 3 CT_NAUD OK P2 80 60 28 3 10 3 CT_NAUD OK P3 160 120 60 3 10 - CT_S ID2 P1 40 30 14 3 10 2 CT_S ID2 P2 80 60 28 3 10 2 CT_S ID2 P3 160 120 60 3 10 - CT_S OK P1 40 30 14 3 10 2 CT_S OK P2 80 60 28 3 10 2 CT_S OK P3 160 120 60 3 10 - CT_S-K OK P1 40 30 14 3 10 3 CT_S-K OK P2 80 60 28 3 10 3 CT_S-K OK P3 160 120 60 3 10 - CT_T ID2 P1 40 30 14 3 10 2 CT_T ID2 P2 80 60 28 3 10 2 CT_T ID2 P3 160 120 60 3 10 - CT_T OK P1 40 30 14 3 10 2 CT_T OK P2 80 60 28 3 10 2 CT_T OK P3 160 120 60 3 12 - CT_U OK P1 40 30 14 3 10 3 CT_U OK P2 80 60 28 3 10 3 CT_U OK P3 160 120 60 3 10 - CT_V ID2 P1 40 30 14 3 10 3 CT_V ID2 P2 80 60 28 3 10 3 CT_V ID2 P3 160 120 60 3 10 - North American Lithium DFS Technical Report Summary – Quebec, Canada 176 Dyke Interpolation Method Pass Ellipsoid Ranges (m) Number of Samples Drillhole Limit Max Inter-mediate Min Max Min Max Samples/Hole CT_V OK P1 40 30 14 3 10 3 CT_V OK P2 80 60 28 3 10 3 CT_V OK P3 160 120 60 3 10 - CT_V2 ID2 P1 40 30 14 3 10 2 CT_V2 ID2 P2 80 60 28 3 10 2 CT_V2 ID2 P3 160 120 60 3 10 - CT_V2 OK P1 40 30 14 3 10 2 CT_V2 OK P2 80 60 28 3 10 2 CT_V2 OK P3 160 120 60 3 10 - D ID2 P1 40 30 14 3 10 2 D ID2 P2 80 60 28 3 10 2 D ID2 P3 160 120 60 3 10 - D OK P1 40 30 14 3 10 2 D OK P2 80 60 28 3 10 2 D OK P3 160 120 60 3 10 - K OK P1 40 30 14 3 10 3 K OK P2 80 60 28 3 10 3 K OK P3 160 120 60 3 10 - M ID2 P1 40 30 14 3 10 3 M ID2 P2 80 60 28 3 10 3 M ID2 P3 160 120 60 3 10 - M OK P1 40 30 14 3 10 3 M OK P2 80 60 28 3 10 3 M OK P3 160 120 60 3 10 - N ID2 P1 40 30 14 3 10 3 N ID2 P2 80 60 28 3 10 3 N ID2 P3 160 120 60 3 10 - N OK P1 40 30 14 3 10 3 N OK P2 80 60 28 3 10 3 N OK P3 160 120 60 3 10 - N1 ID2 P1 40 30 14 3 10 2 N1 ID2 P2 80 60 28 3 10 2 N1 ID2 P3 160 120 60 3 10 - N1 OK P1 40 30 14 3 10 2 N1 OK P2 80 60 28 3 10 2 N1 OK P3 160 120 60 3 10 - N2 ID2 P1 40 30 14 3 10 2 N2 ID2 P2 80 60 28 3 10 2 N2 ID2 P3 160 120 60 3 10 - N2 OK P1 40 30 14 3 10 2 N2 OK P2 80 60 28 3 10 2 N2 OK P3 160 120 60 3 10 - NAUD2 ID2 P1 40 30 14 3 10 2 NAUD2 ID2 P2 80 60 28 3 10 2 NAUD2 ID2 P3 160 120 60 3 10 - NAUD2 OK P1 40 30 14 3 10 2 NAUD2 OK P2 80 60 28 3 10 2 NAUD2 OK P3 160 120 60 3 10 - NAUD3_test ID2 P1 40 30 14 3 10 2 NAUD3_test ID2 P2 80 60 28 3 10 2 NAUD3_test ID2 P3 160 120 60 3 10 - NAUD3_test OK P1 40 30 14 3 10 2 NAUD3_test OK P2 80 60 28 3 10 2 NAUD3_test OK P3 160 120 60 3 10 - NAUD4 ID2 P1 40 30 14 3 10 2 NAUD4 ID2 P2 80 60 28 3 10 2 NAUD4 ID2 P3 160 120 60 3 10 - NAUD4 OK P1 40 30 14 3 10 2

North American Lithium DFS Technical Report Summary – Quebec, Canada 177 Dyke Interpolation Method Pass Ellipsoid Ranges (m) Number of Samples Drillhole Limit Max Inter-mediate Min Max Min Max Samples/Hole NAUD4 OK P2 80 60 28 3 10 2 NAUD4 OK P3 160 120 60 3 10 - O ID2 P1 40 30 14 3 10 3 O ID2 P2 80 60 28 3 10 3 O ID2 P3 160 120 60 3 10 - O OK P1 40 30 14 3 10 3 O OK P2 80 60 28 3 10 3 O OK P3 160 120 60 3 10 - P ID2 P1 40 30 14 3 10 3 P ID2 P2 80 60 28 3 10 3 P ID2 P3 160 120 60 3 10 - P OK P1 40 30 14 3 10 3 P OK P2 80 60 28 3 10 3 P OK P3 160 120 60 3 10 - P1 ID2 P1 40 30 14 3 10 3 P1 ID2 P2 80 60 28 3 10 3 P1 ID2 P3 160 120 60 3 10 - P1 OK P1 40 30 14 3 10 3 P1 OK P2 80 60 28 3 10 3 P1 OK P3 160 120 60 3 10 - Q ID2 P1 40 30 14 3 10 3 Q ID2 P2 80 60 28 3 10 3 Q ID2 P3 160 120 60 3 10 - Q OK P1 40 30 14 3 10 3 Q OK P2 80 60 28 3 10 3 Q OK P3 160 120 60 3 10 - Q1 ID2 P1 40 30 14 3 10 2 Q1 ID2 P2 80 60 28 3 10 2 Q1 ID2 P3 160 120 60 3 10 - Q1 OK P1 40 30 14 3 10 2 Q1 OK P2 80 60 28 3 10 2 Q1 OK P3 160 120 60 3 10 - Q2 ID2 P1 40 30 14 3 10 2 Q2 ID2 P2 80 60 28 3 10 2 Q2 ID2 P3 160 120 60 3 10 - Q2 OK P1 40 30 14 3 10 2 Q2 OK P2 80 60 28 3 10 2 Q2 OK P3 160 120 60 3 10 - Q3 ID2 P1 40 30 14 3 10 2 Q3 ID2 P2 80 60 28 3 10 2 Q3 ID2 P3 160 120 60 3 10 - Q3 OK P1 40 30 14 3 10 2 Q3 OK P2 80 60 28 3 10 2 Q3 OK P3 160 120 60 3 10 - Q4 ID2 P1 40 30 14 3 10 2 Q4 ID2 P2 80 60 28 3 10 2 Q4 ID2 P3 160 120 60 3 10 - Q4 OK P1 40 30 14 3 10 2 Q4 OK P2 80 60 28 3 10 2 Q4 OK P3 160 120 60 3 10 - R ID2 P1 40 30 14 3 10 3 R ID2 P2 80 60 28 3 10 3 R ID2 P3 160 120 60 3 10 - R OK P1 40 30 14 3 10 3 R OK P2 80 60 28 3 10 3 R OK P3 160 120 60 3 10 - R2 ID2 P1 40 30 14 3 10 2 R2 ID2 P2 80 60 28 3 10 2 North American Lithium DFS Technical Report Summary – Quebec, Canada 178 Dyke Interpolation Method Pass Ellipsoid Ranges (m) Number of Samples Drillhole Limit Max Inter-mediate Min Max Min Max Samples/Hole R2 ID2 P3 160 120 60 3 10 - R2 OK P1 40 30 14 3 10 2 R2 OK P2 80 60 28 3 10 2 R2 OK P3 160 120 60 3 10 - Z ID2 P1 40 30 14 3 10 3 Z ID2 P2 80 60 28 3 10 3 Z ID2 P3 160 120 71 3 10 - Z OK P1 40 30 14 3 10 3 Z OK P2 80 60 28 3 10 3 Z OK P3 160 120 60 3 10 - Z1 ID2 P1 40 30 14 3 10 2 Z1 ID2 P2 80 60 28 3 10 2 Z1 ID2 P3 160 120 60 3 10 - Z1 OK P1 40 30 14 3 10 2 Z1 OK P2 80 60 28 3 10 2 Z1 OK P3 160 120 60 3 10 - Z2 ID2 P1 40 30 14 3 10 2 Z2 ID2 P2 80 60 28 3 10 2 Z2 ID2 P3 160 120 60 3 10 - Z2 OK P1 40 30 14 3 10 2 Z2 OK P2 80 60 28 3 10 2 Z2 OK P3 160 120 60 3 10 - Z3 ID2 P1 40 30 14 3 10 2 Z3 ID2 P2 80 60 28 3 10 2 Z3 ID2 P3 160 120 60 3 10 - Z3 OK P1 40 30 14 3 10 2 Z3 OK P2 80 60 28 3 10 2 Z3 OK P3 160 120 60 3 10 - Hard boundaries between the mineralized zones were used to prevent grades from adjacent zones being used during interpolation. As a block was estimated, it was tagged with the corresponding pass number. The interpolation was made sequentially, dyke by dyke, and restricted by composites uniquely coded for each dyke. 11.3.3 Block Model Statistical Validation Validation of the block model was performed using Swath Plots in each of the three block model axes, ID2 and NN grade estimations, global means comparisons, and visual inspection in 3D and along plan views and cross-sections. Every step of the block modelling process was revised to ensure fair representation and consistency of the primary data. 11.3.3.1 Visual Inspection Block model grades were visually compared against drillhole composite grades in cross-section and 3D views. This visual validation process also included confirming that the proper parameters were selected for the various domains and checks for global and local bias. North American Lithium DFS Technical Report Summary – Quebec, Canada 179 The visual comparison shows that the block model is reasonably consistent and correlates well with the primary data without excessive smoothing, as shown in Figure 11-10. Figure 11-10 – Visual inspection on a cross-section looking to the west. Note that discrepancy between drillholes intercepts and modelled dykes are due to the 50 m clipping of the section view; all intercepts are snapped to drillholes. 11.3.3.2 Swath Plots Swath plots were generated as part of the block model validation process. A swath plot is a graphical display of the grade distribution derived from a series of bands (or swaths) generated in several directions throughout the deposit. Using swath plots, grade variations from the Li2OO_OK model are compared to the distribution of grades interpolated with the Li2O_NN and Li2O_ID2 methods and the composites. This validation method also works as a visual means to identify possible interpolation bias. Figure 11-11 illustrates a swath plot through a single pegmatite domain. Generally, the grades estimated in the blocks are close to the average grades provided by the data source. No bias was found in the resource estimate. North American Lithium DFS Technical Report Summary – Quebec, Canada 180 Figure 11-11 – Swath plot for mineralized dyke A - direction Y. 11.3.3.3 Global Comparison Additional estimations were completed using the NN method to compare with the OK and ID2 block model estimation. Grade averages for the OK, NN and the ID2 models are tabulated in Table 11-8. This comparison did not identify significant issues. As expected, the average grades generated by the NN interpolation methods are very close to those reported from the OK/ID2 interpolation. Block grade averages with OK and ID2 estimates are slightly lower than the composites in some dykes. It is expected in areas where high-grade composites are clustered, but block estimates receive information from lower grade composites farther away in the search ellipse.

North American Lithium DFS Technical Report Summary – Quebec, Canada 181 Table 11-8 – Comparison of global grades for estimation method by mineralized zones. Zone Li2O_Composite Li2O_ID Li2O_OK Li2O_NN Final Grade Estimator Method (%) (%) (%) (%) A 1.19 1.22 1.17 1.12 OK A1 0.88 1.01 0.99 0.96 OK A2 0.69 0.73 - 0.80 ID2 A3 1.27 1.27 - 1.28 ID2 B 1.21 1.07 1.23 1.20 OK B1 1.05 1.01 1.00 1.00 OK B2 0.72 0.70 - 0.58 ID2 B3 0.93 0.95 - 0.87 ID2 BN 0.72 0.61 - 0.48 ID2 C 1.41 1.45 1.42 1.29 OK CT_D 1.02 0.87 - 0.83 ID2 Ct_D2 0.71 0.66 - 0.58 ID2 CT_D3 0.92 0.62 - 0.75 ID2 CT_D33 1.09 1.11 - 1.05 ID2 CT_DD 0.81 0.63 - 0.54 ID2 CT_EE 1.04 0.86 0.87 0.88 OK CT_EEE 0.62 0.83 - 0.85 ID2 CT_K 0.79 0.81 - 0.73 ID2 CT_T 1.38 1.34 1.26 1.10 OK CT_U 0.91 0.87 - 0.78 ID2 CT_V 1.17 1.20 1.18 1.10 OK CT_V2 0.80 0.66 - 0.55 ID2 D 0.97 1.00 0.98 0.91 OK D1 0.93 0.75 0.74 0.71 OK K 1.16 1.11 - 1.11 ID2 M 0.31 0.20 - - ID2 N 0.32 0.24 0.21 0.22 OK N1 0.95 1.15 0.92 1.00 OK N2 0.40 0.45 0.43 0.42 OK N2 0.64 0.51 0.53 0.47 OK NAUD2 0.19 0.14 - 0.16 ID2 NAUD3_test 0.73 0.81 - 0.84 ID2 NAUD4 1.09 1.01 - 0.95 ID2 O 0.79 0.70 - 0.73 ID2 P 0.72 0.68 - 0.76 ID2 P1 0.63 0.61 0.62 0.57 OK Q 0.86 0.81 0.79 0.83 OK Q1 0.46 0.42 0.38 0.38 OK Q2 1.15 1.08 1.07 1.08 OK Q3 1.43 1.26 - 1.34 ID2 Q4 0.78 0.90 - 0.75 ID2 R 1.09 1.10 - 1.04 ID2 R2 1.25 1.33 - 1.13 ID2 Z 1.19 1.20 1.19 1.05 OK Z1 1.55 1.66 - 1.44 ID2 Z2 0.97 0.93 0.89 0.85 OK Z3 1.07 0.96 - 0.96 ID2 North American Lithium DFS Technical Report Summary – Quebec, Canada 182 11.4 MINERAL RESOURCE CLASSIFICATION The classification was based on drill spacing, grade continuity, geological interpretation, and the QP’s judgment and experience on similar projects. The final classification is assigned to blocks from a manually smoothed solid designed along the longitudinal section of each pegmatite dyke. • Blocks were classified as Inferred when the drill spacing was 150 m or better. • Blocks were classified as Indicated when the drill spacing was 80 m or better inside the conceptual resources pit shell. • Blocks were classified as Measured if they fell within 10 m of the bottom of the current pit surface. • A 10 m buffer zone was implemented around historical underground voids. All material inside this buffer zone was at best Inferred even if the drill spacing allowed for Indicated. This is to account for the uncertainty associated with the accuracy of historical underground mining voids. • Smaller pegmatite dykes defined by limited data were entirely classified as Inferred, given that they also met the minimum drillhole spacing of 150 m or better. Figure 11-12 shows a longitudinal section view of classification for one of the 49 dykes. Figure 11-12 – Classification distribution on a longitudinal section looking northwest. Connecting blue and red blocks mathematically meet 80 m and 150 m drill spacings, respectively. The blue and red outlines represent the manual classification. North American Lithium DFS Technical Report Summary – Quebec, Canada 183 11.5 CLASSIFIED MINERAL RESOURCE ESTIMATES By definition, a Mineral Resource must have “reasonable prospects for eventual economic extraction”. Factors significant to technical feasibility and potential economic viability include such items as: • The size and legal conditions of the land tenure sufficient to fully enclose the Mineral Resource; • The extraction selectivity for the mining methods under consideration relative to the size and geometries of the mineralization interpretations; • The processing method under consideration, the expected recovery from the mined material to a commercially marketable product and the proposed production volume; • The price/value of the product and the market for the product at that price; and • The factors significant to cut-off grades or values (e.g., process recovery, treatment charges, operating costs, royalties, etc.) used for reporting of Mineral Resource estimates. For an MRE, factors significant to technical feasibility and economic viability should be current, reasonably developed, and based on generally accepted industry practice and experience. The factors and parameters used to determine the MRE on the Project are based on the actual factors and parameters applied to the material planned to be extracted. All identified aspects are typical for this type of project and can be resolved with further work. The MRE has been tabulated using a cut-off grade of 0.6% Li2O for an open-pit mining scenario and 0.6% Li2O for an underground mining scenario based on 5.4% spodumene concentrate selling price of $1,273 USD/t and with mining costs and metallurgical recoveries used to develop the mineral reserves estimate cut-off grades disclosed in Chapter 12. Table 11-9 summarizes the values used to determine the cut-off grades for the MRE. The reasonable underground mining shapes were based on minimum width and/or the geometry of the mineralization. The solids representing the reasonable mining shapes are around contiguous blocks above the cut-off grade. These solids were created to remove any “orphaned” blocks located too far from the existing mining fronts or blocks in the model with no prospect for eventual economic extraction. The solids are queried to include blocks below cut-off. The calculated open pit cut-off grade is 0.15% Li2O, but due to metallurgical limitations and in order to achieve a saleable spodumene concentrate, a cut-off grade of 0.60% was established (see Chapter 10 for details). Table 11-9 – Reasonable extraction factors. Cost Unit Open Pit Underground Mining CAD/t mined 5.12 100.00 Processing CAD/t milled 23.44 23.44 Water Treatment CAD/ t milled 0.18 0.18 Tailings Management Cost CAD/t milled 2.86 2.86 North American Lithium DFS Technical Report Summary – Quebec, Canada 184 Cost Unit Open Pit Underground G&A CAD/t milled 6.00 6.00 6% Li2O concentrate price USD/t conc. 1,273 1,273 Concentrate transport USD/t conc. 118.39 118.39 Exchange rate USD/CAD 1.32 1.32 Recovery % 73.60 73.60 Break-even grade % 0.15 0.62 Cut-off grade applied % 0.60 0.60 11.5.1 Mineral Resource Statement The Mineral Resource Statement, effective as of December 31, 2022, has been tabulated in terms of cut- off grade at 0.6% Li2O and is summarized in Table 11-10. The MRE is inclusive of Mineral Reserves. Table 11-10 – NAL Mineral Resource statement at effective date of December 31, 2022 based on USD $1,273/t Li₂O, inclusive of Mineral Reserves. NAL – Open-pit Constrained Mineral Resource Statement Category Tonnes (MT) Grade (% Li2O) Cut-Off Grade % Li2O Met Recovery % Measured 1 1.19 0.60 73.6 Indicated 24 1.23 0.60 73.6 Measured and Indicated 25 1.23 0.60 73.6 Inferred 22 1.2 0.60 73.6 NAL – Underground Constrained Mineral Resource Statement Category Tonnes (Mt) Grade (% Li2O) Cut-Off Grade % Li2O Met Recovery % Measured - - 0.60 73.6 Indicated - - 0.60 73.6 Measured and Indicated - - 0.60 73.6 Inferred 11 1.3 0.80 73.6 NAL – Total Open Pit and Underground Constrained Mineral Resource Statement Category Tonnes (Mt) Grade (% Li2O) Cut-Off Grade % Li2O Met Recovery % Measured 1 1.19 0.6 73.6 Indicated 24 1.23 0.6 73.6 Measured and Indicated 25 1.23 0.6 73.6 Inferred 33 1.2 0.67 73.6

North American Lithium DFS Technical Report Summary – Quebec, Canada 185 1. The Mineral Resource was originally estimated by Pierre-Luc Richard, P.Geo., and subsequently reviewed by Ehouman N’Dah, P.Geo., who serves as the Qualified Person under S-K §229.1304 and assumes responsibility. The effective date of the estimate in the report remains December 31, 2022. 2. The Mineral Resource Estimate is inclusive of Mineral Reserves. 3. Mineral Resources are 100% attributable to the property. Sayona Quebec has 100% interest in North American Lithium. 4. These mineral resources are not mineral reserves as they do not have demonstrated economic viability. The quantity and grade of reported Inferred resources in this MRE are uncertain in nature and there has been insufficient exploration to define these resources as Indicated or Measured; however, it is reasonably expected that the majority of Inferred Mineral Resources could be upgraded to Indicated Mineral Resources with continued exploration. 5. Resources are presented undiluted, pit constrained and within stope shapes, and are considered to have reasonable prospects for eventual economic extraction. Although the calculated cut-off grade is 0.15% Li2O for open pit, a cut-off grade of 0.60% Li2O was used for the MRE due to processing limitations. The pit optimization was done using Deswik mining software. The constraining pit shell was developed using pit slopes of 46 to 53 degrees. The open-pit cut-off grade and pit optimization were calculated using the following parameters (amongst others): 5.40% Li2O concentrate price = $1,273 USD per tonne; CAD:USD exchange rate = 1.32; Hard Rock and Overburden Mining cost = $5.12/t mined; Mill Recovery of 73.6%; Processing cost = $23.44/t processed; G&A = $6.00/t processed; Transportation cost = $118.39/t conc; Tailing Management Cost = $2.86/t processed, and Water treatment $0.18/t processed. The cut-off grade for underground resources was calculated at 0.62% Li2O but rounded to 0.60% Li2O; it used identical costs and recoveries, except for mining costs being at $100/t. Cut-off grades will be re-evaluated in light of future prevailing market conditions and costs. 6. The MRE was prepared using Leapfrog Edge™ and is based on 247 surface drillholes. The resource database was validated before proceeding to the resource estimation. Grade model resource estimation was interpolated from drillhole data using OK and ID2 interpolation methods within blocks measuring 5 m x 5 m x 5 m in size and subblocks of 1.25 m. 7. The model comprises 49 mineralized dykes (which have a minimum thickness of 2 m, with rare exceptions between 1.5 m and 2 m). 8. High-grade capping was done on the composited assay data. Capping grades was fixed at 2.3% Li2O. A value of zero grade was applied in cases where core was not assayed. 9. Fixed density values were established on a per unit basis, corresponding to the median of the SG data of each unit ranging from 2.70 g/cm3 to 3.11 g/cm3. A fixed density of 2.00 t/m3 was assigned to the overburden. 10. The MRE presented herein is categorized as Measured, Indicated and Inferred Resources. The Measured Mineral Resource is limited to 10 m below the current exposed pit. The Indicated Mineral Resource is defined for blocks that are informed by a minimum of two drillholes where drill spacing is less than 80 m. The Inferred Mineral Resource is defined where drill spacing is less than 150 m. Where needed, some materials have been either upgraded or downgraded to avoid isolated blocks and spotted-dog effects. 11. The number of tonnes (metric) and contained Li2O tonnes were rounded to the nearest hundred thousand. *Rounded to the nearest thousand. Table 11-11 is presented to display the NAL Mineral Resource Statement exclusive of Mineral Reserves. Table 11-11 – NAL Mineral Resource statement at effective date of December 31, 2023 based on USD $1,273/t Li₂O exclusive of Mineral Reserves. NAL – Total Open Pit and Underground Constrained Mineral Resource Statement Category Tonnes (Mt) Grade (% Li2O) Cut-Off Grade % Li2O Met Recovery % Measured 0.7 1.00 0.6 73.6 Indicated 6.5 1.15 0.6 73.6 Measured and Indicated 7.3 1.14 0.6 73.6 Inferred 33.0 1.23 0.6 73.6 North American Lithium DFS Technical Report Summary – Quebec, Canada 186 11.6 POTENTIAL RISKS IN DEVELOPING THE MINERAL RESOURCE A potential risk for the mineral resource is the distribution of iron in the country rock that could be improved in the block model as currently averages of a limited number of samples is applied for each lithological units without taking into consideration possible local variations. A strategic resampling of existing core throughout the deposit could be performed, complete with mineralogical studies. North American Lithium DFS Technical Report Summary – Quebec, Canada 187 12. MINERAL RESERVES ESTIMATES 12.1 RESERVE ESTIMATE METHODOLOGY, ASSUMPTIONS, AND PARAMETERS As described in Chapter 11 of this Report, the structural geology of the Project is quite complex and resembles a narrow vein-style orebody. A key consideration is the variable width nature of individual dykes. Structures may vary from less than 2 m in width to over 25 m in width in the span of 10 m or less. This will lead to considerable changes in the dilution and ore losses both over short and long-term planning horizons. As an industrial mineral, the specification of the final product must meet relatively tight tolerances for lithium content, i.e., Li2O for concentrate, as well as contaminants, such as iron. The contaminant grade in the final product is directly linked to the quantity of diluting waste in the Ore feed. This is precisely why understanding the impacts of the variable dyke geometry on dilution and ore losses is critical. Dilution is the quantity of non-economically viable material that will be sent to the mill during mining activities. Ore losses are the quantity of economically viable material that will be sent to the waste rock stockpiles. Typical causes for dilution and ore losses include blast movement, improper identification of ore and waste zone limits, i.e., grade control, and selectivity limitations of loading equipment. A detailed dilution model was developed by BBA and coded into the mining block model. This was then used throughout the mine planning process. This section provides a summary of the methodology used. Mining operations must deal with practical limitations regarding minimum ore selectivity as well as minimum waste separation widths. Modelling these factors manually is not a practical exercise, given the scale of the deposit. Therefore, BBA borrowed from underground mine design techniques; utilizing Deswik’s Stope Optimizer tool (Deswik.SO) to generate shapes of continuous mineralization with a minimum lithium content. This approach provided an automated method of evaluating on a local scale, whether the combination of a particular dyke width, pegmatite grade and distance to the next dyke, i.e., waste separation, could result in producing a mill feed above a diluted COG of 0.60% Li2O. Mineable shapes were created by the tool. Mineralized material that did not pass this selectivity test was considered as geological ore loss. The resulting ROM feed is subject to an average LOM dilution of 16%. It is important to note that these are the LOM averages and will vary over life of mine. More details are presented in Chapter 13 of this Report. To account for operational errors, an additional mining ore loss factor of 3% was applied. Table 12-1 summarizes the main shape design criteria used as inputs in Deswik.SO. Figure 12-1 1illustrates a cross-section of the sub-blocked resource model and the resulting stope shape created in Deswik. From this, the diluting material along the hanging wall and footwall of the dyke is clearly visible. North American Lithium DFS Technical Report Summary – Quebec, Canada 188 Table 12-1 – Deswik.SO input parameters. Parameter Units Value Maximum shape width m n/a Minimum shape width m 2 Shape height m 10 Shape length m 10 Minimum waste pillar width m 3 Footwall dilution m 1 Hanging wall dilution m 1 Minimum diluted grade to produce shape (% Li2O) 1 Figure 12-1 – Cross section illustrating stope solids in various geological settings. Iron oxides, present in both the host (waste) rock and pegmatite dykes are an important consideration for the final product specification. To make sure to have reliable iron content values in all future mining areas for operational purposes, additional sampling was recommended on existing cores.

North American Lithium DFS Technical Report Summary – Quebec, Canada 189 12.2 MINE AND PLANT PRODUCTION SCENARIOS 12.2.1 Pit Optimization Methodology The purpose of pit optimization is to determine the ultimate pit limits that satisfy one or a range of business objectives. For NAL, the overall objective was to maximize the net present value (NPV) of the Project. Pit optimization was carried out on the diluted mining block model described in Section 12.1 of this chapter. This ensured that the mining selectivity criteria were accounted for in determining the ultimate pit shape. Pit optimization for the PFS was completed using the Pseudoflow command with the Deswik mining software. Inferred resources were not considered as potential ROM ore feed. This approach produces mathematically identical results to the traditional Lerchs-Grossmann algorithm, but in a fraction of the computing time since it is fundamentally a more efficient technique. 12.2.2 Pit Optimization Parameters The inputs for the pit optimization are presented in Table 12-2and detailed in the Mine Design Criteria document (6015049-02200-4M-EDC-0002-R00.pdf). Overall pit slopes were based on the parameters developed by Golder Associates (Golder) – refer to Chapter 13 for more details – and adjusted after preliminary runs to include allowances for haulage ramps and geotechnical berms. Revenue factors were applied to evaluate the sensitivity of the pit size versus selling prices, varying from 0.3 to 1.0. Note that the selling prices, costs, and technical parameters used were based on the best available information at this early stage of the study. Within a 10 m envelope of the old underground workings, the mining costs were inflated by 30% for the pit optimization. This accounts for the additional operational delays that result in higher operating costs for mining near and through these areas. More details with regards to operations in the vicinity of the underground workings can be found in Chapter 13. Figure 12-2 illustrates the envelope described above. A technical memorandum was produced by WSP-Golder on February 8th, 2023, to issue recommendations for the DFS study pit design parameters as well as the minimum setback distance between the edge of the ultimate pit and the Lake Lortie. (ref: 22515754-166-MTF-RevB) North American Lithium DFS Technical Report Summary – Quebec, Canada 190 Table 12-2 – Open pit optimization parameters (base case). Parameters Unit Value Comments Revenue Concentrate price USD/t of conc. 1,273 Preliminary market study from PwC Concentrate grade % Li2O 5.4 Transportation cost CAD/t of conc. 118 Preliminary budgetary quotes Royalty N/A Economics Currency CAD - Exchange rate USD/CAD 0.76 Discount rate % 8 Cost basis Mining Mining cost CAD/t mined 5.12 2022 PFS mining cost and mining contractor costs price-weighted average Processing & G&A Cost CAD/t milled 32.48 Operating Parameters Ore production Mtpy 1.0 Average ore production sent to crusher Overall recovery % 73.6 Geotechnical parameters Overburden (IRA) degree 26.6 Golder-WSP Memo Feb. 2023 Rock (OSA) degree 45.7, 49.1, 52.6 Golder-WSP Memo Feb. 2023 Limits and constraints Lease or Claim Claim NAL_claims_2023.dxf Setback from watercourse m 60 Setback from Lac Lortie limit [1] (Lac_Lortie_offset_60m.dxf) North American Lithium DFS Technical Report Summary – Quebec, Canada 191 Figure 12-2 – Cross-section view – 10 m envelope surrounding underground workings for pit optimization. Topography shown as green line, stopes and workings as dark shaded area, 10 m offset as yellow polylines. 12.2.3 Analysis of Pit Optimization Results As described above, the pit optimization will determine the pit shape based on given economic parameters, surface boundaries and pit slopes that results in maximum undiscounted value. This result, however, is not satisfactory, since it is not practical to assume that mining activities will occur instantaneously. Furthermore, due to the practical development sequence of open-pit mining, i.e., top down, it is likely that certain waste development costs may be incurred some time before the underlying economic material can be reached. To assess a more realistic value for a given pit shell, a discounted cash flow analysis is carried out. At this stage, it is important to note that the cash flows are indicative only and serve for relative comparison of value between various pits. Table 12-3 presents the results of the pit optimization in table form, while Table 12-4 presents the DCF ranges examined. Figure 12-3 presents a portion of this data graphically. A discount rate of 8% and ROM feed rate of 1.0 Mtpy have been used for the analysis. The values returned by the optimizer do not include capital investments and are only used as a relative indicator of the sensitivity of the Project to changes in costs. The revenue factor 0.60 pit shell was selected as a guide for the final pit limits. This selection was based on maximizing project reserves while respecting a relatively high NPV. This pit shell contained approximately 23.2 Mt of ROM ore feed and is within 10% of the highest discounted cash flow pit shell. It is clear that changes to the selling price, evaluated with the revenue factors are the dominant driver of the overall pit size. North American Lithium DFS Technical Report Summary – Quebec, Canada 192 The chosen optimized pit shell (red highlight) does not necessarily correspond with the final pit design used in the DFS. In the case of this specific project, physical and geotechnical limitations due to the old underground workings resulted in a final design with a higher strip ratio and lower ROM ore feed than the optimized shell. With the exception of the revenue factors, BBA did not perform a sensitivity analysis on other parameters. It is recommended that pit optimization sensitivity be conducted on the following parameters: 1) Metallurgical recovery. 2) Overall pit slopes. 3) Dilution and ore losses. The Mineral Reserves are based on an updated concentrator feed strategy that includes ore coming from Sayona’s Authier Project. Ore coming from the Authier site will be combined with the NAL ore and fed to the crusher. The life-of-mine (LOM) production plan has been prepared to reflect the new blending strategy. The Project LOM plan and subsequent Mineral Reserves are based on a spodumene concentrate selling price of $1,352 USD/t of concentrate. The effective date of the Mineral Reserves estimate is December 31, 2023, and based on an exchange rate of $0.75 USD:$1.00 CAD.

North American Lithium DFS Technical Report Summary – Quebec, Canada 193 Table 12-3 – Pit optimization results (blue line is maximum NPV pit, brown line is RF=1.0 pit). Revenue Factor ROM Ore Waste Rock (Mt) Strip Ratio Financial Analysis Tonnes Li2O including Li2O Concentrate Mining Processing Tailing G&A Revenue Mine Un-discounted NPV (Mt) dilution (%) (kt) (Mt) @ 5.4% Cost (M$) Cost (M$) Cost (M$) (M$) (M$) Life (y) Value (M$) (M$) 0.100 0.0 1.87 0 0.0 0.0 0.0 0 0 0 0 1 0 1 1 0.125 0.1 1.66 1 0.0 0.0 0.2 0 1 0 0 16 0 14 14 0.150 0.3 1.49 4 0.1 0.2 0.7 2 6 1 2 69 0 58 57 0.175 0.8 1.36 11 0.1 0.8 1.0 8 18 2 5 183 1 150 146 0.200 1.4 1.30 18 0.2 2.0 1.4 17 33 4 8 314 1 252 241 0.225 2.6 1.26 32 0.4 5.9 2.3 43 60 7 15 561 3 435 399 0.250 3.6 1.24 45 0.6 10.0 2.7 70 85 10 22 783 4 596 525 0.275 4.6 1.21 56 0.8 14.3 3.1 97 109 13 28 975 5 728 621 0.300 9.7 1.18 115 1.6 43.3 4.5 272 228 28 58 1 990 10 1,404 1,003 0.325 15.1 1.15 174 2.4 77.9 5.2 477 355 43 91 3 021 15 2,056 1,233 0.350 16.6 1.15 191 2.6 89.2 5.4 542 390 48 100 3 312 17 2,233 1,279 0.375 17.3 1.14 198 2.7 94.5 5.5 573 406 50 104 3 436 18 2,304 1,293 0.400 17.9 1.14 204 2.8 100.0 5.6 604 421 51 108 3 548 18 2,365 1,302 0.425 18.5 1.14 210 2.9 105.2 5.7 633 433 53 111 3 643 19 2,413 1,309 0.450 19.0 1.13 215 2.9 110.3 5.8 662 445 54 114 3 732 19 2,456 1,312 0.475 20.2 1.12 226 3.1 121.7 6 726 472 58 121 3 915 21 2,538 1,313 0.500 21.4 1.11 237 3.2 135.7 6.3 804 501 61 128 4,119 22 2,625 1,313 0.525 22.0 1.11 243 3.3 143.1 6.5 845 516 63 132 4,222 22 2,666 1,310 0.550 22.3 1.10 246 3.4 147.3 6.6 868 523 64 134 4,273 23 2,684 1,308 0.575 22.6 1.10 249 3.4 150.7 6.7 887 529 65 135 4,315 23 2,698 1,306 0.600 23.2 1.09 254 3.5 159.1 6.8 934 545 66 139 4,413 24 2,728 1,298 0.625 23.5 1.09 257 3.5 163.4 6.9 957 551 67 141 4,458 24 2,741 1,295 0.650 24.0 1.09 261 3.6 170.1 7.1 994 562 69 144 4,525 24 2,758 1,288 0.675 24.2 1.09 263 3.6 173.5 7.2 1,012 566 69 145 4,557 25 2,765 1,285 0.700 24.3 1.09 264 3.6 176.3 7.2 1,027 570 70 146 4,581 25 2,769 1,282 0.725 24.4 1.09 265 3.6 178.5 7.3 1,039 573 70 147 4,601 25 2,772 1,279 0.750 24.6 1.08 267 3.6 181.5 7.4 1,055 576 70 148 4,625 25 2,775 1,276 0.775 24.7 1.08 267 3.6 183.2 7.4 1,065 578 71 148 4,638 25 2,777 1,274 0.800 24.8 1.08 269 3.7 186.7 7.5 1,083 582 71 149 4,664 25 2,778 1,269 0.825 25.0 1.08 270 3.7 189.0 7.6 1,096 585 71 150 4,680 25 2,779 1,266 0.850 25.1 1.08 271 3.7 192.9 7.7 1,116 589 72 151 4,707 26 2,779 1,261 0.875 25.4 1.08 273 3.7 198.2 7.8 1,145 595 73 152 4,743 26 2,779 1,254 0.900 25.4 1.08 274 3.7 200.1 7.9 1,155 597 73 153 4,755 26 2,779 1,251 0.925 25.5 1.08 275 3.7 201.9 7.9 1,164 598 73 153 4,766 26 2,778 1,248 0.950 25.6 1.08 275 3.7 202.7 7.9 1,169 599 73 153 4,772 26 2,777 1,247 0.975 25.6 1.08 275 3.8 204.1 8.0 1,176 600 73 154 4,780 26 2,776 1,245 1.000 25.7 1.07 276 3.8 206.4 8.0 1,188 602 74 154 4,793 26 2,774 1,242 North American Lithium DFS Technical Report Summary – Quebec, Canada 194 Revenue Factor ROM Ore Waste Rock (Mt) Strip Ratio Financial Analysis Tonnes Li2O including Li2O Concentrate Mining Processing Tailing G&A Revenue Mine Un-discounted NPV (Mt) dilution (%) (kt) (Mt) @ 5.4% Cost (M$) Cost (M$) Cost (M$) (M$) (M$) Life (y) Value (M$) (M$) 1.025 25.7 1.07 277 3.8 207.7 8.1 1,195 603 74 154 4,800 26 2,773 1,240 1.050 25.8 1.07 277 3.8 208.8 8.1 1,201 605 74 155 4,806 26 2,771 1,238 1.075 25.8 1.07 277 3.8 210.0 8.1 1,207 606 74 155 4,812 26 2,770 1,236 1.100 25.9 1.07 277 3.8 210.5 8.1 1,210 606 74 155 4,815 26 2,769 1,235 Table 12-4 – Discounted Cash Flows. Revenue Factor ROM Feed Li2O Grade Waste Overall Stripping Ratio Best Case Worst Case Average (Mt) (% Li2O) (Mt) DCF (M$) DCF (M$) Case DCF (M$) 0.30 838,894 1.2 560,441 0.7 80,253,966 80,253,966 80,253,966 0.35 1,612,680 1.1 1,594,893 1.0 136,552,113 135,717,199 136,134,656 0.40 3,998,847 1.0 5,597,980 1.4 266,249,048 260,248,729 263,248,889 0.45 6,923,504 1.0 13,150,179 1.9 382,476,806 364,731,378 373,604,092 0.50 9,713,012 1.0 23,515,529 2.4 465,632,281 429,379,945 447,506,113 0.55 20,322,425 1.0 74,712,172 3.7 606,177,791 498,024,835 552,101,313 0.60 30,208,728 1.0 128,895,550 4.3 659,839,788 450,558,671 555,199,229 0.65 33,257,469 1.0 148,349,031 4.5 669,922,463 421,905,915 545,914,189 0.70 34,379,116 1.0 155,936,311 4.5 672,595,760 409,202,802 540,899,281 0.75 35,648,029 1.0 165,593,166 4.6 674,871,968 391,308,014 533,089,991 0.80 37,265,777 1.0 177,881,792 4.8 676,777,819 366,428,378 521,603,098 0.85 38,438,705 0.9 187,022,825 4.9 677,781,193 347,275,422 512,528,307 0.90 39,351,962 0.9 196,497,022 5.0 678,299,028 330,042,716 504,170,872 0.95 39,901,148 0.9 202,277,375 5.1 678,475,377 320,017,684 499,246,530 1.00 40,490,685 0.9 209,022,845 5.2 678,518,112 306,478,365 492,498,238 North American Lithium DFS Technical Report Summary – Quebec, Canada 195 Figure 12-3 – Pit optimization results. 12.2.4 Mine Design and Production 12.2.4.1 Resource Block Model The basis for the Mineral Reserves estimation is the resource block model prepared by BBA and Mr. Pierre- Luc Richard, from PLR Resources Inc., sub-contracted by BBA, who acted as the QP and completed the MRE with an effective date of December 31, 2022. The MRE was reviewed by Mr. Ehouman N’Dah, P.Geo. Block models were established in Leapfrog Edge™ for each of the wireframed dykes. Parent cells of 5 m x 5 m x 5 m were sub-blocked four times in each direction (minimum sub-block of 1.25 m in each direction). Sub-blocks are triggered by both the geological model and mining voids, for precise depletion. This model has proportional sub-blocks to cover the spaces inside the solid boundaries. The size of the sub-blocking was chosen to best match the thickness of the mineralized dykes and the complexity of the geological model. North American Lithium DFS Technical Report Summary – Quebec, Canada 196 12.2.4.2 Mining Block Model A mining block model was created from the resource block model described above. The purpose of this was to include additional items required for mining engineering activities, and for the application of modifying factors. The resource model was loaded into Deswik software. The model was supplied with the 3D wireframes used to define the different lithological zones. The overburden surface was also provided. A detailed dilution model was developed and coded into a sub-celled mining block model for mine planning use, as described in more detail in Section 12.1. This sub-celled model was then regularized to the parent block size of 5 m x 5 m x 5 m with tonnages and grades coded for each material type. This final regularized mining block model was then exported to MineSight for mine planning purposes. 12.2.4.3 Pit Slope Geotechnical and Hydrogeological Work 12.2.4.3.1 Geotechnical and hydrogeological Study Geotechnical and hydrogeological studies were carried out by Golder Associates in 2010. Geotechnical investigations that were performed by Golder in late 2018 and early 2019 have now been completed (now by WSP-Golder) and final updated geotechnical study will be issued in Q2-2023. An updated hydrogeology study has also been issued in November 2022 (ref: 152-22513708-RF-RevA). For the DFS study, WSP-Golder produced a technical memorandum that includes geotechnical and hydrogeological recommendations regarding the design criteria required for the pit shell distance to be maintained with Lac Lortie (22515754-166-MTF-RevB.pdf). For the technical memorandum mentioned in the previous paragraph, the reference pit shell is the same optimized pit shell used to guide the ultimate pit design for this study. 12.2.4.3.2 Planning Around Underground Workings Based on the current understanding of the geometries and locations of the existing underground openings in relation to the pit shell, all of these underground openings will be within the pit shell, i.e., will not intercept the final pit wall. Local modifications to the slope design might be required for safe and stable excavations in areas where stopes intersect the pit wall or floor, or drifts that run parallel to the pit wall. Slopes in these areas should be developed with care to ensure the safety of personnel and prevent equipment damage due to collapsing stopes and drifts.

North American Lithium DFS Technical Report Summary – Quebec, Canada 197 Historical underground openings will represent an operating hazard, a risk to local bench-scale and multi- bench stability and a potential rockfall hazard, depending on the character of the openings and any backfill. Systematic investigation and mitigation design will be required to manage these risks for both interim and final pit walls. Investigation and evaluation of these hazards, and design of mitigation, are currently underway by WSP-Golder for Sayona and will be continued through the operating life of the mine. A technical memorandum was issued by WSP-Golder on December 2, 2022, regarding the surface pillars for the underground opening (ref: 221515754-159-R-Rev0). 12.2.4.3.3 Operational Considerations Good quality operational practices will be essential for the safe development of stable and steep slopes. The slope design recommendations based on pre-split blasting assume that a workforce and supervisors skilled in implementing effective, controlled blasting and excavation procedures will be available throughout the mining operations. Optimized controlled blasting designs should be developed early in the mine life for use on long-term and final slopes. Blasting experience and trials should be developed and optimized in the interior of the open pit prior to applying it to the final slopes. 12.2.4.4 Pit Design Parameters The detailed mine design was carried out using the selected pit shell as a guide. The pit design parameters are detailed on Table 12-5. The proposed pit design includes the practical geometry required in a mine, including pit access and haulage ramps to all pit benches, pit slope designs, benching configurations, smoothed pit walls and catch benches. It was recommended in 2017 that a feasibility-level hydrogeology study be completed to validate designs and to support mine operations. As mentioned in the previous section, Golder-WSP completed that study in November 2022. An update of Golder Feasibility Pit Slope Design Report (2010 – ref: 10-1221-0017- 3000-Rev0) is currently ongoing and is to be completed in Q2-2023. For FS design considerations while waiting for the final study update, a preliminary technical memorandum was submitted to Sayona in February 2023 including pit design parameters recommendations which consider the FS updated pit shell. A review of the preliminary pit design issued by BBA was also done by WSP-Golder. The haulage fleet operated by the mining contractor is using 90 t capacity haul trucks in the first four years. This truck size was used as well for the owner-operated fleet starting in Year 5. As a result, the haulage ramps and access roads for the ultimate pit have been designed with this in mind. Table 12-6 presents the haul road design parameters. This is also shown graphically in Figure 12-4 and Figure 12-5 for in-pit single- and dual-lane haul ramps, respectively. North American Lithium DFS Technical Report Summary – Quebec, Canada 198 Table 12-5 – Ultimate pit design parameters. Design Sector Wall Dip Direction Bench Catch Bench Bench Face Inter-Ramp Geotechnical From To Height (m) Width (m) Angle (deg) Angle (deg) berm interval (m) Overburden (1) 0 360 NA 9 26.6 NA NA South 355 35 20 16 60.0 45.7 120 Northeast 195 270 20 10 65.0 49.1 120 Northwest 35 195 20 10 70.0 52.6 120 Southeast 270 355 20 10 70.0 52.6 120 (1) A 7 to 9 m setback considered at bedrock contact, depending on various factors listed in section 2.4.2 of the WSP-Golder memorandum (22515754-166-MTF-RevB). Table 12-6 – Haul Road design criteria. Parameters Units Dual Lane Single Lane Comments Reference Haul Truck - 90T-class 90T-class Largest haul truck expected for the NAL project Operating Width (m) 6.7 6.7 Includes clearance for mirrors and accessories Running Surface Multiplier (factor) 3.0 1.9 Minimum value for adequate clearance Running Surface Width (m) 20.0 12.5 For temporary and permanent roads Tire Diameter (m) 2.7 2.7 For 27.00 R49 tires Berm Height : Tire Ratio (ratio) 0.5 0.5 Minimum recommended value Berm Height (m) 1.3 1.3 For temporary and permanent roads Berm slope xH:1V Ratio (ratio) 1.3H:1.0V 1.3H:1.0V Angle of Repose 37.5 Berm Width (Top) (m) 0.5 0.5 Minimum recommended value Berm Width (Bottom) (m) 4.0 4.0 For temporary and permanent roads No. of Berms - Surface Road (#) 2.0 2.0 Industry standard practice No. of Berms - Pit Ramp (#) 1.0 1.0 Industry standard practice No. of Berms - Pit Slot (#) 0.0 0.0 Industry standard practice Ditch Depth (m) 0.8 0.5 For temporary and permanent roads Ditch slope xH:1V Ratio (ratio) 1.0H:1.0V 1.0H:1.0V Maximum recommended value Ditch Width (Bottom) (m) 0.5 0.5 Minimum recommended value Ditch Width (Top) (m) 2.0 1.5 For temporary and permanent roads No. of Ditches - Surface Road (#) 0.0 0.0 Industry standard practice No. of Ditches - Pit Ramp (#) 1.0 1.0 Industry standard practice No. of Ditches - Pit Slot (#) 2.0 2.0 Industry standard practice Overall Width - Surface Road (m) 28.0 20.5 For temporary and permanent roads Overall Width - Pit Ramp (m) 26.0 18.5 For temporary and permanent roads Overall Width - Pit Slot (m) 24.0 15.5 For temporary and permanent roads Maximum Grade - Permanent Road (%) 10.0 10.0 Maximum recommended value Maximum Grade - Temporary Road (%) 12.0 12.0 Maximum recommended value Haul Road Drainage Crossfall (%) 2.0 2.0 For temporary and permanent roads North American Lithium DFS Technical Report Summary – Quebec, Canada 199 Figure 12-4 – Single-lane in-pit haul ramp design. Figure 12-5 – Dual-lane in-pit haul ramp design. North American Lithium DFS Technical Report Summary – Quebec, Canada 200 A minimum mining width of 40 m has been applied in most areas and 20 m in some specific areas. Working widths are reduced in select instances, such as the final pit benches. A 60 m layback has been considered between the final pit and Lac Lortie. The pit design is not limited to the existing mining lease boundary. During the first three years of the LOM, mining will occur within the existing mining lease. Figure 12-6 present the final pit design in plan view. The in-pit haul road has been designed on the hanging wall side of the deposit to maximize ore recovery within the pit shell and to provide access for the final mining pushback. See Chapter 13 for more details regarding phases design within the ultimate pit. Figure 12-6 – Ultimate pit – plan view. 12.2.5 Plant Production For the conversion of mineral resources to Ore Reserves, it is necessary to consider and apply a variety of modifying factors. Those applicable to the Project are discussed in detail below.

North American Lithium DFS Technical Report Summary – Quebec, Canada 201 12.2.5.1 Metallurgical Recoveries ROM ore is subject to a variety of metallurgical recovery factors, once feed material enters the crusher. Metallurgical recovery varies according to the spodumene concentrate grade produced. Refer to Chapter 10 of this Report for additional details regarding these parameters. 12.2.5.2 Cut-Off Grade The breakeven cut-off grade (COG) is calculated considering costs for processing, G&A, and other costs related to concentrate production and transport. Table 12-7 presents the parameters used to determine the mill COG. Based on a 5.4% Li2O concentrate selling price of $1,273 USD/t, the COG would be 0.15% Li2O. However, due to metallurgical recovery limitations, a metallurgical COG of 0.60% Li2O was selected based on iterative analysis and to assure a feed grade that allows a sufficient metallurgical recovery to produce the required spodumene concentrate grade. Future mine planning work should evaluate the possibility of implementing a variable cut-off grade. This may prove beneficial with regards to the trade-off between stockpiling / wasting marginal ROM feed, versus blending this with higher-grade ore feed, which could potentially reduce the total material movement required to maximize processing capacity. Table 12-7 – COG calculation parameters. Parameter Units Value Recovery % 73.60 Gross 5.4% Li2O Price USD/t conc. 1,273.00 Concentrate Transportation Cost USD/t conc. 88.80 Royalties USD/t conc. 0.00 Net 6% Li2O Selling Price USD/t conc. 1,184.20 Concentrate Grade % 5.40 Exchange Rate USD/CAD 0.76 Processing Cost CAD/t milled 32.48 G&A Cost CAD/t milled 6.00 Calculated Cut-Off Grade % Li2O 0.15 Metallurgical Cut-Off Grade % Li2O 0.60 12.3 MINERAL RESERVE ESTIMATE The Mineral Reserves estimate was completed by BBA inc. (BBA) in March 2023, and is based on the block model prepared by BBA and used to report the Mineral Resources presented in Chapter 11 of this Report. North American Lithium DFS Technical Report Summary – Quebec, Canada 202 For the filing of this S-K §229.1304 compliant report, the original MRE was reviewed by Philippe Chabot, P.Eng., whom is the responsible QP for this section of the report. The North American Lithium (NAL) Mineral Reserves have been estimated for a total of 20.4 Mt of Proven and Probable Mineral Reserves at an average grade of 1.10% Li2O, which is comprised of 0.3 Mt of Proven Mineral Reserves at an average grade of 1.40% Li2O and 20.2 Mt of Probable Mineral Reserves at an average grade of 1.08% Li2O. Table 12-8 summarizes the Proven and Probable Mineral Reserves for the Project. The table shows the Li2O grade as well as the iron content, which is considered a contaminant at the processing plant. Table 12-8 – NAL Mineral Reserve Statement at effective date of December 31, 2023 based on USD $1,352/t Li₂O. North American Lithium Project Ore Reserve Estimate (0.60% Li2O cut-off grade) Category Tonnes (Mt) Grades (%Li2O) Cut-off Grade % Li2O Met Recovery % Proven Ore Reserves 0.3 1.40 0.60 73.6 Probable Ore Reserves 20.2 1.08 0.60 73.6 Total Ore Reserves 20.4 1.10 0.60 73.6 1. Ore Reserves are measured as dry tonnes at the crusher above a diluted cut-off grade of 0.60% Li2O. 2. Mineral Reserves result from a positive pre‐tax financial analysis based on a variable 5.4% to 5.82% Li2O spodumene concentrate average selling price of US$1,352/t and an exchange rate of 0.75 US$:1.00 C$. The selected optimized pit shell is based on a revenue factor of 0.6 applied to a base case selling price of US$1,352/tonne of concentrate. 3. Topographic surface as of December 31, 2022, and mining forecast and ramp-up data was used to adjust for December 31, 2023. 4. The reference point of the Mineral Reserves Estimate is the NAL crusher feed. 5. In-situ mineral resources are converted to Mineral Reserves based on pit optimization, pit design, mine scheduling and the application of modifying factors, all of which support a positive LOM cash flow model. According to SEC Definition Standards on Mineral Resources and Reserves, Inferred Resources cannot be converted to Mineral Reserves. 6. The waste and overburden to ore ratio (strip ratio) is 8.3. 7. The Mineral Reserves for the Project was originally estimated by Mélissa Jarry, P.Eng. OIQ #5020768, and subsequently reviewed by Philippe Chabot, P.Eng., who serves as the QP under S-K §229.1304. 8. Mineral Reserves are valid as of December 31, 2023. 9. Totals may not add up due to the rounding of significant figures. The Mineral Reserves are based on an updated concentrator feed strategy that includes ore coming from Sayona Quebec’s Authier Project. Ore coming from the Authier site will be combined with the NAL ore and fed to the crusher. The life-of-mine (LOM) production plan has been prepared to reflect the new blending strategy. The Project LOM plan and subsequent Mineral Reserves are based on a spodumene concentrate selling price of $1,352 USD/t of concentrate. The effective date of the Mineral Reserves estimate is December 31, 2023, and based on an exchange rate of $0.75 USD:$1.00 CAD. North American Lithium DFS Technical Report Summary – Quebec, Canada 203 Development of the LOM plan included pit optimization, pit design, mine scheduling and the application of modifying factors to the Measured and Indicated portion of the in-situ mineral resource. Tonnages and grades are reported as run of mine (ROM) feed at the crusher and are inclusive of mining dilution, geological losses, and operational mining loss factors. 12.4 PERMITTING & ENVIRONMENTAL CONSTRAINTS As a brownfield site, it was necessary to consider a range of existing permitting and environmental constraints already in place. This is necessary to ensure consistency with permit applications currently at the review / approval stage with government agencies. A list of the main permitting and environmental constraints considered for mine planning are presented in Table 12-9. Note that this list is not exhaustive; however, it presents those items of greatest potential impact. Table 12-9 – Environmental and/or permitting constraints affecting mineral reserves. Constraint Type Description / constraint Mining lease Permitting The mining operation footprint stays inside the mining lease for the first 3 years of the LOM plan only. It is assumed that a new mining lease will be obtained by 2026. ROM ore throughput Permitting 3,800 tpd measured at the entrance to the rod mill until July 2023 and then a ramp-up to 4,200 tpd in October 2023 Open pit offset from Lac Lortie Environmental/ Geotechnical Minimum 60 m set-back from Lac Lortie 12.5 ASSUMPTIONS AND RESERVE ESTIMATE RISKS The Mineral Reserve estimate has changed since the previous estimate published in the 2022 Prefeasibility Study, prepared by BBA. The previous estimate totaled 29.2 Mt. The model refinement for the NAL deposit enabled a more precise segregation between the spodumene-bearing pegmatites, and the high-Fe waste rock. This, in turn, has the combined effect of reducing the overall in-pit resource tonnage of Measured and Indicated tonnes (-54%), with a corresponding increase in Li2O grade (+22%). Overall, the resource pit shell contained Li2O metal for Measured, Indicated, and Inferred Resources decreased by 16%, which explains why the Mineral Reserves decreased to a total of 21.7 Mt. The site is a brownfield project since the open pit has been operated from 2012 to 2014 and then from 2017 to 2019. The site was then under care and maintenance until the operations restarted in Fall 2022 for mining operations and Q1-2023 for the processing activities. North American Lithium DFS Technical Report Summary – Quebec, Canada 204 The author is of the opinion that no other known risks, including legal, political, or environmental, would materially affect potential development of the Ore Reserves, except for those already discussed in this Report. 12.6 MATERIAL DEVELOPMENT AND OPERATIONS NAL's mining site restarted the pit operations with a first mass blasting in November 2022. The process plant did start-up in March 2023. As of December 31, 2023. production targets have been met. A drilling campaign was carried out in 2023 inside of the current pit with the aim of transferring the resources from the Inferred Category to the Indicated one. This zone has the potential to upgrade the current mineral resource estimate, however, with assay results still pending at the effective date of this report, this is not affecting the current mineral resource estimate. However, ramp-up mining operations have affected the mineral reserve estimate and this is reflected in the updated mineral reserve estimate presented in this Report in comparison with the one in the DFS.

North American Lithium DFS Technical Report Summary – Quebec, Canada 205 13. MINING METHODS The Project will be mined using a conventional open-pit drill-blast-load-haul cycle, with a 10 m bench height, for delivery of run-of-mine (ROM) ore from the open pit to the crusher. The Project was most recently operated from 2017 to early 2019 using a similar methodology. Historical underground openings are within the proposed open pit and mining in these areas will take place in the near term, necessitating particular consideration in detailed mine planning and operations. 13.1 MINE DESIGN 13.1.1 Pit Phasing Strategy To maximize the Project net present value (NPV), a series of six mining phases were developed, including the ultimate pit design. A set of pit shells were obtained from the optimization process inside the ultimate pit design, and they were used as a basis to guide the designs of the phases. Special attention was given to the historical underground openings when setting the physical limits for every phase, resulting in phase limits not precisely following the pit optimization shells. Additional care was taken to ensure that phase walls do not intersect these old workings. These phase designs were developed to define the mining sequence. The following criteria were used in the mine phase designs: • Minimum mining width of 60 m considered between phases on the surface and 40 m at the phase bottoms; • The Phase 1 design corresponds to the continuation of the previous mining operations in the southeastern part of the pit. In 2019, that area had already been mined to elevation 360 m; • Ease of access to different mining areas; • Mining and processing production rate; • Physical constraints posed by historical underground workings. Interne pit walls (i.e., pit walls that do not correspond to the ultimate pit) have been designed with single 20 m bench heights and 15 m catch bench widths, which will allow for shallower interim slopes. The mining phases are presented in Figure 13-1 to Figure 13-6. Phase 1 is located in the South-East area of the ultimate pit and aligns with the actual mined out limits of previous mining operations, which is already mined down to 360 m elevation. The final elevation for Phase 1 is 310 m. Phase 2 is located in the Northwest area of the pit, and the final elevation is 340 m. Phase 3 will connect Phases 1 and 2 in the central area of the ultimate pit, with the final elevation for this phase being 370 m. Phase 4 will mine through the historical underground openings and in the western part of the ultimate pit. In Phase 5, the Eastern area of the ultimate pit will be mined to the 350 m elevation. Phase 6 corresponds to the ultimate pit design and all remaining material. The material quantities for each phase are presented in Table 13-1. North American Lithium DFS Technical Report Summary – Quebec, Canada 206 Table 13-1 – Material quantities by phase1. Quantities Units Total Phase 1 Phase 2 Phase 3 Phase 4 Phase 5 Phase 6 Total In-Pit (Mt) 201.00 8.00 8.80 10.30 58.90 20.80 94.20 Waste Rock (Mt) 172.30 6.60 5.60 8.90 51.80 18.70 80.70 Overburden (Mt) 7.10 0.30 1.70 0.50 3.00 1.50 0.10 ROM Ore (Mt) 21.60 1.10 1.40 0.90 4.20 0.60 13.40 Lithium Grade (% Li2O) 1.08 1.10 1.14 0.99 1.09 0.82 1.09 Iron Grade (% Fe) 0.79 0.64 1.07 0.88 1.03 1.15 0.67 Strip Ratio (twaste : tore) 8.30 6.40 5.10 10.70 13.00 36.70 6.00 1 Totals may not add up due to rounding. Figure 13-1 – Isometric view of Phase 1. North American Lithium DFS Technical Report Summary – Quebec, Canada 207 Figure 13-2 – Isometric view of Phase 2. Figure 13-3 – Isometric view of Phase 3. North American Lithium DFS Technical Report Summary – Quebec, Canada 208 Figure 13-4 – Isometric view of Phase 4. Figure 13-5 – Isometric view of Phase 5.

North American Lithium DFS Technical Report Summary – Quebec, Canada 209 Figure 13-6 – Isometric view of Phase 6. 13.1.2 LOM Production Plan The key highlights of the LOM plan are summarized as follows: • Mine life of 20 years ending in 2042, • An overall strip ratio of 8.3, evolving over the years. • Total material movement peaking at 19.5 Mt in 2025 and then decreasing gradually until 2049, • At the beginning of March 2023, a total of 120 000 tonnes at an average grade of 1.16% Li2O was stockpiled on the crusher pad, • Crusher feed grade fluctuates from 0.96% Li2O to 1.25% Li2O on a yearly basis over the LOM (except last year), reaching its maximum value in Year 2038. A summary of the LOM plan is presented in Table 13-2 and Figure 13-7 below. This summary details the LOM plan for the NAL operation only and excludes the crusher feed portion from the Authier Lithium operation that will start in July 2025. The Authier Lithium ore will be delivered to the NAL ROM Pad. Views representing the zones mined per period are presented in Figure 13-8 to Figure 13-14, with the areas being mined during that period shown in blue. The elevations of main work areas are also visible on the figures. North American Lithium DFS Technical Report Summary – Quebec, Canada 210 Table 13-2 – LOM production plan and material movement. Physicals Units Production LOM 2023 2024 2025 2026 2027 2028 2029 2030 2031-2035 2036-2040 2041-2042 Total moved (Expit + Rehandle) (Mt) 13.3 18.3 19.5 17.2 15.7 15.9 15.2 15.9 46.5 25.4 3.7 207.5 Total Expit (Mt) 13.3 18.2 19.2 15.0 15.6 15.8 15.0 15.9 46.1 24.4 2.5 201.0 Expit waste rock (Mt) 9.2 15.3 17.5 13.4 13.5 13.3 14.1 14.8 40.3 19.2 1.6 172.3 Expit overburden (Mt) 2.7 1.0 0.6 0.6 0.6 1.6 0.0 0.0 0.0 0.0 0.0 7.1 Expit ore to ROMPad (Mt) 1.1 1.6 1.0 0.9 1.1 0.9 0.8 1.1 4.8 4.2 0.7 18.2 Expit ore to stockpile (Mt) 0.3 0.3 0.1 0.0 0.4 0.0 0.1 0.1 1.0 1.0 0.1 3.4 Stripping Ratio (twaste:tRoM) 8.7 8.8 15.8 14.5 9.5 16.6 16.0 12.5 7.0 3.7 1.9 8.3 Total expit ore (Mt) 1.4 1.9 1.1 1.0 1.5 0.9 0.9 1.2 5.8 5.2 0.8 21.6 Expit ore lithium grade (% Li2O) 1.1 1.1 1.0 1.0 1.1 1.2 1.0 1.0 1.0 1.1 1.3 1.1 Expit ore iron grade (% Fe) 1.1 0.8 1.0 1.0 1.0 1.0 0.9 0.7 0.7 0.7 0.5 0.8 Rehandle Reclaim from stockpile (Mt) 0 78,153 315,015 134,182 165 154,668 211,885 1,458 399,621 971,876 1,236,951 3,503,975 Reclaim lithium grade (% Li2O) 0.00% 0.78% 0.70% 0.59% 0.68% 1.06% 0.91% 0.57% 0.76% 1.01% 0.76% 0.84% Reclaim iron grade (%Fe) 0.00% 0.55% 0.67% 0.86% 1.49% 0.82% 0.91% 1.07% 0.75% 0.58% 0.67% 0.71% Processing Total crusher feed 1 (Mt) 1.1 1.6 1.4 1.1 1.1 1.1 1.1 1.1 5.2 5.2 2.0 21.7 Crusher feed lithium grade (% Li2O) 1.2 1.1 1.0 1.0 1.2 1.2 1.0 1.0 1.1 1.1 0.9 1.1 Crusher feed iron grade (% Fe) 1.0 0.8 0.9 0.9 1.0 1.0 0.9 0.7 0.7 0.7 0.6 0.8 Total rod mill feed (Mt) 944,691 1,425,690 1,173,601 912,442 912,442 912,442 912,442 912,442 4,562,210 4,542,210 1,761,757 18,972,369 Rod mill lithium grade (% Li2O) 1.26 1.22 1.05 1.06 1.33 1.27 1.05 1.13 1.15 1.22 0.99 1.16 North American Lithium DFS Technical Report Summary – Quebec, Canada 211 Figure 13-7 – LOM Summary. North American Lithium DFS Technical Report Summary – Quebec, Canada 212 Figure 13-8 – 2023 mined area isometric view. Figure 13-9 – 2024 mined areas isometric view.

North American Lithium DFS Technical Report Summary – Quebec, Canada 213 Figure 13-10 – 2025 mined areas isometric view. Figure 13-11 – 2030 mined areas isometric view. North American Lithium DFS Technical Report Summary – Quebec, Canada 214 Figure 13-12 – 2035 mined areas isometric view. Figure 13-13 – 2040 mined areas isometric view. North American Lithium DFS Technical Report Summary – Quebec, Canada 215 Figure 13-14 – Ultimate Pit isometric view. Storage piles have been designed to contain the waste rock and overburden material that will be mined over the LOM. These facilities are described in further detail in Chapter 15. 13.2 GEOTECHNICAL AND HYDROLOGICAL CONSIDERATIONS Geotechnical studies are currently ongoing with WSP-Golder to support mine operations. Water inflow and pumping requirements are only developed to a conceptual level and need to be updated according to the Hydrogeology Study update completed by WSP-Golder in December 2022. Operating costs may increase if additional mine pumping is needed. 13.3 MINE OPERATING STRATEGY Value engineering was carried out during previous operations and identified a need for smaller, more selective mining equipment. This will ensure that mining dilution and ore losses remain within acceptable limits for final product specifications. North American Lithium DFS Technical Report Summary – Quebec, Canada 216 To achieve minimal mining dilution and ore losses, mining operations must follow specific procedures, depending on the dyke width and physical properties. Some details are provided below. Typical blast patterns for pre-split, ore material and waste rock material that were developed during the 2017-2019 operations are described in Table 13-3 and were assumed for the current study. Blasting parameters will be adjusted as mining progresses in the pit according to the rock’s geo-mechanical properties and dyke configuration. Pre-split will be done on ultimate pit walls, using prepackaged emulsion. Pre-split holes will be drilled on double bench height (20 m) and have 89 mm diameter. Chapter 15 (Section 15.10.2) describes how explosives products and accessories will be brought on site and stored in the explosives magazines. The explosives will be loaded in the holes by the blasting contractor. Approximately 3.1 kt of explosives will be used on average every year. Blast patterns must be designed and sequenced to blast in a direction parallel to the dykes. The methodology used in the previous operations (2017-2019) is presented in Figure 13-15 and Table 13-4. Waste rock material will be excavated on 10 m benches, while ore will be mined on 5 m flitches or less, where operational considerations allow. Table 13-3 – Typical blast patterns. Description Units Pre-Split Ore pattern Waste pattern Bench Height m 20.0 10.0 10.0 Hole Diameter mm 89.0 114.0 171.0 Hole length m 22.0 11.0 11.0 Burden m - 3.3 4.8 Spacing m 1.5 3.3 4.8 Collar m - 2.5 3.5 Sub-drilling m 0.0 1.0 1.0 Powder Factor kg/m3 - 0.4 0.3

North American Lithium DFS Technical Report Summary – Quebec, Canada 217 Figure 13-15 – Section view of mining method. 13.4 MINING FLEET AND MANNING 13.4.1 Mine Equipment and Operations Mining will be conducted by a mining contractor for the first four (4) years of operation, and then by Sayona Quebec’s operations team and equipment fleet. The mining contractor is responsible for providing and maintaining all equipment required to supply ROM ore to the crusher. Table 13-4 describes the main mining equipment types and sizes that are planned, with their peak requirements. An additional fleet may be added or modified by the contractor, as needed, to support operations. As there are no power infrastructures in the pit actually, pumping will be carried out using diesel pumps, HDPE piping and generators in the first periods of operation, but mining costs include installation of electrical infrastructure to carry out the pit dewatering starting in the second half of 2023. North American Lithium DFS Technical Report Summary – Quebec, Canada 218 Table 13-4 – Mining equipment description and maximum number of units. Equipment Type Description Peak Requirement Mining truck Payload 92 t 16.0 Hydraulic excavator Bucket payload – 5 m3 1.0 Hydraulic excavator Bucket payload – 6.7 m3 5.0 Hydraulic excavator Bucket payload – 11 m3 1.0 Production drill DTH – 4” to 7” hole size 3.0 Track Dozer Net Power – 197 kW 1.0 Track Dozer Net Power – 265 kW 2.0 Road grader Net Power – 216 kW 1.0 Utility Excavator Net Power – 308 kW 1.0 Wheel Dozer Net Power – 249 HP 1.0 Water Truck/Sand spreader Capacity – 80 000L 1.0 Wheel Loader Bucket payload – 7.8 m3 1.0 Fuel & Lube Truck n/a 1.0 Service Truck n/a 1.0 Pick-Up Trucks n/a 12.0 Tower Lights n/a 8.0 13.4.2 Mine Personnel Requirements The mining contractor is responsible for providing all personnel required to carry out mining activities such as drilling, blasting, loading, and hauling material, for the four-year duration of its contract with the mine. Mining contractor personnel will include superintendents, mine supervisors, operators, drill-and- blast personnel, maintenance supervisors and mechanics. Starting in 2027, these positions will be filled by Sayona Quebec’s team. Sayona Quebec’s team will consist of technical services and management personnel for the duration of the entire operation. Key positions for the geology, mine engineering and administrative staff positions have already been filled. As of 2027, Sayona will hire the entire mining operations staff and personnel to operate the open pit, Including the maintenance and supervisory roles. During the LOM, the mine personnel requirement is estimated to reach a peak of 121 employees in the years 2027 to 2030, including 65 employees for operations, 36 for maintenance and 20 for technical services. 13.5 MINE PLAN AND SCHEDULE AS presented in Table 13-2, BBA has developed during the DFS a life-of-mine (LOM) mining schedule for the Project using the phases, stockpiles, and waste dumps designs. The LOM plan was developed using MinePlan Schedule Optimizer (MPSO). The key constraints and objectives considered for the LOM are summarized as follows: North American Lithium DFS Technical Report Summary – Quebec, Canada 219 • Starting date of LOM plan: January 1, 2023; • Rod mill feed supply start at 1,600 tpd in March 2023 and gradually increased to reach 3,900 tpd in December 2023; • In January 2024, the ROM supply from NAL will be 4,200 tpd until the Authier Lithium project starts producing and transporting ROM; • Maximum annual mining capacity of 20 Mt; • Maximum bench sinking rate of eight (6) 10-m benches per phase per year; • Maximum ore stockpiling capacity: o Low grade (LG, 0.6% Li2O to 0.8% Li2O) stockpile: 700,000 tonnes; o ROM pad (ROMPad) area (>0.8% Li2O): 300,000 tonnes. • It is considered that all ore is either: o dumped on the ROM Pad and rehandled for blending purposes to feed to the crusher, or; o stockpiled on the LG stockpile to be reclaimed later. As of December 31, 2023, there are no substantial changes to these constraints and objectives. North American Lithium DFS Technical Report Summary – Quebec, Canada 220 14. PROCESSING AND RECOVERY METHODS The recovery methods for the Project were established based on the existing plant, historical operational data, metallurgical testwork as described in Chapter 10, and equipment information from suppliers. Process improvements to the North American Lithium (NAL) flowsheet are based on the operational and metallurgical reviews of the past process plant operation and testwork data. The work completed established the design basis of the plant, capital costs, and operating costs that were developed in this Feasibility Study. 14.1 PROCESS DESIGN CRITERIA After having been placed on care and maintenance in early 2019, NAL recently restarted concentrator operations in Q1 2023. The plant will initially process lithium-bearing pegmatite ore from the NAL mine. When the Authier mine comes into operation in 2025, the NAL concentrator will process a blend of ore from the NAL deposit and the Authier mine to produce a spodumene concentrate ranging in grade from 5.40 to 5.82% Li2O. The run of mine (ROM) ore from Authier will be transported to NAL and processed through the NAL mill during the 18 years of Authier mine operation. During the Authier life of mine (LOM), the NAL crushing plant will be fed based on a 33% Authier / 67% NAL blend ratio. Several process improvements were incorporated into the crushing plant and concentrator flowsheets in the past year with the objectives of increasing throughput and ensuring production of high quality spodumene concentrate. Modifications to the plant include: • Modifications to the dump pocket and installation of an apron feeder ahead of the primary crusher; • The addition of an optical sorter in parallel to the existing secondary sorter; • The installation of two additional stack sizer screens; • The addition of a low-intensity magnetic separator (LIMS) prior to wet high-intensity magnetic separation (WHIMS); • The addition of a second WHIMS in series with the existing unit prior to flotation; • Upgrading the existing high-density/intensity conditioning tank; • Installing a higher capacity spodumene concentrate filter. Other modifications to the process are still being developed such as: • The addition of a crushed ore storage dome to increase ore retention capacity. The crushed ore pile will feed the rod mill feed conveyor during periods of crushing circuit maintenance.

North American Lithium DFS Technical Report Summary – Quebec, Canada 221 The concentrator will have a 6-month ramp-up period to achieve the initial targeted throughput of 3,800 tpd (rod mill feed). During this period only material from NAL will be processed in the mill. The concentrator already has the operation permits for a throughput of 3,800 tpd and procedures for increasing their mill throughput operating authorization to a maximum of 4,500 tpd is underway. The current mass balance is based on nominal rod mill feed of 175 tph or 4,200 tpd. This will lead to a design production of 184,511 tpy (dry) of spodumene concentrate at 5.82% Li2O. In the first four years of operation, the plant will target a concentrate grade of 5.40% Li2O and then, in 2027, it will reach the design grade of 5.82%. Table 14-1 presents the summary of concentrate grades and recoveries over the LOM: Table 14-1 – Grade and recoveries over LOM. Year Concentrate Grade (% Li2O) Recovery (% Li2O) 2023-2026 5.4 72.0 (Avg. NAL only and NAL/Authier blend) 2027-2042 5.8 66.3 Total (avg.) 5.7 67.4 Concentrate will be trucked to Val-d’Or and then transloaded onto rail cars. From Val-d’Or, concentrate will be railed to the Port of Québec, where it will be off-loaded and stored prior to being loaded into sea vessels. At design condition, the crushing plant will process 1.557 Mtpy of ROM ore and the concentrator will process 1.426 Mtpy of ore, or the equivalent of a daily maximum throughput of 4,200 tpd rod mill feed at 93% availability. The optical sorters will reject approximately 131,707 tpy of material. The crushing circuit availability is 65%. At an average design crusher feed head grade of 1.04% Li2O, concentrate production is estimated at 184,511 tpy at 5.82 % Li2O, equivalent to 22.65 tph. The lithium recovery is estimated at 66.3%. 14.2 PROCESS FLOWSHEET AND DESCRIPTION 14.2.1 Concentrator Production Schedule The mines are scheduled to produce an average rate of 4,588 tpd of blended ore, composed of 33% Authier ore and 67% NAL ore. The crushing and sorting area of the plant, which includes primary, secondary, and tertiary crushing and screening, as well as ore sorting, is designed to operate with an availability of 65%. From the crushed ore storage silo, 4,200 tpd at 93% plant availability are then fed to the concentrator, which includes grinding mills (one rod mill and one ball mill), desliming, magnetic North American Lithium DFS Technical Report Summary – Quebec, Canada 222 separation and flotation circuits, which make up the concentrator portion of the plant. The concentrator will operate on a 24-hour per day and 7 days per week basis. For the crushing plant and concentrator, operation crews will work on the basis of 12-hour shifts. There will be four shift crews rotating on a 7-day (on/off) schedule. The remaining process plant maintenance personnel will work 8-hour shifts on a 5 2 (on/off) basis. 14.2.2 Concentrator Operating Design Parameters Table 14-2 presents an overview of the main design criteria factors employed. Table 14-2 – General process design criteria – concentrator. Criterion Unit Value General Design Data Process Plant Operating Lifetime y 20 Crushing Plant Availability % 65 Crushing Operating Hours Per Year h 5,694 Concentrator Availability % 93 Concentrator Operating Hours Per Year h 8,147 Total ROM Mine Feed tpy 1,557,397 Total Concentrate Production tpy 184,511 Concentrate Design Grade % Li2O 5.82 Lithium Recovery Data Overall Crushing and Sorting Lithium Recovery (A) % 96.5 Ore Sorting Waste Rejection % 50.0 Desliming and WHIMS Lithium Recovery (B) % 88.5 Flotation Lithium Recovery (C) % 77.6 Overall Lithium Recovery (Concentrator) (A×B×C) % 66.3 Crushing Plant Feed ROM Dilution % 10.1 ROM Mine Grade (excluding dilution) % Li2O 1.15 ROM Mine Grade (including dilution) % Li2O 1.04 Feed Tonnage tph 274 Concentrator Feed Ore Feed to Rod Mill tph 175 Ore Feed to Rod Mill Per Year tpy 1,425,690 Rod Mill Feed Grade % Li2O 1.10 Concentrate Production Concentrate Production tph 22.65 Concentrate Grade (target) % Li2O 5.82 Concentrate Iron Content (target) % Fe < 1.00 Concentrate Humidity % H2O 8 14.2.3 Concentrator Facilities Description The NAL process facilities are comprised of: North American Lithium DFS Technical Report Summary – Quebec, Canada 223 • A crushing circuit, incorporating primary, secondary, and tertiary crushers with primary and secondary screens and ore sorting; • A grinding circuit, combining a rod mill in open circuit and a ball mill in closed circuit. • Attrition scrubbing and desliming; • Magnetic separation, combining a LIMS and two WHIMS in series; • A flotation circuit, which is comprised of rougher and scavenger cells, followed by three stages of cleaning. Figure 14-1 is a simplified process flow diagram of the concentrator facilities. The following sections describe the flowsheet in more detail. Figure 14-1 – Simplified process flowsheet – concentrator. 14.2.3.1 Primary Crushing The primary crushing system includes an apron feeder to the jaw crusher. The apron feeder is sized at 6,100 mm × 1,219 mm for a daily throughput of 4,588 tpd. The crusher selection is based upon a feed North American Lithium DFS Technical Report Summary – Quebec, Canada 224 size of 309 mm and a product (P80) of 94 mm, with an expected utilization of 65%. The jaw crusher is equipped with a 149 kW motor. 14.2.3.2 Secondary Crushing A two-deck vibrating screen, with a nominal feed size (F80) of 94 mm, receives the jaw crusher product. The top deck opening is 75 mm, and the bottom deck opening is 20 mm. The top deck oversize, with P80 of 119 mm, is directed to the primary ore sorter and the bottom deck oversize, with P80 of 59 mm, is directed to the two secondary ore sorters. The screen undersize, with P80 of 13 mm, will go directly to the tertiary crusher; the accepted material from the primary and secondary sorting will report to the secondary crusher. The primary and secondary ore sorters receive feed with a Li2O grade of 1.04%. All three sorters have a waste rejection estimated at 50% and will upgrade the ore to approximately 1.10% Li2O. The reject grade is estimated at 0.43% Li2O. The secondary cone crusher product (P80 of 24 mm) is fed to the secondary vibrating screen. The screen has three decks and divides the feed into an oversize that reports to the tertiary crusher, and undersize that is sent to the fine ore storage silo that supplies the grinding circuit. The tertiary short-head cone crusher reduces the feed from the screen oversize to a product size P80 of approximately 9 mm that is then sent to the fine ore storage silo. The crushing circuit lithium recovery, including sorting, is 95.6%. 14.2.3.3 Grinding The grinding circuit consists of an open-circuit rod mill followed by a ball mill in closed circuit with stack sizer screens. The rod mill has an installed power of 970 kW, reducing the feed from a P80 of 13,000 µm to 1,050 µm, with a nominal feed rate of 4,200 tpd. The product of the rod mill is sent to six stack sizer screens, which divide the stream into an oversized product having a P80 of 970 µm, which is discharged to the ball mill, and an undersized product having a P80 of 200 µm, which is discharged to desliming. The ball mill reduces the screen oversize and then sends the product back to the screens for classification. 14.2.3.4 Desliming and WHIMS Circuit The undersize from the grinding area screens is sent to the first stage of desliming, which consists of 17 operating cyclones plus two on stand-by. The overflow cut size (D50) of the cyclones is 10 µm. The cyclone

North American Lithium DFS Technical Report Summary – Quebec, Canada 225 underflow passes through an intermediate stage of attrition scrubbers to clean the mineral surfaces, before the second stage of desliming cyclones. There are six attrition scrubbers, each with a volume of 13 m3; the retention time is approximately 16 minutes with a nominal flowrate of 206 m3/h. The attrition scrubber discharge is processed in a LIMS unit to remove ball mill chips. By removing the ball mill chips, the risk of clogging the two WHIMS downstream is mitigated. A density meter is included to control the process water addition to the pump box feeding the LIMS. Slurry density is adjusted based on the incoming flow to ensure the LIMS is operated at its most efficient volumetric capacity. The feed will be diluted to a slurry density of approximately 29% (w/w). One double-drum counter-rotation wet LIMS will be required to handle the throughput. Each unit will provide a magnetic field strength of 950 gauss. The non-magnetic slurry stream from the LIMS will report to two identical 13,000 gauss WHIMS units in series, where iron-bearing silicate minerals will be rejected to the magnetics stream. The magnetic waste stream from each WHIMS is sent directly to the tailings thickener. The non-magnetic concentrate is sent towards the second stage of desliming cyclones, which consists of eight operating cyclones plus two kept on stand- by. The cyclone overflow, at a target density of 2.85%, is returned to the first stage of desliming. The cyclone underflow proceeds to the flotation circuit at a solids density of approximately 55%. The lithium recovery is 88.5% from the desliming and WHIMS circuit. 14.2.3.5 Flotation Circuit The deslimed stream is conditioned in a high-density conditioning tank through intense mixing and the addition of chemical reagents. The retention time is 16.4 minutes with a nominal slurry flowrate of 176 m³/h. The conditioned ore is floated to produce a spodumene concentrate containing at least 5.82% Li2O after three stages of cleaning. A rougher dilution tank is used after the high-density conditioning tank dilutes the slurry to a solids density of 32% prior to entering the rougher cell bank, which consists of three 30 m3 tank cells. Rougher flotation is followed by scavenger flotation, consisting of three 30 m3 tanks. The concentrate is sent to a 3-stage flotation cleaning circuit. The rougher scavenger tailings will be collected in a pump box and pumped to the tailings cyclone. The first cleaners consist of 18 conventional, flotation cells, each with a capacity of 8.5 m3. A nominal slurry feed rate of 200 m3/h is fed through the first cleaners. The first cleaner concentrate will report to the second stage of the cleaning circuit. The first cleaner tailings will be collected in a pump box and pumped to the tailings cyclone. The second cleaners consist of 13 conventional, flotation cells, each with a capacity of 5.1 m3. The tailings from the second stage cleaner circuit are recirculated to the first cleaners. North American Lithium DFS Technical Report Summary – Quebec, Canada 226 The third cleaners consist of 19 conventional cells, each with a capacity of 2.8 m3. The tailings from the third bank are recycled to the second cleaner circuit. The concentrate grade is expected to be 5.82% Li2O. The recovery of lithium in the flotation circuit is estimated to be 78.4%. The third cleaner concentrate is sent to a concentrate storage tank, equipped with an agitator, where it is stored before it is dewatered using a belt filter, recovering a concentrate with a moisture content of approximately 8% by weight. The spodumene concentrate is sent to a concentrate storage dome prior to being loaded onto trucks and transported for sale. 14.2.3.6 Tailings Disposal and Management The tailings from the spodumene concentrator will be collected in the final tailings tank prior to reporting to the tailings pond. The scavenger and first cleaner tailings are pumped to a dewatering cyclone. The dewatering cyclone underflow, containing 117 tph solids at a solids density of 48.9%, reports directly to the final tailings tank at a flow rate of 167 m3/h. The dewatering tailings cyclone overflow is combined with the first desliming cyclone residue, LIMS rejects and WHIMS rejects, and is pumped to an 18.3 m diameter, steel-constructed thickener. The thickener underflow, containing 34.8 tph solids at a solids density of 50%, will be pumped to the final tailings tank at a flow rate of 47.7 m3/h. The tailings thickener overflow is returned to the process water tank. 14.2.3.7 Tailings Filtration (2025) Tailings from the final tailings tank are pumped to the agitated filter feed tank, which acts as a buffer between the lithium recovery process and the tailings filtration circuit. The slurry is then pumped to the tailings filter presses. The filtration plant consists of two recessed plate filter presses (one in operation, one on standby). The presses operate in a cycle consisting of filter closing and clamping, filter feed and compacting, blowing of the cake, cake discharge, and finally filter cleaning. The filters bring the moisture content of the filter cake below 15%. Filtrate and wash water are collected and pumped to a clarifier. Part of the clarifier overflow is sent to a buffer tank that feeds a multi-media filter to be re-used as filter wash water and gland seal water in a closed loop, while the excess is sent to the process water tank. The filter cake is dropped onto an underlying conveyor, sending the material to the tailings discharge conveyor. The discharge conveyor extends outside the plant building to stockpile the tailings. Tailings are then loaded onto trucks and transported to the dry tailings facility. North American Lithium DFS Technical Report Summary – Quebec, Canada 227 14.2.4 Concentrator Consumables The main consumables for the concentrator are the grinding media and liners for the two mills as well as the reagents used in the flotation circuit and thickener. All process reagents are contained in a separate area within the process plant building to prevent any contamination of any surrounding areas in case of a spill. Safety showers are provided in the different reagent mixing and utilization areas in case of contact with the reagents. Grinding media will be stored in pits located indoors and near their points of use. The primary reagents used in the process include collector, dispersant, soda ash and flocculant. Consumption rates are mostly based upon results from flotation testwork. Table 14-3 and Table 14-4 list all reagents, media, areas of usage and their purpose. Table 14-3 – Concentrator reagents. Reagent Area Use Consumption (tpy) Collector (Custofloat 7080) Rougher and Scavenger Flotation Collecting agent 1,118 Dispersant (F220) Attrition scrubber cleaner flotation (1st, 2nd, 3rd stages) Prevent fine particle aggregation 354 Soda ash (Na2CO3) High density conditioning tank pH control 181 Flocculant (Flomin 920) Thickener Flocculate solids to assist in solid/liquid separation 61 Table 14-4 – Grinding media. Media Area Consumption (tpy) Rods (75 mm diameter) Rod mill 949 Balls (50 mm diameter) Ball mill 849 The collector reagent (Custofloat 7080) is delivered in 20 t tanker trucks. The collector is added to the high-density conditioning tank, the scavenger dilution tank and the third cleaners for use in the rougher and scavenger flotation circuits. The dispersant reagent (F220) is delivered in solid form in bulk bags of 600 kg. The dispersant is put in solution in the dispersant mixing tank. It is primarily added to the attrition scrubber and the second and third cleaners. The soda ash is delivered bulk in a powder form, unloaded to a storage silo. Two mixing tanks (one operating, one stand-by in alternance) produce a soda ash solution to be used for pH control in the high- density conditioning tank. North American Lithium DFS Technical Report Summary – Quebec, Canada 228 The flocculant is received in solid form in 25 kg bags. The flocculant is first pre-mixed with fresh water in the flocculant mixing tank. The mixing tank is paired with a distribution tank that holds the pre-mixed solution. An in-line mixer is used to further dilute the flocculant solution prior to reaching the addition point. It is added to the tailings thickener feed box. 14.2.5 Concentrator Process Water The tailings thickener overflow is recovered and used as process water. Make-up water will be required to ensure the process plant requirement. For this study, the make-up water source is assumed to be returning from the tailings pond. 14.2.6 Concentrator Personnel A total of 86 employees are required in the concentrator (28 salaried staff and 58 hourly workers) assuming management, operations, and maintenance functions. Table 14-5 and Table 14-6 present the salaried and the hourly manpower requirements, respectively, for the concentrator. These values are specified by NAL as their staffing plan for the plant restart. Table 14-5 – Concentrator salaried manpower. Position Number of Employees General Manager 1 Chief Metallurgist 1 General Foreman 1 General Operations Foreman 1 Administrative Assistant 1 Supervisor – Operation 4 Supervisor – Mechanical 1 Supervisor – Electrical 1 Engineering and Operations Director 1 Optimization Director 1 Project and Improvement Coordinator 1 Engineering Coordinator 1 Technician – Metallurgy 1 Technician – Process 2 Engineer – Mechanical 1 Engineer – Electrical 1 Medium term Planning Engineer 1 Senior Mechanical Engineer 1 Senior Metallurgist 3 Plant Planner 1 Junior Engineer 1 Plant Technical Expert 1 Total – Salaried 28

North American Lithium DFS Technical Report Summary – Quebec, Canada 229 Table 14-6 – Concentrator hourly manpower. Position Number of Employees Control Room Operator 4 Crushing Operator 4 Crushing Operator Assistant 7 Grinding Operator 4 Grinding Utilities Operator 3 Flotation Operator 4 Flotation Operator Assistant 4 Concentrator Samplers 3 Mechanical Maintenance Lead 2 Mechanic 15 Electrical Technician 6 Building Maintenance Operator 1 Piping Operator 1 Total – Hourly 58 14.2.7 Utilities 14.2.7.1 Electricity The electricity to the concentrator will be supplied by Hydro-Québec. 14.2.7.2 Fuel – Natural Gas The plant is currently heated with natural gas supplied by Énergir. The supply pipeline to the plant site was installed in 2014. The nominal natural gas consumption for heating the crusher building is 52,470 m3/month. NAL has confirmed it has concluded a contract with Énergir, a natural gas distributor in Québec, for an assured supply of 3,400 m3/h. This is the maximum that can be secured due to limitations in the regional distribution network. Peak winter loads are expected to exceed the assured supply. Énergir has indicated that they are investigating ways to expand the network’s capacity. Should the network expansion not materialize, peak loads could be satisfied by adding a LNG make-up system or by segregating loads and running part of the plant, especially heating, off the existing propane supply. North American Lithium DFS Technical Report Summary – Quebec, Canada 230 14.3 PRODUCTS AND RECOVERIES The concentrator will have a 6-month ramp-up period to achieve the initial targeted throughput of 3,800 tpd (rod mill feed). During this period only material from NAL will be processed in the mill. The concentrator already has the operation permits for a throughput of 3,800 tpd and procedures for increasing their mill throughput operating authorization to a maximum of 4,500 tpd is underway. The current mass balance is based on nominal rod mill feed of 175 tph or 4,200 tpd. This will lead to a design production of 184,511 tpy (dry) of spodumene concentrate at 5.82% Li2O. In the first four years of operation, the plant will target a concentrate grade of 5.40% Li2O and then, in 2027, it will reach the design grade of 5.82%. Table 14-7 presents the summary of concentrate grades and recoveries over the LOM: Table 14-7 – Grade and recoveries over LOM. Year Concentrate Grade (% Li2O) Recovery (% Li2O) 2023-2026 5.4 72.0 (Avg. NAL only and NAL/Authier blend) 2027-2042 5.8 66.3 Total (avg.) 5.7 67.4 Concentrate will be trucked to Val-d’Or and then transloaded onto rail cars. From Val-d’Or, concentrate will be railed to the Port of Québec, where it will be off-loaded and stored prior to being loaded into sea vessels. At design condition, the crushing plant will process 1.557 Mtpy of ROM ore and the concentrator will process 1.426 Mtpy of ore, or the equivalent of a daily maximum throughput of 4,200 tpd rod mill feed at 93% availability. The optical sorters will reject approximately 131,707 tpy of material. The crushing circuit availability is 65%. At an average design crusher feed head grade of 1.04% Li2O, concentrate production is estimated at 184,511 tpy at 5.82 % Li2O, equivalent to 22.65 tph. The lithium recovery is estimated at 66.3%. 14.4 RECOMMENDATIONS Testwork on blended composite and variability samples was undertaken to support the DFS process design. Testwork has shown that metallurgical performance is strongly influenced by grind size, host rock type, and lithia and iron grades in the run-of-mine ore. For this reason, attention should be made to manage ROM feed grade fluctuations to allow stable operation of the process plant. The following should be considered: North American Lithium DFS Technical Report Summary – Quebec, Canada 231 • Further metallurgical testwork are recommended such as: o Assessment of the impact of dilution and head grade on metallurgical performance. More detailed variability (Authier and NAL ore) testwork should be performed to produce a recovery model based on feed characteristics. o Mineralogy and liberation analysis should be completed around the flotation circuit to investigate potential optimization opportunities. • Testwork showed metallurgical performance is strongly sensitive to grind size. High attention should be given to the operation of crushing and grinding circuits to ensure optimal grind size is achieved. • The mine plan showed variability in iron content of the ROM material. An operational strategy should be developed for ore sorter and WHIMS operation to minimize lithium losses while attaining the desired concentrate quality. • Continue filtration testing to confirm the design of the tailings filtration plant. Optimize the filter plant layout based on the selected technology. North American Lithium DFS Technical Report Summary – Quebec, Canada 232 15. INFRASTRUCTURE The North American Lithium (NAL) property is located 60 km to the north of the city of Val-d’Or and 35 km to the southeast of the city of Amos. The Project is readily accessible by the national highway and a high-quality rural road network. The current site infrastructures include: • Open pit. • Processing plant and ROM ore pad. • Waste rock (1) and Overburden (1) piles. • Conventional tailings pond (TSF-1). • Administration facility, including offices and personnel changing area (dry). • Workshop, tire change, warehouse, and storage areas. • Fuel, lube, and oil storage facility; and • Reticulated services, including power, lighting and communications, raw water and clean water for fire protection, process water and potable water, potable water treatment plant, sewage collection, treatment, and disposal. Proposed new site infrastructure includes: • Expansion of the open pit. • Expansion of the current mine garage. • Crushed ore dome. • Dam raise of the current tailings storage facility. • Upgrade to the processing plant, including additional ore sorter, crushed ore dome, crushing circuit upgrade, dedusting, additional wet high-intensity magnetic separator (WHIMS), additional low-intensity magnetic separator (LIMS), new high intensity conditioning tank, new concentrate belt filter and new tailings filtration plant. • Additional tailings management facilities, including dry-stacked tailings area (TSF-2), tailings filter plant, access roads, and associated water management infrastructure. • Additional waste pile area, access roads and associated water management infrastructures; and • Relocation of the fuel, lube, and oil storage facility. A preliminary site layout has been prepared that considers the operational requirements for the site, light and heavy vehicle traffic flows, site access, pit access, water management, environment infrastructure locations, and stockpiles. Figure 15-1 shows the overall site layout and offers a general overhead view of existing and new infrastructure required to manage mine waste and impacted water.

North American Lithium DFS Technical Report Summary – Quebec, Canada 233 Figure 15-1 – NAL Projected project site layout at end of life of mine. 15.1 ACCESS ROADS 15.1.1 Public Roads The site can be accessed by existing public roads, Route 111, and Route du Lithium from the municipality of Barraute, 17.2 km away, via chemin du Mont-Vidéo and Route du Lithium. From Route du Lithium, there are multiple small access roads that can lead into the pit area. These access roads have been blocked and their access will be controlled during blasting operations. North American Lithium DFS Technical Report Summary – Quebec, Canada 234 15.1.2 Site Roads Existing roads connect the various site service buildings and provide passage for heavy trucks between the pit, the crusher, the waste rock dumps, and the truck maintenance shop. New haul roads will be built to link the following: • Pit to the south side of WRP-3, passing south of the concentrator and the new Overburden Pile No. 2 (OBP-2). • Concentrator area to the new filter plant, located southeast of TSF-2; and • Site Preparation and Pads General site preparation will consist of clearing, grubbing, topsoil and overburden removal, rock excavation, backfilling, and surface leveling for all new site infrastructures. The existing site topography was based on past LiDAR information and orthophotos from 2017 and 2018, respectively. A general overview of the NAL site, showing the general location of site infrastructures, can be found in the general arrangement plan in Figure 15-1. Site drainage will be realized with the construction of drainage ditches, ponds, and pumping stations, as described in Section 15.7.3. Since most of the site is already developed, new gravel pads will only be built to accommodate the mine refueling station, laydown area, and the filter plant. 15.1.3 Private Radio Antenna A private radio antenna (telecom tower) is currently operated on an adjacent property (lot 6,242,657), located along and south of the Route du Lithium and northwest of the NAL mine site. The antenna is owned by Radio Nord Communications Inc. (RNC Media), which has legal surface rights for industrial activities through a public land lease contract with Ministry of Energy and Natural Resources (MERN, now MRNF). An agreement has been concluded between NAL and RNC Media in regard to the construction of infrastructures related to WRP-3. A segment of the peripheral drainage ditch, northwest of WRP-3, and a short access trail to basin BO-12, will encroach on the RNC Media site. The terms and conditions of the agreement include site access protocols, health and safety aspects, maintenance of infrastructures, and site restoration at the end of the life of mine (LOM). North American Lithium DFS Technical Report Summary – Quebec, Canada 235 15.1.4 Rail The main Canadian National (CN) railway line runs through Barraute, a CN section town, and passes approximately 11 km to the north of the Property. A spur line serviced the Property during the period of historic production, but all tracks were removed after Québec Lithium Corporation ceased operations in 1965. The rail right-of-way has since become overgrown, but the rail bed is still in excellent shape. 15.2 ELECTRICAL POWER SUPPLY AND DISTRIBUTION 15.2.1 Site Electrical Utility Supply Power for the Project is taken at 120 kV from transmission line No. 1301, running between the Figuery and Val-d’Or substations, which is owned by the provincial utility company, Hydro Québec. This transmission line runs on the west side of the Project site and the spur feeding the plant is approximately 600 m long. 15.2.2 Site Electrical Distribution The electrical power demand of the Project is approximately 11.4 MW. The plant's outdoor substation steps down the incoming voltage to 13.8 kV, which is used to power up the different transformers, all located indoors, further stepping down the voltage to 4.16 kV and 600 V, two voltage levels at which process equipment is operated. Sayona Quebec is in the process of purchasing a new larger 120/13.8 kV transformer to meet future needs and improve reliability. The power distribution to the process equipment is through armored cables installed in cable trays. 15.2.3 Emergency Power Supply In the event of a power failure, emergency power for operating critical equipment is provided by a single 4.16 kV, 1,400 kW emergency stand-by generator. The generator is connected to the main 4.16 kV switchgear to back feed the 13.8 kV switchgear during emergency operations. This configuration allows emergency power to be routed to any load in the plant. All switching is done manually, with interlocks in place to prevent unsafe operations. North American Lithium DFS Technical Report Summary – Quebec, Canada 236 15.3 FUEL STORAGE There are two fuel stations at the site: • A gasoline station near the garage with a 2,359 L capacity tank dedicated to light vehicles. • A three-tank diesel station for heavy equipment located near the pit operations. The capacity of each tank is 50,000 L. For security purposes this station will be moved to the intersection of the road to the crusher and the road to WRP-2. 15.4 NATURAL GAS AND PROPANE Propane tanks are located in two areas on the site: • A station near the plant at the south side with two tanks of 2,000 L each. This station is used to heat a part of the plant. • A station on the west side of the plant with two tanks of 50,000 L each. This station is used to heat a part of the plant and the kiln when running. A 30 km natural gas line was built while the Project was under CLQ; natural gas would be supplied from Énergir’s Abitibi network. The line runs to the site and the connection will be completed for the operations restart. The expected annual supply is 25.4 Mm3 at a delivery pressure of 490 kPa with the maximum flow limited to 3,400 m3/h in the wintertime. Only the distribution substation must be built to completely connect to the regional natural gas distribution network. 15.5 WATER SUPPLY 15.5.1 Water Reclaim System and TSF Level Control The Project has no infrastructures in place to draw water from any external source for processing purposes. Groundwater and run-off from the mine pit will be recovered for use as fresh water in the process plant. Water from rain or other sources is recovered and sent to the TSF-1. Surface runoff from WRP-2 is sent to a distinct sedimentation basin. All water used in the concentrator is recycled internally or is reclaimed from the TSF-1, whose levels must be managed seasonally.

North American Lithium DFS Technical Report Summary – Quebec, Canada 237 15.5.2 Water for Fire Protection Water for fire protection is stored in the lower section of the process water tank. Water pumps feed the process plant fire water ring main and also supply fire water hydrants at the mine garage and at the administration building. Exterior sections of the fire water piping are buried below the frost line to prevent freezing. Supplementary hand-held fire extinguishers, each suited for its own specific area, are mounted throughout all buildings. No sprinkler system is installed in the prefabricated wood frame administration building. 15.5.3 Potable Water Potable water is supplied by a contractor who is responsible for managing bottled water supplies. 15.5.4 Sewage and Waste A complete sewage water plant with two septic tanks (20 m3 and 10 m3) were installed at the west end of the main building in the summer of 2022. These units will treat the wastewater from the concentrator, the new dry house, the main building, and the garage. The drain water is being discharged into a septic field. 15.6 ON/OFF AND ROM PADS BBA has developed a life-of-mine (LOM) mining schedule for the Project using the phases, stockpiles, and waste dumps designs. The LOM plan was developed using MinePlan Schedule Optimizer (MPSO). The key constraints and objectives considered for the LOM are summarized as follows: • Starting date of LOM plan: January 1, 2023. • Rod mill feed supply start at 1,600 tpd in March 2023 and gradually increases to reach 3,900 tpd in December 2023. • In January 2024, the ROM supply from NAL is 4,200 tpd until the Authier Lithium project starts producing and transporting ROM in July 2025. • Maximum annual mining capacity of 20 Mt. • Maximum bench sinking rate of eight (6) 10-m benches per phase per year. • Maximum ore stockpiling capacity: o Low grade (LG, 0.6% Li2O to 0.8% Li2O) stockpile: 700,000 tonnes. North American Lithium DFS Technical Report Summary – Quebec, Canada 238 o ROM pad (ROMPad) area (>0.8% Li2O): 300,000 tonnes. • It is considered that all ore is either: o Dumped on the ROMPad and rehandled for blending purposes to feed to the crusher, or. o Stockpiled on the LG stockpile to be reclaimed later. 15.7 TAILINGS STORAGE/DISPOSAL The following standards and regulations were used for the design of the new TSF-2 and WRP-3, as well as all their related water management structures: • Directive 019 specific to the mining industry in Québec. • Metal and Diamond Mining Effluent Regulations (MDMER) in Canada. • Loi sur la sécurité des barrages (The Dam Safety Law applied in Québec) (LSB) and the associated regulation (RSB). • The Dam Safety Guideline produced by the Canadian Dam Association (2007). • Manuel de conception des ponceaux (MTQ, 2004). • Règlement sur la santé et la sécurité du travail dans les mines, Loi sur la santé et la sécurité du travail – Québec (2014) (Québec health and safety regulations). • The Québec and/or the Canadian Legal framework applied to the environment and water sectors. 15.7.1 Tailings Storage Facility No. 2 (TSF-2) 15.7.1.1 TSF-2 Facility Location The new facility will be located to the west of the current TSF-1. The chosen location was optimized by BBA to respect the maximum elevation constraints of 479 m, which required a slight modification to the original footprint proposed by Sayona Quebec. The volume of waste rock to be stored in the facility needed to be adjusted in consideration of the optimization of the pit shell and the maximum capacity of WRP-3. The proposed final layout of TSF-2 is shown in Figure 15-2, which also shows the original footprint overlain onto the final configuration. The original selection of the proposed location has been defined as per the following steps: • Analysis of site characteristics based on aerial photos, LIDAR information, and regional land use information, which includes the identification of existing infrastructure such as electric lines, roads, forestry domains, and natural water bodies. North American Lithium DFS Technical Report Summary – Quebec, Canada 239 • Volumetric compliance for tailings and waste rock placement; the targeted volume from the PFS was around 19.2 Mm³ of tailings and 25.4 Mm³ of waste rock; and • Preliminary analysis of the environmental and social constraints of the selected deposition storage facility footprints. Figure 15-2 – Tailings Storage Facility No. 2 (TSF-2) layout. 15.7.1.2 Tailings Management Strategy The restart of operations at the NAL site by Sayona Quebec includes the existing TSF-1 that has some residual and potential future capacity. Also, the previous NAL operators included a secondary transformation process to make lithium carbonate, which generated additional residues. BBA first evaluated the volume remaining in TSF-1 and then the authorized capacity with the completion of the raise, which was started prior to the most recent closure of the NAL operations. Going forward, the operational assumption was that no secondary transformation is envisioned at this time, however the strategy proposed allows for possible secondary transformation should it be required in the future. Furthermore, ramp-up to 4,200 tpd mill production was ignored, providing some buffer North American Lithium DFS Technical Report Summary – Quebec, Canada 240 capacity for the TSFs. The assumed operational construct is illustrated in Figure 15-3 and Table 15-1, assuming that 546.5 tpd of concentrate and 3,653.5 tpd of residues will be produced. For TSF-2, Sayona Quebec has looked for a facility that can manage tailings produced at the concentrator and the possibility to store waste rock from the mine as well. The disposal strategy consists of using waste rock to construct peripheral berms and peripheral roads, thus confining filtered tailings within the waste rock cell. During the 20-year LOM, 78.3 Mm³ (loose volume) of waste rock and 19.2 Mm³ of tailings will be generated from which a total of 44.6 Mm³ is to be stored in TSF-2 (25.4 Mm3 of waste rock inside the TSF- 2 peripheral berms). The remainder of waste rock is destined to WRP-3, WRP-2 and various roads and pads. The quantity of tailings has been calculated by subtracting the average yearly spodumene production; data obtained from the new tests from the FS, from the concentrator’s direct ore feed, which is based on the new life of the mine. At the outset of start-up, conventional slurry may be deposited into TSF-1 without needing to complete the current raise. The TSF-2 operation starts at Year 1 and tailings will be contained within the entire facility footprint, never being more than 10 m below the rock perimeter berm. A new water management basin to the northeast of the facility will also be required. Deposition plans for each phase of deposition were not fully developed at the time of writing of this document. Figure 15-3 – Illustration of tailings production assumptions.

North American Lithium DFS Technical Report Summary – Quebec, Canada 241 Table 15-1 – Tailings yearly production and filling rate. Mine Plan - Updated Period Tonnages Volume Concentrate (to Transport) Produced Tailings (to TSF-1) Produced Tailings (to TSF-2) TSF-1 TSF-1 Cum. TSF-2 TSF-2 Cum. (tpd) (tpy) (tpd) (tpy) (tpd) (tpy) Tailings (m3) Tailings (m3) Tailings (m3) Tailings (m3) 1 546.5 199,473 3,654 1,333,528 0 0 1,025,790 2,325,790 0 0 2 546.2 199,363 3,654 1.333.528 0 0 1,025,790 3,351,581 0 0 3 10.8 3,942 535.7 195,523 3,653.5 1,333,535 150,402 3,501,983 833,459 833,459 4 10.8 3,942 535.7 195,523 3,653.5 1,333,535 150,402 3,652,386 833,459 1,666,919 5 10.8 3,942 535.7 195,523 3,653.5 1,333,535 150,402 3,802,788 833,459 2,500,378 6 10.8 3,942 535.7 195,523 3,653.5 1,333,535 150,402 3,953,191 833,459 3,333,837 7 10.8 3,942 535.7 195,523 3,653.5 1,333,535 150,402 4,103,593 833,459 4,167,296 8 10.8 3,942 535.7 195,523 3,653.5 1,333,535 150,402 4,253,996 833,459 5,000,756 9 10.8 3,942 535.7 195,523 3,653.5 1,333,535 150,402 4,404,398 833,459 5,834,215 10 10.8 3,942 535.7 195,523 3,653.5 1,333,535 150,402 4,554,800 833,459 6,667,674 11 10.8 3,942 535.7 195,523 3,653.5 1,333,535 150,402 4,705,203 833,459 7,501,133 12 10.8 3,942 535.7 195,523 3,653.5 1,333,535 150,402 4,855,605 833,459 8,334,593 13 10.8 3,942 535.7 195,523 3,653.5 1,333,535 150,402 5,006,008 833,459 9,168,052 14 10.8 3,942 535.7 195,523 3,653.5 1,333,535 150,402 5,156,410 833,459 10,001,511 15 10.8 3,942 535.7 195,523 3,653.5 1,333,535 150,402 5,306,813 833,459 10,834,970 16 10.8 3,942 535.7 195,523 3,653.5 1,333,535 150,402 5,457,215 833,459 11,668,430 17 10.8 3,942 535.7 195,523 3,653.5 1,333,535 150,402 5,607,618 833,459 12,501,889 18 10.8 3,942 535.7 195,523 3,653.5 1,333,535 150,402 5,758,020 833,459 13,335,348 19 10.8 3,942 535.7 195,523 3,653.5 1,333,535 150,402 5,908,423 833,459 14,168,807 20 10.8 3,942 535.7 195,523 3,653.5 1,333,535 150,402 6,058,825 833,459 15,002,267 21 10.8 3,942 535.7 195,523 3,653.5 1,333,535 150,402 6,209,228 833,459 15,835,762 22 10.8 3,942 535.7 195,523 3,653.5 1,333,535 150,402 6,359,630 833,459 16,669,185 23 10.8 3,942 535.7 195,523 3,653.5 1,333,535 150,402 6,510,032 833,459 17,502,644 24 10.8 3,942 535.7 195,523 3,653.5 1,333,535 150,402 6,660,435 833,459 18,336,104 25 10.8 3,942 535.7 195,523 3,653.5 1,333,535 150,402 6,810,837 833,459 19,169,563 LOM 489,502 7,164,089 30,671,300 5,510,837 19,169,563 2nd Transformation Tailings Total tailings production for 1st and 2nd year will go in TSF-1 while permitting for TSF-2 is settled. The final capacity is 5.5 Mm3 + current deposited tailings (1.3 Mm3) = 6.8 Mm3 A total of 19.2M m³ of tailings and 25.4M m³ of waste rock will be disposed in the facility over its lifetime. Even if the current DFS LOM plan has a 20-year mine life, the TSF-2 capacity can accommodate 25 years of production. Optimization of this facility remains possible and should be considered in detailed engineering. North American Lithium DFS Technical Report Summary – Quebec, Canada 242 15.7.1.3 Tailings Storage Facility Design The typical cross-section of tailings and waste rock is presented in Figure 15-4. Berms will be built to confine tailings within the surrounding waste rock. The deposition strategy for waste rock is planned to have sufficient available space in the cells to manage future tailings. Tailings will be transported by truck from the filter plant to the co-disposal storage facility. Figure 15-4 – General cross-section of the tailings and waste rock facility. All the waste rock and filtered tailings will be contained in this co-disposal storage facility, which was designed with the following parameters: • Rock perimeter berm final crest (7 m). • Final overall slope angle (2.5H:1V). • Height difference between tailings and waste rock (10 m). • Ramp width, 12.0 m, or 20.1 m, depending on the mining truck to be used. This is to be defined at a later stage of the Project. • Access ramp maximum slope (10%). • Dry tailings density (1.6 t/m³). • Waste rock and tailings are considered NPAG and non-leachable. • In-place waste rock density in the waste pile (2.3 t/m3). • This pile has a footprint of approximately 90 ha and a maximum height of ±85 m. Table 15-2 summarizes the total volumes of waste rock and filtered tailings to manage and the associated capacity of the co-disposal storage facility for the 20-year LOM. Waste rock quantities were obtained from information based on the LOM and mining plans. North American Lithium DFS Technical Report Summary – Quebec, Canada 243 Table 15-2 – Summary of the tailings storage facility capacity (tailings and waste rock). Parameter Units Quantity Total tailings tonnage to manage Mt 31.8 Total tailings volume to manage Mm3 19.2 Total tailings storage capacity Mm3 20.3 Total waste rock storage capacity in TSF-2 Mm3 25.4 Total TSF-2 storage capacity Mm3 45.7 15.7.1.4 Stability Analysis for TSF-2 and Related Infrastructure Stability analysis has been performed in both static and pseudo-static conditions for three critical sections selected for the NAL facility, as illustrated in Figure 15-5, Table 15-5 and Table 15-6, including: • Critical TSF-2 sections (Profile 1 to profile 6). • Waste rock and both tailings storage facilities water management basins BO-13 (Profile 2) and BO-12 (Profile 7 and 8) for both critical cut and dyke sections. A geotechnical campaign has been ongoing in Q3 and Q4 of 2022 and Q1 of 2023 for all new waste rock, tailings, and water management infrastructures for the NAL site. Based on the geotechnical campaign results completed in Q4 of 2022 and Q1 of 2023, the previously designed waste rock and overburden piles were analyzed, necessary modifications have been made to conform with the regulatory regulations. Waste pile 2 has been analyzed based on some limited geotechnical data based on some assumption. It should be noted that the validity of these assumptions needs to be addressed by ongoing geotechnical tests. The results of the slope stability analysis will be given in a separate technical note. The parameters given in Table 15-3 were used to calculate slope stability. The shear strength parameters for dry stack tailings, waste rock, and dykes were selected from available literature and considering conservative values for slope stability analysis. The foundation soils and their properties were determined based on the ongoing geotechnical campaign data by BBA. Based on the geotechnical data, no clayey soils were identified in the foundation soils. The methodology, design criteria, seismicity of the site, geotechnical data, assumptions, and optimization results have been detailed in a separate technical note. North American Lithium DFS Technical Report Summary – Quebec, Canada 244 Figure 15-5 – Critical section for slope stability analysis – Profile 1 (TSF-2).

North American Lithium DFS Technical Report Summary – Quebec, Canada 245 Figure 15-6 – Critical section for slope stability analysis – Profile 2 (Basin BO-13). North American Lithium DFS Technical Report Summary – Quebec, Canada 246 Figure 15-7 – Critical section for slope stability analysis – Profile 3 (Basin BO-12). Table 15-3 – Shear strength parameters used in slope stability analysis. Description γ (kN/m3) C’ (kPa) Φ’ (˚) Waste rock 22 0 37 Tailings (undrained) 17 0 28 Tailings (drained) 17 0 30 Organic mixtures (loose) 15 0 22 Non-clay deposits (compact) 17 0 32 Till (very dense) 18 0 37 Gravels 22 0 40 Sand 17 0 34 Mass backfill (dyke) 18 0 35 The results of slope stability analysis under different loading conditions are presented in Table 15-4 for both global and local stability. The obtained factors of safety show that the stability of TSF-2 and basins BO-12 and BO-13 in the proposed configurations meet the design criteria specified in MERN (2017), now MRNF and Directive 019 (MDDEP 2012), now MELCCFP, within the context of this study. 15.7.1.5 Waste and Tailings Handling Methodology Based upon BBA’s experience with projects of this size and the transportation distance of the waste rock and tailings, the handling of all waste material is to be conducted using trucks. Filtered tailings will be transported from the filter plant to the TSF-2. The CAPEX and OPEX related to the transportation and disposal of waste rock and tailings have been included in the mining cost estimate of this report. North American Lithium DFS Technical Report Summary – Quebec, Canada 247 Table 15-4 – Factor of safety of slope stability analysis. Sections Static (short term) Static (long term) Pseudo-static Profile1 TSF-2 1,9 1,9 1,6 Profile 2 1,9 1,9 1,6 Profile 3 1,9 1,9 1,6 Profile 4 1,9 1,9 1,6 Profile 5 TSF-2 1,9 1,9 1,6 South Berm 2,2 2,2 1,8 Profile 6 TSF-2 1,8 1,8 1,6 North Berm 2,1 2,1 1,8 Profile 7 (slope 1) Basin B013 1,6 2,1 1 Profile 7 (slope 2) 2,2 2,3 1,9 Profile 7 (slope 3) 2 2 1,7 Profile 8 2,1 2,1 1,8 15.7.2 Waste rock pile 3 and Overburden Stockpiles The mining site currently includes one existing waste rock storage area named Waste Rock Pile 2 (WRP-2) and will include an additional waste rock disposal area in the future (WRP-3). In the short term WRP-2 will need to be expanded to meet the LOM needs. The permitting process is currently ongoing for this expansion while the WRP-3 is in final approval. For overburden piles, the situation is similar. There is an existing pile nearby the open pit area named Overburden Pile 1 (OBP-1) and an additional pile (OBP-2) will be located near TSF-1. The Overburden Pile 1 will need to be expanded as well as the overburden quantity has increased with the DFS pit design. . An issue of ferrous water leaching has emerged since its creation. More investigations are being carried out to control this water. This issue is included in the OBP-2 project. Geotechnical slope stability recommendations were provided by Golder in the technical memorandum “005-1671082-Rev0.pdf”. Current pile designs were adjusted according to the recommendations included in this report and the ongoing geotechnical campaign data by BBA. This report recommended subsequent additional site characterization to validate geotechnical parameters for waste rock pile 2 which are being addressed by the ongoing geotechnical campaign. The geometry of the piles and design parameters could be modified according to the final results of this campaign. A swell factor of 30% was considered for waste rock and 20% for overburden material to calculate pile storage requirements. Note that these swell factors represent material once placed and consolidated on the pile. The waste rock material not used for construction will mainly be stored in two separate piles as well as in the TSF-2 dykes. The final raise for the actual TSF-1 will also use waste material for its construction. Plan North American Lithium DFS Technical Report Summary – Quebec, Canada 248 views of the waste rock and overburden piles are presented in Figure 15-8. The overburden material will be contained in the pile shown to the South-West of the pit in Figure 15-1. Table 15-5 below details waste rock and overburden volumes mined. Overburden material will be stored in the actual pile located southwest of the pit (OBP-1) and in a second pile (OBP-2) which will be located on the north side of TSF-1. OBP-1 has been partially filled during previous operations and was adjusted to have 3 m high benches and 3 m berms, peaking at a maximum elevation of 445 m, which results in a remaining storage capacity of 0.8 Mm3 (considering end of March 2023 survey). The second overburden pile has a capacity of approximately 0.15 Mm3. As the total volume of overburden to be mined from the pit is approximately 3.9 Mm3 according to the geological model (including a swell factor of 20%), the exceeding volume will be used for progressive reclamation purposes or stored in WRP-3, in the case where there would be material left. Another option actually being considered is to expand the current OBP-1. Permitting requirements are currently being assessed for this expansion. The geological contact between rock and overburden precision does not allow for precise volume calculation which means the total overburden volume might be over-estimated. Table 15-5 – Waste storage capacity. Volume In-situ Volume (m3) Loose Volume (m3) Swell Factor Waste Rock Volume 60,191,000 78,248,300 1.3 Overburden Volume 3,903,000 4,683,600 1.2 Total storage capacity needed for overburden and waste rock (loose) 82,931,900 Table 15-6 – Storage capacity detailed per waste dump. Waste Dump Capacity (Mm3) Overburden Pile 1 0.5 Overburden Pile 2 0.2 Waste Rock Pile 2 0.3 Waste Rock Pile 2 extension 15.8 Tailings Storage Facility 1 1.3 Tailings Storage Facility 2 25.4 Mine Roads and pads 0.8 Waste Rock Pile #3 31.3 Waste Rock Pile #3 extension 10.9 Whereas the required total storage capacity of approximately 83 Mm3 is required, permitting efforts continue to allow for the required storage. Table 15-6 presents the maximum capacity for each of the waste dumps. As per the storage capacities shown in Table 15-5, many possibilities are currently being evaluated and permitted to increase the total waste storage capacity, notably a possible extension to WRP-2 and WRP-3, depending on the environmental constraints.

North American Lithium DFS Technical Report Summary – Quebec, Canada 249 15.7.3 Site Water Management 15.7.3.1 Basins and Ditches Design Criteria The design criteria applying to the storage capacity of the BO-13 water retention basin is the following: this basin must be capable of managing a 24 h rainfall with a recurrence of 100-year, combined with a 100-year recurrence snowmelt, as per Directive 019 (MDDELCC, 2012), given that the waste and tailings are not acid generating and not leachable. For basin BO-12, as it has been designed as a sedimentation basin, the design criteria are related to the residence time. The only contaminant targeted is the Total Suspended Solids (TSS) parameter. BO-12 should be capable of decanting soil particles of 0.1 mm diameter or higher for the 100-year, 24-hour, runoff event. The minimum hydraulic retention time has been established at 12 h. . BO-13 and BO-12 are related to WRP#3. In all cases, for water management basins where retaining structures are considered, an emergency spillway and exit channel must be able to safely discharge the most severe flooding event. This is the Probable Maximum Flood (PMF) as specified in Directive 019. Furthermore, freeboard requirements are as stipulated by Directive 019 (section 2.9.3.1) and the CDA guidelines (section 6.4). At this stage of the Project, it is proposed that the dykes must be designed to have a freeboard of at least 1.0 m, measured between the impermeable dam crest, i.e. elevation of the membrane anchor and not that of the running course, and the maximum water level during the Environmental Design Flood (EDF) event. The design criteria applying to the ditches of TSF-2 and WRP-3 are presented below and are based on a design rainfall of a 100-year recurrence as per Directive 019. The discharge was increased by 18% to consider the impact of climate change: • Minimum depth (1.0 m). • Minimum base width (1.0 m). • Minimum freeboard (0.3 m). • Minimum longitudinal slope (0.001 m/m). • Minimum velocity (0.5 m/s). • Lateral slopes are defined according to the natural terrain. • Riprap was defined according to water velocities observed at each ditch. 15.7.3.2 Water Management Strategy The general water management strategy developed for the Project aims to: • Divert off-site, all non-contact water from non-perturbed areas surrounding the site. North American Lithium DFS Technical Report Summary – Quebec, Canada 250 • Manage by draining, conveying, and containing runoff from surface infrastructure from the mill and waste (tailings and waste rock) management areas as well as underground water. • Recycle a maximum of the mine site water from runoff, process, and groundwater for water supply purposes. • For TSS sedimentation, retain water in ponds prior to treatment for release to the environment. • Treat all contaminated water before releasing it to the environment. Given that the mine was previously operating, the water management infrastructure that was in place will be reused. The additions to the Water Management Plan (WMP) address the management of runoff water that has been in contact with the mine site as well as the clean water that flows through the Project site. The WMP update includes the tailings and waste rock storage facility runoff water, which represents a major addition in impacted surface area to the Project. Runoff water and underground water from the open pit are also collected. The domestic water is collected, and an appropriate treatment system is to be provided. In preparing the WMP, priority was given to minimizing the impacted areas that generate contact water, to reduce the water volumes that will be managed. On the other hand, reclaim of contact water is prioritized to maximize the re-utilization ratio. Particular consideration was given to water management based on watersheds. The WMP mitigates the volume of contact water inflows to be managed on-site by diverting clean water to the environment. 15.7.3.3 Project Watersheds The Project’s watersheds have been delineated to perform the design of ditches and basins. Figure 15-8 and Figure 15-9 show the watersheds of the mine site in their current and updated conditions. Topographic information was gathered from Données Québec, which gives access to LiDAR information at a resolution of 1 m. North American Lithium DFS Technical Report Summary – Quebec, Canada 251 Figure 15-8 – Project watersheds under present conditions. 15.7.3.4 Basins Sizing and Design Based on the design criteria and the water management approach previously described, the environmental design flood was established. Two new basins, BO-12 and BO-13 will be required to manage runoff water from TSF-2 and WRP-3 areas; BO-13 has been designed with a storage capacity of 100,000 m³, while BO-12 has a capacity of 74,000 m³. As designed, these two additional basins will ensure compliance for the LOM of the newly developed areas. The BO-13 basin capacity has taken into consideration that during the spring melt period, 0.15 m³/s of water will be pumped from the basin to the process water basin for further management and treatment if required. Otherwise, water can be released to an associated effluent to the basin BO-13 if environmental criteria are met without additional chemical treatment than physical settling. Basin volumes will be attained partially through excavation and partially through the construction of dams. Dam height has been limited to roughly 6.0 m. Table 15-7 provides crest elevations for each basin as well as elevation for each associated spillway. North American Lithium DFS Technical Report Summary – Quebec, Canada 252 Figure 15-9 – Project watersheds in updated conditions. Table 15-7 – Crest elevations. Basin designation Basin volume (m3) Geomembrane elevation (m) Spillway elevation (m) Crest elevation (m) Freeboard (m) BO-12 74,000 371 370 372 1 BO-13 100,000 395 394 396 1 15.7.3.5 Design of TSF-2 and WRP-3 Drainage Ditches Two new series of ditches are required for this project. The first for the WRP-3 with water collected at BO-12 and the second for TSF-2 with water brought to BO-13. The hydrotechnical parameters of the ditches are presented in Table 15-8 and Table 15-9. Several cross-sections are used for the WRP-3 ditches depending upon the flow discharge and the slopes. A total of three cross-sections are used for ditch 1 for a distance of 500 m, 1,500 m, and 300 m,

North American Lithium DFS Technical Report Summary – Quebec, Canada 253 respectively, and two cross-sections are used for ditch 2, for a distance of 350 and 2,400 m, respectively. The following table shows the cross section located at the entrance of BO12 basin, which has the most important parameters. Table 15-8 – Typical cross-section to be used for the TSF-2 ditches. Section Average Discharge Roughness Base Lateral Water Average Total slope [m/m] [m3/s] coefficient [s/m1/3] width [m] slope [H:1V] depth [m] velocity [m/s] depth (1) [m] 1 0.005 3.35 0.035 1 2 0.92 1.29 1.5 2 0.010 2.04 0.035 1 2 0.64 1.41 1 3 0.030 2.26 0.035 1 2 0.51 2.22 1 Table 15-9 – Typical cross-section to be used for the WRP-3 ditches. Ditch Average Discharge Roughness Base Lateral Water Velocity Total depth (1) slope [m/m] [m3/s] coefficient [s/m1/3] width [m] slope [H:1V] depth [m] [m/s] From To 1 0.002 9.58 0.035 1 2 1.77 1.19 1.0 2.5 2 0.012 9.64 0.035 1 2 1.21 2.34 1.5 2.0 15.7.3.6 Miscellaneous ditches Two miscellaneous ditches will be designed to evacuate water from WRP-2 and OBP-2. The WRP 2 ditches will collect water from WRP-2 and send it to the BO-11 basin and then on to the BO-11 effluent. The OBP- 2 ditches are used to collect the water from OBP-2, sending it to the OBP-2 basin. Table 15-10 shows conceptual cross-sections dimensions proposed for the WRP-2 and OBP 2 ditches. The detailed design is still in progress. Table 15-10 – Typical cross-section to be used for WRP-2 and OBP-2 (in progress). Ditch Lateral Roughness Base Max slope [H:1V] coefficient [s/m1/3] width [m] depths [m] WRP-2 2 0.035 1 1 OBP-2 2 0.035 1 1 15.7.3.7 Future Fuel Pad The future fuel pad will be moved in the future. Its location must be determined. It will be occupied by several infrastructures, including the petroleum equipment, pick-up parking, a trailer area, and mine North American Lithium DFS Technical Report Summary – Quebec, Canada 254 equipment parking. The perimeter of the fuel pad will have a berm that helps to collect water by gravity to a pumping basin that will be located on the north side of the fuel pad. The pumping basin will have a geomembrane lining. The planned discharge pipe is made of high-density polyethylene (HDPE), will be above ground, and will pump the water along the west side of the future fuel pad into another basin (380A) and then into TSF-1. 15.7.3.8 Pumping System A total of three new pumping stations around TSF-2 are required over the life of the Project for runoff and exfiltration management: two at the south end and one at the north end of the facility. At each pumping point, a surge pump basin has been designed. All pumped water will be transferred to the BO-13 basin. The hydrotechnical parameters of the pumping basins are presented in Table 15-11. Table 15-11 – Typical dimensions of pumping basins. Basin designation Basin Freeboard Pumping Pumping volume (m3) (m) Requirement (m³/s) Line Length (m) North 4,000 1 0.050 310 Southwest 7,200 1 0.080 1,270 Southeast 6,600 1 0.080 1,470 15.7.3.9 Wastewater Treatment All solid waste coming from the NAL mine and mill are considered to be non-acid generating and non- leaching. As such, a conventional sedimentation and physical-chemical treatment approach can be considered for the treatment of TSS. A water treatment facility may be required for this Project depending upon the availability of spare capacity of the reverse-osmosis treatment system that is currently installed. An additional design capacity of 0.15 m3/s, assuming 24-h operation, with 90% availability has been estimated in the design of basin BO-13. This capacity is assumed to be available with the reverse osmosis (RO) unit currently in place. The reverse-osmosis treatment system was not evaluated as part of this study. BO-12 has been designed as a sedimentation basin for water management of WRP-3. As such, no additional treatment has been planned. However, in the event that the water quality does not meet the required effluent criteria, additional water treatment infrastructure would be required. North American Lithium DFS Technical Report Summary – Quebec, Canada 255 Figure 15-10 – Flow Diagram at NAL site – current operating conditions. 15.7.3.10 Assessment of the Risk of Climate Change In general, the consequences of climate change represent a new risk that needs to be addressed in water management plans and for the design of the water management infrastructure, e.g., basins and ditches; mitigation and adaptation measures must be considered. The climate change risk was analyzed based on available scientific data, including recommendations put forward by the OURANOS consortium for the province of Québec. According to the simulations performed by OURANOS for the Abitibi region (www.ouranos.ca/portraitsclimatiques), assuming Val d’Or as a reference station, the projections (2041-2070 horizons) for climate change in terms of temperature increase and precipitation are based on a ‘high level of greenhouse gas emissions’ scenario (50th percentile) and shown in Table 15-12. North American Lithium DFS Technical Report Summary – Quebec, Canada 256 Table 15-12 – OURANOS projections for temperature and precipitation. Mean Temperature Projected variation (oC) Relative variation in Temperature Mean Precipitation Projected variation (mm) Relative variation (%) Annual +3.2 ( 02.0 ) 260 Annual +85 (900) 9.4 Winter +3.8 ( -14.0) 73 Winter +30 (161) 18.6 Spring +2.6 (01.4) 285 Spring +32 (188) 17.1 Summer +3.1 (16.3) 119 Summer -05 (295) -15.3 Autumn +2.9 (04.2) 169 Autumn +25 (261) 9.6 Note: variation is relative to the reference period 1981-2010 For the Project, the design for water collecting ditches has assumed an increase of 18% of the Intensity Duration-Frequency values that are available for the Amos weather station (Environment Canada). To manage the risk of an increase in runoff water volumes, the water treatment design capacity was increased by 10%. Also, to manage the risk, the mine pit was considered as a buffer in case of an extreme precipitation event beyond the design criteria. It is understood that during extreme events, the operations (in the pit) will be temporarily suspended. 15.8 COMMUNICATIONS On-site communications consist of interconnected, pole-mounted fiber optic cables linking the various infrastructure buildings. The plant is equipped with communication fire wall protection, Ethernet switches and telephone server, Internet web server for the personnel’s computer network, and a camera server for monitoring the plant and operations. 15.9 SECURITY AND ACCESS POINT Site access is through a guard/security house located at the entrance to the site on the main access road. The guard house is a prefabricated building with separate entrance and exit doors. Parking bays for trucks and visitors’ reception are provided next to the guard house.

North American Lithium DFS Technical Report Summary – Quebec, Canada 257 15.10 ON-SITE INFRASTRUCTURE 15.10.1 General, Green, And Regulated Waste Management General, green, and regulated waste will be sorted, stored, and disposed of according to the regulations and good practices. Bins are labelled for sorting. Two categories are defined: hazardous waste and non- hazardous waste. For the non-hazardous waste, recyclable materials are collected and sent to a subcontractor for recycling, while non-recyclable materials are sent to the landfill site. All categories of hazardous waste are collected by a licensed contractor and managed according to the regulations. 15.10.2 Explosives Magazines Two explosives magazines will be brought on-site by the explosives provider. The first is the cap magazine that will house priming explosives such as detonators, and the second explosive magazine will contain boosters and pre-shear explosives. The magazines are to be strategically located in a fenced and gated area just outside of the mine site. As the proposed main supplier of explosives is located in close proximity to the mine, magazine capacities will be kept at a minimum. 15.10.3 Administration Office The administration building accommodates senior staff, including the general manager, human resources, health & safety, environment, geology, mining, procurement, and accounting, but excludes process plant personnel. In addition to the offices, the prefabricated wood frame building includes facilities such as lunchrooms, toilets, print rooms, conference rooms, etc. All workstations are provided with basic furnishings, internet, and telephone connections. Potable water is supplied to the kitchen and drinking fountains. Power outlets are provided in all rooms. 15.10.4 Mine Garage The mine garage is attached to the administration building and is a prefabricated structure, constructed of light steel, that was brought to site and erected. The garage has two service bays and a warehouse North American Lithium DFS Technical Report Summary – Quebec, Canada 258 area, all of which are currently used by the mining contractor. The DFS Capital costs estimate includes an expansion for the actual mine garage. 15.10.5 Process Plant Building The crushing building is a steel structure with an approximate surface of 300 m2 that houses a three-stage crushing circuit. The process plant building is a steel structured building with aluminum siding with an approximate surface area of just under 8,000 m2. The building, which has a height of about 26 m, houses the concentrator, including ball mill and rod mill, ore sorters, flotation, and WHIMS. There are dedicated areas for offices, a control room, and electrical room, as well as the analytical laboratory. The building has some overhead cranes for service and maintenance. A tailings filtration plant is located close to the tailings management facility (TMF). 15.10.6 Assay Lab The plant laboratories, metallurgical and analytical, are located inside the concentrator building. The metallurgical lab is fully equipped to operate bench scale flotation tests. The analytical laboratory is split into three sections, comprising a sample preparation room, a wet lab, and an instrument lab. The approximate surface area of each section is 49 m2. The analytical laboratory includes sample preparation equipment and analytical equipment, including ICP-EOS and Flame AA for elemental analyses. The analytical lab treats geological, grade control, and plant metallurgical samples. NAL owns the laboratories and all installed equipment. As described in Chapter 18, NAL sub-contracts the operation of the analytical lab to a specialized and certified contractor. 15.10.7 Filtration building The new filter plant will be located adjacent to the TSF-2. The filter plant will be designed to have the capacity to treat 164 tph of pegmatite ore tailings. A pipeline will connect the spodumene concentrator to the tailings filtration plant. The filter plant will include the following major equipment: one tailings filter feed tank, two 23.5 m x 4.2 m x 5.3 m recessed plate filter presses, one filtrate tank, one filtrate clarifier, and one multimedia filter. North American Lithium DFS Technical Report Summary – Quebec, Canada 259 15.11 RISKS AND UNCERTAINTIES 15.11.1 Tailings • The terrain conditions associated with the tailings facilities may necessitate revisions to the structure of the pile, e.g., a softer slope, requiring more fill material. The stratigraphy of the soils present in the footprint of the adjacent site, particularly along the embankments, should be investigated and better defined. Based on survey observations, excavation of existing soils and surface drainage measurements may be important. • A change in the storage quantities or the properties of the tailings to be disposed of could modify the footprint required to store them. Resolution of this risk is currently being evaluated. 15.11.2 Site Water Management The existing water treatment capacity (Reverse Osmosis) could be limited given that for the design of the new basins BO-12, BO-13, it was assumed that only TSS are the only potential contaminant. If the settlement capacities of BO-12 and BO-13 basins are not appropriate for finer TSS or for additional contaminants, use of some adds to enhance the settlement or use of auxiliary treatment units is recommended. Exfiltration of ferrous water coming from OBP-1 could require technological adjustments in order to control this water. North American Lithium DFS Technical Report Summary – Quebec, Canada 260 16. MARKET STUDIES AND CONTRACTS Portions of this section have been adapted from the “Lithium Market Study” prepared by PWC for Sayona Quebec dated March 2023. 16.1 MARKET BALANCE According to BMI, the market balance for battery grade lithium chemicals is expected to be in a deficit from 2021 to 2024. From 2025 to 2027, a slight surplus is expected as new production is brought online more rapidly than demand. However, from 2028 to 2040, a growing deficit is projected and is expected to reach 2,289 thousand tons (short tons = 2,000 lb/ton) of LCE in 2040 as demand for electric vehicles (EV) grows faster than supplier production. Several new supply projects are expected to start in the next few years. These projects have been discounted based on the current stage of development. For example, an operating facility will be 100% captured in the supply forecast. The scenario includes theoretical brines and conversion projects that have not been discovered as of Q4 2022. In all cases, the lithium chemicals market enters a deficit in 2028, even when including all potential projects forecasted by BMI. In May 2022, BMI projected that the industry would require more than 42 billion U.S. dollars of investment to meet market demand, a figure that has likely increased since then with the increasing demand projections (Figure 16-1). Figure 16-1 – et balance (supply vs demand) for battery grade lithium, 2020-2040 (Source: Lithium-Price- Forecast-Q4-2022-Benchmark-Mineral-Intelligence, PwC Analysis).

North American Lithium DFS Technical Report Summary – Quebec, Canada 261 16.2 PRODUCT PRICING In 2021 Sayona Quebec and Piedmont Lithium entered into an offtake agreement where Piedmont holds the right to purchase the greater of 50% of spodumene concentrate for 113,000 tpy from North American Lithium at a floor price of $500 /t and a ceiling price of $900 /t (6.0% Li2O equivalent) on a life-of-mine basis. For purposes of financial modeling and the Technical Report Summary sales from 2023 to 2026 are based on the greater of 113 kt of spodumene concentrate or 50% of spodumene concentrate sales at the Piedmont Lithium contract price and the remaining concentrate sales at BMI Q4 2022 spodumene market prices. From 2027 onwards, the entire concentrate sales are settled at BMI Q4 2022 spodumene market prices. For the contracted volume to Piedmont Lithium, a price of $810 USD/t (from the reference of $900 USD/t @ 6.0% Li2O to adjusted value of $810 USD/t assuming 5.4% Li2O and applied 10% price discount from $900 USD/t for lower grade) assumed over 2023-26, while the remainder of the concentrate production uses market prices. From 2027 and beyond, Sayona Quebec is reverting back to market prices for the entire production as it seeks to pursue a lithium transformation project on-site, leveraging prior investments, in line with its commitments with the Government of Québec related to its acquisition of NAL. The construction or completion of conversion facilities owned by Sayona Quebec remains subject to the approval of both Sayona and Piedmont and therefore the associated pricing assumptions used in this TRS for Piedmont’s allocation of spodumene concentrate should be considered illustrative only . 16.2.1 Spodumene Price Forecast The prices for spodumene concentrate and battery-grade lithium are expected to remain high relative to historic prices, driven mainly by the demand for lithium for EV batteries. According to BMI, the price of spodumene concentrate (6%) is expected to increase significantly from 2020 to 2024, reaching a peak of $5,525 USD/t. However, by 2026, the market price of spodumene is expected to decrease to below $2,000 USD/t, and gradually stabilize at a long-term price of $1,050 USD/t from 2033 onwards (Figure 16-2). North American Lithium DFS Technical Report Summary – Quebec, Canada 262 Figure 16-2 – Spodumene concentrate price forecast 2020-2040. 16.2.2 Carbonate Price Forecast According to BMI, the price for battery grade carbonate is expected to jump in 2023, driven by the fast growth of the EV industry. BMI price expectations imply a peak of $75,475 USD/t in 2024. After 2025, supply increase is projected to meet market demand, bringing down prices gradually through to 2032. From 2033 onwards, BMI projects an average carbonate price of $20,750 USD/t (Figure 16-3). North American Lithium DFS Technical Report Summary – Quebec, Canada 263 Figure 16-3 – Battery-Grade Lithium Carbonate Price Forecast 2022-2040. 16.2.3 Spodumene Price forecast – Relatively to carbonate price When we analyze the variations in price for spodumene (6%) as a percentage of lithium carbonate, prices are observed to vary from 3.1% to 7.3% depending on the period. According to BMI, the price of spodumene is expected to ratio against lithium products in 2024. In the long-term, BMI projects the spodumene to lithium ratio to stabilize between 4% to 5% (Figure 16-4). North American Lithium DFS Technical Report Summary – Quebec, Canada 264 Figure 16-4 – Spodumene price forecast (as % of carbonate price) 2020-2040. 16.3 CONTRACT SALES Piedmont entered into a purchase agreement with Sayona Québec for the purchase of 50% of the production or 113,000 t (dry) of spodumene concentrate per year, containing 6.0% Li2O grade with less than 1.5% Fe2O3 (dry basis) and less than 12.0% total moisture. With regards to the remaining spodumene volume projected at 113,000 t (dry), Sayona Québec is currently exploring the most advantageous commercial options to commercialize its share of the spodumene production. The projected start-of-production date for commercial shipments is July 2023. In June 2022, a formal agreement was announced by Sayona Québec and Piedmont to restart spodumene production at NAL. Subject to further agreement between the joint-venture partners this may ultimately include the development of a spodumene conversion facility at NAL to produce lithium hydroxide or lithium carbonate, as per the Company’s agreement with the Québec Government to develop a local downstream processing capability in proximity to the North American battery market. A prefeasibility study for lithium chemical operation is currently underway to transform spodumene into lithium carbonate. The results are expected in the second quarter of 2023. If Sayona Québec commences lithium chemical operations, then Piedmont and Sayona Québec have agreed that the spodumene from the Piedmont offtake agreement will first be delivered to a jointly owned chemical plant and then to Piedmont Lithium, and lastly to third parties.

North American Lithium DFS Technical Report Summary – Quebec, Canada 265 16.3.1 Other Contracts As of the effective date of this Report, the company is in discussions for several services and material supply contracts as part of the operating activities of the Project. The significant contracts are summarized here: • Fuel: Multi-Years contract executed with Shell. • Laboratories and Surveying: Multi-Years contract executed with SGS. • Reagents: Short-term agreement in place with Univar. • Grinding Media: Yearly supply agreement executed with Mc Mines. • Land transport and trans boarding: Advance discussions with Solurail Logistics (SL) to execute long term contract. • Railway: Advance discussions with Canadian National (CN) to execute long term contract. • Port handling and storage: Long term contract with Quebec Stevedoring Limited (QSL) executed. • Electrical power: Different additional power requests to Hydro Québec (HQ) in preparation. 16.4 MARKET ANALYSIS 16.4.1 Refined Lithium Demand by Product According to Wood Mackenzie’s analysis, changing consumer preferences, government policies facilitating lower emissions as well as EV manufacturers increasing the number of models which provides more options to consumers are the key drivers for this demand growth. Also, recent investments in battery recharge infrastructure support aggressive growth in demand for the different lithium products. When observing demand for lithium by product, battery-grade lithium hydroxide (LiOH) and battery-grade lithium carbonate (Li2CO3) are the two most significant segments based on BMI’s forecasts. Lithium hydroxide demand is expected to reach a 58% market share by 2040 compared to 42% for lithium carbonate (Figure 16-5). North American Lithium DFS Technical Report Summary – Quebec, Canada 266 Figure 16-5 – Refined demand by product, 2020-2040 (Source: Lithium-Price-Forecast-Q4-2022- Benchmark-Mineral-Intelligence, PwC Analysis). 16.4.2 Refined Lithium Demand by End Use Segment According to Benchmark Minerals Intelligence (BMI), market demand is expected to reach 5,814 thousand tons (short tons = 2,000 lb/ton) of lithium carbonate equivalent (LCE) in 2040, which is 17.4 times higher than the demand for lithium in 2020, which was 362 thousand tons (short tons = 2,000 lb/ton) of LCE. On that basis, aggregate lithium demand will grow at a compound annual growth rate (CAGR) of 15% from 2020 to 2040. From 2020 to 2030, demand is expected to grow 1.5x faster than 2020-2040, with a CAGR of 22%. The rechargeable battery segment is the most important segment for lithium demand, making up more than 95% of total demand on a 20-year average and growing at a 17% CAGR over the period (Figure 16-6). North American Lithium DFS Technical Report Summary – Quebec, Canada 267 Figure 16-6 – Lithium demand by end use, 2020-2040 (Sources: Lithium-Price-Forecast-Q4-2022- Benchmark-Mineral-Intelligence, PwC Analysis). 16.4.3 Type of Ore Processed from Hard Rock to Supply Lithium According to Wood Mackenzie, the total supply is projected to grow at a CAGR of 14% from 2020 to 2030. Although lepidolite production will increase from 2020 to 2025 and new processes such as jadarite, clay and zinnwaldite will be introduced starting in 2023, spodumene concentrate will remain the dominant mineral concentrate output. Depending on the period, spodumene concentrate is expected to account for 73% to 87% of the total capacity of the mine. Significant exploration, necessary to support the growth of the demand, is underway to identify and then qualify resources and reserves to bring to production over the next years. Successful explorations and entry into service of new mines will be required to meet the growing lithium market demand by 2030, and more substantially by 2040, and replace mine capacity who reach end of life (Figure 16-7). North American Lithium DFS Technical Report Summary – Quebec, Canada 268 Figure 16-7 – Mine capacity by type, 2020-2040 (kt LCE) (Sources: Lithium-Price-Forecast-Q4-2022- Benchmark-Mineral-Intelligence, PwC Analysis). 16.4.4 Refined Production Capacity by Final Product Lithium carbonate and lithium hydroxide will dominate refined production for lithium products. From 2020 to 2040, lithium hydroxide and lithium carbonate are projected to grow at a CAGR of 16% and 11% respectively. The production, based on the current in production or planned projects per the BMI forecast, is insufficient to meet market demand by 2040 (Figure 16-8).

North American Lithium DFS Technical Report Summary – Quebec, Canada 269 Figure 16-8 – Refined production capacity by product, 2020-2040 (kt LCE) (Sources: Lithium-Price- Forecast-Q4-2022-Benchmark-Mineral-Intelligence, PwC Analysis). 16.4.5 Refined Production by Raw Materials Based on the current spodumene operating plants and advanced projects by BMI, spodumene is projected to remain an important source of raw material from 2020 to 2040, and further projects will be required to meet market demand. From 2020 to 2030, the CAGR of spodumene is projected to grow at an 18% CAGR whereas over refined production is projected to grow at a 20% CAGR, supported strong brine growth and the acceleration of recycled lithium. Even when accounting for the recycled lithium volume, significant growth of refined production capacity is required to meet BMI’s projected market demand, particularly from 2030 to 2040 (Figure 16-9). North American Lithium DFS Technical Report Summary – Quebec, Canada 270 Figure 16-9 – Refined Production by Raw Material, 2020-2040 (kt LCE) (Sources: Lithium-Price-Forecast- Q4-2022-Benchmark-Mineral-Intelligence, PwC Analysis). 16.5 PACKAGING AND TRANSPORTATION Spodumene concentrate will be bulked transported by truck from mill to a rail trans boarding facility in Val-d’Or were concentrated will be transferred into mineral covered railcar gondolas and then shipped on CN’s mainline to the Québec City port. The transport and logistics total cost were evaluated based on firm executed service contract, budgetary quotations & assumptions. The total LOM transport and logistics costs are at $133.92 CAD/t transported (wet basis). Once the lithium carbonate plant is in operation, the supply chain will be re-engineered to handle product conditioned into big bags. Different mode of transportation has been investigated (rail, intermodal, land) in regards of cost, destination, and carbon footprint reduction. North American Lithium DFS Technical Report Summary – Quebec, Canada 271 16.6 RISKS AND UNCERTAINTIES According to BMI, starting in 2028, lithium supply is projected to fall short of demand. 16.7 OPPORTUNITIES Lithium market demand is expected to grow largely due to the increase in battery production from a global standpoint. Lithium hydroxide demand is expected to increase at a more robust growth rate than lithium carbonate to reach 58% of aggregate demand by 2040. Raw material supply is projected to be led by spodumene (hard rock) and brine while recycling will gradually occupy a significant market share of supply by 2040 (33%). Spodumene and lithium carbonate prices are expected to reach their highest price in 2024 and decline gradually to reach a steady state by 2033 of $1,050 USD/t of spodumene and $20,750 USD/t of lithium carbonate. North American Lithium DFS Technical Report Summary – Quebec, Canada 272 17. ENVIRONMENTAL STUDIES, PERMITTING, SOCIAL OR COMMUNITY IMPACTS The Project is already operational and all steps for obtaining the necessary permits and provincial regulatory authorizations have been completed to accommodate actual operations. Submissions for some necessary permits and provincial regulatory authorizations have also been sent to the concerned agencies for new infrastructure, which will be required in the short and medium term. Finally, other submissions for permits and authorization will be sent to concerned agencies in the coming months. While the mine site was under care and maintenance, a skeleton staff remained to ensure integrity of the assets and protection of the environment. Over the past few years, environmental studies were conducted, and regulatory monitoring of operations was instituted. 17.1 ENVIRONMENTAL BASELINE AND IMPACT STUDIES 17.1.1 Physical Environment 17.1.1.1 Climate The Abitibi-Témiscamingue region enjoys a temperate, cold, continental climate with long, cold, and dry winters, and short, yet warm summers. Data obtained from the Val-d’Or weather station, located 40 km to the south, indicates that the average temperature is 17.2 °C in July and 17.2 °C in January. The average yearly daily temperature is 1.2 °C. The region has an average of 635.2 mm of rain and 300.4 cm of snow, for total precipitation (rain equivalent) of 914 mm. 17.1.1.2 Topography The regional study zone is located in the physical geography unit of the region’s lower plateau, called the Bas-Plateau de l’Abitibi. The slightly hilly relief was molded and smoothed out somewhat by the introduction of thick clay deposits from the Ojibway-Barlow Lake vestiges. The site also has a few broken- up strips of rocky cliffs that cut across the clay plain, including Mont Vidéo, a hill that rises to 470 m (m.a.s.l.). The other hills are between 420 m and 450 m high, and the lowlands have an average altitude of around 360 m.

North American Lithium DFS Technical Report Summary – Quebec, Canada 273 17.1.1.3 Geology The study zone lies within the Superior Province of the Canadian Shield. The rocks in this zone date back to the Archean era. The batholith consists of several parallel dykes, ranging from pegmatite to spodumene, feldspar and quartz. These dykes are nearly 3 km long and run northwest/southeast. They are present to a maximum depth of 260 m, are very continuous and contain a uniformly distributed spodumene mineralization. 17.1.1.4 Geomorphology The glacial footprint of the existing landscape is the one left by the last glacier in the region, nearly 9,000 years ago. A key feature of the last deglaciation in Abitibi-Témiscamingue is the development of the Harricana till. This till delineates the convergence of the Hudson and the Nouveau-Québec glaciers. Several major fluvio-glacial deposits, e.g., eskers and spreads, emerged during the glacial retreat. The local study zone is essentially characterized by the presence of a continuous cover till, generally over 1 m in thickness, over the pit and the mining complex. The existing till has an average permeability and can be considered a discontinuous aquifer, enabling the flow of groundwater. 17.1.1.5 Hydrography Three lakes – Roy, Legendre and Lortie – are the main bodies of water near the Project. Lac Lortie, located north of the planned pit, is an isolated lake with no surface outlet. The Hydrological Atlas of Canada indicates that it drains northwest, into the Landrienne River basin. The Harricana till is located at the Continental Divide, between the waters flowing towards the Landrienne River, a Harricana River tributary, and the Barraute Stream, a Laflamme River tributary. The Project is located at the head of the sub-watersheds of the Laflamme, Fiedmont and Landrienne Rivers. The concentrator and tailings site are in the Fiedmont River sub-basin, the area of waste rock accumulation is in the Landrienne River basin, and the pit is at the intersection of the three sub- watersheds. 17.1.1.6 Background Surface Water Quality As part of the Environmental and Social Impact Assessment (ESIA), two characterization campaigns of the surface water and sediment quality were conducted in 2009 and 2010. The quality of the surface water of three lakes and three nameless streams was analyzed and compared to known quality criteria. Globally, North American Lithium DFS Technical Report Summary – Quebec, Canada 274 the environmental protection criteria for the analyzed substances were rarely exceeded. Some exceedances have been observed for fluoride, total phosphorus, pH, aluminum, iron, manganese, and mercury. 17.1.1.7 Background Sediment Quality The stations for which a sediment quality analysis was performed are the same ones whose water quality was measured. The substances analyzed in the sediments include metals and organic compounds, such as oils, greases, and aliphatic hydrocarbons (C10–C50). The second campaign also included an analysis of polychlorinated biphenyls (PCBs). The Lac Lortie station contains more aluminum, lithium, potassium, sodium, and zinc than other stations. Petroleum hydrocarbons were detected but no PCBs were detected. Some exceedances of criteria have been observed for cadmium, arsenic, mercury, lead, and zinc. 17.1.1.8 Hydrogeology Twenty or so borings were initially used to identify the hydrogeological properties of the rock and establish the site piezometry. Two surveys were also conducted in the superficial deposits north of Lac Lortie. The surveys performed on the site identified different hydrogeological units, based on sectors. A horizon of waste matter, i.e., tailings and waste rock, from prior mining activities lies north of the pit. The flow of groundwater into the superficial deposits and the rock occurs in several directions, i.e., following the topography. Hence, in the mining complex zone, groundwater flows east and south, but the flow is south at the tailings site. In the pit area, which is at a higher level, the water flows in all directions. No hydraulic connection was identified between Lac Lortie and the aquifers in the pit zone. There is no overall catchment structure near the study zone. Moreover, there are no reported shafts over a 1 km radius around the local study zone. There are individual catchment structures at the edge of Lac Legendre as well as in the Mont Vidéo sector. However, the planned mining facilities are located beyond the minimum regulatory distances that must be complied with to ensure the protection of existing catchment structures. 17.1.1.9 Groundwater Quality The quality of the groundwater is very good and only two exceedances of criteria for iron and nickel have been observed in ESIA baseline studies. North American Lithium DFS Technical Report Summary – Quebec, Canada 275 17.1.2 Biological Environment 17.1.2.1 Vegetation The regional study zone is located within the western balsam fir-yellow birch bioclimatic domain. The forest landscape is dominated by stands of pine and white spruce, intermingling with white birch trees. The regional study zone includes several open environments, e.g., farmer’s fields, non-forest wetlands, recent logging areas, etc., but is nonetheless primarily comprised of forest. Conifer stands predominate, followed by mixed stands. Hardwood or deciduous stands are less frequent and consist almost solely of young stands or trees undergoing regeneration. The numerous disturbances of the late ‘70s, e.g., epidemics, logging, plantations, and windfall, all resulted in major occurrences of these types of stands. According to the Centre de données sur le patrimoine naturel du Québec (CDPNQ), the sector concerned by the Project does not include any plant species designated as threatened, vulnerable or likely to be thus designated. Any special-status species have been observed in the ESIA baseline studies. The sector contains no exceptional forest ecosystems (EFEs), forest stands with a phytosociological interest or biological refuges. Furthermore, the past few years have seen considerable logging activity. 17.1.2.2 Wetlands There are numerous forest wetlands in the deciduous or mixed stands, or in areas where trees were recently felled. These zones are characterized by hydric and sub-hydric drainage. The area also has non- forest wetlands consisting of alder groves and stripped wetlands. 17.1.2.3 Aquatic Fauna 17.1.2.3.1 Fish fauna and aquatic habitats Overall, the quality of the fish habitats is very poor, which is due to the homogeneity of the aquatic habitats, very low flow rates, flow that is sometimes intermittent or below ground and numerous obstacles preventing fish. According to the Ministère des Resources naturelles et des Forêts (MRNF formerly MERN), there may be up to 49 fish species in the Abitibi-Témiscamingue watercourses; 15 of these species, in fact, have already been identified in the sectors surrounding the Project. Through samplings, nine species of fish were confirmed as present in the inventoried bodies of water, specifically lake cisco, brook stickleback, lake whitefish, goldeye, monkfish, white sucker, pearl dace, brook trout and yellow perch. In addition to the species identified, the MRNF noted the presence of three North American Lithium DFS Technical Report Summary – Quebec, Canada 276 other species in the area’s lakes; they are the brown bullhead (Ameiurus nebulosus), the northern pike (Esox lucius) and the walleye (Sander vitreus), which are all found in Lac Legendre. None of these species has a special status, be it provincial or federal. 17.1.2.3.2 Herpetofauna The various inventories conducted made it possible to confirm the presence of three amphibian species: the green frog (Lithobates clamitans), wood frog (Lithobates sylvaticus) and American toad (Anaxyrus americanus). However, two of the reptiles have a special status: the wood turtle (Glyptemys insculpta) and the common snapping turtle (Chelydra serpentina) have not been observed. 17.1.2.3.3 Avian fauna Avian fauna inventories were conducted as part of the ESIA to specifically establish the possible presence of special-status species. The data gathered allowed for identifying 71 bird species in the study zone. While the targeted special-status species were not observed (the short-eared owl (Asio flammeus), the olive-sided flycatcher (Contopus borealis), the rusty blackbird (Euphagus carolinus) and the bobolink (Dolichonyx oryzivorus)), other such species were identified in the study zone. These species, which could be designated threatened or vulnerable, are the Canada warbler (Wilsonia canadensis) and the common nighthawk (Chordeiles minor). 17.1.2.3.4 Mammals The local study zone could be a habitat for a wide variety of mammals. The large animals most likely to be found are the moose (Alces americanus) and the brown bear (Ursus americanus). The presence of white-tailed deer (Odocoileus virginianus) is unlikely. The site zone potentially includes 13 species of small mammals and five species of bats, five of which could be designated threatened or vulnerable. The small mammals in this latter group are the rock vole (Microtus chrotorrhinus) and the southern bog lemming (Synaptomys cooperi), while the bats are the silver-haired bat (Lasionycteris noctivagans), the eastern red bat (Lasiurus borealis) and the hoary bat (Lasiurus cinereus). While the sub-sections for the different animal groups indicate the possible presence of a few special- status species, the information obtained from the CDPNQ reveals that no threatened or vulnerable faunal species, or faunal species likely to be designated as such, were identified in the site zone.

North American Lithium DFS Technical Report Summary – Quebec, Canada 277 17.1.3 Social Considerations 17.1.3.1 Territory Use The Project is situated in the administrative region of Abitibi Témiscamingue (08), within the boundaries of the Abitibi RCM. All planned mining infrastructure for the Project are located in the municipality of La Corne. The lands included in the regional study zone mostly comprise Crown land, hence a territory under the administrative responsibility of the MRNF. In addition, the public territory of the regional study zone is comprised of Category III lands under the James Bay and Northern Québec Agreement (JBNQA). This means that the First Nations people in the territory retain fishing, hunting, and trapping rights, without being subject to permitting requirements, catch limits or specific periods, during which these activities are allowed, all contingent on any potential conservation principles. Of the nine major land uses for the territory identified in the Abitibi RCM’s territory development and activities plan (SAD), eight concern the regional study zone. These eight uses are agriculture, forestry, agroforestry, agricultural, urban, recreational, conservation and resorts, i.e., development and consolidation. Most of the territory in the regional and local study zones are part of a zone designated for forestry use. In the local study zone, there is a recreational use zone around Lac Roy and Lac Lortie as well as Mont Vidéo. Noteworthy, a zone for resorts is located on the shores of Lac Legendre. 17.1.3.2 Development and Activities As regards the major activities included in the SAD, the Abitibi RCM wants to ensure available space for the development of various types of industries, while protecting the existing environment and activities. The need to minimize the impact of mining activities on nearby sectors, protect the aquifers, including those of the Harricana till, ensure adequate protection for the various natural environments and their elements of interest, and promote the integrated enhancement of forest resources should be underscored. 17.1.3.3 Land Use The three municipalities included in the regional study zone are characterized by a low land use density. The residential environment is concentrated in urban sectors, all of which are less than 15 km from the Project site. There are no landholdings on the planned site of the Project infrastructure. However, two groupings of private, resort-type homes are located nearby Lac Legendre and Mont Vidéo. North American Lithium DFS Technical Report Summary – Quebec, Canada 278 17.1.3.4 Public Utilities Infrastructure As regards to transport infrastructure, the regional sector includes a section of provincial route 111, which links Val-d’Or and Amos, and runs through La Corne. Two regional routes also pass through the zone: route 386, between Landrienne and Amos, and route 397, between Barraute and Val-d’Or. The recreational or leisure network includes numerous snowmobile trails and a few quad trails, which are currently being developed. The Abitibi RCM’s electricity network is managed by Hydro-Québec and a 120 kV power line crosses the site. 17.1.3.5 Recreation and Tourism Activities The Centre de plein air du Mont-Vidéo, an outdoor recreation center, is located about 2 km from the Project. This complex includes a downhill skiing center, snowshoe, and cross-country ski trails, hiking and mountain bike trails, a campsite with a beach on the shore of Lac Roy and a number of summer camps. Fishing and hunting, in turn, are regularly practiced throughout the region. Forestry and Agricultural Activities Some of the Crown lands in the regional study zone are subject to forest logging rights, i.e., guarantee of supply. The study zone is included in the common area of UAF 084-51 and 086-51. The primary holders of forest rights in these areas are two companies: Matériaux Blanchet Inc. and Scierie Landrienne Inc. As for the agricultural activities in the study zone, these are mainly concentrated in the urban regions near Landrienne, La Corne and Barraute. There are no agricultural zones designated as protected under the Act respecting the preservation of agricultural land and agricultural activities on the site dedicated to Project infrastructure. 17.1.3.6 Aboriginal Populations The Project site is situated at the boundary of the First Nations communities of Lac Simon and Pikogan. 17.1.3.7 Archeological and Heritage Potential While there are no known archeological sites within the boundaries of the regional study zone, two studies on the area’s archeological potential have been carried out, the goal being to adequately evaluate the probability of prehistorical and historical human occupation. These studies indicated the presence of two North American Lithium DFS Technical Report Summary – Quebec, Canada 279 25 m shorelines encircling Lac Roy and Lac Lortie having a strong archeological potential. Current plans do not include any structures in these particular zones. There is no specific potential in any other part of the site. 17.2 PROJECT PERMITTING Sayona plans to restart NAL mining and ore treatment operations in accordance with existing approvals by provincial and federal authorities. The concentrator has approval for throughput of 3,800 tpd. A planned increase to 4,500 tpd has been submitted to the authorities for approval in January 2023. Increase will not trigger federal or provincial environmental examination procedures. At the provincial level, permits have been obtained for most project components. Some original permits were transferred to North American Lithium following acquisition of the site in 2017 and transferred again to Sayona following acquisition in 2021. 17.2.1 Ministry of Environment, Fight Against Climate Change, Fauna, and Parks (MELCCFP) Existing permits: • Open pit mine. • Spodumene concentrate mill. • Lithium carbonate refinery. • Tailings management area no. 1. • Process water pond. • Industrial wastewater treatment plant. • Waste rock dump no. 2. • Waste rock dump no. 3. • Overburden dump no. 1. • Overburden dump no. 2. Ongoing permitting activities: The permitting process is well advanced for additional Project components or modification of existing authorizations: • Waste rock dump no. 3, including modification to water management and access road; North American Lithium DFS Technical Report Summary – Quebec, Canada 280 • Access road to waste rock dump no. 3 and tailings management area no. 2. • Extension of waste rock dump no. 2 and construction of water pond BO-11A. • These permits are expected to be obtained in 2024. Storage on authorized waste dumps will be carried out until obtainment of new waste dump permit. • The permitting process is ongoing for additional Project components or modification of existing authorization, including: • Tailings management area no. 2, including filter press and water management installations (BO- 13 pond). The permit is not required before the end of 2025 and final approval is expected in 2025. • The permitting process is about to start for the low-grade pile and the topsoil pile. The final approval is expected for 2024. 17.2.2 Ministry of Natural Resources and Forests (MRNF) - Lands Sector Various land occupation leases have been obtained from MRNF. Various requests of land occupation leases have also been submitted to MRNF and leases are expected to be obtained in 2022. Requests for less urgent land occupation leases will be submitted in summer 2022. 17.2.3 Ministry of Natural Resources and Forests (MRNF) - Forestry Sector Permits for tree cutting have been obtained for urgent works, e.g., geotechnical surveys. A global permit for tree cutting, establishment of haulage roads for waste rock dump no. 3, culverts and water pond BO- 12 are obtained or expected be obtained in 2023. 17.2.4 Department of Fisheries and Oceans of Canada (DFO) Due to federal regulation changes, request for approval by the Department of Fisheries and Oceans of Canada (DFO) has been approved in December 2022. Any changes to the Project that could increase the total impact on fish habitats will require a modification to existing DFO approval.

North American Lithium DFS Technical Report Summary – Quebec, Canada 281 17.3 OTHER ENVIRONMENTAL CONCERNS 17.3.1 Waste Rock, Tailings and Water Management In 2012, a geochemical characterization of a combined tailings sample, i.e., tailings from spodumene concentrate production and tailings from lithium carbonate production, was carried out by Golder Associates. Metals content measurements, static Acid Rock Drainage (ARD) testing and Metals Leaching (ML) static testing have been carried out on solid samples and the liquid fraction of tailings pulp. The results showed that combined tailings are not ARD. However, leaching tests and liquid fraction analysis showed that low pH as well as copper, lithium, zinc, sodium, and sulphate concentrations could be a concern. Therefore, a liner has been installed under tailings management area no. 1. At the end of 2017 and the beginning of 2018, only seven samples of tailings produced from spodumene concentrate production had been analyzed. The results showed that tailings from spodumene concentrate production are neither ARD, nor ML. Whereas the geochemical test was previously relevant, it no longer represents the tailings management approach going forward. The current plan is to have only spodumene tailings. The geochemical characteristics of these tailings need to be evaluated on their own. This would remain consistent, going forward, even if carbonate tailings are to be produced at some point. The plan would be to keep such tailings separate from the spodumene tailings. Tests on waste rock were conducted as part of a geochemical study performed by Golder Consulting. A total of 65 samples from six different overburden areas were analyzed for their metal contents, ARD potential, and ML potential. A complementary geochemical study was conducted at Unité de Recherche et de Service en Technologie Minérales (URSTM) in 2013. Column testing was also carried out on four samples representing the main waste rock lithologies. Results from the geochemical studies showed that waste rock is neither ARD, nor ML; therefore, no special requirements are required by the Ministère de l’Environnement, de la Lutte contre les changements climatiques, de la Faune et des Parcs (MELCCFP formerly MELCC) for stockpiling and water management. In fact, the MELCCFP also allows use of waste rock for construction purposes, e.g., road, lay-down areas, etc. 17.3.2 Regulatory Context 17.3.2.1 Provincial Procedure for Environmental Impact Assessment The Project is subject to Québec’s Environment Quality Act (EQA, c. Q-2). Under this act, projects requiring environmental impact studies are identified in the Regulation Respecting Environmental Impact North American Lithium DFS Technical Report Summary – Quebec, Canada 282 Assessment and Review (Q-2, r. 23). At the time that the Project was authorized, only mining projects having an ore processing capacity of over 7,000 tpd were subject to the provincial impact assessment procedure. Although this regulation has since been revised and stipulates that mining projects at an ore processing capacity at or above 2,000 tpd (section no. 8) are now subject to this procedure, the Project has already been authorized by the Québec government and its expansion does not make it subject to the environmental impact assessment procedure, but other new permits will be required (see Section 17.2). 17.3.2.2 Federal Procedure for Environmental Impact Assessment The impact study of the initial project was submitted in February 2013 to the Canadian Environment Assessment Agency (CEAA) under the Canadian Environmental Assessment Act (S.C. 1992, c. 37). The CEAA issued a Study Report in February 2018 presenting the Agency requirements for atmospheric environment, water quality, fish and fish habitats, birds, and birds habitats as well as traditional land and resources use. As per the Physical Activities Regulations (SOR/2019-285), the Project would be subjected to the new Impact Assessment Act (S.C. 2019, c. 28, s. 1) procedure if the expansion of the Project results in an increase in the area of mining operations of 50% or more and the total ore input capacity reaches 5,000 t/day or more after the expansion. Both conditions have to be trigger to be subjected to this procedure 17.3.2.3 Laws and Regulations for Environmental Impact Assessment The Project is subject to a number of provincial, federal and, in some cases, municipal regulations. Main laws and regulations that are applicable are listed in Table 17-1: Table 17-1 – Provincial and federal acts and regulations. Acts and Regulations Provincial Environment Quality Act (c. Q-2) Regulation respecting the application of section 32 of the Environmental Quality Act (Q-2, r. 2) Regulation respecting the application of the Environment Quality Act (Q-2, r. 3) Regulation respecting the regulatory scheme applying to activities on the basis of their environmental impact (Q-2, r.23.1) Design code of a storm water management system eligible for a declaration of compliance (Q-2, r.9.01) Clean Air Regulation (Q-2, r. 4.1) Regulation respecting the operation of industrial establishments (Q-2, r. 26.1) Snow, Road Salt and Abrasives Management Regulation (Q-2, r. 28.2) Regulation respecting pits and quarries (Q-2, r. 7) North American Lithium DFS Technical Report Summary – Quebec, Canada 283 Acts and Regulations Regulation respecting the declaration of water withdrawals (Q-2, r. 14) Regulation respecting mandatory reporting of certain emissions of contaminants into the atmosphere (Q-2, r. 15) Regulation respecting halocarbons (Q-2, r. 29) Regulation respecting hazardous materials (Q-2, r. 32) Regulation respecting the reclamation of residual materials (Q-2, r.49) Regulation respecting activities in wetlands, bodies of water and sensitive areas (Q-2, r.0.1) Protection policy for lakeshores, riverbanks, littoral Zones and floodplains (Q-2, r. 35) Water withdrawal and protection regulation (Q-2, r. 35.2) Land protection and rehabilitation regulation (Q-2, r. 37) Regulation respecting the charges payable for the use of water (Q-2, r. 42.1) Directive 019 sur l’industrie minière (2012) Protection and rehabilitation of contaminated sites policy (1998) Mining Act (c. M-13.1) Regulation respecting mineral substances other than petroleum, natural gas and brine (M-13.1, r. 2) Threatened or Vulnerable Species Act (c. E-12.01) Regulation respecting threatened or vulnerable wildlife species and their habitats (E-12.01, r. 2) Regulation respecting threatened or vulnerable plant species and their habitats (E-12.01, r. 3) Compensation Measures for the Carrying out of Projects Affecting Wetlands or Bodies of Water Act (M-11.4) Act respecting the conservation of wetlands and bodies of water (2017, chapter 14; Bill 132) Watercourses Act (c. R-13) Regulation respecting the water property in the domain of the State (R-13, r. 1) Conservation and Development of Wildlife Act (c. C-61.1) Regulation respecting wildlife habitats (C-61.1, r. 18) Act respecting the lands in the domain of the state (c. T-8.1) Regulation respecting the sale, lease and granting of immovable rights on lands in the domain of the State (c. T-8.1, r. 7) Sustainable Forest Development Act (c. A-18.1) Regulation respecting the sustainable development of forests in the domain of the State (c. A-18.1, r. 0.01) Regulation respecting forestry permits (c. A-18.1, r. 8.) Building Act (c. B-1.1) Safety Code (B-1.1, r. 3) Construction Code (B-1.1, r. 2) Explosives Act (c. E-22) Regulation under the Act respecting explosives (E-22, r. 1) Cultural Heritage Act (c. P-9.002) Occupational Health and Safety Act (c. S-2.1) Regulation respecting occupational health and safety in mines (S-2.1, r. 14) Highway Safety Code (c. C-24.2) Transportation of Dangerous Substances Regulation (c. 24.2, r. 43) Federal Impact Assessment Act (S.C. 2019, c. 28, s. 1) Physical Activities Regulations (SOR/2019-285) Designated Classes of Projects Order (SOR/2019-323) Information and Management of Time Limits Regulations (SOR/2019-283) Fisheries Act (R.S.C., 1985, c. F-14) Authorizations Concerning Fish and Fish Habitat Protection Regulations (SOR/2019-286); Metal Mining Effluent Regulations (SOR/2002-222) Canadian Environmental Protection Act (S.C. 1999, c. 33) PCB Regulations (SOR/2008-273) Environmental Emergency Regulations, 2019 (SOR/2019-51); Federal Halocarbon Regulations (SOR/2003-289) National Pollutant Release Inventory Species at Risk Act (S.C. 2002, c. 29) Canadian Wildlife Act (R.S.C., 1985, c. W-9) North American Lithium DFS Technical Report Summary – Quebec, Canada 284 Acts and Regulations Wildlife Area Regulations (C.R.C., c. 1609) Migratory Birds Convention Act, 1994 (S.C. 1994, c. 22) Migratory Birds Regulations (C.R.C., c. 1035) Nuclear Safety and Control Act (S.C., 1997, c. 9) General Nuclear Safety and Control Regulations (SOR/2000-202) Nuclear Substances and Radiation Devices Regulations (SOR/2000-207) Hazardous Products Act (R.S.C., 1985, c. H-3) Explosives Act (R.S.C., 1985, c. E-17) Transportation of Dangerous Goods Act (1992) Transportation of Dangerous Goods Regulations (SOR/2001-286) 17.4 SOCIAL AND COMMUNITY IMPACTS 17.4.1 Consultation Activities A public communication and consultation program was developed by the Project at the onset of exploration in 2009. The consultation component consisted of two separate phases; the first one being to provide regional representatives, as well as the general population, with information on the Project, and to invite them to share their concerns and expectations. The next step, which took place from January to May 2010, consisted of 18 meetings with stakeholders from various groups, i.e., representatives from the government, municipalities, the Council of the Abitibiwinni First Nation of Pikogan, recreational and tourism groups, and the general public. The second phase of the consultation program was held to notify stakeholders of the Project’s progress and to learn more about regional concerns and expectations. This second phase was carried out between October 2010 and March 2011. Thirty or so meetings were held with 27 stakeholder groups and, more specifically, representatives from governments, municipalities, the councils of the Abitibiwinni First Nation of Pikogan and the Anishnabe First Nation of Lac Simon, recreational and tourism groups, local and regional development agencies, environmental groups, and the general public. The stakeholders’ concerns were considered during Project planning. 17.4.2 Monitoring Committee The consultation process notably prompted various changes in the Project. It also resulted in the creation, in 2011, of a permanent monitoring committee comprised of Abitibi RCM citizens, regional representatives and representatives from the First Nation communities concerned; this committee aimed to ensure follow-up during the Project’s construction, operations and closing phases. The committee held its first meeting on November 15, 2011, and met regularly thereafter. Its mission was to act as a liaison between the population and the Project, and thereby favor the maximization of local spin-offs, prevent any possible problems and resolve any emerging issues. The committee also sought to promote a discussion of all questions or problems regarding the Project and its operations with an actual or potential

North American Lithium DFS Technical Report Summary – Quebec, Canada 285 major impact on the community or the living environment. In this regard, it has served as a tool for easily identifying possible social issues associated with the Project. It also encourages community members, interest groups and other stakeholders to ask questions, discuss their concerns and share their preoccupations as these arise. Over 15 meetings have been held since 2012. Discussions resumed in 2017 with the Lac-Simon and Pikogan communities for the ratification of an Impact Benefit Agreement (IBA). Several initiatives are planned in 2023 to maximize socioeconomic benefits for all stakeholders. 17.5 MINE CLOSURE AND RECLAMATION PLAN As per the provisions of Section 232.1 of the Mining Act (R.S.Q., c.M-13.1), any entity that engages in mining exploration activities must submit a restoration plan for its mining site. This restoration plan must be prepared according to the specific requirements of the MRNF’s document Guidelines for preparing a mining site rehabilitation plan and general mining site rehabilitation requirements. Since then, there have been amendments to the Regulation respecting mineral substances other than petroleum, natural gas, and brine (R.S.R.Q. section M-13.1, r.2). This regulation, which came into force on July 23, 2013, has a direct impact on the calculations for the financial guarantee and payment of the contribution to this guarantee for site restoration once the mining activities have ceased. The mining company must foresee the costs of restoring the entire site, as well as the costs associated with the closing and rehabilitation of the mining site, necessary for securing the area and returning it to a condition that is deemed compatible with its environment and that satisfies the expectations of the community and the government departments involved. A closure plan has been sent to MRNF at the beginning of December 2022. By the beginning of April 2023, MRNF had not provided Sayona Quebec with questions regarding the submitted closure plan. The main measures for restoring the mining site will include: • Stabilizing the natural water level, following the end of the pumping activities in the pit, at an elevation of around 410 m, which will transform the pit into a body of water. • Seeding the slope of the overburden over the entire perimeter of the pit. • Building a raised trench to prevent access to the pit. • Dismantling the infrastructure of the tailings site, e.g., power line, barge, conduits. • Reconfiguring the tailings site spillway so as to accommodate a freshet of 1:1,000 as well as the progressive flow of the runoff, based on the capacity, for receiving this flow, of the watercourses. • Comprehensive revegetation of the accumulation sites, i.e., tailings and waste rock, by spreading a layer of overburden and then covering it with topsoil before seeding. • Revegetation of the overburden dumps by covering them with topsoil before seeding. • For all ponds, breaching the dam and then filling with topsoil before seeding. North American Lithium DFS Technical Report Summary – Quebec, Canada 286 • Demolition and removal of all buildings and other surface infrastructure, including power lines, pipelines, etc. • Levelling of the process plant area and landscaping to restore the natural drainage system. • Revegetation of the process plant area by scarification, then covering it with topsoil before seeding. • Management of the matter generated during the dismantling of the facilities, by applying the principles of reduction, reuse, recycling, and reclamation and, if necessary, elimination of matter at authorized sites, according to the degree of contamination. • Execution of a land characterization study to identify the presence of contaminants with concentrations in excess of regulatory values and taking the necessary measures, in compliance with the provisions of the Environment Quality Act and the Land Protection and Rehabilitation Regulation. • Scarification of the roads built by NAL as part of the mining activities, restoring of the natural drainage and seeding. Some of the restoration works will be carried out during the mining operations, with the balance done at the end of the mine’s life. Lastly, the implementation of the proposed environmental monitoring program will allow for demonstrating that the restoration works have achieved their goals. 17.5.1 Financial Commitment for Mine Closure As part of approvals for the site restoration plan, the MRNF issued to the previous owners of the Project a schedule for providing the financial guarantees, i.e., closure bond, needed to cover the cost of closure. As of June 20, 2014, the total commitment was estimated by MRNF at $25,608,740. Sayona Quebec has already filled the guarantee fund for the total estimated cost. For the FS, BBA has estimated the closure and reclamation activities at $28.8M. North American Lithium DFS Technical Report Summary – Quebec, Canada 287 18. CAPITAL AND OPERATING COSTS The Project capital and operating costs in this study center around the addition of new infrastructure such as additional dry stack tailings facilities, basins, ditches, and various roads to the existing North American Lithium (NAL) facilities. These additions are required to achieve the production of approximately 190,000 tpy of spodumene concentrate. This chapter summarizes the capital and operating cost estimates related to the Project installations. 18.1 SUMMARY OF CAPITAL COST ESTIMATE For the original DFS, Sayona Quebec engaged BBA to provide estimates supporting various cost portions of the Project and integrate those prepared by Sayona Quebec. Contributions are listed below (Table 18-1). All costs in Canadian dollar (CAD or $). Table 18-1 – Capital cost estimate contributors. Scope / Responsibility Contributor(s) Concentrator – Incurred and Forecasted CAPEX BBA Infrastructure – Estimated CAPEX BBA Water Management and Treatment Facilities BBA Tailings Management Facilities (TMF) BBA Owner’s Costs Sayona Quebec The total estimated capital cost (-20% / +20%) of the Project facilities is estimated at $363.5M of which includes $35M for closure and rehabilitation activities. These costs are stated in constant dollars as of February 2023. This section describes the methodologies and basis for the preparation of the capital cost estimate for the pre-production cost expenditures (CAPEX). A breakdown of the capital expenditures is shown in Table 18-2 with capital expenditures over the LOM in annual increments shown in Table 18-3. Table 18-2 – Capital costs summary by major area ($M CAD). Cost Item CapEx ($M) Mining Equipment 105.6 Dry Stack Mobile Equipment 19.6 Pre-Approved Projects 26.9 Tailings Filtration Plant and Access Roads 80.6 Various Civil Infrastructure 37.6 Tailings Storage Facilities 53.4 Truck Shop Expansion 4.9 Reclamation & Closure 34.9 Total CAPEX 363.5 North American Lithium DFS Technical Report Summary – Quebec, Canada 288 Table 18-3 – Capital costs over LOM ($M CAD). CAPEX in $M CAD Total 2023 2024 2025 2026 2027 2028 2029 2030 2031 2032 2033 2034 2035 2036 2037 2038 2039 2040 2041 2042 Mine 109,9 6,3 4,4 0,0 0,4 70,4 2,0 0,0 0,2 0,3 2,3 1,5 8,3 8,2 0,3 0,3 3,0 0,8 1,1 0,0 Concentrator 218,7 72,0 51,3 31,5 11,8 6,0 8,0 0,1 9,8 2,3 6,1 5,7 0,0 2,4 0,0 3,7 1,9 2,3 3,7 0,1 Closure Cost 34,9 0,0 34,9 Total 363,5 78,3 55,7 31,5 12,1 76,5 10,0 0,1 10,0 2,7 8,4 7,1 8,3 10,6 0,3 4,0 4,9 3,2 4,8 0,1 34,9

North American Lithium DFS Technical Report Summary – Quebec, Canada 289 18.2 MINE CAPITAL EXPENDITURE 18.2.1 Mine Equipment Capital Cost Since the operation of the mine will be contracted out for the first 4 years, the majority of the mining equipment will be bought in the fifth year. The capital costs incurred within the first 4 years amount to $6.9M and consist of a wheel loader for ore re-handling at crusher, a hydraulic excavator for waste stripping, clearing, and grubbing as well as spare parts. The remaining capital costs amount to $98.8M and consist of mine equipment purchase and replacement, mine dewatering and other minor expenses. In addition to the mining fleet, the dry stacked tailings require transportation of dry tailings using a fleet consisting of: • Two articulated trucks. • One wheel loader. • One track type tractor. • Other: skid steer, pick-up truck, and tower lights. 18.2.2 Mine Development Capital There is no capital expenditure expected for mine development given that all the preproduction costs for mine development have already been spent prior to the publication of this Technical Report. The open pit mine has been rehabilitated. 18.3 PLANT CAPITAL EXPENDITURE There is no capital expenditure expected for the processing plant given that all the preproduction costs for processing have already been spent prior to the publication of this Technical Report. The processing plant has been rehabilitated. 18.4 INFRASTRUCTURE CAPITAL COST 18.4.1 Pre-Approved Projects At the time of publication, the plant commissioning is completed and ramp-up is underway. As planned, some elements of the Project approved by Sayona Quebec as part of the NAL restart continue beyond the start of operations. These projects include the following: • Construction and commissioning of the crushed ore dome. • Additional main substation transformer. • Miscellaneous refurbishing activities. North American Lithium DFS Technical Report Summary – Quebec, Canada 290 The estimated value for these projects corresponds to the approved budget used to control them. It is inclusive of direct, indirect, related owner’s costs, pre-operational verification, commissioning, operational readiness, and contingencies. 18.4.2 Estimated Projects A class 3 capital cost estimate according to AACE International was prepared for the tailings filtration plant as well as for the tailings and waste rock storage facilities additions and expansions. The estimating methodology applied for the development of these cost estimates is described herein. The truck shop expansion capital cost estimate is based on a reference project for a similar facility. 18.4.3 Direct Costs Direct costs include all of the equipment, material and labor costs associated with the physical construction of the permanent facilities, and include: • Purchase and installation of bulk materials. • Construction labor. • Scaffolding. • Contractors’ temporary construction facilities, power, and water. • General construction equipment, e.g., cranes, excavators, man lifts, tools, etc. • Contractors’ labor, including overhead and profit. 18.4.3.1 Mechanical Equipment Budgetary pricing was obtained for all major mechanical equipment supply. Installation hours were estimated based on estimator experience from previous projects and input from engineering. 18.4.3.2 Bulk Materials Bulk material estimates were developed from commodity descriptions and engineering generated material take-offs (MTOs). 18.4.3.3 Site Preparation, Earthworks, Roadworks, and Drainage The estimates for earthworks and roadworks were prepared on the following basis: • The existing site drainage system is assumed to have adequate capacity to handle any increases in flow rates resulting from the actual planned work. Other drainage infrastructure is to be constructed to account for additional waste dumps, pads, and haul roads. Their construction will be sequenced in phases. • Site soils are assumed to be non-contaminated. North American Lithium DFS Technical Report Summary – Quebec, Canada 291 18.4.3.4 Concrete The estimates for concrete works were prepared on the following basis: • The foundation quantities were calculated based on current knowledge of loads and layout information. • Equipment foundations were estimated based on descriptions from loads and dimensions supplied by engineering. • Quantities were grouped by foundation elements such as piers, footings, slabs, walls, etc. • The unit cost of all concrete includes costs for rebar, formwork installation/stripping, embedded metals, and finishing. Man-hours for placement and formation of concrete elements were based on quotes and database information for projects of a similar nature and concrete structure, i.e., slab on grade, footing, elevated slab, etc. 18.4.3.5 Steel work The estimates for structural steel and miscellaneous steel work and rework were prepared on the following basis: • Steel quantities were grouped by steel member density classifications, i.e., industry standard light, medium and heavy categories, as well as quantities for handrail, grating, stairs, etc. • Steel quantities include an allowance for connection to structural members, i.e., bolts, lifting lugs, etc. The structural steel unit costs include material supply, connection design, detailing, fabrication, surface treatment, painting, coating, and delivery to site. Steel work erection man-hours were based on quotes and historical data from projects of a similar nature. 18.4.3.6 Architectural The estimates for architectural components were prepared on the following basis: • Architectural quantities were grouped by commodity, (i.e.: roofing, siding, partitions, door counts, heating, and lighting, etc.). • Architectural quantities include costs for flashing, joint sealing, wall/roof openings, etc. Quantities for siding and roofing were based on engineering calculations. Costs of all architectural elements were priced using a database of recent historical costs and recent budgetary quotes. North American Lithium DFS Technical Report Summary – Quebec, Canada 292 18.4.3.7 Piping The estimates for piping works were prepared on the following basis: • Pricing was based on recent budgetary quotations for supply of pipe and estimator experience for field installation man-hours. • Pricing and installation man-hours were based on medium complexity piping lines, which included an average number of fittings per length of pipe. • Estimators provided allowances for valves, painting, tie-ins, flushing and testing of lines. • Pipe insulation was priced using a database of recent historical costs as well as recent budgetary quotes. 18.4.3.8 Electrical The estimates for electrical works were prepared on the following basis: • Pricing was based on recent budgetary prices for the supply of electrical equipment as well as all cables. • Cable tray pricing was based on recent budgetary prices and historical installation man-hours. • Field installation man-hours were estimated from recent projects in Québec and compared against recognized industry standards. 18.4.3.9 Instrumentation and Controls The estimates for instrumentation and controls were prepared on the following basis: • Pricing was based on recent budgetary prices for the supply of instrumentation equipment as well as all cables. • Field installation man-hours were estimated from recent projects in Québec and compared against recognized industry standards. 18.4.3.10 Pricing Sources Pricing came from one of the following categories: • Bid contract proposals. • Fixed price quotations for equipment. • Budgetary quotations from reputable sellers. • Database of historical data. • Allowance: estimator-generated with engineering feedback.

North American Lithium DFS Technical Report Summary – Quebec, Canada 293 18.4.3.11 Design Growth Design growth is development in engineering quantities in the detailed engineering (FEL-4) phase of a project and is seen in virtually every project during execution. Table 18-4 shows the quantity growth factors applied to the engineered quantities. Table 18-4 – Design growth. Discipline Design Growth Excavation volumes 15% Backfill volumes 20% Concrete 7.5% Structural Steel 10% Piping 10% Instrument Wire and Cable 15% 18.4.3.12 Labor Direct field labor is the skilled and unskilled labor required to install permanent equipment and bulk materials at the Project site. Direct field installation man-hours were developed using estimated unit man-hours for each commodity, multiplied by the final quantity. Adjustments to standard man-hours were made using productivity factors to reflect the specific conditions at the Project site, such as climate, physical extent of the site, working schedule, industrial environment, etc. Two different labor rates per discipline were considered in response to the mix of greenfield and brownfield works at the site. The ‘all-in’ labor rates used in the estimate were calculated from first principles based on Québec collective agreements ending in 2025. The base labor rates reflect 50 working hours per week, based on 10 hours per day and 5 days per week. The base labor rates included the following wage-related components: • Base wage rates. • Medical, vacation benefits. • Pension. In addition, the following contractor overhead costs were included in the all-inclusive labor rate: • Small tools and consumables. • General construction equipment (man lifts, boom trucks). • Safety. • Travel costs. • Contractor’s home office costs. • Site office operations. North American Lithium DFS Technical Report Summary – Quebec, Canada 294 • Contractors’ site supervision. • Contractors’ overhead and profit. A combined crew rate was developed to account for a 50-hour work week: 10 h/d and 5 d/wk. The all- inclusive construction labor rates are listed in Table 18-5. 18.4.3.1 Labor Productivity The Project was considered to have both a greenfield and a brownfield component, with the greenfield man-hours being reflective of typical northeastern Canada productivity. The brownfield man-hours were a result of the baseline hours multiplied by a corresponding productivity loss factor reflecting the increased complexity. Contractor non-direct labor, such as site supervisory and field support staff, is included in the indirect portion of the all-inclusive labor rate. Table 18-6 summarizes the greenfield and brownfield labor productivities used for the estimate. Table 18-5 – Labor rate summary (Phase 2). Discipline Rates ($) Civil Works $205.20 Concrete Works = Formworks + Reinforcement + Concrete $135.90 Structural Works = Unload + Shake out / Erect + Plumb $173.15 Architectural $134.80 Mechanical $163.45 Piping $154.70 Insulation $127.90 Electrical $143.70 Automation and Telecommunications $138.05 Average $154.20 Table 18-6 – Labor productivity factors (Phase 2). Activity Productivity loss factor Site Development 1.2 Concrete Works 1.3 Structural Elements 1.3 Architectural Finishes 1.3 Mechanical Components 1.3 Piping and Fittings 1.4 Electrical 1.3 Process Control 1.3 Multidisciplinary 1.3 North American Lithium DFS Technical Report Summary – Quebec, Canada 295 18.4.4 Indirect Costs 18.4.4.1 EPCM Costs for EPCM services were factored, a value of 18% was applied for the filtration plant while a value of 10% was applied for the tailings, waste stockpile and water management infrastructure. 18.4.4.2 Temporary Site Costs Construction infrastructure requirements are considered mostly already existing on-site and, as such, a minimal allowance of 2% of direct costs was applied for temporary site installations. 18.4.4.3 Commissioning Services Commissioning services include the costs for testing the quality and conformance of final product deliverables. An allowance was made for the personnel required for this activity and was estimated at 3.5% of equipment supply cost. 18.4.4.4 Vendor Representatives / Technical Assistance A vendor representation and technical assistance cost allowance, to provide technical support during the commissioning of major equipment, was based on 1.5% of equipment supply costs. 18.4.4.5 Commissioning Spare Parts Commissioning spare parts are usually included in a list from the client. In this case, no list was provided; therefore, an allowance of 1.5% of equipment costs. 18.4.4.6 First Fills An allowance for the first fills was made for all major and secondary equipment. This includes costs for reagents, oils, and consumables to achieve inventory levels for start-up operations. This cost was estimated at 1% of equipment costs. 18.4.4.7 Freight The freight costs for all equipment from a vendor’s warehouse to site are included as a percentage of the total equipment cost. This was evaluated at 12% of equipment costs, based on the remote location of the site. North American Lithium DFS Technical Report Summary – Quebec, Canada 296 18.4.4.8 Owner’s Costs Owner’s costs are normally provided by the Owner. In the absence of this information, these costs have been estimated as being 2% of direct costs, which is meant to cover the Owner’s project management team, plus their expenses during the execution phase. 18.4.4.9 Project Contingency An allowance of 15% of direct and indirect costs was applied for contingency. For the filtration plant this represents $9.6M, while it represents $2.5M for the tailings, waste rock and water management infrastructure. 18.4.4.10 Exclusions The following items are considered excluded from the capital cost estimate: • Escalation beyond estimate base date. • Taxes and duties. • Schedule acceleration or schedule extension costs. • Schedule delays and associated costs, such as those caused by: o Unexpected site conditions. o Unidentified ground conditions. • Development fees and approval costs of statutory authorities. • Cost of any disruption to normal operations. • Foreign currency changes from Project exchange rates. • Working and sustaining capital. • Force majeure. • Permits, i.e., construction and environmental. • Event risk. • Operator management fees. • Costs associated with third party delays. • Changes in laws and regulations. • Soil decontamination and disposal costs. • Technology fees, if any. 18.4.5 Closure and Rehabilitation Closure and reclamation costs include a post-closure monitoring/inspection program, engineering, contracts, supervision, reporting, removal of Project infrastructure, (i.e., ponds, buildings, electrical poles,

North American Lithium DFS Technical Report Summary – Quebec, Canada 297 tanks, roads, etc.), and site restoration activities as per the Project site restoration plan submitted to governmental agencies. Reclamation and closure costs for the Project have been evaluated to be $34.9M. 18.5 SUMMARY OF OPERATING COST ESTIMATE The operating cost estimate was based on Q1 2023 assumptions. The estimate has an accuracy of ±15- 15% and does not include any contingency. Mining, process, and tailings management are generally itemized in detail; however, General and Administration (G&A) items, such as training, are calculated estimates and have been included as an allowance. Many items of the operating cost estimate are based on firm supply quotations, budgetary quotations, NAL supplied costs and allowances based on in-house data. The overall estimate combined inputs from BBA and Sayona Quebec. Costs are based on the Ore Reserve Estimate and LOM plan, presented in chapters 15 and 16 respectively. All mine site staff and administration personnel will work 10-hour shifts on a 4 days (on) / 3 days (off) basis. Contracted mine operations will work 12-hour shifts. For the process plant (concentrator), operations crews will work on the basis of two 12-hour shifts. There will be four shift crews rotating on a 7 days on) / 7 days (off) schedule. The most process plant maintenance personnel will work 8-hour shifts on a 5 days (on) / 2 days (off) basis. North American Lithium DFS Technical Report Summary – Quebec, Canada 298 Table 18-7 – NAL Operating Costs per year ($M CAD) Operating Costs - $M CAD To ta l 2 0 2 3 2 0 2 4 2 0 2 5 2 0 2 6 2 0 2 7 2 0 2 8 2 0 2 9 2 0 3 0 2 0 3 1 2 0 3 2 2 0 3 3 2 0 3 4 2 0 3 5 2 0 3 6 2 0 3 7 2 0 3 8 2 0 3 9 2 0 4 0 2 0 4 1 2 0 4 2 Ore from Authier 1120,0 30,3 63,1 71,0 64,8 64,6 64,6 64,7 63,6 62,8 63,5 63,2 62,8 65,2 63,4 62,9 63,0 62,8 63,5 Mining Costs 956,1 79,1 86,0 95,9 71,5 67,8 52,7 52,5 57,5 53,6 37,8 42,4 39,7 33,6 33,0 34,9 25,8 30,4 29,7 21,0 11,0 Processing Costs 829,2 26,6 43,9 42,2 42,3 47,2 42,1 42,4 42,7 42,6 42,5 41,7 42,2 41,7 41,4 42,6 41,4 41,8 41,2 41,1 39,5 SG&A 394,7 17,4 19,9 19,9 19,9 19,9 19,9 19,9 19,9 19,9 19,9 19,9 19,9 19,9 19,9 19,9 19,9 19,9 19,9 19,9 19,9 Water Treatment 8,6 0,2 0,5 0,4 0,4 0,5 0,4 0,4 0,4 0,4 0,4 0,4 0,4 0,4 0,4 0,4 0,4 0,4 0,4 0,4 0,4 Tailing 79,1 0,0 0,0 2,2 4,4 5,0 4,5 4,5 4,5 4,5 4,5 4,5 4,5 4,5 4,5 4,5 4,5 4,5 4,5 4,5 4,5 Total 3387,8 123,3 150,2 190,9 201,6 211,4 184,4 184,2 189,6 185,7 168,7 171,8 170,1 163,4 162,1 167,6 155,5 159,9 158,8 149,7 138,8 North American Lithium DFS Technical Report Summary – Quebec, Canada 299 18.6 MINE OPERATING COST The mine operating costs are based on the Ore Reserves Estimate and LOM plan, presented respectively in Chapters 12 and 13. General rates used in the estimate are summarized in Table 18-8. The mine operating expenditures (OPEX) are estimated based on current contract mining costs at the site for the first 4 years of operations. In 2027, Sayona Quebec will purchase a mining fleet to begin an owner- operated operation for the remaining mine life. The remaining LOM operating expenditures were estimated on suppliers’ quotes and/or an internal database. Table 18-9 presents the unit mine OPEX over the LOM. Table 18-8 – General rate assumptions. Factor Unit Value Mining (Tonnes Ex-pit) – LOM Mt 201.0 Mining (Ore Tonnes Ex-pit) – LOM Mt 21.6 Plant Initial Capacity (Rod Mill Feed) tpd 3,800 Plant Final Capacity (rod mill feed) tpd 4,200 Mine Life year 20 Total Mill Feed Tonnage Including Authier Mt 31.0 LOM Concentrate Production Mt 3.8 Exchange Rate US:CAD 0.75 Electricity $/kWh 0.053 Diesel Fuel $/L 1.16 Table 18-9 – Mine operating costs. OPEX $/t Ex-Pit (CAD) Mining Contractor * 1.52 Reclaim (ROM Pad only) 0.20 Equipment (parts, repairs, tires and GET tools) 0.84 Fuel 0.56 Salaries 0.97 Blasting 0.34 Services (dewatering, road maintenance, rentals, etc.) 0.32 Total Mine Operating Cost $4.75 *Cost per tonne provided on total LOM Ex-Pit tonne The mine operating costs are presented in 2023 constant dollars. Over the LOM it is anticipated that approximately 116.6 ML of diesel fuel, 6.9 ML/y on average, will be consumed by the mining fleet. North American Lithium DFS Technical Report Summary – Quebec, Canada 300 The mining contractor is responsible for providing all personnel for mine operations, maintenance, and related supervision. The mine personnel will peak at around 121 employees in Year 2030 with an owner- operated fleet, due to longer haulage distances, which increases the number of trucks. 18.7 PLANT OPERATING COST The operating cost estimate for the concentrator includes all expenses incurred to operate the processing plant from Year 1 through Year 20 at a design crusher throughput of 4,588 tpd, which is the estimated capacity for operation. The design feed to the concentrator rod mill is 4,200 tpd or 175 tph at 93% plant availability. The concentrator operating costs are based on the mine plan, as described in Chapter 13, and are estimated to be $837.2M over a mine life of approximately 20 years. It is expected that 31 Mt of ore (21.7 Mt of ore from NAL and 9.3 Mt ore from Authier) will be processed; producing approximately 3.8 Mt of spodumene concentrate (5.40 to 5.82.0% Li2O). The average operating cost of the concentrator over the life of the mine is estimated to be 27$/t of ore crushed (220.27$/t concentrate). A breakdown of the concentrator operating costs is shown in Table 18-10 and represented by a pie chart in Figure 18-1. Water treatment costs include only the treatment of process water done by multimedia filters. Treatment costs for water released to the environment are not included in the concentrator operating costs. Table 18-10 – Concentrator operating costs. Sector LOM ($M) Average Annual ($M) Cost per Tonne Crushed ($/t) Cost per Tonne Concentrate ($/t) Concentrator OPEX (%) Reagents 156.5 7.9 5.05 41.16 18.7 Consumables 126.3 6.4 4.07 33.23 15.1 Grinding Media 89.6 4.5 2.89 23.57 10.7 Personnel 283.6 14.3 9.15 74.63 33.9 Staff and Labour 269.2 13.6 8.68 70.82 32.2 Contractors 14.5 0.7 0.47 3.81 1.7 Water Treatment 8.8 0.4 0.28 2.31 1.1 Utilities 120.9 6.1 3.90 31.80 14.4 Power 119.3 6.0 3.85 31.39 14.3 Fuel (Natural Gas) 1.6 0.1 0.05 0.41 0.2 Laboratory 51.5 2.6 1.66 13.56 6.2 Total 837.2 42.2 27.00 220.27 100%

North American Lithium DFS Technical Report Summary – Quebec, Canada 301 Figure 18-1 – Concentrator operating costs. 18.7.1 Personnel A total of 86 employees, 28 salaried and 58 hourly, divided into management, operations and maintenance departments are required in the concentrator. These employees make up the personnel list as presented in Chapter 14. Salaries, benefits, and bonuses were provided by NAL. Some salaried personal costs are included in G&A costs. The estimated personnel cost (salaried and hourly combined), excluding the portion attributed to G&A, represents approximately 34% of the total concentrator operating cost at 9.15$/t crushed (74.63$/t concentrate). 18.7.2 Power The power demand estimate for the concentrator is based on historic values from site operation plus power demand determined for additional equipment required for the NAL process plant. The power demand for the concentrator is approximately 15.56 MW and the estimated annual energy consumption is 111.46 GWh. The electrical power of the process plant represents approximately 14% of the total operating costs for the concentrator at 3.85$/t crushed (31.39$/t concentrate). The largest power consumers within the concentrator are the crushers, rod, and ball mills. 18.7.3 Grinding Media The consumption rates for the grinding media were calculated using Bond’s correlations, which give the wear rate in pounds of metal wear per kilowatt-hour (lb/kWh) of energy used in the comminution process. North American Lithium DFS Technical Report Summary – Quebec, Canada 302 The input data considered the abrasion index, which was determined from testwork, the nominal throughput and the nominal power draw of each mill. The wear and annual media consumption rates for each type are presented in Table 18-11. Table 18-11 – Average LOM media wear and consumption rates. Media Type Wear Rate (lb/kWh) Annual Consumption (tonnes) Rod Mill – steel rods 0.306 949 Ball Mill – steel balls 0.282 849 Grinding media represents approximately 10.7% of the total operating cost for the concentrator at 2.89$/t crushed (23.57$/t concentrate). 18.7.3.1 Reagents The reagent consumptions were estimated based on testwork, industrial references and historical plant consumptions from 2023. The reagent unit costs ($/t reagent) were established through recent vendor quotations and comparison to prices at reference sites and include delivery to site. The reagents represent approximately 18.7% of the total concentrator operating costs at 5.05$/t crushed (41.16$/t concentrate). 18.7.3.2 Equipment consumables The replacement costs for major equipment consumables, such as crushing and grinding equipment’s wear parts and liners, screen decks, filter cloths and ore sorter spares, were calculated based on recommended change-out schedules, budgetary quotations, and BBA’s internal database. A 5% allocation for other maintenance costs is also included. Equipment consumables represent approximately 15.1% of the total concentrator operating costs at 4.07$/t crushed (33.23$/t concentrate). 18.7.3.3 Laboratory Laboratory costs include a fixed price for labor as well as a variable cost for analytical tests and testwork to be completed. The laboratory cost represents approximately 6.2% of the total concentrator operating costs at 1.66$/t crushed (13.56$/t concentrate). North American Lithium DFS Technical Report Summary – Quebec, Canada 303 18.7.3.4 Contractors Contractor assistance will be required to support NAL during operations of the concentrator. Contractor costs were provided by NAL. Contractors represent 1.7% of the total operating cost for the concentrator at 0.47$/t crushed (3.81$/t concentrate). 18.7.3.5 Fuel Initially the Project will use propane and natural gas, when the conversion plant is in operation, to heat the crusher and concentrator buildings. The total fuel costs for the concentrator are estimated at approximately 0.2% of the total operating costs at 0.05$/t crushed (0.41$/t concentrate). 18.7.3.6 Water Treatment and Tailings Management Part of the process water will be treated by multimedia filters and will service the requirements for reagents preparation and equipment gland seals. Water treatment costs for the concentrator do not cover the treatment of water rejected to the environment nor tailings pond water. Water treatment represents 1.1% of the total operating cost for the concentrator at 0.28$/t crushed (2.31$/t concentrate). The environmental discharge water treatment operating costs were estimated and are based on operating a rented water treatment plant, which can be expanded as required to meet annual water treatment requirements. This area includes the costs to rent, operate and maintain a reverse osmosis water treatment plant. Based on the preliminary water balance, it is expected that approximately 1.3M m3 of clean water will be discharged from the TMF water treatment plant to the environment at the peak of Project operations. The tailings operating cost is presented in Table 18-12 and its breakdown in Figure 18-2. Table 18-12 – Tailings operating costs. Tailings OPEX $M (LOM) $/t (wet) tailings Parts & Repair 33.8 0.9 Fluids and Fuel 23.7 0.6 Labour (Maintenance) 15.5 0.4 Labour (Operator) 42.8 1.1 Total 115.8 3.09 North American Lithium DFS Technical Report Summary – Quebec, Canada 304 Figure 18-2 – Tailings operating cost breakdown. 18.8 G&A G&A costs are expenses not directly related to the production of goods and encompass items not included in the mining, processing, refining, water treatment and transportation costs of the Project. G&A costs for the operations phase were established by Sayona Quebec based on their current knowledge of the site costs and the proposed operational structure. Costs were estimated by area and include provisions for business sustainability, finance, environment and permitting, human resources, procurement, training, health, safety, security, technology, supply chain, site administration and general management. The G&A costs are estimated to be $22.4M annually over the mine’s planned 20 years of operation. 18.9 PRODUCT TRANSPORT AND LOGISTICS The transport and logistics costs for shipping the primary products, i.e., spodumene concentrate over the LOM were estimated. Spodumene concentrate will be bulked transported by truck from the mill to a rail trans boarding facility in Val-d’Or were concentrated will be transferred into a mineral covered railcar gondolas and then shipped on CN’s mainline to the Québec City port. The transport and logistics fees were evaluated based on typical industry bulk transport terms, budgetary quotations, BBA’s in-house database and information provided by NAL. Total LOM transport costs are estimated to be $135.3M or approximately $30M/y for the first 4 years. Since Sayona Quebec plans to transform spodumene at its on-site carbonate plant from 2027, supply chain will be re-engineered to transport carbonate in big bags.

North American Lithium DFS Technical Report Summary – Quebec, Canada 305 19. ECONOMIC ANALYSIS The economic/financial assessment of the Project was carried out using a discounted cash flow approach on a pre-tax and after-tax basis, based on lithium forecasts in U.S. currency and cost estimates in Canadian currency. An exchange rate of $0.75 USD to $1.00 CAD was assumed to convert USD market price projections and particular components of the initial capital cost estimates into CAD. No provision was made for the effects of inflation as real prices and costs were used in the financial projections. Current Canadian tax regulations were applied to assess the corporate tax liabilities, while the most recent provincial regulations were applied to assess the Québec mining tax liabilities. The Project has been evaluated using a discounted cash flow (DCF) analysis. Cash inflows consist of annual revenue projections. Cash outflows consist of capital expenditures, including sustaining capital costs, operating costs, and taxes. These are subtracted from the inflows to arrive at the annual cash flow projections. To reflect the time value of money, unlevered free cash flow (UFCF) projections are discounted back to January 2023 using a discount rate. For this evaluation, a base case discount rate of 8% has been assumed. The discounted present values of the cash flows are summed to arrive at the Project’s net present value (NPV). The internal rate of return (IRR) on total investment was calculated based on 100% equity financing. The IRR is defined as the discount rate that results in a NPV equal to zero. The Project’s payback period, which does not consider the time value of money, is calculated as the time required to achieve positive cumulative cash flow. Furthermore, an after-tax sensitivity analysis has been performed to assess the impact of variations in spodumene concentrate prices, USD:CAD exchange rate, operating costs, project capital costs and sustaining costs on IRR and NPV at different discount rates, i.e. 0%, 5%, 8%, 10%, and 12%. The economic analysis presented in this section contains forward-looking information regarding the Mineral Resource estimates, commodity prices, exchange rates, proposed mine production plan, projected recovery rates, operating costs, construction costs and the project schedule. The results of the economic analysis are subject to several known and unknown risks, uncertainties and other factors that may cause actual results to differ materially from those presented here. 19.1 ECONOMIC INPUTS, ASSUMPTIONS & KEY METRICS The financial analysis was performed using the following assumptions and basis: • The economic analysis has been done on a Project basis and does not take into consideration the timing of capital outlays that were completed prior to the date of this Report. • The financial analysis was based on the Mineral Reserves presented in Chapter 12, the mine and process plan and assumptions detailed in Chapters 13 and 14, the marketing assumptions in North American Lithium DFS Technical Report Summary – Quebec, Canada 306 Chapter 16, the capital and operating costs estimated in Chapter 18 and by taking into consideration key Project milestones as detailed in Chapter 21. • The analysis was performed based on fiscal years (FYs) as opposed to calendar years, unless specified otherwise. The fiscal years begin on July 1st and end on June 30th. • Commercial production of spodumene concentrate is scheduled to begin in the second quarter (Q2) of 2023 model Year 1. • Exchange rates: An exchange rate of $0.75 USD to $1.00 CAD was used to convert the USD market price projections into Canadian currency. The sensitivity of the base case financial results to variations in the exchange rate was examined. Those cost components, which include U.S. content originally converted to Canadian currency using the base case exchange rate, were adjusted accordingly. • Discount rate: A discount rate of 8% has been applied for the NPV calculation. • The long-term prices of spodumene concentrate were estimated based on market studies, discussions with experts and recent lithium price forecasts (Chapter 16) and Piedmont contract prices. Revenue up to fiscal year 2026 is based on 50% of the concentrate sales at average benchmarked spodumene market prices and the remaining 50% of concentrate sales to the Piedmont Lithium contract price. • Selling costs are the transport and logistics costs of the concentrate to the Quebec City port facility. • The products are sold in batches of 30 kt. The 30-kt shipment intervals were used for Sayona Quebec to accumulate sufficient inventory to achieve a full boatload for shipping cost efficiency. • Class specific capital cost allowance rates are used for the purpose of determining the allowable taxable income. • The financial analysis was performed on Proven and Probable Mineral Reserves as outlined in this Report. • Tonnes of concentrate are presented as dry tonnes. • Discounting starts on January 1st, 2023. • Authier ore is purchased at $120 CAD/t. • All costs and sales are presented in constant Q1-2023 CAD, with no inflation or escalation factors considered. • All related payments and disbursements incurred prior to the end of Q2-2023 are considered as sunk costs. • Royalties: North American Lithium (NAL) is not subject to royalty payments. • The accuracy of this CAPEX estimate has been assessed at ±20%. This financial analysis was performed on both a pre-tax basis and an after-tax basis with the assistance of an external tax consultant. The general assumptions and key outcomes of the financial model are summarized in Table 19-1. North American Lithium DFS Technical Report Summary – Quebec, Canada 307 Table 19-1 – NAL operation including Authier ore supply – Financial analysis summary. Metrics Unit Value Life of Mine year 20 Processing: Average Annual Ore Feed to Plant Mtpa 1.4 Mining: Total Material Mined Mt 201.1 LOM - Mill daily throughput tonne/day 4,200 Years 1-4 average1 concentrate production tonne 226,000 After year 5 to end of LOM average2 concentrate production tonne 185,814 LOM average annual concentrate production tonne 190,039 Years 1-4 recovery3 % 70.2 Years 5-20 recovery3 % 66.3 Average LOM recovery % 67.4 Average Blended Crusher Feed Grade % Li2O 1.0 Average LOM strip ratio waste:ore 8.3 LOM Spodumene Concentrate Market Price USD/t 1,352 CAD / US$ assumption CAD / USD 0.75 5 years Cumulative FCF $ million 1,005 Project Total LOM Capital Cost $ million 363.5 Total Net Revenue $ million 6,818 Project EBITDA $ million 3,318 Mining cost $/t mined 4.75 Milling cost $/t milled 27.00 AISC $/t conc 987 Total Cash Cost $/t conc 817 Pre‐Tax Net Present Value (NPV) $ million 2,001 Pre‐Tax Internal Rate of Return (IRR) % 4,701 Discount Rate % 8 Pre‐Tax Project payback period year N/A After‐tax NPV $ million 1,367 After‐tax payback period year N/A After‐tax IRR % 2,545 Notes: 1. Excluding ramp up time of 6 months. Producing spodumene concentrate @ 5.4% 2. Feed for Sayona Quebec carbonate plant. 3. Carbonate plant project start-up by fourth year. Key outcomes of the North American Lithium (NAL) Definitive Feasibility Study (DFS) include an estimated pre‐tax NPV of $2,001 million (8% discount rate) and a pre‐tax IRR of 4,701%. Life of mine is now 20 years, based on an estimated Proven and Probable Mineral Reserves of 21.7 Mt @ 1.08% Li2O (Proven Reserve 0.7 Mt @ 1.24% Li2O and Probable Reserve 21.0 Mt @ 1.08% Li2O) for NAL and the inclusion of the Authier Lithium Project’s Proven and Probable Mineral Reserves. Table 19-2shows cashflows over the LOM for the NAL Project. North American Lithium DFS Technical Report Summary – Quebec, Canada 308 Table 19-2 – NAL operation including Authier ore supply – Cashflow over LOM. Detailed Period Total 2023 2024 2025 2026 2027 2028 2029 2030 2031 2032 2033 2034 2035 2036 2037 2038 2039 2040 2041 2042 NAL - Production Summary Waste Rock (Mt) 172,3 9,2 15,3 17,5 13,4 13,5 13,3 14,1 14,8 12,2 7,1 8,8 7,2 5,1 4,7 5,2 2,4 3,8 3,2 1,6 0,1 Overburden (Mt) 4,4 1,0 0,6 0,7 0,6 1,6 0,0 0,0 0,0 0,0 0,0 0,0 0,0 0,0 0,0 0,0 0,0 0,0 0,0 0,0 0,0 ROM (Ore to Plant (Mt) 21,7 1,1 1,6 1,4 1,1 1,1 1,0 1,0 1,1 1,1 1,1 1,0 1,0 1,0 1,0 1,1 1,0 1,0 1,0 1,0 0,9 Stripping Ratio 8,1 9,4 9,7 13,3 13,1 14,2 12,8 13,5 13,9 11,5 6,7 8,5 6,9 4,9 4,6 4,9 2,4 3,6 3,1 1,5 0,1 Ore From Authier (Mt) 8,5 0,5 0,5 0,5 0,5 0,5 0,5 0,5 0,5 0,5 0,5 0,5 0,5 0,5 0,5 0,5 0,5 0,5 Operating Costs - CAD $ M Total 2023 2024 2025 2026 2027 2028 2029 2030 2031 2032 2033 2034 2035 2036 2037 2038 2039 2040 2041 2042 Ore from Authier 1120,0 30,3 63,1 71,0 64,8 64,6 64,6 64,7 63,6 62,8 63,5 63,2 62,8 65,2 63,4 62,9 63,0 62,8 63,5 Mining Costs 956,1 79,1 86,0 95,9 71,5 67,8 52,7 52,5 57,5 53,6 37,8 42,4 39,7 33,6 33,0 34,9 25,8 30,4 29,7 21,0 11,0 Processing Costs 829,2 26,6 43,9 42,2 42,3 47,2 42,1 42,4 42,7 42,6 42,5 41,7 42,2 41,7 41,4 42,6 41,4 41,8 41,2 41,1 39,5 SG&A 394,7 17,4 19,9 19,9 19,9 19,9 19,9 19,9 19,9 19,9 19,9 19,9 19,9 19,9 19,9 19,9 19,9 19,9 19,9 19,9 19,9 Water Treatment 8,6 0,2 0,5 0,4 0,4 0,5 0,4 0,4 0,4 0,4 0,4 0,4 0,4 0,4 0,4 0,4 0,4 0,4 0,4 0,4 0,4 Tailing 79,1 0,0 0,0 2,2 4,4 5,0 4,5 4,5 4,5 4,5 4,5 4,5 4,5 4,5 4,5 4,5 4,5 4,5 4,5 4,5 4,5 Total 3387,8 123,3 150,2 190,9 201,6 211,4 184,4 184,2 189,6 185,7 168,7 171,8 170,1 163,4 162,1 167,6 155,5 159,9 158,8 149,7 138,8 Capital - CAD $M Mine 109,9 6,30 4,43 0,00 0,37 70,45 1,96 0,00 0,20 0,34 2,30 1,47 8,30 8,17 0,34 0,34 2,97 0,83 1,10 0,00 Concentrator 218,7 72,04 51,30 31,51 11,78 6,03 8,01 0,07 9,80 2,33 6,10 5,67 0,00 2,39 0,00 3,70 1,91 2,33 3,70 0,07 Closure Cost 34,9 34,90 Total 363,5 78,34 55,74 31,51 12,14 76,48 9,97 0,07 10,00 2,67 8,40 7,13 8,30 10,57 0,34 4,04 4,87 3,16 4,80 0,07 34,90 Revenues - CAD $M Net Revenues 6817,7 552,97 918,19 401,66 340,40 450,19 405,29 325,73 323,39 298,97 297,56 245,45 244,98 249,48 236,34 258,33 271,14 257,20 277,05 254,80 208,56

North American Lithium DFS Technical Report Summary – Quebec, Canada 309 19.2 PRODUCTS CONSIDERED IN THE CASH FLOW ANALYSIS 19.2.1 Spodumene Concentrate Production The run‐of‐mine ore from Authier will be transported to the NAL site where it will be blended with the NAL ore material using a ratio of 33% Authier / 67% NAL, and then fed to the primary crusher. NAL and Authier mines will produce a total of 3.8 Mt of spodumene concentrate, which is approximately 190 kt per year over the life of mine (LOM). Figure 19-1 presents the expected concentrate production of the NAL concentrator. The production levels and mill feed by source are detailed in Figure 19-2. Figure 19-1 – Production of spodumene concentrate of the LOM. North American Lithium DFS Technical Report Summary – Quebec, Canada 310 Figure 19-2 – NAL open pit production profile and Authier ore supply. 19.3 TAXES, ROYALTIES AND OTHER FEES 19.3.1 Royalties There are no royalties associated with the Project. 19.3.2 Working Capital The change in working capital is included in the calculation of both the pre-tax and post-tax cashflow. The major categories of working capital are: • Accounts receivable. • Accounts payable. • Deferred revenue. • Inventory. Net Cash Flow (NCF) projections presume that NAL sells spodumene in batches of 30,000 dry tonnes, which impacts working capital and, by extension, the timing of cash flows. 19.3.3 Salvage Value Salvage value has not been applied in the financial model. 19.3.4 Taxation The Project is subject to three levels of taxation: federal corporate income tax, provincial corporate income tax, and provincial mining taxes. NAL compiled the taxation calculations for the Project with assistance from third-party taxation experts; however, this information was not verified by the authors. The current Canadian tax system applicable to Mineral Resource income was used to assess the annual tax liabilities for the Project. This consists of federal and provincial corporate income taxes, as well as provincial mining taxes. The federal and provincial (Québec) corporate income tax rates currently applicable over the operating life of the Project are 15.0% and 11.5% of taxable corporate income, respectively. The marginal tax rates applicable under the Mining Tax Act in Québec are 16%, 22% and North American Lithium DFS Technical Report Summary – Quebec, Canada 311 28% of taxable income and are dependent on the profit margin. It has been assumed that the 20% processing allowance rate associated with transformation of the mine product to a more advanced stage within the province would be applicable in this instance. The tax calculations are based on the following key assumptions: • The Project is held 100% by a corporate entity carrying on its activities solely in La Corne, Québec, and the after-tax analysis does not attempt to reflect any future changes in corporate structure or property ownership. • Financing is with 100% equity and, therefore, does not consider interest and financing expenses. • Tax legislation, i.e., federal, provincial, and mining, will apply up to the end of the period covered by the calculations as currently enacted and considering currently proposed legislation. • NAL is entitled to claim the full amount of $80 million for the purpose of the provincial reduced minimum mining tax rate of 1%. • Actual taxes payable will be affected by corporate activities, including tax loss carryforwards from prior investment losses at NAL. 19.4 CONTRACTS According to BMI, starting in 2028, lithium supply is projected to fall short of demand. Lithium market demand is expected to grow largely due to the increase in battery production on a global standpoint. Lithium hydroxide demand is expected to increase at a more robust growth rate than lithium carbonate to reach 58% of aggregate demand by 2040. Raw material supply is projected to be led by spodumene (hard rock) and brine while recycling will gradually occupy a significant market share of supply by 2040 (33%). Spodumene and lithium carbonate prices are expected to reach their highest price in 2024 and decline gradually to reach a steady state by 2033 of $1,050 USD/t of spodumene and $20,750 USD/t of lithium carbonate. In 2021 Sayona Quebec and Piedmont Lithium entered into an offtake agreement where Piedmont holds the right to purchase the greater of 50% of spodumene concentrate for 113,000 tpy from North American Lithium at a floor price of $500 /t and a ceiling price of $900 /t (6.0% Li2O equivalent) on a life-of-mine basis. For purposes of financial modeling and the Technical Report Summary sales from 2023 to 2026 are based on the greater of 113 kt of spodumene concentrate or 50% of spodumene concentrate sales at the Piedmont Lithium contract price and the remaining concentrate sales at BMI Q4 2022 spodumene market prices. From 2027 onwards, the entire concentrate sales are settled at BMI Q4 2022 spodumene market prices . For the contracted volume to Piedmont Lithium, a price of $810 USD/t (from the reference of $900 USD/t @ 6.0% Li2O to adjusted value of $810 USD/t assuming 5.4% Li2O and applied 10% price discount from North American Lithium DFS Technical Report Summary – Quebec, Canada 312 $900 USD/t for lower grade) assumed over 2023-26, while the remainder of the concentrate production uses market prices. From 2027 and beyond, Sayona Quebec is reverting back to market prices for the entire production as it seeks to pursue a lithium transformation project on-site, leveraging prior investments, in line with its commitments with the Government of Québec related to its acquisition of NAL. The construction or completion of conversion facilities owned by Sayona Quebec remains subject to the approval of both Sayona and Piedmont and therefore the associated pricing assumptions used in this TRS for Piedmont’s allocation of spodumene concentrate should be considered illustrative only . 19.5 INDICATIVE ECONOMICS, BASE CASE SENSITIVITY ANALYSIS 19.5.1 Positive Financials The DFS financial analysis has demonstrated that the NAL project is financially robust. The DFS’ NPV and IRR were calculated based on the production of spodumene concentrate at a grade of 5.4% Li2O over the first four years, then at 5.82% for the following 16 years, for a 20‐year life‐of‐mine. Table 19-1 provides a summary of the financial analysis, which demonstrates that the NAL project is economically viable. Key outcomes of the DFS include an estimated pre‐tax 100% equity NPV of $2,001 million (8% discount rate), a pre‐tax IRR of 4,701%. 19.5.2 Sensitivity Analysis The results of the sensitivity analyses are detailed in Figure 19-3 and Figure 19-4. The key outcome is the sensitivity to revenue (spodumene ore price) which is greater than both OPEX and CAPEX. Open pit mining operations such as the NAL operation is generally more susceptible to fluctuations in ore prices, therefore the result is not unusual. The upside however is that the project is very robust regarding pricing, providing a long‐term stable platform to deliver strong cashflows and shareholder returns. The spodumene grade is also a significant factor of the project as the grade is directly tied to the revenue.

North American Lithium DFS Technical Report Summary – Quebec, Canada 313 Figure 19-3 – Average annual spodumene price sensitivities. Figure 19-4 – DFS Sensitivity analysis on NPV @ 8%. North American Lithium DFS Technical Report Summary – Quebec, Canada 314 Post‐Tax NPV sensitivities range from ‐30% to +30% to show the impact of the NPV outputs at an 8% discount rate. Complementing the Post‐Tax NPV sensitivities is the Post‐Tax IRR graph, which shows the overall project impact at these sensitivity ranges. The Post‐Tax sensitivity analysis shows that spodumene price, spodumene concentrate volume and exchange rates have the largest NPV variation. The operating expenditure is also showing a significant NPV variation and can be an opportunity to improve in the next steps of the NAL engineering study. 19.6 ALTERNATIVE CASES / SENSITIVITY MODELS No alternative financial cases have been considered for this study. North American Lithium DFS Technical Report Summary – Quebec, Canada 315 20. ADJACENT PROPERTIES The North American Lithium Property is surrounded by active claims that cover more than a dozen known lithium occurrences located between Lac La Motte and Lac Roy. Figure 20-1 shows the location of metallic deposits and showings in the area. The green dots are occurrences of lithium (from the Québec MRNF Sigeom Interactive database, 2012). It should be noted that the following information is not necessarily indicative of the mineralization on the Property that is the subject of this Technical Report. Figure 20-1 – Local metallic deposits and showings. There are also past producing mines in addition to that of the Project, as listed below: • Preissac Moly: operated an underground mine and produced 2,235,880 t grading 0.19% Mo and 0.03% Bi from 1943 to 1944 and 1962 to 1971 (MRNFQ Report DPV 619). North American Lithium DFS Technical Report Summary – Quebec, Canada 316 • Cadillac Moly: operated an underground mine and produced 1,761,000 t grading 0.83% Mo, 0.04% Bi and 0.45 g/t Ag from 1965 to 1970 (MRNFQ Report DV-85-08). • Lacorne Moly: operated an underground mine and produced 3,828,844 t grading 0.33% Mo and 0.04% Bi from 1954 to 1972 (MRNFQ Report GM 28882). Figure 20-2 shows a map of adjacent claims to NAL. Several of the companies are exploring for lithium. Owners of adjacent properties include Entreprises Minières Globex Inc, First Energy Metals Limited, Glenn Griesbach, Frédéric Bergeron, Musk Metals Corp., Mine Abcourt Inc., and Ressources Jourdan Inc. Figure 20-2 – Claim map of adjacent properties (Supplied by Sayona, March 27, 2023).

North American Lithium DFS Technical Report Summary – Quebec, Canada 317 21. OTHER RELEVANT DATA AND INFORMATION In 2021, Sayona Quebec acquired the former North American Lithium (NAL) Project, including a concentrator and facilities for making lithium carbonate. The previous owner(s) had ceased their operations following bankruptcy in 2019. From 2019 to September 2022, the mine and process plant were under care and maintenance. Then, from October 2022 up to March 2023, improvements aiming to increase processing capacity have been completed, the mining operation restarted, and the plant recommissioned. The preliminary Project execution strategy for the remaining activities is described herein. 21.1 EXECUTION PLAN The execution plan and strategy herein described focuses on the main remaining Project components which are: • Crushed ore dome and ore reclaim system. • Dry stacking tailings management facilities, including tailings filtration plant with studies on-going. Table 21-1 shows the dates of the Project’s major milestones: Table 21-1 – Major activities for the Project. Activity Completion Date Complete Crushed Ore Dome Mar, 2024 TSF 1 raise Completed Jan, 2024 Start Engineering Tailings Filter Plant On going Studies Start Construction Tailings Filter Plant On going Studies Start Depositing Waste at Rock Stockpile #2 Oct, 2024 Start TSF 2 Construction On going Studies Tailings Filters Delivered to Site On going Studies Start-up and Ramp-up Tailings Filter Plant On going Studies 21.1.1 Completion of Crushed Ore Dome This step sees the completion of the material handling bypass of the fine ore storage silo. Contracting is underway and construction is scheduled for completion in March 2024. North American Lithium DFS Technical Report Summary – Quebec, Canada 318 21.1.2 Additional Waste and Tailings Management Facilities The work to be undertaken to move from a wet tailings concept to a dry stacking tailings storage for the second tailings facility is broken down as per the following items: • Raise of the wet tailings area (TSF-1). • Waste rock stockpile #2. • Dry-stacked tailings area (TSF-2). • Tailings filter plant. • Access roads. • Associated water management infrastructures. 21.1.2.1 Raise of the TSF-1 TSF-1 containment capacity will be increased by raising its berms in 2023 to allow storage of concentrator tailings until the filtration plant comes online in 2025. 21.1.2.2 Waste Rock Stockpile #2 The permits for the waste rock stockpile #2 and related water management infrastructure have been requested and are expected in Q3 2023. Water management ditches required to start using the waste stockpile #2 will be completed in 2024. 21.1.2.3 Dry-stacked Tailings Management Facility (TSF-2) The existing tailings management facility, designed to receive wet tailings, will be used to store the tailings produced by the process plant until the tailings filter plant and TSF-2 are commissioned. Permitting for TSF-2 will be launched in 2024 and the construction is expected to be completed for the initial requirement from April to October 2025. 21.1.2.4 Tailings Filter Plant If dry stacking is choose (under review), detailed engineering for the filter plant will be launched in December 2024. North American Lithium DFS Technical Report Summary – Quebec, Canada 319 21.1.2.5 Roads Roads linking the TSF-2 and the open pit will be built in parallel with the TSF-2 once the permit is obtained. Construction of these roads will ensure that mine trucks can deliver waste rock to the TSF-2 to build up its dykes. 21.1.2.6 Water Management The design of the network of ditches, basins and ponds required to control water on the mine site will be updated to incorporate the new facilities and roads. 21.1.3 Project Organization Going Forward The selected execution model for the Project is an integrated team of engineering and project management consultants led by Sayona Quebec. 21.1.3.1 Engineering & Procurement Specialized firms have been, and will be, selected based on their expertise. They will develop their design under Sayona Quebec’s supervision. The procurement process will have engineering firms issue bid requests, analyze the received bids, technically and commercially, and issue a recommendation for purchase to Sayona Quebec, which will place the purchase orders and contracts. 21.1.3.2 Project Controls An independent project control team has been mobilized to monitor the budget, schedule, change control and prepare monthly status reports. This information is essential in decision-making by project leaders. 21.1.3.3 Construction Management A construction management team is responsible for the technical and administrative management of contractors and contracts on-site. This team’s primary mission will be to ensure the correctness of the work carried out in relation to the plans and specifications, as well as a harmonious and safe coordination North American Lithium DFS Technical Report Summary – Quebec, Canada 320 with the operations activities of the plant. The management of the material received at site is their responsibility. 21.1.3.4 POV and Commissioning Pre-operational verification (POV), or cold commissioning, will begin as soon as some systems are mechanically complete. 21.1.3.5 Operations While completing the filtration plant, Sayona Quebec will hire and train additional operators and maintenance personnel to take over these systems upon transfer from construction to operation. 21.2 PROJECT RISKS The most significant internal project risks, potential impacts and possible mitigation approaches that could affect the technical and economic outcome of the Project are summarized in Table 21-2. External risks are, to a certain extent, beyond the control of the project proponents and are much more difficult to anticipate and mitigate, although, in many instances, some risk reduction can be achieved. External risks are things such as the political situation in the project region, product prices, exchange rates and government legislation. These external risks are generally applicable to all mining projects. Negative variance to these items from the assumptions made in the economic model would reduce the profitability of the mine and the mineral resource/reserve estimates. Table 21-2 – Project risks. Area Risk and Potential Impact Possible Mitigation Approach Geology, Resources 1. The distribution of iron in the country rock could be improved in the block model as currently averages of a limited number of samples is applied for each lithological units without tacking into consideration possible local variations. A strategic resampling of existing core throughout the deposit could be performed, complete with mineralogical studies. Open Pit Mining 2. Historical underground openings will represent an operating hazard, a risk to local bench-scale and multi-bench stability and a potential rockfall hazard, depending on the character of the openings and any backfill. Systematic investigation and mitigation design will be required to manage these risks for both interim and final pit walls. Investigation, analysis, and recommendations are currently being prepared by WSP-Golder for Sayona Quebec and a technical memorandum was issued during Q4-2022. SOP development specifically to address mining in these zones. Progressive scans to prevent advancing in unknown conditions.

North American Lithium DFS Technical Report Summary – Quebec, Canada 321 Area Risk and Potential Impact Possible Mitigation Approach 3. Storage locations for waste rock and overburden piles for the life of mine plan follow the current permitting process, but not all physical permits have been obtained for designed storage location . Also, the current waste storage piles footprint does not cover all waste material storage needs. Required extensions have been designed and are currently starting the permitting process. Accelerate process to enlarge the footprints of surface rights and obtain permission to enlarge waste rock and overburden storage facilities. Waste rock pile 2 and 3 footprint can be extended depending on environmental regulations and compensation, respectively. The overburden pile 1 (OBP-1) can also be extended to the West. Expansion of this overburden pile is currently in design to proceed with permitting process. 4. Mine geotechnical studies for the open pit are currently being completed. Water inflow and pumping requirements are only developed to a conceptual level and need to be updated according to the Hydrogeology Study update completed by WSP-Golder in December 2022. Operating costs may increase if additional mine pumping is needed. Hydrogeological study was completed, and the geotechnical studies are currently ongoing with WSP-Golder to support mine operations. 5. The size of the reserve is sensitive to pit slopes, although to a lesser extent than selling prices. 6. Mining contractor will need to have sufficient equipment and personnel to follow the LOM plan tonnage in 2024 and 2025 , where tonnage increases to 19Mt moved. Meet with the contractor representatives to ensure they adjust the mining equipment fleet and personnel to the new LOM plan. Tailings 7. The terrain conditions may necessitate revisions to the structure of the pile, e.g., a softer slope, requiring more fill material. The stratigraphy of the soils presents in the footprint of the adjacent site, particularly along the embankments, should be investigated and better defined. Based on survey observations, excavation of existing soils and surface drainage measurements may be important. Management 8. Sequential deposition optimized for short periods could lead to a revision of the stages of pile elevation. To be evaluated. Facility 9. A change in the storage quantities or the properties of the tailings to be disposed of could modify the footprint required to store them. To be evaluated. 10. The existing water treatment capacity (Reverse Osmosis) could be limited given that for the design of the new basins BO-12, BO-13, it was assumed that only TSS are the only potential contaminant. If the settlement capacities of BO-12 and BO-13 basins are not appropriate for finer TSS or for additional contaminants, use of some adds to enhance the settlement or use of auxiliary treatment units is recommended. Permitting 11. Inability to start production due to a missing CA approval or renewal. Various permits are currently being authorized and could impact production sequence. Discussions with governmental instances are ongoing. Critical permits are to be obtained in Q3-Q4 2022. 12. The TSF-2 site is located within a zone including water streams. A request for a special environment certification approval to the Ministry of Environment. Concentrator 13. Limited metallurgical testing on blended feed containing volcanics host rock (ore sorting, magnetic separation, flotation), metallurgical performance may not be achieved. More detailed variability testing is recommended for the blended ore to better assess the impact of dilution and grade on the metallurgical performance. 14. High variability in the head grades (lithia and iron content in the run-of-mine ore, resulting in poor product quality. Implementing an ore stockpiling strategy to ensure a concentrator feed characteristic are understood prior to processing. 15. Testwork showed that the process performance is sensitive to grind size (ore sorting, magnetic separation, and flotation), under or over crushing and grinding could lead to poor product quality and low recoveries. Implementing proper procedures and monitoring to operate crushing and grinding circuits in optimum conditions. 16. The potential presence of silica and beryllium in some production areas, due to dust emissions, is identified as a health & safety risk. All dust collection systems and extraction points are being reviewed and upgraded; must ensure that adequate SOPs, guidelines, and ambient air sampling procedures are in place for ongoing production. Dust collection improvements will be completed, when needed, according to testing results. 17. Low feed density to tailings thickener leading to insufficient capacity of the equipment. Implement a water management strategy in operation. 18. Level of lithium in filtering water requiring additional filters due to increased wash cycle time Investigate alternate water treatment upstream and downstream of filters. North American Lithium DFS Technical Report Summary – Quebec, Canada 322 Area Risk and Potential Impact Possible Mitigation Approach General 19. A low unemployment rate in the region will increase the difficulty of recruiting qualified personnel; a loss of productivity may result. NAL has put in place a hiring program to recruit experienced and qualified personnel. A human resources manager is leading the program with the help of an outside firm. 20. The Abitibi-Temiscamingue region is impacted by low electrical power availability. For the first phase of the NAL plant, Hydro-Québec (HQ) has an available block of power of 12 MVA for the plant (8.4 to 11.4 MW depending on plant’s power factor). Beyond this value, a power increase request must be filed with HQ; this will be required for later phases of the Project. Discussions with Hydro-Québec are ongoing to ensure that electrical requirements are met. Given the low electrical power availability in the region, capacitor banks will be purchased in 2023 to improve the plant’s power factor. 21.3 PROJECT OPPORTUNITIES Over the years, the Project has undergone several operational and ownership changes and improvements have been made since being put on care and maintenance in 2014. Based on the current recommissioning plans, a number of significant opportunities have been identified. The major opportunities that have been identified at this time are summarized in Table 21-3 excluding those typical to all mining projects, such as changes in product prices, exchange rates, etc. Further information and assessments are needed before these opportunities should be included in the project economics. Table 21-3 – Project opportunities. Area Opportunity Explanation Benefit Geology and Resource Model 1. A lot of material within the pit-constrained and underground resources have been classified as inferred and has a chance of being upgraded to indicated. Additional drilling is likely to upgrade inferred resources to indicated. 2. The calculated open-pit cut-off grade is 0.15% Li2O whereas the Mineral Resource Estimate cut-off grade is 0.60%. Metallurgists requested the cut-off grade to be 0.60% at a minimum due to metallurgical constraints, Additional discussions with Metallurgists and mine site geologists and engineers could potentially identify additional materials to be included in a future mineral resource estimate update. 3. The interpretation of pegmatitic dykes rests on a limited number of intercepts in some areas. These areas were classified as inferred resources. Infill drilling should be completed to convert inferred resources to indicated in those zones. 4. The deposit is open in both NW and SE directions as well as at depth. Additional drilling is warranted to explore the full extent of the mineralization. Additional drilling might add mineral resources. Open Pit Mining and Reserves 5. The current LOM plan could be further improved with a grade optimization and ore stockpiling strategy, especially with the feed portion coming from Authier. This strategy will help to optimize the stripping ratio versus ore feed grades. 6. Based on current modelling efforts, some dykes are too small or narrow to be mined selectively and will be sent directly to waste due to their potential high dilution. There is an opportunity of including these deposits in the actual mining plan by executing offline sorting. Higher project revenues due to an increase of available mineral resources 7. Steeper slope angles may be feasible by optimizing designs based on the documented geological conditions and performance achieved in the field. Excellent field performance may warrant increasing the design bench face angle (BFA). Map the mining faces and keep a log of rock mechanics considerations to validate if steeper angles could be achievable in specific geotechnical sectors. Concentrator 8. Optimize iron to lithia ratio and limit fluctuation in the ROM to ensure stable operation and allow process optimization. Increase overall concentrator recovery which would help increase overall project revenues North American Lithium DFS Technical Report Summary – Quebec, Canada 323 Area Opportunity Explanation Benefit 9. Investigate alternative tailings treatment strategies (Coarse and fine tailings separately) and technologies (other dewatering systems) to identify the optimum and cost-effective solution. Reduction in CAPEX and potential savings in OPEX. Increase plant flexibility for operation and maintenance. Water Management 10. There is an opportunity to combine the existing process plant water treatment area and the proposed site water treatment facilities together. Simplified and improved operational flexibility. Potential reductions in OPEX/CAPEX. 11. There is an opportunity to delay the implementation of WRP-3 by as much as 5 years by using the produced waste rock for site construction activities and for construction of the tailings facility retention berms as soon as permits are obtained for those infrastructures. Delay the construction of BO-12 and associated ditches. 12. A distance of less than ten kilometers would be necessary to connect the plant operations to an existing rail infrastructure. Feasibility of this option should be further analyzed. Lower operational costs due to a potential decrease of transport costs. North American Lithium DFS Technical Report Summary – Quebec, Canada 324 22. INTERPRETATION AND CONCLUSIONS 22.1 PROJECT SUMMARY The original DFS Report was prepared and compiled by BBA under the supervision of the authors at the request of Sayona Quebec. From the outcome of the DFS, this S-K §229.1304 compliant Technical Report Summary provides a summary of the results and findings from each major area of investigation to a level that is equivalent and normally expected for a Definitive Feasibility Study (DFS) of a resource development project. Standard industry practices, equipment and process were used within this study. This Report is based on an updated mineral reserve estimate effective as of Dec 31, 2023, as well as Sayona Quebec’s restart of the spodumene concentrator processing facilities, which commenced operation in 2023-Q1. 22.1.1 Key Outcomes Working with its consultants, Sayona Quebec has planned a number of improvements and changes to the Project since it was put on care and maintenance in 2019. The authors note the following interpretations and conclusions in their respective areas of expertise, based on the review of data available for this Report. 22.2 GEOLOGY AND RESOURCES 22.2.1 Geology • The geology and geochemistry of LCT pegmatites is well understood. • The geology units on the project are well understood, including the various types of pegmatite dykes; and • Over 49 spodumene-bearing pegmatite dykes have been identified on the Project. o Drilling • Sayona Quebec conducted a diamond drilling program between April and November 2023. Results from this program are still pending and where not incorporated in this Report. In addition, Sayona Quebec conducted a resampling program in 2022 to improve the geological model, Li2O and Fe grade distribution, and density; and • Drilling completed on the project by previous operators followed industry best practices.

North American Lithium DFS Technical Report Summary – Quebec, Canada 325 22.3 MINING AND RESERVES 22.3.1 Reserves • The open pit constrained mineral resources estimate, effective as of December 31, 2022, using a cut-off grade of 0.60% Li2O, is reported as 1.0 Mt at 1.19% Li2O (Measured), 24.0 Mt at 1,23% Li2O (Indicated), and 22 Mt at 1.2% Li2O (Inferred). Additionally, underground mineral resources using a cut-off grade of 0.60% Li2O of 11 Mt at 1.3% Li2O (Inferred) is also reported. • The geological model that underpins the NAL Mineral Resource Estimate was significantly improved since the previous Mineral Resource Estimate (McCracken et al, 2022) to reflect the host rock lithologies and the thickness, orientation, as well as lateral and down-dip continuity of the pegmatite dyke swarm. The enhancements were made possible by the integration of new sampling data, a detailed review of relationships between pegmatites and diluting host rock, and through discussions with internal and external experts. The model accuracy was also validated against historical mining voids, past production average grades and trends observed in historical grade control data. The previous geological model, prepared for the NAL Pre-Feasibility Study, used a more generalized approach, modelling “corridors containing pegmatites” rather than pegmatitic dykes, with consideration for up to 20% internal waste. These corridors are understood to encompass multiple stacked, and/or cross-cutting dykes, intermingled with high- Fe country-rock, devoid of spodumene. The updated interpretation better reflects the QP’s understanding of the local variation of the dyke swarm. Internal dilution now represents less than 3% of the Mineral Resource estimate. The model refinement for the NAL deposit enabled a more precise segregation between the spodumene-bearing pegmatites, and the high-Fe waste rock. This, in turn, has the combined effect of reducing the overall in-pit resource tonnage of Measured and Indicated tonnes (-54%), with a corresponding increase in Li2O grade (+22%). Importantly, the increased accuracy of model permits greater mining selectivity to be applied, thereby reducing the quantity of waste, and improving metal recovery at the plant. • Updates to the geological model and understanding of the mineralized system are critical to the upcoming drilling programs targeted at both resource conversion and exploration. The QP is confident that the majority of the inferred mineral resources will be upgraded to indicated resources with additional drilling. 22.3.2 Mining • Mineral Reserves have been estimated for a total of 21.7 Mt of Proven and Probable Mineral Reserves at an average grade of 1.08% Li2O, which is comprised of 0.7 Mt of Proven Mineral Reserves at an average grade of 1.24% Li2O and 21.0 Mt of Probable Mineral Reserves at an average grade of 1.08% Li2O. North American Lithium DFS Technical Report Summary – Quebec, Canada 326 • Development of a mine plan that provides sufficient ore to support an annual feed rate of approximately 1,100,000 tonnes at the crusher coming from NAL (the remaining portion coming from Authier at approximately 530,000 tonnes of ore per year). • Updated detailed mine designs, including pit phasing. • Development of a dilution model to ensure that potential ROM ore feed respects final product specifications. • Development of a life of mine (LOM) plan that results in a positive cash flow for the Project, which permits conversion of resources to reserves. 22.4 METALLURGY AND PROCESSING North American Lithium (NAL) has restarted in Q1-2023 concentrator operations, which had been on care and maintenance since 2019. The concentrator plant will first process ore form the NAL deposit and then, when the Authier Lithium mine comes into operation in 2025, a blend of ore from both deposits will be processed. The LOM average spodumene concentrate grade is 5.74% Li2O with a 67.4% lithium recovery. Several upgrades were made to the crushing circuit and concentrator to achieve nameplate capacity and the targeted metallurgical performance. Those modifications are presented in Table 22-1. Table 22-1 – Major plant upgrades. Major Upgrades Results Modifications to the dump pocket and installation of an apron feeder ahead of the primary crusher. To ensure a stable feed to the primary crusher and to avoid blockage, which frequently occurred in previous operation. Addition of an optical sorter in parallel to the existing secondary sorter. Optical sorting is critical to remove waste from the pegmatite ore. In addition to meeting capacity requirements, the addition of a third sorter should allow for higher separation efficiency. Installation of two additional stack sizer screens. Testwork showed metallurgical performance is strongly sensitive to grind size. Historical data showed low rod mill power draws and screen overloading, resulting in high bypass of fines to the ball mill, which leads to a reduction in grinding rates. The addition of the two new screens will provide better separation. Addition of a low-intensity magnetic separator (LIMS) prior to wet high- intensity magnetic separation (WHIMS). There was no LIMS in the previous flowsheet. The LIMS removes grinding media chips to protect the downstream WHIMS. Addition of a second WHIMS in series with the existing unit prior to flotation. Magnetic separation is a critical step in the process to reject iron-bearing silicate minerals. A second WHIMS will allow for higher removal of iron-bearing minerals prior to flotation. Upgrade of the existing high-density conditioning tank. Improve conditioning, thus flotation efficiency. Installation of a higher capacity spodumene concentrate filter. Increased concentrate filtration capacity to meet throughput requirements. North American Lithium DFS Technical Report Summary – Quebec, Canada 327 Other modifications to the process are still being developed such as: • The addition of a crushed ore storage dome to increase ore retention capacity. The crushed ore pile will feed the rod mill feed conveyor during periods of crushing circuit maintenance. • The addition of a tailings filter plant as a future tailings management option (dry stack). The tailings filter plant is scheduled for start-up in 2025. Based on the testwork and proposed flowsheet, the design Project metallurgical recoveries at 5.82% Li2O concentrate grade are as presented in Table 22-2. Table 22-2 – Projected metallurgical recoveries. Lithium Recovery Data Criterion Unit Value Overall Crushing and Sorting Lithium Recovery (A) % 96.5 Ore Sorting Waste Rejection % 50.0 Desliming and WHIMS Lithium Recovery (B) % 88.5 Flotation Lithium Recovery (C) % 77.6 Overall Lithium Recovery (Concentrator) (AxBxC) % 66.3 22.5 INFRASTRUCTURE AND WATER MANAGEMENT • The tailings and water management are based on a strategy of placing conventional Spodumene tailings in Tailings Storage Facility 1 (TSF-1) for the first two years of operation. In Year 2 the plan would be to convert to a dry stack facility to the West of TSF1 (TSF-2). The TSF-2 site still needs to be permitted. It will be built as a co-deposition facility whereby compacted tailings are confined within a waste rock confinement berm. • Water management focused on water diversion, where possible. Water management infrastructure will be phased in as required. 22.6 MARKET STUDIES According to BMI, starting in 2028, lithium supply is projected to fall short of demand. Lithium market demand is expected to grow largely due to the increase in battery production from a global standpoint. Lithium hydroxide demand is expected to increase at a more robust growth rate than lithium carbonate to reach 58% of aggregate demand by 2040. Raw material supply is projected to be led by spodumene (hard rock) and brine while recycling will gradually occupy a significant market share of supply by 2040 (33%). Spodumene and lithium carbonate prices are expected to reach their highest price in 2024 and North American Lithium DFS Technical Report Summary – Quebec, Canada 328 decline gradually to reach a steady state by 2033 of $1,050 USD/t of spodumene and $20,750 USD/t of lithium carbonate. For the purpose of this Project, sales from 2023 to 2026 are based on the greater of 113 kt of spodumene concentrate or 50% of spodumene concentrate sales at the Piedmont Lithium contract price and the remaining concentrate sales at BMI Q4 2022 spodumene market prices. From 2027 onwards, the entire concentrate sales are settled at BMI Q4 2022 spodumene market prices. For the contracted volume to Piedmont Lithium Inc, a price of $810 USD/t (from the reference of $900 USD/t @ 6.0% Li2O to adjusted value of $810 USD/t assuming 5.4% Li2O and applied 10% price discount from $900 USD/T for lower grade) assumed over 2023-26, while the remainder of the concentrate production uses market prices. From 2027 and beyond, Sayona Quebe is reverting back to market prices for the entire production as it seeks to pursue a lithium transformation project on-site, leveraging prior investments, in line with its commitments with the Government of Québec related to its acquisition of NAL. 22.7 PROJECT COSTS AND FINANCIAL EVALUATION 22.7.1 Capital Costs The total capital expenditure (CAPEX) proposed for the project is estimated at $363.5M CAD, inclusive of owners’ costs, indirects costs and contingencies. The present costs estimate pertaining to this study qualifies as Class 3 –feasibility Study Estimate, as per AACE recommended practice R.P.47R-11. The accuracy of this CAPEX estimate has been assessed at ±20%. The CAPEX estimate includes all the direct and indirect project costs, complete with the associated contingency. The estimating methods include quotations from vendors and suppliers specifically sought for this project, approximate quantities and unit rates sourced from quotations and historic projects and allowances based on past projects. A summary of the capital expenditure distribution is shown in Table 22-3 below, in Canadian dollars. 22.7.2 Operating Costs Table 22-4 and Table 22-5 are in Canadian dollars.

North American Lithium DFS Technical Report Summary – Quebec, Canada 329 Table 22-3 – NAL CAPEX Summary. Cost Item Capital Expenditures ($M) Mining Equipment 105.6 Dry Stack Mobile Equipment 19.6 Pre-Approved Projects 26.9 Tailings Filtration Plant and access Roads 80.6 Various Civil Infrastructures 37.6 Tailings Storage Facilities 53.4 Truck Shop Expansion 4.9 Reclamation & Closure 34.9 Total CAPEX 363.5 Table 22-4 – Operating cost summary by area. Cost Area LOM (M CAD) CAD/t Ore USD/t Ore Mining 955.73 44.25 33.19 Mineral processing 828.54 38.36 28.77 Water treatment 8.68 0.40 0.30 Tailings management 78.79 3.65 2.74 General and administrative (G&A) 394.65 18.27 13.70 Reclamation bond insurance payment 5.53 0.26 0.19 Total operating costs 2,271.92 105.19 78.90 Ore Transport and Logistics Costs 135.33 6.27 4.70 Total on-site and off-site costs 2,407.25 111.46 83.60 Authier Lithium Ore Purchase 1,114.88 51.62 38.72 Reclamation and closure costs 34.91 1.62 1.21 Total Operating and Other Costs 3,557.04 164.70 123.52 Table 22-5 – NAL operation including Authier ore supply - Financial analysis summary. Item Unit Value (US$) Value (C$) Mine life year 20 Strip Ratio waste t: ore t 8.3 Total NAL Mined Tonnage Mt 201 Total Crusher Feed Tonnage, including Authier Mt 31 Total Crusher Feed Grade, including Authier % 1.04 Revenue Average Concentrate Selling Price $/t conc. 1,352 1,803 Exchange Rate C$:US$ 0.75 Selling Cost Product Transport and Logistic Costs $/t conc. 26 34 Project Costs Open Pit Mining $/t conc. 189 252 Mineral Processing $/t conc. 164 218 Water Treatment, Management and Tailings $/t conc. 2 2 General and Administration (G&A) $/t conc. 78 104 North American Lithium DFS Technical Report Summary – Quebec, Canada 330 Item Unit Value (US$) Value (C$) Authier Ore Purchase $/t conc. 220 293 Project Economics Gross Revenue $M 5,114 6,818 Authier Ore Purchased Cost $M 834 1,114 Total Selling Cost Estimate $M 98 130 Total Operating Cost Estimate $M 1,701 2,268 Total Sustaining Capital Cost $M 281 375 Undiscounted Pre‐Tax Cash Flow $M 2,225 2,966 Discount Rate % 8 8 Pre‐tax NPV @ 8% $M 1,500 2,001 Pre‐tax Internal Rate of Return (IRR) % 4,701 4,701 After‐tax NPV @ 8% $M 1,026 1,367 After‐tax IRR % 2,545 2,545 Cash Cost, including Authier ore purchase $/t conc. 691 817 All‐In Sustaining Costs, excluding Authier $/t conc. 740 987 22.7.3 Project Economics Table 22-5 provides a summary of the financial analysis, which demonstrates that the NAL project is economically viable. Key outcomes of the North American Lithium (NAL) Definitive Feasibility Study (DFS) include an estimated pre‐tax NPV of $2,001 million (8% discount rate) and a pre‐tax IRR of 4,701%. Life of mine is now 20 years, based on an estimated Proven and Probable Mineral Reserves of 21.7 Mt @ 1.08% Li2O (Proven Reserve 0.7 Mt @ 1.24% Li2O and Probable Reserve 21.0 Mt @ 1.08% Li2O) for NAL and the inclusion of the Authier Lithium Project’s Proven and Probable Mineral Reserves. Note: All-In Sustaining Costs = Cash Costs + Sustaining Capital + Exploration expenses + G & A expenses. Summary of the main assumptions: • The economic analysis has been done on a Project basis and does not take into consideration the timing of capital outlays that have been completed prior to the date of this Report. • The financial analysis was based on the Mineral Reserves presented in Chapter 12, the mine and process plan and assumptions detailed in Chapters 13 and 14, the marketing assumptions in Chapter 16, the capital and operating costs estimated in Chapter 18 and by taking into consideration key Project milestones as detailed in Chapter 21. • The analysis was performed based on fiscal years (FYs) as opposed to calendar years, unless specified otherwise. The fiscal year begins on July 1st and end on June 30th. • Commercial production of spodumene concentrate is scheduled to begin in the second quarter (Q2) of 2023 model Year 1. • Exchange rates: An exchange rate of $0.75 USD per $1.00 CAD was used to convert the USD market price projections into Canadian currency. The sensitivity of the base case financial results North American Lithium DFS Technical Report Summary – Quebec, Canada 331 to variations in the exchange rate was examined. Those cost components, which include U.S. content originally converted to Canadian currency using the base case exchange rate, were adjusted accordingly. • Discount rate: A discount rate of 8% has been applied for the NPV calculation. • The long-term prices of spodumene concentrate were estimated based on market studies, discussions with experts, recent lithium price forecasts (Chapter 16) and Piedmont contract prices. Revenue up to fiscal year 2026 is based on 50% of the concentrate sales at average benchmarked spodumene market prices and the remaining 50% of concentrate sales to the Piedmont Lithium contract price. • Selling costs are the transport and logistics costs of the concentrate to the Quebec City port facility. • The products are sold in batches of 30 kt. The 30-kt shipment intervals were used for Sayona Quebec to accumulate sufficient inventory to achieve a full boatload for shipping cost efficiency. • Class specific capital cost allowance rates are used for the purpose of determining the allowable taxable income. • The financial analysis was performed on Proven and Probable Mineral Reserves as outlined in this Report. • Tonnes of concentrate are presented as dry tonnes. • Discounting starts on January 1, 2023. • Authier ore is purchased at $120 CAD/t. • All costs and sales are presented in constant Q1-2023 CAD, with no inflation or escalation factors considered. • All related payments and disbursements incurred prior to the end of Q2-2023 are considered as sunk costs. • Royalties: North American Lithium (NAL) is not subject to royalty payments. • The accuracy of this CAPEX estimate has been assessed at ±20%. North American Lithium DFS Technical Report Summary – Quebec, Canada 332 23. RECOMMENDATIONS 23.1 PROJECT SUMMARY This Report was prepared by Sayona Quebec for the registrant, Piedmont. This Report provides a summary of the results and findings from each major area of investigation to a level that is equivalent and normally expected for a Definitive Feasibility Study (DFS) of a resource development project. Standard industry practices, equipment and process were used within this study. This Report is based on an updated mineral resource estimate effective as of December 31, 2022, as well as Sayona’s restart of the spodumene concentrator processing facilities, which commenced operation in 2023-Q1. 23.2 GEOLOGY AND RESOURCES The following activities were recommended in the DFS to improve geology and mineral resource estimation. • Additional drilling is warranted: o Approximately 16,250m to convert material currently classified as inferred resources in the resource pit shell to the indicated category. o Approximately 17,500m to explore lateral plausible extensions NW and SE of the current deposit. • Shoulder samples and internal samples of waste (granodiorite and volcanics) should be collected and assayed on all future drill programs. • Continue to collect bulk density measurements in all rock types, particularly the volcanics and granodiorites. • Surface mapping of the pegmatite dykes, particularly in the volcanics, will improve the understanding of the dyke geometry. • Where possible, channel samples across the pegmatites in the volcanics should be collected and assayed to support the near surface grade estimation. • A thorough grade control program must be implemented and applied during future mine operation. In fact, Sayona carried out a surface drilling campaign on NAL property during 2023. In total 172 holes have been drilled, totaling over 45,535 meters. The objective of this drilling campaign was to increase the resources on the entire NAL property and more particularly to convert the inferred mineral resources into indicated mineral resources. The results of this campaign have not been incorporated into the resources model as of the effective date of this report.

North American Lithium DFS Technical Report Summary – Quebec, Canada 333 Sayona's objective is to continue exploration on the entire NAL property (including the mining lease) with the aim of increasing the resource and mineral reserve. 23.3 MINING AND RESERVES Conducting the following geotechnical work in the next stage of the Project was recommended in the DFS (and are currently ongoing by WSP-Golder): • Preparation of a drawing containing the geology draped on the planned pit walls, using the updated pit shell with the angles presented in this Report, to better define the rock mass that will likely be exposed on the walls. • Continue updating the limits of the design sectors and define the application of the proposed rock slopes for the updated pit shell. • Start to develop a 3D structural model containing the interpretation of the fault intervals from the geotechnical and exploration holes, as well as the mineralized pegmatite dykes. • Update the engineering geology model as additional data becomes available prior to mining. • Carry out additional direct shear tests on the identified major discontinuity sets, particularly those labelled G_CO1 or M_CO1. • Continue to read the installed vibrating wire piezometers to obtain the seasonal variation of groundwater elevations. • Installation of additional piezometers may be required for this monitoring to supplement the data from the three units installed during the 2010 geotechnical investigation. • Carry out test works and analysis to confirm the actual in-place density of the waste material once deposited on the waste rock piles. This is to ensure the planned waste rock areas have sufficient capacity. As the mine re-starts operation, the risks associated with the uncertainties related to geological structures should be managed by a program of ongoing geotechnical documentation and monitoring, including: • Pit documentation during pit development, including geotechnical wall mapping of the exposed rock faces. • Slope monitoring, including: o Visual inspection. o Surface displacement monitoring. o Subsurface displacement monitoring. o Water-level monitoring and monitoring of piezometric pressures in the NW, N and NE sectors, due to Lac Lortie, settling pond and former tailings basin. o Blasting-related monitoring. Other recommendations as the mine re-starts operations: North American Lithium DFS Technical Report Summary – Quebec, Canada 334 • Further optimize the mine plan and detail the mining sequence to mine efficiently around old underground workings. • Optimize the crusher feed and adjust mine planning sequence accordingly to maximize the average grade feed with ROM feed coming from Authier and to minimize the iron content in the feed. Validations with the Processing team on the timeframe within which the feed grade must be constant. • Detail the waste deposition sequence to various waste rock piles as well as for site infrastructure construction (site roads, haul roads, pads, and tailings storage facilities). 23.4 METALLURGY AND PROCESSING Testwork on blended composite and variability samples was undertaken to support the DFS process design. Testwork has shown that metallurgical performance is strongly influenced by grind size, host rock type, and lithia and iron grades in the run-of-mine ore. For this reason, attention should be made to manage ROM feed grade fluctuations to allow stable operation of the process plant. The following should be considered: • Further metallurgical testwork are recommended such as: o Assessment of the impact of dilution and head grade on metallurgical performance. More detailed variability (Authier and NAL ore) testwork should be performed to produce a recovery model based on feed characteristics. o Mineralogy and liberation analysis should be completed around the flotation circuit to investigate potential optimization opportunities. • Testwork showed metallurgical performance is strongly sensitive to grind size. High attention should be given to the operation of crushing and grinding circuits to ensure optimal grind size is achieved. • The mine plan showed variability in iron content of the ROM material. An operational strategy should be developed for ore sorter and WHIMS operation to minimize lithium losses while attaining the desired concentrate quality. • Continue filtration testing to confirm the design of the tailings filtration plant. Optimize the filter plant layout based on the selected technology. 23.5 INFRASTRUCTURE • It is recommended that the current water management approach to the East of the site (pre- existing) be reviewed and optimized, considering the new footprint to the West of the powerline. North American Lithium DFS Technical Report Summary – Quebec, Canada 335 • It is recommended that the current water treatment system (reverse-osmosis) be evaluated as to its capacity and efficiency of the current water treatment system for use over the larger footprint of the new project. • The entrance to the site should be upgraded to allow for a larger turn radius for the vehicles transporting the ore and concentrate. There will be a considerable increased amount of traffic at this entrance. Additionally, it is recommended that the existing public gravel road should be upgraded and paved to support the added traffic. • Geotechnical investigations should continue and be completed in all proposed infrastructure areas to validate geotechnical assumptions taken during this study. This will also support detailed engineering. 23.6 MARKET STUDIES For North American Lithium, the ore processed is processed into lithium spodumene. The spodumene is then sold in part to Piedmont Lithium through the existing offtake agreement, and in part sold to market participants, for transformation in lithium carbonate or hydroxide. The spodumene can be sold directly to customers, or through an intermediary commodity trader. 23.7 ENVIRONMENTAL AND SOCIAL RECOMMENDATIONS • It is recommended that geotechnical investigations continue in the area of the waste rock pile no. 2 extension (WRP-2) in support of detailed engineering. • Samples (3 minimum) of the hydromet tailings should be tested to determine the optimal degree for compaction and required moisture content (Proctor tests). • Samples of hydromet tailings (liquid portion and solid portion) should be subjected to a comprehensive environmental geochemical characterization program. • The geochemical characterization of the spodumene tailings should be further explored. • Progressive restoration of waste pile #2 should be started soon. • . • Potential areas for waste storage closer to the open-pit location should be reassessed according to environmental constraints since a shorter haul distance for waste and overburden would have a positive impact on costs and greenhouse gas (GHG) emissions. • It would be relevant to carry out a complementary geochemical characterization of the tailings generated from the milling of NAL ore for spodumene concentrate production. Available geochemical characterization has been produced on a combined tailings sample representing a mixed tailings from spodumene concentrate production and lithium carbonate production. It is understood that the new tailings management area will only be used for storage of tailings from North American Lithium DFS Technical Report Summary – Quebec, Canada 336 spodumene concentrate production. Geochemical characterization carried out on tailings from processing of Authier ore have demonstrated that those tailings showed no Acid Rock Drainage or Metal Leaching potentials. • It would be relevant to carry out a comprehensive environmental characterization of the existing tailings storage facility (TSF-1) in order to develop optimized concepts for its reclamation. Special attention must be given to the requirements for treatment of contaminated waters still present at the end of operation of the TSF-1. • A global water balance must be developed for the entire site, including the new tailings storage facility (TSF-2). In order to optimize the water management, special attention must be given to the source of waters used for processing (mine water, water from existing TSF and/or from future TSF). • It would be relevant to begin revegetation tests on waste rock pile no. 2 (WRP-2) in order to confirm the feasibility of the concept presented in the closure plan for the restoration of waste rock piles. 23.8 PROJECT COSTS AND FINANCIAL EVALUATION There are currently no recommendations on project costs or financial evaluations.

North American Lithium DFS Technical Report Summary – Quebec, Canada 337 24. REFERENCES 24.1 GENERAL PROJECT Agence Canadienne d’Évaluation Environnementale. 2018. Projet de mine de spodumène North American Lithium. Rapport d’étude approfondie. 107 p. BBA, 2023. Leblanc, I, Piciacchia, L, Quinn, J., Dupéré, M. Updated Definitive Feasibility Study Report for the Authier Lithium Project prepared for Sayona Mining Limited, dated April 14, 2023. Benchmark Minerals, 2022, Lithium Forecast | Q1 2022 | Benchmark Mineral Intelligence. Canada Lithium Corp., 2012, Feasibility Study Update – NI 43-101 Technical Report, Québec Lithium Project, La Corne Township, Québec, October, 2012. Canadian Dam Association, 2013, Application of Dam Safety Guidelines to Mining Dams. Canadian Dam Association, 2014, Application of Dam Safety Guidelines to Mining Dams. Environment Canada, 2016, Guidelines for the Assessment of Alternatives for Mine Waste Disposal. Golder Associates. 2012. Caractérisation géochimique d’échantillons de stériles miniers du projet Québec Lithium. Québec Lithium inc. 9 p. + appendices. Golder Associates. 2012. Caractérisation géochimique d’échantillons de résidu combiné du projet Québec Lithium. 13 p. + appendices. Golder, 2017b, Niveau Maximum d’Opération du Parc à Résidus #1 – Phase 1B+. Hawley, M., Cunning, J., 2017, Guidelines for Mine Waste Dump and Stockpile Design, CRC Press/Balkema. Kramer, S.L., 1996, Geotechnical Earthquake Engineering, Prentice Hall Inc., Englewood Cliffs, NJ. Ministère de l’Énergie et des Ressources Naturelles, Direction de la restauration des sites miniers, 2016, Guide de préparation du plan de réaménagement et de restauration des sites miniers au Québec. Ministère du Développement durable, de l’Environnement et des Parcs, 2012, Directive 019 sur l’industrie minière. Ministère des Ressources Naturelles, Direction de la restauration des sites miniers, 2014, Approbation de la mise à jour du plan de restauration du site minier Québec Lithium. SNC, 1974. Surveyer, Nenniger and Chênevert Inc (SNC). Report of Lithium Property, Barraute, Quebec for Sullivan Mining Group, Montreal, Quebec. 63 pp. North American Lithium DFS Technical Report Summary – Quebec, Canada 338 URSTM. 2015. Essais cinétiques sur quatre lithologies du projet Québec Lithium. 54 p. Wood Mackenzie, 2022, Global lithium strategic planning outlook – Q1 2022. 24.2 GEOLOGY AND RESOURCES Asselin, R., Chief Geologist, 2016, Final – Procédures Forages de Surface 2016, Internal North American Lithium report (in French). Blanchet, D., Hardie, C., Lavery, M.E., Lemieux, M., Nussipakynova, D., Shannon, J.M., Woodhouse, P., 2011, Feasibility Study Update, NI 43-101 Technical Report, Québec Lithium Project, La Corne Township, Québec, Prepared for Canada Lithium Corp., (pp.164). Breaks, F.W. and Tindle, A.G,1997, Rare-Metal Exploration Potential of the Separation Lake Area: An Emerging Target for Bikita-Type Mineralization in Superior Province, Northwestern Ontario, Ministry of Energy, Northern Development and Mines Publication OFR5966. Carrier, A., Kerr-Gilespis, F., 2016, Note technique préliminaire de diligence raisonnable sur la campagne de forage de surface et d’échantillonnage, InnovExplo due diligence report, 10 p. (in French). Černý, P., 1991, Rare Element Granitic Pegmatites. Part I: Anatomy and Internal Evolution of Pegmatite Deposits, Geoscience Canada, v.18, (pp. 46-67). Corfu, F.,1993, The evolution of the southern Abitibi greenstone belt in light of precise U-Pb geochronology, Economic Geology (1993) 88 (6): 1323–1340. Dawson, K.R., 1966, A Comprehensive Study of the Preissac-La Corne Batholith, Abitibi Country, Québec, Geological Survey of Canada, Bulletin 142. Derry, D.R., 1950, Lithium-bearing Pegmatites in Northern Québec, Economic Geology, v. 45(2), (pp. 95- 104). Feng, R. and Kerrich, R., 1991, Single zircon age constraints on the tectonic juxtaposition of the Archean Abitibi greenstone belt and Pontiac Subprovince, Québec, Canada, Geochimica et Cosmochimica Acta, volume 55 Issue 11. Gariépy, C. and Allègre, C., 1985, The lead isotope geochemistry and geochronology of late-kinematic intrusives from the Abitibi greenstone belt, and the implications for late Archaean crustal evolution, Geochimica et Cosmochimica Acta, volume 49 Issue 11. Hardie, C., Live, P., Palumbo, E., 2016, Technical Report 43-101 on the Pre-Feasibility Study for the Québec Lithium Project, Prepared for Canada Lithium Corp., (pp. 135). North American Lithium DFS Technical Report Summary – Quebec, Canada 339 Hardie, C., Stone, M., Lavery M.E., Lemieux, M., Blanchet, D., Woodhouse, P., January 2011, Technical Report NI 43-101 on the Feasibility Study for the Québec Lithium Project, La Corne Township, Québec, Prepared for Canada Lithium Corp., (pp. 146). Karpoff, B.S., 1955, Pegmatitic Lithium Deposit of the Québec Lithium Corporation, Internal Report of Québec Lithium Corporation. Karpoff, B.S., 1993, Évaluation Technique de la Propriété Minière Québec Lithium, Internal Report for Cambior Inc. (in French). Lavery, M.E., Stone, M., November 2010, Technical Report, Québec Lithium Property, La Corne Township, Québec, Prepared for Canada Lithium Corp., (pp. 146). London, D. 2008, Pegmatites, The Canadian Mineralogist Special Publication 10. McCracken, T., et al., 2022, Prefeasibility Study Report for the North American Lithium Project, Québec Lithium Property, La Corne, Québec, Canada, Prepared for Sayona Mining Limited. Mulja, T., Williams-Jones, A.E., Wood, S.A., Boily, M., 1995, The Rare-Element enriched Monzogranite- Pegmatite-Quartz Vein System in the Preissac-La Corne Batholith, Québec, Geology and Mineralogy, Canadian Mineralogist, v. 33, (pp. 793-815). Rowe, R.B., 1953, Pegmatitic Beryllium and Lithium Deposits, Preissac-La Corne region, Abitibi County, Québec, Geological Survey of Canada, Paper 53-3. Selway, J.B., Breaks, F.W., Tindle, A.G., 2005, A Review of Rare-Element (Li-Cs-Ta) Pegmatite Exploration Techniques for the Superior Province, Canada, and Large Worldwide Tantalum Deposits, Exploration and Mining Geology (2005) 14 (1-4): 1–30. Shannon, J.M., Nussipakynova, D., Pitman, C., 2011, Québec Lithium Property, La Corne Township, Québec, Technical Report for Canada Lithium Corp., Prepared by AMC Mining Consultants (Canada) Ltd., December 5, 2011, (pp. 115). Steiger, R.H. and Wasserburg, G.J., 1969, Comparative U-Th-Pb systematics in 2.7 × 10⁹yr plutons of different geologic histories, Geochimica et Cosmochimica Acta, Volume 33, Issue 10, Pages 1213- 1232. Stone, M., Ilieva, T., April 2010, Independent Technical Report, Québec Lithium Property, La Corne Township, Québec, Prepared for Canada Lithium Corp. by Caracle Creek International Consulting Inc., (pp. 227). Stone, M., Selway, J., December 2009, Independent Technical Report, Québec Lithium Property, La Corne Township, Québec, Prepared for Canada Lithium Corp. by Caracle Creek International Consulting Inc., (pp. 132, plus appendices). North American Lithium DFS Technical Report Summary – Quebec, Canada 340 Tremblay, L.P., 1950, Fiedmont Map Area, Abitibi County, Québec, Geological Survey of Canada, Memoir 253. 24.3 MINING Castro, L., El Madani, F., 2010, Feasibility Pit Slope Design – Québec Lithium Open Pit Project - report no. 10-1221-0017-3000-Rev0. Poniewierski, J., 2017, Pseudoflow Explained - A discussion of Deswik Pseudoflow Pit Optimization in comparison to Whittle LG Pit Optimization, (pp. 4). Golder Associés Ltée, 2010, Investigation hydrogéologique - Exploitation à ciel ouvert, Québec Lithium - Secteur du Lac Lortie. Golder Associés Ltée, 2017, Investigation hydrogéologique - Exploitation à ciel ouvert, Québec Lithium - Secteur du Lac Lortie. Golder Associés Ltée, 2018, Memorandum Technique, TMF Chapter for NI-43101 Update – June 17 Golder Associés Ltée, 2022, Avis Technique – Critères de Conception pour l’Enveloppe de Fosse de Niveau Pré-faisabilité – Site Minier Lithium Amérique du Nord, La Corne, Québec. WSP Golder, November 2022, Étude hydrogéologique du secteur de la fosse au site minier de Lithium Amérique du Nord, La Corne, Québec WSP Golder, 2 december 2022, Mise à jour de l’évaluation des piliers de surface de la mine Lithium Amérique du Nord WSP Golder, february 23, 2023, Revue sommaire de l’enveloppe de fosse du 21 février 2023 WSP Golder, 2023, Memorandum Technique, Préliminaire - Recommandations pour les angles de pentes pour l’étude de faisabilité de la réouverture de la fosse Lithium Amérique du Nord - Lacorne, Québec, Canada 24.4 MINERAL RESOURCES AND METALLURGY North American Lithium, Rapport de Production (Internal document), June 2017 to March 2019. Palumbo, E., Hardie, C., 2016, Technical Report on Laboratory Testwork and Operational Issues, Prepared for North American Lithium Inc. by BBA Inc. (Technical Report No. 5939017-000000-49-ERA-0002, Rev 00, December 12, 2016), (pp. 112).

North American Lithium DFS Technical Report Summary – Quebec, Canada 341 Primero, 2022, North American Lithium Mine - Concentrate Belt Filter Upgrade Study - 24003-REP-PR-001 Rev. C, February 8th, 2022. SGS Canada Inc., 2010, A Pilot Plant Investigation into the Flotation Recovery of Lithium, Québec Lithium Project, Final Report prepared for Canada Lithium Corp., October 25, 2010. SGS Canada Inc., 2019, 15818-004A Flot Test NAL-Sayona. SGS Canada Inc., 2021, 15818-05A Flot Test-Nov. 18. SGS Canada Inc., 2022, 15818-05A/MI4537-NOV21, Semi-Quantitative X-Ray Diffraction. SGS Canada Inc., 2022, 15818-05A Flot Test-March 13. SGS Canada Inc., 2023, 15818-05A Flot Testwork-March 05 Woodhouse, P. et al., 2011, Updated Feasibility Study for the Quebec Lithium Project – Process Section, Prepared for Canada Lithium Corp. by Technology Management Group, (pp. 66). North American Lithium DFS Technical Report Summary – Quebec, Canada 342 25. RELIANCE ON INFORMATION SUPPLIED BY REGISTRANT 25.1 GENERAL The authors of the Definitive Feasibility Study (DFS) relied upon information provided by experts who were not authors of the Report. The authors of the various sections of the Report believe that it is reasonable to rely upon these experts, based on the assertion that the experts have the necessary education, professional designation, and related experience on matters relevant to the technical report. The authors have assumed, and relied on the fact, that all the information and existing technical documents listed in Chapter 24 (References) of this Report are accurate and complete in all material aspects. While the authors reviewed all the available information presented, we cannot guarantee its accuracy and completeness. The authors reserve the right, but will not be obligated, to revise the Report and conclusions, if additional information becomes known subsequent to the date of this Report. The statements and opinions expressed in this document are given in good faith and in the belief that such statements and opinions are neither false, nor misleading at the date of this Report. A draft copy of the Report has been reviewed for factual errors by Sayona Quebec. Any changes made because of these reviews did not involve any alteration to the conclusions made. 25.2 MINERAL CLAIMS AND SURFACE RIGHTS The authors have not independently reviewed ownership of the Project area and any underlying property agreements, mineral claims, surface rights or royalties. The authors have fully relied upon, and disclaimed responsibility for, information derived from Sayona Quebec. Refer to Chapter 3 (Property Description and Location) for further information on property ownership and agreements.
EX-96.4
25
ex964dfs-authier22724.htm
EX-96.4
ex964dfs-authier22724

Authier Lithium DFS Technical Report Summary – Quebec, Canada Exhibit 96.4 Authier Lithium DFS Technical Report Summary – Quebec, Canada Date and signature page This Technical Report Summary is effective as of the 31st of December 2023. Name: Sylvain Collard, P.Eng. Signature: [Signed and Sealed] Date: February 27, 2024 Name: Jarrett Quinn, P.Eng. Signature: [Signed and Sealed] Date: February 27, 2024 Name: Maxime Dupere, P.Geo. Signature: [Signed and Sealed] Date: February 27, 2024 Name: Philippe Chabot, P.Eng. Signature: [Signed and Sealed] Date: February 27, 2024

Authier Lithium DFS Technical Report Summary – Quebec, Canada 1 TABLE OF CONTENTS 1 Executive Summary ............................................................................................................................ 23 1.1 Introduction ................................................................................................................................ 23 1.2 Forward Looking Notice .............................................................................................................. 23 1.3 Property Description and Ownership ......................................................................................... 24 1.4 Geology and Mineralization ........................................................................................................ 28 1.5 Exploration Status ....................................................................................................................... 29 1.6 Mineral Reserve Estimates ......................................................................................................... 30 1.7 Mineral Resource Estimate ......................................................................................................... 31 1.8 Material Development and Operations ...................................................................................... 33 1.9 Recovery Methods ...................................................................................................................... 33 1.10 Mine Design ................................................................................................................................ 33 1.11 Infrastructure, Capital, and Operating Cost Estimates ............................................................... 34 1.11.1 Project Infrastructure .......................................................................................................... 34 1.11.2 Capital and Operating Cost Estimates................................................................................. 36 1.12 Market Studies ............................................................................................................................ 37 1.12.1 Price Forecast ...................................................................................................................... 38 1.12.2 Spodumene Price Forecast ................................................................................................. 38 1.12.3 Carbonate Price Forecast .................................................................................................... 38 1.13 Environmental, Social and Permitting ........................................................................................ 39 1.13.1 Environmental Studies ........................................................................................................ 39 1.13.2 Decarbonization Plan .......................................................................................................... 40 1.13.3 Population ........................................................................................................................... 41 1.13.4 Permitting ........................................................................................................................... 41 1.13.5 Reclamation and Closure .................................................................................................... 42 1.13.6 Waste Dumps and Tailings .................................................................................................. 42 1.14 Economic Analysis ....................................................................................................................... 43 1.14.1 Project Implementation and Execution .............................................................................. 44 1.14.2 Risk and Opportunity .......................................................................................................... 44 Authier Lithium DFS Technical Report Summary – Quebec, Canada 2 1.15 Conclusions and QP Recommendations ..................................................................................... 45 1.16 Revision Notes ............................................................................................................................ 45 2 Introduction ....................................................................................................................................... 46 2.1 Terms of Reference and Purpose of the Report ......................................................................... 46 2.2 Qualifications of Qualified Persons/Firms .................................................................................. 47 2.2.1 Contributing Authors .......................................................................................................... 47 2.2.2 Site Visits ............................................................................................................................. 48 2.3 Source of information ................................................................................................................. 48 2.4 List of Abbreviations and Units of Measure ................................................................................ 48 3 Property Description .......................................................................................................................... 55 3.1 Property Location, Country, Regional and Government Setting ................................................ 55 3.1.1 Government Setting ............................................................................................................ 57 3.2 Property Ownership, Mineral Tenure, Agreement and Royalties .............................................. 57 3.2.2 Mineral Rights and Permitting ............................................................................................ 60 3.2.3 Agreements and Royalties .................................................................................................. 62 3.3 Environmental Liabilities and Other Permitting Requirements .................................................. 63 4 Accessibility, Climate, Physiography, Local Resources, and Infrastructure ....................................... 64 4.1 Accessibility ................................................................................................................................. 64 4.2 Topography, Elevation, Vegetation and Climate ........................................................................ 64 4.2.1 Physiography ....................................................................................................................... 64 4.2.2 Climate ................................................................................................................................ 64 4.2.3 Vegetation and Wetlands ................................................................................................... 66 4.3 Local Infrastructure and Resources ............................................................................................ 66 4.4 Surface Rights.............................................................................................................................. 67 5 History ................................................................................................................................................ 68 5.1 Historical Exploration and Drill Programs ................................................................................... 68 5.2 Historical Resource and Reserve Estimates ................................................................................ 71 5.3 Historical Production .................................................................................................................. 73 6 Geological Setting, Mineralization and Deposit ................................................................................. 74 6.1 Regional Geology ........................................................................................................................ 74

Authier Lithium DFS Technical Report Summary – Quebec, Canada 3 6.2 Local Geology .............................................................................................................................. 75 6.3 Property Geology ........................................................................................................................ 77 6.4 Mineralization ............................................................................................................................. 78 6.5 Deposit Types .............................................................................................................................. 80 7 Exploration ......................................................................................................................................... 82 7.1 General ........................................................................................................................................ 82 7.2 Sayona Québec Drilling 2016 ...................................................................................................... 82 7.3 Sayona Québec Drilling 2017 ...................................................................................................... 84 7.4 Sayona Québec Drilling 2018 ...................................................................................................... 93 7.5 Resource Expansion and Exploration Drilling ............................................................................. 93 7.6 Drillhole Results by Sector .......................................................................................................... 94 7.6.1 Main Authier Pegmatite ...................................................................................................... 94 7.6.2 Northern Pegmatite ............................................................................................................ 95 7.6.3 Condemnation Holes ........................................................................................................... 96 8 Sample Preparation, Analyses and Security ....................................................................................... 98 8.1 Reverse Circulation Procedures, Sample Preparation and Analyses .......................................... 98 8.1.1 ALS Minerals 2010 Procedures ........................................................................................... 98 8.1.2 AGAT Laboratories 2011-2012 Procedures ......................................................................... 99 8.1.3 SGS 2016-2017 Sampling Procedures ................................................................................. 99 8.2 QA / QC Procedures .................................................................................................................... 99 8.2.1 Quality Assurance and Quality Control Procedure by Glen Eagle ...................................... 99 8.2.2 2010-2012 Reference Materials Results ........................................................................... 101 8.2.3 Quality Assurance and Quality Control Procedures by Sayona Québec ........................... 104 8.2.4 2016 Reference Materials Results .................................................................................... 105 8.2.5 2017 Reference Materials Results .................................................................................... 108 8.2.6 Sayona Québec 2018 Reference Materials Results .......................................................... 112 8.3 Sample Shipment and Security ................................................................................................. 116 8.3.7 AGAT Laboratories 2011-2012 Procedures ....................................................................... 116 8.3.8 SGS 2016-2017 Sampling Procedures ............................................................................... 116 8.4 Core Handling Procedures ........................................................................................................ 116 Authier Lithium DFS Technical Report Summary – Quebec, Canada 4 8.4.1 Sayona Drilling Summary .................................................................................................. 116 8.5 Specific Gravity Measurements ................................................................................................ 118 8.5.1 Specific Gravity of Mineralized Material ........................................................................... 118 8.6 Qualified Person Commentary .................................................................................................. 119 9 Data Verification............................................................................................................................... 120 9.1 General ...................................................................................................................................... 120 9.2 Check Sampling of 2010 Assay Results by SGS Geological Services .......................................... 121 9.3 Check Sampling of 2011-2012 Assay Results by SGS Geological Services ................................ 121 9.4 Twinning of Historical Drillholes ............................................................................................... 123 10 Mineral Processing and Metallurgical Testing ................................................................................. 129 10.1 Initial Characterization and Scoping Studies ............................................................................. 129 10.1.1 Overview ........................................................................................................................... 129 10.2 Metallurgical Laboratory Test-Work Program and Metallurgical Results ................................ 132 10.2.1 Glen Eagle Resources Inc. Testwork (2012) ...................................................................... 132 10.3 Sayona Québec Metallurgical Testing (2016) ........................................................................... 134 10.3.1 Feed Characterization ....................................................................................................... 134 10.3.2 Grindability ........................................................................................................................ 135 10.3.3 Heavy-liquid Separation .................................................................................................... 136 10.3.4 Bench-scale Flotation Tests............................................................................................... 136 10.4 Sayona Québec Metallurgical Test Programs (2017) ................................................................ 137 10.4.1 Bench-scale Flotation (August 2017) ................................................................................ 137 10.4.2 Bench-scale Flotation (October 2017) .............................................................................. 138 10.4.3 Heavy Liquid Separation (October 2017) .......................................................................... 140 10.4.4 Heavy Liquid Separation (December 2017) ...................................................................... 140 10.5 Pilot Plant Operation ................................................................................................................. 141 10.5.1 Sayona Québec Pilot Plant Program (2018) ...................................................................... 141 10.5.2 Sayona Québec Batch Optimization Test Program (2018)................................................ 165 10.6 Qualified Persons Commentary ................................................................................................ 167 11 Mineral Resource Estimates ............................................................................................................. 168 11.1 Data Used for Ore Grade Estimation ........................................................................................ 168

Authier Lithium DFS Technical Report Summary – Quebec, Canada 5 11.1.1 Exploratory Data Analysis ................................................................................................. 168 11.1.2 Analytical Data .................................................................................................................. 168 11.1.3 Mineralized Intervals Data ................................................................................................ 169 11.1.4 Composites Data ............................................................................................................... 170 11.1.5 Specific Gravity .................................................................................................................. 173 11.2 Geological Interpretation .......................................................................................................... 174 11.2.6 Topographic and Overburden/Bedrock Contact Surfaces ................................................ 174 11.3 Resource Estimate Methodology, Assumptions and Parameters ............................................ 178 11.4 Mineral Grade Estimation and Grade Interpolation Methodology .......................................... 179 11.4.1 Geostatistical Study 2018-2020 ........................................................................................ 179 11.4.2 Resource Block Modelling ................................................................................................. 180 11.4.3 Block Model Interpolation ................................................................................................ 180 11.4.4 Statistical Validation of the Interpolation Process ............................................................ 185 11.5 Mineral Resource Classification ................................................................................................ 190 11.6 Classified Mineral Resource Estimates ..................................................................................... 195 11.7 Potential Risks in Developing the Mineral Resource ................................................................ 202 11.7.1 Sensitivity Analysis ............................................................................................................ 202 12 Mineral Reserves Estimates ............................................................................................................. 205 12.1 Reserve Estimate Methodology, Assumptions, Parameters and Cut-off-Value ....................... 205 12.2 Resource Block Model............................................................................................................... 205 12.3 Topography Data ....................................................................................................................... 206 12.4 Mining Block Model .................................................................................................................. 206 12.5 Mine and Plant Production Scenarios ....................................................................................... 206 12.5.1 Modifying Factors ............................................................................................................. 206 12.5.2 Pit Optimization ................................................................................................................ 208 12.5.3 Mine Design ...................................................................................................................... 211 12.6 Mineral Reserve Estimate ......................................................................................................... 214 12.6.1 Assessment of Reserve Estimate Risks ............................................................................. 215 12.7 Material Development and Operations .................................................................................... 216 13 Mining Methods ............................................................................................................................... 217 Authier Lithium DFS Technical Report Summary – Quebec, Canada 6 13.1 Mine Design .............................................................................................................................. 217 13.1.1 Pit Design Parameters ....................................................................................................... 217 13.2 Geotechnical and Hydrological Considerations ........................................................................ 218 13.2.1 Geotechnical Considerations ............................................................................................ 218 13.2.2 Dewatering ........................................................................................................................ 220 13.2.3 Hydrogeological Considerations ....................................................................................... 220 13.2.4 Ore Rehandling Area ......................................................................................................... 221 13.2.5 Haul Roads ........................................................................................................................ 221 13.2.6 Explosives Storage ............................................................................................................. 222 13.3 Mining Fleet and Manning ........................................................................................................ 223 13.3.1 Contract Mining ................................................................................................................ 223 13.3.2 Roster ................................................................................................................................ 223 13.3.3 Mine Maintenance ............................................................................................................ 224 13.3.4 Mine Technical Services .................................................................................................... 224 13.3.5 Drilling ............................................................................................................................... 224 13.3.6 Blasting .............................................................................................................................. 225 13.3.7 Loading .............................................................................................................................. 225 13.3.8 Hauling .............................................................................................................................. 225 13.3.9 Auxiliary ............................................................................................................................. 226 13.4 Mine Plan and Schedule ............................................................................................................ 226 13.4.1 Strategy & Constraints ...................................................................................................... 226 13.4.2 Results ............................................................................................................................... 227 14 Processing and Recovery Methods .................................................................................................. 237 15 Infrastructure ................................................................................................................................... 238 15.1 Waste Rock Storage Facility ...................................................................................................... 238 15.1.1 General Project Description .............................................................................................. 239 15.1.2 Design Update ................................................................................................................... 240 15.1.3 Design Summary ............................................................................................................... 242 15.1.4 Stability Analysis for WRSF and Related Infrastructure .................................................... 244 15.1.5 Waste Rock Handling Methodology.................................................................................. 247

Authier Lithium DFS Technical Report Summary – Quebec, Canada 7 15.2 Water Management .................................................................................................................. 247 15.2.1 Water Management Strategy ........................................................................................... 247 15.2.2 Projected Infrastructure for Water Management ............................................................ 247 15.2.3 Design Criteria for Basins and Ditches .............................................................................. 248 15.2.4 Watersheds ....................................................................................................................... 249 15.2.5 Operational Water Balance and Flux Diagrams ................................................................ 250 15.2.6 Basins Sizing and Design ................................................................................................... 253 15.2.7 Design of the Ditches ........................................................................................................ 253 15.2.8 Pumping Systems .............................................................................................................. 254 15.2.9 Wastewater Treatment ..................................................................................................... 254 15.2.10 Assessment of the Risk of Climate Change ....................................................................... 255 15.3 Access Roads ON/OFF and ROM Pads ...................................................................................... 256 15.3.11 Site Preparation and Pads ................................................................................................. 256 15.3.12 Haul Roads ........................................................................................................................ 257 15.3.13 Internal LV Roads and Car parking .................................................................................... 258 15.4 Electrical Power Supply and Distribution .................................................................................. 258 15.5 Water Supply ............................................................................................................................. 258 15.5.1 Raw Water......................................................................................................................... 258 15.5.2 Fire Water ......................................................................................................................... 259 15.5.3 Sewage .............................................................................................................................. 259 15.6 Construction Materials ............................................................................................................. 259 15.6.1 Fuel, Lube and Oil Storage Facility .................................................................................... 259 15.6.2 Explosives Magazine ......................................................................................................... 260 15.7 Communications ....................................................................................................................... 260 15.8 Security and Access Point ......................................................................................................... 260 15.9 On-Site Infrastructure ............................................................................................................... 261 15.9.1 Temporary Construction Management Facility ................................................................ 261 15.9.2 Offsite Infrastructure ........................................................................................................ 261 15.9.3 General Earthworks .......................................................................................................... 261 15.9.4 General, Green and Regulated Waste .............................................................................. 262 Authier Lithium DFS Technical Report Summary – Quebec, Canada 8 15.9.5 Ore Transportation ........................................................................................................... 262 15.9.6 Administration Facility ...................................................................................................... 262 16 Market Studies and Contracts .......................................................................................................... 263 16.1 Product Specifications ............................................................................................................... 263 16.1.1 Type of Ore Processed from Hard Rock to Supply Lithium ............................................... 263 16.1.2 Refined Production by Raw Materials .............................................................................. 264 16.1.3 Refined Production Capacity by Final Product .................................................................. 265 16.2 Product Pricing .......................................................................................................................... 265 16.2.1 Price Forecast .................................................................................................................... 265 16.2.2 Spodumene Price Forecast ............................................................................................... 266 16.2.3 Carbonate Price Forecast .................................................................................................. 267 16.2.4 Spodumene Price forecast – Relatively to carbonate price .............................................. 267 16.3 Risks and Uncertainties ............................................................................................................. 268 16.4 Opportunities ............................................................................................................................ 268 16.4.1 Refined Lithium Demand by Product ................................................................................ 269 16.4.2 Refined Lithium Demand by End Use Segment ................................................................ 270 16.5 Contract Sales ........................................................................................................................... 271 16.6 Market Analysis ......................................................................................................................... 271 16.6.1 Market Balance for Battery Grade .................................................................................... 271 17 Environmental Studies, Permitting, Social or Community Impacts ................................................. 273 17.1 Environmental Baseline and Impact Studies ............................................................................ 273 17.1.1 Environmental Baseline .................................................................................................... 273 17.1.2 Topography ....................................................................................................................... 273 17.1.3 Local Geomorphology ....................................................................................................... 273 17.1.4 Soils Quality ....................................................................................................................... 274 17.1.5 Hydrology .......................................................................................................................... 274 17.1.6 Underground Water Quality ............................................................................................. 274 17.1.7 Surface Water Quality ....................................................................................................... 274 17.1.8 Sediments.......................................................................................................................... 275 17.1.9 Vegetation and Wetlands ................................................................................................. 275

Authier Lithium DFS Technical Report Summary – Quebec, Canada 9 17.1.10 Terrestrial and Avian Fauna .............................................................................................. 275 17.1.11 Fish and Fish Habitat ......................................................................................................... 276 17.1.12 Benthic Community........................................................................................................... 276 17.1.13 Endangered Wildlife .......................................................................................................... 276 17.2 Monitoring Program ................................................................................................................. 276 17.2.1 Groundwater Monitoring .................................................................................................. 277 17.2.2 Effluent Monitoring ........................................................................................................... 277 17.2.3 Environmental Effects Monitoring Program ..................................................................... 277 17.3 Waste Rock, Ore, and Water Management .............................................................................. 277 17.3.1 Preliminary Geochemical Characterization ....................................................................... 278 17.3.2 Kinetic Geochemical Characterization .............................................................................. 278 17.3.3 Complementary Geochemical Studies .............................................................................. 280 17.3.4 Prediction of Water Quality .............................................................................................. 280 17.4 Project Permitting ..................................................................................................................... 280 17.4.1 Provincial Requirements ................................................................................................... 280 17.4.2 Federal Requirements ....................................................................................................... 282 17.4.3 Other Authorizations ........................................................................................................ 282 17.5 Other Environmental Concerns ................................................................................................ 284 17.5.1 Air Quality ......................................................................................................................... 284 17.5.2 Noise ................................................................................................................................. 285 17.5.3 Soils ................................................................................................................................... 285 17.5.4 Hydrology .......................................................................................................................... 285 17.5.5 Surface Water Quality ....................................................................................................... 285 17.5.6 Hydrogeology and Underground Water Quality ............................................................... 286 17.5.7 Terrestrial Vegetation ....................................................................................................... 287 17.5.8 Wetlands ........................................................................................................................... 287 17.5.9 Ichthyofauna ..................................................................................................................... 288 17.5.10 Species of Interest ............................................................................................................. 288 17.5.11 Cultural and Archaeological Heritage ............................................................................... 288 17.6 Social and Community Impacts ................................................................................................. 288 Authier Lithium DFS Technical Report Summary – Quebec, Canada 10 17.6.1 Decarbonization Plan ........................................................................................................ 288 17.6.2 Strategy ............................................................................................................................. 289 17.6.3 Population ......................................................................................................................... 290 17.6.4 Stakeholder Mapping ........................................................................................................ 291 17.6.5 Land Uses .......................................................................................................................... 292 17.6.6 Potential Community Related Requirements and Status of Negotiations or Agreements 292 17.7 Closure and Reclamation Plan .................................................................................................. 294 17.7.1 Overview ........................................................................................................................... 295 17.7.2 Post-Closure Monitoring ................................................................................................... 295 17.7.3 Costs Estimation ................................................................................................................ 295 18 Capital and Operating Costs ............................................................................................................. 297 18.1 Summary of Capital Cost Estimate ............................................................................................ 297 18.2 Mine Capital Expenditure ......................................................................................................... 298 18.3 Plant Capital Expenditure.......................................................................................................... 298 18.4 Infrastructure Capital Expenditure ........................................................................................... 298 18.5 Preproduction and Environmental Costs .................................................................................. 299 18.6 Basis of Estimate ....................................................................................................................... 300 18.6.1 Estimate Overview and Qualifications .............................................................................. 300 18.6.2 Base Date .......................................................................................................................... 300 18.6.3 Estimate Accuracy ............................................................................................................. 301 18.6.4 Exclusions and Assumptions ............................................................................................. 301 18.6.5 Wetlands Compensation ................................................................................................... 301 18.6.6 Royalty Buyback ................................................................................................................ 302 18.6.7 Closure and Reclamation .................................................................................................. 302 18.7 Sustaining Capital ...................................................................................................................... 302 18.7.1 Mining ............................................................................................................................... 302 18.7.2 Infrastructure .................................................................................................................... 303 18.7.3 Closure and Reclamation .................................................................................................. 303 18.8 Summary of Operating Cost Estimate ....................................................................................... 303

Authier Lithium DFS Technical Report Summary – Quebec, Canada 11 18.9 Mine Operating Cost ................................................................................................................. 304 18.9.1 Mine and Geology ............................................................................................................. 304 18.10 Plant Operating Cost ................................................................................................................. 306 18.11 G&A ........................................................................................................................................... 306 19 Economic Analysis ............................................................................................................................ 307 19.1 Economic Base Case, Inputs and Assumptions ......................................................................... 307 19.2 Products Considered in the Cash Flow Analysis ........................................................................ 309 19.3 Financial Model and Key Metrics .............................................................................................. 311 19.4 Taxes, Royalties and Other Fees ............................................................................................... 311 19.4.1 Royalties ............................................................................................................................ 311 19.4.2 Working Capital ................................................................................................................. 311 19.4.3 Taxation ............................................................................................................................. 312 19.5 Contracts ................................................................................................................................... 312 19.6 Indicative Economics, Base Case ............................................................................................... 313 19.7 Sensitivity Analysis .................................................................................................................... 313 19.8 Alternative Cases / Sensitivity Models ...................................................................................... 318 20 Adjacent Properties .......................................................................................................................... 319 21 Other Relevant Data and Information ............................................................................................. 322 21.1 Project Execution Plan .............................................................................................................. 322 21.2 Project Organization ................................................................................................................. 322 21.2.1 Engineering and Procurement .......................................................................................... 322 21.2.2 Construction Management ............................................................................................... 324 21.3 Risk and Opportunity Assessment ............................................................................................ 324 22 Interpretation and Conclusions ........................................................................................................ 332 22.1 Project Summary ....................................................................................................................... 332 22.2 Key Outcomes ........................................................................................................................... 332 22.3 Geology and Resources ............................................................................................................. 332 22.4 Mining and Reserves ................................................................................................................. 333 22.5 Infrastructure and Water Management ................................................................................... 333 22.6 Market Studies .......................................................................................................................... 333 Authier Lithium DFS Technical Report Summary – Quebec, Canada 12 22.7 Environmental and Social Issues ............................................................................................... 334 22.8 Project Costs and Financial Evaluation ..................................................................................... 334 22.8.1 Capital Costs ...................................................................................................................... 334 22.8.2 Operating Costs ................................................................................................................. 335 22.8.3 Financial Analysis .............................................................................................................. 336 23 Recommendations ........................................................................................................................... 338 23.1 Project Summary ....................................................................................................................... 338 23.2 Geology and Resources ............................................................................................................. 338 23.3 Mining and Reserves ................................................................................................................. 339 23.4 Infrastructure ............................................................................................................................ 340 23.5 Market Studies .......................................................................................................................... 341 23.6 Environmental and Social Recommendations .......................................................................... 341 23.7 Project Costs and Financial Evaluation ..................................................................................... 341 23.8 Waste Dumps Management ..................................................................................................... 342 23.9 Decarbonization ........................................................................................................................ 342 23.10 Project Execution ...................................................................................................................... 342 24 References ........................................................................................................................................ 343 24.1 List of References ...................................................................................................................... 343 25 Reliance on Information supplied by Registrant .............................................................................. 346 25.1 Information Supplied by Registrant .......................................................................................... 346 25.2 Details of Reliance ..................................................................................................................... 346

Authier Lithium DFS Technical Report Summary – Quebec, Canada 13 LIST OF TABLES Table 1-1 – List of Authier Property claims ................................................................................................. 27 Table 1-2 – Authier Lithium Project Mineral Reserve estimate at Effective Date of December 31, 2023 at CAD$120/t. .................................................................................................................................................. 30 Table 1-3 – Authier Mineral Resource statement at effective date of October 6, 2021 based on USD $977/t Li₂O, exclusive of Mineral Reserves. ........................................................................................................... 32 Table 1-4 – Project initial capital cost detailed summary ........................................................................... 36 Table 1-5 – Sustaining Capital Cost Estimate Summary.............................................................................. 37 Table 1-6 – Summary LOM Operating Cost Estimate Summary ................................................................. 37 Table 1-7 – Financial Analysis Summary ..................................................................................................... 43 Table 1-8 – Main project risks ..................................................................................................................... 45 Table 2-1 – Chapters responsibility ............................................................................................................. 47 Table 2-2 – List of Abbreviations ................................................................................................................. 49 Table 2-3 – Units of Measure ...................................................................................................................... 52 Table 3-1 – List of Authier Property claims ................................................................................................. 59 Table 3-2 – Authier project summary royalties .......................................................................................... 62 Table 4-1 – Average temperatures by month. ............................................................................................ 65 Table 4-2 – Average monthly precipitation with the proportions of rain and snow. ................................. 65 Table 5-1 – Summary of drilling completed on the Property prior to the Sayona acquisition in 2016. ..... 71 Table 5-2 – Glen Eagle 2013 Historical Estimate (NI 43-101 compliant at 0.5% Li2O cut-off). ................... 72 Table 7-1 – Phase 1 Sayona drillhole collar location and intercept information (Downhole intersections in metres). ....................................................................................................................................................... 83 Table 7-2 – Phase 2 Sayona drillhole collar location and intercept information (downhole intersections in meters). ....................................................................................................................................................... 85 Table 7-3 – Sayona Phase 3 Metallurgical Pilot Plan drillhole collar location and intercept information (downhole intersections in meters). ........................................................................................................... 95 Table 7-4 – Sayona Phase 3 Metallurgical Pilot Plan drillhole collar location and intercept information (downhole intersections in metres). ........................................................................................................... 96 Table 8-1 – Results from Custom Low-Li and High-Li standards. .............................................................. 101 Authier Lithium DFS Technical Report Summary – Quebec, Canada 14 Table 8-2 – Results from custom Low-Li and High-Li standards – Sayona Québec 2016. ........................ 105 Table 8-3 – Blank Summary – Sayona Québec 2016. ................................................................................ 107 Table 8-4 – Results from custom Low-Li and High-Li standards – Sayona Québec 2017. ........................ 108 Table 8-5 – Blank summary – Sayona Québec 2017. ................................................................................ 111 Table 8-6 – Authier 2018 SGS Lakefield batch summary statistics. .......................................................... 112 Table 8-7 – Sayona Québec standard reference material summary. ....................................................... 113 Table 8-8 – Sayona Québec blank summary. ............................................................................................ 115 Table 8-9 – Specific gravity measurements statistical parameters (2010 Program). ............................... 118 Table 8-10 – Specific gravity measurements statistical parameters (2017 Program). ............................. 119 Table 9-1 – Summary statistical analysis of original and check assay results. .......................................... 123 Table 9-2 – Comparative results for metallurgical pilot plant drillholes vs. original drillholes - Authier Property. ................................................................................................................................................... 124 Table 9-3 – Comparative results from the 2010-2012 twin hole drill program at Authier....................... 128 Table 10-1 – Recent Authier metallurgical testing programs. .................................................................. 130 Table 10-2 – Feed sample chemical analysis (2012 testing). .................................................................... 132 Table 10-3 – Mineralogical analysis of the feed sample. .......................................................................... 133 Table 10-4 – Grindability results (2012). ................................................................................................... 133 Table 10-5 – Test F8 test conditions (2012). ............................................................................................. 134 Table 10-6 – Test F8 bench-scale flotation results. .................................................................................. 134 Table 10-7 – Composite sample assays (2016). ........................................................................................ 135 Table 10-8 – Mineralogical analysis (2016). .............................................................................................. 135 Table 10-9 – Grindability results (2016). ................................................................................................... 136 Table 10-10 – Summary of batch test conditions for tests F8 and F15 on AMET1 sample. ..................... 137 Table 10-11 – Summary of batch flotation tests F8 and F15 on AMET1 sample. ..................................... 137 Table 10-12 – Composite assays for the August 2017 test program. ....................................................... 138 Table 10-13 – August 2017 metallurgical testing – Flotation test results. ............................................... 138 Table 10-14 – Composite assays for the October 2017 test program. ..................................................... 139 Table 10-15 – HLS combined sinks results (October 2017). ..................................................................... 140 Table 10-16 – Composite assays for the December 2017 test program. ................................................. 140

Authier Lithium DFS Technical Report Summary – Quebec, Canada 15 Table 10-17 – Chemical compositions of the pilot plant feed samples. ................................................... 142 Table 10-18 – Semi-quantitative XRD results (Rietveld Analysis). ............................................................ 142 Table 10-19 – Summary of grindability results. ........................................................................................ 143 Table 10-20 – Reagent dosages for selected batch tests.......................................................................... 145 Table 10-21 – Selected batch test results for Composite 1 and Composite 2. ......................................... 146 Table 10-22 – Reagent dosages for the locked-cycle batch tests. ............................................................ 151 Table 10-23 – Locked-cycle test results. ................................................................................................... 152 Table 10-24 – Reagent dosages for selected pilot plant tests. ................................................................. 156 Table 10-25 – Selected pilot plant mass balances. ................................................................................... 157 Table 10-26 – Mineralogical analysis of PP11 spodumene concentrate. ................................................. 164 Table 11-1 – Database statistics. .............................................................................................................. 168 Table 11-2 – Range of analytical data inside mineralized solids. .............................................................. 169 Table 11-3 – Statistics for the 1.5-m composites for Li2O......................................................................... 171 Table 11-4 – Specific gravity statistics on Authier. ................................................................................... 173 Table 11-5 – Variography settings. ........................................................................................................... 179 Table 11-6 – Resource block model parameters. ..................................................................................... 180 Table 11-7 – Statistical comparison of assay, composite, and block data statistics report. .................... 189 Table 11-8 – Authier Mineral Resource statement at effective date of October 6, 2021 based on USD $977/t Li₂O, inclusive of Mineral Reserves. .............................................................................................. 198 Table 11-9 – Authier Mineral Resource statement at effective date of October 6, 2021 based on USD $977/t Li₂O, exclusive of Mineral Reserves. ............................................................................................. 199 Table 11-10 – Parameters used by SGS for the Resource pit optimization. ............................................. 200 Table 12-1 – Pit optimization parameters for the Authier Lithium Project. ............................................. 208 Table 12-2 – Pit optimization results. ....................................................................................................... 210 Table 12-3 – Pit design geotechnical parameters. .................................................................................... 212 Table 12-4 – Pit design parameters. ......................................................................................................... 213 Table 12-5 – In-pit haul roads design parameters. ................................................................................... 214 Table 12-6 – Authier Lithium Project Mineral Reserve estimate at Effective Date of March 27, 2023 at CAD$120/t. ................................................................................................................................................ 215 Table 13-1 – Pit design parameters. ......................................................................................................... 217 Authier Lithium DFS Technical Report Summary – Quebec, Canada 16 Table 13-2 – In-pit haul roads design parameters. ................................................................................... 217 Table 13-3 – Pit design geotechnical parameters. .................................................................................... 219 Table 13-4 – Road design parameters. ..................................................................................................... 222 Table 13-5 – Drilling ore and waste patterns. ........................................................................................... 224 Table 13-6 – Mine equipment requirements over the LOM..................................................................... 228 Table 13-7 – Authier Lithium LOM plan. ................................................................................................... 229 Table 15-1 – Summary of the LOM waste material from Authier pit. ...................................................... 240 Table 15-2 – Authier waste LOM production. ........................................................................................... 242 Table 15-3 – Waste rock storage facility required capacity. ..................................................................... 243 Table 15-4 – Waste rock stockpile volumetric LOM requirements. ......................................................... 244 Table 15-5 – Geotechnical parameters of waste rock stockpile constituent materials. .......................... 245 Table 15-6 – Factor of safety of slope stability analysis. .......................................................................... 246 Table 15-7 – Main outputs of the operational water balance. ................................................................. 251 Table 15-8 – Crest elevations. ................................................................................................................... 253 Table 15-9 – Typical Cross-section to be used for the mine site ditches. ................................................. 254 Table 15-10 – Pumping system and lines. ................................................................................................. 254 Table 15-11 – OURANOS Projections for temperature and precipitation. ............................................... 255 Table 17-1 – Provincial and federal acts and regulations. ........................................................................ 283 Table 18-1 – Initial capital costs summary. ............................................................................................... 297 Table 18-2 – Initial capital cost estimate for mining. ................................................................................ 298 Table 18-3 – Infrastructure capital cost estimate. .................................................................................... 299 Table 18-4 – Project initial capital cost detailed summary. ...................................................................... 300 Table 18-5 – Sustaining capital costs. ....................................................................................................... 302 Table 18-6 – Summary LOM operating costs. ........................................................................................... 303 Table 18-7 – LOM mining operating costs. ............................................................................................... 305 Table 18-8 – LOM mining operating cost breakdown. ............................................................................. 306 Table 19-1 – Authier Lithium operation – Financial analysis summary. ................................................... 308 Table 19-2 – Authier Lithium operation – Authier Lithium total project costs. ....................................... 308 Table 19-3 – Project cash flows on an annualized basis (CAD). ................................................................ 309

Authier Lithium DFS Technical Report Summary – Quebec, Canada 17 Table 19-4 – Financial analysis summary (pre-tax and after-tax). ............................................................ 311 Table 19-5 – Ore price sensitivities on after-tax NPV. .............................................................................. 314 Table 19-6 – Operating costs sensitivities on after-tax NPV. .................................................................... 314 Table 19-7 – Capital costs sensitivities on after-tax NPV. ......................................................................... 315 Table 19-8 – Sustaining capital costs sensitivities on after-tax NPV. ........................................................ 315 Table 21-1 – Risks. ..................................................................................................................................... 325 Table 21-2 – Main project risks. ................................................................................................................ 326 Table 21-3 – Main project opportunities. ................................................................................................. 326 Table 21-4 – Project risk register. ............................................................................................................. 327 Table 22-1 – Project initial capital cost detailed summary. ...................................................................... 334 Table 22-2 – Project sustaining capital cost detailed summary. .............................................................. 335 Table 22-3 – Summary LOM operating costs. ........................................................................................... 335 Table 22-4 – Financial analysis summary. ................................................................................................. 336 Table 23-1 – Recommended work program for the Authier Lithium Deposit. ......................................... 339 Authier Lithium DFS Technical Report Summary – Quebec, Canada 18 TABLE OF FIGURES Figure 1-1 – Authier property location coordinates (Source: Google Earth). ............................................. 25 Figure 1-2 – Property mining titles location map ....................................................................................... 26 Figure 1-3 – Proposed pit relative to claim boundaries. ............................................................................. 27 Figure 1-4 – Authier Lithium LOM production profile. ............................................................................... 34 Figure 1-5 – Site Layout............................................................................................................................... 35 Figure 3-1 – Authier property location coordinates (Source: Google Earth). ............................................. 55 Figure 3-2 – Location of the Property relative to a number of nearby regional townships. ...................... 56 Figure 3-3 – Authier proximity to nearby mining services centres. ............................................................ 56 Figure 3-4 – Property mining titles location map. ...................................................................................... 58 Figure 3-5 – Proposed pit relative to claim boundaries. ............................................................................. 59 Figure 5-1 – 2010 Authier Property magnetic survey. ................................................................................ 70 Figure 6-1 – Regional geology map. ............................................................................................................ 75 Figure 6-2 – Stratigraphy of the Authier Lithium Project. .......................................................................... 76 Figure 6-3 – Local geological map. .............................................................................................................. 78 Figure 6-4 – Drill core from hole AL-10-03, showing core and transition zones. ....................................... 79 Figure 6-5 – Drill core from hole AL-16-10, showing spodumene mineralization in the new Authier North pegmatite. ................................................................................................................................................... 80 Figure 6-6 – Schematic representation of regional zonation of pegmatites source (Image from Sinclair 1996 [modified from Trueman and Cerny 1982]). ............................................................................................... 81 Figure 7-1 – Drillhole collar location in isometric view and plan view. ...................................................... 82 Figure 7-2 – Section 707050 m E looking west, demonstrating the extension of mineralization. ............. 88 Figure 7-3 – Section 706800 m E looking west, intersecting narrow zones of low grade to barren mineralization. ............................................................................................................................................ 89 Figure 7-4 – Section 707400 m E looking west (Gap Zone) showing the dip extension of mineralization. 90 Figure 7-5 – Section 707725 m E looking west. .......................................................................................... 91 Figure 7-6 – Hole AL-17-10 in the Northern Pegmatite which intersected 7 m of 1.36% Li2O from a downhole depth of 15 m (vertical depth of 12 m), including 2 m of 2.24% Li2O from 17 m. ..................... 92

Authier Lithium DFS Technical Report Summary – Quebec, Canada 19 Figure 7-7 – Drillhole collar location plan view, highlighting (light blue) the Metallurgical Pilot Plan drillholes completed during Phase 3 drilling at Authier Project. ................................................................ 93 Figure 7-8 – Drillhole collar location plan view, highlighting (red) Condemnation drillholes completed during Phase 3 drilling at the Authier Property. ......................................................................................... 97 Figure 8-1 – RM (STD High, STD Low) results. ........................................................................................... 102 Figure 8-2 – ALS 2010 RM Z-score & percentage from expected RM value. ............................................ 103 Figure 8-3 – AGAT 2011-2012 RM Z-score & percentage from expected RM value. ............................... 104 Figure 8-4 – RM (STD High) results Sayona Québec 2016. ....................................................................... 106 Figure 8-5 – RM (STD Low) results Sayona Québec 2016. ........................................................................ 106 Figure 8-6 – Blank Performance – Sayona Québec 2016. ......................................................................... 107 Figure 8-7 – RM (STD High) results. .......................................................................................................... 109 Figure 8-8 – RM (STD Low) results. ........................................................................................................... 109 Figure 8-9 – Authier High-Li and SGS NBS183 performance 2016-2017. ................................................. 110 Figure 8-10 – Blank performance – Sayona Québec 2017. ....................................................................... 111 Figure 8-11 – Authier High-Li performance. ............................................................................................. 114 Figure 8-12 – Authier Low-Li performance. .............................................................................................. 114 Figure 8-13 – Sayona Québec blank performance. ................................................................................... 115 Figure 9-1 – Correlation plot for independent check samples. ................................................................ 122 Figure 9-2 – Oblique view showing results for twin holes Al-16 and AL-12-09. ....................................... 126 Figure 9-3 – Oblique view showing results for twin holes Al-19 and AL-12-14. ....................................... 127 Figure 10-1 – Authier bulk test pit. ........................................................................................................... 130 Figure 10-2 – Drillhole locations for the various metallurgical testing samples....................................... 131 Figure 10-3 – Grade-recovery curves for the October 2017 testwork. .................................................... 140 Figure 10-4 – Optimized batch flowsheet. ................................................................................................ 144 Figure 10-5 – Batch test grade-recovery curves. ...................................................................................... 145 Figure 10-6 – Locked-cycle flowsheet (Composite 1). .............................................................................. 150 Figure 10-7 – Pilot plant flowsheet (PP-06). ............................................................................................. 155 Figure 10-8 – Effect of pulp density during spodumene conditioning (Composite 1). ............................. 166 Figure 10-9 – Effect of pulp density during spodumene conditioning (Composite 2). ............................. 166 Authier Lithium DFS Technical Report Summary – Quebec, Canada 20 Figure 11-1 – Histograms of the composites. ........................................................................................... 171 Figure 11-2 – Histograms of the Authier mineralised solid original samples compared to the composites. .................................................................................................................................................................. 172 Figure 11-3 – Plan view showing the spatial distribution of the composites. .......................................... 172 Figure 11-4 – View showing the distribution of the composites (looking north). .................................... 173 Figure 11-5 – Section E706800 (looking west) interpretations of the mineralized solids. ....................... 175 Figure 11-6 – Section E707050 (looking west) interpretations of the mineralized solids. ....................... 176 Figure 11-7 – Section E707400 (looking west) interpretations of the mineralized solids. ....................... 176 Figure 11-8 – Section E707500 (looking west) interpretations of the mineralized solids. ....................... 177 Figure 11-9 – Isometric view of the final mineralized solids. ................................................................... 177 Figure 11-10 – Search ellipsoids and orientation grid used in the interpolation process. ....................... 181 Figure 11-11 – Isometric and plan views of the interpolated block model (ID2). ..................................... 182 Figure 11-12 – Section E706800 (looking west) view of the interpolated block model (ID2). .................. 183 Figure 11-13 – Section E707050 (looking west) view of the interpolated block model (ID2). .................. 183 Figure 11-14 – Section E707400 (looking west) view of the interpolated block model (ID2). .................. 184 Figure 11-15 – Section E707500 (looking west) view of the interpolated block model (ID2). .................. 184 Figure 11-16 – Bench (Z202) view of the interpolated block model (ID2). ............................................... 185 Figure 11-17 – Variogram of the 1.5 m composites for Li2O% grades. ..................................................... 186 Figure 11-18 – Histogram of blocks (ID2) vs. composites vs. assays. ........................................................ 187 Figure 11-19 – Boxplot of blocks (ID2) vs. composites vs. assays. ............................................................ 187 Figure 11-20 – Swath plot (X) of blocks vs. composites vs. volume. ........................................................ 188 Figure 11-21 – Swath plot (Y) of blocks vs. composites vs. volume. ........................................................ 188 Figure 11-22 – Swath plot (Z) of blocks vs. composites vs. volume. ......................................................... 189 Figure 11-23 – Block values versus composites inside those blocks comparison. ................................... 190 Figure 11-24 – Classified block model on bench (Z202). .......................................................................... 192 Figure 11-25 – Classified block model on section E706800. ..................................................................... 192 Figure 11-26 – Classified block model on section E707050. ..................................................................... 193 Figure 11-27 – Classified block model on section E707400. ..................................................................... 193 Figure 11-28 – Classified block model on section E707500. ..................................................................... 194

Authier Lithium DFS Technical Report Summary – Quebec, Canada 21 Figure 11-29 – Block model final classification in plan and isometric views. ........................................... 194 Figure 11-30 – Optimized pit shell and block model (no waste/barren material included) in plan and isometric views. ........................................................................................................................................ 201 Figure 11-31 – Optimized pit shell and block model (waste/barren material included) in plan and isometric views). ....................................................................................................................................................... 201 Figure 11-32 – Optimized pit shell and classified block model in plan and isometric views. ................... 202 Figure 11-33 – Grade tonnage curve depending on type of estimation................................................... 203 Figure 12-1 – Pit optimization results. ...................................................................................................... 211 Figure 12-2 – Pit slope design sectors. ...................................................................................................... 213 Figure 12-3 – Ultimate Authier Lithium pit – plan and isometric views. .................................................. 214 Figure 13-1 – Ultimate Authier Lithium pit – plan and isometric views. .................................................. 218 Figure 13-2 – Pit slope design sectors. ...................................................................................................... 219 Figure 13-3 – Authier Lithium LOM production profile. ........................................................................... 230 Figure 13-4 – Isometric view of 2025 pre-production period. .................................................................. 231 Figure 13-5 – Isometric view of 2025 production period. ........................................................................ 231 Figure 13-6 – Isometric view of 2026. ....................................................................................................... 232 Figure 13-7 – Isometric view of 2027. ....................................................................................................... 232 Figure 13-8 – Isometric view of 2028. ....................................................................................................... 233 Figure 13-9 – Isometric view of 2029. ...................................................................................................... 233 Figure 13-10 – Isometric view of 2030...................................................................................................... 234 Figure 13-11 – Isometric view of 2031-35. ............................................................................................... 234 Figure 13-12 – Isometric view of 2036-2040. ........................................................................................... 235 Figure 13-13 – Isometric view of 2041-2046. ........................................................................................... 235 Figure 13-14 – Isometric view at the end of 2046. ................................................................................... 236 Figure 15-1 – Waste rock stockpile cross-section – Overall concept........................................................ 241 Figure 15-2 – Critical sections for stability analysis. ................................................................................. 245 Figure 15-3 – Watersheds in developed conditions. ................................................................................ 248 Figure 15-4 – Watersheds in undeveloped conditions for the Project area. ............................................ 250 Figure 15-5 – LOM water balance for normal precipitation. .................................................................... 252 Authier Lithium DFS Technical Report Summary – Quebec, Canada 22 Figure 15-6 – Site layout. .......................................................................................................................... 256 Figure 16-1 – Mine capacity by type (2020-2040) (kt LCE). Sources: Wood Mackenzie, PwC Analysis. .. 263 Figure 16-2 – Refined production by raw material (2020-2040) (kt LCE). Sources: Lithium-Price-Forecast- Q4-2022-Benchmark-Mineral-Intelligence, PwC Analysis. ....................................................................... 264 Figure 16-3 – Refined production capacity by product (2020-2040) (kt LCE). Sources: Lithium-Price- Forecast-Q4-2022-Benchmark-Mineral-Intelligence, PwC Analysis. ........................................................ 265 Figure 16-4 – Spodumene concentrate price forecast 2020-2040. Sources: Lithium-Price-Forecast-Q4- 2022-Benchmark-Mineral-Intelligence, PwC Analysis. ............................................................................. 266 Figure 16-5 – Battery-grade lithium carbonate price forecast 2022-2040. Sources: Lithium-Price-Forecast- Q4-2022-Benchmark-Mineral-Intelligence, PwC Analysis. ....................................................................... 267 Figure 16-6 – Spodumene price forecast (as % of carbonate price) 2020-2040. Sources: Lithium-Price- Forecast-Q4-2022-Benchmark-Mineral-Intelligence, PwC Analysis. ........................................................ 268 Figure 16-7 – Refined demand by product (2020-2040). Sources: Lithium-Price-Forecast-Q4-2022- Benchmark-Mineral-Intelligence, PwC Analysis. ...................................................................................... 269 Figure 16-8 – Lithium demand by end use (2020-2040). Sources: Lithium-Price-Forecast-Q4-2022- Benchmark-Mineral-Intelligence, PwC Analysis. ...................................................................................... 270 Figure 16-9 – et balance (supply vs demand) for battery grade lithium (2020-2040). Sources: Lithium- Price-Forecast-Q4-2022-Benchmark-Mineral-Intelligence, PwC Analysis. ............................................... 272 Figure 17-1 – Decision flowsheet to determine the level of required protective measures (translation of Figure 2.3 of Directive 019, March 2012 version)..................................................................................... 279 Figure 19-1 – After-Tax NPV at 8% discount rate for different sensitivity scenarios. .............................. 316 Figure 19-2 – After-Tax IRR for different sensitivity scenario. .................................................................. 317 Figure 20-1 – Local metallic deposits and showings. ................................................................................ 320 Figure 20-2 – Adjacent properties map. ................................................................................................... 321

Authier Lithium DFS Technical Report Summary – Quebec, Canada 23 1 EXECUTIVE SUMMARY 1.1 INTRODUCTION This S-K §229.1304 compliant Technical Report Summary (the Report) was prepared at the request of Piedmont Lithium Inc (Piedmont) by Sayona Quebec, based on an existing Technical Report compiled according to the Canadian Institute of Mining, Metallurgy and Petroleum (CIM) reporting guidelines as used in National Instrument 43-101 standards (NI 43-101), which has been previously published and filed by Sayona Mining Limited (Sayona Mining or Sayona). The report was titled: Updated Definitive Feasibility Study Report (UDFS). The Authier property is wholly owned and operated by Sayona Quebec Inc (Sayona Quebec), with Sayona owning 75% and Piedmont 25% of Sayona Quebec in a Joint Venture agreement. Sayona, the registrant of the original NI 43-101 compliant Technical Report, engaged the services of BBA Inc., Synectiq Inc. and SGS Canada Inc., supporting qualified firms staffed with professional engineers, geologists, and process engineers, to prepare this Technical Report at the Feasibility Study (FS) level; using data gathered by the Qualified Persons (QPs) to the disclosure requirements for the Canadian Institute of Mining, Metallurgy and Petroleum (CIM) reporting guidelines as used in National Instrument 43-101 standards (NI 43-101) to compile said report. Piedmont serves as the registrant of this S-K §229.1304 compliant Technical Report Summary. The statement is based on information provided by Sayona Quebec and reviewed by various professionals and Qualified Persons from Sayona Quebec and SGS, or references to information in this Report may not be used without the written permission of Sayona Quebec. Qualified professionals who contributed to the drafting of this report meet the definition of Qualified Persons (QPs), consistent with the requirements of the SEC. The information in this Report related to ore resources and mineral reserves is based on, and fairly represents, information compiled by the QPs as of the effective date of the report. The Authier property is considered material to Piedmont. This report has an effective date of December 31, 2023. The Authier project will be mined through surface mining methods by the sole proprietor, Sayona Quebec. 1.2 FORWARD LOOKING NOTICE Sections of the report contain estimates, projections and conclusions that are forward-looking information within the meaning of applicable securities laws. Forward-looking statements are based upon Authier Lithium DFS Technical Report Summary – Quebec, Canada 24 the responsible QP’s opinion at the time that they are made but, in most cases, involve significant risk and uncertainty. Although the responsible QP has attempted to identify factors that could cause actual events or results to differ materially from those described in this report, there may be other factors that cause events or results to not be as anticipated, estimated, or projected. None of the QPs undertake any obligation to update any forward-looking information. There can be no assurance that forward-looking information in any section of the report will prove to be accurate in such statements or information. Accordingly, readers should not place undue reliance on forward-looking information. This report also includes methodologies behind the derivation of mineral resources and ore reserves, as defined under the United States Securities and Exchange Commission (SEC), through the consideration of geological, mining, and environmental factors. Probable ore reserves, derived from an indicated resource, both of which are assessed in this report, ultimately contribute to revenues and profits in a hypothetical business plan which aligns with Sayona Quebec’s mining plan of the subject property as of December 31, 2023, the effective date of this report. Certain information set forth in this report contains “forward- looking information”, including production of reserves, associated productivity rates, operating costs, capital costs, sales prices, and other assumptions. These statements are not guarantees of future performance and undue reliance should not be placed on them. The assumptions used to develop the forward-looking information and the risks that could cause the actual results to differ materially are detailed in the body of this report. By definition, “indicated” and “probable” terminology carries a lower level of geological and engineering confidence than that which would be reflected through the derivation of “measured” resources and “proven” reserves. Indicated definitions provide a confidence level to support broad estimates of Mineral Resource quantity and grade adequate for long-term mine planning to support Probable Reserve definitions. Resource and reserve estimations, and their impacts on production schedules, processing recoveries, saleable product tonnages, costs, revenues, profits, and other results presented in this report align with the definition and accuracy of indicated resources and probable reserves. Through future exploration campaigns, geological and engineering studies, Sayona Quebec desires to elevate classifications of resources and reserves in due time. 1.3 PROPERTY DESCRIPTION AND OWNERSHIP The Authier property is located in the Abitibi-Témiscamingue Region of the Province of Québec, approximately 45 km northwest of the city of Val-d’Or and 15 km north of the nearest town of Rivière- Héva. The property is situated 48°21'47"N, 78°12'22W in the province of Quebec, as shown in Figure 1-1 (Source: Google Earth).

Authier Lithium DFS Technical Report Summary – Quebec, Canada 25 Figure 1-1 – Authier property location coordinates (Source: Google Earth). The Property is accessible by a high-quality, rural road network connecting to the main highway, Route 109, situated a few kilometres east, which links Rivière-Héva to Amos. Route 109 connects Rivière-Héva to Highway 117, a provincial highway that links Val-d’Or and Rouyn- Noranda (the two regional centers of the Abitibi-Témiscamingue region), to Montréal, which is the closest major city, almost 500 km to the southeast. As of April 6, 2023, the Property consists of one block totaling 24 mineral claims covering 884 ha. The claims are located on Crown Lands in the La Motte and the Preissac Townships. The authors have not independently reviewed ownership of the Project area and any underlying property agreements, mineral claims, surface rights or royalties. The authors have fully relied upon, and disclaimed responsibility for, information derived from Sayona Quebec. Refer to Chapter 3 (Property Description and Location) for further information on the property ownership and agreements. As of April 6, 2023, the Property consists of one block totaling 24 mineral claims covering 884 ha. The claims are located on Crown Lands in the La Motte and the Preissac Townships. The Property area extends 4.1 km in the east-west direction and 3.3 km in the north-south direction. All of the claims comprising the Authier Lithium DFS Technical Report Summary – Quebec, Canada 26 Property are map designated cells (CDC). Figure 1-2 shows the claims map of the Property, and a detailed listing of the Authier Property claims is included in Table 1-1. Approximately 75% of the mineral resources are situated in CDC 2183455, 2194819 and 2116146, with the remainder in claims 2183454 and 2187652 (Figure 1-3). Figure 1-2 – Property mining titles location map

Authier Lithium DFS Technical Report Summary – Quebec, Canada 27 Figure 1-3 – Proposed pit relative to claim boundaries. Table 1-1 – List of Authier Property claims Claim Registered holder Status Registration Expiry Area (ha) Required Number date date work ($) CDC 2116146 Sayona Québec Inc. (100%) Active 08-08-2007 08-07-2025 43.24 $2,500 CDC 2116154 Sayona Québec Inc. (100%) Active 08-08-2007 08-07-2026 42.88 $2,500 CDC 2116155 Sayona Québec Inc. (100 %) Active 08-08-2007 08-07-2026 42.87 $2,500 CDC 2116156 Sayona Québec Inc. (100%) Active 08-08-2007 08-07-2025 42.86 $2,500 CDC 2183454 Sayona Québec Inc. (100%) Active 08-08-2007 06-01-2025 42.85 $2,500 CDC 2183455 Sayona Québec Inc. (100%) Active 06-02-2009 06-01-2025 42.84 $2,500 CDC 2187651 Sayona Québec Inc. (100%) Active 09-02-2009 09-01-2026 21.39 $1,000 CDC 2187652 Sayona Québec Inc. (100 %) Active 09-02-2009 09-01-2025 21.29 $1,000 CDC 2192470 Sayona Québec Inc. (100%) Active 10/22/2009 10/21/2025 21.08 $1,000 CDC 2192471 Sayona Québec Inc. (100%) Active 10/22/2009 10/21/2025 21.39 $1,000 CDC 2194819 Sayona Québec Inc. (100%) Active 11/19/2009 11/18/2025 42.82 $2,500 CDC 2195725 Sayona Québec Inc. (100%) Active 11/27/2009 11/26/2026 29.03 $2,500 CDC 2219206 Sayona Québec Inc. (100%) Active 4/22/2010 4/21/2025 5.51 $1,000 CDC 2219207 Sayona Québec Inc. (100%) Active 4/22/2010 4/21/2025 17.06 $1,000 Authier Lithium DFS Technical Report Summary – Quebec, Canada 28 CDC 2219208 Sayona Québec Inc. (100%) Active 4/22/2010 4/21/2025 55.96 $2,500 CDC 2219209 Sayona Québec Inc. (100%) Active 4/22/2010 4/21/2025 42.71 $2,500 CDC 2240226 Sayona Québec Inc. (100%) Active 07-09-2010 07-08-2025 42.71 $2,500 CDC 2240227 Sayona Québec Inc. (100%) Active 07-09-2010 07-08-2025 42.71 $2,500 CDC 2247100 Sayona Québec Inc. (100%) Active 8/23/2010 8/22/2025 42.75 $2,500 CDC 2247101 Sayona Québec Inc. (100%) Active 8/23/2010 8/22/2025 53.77 $2,500 CDC 2472424 Sayona Québec Inc. (100%) Active 01-11-2017 01-10-2026 42.5 $1,800 CDC 2472425 Sayona Québec Inc. (100%) Active 01-11-2017 01-10-2026 55.96 $1,800 CDC 2480180 Sayona Québec Inc. (100%) Active 2/22/2017 2/21/2026 42.51 $1,800 CDC 2507910 Sayona Québec Inc. (100%) Active 12/15/2017 12/14/2026 25.35 $1,800 Total 884.04 $48,200 1.4 GEOLOGY AND MINERALIZATION The Authier property is located in the southeast part of the Superior Province of the Canadian Shield craton, more specifically in the Southern Volcanic Zone of the Abitibi Greenstone Belt. The spodumene- bearing pegmatites observed on the Property are genetically related to the Preissac-La Corne batholith located 40 km northeast of the city of Val-d’Or (Corfu, 1993; Boily, 1995; Mulja et al., 1995a). The Property geology comprises intrusive units of the La Motte pluton to the north and Preissac pluton to the south, with volcano-sedimentary lithologies of the Malartic Group in the centre. The lithium mineralization observed at the Authier project is mainly spodumene within pegmatite intrusive dykes. The main intrusive phase observed in the pegmatite is described as a core pegmatitic zone, characterized by large centimetre-scale spodumene crystals and white feldspar minerals. The core pegmatitic zone shows internally different pegmatitic phases, characterized by different spodumene crystal lengths, ranging from coarse-grained (earlier) to fine-grained (later). The contacts between different spodumene- bearing pegmatite phases are transitional and well defined at core logging scale. Higher lithium grades are correlated with higher concentrations of larger spodumene crystals. Late-mineral to post-mineral aplite phases cut earlier spodumene-bearing mineralization, causing local diminishing of lithium grade. The core zone hosts the majority of the spodumene mineralization at Authier. The spodumene-bearing pegmatite is principally defined by one single continuous intrusion, or dyke, that contains local rafts, or xenoliths, of the amphibolitic host rock, which are a few metres thick and up to 200 m in length at shallow levels within the western zone. The main pegmatite outcrops in a small, 50 m by 20 m, area at the central-eastern sector that orients east-west and is mostly covered by up to 10 m of overburden. Based on the information gathered from the drilling, the pegmatite intrusion is more than

Authier Lithium DFS Technical Report Summary – Quebec, Canada 29 1,100 m in length and can be up to 60 m thick. The intrusion is generally oriented east-west, dips to the north at angles ranging between 35° and 50° and reaches depths of up to 270 m below surface in drilling to date. A second spodumene-bearing pegmatite, not visible from the surface, was intersected by diamond hole AL-16-10 at shallow levels, between 15 m and 22 m downhole depth, approximately 400 m north of the main pegmatite. Follow-up drilling in early 2017 and 2018 outlined this new body, the Authier North pegmatite, which has a strike extension of 500 m east-west, 7 m average width, gently dipping 15 degrees to the north. The Authier North pegmatite appears at shallow levels, 15 m to 25 m vertical depth, and is open in all directions. These aspects have been prepared under the supervision of Maxime Dupéré who is employed by SGS and holds the position of Geologist. 1.5 EXPLORATION STATUS From 1966 until 1969, exploration work was conducted under the direction and supervision of Mr. George H. Dumont, consulting engineer. The exploration programs, originally designed for magmatic sulphides, successfully outlined the main spodumene-bearing pegmatite on the Property. The work included magnetic and electromagnetic surveys, as well as 23 diamond drillholes (DDH) totaling 2,611.37 m. In 1978, Société Minière Louvem Inc. completed two DDH, AL-24 and Al-25, on the western extension of the pegmatite dyke for a total of 190.5 m. In 1980, Société Québécoise d’Exploration Minière (SOQUEM) completed six DDH (80-26 to 80-31), totaling 619.96 m in the central portion of the spodumene-bearing pegmatite. At the same time, 224 core samples from previous drilling, done between 1967 and 1980 on the pegmatite dyke, were re-assayed for Li2O. In 1993, Raymor conducted additional drilling of 33 holes for a total of 3,699.66 m with the objective of verifying the presence and detailing the geometry of the spodumene-bearing pegmatite. Raymor also conducted geological mapping and trenching and started a 30-t bulk sampling of the pegmatite dyke, which was completed in 1996. From 2010 to 2012, Glen Eagle completed 8,990 m in 69 diamond, NQ diameter DH on the Authier Property; 7,959 m were drilled on the Authier Deposit; 609 m (five DDH) were drilled on the northwest and 422 m on the south-southwest sectors of the Property. From these DH, 1,474 samples were collected for analysis, representing approximately 18% of the drill core material. The DH are generally spaced 25 m to 50 m apart, with azimuth generally south dipping (180°) and dip ranging from 45° to 70°. The mineralized drill intersection ranged from near true thickness to 85% true thickness. Authier Lithium DFS Technical Report Summary – Quebec, Canada 30 In August 2016, Sayona completed the acquisition of the Authier Property for CAD4.0M. In September of the same year, Sayona drilled 19 DDH, for a total of 3,982 metres, prior to completion of a prefeasibility study undertaken by SGS. From January to March 2017, 31 DDH were done, totalling 4,122 metres, drilled for definition and metallurgical testing. A prefeasibility study update was completed in December 2017 by Wave International Ltd. From January to March 2018, 19 DDH were completed, for a total of 2,025 metres, to confirm lithium mineralization at depth. Towards the end of 2018, Sayona completed a seven DDH program totalling 342.5 metres for condemnation purposes. A definitive feasibility study was completed for the Project in September 2018 by BBA Inc. In September 2021, 25 DDH, totalling 3,908 metres, were completed on exploration and definition targets. Under normal circumstances, exploration and mining operations are conducted year-round without interruption due to weather conditions. These aspects have been prepared under the supervision of Maxime Dupéré from SGS. 1.6 MINERAL RESERVE ESTIMATES The Project LOM plan and subsequent Mineral Reserve estimate are based on an ore selling price of 120 CAD/t. A memorandum of understanding (MOU) was developed between the Authier operation and NAL operation, in which NAL agrees to buy 100% of the Authier ore material at a selling price of 120 CAD/t, delivered to the NAL ore pad area. The effective date of the Mineral Reserve estimate is December 31, 2023. It has been done under the supervision of Phillipe Chabot, P.Eng., from Sayona Quebec, who holds the position of Vice President with Sayona Quebec. Table 1-2 summarizes the Proven and Probable Mineral Reserve estimate for the Project. Table 1-2 – Authier Lithium Project Mineral Reserve estimate at Effective Date of December 31, 2023 at CAD$120/t. Authier Lithium Project Ore Reserve Estimate (0.55% Li2O cut-off grade) Category Tonnes (Mt) Grades (%Li2O) Cut-off Grade % Li2O Met Recovery % Proven Ore Reserves 6.2 0.93 0.55 73.6 Probable Ore Reserves 5.1 1.00 0.55 73.6 Total Ore Reserves 11.2 0.96 0.55 73.6

Authier Lithium DFS Technical Report Summary – Quebec, Canada 31 Notes: 1. Mineral Reserves are measured as dry tonnes at the crusher above a diluted cut-off grade of 0.55% Li2O. 2. Mineral Reserves result from a positive pre‐tax financial analysis based on an ore selling price of CAD$120/t and an exchange rate of USD$0.75:CAD$1.00. The selected optimized pit shell is based on a revenue factor of 0.86 applied to a base case selling price of USD$850/t of spodumene concentrate. 3. The reference point of the Mineral Reserves is the NAL crusher feed. 4. In-situ Mineral Resources are converted to Mineral Reserves based on pit optimization, pit design, mine scheduling and the application of modifying factors, all of which supports a positive LOM cash flow model. 5. The Mineral Reserve estimate is valid as of December 31, 2023. 6. Totals may not add up due to rounding for significant figures. 7. The Mineral Reserves in this report were estimated and assembled using the regulation S-K §229.1304 of the United States Securities and Exchange Commission (SEC). *Metallurgical recovery not applied 1.7 MINERAL RESOURCE ESTIMATE The Mineral Resource Estimate (MRE), with an effective date of October 6, 2021, is shown in Table 1-3. The Mineral Resources of Authier Lithium are reported using an open-pit mining perspective. It was originally prepared by Maxime Dupéré an employee of SGS Canada in the position of Geologist for the original NI 43-101 TR filing and this report., To define the Mineral Resources of Authier Lithium, SGS created and used an optimized pit shell, that was done in the Whittle software, which corresponds to the ultimate pit shell in the present study at a revenue factor of 1. The final Mineral Resources include the resource blocks located within the optimized pit shell, below the overburden/bedrock interface and above the cut-off grade of 0.55% Li2O established by Sayona and BBA. The final Mineral Resources of Authier Lithium are exclusive of Mineral Reserves. The Final exclusive Mineral Resources include the resource blocks located below the overburden/bedrock interface and; above the optimized pit shell created by SGS; and below the selected reserves optimized pit shell (see Mineral Reserves Estimate) is based on a revenue factor of 0.86 applied to a base case selling price of USD$977/t of spodumene concentrate; and above the cut-off grade of 0.55% Li2O established by Sayona and BBA based on metallurgical parameters to achieve saleable concentrate. The Mineral Resources at Authier Lithium are classified into Measured, Indicated, and Inferred categories. The Mineral Resource classification follows the SEC definitions and guidelines and is based on the density of analytical information, the grade variability and spatial continuity of mineralization. Authier Lithium DFS Technical Report Summary – Quebec, Canada 32 Table 1-3 – Authier Mineral Resource statement at effective date of October 6, 2021 based on USD $977/t Li₂O, exclusive of Mineral Reserves. Authier – Total Open Pit Constrained Mineral Resource Statement Category Tonnes (Mt) Grade (% Li2O) Cut-Off Grade (% Li2O) Met Recovery % Measured 0.23 0.8 0.55 78 Indicated 3.18 0.98 0.55 78 Measured and Indicated 3.40 0.96 0.55 78 Inferred 6.35 0.98 0.55 78 Notes: 1. Mineral Resources are 100% attributable to the property. Sayona has 100% interest in Authier. 2. Mineral Resources are exclusive of Mineral Reserves. 3. The Mineral Resource was estimated by Maxime Dupéré from SGS, Qualified Person under S-K §229.1302 who assumes responsibility. 4. Mineral Resources do not have demonstrated economic viability. The estimate of Mineral Resources may be materially affected by environmental, permitting, legal, title, taxation, socio-political, marketing, or other relevant issues. 5. The Inferred Mineral Resource in this estimate has a lower level of confidence that applied to an Indicated Mineral Resource and is not converted to a Mineral Reserve. It is reasonably expected that the majority of the Inferred Mineral Resource could be upgraded to an Indicated Mineral Resource with continued exploration. 6. Numbers in the table might not add precisely due to rounding. 7. Resources are within the Pit :Authier20210821_977.dxf,; and under the optimised pit design (5m Contour) 8. Bulk density of 2.71 t/m³ is used. 9. Effective date October 6, 2021. 10. Only block centroids had to be inside the pit to be considered. 11. The Mineral Resource estimate has been assembled using the regulation S-K §229.1304 of the United States Securities and Exchange Commission (SEC). Mineral Resources, which are not Mineral Reserves, do not have demonstrated economic viability. Inferred Mineral Resources are exclusive of the Measured and Indicated Resources. * Rounded to the nearest thousand.

Authier Lithium DFS Technical Report Summary – Quebec, Canada 33 1.8 MATERIAL DEVELOPMENT AND OPERATIONS There are no material development and operations, that may have impacted resource and reserve statements since stated effective dates, to declare. 1.9 RECOVERY METHODS The current Project considers mining Authier ore for shipment to the North American Lithium (NAL) concentrator for processing. There is a memorandum of understanding that the NAL operation will purchase the Authier ore. Historical metallurgical testwork for the Authier project was undertaken as part of feasibility studies carried out for the mine and concentrator project in 2018 and 2019. 1.10 MINE DESIGN The Authier Lithium Project will be an open-pit mining operation. The mining activities will be performed by a mining contractor, with Sayona Quebec supervising the work and providing technical services. For the purposes of this study, certain equipment types were considered, and the requirements estimated. However, the actual equipment used at the site will need to be determined during negotiations with the mining contractor. The pit will comprise of 5 phases. The run of mine (ROM) ore feed contained in the final pit is sufficient for a mine life of 22 years. Due to the phase designs, very little waste material is mined to supply the mill in the first two years. This strategy keeps the mining activities to a minimum, allowing the operation to improve its mining practices and equipment needs and, consequently, keeps mine operating costs low. The overall pit has a variable strip ratio. The annual mining productivity gradually increases to 6.0 Mt in Year 5, and gradually decreases from Year 13 to the end of the mine life. Figure 1-4 shows the Authier Lithium LOM production profile. This aspect has been prepared under the supervision of Philippe Chabot, an employee of Sayona and employed as Vice-President Mining. Authier Lithium DFS Technical Report Summary – Quebec, Canada 34 Figure 1-4 – Authier Lithium LOM production profile. 1.11 INFRASTRUCTURE, CAPITAL, AND OPERATING COST ESTIMATES 1.11.1 Project Infrastructure The project infrastructure includes Run of mine (ROM) and loadout pad, administrative building, dry room, lay down area for mining contractor equipment shop, Waste Rock Storage Facility, mine wastewater treatment plant, site access roads, mine hauling and service roads, mine water management infrastructure, electrical distribution facilities, fuel and explosive storage and communication systems (see Figure 1-5). 0.0 0.2 0.4 0.6 0.8 1.0 1.2 1.4 0 1,000 2,000 3,000 4,000 5,000 6,000 7,000 2025 2026 2027 2028 2029 2030 2031 2032 2033 2034 2035 2036 2037 2038 2039 2040 2041 2042 2043 2044 2045 2046 O re G ra d e ( % L i 2 O ) M a te ri a l Q u a n ti ti e s (k t) Year Ore Waste Rock Overburden Rehandling Ore Grade

Authier Lithium DFS Technical Report Summary – Quebec, Canada 35 Figure 1-5 – Site Layout. Authier Lithium DFS Technical Report Summary – Quebec, Canada 36 1.11.2 Capital and Operating Cost Estimates The following tables summarize the capital, sustaining capital and operating costs resulting from the DFS work. It has been done under the supervision of Sylvain Collard, an employee from Sayona Quebec working in the position of Executive Vice President & Chief Operating Officer. The capital cost estimate prepared for this study meets AACE Class 3 criteria, usually prepared to establish a preliminary capital cost forecast and assess the economic viability of the Project. This allows management, and / or the Project sponsor, to obtain authorization for funds for the Project’s next stages. As such, this estimate forms the initial control estimate against which subsequent phases will be measured and monitored. There are two significant changes to the capital cost estimate with respect to the previous study done in 2019: 1. There is no longer a concentrator at the Authier site; and 2. The waste piles and water management infrastructure require a geomembrane under their bases due to the potential for metal leaching of the waste rock material. Table 1-4 summarizes the initial capital cost estimate, Table 1-5 summarizes the sustaining capital cost estimate, and Table 1-6 summarizes the operating cost estimate. Table 1-4 – Project initial capital cost detailed summary Item Total (M CAD) Mining $5.80 Preproduction Mining $3.39 Owner Equipment and Mine Services $2.41 Infrastructure $69.62 Waste Stockpile and Water Management $44.85 Electrical Work $0.84 On-site Roads $2.53 Access Road $0.65 Owner's Costs $2.44 EPCM Services $7.33 Commissioning $0.28 Overhead $0.22 Other $1.37 Contingency $9.08 Wetland Compensation $1.50 Wetland Compensation $1.50 Royalty Buyback $1.00 1 claim $1.00 Total $77.92

Authier Lithium DFS Technical Report Summary – Quebec, Canada 37 Table 1-5 – Sustaining Capital Cost Estimate Summary Year LOM (M CAD$) Mining 3.76 Infrastructure 70.64 Sustaining Capital Costs 74.4 Table 1-6 – Summary LOM Operating Cost Estimate Summary Cost Area LOM (M CAD) Unit (CAD/t Ore) Unit (USD/t Ore) Mining $540.56 $48.16 $36.12 Water treatment management $58.73 $5.23 $3.92 General and Administration $20.97 $1.87 $1.40 Total operating costs $620.27 $55.26 $41.44 Reclamation bond insurance payment $7.65 $0.68 $0.51 Ore Transport and Logistics Costs $223.36 $19.90 $14.92 Total operating and other costs $851.28 $75.84 $56.88 Royalty deductions $28.96 $2.58 $1.94 First Nation royalties $27.04 $2.41 $1.81 Reclamation and closure costs $41.71 $3.72 $2.79 Total Operating, Royalties, Reclamation and Closure Costs $948.99 $84.54 $63.41 1.12 MARKET STUDIES According to the firm Wood Mackenzie Consultants in the year 2021, the total lithium supply is projected to grow at a Compound Annual Growth Rate (CAGR) of 14% from 2020 to 2030. Although lepidolite production will increase from 2020 to 2025 and new processes such as jadarite, clay and zinnwaldite will be introduced starting in 2023, spodumene concentrate will remain the dominant mineral concentrate output. Depending on the period, spodumene concentrate is expected to account for 73% to 87% of the total capacity of the mine. Lithium carbonate and lithium hydroxide will dominate refined production for lithium products. From 2020 to 2040, lithium hydroxide and lithium carbonate are projected to grow at a CAGR of 16% and 11% respectively. Authier Lithium DFS Technical Report Summary – Quebec, Canada 38 1.12.1 Price Forecast Sales from 2023 to 2026 are based on the greater of 113 kt of spodumene concentrate or 50% of spodumene concentrate sales at the Piedmont Lithium contract price and the remaining concentrate sales at BMI Q4 2022 spodumene market prices. From 2027 onwards, the entire concentrate sales are settled at BMI Q4 2022 spodumene market prices. For the contracted volume to Piedmont Lithium Inc, a price of USD $810/t (from the reference of USD $900/t @ 6.0% Li2O to adjusted value of USD $810/t assuming 5.4% Li2O and applied 10% price discount from USD $900/T for lower grade) assumed over 2023-26, while the remainder of the concentrate production uses market prices. From 2027 and beyond, Sayona is reverting back to market prices for the entire production as it seeks to pursue a lithium transformation project on-site, leveraging prior investments, in line with its commitments with the Government of Québec related to its acquisition of NAL. 1.12.2 Spodumene Price Forecast The prices for spodumene concentrate and battery-grade lithium are expected to remain high relative to historic prices, driven mainly by the demand for lithium for EV batteries. According to BMI, the price of spodumene concentrate (6%) is expected to increase significantly from 2020 to 2024, reaching a peak of USD $5,525/t. However, by 2026, the market price of spodumene is expected to decrease to below USD $2,000/t, and gradually stabilize at a long-term price of USD $1,050/t from 2033 onwards. 1.12.3 Carbonate Price Forecast According to BMI, the price for battery grade carbonate is expected to jump in 2023, driven by the fast growth of the EV industry. BMI price expectations imply a peak of USD $75,475/t in 2024. After 2025, supply increase is projected to meet market demand, bringing down prices gradually through to 2032. From 2033 onwards, BMI projects an average carbonate price of USD $20,750/t.

Authier Lithium DFS Technical Report Summary – Quebec, Canada 39 1.13 ENVIRONMENTAL, SOCIAL AND PERMITTING 1.13.1 Environmental Studies Environmental baseline studies including literature review, field works, and laboratory analysis were conducted in 2012, and from 2017 to 2022, by Sayona Quebec and the previous owner. The information presented in this report has been validated by Sylvain Collard, P.Eng., of Sayona Quebec. • Soils quality studies were carried out in 2017, 2018, 2019 and 2020. • Hydrogeological study started in December 2016 and currently includes the installation of 27 observation wells (piezometers), groundwater sampling campaigns, the achievement of variable head permeability tests and tracer profile testing as well as groundwater level surveys; • From 2017 to 2022, 14 to 27 wells were sampled for underground water quality. Samples collected were analyzed for a variety of parameters including metals, nutrients, major anions and cations, volatile compounds, polycyclic aromatic hydrocarbons and C10-C50 petroleum hydrocarbons; • Surface water was sampled in 2017, 2018 and 2019. Sampling of the surface water was conducted in five locations, i.e., four stations in the core study area and one outside the extended study area, along the mainstream draining the core study area. Some exceedances of criteria for protection of aquatic life were observed for aluminum, iron, copper, manganese, lead and nickel; • Sedimentation characterization was carried out in 2018, 2019 and 2020. Although several metal concentrations exceeded criteria in the two lakes under study, all the concentrations analyzed fall within the range of concentrations making up the geochemical background of sediments; • Wetlands were characterized in 2017, 2018 and 2019. Bogs and swamps are the main wetland classes characterized during the field surveys. Only a few bogs were located near the Project area. These bogs did not reveal any major particularities. Some low ecological value wetlands are located inside the limit of the open-pit and the waste rock dump areas; • Field inventory for snakes, salamanders and anurans was carried out in 2017 and 2018. Bird surveys were conducted in 2017 and 2019. A bat inventory was completed in 2017. Finally, a small mammal and rodent inventory was conducted in 2017; • Fish and fish habitats surveys were carried out in 2017 and 2019 on nine streams; • Air emission modelling has been conducted in 2022; • A noise modelling for the mining site was carried out in 2019 and updated in 2022. A noise modelling has also been produced in 2022 for the ore transportation to the NAL site. • An archaeological potential study carried out in 2018 concluded that the archaeological potential is very low, or even non-existent. • Several studies of the mineralogy and environmental risk classification of waste rocks have been caried out from 2017 to 2021 and concluded that acid mine drainage is unlikely to occur in the waste stockpile and the temporary ore pile, but there is a potential for nickel leaching. Authier Lithium DFS Technical Report Summary – Quebec, Canada 40 • An environmental site assessment (ESA) - Phase I, conducted in 2020, concludes that there is no activity likely to affect soil and water conditions. • A condemnation report for the future waste stockpile produced in 2022 revealed the absence of economic lithiferous mineralization at the future waste stockpile. • Floristic inventories of non-timber forest products of interest on mine site were carried out in 2020 and 2022 in collaboration with the Abitibiwini First Nation (AFN). Sites of interest for acquiring knowledge about NTFPs were targeted by AFN and inventoried during the summer of 2022. • A study was carried out in 2022 to assess the impact of the ore transportation between the Authier mine and the North American Lithium plant. The southern part of the St-Mathieu-Berry Esker is enclosed into the area of influence of the mine. However, this part of the esker is not connected to the main part of the esker which is being tapped by the drinking facilities of the city of Amos and also by the Eska water bottling society. Both portions of the esker are separated by a bedrock lump. In the esker, the groundwater generally flows towards the north, except in the Project area where it is heading south and southeast and to the Harricana River watershed. The southern portion of the esker, located in the Project area, is in a different watershed than the remainder of the esker. However, because it is located at a lower altitude than the esker and isolated from it by a bedrock, the Authier Project will not threaten, in any way and under any circumstances, the water quality of this esker. 1.13.2 Decarbonization Plan A preliminary GHG emission level assessment over the life of the Authier Project showed that nearly 80% of the Project’s GHG emissions came from mining operations as well as ore transportation. In order to reduce its environmental impact by reducing its GHG emissions, the Project’s decarbonization plan will address primarily those two emission factors. It will focus on two initial approaches: 1. Deploying innovative technologies to reduce GHG emissions produced by vehicles. 2. Compensating for difficult-to-reduce emissions by investing in GHG offsets. Because a complete reduction of the Authier Project’s GHG emission cannot be foreseen with the current technology maturity, compensation investments will be considered in the decarbonization plan. There are two compensation efforts that will be evaluated:

Authier Lithium DFS Technical Report Summary – Quebec, Canada 41 • Indirect compensation: Purchasing carbon credits from accredited/recognized organizations, with an emphasis on Québec based organizations; Invest in a local GHG reduction initiative. • Direct compensation: Restoring natural habitats, such as wetland, impacted by previous mining activities or other with a high sequestration potential; Creating and running a tree planting program with a focus on the Abitibi region. For Sayona, the decarbonization plan will be an opportunity for unifying venture for its team, its suppliers and its stakeholders going forward. 1.13.3 Population The Authier Project mine area is at the heart of the ancestral Abitibiwinni Aki territory, which the Abitibiwinni has never yielded. The Authier Project site is located in La Motte, in the administrative region of Abitibi-Témiscamingue. The Abitibiwinni (Community of Pikogan) are the Algonquins of northern Abitibi. Today, Abitibiwinni is one of nine Algonquin communities in Québec. The community of residence of Abitibiwinni is known as Pikogan, a reserve established in 1956, 3 km north of the city of Amos. 1.13.4 Permitting The global certificate of authorization frames the environmental component of the Project, in respect to the Regulation respecting the environmental assessment and review of certain projects (CQLR, cQ2, r23.1). The projects listed in Schedule 1 are subject to the environmental impact assessment and review procedure under the Environment Quality Act (article 31.1). Therefore, Schedule 1 includes the establishment of a mine whose maximum daily capacity is equal to or greater than 2,000 metric tons. The mining lease is required to extract ore under the Mining Act. The application must be accompanied by, among other things, an approved closure and rehabilitation plan and a scoping and market study on processing in Québec. The delivery of the mining lease is conditional on obtaining the approbation of the closure plan. According to the Quality Environmental Act a certificate of authorization is also required for construction and operation of the mine. A public consultation must also be part of the legal obligation and should last at least two months and include public open doors in the municipality where the Project is located. However, the government agreed to Sayona’s request to voluntarily submit the Authier project to the Bureau d’audiences publiques sur l’environnement (BAPE). In line with its commitment to transparency and collaboration, Sayona’s request will allow citizens to get involved in the project’s development. Authier Lithium DFS Technical Report Summary – Quebec, Canada 42 The BAPE’s mission is to inform government decision-making by issuing findings and opinions that account for the public’s concerns and are based on the principles of the Sustainable Development Act. 1.13.5 Reclamation and Closure In accordance with the Québec Mining Act requirements, a detailed closure plan must be submitted to the MRNF. The closure plan includes the following activities: • Rehabilitate the waste rock pile by covering slopes and flat areas with geotextiles, compacted inorganic overburden, organic overburden, and vegetation. • Remove from the site all surface and buried pipelines. • Remove buildings and other structures. • Rehabilitate and secure the open pit. • Reclaim any civil engineering works. • Remove machinery, equipment, and storage tanks. • Complete any other work necessary for final rehabilitation and closure. 1.13.6 Waste Dumps and Tailings During the lifespan of the open pit mine, a total of 27.39 Mm³ of waste rocks and 2.71 Mm³ of overburden material and 0.86 Mm³ of organic material will be generated for a total of 30.96 Mm³. Results of the geochemical characterization of waste rock concluded: • Waste rock is not acid generating material. • A good amount of waste rock could be considered metal leaching. • Waste rock will not be considered as high-risk level mining waste. Groundwater protection measures will have to be applied at the foundation of the waste rock stockpile. Based on the available geotechnical and hydrogeological investigation information, the current design assumes that a geomembrane impervious structure is required. Overburden and organic material will be used during construction and closure of the Waste Rock Storage Facility (WRSF). The designed concepts allow management and storage of all Authier waste materials

Authier Lithium DFS Technical Report Summary – Quebec, Canada 43 within the same footprint. The WRSF has a footprint of approximately 75 ha, and a maximum height of ±83 m. The average height is about 72 m. Given that the ore will be processed at North American Lithium (NAL), the site no longer requires a tailings storage facility. 1.14 ECONOMIC ANALYSIS The economic assessment of the Project was carried out using a discounted cash flow (DCF) approach on a pre-tax and after-tax basis, based on the procurement contract between Authier Lithium and North American Lithium (NAL). No provision was made for the effects of inflation as real prices and costs were used in the financial projections. Current Canadian tax regulations were applied to assess the corporate tax liabilities, while the most recent provincial regulations were applied to assess the Québec mining tax liabilities. It has been done under the supervision of Sylvain Collard an employee of Sayona in the position of Executive Vice President & Chief Operating Officer. The key outcomes of the economic evaluation for 100% of the project, before financing costs, are presented in Table 1-7. Table 1-7 – Financial Analysis Summary Item Unit Value Unit Value Mine Life year 22 year 22 Strip Ratio t:t 6.1 t:t 6.1 Total Mill Feed Tonnage Mt 11.2 Mt 11.2 Revenue Ore Selling Price CAD/t ore 120 USD/t ore 90 Exchange Rate USD:CAD 0.75 Project Costs Open Pit Mining CAD/t ore 48.16 USD/t ore 36.12 Water Treatment and Management CAD/t ore 5.23 USD/t ore 3.92 General and Administration (G&A) CAD/t ore 1.87 USD/t ore 1.4 Reclamation Bond Insurance Payment CAD/t ore 0.67 USD/t ore 0.5 Ore transport and logistic costs CAD/t ore 19.9 USD/t ore 14.92 Project Economics Gross Revenue CAD M 1347 USD M 1010.3 Total Operating Cost Estimate CAD M 627.9 USD M 470.9 Reclamation Bond Insurance Payment CAD M 7.6 USD M 5.7 Transportation and Logistics Cost CAD M 223.4 USD M 167.5 Total Capital Cost Estimate CAD M 77.9 USD M 58.4 Total Sustaining Capital Cost Estimate CAD M 74.4 USD M 55.8 Authier Lithium DFS Technical Report Summary – Quebec, Canada 44 Reclamation and Closure Costs CAD M 41.7 USD M 31.3 Royalty Deduction CAD M 29 USD M 21.7 First Nation Royalties CAD M 27 USD M 20.3 Non-discounted Cash Flow (Pre-Tax) CAD M 280.4 USD M 210.3 Discount Rate % 8% % 8% PRE-TAX NPV @ 8% CAD M 58.1 USD M 43.5 Pre-Tax Internal Rate of Return (IRR) % 15% % 15% A financial sensitivity analysis was conducted on the base case after-tax cash flow NPV and IRR of the Project. The sensitivity of the after-tax NPV was evaluated for changes in key variables and parameters such as: • Capital costs. • Sustaining capital costs. • Operating costs. • Price of ore sold to NAL. The after-tax sensitivity analyses show that changes in the price of ore sent to NAL and the Project operating costs create the largest NPV variations. 1.14.1 Project Implementation and Execution The project execution plan is conceptual in nature and will be adjusted and refined during the next phases of the Project. Upon completion of this FS, Sayona plans to award the detailed engineering mandate with a targeted completion date of December 2024 to be executed in parallel with the certificate of authorization approval process. Construction is expected to begin soon after reception of the certificate of authorization with a target readiness for mining operations to start in March 2025. The critical path to ore production goes through obtaining the certificate of authorization, mobilizing the mining contractor, and building the main access roads and the stockpile pads. 1.14.2 Risk and Opportunity There are a number of risks and uncertainties identifiable to any new project that usually cover the mineralization, process, financial, environmental, and permitting aspects. This project faces the same challenges, and an evaluation of the possible risks was undertaken. The resulting register identifies risks,

Authier Lithium DFS Technical Report Summary – Quebec, Canada 45 impact category, the severity and probability ratings as well as potential risk mitigation measures. Table 1-8 shows the top risks of the Project. Table 1-8 – Main project risks Risks Details Category Description Rating category Mitigation Measures Logistics Worldwide crisis on freight forwarding. Schedule Dedicate resources for expediting & logistics. Health & Safety Mining traffic uses segments of roads common to ore transport and employee traffic. Berm separates the mining traffic from the others. Safety Road to be widened and berm separating mining and other traffic. Add secondary access road to remove crossings. Operation Start-up during wintertime. Operation Implement temporary WTP during initial mining development. Operation NAL will process with new ore from Authier after about six months of operation. Production Support from external engineering staff during NAL transition to the blended ore processing. Engineering Consultant engineers are very busy. Schedule Frequent follow-up. Construction Local contractors are very busy. Schedule Reach out to provincewide contractors. Environment Delays in obtaining mining and construction permits. Schedule Frequent follow-up and pro-active approach of permitting authorities. 1.15 CONCLUSIONS AND QP RECOMMENDATIONS The Updated Definitive Feasibility Study included the recent Mineral Resources estimate (SGS 2021), which has been reviewed as part of this Report, a smaller overall footprint of the site, results from a number of technical optimization programs, results from the waste rock geochemical characterization, new strategy to transport ore material to NAL concentrator and realignment of revenue based on the sale of run-of-mine ore. The Updated Definitive Feasibility Study confirmed the technical and financial viability of constructing a simple open-cut mining operation, waste rock storage facility and water treatment plant at the Authier site. The positive study demonstrated the opportunity to create substantial long-term sustainable shareholder value at a low capital cost. Given the technical feasibility and positive economic results of the Updated Definitive Feasibility Study, it was recommended to continue the work necessary to support a decision to fund and develop the project. 1.16 REVISION NOTES This individual Technical Report is the initial report to be issued under the S-K §229.1304 regulations, therefore, no revision note is attached to this individual Technical Report Summary. Authier Lithium DFS Technical Report Summary – Quebec, Canada 46 2 INTRODUCTION 2.1 TERMS OF REFERENCE AND PURPOSE OF THE REPORT This S-K §229.1304 compliant Technical Report Summary (the Report) was prepared at the request of Piedmont Lithium Inc (Piedmont) by Sayona Quebec, based on an existing Technical Report compiled according to the Canadian Institute of Mining, Metallurgy and Petroleum (CIM) reporting guidelines as used in National Instrument 43-101 standards (NI 43-101), which has been previously published and filed by Sayona Mining Limited (Sayona Mining or Sayona). The report was titled: Updated Definitive Feasibility Study Report (UDFS). This Technical Report was prepared to present the UDFS outcomes for the Authier Lithium Project. The Authier property is wholly owned and operated by Sayona Quebec Inc (Sayona Quebec), with Sayona owning 75% and Piedmont 25% of Sayona Quebec in a Joint Venture agreement. Sayona, the registrant of the original NI 43-101 compliant Technical Report, engaged the services of BBA Inc., Synectiq Inc. and SGS Canada Inc., supporting qualified firms staffed with professional engineers, geologists, and process engineers, to prepare the Technical Report at the Feasibility Study (FS) level; using data gathered by the Qualified Persons (QPs) to the disclosure requirements for the Canadian Institute of Mining, Metallurgy and Petroleum (CIM) reporting guidelines as used in National Instrument 43-101 standards (NI 43-101) to compile said report. Piedmont serves as the registrant of this S-K §229.1304 compliant Technical Report Summary. The statement is based on information provided by Sayona Quebec and reviewed by various professionals and Qualified Persons from Sayona and SGS. Copies, or references to information in this Report may not be used without the written permission of Sayona Quebec. The purpose of the original UDFS study was to present the Mineral Resources Estimate and Mineral Reserves Estimate, the potential for mining and all associated infrastructure required for the development of the Authier project. The UDFS Report was based upon developing the Project over a 22-year production period, using a conventional open-pit truck and shovel operation and concentration of the ore in the NAL concentrator facility that was re-started in March 2023 with substantial upgrades to produce a spodumene concentrate (5.40% to 5.82% Li2O). The Authier run-of-mine (ROM) ore will be transported to the NAL site, blended with the NAL ore material, and fed to the crusher.

Authier Lithium DFS Technical Report Summary – Quebec, Canada 47 The Property is planned to be mined via open pit operations and has no historic full-scale production mining to date. Title to the Property is held by Sayona Quebec, which holds 100% of the ownership. The property is currently under continued exploration activity. 2.2 QUALIFICATIONS OF QUALIFIED PERSONS/FIRMS 2.2.1 Contributing Authors Table 2-1 presents the Qualified Persons (QPs) responsible for each chapter of this Report. The QPs of this Report are in good standing with the appropriate professional institutions. The QPs have supervised the preparation of this Report and take responsibility for the contents of the Report as set out in Table 2 1. Each QP has also contributed relevant figures, tables, and written information for Chapters 1 (Executive Summary), 21 (Other Relevant Data and Information), 22 (Interpretation and Conclusions), 23 (Recommendations), and 24 (References), 25 (Reliance on Information Supplied by the Registrant). Table 2-1 – Chapters responsibility CHAPTERS Qualified Persons 1 Executive Summary All 2 Introduction Sylvain Collard, P.Eng. 3 Property Description Sylvain Collard, P.Eng. 4 Accessibility, Climate Local Resources, Infrastructure, Physiography Sylvain Collard, P.Eng. 5 History Maxime Dupéré, P.Geo. 6 Geological Setting and Mineralization and Deposit Maxime Dupéré, P.Geo. 7 Exploration Maxime Dupéré, P.Geo. 8 Sample Prep, Analyses and Security Maxime Dupéré, P.Geo. 9 Data Verification Maxime Dupéré, P.Geo. 10 Mineral Processing and Metallurgical Testing Jarrett Quinn, P.Eng. 11 Mineral Resource Estimates Maxime Dupéré, P.Geo. 12 Mineral Reserves Estimates Philippe Chabot, P.Eng. 13 Mining Methods Philippe Chabot, P.Eng. 14 Processing and Recovery Methods Jarrett Quinn, P.Eng. 15 Infrastructure Sylvain Collard, P.Eng. 16 Market Studies and Contracts Sylvain Collard, P.Eng. 17 Environmental Studies, Permitting, and Social or Community Impacts Sylvain Collard, P.Eng. 18 Capital and Operating Costs Sylvain Collard, P.Eng. 19 Economic Analysis Sylvain Collard, P.Eng. 20 Adjacent Properties (if applicable) Jarrett Quinn, P.Eng. 21 Other Relevant Data and Information All 22 Interpretation and Conclusions All 23 Recommendations All 24 References All 25 Reliance on Information supplied by Registrant All Authier Lithium DFS Technical Report Summary – Quebec, Canada 48 2.2.2 Site Visits The QP’s for the original NI43-101 Report, upon which this Report is based, visited the Project and its existing installations between 2019 and 2023, as part of their mandate. The QP’s as listed in Table 2-1 are responsible for the content of this Report. The QP’s for this Report reviewed all data from the Report upon which this Report is based and amended, altered or updated the data for the purposes of currency and accuracy. All listed QP’s, bar one, are employees of Sayona Quebec. As such they are involved in and around the property as part of their duties and therefore no specific site visit date is considered relevant In addition, Mr. Dupéré from SGS visited the Authier Lithium site several times over the years and its last visits were on Nov 25th 2020 and June 10th , 2021 for data verification. 2.3 SOURCE OF INFORMATION The reports and documentation listed in Chapters 25 (Reliance on Information supplied by Registrant) and 24 (References) were used to support the preparation of this Report. Sections from reports authored by other consultants may have been directly quoted or summarized in this Report and are so indicated, where appropriate. The Report has been completed using the aforementioned sources of information as well as available information contained in, but not limited to, the following reports, documents, and discussions: • Technical discussions with SGS personnel. • Technical information provided by Sayona personnel. • Economic analysis provided by Philippe Pourreaux, Price Waterhouse Coopers (PwC). • Authors’ personal inspections of the Property. • Additional information from public domain sources. 2.4 LIST OF ABBREVIATIONS AND UNITS OF MEASURE The following units and currency are used throughout this report: • All units are metric, unless noted otherwise. • All currency is in Canadian dollars (CAD or $), unless noted otherwise. This Report includes technical information that required subsequent calculations to derive subtotals, totals, and weighted averages. Such calculations inherently involve a degree of rounding and, consequently, introduce a margin of error. Where these occur, the authors consider them immaterial.

Authier Lithium DFS Technical Report Summary – Quebec, Canada 49 Table 2-2 – List of Abbreviations LIST OF ABBREVIATIONS Abbreviation Description 2SD Two standard deviations 3D Three dimensional 3SD Three standard deviations AA Atomic absorption AFN Abitibiwinni First Nation AG Average-grade AGAT AGAT Laboratories Ltd. AI Abrasion index ALS ALS-Chemex / ALS Laboratory Group ARD Acid rock drainage AUD Austrian dollar BBA BBA Inc. BC1 Water storage basin 1 BC2 Water storage basin 2 BFA Bench face angle BM Block model BWI Ball mill work index CAD Canadian dollar CAPEX Capital expenditure CDA Canadian Dam Association CDC Map designated cells CDPNQ Centre de Données sur le Patrimoine Naturel du Québec CIM Canadian Institute of Mining, Metallurgy and Petroleum CMT Construction Management Team COC Chain of custody COG Cut-off grade COSEWIC Committee on the Status of Endangered Wildlife in Canada COVID-19 Coronavirus disease of 2019 CRM Centre de Recherche Minérale CWI Crushing work index Authier Lithium DFS Technical Report Summary – Quebec, Canada 50 DCF Discounted cash flow DD Diamond drilling DDH Diamond drill hole DFS Definitive feasibility study DFO Department of Fisheries and Oceans Canada DH Drillhole DMS Dense media separation EBITDA Earnings Before Interest, Taxes, Depreciation, and Amortization EDF Environmental design flood EIA Environmental Impact Assessment EOY End of year EPCM Engineering, Procurement and Construction Management ESS Energy storage systems ESG Environmental, social and governance ETP Evapotranspiration EV Electric vehicles Fe Iron G&A General and Administration GER Glen Eagle Resources GFE Services Forestiers et d’Exploration GFE GHG Greenhouse gas GMR Gross Metal Royalty GRES UQAT Groupe de recherche sur l’eau souterraine de l'Université du Québec en Abitibi- Témiscamingue HG High-grade High-Li High-grade lithium HLS Heavy-liquid separation HV Heavy vehicle IBA Impacts and Benefits Agreement ICP-AES Inductively coupled plasma – atomic emission spectrometry ICP-MS Inductively coupled plasma mass spectrometry ICP-OES Induced coupled plasma optical emission spectrometry ID2 Inverse distance squared ID3 Inverse distance cubed IDF Inflow design flood IRA Inter ramp angle IRR Internal rate of return JORC Joint Ore Reserves Committee LCE Lithium carbonate equivalent

Authier Lithium DFS Technical Report Summary – Quebec, Canada 51 LFP Lithium iron phosphate LIMS Low-intensity magnetic separator Li2O Lithium oxide LME London Metal Exchange LG Low-grade LOM Life of mine Low-Li Low-grade lithium LSB Loi sur la sécurité des barrage (The Dam Safety Law applied in Québec) LV Light vehicle Max Maximum MDDELCC Ministère du Développement Durable, de l'Environnement et de la Lutte contre les Changements Climatiques MDMER Metal and Diamond Mining Effluent Regulations MELCC Ministère de l’Environnement, et Lutte contre les changements climatiques (now MELCCFP) MELCCFP Ministère de l’Environnement, de la Lutte contre les changements climatiques, de la Faune et des Parcs (formerly MELCC) MENR Ministry of Energy and Natural Resources (now MRNE) MFFP Ministère des Forêts, de la Faune et des Parcs MIA Mine industrial area Min Minimum MMER Metal and Diamond Mining Effluent Regulation MOU Memorandum of understanding MPSO Mine plan schedule optimizer MRE Mineral Resource Estimate MRNF Ministère des Ressources naturelles et des Forêts (formerly MERN) NAD North American Datum NAL North American Lithium NCF Net cash flow NI National Instrument NN Nearest neighbour NPV Net present value NS Not significant NSR Net smelter return OB Overburden OBVAJ Organisme de bassin versant Abitibi-Jamésie OBVT Organisme de bassin versant du Témiscamingue OK Ordinary kriging OPEX Operational expenditure Authier Lithium DFS Technical Report Summary – Quebec, Canada 52 ORG Organic material OSA Overall slope angle PAH Polycyclic aromatic hydrocarbon PCM Project Construction Management PEA Preliminary economic assessment PMF Probable maximum flood PwC PricewaterhouseCoopers QA/QC Quality Assurance / Quality Control QI Québec Inc. QLC Québec Lithium Corporation Q1, Q2, etc. First quarter, Second quarter, etc. Raymor Raymor Resources Ltd. RCM Regional county municipality RM Reference material ROM Run of mine RQD Rock quality designation RSB Règlement sur la sécurité des barrages (The Dam Safety Regulation applied in Québec) RWI Rod mill work index SD Standard deviation SESAT Société de l’eau souterraine d’Abitibi-Témiscamingue SG Specific gravity SGS Minerals SGS Canada Inc. Minerals Services SGS Lakefield SGS Minerals’ laboratory in Lakefield SOQUEM Société Québécoise d’Exploration Minière Synectiq Inc. Synectiq TSF Tailings storage facility TSS Total suspended solids UDFS Updated Definitive Feasibility Study USD United States dollar UTM Universal Transverse Mercator WHIMS Wet high-intensity magnetic separation WR Waste rock WRSF Waste rock storage facility WTP Water treatment plant XRD X-ray diffraction Table 2-3 – Units of Measure Units of Measurement

Authier Lithium DFS Technical Report Summary – Quebec, Canada 53 Unit Description °C Degrees Celsius °F Degrees Fahrenheit µm micrometre / micron µS microsecond A ampere cfm cubic feet per minute cm centimetre d day (24 hours) deg. or ° angular degree dia diameter G giga (billion) g gram g/t grams per tonne h or hr hour (60 minutes) ha hectare hp horsepower Hz hertz in. inch k kilo (thousand) kg kilogram km kilometre km2 square kilometre kV kilovolt kVA kilovolt-amperes kW kilowatt kWh kilowatt hour L litre L/s litres per second LV low voltage M mega (million); molar m metre m3 cubic metre m3/s cubic metres per second m3/h cubic metres per hour mm millimetre mpd metres per day Mt million tonne Mtpy milled tonnage per year MV medium voltage MVA megavolt ampere Authier Lithium DFS Technical Report Summary – Quebec, Canada 54 MW megawatt oz troy ounce (31.1035g) ppm parts per million psi pound per square inch s second sm3 standard cubic metre t tonne (metric ton) tpd tonne per day tph tonne per hour tpy tonnes per year V volt W watt w/w mass percentage of the solute in solution wt% weight percent y year (365 days) yd yard

Authier Lithium DFS Technical Report Summary – Quebec, Canada 55 3 PROPERTY DESCRIPTION 3.1 PROPERTY LOCATION, COUNTRY, REGIONAL AND GOVERNMENT SETTING The Authier Property is located in the Abitibi-Témiscamingue Region of the Province of Québec, Canada, approximately 45 km northwest of the city of Val-d’Or and 15 km north of the nearest of town of Rivière- Héva. The center of the Property is situated on NTS sheet 32D08 at about UTM 5,361,055 m N, 706,270 m E, NAD 1983 (48°21'47"N, 78°12'22W, see Figure 3-1). The Property is accessible by a high-quality, rural road network connecting to the main highway, Route 109, situated a few kilometres east, which links Rivière-Héva to Amos. Route 109 connects at Rivière-Héva to Highway 117, a provincial highway that links Val-d’Or and Rouyn- Noranda (the two regional centers of the Abitibi-Témiscamingue region), to Montréal, which is the closest major city, almost 500 km to the southeast (Figure 3-2 and Figure 3-3). Figure 3-1 – Authier property location coordinates (Source: Google Earth). Authier Lithium DFS Technical Report Summary – Quebec, Canada 56 Figure 3-2 – Location of the Property relative to a number of nearby regional townships. Figure 3-3 – Authier proximity to nearby mining services centres.

Authier Lithium DFS Technical Report Summary – Quebec, Canada 57 3.1.1 Government Setting Canada is a North American country with its center of government located in Ottawa, in the Province of Ontario. Canada is a constitutional monarchy which forms part of the British Commonwealth and is ruled by a parliamentary democratic government. The Crown assumes and oversees the roles of the executive, as the Crown-in-Council; the legislative, as the Crown-in-Parliament; and the judicial, as the Crown-on- the-Bench. The country is politically stable, comprised of ten provinces and three territories, of which Québec is one. The Canadian Federation is currently governed by the elected Liberal Party of Canada, while the province of Québec is governed by the Coalition Avenir Québec. 3.2 PROPERTY OWNERSHIP, MINERAL TENURE, AGREEMENT AND ROYALTIES The Property currently consists of one block totaling 24 mineral claims covering 884 ha. The claims are located on Crown Lands in the La Motte and the Preissac Townships. The Property area extends 4.1 km in the east-west direction and 3.3 km in the north-south direction. All of the claims comprising the Property are map designated cells (CDC). Figure 3-4 shows the claims map of the Property, and a detailed listing of the Authier Property claims is included in Table 3-1. Approximately 75% of the mineral resources are situated in CDC 2183455, 2194819 and 2116146, with the remainder in claims 2183454 and 2187652 (Figure 3-5). Authier Lithium DFS Technical Report Summary – Quebec, Canada 58 Figure 3-4 – Property mining titles location map.

Authier Lithium DFS Technical Report Summary – Quebec, Canada 59 Figure 3-5 – Proposed pit relative to claim boundaries. Table 3-1 – List of Authier Property claims Claim Number Registered holder Status Registration Date Expiry date Area (ha) Required work ($) CDC 2116146 Sayona Québec Inc. (100%) Active 08-08-2007 08-07-2025 43.24 $2,500 CDC 2116154 Sayona Québec Inc. (100%) Active 08-08-2007 08-07-2026 42.88 $2,500 CDC 2116155 Sayona Québec Inc. (100 %) Active 08-08-2007 08-07-2026 42.87 $2,500 CDC 2116156 Sayona Québec Inc. (100%) Active 08-08-2007 08-07-2025 42.86 $2,500 CDC 2183454 Sayona Québec Inc. (100%) Active 08-08-2007 06-01-2025 42.85 $2,500 CDC 2183455 Sayona Québec Inc. (100%) Active 06-02-2009 06-01-2025 42.84 $2,500 CDC 2187651 Sayona Québec Inc. (100%) Active 09-02-2009 09-01-2026 21.39 $1,000 CDC 2187652 Sayona Québec Inc. (100 %) Active 09-02-2009 09-01-2025 21.29 $1,000 CDC 2192470 Sayona Québec Inc. (100%) Active 10-22-2009 10-21-2025 21.08 $1,000 CDC 2192471 Sayona Québec Inc. (100%) Active 10-22-2009 10-21-2025 21.39 $1,000 CDC 2194819 Sayona Québec Inc. (100%) Active 11-19-2009 11-18-2025 42.82 $2,500 Authier Lithium DFS Technical Report Summary – Quebec, Canada 60 CDC 2195725 Sayona Québec Inc. (100%) Active 11-27-2009 11-26-2026 29.03 $2,500 CDC 2219206 Sayona Québec Inc. (100%) Active 4-22-2010 4-21-2025 5.51 $1,000 CDC 2219207 Sayona Québec Inc. (100%) Active 4-22-2010 4-21-2025 17.06 $1,000 CDC 2219208 Sayona Québec Inc. (100%) Active 4-22-2010 4-21-2025 55.96 $2,500 CDC 2219209 Sayona Québec Inc. (100%) Active 4-22-2010 4-21-2025 42.71 $2,500 CDC 2240226 Sayona Québec Inc. (100%) Active 07-09-2010 07-08-2025 42.71 $2,500 CDC 2240227 Sayona Québec Inc. (100%) Active 07-09-2010 07-08-2025 42.71 $2,500 CDC 2247100 Sayona Québec Inc. (100%) Active 8-23-2010 8-22-2025 42.75 $2,500 CDC 2247101 Sayona Québec Inc. (100%) Active 8-23-2010 8-22-2025 53.77 $2,500 CDC 2472424 Sayona Québec Inc. (100%) Active 01-11-2017 01-10-2026 42.5 $1,800 CDC 2472425 Sayona Québec Inc. (100%) Active 01-11-2017 01-10-2026 55.96 $1,800 CDC 2480180 Sayona Québec Inc. (100%) Active 2-22-2017 2-21-2026 42.51 $1,800 CDC 2507910 Sayona Québec Inc. (100%) Active 12-15-2017 12-14-2026 25.35 $1,800 Total 884.04 $48,200 3.2.2 Mineral Rights and Permitting In order to construct and operate the mine, Sayona is required to acquire various permits from federal and provincial authorities. Following the obtainment of the general governmental decree, specific permits are required from the regional office of the Québec Ministère de l’Environnement, de la Lutte contre les changements climatiques, de la Faune et des Parcs (MELCCFP). Some other permits are also required by Québec Ministère des Ressources naturelles et des Forêts (MRNF). Finally, some permits will be required by federal authorities, such as the Department of Fisheries and Oceans Canada (DFO). As of April 2023, Sayona has not obtained any of the required permits. However, as mentioned in February 2023, the government agreed to Sayona’s request to voluntarily submit the Authier project to the Bureau d’audiences publiques sur l’environnement (BAPE). In line with its commitment to transparency and collaboration, Sayona’s request will allow citizens to get involved in the project’s development. The BAPE’s mission is to inform government decision-making by issuing findings and opinions that account for the public’s concerns and are based on the principles of the Sustainable Development Act. The BAPE process takes place in 4 stages: • Preparatory meeting

Authier Lithium DFS Technical Report Summary – Quebec, Canada 61 • Preparation before public sessions • The first and second part public sessions and; • if necessary, private mediation sessions. Preparatory meeting During this 30-day period, a public information session hosted by the BAPE takes place. At this session, around twenty minutes are planned for the presentation of the Authier project and it is followed by a question period. It is during this period that a person, group, organization or municipality may request from the MELCCFP the holding of a public examination of the project by a BAPE commission of inquiry. Preparation before public sessions This preparation period is necessary in order to prepare clear answers to questions during public sessions. This period is also used to prepare visual materials that will be used during these sessions. Finally, this is the moment when Sayona will designate the spokesperson(s) during the sessions. Technical experts may be invited to participate. The first and second part public sessions The first part: it is during the first public session that the commission of inquiry will invite Sayona to publicly present the reasons for the request. An additional period of approximately 20 minutes is allocated for the presentation of the project. Subsequently, Sayona's role will be to answer questions from the public and the committee immediately. Experts may be invited to present or answer questions on technical aspects of the project. The second part: at this stage, the presence of Sayona is required but is limited to the right of rectification. The interested parties present the briefs which remain confidential until their presentation in public session. Private mediation sessions It is possible that certain issues are specific to one of the stakeholders. In this case the BAPE can organize private mediation sessions with the stakeholder. If no commitment from Sayona is possible, or this commitment does not meet the expectations of this stakeholder, the Commission will make a recommendation to the Minister based on the seriousness of this commitment. After the BAPE The BAPE's mandate ends with the submission of the report to the Minister responsible for the Environment, who has 15 days to make it public. It is based on the environmental analysis carried out by his ministry and on the BAPE report that the minister formulates his recommendation to the Council of Ministers, which has the final decision to authorize a project, with or without modifications, or refuse it. Authier Lithium DFS Technical Report Summary – Quebec, Canada 62 After obtaining the government decree, the process of obtaining ministerial authorization can begin according to article 22 of the Environmental Quality Act. 3.2.3 Agreements and Royalties Table 3-2 summarizes the royalties payable from the Authier project. As of April 2023, only four tenements contain ore reserves that would create royalty obligations. These are CDC 2183454, 2183455, 2194819 and 2116146. Table 3-2 – Authier project summary royalties Tenement Royalty Royalty Details 2,116,146 2% NSR royalty payable to Jefmar Inc. § The royalty payable will be based upon the Gross Value less the deductions (costs for treatment and refining, sales, brokerage, certain taxes and transportation). § Gross Value is attributable to a London Metal Exchange (LME) benchmark price (not necessarily the price actually received). § The royalty enables the owner to transact (for sales or smelting) with an affiliate. However actual prices and treatment charge deductions would be substituted with an arm’s-length value for the purposes of calculating the royalty. § 1% of the royalty can be purchased for CAD 1.0 M. 1.5% NSR royalty payable to RNC § The royalty payable will be based upon the gross value less the deductions (costs for treatment and refining, sales, brokerage, certain taxes, and transportation). § No buy-back provision. 2183454 2483455 2% NSR royalty payable to 9187-1400 Québec Inc. § Net Smelter Returns (NSR) means actual proceeds received by Glen Eagle Resources (GER) from any mint, smelter, or purchaser for sale of ores, metals or concentrated products from the Property and sold after deducting: 2194819 1% NSR royalty payable to 9187-1400 Québec Inc. o Smelting, refining charges; o Penalties, marketing costs; o Transportation of ores, metals or concentrates from the Property to any mint, smelter or other purchaser; o Insurance on all ores, metals, or concentrates; and o Any export or import taxes on ores, metals or concentrates in Canada or the receiving country. § A 1% NSR can be repurchased on claims CDC 2183454, 2183455 and 2194819 for CAD 1,000,000 leading respectively to a 1%, 1% and 0% on CDC 2183454, 2183455 and 2194819. Note: Prior to these claims being able to be mined, the final option consideration, due on the day on which a positive feasibility study is completed, will need to be paid to Québec Inc. (QI). This amount is equal to CAD500,000 plus an amount equivalent [in cash] to 1,000,000 GER share at that date. This is in addition to the royalty. This remains outstanding and the substitution of GER shares for Sayona shares has not yet been raised with QI. 2194819 § 1% Gross Metal Royalty (GMR) to Globex.

Authier Lithium DFS Technical Report Summary – Quebec, Canada 63 1% GMR payable to Globex Enterprises Inc. § GMR is a percentage of all metals or mineral compounds including, but not limited to, lithium, lithium compounds, gold, silver, tungsten etc. produced from the Property. § No costs to be included in the Globex royalty calculation. § To be paid in cash or in kind at Globex’s option. 2116154 2116155 2116156 2187651 2192470 2192471 2219206 2219207 2219208 2219209 2247100 2247101 2% GMR payable to Globex Enterprises Inc. § 2% GMR to Globex. § GMR is a percentage of all metals including, but not limited to, lithium, gold, silver, etc. produced from the Property. § No costs to be included in the Globex royalty calculation. § To be paid in cash or in kind at Globex’s option. § Globex’s royalty and metals or minerals shall exclusively be the property of Globex immediately upon production. 2187652 1.5% NSR royalty payable to Canuck Exploration Inc. § 1.5% of NSR payable to Canuck on any resource extracted for commercial purpose derived from the Claim with the exception of surface minerals substances. § NSR is a percentage of the actual proceeds derived from any smelter or mill for the sale of all payable metals less deductions. § Quarterly payments; Canuck has right to audit calculations. 3.3 ENVIRONMENTAL LIABILITIES AND OTHER PERMITTING REQUIREMENTS A Phase 1 Environmental Evaluation was carried out in 2019 by Norinfra Engineering. Soil characterizations were also performed in 2019 and 2020. No sign of contamination has been observed on this greenfield site and, therefore, there are no environmental liabilities pertaining to the Property as of the effective date of the provided information. The current locations remain without significant environmental liabilities. With the exception of permit requests for the backfilling or destruction of certain wetlands, the permits that will be necessary for the start of activities will be produced once the government decree is granted, following the BAPE hearings, and will be requested according to the normal process for obtaining ministerial authorization provided for in article 22 of the Environmental Quality Act Authier Lithium DFS Technical Report Summary – Quebec, Canada 64 4 ACCESSIBILITY, CLIMATE, PHYSIOGRAPHY, LOCAL RESOURCES, AND INFRASTRUCTURE 4.1 ACCESSIBILITY The Property is accessible by well-maintained secondary gravel roads that connect to Route 109, situated a few kilometres to the east; Route 109 links Rivière-Héva to Amos and continues to Matagami. Route 109 meets Route 117 at Rivière-Héva, which is the provincial highway linking Val-d’Or and Rouyn- Noranda. 4.2 TOPOGRAPHY, ELEVATION, VEGETATION AND CLIMATE 4.2.1 Physiography The Property is characterized by a relatively flat topography, with the exception of the northeastern area, where gently rolling hills occur. Outcrops represent approximately 5% of the Project area. The overburden is relatively thin and is characterized by glacial tills and clays. The land is drained westward by small creeks and local grassy swamps occur in topographic lows. The area is generally covered by forest populated by mixed balsam, spruce, and aspen trees. The Property’s elevation above sea level ranges from 320 m at the lowest point to 380 m in the northeastern sector, with an average elevation of 350 m. 4.2.2 Climate The region has a continental climate marked by cold, dry winters and hot, humid summers. The nearest weather monitoring station with data on climate normal, maintained by Environment Canada, is the Amos station. According to the available data collected at this weather station from 1981-2010, the coldest month is January with an average daily temperature of -17.2°C. The warmest month is July, with average daily temperature of 17.4°C. Table 4-1 shows average temperatures per month. The record low during this period was -52.8°C, and the record high was 37.2°C.

Authier Lithium DFS Technical Report Summary – Quebec, Canada 65 Table 4-1 – Average temperatures by month. Month Temperature (°C) January -17 February -15 March -8 April 1 May 9 June 15 July 17 August 16 September 11 October 5 November -4 December -12 Annual 1.5 The extreme temperatures measured between 1981 and 2010 were 37.2°C and -52.8°C. Temperatures are above freezing approximately 210 days per year. Data collected shows total annual precipitation was 929 mm, with peak rainfall occurring during July (112 mm average), August (98 mm average) and September (107 mm average). Snowfall is light to moderate, with annual average of 253 cm. Snow typically accumulates from October to April, with average peak snowfall occurring in November (45 cm), December (51 cm) and January (51 cm). Peak snow depth averaged 68 cm in February. On average, the Property is frost-free for 97 days, though discontinuous permafrost exists in the area. Hours of sunlight vary from 15.5 hours at the summer solstice in June to 8.1 hours at the winter solstice in December. Table 4-2 shows the average annual precipitation with the proportions of rain and snow. Table 4-2 – Average monthly precipitation with the proportions of rain and snow. Month Precipitation (mm) Rain (mm) Snow (mm) January 56 4 51 February 36 3 33 March 50 12 38 April 65 40 25 May 87 85 2 June 94 94 0 July 112 112 0 August 98 98 0 September 107 107 1 October 87 79 8 November 79 34 45 December 59 7 51 Annual 929 676 253 Authier Lithium DFS Technical Report Summary – Quebec, Canada 66 Under normal circumstances, exploration and mining operations are conducted year-round without interruption due to weather conditions. 4.2.3 Vegetation and Wetlands Field surveys were carried out in 2012, 2017 and 2019. Terrestrial vegetation consists mainly of mixed and coniferous forest stands. Hardwood stands are scarce. Together, forest areas cover more than 80% of the study area. It should be noted that a significant portion of the study area has been totally or partially cut. Stands of fir and white spruce, mixed with white birch, dominate the forest landscape of the site. Other sites are occupied by black spruce, jack pine and larch, often in the company of white birch or trembling aspen. Wetlands were characterized in 2017, 2018 and 2019. Bogs and swamps are the main wetland classes characterized during the field surveys. Only a few bogs were located near the Project area. These bogs did not reveal any major particularities. Some low ecological value wetlands are located inside the limit of the open pit and the waste rock dump areas. 4.3 LOCAL INFRASTRUCTURE AND RESOURCES The Project is located in a well-developed mining region with readily available support facilities and services. The towns of Val-d’Or and Rouyn-Noranda, with populations of roughly 26,000 and 42,000, respectively, are well known for their mining history. The agricultural town of Amos, 20 km to the north, has a population of roughly 13,000. An experienced mining workforce and other mining-related support services will come from these nearby cities. Val-d’Or and Rouyn-Noranda have well-established hospitals, regional airports, schools, accommodation, and telecommunications, which are also readily accessed from the Project site. Québec is a major producer of electricity as well as one the largest hydropower generators in the world. Green and renewable, it is well distributed through a reliable power network. Power will be accessed 5 km to the east of the Project site via an electrical grid supplied by low-cost, hydroelectric power. CN Rail has an extensive railway network throughout Canada. The closest rail connections to export shipping ports are located at Cadillac and Amos, 20 km to the southwest of the Property. The rail network

Authier Lithium DFS Technical Report Summary – Quebec, Canada 67 connects to Montréal and Québec City, and to the west through the Ontario Northland Railway and North American rail system. High- and low-pressure natural gas pipelines are located in close proximity to the Authier site, although no immediate reliance upon natural gas is anticipated. 4.4 SURFACE RIGHTS All of the claims composing the Property are situated on Crown Lands. There is no reason to believe that Sayona will not be able to secure the surface rights needed to construct the infrastructure related to a potential mining operation and waste disposal areas and other infrastructures in the mine industrial area (MIA). Authier Lithium DFS Technical Report Summary – Quebec, Canada 68 5 HISTORY 5.1 HISTORICAL EXPLORATION AND DRILL PROGRAMS A series of geological surveys and geoscientific studies were conducted by the Québec Government in the Project area between 1955 and 1959, and again in 1972. In 1956, an electrical resistivity (potential) survey was completed by Kopp Scientific Inc. in the central portion of the Property. In 1958, East-Sullivan Mines Ltd. conducted magnetic and polarization surveys, followed by six drillholes (DH) located in the southwestern area of the Property. In 1963, Space Age Metals Corp., exploring for magmatic sulphides, completed magnetic and electromagnetic surveys in the area of the main pegmatite dyke. In 1965, Delta Mining Corp. Ltd. conducted additional magnetic surveys in the area. From 1966 until 1969, exploration work was conducted under the direction and supervision of Mr. George H. Dumont, consulting engineer. The exploration programs, originally designed for magmatic sulphides, successfully outlined the main spodumene-bearing pegmatite on the Property. The work included magnetic and electromagnetic surveys, as well as 23 diamond drillholes (DDH) totalling 2,611.37 m. In 1969, the Québec Department of Natural Resources carried out a series of flotation tests on two drill core composite samples. The bulk sample was composed of split core from DH AL 14 (50 m) and DH AL- 19 (38.1 m). The results confirmed that the material was amenable to concentration by flotation, producing commercial grade spodumene concentrate, assaying between 5.13% and 5.81% Li2O with recovery ranging from 67% and 82%. In 1978, Société Minière Louvem Inc. completed two DDH, AL-24 and Al-25, on the western extension of the pegmatite dyke for a total of 190.5 m. In 1980, Société Québécoise d’Exploration Minière (SOQUEM) completed six DDH (80-26 to 80-31), totalling 619.96 m in the central portion of the spodumene-bearing pegmatite. At the same time, 224 core samples from previous drilling, done between 1967 and 1980 on the pegmatite dyke, were re- assayed for Li2O. In 1989, the Ministre de l’énergie et des ressources, today the Ministère des Ressources Naturelles et de la Faune (MRNF), released the results of a regional metallogenic study on lithium prospects and other high technology commodities in the Abitibi-Témiscamingue region (Boily et al. 1989). In 1991, Raymor Resources Ltd. (Raymor) conducted small-scale metallurgical testing of pegmatite rocks mineralized in spodumene sampled on the Property. An 18.3 kg sample grading 1.66% Li2O was tested in

Authier Lithium DFS Technical Report Summary – Quebec, Canada 69 1991 by the Centre de Recherche Minérale (CRM). Results of the metallurgical testing returned a concentrate grade of 6.3% Li2O with recovery rate of 73%. In 1993, Raymor conducted additional drilling of 33 holes for a total of 3,699.66 m with the objective of verifying the presence and detailing the geometry of the spodumene-bearing pegmatite. Raymor also conducted geological mapping and trenching and started a 30-t bulk sampling of the pegmatite dyke, which was completed in 1996. In 1997, Raymor contracted the CRM to conduct additional metallurgical testing. The tests were conducted on two different samples weighing roughly 18 t (with an average grade of 1.32% Li2O), and 12 t, (with an average grade of 1.10% Li2O). Testwork results for the first sample returned a concentrate grade of 5.61% Li2O with a recovery rate of 61% following magnetic separation. The second sample returned a final concentrate grade of 5.16% with a recovery rate of 58%. Historical mineral resource estimates from 1994 were then revised in 1999 by Karpoff for SOQUEM and Raymor. The final historical Mineral Resources totalled 2,424,400 t at an average grade of 1.05% Li2O, using a cut-off grade of 0.5% Li2O. To these Mineral Resources, Karpoff defined an additional 1,580,000 t of historical resources in the Possible category, without specifying the Li2O grade. Raymor concluded an agreement with SOQUEM in 1999. The group completed a prefeasibility study on the Project, including additional metallurgical testing. The metallurgical test results underlined the difficulty of generating a high quality spodumene concentrate. The economic analysis returned a negative internal rate of return (IRR), making the Project uneconomic at that time. Glen Eagle Resources (GER) acquired the Project in 2010, and completed some of the mapping, sampling, drilling, metallurgical, and resource definition programs as well as a Preliminary Economic Study in 2012. In November 2010, a ground magnetic survey was performed on the Authier Property. The survey was executed by Services Forestiers et d’Exploration GFE and the data was processed by MB Geosolutions at the request of Glen Eagle. The survey totalled 53.5 line-km and was done through the forest without a cut line grid. The lines were read with a GSM-19 Overhauser magnetometer, built by the company GEM of Toronto, which was used in walking mode with the locations of the readings determined by an integrated GPS. The magnetic measurements were taken continuously along 23 traverse lines for a total of 66,027 readings at every 1.25 m. Magnetic diurnal was monitored with a base station and the magnetic readings were corrected accordingly. Figure 5-1 presents the results of this survey. Authier Lithium DFS Technical Report Summary – Quebec, Canada 70 Figure 5-1 – 2010 Authier Property magnetic survey. In August 2011, a geochemical survey program was completed in an effort to discover new spodumene- bearing pegmatites. Eighty-six samples were collected, mainly in the northwest sector of the Property. Four samples were collected on the main pegmatite and were analyzed for the major elements. The geochemical signature of the collected samples was compared to the signature of the main pegmatite and only a few samples were determined to have a similar signature. Three DH were drilled in the area of these samples; muscovite-bearing pegmatites were discovered with little, or no, spodumene. From 2010 to 2012, Glen Eagle completed 8,990 m in 69 diamond, NQ diameter DH on the Authier Property; 7,959 m were drilled on the Authier Deposit; 609 m (five DDH) were drilled on the northwest and 422 m on the south-southwest sectors of the Property. From these DH, 1,474 samples were collected for analysis, representing approximately 18% of the drill core material. The DH are generally spaced 25 m to 50 m apart, with azimuth generally south dipping (180°) and dip ranging from 45° to 70°. The mineralized drill intersection ranged from near true thickness to 85% true thickness.

Authier Lithium DFS Technical Report Summary – Quebec, Canada 71 The spodumene-bearing pegmatite is principally defined by one single continuous intrusion or dyke, which contains local rafts or xenoliths of the amphibolitic host rock that can be a few metres thick and up to 200 m in length. A total of 19,736 m of historical drilling was completed on the Property. Table 5-1 shows a plan view of the historical drillholes. All the historical drilling that predates Sayona was diamond core of NQ diameter. Table 5-1 – Summary of drilling completed on the Property prior to the Sayona acquisition in 2016. Period Drillholes Series No. of Diamond Drillholes (DDH) Metres Drilled Historical GM-XX 5 1,176 LG-XX 12 2,437 AL-XX 31 3,433 R-93-XX 33 3,700 Glen Eagle Resources AL-10-XX 18 1,905 AL-11-XX 27 4,051 AL-12-XX 24 3,034 Total 150 19,736 5.2 HISTORICAL RESOURCE AND RESERVE ESTIMATES In 2012, Glen Eagle conducted further testing on a 270 kg composite sample and achieved very attractive results, including an 88% metallurgical recovery to a 6.09% Li2O concentrate. The results were achieved in batch flotation tests, after passing the concentrate through wet high-intensity magnetic separation (WHIMS) and two-stage cleaning, without mica pre-flotation. Bumigème Inc. used the results of this program to design a conventional process flowsheet incorporating crushing, grinding and flotation for the Authier NI 43-101 Preliminary Economic Assessment (2013). The flowsheet contemplated the processing of 2,200 tpd of ore at 85% metallurgical recovery, producing a 6% Li2O spodumene concentrate. This assessment suggested the technical and commercial viability of developing the Deposit and reported Mineral Resources at the time, which were a combined Measured and Indicated historical resources of 7.67 Mt at 0.96% Li2O (Table 5-2). Authier Lithium DFS Technical Report Summary – Quebec, Canada 72 Table 5-2 – Glen Eagle 2013 Historical Estimate (NI 43-101 compliant at 0.5% Li2O cut-off). Category Tonnes Grade Contained Li2O (% Li2O) (t) Measured 2,244,000 0.95 21,318 Indicated 5,431,000 0.97 52,681 Total 7,675,000 0.96 73,999 Inferred 1,552,000 0.96 14,899 Although the 2013 Glen Eagle Authier historical estimate was done according to industry’s best practices following the CIM guidelines, from a block model estimated by inverse distance squared, using composited datapoints within a mineralized 3D wireframe model, the Authier Deposit estimate presented above is considered by the author as a historical estimate from a previous owner and should not be relied upon. The author has updated the Authier Deposit resources and done additional sufficient work to classify and disclose current Mineral Resources. These current Mineral Resources are fully described in Chapter 11. The presence of the historical estimates is solely for comparison purposes. In August 2016, Sayona completed the acquisition of the Authier Property for CAD4.0M. In September of the same year, Sayona drilled 19 DDH, for a total of 3,982 metres, prior to completion of a prefeasibility study undertaken by SGS. From January to March 2017, 31 DDH were done, totalling 4,122 metres, drilled for definition and metallurgical testing. A prefeasibility study update was completed in December 2017 by Wave International Ltd. From January to March 2018, 19 DDH were completed, for a total of 2,025 metres, to confirm lithium mineralization at depth. Following this program, an updated Joint Ore Reserves Committee (JORC) Mineral Resources was produced returning 17.18 Mt at 1.01% Li2O in the Measured and Indicated category and 3.76 Mt @ 0.98% Li2O in the Inferred category. Towards the end of 2018, Sayona completed a seven DDH program totalling 342.5 metres for condemnation purposes. A definitive feasibility study was completed for the Project in September 2018 by BBA Inc. The Project contemplated an open pit mine and 675,500 tpy flotation concentrator. In October 2019, BBA Inc. produced an updated feasibility study for the Authier Project. The Project contemplated an open pit mine and 883,000 tpy flotation concentrator. In September 2021, 25 DDH, totalling 3,908 metres, were completed on exploration and definition targets.

Authier Lithium DFS Technical Report Summary – Quebec, Canada 73 5.3 HISTORICAL PRODUCTION The Authier project is a greenfield project. Because of this, no previous production has occurred linked to this project. Authier Lithium DFS Technical Report Summary – Quebec, Canada 74 6 GEOLOGICAL SETTING, MINERALIZATION AND DEPOSIT 6.1 REGIONAL GEOLOGY The Authier property is located in the southeast part of the Superior Province of the Canadian Shield craton, more specifically in the Southern Volcanic Zone of the Abitibi Greenstone Belt. The spodumene- bearing pegmatites observed on the Property are genetically related to the Preissac-La Corne batholith (Figure 6-1) located 40 km northeast of the city of Val-d’Or (Corfu, 1993; Boily, 1995; Mulja et al., 1995a). The Preissac-La Corne batholith is an Archean-age syn- to post-tectonic intrusive complex that intruded along the La Pause anticline into the volcano-sedimentary units of the Malartic Composite Group. The rocks of the Malartic Group are metamorphosed to the greenschist to lower amphibolite metamorphic grade and are bounded to the north by the Manneville fault and by the Cadillac-Larder Lake fault to the south. The units comprising the Malartic Group are mafic to ultramafic metavolcanic rocks (serpentinized peridotites, amphibolitic mafic flows) and metasedimentary units (biotite schists derived from greywackes). The Preissac-La Corne batholith comprises early-stage metaluminous intrusive suites, dioritic to granodioritic in composition, and four late-stage peraluminous monzogranitic plutons: Preissac, La Corne, and La Motte and Moly Hill plutons. Late Proterozoic-age diabase dykes crosscutting all the lithologies can also be observed in the region (Boily, 1995; Mulja et al., 1995; Desrocher and Hubert, 1996). The pegmatite dykes and other aplitic dykes and veins observed in the region are genetically derived from the late peraluminous plutons. More than one thousand intrusions of mineralized, but mostly barren, pegmatite dykes have been mapped in the vicinity of the Preissac-La Corne batholith. These intrusions crosscut all of the units of the Malartic Group and intrusive lithologies of the batholith, with the exception of the late Proterozoic diabase dykes. The pegmatites and the aplitic intrusions occur in two distinct morphologies: tabular, generally strongly dipping dykes with sharp contacts, and irregularly shaped dykes, often comprised of mixed pegmatitic and aplitic lithologies in contact with the country rocks. The dykes can be up to hundreds of metres in length with a thickness varying from a few centimetres to tens of metres, with the majority having less than 1 m in thickness. The pegmatites can be classified by their spatial distribution within and around the lithologies of the Preissac-La Corne batholith. The pegmatites occurring within, or in, the vicinity of the La Motte and La Corne plutons are generally mineralized in beryl and columbite-tantalite as opposed to the pegmatites observed in association with the Preissac pluton, which are mostly un-mineralized. The spodumene- bearing pegmatites almost exclusively cross-cut lithologies located outside the late-stage plutons of the Preissac-La Corne Batholith and can be uniform or present internal zoning enriched in spodumene. The hydrothermal veins mineralized in molybdenite occur inside, near the edges, of the intrusives related to the Preissac and Moly Hill plutons.

Authier Lithium DFS Technical Report Summary – Quebec, Canada 75 Figure 6-1 – Regional geology map. 6.2 LOCAL GEOLOGY The project primarily encompasses extensive sections of massive to spinifex ultramafic flows from the Preissac pluton. The pegmatites occur within basaltic flows and komatiites, while being adjacent to a felsic intrusive towards the western boundary. Below is a concise overview of these rock types present within the project area and Figure 6-2 illustrates the stratigraphic column of the local geology. Numerous small pegmatites, generally composed of quartz monzonite, are intruding the volcanic stratigraphy, including the larger Authier spodumene-bearing pegmatite, which is the focus of study. This pegmatite is principally defined by a single, continuous intrusion, or dyke, that contains local rafts, or xenoliths, of the amphibolitic host rock, which are a few meters thick and up to 200m in length at shallow levels within the western zone. Based on the information gathered from the drilling, the pegmatite intrusion is more than 1,100 m in length with an average thickness of 25 m, ranging from 4 to 60 m, and dipping 35 to 50 degrees to the north. It outcrops in a small, 50 m by 20 m, area at the central-eastern sector that orients east-west and is mostly covered by up to 10 m of overburden reaches depths of up to 270 m below surface in drilling to date. Authier Lithium DFS Technical Report Summary – Quebec, Canada 76 Figure 6-2 – Stratigraphy of the Authier Lithium Project. A second spodumene-bearing pegmatite, not visible from surface, was intersected by diamond drill hole AL-16-10 at a shallow depth, between 15 m and 22 m, approximately 400 m north of the main pegmatite. Follow-up drilling in early 2017 and 2018 outlined this new mineral body, the Authier North pegmatite, which has a strike extension of 500 m east-west, 7 m average width, and dips gently 15 degrees to the

Authier Lithium DFS Technical Report Summary – Quebec, Canada 77 north. The Authier North pegmatite appears at 15 m to 25 m vertical depth and is open in all directions. Figure 6-5 is a photograph showing spodumene mineralization from the new shallow pegmatite intersected by drillhole AL 16-10. The volcanic assemblages predominantly comprise ultramafic (peridotitic) metavolcanic flows, with a smaller presence of basaltic metavolcanics and Komatiites. The basaltic formations exhibit a range of appearances, varying from fine to coarse-grained textures, characterized by either massive or variolitic structures. Pillowed structures are frequently observed within these formations. Furthermore, it is common for basaltic rocks to contain chlorite and exhibit a high magnesium content. The Komatiite is often aphanitic in appearance and blueish or greenish in color. Spinifex to massive texture is common along with strong magnetism, however, this is variable at the contacts. The Authier Pegmatite is adjacent to a Felsic Intrusive formation situated towards its western boundary. This unit exhibits varying shades of gray and pink, dependent on its composition. The intrusive primarily consists of quartz, with occasional occurrences of feldspar and biotite. Contact zones between these rock formations often exhibit irregular or diffuse boundaries. 6.3 PROPERTY GEOLOGY The Property geology comprises intrusive units of the La Motte pluton to the north and Preissac pluton to the south, with volcano-sedimentary lithologies of the Malartic Group in the centre (Figure 6-3). The volcano-sedimentary stratigraphy is generally oriented east-west and ranges between 500 m and 850 m in thickness (north-south). The volcanic units comprise principally ultramafic (peridotitic) metavolcanic flows with less abundant basaltic metavolcanics. Several highly metamorphosed metasedimentary units, described as hornblende-chlorite-biotite schists, occur on the south-central portion of the Property, generally in contact with the La Motte pluton to the north (Karpoff, 1994). The northern border of the Preissac pluton, composed of granodiorite and monzodiorite, runs east-west along the southern edge on the Property. To the north, muscovite monzogranitic units of the La Motte pluton cover the Property. Numerous small pegmatites, generally composed of quartz monzonite, are intruding the volcanic stratigraphy, including the larger Authier spodumene-bearing pegmatite, which is the focus of study. Authier Lithium DFS Technical Report Summary – Quebec, Canada 78 Figure 6-3 – Local geological map. 6.4 MINERALIZATION The lithium mineralization observed at the Authier project is mainly spodumene within pegmatite intrusive dykes. There are also trace amounts of beryllium, molybdenum, tantalum, niobium, cesium, and rubidium. Detailed logging of drill core suggests that the main pegmatite at Authier is composed of several internal phases related to intrusive placement and progressive cooling. The outside border of the pegmatite in contact with the host rocks has been identified as a transition zone or border zone. This transition zone is often significantly less mineralized in spodumene and is characterized by a centimeter-scale fine- to medium-grained chill margin, followed by a medium- to coarse-grained decimeter to meter-scale zone. The transition zone often includes fragments of the host rock and can also be intermixed with the material from the core zone. The main intrusive phase observed in the pegmatite is described as a core pegmatitic zone, characterized by large centimeter-scale spodumene crystals and white feldspar minerals. The core pegmatitic zone shows internally different pegmatitic phases, characterized by different spodumene crystal lengths, ranging from coarse-grained (earlier) to fine-grained (later). The contacts between different spodumene-

Authier Lithium DFS Technical Report Summary – Quebec, Canada 79 bearing pegmatite phases are transitional and well defined at core logging scale. Higher lithium grades are correlated with higher concentrations of larger spodumene crystals. Late-mineral to post-mineral aplite phases cut earlier spodumene–bearing mineralization, causing local diminishing of lithium grade. The core zone hosts the majority of the spodumene mineralization at Authier. Figure 6-4 is a photograph that illustrates the transition and core zones from drillhole AL-10-03. The spodumene-bearing pegmatite is principally defined by one single continuous intrusion, or dyke, that contains local rafts, or xenoliths, of the amphibolitic host rock, which are a few metres thick and up to 200 m in length at shallow levels within the western zone. The main pegmatite outcrops in a small, 50 m by 20 m, area at the central-eastern sector that orients east-west and is mostly covered by up to 10 m of overburden. Based on the information gathered from the drilling, the pegmatite intrusion is more than 1,100 m in length and can be up to 60 m thick. The intrusion is generally oriented east-west, dips to the north at angles ranging between 35° and 50° and reaches depths of up to 270 m below surface in drilling to date. A second spodumene-bearing pegmatite, not visible from the surface, was intersected by diamond hole AL-16-10 at shallow levels, between 15 m and 22 m downhole depth, approximately 400 m north of the main pegmatite. Follow-up drilling in early 2017 and 2018 outlined this new body, the Authier North pegmatite, which has a strike extension of 500 m east-west, 7 m average width, gently dipping 15 degrees to the north. The Authier North pegmatite appears at shallow levels, 15 m to 25 m vertical depth, and is open in all directions. Figure 6-5 is a photograph showing spodumene mineralization from the new shallow pegmatite intersected by drillhole AL 16-10. Figure 6-4 – Drill core from hole AL-10-03, showing core and transition zones. Authier Lithium DFS Technical Report Summary – Quebec, Canada 80 Figure 6-5 – Drill core from hole AL-16-10, showing spodumene mineralization in the new Authier North pegmatite. 6.5 DEPOSIT TYPES The deposit type for the lithium mineralization occurring on the Authier Property is a granitic pegmatite type, more specifically the rare-element pegmatites subtype, due to the presence of spodumene. Rare-element pegmatites typically occur in metamorphic terrains and are commonly peripheral to larger granitic plutons which, in many cases, represent the parental granite from which the pegmatite was derived. The late Archean pegmatites of the Superior Province are typically located along deep fault systems that, in many areas, coincide with major metamorphic and tectonic boundaries. Most pegmatites range in size from a few metres to hundreds of metres long and from centimetric-scale to several hundred metres wide, and even more for a few known cases. Rare-element pegmatites can have complex internal structures where the internal units in complex pegmatites consist of a sequence of zones, mainly concentric, which conform roughly to the shape of the pegmatite, but differ in mineral assemblages and textures. From the margin inward, these zones consist of a border zone, a wall zone, intermediate zones, and a core zone. The border zone is generally thin and typically aplitic or fine-grained in texture. The wall zone, composed mainly of quartz-feldspar-muscovite, is wider and coarser grained than the border zone and marks the beginning of coarse crystallization characteristic of pegmatites. Intermediate zones, where present, are more complex mineralogically and contain a variety of economically important minerals such as sheet mica, beryl and spodumene.

Authier Lithium DFS Technical Report Summary – Quebec, Canada 81 In the intermediate zones of some pegmatites, individual crystal size can reach metres to tens of metres. The core zone consists mainly of quartz, either as solid masses or as euhedral crystals. Rare-element pegmatites, typically associated with granitic intrusions, are distributed in zonal patterns around such intrusions. In general, the pegmatites most enriched in rare metals and volatile components are located farthest from intrusions (Figure 6-6). Rare-element pegmatites are generally considered to form by primary crystallization from volatile-rich siliceous melt related to highly differentiated granitic magmas. The lithology of the source rocks for these melts is a major control on the ultimate composition of subsequently formed rare-element pegmatites (Cerny, 1993; Sinclair, 1996). Figure 6-6 – Schematic representation of regional zonation of pegmatites source (Image from Sinclair 1996 [modified from Trueman and Cerny 1982]). Authier Lithium DFS Technical Report Summary – Quebec, Canada 82 7 EXPLORATION 7.1 GENERAL Exploration drilling conducted by Sayona Quebec is divided into three phases, which occurred in 2016, 2017 and 2018 respectively. These are summarized individually. 7.2 SAYONA QUÉBEC DRILLING 2016 Sayona Québec completed a Phase 1 diamond drilling program at the Authier Property, including 18 holes for 3,967 m (Figure 7-1), which had the following objectives: • Converting the Inferred Mineral Resources to be Measured and Indicated through further drilling. • Exploring for extensions to the existing Mineral Resources and other potential mineralization within the tenement package. • Collecting geotechnical data for incorporation in the Authier prefeasibility study. • Collecting additional drill core for any additional metallurgical testing that may be required to complete a definitive feasibility study. Figure 7-1 – Drillhole collar location in isometric view and plan view. Holes were typically drilled perpendicular to the strike of the mineralized pegmatite to provide high confidence in the grade, strike, and vertical extensions of the mineralization.

Authier Lithium DFS Technical Report Summary – Quebec, Canada 83 The final diamond drillholes (Table 7-1) have all intersected high-grade spodumene mineralization, including: Table 7-1 – Phase 1 Sayona drillhole collar location and intercept information (Downhole intersections in metres). Drillhole East North RL Azimuth Dip Depth From To Thickness Grade (m) (m) (m) (% Li2O) AL-16-001 707,525 5,360,175 330 180 -45 87 12 74 62 1.35 including 27 43 16 1.65 AL-16-002 707,525 5,360,245 330 180 -45 111 50 99 49 1.18 including 81 98 17 1.49 AL-16-003 707,600 5,360,500 331 180 -55 267 170 197 27 1.46 including 181 192 11 1.66 213 223 10 1.24 including 218 221 3 1.63 AL-16-004 707,525 5,360,430 331 180 -55 246 156 206 50 1.13 including 157 168 11 1.40 200 205 5 1.89 AL-16-005 707,500 5,360,520 332 180 -55 294 197 202 5 1.44 218 243 25 1.08 including 218 232 14 1.18 AL-16-006 707,650 5,360,210 330 180 -45 105 16 60 44 1.02 including 16 35 19 1.45 AL-16-007 707,479 5,360,174 330 180 -45 90 4 44 40 1.27 including 13 33 20 1.47 AL-16-008 707,475 5,360,425 330 180 -60 234 162 198 36 0.93 including 163 173 10 1.32 AL-16-009 707,245 5,360,478 330 180 -60 249 192 230 38 1.10 including 192 215 23 1.35 AL-16-010 707,500 5,360,580 330 180 -55 330 15 22 7 1.36 including 17 19 2 2.24 236 241 5 1.36 258 266 8 0.85 including 264 266 2 1.42 AL-16-011 707,220 5,360,420 330 180 -65 204 135 181 46 1.26 including 137 161 24 1.62 AL-16-012 707,500 5,360,460 331 180 -55 240 161 208 47 1.05 including 167 194 27 1.31 AL-16-013 707,175 5,360,478 331 180 -60 234 184 208 24 1.25 216 224 8 0.91 AL-16-014 707,600 5,360,440 331 180 -55 241 148 193 45 1.08 including 149 157 8 1.36 171 189 18 1.34 203 207 4 1.65 AL-16-015 707,175 5,360,550 330 180 -60 279 242 262 20 1.32 including 248 259 11 1.61 AL-16-016 707,400 5,360,425 331 180 -60 252 158 186 28 1.20 including 162 180 18 1.39 AL-16-017 707,280 5,360,500 330 180 -60 240 190 235 45 1.28 including 190 213 23 1.77 AL-16-018 707,318 5,360,465 330 170 -55 264 197 201 4 0.99 206 213 7 0.95 218 228 10 1.20 including 219 225 6 1.48 Note: Downhole widths are not true widths Authier Lithium DFS Technical Report Summary – Quebec, Canada 84 The highlights of the 2016 drilling program include: • Fourteen new drillholes successfully tested the deep extensions of mineralization on the main Authier pegmatite. • Holes AL-16-01, 02, 06 and 07 successfully tested the geometry of the Authier pegmatite at shallow levels in the eastern and central sectors to upgrade the resource categories from Indicated to Measured. • Hole AL-16-16 intersected a thick zone of spodumene mineralization in the gap zone, between eastern and western zones of the main pegmatite. • Holes AL-16-03, 04, 05, 08, 10, 12 and 14 extended the lithium mineralization in the eastern sector of the main Authier pegmatite, beyond 200 m of vertical depth. • In addition, hole AL-16-10 intercepted a new pegmatite at shallow levels between 15 m and 22 m downhole depth, which is not visible from the surface and located 400 m north of the main Authier pegmatite. • Holes AL-16-09, 11, 13, 15, 17 and 18 extended the lithium mineralization in the western sector of the main Authier pegmatite, beyond 200 m of vertical depth. The mineralization remains open in all directions. 7.3 SAYONA QUÉBEC DRILLING 2017 Sayona Québec completed a Phase 2 diamond drilling program at the Authier Property, including 31 holes for 4,117 m (Figure 7-1), having the following objectives: • Defining the mineralized boundaries and lifting the resource categories in zones in the western sector that were drilled during the 2016 drill program. The 2016 drilling program in the west zone highlighted a number of new high-grade intersections between 120 m to 220 m vertical depth, such as hole AL-16-11, which returned 46 m of 1.26% Li2O from 135 m, including 24 m of 1.62% Li2O from 137 m. • Testing for mineralization in the eastern strike extension at both shallow and deeper levels at a similar vertical level to hole AL-16-14, which intercepted 45 m of 1.08% Li2O from 148 m, including 8 m of 1.36% Li2O from 149 m and 18 m of 1.34% Li2O from 171 m. • Testing for a vertical extension of the mineralization in the gap zone to follow up hole AL-16-16, which intersected 28 m of 1.20% Li2O from 158 m, including 18 m of 1.32% Li2O from 149 m. • Assessing the resource potential of the new northern pegmatite, which intersected 7 m of 1.36% Li2O from 15 m in Sayona’s 2016 drilling. The Phase 2 diamond drillholes are detailed as follows (Table 7-2):

Authier Lithium DFS Technical Report Summary – Quebec, Canada 85 Table 7-2 – Phase 2 Sayona drillhole collar location and intercept information (downhole intersections in meters). Drillhole East North RL Azimuth Dip Depth From (m) To (m) Thickness (m) Grade (% Li2O) AL-17-01 707,210 5,360,520 332 180 -60 283 242 252 10 NS AL-17-02 707,080 5,360,460 331 180 -65 253 165 197 32 1.15 including 177 184 7 1.44 and 186 192 6 1.37 AL-17-03 707,000 5,360,500 330 180 -60 268 222 233 11 1.07 including 226 231 5 1.42 236 240 4 1.00 AL-17-04 706,900 5,360,425 335 180 -70 264 166 177 11 0.88 including 166 169 3 1.26 214 225 11 1.03 including 218 222 7 1.26 AL-17-05 706,800 5,360,425 345 180 -75 303 199 205 6 1.09 224 243 19 1.26 including 224 233 9 1.69 AL-17-06 706,900 5,360,360 332 180 -55 240 NS AL-17-07 706,803 5,360,356 339 180 -55 246 210 211 1 0.64 214 219 6 0.89 including 215 216 1 1.48 AL-17-08 706,802 5,360,310 335 180 -45 219 165 173 8 1.07 including 167 170 3 1.31 AL-17-09 707,500 5,360,630 339 180 -55 90 26 31 5 0.84 including 28 29 1 2.34 AL-17-10 707,500 5,360,680 340 180 -55 78 20 21 1 0.62 AL-17-11 707,450 5,360,615 337 180 -55 48 23 29 6 1.32 including 24 27 3 1.76 AL-17-12 707,550 5,360,615 339 180 -55 72 27 32 5 0.90 including 30 31 1 1.71 AL-17-13 707,720 5,360,440 333 180 -55 228 153 156 3 1.17 including 154 156 2 1.32 163 189 26 1.26 including 169 184 15 1.42 AL-17-14 707,780 5,360,440 332 180 -55 213 169 189 20 0.95 including 170 180 10 1.19 AL-17-15 707,780 5,360,250 330 180 -55 81 11 14 3 1.02 including 12 13 1 1.40 AL-17-16 707,700 5,360,210 329 180 -50 87 8 15 7 0.76 Authier Lithium DFS Technical Report Summary – Quebec, Canada 86 Drillhole East North RL Azimuth Dip Depth From (m) To (m) Thickness (m) Grade (% Li2O) including 10 11 1 1.10 AL-17-17 707,830 5,360,250 327 180 -60 57 22 23 1 1.13 AL-17-18 707,400 5,360,610 336 180 -55 39 22 26 4 0.82 AL-17-19 707,350 5,360,610 336 180 -55 45 11 19 8 0.88 including 11 15 4 1.27 AL-17-20 707,450 5,360,680 338 180 -55 51 NS AL-17-21 707,550 5,360,680 342 180 -90 69 NS AL-17-22 707,400 5,360,525 334 180 -60 271 227 256 29 0.92 including 232 245 13 1.10 including 248 249 4 1.46 AL-17-23 707,600 5,360,615 339 180 -55 36 16 24 9 0.82 including 21 24 3 1.53 AL-17-24 707,323 5,360,628 336 180 -55 39 12 15 3 0.56 including 12 13 1 1.13 AL-17-25 707,308 5,360,671 336 180 -65 42 NS AL-17-26 707,890 5,360,265 333 180 -65 60 27 39 13 0.73 including 27 31 4 0.95 including 37 39 2 1.33 AL-17-27 707,890 5,360,345 333 180 -65 87 NS AL-17-28 707,720 5,360,345 331 180 -65 181 NS AL-17-29 707,935 5,360,341 333 180 -45 71 NS AL-17-30 707,833 5,360,286 333 180 -45 66 16 19 3 0.84 30 40 10 1.04 including 30 33 3 1.26 including 35 39 4 1.16 AL-17-31 707,740 5,360,615 333 180 -65 30 NS Note: Downhole widths are not true widths NS: Not Significant Results

Authier Lithium DFS Technical Report Summary – Quebec, Canada 87 The highlights of the 2017 drilling program include: • Extension of the mineralization within the main pegmatite orebody by 150 m to the east, up to 300 m to the west within the deeper levels, and 200 m to the west at shallower levels and at depth in the gap zone. • The east-west strike length of the main deposit has now been extended from 850 m to 1,100 m, with an average thickness of 25 m, ranging from 4 m to 55 m, dipping at 40 to 50 degrees to the north. The orebody remains open to the east, west and at depth. • Delineation of the Authier North pegmatite, which has 670 m of drilling completed in 13 holes. The northern pegmatite has a narrow and gently dipping geometry between 10 m and 25 m vertical depth, not visible from the surface, and downhole intersections typically averaging 5 m to 8 m in width. The pegmatite remains open in all directions. Sayona Québec aims to delineate a resource at shallow levels that would be amenable to open-cut mining at a low stripping ratio. Drilling has successfully defined a 300 m western extension of the main Authier pegmatite at between 110 m and 220 m vertical depth, including: • AL-17-02: 32 m of 1.15% Li2O, including 7 m of 1.44% Li2O. • AL-17-05: 19 m of 1.26% Li2O, including 9 m of 1.69% Li2O. • AL-17-08: 8 m of 1.07 % Li2O from 165 m, including 3 m of 1.31% Li2O from 167 m. AL-17-02 and AL-17-05 demonstrated similar widths and grades to those in the deeper, Phase 1 holes, which included: • AL-16-13: 24 m of 1.25% Li2O from 184 m and 8 m of 0.91% Li2O from 216 m. • AL-16-15: 20 m of 1.32% Li2O from 242 m, including 11 m of 1.61% Li2O from 248 m. The results indicate a potential western plunge of the high-grade mineralization at deeper levels within the western sector. The higher-grade mineralization below the economic open-cut pit depths could be amenable to future underground mining (Figure 7-2). Authier Lithium DFS Technical Report Summary – Quebec, Canada 88 Figure 7-2 – Section 707050 m E looking west, demonstrating the extension of mineralization. AL-17-01, AL-17-06 and AL-17-07 (Section 706,800 m East, see Figure 7-3) have intercepted narrow zones of low-grade to barren pegmatite, which has been affected by a large north-south fault cross-cutting the mineralization in the Beaver Dam area on Section 707560 m East. The pegmatite pinches within the fault zone but shows no significant evidence of post-mineral displacement.

Authier Lithium DFS Technical Report Summary – Quebec, Canada 89 Figure 7-3 – Section 706800 m E looking west, intersecting narrow zones of low grade to barren mineralization. AL-17-22 intersected a thick zone of spodumene mineralization in the gap zone, 29 m of 0.92% Li2O, confirming an 85 m down-dip extension of the exploratory Phase 1 drillhole AL-16-16, which intersected 28 m of 1.20% Li2O from 158 m, including 18 m of 1.39% Li2O from 162 m. AL 17-22 has confirmed an extension of the resource down to approximately 200 m in the gap zone (see Figure 7-4). Authier Lithium DFS Technical Report Summary – Quebec, Canada 90 Figure 7-4 – Section 707400 m E looking west (Gap Zone) showing the dip extension of mineralization. Holes AL-17-13 (section 707725 m East, Figure 7-5) and AL-17-14 (section 707775 m East) in the eastern deep zone have extended mineralization 150 m to the east. Hole AL-17-13 yielded 26 m of 1.26% Li2O from 163 m, including 15 m of 1.42% Li2O from 169 m, and is located 120 m east of AL-16-14, which intercepted mineralized pegmatite from a vertical depth of 120 m and is expected to result in an 80 m deepening of the current pit outline. Hole AL-17-28, a 100 m step forward from AL-17-13, intercepted low-grade pegmatite that was affected by a fault zone, which caused a local pinching of the main Authier pegmatite.

Authier Lithium DFS Technical Report Summary – Quebec, Canada 91 Figure 7-5 – Section 707725 m E looking west. Hole AL-17-16 intercepted a narrow zone of mineralized pegmatite, 7 m of 0.76% Li2O, within a wider zone of low-grade to barren pegmatite at shallow levels. It is interpreted that the mineralization has been pinched with respect to the wider pegmatite intercepted by the following holes: • AL-17-30: 10 m of 1.04% Li2O from 30 m, including 3 m of 1.26% Li2O from 30 m. • AL-17-26: 13 m of 0.73% Li2O from 27 m, including 2 m of 1.33% Li2O from 37 m. Hole AL-17-17 intercepted the narrow, lower portion of the eroded pegmatite, 1 m of 1.03% Li2O, immediately below 12 m of overburden being collared 35 m south (same section) of AL-17-30. Holes AL-17-30 and AL-17-26, separated 65 m east-west, intercepted the main pegmatite slightly deeper than AL-17-15 and AL-17-17. The narrow mineralization intercepted by AL-17-15 was extended 165 m down-dip by AL-17-14, which yielded 20 m of 0.95% Li2O from 169 m, including 10 m of 1.19% Li2O from 170 m, from a vertical depth of 135 m and collared 185 m north in the same section. Holes AL-17-27 and AL-17-29, the easternmost holes, intercepted narrow barren pegmatite in fault zones. The geometry of the pegmatite at narrow levels pinches and swells, but it is considered open and further drilling is required to test the easternmost strike extent. During Phase 2, drilling began to define the geometry of the new northern pegmatite, located 400 m north of the main Authier pegmatite. During the Phase 1 drilling, AL-16-10 intersected 7 m of 1.36% Li2O from 7 m in a step-back hole targeting deeper mineralization in the main pegmatite. Drilling from the Phase 2 Authier Lithium DFS Technical Report Summary – Quebec, Canada 92 program has now defined additional mineralization over 300 m in strike length and the system remains open in all directions. Such a mineralized zone was built using a reference east–west line, 35 m north of AL-16-11, in a 50 m by 50 m drilling grid. The most significant holes are: • AL-17-11: 6 m of 1.32% Li2O from 23 m, including 3 m of 1.76% Li2O from 24 m. • AL-17-12: 5 m of 0.90% Li2O from 27 m, including 1 m of 1.71% Li2O from 30 m. • AL-17-19: 8.27 m of 0.88% Li2O from 10.7 m, including 4.27 m of 1.27% Li2O from 10.7 m. • AL-17-23: 8 m of 0.86% Li2O from 16 m, including 3 m of 1.53% Li2O from 21 m. Fifty-meter step-back holes AL-17-10 (Figure 7-6), AL-17-20, AL-17-21, AL-17-24, and AL-17-25, as well as scout hole AL-17-31, intercepted narrow and low-grade to barren pegmatite. While the grades were lower than anticipated, Sayona Québec believes the system has good potential to host further mineralization. Zones within the pegmatite occur as coarse-grained, narrow, high-grade mineralization, suggesting potential for a large feeder system at depth. Further drilling will be required to test the down- dip extensions of the pegmatite, which has only been drilled to shallow levels. Figure 7-6 – Hole AL-17-10 in the Northern Pegmatite which intersected 7 m of 1.36% Li2O from a downhole depth of 15 m (vertical depth of 12 m), including 2 m of 2.24% Li2O from 17 m.

Authier Lithium DFS Technical Report Summary – Quebec, Canada 93 7.4 SAYONA QUÉBEC DRILLING 2018 Sayona Québec completed a Phase 3 diamond drilling program at the Authier Property, including 33 holes for 3,282.6 m (Figure 7-7) and having the following objectives: • Converting the Inferred mineral resources to Measured and Indicated and upgrading Ore Reserves for the UDFS. • Exploring for extensions to the existing mineral resources and other potential mineralization within the tenement package. • Collecting geotechnical data for incorporation into the UDFS and 5,000 kg of core for pilot metallurgical testing. • Condemnation drilling in areas planned for infrastructure. Figure 7-7 – Drillhole collar location plan view, highlighting (light blue) the Metallurgical Pilot Plan drillholes completed during Phase 3 drilling at Authier Project. 7.5 RESOURCE EXPANSION AND EXPLORATION DRILLING A total of 19 diamond core holes (NQ diameter), for 2,170 m, were completed as part of the Phase 3 drilling program. Authier Lithium DFS Technical Report Summary – Quebec, Canada 94 A number of diamond drillholes have intercepted high-grade spodumene mineralization with the best intercepts including: • AL-18-09: 25 m of 1.48% Li2O from 79 m, including 6 m of 1.77% Li2O from 80 m and 6 m of 1.78% Li2O from 94 m. • AL-18-10: 6 m of 1.26% Li2O from 97.4 m, including 4 m of 1.52% Li2O from 98.4 m. • AL-18-16: 37 m of 1.03% Li2O from 255 m, including 11 m of 1.24% Li2O from 266 m and 3 m of 1.67% Li2O from 281 m. • AL-18-17: 33 m of 1.18% Li2O from 160 m, including 10 m of 1.25% Li2O from 166 m and 3 m of 1.75% Li2O from 190 m. Drilling has successfully demonstrated depth extensions of the mineralization at the main Authier pegmatite. Infill drilling successfully targeted areas of low drilling density with the objective of upgrading the resource categories. A number of holes testing the eastern extensions of the main Authier pegmatite at shallow levels were stopped due to the presence of a fault zone but warrant further testing in a future drilling program. A potential third deep pegmatite dyke was intercepted at a depth of 300 m and returned low-grade mineralization due to the replacement of spodumene by phengite. Further drilling will be required to test the potential of this system, especially at shallower levels. Drilling has successfully extended the mineralization at the Authier North pegmatite from 300 m to 500 m in strike length and at depth. The system remains open in all directions. The mineralization remains open in all directions. 7.6 DRILLHOLE RESULTS BY SECTOR 7.6.1 Main Authier Pegmatite The following summarizes the key outcomes of the resource expansion and exploration drilling program within Phase 3 drilling: • AL-18-01 and AL-18-02 were stopped before hitting the target due to a fault zone. • AL-18-09, 18-04, 18-05, 18-06 and 18-07 tested the eastern extension of the main Authier pegmatite at shallow levels, intercepting narrow zones of weak lithium mineralization. • AL-18-08 and AL-18-09 filled the gaps within the East zone of the main Authier pegmatite resource from 40 m to 70 m vertical depth. AL-18-09 yielded 25 m of 1.48% Li2O from 79 m, including 6 m of 1.77% Li2O from 80 m and 6 m of 1.78% Li2O from 94 m. • AL-18-10 intercepted a narrow lithium-mineralized zone that filled the gap of the main Authier pegmatite resource in the central part, including 6 m of 1.26% Li2O from 97.4 m, including 4 m of 1.52% Li2O from 98.4 m.

Authier Lithium DFS Technical Report Summary – Quebec, Canada 95 • AL-18-12 drilled within a NNE fault zone intercepted narrow and weak lithium anomalies in the west zone. • AL-18-16 at the deep west zone of the main Authier pegmatite intercepted a wide deep extension of the pegmatite at a vertical depth of 235 m to 270 m, 75 m step back of hole AL-16-15 (20 m of 1.32% Li2O from 242 m). A potential third pegmatite dyke was intercepted at a vertical depth of 300 m with 25 m downhole width, which returned no significant spodumene mineralization due the replacement of spodumene by phengite. Additionally, AL-18-16 intercepted the Authier North pegmatite with lithium mineralization at shallow levels. • AL-18-17, an infill hole at the East zone of the main Authier pegmatite, intercepted a wide mineralized pegmatite zone of 33 m of 1.18% Li2O from 160 m, including 10 m of 1.25% Li2O from 166 m and 3 m of 1.75% Li2O from 190 m (Figure 7-7). Sayona Québec believes that the main Authier pegmatite is still open in all directions. The geometry of the mineralized pegmatite at shallow levels in both east and west extensions seem affected by post- mineral faulting, and further drilling should be conducted at mid-to-deep levels to test along strike extension of the main pegmatite. The deep extensions of the main pegmatite are demonstrating excellent grades and widths. 7.6.2 Northern Pegmatite Holes AL-18-13, AL-18-14 and AL-18-16 extended the mineralization from 250 m to 500 m in strike extension; AL-18-13, AL-18-18 and AL-18-19 were infill holes. The Authier North pegmatite is narrow, gently dipping to the north, and is still open along strike. The resource expansion and exploration drillhole results as part of Phase 3 diamond drilling (Table 7-3) are detailed as follows: Table 7-3 – Sayona Phase 3 Metallurgical Pilot Plan drillhole collar location and intercept information (downhole intersections in meters). Drillhole East North RL Azimuth Dip Depth From (m) To (m) Thickness (m) Grade (%Li2O) AL-17-32 707,520 5,360,175 329 180 -45 98 13 78 65 1.29 including 27 48 21 1.54 AL-17-33 707,520 5,360,240 331 180 -45 120 53 99 46 1.28 including 54 66 12 1.50 AL-17-34 707,550 5,360,240 331 177 -45 96 56 91 35 1.09 AL-17-35 707,425 5,360,225 330 177 -45 74 5 42 37 0.98 including 27 42 15 1.10 AL-17-36 707,150 5,360,350 330 180 -52 112 67 81 14 1.47 83 95 12 1.57 Authier Lithium DFS Technical Report Summary – Quebec, Canada 96 104 112 8 1.49 AL-17-37 707,218 5,360,418 330 180 -65 186 139 146 7 1.15 151 167 16 0.54 AL-17-38 707,375 5,360,300 330 180 -45 85 34 52 18 0.96 54 60 6 1.32 63 65 2 1.30 Note: Downhole widths are not true widths 7.6.3 Condemnation Holes In 2018, seven diamond core holes, NQ diameter for 342.65 m, were completed in the zone north of the Authier deposit to test and discard potential mineralized pegmatite within the planned infrastructure zone. The areas tested were selected based on geological mapping and sampling, close to outcropping pegmatite, which returned low-grade lithium anomalies after surface rock chip sampling or nearby historical drilling (Figure 7-8). All of the holes intercepted narrow zones of low-grade to barren pegmatite dykes at different depths. Sampling has been performed to confirm the low-grade to barren character of the pegmatites dykes and results will be made available. The condemnation drillholes results of Phase 3 diamond drilling (Table 7-4) are detailed as follows: Table 7-4 – Sayona Phase 3 Metallurgical Pilot Plan drillhole collar location and intercept information (downhole intersections in metres). Drillhole East North RL Azimuth Dip Depth From (m) To (m) Thickness (m) Grade (%Li2O) AL-18-20 707,348 5,360,950 340 180 -50 48 NS AL-18-21 707,037 5,360,304 341 180 -50 42 NS AL-18-22 706,039 5,360,905 341 180 -50 51 NS AL-18-23 706,115 5,360,890 340 180 -50 51 NS AL-18-24 706,107 5,361,328 342 180 -50 49 NS AL-18-25 706,446 5,361,165 341 180 -50 51 NS AL-18-26 706,450 5,360,970 340 180 -50 51 NS Note: Downhole widths are not true widths NS: Not significant results

Authier Lithium DFS Technical Report Summary – Quebec, Canada 97 Figure 7-8 – Drillhole collar location plan view, highlighting (red) Condemnation drillholes completed during Phase 3 drilling at the Authier Property. Authier Lithium DFS Technical Report Summary – Quebec, Canada 98 8 SAMPLE PREPARATION, ANALYSES AND SECURITY 8.1 REVERSE CIRCULATION PROCEDURES, SAMPLE PREPARATION AND ANALYSES The following section presents the sample preparation, analysis and security procedures followed during the various drilling campaigns. These procedures were reviewed by SGS in 2012, while preparing the preliminary economic assessment of the Authier Lithium Project, and subsequently reviewed by Sayona Québec in 2016 during the prefeasibility study. 8.1.1 ALS Minerals 2010 Procedures All samples received at ALS in 2010 from the Project were digitally inventoried using bar codes, then weighed. Samples with excess moisture were dried. Samples were crushed in a jaw and/or roll crusher to 70% passing 9 mesh. Crushed material was split in a rifle splitter to obtain a 250 g subsample, which was then pulverized to 85% passing 200 mesh using either a single component flying disk mill, or a two- component ring and puck mill. The analyses were conducted at the ALS laboratory, an accredited laboratory under ISO/IEC 17025 standards, located in North Vancouver, British Columbia. Two analytical methods were used for samples from the Authier Lithium Deposit. The first analytical method used by ALS was the 38 elements analysis, not including lithium, using lithium metaborate fusion, followed by inductively coupled plasma mass spectrometry (ICP-MS) (ALS code ME-MS81). The method used 0.2 g of the pulverized material and returned different detection limits for each element. The second analytical protocol used by ALS was the ore grade lithium four-acid digestion with inductively coupled plasma – atomic emission spectrometry (ICP-AES) (ALS code Li-OG63). The Li-OG63 analytical method uses approximately 0.4 g of pulp material and returned a lower detection limit of 0.01% Li. SGS Geological Services conducted independent check sampling of selected drill core from the Project. The analyses of the check samples were conducted at SGS Canada Inc. Minerals Services laboratory located in Toronto, Ontario (SGS Minerals), which is an accredited ISO/IEC 17025 laboratory. The analytical method used by SGS Minerals is the ore grade analysis using sodium peroxide fusion with induced coupled plasma optical emission spectrometry (ICP-OES) finish methodology with a lower detection limit of 0.01% lithium (SGS code ICP90Q). This method uses 20 g of pulp material.

Authier Lithium DFS Technical Report Summary – Quebec, Canada 99 8.1.2 AGAT Laboratories 2011-2012 Procedures Samples received at AGAT Laboratories in 2011-2012 were processed according to the following procedures at the AGAT preparation facilities in Sudbury, Ontario. All samples were inspected and compared to the chain of custody (COC) and logged into the AGAT laboratory management system then weighed. Drying was undertaken at 60°C on all samples. Sample material was crushed in a Rocklabs Boyd or a TM Terminator Jaw Crusher to 75% passing 10 mesh (2 mm). The crushed material was split with either a rifle splitter or a rotary splitter to obtain a 250 g subsample, which was then pulverized to 85% passing 200 mesh (75 µm) using TM and TM-2 pulverizers. The analyses were conducted at the AGAT laboratory, an accredited laboratory under ISO/IEC 17025 standards, located in Mississauga, Ontario. The analytical protocol used at AGAT is the ore grade lithium four-acid digestion with ICP-OES (AGAT code 201079) -Li. The analytical method uses approximately 0.5 g of pulp material and uses a lower detection limit of 0.0001% lithium. 8.1.3 SGS 2016-2017 Sampling Procedures Drill core samples collected during the 2016 diamond drilling program were transported directly by a courier truck, contracted by Sayona Québec, to the SGS laboratory preparation facilities in Sudbury, Ontario for sample preparation. Procedures followed were based upon industry best practice. All samples were inspected and compared to the chain of custody and logged into the SGS laboratory management system. Samples were then weighed and dried. Samples were crushed to 75% passing 10 mesh (2 mm), split to obtain a 250 g subsample, which was pulverized to 85% passing 200 mesh (75 µm). Samples were then shipped to SGS Mineral Services laboratories in Lakefield, Ontario, for analysis. Analyses of all 2016 drilling samples were conducted at the SGS laboratory located in Lakefield, Ontario, which is an accredited laboratory under ISO/IEC 17025 standards accredited by the Standards Council of Canada. The analytical protocol used at SGS Lakefield was method GE ICP90A 29 element analysis – sodium peroxide fusion that involved the complete dissolution of the sample in molten flux for ICP-AES analysis. The detection limits for lithium are 10 ppm (lower) and 10,000 ppm (upper). No geophysical or handheld tools were used. 8.2 QA / QC PROCEDURES 8.2.1 Quality Assurance and Quality Control Procedure by Glen Eagle Over and above the laboratory quality assurance quality control protocol (QA/QC) routinely conducted by ALS using pulp duplicate analysis, Glen Eagle implemented an internal QA/QC protocol consisting of the insertion of reference material, i.e., analytical standards and blanks, on a systematic basis, with the Authier Lithium DFS Technical Report Summary – Quebec, Canada 100 samples shipped to ALS. The company also sent pulps from selected mineralized intersections to SGS Minerals for reanalysis. SGS Geological Services did not visit the ALS or SGS Minerals facilities or conduct an audit of the laboratories. 8.2.1.1 Analytical Standards Two different standards were used by Glen Eagle for the internal QA/QC program: one low-grade lithium (Low-Li) and one high-grade lithium (High-Li) standard. Both standards were custom-made reference materials from mineralized material coming from the main pegmatite intrusion at the Authier Property. To evaluate their expected values, both Low-Li and High-Li standards were analyzed 15 times each at the SGS Minerals laboratory in Toronto and 15 times each at the ALS laboratory in North Vancouver, British- Colombia. The analytical protocol used at SGS Minerals was the mineral grade sodium peroxide fusion with ICP-OES finish described in Section 8.1.1. The analytical protocol used at ALS was the ore grade lithium four-acid digestion with ICP-AES finish, also described in Section 8.1.1. For the Low-Li standard, the analytical results returned from SGS Minerals for the 15 samples averaged 0.63% Li2O versus an average of 0.61% Li2O for the 15 samples submitted to ALS. For the High-Li standard, the average of the 15 samples analyzed at SGS Minerals returned 2.91% Li2O versus an average of 2.88% Li2O for the 15 samples processed at ALS. Each laboratory showed relatively consistent analytical results from one sample to another for each standard analyzed. The averages for each standard also show a good correlation between SGS Minerals and ALS. The results from the analysis of these 30 samples for each Low-Li and High-Li were used to determine the expected values, based upon a mean value from the 30 samples, and the QA/QC warning/failure thresholds, i.e., ±2 standard deviations and ±3 standard deviations, respectively. Table 8-1 shows the results for each standard using both analytical protocols.

Authier Lithium DFS Technical Report Summary – Quebec, Canada 101 Table 8-1 – Results from Custom Low-Li and High-Li standards. Glen Eagle Resources Inc. – Authier Project – Standards Certifications Low-grade Standard (% Li2O) ALS Data SGS Data All Data Count 15 15 30 Mean 0.614 0.629 0.622 Std. Dev 0.042 0.012 0.031 Min 0.588 0.603 0.588 Median 0.605 0.624 0.619 Max 0.764 0.646 0.764 QA/QC Thresholds Warning Range Lower Limit 0.559 (2 x Std Dev) Higher Limit 0.684 Failure Limit Lower Limit 0.528 (3 x Std Dev) Higher Limit 0.715 High-grade Standard (% Li2O) ALS Data SGS Data All Data Count 15 15 30 Mean 2.884 2.911 2.898 Std. Dev 0.067 0.031 0.053 Min 2.756 2.820 2.756 Median 2.874 2.907 2.907 Max 3.090 2.950 3.090 QA/QC Thresholds Warning Range Lower Limit 2.792 (2 x Std Dev) Higher Limit 3.003 Failure Limit Lower Limit 2.739 (3 x Std Dev) Higher Limit 3.056 8.2.2 2010-2012 Reference Materials Results In 2010, Glen Eagle sent samples to ALS Minerals in Vancouver, British Columbia and, starting in 2011, to AGAT in Mississauga, Ontario. During this period, 31 High-Li and 32 Low-Li were inserted into the sampling procedure. A graphic representation of reference materials (RM) quality control failures and the labelling results are included in Figure 8-1. The red lines represent three times the standard deviation (±3σ). Of a total of 63 RM samples tested since 2010, seven RM samples (11%) produced results exceeding ±3σ. Similarly, only two RM samples (3%) produced results exceeding 10% of the expected value. Almost all RM analyses fell under the 10% difference from the expected RM value. 8.2.2.1 Z Scores The Z scores were also calculated and plotted (Figure 8-1). The z-score is the difference between the observed RM result and the expected result divided by the expected standard deviation: z-score = (x - μ) / s, Where: x is the observed assay; Authier Lithium DFS Technical Report Summary – Quebec, Canada 102 μ is the expected assay for the RM; s is the expected standard deviation for the RM. Figure 8-1 – RM (STD High, STD Low) results. 8.2.2.2 ALS Minerals 2010 Reference Materials Results In 2010, Glen Eagle sent samples to ALS Minerals of Vancouver. In Figure 8-2, the red lines represent the absolute limits of three times the standard deviations (±3σ) and the absolute percentage differences from the RM expected values. Of a total of 31 RM analyses, two RM (6%) produced results exceeding ±3σ the expected value. Additionally, no RM produced results exceeding 10% the RM expected value. Possible mislabels are included in this analysis.

Authier Lithium DFS Technical Report Summary – Quebec, Canada 103 Figure 8-2 – ALS 2010 RM Z-score & percentage from expected RM value. 8.2.2.3 AGAT 2011-2012 Reference Materials Results Beginning in 2011, Glen Eagle sent samples to AGAT Laboratories in Mississauga for analysis. In Figure 8-3 3, the red lines represent the absolute limits of three times the standard deviations (±3σ) and the absolute percentage differences from the RM expected values. Out of a total of 32 RM, five RM (15%) produced results exceeding ±3σ the expected value. Additionally, two RM produced results exceeding 10% of the expected value. Possible mislabels are included in this analysis. SGS Geological Services is of the opinion that certain RMs were mislabelled at that time. Authier Lithium DFS Technical Report Summary – Quebec, Canada 104 Figure 8-3 – AGAT 2011-2012 RM Z-score & percentage from expected RM value. 8.2.3 Quality Assurance and Quality Control Procedures by Sayona Québec In addition to the laboratory QA/QC protocol routinely conducted by SGS using standards and pulp duplicate analysis, Sayona Québec applied a QA/QC protocol involving a review of laboratory-supplied internal QA/QC and in-house controls consisting of the insertion of in-house reference standards, i.e., high- and low-grade, prepared with material from the Project and certified by lab round-robin, and samples of barren material (blanks), on a systematic basis with the samples shipped to SGS. Sample sizes are considered appropriate with regard to the grain size of the sampled material. 8.2.3.1 Analytical Standards Two different standards were used by Sayona Québec for the internal QA/QC program: one Low-Li and one High-Li standard. The samples were the same standards used by Glen Eagle for the 2010-2012 drilling programs. Both standards were custom-made references produced from mineralized material from the main pegmatite intrusion at the Authier Property. Both Low-Li and High-Li standards were analyzed 15 times each at the SGS Minerals laboratory in Toronto, Ontario, and 15 times each at the ALS laboratory in North Vancouver, British-Colombia. The analytical protocol used at SGS Minerals was the mineral grade sodium peroxide fusion with ICP-OES finish described in Section 8.1.1. The analytical protocol used at ALS was the ore grade lithium four-acid digestion with ICP-AES finish, also described in Section 8.1.1.

Authier Lithium DFS Technical Report Summary – Quebec, Canada 105 For the Low-Li standard, the analytical results returned from SGS Minerals for the 15 samples averaged 0.63% Li2O versus an average of 0.61% Li2O for the 15 samples submitted to ALS. For the High-Li standard, the average of the 15 samples analyzed at SGS Minerals returned 2.91% Li2O versus an average of 2.88% Li2O for the 15 samples processed at ALS. Each laboratory shows relatively consistent analytical results from one sample to another for each standard analyzed. The averages for each standard also show a good correlation between SGS Minerals and ALS. The results from the analysis of the 30 samples for each Low- Li and High-Li are used to determine the expected values, based upon a mean value from the 30 samples, and the QA/QC warning/failure thresholds, i.e., ±2 standard deviations and ±3 standard deviations, respectively. Table 8-2 shows the results for each standard using both analytical protocols. Table 8-2 – Results from custom Low-Li and High-Li standards – Sayona Québec 2016. Li Standard(s) No. of Samples Calculated Values Standard Method Exp Method Exp Value Exp SD Mean Li SD CV Mean Bias High_Li FS_ICPES FS_ICPES 1.346 0.025 29 1.412 0.032 0.022 4.91% Low_Li FS_ICPES 4A_ICPES 0.289 0.014 25 0.301 0.005 0.018 4.56% 8.2.4 2016 Reference Materials Results The 2016 QA/QC follow-up was conducted by Rock Solid Data Consultancy Pty., mandated by Sayona Québec, which prepared a report that included performance of reference material (Sayona Québec and SGS). In 2016, Sayona Québec included the two standards at random intervals during sampling, at a rate of approximately 1:20 samples. All results for both the High-Li and Low-Li reported above the expected values and fell within ±10% from expected value. The results show a consistent bias with a mean of +4.91% for High-Li and +4.56% for Low-Li. The bias might be attributed to the difference between the SGS method by which the standard samples were analyzed (SGS GE_ICP90A) and the methods used for deriving the expected value for the standards (SGS ICP90Q and ALS Li-OG63). In Figure 8-4 and Figure 8-5, orange lines represent the ±3σ from the expected value and the red lines represent ±10% of the expected value. The results for the 29 High-Li and 25 Low-Li samples are summarized in Table 8-2. Authier Lithium DFS Technical Report Summary – Quebec, Canada 106 Figure 8-4 – RM (STD High) results Sayona Québec 2016. Figure 8-5 – RM (STD Low) results Sayona Québec 2016.

Authier Lithium DFS Technical Report Summary – Quebec, Canada 107 8.2.4.1 Company Blank Material Sayona Québec used one non-certified silica blank during the 2016 and 2017 drilling campaigns to test for potential sample contamination during sampling, preparation, and analysis processes. The material was "Special Kitty Litter" purchased from Walmart and was stored in airtight plastic tubs to prevent contamination. Each sample consisted of approximately 200 g of material scooped with a dedicated mug into the plastic sample bags. The blanks were included at routine intervals during sampling at a rate of approximately 1:20 samples. The blanks were analyzed for lithium by SGS using the sodium peroxide fusion ICPOES (GE_ICP90A) method. The expected value and standard deviation for the blank were set to 0.001% lithium, which is the detection limit for the analysis method. The control limits were set as ±3σ from the expected value. The blank material performed well with all samples <0.003% and no outliers reported. The results for the 57 blank samples are summarized in the Table 8-3 and Figure 8-6. Table 8-3 – Blank Summary – Sayona Québec 2016. Li Standard(s) No. of Samples Calculated Values Standard Method Exp Method Exp Value Exp SD Mean Li SD CV Mean Bias Blk_SpKi Litter FS_ICPES FS_ICPES 0.001 0.001 57 0.000 0.001 0.000 na Figure 8-6 – Blank Performance – Sayona Québec 2016. Authier Lithium DFS Technical Report Summary – Quebec, Canada 108 8.2.4.2 Sayona Québec Duplicates 2016 Sayona Québec did not collect duplicate samples during the 2016 drill campaign. The SGS Lakefield laboratory reported two types of laboratory duplicates in their batches, a coarse duplicate, and a pulp repeat. 8.2.5 2017 Reference Materials Results The 2017 QA/QC follow-up was conducted by Rock Solid Data Consultancy Pty., mandated by Sayona Québec, which included performance of reference material of both Sayona Québec and SGS. In 2017, Sayona Québec included the two standards at random intervals during sampling at a rate of approximately 1:20 samples, the same procedure as 2016. The Sayona Québec blank material, the SGS blank and low-grade SGS laboratory standard (RTS-3A) performed well with all samples within control limits. The two Sayona Québec standards, High-Li, and Low-Li, and SGS laboratory standards, NBS183, NIST97B and SY-4, exhibited a bias shift in the results reported during April 2017 compared to the results reported in March 2017. All results for laboratory standard NBS183, reported during April 2017, fell below 3σ from the expected value, which is in contrast to the results for March 2017 and for the 2016 drilling campaign, where all results reported within ±3σ from the expected value. The apparent bias could be due to laboratory calibration error and will be controlled by Sayona Québec through pulp check assaying in both the same lab and another lab during the Phase 3 drilling program. In the charts that follow, the orange lines represent the ±3σ from the expected value and the red lines represent ±10% from expected value. The results for the 17 High-Li and 19 Low-Li samples are summarized in Table 8-4. Table 8-4 – Results from custom Low-Li and High-Li standards – Sayona Québec 2017. Li Standard(s) No. of Samples Calculated Values Standard Method Exp Method Exp Value Exp SD Mean Li SD CV Mean Bias High_Li FS_ICPES UN_UN 1.346 0.025 17 1.360 0.051 0.038 1.05% Low_Li FS_ICPES UN_UN 0.288 0.014 19 0.289 0.010 0.035 0.29%

Authier Lithium DFS Technical Report Summary – Quebec, Canada 109 Figure 8-7 – RM (STD High) results. Figure 8-8 – RM (STD Low) results. Authier Lithium DFS Technical Report Summary – Quebec, Canada 110 Figure 8-9 – Authier High-Li and SGS NBS183 performance 2016-2017. 8.2.5.1 Company Blank Material Sayona Québec utilized one non-certified silica blank during the 2016 and 2017 drilling campaign to test for potential sample contamination during sampling, preparation, and analysis processes. The material was "Special Kitty Litter" purchased from Walmart and was stored in airtight plastic tubs to prevent contamination. Each sample consisted of approximately 200 g of the material scooped with a dedicated mug into the plastic sample bags. The blanks were included at routine intervals during sampling at a rate of approximately 1:20 samples. The blanks were analyzed for Li by SGS sodium peroxide fusion ICP-OES (GE_ICP90A). The expected value and standard deviation for the blanks were set to 0.001% lithium, which is the detection limit for the analysis method. The control limits are set as ±3σ from the expected value.

Authier Lithium DFS Technical Report Summary – Quebec, Canada 111 The blank material performed well with all samples <0.003% and no outliers reported. The results for the 44 blank samples are summarized in Table 8-5 and Figure 8-10. Orange lines in the figure represent the ±3σ from the expected value and the red lines represent ±2σ from the expected value. Table 8-5 – Blank summary – Sayona Québec 2017. Li Standard(s) No. of Samples Calculated Values Standard Method Exp Method Exp Value Exp SD Mean Li SD CV Mean Bias Blank FS_ICPES FS_ICPES 0.000 0.001 44 -0.001 0.001 0.000 0.00% Figure 8-10 – Blank performance – Sayona Québec 2017. 8.2.5.2 Sayona Québec Duplicates 2017 Sayona Québec did not collect duplicate samples during the 2017 drill campaign. The SGS Lakefield laboratory reported two types of laboratory duplicates in their batches, a coarse duplicate, and a pulp repeat. Authier Lithium DFS Technical Report Summary – Quebec, Canada 112 8.2.6 Sayona Québec 2018 Reference Materials Results The 2018 QA/QC follow-up was conducted by Rock Solid Data Consultancy Pty., mandated by Sayona Québec. The report included performance of reference materials for both Sayona Québec and SGS. The sampling data was managed by Rock Solid Data and stored in a custom-relational SQL database. The report is based on quality control data associated with 2,154 m of NQ diamond drilling (DD) from 19 drillholes (AL-18-001 to AL-18-019). A total of 364 half-core samples were collected from mineralized intersections between January and March 2018. Available quality control data include two company standards and one company blank as well as laboratory duplicates, blanks, and standards. Sayona Québec did not collect duplicate samples during the report period. The drill and quality control samples were submitted to SGS Lakefield, where they were analyzed for lithium and 27 additional elements by sodium peroxide fusion ICP-OES with HCl finish (GE_ICP91A). The lower detection limit for lithium is 0.001%. SGS reported a total of seven batches, between February 22 and March 27, 2018. The lithium analyses are the subject of this report and values are reported in percent. The amount of drill samples, duplicates and standards reported during the sampling program are summarized in Table 8-6. Approximately 8% of all samples submitted to SGS are Sayona Québec standards and blanks. Laboratory standards and laboratory duplicates represent approximately 11% of the reported samples. Table 8-6 – Authier 2018 SGS Lakefield batch summary statistics. Number of Batches Drill Samples Drill Duplicates Company Standards Company Blanks Laboratory Duplicates Laboratory Standards and Blanks 7 364 0 13 20 20 28 During the Authier 2018 drilling campaign, Sayona Québec used two company standards and one blank to monitor the accuracy of the laboratory assay results. The company standards were a High-Li (approx. 1.4%) and a Low-Li (approx. 0.3%) standard. The High-Li and Low-Li standards were custom-made from mineralized material from the main pegmatite intrusion at the Authier site and were used by Glen Eagle during their 2010-2012 drilling campaigns. The expected value and standard deviation for the standards were derived by Glen Eagle from 30 Lithium (Li2O) analyses from SGS Toronto and ALS Vancouver. The 15 SGS Toronto analyses were by sodium peroxide fusion with ICP-OES finish (SGS code ICP90Q) and the 15 ALS Vancouver analyses were by ore grade lithium four acid digestion with ICP-AES finish (ALS code Li-OG63). The control limits were set as ±3σ from the expected value. For further details regarding the two standards, refer to document "March-

Authier Lithium DFS Technical Report Summary – Quebec, Canada 113 01-2013_PEA_Glen-Eagle_rev_March-11.pdf”. The two standards were included at routine intervals during sampling at a rate of approximately 1:30 samples. The standards were analyzed for lithium by sodium peroxide fusion ICP-OES with HCl finish (GE_ICP91A). Sayona Québec used one non-certified blank, logged as Blk_Spki_Litter to test for potential sample contamination during sampling, preparation, and analysis processes. The Blank, Blk_SpKi_Litter was sourced from Walmart under the name "Special Kitty” Natural Clay Cat Litter. It was stored post purchase in airtight plastic tubs to prevent contamination. The blanks were included at routine intervals during sampling at a rate of approximately 1:20 samples. Each sample consisted of approximately 200 g of the material scooped with a dedicated mug into the plastic sample bags. The blanks were analyzed for lithium by sodium peroxide fusion ICP-OES with HCl finish (GE_ICP91A). 8.2.6.1 Sayona Québec 2018 Standards Results The lithium results for the company standards are summarized in Table 8-7, Figure 8-11 and Figure 8-12. A total of 13 standards were analyzed. All results for High-Li were within ±3σ from the expected value and all results for Low-Li were within ±2σ from the expected value. Table 8-7 – Sayona Québec standard reference material summary. Li Standard(s) No. of Samples Calculated Values Standard Method Exp Method Exp Value Exp SD Mean Li SD CV Mean Bias High_Li GE_ICP91A - 1.346 0.025 6 1.366 0.023 0.002 1.50% Low_Li GE_ICP91A - 0.288 0.014 7 0.294 0.008 0.003 2.25% Authier Lithium DFS Technical Report Summary – Quebec, Canada 114 Figure 8-11 – Authier High-Li performance. Figure 8-12 – Authier Low-Li performance.

Authier Lithium DFS Technical Report Summary – Quebec, Canada 115 8.2.6.2 Sayona Québec 2018 Blank Results During the report period a total of 20 blank samples were analyzed. Results for the blanks are summarized in Table 8-8 and Figure 8-13. Table 8-8 – Sayona Québec blank summary. Li Standard(s) No. of Samples Calculated Values Standard Method Exp Method Exp Value Exp SD Mean Li SD CV Mean Bias Blank GE_ICP91A - - - 20 0.004 0.001 0.161 - Figure 8-13 – Sayona Québec blank performance. 8.2.6.3 Sayona Québec Duplicates 2018 Sayona Québec did not collect duplicate samples during the 2018 drill campaign. The SGS Lakefield laboratory reported two types of laboratory duplicates in their batches, a coarse duplicate, and a pulp repeat. Authier Lithium DFS Technical Report Summary – Quebec, Canada 116 8.3 SAMPLE SHIPMENT AND SECURITY 8.3.7 AGAT Laboratories 2011-2012 Procedures Samples received at AGAT Laboratories in 2011-2012 were processed according to the following procedures at the AGAT preparation facilities in Sudbury, Ontario. All samples were inspected and compared to the chain of custody (COC) and logged into the AGAT laboratory management system then weighed. Drying was undertaken at 60°C on all samples. Sample material was crushed in a Rocklabs Boyd or a TM Terminator Jaw Crusher to 75% passing 10 mesh (2 mm). The crushed material was split with either a rifle splitter or a rotary splitter to obtain a 250 g subsample, which was then pulverized to 85% passing 200 mesh (75 µm) using TM, TM-2 pulverizers. The analyses were conducted at the AGAT laboratory, an accredited laboratory under ISO/IEC 17025 standards, located in Mississauga, Ontario. The analytical protocol used at AGAT is the ore grade lithium four-acid digestion with ICP-OES (AGAT code 201079) -Li. The analytical method uses approximately 0.5 g of pulp material and uses a lower detection limit of 0.0001% lithium. 8.3.8 SGS 2016-2017 Sampling Procedures Drill core samples collected during the 2016 diamond drilling program were transported directly by a courier truck, contracted by Sayona Québec, to the SGS laboratory preparation facilities in Sudbury, Ontario for sample preparation. Procedures followed were based upon industry best practice. All samples were inspected and compared to the chain of custody and logged into the SGS laboratory management system. 8.4 CORE HANDLING PROCEDURES 8.4.1 Sayona Drilling Summary Sayona Québec has completed three drilling programs at the Authier Property, including: • Phase 1 program in October/November 2016 of 18 holes, totalling 3,967 m. Following the drilling program, Sayona completed an upgrade of the resource and completed a Prefeasibility Study, dated February 2017; • Phase 2 diamond drilling program in May 2017 of 31 holes totaling 4,117 m; and • Phase 3 diamond drilling program in November/December 2017, which comprised seven diamond holes (PQ and HQ) for 769.5 m and the collection of five tonnes of core for pilot metallurgical testing; January / March 2018, which comprised 19 holes, NQ diameter, totaling 2,170.45 m; April 2018, involving condemnation drilling, six holes, NQ diameter, for 342.65 m.

Authier Lithium DFS Technical Report Summary – Quebec, Canada 117 The drilling performed by Sayona since acquiring the Authier Property from Glen Eagle is 81 holes for 11,367.5 m. From this database, 199 drillholes were used for the solid modelling and updated Mineral Resource Estimate (MRE). All holes completed by Sayona in both programs have been diamond core drillholes (DDH) using HQ or NQ core diameter size with a standard tube and bit. Core diameter for metallurgical drilling was done using PQ core for 680 m and HQ core for 89.5 m. Condemnation drilling was done using NQ core diameter. Core was oriented using a Reflex ACT III tool for Phase 1 and Phase 2, whereas Phase 3 diamond core was not oriented. The drilling programs were planned and managed by Sayona’s Qualified Person, assisted by one of Sayona’s project geologists. In addition, Sayona contracted Services Forestiers et d’Exploration GFE (GFE) for the permitting and logistic support of the drilling program. GFE provided the office, core logging and storage facilities to Sayona, which are located less than 4 km southeast from the main pegmatite dyke, near the town of La Motte. All drill core handling was done on-site with logging and sampling processes conducted by employees and contractors of Sayona. Drill core of HQ size was placed in wooden core boxes and collected twice a day at the drill site and then transported to the core logging facilities. The drill core was first aligned and measured by a technician or the geologist for core recovery. After a summary review of the core, it was oriented and geologically and geotechnically logged, including rock type, spodumene abundance, mica abundance, rock quality designation (RQD), orientation data (alpha and beta angles) for structures (faults, fractures, etc.). Point load tests (one each, 10 m average) have also been undertaken. The logging of the geological features was predominately qualitative. Parameters such as spodumene abundance are visual estimates by the logging geologist. The observations of lithology, structure, mineralization, sample number and location were noted by the geologists and geotechnicians in hard copy and an excel spreadsheet, and then recorded in a Microsoft® Access digital database. Copies of the database are stored on an external hard drive for security. Sampling intervals were defined by a geologist. Before sampling, the core was photographed using a digital camera after meter marks and sample intervals have been clearly marked on the core. The core was photographed dry and wet. The core boxes were identified with the box number, hole ID, from and to using aluminum tags. The entire target mineralization type core, i.e., spodumene pegmatite, and surrounding barren host rock has been logged, sampled, and assayed. The footwall and hanging wall barren host rock has been summary logged. Main rock units, i.e., pegmatite and host rock, are competent with average core recovery of around 99%. High competence of the core tends to preclude any potential issue of sampling bias and sampling is considered representative. Sampling intervals were determined by the geologist, marked, and tagged based on observations of the lithology and mineralization. The typical sample length is 1.0 m, starting 2 m to 3 m above and below the Authier Lithium DFS Technical Report Summary – Quebec, Canada 118 contact of the pegmatite with the barren host rock. In general, at least two host rock samples were collected from each side from the contact with the pegmatite. High- to low-grade lithium-bearing mineralization, i.e., spodumene, is visible during geological logging and sampling. The drill core samples were split into two halves with one half-placed in a new plastic bag along with the sample tag; the other half was placed in the core box with the second sample tag for reference. The third sample tag was archived on-site. The samples were then catalogued and placed in rice bags or sealed pails for shipping. The sample shipment forms were prepared on-site with one copy inserted into one of the shipment bags and one copy kept for reference. Full core was sent to the laboratory for PQ and NQ diameter samples taken for the metallurgical drilling program. As with the 2017 and 2016 samples, the 2018 samples were transported on a regular basis by a courier truck contracted by Sayona, directly to the SGS facilities in Lakefield, Ontario. Sample preparation and assaying techniques are within industry standards and appropriate for this type of mineralization. All core drilling before 2016 was NQ core diameter size only, standard tubes and bit, and not oriented. 8.5 SPECIFIC GRAVITY MEASUREMENTS 8.5.1 Specific Gravity of Mineralized Material As part of the 2010 independent data verification program, SGS Geological Services conducted specific gravity (SG) measurements on 38 mineralized core samples collected from drillholes AL 10-01 and AL-10- 11 (see Table 8-9). The measurements were performed using the water displacement method, i.e., weight in air divided by volume of water displaced, on representative half-core pieces weighing between 0.67 kg and 1.33 kg, with an average of 1.15 kg, yielding an average SG value of 2.71 t/m3. Table 8-9 – Specific gravity measurements statistical parameters (2010 Program). Unit Mineralized Material Count # 38 Mean t/m3 2.71 Std Dev t/m3 0.01 Minimum t/m3 2.64 Median t/m3 2.71 Maximum t/m3 2.81

Authier Lithium DFS Technical Report Summary – Quebec, Canada 119 In 2017, Sayona Québec performed a density validation program on both mineralized and non-mineralized material. Core samples were sent to ALS in Val-d’Or, Québec, which did the measurements using the same water displacement method. The results of these tests are presented Table 8-10. Table 8-10 – Specific gravity measurements statistical parameters (2017 Program). Unit Non-mineralized Material Mineralized Material Count # 14 15 Mean t/m3 2.90 2.70 Std Dev t/m3 0.07 0.05 Minimum t/m3 2.77 2.62 Median t/m3 2.91 2.70 Maximum t/m3 2.99 2.86 8.6 QUALIFIED PERSON COMMENTARY It is the Author’s opinion, based on a review of all possible information, that the sample preparation, analyses and security used on the Project by Sayona currently meets acceptable industry standards and the drill data can and has been used for geological and resource modeling, and resource estimation of classified mineral resources. It is suggested QAQC be implemented on all sampling programs including soil and rock (grab, channel, trench, etc.). Authier Lithium DFS Technical Report Summary – Quebec, Canada 120 9 DATA VERIFICATION 9.1 GENERAL Sayona Québec conducted the current mineral resource estimate (MRE) for the Authier Deposit using an updated, validated database, which incorporates diamond drilling programs completed by Sayona in 2016, 2017 and 2018. The database also includes validated historical drilling data from the Glen Eagle programs between 2010 and 2012. The Glen Eagle drilling database was also validated by SGS Geological Services for the MRE released on November 19, 2013, by Glen Eagle. The validation did not return any significant issues. The AL-10-XX, AL-11-XX and AL-12-XX collar coordinates present in the database were taken from signed originals and authorized copies of surveyed collar data from independent land surveying companies. As part of the data verification (see Section 2.2.2 for further reference), the analytical data from the database has been validated with values reported in the laboratories’ analytical certificates. The total laboratory certificates verified amounts to a minimum of 20% of the overall laboratory certificates of the Property. There were no relevant errors or discrepancies noted during the validation. The database used to produce the MRE is derived from a total of 225 holes from across the entire Authier Property, including: • 81 historical holes. • 69 drilled by Glen Eagle between 2010 and 2012. • 75 drilled by Sayona Québec between 2016 and 2018. The database contains the survey collar location, lithology, and analytical results. The database cut-off date is August 31, 2021. The author is of the opinion that the final drillhole database is adequate to support the MRE. From this database, 199 drillholes were used for the solid modelling and MRE. There is a total of 5,049 assay intervals in the database used for the current MRE and 2,456 of them are contained inside the mineralized solids.

Authier Lithium DFS Technical Report Summary – Quebec, Canada 121 9.2 CHECK SAMPLING OF 2010 ASSAY RESULTS BY SGS GEOLOGICAL SERVICES As part of the 2010 data verification program, SGS Geological Services completed independent analytical checks of drill core duplicate samples taken from Glen Eagle’s 2010 diamond drilling program. SGS Geological Services also conducted analysis of twin holes completed by Sayona Québec to validate the historical analytical data. Finally, verification of the laboratories’ analytical certificates and validation of the Project digital database supplied by Glen Eagle were verified for errors or discrepancies. Thirty mineralized drill core duplicates were collected from holes AL-10-01 and AL-10-11 by SGS Geological Services. The comparison of the 2010 original and duplicate analytical values suggests a small analytical bias toward the original samples processed by ALS. The 2010 Glen Eagle pulp duplicate program also came to this conclusion. The 2010 analytical bias was not very significant, with the duplicate samples returning an average Li2O value 7.9% higher compared to the original samples. 9.3 CHECK SAMPLING OF 2011-2012 ASSAY RESULTS BY SGS GEOLOGICAL SERVICES SGS Geological Services completed analytical checks of drill core duplicate samples taken from selected Glen Eagle 2011-2012 diamond drillholes on the Authier Deposit as part of the independent data verification program. SGS Geological Services also conducted verification of the laboratories analytical certificates and validation of the database supplied by Glen Eagle for errors and discrepancies. During the July 30, 2012, site visit by the author, Maxime Dupéré (P.Geo.), a total of 38 mineralized core duplicates from the Authier pegmatite were collected from holes AL-11-01, AL-11-16 and AL-12-20, and submitted for analysis at SGS Minerals’ laboratory in Lakefield (SGS Lakefield), Ontario, Canada which is an accredited ISO/IEC 17025 laboratory. This has been reviewed and verified by Ehouman N’Dah, P,Geo., the QP for this Report. The analytical method used by SGS Lakefield is the ore grade analysis using sodium peroxide fusion with induced coupled plasma optical emission spectrometry (ICP-OES) finish methodology with a lower detection limit of 0.01% Li (SGS code ICP90Q). This method uses 20 g of pulp material. Blanks were inserted respectively at the beginning and the end of the sample series. Two non-commercial reference materials were also inserted in the sample series: High-grade lithium (High-Li) and Low-grade lithium (Low-Li). Figure 9-1 shows the correlation plots for the check data versus the original data. A summary of the statistical analysis conducted on the data is shown in Table 9-1. There is a good assay correlation for Li2O. The correlation coefficient is above 0.9. The average Li2O grade of the duplicate assays is 13% higher than the original samples. The sign test shows that the proportion Authier Lithium DFS Technical Report Summary – Quebec, Canada 122 of pairs with an old sample value greater than the new sample value is 8 out of 43. The sign test clearly showed a bias at a 95% confidence level. In comparison to the previous check samplings done by SGS Geological Services, results show a clear variability of assay results between laboratories. It is SGS Geological Services, and the author’s, opinion that this difference in favour of the 2010 samples for ALS and the one in favour of the old assay results from the 2012 sampling (AGAT) is less than 15% and is considered acceptable. Recommendations will be made to mitigate this difference in the recommendation section. Figure 9-1 – Correlation plot for independent check samples. 0.000 0.500 1.000 1.500 2.000 2.500 3.000 - 0.50 1.00 1.50 2.00 2.50 3.00 D u p li c a te L i 2 O ( % ) Original Li2O (%) Check Assays Results Comapraison

Authier Lithium DFS Technical Report Summary – Quebec, Canada 123 Table 9-1 – Summary statistical analysis of original and check assay results. Criteria Count Original < Duplicate Original > Duplicate All samples 43 35 8 81% 19% > 0.75% 35 30 5 86% 14% > 0.75% & <= 1.5% 31 28 3 90% 10% > 1.5% 4 2 2 50% 50% 9.4 TWINNING OF HISTORICAL DRILLHOLES As part of the Stage 3 drilling program in December 2017, Sayona Québec drilled seven diamond core holes for 769.5 m, PQ diameter, to collect 5.5 tonnes of pegmatite material for the pilot plant program. All PQ drillholes were from the same drilling pad as both of Sayona Québec’s historical holes; PQ holes were sampled metre by metre (full core). The diamond core was assayed and stage-crushed to the appropriate particle size to feed the pilot plant. The samples were processed and assayed at SGS Lakefield for lithium using sodium peroxide fusion, followed by ICP-OES analysis and whole rock analysis (major elements) using X-ray fluorescence (XRF76V) with majors by lithium metaborate fusion. No internal or laboratory QA/QC was applied for the metallurgical sampling as the aim of the analysis was to estimate composition of the two composite pilot plant feed samples, which represented Years 0 to 5 and Years 5+ of the operation. Comparisons between holes were performed, when possible, based upon holes that were collared and positioned, i.e., azimuths and dip, close enough to the original. Table 9-2 shows the results obtained. Authier Lithium DFS Technical Report Summary – Quebec, Canada 124 Table 9-2 – Comparative results for metallurgical pilot plant drillholes vs. original drillholes - Authier Property. Drillhole From (m) To (m) Thickness (m) Grade (% Li2O) Relative Difference (%) AL-17-32 13 78 65 1.29 4.55 AL-16-01 12 74 62 1.35 AL-17-33 53 99 46 1.28 8.14 AL-16-02 50 99 49 1.18 AL-17-34 56 91 35 1.09 15.05 AL-14 49.38 99.36 49.98 1.27 AL-17-35 4.7 42 37.3 0.98 NC (1) AL-12-09 6 33 27 0.85 AL-17-36 67 81 14 1.47 NC (2) 83 95 12 1.57 104 112 8 1.49 AL-10-01 72 112.5 40.5 1.38 AL-17-37 139 146 7 1.15 NC (3) 151 167 16 0.54 AL-16-11 135 175 40 1.39 AL-17-38 34 52 18 0.96 NC (4) 54 60 6 1.32 63 65 2 1.30 R-93-06 36.58 70.10 33.52 1.12 Table 9-2 shows a good correlation between AL-17-32 vs. AL-16-01 and AL-17-33 vs. AL-16-02, which were collared less than 5 m from original and drilled at the same azimuth and dip. The correlation is fair for AL- 17-34 vs. AL-14. Note that NC means no comparison done due to technical or operational differences: • NC (1): No comparison was made between AL-17-35 and AL-12-09 because both holes were drilled at different azimuths and dips; • NC (2): No comparison was made between AL-17-36 and AL-10-01 because 2 m portions of pegmatite cores from AL-17-36 were used during the pilot plant setup and assays were not reported for such intervals; • NC (3): No comparisons were made between AL-17-37 and AL-16-11 because 2 m portions of pegmatite cores from AL-17-37 were used during pilot plant setup and assays were not reported for such intervals; • NC (4): No comparison was made between AL-17-38 and R-93-06 because 2 m portions of pegmatite cores from AL-17-38 were used during pilot plant setup and assays were not reported for such intervals.

Authier Lithium DFS Technical Report Summary – Quebec, Canada 125 Considering the grade and geometry variability observed in the Authier pegmatite intrusive body, the results of the metallurgical drillhole program showed a fair to good correlation between the metallurgical versus recent and historical drillholes. Sayona Québec has not conducted twinning of historical drillholes as part of the Phase 1 (2016) and Phase 2 (2017) drilling programs. Before Sayona Québec’s acquisition, and to validate the historical drilling data, SGS Geological Services recommended that Glen Eagle complete twin holes of selected historical drillholes from the AL-XX and the R-93-XX series. In 2010, following SGS Geological Services recommendations, Glen Eagle completed three twin drillholes to verify the historical R-93-XX drillholes series. Holes R-93-01, R-93-13, and R-93-25 were twinned with holes Al-10-11, AL-10-06 and Al-10-01, respectively. Hole AL-10-11 intersected the mineralized interval at a distance varying between 1 m and 5 m from hole R-93-01. Hole AL-10-11 returned 0.87% Li2O over 35.90 m, which is 3.68% lower compared to the original mineralized interval of 0.90% Li2O over the 43.28 m intersected in hole R-93-01. Hole AL-10-06 intersected two mineralized intervals at a distance varying between 4 m and 4.5 m from hole R-93-13. The first mineralized interval intersected by hole AL-10-13 returned 1.17% Li2O over 8.55 m, which is 9.36% lower compared to the original mineralized interval of 1.29% Li2O over the 8.08 m intersected in hole R-93-13. The second mineralized interval intersected by hole AL-10-06 returned 0.83% Li2O over 8.30 m, which is 27.31% lower compared to the original mineralized interval of 1.14% Li2O over 9.75 m that was intersected in hole R-93-13. Hole AL-10-01 intersected the mineralized interval at a distance less than 7.5 m from hole R-93-25. Hole AL-10-01 returned 1.35% Li2O over 51.25 m, which is 8.46% higher compared to the original mineralized interval of 1.25% Li2O over the 49.38 m that was intersected in hole R-93-25. Due to localization difficulties encountered in the field by Sayona Québec, the twin drillholes planned for the AL-XX drillhole series were collared too far, more than 15-20 m, from the historical holes, to be considered valid for data verification. After reviewing all the drill data, two holes, one by the recent Glen Eagle drilling (Al-10-15) and one from the R93-XX series (R93-12), intersected mineral intervals near enough holes from the AL-XX series to be considered valid for data verification. Hole AL-10-15 intersected a mineralized interval at a distance less than 4.5 m from hole AL-18. Hole AL- 10-15 returned 1.20% Li2O over 15.4 m, which is 75.3% higher compared to the original mineralized interval of 0.69% Li2O over 15.24 m that was intersected in hole AL-18. Hole R-93-12 intersected a mineralized interval at a distance less than 5 m from hole AL-24. Hole R-93-12 returned 0.81% Li2O over 12.19 m, which is 11.8% lower compared to the original mineralized interval of 0.92% Li2O over 11.52 m that was intersected in hole AL-24. Authier Lithium DFS Technical Report Summary – Quebec, Canada 126 Hole AL-12-09 intersected one mineralized interval at a distance varying between 1.5 m and 5 m from hole AL-16. The mineralized interval intersected by hole AL-12-19 returned 0.81% Li2O over 27 m, which is 22.1% lower compared to the original mineralized interval of 1.01% Li2O over the 27.4 m that was intersected in hole AL-16 (Figure 9-2). Figure 9-2 – Oblique view showing results for twin holes Al-16 and AL-12-09. Hole AL-12-14 intersected one mineralized interval at an average distance of less than 8.5 m from hole AL-19. The mineralized interval intersected by hole AL-12-19 returned 0.74% Li2O over 36 m, which is 43.4% lower compared to the original mineralized interval of 1.15% Li2O over the 35.1 m that was intersected in hole AL-19.

Authier Lithium DFS Technical Report Summary – Quebec, Canada 127 Figure 9-3 – Oblique view showing results for twin holes Al-19 and AL-12-14. Considering the grade and geometry variability observed in the Authier pegmatite intrusive body, the results of the twin drillhole program showed a fair to good correlation between the recent and historical drillholes, except between historical R-93-13 and AL-10-06 as well as historical AL-19 and AL-12-14, lower mineralized intercepts of which returned Li2O grade differences in excess of 30% and 40% differences, respectively. No systematic analytical bias was outlined. Based upon the results of the twin hole drill program, SGS Geological Services considers the historical drill data to be of acceptable quality to be included in the final drillhole database of the Project. Table 9-3 summarizes the overall results of the 2010-2012 twin hole drilling program. Authier Lithium DFS Technical Report Summary – Quebec, Canada 128 Table 9-3 – Comparative results from the 2010-2012 twin hole drill program at Authier. Hole ID From To Length Weighted Average Li2O (%) Relative Percent Difference (%) R-93-01 35.97 79.25 43.28 0.90 3.75 AI-10-11 38.55 74.45 35.90 0.87 R-93-13 7.16 15.24 8.08 1.29 9.82 AI-10-06 6.55 15.10 8.55 1.17 R-93-13 31.09 40.84 9.75 1.14 31.63 AI-10-06 32.70 41.00 8.30 0.83 R-93-25 76.20 125.58 49.38 1.25 8.11 AI-10-01 72.00 123.25 51.25 1.35 AL-18 96.62 111.86 15.24 0.69 54.72 AI-10-15 81.00 96.40 15.40 1.20 AI-24 79.34 90.86 11.52 0.92 12.59 R-93-12 96.93 109.12 12.19 0.81 AL-16 6.10 33.53 27.43 1.01 22.10 AL-12-09 135.64 170.69 27.00 0.81 AL-19 135.64 170.69 35.05 1.15 43.40 AL-12-14 132.00 168.00 36.00 0.74 The final database includes the historical and the 2010-2012 drilling data compiled from the Glen Eagle exploration programs. Table 9-3 lists the data contained in the final drillhole database. Although the sign test clearly showed a bias at a 95% confidence level with a 7.9% difference in favour of the duplicate (SGS) Li2O results, SGS Geological Services is of the opinion that the final drillhole database is adequate to support mineral resources estimation.

Authier Lithium DFS Technical Report Summary – Quebec, Canada 129 10 MINERAL PROCESSING AND METALLURGICAL TESTING 10.1 INITIAL CHARACTERIZATION AND SCOPING STUDIES 10.1.1 Overview Initial testwork on the Authier Deposit was undertaken by the Québec Department of Natural Resources in 1969. Flotation tests were carried out on a bulk composite sample prepared from split drill core. Results confirmed the ore was amenable to concentration by flotation and the tests produced spodumene concentrates assaying between 5.13% and 5.81% Li2O with lithium recovery ranging from 67% to 82%. In 1991, Raymor Resources Ltd. conducted bench-scale metallurgical testing on mineralized pegmatite samples from the Property. An 18.3 kg sample grading 1.66% Li2O was tested at the Centre de Recherche Minérale (CRM, now COREM) in Québec City. The testwork produced a spodumene concentrate grading 6.30% Li2O with lithium recovery of 73%. In 1997, Raymor Resources Ltd. completed testing at CRM on two samples from a pegmatite dyke on the Property: 1) 18-t sample grading 1.32% Li2O; and 2) 12-t sample grading 1.10% Li2O. Metallurgical testing on the first sample produced a concentrate grading 5.61% Li2O with 61% lithium recovery. Magnetic separation was used in the testing to remove iron-bearing silicate minerals. The second sample returned a final concentrate grade of 5.16% Li2O with 58% recovery. In 1999, metallurgical testing was conducted at COREM on a 40-t mineralized pegmatite sample from the main intrusion at the Authier Property. Figure 10-1 shows the test pit from which the sample was taken. The testing program was conducted as part of a pre-feasibility study. Results showed spodumene concentrate grades ranging from 5.78% to 5.89% Li2O with lithium recoveries ranging from 68% to 70% from a sample with head grade of 1.14% Li2O. A sample with head grade of 1.35% Li2O produced a 5.96% Li2O concentrate at 75% recovery. Authier Lithium DFS Technical Report Summary – Quebec, Canada 130 Figure 10-1 – Authier bulk test pit. Table 10-1 gives an overview of recent metallurgical testing programs operated by SGS Canada Inc. at their facilities in Lakefield, Ontario. Table 10-1 – Recent Authier metallurgical testing programs. Year Owner Sample Size Testwork 2012 Glen Eagle 270 kg Flotation testing 2016 Sayona Québec 430 kg HLS and flotation testing 2017 52 kg HLS and flotation testing 66 kg sample HLS and flotation testing 120 kg sample HLS 2018 5 t sample Pilot plant program 2019 Pilot plant sample Batch optimization testing Figure 10-2 shows the locations in The Deposit from which the historical metallurgical testing samples were taken.

Authier Lithium DFS Technical Report Summary – Quebec, Canada 131 Figure 10-2 – Drillhole locations for the various metallurgical testing samples. Glen Eagle Resources Inc. undertook a testing program in 2012 on a 270 kg sample as part of a Preliminary Economic Assessment (PEA) of the Project. Batch testwork produced a concentrate grading 6.09% Li2O with 88% lithium recovery after two stages of cleaning (without mica pre-flotation). After four stages of cleaning and passing the concentrate through a Wet High-Intensity Magnetic Separator (WHIMS) at 15,000 gauss a concentrate grading 6.44% Li2O was produced with 85% lithium recovery. In 2016, Sayona completed a metallurgical testing program using drill core from 23 historical holes totalling 430 kg, representing the entire Deposit geometry (including 5% dilution). Concentrate grades varied from 5.38% to 6.05% Li2O with a lithium recovery ranging from 71% to 79%. Results indicated that ore dilution had a negative impact on flotation performance. In 2017, two representative samples were prepared, and flotation testing was undertaken to examine the impact of the presence of dilution and the use of site water. Testwork demonstrated the ability to produce concentrate grading 6.0% Li2O with lithium recovery greater than 80%. The majority of the testing for the Project has focused on spodumene recovery by froth flotation. In 2016- 17, Sayona performed several heavy-liquid separation (HLS) test programs to assess the viability of producing a coarse spodumene concentrate using dense media. Testwork and studies were undertaken and showed that dense media separation (DMS) was not a viable process option for the Authier Deposit. Authier Lithium DFS Technical Report Summary – Quebec, Canada 132 A pilot plant testwork program was undertaken in 2018 at SGS Canada Inc. as part of the feasibility study. The aim of the testwork was to confirm the spodumene concentration flowsheet, operational parameters, efficiencies, and reagent consumptions. Roughly 5 t of drill core was used to prepare two composite samples representing: 1) years 0-5, and 2) years 5+ of operation. Testwork included batch and locked- cycle tests and continuous piloting. In late 2018, an optimization batch testwork program was undertaken at SGS. Testing was performed using sub-samples from the two pilot plant composites. Tests examined the effect of spodumene conditioning, and spodumene collector optimization. 10.2 METALLURGICAL LABORATORY TEST-WORK PROGRAM AND METALLURGICAL RESULTS 10.2.1 Glen Eagle Resources Inc. Testwork (2012) In 2012, Glen Eagle Resources Inc. operated a testwork program at SGS Canada Inc. in Lakefield, Ontario on samples from the Authier Deposit. A 270 kg representative sample was prepared from three drillholes (DH) along the strike length of the Deposit. The average grade of the sample was 1.23% Li2O (Table 10-2), which was higher than the 1.02% Li2O resource grade outlined in the 2012 Glen Eagle 43-101 PEA. Table 10-2 – Feed sample chemical analysis (2012 testing). Analysis Grade (%) Li 0.57 Li2O 1.23 SiO2 74.90 Al2O3 15.80 Na2O 4.22 K2O 3.08 Fe2O3 0.59 CaO 0.18 MgO 0.07 P2O5 0.02 MnO 0.10 Cr2O3 0.02 LOI 0.40 Mineralogical analysis (Table 10-3) showed major components of the sample to be albite (37%), quartz (27%), microcline (16%), spodumene (15%), and muscovite (5%).

Authier Lithium DFS Technical Report Summary – Quebec, Canada 133 Table 10-3 – Mineralogical analysis of the feed sample. Mineral Weight (%) Albite 37.20 Quartz 26.50 Microcline 16.20 Spodumene 14.90 Muscovite 4.80 Total 99.6 10.2.1.1 Grindability Bond rod mill work index (RWI) and Bond ball mill work index (BWI) were determined to be 12.3 kWh/t and 15.6 kWh/t, respectively (Table 10-4). BWI was tested using a closing screen size of 150 μm. Table 10-4 – Grindability results (2012). Sample RWI (kWh/t) BWI (kWh/t) 2012 Composite 12.30 15.60 10.2.1.2 Bench-scale Flotation Tests SGS completed ten batch flotation tests based on a conventional spodumene flotation flowsheet. Variables investigated during the program included grind size, collector types, and the use of mica pre- flotation. Stage-grinding and scrubbing were performed in a Denver flotation cell at pH 11 (using NaOH) and in the presence of lignin sulphonate (D618). De-sliming was by settling and decantation. Final concentrate was passed through a WHIMS for upgrading and iron rejection. The testwork showed that a 6.0% Li2O concentrate could be produced with lithium recovery greater than 80%. Test F8 showed the best flotation performance (conditions shown in Table 10-5) and resulted in the production of a spodumene concentrate grading 6.09% Li2O (and 1.57% Fe2O3) with 88% lithium recovery after two cleaning stages without the use of mica pre-flotation. Authier Lithium DFS Technical Report Summary – Quebec, Canada 134 Table 10-5 – Test F8 test conditions (2012). Test Objective Grind (P100) Reagent Dosage (g/t) Fuel Oil NaOH Na2CO3 D618 FA-2 F8 Test without mica flotation -210 µm 0 275 50 450 675 Table 10-6 – Test F8 bench-scale flotation results. Product Weight (%) Assay (%) Dist. (%) Li2O Fe2O3 Li Fe Non-mag final concentrate 16.1 6.44 1.06 85 24 4th Cleaner concentrate 16.7 6.29 1.58 86 37 3rd Cleaner concentrate 17.1 6.21 1.58 87 38 2nd Cleaner concentrate 17.6 6.09 1.57 88 39 1st Cleaner concentrate 18.4 5.89 1.57 89 40 Rougher concentrate 18.7 5.81 1.56 89 41 Rougher and scav. conc 21.8 5.07 1.52 90 46 Optimal flotation performance was achieved with stage-grinding to -150 μm and without mica pre- flotation. De-sliming was undertaken using dispersant at pH 11. Spodumene flotation was performed at pH 8 using a fatty acid collector. 10.3 SAYONA QUÉBEC METALLURGICAL TESTING (2016) In 2016, nine composite samples weighing 358 kg were shipped to SGS Canada Inc. in Lakefield, Ontario for metallurgical testing. The composites were prepared using historical drill core samples. Drill core was selected to produce a sample with similar average grade and mineralogy to the Deposit as a whole. In addition, 5% ore dilution from the hanging wall was added. 10.3.1 Feed Characterization Sample AMET1 was the main composite tested and the remaining eight composites were considered variability samples. The head assays of the nine composite samples are shown in Table 10-7. Head grades varied between 0.88% Li2O to 1.12% Li2O.

Authier Lithium DFS Technical Report Summary – Quebec, Canada 135 Table 10-7 – Composite sample assays (2016). AMET Assay (%) Li Li2O SiO2 Al2O3 Fe2O3 MgO CaO Na2O K2O P2O5 MnO LOI Sum 1 0.52 1.12 73.90 15.70 0.81 0.62 0.34 4.42 2.83 0.03 0.11 0.67 99.4 2 0.44 0.95 72.20 15.00 0.83 0.35 0.32 4.73 2.85 0.03 0.09 0.47 96.9 3 0.41 0.88 74.20 15.60 0.59 0.19 0.21 4.88 3.13 0.02 0.09 0.57 99.5 4 0.51 1.10 72.60 15.30 1.20 1.25 0.49 4.06 2.89 0.03 0.11 0.80 98.8 5 0.51 1.10 73.60 15.30 0.95 0.98 0.47 4.17 3.06 0.02 0.10 0.70 99.4 6 0.49 1.05 73.30 15.50 0.91 0.89 0.42 4.34 3.04 0.04 0.10 0.68 99.2 7 0.52 1.12 71.20 15.00 0.67 0.21 0.17 4.50 2.80 0.03 0.09 0.50 95.2 9 0.48 1.03 73.50 15.10 1.03 1.09 0.42 3.96 3.08 0.02 0.09 0.83 99.1 10 0.41 0.88 74.00 15.30 0.66 0.19 0.20 4.48 3.15 0.03 0.09 0.60 98.7 Mineralogy of the nine composite samples is shown in Table 10-8. Major components of the samples were plagioclase, quartz, K-feldspar, spodumene and muscovite. Spodumene content in the AMET1 sample was 13.3% and ranged from 9.6% to 13.7% in the variability samples. Minor quantities of several iron-bearing silicate minerals were detected (e.g., biotite, amphibole). Table 10-8 – Mineralogical analysis (2016). Mineral AMET Sample No. 1 2 3 4 5 6 7 9 10 M in e ra l C o m p o si ti o n ( % ) Spodumene 13.30 11.00 9.60 12.40 11.10 11.80 13.70 13.40 10.80 Quartz 24.80 27.40 24.80 27.30 25.40 25.50 26.70 28.50 27.40 Plagioclase 38.50 38.80 40.70 34.20 35.90 37.50 37.80 33.20 38.30 K-Feldspar 18.60 18.70 21.50 17.90 21.00 18.60 19.10 19.20 20.60 Muscovite 1.88 1.77 1.58 2.49 1.83 1.96 1.68 2.19 1.84 Biotite 1.02 0.55 0.44 0.69 0.55 2.08 0.33 0.12 0.30 Tourmaline 0.29 0.22 0.34 0.28 0.24 0.22 0.26 0.20 0.13 Amphibole 1.29 1.11 0.48 3.21 2.77 2.12 0.06 2.39 0.43 Chlorite 0.18 0.10 0.21 1.34 0.92 0.06 0.18 0.64 0.14 Other 0.23 0.28 0.31 0.24 0.21 0.17 0.11 0.22 0.10 Total 100 100 100 100 100 100 100 100 100 10.3.2 Grindability Grindability test results are shown in Table 10-9. Bond abrasion tests were performed on five samples. Abrasion index (AI) ranged from 0.968 g to 1.066 g and fell in at least the 98th percentile in the SGS database which classified the composite samples as very abrasive. BWI was performed on four samples and ranged from 14.2 kWh/t to 14.9 kWh/t classifying the composites as hard. Authier Lithium DFS Technical Report Summary – Quebec, Canada 136 Table 10-9 – Grindability results (2016). Sample AI (g) BWI (kWh/t) AMET1 1.03 14.20 AMET3 1.01 - AMET4 - 14.80 AMET6 1.07 14.50 AMET9 0.97 14.90 AMET10 1.03 - 10.3.3 Heavy-liquid Separation Bench-scale HLS tests were performed on five of the AMET samples. Samples were stage-crushed, and the -6.4 mm / +0.86 mm size fraction was tested. The results indicated that DMS was not a viable option. Using a heavy liquid with sg of 2.95 g/cm3, the testwork was unable to produce a 6.0% Li2O concentrate (the highest grade achieved was 4.7% Li2O). For upgrading tests (separation at 2.7 g/cm3), results suggest that it was possible to reject more than 40% of the feed mass with lithium losses of between 6% and 15%. 10.3.4 Bench-scale Flotation Tests Testwork was undertaken on composite sample AMET1. Flotation charges were prepared with grind sizes ranging from 100% passing 300 µm to 75 µm. The results showed optimal grind size to be 100% passing 150 µm. Magnetic separation was performed ahead of flotation in a rougher (5,000 gauss) – scavenger (10,000 gauss) arrangement to reject iron-bearing silicate minerals. Results showed less than 1.5% lithium losses to the magnetic concentrate. Table 10-11 summarizes the optimized flotation test results for AMET1 sample. Bench-scale results indicated that achieving a concentrate grade of 6.0% Li2O was difficult and attributed to poor spodumene liberation (68.6% in case of the AMET1 composite). Results show that test F8 produced a concentrate grading 6.07% Li2O with 71% lithium recovery. Test F15 achieved a concentrate grade of 5.88% Li2O with 80% recovery. Both of the tests were operated with mica flotation. Based on the results, a locked-cycle test was operated (based on the F15 conditions) and resulted in the production of a 5.65% Li2O concentrate with lithium recovery of 82%.

Authier Lithium DFS Technical Report Summary – Quebec, Canada 137 Table 10-10 – Summary of batch test conditions for tests F8 and F15 on AMET1 sample. Test Grind Dosage (g/t) (μm) H2SO4 NaOH Na2CO3 Armac C F100 FA-2 Na Silicate F8 212 1,200 250 56 75 400 575 50 F15 150 0 125 338 50 400 580 0 Table 10-11 – Summary of batch flotation tests F8 and F15 on AMET1 sample. Test Assay (% Li2O) Rec. (%) Observations / Comments F8 6.07 71.1 Mica flotation with Armac C at pH ~2.5, coarser grind produced >6.0% Li2O. F15 5.88 80.3 Mica flotation with Armac C at pH 10.5. Conc. grade 5.9% Li2O, rec. >80%. Testwork results showed spodumene liberation did not exceed 74% in any size fraction. The optimal grind size was found to be 100% passing 150 μm and achieving high-grade spodumene concentrate (>6.0% Li2O) at high recoveries (>80%) was challenging and attributed to poor spodumene liberation. 10.4 SAYONA QUÉBEC METALLURGICAL TEST PROGRAMS (2017) Several metallurgical testing programs were undertaken at SGS Canada Inc. in Lakefield, Ontario during 2017 to investigate: • The effect of head grade and dilution on flotation performance (August 2017); • Impact of grind size and the use of site water on flotation performance (October 2017); and • HLS testing (October and December 2017). 10.4.1 Bench-scale Flotation (August 2017) Two composite samples were prepared from a total of 52 kg of drill core from four holes distributed about the ore body. The sample intervals were selected to provide representative: 1) grade (as compared to the resource), and 2) grain size domains (as identified in the core logs: coarse, medium, and fine). A high- grade (HG) composite and a low-grade (LG) composite were prepared based on the drill core lithia content. Sub-samples from the HG and LG composites were combined to produce an average composite (AG) grading roughly 1.0% Li2O. Waste (dilution) material was included in certain test samples. Assays for each composite sample are given in Table 10-12. Note the relatively high Fe2O3 content (9.39%) in the waste composite. Authier Lithium DFS Technical Report Summary – Quebec, Canada 138 Table 10-12 – Composite assays for the August 2017 test program. Sample Assay (%) Li Li2O SiO2 Al2O3 Fe2O3 MgO CaO Na2O K2O P2O5 MnO LOI Sum HG 0.71 1.53 74.90 15.30 0.50 0.05 0.15 3.86 2.57 0.02 0.11 0.65 98 LG 0.20 0.43 74.40 15.40 0.60 0.17 0.21 5.98 2.68 0.03 0.10 0.56 100 AG 0.46 0.98 74.70 15.40 0.55 0.11 0.18 4.92 2.63 0.03 0.10 0.60 99 Waste 0.00 0.00 45.60 6.34 9.39 24.50 7.56 0.35 0.02 0.02 0.17 5.66 100 Tests were operated to confirm flotation response at a coarser grind size than previously tested and to demonstrate the impact of head grade and the presence of dilution on metallurgical performance. Tests were undertaken on the HG, LG, and AG samples with grind sizes of 150 um and 180 um. Tests were also operated on AG samples which were diluted with waste rock. Samples were stage-ground to the appropriate grind size and passed through a WHIMS at 5,000 gauss and 12,000 gauss. De-sliming was performed with F100 dispersant at pH 11. Mica flotation employed Aero 3030C collector. Spodumene flotation was undertaken using 630 g/t FA-2 collector with three stages of cleaning. Table 10-13 summarizes the batch results for the August 2017 testwork program. Table 10-13 – August 2017 metallurgical testing – Flotation test results. Test Details Head Conc. Grade (%) Li Rec. (% Li2O) Li2O Fe2O3 (%) F1 HG, 150 um 1.47 6.22 1.75 83.9 F2 HG, 180 um 1.50 6.45 1.87 86.2 F3 LG, 150 um 0.42 5.52 2.21 66.1 F4 LG, 180 um 0.42 5.36 2.59 49.5 F5 AG, 150 um, diluted 0.97 5.41 2.58 79.8 F6 AG, 150 um, undiluted 0.99 6.32 1.75 82.6 F7 AG, 180 um, diluted 0.99 5.43 2.62 78.1 F8 AG, 180 um, undiluted 1.00 6.31 1.84 85.2 Test results indicated that the LG composite was unable to produce 6.0% Li2O concentrate while the HG composite achieved the target grade (6.0% Li2O) and recovery (>80%) with a coarser grind (P100 of 180 µm). All concentrates had relatively high iron content ranging from 1.75% to 2.65% Fe2O3. 10.4.2 Bench-scale Flotation (October 2017) A 66 kg sample was prepared from drill cores to provide a sample with representative grade and grain size as identified in the core logging process: coarse, medium, and fine. The composite assays are shown in

Authier Lithium DFS Technical Report Summary – Quebec, Canada 139 Table 10-14. The composite sample head grade was 1.08% Li2O. HLS and flotation tests were undertaken on the composite sample. Table 10-14 – Composite assays for the October 2017 test program. Sample Assay (%) Li Li2O SiO2 Al2O3 Fe2O3 MgO CaO Na2O K2O MnO Oct. Comp. 0.51 1.08 74.60 15.40 0.70 0.12 0.17 4.26 3.22 0.08 Figure 10-3 shows the grade-recovery curves for the four tests from the October 2017 testing program. All tests were able to produce greater than 6.0% Li2O concentrate at roughly 80% recovery. Tests using site water showed slightly better results than tests using tap water. Authier Lithium DFS Technical Report Summary – Quebec, Canada 140 Figure 10-3 – Grade-recovery curves for the October 2017 testwork. 10.4.3 Heavy Liquid Separation (October 2017) The aim of the October 2017 HLS testing program was to confirm the results obtained in the 2016 program. The feed sample used for testing was the same sample as for the October 2017 bench-scale flotation tests (Table 10-15). Samples were stage-crushed, and the -6.4 mm / +0.86 mm size fraction was tested. There was slight improvement in the HLS results as compared to the 2012 testwork program. Using a heavy liquid with sg of 2.95 produced a concentrate grade of 6.16% Li2O but with low lithium recovery of 13.9% (Table 10-15). The results indicated that DMS was not a viable option for the Project. Table 10-15 – HLS combined sinks results (October 2017). HL SG Weight Assays (%) Dist. (%) (g/cm3) (%) Li2O Fe2O3 Li 3.10 0.8 6.91 1.16 5.0 3.00 1.4 6.66 1.10 8.7 2.95 2.4 6.16 1.08 13.9 2.90 2.8 5.95 1.06 15.4 2.80 8.8 4.56 0.99 37.2 2.70 21.0 3.21 0.88 62.4 2.60 53.3 1.48 0.63 72.7 10.4.4 Heavy Liquid Separation (December 2017) The objective of the December 2017 HLS testing program was to test various size fractions. A 120-kg composite sample was prepared from seven DH across the Authier Deposit. The sample was prepared to reflect the average life-of-mine lithium grade and a representative spodumene grain size across the Deposit. The composite assays are shown in Table 10-16. Table 10-16 – Composite assays for the December 2017 test program. Sample Assay (%) Li Li2O SiO2 Al2O3 Fe2O3 CaO Na2O K2O Composite 0.53 1.14 74.20 15.50 0.69 0.21 4.27 3.22 Historical HLS testwork for the Project examined a top crush size of 6.35 mm. Samples for the current study were crushed to a top size of 6.35 mm, 4.75 mm, and 3.35 mm. Sub-samples of each were screened

Authier Lithium DFS Technical Report Summary – Quebec, Canada 141 at 1,000 µm, 850 µm and 500 µm. Undersize fractions were not tested. The objective was to test finer size fractions to determine if improved separation could be achieved due to increased spodumene liberation. Results showed that concentrates grading >6.0% Li2O could be produced using heavy liquid with an sg of 3.0 g/cm3 with low lithium recoveries ranging from 7% to 13% (extrapolation of the data shows the potential for up to ca. 18% lithium recovery). Tests undertaken using heavy liquid with an sg of 2.7 g/cm3 showed the potential to upgrade flotation feed. Results showed mass pull ranging from 50% to 62% with 88% to 93% lithium recovery (combined screen undersize and HLS sinks). The grade of the flotation feed stream ranged from 1.6% to 2.0% Li2O. The testwork results coupled with an economic analysis indicated that DMS was not a viable option for the Authier Project. 10.5 PILOT PLANT OPERATION 10.5.1 Sayona Québec Pilot Plant Program (2018) A pilot plant testwork program was undertaken at SGS Canada Inc. from December 2017 to May 2018. SGS received a roughly 5-t sample of drill core from the Authier Deposit for testing. The samples were crushed and analysed on a metre-by-metre basis. Two composite samples were prepared to represent 1) Years 0-5 and 2) Years 5+ of operation. The pilot plant feed samples were crushed to 100% passing 3.36 mm. An 80-kg sub-sample from each composite was set aside for batch testing. The testwork program included: feed characterization, grindability tests, batch tests, locked-cycle tests, and continuous pilot plant operation. 10.5.1.1 Feed Characterization Chemical analysis of the two composite pilot plant feed samples is shown in Table 10-17. The head grades of the two composite samples were 1.01% Li2O and 1.03% Li2O, respectively. The only significant differences in chemical composition were slightly elevated concentrations of iron and magnesium in Composite 1. Authier Lithium DFS Technical Report Summary – Quebec, Canada 142 Table 10-17 – Chemical compositions of the pilot plant feed samples. Analysis Composite 1 Composite 2 Years 0-5 Years 5+ Li 0.47 0.48 Li2O 1.01 1.03 SiO2 73.50 74.90 Al2O3 15.60 15.60 Fe2O3 0.79 0.56 MgO 0.39 0.10 CaO 0.25 0.17 Na2O 4.69 4.56 K2O 2.72 2.95 MnO 0.10 0.09 sg 2.71 2.71 Samples of each composite were analyzed by X-ray diffraction (XRD). Results of semi-quantitative mineralogical analysis are shown in Table 10-18. Feldspars, quartz and spodumene are the major constituents in the samples. The presence of hornblende, clinochlore and biotite in Composite 1 correspond to elevated concentrations of iron and magnesium in the sample Table 10-17). Table 10-18 – Semi-quantitative XRD results (Rietveld Analysis). Mineral Composite 1 Composite 2 Years 0-5 Years 5+ (wt %) (wt %) Albite 36.2 33.9 Quartz 31.1 34.8 Spodumene 11.3 9.7 Microcline 9.6 11.0 Muscovite 4.0 9.3 Hornblende 3.4 - Biotite 1.6 1.2 Clinochlore 2.7 - Total 100 100 Grindability Table 10-19 summarizes the grindability testwork results obtained during the pilot plant program. Six drill core samples were selected for variability grindability testing. Bond low-energy impact crushing work index (CWI) ranged from 12.1 kWh/t to 19.5 kWh/t (moderately soft to medium range). Bond BWI was measured for the six aforementioned samples and for the two composite pilot plant feed samples. BWI ranged from 12.7 kWh/t to 15.8 kWh/t with an average of 14.6 kWh/t ranking the samples as moderately

Authier Lithium DFS Technical Report Summary – Quebec, Canada 143 soft to moderately hard. AI ranged from 0.806 g to 1.009 g. The material tested is highly abrasive and fell in the 95-98th percentile in the SGS abrasion index database. Table 10-19 – Summary of grindability results. Sample Hole no. CWI BWI AI (kWh/t) (kWh/t) (g) 1.00 AL-17-034 47-49 m 13.0 12.7 0.9 2.00 AL-17-034 54-56 m 14.7 14.5 0.8 3.00 AL-17-037 167-171 m 12.1 15.8 1.0 4.00 AL-17-036 81-83 m 15.8 15.8 1.0 5.00 AL-17-036 102-104 m 19.5 15.2 1.0 6.00 AL-17-038 53-54 m 15.0 14.9 1.0 PP1 Composite 1 - Yr 0-5 - 13.7 - PP2 Composite 2 - Yr 5+ - 14.1 - Bench-scale Flotation Tests Over forty bench-scale batch tests were operated to confirm and optimize the flowsheet and reagent schemes prior to piloting. Batch tests were undertaken on each composite and included: stage-grinding, magnetic separation (5,000 gauss and 10,000 gauss), de-sliming, mica flotation, and spodumene flotation. Initial batch tests focused on replicating the results from October 2017 testwork. The flowsheet was modified as the testwork program progressed to incorporate successful variations to optimize the flowsheet. The optimized flowsheet, based on tests F37 to F43, is presented in Figure 10-4. Authier Lithium DFS Technical Report Summary – Quebec, Canada 144 Figure 10-4 – Optimized batch flowsheet. For the optimized tests, sub-samples of Composites 1 or 2 were stage-ground to 100% passing 180 µm. The stage-ground feed was scrubbed and de-slimed by decantation. The de-slimed material was processed through a lab-scale WHIMS at 5,000 gauss and 10,000 gauss. Mica flotation was undertaken on the non-magnetic fraction. Rougher and scavenger flotation was undertaken using Armac T collector. The mica scavenger tailings were scrubbed at high density, de-slimed, and conditioned at a pulp density of roughly 65% w/w solids with Sylfat FA-2 spodumene collector. Rougher and scavenger flotation were undertaken with, typically, three stages of cleaning. Reagent dosages for the optimized batch tests operated on Composite 1 or Composite 2 are shown in Table 10-20. Armac T dosage ranged from 100 g/t to 110 g/t and FA-2 dosage ranged from 780 g/t to 1,080 g/t. Table 10-20: Reagent dosages for selected batch tests.

Authier Lithium DFS Technical Report Summary – Quebec, Canada 145 Table 10-20 – Reagent dosages for selected batch tests. Feed Test Dosage (g/t) NaOH Na2CO3 Armac T F100 FA-2 Na Silicate Composite 1 F34 250 300 110 250 1,080 0 F37 388 150 110 250 1,080 0 F40 312 125 110 250 780 0 Composite 2 F30 275 175 100 250 1,080 25 F42 375 162 110 250 980 0 F43 450 512 110 250 980 0 Figure 10-5 shows the grade-recovery curves for selected batch tests. The results show that 80% lithium recovery was achieved at a concentrate grade of 6.0% Li2O for both composite samples. Figure 10-5 – Batch test grade-recovery curves. Table 10-21 shows the detailed results for the optimized batch tests. Authier Lithium DFS Technical Report Summary – Quebec, Canada 146 Table 10-21 – Selected batch test results for Composite 1 and Composite 2. Test No. Combined Weight Assays (%) Distribution (%) Objective Product g % Li Li2O SiO2 Al2O3 K2O Na2O CaO MgO MnO P2O5 Fe2O3 Li SiO2 Al2O3 K2O Na2O CaO MgO MnO P2O5 Fe2O3 F34 (Comp 1) 3rd Li Con 267.4 13.6 2.77 5.96 63.7 24.7 0.87 0.80 0.38 0.65 0.16 0.05 1.65 80.4 11.7 21.3 4.4 2.3 12.2 21.1 18.7 32.4 24.9 Studying the Effect of Higher Temp in Conditioning Li 2nd Cl Con 280.1 14.2 2.71 5.84 63.9 24.5 0.94 0.89 0.37 0.64 0.16 0.05 1.63 82.5 12.3 22.1 4.9 2.7 12.5 21.9 19.2 33.0 25.8 Li 1st Cl Con 296.9 15.0 2.62 5.63 64.3 24.2 1.04 1.06 0.36 0.63 0.15 0.05 1.59 84.4 13.1 23.1 5.8 3.4 12.9 22.8 19.8 33.9 26.6 Li Ro Con 348.0 17.7 2.30 4.95 65.6 22.9 1.31 1.62 0.34 0.58 0.14 0.04 1.43 87.0 15.7 25.7 8.6 6.0 14.1 24.6 20.9 36.4 28.1 Li Ro+Sc Con 379.0 19.2 2.14 4.62 66.3 22.3 1.43 1.89 0.33 0.56 0.13 0.04 1.35 88.2 17.3 27.3 10.2 7.7 15.0 25.6 21.5 37.1 28.9 Mica Con 58.0 2.9 0.26 0.56 58.4 23.6 6.80 2.62 0.22 1.59 0.12 0.03 2.67 1.6 2.3 4.4 7.4 1.6 1.5 11.2 3.1 4.2 8.8 Mica Ro+Sc Con 122.3 6.2 0.23 0.50 63.9 20.0 5.62 3.50 0.30 1.62 0.09 0.05 2.20 3.1 5.4 7.9 12.9 4.6 4.5 24.0 4.7 13.6 15.2 Li Ro Tail 1,306.0 66.2 0.02 0.04 78.2 13.3 2.76 5.76 0.17 0.05 0.01 0.01 0.13 2.8 70.2 56.1 67.6 80.4 26.9 7.2 6.2 31.7 9.5 Li Ro+Sc Tail 1,275.0 64.6 0.01 0.03 78.3 13.3 2.76 5.78 0.17 0.04 0.01 0.01 0.12 1.7 68.7 54.6 66.0 78.7 26.0 6.2 5.6 30.9 8.6 10A Mags Con 36.0 1.8 0.62 1.32 48.2 17.5 2.05 1.34 1.24 5.60 3.99 0.04 16.14 2.4 1.2 2.0 1.4 0.5 5.3 24.1 61.8 3.4 32.3 5A Mags Con 16.0 0.8 0.50 1.08 47.9 16.7 1.39 1.59 0.86 3.18 6.07 0.04 20.20 0.9 0.5 0.9 0.4 0.3 1.6 6.2 42.4 1.6 18.2 F34 Total Slimes 161.2 8.2 0.27 0.58 67.4 15.8 3.16 4.95 2.55 1.02 0.09 0.04 1.64 4.7 7.5 8.2 9.6 8.5 49.2 20.1 6.3 15.0 15.0 Head (calc.) 1,973.0 100.0 0.47 1.00 73.7 15.7 2.70 4.74 0.42 0.42 0.12 0.02 0.90 100.0 100.0 100.0 100.0 100.0 100.0 100.0 100.0 100.0 100.0 Head (Dir.) 0.47 1.01 73.5 15.6 2.72 4.69 0.25 0.39 0.10 0.03 0.79 F37 (Comp 1) 3rd Li Con 257.1 13.0 2.86 6.16 63.3 24.6 0.88 0.75 0.36 0.76 0.18 0.05 1.61 77.7 11.1 20.3 4.2 2.0 9.4 23.7 21.3 22.6 24.6 Armac T in mica, and higher density in conditioning Li 2nd Cl Con 270.8 13.6 2.80 6.04 63.5 24.4 0.95 0.83 0.35 0.75 0.18 0.05 1.60 80.2 11.8 21.2 4.8 2.4 9.7 24.8 21.9 23.1 25.7 Li 1st Cl Con 286.3 14.4 2.71 5.84 63.8 24.1 1.05 0.97 0.34 0.74 0.17 0.05 1.57 82.1 12.5 22.2 5.6 2.9 9.9 25.8 22.4 23.7 26.7 Li Ro Con 347.0 17.5 2.31 4.97 65.6 22.6 1.37 1.64 0.31 0.66 0.14 0.04 1.36 84.7 15.6 25.2 8.9 6.0 10.9 27.7 23.0 25.8 28.1 Li Ro+Sc Con 375.0 18.9 2.19 4.72 66.2 22.1 1.47 1.85 0.30 0.63 0.14 0.04 1.31 86.8 17.0 26.7 10.3 7.3 11.5 28.6 23.6 26.8 29.1 Mica Ro Con 42.0 2.1 0.28 0.60 53.2 18.6 6.09 2.50 0.31 1.67 0.10 0.06 2.18 1.2 1.5 2.5 4.8 1.1 1.3 8.5 1.9 4.6 5.5 Mica Ro+Sc Con 79.2 4.0 0.28 0.59 45.2 16.1 4.13 1.78 0.67 3.54 0.86 0.05 7.21 2.3 2.5 4.1 6.1 1.5 5.4 34.0 31.3 6.6 34.0 Li Ro Tail 1,337.0 67.4 0.03 0.07 83.0 14.5 2.96 6.16 0.48 0.09 0.01 0.02 0.16 4.3 75.9 62.2 73.8 87.1 65.8 14.7 8.8 52.5 13.0 Li Ro Scav Tail 1,309.0 66.0 0.02 0.03 6.3 1.4 0.24 0.47 0.36 0.06 0.00 0.00 0.08 2.2 5.7 5.8 5.8 6.6 47.2 9.9 2.8 6.5 6.0

Authier Lithium DFS Technical Report Summary – Quebec, Canada 147 Test No. Combined Weight Assays (%) Distribution (%) Objective Product g % Li Li2O SiO2 Al2O3 K2O Na2O CaO MgO MnO P2O5 Fe2O3 Li SiO2 Al2O3 K2O Na2O CaO MgO MnO P2O5 Fe2O3 10A Mags 50.0 2.5 0.62 1.33 88.1 22.6 4.04 5.83 3.06 2.59 1.46 0.04 5.70 3.3 3.0 3.6 3.8 3.1 15.7 15.8 33.9 3.7 17.1 5A Mags 22.0 1.1 0.61 1.31 146.6 35.3 7.30 10.93 6.35 2.67 0.18 0.07 4.42 1.4 2.2 2.4 2.9 2.5 13.9 7.0 1.8 2.6 5.7 Total Slimes 170.8 8.6 0.30 0.64 66.9 15.1 2.76 5.02 3.52 0.82 0.06 0.03 1.15 5.4 7.8 8.3 8.8 9.1 61.1 16.9 4.6 9.0 11.6 Head (calc.) 1,984.0 100.0 0.48 1.03 73.7 15.7 2.70 4.77 0.50 0.42 0.11 0.03 0.85 100.0 100.0 100.0 100.0 100.0 100.0 100.0 100.0 100.0 100.0 Head (Dir.) 0.47 1.01 73.5 15.6 2.72 4.69 0.25 0.39 0.10 0.03 0.79 F40 (Comp 1) 3rd Li Con 265.7 13.4 2.80 6.03 64.8 24.8 0.86 0.82 0.30 0.42 0.13 0.06 1.36 78.8 12.0 21.4 4.3 2.3 10.7 13.6 16.0 27.9 20.3 600 g/t Collector Dosage Li 2nd Cl Con 273.3 13.8 2.76 5.94 65.0 24.6 0.91 0.89 0.30 0.42 0.13 0.06 1.35 79.8 12.3 21.9 4.6 2.6 10.9 13.9 16.3 28.1 20.7 Li 1st Cl Con 287.8 14.5 2.67 5.74 65.3 24.3 0.99 1.04 0.29 0.41 0.13 0.06 1.32 81.3 13.1 22.7 5.4 3.2 11.2 14.5 16.7 28.9 21.3 Li Ro Con 336.0 17.0 2.33 5.03 66.7 23.0 1.24 1.64 0.27 0.38 0.11 0.05 1.19 83.1 15.6 25.1 7.8 5.9 12.3 15.6 17.1 30.6 22.3 Li Ro + Sc Con 383.0 19.3 2.10 4.52 67.7 22.0 1.43 2.03 0.26 0.37 0.10 0.05 1.10 85.2 18.0 27.4 10.2 8.3 13.5 17.1 17.8 32.2 23.7 Mica Ro Con 63.0 3.2 0.23 0.50 72.3 19.5 6.34 3.97 0.31 1.65 0.08 0.07 1.82 1.5 3.2 4.0 7.5 2.7 2.7 12.7 2.2 7.2 6.5 Mica Ro+Sc Con 131.8 6.7 0.23 0.50 44.2 12.7 3.54 2.17 0.42 2.13 0.21 0.04 4.05 3.2 4.1 5.4 8.8 3.0 7.4 34.2 12.6 9.0 30.0 Li Ro Tail 1,278.0 64.6 0.03 0.06 77.2 13.1 2.67 5.85 0.31 0.07 0.01 0.02 0.14 3.6 68.6 54.6 64.0 79.8 53.5 11.3 6.8 46.2 9.7 Li Ro+Sc Tail 1,232.0 62.2 0.01 0.03 3.3 0.7 0.12 0.25 0.18 0.04 0.00 0.00 0.04 1.6 2.8 3.0 2.8 3.2 30.4 5.3 1.1 3.2 2.8 10A Mags 50.0 2.5 0.78 1.67 193.0 48.7 8.96 13.07 3.57 4.73 2.60 0.09 10.48 4.1 6.7 7.9 8.4 7.0 23.9 28.8 60.4 8.1 29.4 5A Mags 24.0 1.2 0.77 1.66 345.2 81.5 16.66 25.37 6.29 4.93 0.40 0.15 9.71 2.0 5.9 6.5 7.6 6.6 20.5 14.6 4.6 6.4 13.3 Total Slimes 183.3 9.3 0.30 0.65 68.3 15.8 3.04 5.04 2.08 0.89 0.07 0.03 1.57 5.9 8.7 9.4 10.4 9.8 51.0 19.9 5.7 9.6 16.1 Head (calc.) 1,980.0 100.0 0.48 1.03 72.7 15.5 2.69 4.74 0.38 0.42 0.11 0.03 0.90 100.0 100.0 100.0 100.0 100.0 100.0 100.0 100.0 100.0 100.0 Head (Dir.) 0.47 1.01 73.5 15.6 2.72 4.69 0.25 0.39 0.10 0.03 0.79 F30 (Comp 2) 3rd Li Con 271.9 13.9 2.75 5.92 64.7 24.3 0.98 0.93 0.23 0.13 0.14 0.04 1.10 79.9 12.1 21.8 4.7 2.8 8.8 18.0 18.4 20.5 22.9 Slight changes to F12 3rd Li Con 281.5 14.4 2.72 5.86 64.8 24.2 1.02 0.97 0.23 0.13 0.14 0.04 1.10 81.9 12.5 22.4 5.0 3.1 9.0 18.8 18.8 21.1 23.8 Li 2nd Cl Con 300.1 15.3 2.62 5.64 65.2 23.8 1.16 1.12 0.22 0.13 0.13 0.04 1.08 83.9 13.5 23.6 6.1 3.8 9.5 20.5 19.2 21.8 24.9 Li 1st Cl Con 333.0 17.0 2.42 5.21 66.0 23.1 1.39 1.41 0.22 0.13 0.12 0.04 1.03 85.9 15.1 25.3 8.2 5.3 10.2 22.8 19.5 23.0 26.2 Li Ro Con 401.0 20.5 2.02 4.36 67.7 21.5 1.77 2.01 0.21 0.13 0.10 0.03 0.90 86.8 18.7 28.4 12.5 9.1 11.8 26.3 19.8 25.6 27.7 Authier Lithium DFS Technical Report Summary – Quebec, Canada 148 Test No. Combined Weight Assays (%) Distribution (%) Objective Product g % Li Li2O SiO2 Al2O3 K2O Na2O CaO MgO MnO P2O5 Fe2O3 Li SiO2 Al2O3 K2O Na2O CaO MgO MnO P2O5 Fe2O3 Li Ro+Sc Con 457.0 23.3 1.80 3.87 68.8 20.6 1.93 2.36 0.20 0.12 0.09 0.03 0.83 87.8 21.6 30.9 15.5 12.1 13.2 28.8 20.6 27.7 29.2 Mica Ro Con 46.0 2.3 0.26 0.56 58.2 24.7 7.24 2.44 0.18 0.33 0.10 0.07 2.03 1.3 1.8 3.7 5.9 1.3 1.2 7.7 2.2 6.1 7.1 Mica Ro+Sc Con 87.0 4.4 0.28 0.60 61.2 22.7 6.85 2.82 0.23 0.35 0.10 0.09 1.72 2.6 3.6 6.5 10.4 2.7 2.8 15.6 4.2 14.5 11.4 Li Ro. Tail 1,256.0 64.2 0.02 0.04 78.4 13.0 2.95 5.48 0.16 0.02 0.01 0.02 0.13 2.4 67.7 53.9 65.3 77.3 28.5 14.8 6.6 47.4 12.5 Li Ro+Sc Tail 1,201.1 61.4 0.01 0.02 78.5 13.0 2.95 5.50 0.16 0.02 0.01 0.02 0.12 1.4 64.8 51.4 62.3 74.2 27.1 12.2 5.8 45.3 11.0 10A Mags 29.6 1.5 0.86 1.84 52.8 18.2 1.96 1.78 0.51 1.00 4.52 0.04 16.24 2.7 1.1 1.8 1.0 0.6 2.2 15.1 64.6 2.2 36.8 5A Mags 16.6 0.8 0.79 1.70 55.4 18.3 1.71 2.00 0.51 0.75 5.76 0.04 12.90 1.4 0.6 1.0 0.5 0.4 1.2 6.3 46.2 1.3 16.4 Head (calc.) 1,958.0 100.0 0.48 1.03 74.3 15.5 2.90 4.55 0.36 0.10 0.11 0.03 0.67 100.0 100.0 100.0 100.0 100.0 100.0 100.0 100.0 100.0 100.0 Head (Dir.) 0.48 1.03 74.9 15.6 2.95 4.56 0.17 0.10 0.09 0.02 0.56 F42 (Comp 2) 3rd Li Con 288.0 14.4 2.77 5.96 64.7 24.1 0.98 1.02 0.21 0.10 0.14 0.04 1.01 81.0 12.7 22.4 4.9 3.3 9.7 13.2 19.7 28.4 22.8 F39 but with Composite 2 Li 2nd Cl Con 298.0 14.9 2.71 5.84 64.9 23.9 1.04 1.11 0.21 0.10 0.14 0.04 1.00 82.1 13.2 23.0 5.4 3.7 10.0 13.9 20.0 28.9 23.4 Li 1st Cl Con 312.0 15.5 2.63 5.65 65.2 23.6 1.12 1.24 0.21 0.10 0.13 0.04 0.99 83.1 13.8 23.7 6.1 4.3 10.4 14.9 20.3 29.5 24.2 Li Ro Con 363.0 18.1 2.28 4.91 66.8 22.2 1.38 1.79 0.20 0.10 0.12 0.03 0.90 84.1 16.5 26.0 8.7 7.2 11.9 16.7 20.8 30.8 25.4 Li Ro+Sc Con 409.0 20.4 2.06 4.44 67.7 21.3 1.55 2.12 0.21 0.10 0.11 0.03 0.84 85.6 18.9 28.1 11.0 9.6 13.4 19.0 21.5 33.0 26.8 Mica Ro Con 80.8 4.0 0.23 0.50 104.9 21.3 5.49 6.64 0.30 0.18 0.04 0.06 0.58 1.9 5.8 5.5 7.7 5.9 3.9 6.8 1.7 11.3 3.7 Mica Ro+Sc Con 196.0 9.7 0.22 0.48 50.2 10.9 2.58 3.03 0.17 0.20 0.18 0.03 1.78 4.4 6.7 6.9 8.8 6.6 5.4 17.9 16.9 13.0 27.2 Li Ro. Tail 1,243.0 62.0 0.02 0.05 75.5 12.8 2.88 5.31 0.25 0.05 0.01 0.01 0.12 2.7 63.9 51.1 62.2 73.1 49.0 27.3 6.4 30.8 11.3 Li Ro+Sc Tail 1,198.0 59.7 0.01 0.02 1.5 0.3 0.07 0.11 0.10 0.01 0.00 0.00 0.01 1.2 1.2 1.3 1.4 1.4 18.4 5.4 0.5 1.4 1.0 10A Mags 39.1 1.9 0.93 2.00 266.7 65.1 13.69 17.93 4.81 1.49 2.74 0.16 8.45 3.7 7.1 8.2 9.3 7.8 30.1 26.6 52.4 15.2 25.9 5A Mags 15.8 0.8 0.88 1.89 604.4 141.7 32.19 42.51 11.37 2.80 0.70 0.35 11.11 1.4 6.5 7.2 8.9 7.4 28.7 20.2 5.4 13.6 13.7 Total Slimes 165.8 8.3 0.30 0.64 68.6 16.0 3.54 4.83 1.78 0.34 0.07 0.04 1.14 5.0 7.7 8.5 10.2 8.9 47.1 25.6 5.9 15.0 14.7 Head (calc.) 2,007.0 100.0 0.49 1.06 73.2 15.5 2.86 4.50 0.31 0.11 0.10 0.02 0.64 100.0 100.0 100.0 100.0 100.0 100.0 100.0 100.0 100.0 100.0 Head (Dir.) 0.48 1.03 74.9 15.6 2.95 4.56 0.17 0.10 0.09 0.02 0.56 F43 (Comp 2) 3rd Li Con 278.0 13.8 2.81 6.05 64.4 24.2 0.92 0.95 0.22 0.10 0.12 0.04 1.04 79.0 12.1 21.6 4.4 2.9 5.9 12.0 16.7 28.6 21.7 F41 but with Composite 2 Li 2nd Cl Con 291.0 14.4 2.74 5.90 64.7 23.9 1.00 1.06 0.22 0.10 0.12 0.04 1.03 80.6 12.7 22.4 5.0 3.4 6.1 12.9 17.1 29.0 22.5

Authier Lithium DFS Technical Report Summary – Quebec, Canada 149 Test No. Combined Weight Assays (%) Distribution (%) Objective Product g % Li Li2O SiO2 Al2O3 K2O Na2O CaO MgO MnO P2O5 Fe2O3 Li SiO2 Al2O3 K2O Na2O CaO MgO MnO P2O5 Fe2O3 Li 1st Cl Con 312.0 15.4 2.61 5.62 65.1 23.5 1.12 1.25 0.22 0.11 0.11 0.04 1.01 82.3 13.7 23.5 6.0 4.3 6.5 14.3 17.6 30.0 23.6 Li Ro Con 366.0 18.2 2.26 4.86 66.7 22.1 1.40 1.81 0.21 0.11 0.10 0.03 0.92 83.7 16.5 26.0 8.9 7.3 7.6 16.9 18.5 32.9 25.2 Li Ro+Sc Con 414.0 20.5 2.03 4.37 67.7 21.2 1.58 2.14 0.21 0.11 0.09 0.03 0.87 85.0 18.9 28.2 11.3 9.7 8.5 19.2 18.9 34.1 26.8 Mica Ro Con 82.4 4.1 0.23 0.50 74.3 15.6 4.08 4.68 0.23 0.14 0.03 0.05 0.46 1.9 4.1 4.1 5.8 4.2 1.9 5.1 1.3 10.8 2.8 Mica Ro+Sc Con 166.0 8.2 0.22 0.48 44.6 10.1 2.37 2.65 0.17 0.20 0.18 0.03 2.03 3.8 5.0 5.4 6.8 4.8 2.7 14.5 15.2 12.5 25.3 Li Ro Tail 1,252.0 62.0 0.02 0.04 77.0 13.0 2.95 5.46 0.27 0.05 0.01 0.01 0.14 2.5 65.1 52.3 64.0 74.6 32.3 25.7 6.7 33.2 12.8 Li Ro+Sc Tail 1,205.0 59.7 0.01 0.02 2.4 0.5 0.10 0.17 0.12 0.01 0.00 0.00 0.01 1.2 2.0 2.0 2.1 2.3 13.7 4.8 0.6 2.2 1.1 10A Mags 50.3 2.5 0.92 1.98 217.1 53.8 11.06 14.29 11.39 1.49 2.25 0.11 7.15 4.7 7.4 8.7 9.6 7.9 55.3 32.5 56.7 13.7 27.0 5A Mags 27.9 1.4 0.90 1.94 330.6 78.1 17.74 23.28 20.06 1.86 0.35 0.15 6.20 2.5 6.2 7.0 8.6 7.1 54.0 22.5 4.9 10.9 13.0 Total Slimes 183.3 9.1 0.29 0.62 66.3 15.3 3.36 4.67 3.83 0.34 0.06 0.03 1.02 5.3 8.2 9.0 10.6 9.4 67.7 27.3 5.6 13.1 14.0 Head (calc.) 2,018.0 100.0 0.49 1.05 73.4 15.4 2.86 4.54 0.51 0.11 0.10 0.02 0.66 100.0 100.0 100.0 100.0 100.0 100.0 100.0 100.0 100.0 100.0 Head (Dir.) 0.48 1.03 74.9 15.6 2.95 4.56 0.17 0.10 0.09 0.02 0.56 Authier Lithium DFS Technical Report Summary – Quebec, Canada 150 Locked-cycle Tests A locked-cycle test was performed on each composite sample. The conditions for the tests were based on batch tests F41 and F43. The flowsheet for the locked-cycle tests in shown in Figure 10-6. Feed samples were stage-ground to 100% passing 180 µm. Reagent dosages for the tests are given in Table 10-22. The only differences in the test conditions were the slight increase in Armac T dosage from 110 g/t (Composite 1) to 120 g/t (Composite 2) and the addition of MIBC (10 g/t) ahead of mica flotation for Composite 2. Figure 10-6 – Locked-cycle flowsheet (Composite 1). 2 Iron Silicate 3 Product Legend Spodumene Flotation Flowsheet Slimes 4 Li Ro Tail7 1 st Cleaner High Density Cond. 70% FA-2 1000 g/t Temp. 30'C Spod. Ro. Flotation 2 nd Cleaner Mica Concentrate Mica Ro. Flotation 4 7 6 6 Scrubbing Slimes High Density Scrubber F220 Dispersant 250g/t, SodaAsh 400 g/t PH 12, Temp 22'C 2 pH Adj Tank Armac T 70g/t De-Sliming Cyclone De-Sliming Cyclone 180 mic Screen 5 Water Recovery 1 1 Spodumene Flot Feed 3 rd Cleaner 9 Li Final Conc.9 MidsMag Non- Mag 3 scrubbing Mag Sep 5 De-watering Cyclone 8 8 1 st cleaner Tail Mica Scav. Flotation 4 25g/t FA-2 5g/t FA-2 5g/t FA-2 pH 10.5 Armac T 30g/t

Authier Lithium DFS Technical Report Summary – Quebec, Canada 151 Table 10-22 – Reagent dosages for the locked-cycle batch tests. Feed Dosage (g/t) NaOH Na2CO3 Armac T MIBC F100 FA-2 Composite 1 150 600 110 0 250 1,035 Composite 2 150 600 120 10 250 1,035 Table 10-23 shows the detailed results for the locked-cycle batch tests. Results on Composite 1 and Composite 2 showed an average concentrate grade of 5.85% Li2O at 84% recovery, and 5.86% Li2O at 83% recovery, respectively. Authier Lithium DFS Technical Report Summary – Quebec, Canada 152 Table 10-23 – Locked-cycle test results. Composite 1 | Projected Balance Cycles B to F Combined Weight Assays % Global Distribution % Product g % Li Li2O SiO2 Al2O3 K2O Na2O CaO MgO Fe2O3 Li SiO2 Al2O3 K2O Na2O CaO MgO Fe2O3 Li 3rd Cl Conc 1,709.6 14.5 2.72 5.86 63.3 24.5 0.98 0.77 0.42 0.93 1.81 83.8 12.5 22.7 5.3 2.3 14.7 33.6 31.4 Li 1st Cl Tail 417.1 3.5 0.58 1.24 72.9 16.7 3.01 4.57 0.17 0.34 0.57 4.3 3.5 3.8 4.0 3.4 1.5 3.0 2.4 Li Ro Tail 8,106.6 68.7 0.02 0.04 77.7 13.3 2.80 5.76 0.17 0.05 0.05 2.8 72.7 58.5 71.6 83.4 28.5 9.3 4.1 Slime 2 571.6 4.8 0.33 0.72 69.2 15.1 2.71 5.11 2.79 0.60 0.74 3.4 4.6 4.7 4.9 5.2 32.6 7.2 4.3 Mica Ro. Conc. 134.5 1.1 0.26 0.55 57.3 23.8 6.87 2.65 0.24 1.31 2.72 0.6 0.9 1.7 2.9 0.6 0.7 3.7 3.7 Mica Scav. Conc. 304.8 2.6 0.24 0.52 59.2 22.7 6.84 2.61 0.25 1.66 2.66 1.3 2.1 3.8 6.6 1.4 1.6 10.7 8.2 Mag Sep 173.2 1.5 0.57 1.24 42.2 16.9 1.54 0.78 1.34 6.55 21.86 1.8 0.8 1.6 0.8 0.2 4.8 24.0 38.3 Slime 1 376.3 3.2 0.28 0.59 67.5 16.0 3.28 4.92 2.06 1.07 2.00 1.9 2.9 3.3 3.9 3.3 15.9 8.5 7.6 Total Feed 11,793.7 100.0 0.47 1.01 73.5 15.6 2.69 4.74 0.42 0.40 0.84 100.0 100.0 100.0 100.0 100.0 100.0 100.0 100.0 Direct Feed 0.47 1.01 73.5 15.6 2.72 4.69 0.25 0.39 0.79 Combined Slimes 8.0 0.31 0.67 68.5 15.4 2.94 5.03 2.50 0.78 1.24 5.3 7.5 7.9 8.8 8.5 48.4 15.7 11.9 Combined Mag Sep 1.5 0.57 1.23 42.2 16.9 1.54 0.78 1.34 6.55 21.86 1.8 0.8 1.6 0.8 0.2 4.8 24.0 38.3 Composite 2 | Projected Balance Cycles B to F Combined Weight Assays % Global Distribution % Product g % Li Li2O SiO2 Al2O3 K2O Na2O CaO MgO Fe2O3 Li SiO2 Al2O3 K2O Na2O CaO MgO Fe2O3 Li 3rd Cl Conc 1,701.4 14.6 2.72 5.85 65.1 24.5 0.93 0.93 0.26 0.10 1.09 82.8 12.8 23.0 4.7 3.0 10.5 12.8 24.3 Li 1st Cl Tail 366.7 3.1 0.42 0.90 74.9 15.6 3.08 4.91 0.16 0.10 0.40 2.7 3.2 3.2 3.4 3.4 1.4 2.7 1.9 Li Ro Tail 7,480.1 64.1 0.02 0.05 77.9 13.0 2.88 5.51 0.17 0.06 0.16 3.0 67.4 53.7 63.9 77.7 30.9 31.7 15.2 Slime 2 252.5 2.2 0.41 0.88 67.0 14.8 2.46 4.89 4.85 0.28 0.41 1.9 2.0 2.1 1.8 2.3 29.6 5.3 1.4 Mica Ro. Conc. 396.0 3.4 0.17 0.37 62.9 21.9 7.03 2.93 0.15 0.26 1.42 1.2 2.9 4.8 8.3 2.2 1.4 7.7 7.3 Mica Scav. Conc. 623.9 5.3 0.17 0.37 73.0 15.8 5.17 3.97 0.19 0.15 0.45 1.9 5.3 5.5 9.6 4.7 2.9 7.2 3.6 Mag Sep 10A 115.2 1.0 0.97 2.10 54.8 17.9 2.49 2.04 0.44 1.16 16.39 2.0 0.7 1.1 0.9 0.4 1.2 9.9 24.6 Mag Sep 5A 99.6 0.8 0.84 1.81 56.9 19.5 1.94 2.31 0.54 0.97 9.19 1.5 0.7 1.1 0.6 0.4 1.3 7.2 11.9

Authier Lithium DFS Technical Report Summary – Quebec, Canada 153 Slime 1 627.4 5.4 0.26 0.57 69.8 16.2 3.70 4.96 1.37 0.33 1.19 3.0 5.1 5.6 6.9 5.9 20.7 15.5 9.8 Total Feed 11,662.7 100.0 0.48 1.03 74.1 15.5 2.89 4.55 0.36 0.11 0.66 100.0 100.0 100.0 100.0 100.0 100.0 100.0 100.0 Direct Feed 0.48 1.03 74.9 15.6 2.95 4.56 0.17 0.10 0.56 Combined Slimes 7.5 0.31 0.66 69.0 15.8 3.34 4.94 2.37 0.32 0.97 4.8 7.0 7.7 8.7 8.2 50.3 20.9 11.1 Combined Mag Sep 1.8 0.91 1.96 55.7 18.7 2.23 2.16 0.49 1.07 13.05 3.5 1.4 2.2 1.4 0.9 2.5 17.1 36.6 Authier Lithium DFS Technical Report Summary – Quebec, Canada 154 Continuous Pilot Plant Tests The concentrator pilot plant was operated by SGS Canada Inc. in Lakefield, Ontario. Pilot plant operation commenced on April 5, 2018, and concluded on April 26, 2018, in a series of 13 campaigns (operational shifts). Three feed samples were tested: a low-grade commissioning sample, Composite 1 and Composite 2. The commissioning sample was initially fed to the pilot plant to confirm mechanical reliability, robust operating procedures, and analytical laboratory capabilities. Once commissioning was complete, the two composite pilot plant samples were processed through the plant. The plant operated for over 100 h and processed over 5 t of feed material. The pilot plant flowsheet for campaign PP06 is shown in Figure 10-7. The circuit was fed at a rate of 50 kg/h of crushed ore (-3.36 mm) to a rod mill in closed-circuit with a 180 µm vibrating screen. The screen undersize fed a dewatering hydrocyclone. The cyclone underflow fed the magnetic separation circuit which consisted of a LIMS and WHIMS unit in series. The magnetic concentrates were combined and sent to tailings. The non-magnetic fraction fed a de-sliming cyclone. The slimes were sent to tailings while the underflow stream fed the mica-conditioning tank where sodium hydroxide and Armac T collector were added. The conditioning tank overflowed to feed three Denver A5 mica rougher cells. The rougher tails fed a second conditioning tank where supplemental Armac T was added prior to three Denver A5 mica scavenger cells. The mica rougher and scavenger concentrates were combined and sent to tailings. The mica scavenger tails were de-watered and fed to the attrition scrubber where sodium hydroxide and dispersant were added prior to de-sliming. The cyclone underflow was collected and thickened (to 60% w/w solids) and fed to spodumene conditioning. The thickening stage was implemented due to the small- scale of the pilot-scale hydrocyclone (1”) which were prone to plugging under the testing conditions. The slurry was conditioned with FA-2 collector and soda ash in a 20-L tank with double impeller. The conditioning tank overflowed to feed four Denver A5 spodumene rougher cells. Rougher tailings were discarded. The first and second cleaners were both single Denver D12 machines. Soda ash was added to spodumene flotation cells as required to maintain the pulp pH at 8.5. Final concentrate was collected separately on a shift basis. Reagent dosages for the optimized pilot plant campaigns are shown in Table 10-24. For the optimized conditions, Armac T dosage ranged from 112 g/t to 220 g/t and FA-2 dosage ranged from 656 g/t to 1,106 g/t.

Authier Lithium DFS Technical Report Summary – Quebec, Canada 155 Figure 10-7 – Pilot plant flowsheet (PP-06). Authier Lithium DFS Technical Report Summary – Quebec, Canada 156 Table 10-24 – Reagent dosages for selected pilot plant tests. Test Feed P80 Dosage (g/t) (µm) Na2CO3 Armac T MIBC F100 FA-2 PP-11S Composite 1 188 576 130 21 254 693 PP-11F 188 576 130 21 254 693 PP-12F 189 543 220 21 266 656 PP06 Composite 2 180 402 112 19 242 1,065 PP-07S1 182 600 121 19 264 1,106 PP-07S2 182 600 212 19 264 1,106 Note: NaOH consumption was not measured during pilot plant operation Pilot plant mass balance data was reconciled using Bilmat software. Reconciled data for the selected campaigns is summarized in Table 10-25. For the optimized flowsheets, pilot plant operation on Composite 1 produced concentrate ranging from 5.9% to 6.0% Li2O with recoveries ranging from 67% to 71%. Fe2O3 content in the spodumene concentrates ranged from 1.70% to 1.89%. For Composite 2, concentrate grade ranged from 5.8% to 6.2% Li2O with lithium recovery from 73% to 79%. Iron content in the spodumene concentrates ranged from 0.96% to 1.16% Fe2O3.

Authier Lithium DFS Technical Report Summary – Quebec, Canada 157 Table 10-25 – Selected pilot plant mass balances. Composite 1 | PP-11S Mass Balance Stream Mass Pull (%) Assay (%) Li2O SiO2 Al2O3 Fe2O3 MgO CaO Na2O K2O Adj. Meas. Adj. Meas. Adj. Meas. Adj. Meas. Adj. Meas. Adj. Meas. Adj. Meas. Adj. Meas. Feed 100 1.06 1.08 72.9 73.3 15.7 15.9 0.89 0.82 0.39 0.42 0.30 0.23 4.67 4.69 2.66 2.69 Combined Mag Con 3.7 2.11 2.11 58.8 58.8 19.5 19.5 6.29 6.42 3.44 3.39 0.69 0.70 2.16 2.16 2.52 2.52 Combined Mica Con 3.6 0.21 0.21 67.7 67.7 17.9 17.9 0.98 0.98 0.50 0.50 0.22 0.22 3.45 3.45 6.44 6.43 Combined Slimes 14.5 0.69 0.69 70.1 70.0 15.9 15.9 1.60 1.64 0.65 0.64 0.72 0.79 5.02 5.02 3.19 3.18 Spod Ro Tails 65.6 0.20 0.21 76.6 76.6 13.7 13.6 0.27 0.26 0.08 0.07 0.17 0.19 5.54 5.57 2.64 2.61 Spod Cl Conc 12.6 5.95 5.96 62.3 62.3 24.5 24.5 1.70 1.71 0.77 0.76 0.39 0.41 0.80 0.81 1.08 1.08 Streams Mass Pull (%) Recovery (%) Li2O SiO2 Al2O3 Fe2O3 MgO CaO Na2O K2O Feed 100 100 100 100 100 100 100 100 100 Combined Mag Con 3.7 7.3 3.0 4.6 26.2 32.8 8.6 1.7 3.5 Combined Mica Con 3.6 0.7 3.4 4.1 4.0 4.7 2.7 2.7 8.8 Combined Slimes 14.5 9.4 14.0 14.7 26.3 24.4 35.5 15.6 17.4 Spod Ro Tails 65.6 12.4 68.9 57.0 19.6 13.1 36.8 77.8 65.2 Spod Cl Conc 12.6 70.2 10.7 19.6 24.0 25.0 16.5 2.2 5.1 PP-11F Mass Balance Stream Mass Pull (%) Assay (%) Li2O SiO2 Al2O3 Fe2O3 MgO CaO Na2O K2O Adj. Meas. Adj. Meas. Adj. Meas. Adj. Meas. Adj. Meas. Adj. Meas. Adj. Meas. Adj. Meas. Feed 100 1.01 0.99 73.5 72.8 15.5 15.6 0.62 1.10 0.29 0.43 0.27 0.26 4.70 4.69 2.73 2.71 Cyclone #1 O/F 2.9 0.62 0.62 70.4 70.4 16.3 16.3 2.54 2.48 0.76 0.75 0.41 0.41 5.04 5.04 3.30 3.30 Cy#1 U/F 97.1 1.03 0.99 73.6 73.2 15.5 15.6 0.57 0.98 0.27 0.41 0.26 0.25 4.69 4.68 2.71 2.71 Combined Mag Con 3.6 1.41 1.42 74.4 74.4 16.0 16.0 0.61 0.60 0.22 0.22 0.21 0.21 4.67 4.67 2.32 2.32 Non Mags 93.5 1.01 1.01 73.6 73.5 15.5 15.5 0.56 0.49 0.28 0.28 0.26 0.22 4.69 4.74 2.73 2.66 Cyclone #2 O/F 2.9 0.64 0.65 72.5 72.5 15.7 15.7 0.73 0.72 0.47 0.46 0.32 0.32 5.14 5.14 3.14 3.14 Cy#2 U/F 90.6 1.02 1.01 73.6 73.8 15.5 15.5 0.56 0.61 0.27 0.26 0.26 0.22 4.68 4.70 2.71 2.65 Authier Lithium DFS Technical Report Summary – Quebec, Canada 158 PP-11F Mass Balance Stream Mass Pull (%) Assay (%) Li2O SiO2 Al2O3 Fe2O3 MgO CaO Na2O K2O Adj. Meas. Adj. Meas. Adj. Meas. Adj. Meas. Adj. Meas. Adj. Meas. Adj. Meas. Adj. Meas. Combined Mica Con 18.6 0.16 0.16 73.3 73.5 14.8 14.8 0.58 0.54 0.41 0.37 0.19 0.21 4.23 4.22 4.65 4.74 Mica Tail 72.0 1.25 1.27 73.7 74.2 15.7 15.7 0.55 0.46 0.23 0.22 0.28 0.22 4.79 4.79 2.21 2.19 Cyclone #3 O/F 1.9 1.12 1.12 69.5 69.5 16.5 16.5 1.16 1.16 0.68 0.67 0.91 0.95 4.96 4.96 2.54 2.54 Cy#3 U/F 70.1 1.25 1.29 73.8 74.3 15.6 15.7 0.54 0.53 0.22 0.22 0.26 0.21 4.79 4.83 2.20 2.17 Cyclone #4 O/F 1.4 1.12 1.12 61.7 61.7 14.5 14.5 0.76 0.76 0.66 0.65 5.10 7.16 4.32 4.32 2.02 2.02 Cy#4 U/F 68.7 1.25 1.29 74.1 74.0 15.7 15.8 0.53 0.61 0.21 0.22 0.16 0.22 4.80 4.82 2.21 2.14 Ro Con 16.2 5.34 5.29 63.3 63.3 23.7 23.6 1.62 1.53 0.78 0.74 0.33 0.35 1.18 1.19 1.42 1.44 Spod Ro Tail 56.5 0.25 0.26 76.6 76.6 13.7 13.7 0.27 0.25 0.08 0.07 0.12 0.18 5.66 5.57 2.46 2.56 1st Cl Con 13.8 5.73 5.74 62.7 62.7 24.3 24.3 1.69 1.66 0.82 0.79 0.35 0.36 0.91 0.93 1.15 1.17 1st Cl Tail 2.4 3.11 3.14 66.7 66.7 20.7 20.7 1.23 1.24 0.58 0.59 0.22 0.22 2.73 2.72 2.96 2.94 Spod Cl Con 12.2 5.90 5.91 62.4 62.3 24.5 24.6 1.74 1.72 0.84 0.86 0.36 0.38 0.78 0.76 1.04 1.03 2nd Cl Tail 1.6 4.46 4.49 65.0 65.0 22.4 22.4 1.32 1.33 0.63 0.64 0.26 0.26 1.85 1.84 1.99 1.98 Spod Feed 72.7 1.39 1.25 73.6 73.7 16.0 15.7 0.57 0.56 0.24 0.21 0.17 0.21 4.66 4.64 2.23 2.37 Combined Slimes 9.1 0.81 0.81 69.5 69.5 15.9 15.9 1.41 1.38 0.64 0.63 1.22 1.56 4.94 4.94 2.89 2.89 Streams Mass Pull (%) Recovery (%) Li2O SiO2 Al2O3 Fe2O3 MgO CaO Na2O K2O Feed 100.0 100.0 100.0 100.0 100.0 100.0 100.0 100.0 100.0 Cyclone #1 O/F 2.9 1.8 2.8 3.1 11.9 7.7 4.5 3.1 3.5 Cy#1 U/F 97.1 98.2 97.2 96.9 88.1 92.3 95.5 96.9 96.5 Combined Mag Con 3.6 5.0 3.6 3.7 3.5 2.8 2.8 3.6 3.1 Non Mags 93.5 93.2 93.6 93.2 84.6 89.5 92.7 93.3 93.4 Cyclone #2 O/F 2.9 1.8 2.8 2.9 3.3 4.7 3.4 3.1 3.3 Cy#2 U/F 90.6 91.4 90.7 90.3 81.2 84.9 89.3 90.2 90.1 Combined Mica Con 18.6 2.9 18.6 17.8 17.4 26.5 13.3 16.8 31.7 Mica Tail 72.0 88.4 72.2 72.5 63.8 58.4 76.0 73.4 58.4

Authier Lithium DFS Technical Report Summary – Quebec, Canada 159 Streams Mass Pull (%) Recovery (%) Li2O SiO2 Al2O3 Fe2O3 MgO CaO Na2O K2O Cyclone #3 O/F 1.9 2.1 1.8 2.0 3.5 4.4 6.4 2.0 1.7 Cy#3 U/F 70.1 86.4 70.4 70.6 60.3 54.0 69.6 71.4 56.6 Cyclone #4 O/F 1.4 1.6 1.2 1.3 1.7 3.3 27.4 1.3 1.1 Cy#4 U/F 68.7 84.8 69.2 69.2 58.5 50.7 42.2 70.1 55.6 Ro Con 16.2 85.5 14.0 24.8 42.1 44.0 20.3 4.1 8.5 Spod Ro Tail 56.5 13.9 58.9 50.0 24.6 15.2 25.6 68.1 50.9 1st Cl Con 13.8 78.1 11.8 21.6 37.4 39.1 18.2 2.7 5.8 1st Cl Tail 2.4 7.5 2.2 3.2 4.8 4.9 2.0 1.4 2.6 Spod Cl Con 12.2 70.9 10.3 19.2 33.9 35.5 16.6 2.0 4.7 2nd Cl Tail 1.6 7.2 1.4 2.3 3.4 3.6 1.6 0.6 1.2 Spod Feed 72.7 99.4 72.8 74.8 66.8 59.2 45.8 72.1 59.4 Combined O/F 9.1 7.3 8.6 9.3 20.5 20.0 41.6 9.6 9.6 PP-12 Mass Balance Stream Mass Pull (%) Assay (%) Li2O SiO2 Al2O3 Fe2O3 MgO CaO Na2O K2O Adj. Meas. Adj. Meas. Adj. Meas. Adj. Meas. Adj. Meas. Adj. Meas. Adj. Meas. Adj. Meas. Feed 100.0 0.99 0.97 73.3 72.9 15.6 15.6 0.80 1.09 0.38 0.43 0.28 0.26 4.64 4.68 2.75 2.77 Cyclone #1 O/F 3.9 0.56 0.56 69.3 69.3 16.3 16.3 2.46 2.41 0.86 0.85 0.43 0.43 5.06 5.06 3.39 3.39 Cy#1 U/F 96.1 1.01 0.99 73.4 73.2 15.5 15.6 0.74 0.96 0.36 0.41 0.27 0.24 4.62 4.64 2.72 2.73 Combined Mag Con 2.5 2.00 2.00 57.7 57.7 19.6 19.6 7.44 6.93 3.77 3.63 0.75 0.76 2.03 2.03 2.58 2.58 Non Mags 93.5 0.98 0.92 73.8 73.9 15.4 15.4 0.55 0.49 0.27 0.26 0.26 0.21 4.69 4.75 2.72 2.72 Cyclone #2 O/F 2.9 0.56 0.56 72.5 72.5 15.6 15.6 0.63 0.63 0.44 0.44 0.30 0.30 5.17 5.17 3.18 3.18 Cy#2 U/F 90.6 0.99 0.95 73.9 74.0 15.4 15.4 0.55 0.51 0.26 0.24 0.26 0.21 4.67 4.73 2.71 2.69 Combined Mica Conc 16.2 0.15 0.15 72.9 73.0 14.9 14.9 0.69 0.68 0.44 0.43 0.19 0.21 4.18 4.16 4.81 4.81 Mica Tail 74.4 1.18 1.27 74.1 74.6 15.5 15.5 0.52 0.47 0.22 0.20 0.27 0.22 4.78 4.71 2.25 2.20 Cyclone #3 O/F 1.8 1.01 1.01 67.9 67.9 16.3 16.3 1.31 1.31 0.80 0.80 1.39 1.49 4.87 4.87 2.64 2.64 Cy#3 U/F 72.6 1.18 1.27 74.2 74.8 15.5 15.6 0.50 0.60 0.21 0.22 0.25 0.21 4.78 4.75 2.24 2.24 Authier Lithium DFS Technical Report Summary – Quebec, Canada 160 PP-12 Mass Balance Stream Mass Pull (%) Assay (%) Li2O SiO2 Al2O3 Fe2O3 MgO CaO Na2O K2O Adj. Meas. Adj. Meas. Adj. Meas. Adj. Meas. Adj. Meas. Adj. Meas. Adj. Meas. Adj. Meas. Cyclone #4 O/F 1.6 1.05 1.05 64.9 64.9 15.0 15.0 0.83 0.83 0.69 0.69 3.93 5.06 4.53 4.53 2.24 2.24 Cy#4 U/F 71.0 1.19 1.33 74.5 73.9 15.5 15.5 0.50 0.53 0.20 0.21 0.16 0.22 4.78 4.68 2.24 2.19 Ro Con 15.5 5.39 5.61 62.8 62.9 23.9 23.9 1.71 1.63 0.79 0.82 0.37 0.38 1.06 1.08 1.41 1.43 Spod Ro Tail 59.8 0.30 0.30 76.8 76.8 13.8 13.9 0.24 0.22 0.08 0.08 0.12 0.18 5.54 5.60 2.48 2.48 1st Cl Con 13.4 5.76 5.55 62.3 62.4 24.4 24.3 1.80 1.70 0.82 0.81 0.40 0.41 0.82 0.85 1.08 1.09 1st Cl Tail 2.1 3.11 3.12 66.1 66.1 21.0 21.0 1.15 1.15 0.62 0.62 0.18 0.18 2.54 2.52 3.50 3.48 Spod Cl Con 11.2 5.91 5.89 62.0 61.9 24.5 24.6 1.87 1.90 0.85 0.85 0.42 0.44 0.71 0.69 0.95 0.94 2nd Cl Tail 2.2 4.99 5.03 63.9 63.9 23.5 23.5 1.44 1.46 0.69 0.69 0.26 0.26 1.37 1.35 1.73 1.72 Spod Feed 75.4 1.35 1.25 73.9 73.7 15.9 15.7 0.54 0.56 0.23 0.21 0.17 0.21 4.62 4.64 2.26 2.37 Combined Slimes 10.2 0.71 0.72 69.3 69.3 15.9 15.9 1.49 1.47 0.70 0.70 1.10 1.29 4.98 4.98 3.02 3.02 Streams Mass Pull (%) Recovery (%) Li2O SiO2 Al2O3 Fe2O3 MgO CaO Na2O K2O Feed 100 100 100 100 100 100 100 100 100 Cyclone #1 O/F 3.9 2.2 3.7 4.1 12.0 8.9 6.1 4.3 4.9 Cy#1 U/F 96.1 97.8 96.3 95.9 88.0 91.1 93.9 95.7 95.1 Combined Mag Con 2.5 5.1 2.0 3.2 23.5 25.2 6.9 1.1 2.4 Non Mags 93.5 92.7 94.3 92.7 64.5 65.9 87.1 94.6 92.8 Cyclone #2 O/F 2.9 1.6 2.9 2.9 2.3 3.4 3.1 3.2 3.4 Cy#2 U/F 90.6 91.0 91.4 89.8 62.2 62.5 84.0 91.4 89.4 Combined Mica Con 16.2 2.4 16.2 15.6 13.9 18.6 10.9 14.6 28.5 Mica Tail 74.4 88.6 75.2 74.2 48.3 43.9 73.1 76.7 60.9 Cyclone #3 O/F 1.8 1.9 1.7 1.9 3.0 3.9 9.1 1.9 1.8 Cy#3 U/F 72.6 86.7 73.5 72.3 45.4 40.0 64.0 74.8 59.2 Cyclone #4 O/F 1.6 1.7 1.4 1.5 1.6 2.8 22.0 1.5 1.3

Authier Lithium DFS Technical Report Summary – Quebec, Canada 161 Streams Mass Pull (%) Recovery (%) Li2O SiO2 Al2O3 Fe2O3 MgO CaO Na2O K2O Cy#4 U/F 71.0 85.1 72.2 70.8 43.7 37.2 41.9 73.3 57.9 Ro Con 15.5 84.6 13.3 23.8 33.0 32.5 20.5 3.5 8.0 Spod Ro Tail 59.8 18.3 62.7 53.2 17.8 12.2 25.0 71.5 54.0 1st Cl Con 13.4 77.9 11.4 20.9 29.9 29.0 19.0 2.4 5.3 1st Cl Tail 2.1 6.7 1.9 2.9 3.1 3.5 1.4 1.2 2.7 Spod Cl Con 11.2 66.8 9.5 17.6 25.9 25.0 17.0 1.7 3.9 2nd Cl Tail 2.2 11.1 1.9 3.3 4.0 4.0 2.1 0.7 1.4 Spod Feed 75.4 102.9 76.0 77.0 50.8 44.7 45.4 75.1 62.0 Combined O/F 10.2 7.4 9.7 10.5 18.9 19.0 40.3 11.0 11.3 Composite 2 | PP-06 Mass Balance Stream Mass Pull (%) Assay (%) Li2O SiO2 Al2O3 Fe2O3 CaO Na2O K2O Adj. Meas. Adj. Meas. Adj. Meas. Adj. Meas. Adj. Meas. Adj. Meas. Adj. Meas. Feed 100 1.1 1.08 74.6 74.5 15.5 15.7 0.64 0.58 0.22 0.16 4.53 4.60 2.85 2.88 Combined Mag Con 2.5 2.3 2.28 64.2 64.2 19.3 19.3 4.82 4.90 0.31 0.31 2.67 2.67 2.32 2.32 Combined Mica Con 13.6 0.2 0.15 75.9 75.9 14.0 14.0 0.44 0.45 0.11 0.12 4.08 4.07 4.79 4.78 Combined Slimes 11.8 0.8 0.75 70.5 70.5 16.0 16.0 1.52 1.56 0.80 0.91 4.77 4.76 3.46 3.45 Spod Ro Tails 59.8 0.2 0.19 77.5 77.9 13.7 13.4 0.22 0.21 0.12 0.14 5.42 5.49 2.69 2.73 Spod Cl Con 12.3 6.2 6.08 65.2 64.8 24.4 24.6 1.22 1.30 0.23 0.25 0.88 0.83 1.01 0.96 Streams Mass Pull (%) Recovery (%) Li2O SiO2 Al2O3 Fe2O3 CaO Na2O K2O Feed 100 100 100 100 100 100 100 100 Combined Mag Con 2.5 5.4 2.1 3.1 18.6 3.4 1.5 2.0 Combined Mica Con 13.6 2.0 13.8 12.3 9.5 7.0 12.2 22.9 Combined Slimes 11.8 8.5 11.1 12.2 28.0 42.9 12.4 14.3 Authier Lithium DFS Technical Report Summary – Quebec, Canada 162 Spod Ro Tails 59.8 11.6 62.2 53.1 20.5 33.7 71.5 56.5 Spod Cl Con 12.3 72.6 10.7 19.3 23.5 13.0 2.4 4.3 PP-07S1 Mass Balance Stream Mass Pull (%) Assay (%) Li2O SiO2 Al2O3 Fe2O3 CaO Na2O K2O Adj. Meas. Adj. Meas. Adj. Meas. Adj. Meas. Adj. Meas. Adj. Meas. Adj. Meas. Feed 100 1.0 1.05 74.4 75.1 15.5 15.7 0.62 0.50 0.24 0.15 4.60 4.57 2.89 2.92 Combined Mag Con 2.3 1.9 1.94 61.6 61.6 19.4 19.4 6.03 6.35 0.38 0.39 2.58 2.58 2.46 2.46 Combined Mica Con 13.2 0.2 0.17 73.0 72.9 15.5 15.5 0.54 0.56 0.13 0.14 4.24 4.24 5.24 5.23 Combined Slimes 9.9 0.6 0.58 69.3 69.2 16.0 16.0 1.21 1.27 1.14 1.49 4.93 4.93 3.61 3.61 Cyclone #4 U/F 74.6 1.1 1.23 75.7 75.3 15.4 15.4 0.39 0.38 0.13 0.15 4.68 4.75 2.40 2.41 Flot Feed 79.0 1.2 1.59 75.3 74.5 15.7 16.1 0.42 0.42 0.13 0.15 4.57 4.40 2.39 2.34 Ro Con 17.0 5.4 5.07 66.1 66.5 23.4 23.1 1.09 1.09 0.22 0.21 1.44 1.59 1.41 1.54 Spod Ro Tails 62.1 0.1 0.10 77.8 78.4 13.5 13.2 0.24 0.28 0.11 0.13 5.42 5.59 2.65 2.67 Cl Tails 4.4 3.6 3.55 69.1 69.0 20.6 20.6 0.96 0.96 0.20 0.20 2.66 2.57 2.17 2.11 Spod Cl Con 12.5 6.0 5.93 65.1 64.9 24.4 24.4 1.13 1.22 0.22 0.24 1.01 0.97 1.15 1.10 Streams Mass Pull (%) Recovery (%) Li2O SiO2 Al2O3 Fe2O3 CaO Na2O K2O Feed 100 100 100 100 100 100 100 100 Combined Mag Con 2.3 4.7 1.9 2.9 22.3 3.7 1.3 2.0 Combined Mica Con 13.2 2.4 12.9 13.1 11.4 7.2 12.1 23.8 Combined Slimes 9.9 6.1 9.3 10.3 19.3 48.2 10.7 12.4 Cyclone #4 U/F 74.6 86.7 75.9 73.7 47.0 40.9 75.9 61.8 Flot Feed 79.0 103.5 80.0 79.6 53.8 44.6 78.5 65.1 Ro Con 17.0 95.6 15.1 25.5 29.6 15.6 5.3 8.3 Spod Ro Tails 62.1 7.9 65.0 54.1 24.2 29.0 73.2 56.8 Cl Tails 4.4 16.8 4.1 5.9 6.8 3.7 2.6 3.3 Spod Cl Con 12.5 78.8 11.0 19.7 22.8 11.9 2.8 5.0

Authier Lithium DFS Technical Report Summary – Quebec, Canada 163 PP-07S2 Stream Mass Pull (%) Assay (%) Li2O SiO2 Al2O3 Fe2O3 CaO Na2O K2O Adj. Meas. Adj. Meas. Adj. Meas. Adj. Meas. Adj. Meas. Adj. Meas. Adj. Meas. Feed 100 1.0 1.10 74.5 74.2 15.5 15.6 0.58 0.49 0.21 0.15 4.64 4.58 2.80 2.90 Combined Mag Con 2.4 2.0 1.98 61.9 61.9 19.6 19.6 5.86 6.11 0.39 0.40 2.58 2.58 2.54 2.54 Combined Mica Con 14.0 0.2 0.19 74.4 74.4 15.2 15.2 0.27 0.28 0.12 0.13 4.55 4.56 4.83 4.79 Combined Slimes 11.8 0.7 0.67 71.6 71.6 16.0 16.0 1.16 1.21 0.68 0.77 4.96 4.97 3.52 3.50 Cyclone #4 U/F 71.7 1.2 1.38 75.4 75.8 15.4 15.5 0.37 0.38 0.14 0.15 4.67 4.65 2.30 2.23 Flot Feed 76.3 1.3 1.51 75.2 74.9 15.6 15.9 0.39 0.43 0.14 0.15 4.59 4.49 2.30 2.28 Ro Con 17.9 5.1 4.88 67.1 67.4 22.7 22.4 1.07 1.04 0.23 0.23 1.61 1.69 1.44 1.48 Spod Ro Tails 58.4 0.1 0.08 77.6 77.7 13.4 13.1 0.19 0.19 0.12 0.14 5.50 5.71 2.56 2.60 Cl Tails 4.5 2.9 2.84 70.8 70.7 19.0 19.0 0.78 0.78 0.18 0.18 3.25 3.18 2.31 2.29 Spod Cl Con 13.4 5.8 5.78 65.9 65.7 24.0 24.1 1.16 1.20 0.25 0.26 1.05 1.03 1.15 1.13 Streams Mass Pull (%) Recovery (%) Li2O SiO2 Al2O3 Fe2O3 CaO Na2O K2O Feed 100 100 100 100 100 100 100 100 Combined Mag Con 2.4 4.9 2.0 3.1 24.4 4.6 1.3 2.2 Combined Mica Con 14.0 2.7 14.0 13.7 6.6 8.2 13.7 24.1 Combined Slimes 11.8 8.0 11.4 12.2 23.5 38.6 12.7 14.9 Cyclone #4 U/F 71.7 84.4 72.6 71.0 45.6 48.6 72.3 58.8 Flot Feed 76.3 97.6 77.0 76.6 51.6 52.5 75.5 62.6 Ro Con 17.9 91.9 16.2 26.3 32.8 19.7 6.2 9.2 Spod Ro Tails 58.4 5.7 60.8 50.3 18.8 32.8 69.2 53.3 Cl Tails 4.5 13.1 4.3 5.6 6.1 3.9 3.2 3.8 Spod Cl Con 13.4 78.8 11.8 20.7 26.7 15.8 3.0 5.5 Authier Lithium DFS Technical Report Summary – Quebec, Canada 164 Continuous pilot plant operation produced roughly 400 kg of spodumene concentrate. Concentrate from each campaign (operating shift) was individually collected. The spodumene concentrate produced during pilot plant campaign PP-11 was analyzed by QEMSCAN. The mineralogical composition of the concentrate sample is presented in Table 10-26. Table 10-26 – Mineralogical analysis of PP11 spodumene concentrate. Mineral Composite 1 Years 0-5 (wt %) Spodumene 77.9 K-Feldspar 7.1 Plagioclase 5.5 Quartz 3.3 Biotite 2.2 Muscovite 1.0 Amphibole/Pyroxine 0.8 Fe-Al Silicate 0.7 Chlorite 0.8 Other 0.7 Total 100 Summary of 2018 Pilot Plant Testwork Program The 2018 pilot plant program confirmed the flowsheet and design parameters for the Authier Lithium Project process plant. Testwork confirmed: • Grind size (P80) of 180 µm; • WHIMS was necessary to remove iron-bearing silicate minerals prior to flotation; • Mica flotation in a rougher-scavenger arrangement; • High-density conditioning with fatty acid collector was required to achieve >75% recovery; • Two stages of spodumene cleaning were needed to achieve spodumene concentrate grade of 6.0% Li2O with >75% lithium recovery.

Authier Lithium DFS Technical Report Summary – Quebec, Canada 165 10.5.2 Sayona Québec Batch Optimization Test Program (2018) A sub-sample of each of the two pilot plant feed samples (Composite 1 and Composite 2) were tested during the optimization test program undertaken at SGS in 2018. The program included sample preparation, stage-grinding, wet high-intensity magnetic separation, and flotation. The main objectives of the program were to: • Determine optimal pulp density during spodumene conditioning; and • Test the effect of spodumene collector dosage on concentrate lithium grade and recovery. The lithium grades of Composite 1 and Composite 2 were similar, at 1.03% Li2O and 1.08% Li2O, respectively. The iron content in Composite 1 was higher (0.77% Fe2O3) than that of Composite 2 (0.46% Fe2O3). The metallurgical target was the production of a concentrate grading 6.0% Li2O with 80% lithium recovery. The samples were stage-ground to a K80 of 180 μm. WHIMS was undertaken on the flotation feed. A preliminary flotation test was conducted on Composite 1 using similar conditions to those used in optimized laboratory flotation tests during the pilot plant program. The results of the test were similar to those of the baseline test, producing a 3rd cleaner concentrate grading 6.03% Li2O with 77.2% lithium recovery. Multiple batch tests were undertaken, and the mica tailings streams were homogenized to form a single spodumene flotation feed sample to eliminate variations due to the upstream processes. Lithium losses to the combined slimes, magnetic concentrate, and mica concentrate were similar for both Composite 1 and Composite 2, averaging 6.1%, 3.3%, and 2.6%, respectively. The spodumene flotation tests on Composite 1 and Composite 2 evaluated the impact of conditioning pulp density and collector dosage on flotation performance. The results for both samples showed a significant improvement in concentrate lithium recovery was obtained when the conditioning pulp density was increased from 50% to 55% solids. Further increases in pulp density resulted in more marginal increases in lithium recovery for both composites (Figure 10-8 and Figure 10-9). Authier Lithium DFS Technical Report Summary – Quebec, Canada 166 Figure 10-8 – Effect of pulp density during spodumene conditioning (Composite 1). Figure 10-9 – Effect of pulp density during spodumene conditioning (Composite 2).

Authier Lithium DFS Technical Report Summary – Quebec, Canada 167 A conditioning pulp density of 60% w/w solids was selected for the tests evaluating collector dosage; from the results of these tests, it was determined that a spodumene collector dosage of 800 g/t was sufficient to produce a concentrate grading >6% Li2O with high lithium recovery (>75%) from both composites. The iron content was higher in the spodumene concentrates produced in the flotation tests on Composite 1 (average 1.70% Fe2O3) compared to those produced in the flotation tests on Composite 2 (average 1.12% Fe2O3). 10.6 QUALIFIED PERSONS COMMENTARY Extensive (feasibility-level) batch and pilot-scale test work has been undertaken on mineralized samples from the Authier deposit. The historical test work results confirm that Authier ore is amenable to concentration using conventional spodumene concentration methods (i.e., froth flotation). Authier Lithium DFS Technical Report Summary – Quebec, Canada 168 11 MINERAL RESOURCE ESTIMATES 11.1 DATA USED FOR ORE GRADE ESTIMATION 11.1.1 Exploratory Data Analysis Exploratory data analysis for lithium (%Li2O) was completed on both original analytical data and composite data contained within the modelled mineralized solids. The coordinates of the drillholes were measured in the field in UTM coordinates. In 2018, a high precision LiDAR topographic surface was completed by Sayona. All drillhole collars were draped to the LiDAR surface. The database used for the current MRE comprises data for 192 surface drillholes, totalling 31,123.82 metres, completed in the Deposit area between 1993 and 2018. The database totals 5,049 drill core assay samples representing 6,608.31 metres of drilling. Drill core was assayed mostly for pegmatite occurrences and surrounding host rock, both hanging and footwall. A database validation process was done for any inconsistencies (gaps & overlaps) of length, grade, lithological records, drillhole locations collar and aberrant downhole surveys. Table 11-1 shows the database available data statistics. Table 11-1 – Database statistics. Database Description Record Number Holes 192 Surveys 1,289 Assays 5,049 Intervals 203 Lithologies 2,738 Alterations 589 Mineralization 592 11.1.2 Analytical Data There is a total of 5,049 assay intervals in the database used for the current MRE and 2,406 of them are contained inside the mineralized solids (Authier Main1 (110), Authier Main2 (201) and Authier North (301)). Drill core was assayed mostly for pegmatite occurrences and surrounding host rock, both hanging wall and footwall. Table 11-2 shows the range of Li2O values from the analytical data inside the mineralized solids.

Authier Lithium DFS Technical Report Summary – Quebec, Canada 169 Table 11-2 – Range of analytical data inside mineralized solids. Assays in 2020 Authier Envelope Li2O (%) Min Value - Max Value 2.77 Average 1.01 Length Weighted Average 1.00 Sum of Length 3,234 Variance 0.24 Standard Deviation 0.49 % Variation 0.48 Median 1.00 First Quartile 0.66 Third Quartile 1.37 Count* 2,405 Count Missing (-1) 1 Assays received in Li values were transformed into Li2O values using the conversion factor of 2.153. This conversion factor was used upon conversations with Sayona and peers, according to sources such as the Ministry of Petroleum and Mines of British Columbia: https://www2.gov.bc.ca/gov/content/industry/mineral-exploration-mining/british-columbia-geological- survey/mineralinventory/documentation/minfile-coding- manual?keyword=element&keyword=conversion#appendices The core holes drilled on the Project are generally oriented south (163° to 194°), perpendicular to the general orientation of the pegmatite intrusions, and have a weak to moderate deviation towards the west (Figure 11-3). Their spacing is typically 25 m with larger spacing of 50 m spacing between sections 706750 mE and 707975 mE. The drillhole dips range from 43° to 75° with an average of 50° and the drillhole intercepts range from approximately 70% of true width to near true width of the mineralization. 11.1.3 Mineralized Intervals Data Mineralized intervals were selected for the modelling of the 3D wireframe. A minimum grade of 0.4% Li2O over a minimum drillhole interval length of 2 m was generally used as a guideline to define the width of mineralized interpretations on sections, i.e., polygons. Only Pegmatite intervals were kept even if there Authier Lithium DFS Technical Report Summary – Quebec, Canada 170 were good results either on the footwall or hanging wall side of the pegmatite body. Some lower-grade pegmatite intervals were kept for geological continuity. Mineral intervals that were not retained during the creation of the interpretation on sections were discarded. A special attention was made to discriminate the spodumene-bearing pegmatite from the baren pegmatite intervals. A separate solid was created for the barren pegmatite. It is usually present, but not always, at the footwall and at the hanging wall. 11.1.4 Composites Data Block model grade interpolation was conducted on composited analytical data. A 1.5 m composite calculated length has been selected based on the average thickness of 1 m (2016-2018) assay lengths and previous 1.5 m assays lengths. Approximately 24% of the assay data has an average1.5 m assayed length and 45% of assays are between 1 m and 1.5 m. Compositing is conducted within the downhole mineralized intervals that were also used for 3D solid creation. A maximum of 1.5 m and a minimum of 0.25 m was applied to composite creation settings. Calculated length composites are created by finding the appropriate length of the composites to fit entirely the mineralized intervals. The calculated length was established for every interval trying to be as close as possible to the specified 1.5 m lengths. No capping was applied on the composite analytical data. Table 11-3 shows the statistics of the analytical composites used for the interpolation of the resource block model and Figure 11-1 and Figure 11-2 show the related histograms for Li2O. Figure 11-3 and Figure 11-4 display the spatial distribution of the composites in plan and longitudinal view respectively (hole collars are shown as blue circles and sample composites are shown as black diamonds).

Authier Lithium DFS Technical Report Summary – Quebec, Canada 171 Table 11-3 – Statistics for the 1.5-m composites for Li2O. Descriptive Statistics Li2O(%) Min Value - Max Value 2.61 Average 0.70 Length Weighted Average 0.70 Sum of Length 4,936 Variance 0.32 Standard Deviation 0.57 % Variation 0.81 Median 0.71 First Quartile 0.08 Third Quartile 1.16 Count 3,321 Count Missing - * Histogram does not show the very low-grade composites associated to the internal Waste (999) and the barren pegmatite (100) solids Figure 11-1 – Histograms of the composites. Authier Lithium DFS Technical Report Summary – Quebec, Canada 172 Figure 11-2 – Histograms of the Authier mineralised solid original samples compared to the composites. Figure 11-3 – Plan view showing the spatial distribution of the composites.

Authier Lithium DFS Technical Report Summary – Quebec, Canada 173 Figure 11-4 – View showing the distribution of the composites (looking north). 11.1.5 Specific Gravity An average specific gravity of 2.71 t/m3 was used to calculate tonnage from the volumetric estimates of the block model. The average specific gravity is derived from the 38 specific gravity measurements (Table 11-4) taken by SGS from representative mineralized core samples from the 2010 drilling campaign. In 2017, 15 additional specific gravity measurements were added. The new total of 53 measurements were used to verify the specific gravity that is still 2.71 t/m3. Table 11-4 – Specific gravity statistics on Authier. Authier Project - Spodumene pegmatite S.G. (t/m3) Count 53 Mean 2.711 Std Dev 0.006 Relative Std Dev 0.25% Minimum 2.62 Median 2.71 Maximum 2.86 Authier Lithium DFS Technical Report Summary – Quebec, Canada 174 11.2 GEOLOGICAL INTERPRETATION In 2021, the update of the 2017-2018 geological interpretation helped with updating the 3D wireframe solids of the mineralization. For the purpose of modelling, sections (looking east) were generated every 25 m, with intermediate sections where it was necessary to tie in the solids. The modelling was first completed on sections to define mineralized polygons using the lithologies and analytical data for lithium. A minimum grade of 0.4% Li2O over a minimum drillhole interval length of 2 m was generally used as a guideline to define the width of mineralized interpretations (Figure 11-9). The final 3D wireframe model was constructed by meshing the defined mineralized interpretations based on the geological interpretation. Host rock and internal waste were considered and dealt with during modelling. The updated interpretation continues to show the Main zone, with an E-W strike and dipping between 30° (Main2 3D wireframe solid) to 55° (upperpart of Main 1 3D wireframe solid), averaging -45° towards the north (Figure 11-8 & Figure 11-9). The Authier North 3D wireframe solid is not connected to the Main zone and forms a flat shallow north dipping structure at about 15-20°. Local smaller 3D wireframe solids of significant sized xenolith material (waste) located inside the Main 3D solid were also modelled. The Main and North 3D wireframe solids were cut by the latest 2018 overburden/bedrock contact surface. (See below). There is also the presence of a barren pegmatite body mostly surrounding, sporadically, the main zone. Assay results indicate no or very low lithium values. This solid was also modelled for additional knowledge of the Deposit. In fall 2021, BBA did a review of the barren host rock surrounding the Authier pegmatite. A total of four solids were made and given to SGS for added knowledge. These solids are not part of the resource modelling and act as added knowledge. Figure 11-5 to Figure 11-8 show the interpretation of the mineralized solids. 11.2.6 Topographic and Overburden/Bedrock Contact Surfaces In 2018, a high precision LiDAR topographic surface was flown by Sayona. All drillhole collars were draped to the surface. An overburden/bedrock interface 3D surface has been generated and updated with 2017- 2018 data by triangulating the lower intercept of the overburden-coded lithology from the drillhole dataset. This overburden/bedrock contact surface was used to cut the Main and North 3D solids.

Authier Lithium DFS Technical Report Summary – Quebec, Canada 175 Figure 11-9 shows the final 3D wireframe solids in isometric view. The different colors of the 3D wireframe solids do not represent any specific parameters and are used to help the visual differentiation. Figure 11-5 – Section E706800 (looking west) interpretations of the mineralized solids. Authier Lithium DFS Technical Report Summary – Quebec, Canada 176 Figure 11-6 – Section E707050 (looking west) interpretations of the mineralized solids. Figure 11-7 – Section E707400 (looking west) interpretations of the mineralized solids.

Authier Lithium DFS Technical Report Summary – Quebec, Canada 177 Figure 11-8 – Section E707500 (looking west) interpretations of the mineralized solids. Figure 11-9 – Isometric view of the final mineralized solids. Authier Lithium DFS Technical Report Summary – Quebec, Canada 178 11.3 RESOURCE ESTIMATE METHODOLOGY, ASSUMPTIONS AND PARAMETERS Completion of the current updated Mineral Resource Estimate involved the assessment of a drillhole database, which included all data for drilling completed through early 2018, an updated three- dimensional (3D) geologically controlled wireframe model, revised pit optimization parameters from BBA, review of the classification of the Mineral Resource Estimate (Measured, Indicated, and Inferred) and review of available written reports. Inverse Distance Squared (ID2) restricted to a geologically controlled wireframe model was used to Interpolate Li2O (%) grades into a block model. The Mineral Resource Estimate takes into consideration that the current Deposit will be mined by open-pit mining methods. To complete an updated Mineral Resource Estimate for the Deposit, a database comprising a series of comma delimited spreadsheets containing drillhole and channel information was provided by Sayona Québec. The database included diamond drillhole collar data (NAD83 / UTM Zone 17), survey data, assay data, and lithology data. The data was then imported into the GeoBase database management software operated in Access®. Once importation was completed a validation process was done for any inconsistencies of length, grade, lithological records, and aberrant deviation records. The Database was then imported in the SGS proprietary geological modelling and resource estimation software called Genesis© for statistical analysis, QA/QC verification, block modelling and resource estimation and classification. Historical drillholes remain present in the database. Some twin drilling and sampling were done previously and permitted the use of the historical data. This section reports the results of the October 6, 2021, updated Mineral Resource Estimate (MRE) for the Authier lithium Project. The Mineral Resource update is using the digital database supplied by Sayona (as of August 21, 2021) which includes drillhole data completed by Sayona and previous owners since 2009. The effective date of the Authier MRE is October 6, 2021. Additional density results of the surrounding waste rock material were considered in this study. The MRE is derived from a computerized resource block model. The construction of the block model starts with the modelling of 3D wireframe solids of the mineralization using drillhole Li2O% analytical results and lithological data. The solids from the past Mineral Resource estimation were updated to fit the new data and interpretations were changed in certain sections of the Deposit given the new data from the 2017- 2018 infill drilling and exploration. The analytical data contained within the wireframe solids was normalized to generate fixed length analytical composites. The composite data was used to interpolate the block grades. Blocks were regularly spaced on a defined grid, filling the 3D selected wireframe solids. An optimized pit shell model, using the pit optimization software Whittle©, was produced by SGS Geological Services in 2021. The interpolated blocks located below the bedrock/overburden interface,

Authier Lithium DFS Technical Report Summary – Quebec, Canada 179 within the optimized pit shell and above a determined cut-off grade, constitute the Mineral Resources. The blocks are then classified based on confidence levels using proximity to composites, composite grade variance and mineralized solid geometry. The 3D wireframe modelling, block model, and MRE were completed by SGS based on information provided by Sayona. 11.4 MINERAL GRADE ESTIMATION AND GRADE INTERPOLATION METHODOLOGY 11.4.1 Geostatistical Study 2018-2020 In 2018 (revised in 2020) SGS revised the geostatistical study of the Main1 3D wireframe solid. To determine the continuity and distribution of the Li2O grades, the 1.5 m composites were submitted to a variography study. The variography study helped in the determination of the search ellipse criteria and for the kriging parameters for the block interpolation process. The composites show a normal distribution (Figure 11-1) with a relatively low coefficient of variation (standard deviation to the Mean) of 52%. A variogram was generated for the Main zone orientation (including the Main2) dip north. The resulting model variogram for the Main zone (2020) can be shown with the following function (Table 11-5): Table 11-5 – Variography settings. Name Variable Type Sill Longest Median Shortest Azimuth Dip Spin Range Range Range 2020Main1 Li2O Nugget 0.3 0 0 0 0 0 0 2020Main1 Li2O Exponential 0.2 15 15 5 90 0 -55 2020Main1 Li2O Exponential 0.5 20 20 10 90 0 -55 Where N represents a nugget effect of 30% and maximum continuity of 60 m* is found along both the strike and the dip orientations (-55°). The shortest range is found across the mineralization with a range of 15 m* towards the south and 35° of dip (Figure 11-12). * Exponential component ranges are three times longer than in this table in reality, i.e., First Exponential component: 45 m, 45 m, 15 m. Second Component: 60 m, 60 m, 30 m. Authier Lithium DFS Technical Report Summary – Quebec, Canada 180 11.4.2 Resource Block Modelling A block size of 3 m (NE-SW) by 3 m (NW-SE) by 3 m (vertical) was selected for the resource block model of the Authier Project based on drillhole spacing, width and general geometry of mineralization, but primarily by the selected SMU from the feasibility study. The 3 m vertical dimension corresponds to the bench height of a potential small open-pit mining operation. The 3 m NE-SW dimension corresponds to about the selected degree of selectivity Sayona is wanting to achieve during mining. It also accounts for the variable geometry of the mineralization in that direction. The 3 m NW SE block dimension accounts for the average minimum width of the mineralization modelled at Authier. The resource block model contains 473,962 blocks located inside the mineralized solids (Authier Main1(110), Authier Main2 (201), Authier North (301)) totalling 7,993,779.19 m3 and two barren solids (Internal waste (999), Barren Pegmatite (100)) totalling 2,539,939.33 m3, for a total volume (mineralized and unmineralized) of 10,533,712.52 m3 (Authier Main1, Authier Main2 and Authier North solids only). The Block model was created with block fractions ranging from 0 to 1. Table 11-6 summarizes the parameters of the block model limits. Table 11-6 – Resource block model parameters. Direction Block Size (m) Block Model Origin (Block Edge) Number of Blocks Coordinates (Block Edges) Min (m) Max (m) NE-SW (x) 3 706,699.5 407 706,699.5 707,920.5 NW-SE (y) 3 5,359,998.5 235 5,359,998.5 5,360,703.5 Elevation (z) 3 -51.5 133 -51.5 347.5 11.4.3 Block Model Interpolation The retained grade interpolation for the Authier lithium resource block model is the ID2 methodology. The interpolation process was conducted using three successive passes with more inclusive search conditions from one pass to the next until most blocks were interpolated for each mineralized zone, including the barren pegmatite. Variable search ellipse orientations were used to interpolate the blocks. The general dip direction and strike of the mineralized pegmatite were modelled on each section and then interpolated in each block (Figure 11-10). During the interpolation process, the search ellipse was orientated following the orientation grid (Figure 11-10). The orientation grid generated the interpolation direction, azimuth-dip (dip direction) and spin (strike direction) for each block, hence better representing the dip and orientation of the mineralization. The first pass was interpolated using a search ellipsoid distance of 50 m (long axis) by 50 m (intermediate axis) and 25 m (short axis) with an average orientation of 90° azimuth (local grid), -55° dip and 0° spin

Authier Lithium DFS Technical Report Summary – Quebec, Canada 181 which represents the general geometry of the pegmatites in the Deposit. Using search conditions defined by a minimum of five composites, a maximum of 15 composites and a maximum of two composites per hole (minimum of three holes), 40% of the blocks were estimated. For the second pass, the search distance was twice the search distance of the first pass and composite selection criteria were kept the same as for the first pass. A total of 79% of the blocks were interpolated following the second pass. Finally, the search distance of the third pass was increased to 300 m (long axis) by 300 m (intermediate axis) by 150 m (short axis) and again the same composites selection criteria were applied. The purpose of the last interpolation pass was to interpolate the remaining un-estimated blocks mostly located at the edges of the block model, representing 21% of the blocks. Figure 11-10 illustrates the three search ellipsoids used for the different interpolation passes. Figure 11-11 shows the results of the block model interpolation in oblique view. Figure 11-10 – Search ellipsoids and orientation grid used in the interpolation process. Authier Lithium DFS Technical Report Summary – Quebec, Canada 182 Figure 11-11 – Isometric and plan views of the interpolated block model (ID2).

Authier Lithium DFS Technical Report Summary – Quebec, Canada 183 Figure 11-12 – Section E706800 (looking west) view of the interpolated block model (ID2). Figure 11-13 – Section E707050 (looking west) view of the interpolated block model (ID2). Authier Lithium DFS Technical Report Summary – Quebec, Canada 184 Figure 11-14 – Section E707400 (looking west) view of the interpolated block model (ID2). Figure 11-15 – Section E707500 (looking west) view of the interpolated block model (ID2).

Authier Lithium DFS Technical Report Summary – Quebec, Canada 185 Figure 11-16 – Bench (Z202) view of the interpolated block model (ID2). 11.4.4 Statistical Validation of the Interpolation Process In order to validate the interpolation process, the block model was compared, statistically, to the assays and composites. The distribution of the assays, composites and blocks are normal and show a similar average value with decreasing levels of variance (Figure 11-18 to Figure 11-22). The assays and composites have respective averages of 0.79% Li2O and 0.69% Li2O with variances of 0.34 and 0.32. The resulting interpolated blocks have an average value of 0.74% Li2O with a variance of 0.20% (Figure 11-17) Authier Lithium DFS Technical Report Summary – Quebec, Canada 186 Figure 11-17 – Variogram of the 1.5 m composites for Li2O% grades.

Authier Lithium DFS Technical Report Summary – Quebec, Canada 187 Figure 11-18 – Histogram of blocks (ID2) vs. composites vs. assays. Figure 11-19 – Boxplot of blocks (ID2) vs. composites vs. assays. Authier Lithium DFS Technical Report Summary – Quebec, Canada 188 Figure 11-20 – Swath plot (X) of blocks vs. composites vs. volume. Figure 11-21 – Swath plot (Y) of blocks vs. composites vs. volume.

Authier Lithium DFS Technical Report Summary – Quebec, Canada 189 Figure 11-22 – Swath plot (Z) of blocks vs. composites vs. volume. Table 11-7 – Statistical comparison of assay, composite, and block data statistics report. Statistics Li2O(%) Blocks Composites Assays Min Value 0 0 0 Max Value 2.18 2.61 2.76 Average 0.74 0.69 0.79 Length Weighted Average - 0.70 0.79 Sum of Length 4,936 4,331 Variance 0.20 0.32 0.34 Standard Deviation 0.44 0.57 0.58 % Variation 0.60 0.81 0.74 Median 0.84 0.71 0.80 First Quartile 0.30 0.08 0.22 Third Quartile 1.08 1.16 1.26 Count 473,962 3,321 3,251 Furthermore, the block values were compared to the composite values located inside the interpolated blocks (Figure 11-23). This enables us to test for possible over- or under-evaluation of the grade by the search parameters by testing the local correlation. Authier Lithium DFS Technical Report Summary – Quebec, Canada 190 Figure 11-23 – Block values versus composites inside those blocks comparison. 11.5 MINERAL RESOURCE CLASSIFICATION The Mineral Resources at Authier Lithium are classified into Measured, Indicated, and Inferred categories. The Mineral Resource classification follows the S-K §229.1304 definitions and guidelines and is based on the density of analytical information, the grade variability and spatial continuity of mineralization. The Mineral Resources were classified in two successive stages: automatic classification followed by manual editing of final classification results. The resource classification at Authier Lithium has been applied based on the following criteria; • Search volume • Internal structure of the mineralized zone (whether traceable between drillholes) • Distance to samples (proxy for drill hole spacing) • Number of samples • Extrapolation of mineralization

Authier Lithium DFS Technical Report Summary – Quebec, Canada 191 The first automatic classification stage is focused on composites (and drillholes) rather than blocks. The classification process focuses on each composite respecting a minimum number of nearby composites from a minimum number of holes located within a search ellipsoid of a given size and orientation. For the Measured resource category, the search ellipsoid was 50 m (strike) by 50 m (dip) by 25 m with a minimum of seven composites in at least three different drillholes (maximum of two composites per hole) An ellipse fill factor of 55% was applied to the Measured category i.e., that only 55% of the blocks were tagged as Measured within the search ellipse. For the Indicated category, the search ellipsoid was twice the size of the Measured category ellipsoid using the same composite selection criteria. An ellipse fill factor of 55% was applied to the Indicated category. All remaining blocks were considered to be in the Inferred category. This automatic classification, centred on composites, is preferred to the more classical method of classification, centred on blocks, in a sense that it is significantly limiting the spotted dog effect. The second classification stage involved the manual addition of indicated block clusters into the Measured category. The objective was to smooth the spotted dog effect most evident in the Measured category; and also, to consider the geological continuity and grade. The second stage consisted of the reassignment of selected Indicated blocks within the Measured category general area into the Measured category. The second classification stage also involved the manual transfer of Indicated blocks clusters into the Inferred category. The objective was to assign a more appropriate classification to areas where the density and quality of geological information was insufficient. Figure 11-24 to Figure 11-29 show the block model automatic classification on different sections and benches and the final manual classification of the blocks on sections, plan views and isometric view with respective categories (categories: Measured – red, Indicated – blue, and Inferred – grey). Authier Lithium DFS Technical Report Summary – Quebec, Canada 192 Figure 11-24 – Classified block model on bench (Z202). Figure 11-25 – Classified block model on section E706800.

Authier Lithium DFS Technical Report Summary – Quebec, Canada 193 Figure 11-26 – Classified block model on section E707050. Figure 11-27 – Classified block model on section E707400. Authier Lithium DFS Technical Report Summary – Quebec, Canada 194 Figure 11-28 – Classified block model on section E707500. Figure 11-29 – Block model final classification in plan and isometric views.

Authier Lithium DFS Technical Report Summary – Quebec, Canada 195 11.6 CLASSIFIED MINERAL RESOURCE ESTIMATES The Mineral Resources of Authier Lithium are reported using an open-pit mining perspective. Due to the significant depth extent of the resource block model, it is considered that not all the interpolated blocks could meet the requirement of a reasonable prospect of economic extraction stated in the SEC guidelines for resources estimation. To define the Mineral Resources of Authier lithium, SGS created and used an optimized pit shell, that was done in the Whittle software, which corresponds to the ultimate pit shell in the present study at a revenue factor of 1. The final Mineral Resources include the resource blocks located within the optimized pit shell, below the overburden/bedrock interface and above the cut-off grade of 0.55% Li2O established by Sayona and BBA. See The following table describes the Authier Mineral Resource Statement exclusive of Mineral Reserves. Mineral Reserves are described in the next section. The final MRE exclusive of Mineral Reserves within the open pit are reported at a cut-off of 0.55% Li2O and total 0.22 Mt, with an average grade of 0.80% Li2O in the Measured category, and 3.2 Mt, with an average grade of 0.98% Li2O in the Indicated category, for a combined total of 3.4 Mt at an average of 0.96% Li2O in the Measured and Indicated categories. An additional 6.3 Mt, with an average grade of 0.98% Li2O in the Inferred category is also present at Authier Lithium. The effective date of the Authier MRE is October 6, 2021, and Table 11-9 shows the Authier Mineral Resource Statement exclusive of Mineral Reserves. Table 11-9 – Authier Mineral Resource statement at effective date of October 6, 2021 based on USD $977/t Li₂O, exclusive of Mineral Reserves. Authier – Total Open Pit Constrained Mineral Resource Statement Category Tonnes (Mt) Grade (% Li2O) Cut-Off Grade (% Li2O) Met Recovery % Measured 0.23 0.8 0.55 78 Indicated 3.18 0.98 0.55 78 Measured and Indicated 3.40 0.96 0.55 78 Inferred 6.35 0.98 0.55 78 Notes: 1. Mineral Resources are 100% attributable to the property. Sayona has 100% interest in Authier. Authier Lithium DFS Technical Report Summary – Quebec, Canada 196 2. Mineral Resources are exclusive of Mineral Reserves. 3. The Mineral Resource was estimated by Maxime Dupéré from SGS, Qualified Person under S-K §229.1304 who assumes responsibility. 4. Mineral Resources do not have demonstrated economic viability. The estimate of Mineral Resources may be materially affected by environmental, permitting, legal, title, taxation, socio-political, marketing, or other relevant issues. 5. The Inferred Mineral Resource in this estimate has a lower level of confidence that applied to an Indicated Mineral Resource and is not converted to a Mineral Reserve. It is reasonably expected that the majority of the Inferred Mineral Resource could be upgraded to an Indicated Mineral Resource with continued exploration. 6. Numbers in the table might not add precisely due to rounding. 7. Resources are within the Pit :Authier20210821_977.dxf,; and under the optimised pit design (5m Contour) 8. Bulk density of 2.71 t/m³ is used. 9. Effective date October 6, 2021. 10. Only block centroids had to be inside the pit to be considered. 11. The Mineral Resource estimate has been assembled using the regulation S-K §229.1304 of the United States Securities and Exchange Commission (SEC). Mineral Resources, which are not Mineral Reserves, do not have demonstrated economic viability. Inferred Mineral Resources are exclusive of the Measured and Indicated Resources. * Rounded to the nearest thousand. Table 11-10 for optimization parameters. The purpose of pit optimization is to determine the best scenario of pit limits that satisfy business objectives for the Mineral resources. By selecting a revenue factor of 1, the results were used to determine the most comprehensive and available mineral resources available for extraction. Pit optimization was completed with the Whittle mining software. Inferred resources were considered during this optimization. The pit optimization was developed based on the integration of the costs and parameters associated with the concentration of the ore and production and selling of a 6.0% Li2O spodumene concentrate. The input parameters used for the Resource pit optimization are presented in Table 11-10 – Parameters used by SGS for the Resource pit optimization.Note that the selling prices, costs, and technical parameters

Authier Lithium DFS Technical Report Summary – Quebec, Canada 197 used were based on the best available information at the time of the study, including adjusted costs from the 2019 UDFS and geotechnical information from Journeaux Assoc.’s (Journeaux) report (2018). The final MRE within the open pit are reported at a cut-off of 0.55% Li2O and total 6.04 Mt, with an average grade of 0.988% Li2O in the Measured category, and 8.10 Mt, with an average grade of 1.03% Li2O in the Indicated category, for a combined total of 14.1 Mt at an average of 1.01% Li2O in the Measured and Indicated categories. An additional 3.00 Mt, with an average grade of 1.00% Li2O in the Inferred category is also present at Authier Lithium. The effective date of the Authier MRE is October 6, 2021, and Table 11-8 shows the final resource classifications. The MRE described in this paragraph are resources inclusive of mineral reserves, as they were calculated during the UDFS. Authier Lithium DFS Technical Report Summary – Quebec, Canada 198 Table 11-8 – Authier Mineral Resource statement at effective date of October 6, 2021 based on USD $977/t Li₂O, inclusive of Mineral Reserves. Authier – Open-pit Constrained Mineral Resource Statement Category Tonnes* (Mt) Grade (% Li2O) Cut-Off Grade (% Li2O) Met Recovery % Measured 6.04 1% 0.55 78% Indicated 8.01 1% 0.55 78% Measured and Indicated 14.14 1% 0.55 78% Inferred 2.99 1% 0.55 78% Notes: 1. Mineral Resources are 100% attributable to the property. Sayona has 100% interest in Authier. 2. Mineral Resources are inclusive of Mineral Reserves. 3. The Mineral Resource was estimated by Maxime Dupéré from SGS, who serves as Qualified Person under S-K §229.1304 regulations. 4. Mineral Resources do not have demonstrated economic viability. The estimate of Mineral Resources may be materially affected by environmental, permitting, legal, title, taxation, socio-political, marketing, or other relevant issues. 5. The Inferred Mineral Resource in this estimate has a lower level of confidence that applied to an Indicated Mineral Resource and is not converted to a Mineral Reserve. It is reasonably expected that the majority of the Inferred Mineral Resource could be upgraded to an Indicated Mineral Resource with continued exploration. 6. Numbers in the table might not add up precisely due to rounding. 7. Pit used: Authier20210821_977.dxf 8. Bulk density of 2.71 t/m³ is used. 9. Effective date October 6, 2021. 10. Only block centroids had to be inside the pit to be considered. 11. The Mineral Resource estimate has been assembled using the regulation S-K §229.1304 of the United States Securities and Exchange Commission (SEC). Mineral Resources, which are not Mineral Reserves, do not have demonstrated economic viability. Inferred Mineral Resources are exclusive of the Measured and Indicated Resources. * Rounded to the nearest thousand. The following table describes the Authier Mineral Resource Statement exclusive of Mineral Reserves. Mineral Reserves are described in the next section. The final MRE exclusive of Mineral Reserves within the open pit are reported at a cut-off of 0.55% Li2O and total 0.22 Mt, with an average grade of 0.80% Li2O in the Measured category, and 3.2 Mt, with an average grade of 0.98% Li2O in the Indicated category, for a combined total of 3.4 Mt at an average of 0.96% Li2O in the Measured and Indicated categories. An additional 6.3 Mt, with an average grade of 0.98% Li2O in the Inferred category is also present at Authier Lithium. The effective date of the Authier MRE is October 6, 2021, and Table 11-9 shows the Authier Mineral Resource Statement exclusive of Mineral Reserves.

Authier Lithium DFS Technical Report Summary – Quebec, Canada 199 Table 11-9 – Authier Mineral Resource statement at effective date of October 6, 2021 based on USD $977/t Li₂O, exclusive of Mineral Reserves. Authier – Total Open Pit Constrained Mineral Resource Statement Category Tonnes (Mt) Grade (% Li2O) Cut-Off Grade (% Li2O) Met Recovery % Measured 0.23 0.8 0.55 78 Indicated 3.18 0.98 0.55 78 Measured and Indicated 3.40 0.96 0.55 78 Inferred 6.35 0.98 0.55 78 Notes: 1. Mineral Resources are 100% attributable to the property. Sayona has 100% interest in Authier. 2. Mineral Resources are exclusive of Mineral Reserves. 3. The Mineral Resource was estimated by Maxime Dupéré from SGS, Qualified Person under S-K §229.1304 who assumes responsibility. 4. Mineral Resources do not have demonstrated economic viability. The estimate of Mineral Resources may be materially affected by environmental, permitting, legal, title, taxation, socio-political, marketing, or other relevant issues. 5. The Inferred Mineral Resource in this estimate has a lower level of confidence that applied to an Indicated Mineral Resource and is not converted to a Mineral Reserve. It is reasonably expected that the majority of the Inferred Mineral Resource could be upgraded to an Indicated Mineral Resource with continued exploration. 6. Numbers in the table might not add precisely due to rounding. 7. Resources are within the Pit :Authier20210821_977.dxf,; and under the optimised pit design (5m Contour) 8. Bulk density of 2.71 t/m³ is used. 9. Effective date October 6, 2021. 10. Only block centroids had to be inside the pit to be considered. 11. The Mineral Resource estimate has been assembled using the regulation S-K §229.1304 of the United States Securities and Exchange Commission (SEC). Mineral Resources, which are not Mineral Reserves, do not have demonstrated economic viability. Inferred Mineral Resources are exclusive of the Measured and Indicated Resources. * Rounded to the nearest thousand. Authier Lithium DFS Technical Report Summary – Quebec, Canada 200 Table 11-10 – Parameters used by SGS for the Resource pit optimization. Parameters Value Unit References Sales Revenues Concentrate Price 977 USD/tonne Sayona (6% Li2O: 2.81% Li) 1221.25* CAD/tonne Sayona Operating Costs Mining Mineralized Material 6.26 CAD/t milled BBA Mining Overburden 5 CAD/t BBA Mining Waste 5.26 CAD/t BBA Process, 5.71 CAD/t milled BBA General and Administration Freight Mine to Refinery 61.09 CAD/Conc. Sayona Metallurgy and Royalties Concentration Recovery 78 % JQCI Royalties on claims 15.23 CAD/t conc. Sayona Geotechnical Parameters Pit Slopes 43° and 54° Degrees BBA Mineralized Material Density 2.71 t/m3 SGS Canada Inc. Waste Material Density 2.94 t/m3 BBA Overburden 1.9 t/m3 BBA Cut-Off Grade 0.55 % Li2O Sayona *Exchange rate: 0.75 The breakeven Resource cut-off grade (COG) is calculated considering costs for processing, G&A, and other costs related to concentrate production and transport. Based on a 6.0% Li2O concentrate selling price of US$977 per tonne, the COG would be 0.32% Li2O. However, due to metallurgical recovery limitations, a COG of 0.55% Li2O was selected based on iterative analysis. Figure 11-30 and Figure 11-31 show the block model according to Li2O grade in isometric view of the block model with the selected optimized pit shell. Figure 11-32 shows the classified block model in isometric view of the block model with the selected optimized pit shell.

Authier Lithium DFS Technical Report Summary – Quebec, Canada 201 Figure 11-30 – Optimized pit shell and block model (no waste/barren material included) in plan and isometric views. Figure 11-31 – Optimized pit shell and block model (waste/barren material included) in plan and isometric views). Authier Lithium DFS Technical Report Summary – Quebec, Canada 202 Figure 11-32 – Optimized pit shell and classified block model in plan and isometric views. 11.7 POTENTIAL RISKS IN DEVELOPING THE MINERAL RESOURCE 11.7.1 Sensitivity Analysis A limited sensitivity analysis was conducted using different estimation methods, from Ordinary Kriging (OK) to Inverse Distance Cubed (ID3). The Sensitivity analysis outlined that the OK Mineral Resources and grades are affected by smoothing and that the ID3 estimation is the one with the highest average grades (Figure 11-33). Overall, the ID2 and ID3 are relatively close in terms of tonnage and average grades.

Authier Lithium DFS Technical Report Summary – Quebec, Canada 203 Figure 11-33 – Grade tonnage curve depending on type of estimation. Drilling by Sayona has shown that the main Authier pegmatite is reasonably predictable in both grade and geological continuity, given the consistency of mineralized widths and grades along the strike extension tested so far. Additional review of the geological model highlighted the presence of sterile pegmatite, mostly at the upper contact and the lower contact of the Main pegmatite dyke. The resource expansion achieved by Sayona on the Authier mineralized pegmatite has been basically at depth and along strike. At mid to deep levels (beyond 100 metres down surface) Sayona’s drilling has consistently intercepted mineralized pegmatite returning widths ranging from 20 to 40 metres and average grades equal to or higher than 1% Li2O, even in areas untested by previous owners. The combination of an extensional east – west structural array together with a competent brittle ultramafic metamorphic host rock allowed the placement of a wide single mineralized pegmatite body. There is a limited number of areas at shallow and deep levels that returned little or no mineralized pegmatite due to faulting interpreted as syn-mineral and post-mineral. However, the core part of the Authier pegmatite is not significantly affected by such faulting. Authier Lithium DFS Technical Report Summary – Quebec, Canada 204 This combination of characteristics makes the main Authier mineralized pegmatite predictable in both, geology and grade and allows SGS to expand the mineralization included in both Measured and Indicated resource categories based on geological continuity.

Authier Lithium DFS Technical Report Summary – Quebec, Canada 205 12 MINERAL RESERVES ESTIMATES 12.1 RESERVE ESTIMATE METHODOLOGY, ASSUMPTIONS, PARAMETERS AND CUT-OFF-VALUE The original Mineral Reserve estimate was completed in March 2023 and is based on the November 2021 block model prepared by SGS. This block model was reviewed by the QP for this report and used to report the Mineral Resources presented in Chapter 11 of this report. The Mineral Reserve estimate presented in this report was reviewed by Philippe Chabot, P.Eng., who serves as the QP for this report and has an effective date of March 27, 2023. The Mineral Reserve estimate has changed for this updated definitive feasibility study (UDFS) relative to the DFS that was prepared by BBA with an effective date of February 2019. The Authier Lithium ore will now be sent to the North American Lithium (NAL) spodumene concentrator located in La Corne, Québec to be blended with the NAL run-of-mine (ROM) ore. The ROM ore will be stockpiled and loaded into highway trucks that will transport the ore to the NAL site during weekdays. At the NAL site, the ore will be combined with the NAL ore and fed to the crusher. The life-of-mine (LOM) production plan has been reviewed to reflect the new processing strategy and the annual ore production has been reduced from the previous 833,000 tpy to approximately 530,000 tpy. The waste and overburden piles, as well as mine equipment fleet, workforce, and cost estimates, were updated based on the revised LOM plan. The Project LOM plan and subsequent Mineral Reserve estimate are based on an ore selling price of 120 CAD/t. A memorandum of understanding (MOU) was developed between the Authier operation and NAL operation, in which NAL agrees to buy 100% of the Authier ore material at a selling price of 120 CAD/t, delivered to the NAL ore pad area. The effective date of the Mineral Reserve estimate is March 27, 2023, and based on an exchange rate of 0.75 USD:1.00 CAD. Development of the LOM plan included pit optimization, pit design, mine scheduling and the application of modifying factors to the Measured and Indicated portion of the in-situ Mineral Resource. Tonnages and grades are reported as ROM feed at the NAL crusher and account for mining dilution, geological losses, and operational mining loss factors. 12.2 RESOURCE BLOCK MODEL The resource model for the Project was provided to BBA by SGS Canada via a web link. The resource model was supplied in a file called “20211117Authier.csv”. The model was supplied with the 3D Authier Lithium DFS Technical Report Summary – Quebec, Canada 206 wireframes used to define the different lithological zones. The overburden surface was also provided. This model was reviewed and validated by Ehouman N’Dah, P.Geo., who serves as the QP for this report. The block model file provided contained the mineralized zones and the waste material. The resource estimate considers a parent block size of 3 m x 3 m x 3 m. The resource model considers a constant pegmatite density of 2.71 t/m³. 12.3 TOPOGRAPHY DATA Sayona provided BBA with a LiDAR topographic survey completed in 2016 by Geoposition arpenteurs géomètres (LiDAR, 2016). Topographic contours were provided at 0.5 m intervals for the Project site in the UTM NAD 83 coordinate system. This surface was used as the reference datum for the Mineral Reserves estimate. 12.4 MINING BLOCK MODEL Based on the resource model described above, BBA created a mining block model to be used for mine design and planning purposes. The resource model was sub-celled along the boundaries of the different lithologies. Overburden material was assigned a constant density of 1.90 t/m³. The waste densities were provided in the resource model from SGS. The sub-celled model was then regularized to the parent block size of 3 m x 3 m x 3 m, with tonnages and grades coded for each type of material. Resource classification was conserved from the resource model. The final sub-celled mining block model is called “2008.dm” created from the Deswik© Project “6015032 R00.dcf”. The model was then exported to MineSight© for mine planning as “3005.csv”. 12.5 MINE AND PLANT PRODUCTION SCENARIOS 12.5.1 Modifying Factors For the conversion of Mineral Resources to Mineral Reserves, it is necessary to apply a variety of modifying factors. These will be discussed in the following subsections.

Authier Lithium DFS Technical Report Summary – Quebec, Canada 207 12.5.1.1 Metallurgical Recoveries ROM ore is subject to a variety of metallurgical recovery factors, once feed material enters the crusher. Refer to Chapter 13 of this report and to the ''Definitive Feasibility Study Report for the North American Lithium Project'' (BBA, 2023) for additional details regarding these parameters. 12.5.1.2 Mill Cut-off Grade Calculation The breakeven cut-off grade (COG) is calculated considering costs for processing, G&A, and other costs related to concentrate production and transport. Based on a 6.0% Li2O concentrate selling price of 850 USD per tonne, the COG would be 0.32% Li2O. However, due to metallurgical recovery limitations, a metallurgical COG of 0.55% Li2O was selected based on iterative analysis. 12.5.1.3 Mining Dilution and Mining Ore Losses The Project hosts spodumene-bearing pegmatite dykes. The main dyke, which represents most of the resource, dips approximately 25° to 50° and has a varying thickness between 4 m and 55 m. A second minor dyke is located just to the north of the main dyke, dips approximately 15° and has an average thickness of 7 m. As an industrial mineral, the specification of the final product must meet relatively tight tolerances for Li2O content, as well as contaminants, such as iron. The contaminant grade in the final product is directly linked to the quantity of diluting host waste rock in the mill feed. Dilution is the quantity of non-economically viable material that will be sent to the mill during mining activities. Ore losses are the quantity of economically viable material that will be sent to the waste rock stockpiles. Typical causes for dilution and ore losses include blast movement, improper identification of ore and waste zone limits (i.e., grade control), and selectivity limitations of loading equipment. A detailed dilution model was developed and coded into the mining block model. This was then used throughout the mine planning process. BBA used Deswik’s Stope Optimizer tool (Deswik.SO) to generate shapes of continuous mineralization with a minimum lithium content. This approach provided an automated method of evaluating on a local scale, whether the combination of a particular dyke width, pegmatite grade and distance to the next dyke, i.e., waste separation, could result in producing a mill feed above a diluted COG of 0.55% Li2O. Mineable Authier Lithium DFS Technical Report Summary – Quebec, Canada 208 shapes were created by the tool. Mineralized material that did not pass this selectivity test were considered as ore losses. Three scenarios of varied dilution skin were generated, and a dilution skin of 0.75 m was retained. Based on this methodology and the final pit design, the mining ore losses are approximately 2.3% and the mining dilution is approximately 9.0% dilution. To account for operational errors and additional re-handling, an additional mining ore losses factor of 2.0% was applied, for a total ore losses factor of 4.3%. 12.5.2 Pit Optimization 12.5.2.1 Inputs The purpose of pit optimization is to determine the ultimate pit limits that satisfy business objectives. By running a series with a sensitivity on selling prices (revenue factor), the results can also be used to determine the most economical mining phases. Pit optimization was completed using the Pseudoflow command with the Deswik mining software. Inferred resources were not considered as potential ROM ore feed. This report’s financial evaluation is based on the selling of ore material to the NAL operation. However, the pit optimization was developed based on the integration of the costs and parameters associated with the concentration of the ore and production and selling of a 6.0% Li2O spodumene concentrate. The input parameters used for the pit optimization are presented in Table 12-1. Note that the selling prices, costs, and technical parameters used were based on the best available information at the time of the study, including adjusted costs from the 2019 UDFS and geotechnical information from Journeaux Assoc.’s (Journeaux) report (2018). Table 12-1 – Pit optimization parameters for the Authier Lithium Project. Item Value Unit Notes Revenue Concentrate price 850 USD/t of conc. Average of Roskill Real Contract 2023-2030: USD 857/t conc. (December 2021) Concentrate grade 6.0% Li2O Transportation cost 59.69 USD/t of conc. Previous estimate for Authier Royalty Based on each claim Economics Currency - Canadian Dollars Exchange rate 0.76 USD/CAD

Authier Lithium DFS Technical Report Summary – Quebec, Canada 209 Discount rate 8.0% Cost basis Mining Mining cost - overburden 5.4 CAD/t mined BBA estimate. Assuming contract mining Mining cost - ore 8.73 CAD/t mined Mining cost - waste 6.91 CAD/t mined Processing & G&A Cost 39.31 CAD/t milled Operating parameters Ore production 1,682 tpd Overall Mill Recovery 74.10% Incl. ore sorter losses and mill recovery Geotechnical parameters OSA - north wall 53 ° Based on BBA adjustment to Journeaux's report; OSA - south wall 42 ° -4° to accommodate ramp OSA - east and west walls 48 ° Assumed by BBA for transition between North and South walls OSA - overburden 14 ° Journeaux Limits and constraints Lease Claims_Authier_Actifs.dxf Sayona stated that discussions with MERN were held concerning the suspended claims and will be reactivated when needed. Claims_Authier_Suspended.dxf Setbacks No setback m The optimized parameters do not necessarily correspond with the final design parameters used in the UDFS. A pit optimization has been run using the final Project’s costs and revenue parameters. The resulting optimized pit shell has been compared to the initial selected pit shell and deemed sufficiently close to consider the initial selected pit shell adequate. 12.5.2.2 Results The optimizer estimates best, average- and worst-case discounted values. The best case requires that each shell be mined sequentially while the worst case mines the deposit on a bench-by-bench basis. The best case is generally impracticable as shell increments can be very small and therefore not minable by themselves. The worst case is always achievable but gives much lower discounted cash flows. In practice, a compromise between the two cases is generally achieved by staging the pit using suitable pushbacks. The average case discounted values are used as a measure to compare optimization results. A discount rate of 8% and ROM feed rate of 0.53 Mtpy have been used in this analysis. The values returned by the optimizer do not include capital investments and are only used as a relative indicator of the sensitivity of the Project to changes in costs. Authier Lithium DFS Technical Report Summary – Quebec, Canada 210 The revenue factor 0.86 pit shell was selected as a guide for the final pit limits. This selection was based on maximizing project reserves while respecting a relatively high NPV. This pit shell contained approximately 11.3 Mt of ROM ore feed and is within 10% of the highest average case discounted cash flow. Table 12-2 – Pit optimization results. Revenue Factor Shell ROM Feed Grade Waste Strip Ratio DCFBEST DCFWORST DCFAVG (Mt) (% Li2O) (Mt) n/a (M$) (M$) (M$) 0.4 0.45 1.2 0.20 0.4 41.42 41.42 41.42 0.42 0.67 1.1 0.35 0.5 56.43 56.25 56.34 0.44 0.91 1.1 0.64 0.7 72.19 71.71 71.95 0.46 1.15 1.1 0.95 0.8 86.62 85.71 86.17 0.48 1.62 1.0 1.46 0.9 110.76 108.79 109.78 0.5 1.94 1.0 1.88 1.0 125.24 122.21 123.72 0.52 2.06 1.0 2.03 1.0 129.96 126.48 128.22 0.54 2.17 1.0 2.21 1.0 134.35 130.39 132.37 0.56 2.41 1.0 2.56 1.1 142.47 137.42 139.95 0.58 2.58 1.0 2.95 1.1 148.26 142.4 145.33 0.6 2.73 1.0 3.2 1.2 152.43 145.85 149.14 0.62 3.66 1.0 7.25 2.0 179.89 167.04 173.46 0.64 3.77 1.0 7.65 2.0 182.61 168.81 175.71 0.66 3.88 1.0 8.00 2.1 184.87 170.16 177.52 0.68 3.99 1.0 8.39 2.1 187.17 171.41 179.29 0.7 4.12 1.0 8.94 2.2 189.6 172.54 181.07 0.72 4.19 1.0 9.22 2.2 190.76 172.92 181.84 0.74 4.54 1.0 11.20 2.5 196.48 174.26 185.37 0.76 4.64 1.0 11.76 2.5 197.99 174.37 186.18 0.78 7.69 1.0 32.82 4.3 220.1 165.16 192.63 0.8 8.22 1.0 36.96 4.5 224.17 159.08 191.62 0.82 8.4 1.0 38.21 4.6 225.33 156.84 191.08 0.84 11.08 1.0 59.25 5.3 232.08 117.6 174.84 0.86 11.35 1.0 61.40 5.4 233.02 112.81 172.91 0.88 11.59 1.0 63.63 5.5 233.73 107.45 170.59 0.90 11.72 1.0 64.52 5.5 234 105.15 169.57 0.92 11.82 1.0 65.48 5.5 234.19 102.41 168.3 0.94 11.96 1.0 66.64 5.6 234.38 99.11 166.75 0.96 12.11 1.0 67.85 5.6 234.5 96.03 165.26 0.98 12.27 1.0 69.27 5.6 234.56 91.71 163.14 1.00 12.39 1.0 70.4 5.7 234.57 88.31 161.44 These results are presented graphically in Figure 12-1.

Authier Lithium DFS Technical Report Summary – Quebec, Canada 211 Figure 12-1 – Pit optimization results. With the exception of the revenue factors, BBA did not perform a sensitivity analysis on other parameters. It is recommended that pit optimization sensitivity be conducted on the following parameters: • Metallurgical recovery; • Overall pit slopes; • Dilution and ore losses. 12.5.3 Mine Design 12.5.3.1 Geotechnical Parameters The geotechnical requirements for the UDFS pit design were prepared by Journeaux and their recommendations were provided in a report titled “Open Pit Slope Design Authier Lithium Project Feasibility Study”. Recommendations were provided for the overall slope angle (OSA), inter ramp angle (IRA), bench face angle (BFA) and catch bench width. BBA performed an internal review of the Journeaux (2018) report and provided additional recommendations to ensure stability of the pit walls: • Increase the berm width from 7.2 m to 8.2 m. Authier Lithium DFS Technical Report Summary – Quebec, Canada 212 • Integrate a 16.4 m geotechnical berm on the southwest wall where the pit wall height exceeded 120 m. For design purposes, the following IRA, BFA and catch berm width with triple-bench arrangement were retained and are summarized by sector in Table 12-3. Table 12-3 – Pit design geotechnical parameters. Pit Slope Sector IRA (°) BFA (°) Berm Width (m) North 57.7 80.0 8.2 South 47.3 65.0 8.2 Transition 52.4 72.5 8.2 Overburden 14.0 14.0 10.0* *only at bedrock contact BBA recommends that further geotechnical work be undertaken prior to advancing to the next stage of the Project. An illustration of the different slope zones is presented in Figure 12-2. Journeaux did not specify the parameters for the transition zone. BBA has assumed that the values for the transition zone are between the north and south wall values. Pit Design Parameters The detailed mine design was carried out using the selected pit shell as a guide. The proposed pit design includes the practical geometry required in a mine, including pit access and haulage ramps to all pit benches, pit slope designs, benching configurations, smoothed pit walls and catch benches. The major design parameters used are described in Table 12-4 and Table 12-5.

Authier Lithium DFS Technical Report Summary – Quebec, Canada 213 Figure 12-2 – Pit slope design sectors. Table 12-4 – Pit design parameters. Item Value Unit North Wall South Wall Transition Overburden Berm Width 0 m Bench Face Angle (BFA) 14 degree Set back at the bedrock/OB contact 10 m Rock Bench Height 6 6 6 m Benching Arrangement Triple Triple Triple m Berm Width 8.2 8.2 8.2 m Inter-Ramp Angle (IRA) 57.7 47.3 52.4 degree Bench Face Angle (BFA) 80.0 65.0 72.5 degree Authier Lithium DFS Technical Report Summary – Quebec, Canada 214 Table 12-5 – In-pit haul roads design parameters. Item Value Unit Notes Road Width (dual lane) 23 m Based on 60-65 tonne class haul truck Road Width (single lane) 17 m Bottom benches Max. no. of benches at single lane 9 n/a Based on 6 m bench height Maximum Grade - Overburden 10 % Maximum Grade - Hard Rock 10 % Benches without ramp access at bottom 1 n/a The design outlines a pit of ~1,000 m in length (east-west), an average of 640 m width (north-south) and down to a final pit depth of 200 m. Figure 12-3 presents plan and isometric views of the ultimate Authier Lithium pit. Figure 12-3 – Ultimate Authier Lithium pit – plan and isometric views. 12.6 MINERAL RESERVE ESTIMATE The Project LOM plan and subsequent Mineral Reserve estimate are based on an ore selling price of $120 CAD/t. A memorandum of understanding (MOU) was developed between the Authier operation and NAL operation, in which NAL agrees to buy 100% of the Authier ore material at a selling price of $120 CAD/t, delivered to the NAL ore pad area. The effective date of the Mineral Reserve estimate is March 27, 2023, and based on an exchange rate of $0.75 USD:$1.00 CAD.

Authier Lithium DFS Technical Report Summary – Quebec, Canada 215 Development of the LOM plan included pit optimization, pit design, mine scheduling and the application of modifying factors to the Measured and Indicated portion of the in-situ Mineral Resource. Tonnages and grades are reported as ROM feed at the NAL crusher and account for mining dilution, geological losses, and operational mining loss factors. Table 12-6 summarizes the Proven and Probable Mineral Reserve estimate for the Project. Table 12-6 – Authier Lithium Project Mineral Reserve estimate at Effective Date of March 27, 2023 at CAD$120/t. Authier Lithium Project Ore Reserve Estimate (0.55% Li2O cut-off grade) Category Tonnes (Mt) Grades (%Li2O) Cut-off Grade % Li2O Met Recovery % Proven Ore Reserves 6.2 0.93 0.55 73.6 Probable Ore Reserves 5.1 1.00 0.55 73.6 Total Ore Reserves 11.2 0.96 0.55 73.6 Notes: 1. Mineral Reserves are measured as dry tonnes at the crusher above a diluted cut-off grade of 0.55% Li2O. 2. Mineral Reserves result from a positive pre‐tax financial analysis based on an ore selling price of 120 CAD/t and an exchange rate of USD0.75:CAD1.00. The selected optimized pit shell is based on a revenue factor of 0.86 applied to a base case selling price of USD850/t of spodumene concentrate. 3. The reference point of the Mineral Reserves is the NAL crusher feed. 4. In-situ Mineral Resources are converted to Mineral Reserves based on pit optimization, pit design, mine scheduling and the application of modifying factors, all of which supports a positive LOM cash flow model. According to CIM Definition Standards on Mineral Resources and Reserves, Inferred Resources cannot be converted to Mineral Reserves. 5. The Mineral Reserves estimate for the Project have been developed under the supervision of Mr. Philippe Chabot, P.Eng., an employee of Sayona in the position of Vice President Operations and a Qualified Person as defined by regulation S-K §229.1304 of the United States Securities and Exchange Commission (SEC). 6. The Mineral Reserve estimate is valid as of March 27, 2023. 7. Totals may not add up due to rounding for significant figures. 12.6.1 Assessment of Reserve Estimate Risks The author is of the opinion that no other known risks including legal, political, or environmental, would materially affect potential development of the Mineral Reserve estimate, except for those already discussed in this report. Authier Lithium DFS Technical Report Summary – Quebec, Canada 216 12.7 MATERIAL DEVELOPMENT AND OPERATIONS The Authier project is a greenfield project with operations slated to commence in the future. As such, no material development and/or operations have occurred.

Authier Lithium DFS Technical Report Summary – Quebec, Canada 217 13 MINING METHODS 13.1 MINE DESIGN 13.1.1 Pit Design Parameters The detailed mine design was carried out using the selected pit shell as a guide. The proposed pit design includes the practical geometry required in a mine, including pit access and haulage ramps to all pit benches, pit slope designs, benching configurations, smoothed pit walls and catch benches. The major design parameters used are described in Table 13-1 and Table 13-2. Table 13-1 – Pit design parameters. Item Value Unit North Wall South Wall Transition Overburden Berm Width 0 m Bench Face Angle (BFA) 14 degree Set back at the bedrock/OB contact 10 m Rock Bench Height 6 6 6 m Benching Arrangement Triple Triple Triple m Berm Width 8.2 8.2 8.2 m Inter-Ramp Angle (IRA) 57.7 47.3 52.4 degree Bench Face Angle (BFA) 80 65 72.5 degree Table 13-2 – In-pit haul roads design parameters. Item Value Unit Notes Road Width (dual lane) 23 m Based on 60-65 tonne class haul truck Road Width (single lane) 17 m Bottom benches Max. no. of benches at single lane 9 n/a Based on 6 m bench height Maximum Grade - Overburden 10 % Maximum Grade - Hard Rock 10 % Benches without ramp access at bottom 1 n/a The design outlines a pit of ~1,000 m in length (east-west), an average of 640 m width (north-south) and down to a final pit depth of 200 m. Figure 13-1 presents plan and isometric views of the ultimate Authier Lithium pit. Authier Lithium DFS Technical Report Summary – Quebec, Canada 218 Figure 13-1 – Ultimate Authier Lithium pit – plan and isometric views. 13.2 GEOTECHNICAL AND HYDROLOGICAL CONSIDERATIONS 13.2.1 Geotechnical Considerations The geotechnical requirements for the UDFS pit design were prepared by Journeaux and their recommendations were provided in a report titled “Open Pit Slope Design Authier Lithium Project Feasibility Study”. Recommendations were provided for the overall slope angle (OSA), inter ramp angle (IRA), bench face angle (BFA) and catch bench width. BBA performed an internal review of the Journeaux (2018) report and provided additional recommendations to ensure stability of the pit walls: • Increase the berm width from 7.2 m to 8.2 m. • Integrate a 16.4 m geotechnical berm on the southwest wall where the pit wall height exceeded 120 m. For design purposes, the following IRA, BFA and catch berm width with triple-bench arrangement were retained and are summarized by sector in Table 13-3.

Authier Lithium DFS Technical Report Summary – Quebec, Canada 219 Table 13-3 – Pit design geotechnical parameters. Pit Slope Sector IRA (°) BFA (°) Berm Width (m) North 57.7 80 8.2 South 47.3 65 8.2 Transition 52.4 72.5 8.2 Overburden 14 14 10.0* *only at bedrock contact BBA recommends that further geotechnical work be undertaken prior to advancing to the next stage of the Project. An illustration of the different slope zones is presented in Figure 13-2. Journeaux did not specify the parameters for the transition zone. BBA has assumed that the values for the transition zone are between the north and south wall values. Figure 13-2 – Pit slope design sectors. Authier Lithium DFS Technical Report Summary – Quebec, Canada 220 13.2.2 Dewatering The hydrogeological study, completed in 2018 by Richelieu Hydrogéologie Inc., demonstrated that the mining activities will not affect the quality of the water. Dewatering applies to the management of groundwater that, if not diverted from the pit or pumped from it, would impede mining operations, or add to operating costs, notably for access to ore, blasting, and wear and tear on machinery. Dewatering requirements for the Project were estimated by Technosub, a supplier of mine dewatering equipment. The pumping system has been designed in three stages to consider the increasing water inflow over the life of mine (LOM) (surface and underground combined) estimated in the hydrogeological report. The underground and surface water inflows are currently being reviewed. It is recommended to re- evaluate the dewatering requirements according to the revised water inflow. 13.2.3 Hydrogeological Considerations A hydrogeological study, conducted by Richelieu Hydrogéologie Inc., started in December 2016, and currently includes the installation of 27 observation wells (piezometers), groundwater sampling campaigns, the achievement of variable head permeability tests and tracer profile testing as well as groundwater level surveys. The hydrostratigraphic units identified at the Authier Property are the following: • Bedrock, a regional aquifer of a standard to low permeability. • Glacial till, an aquitard discontinuously covering the bedrock. • Fluvio-glacial sand and gravel (esker), a highly permeable aquifer, covering the till. • Glacio-lacustrine sand (aquifer) and silt (aquitard), covering the till unit and, partly, the fluvioglacial unit. • Organic layer, a thin and discontinuous aquitard. Following the water level surveys that were done for all piezometers installed on the site property, the following observations could be made: the groundwater level in the area of the Property is in the order of 329 m and the general direction of flow is towards the southwest under a horizontal hydraulic gradient of 0.02. During the mine life, the groundwater flow, from beneath the waste rock pile, will be directed towards the pit then, at natural flow, it will be directed towards the southwest. Water will be collected by the drainage ditch surrounding the waste rock pile and directed to the water basins.

Authier Lithium DFS Technical Report Summary – Quebec, Canada 221 The effects of mine dewatering on residential wells are deemed negligible. The effect of the Project on the environment would be, in the worst-case scenario, a reduced groundwater outflow to the local surface water network and to the wetlands. A reduced flow of brooks or drying of wetlands could then occur into the area of influence. The southern part of the St-Mathieu-Berry Esker is enclosed into the area of influence of the mine. However, this part of the esker is not connected to the main part of the esker which is being tapped by the drinking facilities of the city of Amos and also by the Eska water bottling society. Both portions of the esker are separated by a bedrock lump. In the esker, the groundwater generally flows towards the north, except in the Project area where it is heading south and southeast and to the Harricana River watershed. The southern portion of the esker, located in the Project area, is in a different watershed than the remainder of the esker. However, because it is located at a lower altitude than the esker and isolated from it by a bedrock, the Authier Project will not threaten, in any way and under any circumstances, the water quality of this esker. 13.2.4 Ore Rehandling Area Authier Lithium ore will be transported to the North American Lithium (NAL) site for processing. As such, all ore mined from the pit will be temporarily stockpiled on an ore rehandling area situated to the north of the pit. The ore will then be loaded onto highway transport trucks for transport to the NAL site. Ore transportation will only occur during the day, only on weekdays (i.e., Monday to Friday). 13.2.5 Haul Roads To give more flexibility to the mining operation, mining haul roads have been designed to accommodate 2-way traffic for 60 t class haul trucks even though the recommended haul truck is the 40-t class haul truck. Roads will incorporate drainage ditches as well as a safety berm when a drop of more than 3 m exists beyond the road edge. Single-lane haul routes are proposed in some locations (e.g., last benches of phases or the final pit). Table 13-4 lists the specified haul road dimensions used for the updated definitive feasibility study (UDFS). Authier Lithium DFS Technical Report Summary – Quebec, Canada 222 Table 13-4 – Road design parameters. Parameters Unit Dual Lane Single Lane Haul Truck - 60 t class 60 t class Operating Width m 5.7 5.7 Running Surface Multiplier factor 3 2 Running Surface Width m 17 11.5 Tire Diameter m 2.7 2.7 Berm Height : Tire Ratio ratio 0.5 0.5 Berm Height m 1.3 1.3 Berm slope xH:1V Ratio ratio 1.3H:1.0V 1.3H:1.0V Berm Width (Top) m 0.5 0.5 Berm Width (Bottom) m 4 4 No. of Berms - Surface Road number 2 2 No. of Berms - Pit Ramp number 1 1 No. of Berms - Pit Slot number 0 0 Ditch Depth m 0.75 0.5 Ditch slope xH:1V Ratio ratio 1.0H:1.0V 1.0H:1.0V Ditch Width (Bottom) m 0.5 0.5 Ditch Width (Top) m 2 1.5 No. of Ditches - Surface Road number 0 0 No. of Ditches - Pit Ramp number 1 1 No. of Ditches - Pit Slot number 2 2 Overall Width - Surface Road m 25 19.5 Overall Width - Pit Ramp m 23 17 Overall Width - Pit Slot m 21 14.5 Maximum Grade - Permanent Road % 10 10 Maximum Grade - Temporary Road % 12 12 Haul Road Drainage Crossfall % 2 2 13.2.6 Explosives Storage One magazine of explosives will be brought on site by the explosive provider. The magazine will house priming explosives, such as caps and detonating cords. A small number of explosives and boosters will be delivered directly to site as part of the contract mining operations. Further details are provided in Chapter 15 of this Report.

Authier Lithium DFS Technical Report Summary – Quebec, Canada 223 13.3 MINING FLEET AND MANNING 13.3.1 Contract Mining Mining activities will be conducted by a mining contractor for the entire LOM. The mining contractor will be responsible for: Mine equipment fleet (production fleet, auxiliary fleet and support equipment); Mine equipment operator; Mine operations supervision; Mine equipment maintenance; Tree clearing and grubbing; Overburden removal and bench preparation; Drilling, blasting, loading and hauling of ore and waste material; Mine dewatering; Overall site maintenance; Ore re-handling (loading transport trucks for ore transfer between Authier and NAL). 13.3.2 Roster The mine will operate 365 days per year with two 12-hour shifts per day. It is expected that mining contractor equipment operators, mechanics and supervisors will work on a seven-working-day / seven- rest-day schedule. All other mining contractor staff, as well as Sayona’s on-site staff, will work regular 40- hour work weeks. The total mine labour force is only six employees. Most management, technical services and other labour force are taken on by the NAL operation (e.g., mine manager, HSE coordinator, etc.). The rest of the workforce will be provided by the mining contractor and other contract service providers. Authier Lithium DFS Technical Report Summary – Quebec, Canada 224 13.3.3 Mine Maintenance The mining contractor is expected to provide their own maintenance building and execute all maintenance on their equipment. 13.3.4 Mine Technical Services The mine technical services team will consist of a senior engineer supported by a mining engineer, mining technicians, and a senior geologist supported by geology technicians. Some of these staff are shared with the NAL operation. 13.3.5 Drilling Drilling and blasting activities represent a crucial process when developing and sustaining a hard-rock mining operation. The performance and efficiency of this primary rock fragmentation process can heavily impact the mining dilution and ore losses, as well as other downstream activities, such as loading, hauling, crushing, and grinding. Blast fragmentation curves were developed based on rock characterization, types of explosives, blast patterns and powder factors. An ore P80 particle size of 300 mm was targeted. All hard rock material will be drilled with 3.5” diameter holes by top hammer drill rigs. Production blasts will be on 6 m bench heights. The drillhole patterns in ore and waste material are presented in Table 13-5. Table 13-5 – Drilling ore and waste patterns. Drill Pattern Ore Waste Bench Height m 6 6 Hole Diameter in. 3.5 3.5 Hole Diameter mm 89 89 Burden m 2.8 3 Spacing m 2.8 3 Sub-Drill m 0.6 0.6 Pre-split drillholes will be drilled every 1.50 m along the pit walls to improve the pit wall quality.

Authier Lithium DFS Technical Report Summary – Quebec, Canada 225 13.3.6 Blasting Production drillholes will be loaded with a bulk emulsion explosive, whereas pre-split drillholes will be loaded with a continuous packaged emulsion. The production blasts will be detonated with an electronic blasting system. Electronic detonators offer greater flexibility and precision for the blast sequence, which can, in turn, improve rock fragmentation and diggability, and better control the blast movement. Based on the drilling patterns listed above and blast fragmentation curves for host rock and pegmatite, by using an emulsion blasting agent with an average density (in the hole) of 1.15 g/cm3, the powder factor will vary from 0.21 kg to 0.26 kg of explosives per tonne of rock. 13.3.7 Loading A maximum of two 10.5 t-capacity hydraulic backhoe excavators and one 10.0 t-capacity production wheel loader will be required. These equipment units are compatible with the haul truck selected. The excavators will be used to load all material from the pit. Especially in ore, the excavators can selectively mine the ore material to better control dilution and ore losses. The wheel loader will be used to reclaim material from the ore stockpile into the transportation trucks. In case of breakdown of an excavator in the pit, this equipment could be used to mine waste material. 13.3.8 Hauling A maximum of eight 40 t-capacity rigid haul trucks will be required throughout the mine life. It should be noted that the ramp width was evaluated considering a larger truck, in case the mining contractor would like to use other trucks. The ore will be hauled to the ore stockpile just north of the ultimate pit limit. The waste rock, overburden and organic material will be hauled and stockpiled on the waste rock storage facility (WRSF). The overburden and organic material will be used to progressively rehabilitate the WRSF over the life of the Project (see Chapter 18 for more details). The hauling equipment fleet requirements were estimated based on the quantities of material to be transported in each period and the representative haul cycle times. The haul cycle times were estimated with the MS Haulage simulation software. Authier Lithium DFS Technical Report Summary – Quebec, Canada 226 13.3.9 Auxiliary The auxiliary equipment fleet will consist of a variety of support equipment. A 265 hp bulldozer will be required on the waste stockpile. A 14 ft moldboard motor grader will be required for preparing and grading the haul roads. A 50 t auxiliary excavator will be required for pit wall scaling and other secondary work around the pit (e.g., pit dewatering activities, ditches, rock breaking, etc.). The operation will also need a water / sand spreader for watering the roads in the summer for dust suppression and spreading sand for better traction in the winter. Finally, tower lights, an equipment transporter, a fuel and lube truck, and pick-up trucks will be needed. All estimated mine equipment requirements over the mine life are presented in Table 13-6. 13.4 MINE PLAN AND SCHEDULE A LOM plan with a 1,560 tpd crusher capacity was completed for the Authier UDFS using MineSight©’s Mine Plan Schedule Optimizer (MPSO). Details are presented below. 13.4.1 Strategy & Constraints The following constraints and objectives were considered during the development of the LOM plan: Mine plan aligned with NAL mine production plan (BBA, 2023). To be combined with NAL ore and feed to the NAL concentrator; Project ramp-up in Q3 2025; Annual mill feed of approximately 530 ktpy; No long-term stockpile; Maximum mining rate of approximately 6 Mtpy; Mill feed grade ≥0.8% Li2O; Mine planning strategy: maximize NPV.

Authier Lithium DFS Technical Report Summary – Quebec, Canada 227 13.4.2 Results The run of mine (ROM) ore feed contained in the final pit is sufficient for a mine life of 22 years. Due to the phase designs, very little waste material is mined to supply the mill in the first two years. This strategy keeps the mining activities to a minimum, allowing the operation to improve its mining practices and equipment needs and, consequently, keeps mine operating costs low. The overall pit has a variable strip ratio. The annual mining productivity gradually increases to 6.0 Mt in Year 5, and gradually decreases from Year 13 to the end of the mine life. Table 13-7 presents the mine plan summary and Figure 13-3 shows the Authier Lithium LOM production profile. Figure 13-4 to Figure 13-14 show isometric views of the Authier Lithium pit evolution over time, according to the production profile. Authier Lithium DFS Technical Report Summary – Quebec, Canada 228 Table 13-6 – Mine equipment requirements over the LOM. Equipment Pre-Prod Production 2023 2023 2024 2025 2026 2027 2028 2029 2030 2031-2035 2036-2040 2041-2044 Production Equipment Haul Truck – 40-t 2 2 2 2 3 6 7 7 7 8 8 2 Excavator – 10-t capacity 1 1 1 1 1 2 2 2 2 2 2 2 Wheel Loader – 10-t capacity 1 1 1 1 1 1 1 1 1 1 1 1 Drill – 3.5 in. 1 1 1 1 1 2 2 2 2 2 2 1 Auxiliary Equipment Bulldozer 1 1 1 2 2 2 2 2 2 2 2 2 Motor Grader 1 1 1 1 1 1 1 1 1 1 1 1 Auxiliary Excavator 1 1 1 1 1 1 1 1 1 1 1 1 Wheel Dozer 0 1 1 1 1 1 1 1 1 1 1 1 Water Truck / Sand Spreader 1 1 1 1 1 1 1 1 1 1 1 1 Support Equipment Fuel & Lube Truck 1 1 1 1 1 1 1 1 1 1 1 1 Service Truck 1 1 1 1 1 1 1 1 1 1 1 1 Pick-Up Trucks 3 3 3 3 3 3 3 3 3 3 3 3 Tower Lights 6 6 6 6 6 6 6 6 6 6 6 6

Authier Lithium DFS Technical Report Summary – Quebec, Canada 229 Table 13-7 – Authier Lithium LOM plan. Physicals Unit Pre-Prod Life-of-Mine 2025 2025 2026 2027 2028 2029 2030 2031-2035 2036-2040 2040-2046 Total Total Moved (kt) 395. 1,350 2,415 2,427 3,035 6,521 6,517 32,636 26,891 8,643 90,829 Total Expit (kt) 395 1,089 1,883 1,893 2,494 5,983 5,979 29,986 24,245 5,656 79,604 Expit Waste Rock (kt) 138 466 1,289 1,019 447 4,363 4,303 26,730 21,600 2,668 63,023 Expit Overburden (kt) 257 362 61 341 1,508 1,082 1,138 607 0 0 5,356 Expit Ore to Ore Rehandling Area (kt) 0 261 533 534 540 538 538 540 2,647 2,631 11,225 Expit Ore to Ore Rehandling Area (% Li2O) 0.000 0.973 0.939 0.944 0.920 0.851 0.904 0.928 0.966 1.042 0.964 Rehandling (kt) 0 261 533 534 540 538 538 2,649 2,645 2,987 11,225 Stripping Ratio (twaste:tRoM) 0.00 1.00 2.00 3.00 4.00 5.00 6.00 10.32 8.17 0.89 6.09 Authier Lithium DFS Technical Report Summary – Quebec, Canada 230 Figure 13-3 – Authier Lithium LOM production profile. 0.0 0.2 0.4 0.6 0.8 1.0 1.2 1.4 0 1,000 2,000 3,000 4,000 5,000 6,000 7,000 2025 2026 2027 2028 2029 2030 2031 2032 2033 2034 2035 2036 2037 2038 2039 2040 2041 2042 2043 2044 2045 2046 O re G ra d e ( % L i 2 O ) M a te ri a l Q u a n ti ti e s (k t) Year Ore Waste Rock Overburden Rehandling Ore Grade

Authier Lithium DFS Technical Report Summary – Quebec, Canada 231 Figure 13-4 – Isometric view of 2025 pre-production period. Figure 13-5 – Isometric view of 2025 production period. Authier Lithium DFS Technical Report Summary – Quebec, Canada 232 Figure 13-6 – Isometric view of 2026. Figure 13-7 – Isometric view of 2027.

Authier Lithium DFS Technical Report Summary – Quebec, Canada 233 Figure 13-8 – Isometric view of 2028. Figure 13-9 – Isometric view of 2029. Authier Lithium DFS Technical Report Summary – Quebec, Canada 234 Figure 13-10 – Isometric view of 2030. Figure 13-11 – Isometric view of 2031-35.

Authier Lithium DFS Technical Report Summary – Quebec, Canada 235 Figure 13-12 – Isometric view of 2036-2040. Figure 13-13 – Isometric view of 2041-2046. Authier Lithium DFS Technical Report Summary – Quebec, Canada 236 Figure 13-14 – Isometric view at the end of 2046.

Authier Lithium DFS Technical Report Summary – Quebec, Canada 237 14 PROCESSING AND RECOVERY METHODS The current Project considers mining Authier ore for shipment to the North American Lithium (“NAL”) concentrator for processing. There is a memorandum of understanding that the NAL operation will purchase the Authier ore; therefore, no details on the recovery methods are provided in this Report. Authier Lithium DFS Technical Report Summary – Quebec, Canada 238 15 INFRASTRUCTURE The proposed new site infrastructure for the Project include: • Run of mine (ROM) and loadout pad; • Administrative building; • Dry room; • Fuel storage; • Lay down area for mining contractor equipment shop; • Explosive magazine; • A waste rock stockpile; • A mine wastewater treatment plant; • Site access road; • Mine hauling and service roads; and • Mine water management infrastructure, including, ditches, basins, pipelines, and pumping stations. Given that the ore will be processed at North American Lithium (NAL), the site no longer requires a tailings storage facility. A preliminary site layout is presented in Figure 15-6 and shows the operational requirements for the site, light and heavy vehicle traffic flows, site access, pit access, water management infrastructure and ore and waste rock stockpiles. 15.1 WASTE ROCK STORAGE FACILITY The following standards and regulations were used for the design of the waste rock storage facility (WRSF) and its related water management structures: • Directive 019 specific to the mining industry in Québec; • Metal and Diamond Mining Effluent Regulations (MDMER) in Canada; • Loi sur la sécurité des barrage (The Dam Safety Law applied in Québec) (LSB) and the associated regulation (RSB); • The Dam Safety Guideline produced by the Canadian Dam Association (2007); • Manuel de conception des ponceaux (MTQ, 2004); • Règlement sur la santé et la sécurité du travail dans les mines, Loi sur la santé et la sécurité du travail - Québec (2014) (Québec health and safety regulations);

Authier Lithium DFS Technical Report Summary – Quebec, Canada 239 • The Québec and/or the Canadian Legal framework applied to the environment and water sectors. 15.1.1 General Project Description Following the 2019 feasibility study, several project modifications and constraints have been considered while redesigning the WRSF: • Waste rock is considered metal leaching. For this reason, the pile foundation and cover will need to be engineered as impervious layers. • Runoff water will be considered potentially contaminated by metals and total suspended solids (TSS). Site water management infrastructure (ditches and basins) will need to be designed with engineered impervious features. • Ore will not be processed at the Authier site; therefore, no tailings will be produced, and the disposal approach is no longer required. • Site inorganic overburden and organic material will be handled inside the limit of the waste rock stockpile footprint. Inorganic overburden will be used as the foundation layer of the impervious structure. For closure, both inorganic overburden and organic material will be progressively used as waste rock stockpile cover. • On the western side of the considered waste rock pile location, two fish habitats have been confirmed. Infrastructure had to be located outside these protected habitats. • On the western side, the footprint of the facility should not be expanded over the limits of the La Motte municipality. • At the eastern side, the footprint of the facility cannot be expanded towards the Saint-Mathieu- Berry Esker. The Waste rock stockpile must stay inside the eastern limit of the 2019 footprint. • If possible, as per risk management, avoid locating water management basins directly and in close proximity, upstream of the mine open pit. • The life of mine (LOM) was reviewed from 15 to 22 years. • Based on the listed project changes and considering the LOM extension, open-pit and mining plan modifications, the volumetric requirement of the waste rock pile has been estimated at around 75% of the 2019 designed disposal facility capacity. Maintaining similar facility crest elevation, the resulting footprint will also be reduced. During the execution of the Updated Definitive Feasibility Study (UDFS), different arrangements and locations for the waste rock, overburden, and organics stockpiles, as well as associated water management infrastructure, were studied by BBA. The final infrastructure location is provided in Figure 15-1. • The updated location has been defined as per the following steps: o Analysis of site characteristics: geotechnical baseline data, site watersheds, surface drainage, environmental restricted areas. Authier Lithium DFS Technical Report Summary – Quebec, Canada 240 o Volumetric compliance for waste storage: the targeted combined volume was around 31 Mm³ of material (waste rock, overburden, and organics). The resulting design intends to manage all materials in the same footprint. o The overburden and organics will be temporarily stored in the waste rock footprint until its eventual reuse for progressive mine closure. o Analysis of the environmental and social constraints of the selected waste storage facility footprint. This includes Sayona engagements with environmental authorities as stated in previous studies. 15.1.2 Design Update The waste materials that will be managed at Authier are waste rock, overburden, and organics. The expected LOM tonnages extracted from the mining plan are summarized in Table 15-1. Table 15-1 – Summary of the LOM waste material from Authier pit. Waste type Quantity Waste rock (WR) 63,000,000 t Overburden (OB) 4,609,354 t Organic material (ORG) * 740,646 t * Pit organic layer is assumed at 1 m thickness Results of the geochemical characterization of waste rock concluded: • Waste rock is not acid generating material. • A good amount of waste rock could be considered metal leaching (approximatively 70%). • Waste rock will not be considered as high-risk level mining waste. It is expected that an average of 30% of waste rock will be considered as inert. However, Sayona’s approach at this stage is to consider that all waste rock will be stored in the same stockpile. For these reasons, as per Directive 019, level A groundwater protection measures will have to be applied at the foundation of the waste rock stockpile. Based on the available geotechnical and hydrogeological investigation information, the current design assumes that the in-situ soils will not meet Québec Directive 019 requirements. To ensure aquifer protection, a geomembrane impervious structure is required. Furthermore, the facility closure plan should also consider the imperviousness of the stockpile final

Authier Lithium DFS Technical Report Summary – Quebec, Canada 241 surface. At this stage of the Project, it is assumed that the pit overburden and organic material will form the cover structure. Material will be placed between 1% to 2% slope grades to ensure proper water drainage at the crest. At the selected location, the waste rock stockpile foundation is characterized by the presence of rock outcrops. Moreover, in different locations, bedrock appears to be close to the surface. To install impervious liners, the foundation will require some preparation. It must include organic stripping, site grading earthworks and a layer of subgrade soil for the geomembrane. Soil cover will also be required as a protection layer for the impervious liner. Geotechnical investigations indicate that pit overburden material could be appropriate to form the geomembrane structure. In summary, overburden and organic material will be used during construction and closure of the WRSF. The designed concepts allow management and storage of all Authier waste materials within the same footprint, as presented in Figure 15-1. Figure 15-1 – Waste rock stockpile cross-section – Overall concept. Material deposition will take place during different phases. A synchronized operation between pit development and waste rock stockpile construction must be planned. Remaining tonnages will be temporarily stored at the non-developed area of the waste rock stockpile footprint. Waste rock, overburden and organic material production have been extracted from the mining plan and are presented in Table 15-2. Authier Lithium DFS Technical Report Summary – Quebec, Canada 242 Table 15-2 – Authier waste LOM production. Period Waste Material Type Waste Rock Overburden (estimated) Organic Material (estimated) Total (Mt) (Mt) (Mt) (Mt) YR1 0.6 0.53 0.09 1.22 YR2 1.31 0.03 0.01 1.35 YR3 1.01 0.31 0.05 1.37 YR4 0.43 1.31 0.21 1.95 YR5 4.38 0.92 0.15 5.45 YR6 4.26 1.02 0.16 5.44 YR7 5.49 0 0 5.49 YR8 5.49 0 0 5.49 YR9 4.93 0.47 0.07 5.47 YR10 5.44 0.02 0 5.46 YR11 5.47 0 0 5.47 YR12 5.48 0 0 5.48 YR13 4.95 0 0 4.95 YR14 5.04 0 0 5.04 YR15 4.07 0 0 4.07 YR16 1.99 0 0 1.99 YR17 0.86 0 0 0.86 YR18 0.51 0 0 0.51 YR19 0.44 0 0 0.44 YR20 0.38 0 0 0.38 YR21 0.3 0 0 0.3 YR22 0.17 0 0 0.17 Total 63 4.61 0.74 68.35 The waste rock stockpile footprint will be surrounded by four surface drainage ditches. Runoff is collected and directed to two water management basins. Ditches and basins will also consider a geomembrane structure in the design. Optimization of the facility construction and design should be completed in detailed engineering. 15.1.3 Design Summary Authier waste rock, overburden and organic materials will be contained in the same storage facility. The design update was performed with the following parameters: • Final overall slope angle: 2.5H:1V;

Authier Lithium DFS Technical Report Summary – Quebec, Canada 243 • Bench slope angle: to be finalised in detailed engineering; • Bench height: to be finalised in detailed engineering; • Ramp width: 22 m; • Access ramp slope: 10%; • Waste rock placed density: 2.3 t/m³; • Dry overburden placed density: 1.7 t/m³; • Dry organic material placed density: 1.3 t/m³; • The organic layer thickness was assumed to be 1 m, which corresponds to approximately 14% of the total soil excavated; • Facility foundation condition has been established from the most recent geotechnical information collected by BBA in 2020; • The pile has a footprint of approximately 75 ha, and a maximum height of ±83 m. The average height is about 72 m; • Organic material will be stripped from the waste rock facility foundation and will be further used in the closure plan. The foundation layer thickness is assumed at 30 cm. Table 15-3 summarizes the capacities of waste material to be managed. Table 15-3 – Waste rock storage facility required capacity. Parameter Quantity Overburden quantity 4.61 Mt Overburden volume 2.71 Mm³ Tonnage of pit footprint organic material 0.74 Mt Tonnage of stockpile footprint organic material* 0.38 Mt Organic material volume 0.86 Mm³ Waste rock quantity 63.00 Mt Waste rock volume 27.39 Mm3 Total stockpile capacity 30.96 Mm³ Extracted materials from the pit will be continuously placed on the waste rock stockpile. The construction sequence will require coordination between both pit and stockpile developments. Construction efforts will change every year as per material storage needs. Table 15-4 summarizes the LOM volumetric requirements of the WRSF. Authier Lithium DFS Technical Report Summary – Quebec, Canada 244 Table 15-4 – Waste rock stockpile volumetric LOM requirements. Period Waste Material Type Waste rock Overburden (estimated) Organic Material (estimated) Total (Mm³) (Mm³) (Mm³) (Mm³) (YR1) 0.26 0.31 0.07 0.64 (YR2) 0.57 0.02 0 0.59 (YR3) 0.44 0.18 0.04 0.66 (YR4) 0.19 0.77 0.16 1.12 (YR5) 1.9 0.54 0.11 2.56 (YR6) 1.85 0.6 0.13 2.58 (YR7) 2.39 0 0 2.39 (YR8) 2.39 0 0 2.39 (YR9) 2.14 0.27 0.06 2.47 (YR10) 2.37 0.01 0 2.38 (YR11) 2.38 0 0 2.38 (YR12) 2.38 0 0 2.38 (YR13) 2.15 0 0 2.15 (YR14) 2.19 0 0 2.19 (YR15) 1.77 0 0 1.77 (YR16) 0.87 0 0 0.87 (YR17) 0.37 0 0 0.37 (YR18) 0.22 0 0 0.22 (YR19) 0.19 0 0 0.19 (YR20) 0.17 0 0 0.17 (YR21) 0.13 0 0 0.13 (YR22) 0.07 0 0 0.07 Total 27.39 2.71 0.57 30.67 15.1.4 Stability Analysis for WRSF and Related Infrastructure The following stability analyses have been performed considering different loading conditions. The geotechnical study focuses on the Authier waste rock stockpile and its related water management infrastructure. Figure 15-2 presents the analyzed sections. Stability analysis considers the stockpile and geomembrane structure constituent materials presented in Figure 15-1. Facility foundation stratigraphy was established from the factual data gathered by BBA in 2020 and by Richelieu in 2018. The following areas are identified: • The foundation of the northwest area is mostly silt; • The foundation of the west and south areas is till which mixes with sand and silt; • The foundation of the southeast area is sandy till;

Authier Lithium DFS Technical Report Summary – Quebec, Canada 245 • The foundation of the east (northeast) area is loose sand. The properties of foundation soils and waste rock pile were estimated based on available geotechnical reports and typical data collected from literature, as well as several simplifying assumptions (see below). The geotechnical parameters used in this stability analysis are presented in Table 15-5. Figure 15-2 – Critical sections for stability analysis. Table 15-5 – Geotechnical parameters of waste rock stockpile constituent materials. Materials γ (kN/m3) C’ (kPa) Φ’ (˚) Su (kPa) Ksat (m/s) Waste rock 22 0 36 N/A 1×10⁻⁴ Foundation (compact to dense silty sand) 19 0 32 N/A 1×10⁻⁶ Compacted till 19 0 34 N/A 1×10⁻⁷ Foundation till 18 0 33 N/A 1x10⁻⁶ Foundation silt 16.5 0 32 N/A 1×10⁻⁹ MG56 21 0 35 N/A N/A Organic material 13 0 28 N/A N/A Rip rap 22 0 37 N/A N/A Authier Lithium DFS Technical Report Summary – Quebec, Canada 246 The results of slope stability analysis under different loading conditions are presented in Table 15-6 for both global and local stability. The obtained factors of safety show that the stability of WRSF and basins (BC1 and BC2) in the proposed configurations meets the design criteria specified in the Ministère des Ressources naturelles et des Forêts (MRNF formerly MERN) (2017), and Directive 019 (Ministère du Développement Durable, de l'Environnement et des Parcs(MDDEP), 2012) in the context of this study. However, it is worthy to mention that stage construction might be recommended in the next design phase, this, if clayey soils are identified later at the site from additional geotechnical investigations. It should also be noted that the validity of various assumptions needs to be addressed by more detailed geotechnical tests during the detailed engineering design. The stability of the waste rock pile at Authier has been analyzed in this study, based on some assumptions regarding the geotechnical properties of the foundation soils and waste rock. In total, four critical sections were chosen around the waste rock pile (A-A, B-B, C-C, D-D) and stability analyses were performed under the static and pseudo-static conditions, for both short-term and long-term (Figure 15-2). A geomembrane will be used in different structures to prevent pollutants from migrating to the groundwater. The groundwater table was analyzed in section A-A showing that the groundwater table stays close to the foundation of the pile. The obtained groundwater table was applied as the critical condition in other sections. The modelling and analysis were carried out with several hypotheses. Basin BC2 in section B-B is mostly excavated in bedrock. Table 15-6 – Factor of safety of slope stability analysis. Section Estimated FoS After excavation (local stability) End of construction (Short-term) Long-term Pseudo-static FoSmin = 1.2 FoSmin = 1.3 to 1.5 FoSmin = 1.5 FoSmin = 1.1 Section A-A – Basin BC1 Excavation 1.2 1.7 1.5 Section A-A – Basin BC1 Dyke 1.2 2.2 1.9 Section A-A – WR Stockpile 1.7 1.7 1.6 Section B-B – Basin BC2 Dyke-downstream 1.5 1.3 Section B-B – Basin BC2 Dyke-upstream 1.6 1.5 Section B-B – WR Stockpile 1.8 1.7 1.5 Section C-C 1.8 1.8 1.6 Section D-D 1.9 1.9 1.6

Authier Lithium DFS Technical Report Summary – Quebec, Canada 247 15.1.5 Waste Rock Handling Methodology Based on BBA’s experience with projects of this size and the transportation distance of the waste, the handling of waste, overburden and organics is to be conducted using trucks from the pit to the WRSF. 15.2 WATER MANAGEMENT 15.2.1 Water Management Strategy The general water management strategy developed for the Project aims to: • Divert all non-contaminated water off-site (clean water) from non-perturbed areas surrounding the site; • Manage water by collecting, draining, conveying, and containing runoff from all sources including: o Surface infrastructure; o Waste rock storage area. • Treat all contaminated water before releasing it into the environment. • Minimize the waste rock footprint to reduce water storage basin requirements. It is understood, at this stage of the Project, that TSS material and nickel leachate are the key contaminants in the water. Removal of these parameters can be achieved by using sedimentation of contact water in ponds for partial TSS removal and by conditioning of the water with the addition of chemicals in order to generate metal hydroxides and to precipitate out metal hydroxides and TSS in filters and/or clarifiers prior to release into the environment. Any other contaminant should be treated using appropriate water treatment processes. 15.2.2 Projected Infrastructure for Water Management The Authier water management infrastructure is composed of two clean water diversion ditches; four contact water collection ditches that surround the waste rock disposal area and other mining areas; two water storage basins (BC1 and BC2); pumping stations and conveyance pipelines and a water treatment plant (WTP). The main infrastructure is shown in Figure 15-3. Authier Lithium DFS Technical Report Summary – Quebec, Canada 248 Figure 15-3 – Watersheds in developed conditions. 15.2.3 Design Criteria for Basins and Ditches The environmental flood design criteria for basins are the following: The water management basins must be able to manage a 1,000-year recurrence 24-h rainfall combined with a 100-year recurrence snowmelt, as per Directive 019 (MDDEP), with the water from rainfall being stored and the snowmelt being treated simultaneously as it arrives at the basin. The criteria have been defined given that the waste rock is not acid-generating but considered metal-leachable. Where retained structures are considered in the construction of basins, an emergency spillway and channel must be able to safely discharge the most severe flooding event, i.e., Inflow Design Flood (IDF). This is the Probable Maximum Flood (PMF) as specified in the Directive 019; freeboard requirements are as stipulated by Directive 019 (section 2.9.3.1) and the Canadian Dam Association (CDA) guidelines (section 6.4). At this stage of the Project, it is proposed that dykes be designed to have a freeboard of at least 1.0 m, measured between the impermeable dam crest (elevation of membrane anchor and not that of the running coarse) and the maximum water level during the design for Environmental Design Flood (EDF).

Authier Lithium DFS Technical Report Summary – Quebec, Canada 249 The design criteria applying to the ditches of the WRSF are presented below and are based on a design rainfall of a 100-year recurrence as per Directive 019. • Minimum depth 1.0 m; • Minimum base width 1.0 m; • Minimum freeboard m 0.3 m; • Minimum longitudinal slope 0.001 m/m; • Minimum velocity 0.5 m/s; • Lateral slopes are defined according to the natural terrain; • Riprap must be defined according to water velocities. To consider the risks and impacts related to climate change, precipitations used for the design were increased by 18% (see Section 15.2.10). 15.2.4 Watersheds The watersheds have been delineated to perform the design of ditches and basins. Figure 15-3 and Figure 15-4 show the watersheds of the mine site in natural (undeveloped) and developed conditions. Topographic information was gathered from Données Québec which gives access to LiDAR information at a resolution of 1 m. Authier Lithium DFS Technical Report Summary – Quebec, Canada 250 Figure 15-4 – Watersheds in undeveloped conditions for the Project area. 15.2.5 Operational Water Balance and Flux Diagrams An operational water balance was performed for the different hydrological conditions. The following parameters were considered: • Total annual precipitations are 903 mm with 651 mm of rainfall and 253 mm of snowfall (SNC Lavalin, 2018); • It is assumed that the snowmelt occurs from mid-April to mid-May; • The total annual lake evaporation is 460 mm (SNC-Lavalin, 2018); • The potential evapotranspiration (ETP) is 364 mm (SNC-Lavalin, 2018). It is assumed that the stockpile and the mine pit have respective rates of 70% and 50% of the ETP; • It is assumed that the ice cover of the basins is 1 m thick and forms from mid-December to mid- April;

Authier Lithium DFS Technical Report Summary – Quebec, Canada 251 • The groundwater infiltration rate into the mine pit is 108 m³/h (SNC-Lavalin, 2018). The resulting flow diagram and the main outcomes of the water balance are presented in Table 15-7 and Figure 15-5. Table 15-7 – Main outputs of the operational water balance. Parameter Hydrological condition Normal Dry Wet Value (m³) Value (m³) Value (m³) Input 1,610,476 1,312,966 1,746,761 Underground water 946,080 946,080 946,080 Hydrological losses 441,483 412,832 463,262 Yearly volume of water released to the effluent 2,115,073 1,846,213 2,229,579 Authier Lithium DFS Technical Report Summary – Quebec, Canada 252 Figure 15-5 – LOM water balance for normal precipitation.

Authier Lithium DFS Technical Report Summary – Quebec, Canada 253 15.2.6 Basins Sizing and Design Based on the design criteria (Directive 019), and the water management approach previously described, the environmental design flood was established. Two basins, BC1 and BC2 will be required to manage Authier contact water. BC1 and BC2 require a storage capacity of 53,270 m³ and 114,034 m³ respectively. Both basins should be impervious. A geomembrane liner has been considered at this stage of the Project. Basin capacity has taken into consideration the operation of a water treatment plant having a capacity of 0.18 m³/s. Basin volumes will be attained partially through excavation and partially through the construction of dams. Dam height has been limited to roughly 4.0 m. Table 15-8 provides crest elevations for each basin as well as the elevations for each associated spillway. Table 15-8 – Crest elevations. Basin designation Basin volume (m3) Crest elevation (m) Spillway elevation (m) Freeboard (m) BC1 53,270 330 328 1.5 BC2 114,034 338.5 337 1 15.2.7 Design of the Ditches Four main ditches are designed to manage surface water from the waste rock stockpile facility. Two diches drain towards basin BC1 (BC1A, BC1B) and the other two towards BC2 (BC2A, BC2B). These ditches will also be lined with a geomembrane. Two deviation ditches are considered; they are located north and east of the WRSF. A trapezoidal transversal cross-section was considered for hydraulic calculations. Dimensions vary depending on the chainage station of each ditch section. Table 15-9 summarizes waste rock stockpile ditches dimensioning. Authier Lithium DFS Technical Report Summary – Quebec, Canada 254 Table 15-9 – Typical Cross-section to be used for the mine site ditches. Ditch ID Length Discharge Roughness coefficient Base Lateral slope Water depth Velocity Total width depth (1) [m] [m3/s] [s/m1/3] [m] [H:1V] [m] [m/s] [m] BC1A 979.2 5.08 0.04 1.0 2 0.9 2.3 1.0 – 1.5 BC1B 228.4 1.16 0.04 1.0 2 0.4 2.3 1.0 BC2A 2,056.7 9.25 0.04 1.0 - 3.5 2 1.67 2.04 1.0 – 2.0 BC2B 77.5 1.06 0.04 1.0 2 0.41 1.42 1.0 15.2.8 Pumping Systems At least three major pumping stations are required over the life of the Project. One to transfer water from BC1 to BC2, one for pumping water from BC2 to the treatment plant, and a dewatering pumping system is to be installed in the pit to basin BC2. Detailed design of the pumping stations will be done in the next stage of the Project. Pumping lines and requirements are summarized in Table 15-10. Table 15-10 – Pumping system and lines. Pumping System Pumping requirement (m³/s) Pumping Line Length (m) Pit 0.18* 1,610 BC1 0.18* 350 BC2 0.18* 60 15.2.9 Wastewater Treatment Waste rock from the Authier mine is non-acid generating, but probably classified as metal-leaching; as such, in addition to conventional sedimentation within the designed ponds for TSS removal, a physico- chemical treatment approach will be required for treatment of metals. The cost estimates provided for the facility have been derived from wastewater treatment facilities from other similar projects. The required treatment capacity has been estimated to 0.18 m3/s (650 m3/h).

Authier Lithium DFS Technical Report Summary – Quebec, Canada 255 15.2.10 Assessment of the Risk of Climate Change In general, consequences of climate change are a new risk that needs to be addressed in water management plans and for the design of the water management infrastructures, e.g., basins and ditches. Mitigation measures and adaptation measures must be considered. For the Authier Lithium project, the risk was analyzed based on available scientific data including recommendations put forward by the OURANOS consortium for the province of Québec. According to the simulations performed by OURANOS (https://www.ouranos.ca/climate-portraits/#/) for the Abitibi region, assuming Val-d’Or as a reference station, the projections (2041-2070 horizons) of climate change in terms of temperature increase and precipitation are based on a ‘high level of greenhouse gas emissions’ scenario (50th percentile) and shown in Table 15-11. Table 15-11 – OURANOS Projections for temperature and precipitation. Seasons Temperature Precipitations Actual average value Projected Variation Actual average value Projected Variation Projected Variation (° C) (°C) (mm) (mm) (%) Annual 2,0 +3,2 900 85 9 Winter -14,0 +3,8 161 30 19 Spring 1,4 +2,6 188 32 17 Summer 16,3 +3,1 295 -5 -17 Autumn 4,2 +2,9 261 25 10 For the Authier Lithium project, the design for water collecting ditches has assumed an increase by 18% of the Intensity Duration-Frequency values that are available for the Amos weather station (Environment Canada). Also, to manage the risk, the mine pit was considered as a buffer in case of an extreme precipitation event beyond the design criteria. It is understood that during extreme events the mining operations will be temporarily stopped. Authier Lithium DFS Technical Report Summary – Quebec, Canada 256 15.3 ACCESS ROADS ON/OFF AND ROM PADS 15.3.11 Site Preparation and Pads General site preparation will consist of clearing, grubbing, topsoil and overburden removal, rock excavation, backfilling and surface leveling for all site infrastructures. Access and hauling roads were designed based on project requirements and additional project constraints provided by Sayona. Clearing and grubbing will be done in and around all infrastructure areas. Topsoil and overburden will be removed to provide a stable sub-base for roads and pads. A general overview of the Authier site can be found in the general arrangement plan in Figure 15-6. Site drainage will be achieved with the excavation of drainage ditches at the extremity of the infrastructure pads and on the side of the roads. A frost depth of 2.8 m is considered for building foundations not sitting on bedrock and for the underground piping network. Figure 15-6 – Site layout.

Authier Lithium DFS Technical Report Summary – Quebec, Canada 257 The mine industrial area (MIA) will consist of granular pads to accommodate the structures identified in Section 15.1.1. MIA Infrastructure. The site entrance is located on Chemin des Pêcheurs to the east of the Property. The main access road has a total width of 20 m and is approximately 440 m long to the ROM loadout area. From this point to the mining infrastructure pad, the road transforms into a hauling road for about 1.300 m. For this portion of the road, an additional service road for regular vehicle transit is considered. The mine operations site access is controlled by an access gate located approximately at the intersection with the Chemin Preissac. On-site roads consist primarily of heavy-duty traffic haul roads for access between the mine operations pad, the waste rock stockpile, and the open pit. The total width of the haul roads is 20 m. A 770 m long and 7 m wide light-vehicle traffic service road also goes from the mine operations pad to the explosives magazine. Additional traffic gates could be installed at strategic points to control the circulation for safety issues. They will temporarily prevent traffic from entering the Property or leaving the industrial site. Traffic gates will be closed prior to blasting and standard operating procedures will be developed to sweep the road. Vehicular traffic is to be kept at least 300 m from the pit during blasting or otherwise managed. All roads and circulation areas are defined based on standard engineering practices and designed according to the subgrade conditions and the different vehicle load types. Factual geotechnical data indicate that roads and pads will be mainly built over soils composed by silt and sand and, in some areas, over rock outcrops. 15.3.12 Haul Roads Heavy vehicle (HV) haul roads will be laid out to provide access to the active pit, the waste rock stockpile area, the ore stockpile laydown pad, and the MIA. These are two-way roads, 20 m wide, with a geometry accommodating mining haul trucks. Light vehicles (LV) provide access to the pit and ROM dump area and will share the HV haul roads along with the heavy vehicles. Driving and communication standard operating procedures will be developed to manage HV / LV interaction on HV haul roads. Authier Lithium DFS Technical Report Summary – Quebec, Canada 258 15.3.13 Internal LV Roads and Car parking Internal LV roads will be constructed prior to the commencement of operations. Two-way LV roads will be constructed with a 7 m wide gravel surface. One LV car park, for 20 vehicles, will be provided adjacent to the administration building at the mine operations pad. The explosive magazine storage area will only be accessible via the main hauling road, 770 m after the security gate. It consists of a single-lane road suitable for LV traffic. 15.4 ELECTRICAL POWER SUPPLY AND DISTRIBUTION The expected power demand for is approximately 3 MW. For this amount of power, the local utility company, Hydro-Québec, will deliver the power directly at 600 V. Hydro-Québec will need to extend an existing 25 kV power line, located a few kilometres away, to the southeast of the site, and perform some upgrades on a portion of the existing line so it can deliver the required three-phase power. At the Authier site, the 25 kV will be stepped down to 600 V through a pad-mount transformer. For such a 600 V service entrance, Hydro-Québec supplies and installs all that is required at 25 kV as well as the step-down transformer. The Project will provide and install the required civil infrastructures to install the transformer and cabling according to Hydro-Québec requirements. On-site, near the step-down transformer, a prefabricated electrical room will house the 600 V switchboard which will be the source of all main 600 V feeders to the different site loads: truck shop, water treatment plant, offices, main gate, etc. This switchboard will be sized for more than the original expected power demand to simplify the addition of potential future loads. The site power distribution will be done mainly using cables in trays or buried underground. 15.5 WATER SUPPLY 15.5.1 Raw Water Raw water will be untreated and used for washrooms and emergency showers. It is proposed to be supplied either from site-treated effluent or from one or two well(s) located on-site. Raw water will be

Authier Lithium DFS Technical Report Summary – Quebec, Canada 259 pumped directly to a reservoir and then distributed to the various buildings for use via underground PVC piping installed below frost depth. Potable water will be distributed in bottles to the administrative building and the MIA. 15.5.2 Fire Water Fire water for the mine site will be drawn, initially, from the freshwater tank located on the mine infrastructure pad; if more supply is needed then BC2 basin will be used. The fire water pumping system will consist of both an electric delivery pump, to supply firefighting water to buildings throughout the mine site at the required pressure and flows, and a diesel driven electric start pump that will start in the event that power is unavailable to the electric pump, or it fails to start within a set time of a fire demand being registered. An electric “jockey” pump will be used to maintain pressure in the fire mains. The maximum fire water requirement has been estimated at 268 m³/h over a 2-hour period, with full replenishment required within 8 h. Water will be supplied to the freshwater tank from BC2 basin. Fire water will be distributed from the tank to the administrative building and the MIA via underground PVC piping installed below frost depth. 15.5.3 Sewage Sewage and domestic wastewater generated in the occupied areas of the MIA will be collected in underground PVC piping installed below frost depth and directed to a central collection tank located slightly to the west of the administration building. Effluent from the collection tank will be discharged into a buried disposal field. Solid waste from the collection tank will be collected on a regular basis by a local cartage contractor and disposed of at a local authority sewage treatment farm. 15.6 CONSTRUCTION MATERIALS 15.6.1 Fuel, Lube and Oil Storage Facility An external bunded fuel facility is proposed to hold two 50,000 L diesel storage tanks, a 10,000 L gasoline storage tank as well as bulk lubricant and coolant supplies, which will be moved into the maintenance workshop as required. All tanks and piping will be of steel construction. The diesel supply will be fitted with high flow reticulation to the HV refueling bay and both diesel and gasoline with low flow reticulation Authier Lithium DFS Technical Report Summary – Quebec, Canada 260 to a LV fuel dispenser. These quantities are deemed sufficient for more than a week of supply at peak operations. A dedicated, self-bunded, semi-trailer sized bay will be provided for fuel and bulk lube deliveries. A fuel truck will be used for fueling track-mounted equipment. 15.6.2 Explosives Magazine One explosives magazine will be brought on-site by the explosives provider. The magazine will house priming explosives, such as caps and detonating cords. A small number of explosives and boosters will be delivered direct to site as part of contract mining operations. The magazine will be strategically located in a fenced and gated area on the southwest corner of the Property to meet provincial and federal explosives regulations. A gravel road from the MIA will be built to access this area. As the proposed main supplier of explosives is near the mine, the magazine capacity will be kept at a minimum. 15.7 COMMUNICATIONS A factored allowance was made in this study for a site-wide communications system. No details have been developed around its components or implementation. Cell phone coverage is available at site. A site-wide radio system will be installed for the mining operation and emergency response. 15.8 SECURITY AND ACCESS POINT A guard house and gate will be erected at the entrance to the mine site, along the main access road. This area could also be the site of the weigh station, which will weigh incoming and outgoing ore transport trucks. The guard house will be a serviced, prefabricated building, similar in construction to a mobile home.

Authier Lithium DFS Technical Report Summary – Quebec, Canada 261 15.9 ON-SITE INFRASTRUCTURE 15.9.1 Temporary Construction Management Facility At early stages of the Project, an area of approximately 1 ha should be provided for the establishment of a construction management building and car park. Construction facilities will be a pre-engineered re- locatable type of structure with temporary services (tank and pump for potable water delivered from off- site, self-contained wastewater collection facility for pump out and disposal off-site, temporary communications facility and temporary one-phase power line for construction power). Construction contractors for MIA buildings and services will be required to supply similar facilities for their management purposes and workforce requirements. At the completion of construction, these facilities will be reallocated to the operations and any disturbed area should be rehabilitated in accordance with the site environmental requirements. 15.9.2 Offsite Infrastructure The site will be accessed starting from Road 109, then the Chemin de Preissac and finally the Chemin de la Sablière. A 170 m road will be constructed between Chemin de la Sablière and the entrance of the mine site on Route du Nickel. Route du Nickel will be closed from the entrance of the mine site to the junction of Chemin de Preissac because the road is located within the footprint of the open pit mine. 15.9.3 General Earthworks The ROM loadout area and mine operations pad (including ancillary buildings and car park) are approximately 0.86 ha and 1.94 ha in size, respectively. The water treatment plant area is approximately 0.74 ha. At the commencement of construction, these areas will be cleared of vegetation and topsoil and graded. Pad peripheral surface water management ditches, where required, will be built. Drain water will be directed to site collection ponds. All trafficked areas (pads) will be designed with gravel pavements suitable for the foundation soils and the classes of vehicles using them. Sand and gravel backfill will be fabricated from rock excavations performed while building basins BC1 and BC2. This material will be placed and compacted to establish the required mine pads. Similarly, in-situ fabricated sand and gravel material will be used for construction of all site roads. Authier Lithium DFS Technical Report Summary – Quebec, Canada 262 15.9.4 General, Green and Regulated Waste Mine site waste including general, green, and regulated waste will be collected, recycled where applicable and disposed of according to its type. Domestic and general waste will be disposed of by licensed contractors, most likely at a local authority operated facility. Green waste will be recycled and utilized in regeneration works, where practicable and feasible. Regulated waste will be disposed of by licensed contractors, as per statutory requirements. 15.9.5 Ore Transportation The ore will be transported from Authier to NAL by four-axle trucks and four-axle trailers with lateral. The transportation capacity will be 38 t. The use of four-axle trailers will respect the Ministry of Transportation and Sustainable Mobility regulations for transport during the thaw period. 15.9.6 Administration Facility The proposed administration building will be located within the mine industrial pad and will be a light construction modular building with steel cladding and roofing. This building will be sized for a workforce of ten persons and will include offices for the limited staff, a first aid room, washrooms (M/F), communications and storeroom, dining room, and meeting rooms. The building will be compliant with the relevant Québec and Canadian Building Codes. A dry room will be annexed to the administration building. Part of the administration building could be built as part of the early works program and will serve as the construction office during the construction period.

Authier Lithium DFS Technical Report Summary – Quebec, Canada 263 16 MARKET STUDIES AND CONTRACTS 16.1 PRODUCT SPECIFICATIONS 16.1.1 Type of Ore Processed from Hard Rock to Supply Lithium According to Wood Mackenzie, the total supply is projected to grow at a CAGR of 14% from 2020 to 2030. Although lepidolite production will increase from 2020 to 2025 and new processes such as jadarite, clay and zinnwaldite will be introduced starting in 2023, spodumene concentrate will remain the dominant mineral concentrate output. Depending on the period, spodumene concentrate is expected to account for 73% to 87% of the total capacity of the mine. Significant exploration, necessary to support the growth of the demand, is underway to identify and then qualify resources and reserves to bring to production over the next years. Successful explorations and entry into service of new mines will be required to meet the growing lithium market demand by 2030, and more substantially by 2040, and replace mine capacity who reach end of life (Figure 16-1). Figure 16-1 – Mine capacity by type (2020-2040) (kt LCE). Sources: Wood Mackenzie, PwC Analysis. Authier Lithium DFS Technical Report Summary – Quebec, Canada 264 16.1.2 Refined Production by Raw Materials Based on the current spodumene operating plants and advanced projects by BMI, spodumene is projected to remain an important source of raw material from 2020 to 2040, and further projects will be required to meet market demand. From 2020 to 2030, the CAGR of spodumene is projected to grow at an 18% CAGR whereas over refined production is projected to grow at a 20% CAGR, supported strong brine growth and the acceleration of recycled lithium. Even when accounting for the recycled lithium volume, significant growth of refined production capacity is required to meet BMI’s projected market demand, particularly from 2030 to 2040 (Figure 16-2). Figure 16-2 – Refined production by raw material (2020-2040) (kt LCE). Sources: Lithium-Price-Forecast- Q4-2022-Benchmark-Mineral-Intelligence, PwC Analysis.

Authier Lithium DFS Technical Report Summary – Quebec, Canada 265 16.1.3 Refined Production Capacity by Final Product Lithium carbonate and lithium hydroxide will dominate refined production for lithium products. From 2020 to 2040, lithium hydroxide and lithium carbonate are projected to grow at a CAGR of 16% and 11% respectively. The production, based on the current in production or planned projects per the BMI forecast, are insufficient to meet market demand by 2040 (Figure 16-3). Figure 16-3 – Refined production capacity by product (2020-2040) (kt LCE). Sources: Lithium-Price- Forecast-Q4-2022-Benchmark-Mineral-Intelligence, PwC Analysis. 16.2 PRODUCT PRICING 16.2.1 Price Forecast Sales from 2023 to 2026 are based on the greater of 113 kt of spodumene concentrate or 50% of spodumene concentrate sales at the Piedmont Lithium contract price and the remaining concentrate sales at BMI Q4 2022 spodumene market prices. From 2027 onwards, the entire concentrate sales are settled at BMI Q4 2022 spodumene market prices. For the contracted volume to Piedmont Lithium Inc, a price of 810 USD/t (from the reference of 900 USD/t @ 6.0% Li2O to adjusted value of 810 USD/t assuming 5.4% Li2O and applied 10% price discount from 900 USD/T for lower grade) assumed over 2023-26, while the remainder of the concentrate production Authier Lithium DFS Technical Report Summary – Quebec, Canada 266 uses market prices. From 2027 and beyond, Sayona is reverting back to market prices for the entire production as it seeks to pursue a lithium transformation project on-site, leveraging prior investments, in line with its commitments with the Government of Québec related to its acquisition of NAL. 16.2.2 Spodumene Price Forecast The prices for spodumene concentrate and battery-grade lithium are expected to remain high relative to historic prices, driven mainly by the demand for lithium for EV batteries. According to BMI, the price of spodumene concentrate (6%) is expected to increase significantly from 2020 to 2024, reaching a peak of 5,525 USD/t. However, by 2026, the market price of spodumene is expected to decrease to below 2,000 USD/t, and gradually stabilize at a long-term price of 1,050 USD/t from 2033 onwards (Figure 16-4). Figure 16-4 – Spodumene concentrate price forecast 2020-2040. Sources: Lithium-Price-Forecast-Q4- 2022-Benchmark-Mineral-Intelligence, PwC Analysis.

Authier Lithium DFS Technical Report Summary – Quebec, Canada 267 16.2.3 Carbonate Price Forecast According to BMI, the price for battery grade carbonate is expected to jump in 2023, driven by the fast growth of the EV industry. BMI price expectations imply a peak of 75,475 USD/t in 2024. After 2025, supply increase is projected to meet market demand, bringing down prices gradually through to 2032. From 2033 onwards, BMI projects an average carbonate price of 20,750 USD/t (Figure 16-5). Figure 16-5 – Battery-grade lithium carbonate price forecast 2022-2040. Sources: Lithium-Price- Forecast-Q4-2022-Benchmark-Mineral-Intelligence, PwC Analysis. 16.2.4 Spodumene Price forecast – Relatively to carbonate price When we analyse the variations in price for spodumene (6%) as a percentage of lithium carbonate, prices are observed to vary from 3.1% to 7.3% depending on the period. According to BMI, the price of spodumene is expected to ratio against lithium products in 2024. In the long-term, BMI projects the spodumene to lithium ratio to stabilize between 4% to 5% (Figure 16-6). Authier Lithium DFS Technical Report Summary – Quebec, Canada 268 Figure 16-6 – Spodumene price forecast (as % of carbonate price) 2020-2040. Sources: Lithium-Price- Forecast-Q4-2022-Benchmark-Mineral-Intelligence, PwC Analysis. 16.3 RISKS AND UNCERTAINTIES The key risks with regards to the spodumene market: • Resources are being deployed to find substitutes for lithium as lower cost raw material source for battery production. • Lithium produced from brines can be less expensive to produce depending on concentration and extraction technology. • New extraction methods from brines such as direct lithium extraction could increase the supply of lithium. 16.4 OPPORTUNITIES The key opportunities with regards to the spodumene market are:

Authier Lithium DFS Technical Report Summary – Quebec, Canada 269 • There is a growing demand for batteries in line with global decarbonization targets • Hard rock processing into spodumene is a well-known process than is deployable with great certainty. • Lithium refined from spodumene into carbonate or hydroxide is of high purity, and is desired for battery production. 16.4.1 Refined Lithium Demand by Product According to Wood Mackenzie’s analysis, changing consumer preferences, government policies facilitating lower emissions as well as EV manufacturers increasing the number of models which provides more options to consumers are the key drivers for this demand growth. Also, recent investments in battery recharge infrastructure support aggressive growth in demand for the different lithium products. When observing demand for lithium by product, battery-grade lithium hydroxide (LiOH) and battery-grade lithium carbonate (Li2CO3) are the two most significant segments based on BMI’s forecasts. Lithium hydroxide demand is expected to reach a 58% market share by 2040 compared to 42% for lithium carbonate (Figure 16-7). Figure 16-7 – Refined demand by product (2020-2040). Sources: Lithium-Price-Forecast-Q4-2022- Benchmark-Mineral-Intelligence, PwC Analysis. Authier Lithium DFS Technical Report Summary – Quebec, Canada 270 16.4.2 Refined Lithium Demand by End Use Segment According to Benchmark Minerals Intelligence (BMI), market demand is expected to reach 5,814 thousand tons (short tons = 2,000 lb/ton) of lithium carbonate equivalent (LCE) in 2040, which is 17.4 times higher than the demand for lithium in 2020, which was 362 thousand tons (short tons = 2,000 lb/ton) of LCE. On that basis, aggregate lithium demand will grow at a compound annual growth rate (CAGR) of 15% from 2020 to 2040. From 2020 to 2030, demand is expected to grow 1.5x faster than 2020-2040, with a CAGR of 22%. The rechargeable battery segment is the most important segment for lithium demand, making up more than 95% of total demand on a 20-year average and growing at a 17% CAGR over the period (Figure 16-8). Figure 16-8 – Lithium demand by end use (2020-2040). Sources: Lithium-Price-Forecast-Q4-2022- Benchmark-Mineral-Intelligence, PwC Analysis.

Authier Lithium DFS Technical Report Summary – Quebec, Canada 271 16.5 CONTRACT SALES A memorandum of understanding (MOU) was developed between Authier and NAL, whereby NAL agrees to buy 100% of the Authier ore material at a selling price of CAD120/tonne of ore, delivered to the NAL ore pad area. The MOU was developed based on a lithium grade of 0.80% Li2O to 1.15% Li2O. 16.6 MARKET ANALYSIS 16.6.1 Market Balance for Battery Grade According to BMI, the market balance for battery grade lithium chemicals is expected to be in a deficit from 2021 to 2024. From 2025 to 2027, a slight surplus is expected as new production is brought online more rapidly than demand. However, from 2028 to 2040, a growing deficit is projected and is expected to reach 2,289 thousand tons (short tons = 2,000 lb/ton) of LCE in 2040 as demand for electric vehicles (EV) grows faster than supplier production. Several new supply projects are expected to start in the next few years. These projects have been discounted based on the current stage of development. For example, an operating facility will be 100% captured in the supply forecast. The scenario includes theoretical brines and conversion projects that have not been discovered as of Q4 2022. In all cases, the lithium chemicals market enters a deficit in 2028, even when including all potential projects forecasted by BMI. In May 2022, BMI projected that the industry would require more than 42 billion U.S. dollars of investment to meet market demand, a figure that has likely increased since then with the increasing demand projections (Figure 16-9). Authier Lithium DFS Technical Report Summary – Quebec, Canada 272 Figure 16-9 – et balance (supply vs demand) for battery grade lithium (2020-2040). Sources: Lithium- Price-Forecast-Q4-2022-Benchmark-Mineral-Intelligence, PwC Analysis.

Authier Lithium DFS Technical Report Summary – Quebec, Canada 273 17 ENVIRONMENTAL STUDIES, PERMITTING, SOCIAL OR COMMUNITY IMPACTS 17.1 ENVIRONMENTAL BASELINE AND IMPACT STUDIES 17.1.1 Environmental Baseline Environmental baseline studies including literature review, field works, and laboratory analysis were conducted in 2012, and from 2017 to 2022, by Sayona Quebec and the previous owner. The information presented in this report has been validated by Sylvain Collard, P.Eng., of Sayona Quebec. 17.1.2 Topography The topography of the Authier Property is relatively flat. The average elevation is 350 m, varying from 320 m to 390 m. On a regional scale, the crest of the Esker of St-Mathieu-Berry overhangs the surrounding ground by approximately 50 m to 60 m, with a general down slope in a north direction except for its southern extension, just north of the mining property, which has a down slope in a south, southwest, and southeast direction. 17.1.3 Local Geomorphology The three main geological features are small and large bedrock outcrops, the Esker of St-Mathieu-Berry, and glacial lacustrine sediments. Outcrops represent approximately 5% of the area. However, over this, the bedrock is only covered by a thin layer of soil in one third of the Northern claims. The Esker of St-Mathieu-Berry is made up of glaciofluvial sand and gravel with a core of gravel and pebbles, deposited directly over the bedrock. It has a cross-section form of a bell and of a longitudinal crest extending over 25 km on a south-to-north orientation, with its southern limit starting in the northeast corner of the Property. The crest of the Esker of St-Mathieu-Berry overhangs the surrounding ground by 20 m to 30 m. Sand and gravel pits are exploited both in the northern and in the southern portions of the esker. The thick basal till, observed in the southwest corner of the Property, is described as continuous with an average thickness over 1 m and a content of less than 30% of fine particles (silt and clay). A total of ten water wells are located in a radius of 5 km from the centre of the ultimate and the closest well is located at 3 km. The overburden thickness varies regionally (radius of 5 km) with an average of 8.8 m (Richelieu Hydrogéologie, 2018). Authier Lithium DFS Technical Report Summary – Quebec, Canada 274 17.1.4 Soils Quality Soils quality studies were carried out in 2017, 2018, 2019 and 2020. All samples did not show indication of potential contamination on the Property for polycyclic aromatic hydrocarbon (PAH), hydrocarbons, and metals. 17.1.5 Hydrology The Authier Project is close to the water division of two important watersheds that divide the province of Québec: the Harricana River which reports to James Bay, and the Kinojevis River which reports to the St- Lawrence River. The Authier Project is located in the Kinojevis watershed. The Authier Property is located on Kapitagama Lake sub-watershed and Croteau Lake sub-watershed. There are no significant bodies of water or streams close to the future mine site, other than small streams and ponds. A hydrogeological study started in December 2016 and currently includes the installation of 27 observation wells (piezometers), groundwater sampling campaigns, the achievement of variable head permeability tests and tracer profile testing as well as groundwater level surveys 17.1.6 Underground Water Quality From 2017 to 2022, 14 to 27 wells were sampled. Samples collected were analyzed for a variety of parameters including metals, nutrients, major anions and cations, volatile compounds, polycyclic aromatic hydrocarbons and C10-C50 petroleum hydrocarbons. Some aluminum, manganese and mercury concentrations exceeded drinking water standards. Criteria for the protection of aquatic life were also exceeded for copper, mercury, and zinc. 17.1.7 Surface Water Quality Surface water was sampled in 2017, 2018 and 2019. Sampling of the surface water was conducted in five locations, i.e., four stations in the core study area and one outside the extended study area, along the mainstream draining the core study area. Some exceedances of criteria for protection of aquatic life were observed for aluminum, iron, copper, manganese, lead, and nickel.

Authier Lithium DFS Technical Report Summary – Quebec, Canada 275 17.1.8 Sediments Sedimentation characterization was carried out in 2018, 2019 and 2020. Although several metal concentrations exceeded criteria in the two lakes under study, all the concentrations analyzed fall within the range of concentrations making up the geochemical background of sediments. 17.1.9 Vegetation and Wetlands Field surveys were carried out in 2012, 2017 and 2019. Terrestrial vegetation consists mainly of mixed and coniferous forest stands. Hardwood stands are scarce. Together, forest areas cover more than 80% of the study area. It should be noted that a significant portion of the study area has been totally or partially cut. Stands of fir and white spruce, mixed with white birch, dominate the forest landscape of the site. Other sites are occupied by black spruce, jack pine and larch, often in the company of white birch or trembling aspen. Wetlands were characterized in 2017, 2018 and 2019. Bogs and swamps are the main wetland classes characterized during the field surveys. Only a few bogs were located near the Project area. These bogs did not reveal any major particularities. Some low ecological value wetlands are located inside the limit of the open-pit and the waste rock dump areas. 17.1.10 Terrestrial and Avian Fauna Field inventory for snakes, salamanders and anurans was carried out in 2017 and 2018. Bird surveys were conducted in 2017 and 2019. A bat inventory was also completed in 2017. Finally, a small mammal and rodent inventory was conducted in 2017. No herpetofauna and no small mammal species at risk were observed. Three of the four bat species observed are at risk and are described hereafter. A total of 66 bird species were observed during the inventories. Nesting was confirmed for two species (Sharp-tailed Grouse and Cedar Waxwing). Species at risk observed are described hereafter. Authier Lithium DFS Technical Report Summary – Quebec, Canada 276 17.1.11 Fish and Fish Habitat Fish and fish habitats surveys were carried out in 2017 and 2019 on nine streams. Fish habitats have been observed for streams located at the open-pit location, downstream from the open-pit location, northwest of the waste rock dump location and downstream from the expected effluent discharge point. Results indicated that spawning and nursery/foraging habitats are of low quality in streams of the core study area due to, among other things, physicochemical conditions. Only one fish species was captured (i.e., Brook Stickleback). 17.1.12 Benthic Community The benthic community of the different stations sampled in 2012 is mostly composed of nematodes, annelids, insect larvae and mollusks. Results are showing between four and 34 different species with a variation of the number following the sampling stations. 17.1.13 Endangered Wildlife The Centre de Données sur le Patrimoine Naturel du Québec (CDPNQ) and Committee on the Status of Endangered Wildlife in Canada (COSEWIC) databases were consulted to identify any endangered species potentially present on the Property. It is important to mention that the absence of a species from a database or a field survey does not mean that the species is absent from the area of interest. Three at risk bat species were observed in the study area. The Hoary and Silver-haired bats are likely to be designated threatened or vulnerable in Québec (MFFP, 2019). They have no status at the federal level. The Little Brown bat is considered endangered and is listed in Appendix 1 of the Species at Risk Act in Canada. 17.2 MONITORING PROGRAM During the mine site future operations, a monitoring program will be implemented with some instrumentation (e.g., groundwater monitoring wells, surface water monitoring stations, etc.). The environmental monitoring program aims to ensure compliance with the environmental laws and regulations, conditions of the various permits and commitments that Sayona has made during the various meetings with stakeholders and public consultations. The monitoring program will be used to continue the environmental monitoring of the site after its rehabilitation and closure.

Authier Lithium DFS Technical Report Summary – Quebec, Canada 277 17.2.1 Groundwater Monitoring Piezometers are already installed on the site and monitoring of groundwater quality has been done since 2017. Some piezometers are equipped with water level probes and measurements are done continuously. This monitoring will continue during construction, operation and after the closure of the site. Piezometers will be added before construction outside the affected areas, as many of the piezometers currently installed will have to be destroyed (i.e., footprint of the open-pit or the waste rock dump). 17.2.2 Effluent Monitoring The monitoring of the final effluent will comply with the requirements of Directive 019 on the mining industry and the requirements of the Metal and Diamond Mining Effluent Regulation. Monitoring will be carried out as soon as the final effluent is discharged and will continue for five years after closure. 17.2.3 Environmental Effects Monitoring Program Only the federal government requires monitoring of the biological environment, which is a requirement of the Metal and Diamond Mining Effluent Regulation (MMER). The Metal Mining Environmental Effects Monitoring Program includes characterization of effluents (including toxicity testing), and receiving environment (fish, fish tissues, benthos, sediments). 17.3 WASTE ROCK, ORE, AND WATER MANAGEMENT Waste rock, ore and water management are presented in Chapter 15 (Project Infrastructure). Only geochemical characterizations and their results are presented hereafter. Geochemical studies allow the classification of waste rock, ore, and tailings according to provincial authority’s regulations standard for acid rock drainage potential (ARD) and metal leaching potential and identify any chemical that could potentially affect the surface or groundwater quality. Several studies of the mineralogy and environmental risk classification of waste rocks have been caried out from 2017 to 2021 and concluded that acid mine drainage is unlikely to occur in the waste stockpile and the temporary ore pile, but there is a potential for nickel leaching. Authier Lithium DFS Technical Report Summary – Quebec, Canada 278 17.3.1 Preliminary Geochemical Characterization Sayona conducted a preliminary geochemical characterization study of ore, waste rock and tailings samples in 2017 (Lamont, 2017). A total of three ore samples and 52 waste rock samples were collected and tested. These samples were selected based on geological cross-sections through the Deposit in order to select samples that will represent the vertical and spatial variability of the lithological rock units. A total of two samples of concentrator tailings have also been tested. Samples were collected from metallurgical testing and are representative of the final tailings. The main conclusions of the preliminary geochemical characterization were: • All waste rock types, ore and tailings are not potentially ARD generating; • Ore and tailings are not “leachable” as per Directive 019 classification; • Main waste rock lithologies are “leachable” as per Directive 019 classification. Metal leaching is especially important for nickel. 17.3.2 Kinetic Geochemical Characterization Kinetic testing was carried out by CTRI in 2019-2020. Kinetic testing has been carried out on four composite samples using humidity cells, columns, and on-field barrels procedures. The kinetic tests, especially the barrels, showed that waste rock is not ARD, but nickel leaching is significant. Storage of leachable mining residues (including waste rock) require Level A sealing measures (e.g., geomembrane) for the protection of groundwater (Figure 17-1).

Authier Lithium DFS Technical Report Summary – Quebec, Canada 279 Figure 17-1 – Decision flowsheet to determine the level of required protective measures (translation of Figure 2.3 of Directive 019, March 2012 version). Authier Lithium DFS Technical Report Summary – Quebec, Canada 280 17.3.3 Complementary Geochemical Studies In order to document the feasibility of segregation of waste rock as “leachable” and “non leachable”, various studies have been carried out: • Analysis of 611 waste rock samples for total metals and sulfur contents; • 3 D modelling of the nickel and sulfur distribution in the orebody; • Comprehensive mineralogical studies of ten samples with different characteristics (nickel content, sulfur content, etc.) targeting nickel speciation; • Static leaching tests on comprehensive mineralogical samples. • The main conclusion of these studies was that segregation is not possible because: • Nickel and sulfur in significant contents are not located in specific zones of the orebody; • Nickel is contained in both silicates and sulfides; • No relation has been observed between nickel leaching rates and nickel contents or sulfur contents. 17.3.4 Prediction of Water Quality Based on results from preliminary geochemical study and kinetic testing geochemical study, (MDAG, 2021) has produced a modelling of the quality of the water percolating through the waste rock pile and the water from open-pit dewatering. The predicted values will be used for design of the wastewater treatment installations. 17.4 PROJECT PERMITTING 17.4.1 Provincial Requirements In accordance with Québec’s Mining Act and Environmental Quality Act, permits are required in order to build and operate the mine. A mining lease is required from the Ministère des Ressources naturelles et des Forêts (MRNF) (formerly MERN). From a federal point of view, no Environmental Impact Assessment (EIA) is required as long as none of the physical activities (SOR/2012-147) would trigger the federal process. Furthermore, some other permit and authorization will be required in connection with the mining activities.

Authier Lithium DFS Technical Report Summary – Quebec, Canada 281 17.4.1.1 Mining Lease The mining lease is required to extract ore under the Mining Act. The application must be accompanied by, among other things, an approved closure and rehabilitation plan and a scoping and market study on processing in Québec. The deliverance of the mining lease is conditional on obtaining the approbation of the closure plan. According to the Quality Environmental Act a certificate of authorization is also required for construction and operation of the mine. A public consultation must also be part of the legal obligation and should last at least two months and include public open doors in the municipality where the Project is located. 17.4.1.2 Certificate of Authorization (Governmental Decree) The global certificate of authorization frames the environmental component of the Project, in respect to the Regulation respecting the environmental assessment and review of certain projects (CQLR, cQ2, r23.1). The projects listed in Schedule 1 are subject to the environmental impact assessment and review procedure under the Environment Quality Act (article 31.1). Therefore, Schedule 1 includes the establishment of a mine whose maximum daily capacity is equal to or greater than 2,000 metric tons. In 2018, a project notification was sent to the MELCC for an 1,850-tpd project. Due to the nature of the Project, and potential environmental issues, the MELCC has decided to use his discretionary power to make the Project subjected to the environmental assessment and review procedure. In May 2019, Sayona sent a revised Project notification for a 2,600-tpd project. In June 2019, the MELCC issued Guidelines for the EIA study of the Project. In January 2020, Sayona issued the EIA study. At the end of March 2020, the MELCC sent Sayona a first list of questions and commentaries. In December 2020, Sayona provided the MELCC with responses to the questions. In February 2021, the MELCC sent a second list of questions and commentaries to Sayona. In August 2021, Sayona acquired the NAL site. This site has operated between 2013 and 2018. In addition to the mine, a spodumene concentrator and a lithium carbonate hydrometallurgical NAL site are present at this site. Therefore, Sayona has decided to modify the Authier Project in order the transport the ore to the NAL site for processing. Authier Lithium DFS Technical Report Summary – Quebec, Canada 282 At the end of 2021, Sayona advised the MELCC that the Project has been modified in order to extract the ore at a 1,480-tpd rate for an extended life of mine (LOM) of 22 years. Mixing of NAL and Authier ores increase the overall lithium recovery. In November 2022, Sayona notified the MELCCFP that the company would like the Authier project to remain under the provincial environmental authorization procedure (BAPE) even if the production rate is lower than regulatory trigger. In November 2022, Sayona sent a new Project Notice to MELCCFP. In February 2023, MELCCFP notified Sayona that the Authier Lithium Project will be subjected to the BAPE procedure. In terms of social acceptability of the Authier Lithium Project and relations with stakeholders, Sayona has put in place a monitoring committee in accordance with the Mining Law and discussions are underway for the establishment of an Impact and Benefit Agreement with Abitibiwinni (Pikogan) and Lac Simon First Nations. In the coming months, several initiatives are planned to maximize socioeconomic benefits for all stakeholders. A revised ESIA will be produced in 2023. Following obtainment of the Governmental Decree, Sayona will have to obtain various permits for construction and operation of the mine. 17.4.1.3 Permits from MELCCFP Regional Office Following obtainment of the Governmental Decree, permits (ministerial authorization) will have to be delivered by the MELCCFP regional office. 17.4.2 Federal Requirements As per the Impact Assessment Act and the Physical Activities Regulations, a project is subject to the federal environmental impact assessment procedure if the mining or milling rates exceed 5,000 tpd. Therefore, the Authier Project is not subject to the federal procedure. 17.4.3 Other Authorizations Other permits or leases will have to be obtained depending on planned development activities at the site. Also, depending on RCM or municipal legislation, some permits may also be required from the RCM or the municipality.

Authier Lithium DFS Technical Report Summary – Quebec, Canada 283 The Project is subject to a number of provincial, federal and, in some cases, municipal regulations. Main laws and regulations that are applicable are listed in Table 17-1. Table 17-1 – Provincial and federal acts and regulations. Acts and Regulations Provincial Environment Quality Act (c. Q-2) Regulation respecting the application of section 32 of the Environmental Quality Act (Q-2, r. 2) Regulation respecting the application of the Environment Quality Act (Q-2, r. 3) Regulation respecting the regulatory scheme applying to activities on the basis of their environmental impact (Q-2, r.23.1) Design code of a storm water management system eligible for a declaration of compliance (Q-2, r.9.01) Clean Air Regulation (Q-2, r. 4.1) Regulation respecting operation of industrial establishments (Q-2, r. 26.1) Snow, road salt and abrasives management regulation (Q-2, r. 28.2) Regulation respecting pits and quarries (Q-2, r. 7) Regulation respecting the declaration of water withdrawals (Q-2, r. 14) Regulation respecting mandatory reporting of certain emissions of contaminants into the atmosphere (Q-2, r. 15) Regulation respecting halocarbons (Q-2, r. 29) Regulation respecting hazardous materials (Q-2, r. 32) Regulation respecting the reclamation of residual materials (Q-2, r.49) Regulation respecting activities in wetlands, bodies of water and sensitive areas (Q-2, r.0.1) Protection policy for lakeshores, riverbanks, littoral Zones and floodplains (Q-2, r. 35) Water withdrawal and protection regulation (Q-2, r. 35.2) Land protection and rehabilitation regulation (Q-2, r. 37) Regulation respecting the charges payable for the use of water (Q-2, r. 42.1) Directive 019 sur l’industrie minière (2012) Protection and rehabilitation of contaminated sites policy (1998) Mining Act (c. M-13.1) Regulation respecting mineral substances other than petroleum, natural gas and brine (M-13.1, r. 2) Threatened or Vulnerable Species Act (c. E-12.01) Regulation respecting threatened or vulnerable wildlife species and their habitats (E-12.01, r. 2) Regulation respecting threatened or vulnerable plant species and their habitats (E-12.01, r. 3) Compensation Measures for the Carrying out of Projects Affecting Wetlands or Bodies of Water Act (M-11.4) Act respecting the conservation of wetlands and bodies of water (2017, chapter 14; Bill 132) Watercourses Act (c. R-13) Regulation respecting the water property in the domain of the State (R-13, r. 1) Conservation and Development of Wildlife Act (c. C-61.1) Regulation respecting wildlife habitats (C-61.1, r. 18) Act respecting the lands in the domain of the state (chapter T-8.1) Regulation respecting the sale, lease and granting of immovable rights on lands in the domain of the State (chapter T-8.1, r. 7) Sustainable Forest Development Act (chapter A-18.1) Regulation respecting the sustainable development of forests in the domain of the State (chapter A-18.1, r. 0.01) Regulation respecting forestry permits (chapter A-18.1, r. 8.) Building Act (c. B-1.1) Safety Code (B-1.1, r. 3) Construction Code (B-1.1, r. 2) Explosives Act (c. E-22) Regulation under the Act respecting explosives (E-22, r. 1) Cultural Heritage Act (c. P-9.002) Authier Lithium DFS Technical Report Summary – Quebec, Canada 284 Acts and Regulations Occupational Health and Safety Act (c. S-2.1) Regulation respecting occupational health and safety in mines (S-2.1, r. 14) Highway Safety Code (c. C-24.2) Transportation of Dangerous Substances Regulation (C-24.2, r. 43) Federal Impact Assessment Act (S.C. 2019, c. 28, s. 1) Physical Activities Regulations (SOR/2019-285) Designated Classes of Projects Order (SOR/2019-323) Information and Management of Time Limits Regulations (SOR/2019-283) Fisheries Act (R.S.C., 1985, c. F-14) Authorizations Concerning Fish and Fish Habitat Protection Regulations (SOR/2019-286); Metal Mining Effluent Regulations (SOR/2002-222) Canadian Environmental Protection Act (S.C. 1999, c. 33) PCB Regulations (SOR/2008-273) Environmental Emergency Regulations, 2019 (SOR/2019-51); Federal Halocarbon Regulations (SOR/2003-289) National Pollutant Release Inventory Species at Risk Act (S.C. 2002, c. 29) Canadian Wildlife Act (R.S.C., 1985, c. W-9) Wildlife Area Regulations (C.R.C., c. 1609) Migratory Birds Convention Act, 1994 (S.C. 1994, c. 22) Migratory Birds Regulations (C.R.C., c. 1035) Nuclear Safety and Control Act (S.C., 1997, c. 9) General Nuclear Safety and Control Regulations (SOR/2000-202) Nuclear Substances and Radiation Devices Regulations (SOR/2000-207) Hazardous Products Act (R.S.C., 1985, c. H-3) Explosives Act (R.S.C., 1985, c. E-17) Transportation of Dangerous Goods Act (1992) Transportation of Dangerous Goods Regulations (SOR/2001-286) 17.5 OTHER ENVIRONMENTAL CONCERNS The Project will create temporary and permanent modifications to the mine site. During the environmental assessment process, project activities, that may directly or indirectly affect the environmental (physical and biological) and social (human) components, have been identified. These activities could be conducted during one or all of the three phases of the Project: construction, operation, and closure (and restoration). 17.5.1 Air Quality Air emission modelling has been conducted in 2022 and Sayona Québec (Sayona) will put in place a dust management plan to limit most of the possible nuisance. Sayona will establish various mitigation measures, such as use of water to control dust on mining site roads and all gravel roads used for ore transportation to the North American Lithium (NAL), site as well as progressive revegetation of the waste rock pile.

Authier Lithium DFS Technical Report Summary – Quebec, Canada 285 Moreover, Sayona will implement a complaint management protocol to allow citizens to express their concerns if the mining activities generate dissatisfaction. 17.5.2 Noise A noise modelling for the mining site was carried out in 2019 and updated in 2022. Given the size and remoteness of the Authier site, the soundscape should not be impacted, and the citizens should remain unbothered. However, the soundscape will be locally altered and may disturb some territory users. A noise modelling has also been produced in 2022 for the ore transportation to the NAL site. The study showed that with all mitigation measures in place the impact will be negligible. In order to limit noise, Sayona will implement various mitigation measures, such as blasting activities prohibited during evenings, weekends and at night, as well as no ore transportation on weekends and speed reduction on the small portion of the Route du Lithium. 17.5.3 Soils On-site activities may affect soil quality. Sayona will implement a procedure in the event of an oil, hazardous waste or hazardous material spill and carry out employee training. 17.5.4 Hydrology Water flows will be affected by mining operations. Therefore, the Project has been designed so that it has the smallest possible footprint and to avoid, as much as possible, any infringement on permanent watercourse. 17.5.5 Surface Water Quality To reduce unwanted effects on surface waters, Sayona will establish various mitigation measures including use of emulsion type explosives, placement of a geomembrane under the waste rock pile, the ditches and the water basins and installation of a treatment system capable of ensuring the discharge of effluents respecting Directive 019 norms and Metal and Diamond Mining Effluent Regulations (MDMER) norms, as well as aiming to respect, as far as possible, the Effluent Discharge Objectives that will be fixed Authier Lithium DFS Technical Report Summary – Quebec, Canada 286 by the Ministère de l’Environnement, de la Lutte contre les changements climatiques, de la Faune et des Parcs (MELCCFP; formerly MELCC). By applying all these mitigation measures, the water that will be discharged into the natural environment is expected to be harm-free for the environment. 17.5.6 Hydrogeology and Underground Water Quality Dewatering the pit will cause localized groundwater drawdown during the mine operation period. This drawdown will not affect any water users; therefore, no mitigation measures are required for this potential issue. However, a geomembrane will be installed under the waste rock pile, the ditches, and the water basins in order to protect groundwater quality. A hydrogeological study, conducted by Richelieu Hydrogéologie Inc., started in December 2016, and currently includes the installation of 27 observation wells (piezometers), groundwater sampling campaigns, the achievement of variable head permeability tests and tracer profile testing as well as groundwater level surveys. The hydrostratigraphic units identified at the Authier Property are the following: • Bedrock, a regional aquifer of a standard to low permeability. • Glacial till, an aquitard discontinuously covering the bedrock. • Fluvio-glacial sand and gravel (esker), a highly permeable aquifer, covering the till. • Glacio-lacustrine sand (aquifer) and silt (aquitard), covering the till unit and, partly, the fluvioglacial unit. • Organic layer, a thin and discontinuous aquitard. Following the water level surveys that were done for all piezometers installed on the site property, the following observations could be made: the groundwater level in the area of the Property is in the order of 329 m and the general direction of flow is towards the southwest under a horizontal hydraulic gradient of 0.02. During the mine life, the groundwater flow, from beneath the waste rock pile, will be directed towards the pit then, at natural flow, it will be directed towards the southwest. Water will be collected by the drainage ditch surrounding the waste rock pile and directed to the water basins.

Authier Lithium DFS Technical Report Summary – Quebec, Canada 287 The effects of mine dewatering on residential wells are deemed negligible. The effect of the Project on the environment would be, in the worst-case scenario, a reduced groundwater outflow to the local surface water network and to the wetlands. A reduced flow of brooks or drying of wetlands could then occur into the area of influence. The southern part of the St-Mathieu-Berry Esker is enclosed into the area of influence of the mine. However, this part of the esker is not connected to the main part of the esker which is being tapped by the drinking facilities of the city of Amos and also by the Eska water bottling society. Both portions of the esker are separated by a bedrock lump. In the esker, the groundwater generally flows towards the north, except in the Project area where it is heading south and southeast and to the Harricana River watershed. The southern portion of the esker, located in the Project area, is in a different watershed than the remainder of the esker. However, because it is located at a lower altitude than the esker and isolated from it by a bedrock, the Authier Project will not threaten, in any way and under any circumstances, the water quality of this esker. 17.5.7 Terrestrial Vegetation In order to reduce negative effects of activities on the terrestrial vegetation, Sayona will establish various mitigation measures, such as adequate delimitation of construction areas to minimize the size of terrestrial vegetation affected, revegetation of affected construction areas with indigenous species after the work is completed and progressive reclamation of the waste rock pile. 17.5.8 Wetlands In order to reduce negative effects of activities on wetlands, Sayona will implement various mitigation measures, such as adequate delimitation of construction areas to minimize the wetlands surface affected and installation of culverts in areas where a road crosses wetlands to ensure that surface water circulates freely. Finally, a compensation plan has been developed to offset losses of wetlands under the Act respecting the conservation of wetlands and bodies of water. Authier Lithium DFS Technical Report Summary – Quebec, Canada 288 17.5.9 Ichthyofauna In order to reduce negative effects of activities on ichthyofauna, Sayona will establish various mitigation measures, such as adequate delimitation of construction areas to minimize the fish habitats affected, location of infrastructure outside fish habitats where feasible, conservation of a riparian strip with a width of at least 30 m will be preserved on the banks of watercourses and waterbodies and treatment of potentially contaminated waters, if needed, before being sent back into the aquatic environment. 17.5.10 Species of Interest Sayona will implement numerous mitigation measures in order to protect herpetofauna, chiropterofauna, avifauna and small mammals. Those mitigation measures will reduce negative effects of activities on species of interest according to their taxonomic group. 17.5.11 Cultural and Archaeological Heritage No mitigation measures or specific maximization is planned for the cultural and archaeological heritage, except if, during mining activities, a cultural or archaeological site is discovered. In this case, the managers will have to report it to the site supervisor and, if necessary, work will cease at this site until an evaluation is completed by archaeologists. The public will be informed. An archaeological potential study carried out in 2018 concluded that the archaeological potential is very low, or even non-existent. 17.6 SOCIAL AND COMMUNITY IMPACTS 17.6.1 Decarbonization Plan According to numerous scientists, to avoid the worst effects of climate change, global temperature rise must be limited to 1.5°C above pre-industrial levels. To tackle the issue, world leaders at the UN Climate Change Conference (COP21) signed the historic Paris agreement. One of its goals is to reduce global greenhouse gas emissions to limit the global temperature increase in this century to 2°C while pursuing efforts to limit the increase further to 1.5°C. To align with the Paris agreement objectives, different governments are making commitments to reduce their country’s greenhouse gas (GHG) emissions. In Canada, the Net-Zero Emissions Accountability Act (2021), enshrines in legislation Canada's commitment to achieve net-zero emissions by 2050. For its part,

Authier Lithium DFS Technical Report Summary – Quebec, Canada 289 the Québec government committed itself to reducing by 37.5% by 2030 its GHG emissions in relation to the 1990 level. In a February 2023 report, governmental agency Statistiques Canada calculated that the mining sector in the province of Québec was responsible for 2.6% of the direct GHG emissions of the province (Statistiques Canada, 2021). Incidentally, many mining companies are stepping up to lower their emissions on a path towards carbon neutrality. As such, Sayona is engaged to play a role in global GHG emission reduction by extracting battery material that supports the transition to a low carbon energy economy and fight against climate change (United Nations, 2020) while respecting the environment by aiming a low carbon footprint of its activities and applying best practices. With that in mind, the Company started developing a decarbonization plan for the Authier Lithium Project. The first steps of the plan’s development consisted in research and workshop sessions, which resulted in a preliminary roadmap identifying strategies for reducing the Project’s GHG emissions. As the technologies develop regarding GHG emissions reduction, the Company’s decarbonization plan will evolve and the related strategies will be adjusted. 17.6.2 Strategy A preliminary GHG emission level assessment over the life of the Authier Project showed that nearly 80% of the Project’s GHG emissions came from mining operations as well as ore transportation. In order to reduce its environmental impact by reducing its GHG emissions, the Project’s decarbonization plan will address primarily those two emission factors. It will focus on two initial approaches: 1. Deploying innovative technologies to reduce GHG emissions produced by vehicles. 2. Compensating for difficult-to-reduce emissions by investing in GHG offsets. 17.6.2.1 Innovative Technologies Sayona will aim at implementing innovative technologies to reduce the GHG emissions for the Authier Project resulting from the Project related vehicles, both for the mining operation and the ore transportation. Three specific initiatives will be studied as part of the company’s decarbonization plan: Authier Lithium DFS Technical Report Summary – Quebec, Canada 290 • Alternative fuels: Operating conventional vehicles with renewable diesel sourced through the local supply chain; Retrofitting vehicles to run on renewable natural gas RNG; Collaborating with an original equipment manufacturer (OEM) and hydrogen producer for a proof of concept. • Electrification: Deploying battery powered trucks for ore transportation to LAN; Evaluating the best option to electrify mine operation with a mix of battery, trolley, and plug-in equipment. • Vehicle design: Working with an OEM to design more energy efficient equipment; Transitioning to an equipment fleet with structurally different energy consumption profile. Sayona is looking at the different readily available 100% electric transportation truck and related infrastructures to implement a trial period. 17.6.2.2 GHG Emissions Compensation Because a complete reduction of the Authier Project’s GHG emission can not be foreseen with the current technology maturity, compensation investments will be considered in the decarbonization plan. There are two compensation efforts that will be evaluated: • Indirect compensation: Purchasing carbon credits from accredited/recognized organizations, with an emphasis on Québec based organizations; Invest in a local GHG reduction initiative. • Direct compensation: Restoring natural habitats, such as wetland, impacted by previous mining activities or other with a high sequestration potential; Creating and running a tree planting program with a focus on the Abitibi region. For Sayona, the decarbonization plan will be an opportunity for unifying venture for its team, its suppliers and its stakeholders going forward. 17.6.3 Population The Authier Project site is located in La Motte, in the administrative region of Abitibi-Témiscamingue. The Property is accessible by a rural road network (Preissac Road and Nickel Road) connecting to Route 109, located a few kilometres east of the site (approximately 5 km). Route 109 connects Rivière-Héva with Amos, then Matagami; then joins Route 117 at Rivière-Héva. The Project is located approximately 35 km south of the Abitibiwinni Community of Pikogan.

Authier Lithium DFS Technical Report Summary – Quebec, Canada 291 The Abitibiwinni (Community of Pikogan) are the Algonquins of northern Abitibi. Today, Abitibiwinni is one of nine Algonquin communities in Québec. The community of residence of Abitibiwinni is known as Pikogan, a reserve established in 1956, 3 km north of the city of Amos. The Authier Project mine area is at the heart of the ancestral Abitibiwinni Aki territory, which the Abitibiwinni has never yielded. Community members continue to frequent this territory, including traditional hunting, fishing, and picking activities. The community lives approximately 35 km north of the Authier Project mine site and 3 km north of Amos, on the west bank of the Harricana River. Municipalities near the Authier Project site include: La Motte, Saint-Mathieu d’Harricana, Rivière-Héva, Preissac, and Amos. 17.6.4 Stakeholder Mapping Stakeholder identification was completed in 2017 using a mapping of the study area and a series of interviews with community stakeholders. The Project is located on the territory of the municipality of La Motte and on the territory recognized in the agreement signed between the Government of Québec and the Abitibiwinni First Nation. Thus, these two communities were targeted first for information and consultation meetings. The list of stakeholders was then completed by identifying the individuals or groups that could be directly or indirectly affected by the Authier Project. The main Community/Regional Stakeholders (non-exhaustive list) are as follows: • Abitibiwinni First Nation; • Municipality of La Motte; • Municipality of Saint-Mathieu-d’Harricana; • City of Amos; • Municipality of Rivière-Héva; • Municipality of Preissac; • Municipality of Saint-Marc-de-Figuery; • Regional County Municipality of Abitibi; • Comité citoyen pour le développement durable de La Motte; • Société de l’eau souterraine d’Abitibi-Témiscamingue (SESAT); • Groupe de recherche sur l’eau souterraine (GRES UQAT); • Organisme de bassin versant du Témiscamingue (OBVT); • Organisme de bassin versant Abitibi-Jamésie (OBVAJ); • Eska Inc. Authier Lithium DFS Technical Report Summary – Quebec, Canada 292 17.6.5 Land Uses The proposed mine site is entirely located on a forestry sector of public tenure which is not regulated by agreement. The main authorized uses for this forested area are production and harvesting of trees, outdoor activities, and agriculture. In the Project area, the activities found are as follows: • Timber harvesting. • Mining activities. • Exploitation of eskers and moraines. • Agricultural crop production. • Recreational (trails, campsites, ski resorts, etc.) and residential activities (residences, motels, cottages). • Ecological reserves. • Hunting, fishing, and trapping activities. 17.6.6 Potential Community Related Requirements and Status of Negotiations or Agreements 17.6.6.1 Community Relations Program A Community Relations Program has been developed to approach and engage local stakeholders. This program included information sessions and consultations with municipalities, land users, First Nation community, non-governmental environmental organizations, and recreational associations. Consultation and community engagement efforts that have been deployed throughout the Project development allowed Sayona to outline stakeholders’ main preoccupations and expectations. The objective of this program is to provide baseline information to address some of the communities’ concerns and take them into consideration in the permitting process and in the design of the operation phase. The involvement of stakeholders will continue throughout the various project stages. 17.6.6.2 Impacts and Benefits Agreement An Impacts and Benefits Agreement (IBA) will be signed with Abitibiwinni First Nation (AFN). The IBA will contain clauses concerning issues such as financial arrangements, business opportunities, hiring of AFN members living or not in Pikogan, adapted formation program, transportation, social worker,

Authier Lithium DFS Technical Report Summary – Quebec, Canada 293 establishment of various committees, environmental clauses, etc. The discussions between the AFN and Sayona are ongoing. An Agreement in Principle was concluded with AFN in December 2019 for the exploration phase of the Project. 17.6.6.3 Environmental Monitoring Committee The Environmental Monitoring Committee is composed of the following members: • Sayona; • AFN; • La Motte Citizens; • La Motte Senior Recreation Committee; • Regional Environmental Council; • Témiscamingue Watershed Organization; • Community Organization; • Centre-Abitibi Chamber of Commerce; • Harricana SADC; • Abitibi Local Centre for Development; • Eska Inc.; • Municipality of Preissac; • Municipality of La Motte; • Municipality of St-Matthieu d’Harricana; • Ministry of Natural Resources and Forests; • Abitibi MRC - Land Management; • Cegep of Abitibi-Témiscamingue. Meetings of this committee were held three times in 2019, three times in 2021 and twice in 2022. Annual reports from this committee will include: • A summary of the committee activities during the year. • Numbers of employees from La Motte and Preissac municipalities, from Pikogan and from Abitibi and Vallée de l’Or MRC. • Level of capital investments in Abitibi and in Québec province. • Level of operating costs spent in AFN, in Abitibi-Temiscamingue and in Québec province. Authier Lithium DFS Technical Report Summary – Quebec, Canada 294 Annual reports will be made public, and minutes of meetings will be made available on the Sayona internet site. 17.6.6.4 Sayona-Abitibiwinni First Nation Joint Committee In 2021 and 2022, Sayona held numerous meetings with Abitibiwinni Band Council and with the AFN Liaison Agent in order to discuss the various aspects of the Project. 17.6.6.5 Economic Spinoffs Committee Employment creation in this region is expected by the community; Sayona has committed to favor employing local population if qualifications are deemed equivalent to ensure direct social and economic benefits for the local population. Sayona also committed to giving subcontracting contracts to local companies, particularly for construction, deforestation, or transport, which will further stimulate the economy and direct benefits to the local economy. This commitment was made before the La Motte Community as well as the Abitibiwinni First Nation. For this purpose, Sayona initiated the creation of a local business register that also contains their contact information. This will facilitate local recruitment. 17.7 CLOSURE AND RECLAMATION PLAN A rehabilitation and closure plan are required as per the Mining Act. It must be approved before issuance of the mining lease, and a financial guarantee to fully implement the plan must be provided in three payments in the first two years following the approval of the plan. The closure plan was submitted in May 2018 and will be readjusted as Project changes needs. Progressive reclamation would be encouraged during the mining operation and will involve activities to reclaim, where possible, some parts of the waste rock stacking areas, exhausted borrow pits, etc. Rehabilitation would involve all activities after mining operations in accordance with the approved plan. Finally, monitoring would ensure that rehabilitation has been done successfully. Once all these steps are completed to the satisfaction of the MRNF, the land could be returned to the Crown.

Authier Lithium DFS Technical Report Summary – Quebec, Canada 295 17.7.1 Overview In accordance with the Mining Act requirements, a detailed closure plan must be submitted to the MRNF. The closure plan includes the following activities: • Rehabilitate the waste rock pile by covering slopes and flat areas with geotextiles, compacted inorganic overburden, organic overburden, and vegetation. • Remove from the site all surface and buried pipelines. • Remove buildings and other structures. • Rehabilitate and secure the open pit. • Reclaim any civil engineering works. • Remove machinery, equipment, and storage tanks. • Complete any other work necessary for final rehabilitation and closure. 17.7.2 Post-Closure Monitoring The detailed post-closure monitoring program will be conducted for at least five years after the final activities are completed. It will include the following aspects: • Monitoring of final effluent and surface water quality. • Status of revegetation. • Inspection for slope of the open pit, waste rock pile, ditches, etc. • Monitoring of groundwater quality. 17.7.3 Costs Estimation A financial guarantee whose amount corresponds to the total anticipated cost of completing all the work set forth in its rehabilitation and restoration plan. The payment shall be provided in three installments constituting 50%, 25% and 25% of the total restoration costs. The first payment shall be provided within 90 days of receiving the approval of the restoration plan. The second and third installments (25%) are due on the anniversary date of the restoration plan approval. The total cost of closure and reclamation (and the guarantee) is estimated at $41.7M. This cost includes the direct and indirect costs of site rehabilitation as well as post-closure monitoring, engineering costs (30%) and the mandatory 15% contingency. Authier Lithium DFS Technical Report Summary – Quebec, Canada 296 It is noteworthy that the construction of the cover (overburden and geomembrane) over the waste rock pile corresponds to 89% of the total cost estimate. Installation of the cover will be carried out progressively.

Authier Lithium DFS Technical Report Summary – Quebec, Canada 297 18 CAPITAL AND OPERATING COSTS This chapter summarizes the capital and operating cost estimates related to the Project. All costs presented in this Report are in Canadian dollars, unless otherwise specified. 18.1 SUMMARY OF CAPITAL COST ESTIMATE The capital cost estimate prepared for this study meets AACE Class 3 criteria, usually prepared to establish a preliminary capital cost forecast and assess the economic viability of the Project. This allows management, and / or the Project sponsor, to obtain authorization for funds for the Project’s next stages. As such, this estimate forms the initial control estimate against which subsequent phases will be measured and monitored. There are two significant changes to the capital cost estimate with respect to the previous study: 1. There is no longer a concentrator at the Authier site; and 2. The waste piles and water management infrastructure require a geomembrane under their bases due to the metal leaching potential of the waste rock material. Table 18-1 provides a summary by cost type for the initial capital costs. Table 18-1 – Initial capital costs summary. Item Total (M CAD) Mining (mining contractor, mining equipment and services) $5.80 Infrastructure $69.62 Wetland Compensation $1.50 Royalty Buyback $1.00 Total $77.92 Most of the capital for Authier is pre-production and in the first year and is not presented on an annual basis. This is not the case for sustaining capital and is presented on an annual basis in a later section. Authier Lithium DFS Technical Report Summary – Quebec, Canada 298 18.2 MINE CAPITAL EXPENDITURE The mining cost estimate includes all elements associated with mining activities, including mine preproduction, the ore rehandling wheel loader, and other services, dewatering, clearing, grubbing, surveying, and spare parts. The mining operations will be performed by a mining contractor. Table 18-2 – Initial capital cost estimate for mining. Item Total (M CAD) Preproduction 3.39 Equipment 2.41 Total 5.80 The capital expenditure is based on budgetary quotes received from equipment suppliers and mining contractors. 18.3 PLANT CAPITAL EXPENDITURE Plant capital costs have been assigned to the NAL project as the material mined from Authier will be transported and processed at that location. 18.4 INFRASTRUCTURE CAPITAL EXPENDITURE Infrastructure costs included in the capital cost estimate are summarized as follows: • Waste stockpile foundation work; • Water collection basins; • Water treatment plant; • Electrical work; • On-site roads; • Access road; • Owner’s costs; • EPCM services; • Commissioning;

Authier Lithium DFS Technical Report Summary – Quebec, Canada 299 • Overhead; • Other; • Contingency. Table 18-3 provides the infrastructure capital cost estimate. Table 18-3 – Infrastructure capital cost estimate. Item Total (M CAD) Waste Stockpile and Water Management $44.85 Electrical Work $0.84 On-site Roads $2.53 Access Road $0.65 Owner's Costs $2.44 EPCM Services $7.33 Commissioning $0.28 Overhead $0.22 Other $1.37 Contingency $9.08 Total $69.62 Contingency is an integral part of the estimate and can best be described as an allowance for undefined items or cost elements that will be incurred, within the defined Project scope, but that cannot be explicitly foreseen due to a lack of detailed or accurate information. Contingency analysis does not consider Owner’s costs, Project risk, currency fluctuations, escalation, or costs due to potential scope changes or labour stoppages. 18.5 PREPRODUCTION AND ENVIRONMENTAL COSTS Table 18-4 summarizes the initial capital cost estimate with the following sections providing further detail and relevant basis for the estimate. Authier Lithium DFS Technical Report Summary – Quebec, Canada 300 Table 18-4 – Project initial capital cost detailed summary. Item Total (M CAD) Mining $5.80 Preproduction Mining $3.39 Owner Equipment and Mine Services $2.41 Infrastructure $69.62 Waste Stockpile and Water Management $44.85 Electrical Work $0.84 On-site Roads $2.53 Access Road $0.65 Owner's Costs $2.44 EPCM Services $7.33 Commissioning $0.28 Overhead $0.22 Other $1.37 Contingency $9.08 Wetland Compensation $1.50 Wetland Compensation $1.50 Royalty Buyback $1.00 1 claim $1.00 Total $77.92 18.6 BASIS OF ESTIMATE 18.6.1 Estimate Overview and Qualifications The capital cost estimate has been compiled by BBA and includes estimates from different sources and allocations from the Owner’s team. The capital cost estimate includes all direct costs, indirect (Owner and other) costs, contingency, and other allowances. The estimate is based on the preliminary engineering and design completed to date. Budget quotations have been obtained for key equipment while materials and construction efforts are based on in-house data from similar projects and industry standard estimating factors. 18.6.2 Base Date The estimate is expressed in constant Canadian dollars with a base date of Q1 2023.

Authier Lithium DFS Technical Report Summary – Quebec, Canada 301 18.6.3 Estimate Accuracy The estimate accuracy is evaluated based on the level of scope definition and type of pricing obtained for each element. This estimate’s accuracy level is expected to be between -20% to +20%. Foreign exchange risk or new duties impact have not been included in the accuracy assessment. This estimate of accuracy is also limited to the current scope. This accuracy level could be exceeded if the scope is varied by, for example, changing production rate, new environmental study results, or by major changes to assumptions regarding infrastructure. 18.6.4 Exclusions and Assumptions The caveats, exclusions, and assumptions relevant to the capital estimate include, but are not limited to: • Limited geotechnical data was available for the feasibility study; • Hydrogeological inputs to the FS were nominal only; • No infrastructure geotechnical investigations have been undertaken; • Cost of schedule delays caused by scope changes, labour disputes, or environmental permitting activities are excluded; • Project financing cost is excluded; • Additional study costs prior to Project implementation are excluded, e.g., water studies, sampling, ongoing testing, drilling and resource development; • VAT, import duties, surcharges and any other statutory fees are excluded; • Any provisions for Project risks, outside of those related to design and estimating confidence levels, have not yet been evaluated; • Mineral rights, rental fees and the purchase or use of the land are excluded; • Escalation and impact of currency fluctuations has been excluded; • Risk from new duties on material such as steel and aluminum on bulk material (e.g., structural, rebar and embedded metal in concrete, equipment, pipe, wire, etc.) is not included. 18.6.5 Wetlands Compensation A CAD$1.5M compensation measure is expected to offset losses of wetlands under the Act respecting the conservation of wetlands and bodies of water. Authier Lithium DFS Technical Report Summary – Quebec, Canada 302 18.6.6 Royalty Buyback A buyback of the 1% royalty on claim CDC2116146, for an amount of CAD$1.0M, is planned. 18.6.7 Closure and Reclamation In accordance with the Mining Act of Québec, closure and reclamation requirements have been developed to return the Authier Lithium Project site to an acceptable condition, ensuring that the site is safe, and the surrounding environment is protected. The cost of restoring the Authier Lithium site is estimated to be CAD$41.7M. As required by the Ministère des Ressources naturelles et des Forêts (MRNF, formerly MERN), this cost estimate includes the cost of site restoration, the post-closure monitoring as well as engineering costs (30%) and a contingency of 15%. In accordance with the regulations, Sayona intends to post a bond as a guarantee against the site restoration cost. 18.7 SUSTAINING CAPITAL The total sustaining capital cost is estimated at CAD$74.4M through the mine life. The sustaining capital cost is composed of the following items, presented in Table 18-5. Table 18-5 – Sustaining capital costs. Year Unit 2026 2027 2028 2029 2030 2031 –2035 2036 –2040 2041 –2047 Total Mining M CAD $0.00 $0.00 $0.14 $0.14 $1.34 $1.48 $0.26 $0.41 $3.76 Infrastructure M CAD $29.84 $0.00 $9.12 $21.29 $0.00 $10.39 $0.00 $0.00 $70.64 Sustaining Capital Costs M CAD $29.84 $0.00 $9.26 $21.43 $1.34 $11.88 $0.26 $0.41 $74.40 18.7.1 Mining The mine sustaining capital cost is attributable to the growing need for mine dewatering and clearing and grubbing as well as replacement for the ore-rehandling wheel loader.

Authier Lithium DFS Technical Report Summary – Quebec, Canada 303 18.7.2 Infrastructure Infrastructure sustaining costs include the expansion of the waste pile foundation and drainage ditches. Waste pile foundation has been sequenced in time for three reasons: 1. No need to prepare the whole area for Year 1. 2. Limit the amount of water to be treated with a larger area. 3. Delay capital expenditure. 18.7.3 Closure and Reclamation The mine closure cost estimated is attributable to: • The dismantling of the infrastructure, including restoration and the rehabilitation of the sector; • The dismantling and demobilization of the water treatment system and the pumping station including restoration and rehabilitation of the area; • Securing the site; and • The management of residual materials. 18.8 SUMMARY OF OPERATING COST ESTIMATE Table 18-6 summarizes the operating costs calculated for the life of mine (LOM) of the Project. Table 18-6 – Summary LOM operating costs. Cost Area LOM (M CAD) Unit (CAD/t Ore) Unit (USD/t Ore) Mining $540.56 $48.16 $36.12 Water treatment management $58.73 $5.23 $3.92 General and Administration $20.97 $1.87 $1.40 Total operating costs $620.27 $55.26 $41.44 Reclamation bond insurance payment $7.65 $0.68 $0.51 Ore Transport and Logistics Costs $223.36 $19.90 $14.92 Total operating and other costs $851.28 $75.84 $56.88 Royalty deductions $28.96 $2.58 $1.94 First Nation royalties $27.04 $2.41 $1.81 Reclamation and closure costs $41.71 $3.72 $2.79 Total Operating, Royalties, Reclamation and Closure Costs $948.99 $84.54 $63.41 Authier Lithium DFS Technical Report Summary – Quebec, Canada 304 18.9 MINE OPERATING COST 18.9.1 Mine and Geology The operating costs have been estimated using parameters outlined in the previous sections of the Report. A mining contractor will carry out the majority of the mining and maintenance activities. Budgetary quotes were obtained from various mining contractors to estimate the operating costs. The cost estimate was developed from first principles and was based on the following general inputs and assumptions: • Diesel price of CAD$1.160/L. • Mining costs, excluding fuel, mine dewatering, supervision and technical services, and pre-split drilling and blasting: o Ore: CAD$7.01/t mined. o Waste Rock: CAD$5.28/t mined. o Overburden: CAD$3.80 CAD/t minds. • The mine operations salaries were provided by Sayona. BBA has not revised the data of the analysis. Table 18-7 presents the estimated mining operating costs over the LOM and Table 18-8 presents the unit costs per cost category.

Authier Lithium DFS Technical Report Summary – Quebec, Canada 305 Table 18-7 – LOM mining operating costs. Description Unit 2025 2026 2027 2028 2029 2030 2031–2035 2036–2040 2041–2046 LOM Mining Contractor M CAD $5.66 $11.01 $10.59 $12.14 $31.31 $31.43 $165.32 $135.16 $35.73 $438.34 Owner Equipment M CAD $0.07 $0.14 $0.14 $0.14 $0.14 $0.14 $0.71 $0.71 $0.80 $2.99 Fuel M CAD $0.80 $1.57 $1.93 $2.08 $3.22 $3.27 $18.28 $17.93 $9.95 $59.04 Salaries M CAD $0.46 $0.92 $0.92 $0.92 $0.92 $0.92 $4.59 $4.59 $4.28 $18.51 Services M CAD $0.53 $1.08 $1.08 $1.09 $1.09 $1.11 $5.51 $5.59 $4.60 $21.69 Total Cost M CAD $7.53 $14.73 $14.66 $16.36 $36.68 $36.86 $194.41 $163.98 $55.35 $540.56 Total Unit Cost CAD/t mined $6.92 $7.82 $7.74 $6.56 $6.13 $6.17 $6.48 $6.76 $9.79 $6.79 Authier Lithium DFS Technical Report Summary – Quebec, Canada 306 Table 18-8 – LOM mining operating cost breakdown. Cost Category LOM % of Total (CAD/t mined) Mining Contractor $5.51 81% Owner Equipment $0.04 1% Fuel $0.74 11% Salaries $0.23 3% Services $0.27 4% Total $6.79 100% 18.10 PLANT OPERATING COST Plant Operating Cost have been excluded as these form part of the NAL property operating costs. 18.11 G&A The total general and administration (G&A) costs are estimated at CAD$20.97M for the life of the Project, for an average of CAD$1.87/t of ore. The G&A costs are relatively low due to the synergies with the North American Lithium (NAL) mine. The G&A costs include: • Contract services (janitor, security, garbage disposal); • Infirmary and safety equipment. • Site communications. • Training expenses. • Taxes & municipality support. • Additional environmental services. • Insurances. • Other general costs.

Authier Lithium DFS Technical Report Summary – Quebec, Canada 307 19 ECONOMIC ANALYSIS 19.1 ECONOMIC BASE CASE, INPUTS AND ASSUMPTIONS The economic analysis was performed using the following assumptions and basis: • The economic analysis has been done on a Project basis and does not take into consideration the timing of capital outlays that have been completed prior to the date of this Report. • The financial analysis was based on the Mineral Reserve Estimate presented in Chapter 15, the mine plan and assumptions detailed in Chapter 16, the marketing assumptions in Chapter 19, the capital and operating costs estimated in Chapter 21 and by taking into consideration key Project milestones as detailed in Chapter 24. • Production of ore is scheduled to begin in the third quarter (Q3) of 2025 model Year 1. Mine operations are estimated to span a period of approximately 22 years. • A discount rate of 8% has been applied for the NPV calculation. • The ore price of CAD$120/t is established by a contractual procurement agreement between NAL and Authier Lithium and will last for the whole production period of Authier Lithium. Furthermore, to confirm that this price is justifiable, a transfer pricing analysis was performed which provides a feasible price range for Authier Lithium’s ore of CAD$96/t (based on return of capital employed methodology) and CAD$137/t (based on return of total costs methodology). • All products are assumed to be sold in the same year they are produced. • Class-specific capital cost allowance rates are used for the purpose of determining the allowable taxable income. • The economic analysis was performed on Proven and Probable Mineral Reserves as outlined in this Report. • Tonnes of mined ore are presented as dry tonnes. • Discounting starts in January 2025. • Cash inflows and outflows start in March 2025 and are presented in constant Q1 2023 CAD, with no inflation or escalation factors considered. • The accuracy levels ranged from -10% to +15%. This financial analysis was performed on both a pre-tax and after-tax basis with the assistance of an external tax consultant. The general assumptions used for this financial model, are summarized in Table 19-1. Table 19-2 shows all project costs for the life of the Project. Authier Lithium DFS Technical Report Summary – Quebec, Canada 308 Table 19-1 – Authier Lithium operation – Financial analysis summary. Item Unit Value Unit Value Mine Life year 22 year 22 Strip Ratio t:t 6.1 t:t 6.1 Total Mill Feed Tonnage Mt 11.2 Mt 11.2 Revenue Ore Selling Price CAD/t ore 120 USD/t ore 90 Exchange Rate USD:CAD 0.75 Project Costs Open Pit Mining CAD/t ore 48.16 USD/t ore 36.12 Water Treatment and Management CAD/t ore 5.23 USD/t ore 3.92 General and Administration (G&A) CAD/t ore 1.87 USD/t ore 1.4 Reclamation Bond Insurance Payment CAD/t ore 0.67 USD/t ore 0.5 Ore transport and logistic costs CAD/t ore 19.9 USD/t ore 14.92 Project Economics Gross Revenue CAD M 1347 USD M 1010.3 Total Operating Cost Estimate CAD M 627.9 USD M 470.9 Reclamation Bond Insurance Payment CAD M 7.6 USD M 5.7 Transportation and Logistics Cost CAD M 223.4 USD M 167.5 Total Capital Cost Estimate CAD M 77.9 USD M 58.4 Total Sustaining Capital Cost Estimate CAD M 74.4 USD M 55.8 Reclamation and Closure Costs CAD M 41.7 USD M 31.3 Royalty Deduction CAD M 29 USD M 21.7 First Nation Royalties CAD M 27 USD M 20.3 Non-discounted Cash Flow (Pre-Tax) CAD M 280.4 USD M 210.3 Discount Rate % 8% % 8% PRE-TAX NPV @ 8% CAD M 58.1 USD M 43.5 Pre-Tax Internal Rate of Return (IRR) % 14.6% % 14.6% Table 19-2 – Authier Lithium operation – Authier Lithium total project costs. All Project Costs CAD (M) CAD/t Ore USD (M) USD/t Ore Total Operating Cost Estimate $628.00 $55.94 $471.00 $41.95 Transportation and Logistics Cost $223.00 $19.90 $168.00 $14.92 Total Sustaining Capital Cost Estimate $74.00 $6.63 $56.00 $4.97 Total Capital Cost Estimate $78.00 $6.94 $58.00 $5.21 Reclamation and Closure Costs $42.00 $3.72 $31.00 $2.79 Royalty Deduction $29.00 $2.58 $22.00 $1.94 First Nation Royalties $27.00 $2.41 $20.00 $1.81 Total Project Costs $1,101.00 $98.11 $826.00 $73.58

Authier Lithium DFS Technical Report Summary – Quebec, Canada 309 19.2 PRODUCTS CONSIDERED IN THE CASH FLOW ANALYSIS Table 19-3 – Project cash flows on an annualized basis (CAD). Detailed Period/Fiscal Year Financials 2025 2026 2027 2028 2029 2030 2031 2032 2033 2034 2035 2036 2037 2038 2039 2040 2041 2042 2043 2044 2045 2046 2047 LOM Total Authier Mine Production Summary Waste Rock (Mt) 0.1 1.1 1.2 0.7 2.4 4.3 4.9 5.4 5.2 5.2 5.4 5.5 5.2 5 4.6 3 1.4 0.7 0.5 0.4 0.3 0.2 0.1 63 Overburden (Mt) 0.3 0.4 0.2 0.9 1.3 1.1 0.6 0 0.2 0.3 0 0 - - - - - - - - - - - 5.4 ROM Ore to Plant (Mt) - 0.5 0.5 0.5 0.5 0.5 0.5 0.5 0.5 0.5 0.5 0.5 0.5 0.5 0.5 0.5 0.5 0.5 0.5 0.5 0.5 0.4 0.2 11.2 Stripping Ratio - 2.9 2.5 3.1 6.9 10.1 10.1 10.2 10.4 10.4 10.4 10.4 9.8 9.4 8.7 5.8 2.7 1.3 0.9 0.8 0.6 0.5 0.5 6.1 Revenues Ore Sales ($M) - 63.2 64 64.4 64.7 64.6 64.7 64.2 63.2 63.2 63.4 63 64 64.3 63.2 63 62.9 63.2 63.5 63.1 63.3 52.9 21 1347 Royalty Deduction ($M) - -1.4 -1.4 -1.4 -1.4 -1.4 -1.4 -1.4 -1.4 -1.4 -1.4 -1.4 -1.4 -1.4 -1.4 -1.4 -1.4 -1.4 -1.4 -1.4 -1.4 -1.1 -0.5 -29 Total Revenue ($M) - 61.9 62.6 63.0 63.3 63.2 63.3 62.8 61.9 61.8 62.0 61.7 62.7 62.9 61.8 61.6 61.6 61.8 62.1 61.8 62.0 51.8 20.5 1,318.1 Operating Expenditures Open Pit Mining ($M) - OWNER - 3.7 3.9 4.2 4.8 5.4 5.5 5.6 5.7 6 6 6 6 6.1 5.9 5.3 4.5 4.1 4 3.9 3 1.8 0.7 102.2 Open Pit Mining ($M) - CONTRACT - 11.2 10.8 11.4 21.7 31.4 32.3 33.1 32.7 32.7 33.4 33.4 31.8 31 28.6 19.9 11.4 7.5 6.4 6 5.5 4.4 1.7 438.3 Water Treatment/Management ($M) 0.5 1.5 1.5 1.5 2.3 3 3 3 3 3 3 3 3 3 3 3 3 3 3 3 3 2.5 1 58.7 General and Administration ($M) 0.3 1 1 1 1 1 1 1 1 1 1 1 1 1 1 1 1 1 1 1 1 1 0.5 21 Reclamation Bond Insurance Payment ($M) - 0.3 0.3 0.3 0.3 0.3 0.3 0.3 0.3 0.3 0.3 0.3 0.3 0.3 0.3 0.3 0.3 0.3 0.3 0.3 0.3 0.3 0.2 7.5 Total Onsite Operating Costs ($M) 0.8 17.7 17.5 18.3 30.1 41.1 42.1 43.0 42.7 43.0 43.7 43.7 42.2 41.5 38.9 29.5 20.3 16.0 14.7 14.1 12.8 10.0 4.0 627.7 Ore Transport and Logistics Costs ($M) - 10.5 10.6 10.7 10.7 10.7 10.7 10.6 10.5 10.5 10.5 10.5 10.6 10.7 10.5 10.4 10.4 10.5 10.5 10.5 10.5 8.8 3.5 223.4 Authier Lithium DFS Technical Report Summary – Quebec, Canada 310 Detailed Period/Fiscal Year Financials 2025 2026 2027 2028 2029 2030 2031 2032 2033 2034 2035 2036 2037 2038 2039 2040 2041 2042 2043 2044 2045 2046 2047 LOM Total Total Operating and Shipping Costs ($M) 0.8 28.2 28.1 29.0 40.8 51.8 52.8 53.6 53.2 53.5 54.2 54.2 52.8 52.1 49.3 40.0 30.7 26.5 25.3 24.6 23.3 18.7 7.5 851.1 Capital Expenditures Pre-production ($M) 67.9 10 - - - - - - - - - - - - - - - - - - - - - 77.9 Sustaining ($M) - 14.9 14.9 4.6 15.3 11.4 0.7 - 1.7 5.4 4.2 0.7 0.1 - - - 0.1 0.2 0.1 - - - - 74.4 Mine Closure Plan Financial Guarantee ($M) - 20.9 10.4 10.4 - - - - - - - - - - - - - - - - - - - 41.7 Total Capital Costs ($M) 67.9 45.8 25.3 15.1 15.3 11.4 0.7 - 1.7 5.4 4.2 0.7 0.1 - - - 0.1 0.2 0.1 - - - - 194.0 First Nation Royalties First Nation Royalties ($M) 0.1 1.3 1.2 1.3 1.3 1.3 1.3 1.3 1.3 1.3 1.3 1.3 1.3 1.3 1.3 1.3 1.3 1.3 1.3 1.3 1.3 1.1 0.4 27 Cumulative First Nation Royalties ($M) 0.1 1.4 2.6 3.9 5.2 6.5 7.8 9.1 10.4 11.6 12.9 14.2 15.4 16.7 18.0 19.2 20.5 21.8 23.0 24.3 25.6 26.6 27.0 27.0 Pre-Tax Cash Flow Pre-Tax Cash Flow ($M) -57.4 -7.9 7 20.1 9.2 -1.3 10.1 9.6 7.6 3.6 3.4 7.1 9.9 11.3 12.6 21.6 31 35.4 37.1 37.5 38.9 33.9 0.2 280.4 Cumulative Pre-Tax Cash Flow ($M) -57.4 - 65.3 - 58.3 - 38.2 - 28.9 - 30.2 - 20.2 - 10.6 -3.0 0.6 4.0 11.1 21.0 32.2 44.8 66.4 97.4 132.8 169.9 207.4 246.3 280.2 280.4 280.4 Taxes Federal Corporate Income Tax ($M) - 2 1.9 2.2 1 - - - - - - - 0.1 1 1.2 2.4 3.6 4 4.1 4.2 4.3 3.7 1.5 37.2 Provincial Corporate Income Tax ($M) - 1.5 1.5 1.7 0.8 - - - - - - - 0.1 0.7 0.9 1.9 2.8 3.1 3.2 3.2 3.3 2.8 1.1 28.5 Québec Mining Tax ($M) - 1 1.8 2.7 1 0.4 0.4 0.4 0.6 0.5 0.5 0.7 0.8 1.1 1.9 3.4 5.5 7.6 8.4 8.6 9.4 8.2 3.2 68.1 Total Taxes ($M) - 4.5 5.1 6.6 2.7 0.4 0.4 0.4 0.6 0.5 0.5 0.7 1.0 2.9 4.0 7.8 11.8 14.7 15.7 16.0 17.0 14.7 5.8 133.7 Post-Tax Cash Flow Post-Tax Cash Flow ($M) -57.4 - 12.5 1.8 13.4 6.4 -1.8 9.6 9 7 3 2.8 6.3 8.8 8.3 8.5 13.7 19 20.7 21.3 21.4 21.8 19.1 -5.6 144.7 Cumulative Post-Tax Cash Flow ($M) -57.4 - 69.9 - 68.1 - 54.7 - 48.2 - 50.0 - 40.4 - 31.4 - 24.5 - 21.5 - 18.7 - 12.4 -3.6 4.7 13.2 26.9 46.0 66.7 87.9 109.3 131.2 150.3 144.7 144.7

Authier Lithium DFS Technical Report Summary – Quebec, Canada 311 19.3 FINANCIAL MODEL AND KEY METRICS The financial evaluation results for the base case of the Project are presented in Table 19-4. Table 19-4 – Financial analysis summary (pre-tax and after-tax). Description Base Case Unit Pre-Tax Non-Discounted Cashflow $280.40 CAD (M) Net Present Value (8% disc.) $58.10 CAD (M) Internal Rate of Return (IRR) 14.6% % After-Tax Non-Discounted Free Cashflow $144.70 CAD (M) Net Present Value (8% disc.) $10.60 CAD (M) Internal Rate of Return (IRR) 9.4% % The pre-tax base case financial model resulted in an IRR of 14.6% and a NPV of CAD$58.1M with a discount rate of 8%. On an after-tax basis, the base case financial model resulted in an IRR of 9.4% and a NPV of CAD$10.6M, with a discount rate of 8%. 19.4 TAXES, ROYALTIES AND OTHER FEES 19.4.1 Royalties The Project is subject to paying royalties to several parties. Furthermore, Sayona is engaging with First Nations with the consideration of paying both fixed and variable royalties based on project cash flows. Preliminary assumptions have been included in the financial projections for the Project. 19.4.2 Working Capital The change in working capital is included in the calculation of both the pre-tax and after-tax cashflows. The major categories of working capital are: • Accounts receivable; • Accounts payable; Authier Lithium DFS Technical Report Summary – Quebec, Canada 312 • Deferred revenue; • Inventory. 19.4.3 Taxation The Project is subject to three (3) levels of taxation: federal corporate income tax, provincial corporate income tax, and provincial mining taxes. The taxation calculations for the Project were completed by PricewaterhouseCoopers (PwC). The current Canadian tax system applicable to Mineral Resource income was used to assess the annual tax liabilities for the Project. This consists of federal and provincial corporate income taxes, as well as provincial mining taxes. The federal and provincial (Québec) corporate income tax rates currently applicable over the operating life of the Project are 15.0% and 11.5% of taxable corporate income, respectively. The marginal tax rates applicable under the Mining Tax Act in Québec are 16%, 22% and 28% of taxable income and are dependent on the profit margin. It has been assumed that the 20% processing allowance rate associated with transformation of the mine product to a more advanced stage within the province would be applicable in this instance. The tax calculations are based on the following key assumptions: • The Project is held 100% by a corporate entity carrying on its activities solely in La Motte, Québec, and the after-tax analysis does not attempt to reflect any future changes in corporate structure or property ownership. • Financing with 100% equity and, therefore, does not consider interest and financing expenses. • Tax legislation, i.e., federal, provincial, and mining, will apply up to the end of the period covered by the calculations as currently enacted and considering currently proposed legislation. • It is anticipated, based on the Project assumptions, that Authier will pay approximately CAD$133.7M of taxes over the life of the Project. 19.5 CONTRACTS A memorandum of understanding (MOU) was developed between Authier and NAL, whereby NAL agrees to buy 100% of the Authier ore material at a selling price of CAD$120/tonne of ore, delivered to the NAL ore pad area. The MOU was developed based on a lithium grade of 0.80% Li2O to 1.15% Li2O.

Authier Lithium DFS Technical Report Summary – Quebec, Canada 313 19.6 INDICATIVE ECONOMICS, BASE CASE The economic assessment of the Project was carried out using a discounted cash flow (DCF) approach on a pre-tax and after-tax basis, based on the procurement contract between Authier Lithium and North American Lithium (NAL). No provision was made for the effects of inflation as real prices and costs were used in the financial projections. Current Canadian tax regulations were applied to assess the corporate tax liabilities, while the most recent provincial regulations were applied to assess the Québec mining tax liabilities. Cash inflows consist of annual revenue projections. Cash outflows consist of capital expenditures including sustaining capital costs, operating costs, and taxes. These are subtracted from the inflows to arrive at the annual cash flow projections. To reflect the time value of money, annual net cash flow projections are discounted back to the Project valuation date using a discount rate. For this evaluation, a base case discount rate of 8% has been assumed. The discounted present values of the cash flows are summed to arrive at the Project’s net present value (NPV). The internal rate of return (IRR) on total investment was calculated based on 100% equity financing. The IRR is defined as the discount rate that results in a NPV equal to zero. The Project’s payback period has been calculated as the time required to achieve cumulative positive cash flow. Furthermore, an after-tax sensitivity analysis has been performed to assess the impact of variations in ore price, operating costs, project capital costs and sustaining capital costs on IRR and NPV at different discount rates (0%, 5%, 8%, 10%, 12%). The economic analysis presented in this section contains forward-looking information with regard to the Mineral Resource Estimates, commodity prices, exchange rates, proposed mine production plan, projected recovery rates, operating costs, construction costs and the Project schedule. The results of the economic analysis are subject to a number of known and unknown risks, uncertainties and other factors that may cause actual results to differ materially from those presented here. 19.7 SENSITIVITY ANALYSIS A financial sensitivity analysis was conducted on the base case after-tax cash flow NPV and IRR of the Project. The after-tax results for the Project IRR and NPV, based on the sensitivity analysis, are summarized in Table 19-5 through Table 19-8. The sensitivity of the after-tax NPV was evaluated for changes in key variables and parameters such as: • Capital costs; Authier Lithium DFS Technical Report Summary – Quebec, Canada 314 • Sustaining capital costs; • Operating costs; • Price of ore sold to NAL. After-tax NPV sensitivities are from -30% to +30% to show the impact of NPV outputs at 8% discount rate. To complement after-tax NPV sensitivities is the after-tax IRR graph, which shows the overall project impact at these various sensitivities. The after-tax sensitivity analyses show that changes in the price of ore sent to NAL and the Project operating costs create the largest NPV variations. Table 19-5 – Ore price sensitivities on after-tax NPV. Ore Price % Variation -30% -20% -10% 0% 10% 20% 30% Ore Price (CAD/t) $84 $96 $108 $120 $132 $144 $156 Discount rate 0% -$138 -$25 $65 $145 $221 $297 $372 Discount rate 5% -$144 -$71 -$11 $43 $91 $139 $186 Discount rate 8% -$140 -$82 -$33 $11 $49 $87 $125 Discount rate 10% -$136 -$86 -$43 -$4 $30 $63 $95 Discount rate 12% -$133 -$88 -$50 -$15 $15 $44 $73 IRR 0.0% 0.0% 4.0% 9.0% 15.0% 20.0% 25.0% Table 19-6 – Operating costs sensitivities on after-tax NPV. Operating Costs % Variation 30% 20% 10% 0% -10% -20% -30% Operating Costs (CAD M)) $806 $744 $682 $620 $558 $496 $434 Discount rate 0% $24 $67 $107 $145 $181 $216 $252 Discount rate 5% -$43 -$12 $16 $43 $67 $90 $113 Discount rate 8% -$60 -$35 -$11 $11 $30 $48 $67 Discount rate 10% -$66 -$44 -$23 -$4 $13 $29 $45 Discount rate 12% -$70 -$51 -$33 -$15 $0 $14 $28 IRR 1.0% 4.0% 7.0% 9.0% 12.0% 14.0% 17.0%

Authier Lithium DFS Technical Report Summary – Quebec, Canada 315 Table 19-7 – Capital costs sensitivities on after-tax NPV. Capital Costs % Variation 30% 20% 10% 0% -10% -20% -30% Capital Costs (CAD M)) $101 $94 $86 $78 $70 $62 $55 Discount rate 0% $130 $135 $140 $145 $150 $154 $159 Discount rate 5% $26 $32 $37 $43 $48 $53 $59 Discount rate 8% -$6 -$1 $5 $11 $16 $22 $27 Discount rate 10% -$21 -$16 -$10 -$4 $2 $7 $13 Discount rate 12% -$33 -$27 -$21 -$15 -$10 -$4 $2 IRR 7.0% 8.0% 9.0% 9.0% 10.0% 11.0% 12.0% Table 19-8 – Sustaining capital costs sensitivities on after-tax NPV. Sustaining Capital Costs % Variation 30% 20% 10% 0% -10% -20% -30% Sustaining Capital Costs (CAD M)) $97 $89 $82 $74 $67 $60 $52 Discount rate 0% $130 $135 $140 $145 $149 $154 $159 Discount rate 5% $29 $34 $38 $43 $47 $52 $56 Discount rate 8% -$2 $2 $6 $11 $15 $19 $23 Discount rate 10% -$17 -$12 -$8 -$4 $0 $4 $8 Discount rate 12% -$27 -$23 -$19 -$15 -$11 -$7 -$4 IRR 8.0% 8.0% 9.0% 9.0% 10.0% 11.0% 11.0% Authier Lithium DFS Technical Report Summary – Quebec, Canada 316 Figure 19-1 – After-Tax NPV at 8% discount rate for different sensitivity scenarios. -CA$ 150 -CA$ 100 -CA$ 50 CA$ 0 CA$ 50 CA$ 100 CA$ 150 -30% -20% -10% 0% 10% 20% 30% % Variation Ore Transfer Price Opex Project Capex Sustaining Capex

Authier Lithium DFS Technical Report Summary – Quebec, Canada 317 Figure 19-2 – After-Tax IRR for different sensitivity scenario. 0% 5% 10% 15% 20% 25% 30% -30% -20% -10% 0% 10% 20% 30% % Variation Ore Transfer Price Opex Project Capex Sustaining Capex Authier Lithium DFS Technical Report Summary – Quebec, Canada 318 19.8 ALTERNATIVE CASES / SENSITIVITY MODELS As described in the previous sections, several sensitivity analyses have been done on the Base Case scenario with variation of -30% to + 30% on the transfer price, the Opex, the Project Capex and the Sustaining one. For Authier, the transfer price variation has the most material impact on the profitability of the project. This price has been determined by Sayona based on the appropriate level to extract and transport ore to North-American Lithium and it represents a fair market value considering the existing conditions. In addition, in the past, the project has been evaluated on the basis of having its own process plant at site with the associated infrastructures and cost. The possibility of trucking ore to the NAL concentrator has numerous advantages and did improve the project profitability.

Authier Lithium DFS Technical Report Summary – Quebec, Canada 319 20 ADJACENT PROPERTIES The area surrounding the Property, which is located between Val-d’Or, Amos and Malartic, is well known for mineral exploration activity, especially for gold, copper, and zinc. The Authier Property is surrounded by several exploration properties owned by various companies. Figure 20-1 shows the location of metallic deposits and showings in the area. The light green dots are occurrences of lithium in the area (from the Québec MRNF Sigeom Interactive database, 2012). It should be noted that the following information is not necessarily indicative of the mineralization on the Property that is the subject of this Technical Report. The most relevant mineral property in proximity (27 km east) to the Project (Figure 20-1) is Sayona Québec’s North American Lithium (NAL) property. NAL hosts a lithium deposit occurring in a series of spodumene-bearing pegmatite dykes. In recent history, NAL operated between 2013-2014 and 2017- 2019. The project was put into care and maintenance in 2019 due to poor spodumene market conditions. Sayona Québec acquired NAL on August 30, 2021. Sayona Québec restarted mining operations at NAL in late 2022 and commenced concentrator operations in February 2023. Authier Lithium DFS Technical Report Summary – Quebec, Canada 320 Figure 20-1 – Local metallic deposits and showings. Figure 20-2 shows a map of adjacent claims to the Authier Project. As of April 6, 2023, owners of adjacent properties included 2814250 Ontario Inc., First Energy Metals Limited, Olivier Lemieux, Eagle Ridge Mining Ltd., 9219-8845 Québec Inc., Lisa Daigle, and Ressources Jourdan Inc.

Authier Lithium DFS Technical Report Summary – Quebec, Canada 321 Figure 20-2 – Adjacent properties map. Authier Lithium DFS Technical Report Summary – Quebec, Canada 322 21 OTHER RELEVANT DATA AND INFORMATION Sayona was in the process of developing the Authier Property as a mine and concentrator facility until the acquisition of the former North American Lithium (NAL) Project. Since then, Sayona has reoriented the Authier Project to a spodumene ore producer selling its ore to NAL. This chapter describes how the Authier Project will be implemented. 21.1 PROJECT EXECUTION PLAN This execution plan is conceptual in nature and will be adjusted and refined during the next phases of the Project. Upon completion of this FS, Sayona plans to award the detailed engineering mandate with a targeted completion date of December 2024 to be executed in parallel with the certificate of authorization approval process. Construction is expected to begin soon after reception of the certificate of authorization with a target readiness for mining operations to start in March 2025. The critical path to ore production goes through obtaining the certificate of authorization, mobilizing the mining contractor, and building the main access roads and the stockpile pads. In parallel with this work, the permanent facilities will continue to be built during the mining operation with the construction of the ancillary facilities. The following will be completed in 2024. • Administration building; • Mine security and access point; • Fuel, lube, and oil storage facility. The permanent water treatment plant (WTP) will be completed in 2025 due to a long delivery lead time, specifically for the thickener, of 12 months. Until the permanent WTP is operating, temporary treatment solutions will be implemented. 21.2 PROJECT ORGANIZATION 21.2.1 Engineering and Procurement All Project phases including detailed engineering, procurement, preproduction, and construction activities will be under the direction of the Sayona project manager.

Authier Lithium DFS Technical Report Summary – Quebec, Canada 323 Permitting will be supported by Sayona’s environmental team. Sayona has hired complementary expertise in project and construction management to increase its project delivery ability. The result is a team of experienced individuals with knowledge of the Abitibi local construction conditions and contractors. They have managed projects in similar environments for the engineering and planning stages through construction to commissioning and transfer to operations. During the completion of the FS phase, the request for proposal for engineering services has already been sent out. The engineering firms will be responsible for the following procurement functions: • Technical specification and scope of work documents; • Technical and economical evaluations; • Short list meetings; • Purchase order requisition preparation; • Drawing management and approval; • Reception and coordination of vendor maintenance and operational documents. The Sayona team is responsible for the following procurement functions: • Bid request; • Addenda; • Reception of bids; • Final negotiation; • Contract award; • Purchase order release; • Progressive payment; • Shop visits; • Site logistics. Authier Lithium DFS Technical Report Summary – Quebec, Canada 324 21.2.2 Construction Management Sayona will provide Project construction management services under the direction of the Construction Manager. The Construction Management Team (CMT) will include the following services: • Site supervision; • Reporting; • Project cost control; • Health and safety; • Scheduling; • Site procurement and logistics. It is recognized that an effective health and safety program during the Project is a necessity. The success of the construction safety program is contingent upon its enforcement at all stages of the Project including design, construction planning, construction execution, and start-up and commissioning. The CMT will also follow the Sayona procedures and work methods to ensure the protection of the environment. Furthermore, the CMT will work closely with each department of the operations group to ensure proper installation and functional results. 21.3 RISK AND OPPORTUNITY ASSESSMENT There are a number of risks and uncertainties identifiable to any new project that usually cover the mineralization, process, financial, environment and permitting aspects. This project faces the same challenges, and an evaluation of the possible risks was undertaken; the highlights of which are summarized in this section. The resulting register identifies risks, impact categories, the severity and probability ratings as well as potential risk mitigation measures. Risks in the register have been grouped into the following categories: • Financial; • Organizational; • Geology – Resources & Reserves; • Mining; • Design/Engineering; • Procurement; • Construction; • Infrastructure; • Environmental & Permitting; • Legal;

Authier Lithium DFS Technical Report Summary – Quebec, Canada 325 • Community; • Technological; • Operations; • Sales; • Fabrication; • Logistics. The severity/impact and likelihood ratings were identified as shown in Table 21-1. Table 21-1 – Risks. Rating Likelihood (Risk probability) Impact 1 Rare: <1% 1 (Minor) 2 Unlikely 1-10% 2 (Moderate) 3 Possible 10-20% 3 (Serious) 4 Likely 20-50% 4 (Major) 5 Almost Certain: >50% 5 (Critical) A high-level project risk assessment has been completed. The risk assessment identifies risks, impact category and a mitigation plan. The likelihood, impact, controls, and measures were developed for the identified risks. The assessment is necessarily subjective and qualitative. Table 21-2 and Table 21-3 show the top risks of the Project; the whole register can be found in Table 21-4. The risk and opportunities registers should be reviewed and updated at each stage of the Project to reduce uncertainties and de-risk the Project. Authier Lithium DFS Technical Report Summary – Quebec, Canada 326 Table 21-2 – Main project risks. Risks Details Category Description Rating category Mitigation Measures Logistics Worldwide crisis on freight forwarding Schedule Dedicate resources for expediting & logistics Health & Safety Mining traffic uses segments of roads common to ore transport and employee traffic. Berm separates the mining traffic from the others Safety Road to be widened and berm separating mining and other traffic. Add secondary access road to remove crossings Operation Start-up during wintertime Operation Implement temporary WTP during initial mining development Operation NAL will process with new ore from Authier after about six months of operation Production Support from external engineering staff during NAL transition to the blended ore processing Engineering Consultant engineers are very busy Schedule Frequent follow-up Construction Local contractors are very busy Schedule Reach out to province-wide contractors Environment Delays in obtaining mining and construction permits Schedule Frequent follow-up and pro-active approach of permitting authorities Table 21-3 – Main project opportunities. Opportunity Details Category Item Financial Assess the impacts of various financing scenarios Organization Begin planning to build a strong Owner’s team for the detailed engineering phase Resource Potentially increase the size of the Mineral Resource by testing extensions of known mineralization along strike at both of the Authier pegmatites, as well as by conversion of Inferred Mineral Resources to Reserves Geology Infill definition drilling within the main resource zone where the mineralization is not well defined and is currently treated as waste Geology Increase the size of the Mineral Resource at depth by testing the deep extensions of the known mineralization, especially those located on the west portion of the deposit Mining Assess the impact of high grading during the first three years of operation Mining Assess the option of varying the number of cutbacks Mining Perform a cost trade-off to assess the used and/or larger mining equipment Environment Optimize water management and design/construct basins and treatment facilities Construction Continue focusing on delivery of turn-key packages from local contractors Construction Optimize excavation/backfill by using existing Construction Develop strategies to maximize use of waste rock as construction materials Community Continue to increase visibility of Sayona in the local community Transport Explore various transportation options

Authier Lithium DFS Technical Report Summary – Quebec, Canada 327 Table 21-4 – Project risk register. Risk Details Mitigation Category Item Likelihood Impact Principal Impact Category Risk Score Actions Status Likelihood Impact Principal Impact Category Risk Score Logistics Worldwide crisis on freight forwarding. 5 5 Project delay/ cost 25 Shipments from China need to be identified and should be rigorously followed. Different suppliers should be approached if this is the case and dedicate a resource for expediting and logistics. Open 3 5 Project delay and cost 15 Health & Safety Mining traffic uses segments of roads common to ore transport and employee traffic. Berm separates the mining traffic from the others. 4 5 Safety 20 Road to be widened and berm separating mining and other traffic. Add secondary access road to remove crossings. Open 2 5 Safety 10 Operation Start Up during wintertime. 5 4 Operation 20 Implement temporary WTP during initial mine development. Open 4 3 Operation 12 Processing Process at NAL with new ore from Authier after about 6 months. 5 4 Processing 20 Support from external engineering staff during NAL transition to the blended ore processing (NAL+Authier). Open 4 3 Processing 12 Employment Consultants’ engineers and mining contractors are very busy. 4 4 Schedule 16 Frequent follow up. Open 2 2 Schedule 4 Construction Availability of local resources in Val 'D’Or for the construction activities. 5 3 Project Delay 15 Reach out to a variety of contractors (province-wide) and express Sayona’s interest in working with them. Open 3 3 Project Delay 9 Environmental Delays in obtaining mining & construction permits. 5 3 Project Delay 15 Open 3 3 Project Delay 9 Financial Any suspension of NAL operations will remove sole buyer of Authier Ore. 3 5 Financial 15 Open 3 5 15 Organization Hiring key employees 5 3 Management 15 Hiring external support. open 3 3 Management 9 Community Social acceptability of mining project and ore transport from Authier to NAL 3 4 Social 12 Regular communication with the communities and local surveillance committee. Open 2 2 Social 4 Public hearings (impact assessment). Company's social and financial commitment to community projects. Authier Lithium DFS Technical Report Summary – Quebec, Canada 328 Risk Details Mitigation Category Item Likelihood Impact Principal Impact Category Risk Score Actions Status Likelihood Impact Principal Impact Category Risk Score Environmental Dust generation above limits 4 3 Environment 12 Reduce speed limit to 25-30 km/h+H21 in dry condition. Open 2 2 Environment 4 (Wind erosion of TSF and roads. Dust from mining operations and processing) Water spraying on hauling roads during dry condition. Water spraying during blasting, ore and rock loading and crushing. Keep tailings and waste moisture or flooded. Progressive TSF revegetation. Financial Contract Mining OPEX higher than expected 3 4 Financial 12 Select contract mining expert to counsel during proposal request and contractual documents Open 2 2 Financial 4 Incorporate lessons learned from NAL mining procurement process. General Limitations for electronic material supplies (the difficulty of receiving components from Asia in this time of COVID and port delays) 3 4 Schedule 12 Manufacturing control at the supplier's site. Constant follow-up from suppliers. Open 2 2 Schedule 4 Logistics Roadblocks for construction or maintenance between NAL and Authier forcing rerouting 3 4 Financial 12 Prepare permit requests for alternate routings Open 3 3 9 Logistics Maintenance cost of Preissac Road to be assumed by Sayona, current assumption is road maintenance by municipality. 4 3 Financial 12 Open discussions with municipality Open 3 3 9 Procurement Equipment availability delays due to Covid impact of fabrication resource availability (Mining, lifting, treatment …) 4 3 Schedule 12 This factor has and will affect fabrication of equipment. The mitigation plan can be not to use sole source, not to have common spare parts and to accept to pay a premium to receive the equipment on site earlier. Open 2 3 Cost/ Operation 6

Authier Lithium DFS Technical Report Summary – Quebec, Canada 329 Risk Details Mitigation Category Item Likelihood Impact Principal Impact Category Risk Score Actions Status Likelihood Impact Principal Impact Category Risk Score General Covid delays and costs 5 2 Project Delay/ Cost 10 Anticipate delays and additional costs since the impacts are not fully known. The market still volatile. Open 4 2 Project Delay/ Cost 8 Community Issues related to Indigenous relations. 2 4 Social 8 Continuous discussions, meeting with communities and signing of agreement. Open 2 3 Social 6 Geology Reserves lower than expected. 2 4 Financial 8 Ongoing R&R update Open 2 3 Financial 6 Community Social acceptability aggregate transport during construction. 3 2 Social 6 Regular communication with the communities and local surveillance committee. Open 2 1 Social 2 Public hearings (impact assessment). Company's social and financial commitment to community projects. Environmental Spring freshet requires temporary water storage in the pit and may affect productivity. 2 3 Environment 6 Open 2 3 Environment 6 Environmental Costs increase in waste rock storage facility closure plan and other assets retirement obligations. Final guarantee. Lack of a recent mine closure plan update. 2 3 financial 6 Closure plan currently under development Open 1 2 financial 2 Financial CAPEX higher than expected. 3 2 Financial 6 CAPEX update Open 2 2 Financial 4 Environmental Existing geochemical characterization has been carried out for waste rock samples. Based on results, geomembrane has been required. MELCC could require more comprehensive geochemical characterization targeting waste rock. Recent results expected based on existing SPLP results from 2017-2018. Causing a significant capital cost increase. 1 5 CAPEX 5 - Future demonstration that waste rock stockpile water contamination is within acceptable levels would allow for reduction / elimination of future bentonite membrane installation. Open 2 5 CAPEX 10 Authier Lithium DFS Technical Report Summary – Quebec, Canada 330 Risk Details Mitigation Category Item Likelihood Impact Principal Impact Category Risk Score Actions Status Likelihood Impact Principal Impact Category Risk Score Environmental Other contaminants in the mine water over discharge limit due to explosives (ammonium nitrate) Potential surface water contamination. 2 2 Environment 4 Appropriate explosive management and best practice in blasting and appropriate water treatment. Monitoring program of the final effluent. Everything in place and function. Closed 0 0 Environment 0 Non-compliance of water quality at the final effluent. Loss of control of the water treatment. Environmental Failure in environmental impact assessment, surveillance and management. 2 2 Operation 4 Internal auditing. Open 1 2 Operation 2 Periodic performance review. Infrastructure Overflow of untreated water due to water treatment plant shutdown. 2 2 Environment 4 Preventative maintenance program and available spare parts, training. Open 1 2 Environment 2 Design/ Engineering Availability of qualified technical personnel dedicated to the project. 3 1 Design 3 Engineering firm needs to be secured early Open 2 2 Design 4 Environmental Seismic activities above limit disturb community. 1 2 Social 2 Review and improvement of blasting method and design. Open 1 2 Social 2 Environmental Spill or unauthorized discharge of contaminants, chemical or petroleum products. 2 1 Environment 2 Employee’s awareness and SOPs review. Open 2 1 Environment 2 Implementation of SOPs. Internal auditing. Periodic performance review. Daily inspection of operations and infrastructures (Refer to OMS manual). Employee tasks observation/assessment. Preventive maintenance of equipment. Spill kits available in all equipment and in strategic locations on site.

Authier Lithium DFS Technical Report Summary – Quebec, Canada 331 Risk Details Mitigation Category Item Likelihood Impact Principal Impact Category Risk Score Actions Status Likelihood Impact Principal Impact Category Risk Score Procurement Adequate supply and storage of reagents for water treatment of the final effluent (May result in non- compliance of discharged water quality and in the stopping of dewatering of mine pit and of process water pumping). 1 2 Environment 2 Timely discussions with distributors / manufacturers and testing reagents from various sources. Open 1 2 - 2 Authier Lithium DFS Technical Report Summary – Quebec, Canada 332 22 INTERPRETATION AND CONCLUSIONS 22.1 PROJECT SUMMARY The original UDFS Report was prepared and compiled by BBA under the supervision of the authors at the request of Sayona. The actual S-K §229.1304 compliant Technical Report Summary provides a summary of the results and findings from each major area of investigation to a level that is equivalent and normally expected for a Feasibility Study of a resource development project. 22.2 KEY OUTCOMES The authors noted the following interpretations and conclusions in their respective areas of expertise, based on the review of data available for this Report. 22.3 GEOLOGY AND RESOURCES Highlights of the Authier Lithium deposit Mineral Resource Estimate (MRE) Update are as follows: • The MRE inclusive of Mineral Reserves was reported at a cut-off of 0.55% Li2O and totals 6.04 Mt, with an average grade of 0.99% Li2O in the Measured category, 8.10 Mt, with an average grade of 1.03% Li2O in the Indicated category, for a combined total of 14.1 Mt at an average of 1.01% Li2O in the Measured and Indicated categories. An additional 3.00 Mt, with an average grade of 1.00% Li2O in the Inferred category is also present at Authier Lithium; • The effective date of the MRE is October 6, 2021. • The MRE exclusive of Mineral Reserves was reported at a cut-off of 0.55% Li2O and totals 229 Kt, with an average grade of 0.80% Li2O in the Measured category, 3.18 Mt, with an average grade of 0.98% Li2O in the Indicated category, for a combined total of 3.4 Mt at an average of 0.96% Li2O in the Measured and Indicated categories. An additional 6.34 Mt, with an average grade of 0.98% Li2O in the Inferred category is also present at Authier Lithium; • The effective date of the MRE is October 6, 2021.

Authier Lithium DFS Technical Report Summary – Quebec, Canada 333 22.4 MINING AND RESERVES Key mining outcomes include: • Conversion of a portion of the Mineral Resources into Proven and Probable Mineral Reserves of 11.2 Mt at an average grade of 0.96% Li2O. Of this total, 6.2 Mt are Proven Reserves at 0.93% Li2O and 5.1 Mt are Probable Reserves at 1.00% Li2O; • Development of a mine plan that provides sufficient ore to support an annual feed rate of approximately 530,000 tonnes at the North American Lithium (NAL) crusher; • Updated detailed mine designs, including pit phasing; • Development of a dilution model to ensure that the ore sold to NAL and fed to the crusher respects final product specifications; • Development of a life of mine (LOM) plan that results in a positive cash flow for the Project, which permits conversion of resources to reserves. 22.5 INFRASTRUCTURE AND WATER MANAGEMENT Key Infrastructure outcomes include: • Site has been optimized through the reduction in the overall footprint; • The number of basins has been reduced from the original concepts; • New geochemical data has been considered and the use of membranes in ditches and below the waste rock facility are now required; • A progressive reclamation plan has been put in place as part of the overall facility sequencing. 22.6 MARKET STUDIES A supply agreement was signed between Authier and NAL for the purchase of 100% of the ore mined at $120 CAD/t delivered (Li2O content of 0.80% to 1.15%). Authier Lithium DFS Technical Report Summary – Quebec, Canada 334 22.7 ENVIRONMENTAL AND SOCIAL ISSUES As mentioned in February 2023, the government agreed to Sayona’s request to voluntarily submit the Authier project to the Bureau d’audiences publiques sur l’environnement (BAPE). In line with its commitment to transparency and collaboration, Sayona’s request will allow citizens to get involved in the project’s development. The BAPE’s mission is to inform government decision-making by issuing findings and opinions that account for the public’s concerns and are based on the principles of the Sustainable Development Act. 22.8 PROJECT COSTS AND FINANCIAL EVALUATION 22.8.1 Capital Costs • The Project no longer considers a concentrator on site. All ore material will be sold to NAL and treated at the NAL concentrator. • Given that all waste rock material must be considered as metal leaching, the waste rock storage facility and water collection infrastructure must be built with a geomembrane as a foundation. • The total initial capital expenditure for the Project is estimated at CAD$77.9M. This estimate qualifies as Class 3, as per AACE recommended practice R.P.47R-11. The accuracy of this estimate has been assessed at -20% to +20%. • The estimate includes all the direct and indirect project costs, complete with the associated contingency. The estimating methods include quotations from vendors and suppliers specifically sought for this Project, approximate quantities and unit rates sourced from quotations and historic projects and allowances based on past projects. A summary of the capital expenditure distribution and sustaining capital expenditures are shown in Table 22-1 and Table 22-2. Table 22-1 – Project initial capital cost detailed summary. Item Total (M CAD) Mining $5.80 Preproduction Mining $3.39 Owner Equipment and Mine Services $2.41 Infrastructure $69.62 Waste Stockpile and Water Management $44.85 Electrical Work $0.84 On-site Roads $2.53 Access Road $0.65 Owner's Costs $2.44

Authier Lithium DFS Technical Report Summary – Quebec, Canada 335 EPCM Services $7.33 Commissioning $0.28 Overhead $0.22 Other $1.37 Contingency $9.08 Wetland Compensation $1.50 Wetland Compensation $1.50 Royalty Buyback $1.00 CDC2116146 $1.00 Total $77.92 Table 22-2 – Project sustaining capital cost detailed summary. Year Total (M CAD) Mining $3.76 Infrastructure $70.64 Sustaining Capital Costs $74.40 22.8.2 Operating Costs The operating and other costs for the Project are CAD$949M or CAD$84.54/t ore for the LOM. The detailed operating costs are presented in Table 22-3. Table 22-3 – Summary LOM operating costs. Cost Area LOM Unit Unit (M CAD$) (CAD$/t Ore) (USD$/t Ore) Mining $540.56 $48.16 $36.12 Water treatment management $58.73 $5.23 $3.92 General and Administration $20.97 $1.87 $1.40 Total operating costs $620.27 $55.26 $41.44 Reclamation bond insurance payment $7.65 $0.68 $0.51 Ore Transport and Logistics Costs $223.36 $19.90 $14.92 Total operating and other costs $851.28 $75.84 $56.88 Royalty deductions $28.96 $2.58 $1.94 Authier Lithium DFS Technical Report Summary – Quebec, Canada 336 First Nation royalties $27.04 $2.41 $1.81 Reclamation and closure costs $41.71 $3.72 $2.79 Total Operating, Royalties, Reclamation and Closure Costs $948.99 $84.54 $63.41 22.8.3 Financial Analysis The UDFS NPV and IRR were calculated based on the sale of ore to the NAL operation. Table 22-4 provides a summary of the financial analysis, which demonstrates that the NAL Project is economically viable. Key outcomes of the UDFS include: • An estimated pre-tax NPV of CAD58.1M at an 8% discount rate and a pre-tax IRR of 14.6%. • An estimated after-tax NPV of CAD10.6M at an 8% discount rate and an after-tax IRR of 9.4%. The LOM has been extended to 22 years, based on estimated Proven and Probable Mineral Reserves of 11.2 Mt @ 0.96% Li2O. Table 22-4 – Financial analysis summary. Item Unit Value (CAD) Unit Value (USD) Production Mine Life year 22 year 22 Strip Ratio t:t 6.1 t:t 6.1 Total Ore Production Mt 11.2 Mt 11.2 Revenue Ore Selling Price CAD/t 120 USD/t 90 Exchange Rate CAD:CAD 1 USD:CAD 0.75 Project Costs Open Pit Mining CAD/t ore 48.16 USD/t ore 36.12 Water Treatment and Management CAD/t ore 5.23 USD/t ore 3.92 General and Administration (G&A) CAD/t ore 1.87 USD/t ore 1.4 Reclamation Bond Insurance Payment CAD/t ore 0.67 USD/t ore 0.5 Ore Transport and Logistic Costs CAD/t ore 19.9 USD/t ore 14.92 Project Economics Gross Revenue CAD M 1347 USD M 1010.3 Total Operating Cost Estimate CAD M 627.9 USD M 470.9 Transportation and Logistics Cost CAD M 223.4 USD M 167.5 Total Capital Cost Estimate CAD M 77.9 USD M 58.4 Total Sustaining Capital Cost Estimate CAD M 74.4 USD M 55.8 Reclamation and closure costs CAD M 41.7 USD M 31.3 Royalty Deduction CAD M 29 USD M 21.7 First Nation Royalties CAD M 27 USD M 20.3

Authier Lithium DFS Technical Report Summary – Quebec, Canada 337 Undiscounted Pre-tax Cash Flow CAD M 280.4 USD M 210.3 Discount Rate % 8% % 8% Pre-tax NPV @ 8% Internal Rate of Return (IRR) % 14.6% % 14.6% After-tax NPV @ 8% Internal Rate of Return (IRR) % 9.4% % 9.4% Authier Lithium DFS Technical Report Summary – Quebec, Canada 338 23 RECOMMENDATIONS 23.1 PROJECT SUMMARY The Updated Definitive Feasibility Study (UDFS) included the Mineral Resource estimate completed by SGS in 2022, a smaller overall footprint of the site, results from a number of technical optimization programs, results from the waste rock geochemical characterization, a new strategy to transport ore material to the NAL concentrator and realignment of revenue based on the sale of run-of-mine ore. The UDFS confirmed the technical and financial viability of constructing a simple open-cut mining operation, waste rock storage facility and water treatment plant at the Authier site. The positive study demonstrated the opportunity to create substantial long-term sustainable shareholder value at a low capital cost. Given the technical feasibility and positive economic results of the UDFS, it is recommended to continue the work necessary to support a decision to fund and develop the project. 23.2 GEOLOGY AND RESOURCES The Author considers that the Authier Lithium deposit contains a significant open-pit Mineral Resource that is associated with a well-defined mineralized trend and model. The current Mineral Resource Estimate (MRE) update has shown that the Deposit can likely be mined by conventional open-pit mining methods with a scenario of off-site custom milling ore rather than constructing and using an on-site mill. Drillhole results highlighted mineralization at depth and demonstrate that the Property has the potential for an underground resource. Further drilling is recommended to ascertain this potential. The Author considers the Property to have significant potential for delineation of additional Mineral Resources and that further exploration is warranted. Sayona’s intentions are to continue to drill the Deposit in 2023 and plan to direct their exploration efforts towards resource growth, with a focus on extending the limits of known mineralization along strike and at depth, as well as infill drill of the existing deposit to convert portions of Inferred Mineral Resources to Indicated or Measured Mineral Resources. Given the prospective nature of the Property, it is the Author's opinion that the Property merits further exploration and that a proposed plan for further work is justified. A proposed work program by SGS will help improve the Deposit development stage and will improve key inputs required to evaluate the economic viability of a mining project (open-pit and underground) at a feasibility study level.

Authier Lithium DFS Technical Report Summary – Quebec, Canada 339 SGS is recommending that Sayona conduct further exploration, subject to funding and any other matters which may cause the proposed exploration program to be altered in the normal course of its business activities or alterations which may affect the program as a result of exploration activities themselves. For 2023, a total of 30,000 m of drilling is proposed to continue to focus on updating, expanding, and extending Mineral Resources, upgrading existing Indicated and Inferred Resources as well as exploring the Deposit at depth. The total cost of the recommended work program is estimated at CAD$5,625,000 (Table 23-1). Table 23-1 – Recommended work program for the Authier Lithium Deposit. Item Cost in CAD$ Surface mapping, outcrop detailed description, channeling, and sampling $100,000 Soil sampling of prospective areas $50,000 Resource classification drilling; 10,000 m $1,500,000 Underground potential drilling; 20,000 m $3,000,000 Assays/Geochemistry $900,000 Updated Resource Estimate $75,000 Total $5,625,000 23.3 MINING AND RESERVES • Perform a surveying campaign to confirm bedrock surface, focusing on Phase 1 and Phase 2 of the pit, as well as the water basins locations; • Assess the impact of high grading during the first three years of operation; • Assess the option of varying the numbers of mining phases; • Perform pit optimization sensitivity on overall pit slopes, metallurgical recovery and dilution/ore loss; • Perform pit optimization using Inferred Mineral Resources to provide guidance for in-fill drilling; • Conduct an additional geotechnical assessment to confirm the recommended pit slopes prior to advancing to the next stage of the project; • Produce a 2-year detailed mine plan, including a pre-production plan; • Confirm haul road and pit ramp designs based on the mining contractor haulage equipment fleet. Authier Lithium DFS Technical Report Summary – Quebec, Canada 340 23.4 INFRASTRUCTURE During the UDFS, the following elements have been modified or relocated: • Wasterock piles were modified and relocated further from the Saint-Mathieu-Berry Esker; • The main access road was changed and enters the site from the northwest of the property in the municipality of Preissac. The company has committed not to displace any material from the adjacent esker for construction. A conceptual site layout plan was developed which includes water management and treatment facilities, traffic management, and infrastructure. All major buildings were located on existing out-crops easily visible from the LiDAR surveys. Preliminary geotechnical studies were undertaken in 2018 after completion of the Definitive Feasibility Study (DFS). Final plant lay-out and water management basin dimensions will be optimized during detailed engineering. The following recommendations are made related to project infrastructure: 1. Site layout: a. Further work is recommended to optimize the site layout and footprint; b. Review roads configurations to ensure efficient traffic flow and safety of personnel; c. All road and pad construction can be appropriately scheduled to maximize the use of mine waste rock from the pit. There is a possibility of using crushing equipment to produce aggregate for the civil construction to lower costs; d. Examine extending the industrial site by back-filling with waste rock; e. Examine a strategy for waste pile management and perimeter ditch construction to be performed by mining operations; f. Optimization of the use of waste rock for construction of internal roads and infrastructure areas. 2. Geotechnical: a. Additional geotechnical investigations are recommended to characterize and define the soils on the site. 3. Survey: a. Further ground-feature surveys are needed for the proposed infrastructure areas including off-site roads and proposed intersection locations. 4. Water management: a. Water management (e.g., location of ditches, catchment basin size and water treatment plant location and size) will be optimized during the detailed engineering phase. Basin size must be appropriately dimensioned to include fire water reserve. 5. General infrastructure:

Authier Lithium DFS Technical Report Summary – Quebec, Canada 341 a. All recommended service infrastructure work should be focused on developing turn-key packages from local contractors to reduce the overall cost. UDFS costs are based on preliminary proposals from local contractors. Further negotiations during the detailed engineering phase with local contractors will allow for cost optimization. 6. Off-site infrastructure: a. If sections of roads must be enlarged, or culverts should be replaced, it is recommended to discuss the financial aspects with the La Motte and La Corne municipalities. 23.5 MARKET STUDIES For Authier, the ore extracted is to be transported to the North-American Lithium concentrator for processing alongside North-American Lithium's ore to produce spodumene concentrate. There is no external market. For North-American Lithium, the ore processed is processed into lithium spodumene. The spodumene is then sold in part to Piedmont Lithium through the existing offtake agreement, and in part sold to market participants, for transformation in lithium carbonate or hydroxide. The spodumene can be sold directly to customers, or through an intermediary commodity trader. 23.6 ENVIRONMENTAL AND SOCIAL RECOMMENDATIONS • Inform and involve stakeholders as the project advances. • Continue evaluating the impacts of the project on the environment. • Design of mitigation measures, if required, to control dust, noise, etc. • Increase visibility of Sayona in the region with a local office in La Motte • Conduct BAPE audience. 23.7 PROJECT COSTS AND FINANCIAL EVALUATION • Assess impacts of different financing scenarios. • Begin tender and negotiation processes for mining contractor and ore transport contractor. Authier Lithium DFS Technical Report Summary – Quebec, Canada 342 23.8 WASTE DUMPS MANAGEMENT • Complete geochemical characterization for the waste rock is to be confirmed to determine whether they are acceptable as off-site civil construction materials. • Optimization of the water management plan and design/construction of the water basins and treatment plant. • Initiate and complete geochemical characterization of rock excavated from the proposed basins to confirm if this material can be reused for site construction purposes. 23.9 DECARBONIZATION Continue developing Sayona’s decarbonization plan: • Complete a detailed assessment of greenhouse gas (GHG) emissions for the Project. • Develop a holistic decarbonization strategy for Sayona, aligned with broader environmental, social and governance (ESG) goals. • Determine the feasibility and viability of the selected options and continue technological monitoring. 23.10 PROJECT EXECUTION A project execution strategy has been included in the UDFS with a clear separation between detailed engineering and an owner-driven Project Construction Management (PCM) team. The flexibility of a small owner-driven construction team fits well with the size and scope of the Project. Implementing this approach, typically, is more adaptable in a short timeline, such as this one, and simplifies the construction contract administration process.

Authier Lithium DFS Technical Report Summary – Quebec, Canada 343 24 REFERENCES 24.1 LIST OF REFERENCES BBA, 2023. Leblanc, I., Piciacchia, L., Jarry, M., Dupuis, P., Richard, P.-L., Quinn, J. NI 43-101 Technical Report for the Definitive Feasibility Study Report for the North American Lithium Project, La Corne, Québec, Canada. Prepared for Sayona Mining Limited. April 14, 2023. Boily, M., Pilote, P., Raillon, H., 1989. la Metallogenie des Metaux de Haute Technologie en Abitibi- Temiscamingue. MERN; MB 89-29, 118 pages, 1 Plan. Boily, M., 1995. Petrogenese du Batholite de Preissac-Lacorne: Implications pour la Metallogenie des Gisements de Metaux Rares. MRN; et 93-05, 79 pages. Canadian Dam Association, 2007, The Dam Safety Guidelines 2007 (2013 edition) Canadian Dam Association, 2013, Application of Dam Safety Guidelines to Mining Dams. Canadian Dam Association, 2014, Application of Dam Safety Guidelines to Mining Dams. Cernÿ, P., 1993. Rare element granitic pegmatites. Part I: Anatomy and internal evolution of pegmatite deposits. Ore Deposit Models, volume 2, Geoscience Canada Reprint Series 6, p. 29-47. Cernÿ, P., 1993: Rare element granitic pegmatites. Part II: Regional to global environments and petrogenegis. Ore Deposit Models, volume 2, Geoscience Canada Reprint Series 6, p. 49-62. Corfu, F.,1993, The evolution of the southern Abitibi greenstone belt in light of precise U-Pb geochronology, Economic Geology (1993) 88 (6): 1323–1340. Desrocher, JP., and Hubert, C., 1996, Structural evolution and early accretion of the Archean Malartic composite block, southern Abitibi greenstone belt, Quebec, Canada: Canadian Journal of Earth Sciences, v. 33, p. 1556-1569. Environment Canada, 2016, Guidelines for the Assessment of Alternatives for Mine Waste Disposal. Government of Canada website, Canadian Climate Normals, https://climate.weather.gc.ca/climate_normals/index_e.html, accessed Auhust 23, 2022. Hawley, M., Cunning, J., 2017, Guidelines for Mine Waste Dump and Stockpile Design, CRC Press/Balkema. Authier Lithium DFS Technical Report Summary – Quebec, Canada 344 https://francophonie.sqrc.gouv.qc.ca/VoirDocEntentes/AfficherDoc.asp?cleDoc=1171071051202441392 0119115718054076212106206139 http://www.empr.gov.bc.ca/Mining/Geoscience/MINFILE/ProductsDownloads/MINFILEDocumentation/ CodingManual/Appendices/Pages/VII.aspx Karpoff, B.S., 1994: Summary report on Lithium Lamotte Property for Raymor Resources Ltd, GM53176, 21 pages. Kramer, S.L., 1996, Geotechnical Earthquake Engineering, Prentice Hall Inc., Englewood Cliffs, NJ. Journeaux (2018). Open Pit Slope Design, Authier Lithium Project, Feasibility Study, Sayona Mining, Val D’or, Quebec, for Sayona Mining Limited, by Journeaux Assoc. Report No. L-14-2035-1 Rev. A, April 25, 2018, 55 pages. Lamont. 2017. Caractérisation géochimique des stériles, du minerai et des résidus. Projet Authier. 28 p. + appendices. LiDAR, 2016. File: 20161108_Courbes_Geoposition_La_Motte_NAD83_MTM10.dwg. MDAG. 2021. Authier Project – Maximum Full-Scale On-Sire Concentrations in Contact with Rock and Tailings. 22 p. + appendices. MFFP. 2019. Liste des espèces fauniques menacées ou vulnérables au Québec. Internet site. Ministère de l’Énergie et des Ressources Naturelles, Direction de la restauration des sites miniers, 2016, Guide de préparation du plan de réaménagement et de restauration des sites miniers au Québec. Ministère du Développement durable, de l’Environnement et des Parcs, 2012, Directive 019 sur l’industrie minière. Ministère des Ressources Naturelles, Direction de la restauration des sites miniers, 2014, Approbation de la mise à jour du plan de restauration du site minier Québec Lithium. Ministère des transports. (2004). Manuel de conception des ponceaux. Québec : Direction des structures Mulja, T., Williams-Jones, A.E., Wood, S.A. and Boily, M., 1995a: The rare-element-enriched monzogranite-pegmatite-quartz vein system in the Preissac-Lacorne batholith, Quebec. I. Geology and mineralogy, Canadian Mineralogist, v. 33, p. 793-815. Mulja, T., Williams-Jones, A.E., Wood, S.A. and Boily, M., 1995b: The rare-element-enriched monzogranite-pegmatite-quartz vein system in the Preissac-Lacorne batholith, Quebec. II. Geochemistry and Petrogenesis, Canadian Mineralogist, v. 33, p. 817-833.

Authier Lithium DFS Technical Report Summary – Quebec, Canada 345 Richelieu Hydrogéologie Inc., 2018. Projet de lithium Authier de Sayona Québec Étude hydrogéologique et évaluation des effets du projet sur l’environnement. 77p. + appendices. Sinclair, 1996. Sinclair, W.D. 1996: Granitic pegmatites; & Geology of Canadian Mineral Deposit Types, fed.) O.R. Eckstrand, W.D. Sinclair, and R.I. Thorpe; Geological Survey of Canada, Geology of Canada, no. 8, p. 503-512 (a& Geological Society of America, The Geology of North America, v. P- 1). Statistique Canada. (2021). Tableau 14-10-0202-01 - Emploi selon l'industrie, données annuelles, Code SCIAN 212. Repéré à https://doi.org/10.25318/1410020201-fra – Format de rechange - ZIP (Archive compressée) (statcan.gc.ca). United Nations (2020). United Nations Conference on Trade and Development. Commodities at a glance. Special issue on strategic battery raw materials: https://unctad.org/system/files/official- document/ditccom2019d5_en.pdf. URSTM. 2015. Essais cinétiques sur quatre lithologies du projet Québec Lithium. 54 p. Wood Mackenzie, 2022, Global lithium strategic planning outlook – Q1 2022. Authier Lithium DFS Technical Report Summary – Quebec, Canada 346 25 RELIANCE ON INFORMATION SUPPLIED BY REGISTRANT 25.1 INFORMATION SUPPLIED BY REGISTRANT The authors of the original Definitive Feasibility Study (DFS) upon which this Report is based, relied upon information provided by experts who were not authors of the Report. The authors of the various sections of the Report believe that it is reasonable to rely upon these experts, based on the assertion that the experts have the necessary education, professional designation, and related experience on matters relevant to the technical report. The authors have assumed, and relied on the fact, that all the information and existing technical documents listed in Chapter 27 (References) of this Report are accurate and complete in all material aspects. While the authors reviewed all the available information presented, we cannot guarantee its accuracy and completeness. The authors reserve the right, but will not be obligated, to revise the Report and conclusions, if additional information becomes known subsequent to the date of this Report. The statements and opinions expressed in this document are given in good faith and in the belief that such statements and opinions are neither false, nor misleading at the date of this Report. A draft copy of the Report has been reviewed for factual errors by Sayona. Any changes made because of these reviews did not involve any alteration to the conclusions made. 25.2 DETAILS OF RELIANCE The following is a list of the experts relied upon during the development of the UDFS in 2023: • BBA: BBA is an engineering consulting firm which among others offers a wide range of services to the mining industry. The provided inputs related to the infrastructure and the mining, environmental, financial analysis aspects. • Price Waterhouse Coopers: PwC provided support for the pre-tax cashflow and post-tax financial analysis as well as sensitivity analysis. • Richelieu Hydrogéologie Inc.: Richelieu Hydrogéologie was founded in 2005 to provide hydrogeological consulting services. The company specializes in numerical modeling of underground water flows around mines, quarries, and sand pits, e.g., evaluation of dewatering rates for open pits, optimization of dewatering well spacing, evaluation of the impact of groundwater pumping, as well as risk assessment associated with the transport of dissolved contaminants.

Authier Lithium DFS Technical Report Summary – Quebec, Canada 347 • Journeaux Assoc.: Journeaux Assoc. is an engineering consulting firm specialized in foundations, dams, bridges, maritime ports, excavations, hydrogeology, tunnels, underground transportation systems and permafrost. They offer engineering, consulting, and design services in these sectors. • Craler: This firm provided the ore transportation study. • Services Forestiers et Exploration GFE Inc.: GFE provided technical personnel to support the various drilling campaign and samples collection. • Services d’ingénierie Norinfra Inc.: Norinfra did work on the environmental evaluation EES1 and soil characterization. Norinfra are well known in Abitibi and provide engineering services to numerous mining companies. • Intervia: This firm produced the traffic study. • Groupe-conseil Nutshimit-Nippour: This First Nation consulting company, a member of Groupe Desfor, contributed to environment expertise and to the landscaping architecture and related matters. Their expertise of the local Algonquin community and other First Nations particularities brings a unique and complementary expertise to this study. • MDAG and Lamont Inc.: These firms are specialized in geochemistry. They have been involved in geochemical characterization and prediction of mine water quality and waste rock dump water quality. • CTRI: This research institute carried out geochemical characterization studies. • COREM: This research center carried out mineralogical characterization of waste samples for management optimization. • Consultants GCM, Del Degan, Massé et Associés Inc., SNC Lavalin, and Patricia Desgagné, anthropologist and Englobe Corporation, also participated in the drafting of the Environmental Impact Assessment.
EX-97.1
26
ex971-clawback.htm
EX-97.1
ex971-clawback

PIEDMONT LITHIUM INC piedmontlithium.com Australia Address Level 9, 28 The Esplanade Perth WA 6000 +61 8 9322 6322 ARBN 647 286 360 info@piedmontlithium.com www.piedmontlithium.com Head Office – United States 42 E Catawba Street Belmont, NC 28012 704 461 8000 PIEDMONT LITHIUM INC. COMPENSATION RECOUPMENT (CLAWBACK) POLICY Recoupment of Incentive-Based Compensation It is the policy of Piedmont Lithium Inc., a Delaware corporation (the “Company”), that, in the event the Company is required to prepare an accounting restatement of the Company’s financial statements due to material non- compliance with any financial reporting requirement under the federal securities laws (including any such correction that is material to the previously issued financial statements, or that would result in a material misstatement if the error were corrected in the current period or left uncorrected in the current period), the Company will recover on a reasonably prompt basis the amount of any Incentive-Based Compensation Received by a Covered Executive during the Recovery Period that exceeds the amount that otherwise would have been Received had it been determined based on the restated financial statements. Policy Administration and Definitions This Policy is administered by the Leadership and Compensation Committee (the “Committee”) of the Company’s Board of Directors, subject to ratification by the Board of Directors, and is intended to comply with, and as applicable to be administered and interpreted consistent with, and subject to the exceptions set forth in, Listing Standard 5608 adopted by The Nasdaq Stock Market to implement Rule 10D-1 under the Securities Exchange Act of 1934, as amended (collectively, “Rule 10D-1”). For purposes of this Policy: “Incentive-Based Compensation” means any compensation granted, earned, or vested based in whole or in part on the Company’s attainment of a financial reporting measure that was Received by a person (i) on or after October 2, 2023 and after the person began service as a Covered Executive, and (ii) who served as a Covered Executive at any time during the performance period for the Incentive-Based Compensation. A financial reporting measure is (i) any measure that is determined and presented in accordance with the accounting principles used in preparing the Company’s financial statements and any measure derived wholly or in part from such a measure, and (ii) any measure based in whole or in part on the Company’s stock price or total shareholder return. Incentive-Based Compensation is deemed to be “Received” in the fiscal period during which the relevant financial reporting measure is attained, regardless of when the compensation is actually paid or awarded. “Covered Executive” means any “officer” of the Company as defined under Rule 16a-1(f) under the Securities Exchange Act of 1934, as amended. “Recovery Period” means the three completed fiscal years immediately preceding the date that the Company is required to prepare the accounting restatement described in this Policy, all as determined Exhibit 97.1

2 pursuant to Rule 10D-1, and any transition period of less than nine months that is within or immediately following such three fiscal years. If the Committee determines the amount of Incentive-Based Compensation Received by a Covered Executive during a Recovery Period exceeds the amount that would have been Received if determined or calculated based on the Company’s restated financial results, such excess amount of Incentive-Based Compensation shall be subject to recoupment by the Company pursuant to this Policy. For Incentive-Based Compensation based on stock price or total shareholder return, where the amount of erroneously awarded compensation is not subject to mathematical recalculation directly from the information in an accounting restatement, the Committee will determine the amount based on a reasonable estimate of the effect of the accounting restatement on the relevant stock price or total shareholder return. In all cases, the calculation of the excess amount of Incentive- Based Compensation to be recovered will be determined without regard to any taxes paid with respect to such compensation. The Company will maintain and will provide to The Nasdaq Stock Market documentation of all determinations and actions taken in complying with this Policy. Any determinations made by the Committee under this Policy shall be final and binding on all affected individuals. The Company may effect any recovery pursuant to this Policy by requiring payment of such amount(s) to the Company, by set-off, by reducing future compensation, or by such other means or combination of means as the Committee determines to be appropriate. The Company need not recover the excess amount of Incentive-Based Compensation if and to the extent that the Committee determines that such recovery is impracticable, subject to and in accordance with any applicable exceptions under The Nasdaq Stock Market listing rules, and not required under Rule 10D-1, including if the Committee determines that the direct expense paid to a third party to assist in enforcing this Policy would exceed the amount to be recovered after making a reasonable attempt to recover such amounts. The Company is authorized to take appropriate steps to implement this Policy with respect to Incentive-Based Compensation arrangements with Covered Executives. Any right of recoupment or recovery pursuant to this Policy is in addition to, and not in lieu of, any other remedies or rights of recoupment that may be available to the Company pursuant to the terms of any other policy, any employment agreement or plan or award terms, and any other legal remedies available to the Company; provided that the Company shall not recoup amounts pursuant to such other policy, terms or remedies to the extent it is recovered pursuant to this Policy. The Company shall not indemnify any Covered Executive against the loss of any Incentive-Based Compensation pursuant to this Policy. Effective: August 2, 2023
EX-99.3
27
ex993unauditedatlantic63.htm
EX-99.3
ex993unauditedatlantic63

46Atlantic Lithium Limited Annual Report 2023 FINANCIAL STATEMENTS CONSOLIDATED STATEMENT OF PROFIT OR LOSS AND OTHER COMPREHENSIVE INCOME 47 CONSOLIDATED STATEMENT OF FINANCIAL POSITION 48 CONSOLIDATED STATEMENT OF CHANGES IN EQUITY 49 CONSOLIDATED STATEMENT OF CASH FLOWS 50 NOTES TO THE CONSOLIDATED FINANCIAL STATEMENTS 51 Exhibit 99.3 47 Atlantic Lithium Limited Annual Report 2023 Notes 2023 $ 2022 $ Expenses Administration and consulting expenses (1,649,869) (1,081,132) Broker and investor relations (422,264) (393,782) Depreciation 3.3 (26,201) (16,827) Employee benefits expenses 5.1 (4,258,212) (2,124,940) Exploration costs written off 3.4 (39,533) (25,934) Interest expense (2) (1,644) Legal expenses (437,208) (1,039,711) Marketing and conferences (825,440) (564,473) Regulatory and compliance (291,345) (285,992) Share based payments 5.1 (3,544,028) (12,020,442) Unrealised foreign exchange gains (losses) (30,172) (927,941) Write down on demerger 6.3 - (16,228,010) Loss before income tax (11,524,274) (34,710,828) Income tax (expense) / benefit 2.3 (663,343) 63,282 Loss for the year (12,187,617) (34,647,546) Other comprehensive income Items that may be reclassified to profit or loss Exchange differences on translation of foreign operations 1,132,716 (5,774,884) Items that will not be reclassified to profit or loss Change in fair value of financial assets (467,512) 298,520 Income tax relating to change in fair value of financial assets 2.3 140,249 (90,750) Total comprehensive loss for the year attributable to the owners of Atlantic Lithium Limited (11,382,164) (40,214,660) Cents / share Cents / share Loss per share Basic loss per share 2.1 (2.0) (6.1) Diluted loss per share 2.1 (2.0) (6.1) The above consolidated statement of profit or loss and other comprehensive income should be read in conjunction with the accompanying notes. CONSOLIDATED STATEMENT OF PROFIT OR LOSS AND OTHER COMPREHENSIVE INCOME For the year ended 30 June 2023

48Atlantic Lithium Limited Annual Report 2023 Notes 2023 $ 2022 $ Current assets Cash and cash equivalents 15,345,917 23,881,650 Other receivables 3.1 1,600,965 2,298,241 Other current assets 492,402 453,250 Total current assets 17,439,284 26,633,141 Non-current assets Other financial assets 3.2 763,508 1,232,520 Property, plant and equipment 3.3 534,036 209,137 Exploration and evaluation assets 3.4 18,034,331 11,050,354 Total non-current assets 19,331,875 12,492,011 Total assets 36,771,159 39,125,152 Current liabilities Trade and other payables 3.5 6,180,951 4,094,103 Provision for annual leave 3.6 310,985 209,375 Total current liabilities 6,491,936 4,303,478 Non-current liabilities Provision for long service leave 3.6 61,855 43,342 Total non-current liabilities 61,855 43,342 Total liabilities 6,553,791 4,346,820 Net assets 30,217,368 34,778,332 Equity Issued capital 4.1 129,873,021 126,468,060 Reserves (5,385,830) (9,607,522) Accumulated losses (94,269,823) (82,082,206) Total equity attributable to owners of Atlantic Lithium Limited 30,217,368 34,778,332 The above consolidated statement of financial position should be read in conjunction with the accompanying notes. CONSOLIDATED STATEMENT OF FINANCIAL POSITION As at 30 June 2023 49 Atlantic Lithium Limited Annual Report 2023 Issued Capital $ Accumulated Losses $ Share based payments reserve $ Foreign currency translation reserve $ Financial assets revaluation reserve $ Demerger Reserve $ Total Equity $ Balance at 1 July 2022 126,468,060 (82,082,206) 25,745,706 (7,068,660) 509,585 (28,794,153) 34,778,332 Loss for the year - (12,187,617) - - - - (12,187,617) Other comprehensive loss - - 1,132,716 (327,263) - 805,453 Total comprehensive loss for the year - (12,187,617) - 1,132,716 (327,263) - (11,382,164) Transactions with owners as owners Shares issued during the year 4,625,514 - - - - - 4,625,514 Share issue costs (1,220,553) - - - - - (1,220,553) Reduction in demerger reserve (refer Note 6.3) - - - - - (127,789) (127,789) Share based payments - - 3,544,028 - - - 3,544,028 Balance at 30 June 2023 129,873,021 (94,269,823) 29,289,734 (5,935,944) 182,322 (28,921,942) 30,217,368 Balance at 1 July 2021 102,939,352 (47,434,660) 13,725,264 (1,293,776) 301,815 - 68,237,995 Loss for the year - (34,647,546) - - - (34,647,546) Other comprehensive loss - - - (5,774,884) 207,770 - (5,567,114) Total comprehensive loss for the year - (34,647,546) - (5,774,884) 207,770 - (40,214,660) Transactions with owners as owners Shares issued during the year 23,592,802 - - - - - 23,592,802 Share issue costs (64,094) - - - - - (64,094) Capital reduction and in-specie distribution (refer Note 6.3) - - - - (28,794,153) (28,794,153) Share based payments - - 12,020,442 - - - 12,020,442 Balance at 30 June 2022 126,468,060 (82,082,206) 25,745,706 (7,068,660) 509,585 (28,794,153) 34,778,332 The above consolidated statement of changes in equity should be read in conjunction with the accompanying notes. CONSOLIDATED STATEMENT OF CHANGES IN EQUITY For the year ended 30 June 2023

50Atlantic Lithium Limited Annual Report 2023 Notes 2023 $ 2022 $ Cash flows from operating activities Payments to suppliers and employees (including GST) (6,964,927) (5,380,854) Interest paid (2) (2,141) Net cash flows from operating activities 4.3 (6,964,929) (5,382,995) Cash flows from investing activities Refunds from security deposits - 2,500 Cash divested on demerger of subsidary 6.3 - (7,238,862) Purchase of property, plant and equipment (380,395) (97,619) Piedmont contributions from farm-in arrangement 15,630,319 15,451,041 Payments for exploration and evaluation assets (19,720,013) (20,772,143) Net cash flows from investing activities (4,470,089) (12,655,083) Cash flows from financing activities Proceeds from the issue of shares 4,625,514 23,592,802 Transactions costs on the issue of shares (1,743,648) (100,288) Net cash flows from financing activities 2,881,866 23,492,514 Net (decrease) / increase in cash and cash equivalents (8,553,152) 5,454,436 Cash and cash equivalents at the beginning of the year 23,881,650 19,135,463 Net foreign exchange impact 17,419 (708,249) Cash and cash equivalents at the end of the year 15,345,917 23,881,650 The above consolidated statement of cash flows should be read in conjunction with the accompanying notes. CONSOLIDATED STATEMENT OF CASH FLOWS For the year ended 30 June 2023 51 Atlantic Lithium Limited Annual Report 2023 1. ABOUT THIS REPORT Overview Atlantic Lithium Limited (the Company) is a for-profit company incorporated and domiciled in Australia. These financial statements represent the consolidated financial statements of the Company and its subsidiaries (together referred to as the Group) for the year ended 30 June 2023. The financial report was authorised for issue by the Board of Directors on 28 September 2023. Statement of Compliance The financial report is a general purpose financial report which has been prepared in accordance with Australian Accounting Standards, including Australian Accounting interpretations, other authoritative pronouncements of the Australian Accounting Standards Board (AASB) and the Corporations Act 2001. The financial report also complies with International Financial Reporting Standards (IFRS) as issued by the International Accounting Standards Board. 1.1 Basis of Preparation The financial report has been prepared on the basis of historical cost, except for certain financial instruments which are measured at fair value as at the reporting date. Cost is based on the fair values of the consideration given in exchange for assets. All amounts are presented in Australian dollars unless otherwise noted. Certain comparatives have been restated to ensure consistency with current year presentation. 1.2 Going Concern The financial statements have been prepared on a going concern basis which contemplates the continuity of normal business activities and the realisation of assets and discharge of liabilities in the ordinary course of business. The Group has not generated revenues from operations. For the year ended 30 June 2023, the group generated a loss of $12,187,617 and incurred operating cash outflows of $6,964,929. As at 30 June 2023, the Group had cash and cash equivalents of $15,345,917 and net assets of $30,217,368. The Directors note the following with regards to the ability of the Group to continue as a going concern: • Atlantic Lithium has been funded under a co-development agreement whereby Piedmont Lithium Inc solely funds US$17.0m towards studies and exploration (fully utilised as at the date of this report) and US$70.0m towards mine capex for the Ewoyaa Lithium Project (the “Project”). Any additional expenditure for the development of the Project will be shared equally between the Company and Piedmont. • Atlantic Lithium has agreed non-binding Heads of Terms with the Minerals Income Investment Fund of Ghana (“MIIF”) to invest a total of US$32.9 million in the Company and the Ghana subsidiaries. The proposed investment will support the development of the Project and the broader Cape Coast Lithium Portfolio in Ghana. Under the terms of the non-binding agreement, MIIF intend to invest an initial US$27.9 million to acquire a 6% contributing interest in the Company’s Ghana Portfolio and will make ongoing contributions through monthly cash calls as the Project develops. MIIF also intend to subscribe for 19,245,574 shares in Atlantic Lithium for a total value of US$5 million. • The Directors expect that while current funds and funding would be sufficient to meet a minimum programme of exploration and part of the Capex to develop the Project, additional funds would be required. The Group has previously raised funds through share placements and capital raisings from new and existing shareholders. • The Directors have the ability to schedule activities and hence expenditure in accordance with the availability of funds and cash forecasts. The events and conditions noted above indicate the existence of a material uncertainty that may cast significant doubt about the Group’s ability to continue as a going concern and therefore the Group may be unable to realise its assets and discharge its liabilities in the normal course of business. The Directors are confident that they will be able to secure additional funds from other sources and accordingly the going concern basis of preparation for the financial report is appropriate. The Directors are confident that a binding agreement will be reached with MIIF and, based on their previous experience and success in raising capital, additional funds can be obtained to complete the Project if required. The financial report does not include any adjustments relating to the amounts or classification of recorded assets or liabilities that might be necessary if the Group does not continue as a going concern. NOTES TO THE FINANCIAL STATEMENTS For the year ended 30 June 2023

52Atlantic Lithium Limited Annual Report 2023 1.3 Significant Accounting Policies Accounting policies have been consistently applied for all years presented in the financial report. Accounting policies are selected and applied in a manner which ensures that the resulting financial information satisfies the concepts of relevance and reliability, thereby ensuring that the substance of the underlying transactions or other events is reported. Where a significant accounting policy is specific to a note to the consolidated financial statements, the policy is described within that note. New Accounting Standards and Interpretations The Group has adopted all new or amended Accounting Standards and Interpretations issued by the AASB that are mandatory for the current reporting period. The adoption of these new or amended standards and interpretations did not have a significant impact on the Group’s consolidated financial statements. Any new or amended Accounting Standards or Interpretations that are not yet mandatory have not been early adopted, however the estimated impact on adoption is not expected to have a significant impact on the Group’s consolidated financial statements. Basis of Consolidation The consolidated financial statements comprise the financial statements of the Company and entities controlled by the Group. The Group controls an entity when it is exposed to, or has rights to, variable returns from its involvement with the entity and can affect those returns through its power to direct the activities of the entity. The financial statements include the information and results of each subsidiary from the date on which the Company obtains control and until such time as the Company ceases to control an entity. In preparing the consolidated financial statements, all intercompany balances, transactions, and unrealised gains and losses resulting from intra-group transactions have been eliminated in full. A change in the ownership interest of a subsidiary that does not result in a loss of control, is accounted for as an equity transaction. Investments in subsidiaries are carried at their cost of acquisition in the separate financial statements of the Company. Foreign Currency Items included in the financial statements of each of the Group’s entities are measured using the currency of the primary economic environment in which the entity operates (the functional currency). The consolidated financial statements are presented in Australian dollars which is also the functional currency of the Company. The functional currency of all overseas entities is United States Dollars (US dollars). In the prior financial year, the functional currency of the entities incorporated in Ghana was the Ghanaian Cedi. Management have determined that on 1 July 2022 the functional currency of the Ghana entities changed from the Ghanaian Cedi to US dollars. As the exploration and DFS phase of the Ewoyaa project was completed during the current financial year and the Project moves towards development, management believe that US dollars better reflect the currency of the primary economic environment in which these entities operate given that the majority of expenditure and funding is in US dollars. The change in functional currency has been accounted for on a prospective basis. i. Foreign currency transactions Transactions in foreign currencies are translated into the respective functional currencies of Group companies at the exchange rate at the dates of the transactions. Monetary assets and liabilities denominated in foreign currencies are translated into the functional currency at the exchange rate at the reporting date. Non-monetary items that are measured based on historical cost in a foreign currency are translated at the exchange rate at the date of the transaction. Foreign currency differences are recognised in profit or loss. ii. Foreign operations On consolidation, the assets and liabilities of foreign operations are translated into Australian dollars at the exchange rate at the reporting date and their income and expenses are translated to Australian dollars at the exchange rate at the dates of the transactions. Foreign exchange differences resulting from translation are initially recognised in other comprehensive income and are accumulated in the foreign currency translation reserve. When a foreign operation is disposed of any accumulated amount in the reserve is transferred to profit or loss. NOTES TO THE FINANCIAL STATEMENTS For the year ended 30 June 2023 53 Atlantic Lithium Limited Annual Report 2023 Goods and Services Tax (GST) Revenues, expenses and assets are recognised net of GST except where GST incurred on a purchase of goods and services is not recoverable from the taxation authority, in which case the GST is recognised as part of the cost of acquisition of the asset or as part of the expense item. Receivables and payables are stated with the amount of GST included. The net amount of GST recoverable from, or payable to, the taxation authority is included as part of receivables or payables in the Consolidated Statement of Financial Position. Cash flows are included in the Consolidated Statement of Cash Flows on a gross basis and the GST component of cash flows arising from investing and financing activities, which is recoverable from, or payable to, the taxation authority, are classified as operating cash flows. Commitments and contingencies are disclosed net of the amount of GST recoverable from, or payable to, the taxation authority. 1.4 Critical Accounting Estimates and Judgements The application of the Group’s accounting policies requires management to make judgements, estimates and assumptions that affect the amounts reported in this financial report, and the accompanying disclosures. The estimates, judgements and assumptions incorporated into this financial report are based on historical experience, adjusted for current market conditions and economic data, obtained both internally and externally and are reviewed on a regular basis. Actual results may differ from these estimates. As noted above, the functional currency of the Ghana entities changed from Ghanaian Cedi to US dollars on 1 July 2022. Management have exercised judgement in determining that the primary economic environment in which these entities operate has changed and the effective date of the change. Further details on other key judgements and sources of estimation uncertainty can be found in the following notes: • Note 1.2 – Going concern • Note 3.4 – Exploration and evaluation assets • Note 5.2 – Determining the fair value of share-based payments 2. GROUP PERFORMANCE 2.1 Loss Per Share 2023 $ 2022 $ Loss Loss attributable to the owners of Atlantic Lithium Limited, used in the calculation of basic and diluted loss per share (12,187,617) (34,647,546) 2023 Number of Shares 2022 Number of Shares Weighted average number of shares Weighted average number of ordinary shares outstanding during the year, used in the calculation of basic and diluted loss per share 601,215,012 565,084,093 2023 Cents per share 2022 Cents per share Basic and diluted loss per share (2.0) (6.1) The options and performance rights are considered to be non-dilutive as the Group is loss making and are therefore excluded from the weighted average number of shares used in the calculation of diluted loss per share. These options and performance rights may become dilutive in the future periods. Refer to Note 4.1 for details of the options and performance rights on issue as at year end. NOTES TO THE FINANCIAL STATEMENTS For the year ended 30 June 2023

54Atlantic Lithium Limited Annual Report 2023 2.2 Operating Segments The Group has identified its operating segment based on the internal reports that are reviewed and used by the Chief Executive Officer and Board of Directors (the chief operating decision makers) in assessing performance and determining the allocation of resources. The Group has one operating segment, being exploration for base and precious metals. The financial results contained in this consolidated financial report are consistent with the basis on which the chief operating decision makers assess the performance of the sole operating segment. Geographic Information The table below provides information on the geographic locations of non-current assets. Assets are allocated based on the location of the operation to which they relate. 2023 $ 2022 $ Australia 54,452 26,363 Ivory Coast 73,747 68,370 Ghana 18,440,168 11,164,758 18,568,367 11,259,491 2.3 Income Tax 2023 $ 2022 $ Income tax recognised outside of profit or loss Deferred tax credited directly to equity (523,094) (27,468) Deferred tax (credited)/debited to financial assets revaluation reserve (140,249) 90,750 (663,343) 63,282 Reconciliation between loss before income tax and income tax expense/ (benefit) Loss before income tax (11,524,274) (34,710,828) Prima facie tax on loss before income tax at 30% (2022: 30%) (3,457,282) (10,413,248) Tax effect of: Share based payments 1,063,208 3,606,132 Tax losses derecognised 2,206,064 9,203,885 Temporary differences derecognised 849,837 508,933 Other 1,516 16,889 Reversal of DTL on exploration and evaluation costs from acquisition of Tekton investment (part of Demerger with Ricca Resources) - (2,985,873) Income tax expense/(benefit) 663,343 (63,282) NOTES TO THE FINANCIAL STATEMENTS For the year ended 30 June 2023 55 Atlantic Lithium Limited Annual Report 2023 2.3 Income Tax (continued) Movement in Deferred Tax Balances Opening Balance $ Recognised in Profit or Loss $ Recognised in Equity $ Recognised in Other Comprehensive Income $ Closing Balance $ Year ended 30 June 2023 Accruals 111,780 518,539 - - 630,319 Provisions 76,230 40,439 - - 116,669 Share issue costs 676,666 (296,347) 523,094 - 903,413 Less: Deferred tax asset derecognised (508,933) (849,837) - - (1,358,770) Total deferred tax assets recognised 355,743 (587,206) 523,094 - 291,631 Other financial assets (161,724) - - 140,249 (21,475) Unrealised foreign exchange gains (190,472) (76,137) - - (266,609) Other (3,547) - - - (3,547) Total deferred tax liabilities (355,743) (76,137) - 140,249 (291,631) Net deferred tax asset/(liability) recognised - (663,343) 523,094 140,249 - Year ended 30 June 2022 Accruals 62,233 49,547 - - 111,780 Provisions 41,722 34,508 - - 76,230 Share issue costs 565,644 83,554 27,468 - 676,666 Tax losses 1,651,859 (1,651,859) - - - Less: Deferred tax asset derecognised - (508,933) - - (508,933) Total deferred tax assets recognised 2,321,458 (1,993,183) 27,468 - 355,743 Exploration and expenditure (1,858,674) 1,858,674 Other financial assets (22,131) (48,843) - (90,750) (161,724) Unrealised foreign exchange gains (417,993) 227,521 - - (190,472) Other (22,660) 19,113 - - (3,547) Total deferred tax liabilities (2,321,458) 2,056,465 - (90,750) (355,743) Net deferred tax asset/(liability) recognised - 63,282 27,468 (90,750) - 2023 $ 2022 $ Unrecognised deferred tax assets (@30%) Unrecognised temporary differences 1,358,770 508,933 Unrecognised tax losses Unused tax losses carried forward 58,122,083 50,768,530 Unused capital losses carried forward 12,402,110 12,402,110 In order to recoup carried forward losses in future periods, either the Continuity of Ownership Test (COT) or Same Business Test must be passed. The majority of losses are carried forward at 30 June 2023 under COT. NOTES TO THE FINANCIAL STATEMENTS For the year ended 30 June 2023

56Atlantic Lithium Limited Annual Report 2023 2.3 Income Tax (continued) Deferred tax assets which have not been recognised as an asset, will only be obtained if: i. the Company derives future assessable income of a nature and of an amount sufficient to enable the losses to be realised; ii. the Company continues to comply with the conditions for deductibility imposed by the law; and iii. no changes in tax legislation adversely affect the Company in realising the losses. Measurement and Recognition The income tax expense for the period is the tax payable/recoverable on the current period’s taxable income/loss for each jurisdiction, adjusted for changes in deferred tax assets and liabilities and unused tax losses. Current and deferred tax is recognised as an expense or income in the consolidated statement of profit or loss, except where it relates to items credited or debited directly to equity, in which case the deferred tax is also recognised directly in equity. Deferred tax is accounted for in respect of temporary differences between the tax base of assets and liabilities and their carrying amount in the financial statements. Deferred tax liabilities are recognised for all taxable temporary differences. Deferred tax assets are recognised for all deductible temporary differences, unused income tax and capital losses and tax offsets, to the extent that it is probable that sufficient taxable profits will be available to utilise them. Deferred tax assets and liabilities are measured at the tax rates that are expected to apply in the year when the asset is utilised or the liability is settled, based on tax rates and tax laws that have been enacted or substantively enacted at the reporting date. Deferred tax assets and liabilities are not recognised for temporary differences relating to investments in subsidiaries to the extent that the Group is able to control the timing of the reversal of the temporary differences and it is probable that they will not reverse in the foreseeable future. Deferred tax assets and liabilities are offset when they relate to income taxes levied by the same taxation authority and the Group intends to settle its current tax assets and liabilities on a net basis. 3. ASSETS AND LIABILITIES 3.1 Other Receivables 2023 $ 2022 $ Piedmont farm in contributions receivable (refer Note 3.4) 1,141,881 1,987,164 Other receivables 459,084 311,077 1,600,965 2,298,241 Other receivables are recognised initially at fair value and are subsequently measured at amortised cost using the effective interest method, less a loss allowance. Receivables are non-interest bearing and are generally on 30-60 day terms. No allowance for credit loss has been recognised in either the current or previous year as all amounts are expected to be recovered in full. Due to the short-term nature of these receivables, their carrying value approximates their fair value. The maximum exposure to credit risk is the carrying value of the receivables. Collateral is not held as security. NOTES TO THE FINANCIAL STATEMENTS For the year ended 30 June 2023 57 Atlantic Lithium Limited Annual Report 2023 3.2 Other Financial Assets 2023 $ 2022 $ Security deposits 6,000 7,500 Investment in shares at fair value through other comprehensive income Australasian Metals Limited 632,500 1,100,000 Auburn Resources Limited 125,000 125,000 Other 8 20 763,508 1,232,520 Australasian Metals Limited is listed on the Australian Stock Exchange. Auburn Resources Limited is an unlisted public company incorporated in Australia. Fair value has been determined for the investment in Auburn Resources based on the latest share capital placement in July 2021 at 12.5 cents per share. Refer to Note 7.2 for details of contingent liabilities relating to these investments. No dividends have been received nor shares disposed in relation to these investments in either the current or prior financial period. Measurement and Recognition The investment in shares are investments in equity instruments which are not held for trading. In accordance with AASB 9 Financial Instruments the Group made an irrevocable election on initial recognition to designate these equity instruments at fair value through other comprehensive income. Any changes in fair value since original recognition are recognised in other comprehensive income and are never reclassified to profit or loss. 3.3 Property, Plant and Equipment Motor Vehicle $ Plant & Equipment $ Office Equipment $ Total $ Year ended 30 June 2023 Balance as at 1 July 2022 182,773 5,683 20,681 209,137 Effect of movements in foreign exchange rates (9,620) - - (9,620) Additions 389,484 - 54,288 443,772 Depreciation capitalised to exploration and evaluation assets (83,052) - - (83,052) Depreciation expense - (3,221) (22,980) (26,201) Balance as at 30 June 2023 479,585 2,462 51,989 534,036 Cost 704,309 75,555 95,968 875,832 Accumulated depreciation (224,724) (73,093) (43,979) (341,796) Balance as at 30 June 2023 479,585 2,462 51,989 534,036 Year ended 30 June 2022 Balance as at 1 July 2021 278,411 16,059 40,784 335,254 Effect of movements in foreign exchange rates (41,218) 21 105 (41,092) Additions 88,669 - 9,279 97,948 Assets distributed to owners (refer Note 6.3) (39,078) - (15,837) (54,915) Depreciation capitalised to exploration and evaluation assets (104,011) (3,980) (3,240) (111,231) Depreciation expense - (6,417) (10,410) (16,827) Balance as at 30 June 2022 182,773 5,683 20,681 209,137 Cost 303,729 75,555 41,680 420,964 Accumulated depreciation (120,956) (69,872) (20,999) (211,827) Balance as at 30 June 2022 182,773 5,683 20,681 209,137 NOTES TO THE FINANCIAL STATEMENTS For the year ended 30 June 2023

58Atlantic Lithium Limited Annual Report 2023 3.3 Property, Plant and Equipment (continued) Measurement and Recognition Property, plant and equipment is measured at cost less accumulated depreciation and impairment losses. The cost of property, plant and equipment constructed by the Group includes the cost of materials, direct labour, borrowing costs and an appropriate portion of fixed and variable costs. Subsequent costs are included in the asset’s carrying amount or are recognised as a separate asset, as appropriate, only when it is probable that future economic benefits associated with the item will flow to the Group and the cost of the item can be measured reliably. All other repairs and maintenance costs are recognised in the profit or loss as incurred. Depreciation commences once an asset is available for use and is calculated on a straight-line basis so as to write off the net cost of each asset to its estimated residual value over its expected useful life. The useful lives are as follows: Motor vehicles 5 years Plant & equipment 3.3-10 years Office equipment 3 years Impairment of Non-Financial Assets At each reporting date, the Group reviews the carrying value of its assets to determine whether there is any indication that those assets may be impaired. If such an indication exists, the recoverable amount of the asset, being the higher of the asset’s fair value less costs of disposal and value in use, is compared to the asset’s carrying value. Any excess of the asset’s carrying value over its recoverable amount is expensed to the profit or loss. When it is not possible to estimate the recoverable amount of an individual asset, the Group estimates the recoverable amount of the cash-generating unit to which the asset belongs. 3.4 Exploration and Evaluation Assets 2023 $ 2022 $ Exploration and evaluation assets 18,295,581 11,050,354 Movements in carrying amounts Balance as at 1 July 11,050,354 51,449,462 Effect of movement in foreign exchange rates 995,967 (3,272,244) Additions 20,844,027 18,247,469 Piedmont receipts from farm-in arrangements (refer below) (14,816,484) (17,438,205) Assets distributed to owners (refer to Note 6.3) - (37,910,194) Written-off during the year (39,533) (25,934) Balance as at 30 June 18,034,331 11,050,354 The recoverability of the carrying amount of exploration and evaluation assets is dependent on the successful development and commercial exploitation of the relevant area of interest or alternatively on the sale of that area of interest. Piedmont Funding Agreement On 31 August 2021, the Company entered into a binding agreement with Piedmont to provide US$103 million of funding for the Ewoyaa Lithium Project as it moves towards production. Piedmont is an US integrated supplier of raw materials and minerals supporting the electric vehicles and industrial markets. Piedmont is to earn-in up to 50% of the Company’s Cape Coast Lithium Portfolio in Ghana,(CCLP) including Ewoyaa, in the following stages (the “farm-in arrangement”): NOTES TO THE FINANCIAL STATEMENTS For the year ended 30 June 2023 59 Atlantic Lithium Limited Annual Report 2023 3.4 Exploration and Evaluation Assets (continued) Stage 1: Investment into Atlantic Lithium Limited (circa US$16 million) • On 31 August 2021, Piedmont subscribed for 54 million new ordinary shares in the Company at a price of 20 pence per share (£10.8 million), with a further £0.72 million committed via placing 2,880,000 shares at 25 pence per share. After these transactions Piedmont held a 9.91% interest in the issued share capital of the Company. Stage 2: Regional Exploration and Definitive Feasibility Study (“DFS”) Funding (US$17 million) • Piedmont to earn up to an initial 22.5% of CCLP, via sole funding, of the following: • US$5 million towards an accelerated regional exploration programme to enhance the current Ewoyaa resource; and • US$12 million towards completing the DFS for Ewoyaa. • Any cost overruns or savings will be shared equally between the Company and Piedmont • As at 30 June 2023 Piedmont has provided US$17 million of funding for this stage and all ongoing expenditure is now being shared equally between the Company and Piedmont. Stage 3: Development Funding (US$70 million) • On achievement of the “DFS criteria” (refer below) Piedmont can elect to earn a further 27.5% of CCLP via sole funding of Development for the Ewoyaa Project of US$70 million. • Any additional spending or savings will be shared equally between the Company and Piedmont. • Subsequent to year end, Piedmont notified the Company of its intent to support the development of the Ewoyaa Project (refer Note 7.3) Other Key Terms • The minimum DFS criteria is to deliver a 1.5 million tonnes per annum (“mtpa”) to 2.0 mtpa run of mine operation (“LOM”) for an 8 to 10 year life of mine respectively. • If the DFS criteria of Stage 2 is achieved and Piedmont elects by mutual agreement not to proceed to Stage 3, Piedmont will forfeit its Stage 2 interest. • Piedmont is entitled to appoint one director to the Company Board on completion of Stage 1 and while maintaining an equity interest equal to or above 9% in the Company. • An offtake agreement for 50% of the annual LOM lithium spodumene concentrate (SC6%) production where offtake pricing will be determined via a formula which is linked to the prevailing market price of lithium products. Measurement and Recognition Exploration and evaluation expenditure incurred is accumulated in respect of each identifiable area of interest. Such expenditure comprises net direct costs and an appropriate portion of related overhead expenditure but does not include overheads or administration expenditure which does not have a specific nexus with a particular area of interest. These assets are only carried forward to the extent that they are expected to be recouped through the successful development of the area or where activities in the area have not yet reached a stage which permits a reasonable assessment of the existence of economically recoverable reserves and active or significant operations in relation to the area of interest are continuing. A regular review is undertaken on each area of interest to determine the appropriateness of continuing to carry forward the exploration and evaluations assets for that area of interest. Exploration and expenditure assets are tested for impairment in accordance with the policy adopted for non-financial assets in Note 3.3. Once technical feasibility and commercial viability of the extraction of mineral resources in an area of interest are demonstrable and a final investment decision has been made, exploration and evaluation assets attributable to that area of interest are tested for impairment and then reclassified to mine property and development assets in property, plant and equipment. Accumulated costs in relation to an abandoned area are written off in full in the profit or loss in the year in which the decision to abandon the area is made. When production commences, the accumulated costs for the relevant area of interest are amortised over the life of the area according to the rate of depletion of the economically recoverable reserves. Costs of site restoration are provided over the life of the area of interest once exploration commences and are included in the costs of that stage. Site restoration costs include the dismantling and removal of mining plant, equipment and building structures, waste removal, and rehabilitation of the site in accordance with any requirements of mining permits. Such costs have been determined using estimates of future costs, current legal requirements and technology on an undiscounted basis. NOTES TO THE FINANCIAL STATEMENTS For the year ended 30 June 2023

60Atlantic Lithium Limited Annual Report 2023 3.4 Exploration and Evaluation Assets (continued) In determining the costs of site restoration, there is uncertainty regarding the nature and extent of the restoration due to community expectations and future legislation. The Group has assumed that the site will be restored using technology and materials that are currently available. Farm-in Arrangement As set out above the Company has entered a farm-in arrangement with Piedmont whereby Piedmont is able to obtain up to 50% of the Company’s Cape Coast Lithium Portfolio in Ghana through the acquisition of shares in the Company and the sole funding of certain regional exploration, DFS and development activities. Whilst Piedmont (the “farmee”) has been contributing funding to cover Stage 2, as described above, the Group continued to capitalise expenditures incurred as an exploration and evaluation asset for the area of interest. The carrying amount of the relevant exploration and evaluation asset is reduced for any cash payments due or received from the farmee. Critical Accounting Estimates and Judgements Recognition of Exploration and Evaluation Assets Management performs regular reviews of each area of interest to determine the appropriateness of continuing to carry forward exploration and evaluation costs in accordance with the accounting policy described above. Management uses detailed surveys and the analysis of drilling results to assist in making these judgements. There are a number of factors which are considered in determining the potential for successful development or sale of an exploration asset, including but not limited to, judgements in relation to future commercial viability of exploration tenements and potential for successful development, the risk of expiration of exploration rights without renewal and planned expenditure for further exploration, all of which may be further impacted by climate change considerations. 3.5 Trade and other payables 2023 $ 2022 $ Trade payables 2,126,830 2,369,124 Sundry payables and accrued expenses 3,942,938 1,673,913 Employee benefits 111,183 51,066 6,180,951 4,094,103 Trade and other payables are non-interest bearing and are generally on 30-60 day terms. Due to the short term nature of these payables the carrying value approximates fair value. Measurement and Recognition Payables and accrued expenses are recognised when the Group becomes obliged to make future payments resulting from the purchase of goods and services. 3.6 Provisions 2023 $ 2022 $ Annual leave - current 310,985 209,375 Long service leave - non-current 61,855 43,342 372,840 252,717 Liabilities expected to be settled within 12 months of the reporting date are measured at the amounts expected to be paid when the liabilities are settled. Liabilities not expected to be settled within 12 months of the reporting date are measured at the present value of expected future payments to be made in respect of services provided by employees up until the reporting date. NOTES TO THE FINANCIAL STATEMENTS For the year ended 30 June 2023 61 Atlantic Lithium Limited Annual Report 2023 4. CAPITAL STRUCTURE AND FINANCIAL RISK MANAGEMENT 4.1 Issued Capital a) Fully paid ordinary share capital 2023 No. of Shares 2022 No. of Shares 2023 $ 2022 $ Balance as at 1 July 580,041,660 516,114,246 126,468,060 102,939,352 Subscription shares issued - 54,000,000 - 20,304,145 Private placement - 2,880,000 - 1,353,610 Shares issued on exercise of warrants - 2,797,414 - 1,023,875 Shares issued on exercise of employee options 7,000,000 500,000 1,455,197 106,410 Shares issued on exercise of director options 9,250,000 3,750,000 3,170,317 804,762 Shares issued on exercise of employee rights 9,450,000 - - - Share issue costs (net of tax) - - (1,220,553) (64,094) Balance as at 30 June 605,741,660 580,041,660 129,873,021 126,468,060 Shares funded by limited recourse loan (refer (c) below) 3,500,000 - - - 609,241,660 580,041,660 129,873,021 126,468,060 Fully paid ordinary shares carry one vote per share and carry the right to dividends. Costs directly attributable to the issue of new shares or options are shown as a deduction from the equity proceeds, net of any income tax benefit. Where the Company provides a loan to an employee or director to fund the acquisition of shares in the Company, and the loan is limited in recourse to those shares, the arrangement is accounted for as an in-substance option and the shares are not disclosed as ordinary share capital. Refer below for further details. b) Employee and director options As at 30 June 2023, the company has 60,000,000 options on issue (2022: 69,000,000). Each option is exercisable for 1 ordinary share of Atlantic Lithium. Options carry no voting rights and no rights to dividends. Refer to Note 5.2 for further details of outstanding employee and director options. c) In-substance options Where the Company provides loans to employees and directors to fund the acquisition of shares in the Company, and the loan is limited in recourse to those underlying shares, the arrangement is accounted for as an in-substance option. This is because of the option like characteristics of the arrangement whereby the recipient can benefit from increases in the share price over the loan’s face value whilst being protected from decreases below the loan’s face value during the term of the loan. The repayment of the loan represents the ‘exercise’ of the option. As at 30 June 2023, the company has 3,500,000 in-substance options on issue (2022: nil). Each in-substance option is exercisable for 1 ordinary share of Atlantic Lithium. In-substance options carry one vote per option and carry the rights to dividends. Refer to Note 5.2 for further details of outstanding in-substance options. d) Performance rights As at 30 June 2023, the company has 2,700,000 performance rights on issue (2022: 12,150,000). Each performance right is exercisable for 1 ordinary share of Atlantic Lithium. Performance rights carry no voting rights and no rights to dividends. Refer to Note 5.2 for further details of outstanding performance rights. NOTES TO THE FINANCIAL STATEMENTS For the year ended 30 June 2023

62Atlantic Lithium Limited Annual Report 2023 4.1 Issued Capital (continued) e) Capital Risk Management When managing capital, management’s objective is to ensure the entity continues as a going concern as well as to maintain optimal returns to shareholders and benefits for other stakeholders. Management also aims to maintain a capital structure to ensure the lowest cost of capital available to the Group. The Group’s capital comprises equity as shown in the Consolidated Statement of Financial Position. The Group is not exposed to externally imposed capital requirements. 4.2 Dividends and Franking Credits There were no dividends paid or recommended during the year or since the end of the year. There are no franking credits available to shareholders. 4.3 Notes to the Consolidated Statement of Cash Flows 2023 $ 2022 $ Loss after income tax (12,187,617) (34,647,546) Non-cash operating items Write down on demerger - 16,228,010 Depreciation 26,201 16,827 Share based payments 3,544,028 12,020,442 Unrealised foreign exchange losses (gains) 26,386 903,748 Changes in assets and liabilities net of amounts relating to exploration and evaluation assets (Increase) decrease in trade and other receivables (292,700) (25,333) (Increase) decrease in other current assets (102,528) (208,975) Increase (decrease) in trade and other payables 1,357,958 393,114 Change in Deferred Tax 663,343 (63,282) Net cash flows used in operating activities (6,964,929) (5,382,995) Non-cash investing and financing activities Refer Note 6.3 for details of the demerger of Ricca Resources Limited by way of a capital reduction and in-specie distribution in the prior financial year. 4.4 Capital Commitments The terms of the various mining tenements held by the Group include obligations to expend minimum amounts on exploration. These obligations may be varied from time to time and are expected to be fulfilled in the normal course of operations. The maturity profile of the outstanding commitments as at each reporting date are: 2023 $ 2022 $ Less than 12 months 3,573,318 3,447,376 Between 12 months and 5 years 2,855,914 2,755,257 6,429,232 6,202,633 If the minimum expenditure requirements are not met, the Group has the option to negotiate new terms or relinquish the tenement. The Group is also able to meet the expenditure commitments by entering into joint venture or farm-in agreements. NOTES TO THE FINANCIAL STATEMENTS For the year ended 30 June 2023 63 Atlantic Lithium Limited Annual Report 2023 4.4 Capital Commitments (continued) Piedmont Funding Agreement Details of the Piedmont Funding Agreement can be found in Note 3.4. As at 30 June 2023 the outstanding commitment from Piedmont to the Group was US$68,200,626 for development (2022: US$70 million) and sharing all costs equally for Regional Exploration and DFS Funding (2022: US$4,389,829). In accordance with this Funding Agreement, Piedmont will provide funding for a portion of the above capital commitments, depending on the nature of the actual expenditure. 4.5 Financial Risk Management The Board of Directors has overall responsibility for the establishment and oversight of risk management. The Board has delegated the authority for designing and operating processes that ensure the effective implementation of the objectives and policies to the Group’s finance function. The overall objective of the Board is to set policies that seek to reduce risk as far as possible without unduly affecting the Group’s competitiveness and flexibility. The Group is exposed to risks that arise from its use of financial instruments including credit risk, liquidity risk and market risk (interest rate and foreign currency risks). This note describes the Group’s objectives, policies and processes for managing these risks and the methods used to measure them. Further quantitative information in respect of these risks is presented throughout these financial statements. The Group’s financial instruments consist mainly of cash and deposits with banks, receivables and payables. a) Credit Risk Credit risk is the risk that the other party to a financial instrument fails to settle their obligations owing to the Group resulting in a financial loss to the Group. It arises from exposure to receivables as well as deposits with financial institutions. The maximum exposure to credit risk from cash and other receivables is the carrying amount as disclosed in the statement of financial position and notes to the financial statements. As at 30 June 2023 the Group has not recognised any provision for expected credit losses for any financial asset (2022: nil). The largest single debtor of the group is Piedmont for farm in contributions receivable. The balance outstanding has been received in full subsequent to year end. The Group does not have any other material credit risk exposure to any single debtor or group of debtors under financial instruments entered into by the Group and at the reporting date. The majority of bank deposits are with Westpac Banking Corporation Limited (2023: $15.0 million from total of $15.3 million, 2022: $23.2 million from total of $23.9 million) which has an AA- credit rating. b) Liquidity Risk Liquidity risk is the risk that the Group is unable to meet financial obligations as and when they fall due. The Group manages liquidity risk by monitoring forecast cash flows and liquidity ratios such as working capital. The Group does not have any financing facilities available at reporting date. The only financial obligations of the Group at balance date are trade and other payables as disclosed in the statement of the financial position and notes to the financial statements. The contracted cash flows for all trade and other payables are less than 3 months. Refer to Note 1.2 for going concern disclosures and details of sources of funding that are available. c) Market Risk Interest Rate Risk Interest rate risk is the risk that the fair value or future cash flows of a financial instrument will fluctuate because of changes in market interest rates. The Group does not have any external borrowings and all financial assets are non-interest bearing. The Group is not exposed to interest rate risk on any financial assets or liabilities. NOTES TO THE FINANCIAL STATEMENTS For the year ended 30 June 2023

64Atlantic Lithium Limited Annual Report 2023 4.5 Financial Risk Management (continued) Currency Risk Currency risk is the risk that the fair value or future cash flows of a financial instrument will fluctuate because of changes in foreign exchange rates. The Group undertakes certain transactions denominated in foreign currencies and is also exposed to currency risk when recognised financial assets and financial liabilities are denominated in a currency that is not the entity's functional currency. To protect against adverse exchange rate movements, the Group has set up foreign bank accounts in US Dollars, Pounds Sterling and Ghanian Cedi which are used to fund its exploration activities in Ghana. The carrying amount of the Group's foreign currency denominated financial assets and financial liabilities at the reporting date were as follows, expressed in Australian dollars. Assets Liabilities 2023 $ 2022 $ 2023 $ 2022 $ Pound Sterling 1,964,872 19,152,152 44,698 105,679 US Dollars 13,766,965 6,325,691 78,448 1,818,513 Ghanian Cedi 98,836 - - - Singapore Dollars 59,246 57,070 - - South African Rand - - 37,236 - Euro - - - 19,007 The following table details the Group’s sensitivity to movements in the Australian dollar against relevant foreign currencies. A positive number indicates a before-tax increase in profit and a negative number indicates a before-tax decrease in profit. AUD strengthen by 10% AUD weaken by 10% 2023 $ 2022 $ 2023 $ 2022 $ Consolidated 2023 Pound Sterling (192,017) (1,904,647) 192,017 1,904,647 US Dollars (1,368,852) (450,718) 1,368,852 450,718 Ghanian Cedi (9,884) - 9,884 - Singapore Dollars (5,925) (5,707) 5,925 5,707 South African Rand 3,724 - (3,724) - Euro - 1,901 - (1,901) Equity Price Risk Equity price risk is the risk that the fair value of investments in equity instruments will fluctuate due to changes in market share prices. Further details of equity investments can be found in Note 3.2. Any percentage change in the underlying share price will result in an equivalent percentage change in the total carrying amount of the investment. NOTES TO THE FINANCIAL STATEMENTS For the year ended 30 June 2023 65 Atlantic Lithium Limited Annual Report 2023 4.5 Financial Risk Management (continued) d) Fair Value Measurement Some of the Group’s financial assets are measured at fair value at the end of each reporting period. Refer Note 3.2 for further details. These financial assets are categorised into levels 1 to 3 based on the degree to which the fair value inputs are measurable: Level 1: Fair value is based on quoted prices in active markets for identical assets that the Group can access at the measurement date. Level 2: Fair value is estimated using inputs other than quoted prices included within Level 1 that are observable for the assets, either directly or indirectly. Level 3: Fair value is estimated based on unobservable inputs for the asset. Fair value has been based on the latest share capital placement for which information is publicly available. There were no transfers between level 1, level 2, or level 3 during the period. Level 2023 $ 2022 $ Investments in shares at fair value through other comprehensive income – listed entities Level 1 632,508 1,100,020 Investments in shares at fair value through other comprehensive income – unlisted entities Level 3 125,000 125,000 Total 757,508 1,225,020 Assets measured at fair value on a non-recurring basis In the prior financial period the fair value of the Exploration and Evaluation Assets on demerger of Ricca were measured at fair values based on a valuation performed by an independent consultant and adjusted by management based on further technical analysis. 5. EMPLOYEE BENEFITS 5.1 Employee Benefits Expense 2023 $ 2022 $ Remuneration and on-costs 4,174,273 2,052,823 Defined contribution superannuation 83,939 72,117 Equity settled share-based payments expense 3,544,028 12,020,442 7,802,240 14,145,382 5.2 Share-based Payments During the financial year the Group has had the following equity-settled share-based payments plans in place: Option Plans Options may be issued to directors and employees as part of their remuneration. The options do not have any performance conditions or service conditions prior to vesting but are issued to Directors and certain employees to align comparative shareholder return for directors and employees and to provide employees with the opportunity to participate in any future growth of the Company. Director Options refer to options granted to directors whilst Employee Share Option Plan (ESOP) Options refer to options granted to executive directors and employees. Advisory Options have been granted to certain of the Company’s advisers. Options granted carry no rights to dividends and no voting rights. When a participant ceases employment after the vesting of their options, the options are forfeited after 90 days unless cessation of employment is due to termination for cause, whereupon they are forfeited immediately, or death. NOTES TO THE FINANCIAL STATEMENTS For the year ended 30 June 2023

66Atlantic Lithium Limited Annual Report 2023 5.2 Share-based Payments (continued) All options vest on the date of issue and may be exercised at any time on or before the expiry date. On exercise one fully paid ordinary share in the Company is issued for each exercised option. The table below sets out details of the exercise price and expiry date for all tranches of options on foot throughout the financial period as well as details of the changes in the number of options on issue during the period. Plan Type Expiry Date Exercise Price Grant Date Opening Balance Exercised Lapsed Modified Granted Closing Balance Director Options 31 Aug 2022 £0.12 3,000,000 (750,000) (2,250,000) - - - ESOP Options 31 Aug 2022 £0.12 7,000,000 (7,000,000) - - - - Director Options 31 Dec 2022 £0.12 4,500,000 (4,500,000) - - - - Director Options 31 Dec 2022 £0.30 4,000,000 (4,000,000) - - - - Director Options 1 31 Dec 2022 £0.40 5,000,000 - - (5,000,000) - - Director Options 1 31 Dec 2022 £0.50 6,000,000 - - (6,000,000) - - ESOP Options 2 8 Apr 2023 £0.30 3,500,000 - - (3,500,000) - - ESOP Options 18 Aug 2023 £0.30 3,000,000 - - - - 3,000,000 Advisory Options 18 Aug 2023 £0.30 1,000,000 - - - - 1,000,000 ESOP Options 18 Aug 2023 £0.40 4,000,000 - - - - 4,000,000 Advisory Options 18 Aug 2023 £0.40 1,000,000 - - - - 1,000,000 ESOP Options 18 Aug 2023 £0.50 5,000,000 - - - - 5,000,000 Advisory Options 18 Aug 2023 £0.50 1,000,000 - - - - 1,000,000 ESOP Options 1 18 Aug 2023 £0.40 - - - 5,000,000 - 5,000,000 ESOP Options 1 18 Aug 2023 £0.50 - - - 6,000,000 - 6,000,000 ESOP Options 23 Apr 2024 £0.70 8,000,000 - - - - 8,000,000 ESOP Options 23 Apr 2024 £0.75 8,000,000 - - - - 8,000,000 ESOP Options 23 Apr 2024 £0.80 5,000,000 - - - - 5,000,000 ESOP Options 29 Nov 2024 £0.60 28 Nov 2022 - - - - 2,000,000 2,000,000 ESOP Options 29 Nov 2024 £0.70 28 Nov 2022 - - - - 2,000,000 2,000,000 ESOP Options 31 Mar 2025 £0.60 31 Mar 2023 - - - - 7,000,000 7,000,000 ESOP Options 15 May 2025 £0.50 16 May 2023 - - - - 2,000,000 2,000,000 69,000,000 (16,250,000) (2,250,000) (3,500,000) 13,000,000 60,000,000 Weighted average exercise price £0.45 £0.16 £0.12 £0.60 £0.58 Weighted average contractual life (months) 8.5 1 During the period the expiry date of 11 million options was modified from 31 December 2022 to 18 August 2023. The original expiry date of these options was 18 August 2023 and had been modified to 31 December 2022 during the prior financial year. As the current expiry date is the same as the original expiry date, no other modifications to the options terms have been made, and the total fair value of these options was recognised as an expense when the options were originally issued, no additional expense has been recognised for the modification in the current period. 2 The Company provided loans to employees to fund the exercise of these options which was accounted for as a modification to a share-based payment arrangement. Refer below for further details of the new in-substance option arrangements. All options outstanding at year end are exercisable. NOTES TO THE FINANCIAL STATEMENTS For the year ended 30 June 2023 67 Atlantic Lithium Limited Annual Report 2023 5.2 Share-based Payments (continued) Options Granted during the period The table below sets out the inputs used in the Black-Scholes models to determine the fair value of options granted during the current financial period. Grant date (i) 28 Nov 2022 28 Nov 2022 31 Mar 2023 16 May 2023 Vesting date 28 Nov 2022 28 Nov 2022 31 Mar 2023 16 May 2023 Expiry date 28 Nov 2024 28 Nov 2024 31 Mar 2025 16 May 2025 Number of options granted 2,000,000 2,000,000 7,000,000 2,000,000 Exercise price £0.60 £0.70 £0.60 £0.50 Share price £0.403 £0.403 £0.3795 £0.3225 Risk free rate 3.2% 3.2% 3.7% 4.0% Volatility (ii) 79.2% 79.2% 73.2% 83.0% Fair value £0.133 £0.117 £0.111 £0.111 $0.266 $0.234 $0.205 $0.208 (i) Grant date for director options is the date on which shareholder approval is obtained. (ii) Volatility has been estimated based on actual historical share price volatility of the Company. In-substance Options At the time the offer to participate in the ESOP is made, or at any time prior to the expiry date of the options granted, a loan facility may be offered to a plan participant to be used to fund the payment of the exercise price of the options, on a limited recourse basis. As explained in Note 4.1 these arrangements are classified as in-substance options and are accounted for as equity-settled share-based payment transactions. On 6 April 2023 the Company provided loans to employees to fund the exercise of 3,500,000 options at an exercise price of £0.30. The in-substance options vested on grant date (6 April 2023). They have an expiry date of 6 April 2024 and can be exercised at any time up until this date through the repayment of the outstanding loan balance. If the loan balance is not repaid, the in-substance options will be considered to have lapsed and no further amounts are payable by the employee. This change and the granting of the in-substance options has been accounted for as a modified share-based payment arrangement given the only change to the arrangement is the extension of the expiry date by 12 months through the granting of the loan. The table below sets out the inputs used in the Black-Scholes model to determine the fair value of the in-substance options granted during the current financial period. Also included in the table are the inputs used to determine the fair value of the original instrument measured at the same date and the incremental fair value that has been recognised. Original Grant Modified Grant Plan type ESOP options In-substance options Grant date 6 April 2023 6 April 2023 Vesting date 6 April 2023 6 April 2023 Expiry date 9 April 2023 6 April 2024 Exercise price £0.30 £0.30 Share price £0.2988 £0.2988 Risk free rate 3.87% 3.87% Volatility(i) 87.53% 87.53% Fair value £0.0089 £0.1045 $0.0166 $0.1949 Increase in fair value £0.0956 $0.1783 (i) Volatility has been estimated based on actual historical share price volatility of the Company. There were no in-substance options on issue at the start of the current financial period and no in-substance options have been exercised or have lapsed during the current financial period. NOTES TO THE FINANCIAL STATEMENTS For the year ended 30 June 2023

68Atlantic Lithium Limited Annual Report 2023 5.2 Share-based Payments (continued) Performance Rights The Performance Rights Plan is a long-term incentive aimed at creating a stronger link between performance and reward for certain of the Group’s directors, employees and contractors, whilst increasing shareholder value in the Company. Performance rights granted carry no rights to dividends and no voting rights. The performance rights are subject to continued employment and the achievement of a maturity price condition. The maturity price condition is met, and the performance rights will vest, once the volume weighted average price for trading in the Company’s shares over 15 trading days hits the specified maturity price target as set out in the table below. On exercise one fully paid ordinary share in the Company is issued for each exercised performance right. The performance rights have an expiry date of 18 August 2023 and must vest and be exercised on or before this date. During the current financial period there were no performance rights granted or which expired. The table below sets out details of the target share price and expiry date for all performance rights on foot throughout the financial period as well as details of the changes in the number of performance rights on issue during the period. Expiry Date Opening Balance Exercised Closing Balance Description/ Maturity Price Target Vested 31 Dec 2022 9,450,000 (9,450,000) - 60 pence 18 Aug 2023 225,000 - 225,000 65 pence 18 Aug 2023 225,000 - 225,000 70 pence 18 Aug 2023 500,000 - 500,000 75 pence 18 Aug 2023 750,000 - 750,000 1 pound 18 Aug 2023 1,000,000 - 1,000,000 12,150,000 (9,450,000) 2,700,000 All performance rights on issue as at 30 June 2023 are unvested. Measurement and Recognition Equity settled share-based payments are measured at the fair value of the equity instruments at the grant date. The fair value includes the effect of market-based vesting conditions such as share price targets but excludes the effect of non-market-based vesting conditions and service conditions. The fair value is expensed on a straight-line basis over the vesting period with a corresponding increase in the share-based payments reserve. Where options vest on issue, the entire fair value is recognised as an expense on the issue date. At each reporting date, the Group revises its estimate of the number of equity instruments expected to vest as a result of the effect of non-market-based vesting conditions and adjusts the cumulative expense recognised to date to reflect the expected level of vesting. No adjustments are made where options do not vest due a market-condition not being met. Where the terms of share-based payments are modified, the expense continues to be recognised from grant date until vesting date as if the terms had not been changed. In addition, at the date of the modification, a further expense is recognised for any increase in fair value as a result of the change. Critical Accounting Estimates and Judgements Determining the fair value of share-based payments The cost of equity settled share-based payment transactions with employees and other suppliers is measured by reference to the fair value of the equity instruments granted using a Black-Scholes model. This requires judgement to be applied when determining the inputs used in the model after considering the terms and conditions upon which the instruments were granted. The key inputs used in the model, which have the greatest impact on the calculation of the fair value of share-based payments granted in the current and prior period, are set out above. NOTES TO THE FINANCIAL STATEMENTS For the year ended 30 June 2023 69 Atlantic Lithium Limited Annual Report 2023 5.3 Key Management Personnel Compensation Details of Key Management Personnel compensation are contained in the Remuneration Report section of the Directors Report. The total remuneration of Key Management Personnel for the Group for the year is as follows: 2023 $ 2022 $ Short term employee benefits 4,243,075 1,876,465 Post-employment benefits 93,668 67,605 Share based payments 3,365,867 11,776,386 Total 7,702,610 13,720,456 6. GROUP STRUCTURE 6.1 Subsidiaries The consolidated financial statements include the financial statements of Atlantic Lithium Limited and the subsidiaries listed below. Name Country of incorporation Equity interest (%) 2023 2022 Belinga Holdings Pty Ltd Australia 100 100 Charger Minerals Pty Ltd Australia 100 100 Eastern Exploration Pty Ltd Australia 100 100 Gabon Exploration Pty Ltd Australia 100 100 Khaleesi Resources Pty Ltd Australia 100 100 Lithium of Africa Pty Ltd Australia 100 100 Milingui Pty Ltd Australia 100 100 MODA Minerals Pty Ltd Australia 100 100 Khaleesi Resources SARL Côte d’Ivoire 100 100 IronRidge Gabon SA Gabon 100 100 Barari DV Ghana Limited Ghana 90 90 Charger Minerals Ghana Limited Ghana 100 100 Green Metals Resources Limited Ghana 100 100 Joy Transporters Limited Ghana 100 100 Moda Minerals Limited Ghana 100 100 Charger Minerals Singapore Pte Ltd Singapore 100 100 Lithium of Africa Singapore Pte Ltd Singapore 100 100 IronRidge Singapore Pte Ltd Singapore 100 100 Moda Minerals Singapore Pte Ltd Singapore 100 100 NOTES TO THE FINANCIAL STATEMENTS For the year ended 30 June 2023

70Atlantic Lithium Limited Annual Report 2023 6.2 Parent Information a) Statement of Financial Performance 2023 $ 2022 $ Assets Current assets 16,953,176 25,652,089 Non-current assets 16,179,648 10,954,232 Total assets 33,132,824 36,606,321 Liabilities Current liabilities 4,119,725 2,394,873 Non-current liabilities 61,856 43,341 Total liabilities 4,181,581 2,438,214 Net Assets 28,951,243 34,168,107 Issued capital 129,873,021 126,468,060 Share based payment reserve 29,289,734 25,745,706 Financial assets revaluation reserve 184,319 511,575 Demerger Reserve (28,921,942) (28,794,153) Accumulated losses (101,473,889) (89,763,081) Total equity 28,951,243 34,168,107 b) Statement of Profit of Loss and Comprehensive Income 2023 $ 2022 $ Loss for the year (11,710,808) (36,259,124) Other comprehensive income (327,256) 209,760 Total comprehensive loss (12,038,064) (36,049,364) c) Guarantees, contingent liabilities and capital commitments The parent entity has not guaranteed any debts of subsidiaries in the current or prior financial year. The parent entity has no capital commitments as at 30 June 2023 (2022: nil). The contingent liabilities of the parent entity are the same as those of the group as disclosed in Note 7.2. 6.3 Demerger of Ricca Resources Limited (Ricca) On 24 December 2021, the Group completed the demerger of Ricca (and accordingly the Gold Business in Ivory Coast and Chad), by way of a capital reduction and in-specie distribution to eligible Atlantic Lithium shareholders. Eligible shareholders received an in- specie distribution of 1 Ricca share for every 8 Atlantic shares. The demerger distribution is accounted for as a reduction in equity by the recognition of a demerger reserve of ($28,921,942). NOTES TO THE FINANCIAL STATEMENTS For the year ended 30 June 2023 Atlantic Lithium Limited Annual Report 202371 6.3 Demerger of Ricca Resources Limited (Ricca) (continued) The fair values of assets and liabilities distributed to shareholders were: $ Cash and Equivalents 7,238,862 Other Current Assets 21,132 Property Plant and Equipment 54,916 Exploration and Evaluation Assets 37,910,194 Total Assets 45,225,104 Trade and Other Payables (75,152) Carrying value of net assets distributed 45,149,952 Write down on Demerger (16,228,010) Demerger Reserve 28,921,942 NOTE: The Fair value of net assets distributed increased by $127,789 compared to what was reported in the 2022 financial statements. This was due to an adjustment of Loans owing by Ivory Coast and Chad (on demerger date) written off in 2023 financial statements. 6.4 Related Party Transactions As disclosed in Note 3.4, the Company has a Funding Agreement with a major shareholder, Piedmont Lithium Inc. Amounts received from Piedmont during the year are disclosed in Note 3.4 and the amount receivable as at year end is disclosed in Note 3.1. The following table provides details of transactions with related parties during the current and prior financial year: Related party Services provided and reimbursed $ Services received and expensed $ Directors fees expensed $ Assore Limited (i) 2023 - - 120,000 2022 - - 120,000 Sumitomo Corporation (i) 2023 - - - 2022 - - 49,450 Ricca Resources Limited (ii) 2023 206,585 60,101 - 2022 94,330 - - (i) The Company has commercial agreements in place with major shareholders for the services of Non-Executive Directors (NEDs). Assore Limited has provided two NEDs in the current and prior financial year (Kieran Daly and Christelle Van der Merwe) and Sumitomo Corporation provided one NED until 27 April 2022 (Tetsunosuke Miyawaki). The Group pays a monthly fee for these services and the fees have been included in the directors remuneration report under the individual representatives of each shareholder (ii) During the prior financial year the Group completed the demerger of Ricca. Further details of the demerger are contained in Note 6.3. The Company recharges Ricca for certain services provided by the Company including exploration staff, premises, IT and insurance. Ricca recharges the Company for marketing staff. The following amounts were outstanding with related parties at the reporting date. Amounts Owed to Related Parties (i) Amounts Owed by Related Parties (ii) 2023 $ 2022 $ 2023 $ 2022 $ Assore Limited 60,000 885,714 - - Sumitomo Corporation - 4,451 - - Ricca Resources - - 167,406 152,227 (i) Disclosed within trade and other payables in Note 3.5. (ii) Disclosed within other receivables in Note 3.1. All outstanding balances are unsecured, interest free and will be settled in cash. NOTES TO THE FINANCIAL STATEMENTS For the year ended 30 June 2023

Atlantic Lithium Limited Annual Report 2023 72 7. OTHER 7.1 Contingent Liabilities 1. The Group owns 5,500,000 shares in Australasian Metals Limited with a market value on 30 June 2023 of $632,500 (30 June 2022: $1,100,000). Should the company decide to dispose all or any of this investment, then 50% of the consideration will be payable to Ricca Resources Limited within 10 days of the disposal. 2. The Group has an investment of 1,000,000 in the ordinary issued capital of Auburn Resources Ltd, an unlisted public company incorporated in Australia. The valuation of $125,000 on 30 June 2023 (30 June 2022: $125,000) is based on share capital placement on 1 July 2021. Should the company decide to dispose all or any of this investment, then 50% of the consideration will be payable to Ricca Resources Limited within 10 days of the disposal. The Directors are not aware of any other contingent assets or contingent liabilities at the date of this report. 7.2 Subsequent Events On 17 August 2023, Piedmont Lithium Inc notified Atlantic Lithium of its intent to support the development of the Ewoyaa Lithium Project in Ghana towards production and exercised its option to acquire an initial 22.5% interest in the Cape Coast Lithium Portfolio to fast- track the development of the Project. On 18 August 2023, 23 million options lapsed and were not exercised. Details are as follows: • 1 million unlisted options exercisable at £0.30 each • 10 million unlisted options exercisable at £0.40 each • 12 million unlisted options exercisable at £0.50 each On 18 August 2023, 2.7 million unlisted performance rights lapsed. On 22 August 2023, 3 million ordinary shares were issued to Melisa Kolff van Oosterwiik, a personal related party of Lennard Kolff, as a result of the exercise of unlisted ESOP options exercisable at £0.30 each. A one year loan was provided on the exercise of the options for the total exercise value of £900,000. As the loan is limited in recourse, it will be accounted for as an in-substance option. On 30 August 2023, 4.65 million options were granted to employees under the ESOP. The options vested immediately and have an exercise price of £0.30 each and an expiry date of 31 August 2025. On 7 September 2023, Atlantic agreed non-binding Heads of Terms with the Minerals Income Investment Fund of Ghana (“MIIF”) to invest a total of US$32.9 million in the Company and the Ghana subsidiaries. The proposed investment will support the development of the Project and the broader Cape Coast Lithium Portfolio in Ghana. Under the terms of the non-binding agreement, MIIF intend to invest an initial $US27.9 million to acquire a 6% contributing interest in the Company’s Ghana portfolio and will make ongoing contributions through monthly cash calls as the Project develops. MIIF also intend to subscribe for 19,245,574 shares in the Company for a total value of US$5 million. On 11 September 2023, 6 million options held by the former non-executive director Stuart Crow lapsed and were not exercised. Details are as follows: • 1 million unlisted options exercisable at £0.60 each • 2 million unlisted options exercisable at £0.70 each • 2 million unlisted options exercisable at £0.75 each • 1 million unlisted options exercisable at £0.80 each NOTES TO THE FINANCIAL STATEMENTS For the year ended 30 June 2023
EX-99.4
28
ex994sayonafinancials.htm
EX-99.4
ex994sayonafinancials

SAYONA MINING LIMITED AND CONTROLLED ENTITIES ABN 26 091 951 978 FINANCIAL REPORT FOR THE YEAR ENDED 30 JUNE 2023

Consolidated Statement of Profit or Loss for the year ended 30 June 2023 1 Note 2023 $’000 2022 $’000 Restated * Revenue 5 - - Other income 5 1,695 102,103 Expenses 6 (25,794) (22,150) Profit/(loss) from operations (24,099) 79,953 Financial income 20 16,327 111 Financial expenses 20 (1,506) (3,037) Net financial income/(expense) 20 14,821 (2,926) Profit/(loss) before income tax (9,278) 77,027 Income tax expense 7 (3,649) (3,207) Profit/(loss) after income tax (12,927) 73,820 Attributable to: Equity holders of Sayona Mining Limited (13,626) 51,459 Non-controlling interests 699 22,361 Earnings per share Basic earnings per share (cents) 8 (0.16) 0.76 Diluted earnings per share (cents) 8 (0.16) 0.71 * Refer to Note 33 for details on restatement of prior period comparatives. The accompanying notes form part of the consolidated financial statements. Consolidated Statement of Comprehensive Income for the year ended 30 June 2023 Note 2023 $’000 2022 $’000 Restated * Profit/(loss) after income tax (12,927) 73,820 Other comprehensive income/(loss) Items that may be reclassified to the Consolidated Statement of Profit or Loss: Foreign exchange rate differences on translation of foreign operations (4,408) 13,797 Total items that may be reclassified to the Consolidated Statement of Profit or Loss (4,408) 13,797 Items that will not be reclassified to the Consolidated Statement of Profit or Loss: Fair value losses on financial assets at fair value through other comprehensive income, net of tax 24 (1,544) - Total items that will not be reclassified to the Consolidated Statement of Profit or Loss (1,544) - Total other comprehensive income/(loss) (5,952) 13,797 Total comprehensive income/(loss) (18,879) 87,617 Attributable to: Equity holders of Sayona Mining Limited (18,632) 63,008 Non-controlling interests (247) 24,609 * Refer to Note 33 for details on restatement of prior period comparatives. The accompanying notes form part of the consolidated financial statements.

Consolidated Statement of Financial Position as at 30 June 2023 2 Note 2023 $’000 2022 $’000 Restated * ASSETS Current assets Cash and cash equivalents 17 211,119 184,559 Trade and other receivables 9 19,298 9,681 Inventories 10 48,664 - Current tax assets 1,557 - Other assets 11 33,919 13,700 Total current assets 314,557 207,940 Non-current assets Other financial assets 21 12,943 - Property, plant and equipment 12 682,073 453,036 Intangible assets 13 - 185 Total non-current assets 695,016 453,221 Total assets 1,009,573 661,161 LIABILITIES Current liabilities Trade and other payables 14 29,497 23,981 Interest bearing liabilities 18 1,944 10 Provisions 16 846 324 Total current liabilities 32,287 24,315 Non-current liabilities Interest bearing liabilities 18 29,270 23,462 Other liabilities 15 13,956 11,504 Deferred tax liabilities 7 13,983 10,174 Provisions 16 35,254 31,085 Total non-current liabilities 92,463 76,225 Total liabilities 124,750 100,540 Net assets 884,823 560,621 EQUITY Share capital 23 770,700 504,255 Reserves 24 12,773 13,551 Accumulated losses (27,316) (13,782) Total equity attributable to equity holders of Sayona Mining Limited 756,157 504,024 Non-controlling interests 128,666 56,597 Total equity 884,823 560,621 * Refer to Note 33 for details on restatement of prior period comparatives. The accompanying notes form part of the consolidated financial statements.

Consolidated Statement of Changes in Equity for the year ended 30 June 2023 3 Attributable to equity holders of Sayona Mining Limited Note Share capital $’000 Reserves $’000 Accumulated losses $’000 Total $’000 Non- controlling interests $’000 Total equity $’000 Balance as at 1 July 2022 504,255 13,551 (13,782) 504,024 56,597 560,621 Profit/(loss) after income tax - - (13,626) (13,626) 699 (12,927) Other comprehensive loss - (5,006) - (5,006) (946) (5,952) Total comprehensive loss - (5,006) (13,626) (18,632) (247) (18,879) Transactions with owners: Shares issued 23 276,404 - - 276,404 72,316 348,720 Transaction costs 23 (9,959) - - (9,959) - (9,959) Share based payments - 4,320 - 4,320 - 4,320 Transfers and other movements 24 - (92) 92 - - - Balance as at 30 June 2023 770,700 12,773 (27,316) 756,157 128,666 884,823 Restated * Balance as at 1 July 2021 128,728 304 (67,643) 61,389 6,497 67,886 Profit/(loss) after income tax - - 51,459 51,459 22,361 73,820 Other comprehensive income - 11,549 - 11,549 2,248 13,797 Total comprehensive income - 11,549 51,459 63,008 24,609 87,617 Transactions with owners: Shares issued 23 392,475 - - 392,475 26,551 419,026 Transaction costs 23 (16,948) - - (16,948) - (16,948) Share based payments - 3,040 - 3,040 - 3,040 Transfers and other movements 24 - (1,342) 2,402 1,060 (1,060) - Balance as at 30 June 2022 504,255 13,551 (13,782) 504,024 56,597 560,621 * Refer to Note 33 for details on restatement of prior period comparatives. The accompanying notes form part of the consolidated financial statements.

Consolidated Statement of Cash Flows for the year ended 30 June 2023 4 Note 2023 $’000 2022 $’000 Operating activities Profit/(loss) before income tax (9,278) 77,027 Adjustments for: Depreciation and amortisation expense 6,162 50 Gain on acquisition of North American Lithium - (101,716) Net financial income and expenses (14,830) 2,926 Share based payments 4,281 5,919 Changes in assets and liabilities: Trade and other receivables (12,287) 732 Inventories (47,603) - Other assets (19,626) (13,656) Trade and other payables 4,466 3,256 Provisions and other liabilities 19,747 11,711 Cash generated from operations (68,968) (13,751) Interest received 2,817 111 Interest paid (329) (1) Net cash flows from operating activities (66,480) (13,641) Investing activities Acquisition of subsidiaries and joint operations, net of cash acquired - (221,926) Exploration expenditure (66,274) (10,160) Purchases of property, plant and equipment (127,088) (21,865) Investments in financial assets (14,431) - Cash outflows from investing activities (207,793) (253,951) Proceeds from sale of property, plant and equipment 63 - Net cash flows from investing activities (207,730) (253,951) Financing activities Proceeds from associated entities 77,806 16,511 Proceeds from interest bearing liabilities 110 - Repayment of interest bearing liabilities (776) (43) Proceeds from issue of shares and exercise of options 231,870 423,876 Transaction costs associated with share issues (9,959) (15,578) Net cash flows from financing activities 299,051 424,766 Net increase in cash and cash equivalents 24,841 157,174 Cash and cash equivalents at the beginning of the financial year 184,559 35,503 Foreign exchange rate differences on cash and cash equivalents 1,719 (8,118) Cash and cash equivalents at the end of the financial year 17 211,119 184,559 The accompanying notes form part of the consolidated financial statements.

Notes to the Financial Statements 5 These consolidated financial statements and notes represent those of Sayona Mining Limited ("the Company") and its controlled entities (the “Consolidated Group” or “Group”). Where an accounting policy, critical accounting estimate, assumption or judgement is specific to a note, these are described within the note to which they relate. These policies have been consistently applied to all periods presented, except as described in Note 3. The consolidated financial statements of the Group for the year ended 30 June 2023 were authorised for issue in accordance with a resolution of the Directors on 29 September 2023. 1. Reporting Entity Sayona Mining Limited is a for-profit company limited by shares incorporated and domiciled in Australia with a primary listing on the Australian Securities Exchange (ASX) and a secondary listing on the OTCQB Venture Market in the United States (OTCQB). The principal activities of the Group during the year were lithium mining and processing at North American Lithium and ongoing identification, evaluation and development of its portfolio of mineral exploration assets in Australia and Canada, predominantly focusing on lithium. During the year, the Group completed the refurbishment, upgrade and restart of operations at North American Lithium in conjunction with its strategic partner, Piedmont Lithium Québec Holdings Inc. The restart of operations was completed on time, culminating in first spodumene concentrate production in March 2023 as part of the commissioning process. The first shipment of 19,200 dry metric tonnes of concentrate took place in August 2023. There were no other significant changes in the Group’s principal activities during the year. The separate financial statements of the parent entity, Sayona Mining Limited, have been presented in Note 32 of this financial report as required by the Corporations Act 2001. 2. Basis of Preparation The consolidated financial statements are general purpose financial statements which have been prepared in accordance with the requirements of the Corporations Act 2001, Australian Accounting Standards and other authoritative pronouncements of the Australian Accounting Standards Board (AASB), International Financial Reporting Standards (IFRS) and other authoritative pronouncements of the International Accounting Standards Board (IASB). The financial statements have been prepared on a going concern basis as management has assessed that the Group will be able to meet its obligations as and when they fall due and there is no significant uncertainty over the Group’s ability to continue as a going concern for the twelve months from the date of this report. The consolidated financial statements have been prepared on a historical cost basis, except for certain financial assets and liabilities (including derivative financial instruments) which are required to be measured at fair value. All amounts are presented in Australian dollars, with values rounded to the nearest thousand in accordance with ASIC Corporations Instrument 2016/191, unless otherwise stated. Where required by Accounting Standards, comparative figures have been reclassified for consistency with changes in presentation for the current financial year. (a) Principles of consolidation The consolidated financial statements comprise the financial statements of the Group. A list of controlled entities (subsidiaries) at year end is provided in Note 25. Intercompany transactions, balances and unrealised gains or losses on transactions between Group entities are fully eliminated on consolidation. Subsidiaries are consolidated from the date on which control is obtained to the date on which control is ceased. (b) Critical accounting estimates and judgements The preparation of the consolidated financial statements require management to apply accounting policies and methodologies based on complex and subjective judgements and estimates. Estimates assume a reasonable expectation of future events and are based on historical experience and assumptions as well as current trends and economic data, obtained both externally and within the Group. The use of these estimates, assumptions and judgements affects the amounts reported in the consolidated financial statements. The areas involving a higher degree of judgement or complexity, or where assumptions and estimates are significant to the financial statements, are disclosed in the following notes: Note 5 Revenue and Other Income 7 Tax 10 Inventories 12 Property, Plant and Equipment 16 Provisions (c) Foreign currency translation The Group’s consolidated financial statements are presented in Australian dollars, which has been assessed by management as the functional currency of the Group. Management will reassess the Group’s functional currency if there are any changes which impact the primary economic environment of the Group. Transactions denominated in foreign currencies are initially translated into Australian dollars using the exchange rate on the date of the underlying transaction. Monetary assets and liabilities denominated in foreign currencies are translated using the exchange rate at the end of the reporting period. Exchange gains or losses on settlement or translation of monetary items are included in the Consolidated Statement of Profit or Loss, except for foreign exchange differences resulting from translation of foreign operations, which are initially recognised in the Consolidated Statement of Other Comprehensive Income and subsequently transferred to the Consolidated Statement of Profit or Loss on disposal of the foreign operation. Non-monetary items measured on a historical cost basis in a foreign currency are translated into Australian dollars using the exchange rate on the date of the underlying transaction. Non-monetary items measured at fair value in a foreign currency are translated using the exchange rate on the date when the fair value is determined. Exchange gains or losses on translation of non-monetary items measured at fair value are recognised in the same manner as gains or losses on change in fair value of the non-monetary item.

Notes to the Financial Statements 6 (d) Goods and Services Tax (GST) and Québec Sales Tax (QST) Revenues, expenses and assets are recognised net of the amount of GST/QST, except where the amount of GST/QST incurred is not recoverable from the taxation authority. Receivables and payables are stated inclusive of the amount of GST/QST receivable or payable. The net amount of GST/QST recoverable from, or payable to, the taxation authority is included with other receivables or payables in the Consolidated Statement of Financial Position. Cash flows are presented on a gross basis. The GST/QST components of cash flows arising from investing or financing activities are presented as operating cash flows. 3. New Standards and Interpretations (a) New accounting standards and interpretations effective from 1 July 2022 The following new accounting standards and interpretations have been published and are effective for the year ended 30 June 2023: AASB 2020-3: Annual Improvements to IFRS Standards 2018– 2020 and Other Amendments This standard amends: a) the application of AASB 1 by a subsidiary that becomes a first-time adopter after its parent in relation to the measurement of cumulative translation differences; b) AASB 3 to update references to the Conceptual Framework for Financial Reporting; c) AASB 9 to clarify when the terms of a new or modified financial liability are substantially different from the terms of the original financial liability; d) AASB 116 to require an entity to recognise the sales proceeds from selling items produced while preparing property, plant and equipment for its intended use and the related cost in profit or loss, instead of deducting the amounts received from the cost of the asset; e) AASB 137 to specify the costs that an entity includes when assessing whether a contract will be loss-making; and f) the fair value measurement requirements in AASB 141 to align with those in other Australian Accounting Standards. The Group has reviewed these amendments and concluded that none of these changes are likely to have a material impact on the Group. (b) New accounting standards and interpretations issued but not yet effective The following new accounting standards and interpretations have been published but are not yet effective for the year ended 30 June 2023 and have not been early adopted by the Group: AASB 2020-1: Amendments to Australian Accounting Standards – Classification of Liabilities as Current or Non-Current Amends AASB 101 to clarify that liabilities are classified as either current or non-current, depending on the rights that exist at the end of the reporting period. Classification is unaffected by the expectations of the entity or events after the reporting date (for example, the receipt of a waiver, a breach of covenant, or settlement of a liability). AASB 2021-2: Amendments to Australian Accounting Standards – Disclosure of Accounting Policies and Definition of Accounting Estimates This Standard amends: a) AASB 7, to clarify that information about measurement bases for financial instruments is expected to be material to an entity’s financial statements; b) AASB 101, to require entities to disclose their material accounting policy information rather than their significant accounting policies; c) AASB 108, to clarify how entities should distinguish changes in accounting policies and changes in accounting estimates; d) AASB 134, to identify material accounting policy information as a component of a complete set of financial statements; and e) AASB Practice Statement 2, to provide guidance on how to apply the concept of materiality to accounting policy disclosures. AASB 2021-5: Amendments to Australian Accounting Standards – Deferred Tax related to Assets and Liabilities arising from a Single Transaction The amendment narrowed the scope of the recognition exemption in paragraphs 15 and 24 of AASB 112 (recognition exemption) so that it no longer applies to transactions that, on initial recognition, give rise to equal taxable and deductible temporary differences. The amendment applies to transactions that occur on or after the beginning of the earliest comparative period presented. The Group has reviewed these amendments and improvements and does not expect them to have a material impact on the Group. The Group does not intend to early adopt any of the new standards or interpretations. It is expected that where applicable, these standards and interpretations will be adopted on each respective effective date.

Notes to the Financial Statements 7 This section details the results and financial performance of the Group including profitability and earnings per share. 4. Segment Reporting (a) Identification of reportable segments The Group is an emerging lithium producer with operations in Australia and Canada. The principal activities of the Group during the year were lithium mining and processing at North American Lithium and ongoing identification, evaluation and development of its portfolio of mineral exploration assets in Australia and Canada, predominantly focusing on lithium. Management has determined the operating segments based on the reports that are used by the Board to make strategic decisions. Due to the geographically disparate nature of the operations, management examines the Group’s financial performance and activity from a geographical perspective. During the year, the reportable segments for the Group were segregated between Australian operations, Canadian operations and Corporate activities. The principal activities of each reportable segment are summarised as follows: Reportable segment Principal activities Australian operations Operations located in Western Australia, Australia Graphite projects Exploration site for graphite in the East Kimberley region Lithium and gold projects Exploration of lithium and gold tenements in the Pilbara and Yilgarn regions Canadian operations Operations located in Québec, Canada Abitibi-Témiscamingue Hub North American Lithium (NAL) Lithium mining and processing Authier Lithium Project Hard rock lithium deposit Tansim Lithium Project Exploration site for lithium, tantalum and beryllium Vallée Lithium Project Earn-in claims located adjacent to NAL Eeyou Istchee James Bay Hub Lac Albert Lithium Project Exploration site for lithium pegmatite occurrences Moblan Lithium Project Drilling deposit host to high-grade spodumene mineralisation Troilus Claims Wholly-owned claims located adjacent to the Moblan Lithium Project Corporate Corporate activities not directly related to operations Financial Performance

Notes to the Financial Statements 8 4. Segment Reporting (continued) (b) Segment results Segment performance is measured by EBIT and EBITDA. EBIT is profit before net financial income and expenses, tax and other earnings adjustment items including impairments. EBITDA is EBIT before depreciation and amortisation expense. Year ended 30 June 2023 Australian operations $’000 Canadian operations $’000 Corporate $’000 Group eliminations $’000 Total $’000 Revenue - - - - - Other income - 1,695 - - 1,695 Total revenue and other income - 1,695 - - 1,695 EBITDA (247) (9,076) (8,614) - (17,937) Depreciation and amortisation expense - (6,097) (65) - (6,162) EBIT (247) (15,173) (8,679) - (24,099) Net financial income/(expense) - (946) 15,767 - 14,821 Profit/(loss) before income tax (247) (16,119) 7,088 - (9,278) Income tax expense - (3,649) - - (3,649) Profit/(loss) after income tax (247) (19,768) 7,088 - (12,927) Exploration expenditure 593 91,773 - - 92,366 Capital expenditure (1) 5 152,989 40 - 153,034 Total assets 3,750 839,539 805,945 (639,661) 1,009,573 Total liabilities 17 112,706 9,804 2,223 124,750 (1) Capital expenditure excludes capitalised exploration expenditure. Year ended 30 June 2022 Restated * Australian operations $’000 Canadian operations $’000 Corporate $’000 Group eliminations $’000 Total $’000 Revenue - - - - - Other income - 102,061 42 - 102,103 Total revenue and other income - 102,061 42 - 102,103 EBITDA (142) 88,523 (8,378) - 80,003 Depreciation and amortisation expense - (9) (41) - (50) EBIT (142) 88,514 (8,419) - 79,953 Net financial income/(expense) - (1,283) (1,643) - (2,926) Profit/(loss) before income tax (142) 87,231 (10,062) - 77,027 Income tax expense - (3,207) - - (3,207) Profit/(loss) after income tax (142) 84,024 (10,062) - 73,820 Exploration expenditure 1,039 9,276 - - 10,315 Capital expenditure (1) - 22,248 - - 22,248 Total assets 3,153 486,836 431,982 (260,810) 661,161 Total liabilities 28 148,070 1,487 (49,045) 100,540 * Refer to Note 33 for details on restatement of prior period comparatives. (1) Capital expenditure excludes capitalised exploration expenditure. Inter-segment transactions Inter-segment transactions are made on a commercial basis. All such transactions are eliminated on consolidation of the Group's financial statements. There were no transfers between segments reflected in the revenues, expenses or results above. Segment assets Where an asset is used across multiple segments, the asset is allocated to the segment that receives the majority of the economic value from the asset. In most instances, segment assets are clearly identifiable on the basis of their nature and physical location. Segment liabilities Liabilities are allocated to segments where there is a direct nexus between the incurrence of the liability and the operations of the segment.

Notes to the Financial Statements 9 5. Revenue and Other Income 2023 $’000 2022 $’000 Restated * Revenue Revenue from contracts with customers - - Total revenue - - Other income Gain on acquisition of North American Lithium - 101,716 Government grants and incentives 598 42 Other income 1,097 345 Total other income 1,695 102,103 Total revenue and other income 1,695 102,103 * Refer to Note 33 for details on restatement of prior period comparatives. Recognition and measurement Revenue is recognised on an accrual basis and is measured at the fair value of the consideration received or receivable. The Group recognises revenue when the amount of revenue can be reliably measured and it is probable that future economic benefits will flow to the Group. All revenue is stated net of the amount of goods and services tax and sales tax. Government grants and incentives Government grants and incentives are recognised at fair value where there is reasonable assurance that the grants and incentives will be received and the Group will comply with all relevant conditions. Key judgements and estimates Gain on acquisition of North American Lithium On 27 August 2021, the Group acquired 100% of the issued capital of North American Lithium Inc. (NAL), a known lithium reserve and former producer of spodumene concentrate, for a purchase consideration of $128.6 million. The acquisition was part of the Group’s strategy to integrate NAL’s assets with its nearby Authier Lithium Project and expand its lithium reserves and processing operations in the Abitibi- Témiscamingue region. The gain arising on acquisition of NAL was determined using a discounted cash flow model and required significant input by management, subject to judgements and estimates. The fair value of NAL’s identifiable assets and liabilities was based on life-of-mine plans. Expected future cash flows were based on estimates of future production and commodity prices, operating costs, and forecast capital expenditures using the life-of-mine plan at the date of acquisition. A replacement-cost approach was used to determine the fair value of other property, plant and equipment. Market uncertainties, historical transactions and future economic expectations were assessed by management and factored into the cash flow model. Estimates of significant expenditure required to restore operations to full commercial production stage were included. 6. Expenses 2023 $’000 2022 $’000 Acquisition and transaction costs - 1,489 Administration and corporate overheads 8,040 3,533 Changes in inventories of finished goods and work in progress (41,408) - Depreciation and amortisation expense 6,162 50 Employee benefits expense 18,928 9,885 External services 21,970 3,417 Raw materials and consumables used 5,060 857 Royalties paid and payable - 20 All other operating expenses 7,042 2,899 Total expenses 25,794 22,150

Notes to the Financial Statements 10 7. Tax (a) Income tax expense Income tax expense comprises current and deferred tax and is recognised in the Consolidated Statement of Profit or Loss, except to the extent that it relates to items recognised directly in the Consolidated Statement of Comprehensive Income. 2023 $’000 2022 $’000 Restated * Current income tax expense - - Deferred income tax expense 3,649 3,207 Total income tax expense 3,649 3,207 * Refer to Note 33 for details on restatement of prior period comparatives. Income tax expense charged to profit or loss is the tax payable on the current period’s taxable income or loss based on the applicable income tax rate for each jurisdiction adjusted by changes in deferred tax assets and liabilities attributable to temporary differences and to unused tax losses. Current and deferred tax expense is calculated using the tax rates enacted or substantively enacted at the end of the reporting period and includes any adjustment to tax payable in respect of previous years. Management periodically evaluates positions taken in tax returns with respect to situations in which applicable tax regulation is subject to interpretation and considers whether it is probable that a taxation authority will accept an uncertain tax treatment. The Group measures its tax balances based on the most likely amount or the expected value, depending on which method provides a better prediction of the resolution of the uncertainty. (b) Reconciliation of prima facie tax expense to income tax expense 2023 $’000 2022 $’000 Restated * Profit/(loss) before income tax (9,278) 77,027 Income tax on profit/(loss) before income tax calculated at 30% (2022: 25%) (2,783) 19,257 Adjust for tax effect of: Gain on acquisition of North American Lithium - (25,429) Mining tax 1,650 2,048 Non-deductible expenses 4,366 3,702 Other non-assessable income (4,820) (10) Tax losses and temporary differences not brought to account 5,236 3,639 Total income tax expense 3,649 3,207 * Refer to Note 33 for details on restatement of prior period comparatives. (c) Deferred tax balances 2023 $’000 2022 $’000 Restated * At the beginning of the financial year 10,174 - Additions through business combinations - 6,659 Charged to profit or loss 3,649 3,207 Charged to equity 160 308 At the end of the financial year 13,983 10,174 * Refer to Note 33 for details on restatement of prior period comparatives. Deferred tax is provided using the balance sheet liability method, providing for the tax effect of temporary differences between the tax bases of assets and liabilities and their carrying values in the consolidated financial statements. The tax effect of certain temporary differences is not recognised, principally with respect to: – temporary differences arising on the initial recognition of assets or liabilities (other than those arising in a business combination or manner that initially impacted accounting or taxable profit); and – initial recognition of goodwill. Deferred tax assets relating to temporary differences and unused tax losses are recognised only to the extent that it is probable that future taxable profits will be available against which the benefit of the deferred tax assets can be utilised. Deferred tax assets are reviewed at each balance sheet date and amended to the extent that it is no longer probable that the related tax benefit will be realised. Deferred tax assets and liabilities are offset when they relate to income taxes levied by the same tax authority and the Group has both the right and the intention to settle its current tax assets and liabilities on a net or simultaneous basis.

Notes to the Financial Statements 11 7. Tax (continued) (d) Movement in deferred tax balances The composition of the Group’s net deferred tax assets and liabilities recognised in the Consolidated Statement of Financial Position and deferred tax expense charged/(credited) to the Consolidated Statement of Profit or Loss is as follows: Deferred tax assets Deferred tax liabilities Net charge/(credit) 2023 $’000 2022 $’000 Restated * 2023 $’000 2022 $’000 Restated * 2023 $’000 2022 $’000 Restated * Temporary differences Deferred income 1,896 1,881 - - (15) (1,881) Property, plant and equipment 7,331 7,737 91,119 66,232 25,293 58,495 Provisions 13,321 13,238 - - (83) (13,238) Tax losses 52,856 31,198 - - (21,658) (31,198) Other 3,279 2,521 1,547 517 272 (2,004) Total 78,683 56,575 92,666 66,749 3,809 10,174 Set off temporary differences (78,683) (56,575) (78,683) (56,575) - - Total - - 13,983 10,174 3,809 10,174 * Refer to Note 33 for details on restatement of prior period comparatives. (e) Unrecognised deferred tax assets and liabilities The composition of the Group’s unrecognised deferred tax assets and liabilities is as follows: 2023 $’000 2022 $’000 Restated * Tax losses – capital 6,736 5,614 Tax losses – revenue 22,472 17,101 Temporary differences - 909 Total unrecognised deferred tax assets 29,208 23,624 * Refer to Note 33 for details on restatement of prior period comparatives. The Group has carry forward revenue losses of $287,902,521 (2022: $185,272,561) and capital losses of $22,454,683 (2022: $22,454,683). (f) Tax consolidation Sayona Mining Limited and its wholly owned Australian resident subsidiaries formed a tax consolidated group with effect from 1 July 2015 and is therefore taxed as a single entity from that date. Sayona Mining Limited is the head entity of the tax consolidated group. Income tax expense and deferred tax assets and liabilities arising from temporary differences of the members of the tax consolidated group are recognised in the separate financial statements of the members of the tax-consolidated group using the “separate taxpayer within group” approach by reference to the carrying values in the separate financial statements of each entity and the relevant tax values under tax consolidation. Current tax assets and liabilities and deferred tax assets arising from unused tax losses and relevant tax credits of the members of the tax-consolidated group are recognised by the Company (as head entity of the tax consolidated group). Tax funding arrangements are currently in place between entities in the tax consolidated group. Key judgements and estimates Deferred tax Judgement is required in assessing whether deferred tax assets and certain deferred tax liabilities are recognised in the Consolidated Statement of Financial Position. Deferred tax assets are recognised only where it is considered more likely than not that they will be recovered, which is dependent on the generation of sufficient future taxable profits. Assumptions about the generation of future taxable profits depend on management’s estimates of future cash flows. These depend on estimates of future production and sales volumes, commodity prices, reserves, operating costs, closure and rehabilitation costs, capital expenditure and other capital management transactions. Uncertain tax matters – Unused tax losses on acquisition Tax benefits acquired as part of a business combination, but not satisfying the criteria for separate recognition at that date, are recognised subsequently if new information about facts and circumstances arises. The adjustment is treated as a reduction to goodwill if it has occurred during the measurement period. If it occurs outside the recognition period, the adjustment is recognised in the Consolidated Statement of Profit or Loss.

Notes to the Financial Statements 12 8. Earnings per Share The following reflects the profit or loss and number of shares used in the basic and diluted earnings per share (EPS) computations: 2023 2022 Restated * Profit/(loss) attributable to equity holders of Sayona Mining Limited ($’000) (13,626) 51,459 Weighted average number of ordinary shares (‘000) Basic earnings per share denominator 8,695,396 6,794,836 Ordinary shares contingently issuable (1) - 407,180 Diluted earnings per share denominator 8,695,396 7,202,016 Earnings per share (cents) Basic (0.16) 0.76 Diluted (0.16) 0.71 * Refer to Note 33 for details on restatement of prior period comparatives. (1) The weighted average number of options contingently issuable into ordinary shares as at 30 June 2023 is 241.8 million. The inclusion of these contingently issuable ordinary shares would have the effect of reducing the loss per share. Accordingly, these potential ordinary shares have not been included in the determination of diluted earnings per share. Basic earnings per share Basic earnings per share amounts are calculated based on profit or loss attributable to equity holders of Sayona Mining Limited and the weighted average number of ordinary shares outstanding during the year. Diluted earnings per share Dilutive earnings per share amounts are calculated based on profit or loss attributable to equity holders of Sayona Mining Limited and the weighted average number of ordinary shares outstanding after adjustment for the effects of all dilutive potential ordinary shares.

Notes to the Financial Statements 13 This section details the assets used and liabilities incurred to generate the Group’s trading performance. Assets and liabilities relating to the Group’s financing activities are addressed in the Capital Structure and Financial Management section. 9. Trade and Other Receivables 2023 $’000 2022 $’000 Trade receivables 174 577 GST/QST receivable from taxation authorities 18,410 5,934 Other receivables from associated entities (1) - 3,156 Other receivables 714 14 Total trade and other receivables 19,298 9,681 Comprising: Current 19,298 9,681 Non-current - - (1) Amount relates to outstanding cash calls from Piedmont Lithium Québec Holdings Inc. Recognition and measurement Trade receivables are generally due within 30 days. Trade and other receivables are recognised initially at fair value and subsequently measured at amortised cost using the effective interest method, less an allowance for expected credit losses. The collectability of trade and other receivables is assessed continuously. Individual receivables which are deemed to be unrecoverable are written off by reducing the carrying value directly. At the reporting date, specific allowances are made for any expected credit losses based on a review of all outstanding amounts. 10. Inventories 2023 $’000 2022 $’000 Raw materials and consumables 6,333 - Work in progress 5,166 - Finished goods 37,165 - Total inventories 48,664 - Comprising: Current 48,664 - Non-current - - Recognition and measurement Inventories are valued at the lower of cost and net realisable value. Cost is determined primarily on the basis of average cost. For processed inventories, cost is derived on an absorption costing basis. Cost comprises the cost of purchasing raw materials and the cost of production, including attributable overheads. Net realisable value is calculated as the estimated proceeds of sale, less an estimate of all further costs required to the stage of completion and all applicable marketing, selling and distribution costs to be incurred. Raw materials and consumables Raw materials and consumables represent spares, consumables and other supplies yet to be utilised in the production process, except where the raw materials purchased are equivalent products to those that the Group produces and would otherwise classify as work in progress. Key judgements and estimates Carrying value of inventories The Group reviews the carrying value of inventories regularly to ensure that their cost does not exceed net realisable value. In determining net realisable value, various factors are taken into account including estimated future sales prices based on prevailing commodity prices at the reporting date, less estimated costs to complete production and bring the product to sale. Stockpiles are measured by estimating the movement in quantities at each stocking point, the amount of contained metal, and the estimated recovery percentage based on the expected processing method. Physical quantities are assessed primarily through surveys and assays. Estimates are periodically reassessed by the Group, taking into account technical analysis and historical performance. Operating Assets and Liabilities

Notes to the Financial Statements 14 11. Other Assets 2023 $’000 2022 $’000 Deposits 31,993 13,120 Prepayments 1,926 580 Total other assets 33,919 13,700 Comprising: Current 33,919 13,700 Non-current - - Deposits include cash deposits, term deposits held with financial institutions with a maturity of more than three months from reporting date, and funds held as security in favour of Ministere de I'Energie et des Ressources Naturelles (MERN) for mine closure and rehabilitation of North American Lithium. 12. Property, Plant and Equipment Year ended 30 June 2023 Land and buildings $’000 Plant and equipment $’000 Mine properties $’000 Capital works in progress $’000 Exploration and evaluation $’000 Total $’000 Cost At the beginning of the financial year 149 236,126 152,234 27,385 37,325 453,219 Additions 1,522 9,901 - 141,611 92,366 245,400 Disposals (124) (13,369) - - - (13,493) Transfers and other movements 4,668 89,535 77,892 (168,838) 267 3,524 At the end of the financial year 6,215 322,193 230,126 158 129,958 688,650 Accumulated depreciation At the beginning of the financial year (114) (69) - - - (183) Depreciation charge for the year (408) (4,860) (894) - - (6,162) Disposals 124 32 - - - 156 Transfers and other movements (8) (108) (272) - - (388) At the end of the financial year (406) (5,005) (1,166) - - (6,577) Net book value as at 30 June 2023 5,809 317,188 228,960 158 129,958 682,073 Year ended 30 June 2022 Land and buildings $’000 Plant and equipment $’000 Mine properties $’000 Capital works in progress $’000 Exploration and evaluation $’000 Total $’000 Cost At the beginning of the financial year 149 35 - - 25,553 25,737 Acquisition of subsidiaries (1) - 203,387 59,889 - 116,561 379,837 Additions - 1,021 - 21,227 10,315 32,563 Transfers and other movements - 31,683 92,345 6,158 (115,104) 15,082 At the end of the financial year 149 236,126 152,234 27,385 37,325 453,219 Accumulated depreciation At the beginning of the financial year (12) (11) - - - (23) Depreciation charge for the year (39) (11) - - - (50) Transfers and other movements (63) (47) - - - (110) At the end of the financial year (114) (69) - - - (183) Net book value as at 30 June 2022 35 236,057 152,234 27,385 37,325 453,036 (1) On 27 August 2021, the Group acquired 100% of the issued capital of North American Lithium Inc. (NAL). The amounts reported reflect the fair value of identifiable assets at the date of acquisition. Reclassification of asset categories within property, plant and equipment Mine properties, exploration and evaluation assets and right-of-use assets have been reclassified within property, plant and equipment, in line with changes to Group accounting policies in the current reporting period. This reclassification has been applied retrospectively to prior period comparatives.

Notes to the Financial Statements 15 12. Property, Plant and Equipment (continued) Recognition and measurement Property, plant and equipment is recorded at cost less accumulated depreciation and impairment charges. Cost is the fair value of consideration given to acquire the asset at the time of its acquisition or construction, and includes the direct cost of bringing the asset to the location and condition necessary for operation. Subsequent costs are included in the asset’s carrying value or recognised as a separate asset, as appropriate, only when it is probable that the future economic benefits associated with the item will flow to the Group and the cost of the item can be measured reliably. All other repairs and maintenance are recognised as expenses in profit or loss during the financial period in which they are incurred. An item of property, plant and equipment and any significant part initially recognised is derecognised upon disposal or when no future economic benefits are expected. Any gain or loss arising on derecognition of the asset is included in the Consolidated Statement of Profit or Loss when the asset is derecognised. (a) Mine properties Mine properties include: – capitalised development and production stripping costs; – mineral rights acquired. The initial cost of mine properties includes the purchase price or construction cost, any costs directly attributable to bringing the asset into operation, and borrowing costs (where relevant for qualifying assets). The purchase price or construction cost is the aggregate amount paid and the fair value of any other consideration given to acquire the asset. Mine properties also consist of the fair value attributable to mineral reserves and the portion of mineral resources considered to be probable of economic extraction at the date of acquisition. When a mine construction project moves into the production phase, the capitalisation of certain mine construction costs ceases, and costs are either regarded as part of the cost of inventory or expensed, except for costs which qualify for capitalisation. (i) Capitalised development and production stripping costs The process of removing overburden and other waste materials to access mineral deposits is known as stripping. Stripping is necessary to obtain access to mineral deposits and occurs throughout the life of an open-pit mine. Stripping is classified as either development stripping or production stripping. Development and production stripping costs are recognised as part of mine properties in property, plant and equipment. Development stripping costs are initial overburden removal costs incurred to obtain access to mineral deposits that will be commercially produced. These costs are capitalised when it is probable that future economic benefits in the form of access to mineral ores will flow to the Group and costs can be measured reliably. Stripping costs incurred during the development phase of a mine are usually capitalised as part of the depreciable cost of building, developing and constructing the mine. Production stripping costs are post initial overburden removal costs incurred during the normal course of production, which are usually incurred after the first saleable minerals have been extracted from the component of the ore body. Costs are capitalised where production stripping activity results in improved access to future ore and the following criteria are met: – the production stripping activity improves access to a specific component of the ore body and it is probable that economic benefits arising from the improved access to future ore production will be realised; – the component of the ore body for which access has been improved can be identified; and – costs associated with that component can be measured reliably. Production stripping costs are allocated between the inventory produced and the production stripping asset using a life-of-component waste-to- ore (or mineral contained) strip ratio. When the current strip ratio is greater than the estimated life-of-component ratio, a portion of the stripping costs are capitalised to the production stripping asset. (b) Capital works in progress Capital works in progress are measured at cost inclusive of associated on-costs and charges. Costs are only capitalised when it is probable that future economic benefits will flow to the Group and costs can be measured reliably. All assets included in capital works in progress are reclassified to other categories within property, plant and equipment when the asset is available and ready for use in the manner intended. (c) Right-of-use assets Right-of-use assets are presented within the respective categories of property, plant and equipment according to the nature of the underlying asset leased. Refer to Note 19 for details on the Group’s right-of-use assets and corresponding lease liabilities.

Notes to the Financial Statements 16 12. Property, Plant and Equipment (continued) (d) Exploration and evaluation expenditure Exploration and evaluation expenditure is capitalised where it is considered likely to be recoverable or where the activities have not reached a stage that permits a reasonable assessment of the existence of reserves. Exploration is defined as the search for potential mineralisation after the Group has obtained legal rights to explore in a specific area and includes topographical, geological, geochemical and geophysical studies and exploratory drilling, trenching and sampling. Evaluation is defined as the determination of the technical feasibility and commercial viability of a particular prospect. Activities conducted during the evaluation phase include determination of the volume, grade and quality of the deposit, examination and testing of extraction methods and metallurgical or treatment processes, surveys of transportation and infrastructure requirements, and market and finance studies. Recoverability of the carrying value of exploration assets is dependent on the successful exploration and development of projects, or alternatively, through the sale of the areas of interest. Exploration and evaluation expenditure incurred prior to the establishment of a commercially viable mineral deposit is expensed as incurred, except for initial payments for the right to explore (including lease acquisition costs). Accumulated costs in relation to an abandoned area are written off in full against profit or loss in the year in which the decision to abandon the area is made. (e) Impairment of assets At the end of each reporting period, the Group assesses whether there is any indication that an asset may be impaired. The assessment will include consideration of external and internal sources of information. If such an indication exists, the recoverable amount of the asset, being the higher of the asset’s fair value less costs to sell and value in use, is compared to the asset’s carrying value. Any excess of the asset’s carrying value over its recoverable amount is recognised immediately in profit or loss. Where it is not possible to estimate the recoverable amount of an individual asset, the Group estimates the recoverable amount of the cash generating unit to which the asset belongs. (f) Depreciation and amortisation The carrying values of property, plant and equipment are depreciated to their estimated residual values over the estimated useful lives of the specific assets concerned. Estimates of residual values and useful lives are reassessed annually and any change in estimate is considered in the determination of remaining depreciation charges. Depreciation commences on the date of commissioning. The major categories of property, plant and equipment are depreciated on a units of production or straight-line basis using the estimated lives indicated below. Where assets are dedicated to a mine or lease and are not readily transferable, the useful life of the asset is subject to the lesser of the asset’s useful life and the life of the mine or lease. Asset category Depreciation method Buildings 2 to 20 years straight-line Land Not applicable Mine properties (including mineral rights) Based on ore reserves on a units of production basis Plant and equipment 2 to 20 years straight-line Right-of-use assets Based on the shorter of the asset’s useful life or term of the lease (straight-line) Key judgements and estimates Judgement applied in determining ore reserves and mineral resources The Group estimates its ore reserves and mineral resources based on information compiled by Competent Persons in accordance with the Joint Ore Reserves Committee (JORC) code. Estimation requires assumptions about future commodity prices and demand, exchange rates, production costs, transport costs, mine closure and rehabilitation costs, recovery rates, discount rates and, in some instances, the renewal of mining licences. There are many uncertainties in the estimation process and assumptions that are valid at the time of estimation may change significantly when new information becomes available. New geological or economic data, or unforeseen operational issues, may change estimates of ore reserves and mineral resources. The Group uses judgment as to when to include mineral resources in accounting estimates. Useful economic lives of assets The determination of useful lives, residual values and depreciation methods is reviewed at each reporting period and involves estimates and assumptions. Any changes to useful lives or any other estimates or assumptions may impact prospective depreciation rates and asset carrying values. The Group applies judgement in determining the useful economic lives of assets and whether any indicators of impairment are present based on internal and external sources of information available. The table above summarises the depreciation methods and rates applied to major categories of property, plant and equipment.

Notes to the Financial Statements 17 13. Intangible Assets 2023 $’000 2022 $’000 Cost At the beginning of the financial year 186 186 Disposals (185) - At the end of the financial year 1 186 Accumulated amortisation At the beginning of the financial year (1) (1) At the end of the financial year (1) (1) Net book value at the end of the financial year - 185 Recognition and measurement The Group capitalises amounts paid for the acquisition of identifiable intangible assets where it is considered that future economic benefits will flow to the Group and the cost of the asset can be measured reliably. Intangible assets held by the Group are stated at acquisition cost, net of any related accumulated amortisation and impairment charges. (a) Goodwill Where the fair value of consideration paid for a business combination exceeds the fair value of the Group’s share of the identifiable net assets acquired, the difference is treated as purchased goodwill. Where the fair value of the Group’s share of the identifiable net assets acquired exceeds the fair value of consideration paid, the difference is recognised in the Consolidated Statement of Profit or Loss. Goodwill is not amortised; however, its carrying value is assessed annually against its recoverable amount. (b) Other intangible assets Amounts paid for the acquisition of identifiable intangible assets, such as software and licences, are capitalised at the fair value of consideration paid and are recorded at cost less accumulated amortisation and impairment charges. Identifiable intangible assets with a finite life are amortised on a straight-line basis over their expected useful life from when the asset is ready for use. 14. Trade and Other Payables 2023 $’000 2022 $’000 Trade payables 18,682 5,146 Other payables to associated entities (1) 681 17,059 Other payables 10,134 1,776 Total trade and other payables 29,497 23,981 Comprising: Current 29,497 23,981 Non-current - - (1) At 30 June 2022, Piedmont Lithium Québec Holdings Inc. had agreed to joint funding advances in relation to refurbishment activities at NAL. The outstanding amount has been treated as an equity loan, and represents Piedmont’s proportionate share of contributed cash advances to the joint venture. The prior year balance has been reclassified to share capital during the year. Recognition and measurement Trade and other payables represent the liabilities for goods and services received by the Group that remain unpaid at the end of the reporting period. The balance is recognised as a current liability with amounts normally paid within 30 days of recognition of the liability. Amounts are initially recognised at fair value, and subsequently measured at amortised cost. The carrying value of these trade and other payables is considered to approximate fair value due to the short-term nature of the payables. The Group’s obligations for short-term employee benefits are recognised in other payables.

Notes to the Financial Statements 18 15. Other Liabilities 2023 $’000 2022 $’000 Deferred income (1) 13,956 11,504 Total other liabilities 13,956 11,504 Comprising: Current - - Non-current 13,956 11,504 (1) As part of the Group’s acquisition of Moblan, a royalty agreement was entered into with Lithium Royalty Corp. (LRC). Under the terms of the agreement, royalties are payable to LRC based on tonnages produced from properties acquired as part of the Moblan Lithium Project. Royalties are based on either Gross Overriding Revenue (GOR) or Net Smelter Return (NSR), depending on the property. The Group amortises royalty advances based on tonnages produced and the contractual obligations set out in the agreement. 16. Provisions 2023 $’000 2022 $’000 Employee entitlements 846 324 Mine closure and rehabilitation 35,254 31,085 Total provisions 36,100 31,409 Comprising: Current 846 324 Non-current 35,254 31,085 The movement in provisions during the year is as follows: Year ended 30 June 2023 Employee entitlements $’000 Mine closure and rehabilitation $’000 Total $’000 At the beginning of the financial year 324 31,085 31,409 Charge/(credit) for the year to the Consolidated Statement of Profit or Loss: Underlying charge for the year 1,354 3,925 5,279 Released during the year (849) - (849) Foreign exchange rate differences 17 244 261 At the end of the financial year 846 35,254 36,100 Year ended 30 June 2022 Employee entitlements $’000 Mine closure and rehabilitation $’000 Total $’000 At the beginning of the financial year 117 - 117 Acquisition of subsidiaries (1) - 30,133 30,133 Charge/(credit) for the year to the Consolidated Statement of Profit or Loss: Underlying charge for the year 266 - 266 Released during the year (59) - (59) Foreign exchange rate differences - 952 952 At the end of the financial year 324 31,085 31,409 (1) On 27 August 2021, the Group acquired 100% of the issued capital of North American Lithium Inc. (NAL). The amount reported reflects the fair value of the provision for mine closure and rehabilitation at the date of acquisition.

Notes to the Financial Statements 19 16. Provisions (continued) Recognition and measurement Provisions are recognised when the Group has a legal or constructive obligation for which it is probable that an outflow of economic benefits will result, and that outflow can be reliably measured. Provisions are measured using the best estimate of the amounts required to settle the obligation at the end of the reporting period. (a) Employee entitlements Employee entitlements expected to be settled within twelve months are presented as current employee benefit obligations. Liabilities for salaries and wages, including non-monetary benefits, and annual leave are recognised in respect of employees’ services up to the end of the reporting period and are measured at the amounts expected to be paid when the liabilities are settled. The non-current provision for employee entitlements is recognised for employees’ annual leave and long service leave entitlements not expected to be settled wholly within twelve months after the end of the reporting period in which the employees render the related service. Other non-current employee benefits are measured at the present value of the expected future payments to be made to employees. Expected future payments incorporate anticipated future wage and salary levels, durations of service and employee departures and are discounted at rates determined by reference to market yields at the end of the reporting period that have maturity dates that approximate the terms of the obligations. Any remeasurements for changes in assumptions of obligations for other non-current employee benefits are recognised in profit or loss in the period in which the changes occur. (b) Mine closure and rehabilitation The mining and processing activities of the Group normally give rise to obligations for site closure or rehabilitation. Closure and rehabilitation works can include facility decommissioning and dismantling, removal or treatment of waste materials, and site and land rehabilitation in accordance with local laws and regulations and clauses of the permits. Closure and rehabilitation provisions are recognised at the time that environmental disturbance occurs. When the extent of disturbance increases over the life of an operation, the provision is increased accordingly. Costs included in the provision encompass all closure and rehabilitation activity expected to occur progressively over the life of the operation and at, or after, the time of closure, for disturbance existing at the reporting date. Routine operating costs that may impact the ultimate closure and rehabilitation activities, such as waste material handling conducted as an integral part of a mining or production process, are not included in the provision. Costs arising from unforeseen circumstances, such as the contamination caused by unplanned discharges, are recognised as an expense and liability when the event gives rise to an obligation which is probable and capable of reliable estimation. Closure and rehabilitation provisions are measured at the expected value of future cash flows, discounted to their present value and determined according to the probability of alternative estimates of cash flows occurring for each operation. When provisions for mine closure and rehabilitation are initially recognised, the corresponding cost is capitalised as an asset, representing part of the cost of acquiring the future economic benefits of the operation. The capitalised cost of closure and rehabilitation activities is recognised in property, plant and equipment and depreciated accordingly. Closure and rehabilitation provisions are also adjusted for changes in costs and estimates. Any adjustments are made prospectively and are accounted for as a change in the corresponding capitalised asset, except where a reduction in the provision is greater than the depreciated capitalised cost of the related assets, in which case the carrying value is reduced to nil and the remaining adjustment is recognised first against other items in property, plant and equipment, and subsequently to the Consolidated Statement of Profit or Loss. Adjustments to the estimated amount and timing of future closure and rehabilitation cash flows are a normal occurrence in light of the significant judgements and estimates involved. Key judgements and estimates Mine closure and rehabilitation provision on acquisition of North American Lithium The provision recognised at the date of acquisition represents the net present value of mine closure and rehabilitation costs that are expected to be incurred up to the time when the producing mine ceases operations. The provision is based on the Group’s internal estimates and modified by the Ministere de I'Energie et des Ressources Naturelles (MERN). A discount rate of 10% has been applied to reflect the inherent risk in the mining operation. Assumptions have been made based on the current economic environment, which management believe are a reasonable basis upon which to estimate the future liability. These estimates are reviewed regularly to take into account any material changes to the assumptions. Actual rehabilitation costs will ultimately depend on market conditions at the relevant time. The timing of closure and rehabilitation will most likely depend on when the mine ceases to produce at economically viable rates. Mine restoration costs are uncertain, and cost estimates can vary in response to many factors including estimates of the extent of rehabilitation activities, technological changes, regulatory changes, cost increases including inflationary impacts and changes in discount rates. The provision at reporting date represents management’s best estimate of the present value of future rehabilitation costs.

Notes to the Financial Statements 20 This section details the capital structure and related financing activities of the Group. 17. Cash and Cash Equivalents 2023 $’000 2022 $’000 Cash 106,458 184,509 Short-term deposits 104,661 50 Total cash and cash equivalents (1) 211,119 184,559 (1) Cash and cash equivalents include $54.7 million (2022: Nil) which is restricted by legal or contractual arrangements. Cash and cash equivalents include cash on hand, deposits available on demand with banks and other short term highly liquid investments with original maturities of three months or less. 18. Interest Bearing Liabilities 2023 $’000 2022 $’000 Lease liabilities (1) 6,253 10 Non-convertible redeemable cumulative preference shares 24,849 23,462 Other interest bearing liabilities 112 - Total interest bearing liabilities 31,214 23,472 Comprising: Current 1,944 10 Non-current 29,270 23,462 (1) Refer to Note 19 for further details on the Group’s leases. Recognition and measurement All borrowings are initially recognised at their fair value net of directly attributable transaction costs. Subsequent to initial recognition, interest bearing liabilities are measured at amortised cost using the effective interest method. Gains and losses are recognised in the Consolidated Statement of Profit or Loss when the liabilities are derecognised. Interest bearing liabilities are classified as current liabilities, except when the Group has an unconditional right to defer settlement for at least twelve months after the reporting date, in which case the liabilities are classified as non-current. A reconciliation of movements in interest bearing liabilities and other financial liabilities to cash flows arising from financing activities is set out in Note 22 (f). (a) Non-convertible redeemable cumulative preference shares On 27 August 2021, as part of the acquisition of North American Lithium, the Group exchanged Investissement Québec’s (IQ) second ranking debt of C$63 million for twenty million non-convertible redeemable cumulative preference shares held by NAL at a par value of C$1.00 per share. The shares may be redeemed at the option of NAL or at the option of IQ, subject to satisfaction of various performance hurdles. The terms of the preference shares are detailed below: – interest is accrued or paid at 5% per annum; – the shares cannot be converted to equity at any time; – preference shareholders are not entitled to dividends or to vote at shareholder meetings; – redemption commences in accordance with the NAL Constitution and Governance Agreement once the mine is in commercial operation and the redemption term is up to ten years after the first anniversary of the issue of these shares; and – in the event of default, liquidation, or receivership, IQ rank before the ordinary shareholders in priority. The preference shares are recorded at issue price plus accrued interest. Given the nature and conditions impacting on potential redemption terms, the fair value assigned to the preference shares is their face value. Capital Structure and Financial Management

Notes to the Financial Statements 21 19. Leases The nature of the Group’s leases predominantly relates to assets and equipment supporting the operations in line with the Group’s principal activities, as well as real estate in the form of office premises. Lease terms range from three to five years. Lease contracts are negotiated on an individual basis and contain a wide range of terms and conditions. (a) Amounts recognised in the Consolidated Statement of Financial Position The Consolidated Statement of Financial Position includes the following amounts relating to leases: 2023 $’000 2022 $’000 Right-of-use assets recognised in property, plant and equipment Land and buildings Cost 1,522 124 Accumulated depreciation (369) (114) Net book value 1,153 10 Plant and equipment Cost 5,387 - Accumulated depreciation (449) - Net book value 4,938 - Total right-of-use assets 6,091 10 Lease liabilities Land and buildings – current 349 10 Land and buildings – non-current 892 - Plant and equipment – current 1,595 - Plant and equipment – non-current 3,417 - Total lease liabilities 6,253 10 Right-of-use asset additions during the year were $6.9 million (2022: Nil). Lease liabilities have been measured at the present value of the remaining lease payments over the term of the lease. The present value has been determined using discount rates ranging between 4.50% and 10% (2022: 4.50%). (b) Amounts recognised in the Consolidated Statement of Profit or Loss The Consolidated Statement of Profit or Loss includes the following amounts relating to leases: 2023 $’000 2022 $’000 Depreciation of right-of-use assets 811 38 Interest on lease liabilities 148 1 Recognition and measurement At inception of a contract, the Group assesses whether a contract is, or contains, a lease. A contract is, or contains, a lease if the contract conveys the right to control the use of an identified asset for a period of time in exchange for consideration. All contracts that are classified as short-term leases (leases with a remaining lease term of twelve months or less) and leases of low value assets are recognised as an operating expense on a straight-line basis over the term of the lease. Right-of-use assets If a lease is present, a right-of-use asset and corresponding lease liability is recognised at the commencement date of the lease. The right-of-use asset is initially measured at cost, which comprises the initial amount of the lease liability adjusted for any lease payments made at or before the commencement date, plus any initial direct costs incurred and estimated future restoration costs, less any lease incentives received. The right-of- use asset is subsequently measured at cost less accumulated depreciation, impairment charges and any adjustments for remeasurement of the lease liability. Right-of-use assets are depreciated over the term of the lease or useful life of the underlying asset, whichever is the shortest. Where a lease transfers ownership of the underlying asset or the cost of the right-of-use asset indicates the Group is likely to exercise a purchase option, the specific asset is depreciated over the useful life of the underlying asset. Right-of-use assets are recognised in property, plant and equipment in the Consolidated Statement of Financial Position.

Notes to the Financial Statements 22 19. Leases (continued) Lease liabilities Lease liabilities are recognised within interest bearing liabilities in the Consolidated Statement of Financial Position. The lease liability is initially measured at the present value of the lease payments still to be paid at commencement date. Lease payments are discounted using the interest rate implicit in the lease or, if that rate cannot be readily determined, the lessee’s incremental borrowing rate. The lessee’s incremental borrowing rate is the rate of interest that a lessee would have to pay to borrow the funds necessary to obtain an asset of a similar value to the right-of-use asset in a similar economic environment and with similar terms, conditions and security. The lease liability is subsequently measured at amortised cost using the effective interest method. It is remeasured when there is a change in future lease payments arising from a change in rate or index, if there is a change in the Group’s estimate of the amount expected to be payable under a residual guarantee, or if the Group changes its assessment of whether it will exercise a purchase, extension or termination option. When the lease liability is remeasured, a corresponding adjustment is made to the carrying value of the right-of-use asset, or is recorded in the Consolidated Statement of Profit or Loss if the carrying value of the right-of-use asset has been reduced to nil. 20. Financial Income and Expenses 2023 $’000 2022 $’000 Financial income Interest on bank accounts 2,817 111 Net foreign exchange gains 13,510 - Total financial income 16,327 111 Financial expenses Interest on lease liabilities 148 1 Interest on preference shares 1,177 927 Net foreign exchange losses - 2,109 Other financial expenses 181 - Total financial expenses 1,506 3,037 Net financial income/(expense) 14,821 (2,926) 21. Other Financial Assets 2023 $’000 2022 $’000 Investments in listed entities Consolidated Lithium Metals Inc. (1) 2,296 - Troilus Gold Corporation (2) 10,647 - Total other financial assets 12,943 - Comprising: Current - - Non-current 12,943 - (1) On 14 November 2022, the Group acquired a 9.99% shareholding in Consolidated Lithium Metals Inc. (TSXV: CLM) for C$1.5 million through a private placement. The shares were acquired as part of the Group’s agreement with Consolidated Lithium Metals Inc. to acquire claims in the Vallée Lithium Project. (2) On 17 November 2022, the Group completed the acquisition of a 9.26% shareholding in Troilus Gold Corporation (TSXV: TLG) for C$10 million. The acquisition was completed in two tranches totalling 20.4 million shares at C$0.49 per share. The shares were acquired as part of the Group’s agreement with Troilus Gold Corporation to acquire claims near the Moblan Lithium Project. Recognition and measurement The Group has elected at initial recognition to classify equity investments as financial assets at fair value through other comprehensive income (FVOCI). The equity securities are not held for trading and are strategic investments for which the Group considers this classification to be more appropriate. Changes in fair value are accumulated in a separate reserve within equity. The cumulative amount is transferred to the Consolidated Statement of Profit or Loss on disposal of the relevant equity securities. The fair value of the Group’s financial assets at FVOCI is estimated based on quoted market prices at the reporting date and classified as Level 1 on the fair value hierarchy as detailed in Note 22 (e).

Notes to the Financial Statements 23 22. Financial Instruments and Risk Management The Group is exposed to market, liquidity and credit risk through its financial instruments, which comprise cash and cash equivalents, receivables, financial assets, other assets and liabilities, payables and interest bearing liabilities. The main purpose of these financial instruments is to fund the principal activities of the Group. The Board of the Company meets on a regular basis to analyse exposure and evaluate treasury management strategies in the context of the most recent economic conditions and forecasts. The Board has overall responsibility for the establishment and oversight of the Group's risk management framework. Management is responsible for developing and monitoring the risk management policies. (a) Market risk Market risk is the risk that the fair value of future cash flows of a financial instrument will fluctuate because of changes in market prices. Market risk comprises interest rate risk, foreign currency risk and other price risk, such as equity price risk and commodity price risk. The objective of market risk management is to manage market risk exposures to protect profitability and return on assets. (i) Interest rate risk The Group is exposed to interest rate risk on its cash and cash equivalents, other assets and interest bearing liabilities from the possibility that changes in interest rates will affect future cash flows or the fair value of financial instruments. The Group’s net exposure to interest rate risk at the reporting date is as follows: 2023 $’000 2022 $’000 Financial assets Cash and cash equivalents 211,119 184,559 Other assets 31,993 13,120 Net exposure 243,112 197,679 Sensitivity analysis The following table demonstrates the sensitivity to a 100 basis point change in interest rates, with all other variables remaining constant: Effect on profit after tax 2023 $’000 Effect on profit after tax 2022 $’000 +100 basis point change in interest rates 1,702 1,483 -100 basis point change in interest rates (1,702) (149) (ii) Foreign currency risk Foreign currency risk is the risk that the fair value or future cash flows of an exposure will fluctuate because of changes in foreign exchange rates. The Group operates internationally and is exposed to foreign currency risk arising from currency movements, primarily in respect of transactions and instruments in Canadian and United States (US) dollars. No derivative financial instruments are employed to mitigate the exposed risks. The Group's net exposure to foreign currency risk (in Australian dollars) at the reporting date is as follows: Canadian dollar risk exposure 2023 $’000 Canadian dollar risk exposure 2022 $’000 US dollar risk exposure 2023 $’000 US dollar risk exposure 2022 $’000 Financial assets Cash and cash equivalents 106,120 25,271 975 1,094 Trade and other receivables 19,927 10,530 - - Other assets 33,740 11,660 - - Financial liabilities Trade and other payables (24,147) (5,385) (2,300) - Interest bearing liabilities (30,923) (23,462) - - Other liabilities (1,946) (28,563) (12,009) - Net exposure 102,771 (9,949) (13,334) 1,094

Notes to the Financial Statements 24 22. Financial Instruments and Risk Management (continued) Sensitivity analysis Based on the Group’s net financial assets and liabilities as at 30 June, a weakening of the Australian dollar against these currencies as illustrated in the table below, with all other variables held constant, would have the following effect on the Group’s profit or loss after tax: Effect on profit after tax 2023 $’000 Effect on profit after tax 2022 $’000 5% movement in Canadian dollar 3,597 (373) 5% movement in United States dollar 467 41 (b) Liquidity risk Liquidity risk is the risk that the Group may not be able to settle or meet its obligations as they fall due. This risk is managed by ensuring, to the extent possible, that there is sufficient liquidity in place, without incurring unacceptable losses or risking damage to the Group's reputation. The Board manages liquidity risk by sourcing long-term funding, primarily through equity sources. Financial asset and financial liability maturity analysis The following table shows an undiscounted contractual maturity analysis for financial assets and financial liabilities and reflects management's expectations with respect to realisation of financial assets and financial liabilities and timing of termination: Year ended 30 June 2023 Weighted average interest rate % 1 year or less $’000 1 to 5 years $’000 More than 5 years $’000 Total $’000 Financial assets Cash and cash equivalents 2.68% 211,119 - - 211,119 Trade and other receivables - 19,298 - - 19,298 Other financial assets - - - 12,943 12,943 Other assets 2.69% 31,993 - - 31,993 Total financial assets 262,410 - 12,943 275,353 Financial liabilities Trade and other payables - 29,497 - - 29,497 Interest bearing liabilities 5.00% - 112 24,849 24,961 Lease liabilities 9.74% 1,944 4,309 - 6,253 Other liabilities - - - 13,956 13,956 Total financial liabilities 31,441 4,421 38,805 74,667 Net financial instruments 230,969 (4,421) (25,862) 200,686 Year ended 30 June 2022 Weighted average interest rate % 1 year or less $’000 1 to 5 years $’000 More than 5 years $’000 Total $’000 Financial assets Cash and cash equivalents 0.06% 184,559 - - 184,559 Trade and other receivables - 9,681 - - 9,681 Other assets 0.67% 13,120 - - 13,120 Total financial assets 207,360 - - 207,360 Financial liabilities Trade and other payables - 23,981 - - 23,981 Interest bearing liabilities 5.00% - - 23,462 23,462 Lease liabilities 4.50% 10 - - 10 Other liabilities - - - 11,504 11,504 Total financial liabilities 23,991 - 34,966 58,957 Net financial instruments 183,369 - (34,966) 148,403

Notes to the Financial Statements 25 22. Financial Instruments and Risk Management (continued) (c) Credit risk Credit risk refers to the risk that a counterparty will default on its contractual obligations resulting in a financial loss to the Group. Credit risk arises from exposures to deposits with financial institutions, trade and other receivables and deposits. Management monitors credit risk by actively assessing the rating quality and liquidity of counterparties. The Group's maximum exposure to credit risk at reporting date is $10.9 million (2022: $3.7 million). (d) Recognition and measurement Initial recognition and measurement Financial assets and financial liabilities are recognised when the Group becomes a party to the contractual provisions to the instrument. For financial assets, this is the date that the Group commits itself to either the purchase or sale of the asset (i.e. trade date accounting is adopted). Financial instruments are initially measured at fair value plus transaction costs, except where the instrument is classified at fair value through profit or loss, in which case transaction costs are expensed to profit or loss immediately. Subsequent measurement (i) Subsequent measurement of financial assets Financial assets are subsequently measured at amortised cost. Measurement is based on two primary criteria: – the contractual cash flow characteristics of the financial asset; and – the business model for managing the financial assets. A financial asset that meets the following conditions is subsequently measured at amortised cost: – the financial asset is managed solely to collect contractual cash flows; and – the contractual terms within the financial asset give rise to cash flows that are solely payments of principal and interest on the principal amount outstanding on specified dates. (ii) Subsequent measurement of financial liabilities Financial liabilities are subsequently measured at amortised cost using the effective interest method. The effective interest method is a method of calculating the amortised cost of a debt instrument and allocating interest expense in profit or loss over the relevant period. The effective interest rate is the internal rate of return of the financial asset or liability. That is, the rate that exactly discounts the estimated future cash flows through the expected life of the instrument to the net carrying value at initial recognition. Derecognition Derecognition refers to the removal of a previously recognised financial asset or financial liability from the Consolidated Statement of Financial Position. (i) Derecognition of financial assets A financial asset is derecognised when the holder's contractual rights to its cash flows expire, or the asset is transferred in such a way that all the risks and rewards of ownership are substantially transferred. All of the following criteria need to be satisfied for derecognition of a financial asset: – the right to receive cash flows from the asset has expired or been transferred; – all risk and rewards of ownership of the asset have been substantially transferred; and – the Group no longer controls the asset (i.e. the Group has no practical ability to make a unilateral decision to sell the asset to a third party). On derecognition of a financial asset measured at amortised cost, the difference between the asset's carrying value and the sum of the consideration received and receivable is recognised in profit or loss. (ii) Derecognition of financial liabilities A liability is derecognised when it is extinguished (i.e. when the obligation in the contract is discharged, cancelled or expires). An exchange of an existing financial liability for a new one with substantially modified terms, or a substantial modification to the terms of a financial liability is treated as an extinguishment of the existing liability and recognition of a new financial liability. The difference between the carrying value of the financial liability derecognised and the consideration paid and payable, including any non-cash assets transferred or liabilities assumed, is recognised in profit or loss.

Notes to the Financial Statements 26 22. Financial Instruments and Risk Management (continued) Impairment The Group recognises a loss allowance for expected credit losses, using the simplified approach under AASB 9, which requires the recognition of lifetime expected credit loss at all times. (e) Fair values The Group measures some of its assets and liabilities at fair value on either a recurring or non-recurring basis after initial recognition, depending on the requirements of the applicable Accounting Standard. The fair value of cash and cash equivalents and non-interest bearing financial assets and liabilities approximates their carrying value due to their short-term maturity. Fair value is the price the Group would receive to sell an asset or would pay to transfer a liability in an orderly (i.e. unforced) transaction between independent, knowledgeable and willing market participants at the measurement date. The aggregate fair values and carrying values of financial assets and liabilities are disclosed in the Consolidated Statement of Financial Position. Fair values are materially in line with carrying values. Fair value measurement The carrying value of financial assets and liabilities measured at fair value is principally calculated based on inputs other than quoted prices that are observable for these financial assets or liabilities, either directly (i.e. as unquoted prices) or indirectly (i.e. derived from prices). Where no price information is available from a quoted market source, alternative market mechanisms or recent comparable transactions, fair value is estimated based on the Group’s views on relevant future prices, net of valuation allowances to accommodate liquidity, modelling and other risks implicit in such estimates. The Group applies the following hierarchy for financial assets and liabilities carried at fair value: Fair value hierarchy Valuation inputs Level 1 Based on unadjusted quoted prices in active markets for identical financial assets and liabilities. Level 2 Based on inputs other than quoted prices included within Level 1 that are observable for the financial asset or liability, either directly (i.e. as unquoted prices) or indirectly (i.e. derived from prices). Level 3 Based on inputs not observable in the market using appropriate valuation models, including discounted cash flow modelling. Where the carrying value of financial assets and liabilities do not approximate their fair value, the fair value has been measured based on inputs in the hierarchy as follows: At 30 June 2023 Level 1 $’000 Level 2 $’000 Level 3 $’000 Total $’000 Financial assets at FVOCI 12,943 - - 12,943 Total 12,943 - - 12,943 The Group did not measure any financial assets or liabilities at fair value on a non-recurring basis as at 30 June 2023. There were no transfers between levels of the hierarchy during the year. (f) Changes in liabilities from financing activities The movement in the Group’s liabilities from financing activities during the year is as follows: Year ended 30 June 2023 Interest bearing liabilities $’000 Preference shares $’000 Lease liabilities $’000 Total $’000 At the beginning of the financial year - 23,462 10 23,472 Cash movements 110 - (776) (666) Non-cash movements 2 1,387 7,019 8,408 At the end of the financial year 112 24,849 6,253 31,214 Year ended 30 June 2022 At the beginning of the financial year - - 53 53 Cash movements - - (43) (43) Non-cash movements - 23,462 - 23,462 At the end of the financial year - 23,462 10 23,472

Notes to the Financial Statements 27 23. Share Capital Ordinary shares Ordinary shares are classified as equity. Transaction costs (net of tax, where the deduction can be utilised) arising on the issue of ordinary shares are recognised in equity as a reduction of the share proceeds received. Where share application monies have been received but the shares have not been issued, these monies are shown as a payable in the Consolidated Statement of Financial Position. The movement in fully paid ordinary shares during the year is as follows: 2023 No. shares 2022 No. shares 2023 $’000 2022 $’000 At the beginning of the financial year 8,246,752,670 5,153,695,375 504,255 128,728 Shares issued 1,792,385,354 3,093,057,295 276,404 392,475 Transaction costs associated with share issues - - (9,959) (16,948) At the end of the financial year 10,039,138,024 8,246,752,670 770,700 504,255 Ordinary shares participate in dividends and the proceeds on winding up of the parent entity in proportion to the number of shares held. At shareholders' meetings, each ordinary share is entitled to one vote when a poll is called, otherwise each shareholder has one vote on a show of hands. The Company does not have authorised capital or par value in respect of its issued shares. (a) Significant share issues during the year On 17 November 2022, the Group announced an agreement with Troilus Gold Corporation to acquire 1,824 claims located near the Moblan Lithium Project for a purchase consideration of $44.5 million. Pursuant to this agreement, the Group issued 184,331,797 fully paid ordinary shares to Troilus Gold Corporation to settle the transaction. On 24 November 2022, the Group issued 155 million shares to Acuity Capital to be held as collateral against the At-the-Market (ATM) facility, bringing the total security held by Acuity Capital to 250 million shares. Shares were issued following an agreement to increase the facility limit from $50 million to $200 million. These shares were issued at no cost and are similar to treasury shares. On 7 March 2023, the Group entered into a subscription agreement with PearTree Securities Inc. for the issuance of 174,459,177 fully paid ordinary shares at an issue price of $0.315 per share for aggregate gross proceeds of $54.9 million using the flow-through-share (FTS) provisions under Canadian tax law. The gross proceeds received by the Group will be used by 31 December 2024 to incur Canadian exploration expenses (CEE) that qualify as flow through critical mineral mining expenditures as defined in the Income Tax Act (Canada). On 5 June 2023, the Group completed the first tranche of a $200 million placement to institutional, professional and sophisticated investors, resulting in the issuance of 940,384,891 fully paid ordinary shares at an issue price of $0.18 per share for aggregate gross proceeds of $169.3 million. The second tranche totalling $30.7 million was completed on 19 July 2023. Options Options are classified as equity and issue proceeds are taken up in the share based payments reserve. Transaction costs (net of tax, where the deduction can be utilised) arising on the issue of options are recognised in equity as a reduction of the option proceeds received. The movement in options during the year is as follows: Listed options Unlisted options 2023 No. options 2022 No. options 2023 No. options 2022 No. options At the beginning of the financial year 308,290,518 474,857,645 42,000,000 8,000,000 Granted during the year - - 6,234,482 53,200,000 Exercised during the year (304,196,342) (166,567,127) (6,000,000) (19,200,000) Lapsed during the year (4,094,176) - - - At the end of the financial year - 308,290,518 42,234,482 42,000,000 Capital management policy The Group has been funded predominantly by equity up to the date of this report. Management controls the capital of the Group with the aim of generating long-term shareholder value and ensuring the Group can fund its operations and continue as a going concern. The Group’s capital is managed by assessing the Group’s financial risks and adjusting its capital structure in response to changes in these risks and market conditions. None of the Group’s entities are currently subject to externally imposed capital requirements. In addition, there were no changes in the Group’s approach to capital management during the year.

Notes to the Financial Statements 28 24. Reserves Year ended 30 June 2023 Financial asset reserve $’000 Foreign currency translation reserve $’000 Share based payments reserve $’000 Total $’000 At the beginning of the financial year - 11,789 1,762 13,551 Financial assets at fair value through other comprehensive income (1,544) - - (1,544) Foreign exchange differences on translation of foreign operations - (3,462) - (3,462) Share based payments - - 4,320 4,320 Transfers within equity to retained earnings - - (92) (92) At the end of the financial year (1,544) 8,327 5,990 12,773 Year ended 30 June 2022 Restated * At the beginning of the financial year - 195 109 304 Foreign exchange differences on translation of foreign operations - 11,549 - 11,549 Share based payments - - 3,040 3,040 Transfers and other movements - 45 (1,387) (1,342) At the end of the financial year - 11,789 1,762 13,551 * Refer to Note 33 for details on restatement of prior period comparatives. Financial asset reserve The financial asset reserve represents the revaluation of financial assets recognised at fair value through other comprehensive income (FVOCI). The Group transfers amounts from this reserve to retained earnings when the relevant equity securities are derecognised. Foreign currency translation reserve Exchange differences arising on translation of foreign operations are recognised in Consolidated Statement of Other Comprehensive Income and accumulated in a separate reserve within equity. The cumulative amount is transferred to the Consolidated Statement of Profit or Loss on disposal of the foreign operation. Share based payments reserve The share based payments reserve represents the fair value of share based payments provided to both employees and non-employees. Refer to Note 29 for details on share based payments.

Notes to the Financial Statements 29 This section contains information on the structure and related parties of the Group and how it affects the financial performance and position of the Group. 25. Subsidiaries Subsidiaries are entities controlled by the Company. Control exists where the Company is exposed or has rights to variable returns from its involvement with the subsidiary and has the ability to affect those returns through its power over the subsidiary. The Company has power over the subsidiary when it has existing rights to direct the relevant activities of the subsidiary which are those which significantly affect the subsidiary’s returns. The financial statements of subsidiaries are included in the consolidated financial statements for the period they are controlled. The subsidiaries of the Group at the reporting date are as follows: Ownership interest Subsidiaries Country of incorporation Principal activity 2023 % 2022 % 9474-9454 Québec Inc. Canada Exploration 100 - North American Lithium Inc. (1) Canada Lithium mining and processing 75 75 Sayona East Kimberley Pty Ltd Australia Exploration 100 100 Sayona Inc. (2) Canada Administrative, management and support services 100 100 Sayona International Pty Ltd Australia Investment holding company 100 100 Sayona Lithium Pty Ltd Australia Exploration 100 100 Sayona North Inc. Canada Exploration 100 100 Sayona Québec Inc. (1) Canada Investment holding company 75 75 (1) Non-controlling ownership interest of 25% is held by Piedmont Lithium Québec Holdings Inc. (2) Subsidiary was previously named 9451-6705 Québec Inc. 26. Interests in Joint Arrangements The Group’s interests in joint arrangements are classified as either joint operations or joint ventures. The classification depends on the contractual rights and obligations of each investor, rather than the legal structure of the joint arrangement. Joint arrangements represent the contractual sharing of control between two or more parties in a business venture where decisions about the relevant activities of the arrangement (those that significantly affect the returns of the business venture) require the unanimous consent of the parties sharing control. The Group has interests in the following joint arrangements at reporting date: Ownership interest Project Country Counterparty 2023 % 2022 % Moblan Lithium Project Canada SOQUEM Inc. 60 60 Morella Lithium Joint Venture Project Australia Morella Corporation Limited 49 100 The above interests represent arrangements in which the parties maintain direct interests in each asset, and obligations for the liabilities, relating to the arrangement. Accordingly, the Group has accounted for the above arrangements as joint operations. The Group's interest in the assets and liabilities, revenue and expenses of joint operations are included in the respective line items of the consolidated financial statements. Further details on the arrangements are as follows: (a) Moblan Lithium Project On 15 October 2021, the Group acquired a 60% interest in the Moblan Lithium Project, a drilling deposit host to high-grade spodumene mineralisation. The project is 40% owned by SOQUEM Inc., a wholly-owned subsidiary of Investissement Québec. (b) Morella Lithium Joint Venture Project On 1 November 2022, Morella Corporation Limited satisfied the requirements under the Earn-In Agreement relating to several Pilbara tenements with lithium rights located in the Pilgangoora district in Western Australia, Australia. Under the agreement, Morella Corporation Limited was required to spend $1.5 million on exploration within three years in order to earn a 51% interest in the project. Group and Related Party Information

Notes to the Financial Statements 30 27. Related Party Transactions (a) Parent entity The ultimate parent entity of the Group is Sayona Mining Limited, which is incorporated and domiciled in Australia. The registered office of the Company is Level 28, 10 Eagle Street, Brisbane QLD 4000. (b) Subsidiaries, joint ventures and associates The Group’s interests in subsidiaries, joint ventures and associates are disclosed in Note 25. (c) Key management personnel compensation 2023 $’000 2022 $’000 Restated * Short-term employee benefits 2,468 783 Post-employment benefits 89 42 Share based payments 2,221 3,584 Total key management personnel compensation 4,778 4,409 * Refer to Note 33 for details on restatement of prior period comparatives. (d) Transactions with related parties 2023 $’000 2022 $’000 Transactions with related parties Sales of goods and services 18,956 94 Purchases of goods and services 156 121 Interest expense 1,177 927 Net increase (decrease) in other amounts owing with related parties (11,835) 37,365 Net increase (decrease) in loans with related parties 87 - Proceeds from related parties 77,806 13,492 Outstanding balances with related parties Trade and sundry amounts owing to related parties 34 20 Trade and sundry amounts owing from related parties 44 11 Other amounts owing to related parties 25,530 40,521 Other amounts owing from related parties - 3,156 Loan amounts owing from related parties 87 - Transactions between related parties are at market prices or on normal commercial terms, no more favourable to the Group than those arranged with third parties. The Board has determined that the value of the services provided from related parties is not sufficiently material to interfere with the Directors’ capacity to bring an independent judgement to bear on issues before the Board and to act in the best interests of the Group as a whole, rather than in the interests of an individual security holder or other party.

Notes to the Financial Statements 31 This section contains other information that must be disclosed to comply with accounting standards and other pronouncements, but is not considered critical in understanding the financial performance or position of the Group. 28. Auditor’s Remuneration The Group’s auditor is Nexia Brisbane Audit Pty Ltd. 2023 $’000 2022 $’000 Fees paid and payable to the Group’s auditor for assurance services Audit and review of financial statements 326 211 Total auditor’s remuneration 326 211 29. Share Based Payments The Group uses shares and options to settle liabilities. Share based payments to employees are measured at the fair value of the instruments issued and amortised over the vesting periods. Share based payments to non-employees are measured at the fair value of goods or services received or the fair value of the equity instruments issued if the fair value of the goods or services cannot be reliably measured, and are recorded at the date the goods or services are received. (a) Ordinary shares Reconciliation of outstanding equity awards Equity rights at beginning of the year Granted during the year Vested during the year Forfeited during the year Lapsed during the year Equity rights at end of the year FY22 Performance Rights (1) 4,894,986 - - - - 4,894,986 FY23 Performance Rights (2) - 8,559,808 - - - 8,559,808 Total awards 4,894,986 8,559,808 - - - 13,454,794 (1) FY22 Performance Rights relate to equity awards granted to employees on 27 January 2022, subject to the achievement of specific performance measures. All rights are expected to vest in FY24. (2) FY23 Performance Rights relate to equity awards granted to Mr Guy Belleau on 1 January 2023, subject to the achievement of specific performance measures over the period from 1 January 2023 to 30 June 2027. Equity awards are issued for nil consideration and take the form of rights to receive one ordinary share in Sayona Mining Limited for each right granted, subject to performance and/or service conditions being met. Awards do not confer any dividend or voting rights until they convert into ordinary shares at vesting. In addition, awards do not confer any rights to participate in a share issue. (b) Options Reconciliation of outstanding option awards Equity rights at beginning of the year Granted during the year Exercised during the year Forfeited during the year Lapsed during the year Equity rights at end of the year Non-recurring awards Equity-settled services (1) 42,426,423 2,234,482 - - (42,426,423) 2,234,482 Option awards FY20 Performance Rights 2,000,000 4,000,000 (6,000,000) - - - FY22 Performance Rights (2) 40,000,000 - - - - 40,000,000 Total awards 84,426,423 6,234,482 (6,000,000) - (42,426,423) 42,234,482 (1) Outstanding equity-settled services relate to options granted to Jett Capital Advisors, LLC in respect of corporate advisory services undertaken for the Group. Options were granted on 28 November 2022 at an exercise price of $0.1825, expiring on 28 November 2025. (2) Outstanding performance rights relate to options granted to KMP. Options were granted on 28 January 2022 at an exercise price of $0.15, expiring on 28 July 2023. All options were exercised in July 2023, resulting in cash proceeds of $6 million. Option awards do not confer any dividend or voting rights until they convert into ordinary shares. Each option is entitled to be converted into one ordinary share in Sayona Mining Limited. The fair value of options is determined using the Black Scholes valuation model which incorporates all market vesting conditions. Other Disclosures

Notes to the Financial Statements 32 30. Commitments The following commitments exist at balance date but have not been brought to account: 2023 $’000 2022 $’000 Capital expenditure commitments 79,438 110,000 Exploration expenditure commitments 904 3,812 Other contractual commitments 8,300 - Total commitments 88,642 113,812 Exploration expenditure commitments The Group must meet minimum expenditure commitments on granted exploration tenements to maintain those tenements in good standing. If the relevant tenement is relinquished, the expenditure commitment also ceases. 31. Contingent Assets and Liabilities There were no material contingent assets or liabilities at the end of the reporting period (2022: Nil). 32. Parent Entity Information (a) Summary financial information The individual financial statements for the parent entity, Sayona Mining Limited, include the following aggregate amounts: 2023 $’000 2022 $’000 Result of parent entity Profit/(loss) after income tax 106,071 (10,062) Total comprehensive income/(loss) 106,071 (10,062) Financial position of parent entity at year end Current assets 157,096 171,161 Non-current assets 662,981 266,903 Total assets 820,077 438,064 Current liabilities 5,584 1,487 Non-current liabilities 4,220 - Total liabilities 9,804 1,487 Net assets 810,273 436,577 Total equity of parent entity Share capital 770,700 504,255 Reserves 2,850 1,762 Retained earnings/(accumulated losses) 36,723 (69,440) Total equity 810,273 436,577 (b) Parent entity guarantees The parent entity has not entered into any guarantees in the current or previous reporting period. (c) Commitments The parent entity had no contractual or other commitments at the reporting date (2022: Nil).

Notes to the Financial Statements 33 33. Restatement of Comparative Information (a) Recognition of deferred tax liabilities Deferred tax liabilities of $10.2 million have been recognised as at 30 June 2022 following an external review of the Group’s deferred tax position. The adjustment is comprised of $9.0 million in deferred mining taxes and $1.2 million in deferred income taxes. The deferred mining tax is primarily attributable to the book value of the capitalised exploration expenditure as at 30 June 2022, which does not have a tax basis for the purposes of the Québec mining tax return. Accordingly, a deferred tax liability has been recognised in respect of capitalised exploration expenditure. The gain on acquisition of NAL recognised in FY22 has been restated for deferred mining tax purposes. A summary of the adjustments made to the Consolidated Statement of Profit or Loss and Consolidated Statement of Financial Position from the recognition of the deferred tax liability is set out as follows: Year ended 30 June 2022 Reported balance $’000 Adjustment $’000 Restated balance $’000 Consolidated statement of profit or loss Other income 108,375 (6,659) 101,716 Profit/(loss) before income tax 83,686 (6,659) 77,027 Income tax expense - (3,207) (3,207) Profit/(loss) after income tax 83,686 (9,866) 73,820 Consolidated statement of financial position Deferred tax liabilities - 10,174 10,174 Total liabilities 90,366 10,174 100,540 Net assets 570,795 (10,174) 560,621 Reserves 14,385 (834) 13,551 Accumulated losses (7,361) (6,421) (13,782) Total equity attributable to equity holders of Sayona Mining Limited 511,279 (7,255) 504,024 Non-controlling interests 59,516 (2,919) 56,597 Total equity 570,795 (10,174) 560,621 There is no material impact on the operating, investing or financing cash flows of the Group from the restatement. (b) Restatement of earnings per share Earnings per share have been recalculated based on the restated earnings attributable to equity holders of the Company in accordance with the adjustment to deferred tax liabilities as detailed above. In addition, an error was identified in the denominator used to calculate earnings per share in FY22. A summary of the adjustments is as follows: Year ended 30 June 2022 Reported balance Adjustment Restated balance Earnings per share Basic earnings per share (cents) 1.23 (0.47) 0.76 Diluted earnings per share (cents) 1.16 (0.45) 0.71 (c) Restatement of key management personnel compensation A detailed review of remuneration identified that short-term employee benefits disclosed in the FY22 Remuneration Report were misstated due to a calculation error. A summary of the adjustments is as follows: Year ended 30 June 2022 Reported balance $’000 Adjustment $’000 Restated balance $’000 Short-term employee benefits 1,247 (464) 783 Post-employment benefits 42 - 42 Share based payments 3,584 - 3,584 Total key management personnel compensation 4,873 (464) 4,409

Notes to the Financial Statements 34 34. Subsequent Events The following events have arisen since the end of the financial year: Equity Placement On 19 July 2023, the Group completed the second tranche of a $200 million placement to institutional, professional and sophisticated investors, resulting in the issuance of 170,726,221 fully paid ordinary shares at an issue price of $0.18 per share for aggregate gross proceeds of $30.7 million. Board and Leadership Changes On 28 August 2023, the Group announced changes to the Board of Directors following the resignation of Mr Brett Lynch as Managing Director and Chief Executive Officer. To enable a smooth transition to new leadership, Mr James Brown was appointed as Executive Director and Interim Chief Executive Officer, effective 27 August 2023. In addition, Mr Philip Lucas was appointed as a Non-Executive Director, effective 27 August 2023. Mr Lucas is an experienced corporate lawyer with a particular focus on equity capital markets, mergers and acquisitions, corporate governance and Australian Securities Exchange regulations and compliance. Mr Lucas is currently Partner and Chair at boutique corporate and resources law firm, Allion Partners and serves as Chair of Chilwa Minerals Limited. Inaugural Shipment of Spodumene Concentrate from North American Lithium On 6 September 2023, the Group announced the receipt of cash proceeds from the inaugural shipment of spodumene concentrate from its North American Lithium operation in Québec, Canada. The initial cash payment marked an important milestone in Sayona’s evolution from a developer into a key North American lithium producer. Significant Changes in Market Conditions Subsequent to year end, the global lithium industry has observed a significant deterioration in market conditions. On 25 January 2024, the Group announced it would undertake an operational review of the North American Lithium operation, with a particular focus on optimising the cost structure to manage cash flow and enhance financial sustainability in response to a continued decline in market prices. No other matters or circumstances have arisen since the end of the financial year that have significantly affected or may significantly affect the operations, results of operations or state of affairs of the Group in subsequent financial years.

Directors’ Declaration 35 In accordance with a resolution of the Directors of the Company, we declare that: 1. In the opinion of the Directors: (a) The consolidated financial statements and notes that are set out on pages 1 to 34 of the Financial Report comply with: (i) the Australian Accounting Standards applicable to the Group which, as stated in Note 2 to the financial statements, constitutes compliance with International Financial Reporting Standards (IFRS); and (ii) give a true and fair view of the Group’s financial position as at 30 June 2023 and of its performance for the year ended on that date. (b) There are reasonable grounds to believe that the Company will be able to pay its debts as and when they become due and payable. This declaration is made in accordance with a resolution of the Board of Directors. James Brown Executive Director and Interim Chief Executive Officer Paul Crawford Executive Director and Chief Financial Officer Date: 22 February 2024

Independent Auditor’s Report To the Shareholders and Board of Directors of Sayona Mining Limited Report on the Audit of the Financial Report Opinion We have audited the accompanying consolidated financial statements of Sayona Mining Limited (the Company and its controlled entities (the Group)), which comprise the consolidated statement of financial position as at June 30, 2023, the consolidated statements of profit and loss and other comprehensive income, changes in equity and cash flows for the year then ended, and notes to the financial statements. In our opinion, these consolidated financial statements present fairly, in all material respects, the financial position of the Group as of June 30, 2023, and the results of its operations and cash flows for the year then ended in conformity with Australian Accounting Standards and Interpretations of the Australian Accounting Standards Board and International Financial Reporting Standards (IFRS) as issued by the International Accounting Standards Board. Basis for Opinion We conducted our audit in accordance with auditing standards generally accepted in the United States of America (GAAS). Our responsibilities under those standards are further described in the Auditor’s Responsibilities for the Audit of the Consolidated Financial Statements section of our report. We are required to be independent of the Group and to meet our other ethical responsibilities, in accordance with the relevant ethical requirements relating to our audit. We believe that the audit evidence we have obtained is sufficient and appropriate to provide a basis for our audit opinion. Key Audit Matters Key audit matters are those that, in our professional judgment, were of most significance in our audit of the consolidated financial statements of the current period. These matters were addressed in the context of our audit of the consolidated financial statements as a whole, and in forming our opinion thereon, and we do not provide a separate opinion on these matters.

Independent Auditor’s Report to the Shareholders and Board of Directors of Sayona Mining Limited (continued) Key audit matter How our audit addressed the key audit matter Accounting for mine development costs to plant and equipment and mine properties Refer to Note 12 As at 30 June 2023, the carrying value of plant and equipment amounts to $317.2 million and mine properties amounts to $229.0 million. Accounting for mine properties requires management to exercise significant judgement in determining the appropriate estimates to be applied in the application of the Group’s accounting policy, including: • The allocation of mining costs between operating and capital expenditure; and • Determining the units of production used to amortise mine properties. In addition, the mine was in development phase up to 1 May 2023 after which it reached production phase. The accounting and treatment of capitalised development and production stripping costs is affected, depending on which phase the mine is in. Once production phase has been reached, the key driver of the allocation of costs between operating and capital expenditure is the physical mining data associated with mining activities. Life-of-mine strip ratios need to be determined and continuously reviewed as production progresses. Costs are capitalised to the extent they relate to expenditures incurred in creating future access to ore rather than current period inventory. In commissioning mine properties and mine plant and equipment, judgement is also required to allocate capitalised works in progress to either mine properties or plant and equipment when the underlying asset is in the location and condition necessary for it to be capable of operating in the manner intended by management. Amortisation is applied to mine properties on a units of production basis. Plant and equipment is depreciated based on the lesser of the asset’s useful life and life of mine. The rates of amortisation and depreciation will therefore be revised and updated in accordance with changes in life of mine estimates and levels of production. For the allocation and capitalisation of mining and development costs, our procedures included, but were not limited to: • Assessing management’s criteria with their determination of whether the mine was in development phase or whether production had been reached; • obtaining an understanding and testing of the key controls management has in place in relation to capitalisation of mining expenditure; • assessment of the appropriateness of the allocation of costs between operating and capital expenditure, based on the nature of the underlying activity and consideration of whether the mine was in development or production phase; • performed physical verification procedures to ascertain the completeness and existence of mine plant and equipment and mine properties recorded in the asset register; • testing a representative sample of additions in the year to determine whether the capitalisation was appropriate by considering the nature of capitalised works in progress including the value, timing and classification thereof; and • assessment of transfers from capitalised works in progress to plant and equipment and mine properties, considering whether the underlying assets had been brought into use on that date. For the Group’s amortisation and depreciation calculations, our procedures included, but were not limited to: • obtaining an understanding of the key controls that management has in place in relation to the calculation of the unit of production amortisation rate and the depreciation rates applicable to plant and equipment; • assessing the appropriateness of production amortisation rates and depreciation rates for reasonableness and determination of the useful life of mine plant and equipment and mine properties is in line with accounting policies; and • testing the mathematical accuracy of the application of production amortisation rates and depreciation rates applied to individual items of plant and equipment and mine properties.

Key audit matter How our audit addressed the key audit matter We also assessed the adequacy of the disclosures in Note 12 to the financial statements including the critical accounting estimates and judgements in the accounting policy notes using our understanding obtained from our testing, ensuring the disclosures were consistent with the applied practices and the requirements of the accounting standards. Responsibilities of Directors for the Consolidated Financial Statements The directors are responsible for the preparation and fair presentation of the financial statements in accordance with Australian Accounting Standards and International Financial Reporting Standards, and for the design, implementation, and maintenance of internal control relevant to the preparation and fair presentation of financial statements that are free from material misstatement, whether due to fraud or error. In preparing the consolidated financial statements, the directors are required to evaluate whether there are conditions or events, considered in the aggregate, that raise substantial doubt about the Group’s ability to continue as a going concern for one year after the reporting date. Auditor’s Responsibilities for the Audit of the Consolidated Financial Statements Our objectives are to obtain reasonable assurance about whether the financial statements as a whole are free from material misstatement, whether due to fraud or error, and to issue an auditor’s report that includes our opinion. Reasonable assurance is a high level of assurance but is not absolute assurance and therefore is not a guarantee that an audit conducted in accordance with GAAS will always detect a material misstatement when it exists. The risk of not detecting a material misstatement resulting from fraud is higher than for one resulting from error, as fraud may involve collusion, forgery, intentional omissions, misrepresentations, or the override of internal control. Misstatements are considered material if there is a substantial likelihood that, individually or in the aggregate, they would influence the judgment made by a reasonable user based on the financial statements. In performing an audit in accordance with GAAS, we: • Exercise professional judgment and maintain professional skepticism throughout the audit. • Identify and assess the risks of material misstatement of the consolidated financial statements, whether due to fraud or error, and design and perform audit procedures responsive to those risks. Such procedures include examining, on a test basis, evidence regarding the amounts and disclosures in the financial statements. • Obtain an understanding of internal control relevant to the audit in order to design audit procedures that are appropriate in the circumstances, but not for the purpose of expressing an opinion on the effectiveness of the Group’s internal control. Accordingly, no such opinion is expressed.

Independent Auditor’s Report to the Shareholders and Board of Directors of Sayona Mining Limited (continued) • Evaluate the appropriateness of accounting policies used and the reasonableness of significant accounting estimates made by management, as well as evaluate the overall presentation of the consolidated financial statements. • Conclude whether, in our judgment, there are conditions or events, considered in the aggregate, that raise substantial doubt about the Group’s ability to continue as a going concern for a reasonable period of time. We are required to communicate with those charged with governance regarding, among other matters, the planned scope and timing of the audit, significant audit findings, and certain internal control-related matters that we identified during the audit. Nexia Brisbane Audit Pty Ltd Ann-Maree Robertson Director Level 28, 10 Eagle Street Brisbane, Queensland, Australia, 4000. Date: February 22, 2024