
NASDAQ: CLBK

SAFE HARBOR STATEMENT THIS PRESENTATION CONTAINS FORWARD‐LOOKING STATEMENTS WITHIN THE MEANING OF THE PRIVATE SECURITIES LITIGATION REFORM ACT OF 1995 REGARDING COLUMBIA FINANCIAL INC.’S EXPECTATIONS OR PREDICTIONS OF FUTURE FINANCIAL OR BUSINESS PERFORMANCE OR CONDITIONS. FORWARD‐LOOKING STATEMENTS ARE TYPICALLY IDENTIFIED BY WORDS SUCH AS “BELIEVE,” “EXPECT,” “ANTICIPATE,” “INTEND,” “TARGET,” “ESTIMATE,” “CONTINUE,” “POSITIONS,” “PROSPECTS,” OR “POTENTIAL,” BY FUTURE CONDITIONAL VERBS SUCH AS “WILL”, “WOULD”, “SHOULD”, “COULD”, “MAY”, OR BY VARIATIONS OF SUCH WORDS OR BY SIMILAR EXPRESSIONS. THESE FORWARD‐LOOKING STATEMENTS ARE SUBJECT TO NUMEROUS ASSUMPTIONS, RISKS AND UNCERTAINTIES, WHICH CHANGE OVER TIME. FORWARD‐LOOKING STATEMENTS SPEAK ONLY AS OF THE DATE THEY ARE MADE AND WE ASSUME NO DUTY TO UPDATE ANY FORWARD‐LOOKING STATEMENTS. ACTUAL RESULTS MAY DIFFER MATERIALLY FROM CURRENT PROJECTIONS. IN ADDITION TO FACTORS PREVIOUSLY DISCLOSED IN COLUMBIA FINANCIAL’S REPORTS FILED WITH THE U.S. SECURITIES AND EXCHANGE COMMISSION AND THOSE IDENTIFIED ELSEWHERE IN THIS PRESENTATION, THE FOLLOWING FACTORS AMONG OTHERS, COULD CAUSE ACTUAL RESULTS TO DIFFER MATERIALLY FROM FORWARD‐LOOKING STATEMENTS OR HISTORICAL PERFORMANCE: CHANGES IN INTEREST RATES, HIGHER INFLATION AND THEIR IMPACT ON NATIONAL AND LOCAL ECONOMIC CONDITIONS, CHANGES IN MONETARY AND FISCAL POLICIES OF THE U.S. TREASURY, THE BOARD OF GOVERNORS OF THE FEDERAL RESERVE SYSTEM AND OTHER GOVERNMENTAL ENTITIES, COMPETITIVE PRESSURES FROM OTHER FINANCIAL INSTITUTIONS AND FINANCIAL SERVICES COMPANIES, THE EFFECTS OF GENERAL ECONOMIC CONDITIONS ON A NATIONAL BASIS OR IN THE LOCAL MARKETS IN WHICH THE COMPANY OPERATES IN, INCLUDING CHANGES THAT ADVERSELY AFFECT A BORROWERS’ ABILITY TO SERVICE AND REPAY THE COMPANY’S LOANS, THE EFFECT OF ACTS OF TERRORISM, WAR OR PANDEMIC, SUCH AS THE RECENT COVID-19 PANDEMIC, INCLUDING ON OUR CREDIT QUALITY AND BUSINESS OPERATIONS, AS WELL AS ITS IMPACT ON GENERAL ECONOMIC AND FINANCIAL MARKET CONDITIONS, CHANGES IN THE VALUE OF SECURITIES IN THE COMPANY’S PORTFOLIO; CHANGE IN LOAN AND DEFAULT AND CHARGE-OFF RATES, FLUCTUATIONS IN REAL ESTATE VALUES, THE ADEQUACY OF LOAN LOSS RESERVES; DECREASES IN DEPOSIT LEVELS NECESSITATING INCREASED BORROWING TO FUND LOANS AND SECURITIES; LEGISLATIVE CHANGES AND CHANGES IN GOVERNMENTAL REGULATION; CHANGES IN ACCOUNTING STANDARDS AND PRACTICES; DEMAND FOR LOANS IN THE COMPANY’S MARKET AREA; THE COMPANY’S ABILITY TO ATTRACT AND MAINTAIN DEPOSITS AND EFFECTIVELY MANAGE LIQUIDITY; RISKS RELATED TO THE IMPLEMENTATION OF ACQUISITIONS, DISPOSITIONS, AND RESTRUCTURINGS; THE RISK THE COMPANY MAY NOT BE SUCCESSFUL IN THE IMPLEMENTATION OF ITS BUSINESS STRATEGIES OR ITS INTEGRATION OF ACQUIRED FINANCIAL INSTITUTIONS AND BUSINESSES; AND CHANGES IN ASSUMPTIONS USED IN MAKING SUCH FORWARD-LOOKING STATEMENTS WHICH ARE SUBJECT TO NUMEROUS RISKS AND UNCERTAINTIES, INCLUDING BUT NOT LIMITED TO THOSE SET FORTH IN ITEM 1A OF THE COMPANY’S ANNUAL REPORT ON FORM 10-K AND THOSE SET FORTH IN THE COMPANY’S QUARTERLY REPORTS ON FORM 10-Q AND CURRENT REPORTS ON FORM 8-K, ALL FILED WITH THE SECURITIES AND EXCHANGE COMMISSION. THESE FACTORS SHOULD BE CONSIDERED IN EVALUATING THE FORWARD‐LOOKING STATEMENTS AND UNDUE RELIANCE SHOULD NOT BE PLACED ON SUCH STATEMENTS. TRADEMARKS REFERRED TO IN THIS PRESENTATION ARE THE PROPERTY OF THEIR RESPECTIVE OWNERS, ALTHOUGH FOR PRESENTATION CONVENIENCE WE MAY NOT USE THE ® OR THE ™ SYMBOLS TO IDENTIFY SUCH TRADEMARKS. THIS PRESENTATION ALSO INCLUDES INTERIM AND UNAUDITED FINANCIAL INFORMATION THAT IS SUBJECT TO FURTHER REVIEW BY COLUMBIA FINANCIAL’S INDEPENDENT REGISTERED PUBLIC ACCOUNTING FIRM. 2
NON-GAAP FINANCIAL MEASURES THIS PRESENTATION CONTAINS FINANCIAL INFORMATION PRESENTED IN ACCORDANCE WITH U.S. GENERALLY ACCEPTED ACCOUNTING PRINCIPLES (“GAAP”). THIS PRESENTATION ALSO CONTAINS CERTAIN NON-GAAP INFORMATION THAT THE COMPANY’S MANAGEMENT USES IN ITS ANALYSIS OF THE COMPANY’S FINANCIAL RESULTS, INCLUDING CORE NET INCOME, CORE RETURN ON AVERAGE ASSETS, CORE RETURN ON AVERAGE TANGIBLE STOCKHOLDERS EQUITY AND CORE EFFICIENCY RATIO. SPECIFICALLY, THE COMPANY PROVIDES MEASURES BASED ON WHAT IT BELIEVES ARE ITS OPERATING EARNINGS ON A CONSISTENT BASIS, AND EXCLUDES MATERIAL NON-ROUTINE OPERATING ITEMS WHICH AFFECT THE GAAP REPORTING OF RESULTS OF OPERATIONS. THE COMPANY’S MANAGEMENT BELIEVES THAT PROVIDING THIS INFORMATION TO ANALYSTS AND INVESTORS ALLOWS THEM TO BETTER UNDERSTAND AND EVALUATE THE COMPANY’S CORE FINANCIAL RESULTS FOR THE PERIODS PRESENTED. BECAUSE NON-GAAP FINANCIAL MEASURES ARE NOT STANDARDIZED, IT MAY NOT BE POSSIBLE TO COMPARE THESE FINANCIAL MEASURES WITH OTHER COMPANIES’ NON-GAAP FINANCIAL MEASURES HAVING THE SAME OR SIMILAR NAMES. THE COMPANY ALSO PROVIDES MEASUREMENTS AND RATIOS BASED ON TANGIBLE STOCKHOLDERS’ EQUITY. THESE MEASURES ARE COMMONLY UTILIZED BY REGULATORS AND MARKET ANALYSTS TO EVALUATE THE COMPANY’S FINANCIAL CONDITION AND, THEREFORE, THE COMPANY’S MANAGEMENT TEAM BELIEVES THAT SUCH INFORMATION IS USEFUL TO INVESTORS. A RECONCILIATION OF THE NON-GAAP FINANCIAL MEASURES USED IN THIS PRESENTATION TO THE MOST DIRECTLY COMPARABLE GAAP MEASURES IS PROVIDED IN THE APPENDIX TO THIS PRESENTATION. 3
2022 YEAR IN REVIEW ■ Completed the acquisition and integration of RSI Bank ■ Reported net income of $86.2 million, or $0.82 per basic and $0.81 per diluted share ■ Achieved core return on average assets(1) and core return on average tangible equity(1) of 0.93% and 9.56%, respectively ■ Continued to grow a strong, conservative balance sheet • Asset growth of 12.8% to $10.4 billion • Loans receivable growth of 20.7% to $7.7 billion • Deposit growth of 5.7% to $8.0 billion ■ Grew net interest income 14.4% to $266.8 million ■ Maintained strong asset quality - nonperforming assets to total assets was 0.06% at December 31, 2022 ■ Continued our ongoing investment in new digital initiatives to improve the customer experience, increased product offerings, enhanced security, and improved efficiencies ■ Repurchased 4.5 million shares of our common stock for $94.0 million ■ Continued to attract diverse talent throughout our organization (1) Represents a Non-GAAP financial measure. See the appendix for the reconciliation of GAAP to Non-GAAP financial measures. 4

CONSOLIDATED STATEMENTS OF FINANCIAL CONDITION 3/31/2023 12/31/2022 12/31/2021 12/31/2020 12/31/2019 (In thousands) Total assets $ 10,634,650 $ 10,408,169 $ 9,224,097 $ 8,798,536 $ 8,188,694 Total cash and cash equivalents 319,439 179,228 70,963 422,957 75,547 Debt securities available for sale, at fair value 1,272,570 1,328,634 1,703,847 1,316,952 1,098,336 Debt securities held to maturity, at amortized cost 417,227 421,523 429,734 262,720 285,756 Loans receivable, net 7,734,199 7,624,761 6,297,912 6,107,094 6,135,857 Deposits 7,674,201 8,001,159 7,570,216 6,778,624 5,645,842 Borrowings 1,706,613 1,127,047 377,309 799,364 1,407,022 Total stockholders’ equity 1,038,890 1,053,595 1,079,081 1,011,287 982,517 5

FINANCIAL PERFORMANCE For the Three Months Ended March 31, For the Years Ended December 31, Operating Data 2023 2022 2022 2021 2020 2019 (In thousands) Interest income $ 92,880 $ 68,735 $ 309,670 $ 270,150 $ 295,711 $ 261,083 Interest expense 32,016 6,009 42,893 37,016 74,138 88,712 Net interest income 60,864 62,726 266,777 233,134 221,573 172,371 Provision for (reversal of) credit losses(1) 175 1,459 5,485 (9,953) 18,447 4,224 Non-interest income 8,073 7,041 30,400 38,831 31,270 31,636 Non-interest expenses 43,901 40,749 174,816 155,737 158,139 128,701 Pre-tax income 24,861 27,559 116,876 126,181 76,257 71,082 Income tax expense 6,138 7,155 30,703 34,132 18,654 16,365 Net income $ 18,723 $ 20,404 $ 86,173 $ 92,049 $ 57,603 $ 54,717 Core net income(2) $ 19,779 $ 22,171 $ 90,853 $ 94,031 $ 63,033 $ 54,873 (1) The Company adopted ASU 2016-13 as of January 1, 2022. Prior periods have not been restated. (2) Represents a Non-GAAP financial measure. See the appendix for the reconciliation of GAAP to Non-GAAP financial measures. 6

FINANCIAL PERFORMANCE (1) Represents a Non-GAAP financial measure. Ratios for 1Q 2023 are annualized. See the appendix for the reconciliation of GAAP to NON-GAAP financial measures. 7
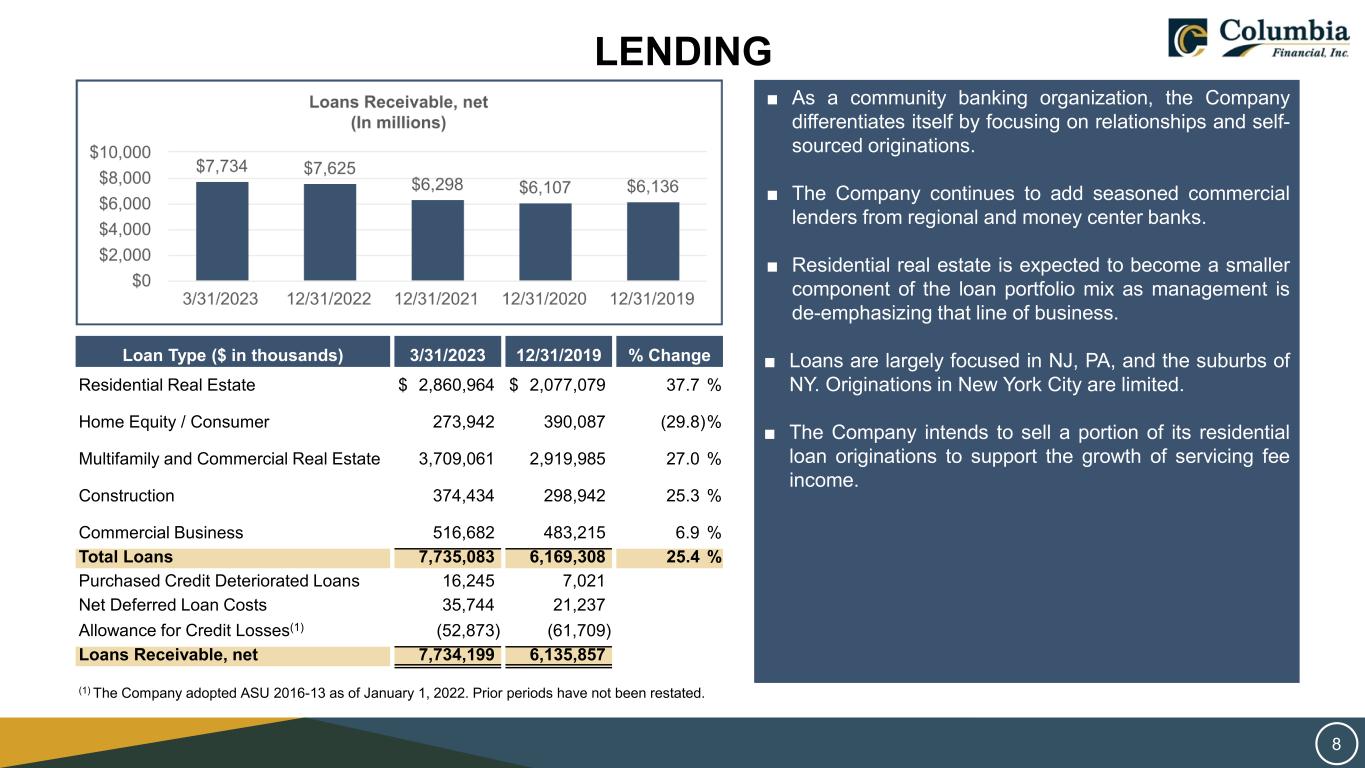
LENDING Loan Type ($ in thousands) 3/31/2023 12/31/2019 % Change Residential Real Estate $ 2,860,964 $ 2,077,079 37.7 % Home Equity / Consumer 273,942 390,087 (29.8)% Multifamily and Commercial Real Estate 3,709,061 2,919,985 27.0 % Construction 374,434 298,942 25.3 % Commercial Business 516,682 483,215 6.9 % Total Loans 7,735,083 6,169,308 25.4 % Purchased Credit Deteriorated Loans 16,245 7,021 Net Deferred Loan Costs 35,744 21,237 Allowance for Credit Losses(1) (52,873) (61,709) Loans Receivable, net 7,734,199 6,135,857 (1) The Company adopted ASU 2016-13 as of January 1, 2022. Prior periods have not been restated. ■ As a community banking organization, the Company differentiates itself by focusing on relationships and self- sourced originations. ■ The Company continues to add seasoned commercial lenders from regional and money center banks. ■ Residential real estate is expected to become a smaller component of the loan portfolio mix as management is de-emphasizing that line of business. ■ Loans are largely focused in NJ, PA, and the suburbs of NY. Originations in New York City are limited. ■ The Company intends to sell a portion of its residential loan originations to support the growth of servicing fee income. 8
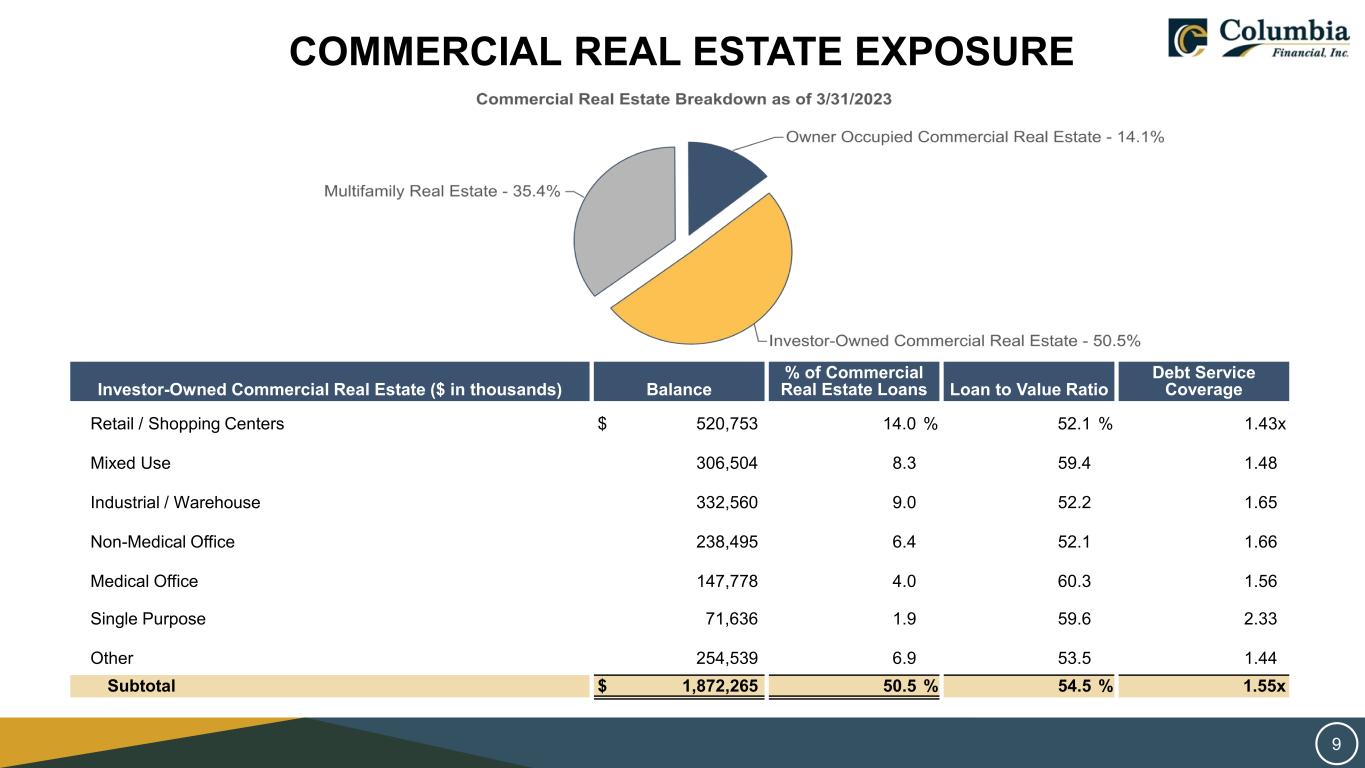
COMMERCIAL REAL ESTATE EXPOSURE Investor-Owned Commercial Real Estate ($ in thousands) Balance % of Commercial Real Estate Loans Loan to Value Ratio Debt Service Coverage Retail / Shopping Centers $ 520,753 14.0 % 52.1 % 1.43x Mixed Use 306,504 8.3 59.4 1.48 Industrial / Warehouse 332,560 9.0 52.2 1.65 Non-Medical Office 238,495 6.4 52.1 1.66 Medical Office 147,778 4.0 60.3 1.56 Single Purpose 71,636 1.9 59.6 2.33 Other 254,539 6.9 53.5 1.44 Subtotal $ 1,872,265 50.5 % 54.5 % 1.55x 9
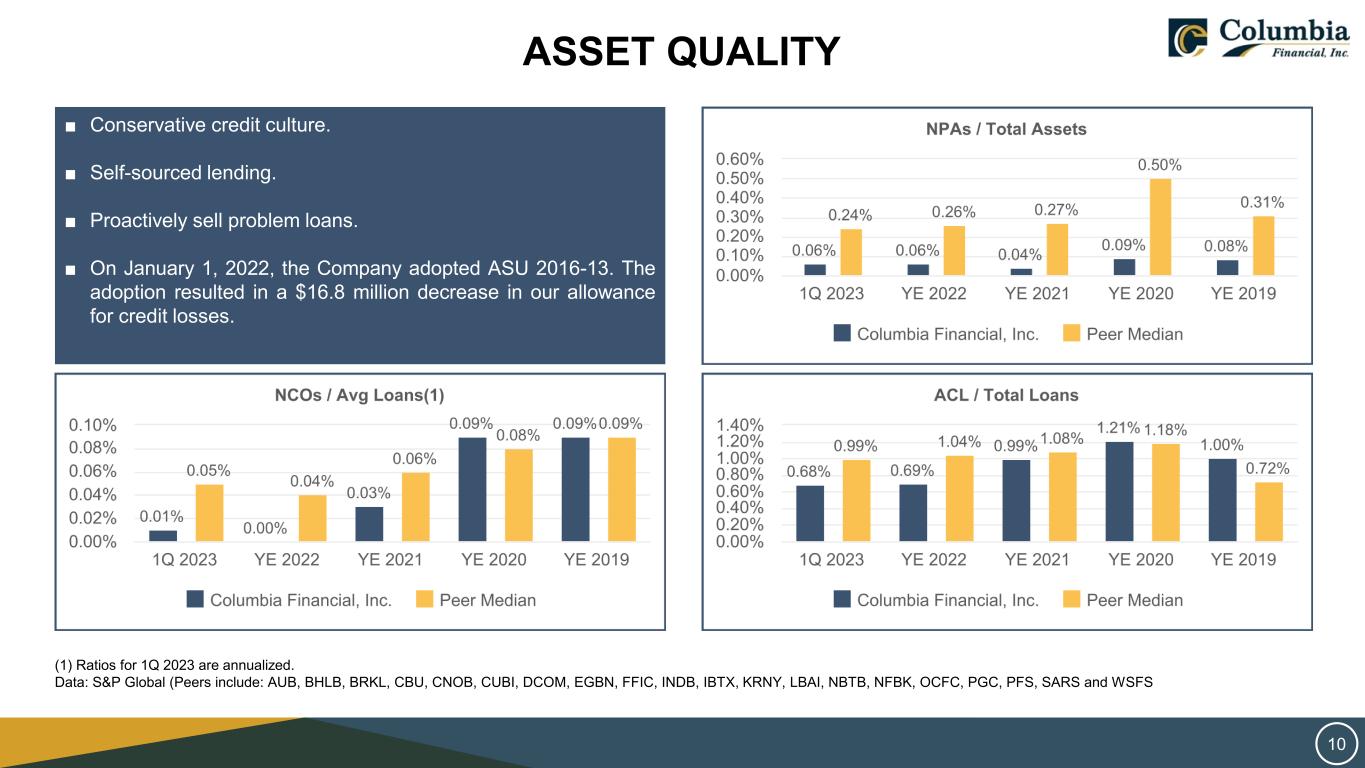
ASSET QUALITY ■ Conservative credit culture. ■ Self-sourced lending. ■ Proactively sell problem loans. ■ On January 1, 2022, the Company adopted ASU 2016-13. The adoption resulted in a $16.8 million decrease in our allowance for credit losses. (1) Ratios for 1Q 2023 are annualized. Data: S&P Global (Peers include: AUB, BHLB, BRKL, CBU, CNOB, CUBI, DCOM, EGBN, FFIC, INDB, IBTX, KRNY, LBAI, NBTB, NFBK, OCFC, PGC, PFS, SARS and WSFS 10
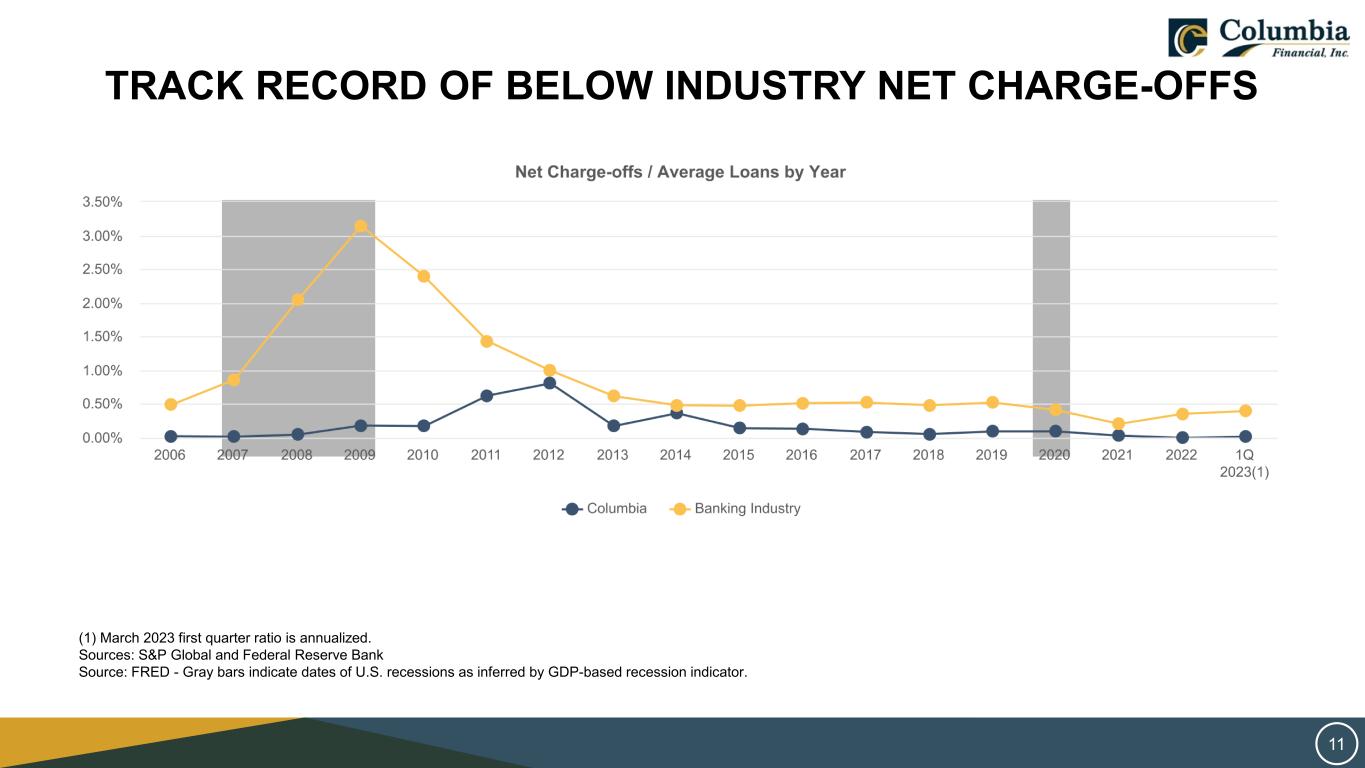
TRACK RECORD OF BELOW INDUSTRY NET CHARGE-OFFS (1) March 2023 first quarter ratio is annualized. Sources: S&P Global and Federal Reserve Bank Source: FRED - Gray bars indicate dates of U.S. recessions as inferred by GDP-based recession indicator. 11
CURRENT BANKING ENVIRONMENT There has been a considerable amount of negative attention focused on the failure of three banks with material business concentrations and specializations. Our Company’s business model is completely different from these other institutions. ■ Our Company’s banking subsidiaries are community banks with a diverse customer base ■ We accept deposits from the local community and invest those funds in local businesses, properties, and facilitate home ownership ■ While our conservative business model will allow us to successfully navigate the challenging environment, we expect to experience rising funding costs which will likely pressure our net interest margin and profitability ■ Our Company is executing strategies to partially offset this margin pressure 12
LIQUIDITY AND INVESTMENT PORTFOLIO At March 31, 2023, available sources of liquidity include but are not limited to: ■ Cash and cash equivalents of $319.4 million; ■ Borrowing capacity based on unencumbered collateral pledged at FHLB totaling $1.1 billion; ■ Borrowing capacity based on unencumbered collateral pledged at FRB totaling $1.4 billion; ■ Available correspondent lines of credit of $384.0 million with various third parties; and ■ Unpledged loan collateral available to pledge in excess of $2.7 billion. The Company maintains a liquid high-quality securities portfolio ■ Direct government obligations or government sponsored obligations represented 94.8% of the total securities portfolio ■ Approximately 97.0% of the total securities portfolio was rated A or better ■ The securities portfolio is 75.3% designated available for sale 13
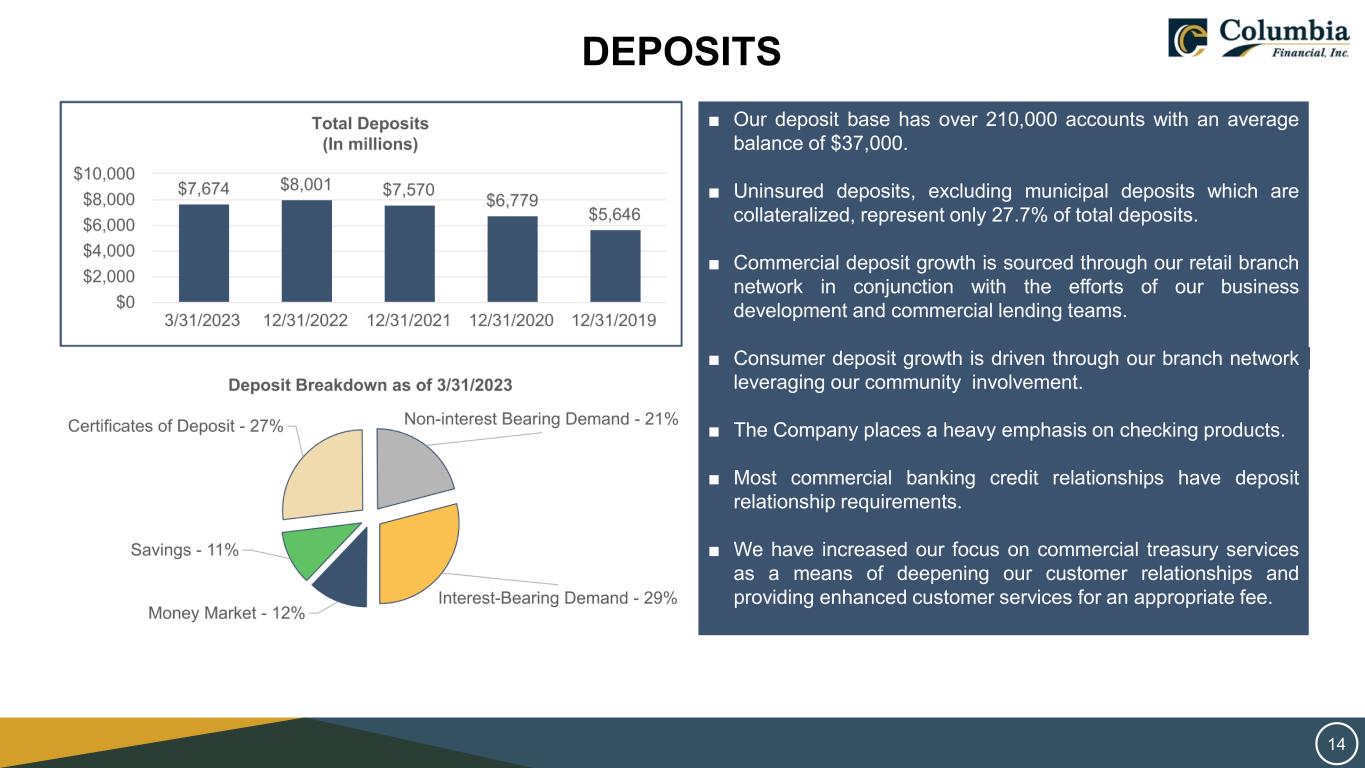
DEPOSITS ■ Our deposit base has over 210,000 accounts with an average balance of $37,000. ■ Uninsured deposits, excluding municipal deposits which are collateralized, represent only 27.7% of total deposits. ■ Commercial deposit growth is sourced through our retail branch network in conjunction with the efforts of our business development and commercial lending teams. ■ Consumer deposit growth is driven through our branch network leveraging our community involvement. ■ The Company places a heavy emphasis on checking products. ■ Most commercial banking credit relationships have deposit relationship requirements. ■ We have increased our focus on commercial treasury services as a means of deepening our customer relationships and providing enhanced customer services for an appropriate fee. 14
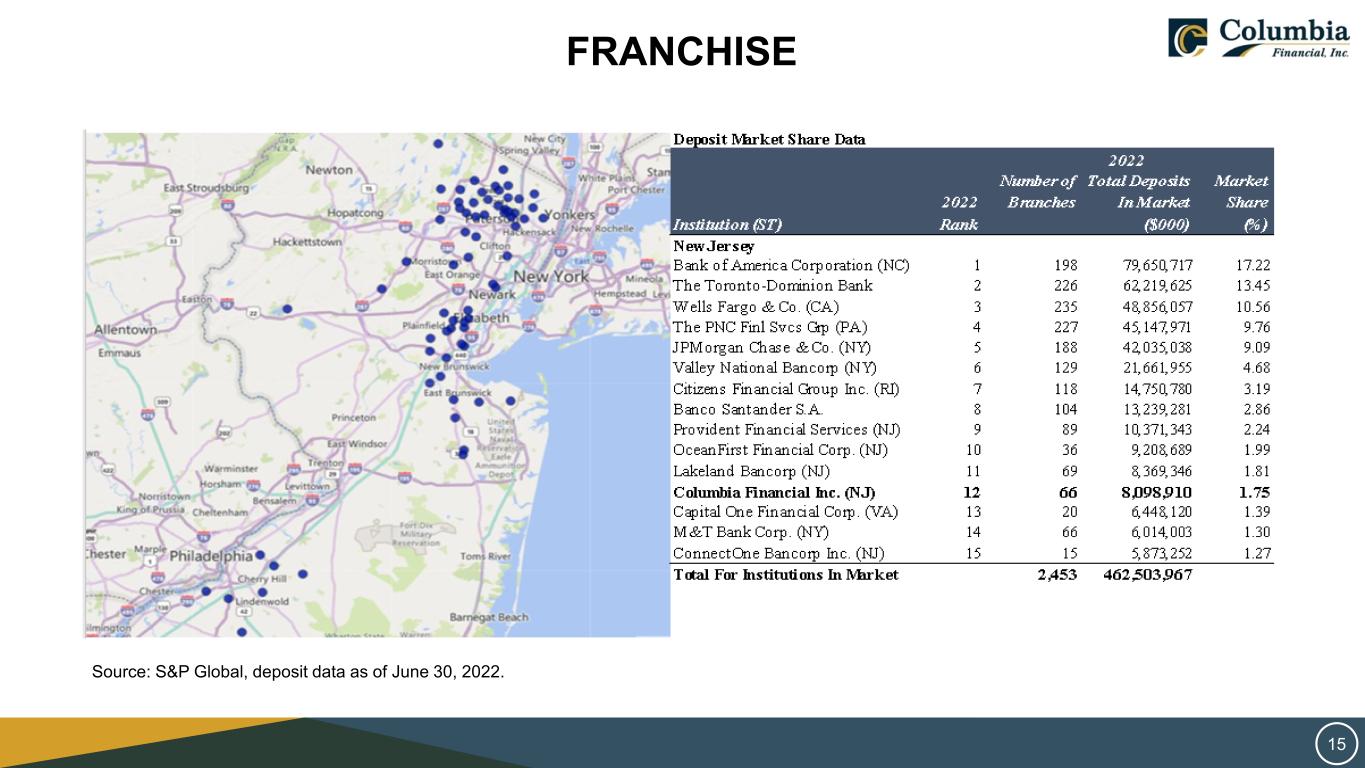
Source: S&P Global, deposit data as of June 30, 2022. FRANCHISE 15

MERGERS & ACQUISITIONS 16

STOCK PERFORMANCE Source: S&P Global with data through June 5, 2023. 17
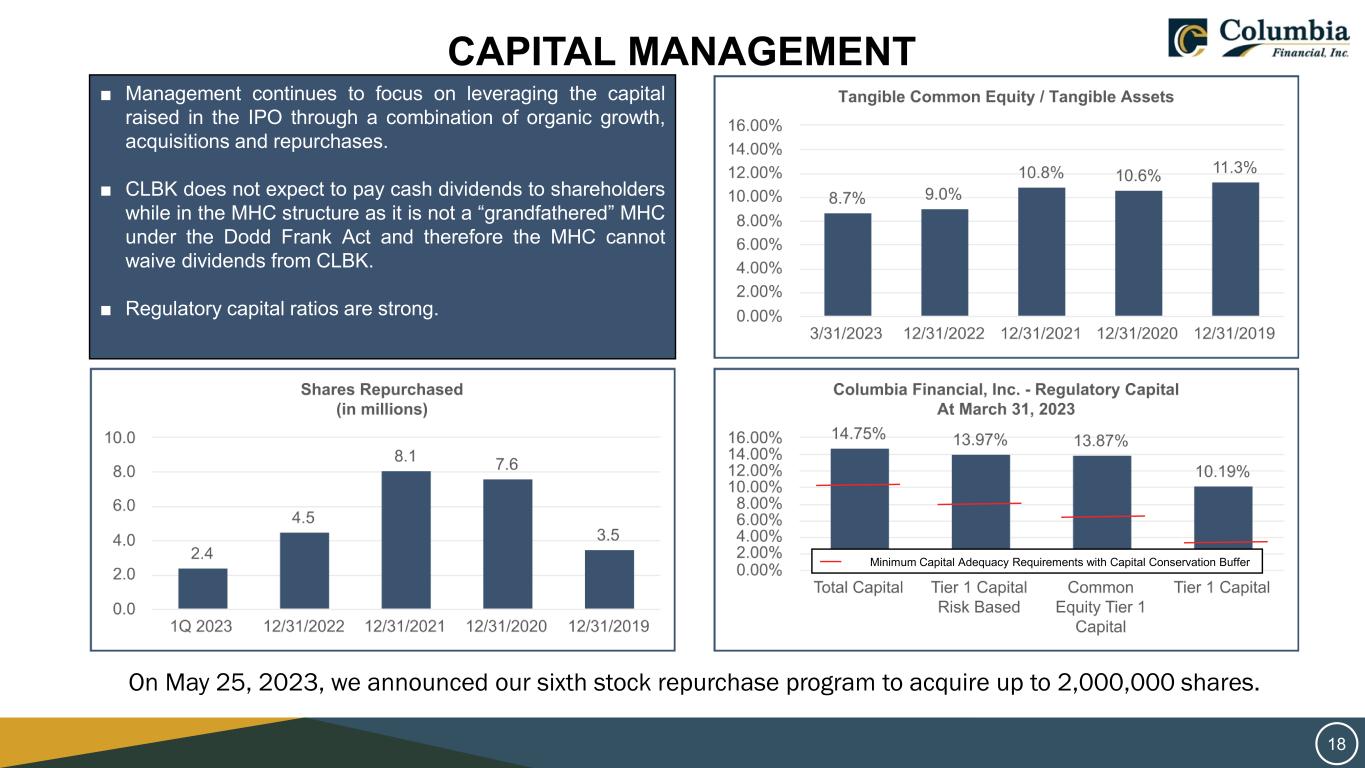
CAPITAL MANAGEMENT ■ Management continues to focus on leveraging the capital raised in the IPO through a combination of organic growth, acquisitions and repurchases. ■ CLBK does not expect to pay cash dividends to shareholders while in the MHC structure as it is not a “grandfathered” MHC under the Dodd Frank Act and therefore the MHC cannot waive dividends from CLBK. ■ Regulatory capital ratios are strong. Minimum Capital Adequacy Requirements with Capital Conservation Buffer 18 On May 25, 2023, we announced our sixth stock repurchase program to acquire up to 2,000,000 shares.

TECHNOLOGY & DIGITAL STRATEGY ROADMAP 19
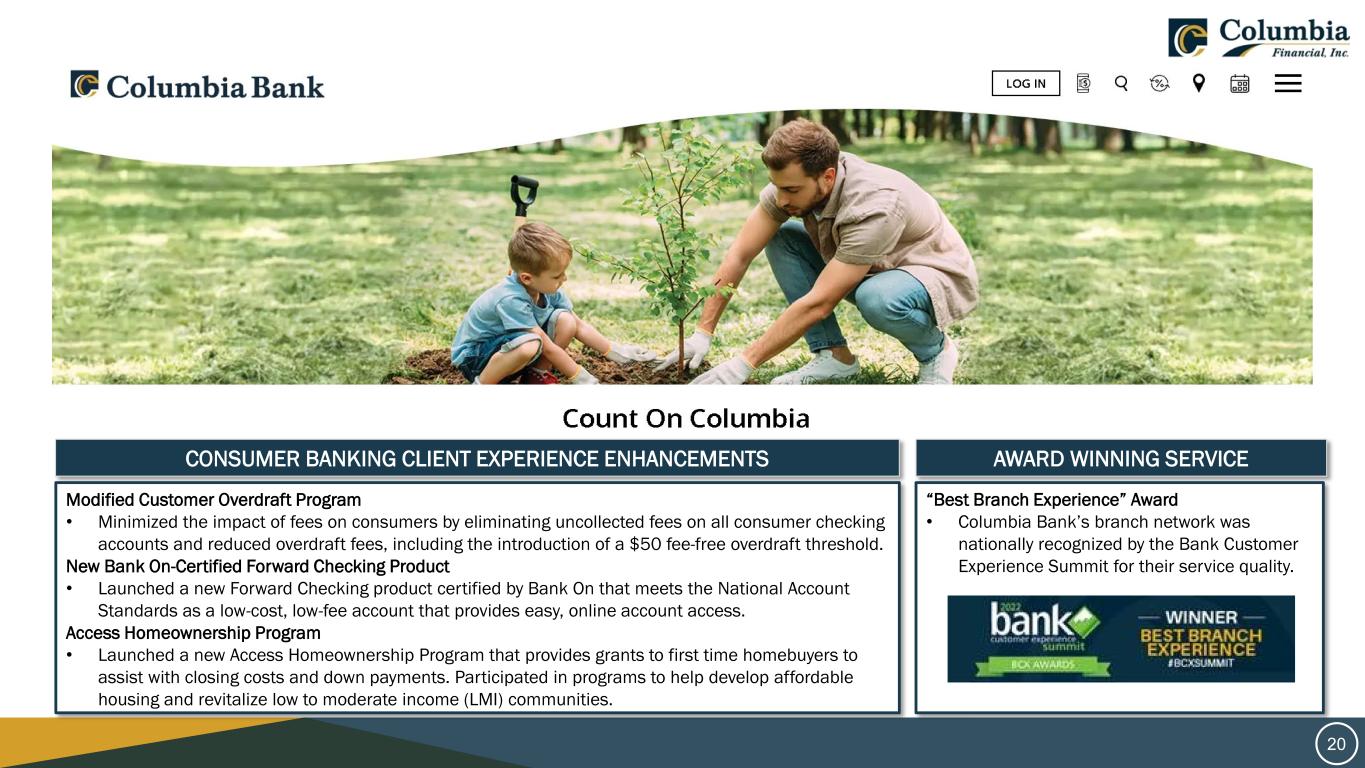
20 20 CONSUMER BANKING CLIENT EXPERIENCE ENHANCEMENTS Modified Customer Overdraft Program • Minimized the impact of fees on consumers by eliminating uncollected fees on all consumer checking accounts and reduced overdraft fees, including the introduction of a $50 fee-free overdraft threshold. New Bank On-Certified Forward Checking Product • Launched a new Forward Checking product certified by Bank On that meets the National Account Standards as a low-cost, low-fee account that provides easy, online account access. Access Homeownership Program • Launched a new Access Homeownership Program that provides grants to first time homebuyers to assist with closing costs and down payments. Participated in programs to help develop affordable housing and revitalize low to moderate income (LMI) communities. AWARD WINNING SERVICE “Best Branch Experience” Award • Columbia Bank’s branch network was nationally recognized by the Bank Customer Experience Summit for their service quality.
■ Management and the Board of Directors are aware of the opportunities afforded by a second step conversion. ■ We believe that being “well positioned” to execute a second step conversion is important. ■ Therefore, management is focused on: • Building the growth engine so we can leverage the amount of capital raised in a second step; • Deploying the remaining excess capital from the initial MHC offering; • Continuing to evaluate potential merger opportunities; and • Improving profitability and franchise value. Legal Disclaimer: While we continue to evaluate our organizational structure, we have no current plans to undertake a second step conversion nor is there any assurance that we will undertake such a conversion in the future. ORGANIZATIONAL CONSIDERATIONS 21
■ Continue our controlled organic growth strategy being mindful of economic conditions and evaluate acquisitions opportunistically; ■ Moderate our level of operating expenses to partially offset the earnings impact of margin compression; ■ Focus on controlling funding costs to defend margin; ■ Emphasize our commercial lines of business to continue our migration toward a commercial bank balance sheet; ■ De-emphasize residential mortgage lending due to lower profitable margins, long asset durations and interest rate cyclicality; ■ Build our core deposit base with an emphasis on commercial treasury services; ■ Continue ESG programming and diversity initiatives; ■ Increase our emphasis on digital strategies to address customer preferences and gain operating efficiencies; ■ Repurchase shares of common stock on a disciplined basis; and ■ Maintain credit discipline and continue to bolster risk management for regional bank oversight. STRATEGIC FOCUS 22

QUESTIONS AND ANSWERS 23
NASDAQ: CLBK
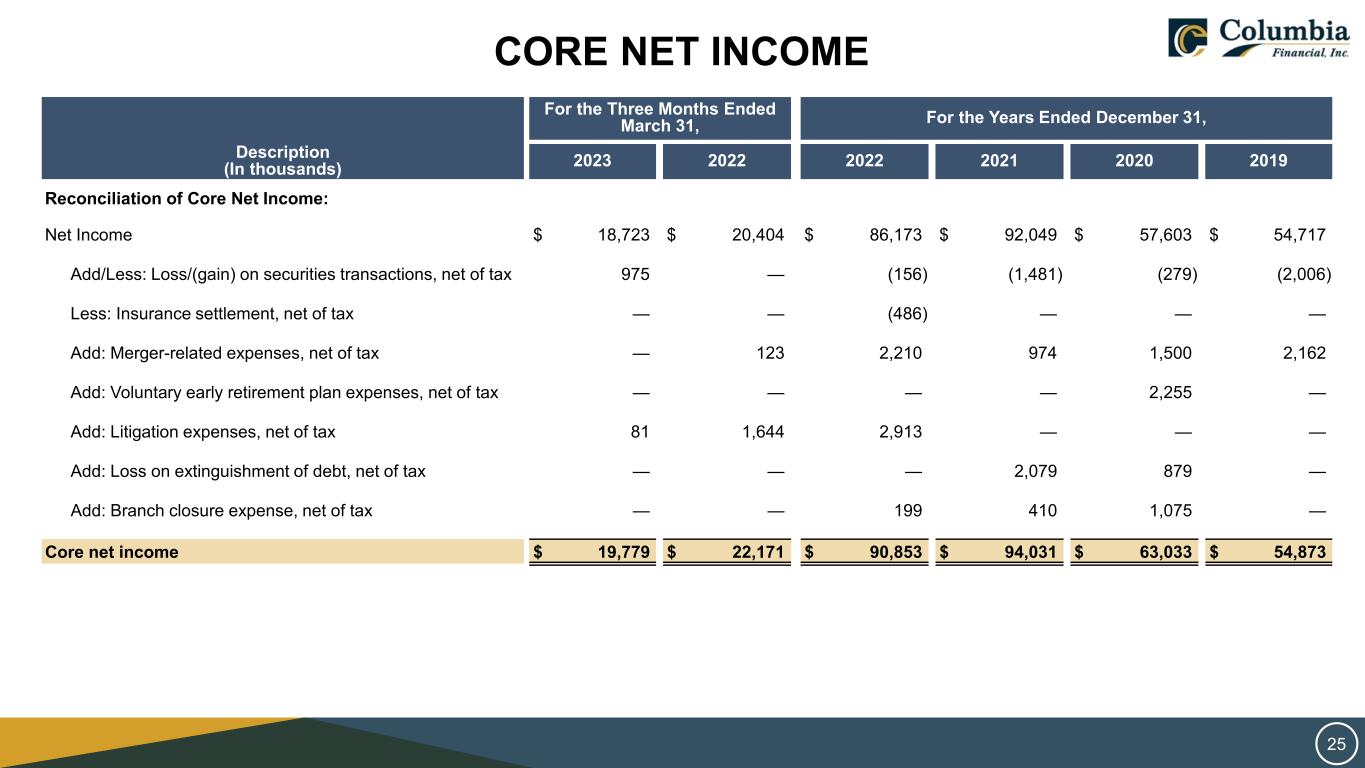
CORE NET INCOME For the Three Months Ended March 31, For the Years Ended December 31, Description (In thousands) 2023 2022 2022 2021 2020 2019 Reconciliation of Core Net Income: Net Income $ 18,723 $ 20,404 $ 86,173 $ 92,049 $ 57,603 $ 54,717 Add/Less: Loss/(gain) on securities transactions, net of tax 975 — (156) (1,481) (279) (2,006) Less: Insurance settlement, net of tax — — (486) — — — Add: Merger-related expenses, net of tax — 123 2,210 974 1,500 2,162 Add: Voluntary early retirement plan expenses, net of tax — — — — 2,255 — Add: Litigation expenses, net of tax 81 1,644 2,913 — — — Add: Loss on extinguishment of debt, net of tax — — — 2,079 879 — Add: Branch closure expense, net of tax — — 199 410 1,075 — Core net income $ 19,779 $ 22,171 $ 90,853 $ 94,031 $ 63,033 $ 54,873 25
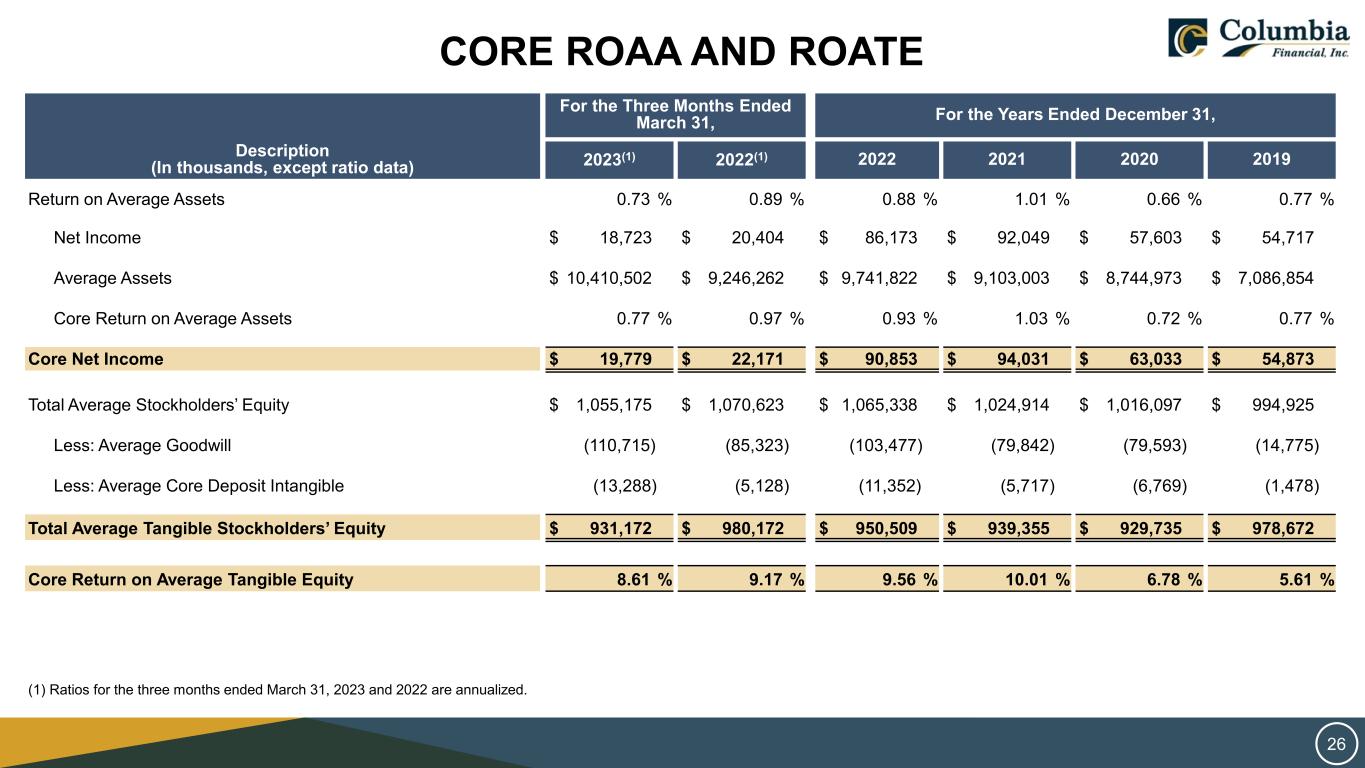
CORE ROAA AND ROATE For the Three Months Ended March 31, For the Years Ended December 31, Description (In thousands, except ratio data) 2023(1) 2022(1) 2022 2021 2020 2019 Return on Average Assets 0.73 % 0.89 % 0.88 % 1.01 % 0.66 % 0.77 % Net Income $ 18,723 $ 20,404 $ 86,173 $ 92,049 $ 57,603 $ 54,717 Average Assets $ 10,410,502 $ 9,246,262 $ 9,741,822 $ 9,103,003 $ 8,744,973 $ 7,086,854 Core Return on Average Assets 0.77 % 0.97 % 0.93 % 1.03 % 0.72 % 0.77 % Core Net Income $ 19,779 $ 22,171 $ 90,853 $ 94,031 $ 63,033 $ 54,873 Total Average Stockholders’ Equity $ 1,055,175 $ 1,070,623 $ 1,065,338 $ 1,024,914 $ 1,016,097 $ 994,925 Less: Average Goodwill (110,715) (85,323) (103,477) (79,842) (79,593) (14,775) Less: Average Core Deposit Intangible (13,288) (5,128) (11,352) (5,717) (6,769) (1,478) Total Average Tangible Stockholders’ Equity $ 931,172 $ 980,172 $ 950,509 $ 939,355 $ 929,735 $ 978,672 Core Return on Average Tangible Equity 8.61 % 9.17 % 9.56 % 10.01 % 6.78 % 5.61 % (1) Ratios for the three months ended March 31, 2023 and 2022 are annualized. 26
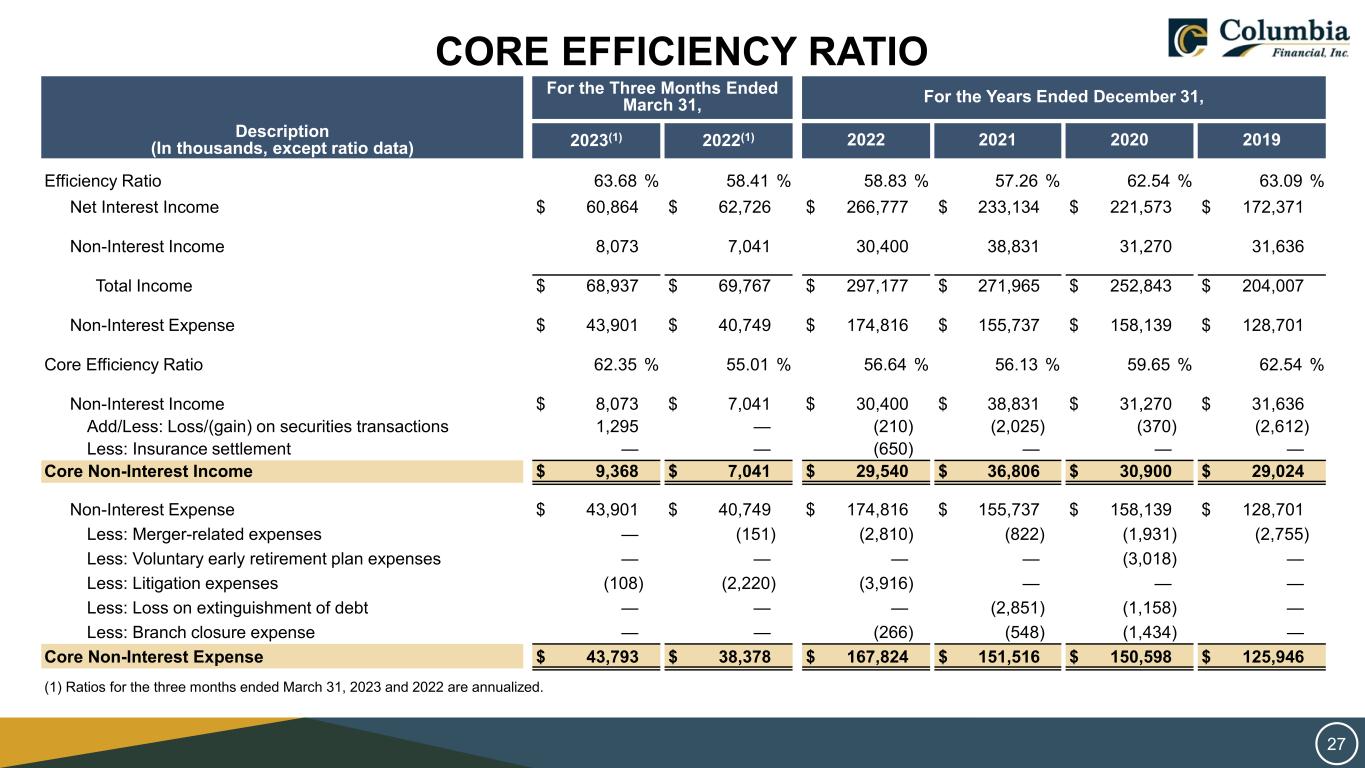
CORE EFFICIENCY RATIO For the Three Months Ended March 31, For the Years Ended December 31, Description (In thousands, except ratio data) 2023(1) 2022(1) 2022 2021 2020 2019 Efficiency Ratio 63.68 % 58.41 % 58.83 % 57.26 % 62.54 % 63.09 % Net Interest Income $ 60,864 $ 62,726 $ 266,777 $ 233,134 $ 221,573 $ 172,371 Non-Interest Income 8,073 7,041 30,400 38,831 31,270 31,636 Total Income $ 68,937 $ 69,767 $ 297,177 $ 271,965 $ 252,843 $ 204,007 Non-Interest Expense $ 43,901 $ 40,749 $ 174,816 $ 155,737 $ 158,139 $ 128,701 Core Efficiency Ratio 62.35 % 55.01 % 56.64 % 56.13 % 59.65 % 62.54 % Non-Interest Income $ 8,073 $ 7,041 $ 30,400 $ 38,831 $ 31,270 $ 31,636 Add/Less: Loss/(gain) on securities transactions 1,295 — (210) (2,025) (370) (2,612) Less: Insurance settlement — — (650) — — — Core Non-Interest Income $ 9,368 $ 7,041 $ 29,540 $ 36,806 $ 30,900 $ 29,024 Non-Interest Expense $ 43,901 $ 40,749 $ 174,816 $ 155,737 $ 158,139 $ 128,701 Less: Merger-related expenses — (151) (2,810) (822) (1,931) (2,755) Less: Voluntary early retirement plan expenses — — — — (3,018) — Less: Litigation expenses (108) (2,220) (3,916) — — — Less: Loss on extinguishment of debt — — — (2,851) (1,158) — Less: Branch closure expense — — (266) (548) (1,434) — Core Non-Interest Expense $ 43,793 $ 38,378 $ 167,824 $ 151,516 $ 150,598 $ 125,946 (1) Ratios for the three months ended March 31, 2023 and 2022 are annualized. 27


