0001710366falseFY2025P1YP1Yhttp://fasb.org/us-gaap/2025#OtherAssetsMiscellaneousNoncurrenthttp://fasb.org/us-gaap/2025#OtherAssetsMiscellaneousNoncurrenthttp://fasb.org/us-gaap/2025#AccruedLiabilitiesCurrenthttp://fasb.org/us-gaap/2025#AccruedLiabilitiesCurrenthttp://fasb.org/us-gaap/2025#OtherLiabilitiesNoncurrenthttp://fasb.org/us-gaap/2025#OtherLiabilitiesNoncurrentiso4217:USDxbrli:sharesiso4217:USDxbrli:sharesxbrli:purecnr:statecnr:minecnr:terminalcnr:subsidiarycnr:treatmentSystemcnr:plancnr:segment00017103662025-01-012025-12-3100017103662025-06-3000017103662026-01-3000017103662024-01-012024-12-3100017103662023-01-012023-12-3100017103662025-12-3100017103662024-12-310001710366us-gaap:CommonStockMember2022-12-310001710366us-gaap:AdditionalPaidInCapitalMember2022-12-310001710366us-gaap:RetainedEarningsMember2022-12-310001710366us-gaap:AccumulatedOtherComprehensiveIncomeMember2022-12-3100017103662022-12-310001710366us-gaap:RetainedEarningsMember2023-01-012023-12-310001710366us-gaap:AccumulatedOtherComprehensiveIncomeMember2023-01-012023-12-310001710366us-gaap:CommonStockMember2023-01-012023-12-310001710366us-gaap:AdditionalPaidInCapitalMember2023-01-012023-12-310001710366us-gaap:CommonStockMember2023-12-310001710366us-gaap:AdditionalPaidInCapitalMember2023-12-310001710366us-gaap:RetainedEarningsMember2023-12-310001710366us-gaap:AccumulatedOtherComprehensiveIncomeMember2023-12-3100017103662023-12-310001710366us-gaap:RetainedEarningsMember2024-01-012024-12-310001710366us-gaap:AccumulatedOtherComprehensiveIncomeMember2024-01-012024-12-310001710366us-gaap:CommonStockMember2024-01-012024-12-310001710366us-gaap:AdditionalPaidInCapitalMember2024-01-012024-12-310001710366us-gaap:CommonStockMember2024-12-310001710366us-gaap:AdditionalPaidInCapitalMember2024-12-310001710366us-gaap:RetainedEarningsMember2024-12-310001710366us-gaap:AccumulatedOtherComprehensiveIncomeMember2024-12-310001710366us-gaap:RetainedEarningsMember2025-01-012025-12-310001710366us-gaap:AccumulatedOtherComprehensiveIncomeMember2025-01-012025-12-310001710366us-gaap:CommonStockMember2025-01-012025-12-310001710366us-gaap:AdditionalPaidInCapitalMember2025-01-012025-12-310001710366us-gaap:CommonStockMember2025-12-310001710366us-gaap:AdditionalPaidInCapitalMember2025-12-310001710366us-gaap:RetainedEarningsMember2025-12-310001710366us-gaap:AccumulatedOtherComprehensiveIncomeMember2025-12-310001710366cnr:TermLoanBFacilityMember2025-01-012025-12-310001710366cnr:TermLoanBFacilityMember2024-01-012024-12-310001710366cnr:TermLoanBFacilityMember2023-01-012023-12-310001710366cnr:SeniorSecuredSecondLienNotesDue2025Member2025-01-012025-12-310001710366cnr:SeniorSecuredSecondLienNotesDue2025Member2024-01-012024-12-310001710366cnr:SeniorSecuredSecondLienNotesDue2025Member2023-01-012023-12-310001710366cnr:DominionTerminalMember2025-01-140001710366srt:MinimumMemberus-gaap:BuildingAndBuildingImprovementsMember2025-12-310001710366srt:MaximumMemberus-gaap:BuildingAndBuildingImprovementsMember2025-12-310001710366srt:MinimumMemberus-gaap:MachineryAndEquipmentMember2025-12-310001710366srt:MaximumMemberus-gaap:MachineryAndEquipmentMember2025-12-310001710366us-gaap:RestrictedStockUnitsRSUMember2025-01-012025-12-310001710366us-gaap:RestrictedStockUnitsRSUMember2024-01-012024-12-310001710366us-gaap:RestrictedStockUnitsRSUMember2023-01-012023-12-310001710366us-gaap:PerformanceSharesMember2025-01-012025-12-310001710366us-gaap:PerformanceSharesMember2024-01-012024-12-310001710366us-gaap:PerformanceSharesMember2023-01-012023-12-310001710366cnr:ArchResourcesIncMember2025-01-142025-01-140001710366cnr:ArchResourcesIncMember2025-01-140001710366cnr:ArchResourcesIncMember2025-01-132025-01-1300017103662025-01-140001710366cnr:ArchResourcesIncMember2025-01-012025-12-310001710366cnr:ArchResourcesIncMemberus-gaap:OtherNoncurrentAssetsMember2025-12-310001710366cnr:ArchResourcesIncMemberus-gaap:OtherNoncurrentLiabilitiesMember2025-12-310001710366srt:MinimumMember2025-01-012025-12-310001710366srt:MaximumMember2025-01-012025-12-310001710366cnr:ArchResourcesIncMembercnr:BusinessCombinationProFormaInformationNonrecurringAdjustmentTotalMember2024-01-012024-12-310001710366cnr:ArchResourcesIncMembercnr:BusinessCombinationProFormaInformationNonrecurringAdjustmentTransactionAndEmployeeRelatedCostsMember2024-01-012024-12-310001710366cnr:ArchResourcesIncMemberus-gaap:AcquisitionRelatedCostsMember2024-01-012024-12-310001710366cnr:ArchResourcesIncMemberus-gaap:FairValueAdjustmentToInventoryMember2024-01-012024-12-310001710366cnr:PowerGenerationMembercnr:DomesticCoalRevenueMember2025-01-012025-12-310001710366cnr:PowerGenerationMembercnr:ExportCoalRevenueMember2025-01-012025-12-310001710366cnr:PowerGenerationMember2025-01-012025-12-310001710366cnr:IndustrialMembercnr:DomesticCoalRevenueMember2025-01-012025-12-310001710366cnr:IndustrialMembercnr:ExportCoalRevenueMember2025-01-012025-12-310001710366cnr:IndustrialMember2025-01-012025-12-310001710366cnr:MetallurgicalMembercnr:DomesticCoalRevenueMember2025-01-012025-12-310001710366cnr:MetallurgicalMembercnr:ExportCoalRevenueMember2025-01-012025-12-310001710366cnr:MetallurgicalMember2025-01-012025-12-310001710366us-gaap:PublicUtilitiesInventoryCoalMembercnr:DomesticCoalRevenueMember2025-01-012025-12-310001710366us-gaap:PublicUtilitiesInventoryCoalMembercnr:ExportCoalRevenueMember2025-01-012025-12-310001710366us-gaap:PublicUtilitiesInventoryCoalMember2025-01-012025-12-310001710366cnr:TerminalRevenueMember2025-01-012025-12-310001710366cnr:OtherRevenueMember2025-01-012025-12-310001710366cnr:PowerGenerationMembercnr:DomesticCoalRevenueMember2024-01-012024-12-310001710366cnr:PowerGenerationMembercnr:ExportCoalRevenueMember2024-01-012024-12-310001710366cnr:PowerGenerationMember2024-01-012024-12-310001710366cnr:IndustrialMembercnr:DomesticCoalRevenueMember2024-01-012024-12-310001710366cnr:IndustrialMembercnr:ExportCoalRevenueMember2024-01-012024-12-310001710366cnr:IndustrialMember2024-01-012024-12-310001710366cnr:MetallurgicalMembercnr:DomesticCoalRevenueMember2024-01-012024-12-310001710366cnr:MetallurgicalMembercnr:ExportCoalRevenueMember2024-01-012024-12-310001710366cnr:MetallurgicalMember2024-01-012024-12-310001710366us-gaap:PublicUtilitiesInventoryCoalMembercnr:DomesticCoalRevenueMember2024-01-012024-12-310001710366us-gaap:PublicUtilitiesInventoryCoalMembercnr:ExportCoalRevenueMember2024-01-012024-12-310001710366us-gaap:PublicUtilitiesInventoryCoalMember2024-01-012024-12-310001710366cnr:TerminalRevenueMember2024-01-012024-12-310001710366cnr:OtherRevenueMember2024-01-012024-12-310001710366cnr:PowerGenerationMembercnr:DomesticCoalRevenueMember2023-01-012023-12-310001710366cnr:PowerGenerationMembercnr:ExportCoalRevenueMember2023-01-012023-12-310001710366cnr:PowerGenerationMember2023-01-012023-12-310001710366cnr:IndustrialMembercnr:DomesticCoalRevenueMember2023-01-012023-12-310001710366cnr:IndustrialMembercnr:ExportCoalRevenueMember2023-01-012023-12-310001710366cnr:IndustrialMember2023-01-012023-12-310001710366cnr:MetallurgicalMembercnr:DomesticCoalRevenueMember2023-01-012023-12-310001710366cnr:MetallurgicalMembercnr:ExportCoalRevenueMember2023-01-012023-12-310001710366cnr:MetallurgicalMember2023-01-012023-12-310001710366us-gaap:PublicUtilitiesInventoryCoalMembercnr:DomesticCoalRevenueMember2023-01-012023-12-310001710366us-gaap:PublicUtilitiesInventoryCoalMembercnr:ExportCoalRevenueMember2023-01-012023-12-310001710366us-gaap:PublicUtilitiesInventoryCoalMember2023-01-012023-12-310001710366cnr:TerminalRevenueMember2023-01-012023-12-3100017103662026-01-012025-12-310001710366cnr:SeniorSecuredSecondLienNotesDue2025Memberus-gaap:SeniorNotesMember2017-12-3100017103662025-02-180001710366country:US2025-12-310001710366country:US2025-01-012025-12-310001710366us-gaap:StateAndLocalJurisdictionMember2025-12-310001710366us-gaap:ValuationAllowanceOfDeferredTaxAssetsMember2024-12-310001710366us-gaap:ValuationAllowanceOfDeferredTaxAssetsMember2025-01-012025-12-310001710366us-gaap:ValuationAllowanceOfDeferredTaxAssetsMember2025-12-310001710366us-gaap:ValuationAllowanceOfDeferredTaxAssetsMember2023-12-310001710366us-gaap:USTreasurySecuritiesMember2024-12-310001710366us-gaap:TradeAccountsReceivableMember2024-12-310001710366cnr:OtherNontradeContractualArrangementsMember2024-12-310001710366us-gaap:TradeAccountsReceivableMember2025-01-012025-12-310001710366cnr:OtherNontradeContractualArrangementsMember2025-01-012025-12-310001710366us-gaap:TradeAccountsReceivableMember2025-12-310001710366cnr:OtherNontradeContractualArrangementsMember2025-12-310001710366cnr:PennsylvaniaDepartmentOfEnvironmentalProtectionMembercnr:GlobalWaterTreatmentTrustFundMember2024-10-020001710366cnr:PennsylvaniaDepartmentOfEnvironmentalProtectionMembercnr:GlobalWaterTreatmentTrustFundMember2024-10-022024-10-020001710366cnr:PennsylvaniaDepartmentOfEnvironmentalProtectionMembercnr:GlobalWaterTreatmentTrustFundMember2024-10-022025-12-310001710366cnr:GlobalWaterTreatmentTrustFundMember2025-12-310001710366cnr:GlobalWaterTreatmentTrustFundMember2024-12-310001710366cnr:CoalAndOtherPlantAndEquipmentMember2025-12-310001710366cnr:CoalAndOtherPlantAndEquipmentMember2024-12-310001710366us-gaap:MiningPropertiesAndMineralRightsMember2025-12-310001710366us-gaap:MiningPropertiesAndMineralRightsMember2024-12-310001710366cnr:AirshaftsMember2025-12-310001710366cnr:AirshaftsMember2024-12-310001710366us-gaap:MineDevelopmentMember2025-12-310001710366us-gaap:MineDevelopmentMember2024-12-310001710366cnr:CoalAdvanceMiningRoyaltiesMember2025-12-310001710366cnr:CoalAdvanceMiningRoyaltiesMember2024-12-310001710366cnr:AccountsReceivableSecuritizationFacilityMemberus-gaap:LineOfCreditMember2025-12-310001710366cnr:AccountsReceivableSecuritizationFacilityMemberus-gaap:LineOfCreditMember2025-01-012025-12-310001710366cnr:AccountsReceivableSecuritizationFacilityMemberus-gaap:LineOfCreditMember2024-12-310001710366cnr:AccountsReceivableSecuritizationFacilityMemberus-gaap:LineOfCreditMember2024-01-012024-12-310001710366cnr:AccountsReceivableSecuritizationFacilityMemberus-gaap:LineOfCreditMember2023-01-012023-12-310001710366cnr:WVEDASolidWasteDisposalRevenueBondsMember2025-12-310001710366cnr:WVEDASolidWasteDisposalRevenueBondsMember2024-12-310001710366cnr:WVEDASolidWasteDisposalRevenueBondsMember2025-03-270001710366cnr:MEDCORevenueBondsMember2025-12-310001710366cnr:MEDCORevenueBondsMember2024-12-310001710366cnr:MEDCORevenueBondsMember2025-03-270001710366cnr:PEDFASolidWasteDisposalRevenueBondsMember2025-12-310001710366cnr:PEDFASolidWasteDisposalRevenueBondsMember2024-12-310001710366cnr:PEDFASolidWasteDisposalRevenueBondsMember2025-03-270001710366cnr:EquipmentFinancingMember2024-12-310001710366cnr:EquipmentFinancingMember2025-12-310001710366cnr:AdvanceRoyaltyCommitmentsMember2025-12-310001710366cnr:AdvanceRoyaltyCommitmentsMember2024-12-310001710366cnr:OtherAssetBackedFinancingMember2025-12-310001710366cnr:OtherAssetBackedFinancingMember2024-12-310001710366us-gaap:RevolvingCreditFacilityMemberus-gaap:LoansPayableMember2025-12-310001710366us-gaap:RevolvingCreditFacilityMemberus-gaap:LoansPayableMember2024-12-310001710366us-gaap:RevolvingCreditFacilityMemberus-gaap:LineOfCreditMember2024-12-310001710366us-gaap:RevolvingCreditFacilityMemberus-gaap:LineOfCreditMember2025-01-310001710366us-gaap:RevolvingCreditFacilityMemberus-gaap:LineOfCreditMember2025-01-012025-01-310001710366us-gaap:RevolvingCreditFacilityMemberus-gaap:LineOfCreditMember2025-01-012025-12-310001710366cnr:RevolvingCreditFacilityAndTLAFacilityMembersrt:MaximumMemberus-gaap:LineOfCreditMember2025-12-310001710366cnr:RevolvingCreditFacilityAndTLAFacilityMemberus-gaap:LineOfCreditMember2025-12-310001710366us-gaap:RevolvingCreditFacilityMember2025-12-310001710366us-gaap:RevolvingCreditFacilityMemberus-gaap:LineOfCreditMember2025-12-310001710366us-gaap:RevolvingCreditFacilityMember2024-12-310001710366srt:NonGuarantorSubsidiariesMember2025-12-310001710366srt:NonGuarantorSubsidiariesMember2024-12-310001710366srt:NonGuarantorSubsidiariesMember2025-01-012025-12-310001710366srt:NonGuarantorSubsidiariesMember2024-01-012024-12-310001710366srt:NonGuarantorSubsidiariesMember2023-01-012023-12-310001710366cnr:PEDFASolidWasteDisposalRevenueBondsMember2025-03-272025-03-270001710366cnr:MEDCORevenueBondsMember2025-03-272025-03-270001710366cnr:WVEDASolidWasteDisposalRevenueBondsMember2025-03-272025-03-270001710366cnr:Series2020Membercnr:WVEDASolidWasteDisposalRevenueBondsMember2025-03-270001710366cnr:Series2021Membercnr:WVEDASolidWasteDisposalRevenueBondsMember2025-03-270001710366us-gaap:OtherPostretirementBenefitPlansDefinedBenefitMember2025-12-310001710366us-gaap:PensionPlansDefinedBenefitMember2024-12-310001710366us-gaap:PensionPlansDefinedBenefitMember2023-12-310001710366us-gaap:OtherPostretirementBenefitPlansDefinedBenefitMember2024-12-310001710366us-gaap:OtherPostretirementBenefitPlansDefinedBenefitMember2023-12-310001710366us-gaap:PensionPlansDefinedBenefitMember2025-01-012025-12-310001710366us-gaap:PensionPlansDefinedBenefitMember2024-01-012024-12-310001710366us-gaap:OtherPostretirementBenefitPlansDefinedBenefitMember2025-01-012025-12-310001710366us-gaap:OtherPostretirementBenefitPlansDefinedBenefitMember2024-01-012024-12-310001710366us-gaap:PensionPlansDefinedBenefitMember2025-12-310001710366us-gaap:PensionPlansDefinedBenefitMember2023-01-012023-12-310001710366us-gaap:OtherPostretirementBenefitPlansDefinedBenefitMember2023-01-012023-12-310001710366cnr:UnitedStatesEquitySecuritiesMember2025-12-310001710366cnr:NonUSEquitySecuritiesMember2025-12-310001710366us-gaap:DefinedBenefitPlanEquitySecuritiesCommonStockEmployerRelatedPartyMember2024-12-310001710366us-gaap:DefinedBenefitPlanEquitySecuritiesCommonStockEmployerRelatedPartyMember2025-12-310001710366us-gaap:DefinedBenefitPlanCashAndCashEquivalentsMember2025-12-310001710366us-gaap:DefinedBenefitPlanCashAndCashEquivalentsMemberus-gaap:FairValueInputsLevel1Member2025-12-310001710366us-gaap:DefinedBenefitPlanCashAndCashEquivalentsMemberus-gaap:FairValueInputsLevel2Member2025-12-310001710366us-gaap:DefinedBenefitPlanCashAndCashEquivalentsMemberus-gaap:FairValueInputsLevel3Member2025-12-310001710366us-gaap:DefinedBenefitPlanCashAndCashEquivalentsMember2024-12-310001710366us-gaap:DefinedBenefitPlanCashAndCashEquivalentsMemberus-gaap:FairValueInputsLevel1Member2024-12-310001710366us-gaap:DefinedBenefitPlanCashAndCashEquivalentsMemberus-gaap:FairValueInputsLevel2Member2024-12-310001710366us-gaap:DefinedBenefitPlanCashAndCashEquivalentsMemberus-gaap:FairValueInputsLevel3Member2024-12-310001710366us-gaap:PrivateEquityFundsMember2025-12-310001710366us-gaap:PrivateEquityFundsMemberus-gaap:FairValueInputsLevel1Member2025-12-310001710366us-gaap:PrivateEquityFundsMemberus-gaap:FairValueInputsLevel2Member2025-12-310001710366us-gaap:PrivateEquityFundsMemberus-gaap:FairValueInputsLevel3Member2025-12-310001710366us-gaap:PrivateEquityFundsMember2024-12-310001710366us-gaap:PrivateEquityFundsMemberus-gaap:FairValueInputsLevel1Member2024-12-310001710366us-gaap:PrivateEquityFundsMemberus-gaap:FairValueInputsLevel2Member2024-12-310001710366us-gaap:PrivateEquityFundsMemberus-gaap:FairValueInputsLevel3Member2024-12-310001710366us-gaap:FairValueInputsLevel1Member2025-12-310001710366us-gaap:FairValueInputsLevel2Member2025-12-310001710366us-gaap:FairValueInputsLevel3Member2025-12-310001710366us-gaap:FairValueInputsLevel1Member2024-12-310001710366us-gaap:FairValueInputsLevel2Member2024-12-310001710366us-gaap:FairValueInputsLevel3Member2024-12-310001710366us-gaap:NonqualifiedPlanMemberus-gaap:PensionPlansDefinedBenefitMember2025-12-310001710366cnr:CoalWorkersPneumoconiosisMember2024-12-310001710366cnr:CoalWorkersPneumoconiosisMember2023-12-310001710366cnr:WorkersCompensationMember2024-12-310001710366cnr:WorkersCompensationMember2023-12-310001710366cnr:CoalWorkersPneumoconiosisMember2025-01-012025-12-310001710366cnr:CoalWorkersPneumoconiosisMember2024-01-012024-12-310001710366cnr:WorkersCompensationMember2025-01-012025-12-310001710366cnr:WorkersCompensationMember2024-01-012024-12-310001710366cnr:CoalWorkersPneumoconiosisMember2025-12-310001710366cnr:WorkersCompensationMember2025-12-310001710366cnr:CoalWorkersPneumoconiosisMember2023-01-012023-12-310001710366cnr:WorkersCompensationMember2023-01-012023-12-310001710366cnr:WorkersCompensationInsuredPlanMember2025-12-310001710366cnr:WorkersCompensationInsuredPlanReimbursableMember2025-12-310001710366cnr:ActuarialBenefitsMember2025-12-310001710366cnr:OtherBenefitsMember2025-12-310001710366cnr:RetireeHealthBenefitActOf1992Member2025-01-012025-12-310001710366cnr:RetireeHealthBenefitActOf1992Member2024-01-012024-12-310001710366cnr:RetireeHealthBenefitActOf1992Member2023-01-012023-12-310001710366cnr:RetireeHealthBenefitActOf1992Member2025-12-310001710366cnr:NonPensionMultiemployerPlansMember2025-12-310001710366cnr:NonPensionMultiemployerPlansMember2024-12-310001710366cnr:NonPensionMultiemployerPlansMember2023-12-310001710366cnr:LongTermDisabilityMemberMember2025-01-012025-12-310001710366cnr:LongTermDisabilityMemberMember2024-01-012024-12-310001710366cnr:LongTermDisabilityMemberMember2023-01-012023-12-310001710366cnr:LongTermDisabilityMemberMember2025-12-310001710366cnr:LongTermDisabilityMemberMember2024-12-310001710366cnr:LongTermDisabilityMemberMember2023-12-310001710366cnr:ArchResourcesIncMember2025-02-180001710366cnr:PerformanceIncentivePlanRemainingArchPlanSharesMember2025-12-310001710366us-gaap:SellingGeneralAndAdministrativeExpensesMember2025-01-012025-12-310001710366us-gaap:SellingGeneralAndAdministrativeExpensesMember2024-01-012024-12-310001710366us-gaap:SellingGeneralAndAdministrativeExpensesMember2023-01-012023-12-310001710366us-gaap:RestrictedStockUnitsRSUMember2025-01-012025-12-310001710366us-gaap:RestrictedStockUnitsRSUMember2024-01-012024-12-310001710366us-gaap:RestrictedStockUnitsRSUMember2023-01-012023-12-310001710366us-gaap:RestrictedStockUnitsRSUMember2024-12-310001710366us-gaap:RestrictedStockUnitsRSUMember2025-12-310001710366us-gaap:PerformanceSharesMember2025-01-012025-12-310001710366us-gaap:PerformanceSharesMember2024-01-012024-12-310001710366us-gaap:PerformanceSharesMember2023-01-012023-12-310001710366us-gaap:PerformanceSharesMember2024-12-310001710366us-gaap:PerformanceSharesMember2025-12-310001710366cnr:NotesReceivedFromPropertySalesMember2025-01-012025-12-310001710366cnr:NotesReceivedFromPropertySalesMember2024-01-012024-12-310001710366cnr:NotesReceivedFromPropertySalesMember2023-01-012023-12-310001710366us-gaap:NonUsMembercnr:ExportersConcentrationRiskMemberus-gaap:SalesRevenueNetMember2025-01-012025-12-310001710366us-gaap:NonUsMembercnr:ExportersConcentrationRiskMemberus-gaap:SalesRevenueNetMember2024-01-012024-12-310001710366us-gaap:NonUsMembercnr:ExportersConcentrationRiskMemberus-gaap:SalesRevenueNetMember2023-01-012023-12-310001710366cnr:CoalRevenueMembercountry:USus-gaap:GeographicConcentrationRiskMemberus-gaap:SalesRevenueNetMember2025-01-012025-12-310001710366cnr:CoalRevenueMembercountry:USus-gaap:GeographicConcentrationRiskMemberus-gaap:SalesRevenueNetMember2024-01-012024-12-310001710366cnr:CoalRevenueMembercountry:USus-gaap:GeographicConcentrationRiskMemberus-gaap:SalesRevenueNetMember2023-01-012023-12-310001710366cnr:OneCustomerMemberus-gaap:CustomerConcentrationRiskMemberus-gaap:AccountsReceivableMember2025-01-012025-12-310001710366cnr:TwoCustomersMemberus-gaap:CustomerConcentrationRiskMemberus-gaap:SalesRevenueNetMember2024-01-012024-12-310001710366cnr:TwoCustomersMemberus-gaap:CustomerConcentrationRiskMemberus-gaap:SalesRevenueNetMember2023-01-012023-12-310001710366cnr:TwoCustomersMemberus-gaap:CustomerConcentrationRiskMemberus-gaap:AccountsReceivableMember2024-01-012024-12-310001710366cnr:ThermalCoalUtilitiesMemberus-gaap:CustomerConcentrationRiskMemberus-gaap:AccountsReceivableMember2025-12-310001710366cnr:ThermalCoalUtilitiesMemberus-gaap:CustomerConcentrationRiskMemberus-gaap:AccountsReceivableMember2024-12-310001710366cnr:CoalExportersAndDistributorsMemberus-gaap:CustomerConcentrationRiskMemberus-gaap:AccountsReceivableMember2025-12-310001710366cnr:CoalExportersAndDistributorsMemberus-gaap:CustomerConcentrationRiskMemberus-gaap:AccountsReceivableMember2024-12-310001710366cnr:SteelAndCokeProducersMemberus-gaap:CustomerConcentrationRiskMemberus-gaap:AccountsReceivableMember2025-12-310001710366cnr:SteelAndCokeProducersMemberus-gaap:CustomerConcentrationRiskMemberus-gaap:AccountsReceivableMember2024-12-310001710366us-gaap:OtherCustomerMemberus-gaap:CustomerConcentrationRiskMemberus-gaap:AccountsReceivableMember2025-12-310001710366us-gaap:OtherCustomerMemberus-gaap:CustomerConcentrationRiskMemberus-gaap:AccountsReceivableMember2024-12-310001710366us-gaap:USTreasurySecuritiesMemberus-gaap:FairValueInputsLevel1Member2025-12-310001710366us-gaap:USTreasurySecuritiesMemberus-gaap:FairValueInputsLevel2Member2025-12-310001710366us-gaap:USTreasurySecuritiesMemberus-gaap:FairValueInputsLevel3Member2025-12-310001710366us-gaap:USTreasurySecuritiesMemberus-gaap:FairValueInputsLevel1Member2024-12-310001710366us-gaap:USTreasurySecuritiesMemberus-gaap:FairValueInputsLevel2Member2024-12-310001710366us-gaap:USTreasurySecuritiesMemberus-gaap:FairValueInputsLevel3Member2024-12-310001710366cnr:GlobalWaterTreatmentTrustFundMemberus-gaap:FairValueInputsLevel1Member2025-12-310001710366cnr:GlobalWaterTreatmentTrustFundMemberus-gaap:FairValueInputsLevel2Member2025-12-310001710366cnr:GlobalWaterTreatmentTrustFundMemberus-gaap:FairValueInputsLevel3Member2025-12-310001710366cnr:GlobalWaterTreatmentTrustFundMemberus-gaap:FairValueInputsLevel1Member2024-12-310001710366cnr:GlobalWaterTreatmentTrustFundMemberus-gaap:FairValueInputsLevel2Member2024-12-310001710366cnr:GlobalWaterTreatmentTrustFundMemberus-gaap:FairValueInputsLevel3Member2024-12-310001710366us-gaap:CarryingReportedAmountFairValueDisclosureMember2025-12-310001710366us-gaap:EstimateOfFairValueFairValueDisclosureMember2025-12-310001710366us-gaap:CarryingReportedAmountFairValueDisclosureMember2024-12-310001710366us-gaap:EstimateOfFairValueFairValueDisclosureMember2024-12-310001710366us-gaap:PendingLitigationMembercnr:UnitedMineWorkersOfAmerica1992BenefitPlanLitigationMember2025-12-310001710366us-gaap:PendingLitigationMembercnr:UnitedMineWorkersOfAmerica1992BenefitPlanLitigationMember2025-01-012025-12-310001710366us-gaap:StandbyLettersOfCreditMembercnr:EmployeeRelatedCommitmentMember2025-12-310001710366us-gaap:StandbyLettersOfCreditMembercnr:EnvironmentalCommitmentMember2025-12-310001710366us-gaap:StandbyLettersOfCreditMembercnr:OtherCommitmentMember2025-12-310001710366us-gaap:StandbyLettersOfCreditMember2025-12-310001710366us-gaap:SuretyBondMembercnr:EmployeeRelatedCommitmentMember2025-12-310001710366us-gaap:SuretyBondMembercnr:EnvironmentalCommitmentMember2025-12-310001710366us-gaap:SuretyBondMembercnr:OtherCommitmentMember2025-12-310001710366us-gaap:SuretyBondMember2025-12-310001710366cnr:HighCVThermalMember2025-01-012025-12-310001710366cnr:MetallurgicalSegmentMember2025-01-012025-12-310001710366cnr:PRBMember2025-01-012025-12-310001710366cnr:CoreMarineTerminalMember2025-01-012025-12-310001710366us-gaap:IntersegmentEliminationMembercnr:HighCVThermalMember2025-01-012025-12-310001710366us-gaap:IntersegmentEliminationMembercnr:MetallurgicalSegmentMember2025-01-012025-12-310001710366us-gaap:IntersegmentEliminationMembercnr:PRBMember2025-01-012025-12-310001710366us-gaap:IntersegmentEliminationMembercnr:CoreMarineTerminalMember2025-01-012025-12-310001710366us-gaap:OperatingSegmentsMembercnr:HighCVThermalMember2025-01-012025-12-310001710366us-gaap:OperatingSegmentsMembercnr:MetallurgicalSegmentMember2025-01-012025-12-310001710366us-gaap:OperatingSegmentsMembercnr:PRBMember2025-01-012025-12-310001710366us-gaap:OperatingSegmentsMembercnr:CoreMarineTerminalMember2025-01-012025-12-310001710366us-gaap:OperatingSegmentsMember2025-01-012025-12-310001710366cnr:CorporateAndReconcilingItemsMember2025-01-012025-12-310001710366us-gaap:IntersegmentEliminationMember2025-01-012025-12-310001710366us-gaap:OperatingSegmentsMembercnr:HighCVThermalMember2025-12-310001710366us-gaap:OperatingSegmentsMembercnr:MetallurgicalSegmentMember2025-12-310001710366us-gaap:OperatingSegmentsMembercnr:PRBMember2025-12-310001710366us-gaap:OperatingSegmentsMembercnr:CoreMarineTerminalMember2025-12-310001710366cnr:CorporateAndReconcilingItemsMember2025-12-310001710366cnr:HighCVThermalMember2024-01-012024-12-310001710366cnr:MetallurgicalSegmentMember2024-01-012024-12-310001710366cnr:PRBMember2024-01-012024-12-310001710366cnr:CoreMarineTerminalMember2024-01-012024-12-310001710366us-gaap:IntersegmentEliminationMembercnr:HighCVThermalMember2024-01-012024-12-310001710366us-gaap:IntersegmentEliminationMembercnr:MetallurgicalSegmentMember2024-01-012024-12-310001710366us-gaap:IntersegmentEliminationMembercnr:PRBMember2024-01-012024-12-310001710366us-gaap:IntersegmentEliminationMembercnr:CoreMarineTerminalMember2024-01-012024-12-310001710366us-gaap:OperatingSegmentsMembercnr:HighCVThermalMember2024-01-012024-12-310001710366us-gaap:OperatingSegmentsMembercnr:MetallurgicalSegmentMember2024-01-012024-12-310001710366us-gaap:OperatingSegmentsMembercnr:PRBMember2024-01-012024-12-310001710366us-gaap:OperatingSegmentsMembercnr:CoreMarineTerminalMember2024-01-012024-12-310001710366us-gaap:OperatingSegmentsMember2024-01-012024-12-310001710366cnr:CorporateAndReconcilingItemsMember2024-01-012024-12-310001710366us-gaap:IntersegmentEliminationMember2024-01-012024-12-310001710366us-gaap:OperatingSegmentsMembercnr:HighCVThermalMember2024-12-310001710366us-gaap:OperatingSegmentsMembercnr:MetallurgicalSegmentMember2024-12-310001710366us-gaap:OperatingSegmentsMembercnr:PRBMember2024-12-310001710366us-gaap:OperatingSegmentsMembercnr:CoreMarineTerminalMember2024-12-310001710366cnr:CorporateAndReconcilingItemsMember2024-12-310001710366cnr:HighCVThermalMember2023-01-012023-12-310001710366cnr:MetallurgicalSegmentMember2023-01-012023-12-310001710366cnr:PRBMember2023-01-012023-12-310001710366cnr:CoreMarineTerminalMember2023-01-012023-12-310001710366us-gaap:IntersegmentEliminationMembercnr:HighCVThermalMember2023-01-012023-12-310001710366us-gaap:IntersegmentEliminationMembercnr:MetallurgicalSegmentMember2023-01-012023-12-310001710366us-gaap:IntersegmentEliminationMembercnr:PRBMember2023-01-012023-12-310001710366us-gaap:IntersegmentEliminationMembercnr:CoreMarineTerminalMember2023-01-012023-12-310001710366us-gaap:OperatingSegmentsMembercnr:HighCVThermalMember2023-01-012023-12-310001710366us-gaap:OperatingSegmentsMembercnr:MetallurgicalSegmentMember2023-01-012023-12-310001710366us-gaap:OperatingSegmentsMembercnr:PRBMember2023-01-012023-12-310001710366us-gaap:OperatingSegmentsMembercnr:CoreMarineTerminalMember2023-01-012023-12-310001710366us-gaap:OperatingSegmentsMember2023-01-012023-12-310001710366us-gaap:IntersegmentEliminationMember2023-01-012023-12-310001710366us-gaap:OperatingSegmentsMembercnr:HighCVThermalMember2023-12-310001710366us-gaap:OperatingSegmentsMembercnr:MetallurgicalSegmentMember2023-12-310001710366us-gaap:OperatingSegmentsMembercnr:PRBMember2023-12-310001710366us-gaap:OperatingSegmentsMembercnr:CoreMarineTerminalMember2023-12-310001710366cnr:CorporateAndReconcilingItemsMember2023-12-310001710366cnr:CorporateAndReconcilingItemsMember2023-01-012023-12-310001710366cnr:CustomerAMemberus-gaap:CustomerConcentrationRiskMemberus-gaap:SalesRevenueNetMember2024-01-012024-12-310001710366cnr:CustomerAMemberus-gaap:CustomerConcentrationRiskMemberus-gaap:SalesRevenueNetMember2023-01-012023-12-310001710366cnr:CustomerBMemberus-gaap:CustomerConcentrationRiskMemberus-gaap:SalesRevenueNetMember2024-01-012024-12-310001710366cnr:CustomerBMemberus-gaap:CustomerConcentrationRiskMemberus-gaap:SalesRevenueNetMember2023-01-012023-12-310001710366country:USus-gaap:GeographicConcentrationRiskMemberus-gaap:SalesRevenueNetMember2025-01-012025-12-310001710366country:INus-gaap:GeographicConcentrationRiskMemberus-gaap:SalesRevenueNetMember2025-01-012025-12-310001710366country:INus-gaap:GeographicConcentrationRiskMemberus-gaap:SalesRevenueNetMember2024-01-012024-12-310001710366country:USus-gaap:GeographicConcentrationRiskMemberus-gaap:SalesRevenueNetMember2024-01-012024-12-310001710366country:CNus-gaap:GeographicConcentrationRiskMemberus-gaap:SalesRevenueNetMember2024-01-012024-12-310001710366country:USus-gaap:GeographicConcentrationRiskMemberus-gaap:SalesRevenueNetMember2023-01-012023-12-310001710366country:INus-gaap:GeographicConcentrationRiskMemberus-gaap:SalesRevenueNetMember2023-01-012023-12-310001710366country:CAus-gaap:GeographicConcentrationRiskMemberus-gaap:PropertyPlantAndEquipmentMember2025-01-012025-12-310001710366country:CAus-gaap:GeographicConcentrationRiskMemberus-gaap:PropertyPlantAndEquipmentMember2024-01-012024-12-310001710366us-gaap:SubsequentEventMember2026-02-122026-02-1200017103662025-10-012025-12-31
UNITED STATES
SECURITIES AND EXCHANGE COMMISSION
Washington, D.C. 20549
FORM 10-K
(Mark One)
|
|
|
|
|
|
| ☒ |
ANNUAL REPORT PURSUANT TO SECTION 13 OR 15(d) OF THE SECURITIES EXCHANGE ACT OF 1934 |
For the fiscal year ended December 31, 2025
OR
|
|
|
|
|
|
| ☐ |
TRANSITION REPORT PURSUANT TO SECTION 13 OR 15(d) OF THE SECURITIES EXCHANGE ACT OF 1934 |
For the transition period from _______to _______
Commission file number: 001-38147
Core Natural Resources, Inc.
(Exact name of registrant as specified in its charter)
|
|
|
|
|
|
| Delaware |
82-1954058 |
| (State or other jurisdiction of incorporation or organization) |
(I.R.S. Employer Identification No.) |
275 Technology Drive Suite 101
Canonsburg, PA 15317-9565
(724) 416-8300
(Address, including zip code, and telephone number, including area code, of registrant’s principal executive offices)
Securities registered pursuant to Section 12(b) of the Act:
|
|
|
|
|
|
|
|
|
| Title of each class |
Trading Symbol(s) |
Name of each exchange on which registered |
| Common Stock ($0.01 par value) |
CNR |
New York Stock Exchange |
Securities registered pursuant to Section 12(g) of the Act: None
Indicate by check mark if the registrant is a well-known seasoned issuer, as defined in Rule 405 of the Securities Act. Yes ☒ No ☐
Indicate by check mark if the registrant is not required to file reports pursuant to Section 13 or Section 15(d) of the Act. Yes ☐ No ☒
Indicate by check mark whether the registrant (1) has filed all reports required to be filed by Section 13 or 15(d) of the Securities Exchange Act of 1934 during the preceding 12 months (or for such shorter period that the registrant was required to file such reports), and (2) has been subject to such filing requirements for the past 90 days. Yes ☒ No ☐
Indicate by check mark whether the registrant has submitted electronically every Interactive Data File required to be submitted pursuant to Rule 405 of Regulation S-T (§232.405 of this chapter) during the preceding 12 months (or for such shorter period that the registrant was required to submit such files). Yes ☒ No ☐
Indicate by check mark whether the registrant is a large accelerated filer, an accelerated filer, a non-accelerated filer, a smaller reporting company, or an emerging growth company. See the definitions of “large accelerated filer,” “accelerated filer,” “smaller reporting company” and “emerging growth company” in Rule 12b-2 of the Exchange Act.
Large accelerated filer ☒ Accelerated filer ☐ Non-accelerated filer ☐ Smaller Reporting Company ☐ Emerging Growth Company ☐
If an emerging growth company, indicate by check mark if the registrant has elected not to use the extended transition period for complying with any new or revised financial accounting standards provided pursuant to Section 13(a) of the Exchange Act. ☐
Indicate by check mark whether the registrant has filed a report on and attestation to its management’s assessment of the effectiveness of its internal control over financial reporting under Section 404(b) of the Sarbanes-Oxley Act (15 U.S.C. 7262(b)) by the registered public accounting firm that prepared or issued its audit report. Yes ☒ No ☐
If securities are registered pursuant to Section 12(b) of the Act, indicate by check mark whether the financial statements of the registrant included in the filing reflect the correction of an error to previously issued financial statements. ☐
Indicate by check mark whether any of those error corrections are restatements that required a recovery analysis of incentive-based compensation received by any of the registrant’s executive officers during the relevant recovery period pursuant to §240.10D-1(b). ☐
Indicate by check mark whether the registrant is a shell company (as defined in Rule 12b-2 of the Act). Yes ☐ No ☒
The aggregate value of common stock held by non-affiliates of the registrant (treating all executive officers and directors of the registrant, for this purpose, as if they may be affiliates of the registrant) was approximately $3,514,239,816 as of June 30, 2025, the last business day of the registrant’s most recently completed second fiscal quarter, based on the reported closing price of the common stock as reported on The New York Stock Exchange on such date.
The number of shares outstanding of the registrant’s common stock as of January 30, 2026 was 50,979,544 shares.
DOCUMENTS INCORPORATED BY REFERENCE:
Portions of Core Natural Resources, Inc.’s Proxy Statement for the 2026 Annual Meeting of Stockholders to be filed within 120 days of the end of the registrant’s fiscal year are incorporated by reference in Items 10, 11, 12, 13 and 14 of Part III.
TABLE OF CONTENTS
|
|
|
|
|
|
|
|
|
| |
|
Page |
|
|
|
|
|
|
|
|
|
|
| ITEM 1C. |
Cybersecurity |
|
|
|
|
|
|
|
|
|
|
| |
|
|
|
|
|
|
|
|
|
|
|
|
|
|
|
|
|
|
|
|
|
|
|
|
|
|
|
|
|
| |
|
|
|
|
|
|
|
|
|
|
|
|
|
|
|
|
|
|
| |
|
|
|
|
|
|
|
|
|
|
|
PART I
Explanatory Note
On January 14, 2025, CONSOL Energy Inc., a Delaware corporation, completed its previously announced all-stock merger of equals transaction (the “Merger”) with Arch Resources, Inc., a Delaware corporation (“Arch”), pursuant to that certain Agreement and Plan of Merger, dated as of August 20, 2024 (the “Merger Agreement”), by and among CONSOL Energy Inc., Mountain Range Merger Sub Inc., a Delaware corporation and wholly-owned subsidiary of CONSOL Energy Inc. (“Merger Sub”), and Arch. Pursuant to the terms of the Merger Agreement, Merger Sub merged with and into Arch, with Arch continuing as the surviving corporation and as a wholly-owned subsidiary of the Company. Additionally, pursuant to the Merger Agreement, the Company was renamed “Core Natural Resources, Inc.” and began trading under the ticker symbol “CNR” on January 15, 2025.
The information set forth herein does not include the results of operations or cash flows of Arch prior to January 14, 2025. Accordingly, unless otherwise specifically noted, references herein to “Core Natural Resources,” “Core,” “we,” “our,” “us,” “our Company” and “the Company” refer only to Core and its subsidiaries and do not include Arch and its subsidiaries prior to the Merger. See Note 2—Merger with Arch for further discussion of the unaudited pro forma information.
Important Definitions Referenced in this Annual Report on Form 10-K
•“Core Natural Resources,” “Core,” “we,” “our,” “us,” “our Company” and “the Company” refer to Core Natural Resources, Inc. (formerly known as CONSOL Energy Inc. before the effective time of the Merger) and its subsidiaries;
•“Arch” refers to Arch Resources, Inc., a Delaware corporation and a wholly-owned subsidiary of the Company following the Merger;
•“Beckley” refers to the Company’s Low-Vol metallurgical mining complex located in Raleigh County, West Virginia;
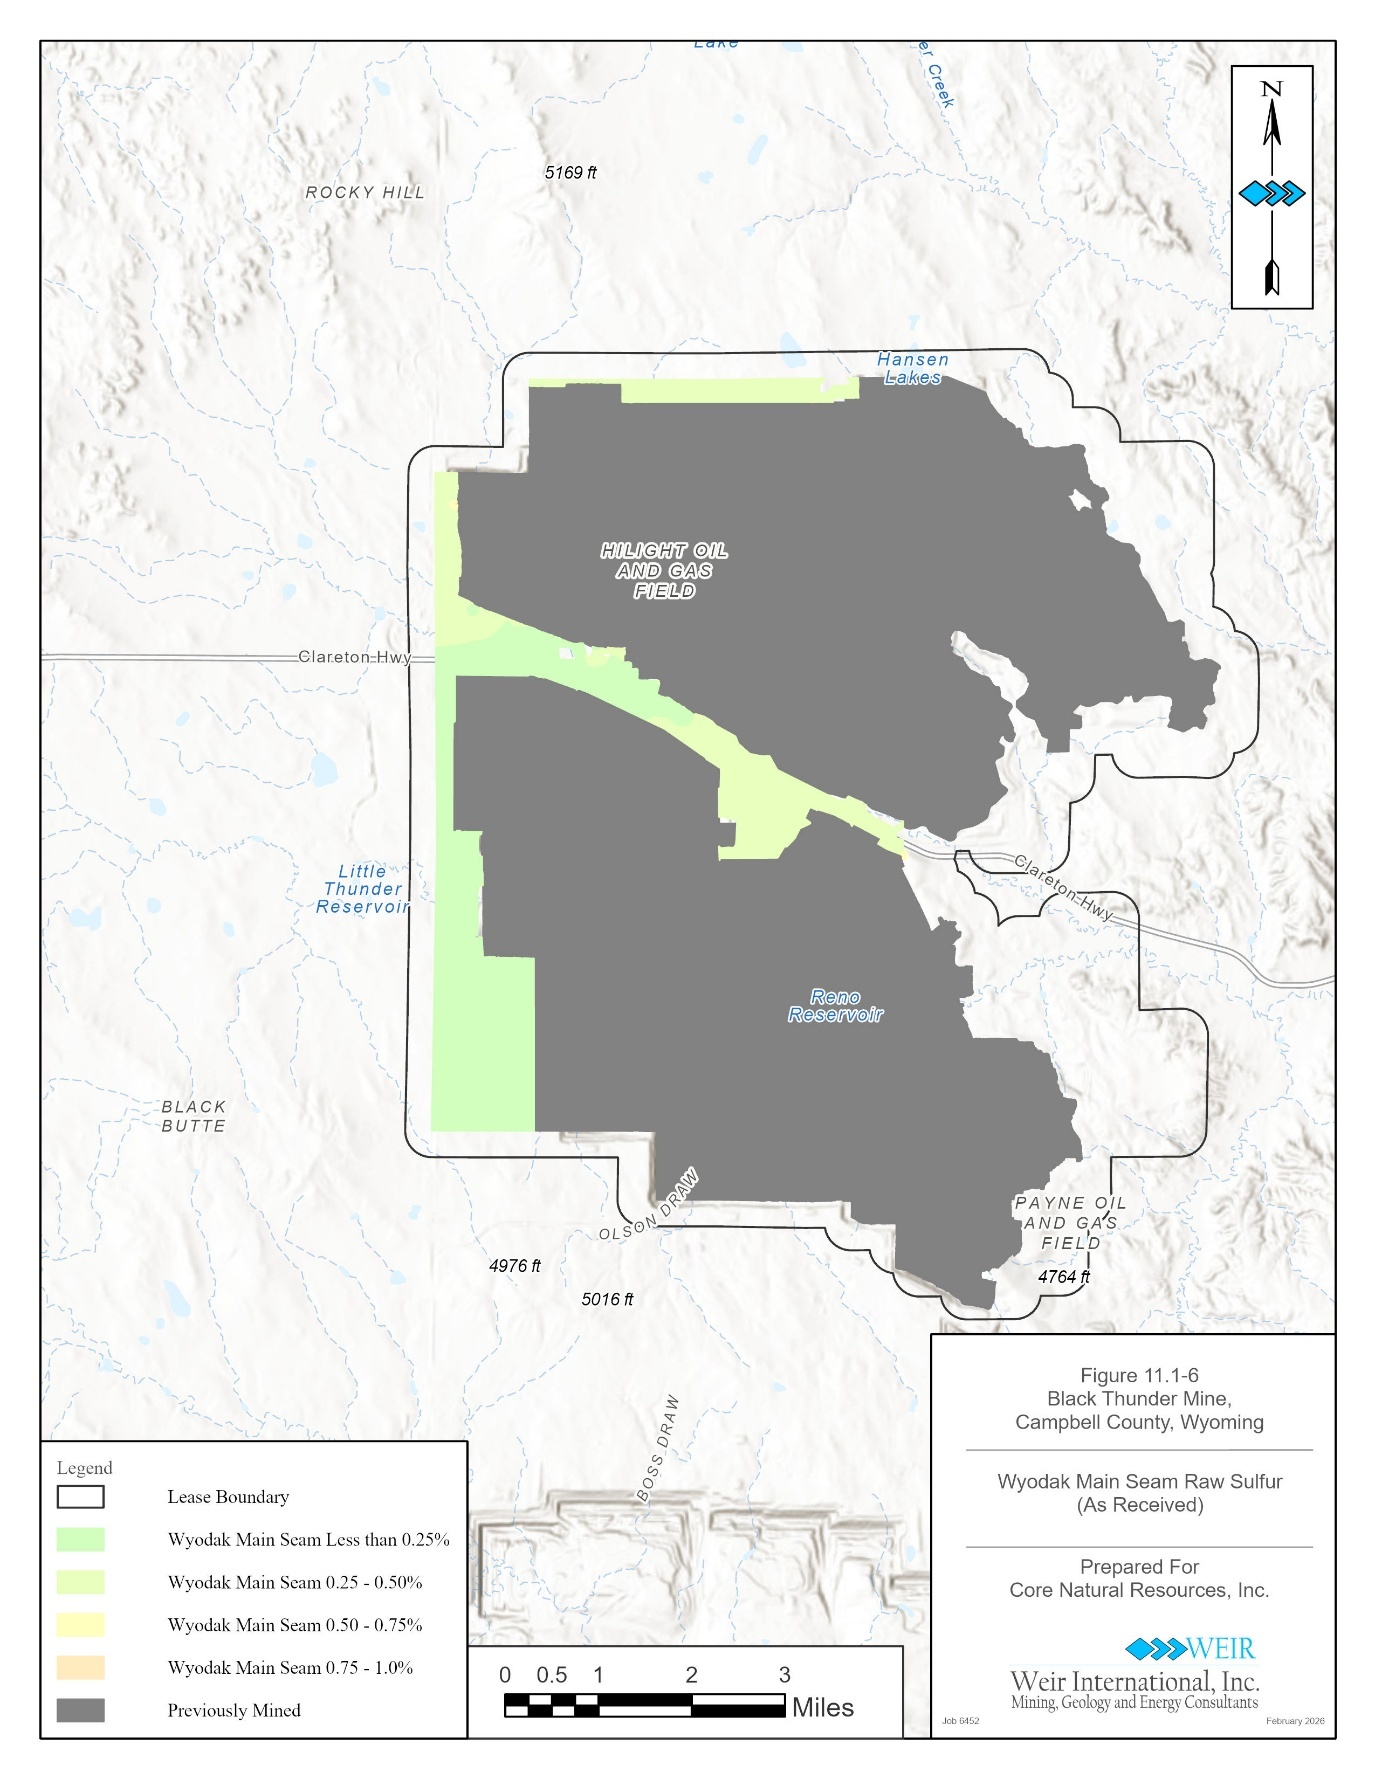
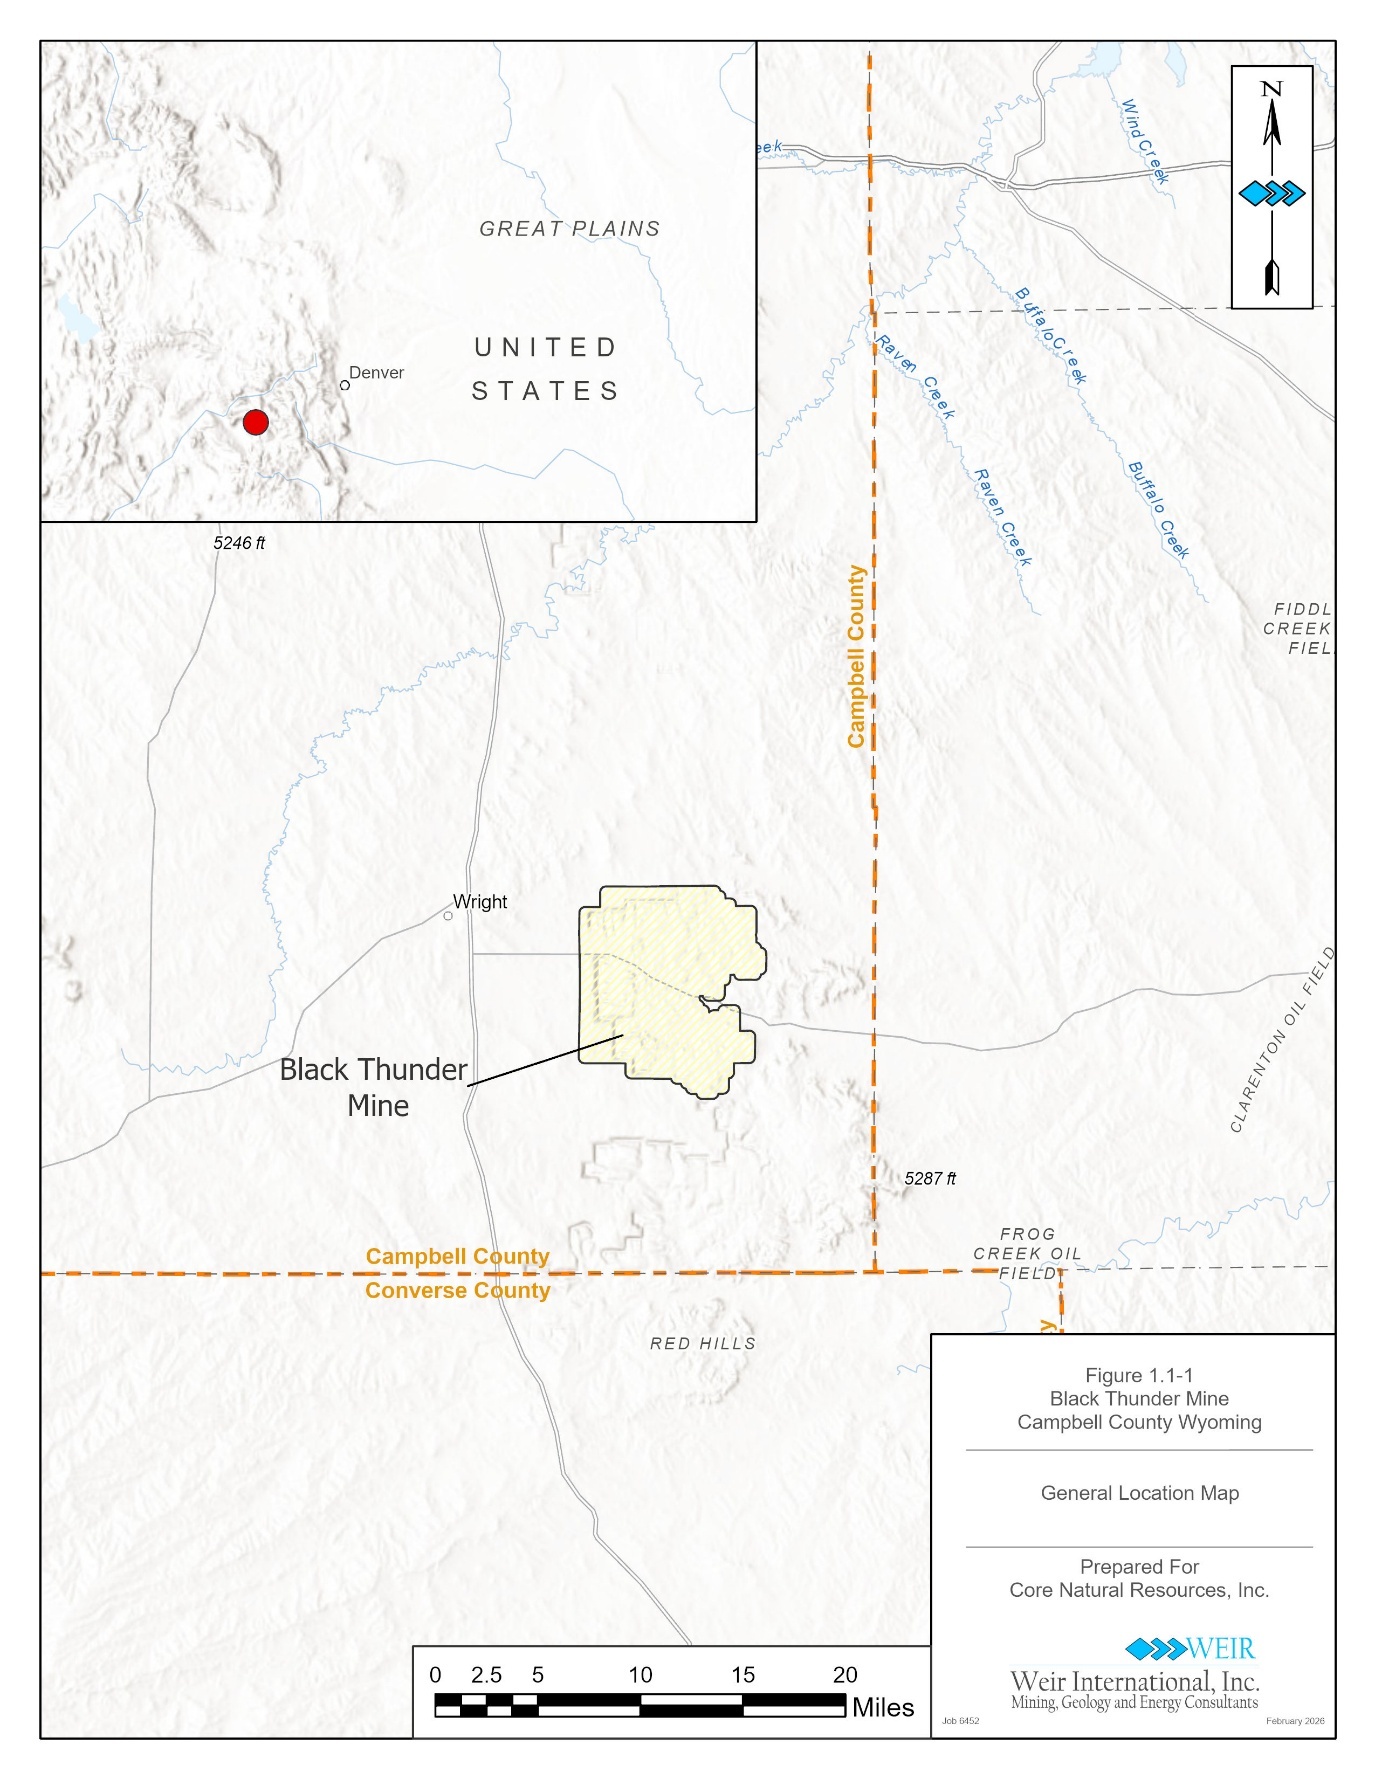
•“Black Thunder” refers to the Company’s sub-bituminous thermal surface mining complex located in Campbell County, Wyoming;
•“Btu” refers to one British thermal unit;
•“Coal Creek” refers to the Company’s sub-bituminous thermal surface mining complex located in Campbell County, Wyoming;
•“coal reserves” refer to the Company’s proven and probable coal reserves as defined by Section 1300 et. seq. of Regulation S-K that could be economically mineable, after taking into account modifying factors, including mining recovery and preparation plant yield;
•“Core Marine Terminal” refers to the Company’s terminal operations located in the Port of Baltimore, Maryland;
•“Dominion Terminal” refers to the ground storage-to-vessel coal transloading facility in Newport News, Virginia operated by DTA;
•“DTA” refers to Dominion Terminal Associates LLP, a limited liability partnership, in which the Company owns a 35% interest;
•“former parent” refers to CNX Resources Corporation and its consolidated subsidiaries;
•“Greenfield Reserves and Resources” refer to those undeveloped reserves and resources owned by the Company in the Northern Appalachian, Central Appalachian, Illinois and Powder River basins that are not associated with active mining complexes;
•“Itmann” refers to the Company’s Low-Vol metallurgical mining complex located in Wyoming County, West Virginia;
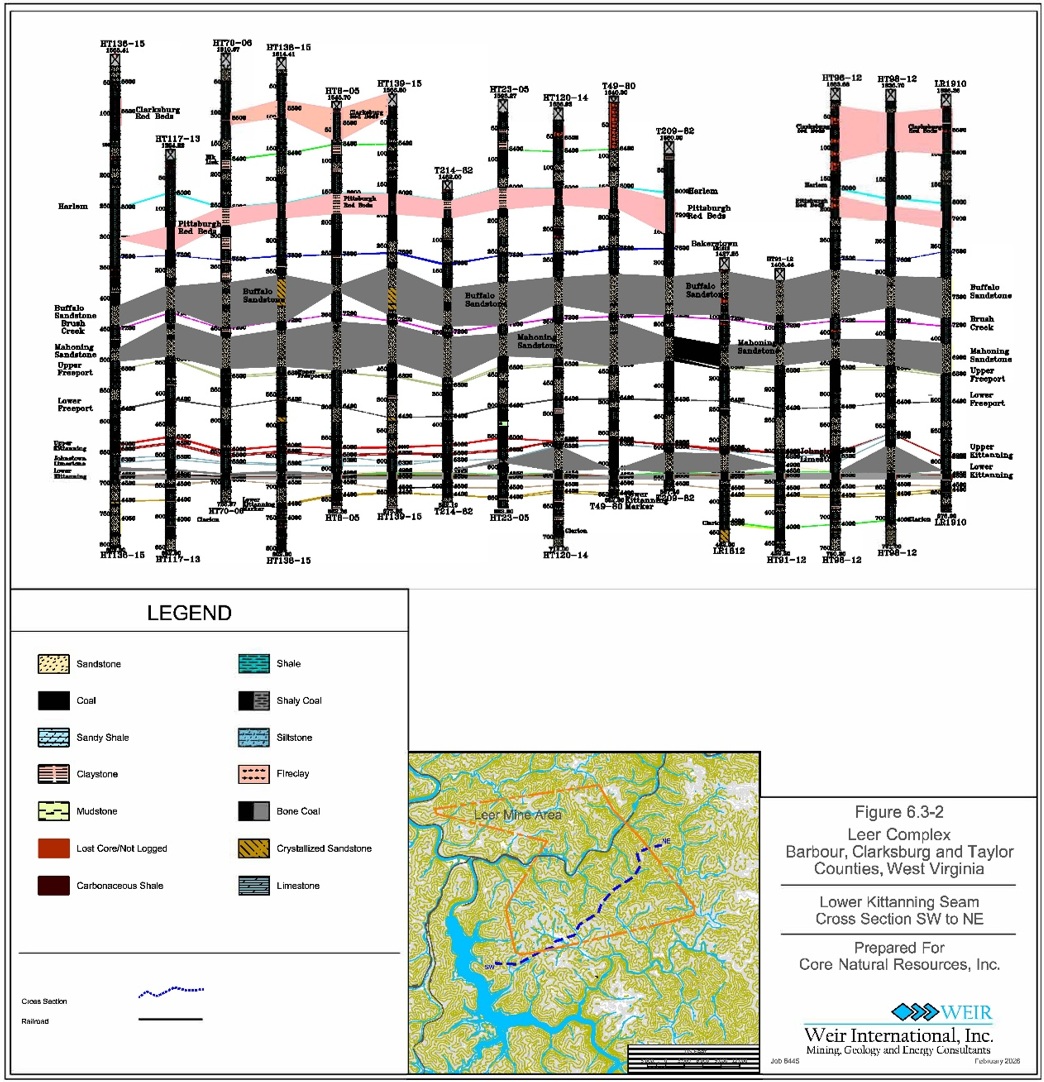
•“Leer” refers to the Company’s High-Vol metallurgical mining complex located in Taylor County, West Virginia;
•“Leer South” refers to the Company’s High-Vol metallurgical mining complex located in Barbour County, West Virginia;
•“Leer West” refers to the Company’s High-Vol metallurgical mining project located in Barbour County, West Virginia (collectively with Leer and Leer South, the “Leer Complex”);
•“Merger” refers to the Company’s all-stock merger of equals transaction with Arch that closed on January 14, 2025;
•“Merger Agreement” refers to the Agreement and Plan of Merger, dated as of August 20, 2024, by and among the Company, Merger Sub and Arch;
•“mmBtu” refers to one million British thermal units;
•“Mountain Laurel” refers to the Company’s High-Vol metallurgical mining complex located in Logan County and Boone County, West Virginia;
•“Pennsylvania Mining Complex” or “PAMC” refers to the Company’s Bailey, Enlow Fork and Harvey high calorific value thermal coal mines, and the Central Preparation Plant serving those mines, located in southwestern Pennsylvania and northern West Virginia; and
•“West Elk” refers to the Company’s high calorific value thermal mining complex located in Gunnison County, Colorado.
FORWARD-LOOKING STATEMENTS
Certain statements in this Annual Report on Form 10-K (“Report”) are “forward-looking statements” within the meaning of the federal securities laws. With the exception of historical matters, the matters discussed in this Report are forward-looking statements (as defined in Section 21E of the Securities Exchange Act of 1934, as amended (the “Exchange Act”)) that involve risks and uncertainties that could cause actual results and outcomes to differ materially from results expressed in or implied by our forward-looking statements. Accordingly, investors should not place undue reliance on forward-looking statements as a prediction of actual results. The forward-looking statements may include projections and estimates concerning the timing and success of specific projects and our future production, revenues, income and capital spending. When we use the words “anticipate,” “believe,” “continue,” “could,” “estimate,” “expect,” “intend,” “may,” “plan,” “predict,” “project,” “should,” “will,” “would,” or their negatives, or other similar expressions, the statements which include those words are usually forward-looking statements. When we describe strategy that involves risks or uncertainties, we are making forward-looking statements. The forward-looking statements in this Report speak only as of the date of this Report. We disclaim any obligation to update these statements unless required by securities law, and we caution you not to rely on them unduly. We have based these forward-looking statements on our current expectations and assumptions about future events. While our management considers these expectations and assumptions to be reasonable, they are inherently subject to significant business, economic, competitive, regulatory and other risks, contingencies and uncertainties, most of which are difficult to predict and many of which are beyond our control. These risks, contingencies and uncertainties relate to, among other matters, the following:
•deterioration in economic conditions or changes in consumption patterns of our customers may decrease demand for our products, impair our ability to collect customer receivables and impair our ability to access capital;
•volatility and wide fluctuation in coal prices based upon a number of factors beyond our control;
•an extended decline in the prices we receive for our coal;
•significant downtime of our equipment or inability to obtain equipment, parts or raw materials;
•decreases in the availability of, or increases in the price of, commodities or capital equipment used in our coal mining operations;
•our reliance on major customers, our ability to collect payment from our customers and uncertainty in connection with our customer contracts;
•our inability to acquire additional coal reserves or resources that are economically recoverable;
•decreases in coal consumption patterns for steel production, electric power generation and industrial applications;
•the availability and reliability of transportation facilities and other systems that deliver our coal to market and fluctuations in transportation costs;
•a loss of our competitive position;
•inflation that could result in higher costs and decreased profitability;
•foreign currency fluctuations that could adversely affect the competitiveness of our coal abroad;
•risks related to the fact that a significant portion of our production is sold in international markets (and may grow) and our compliance with export control and anti-corruption laws;
•coal users switching to other fuels in order to comply with various environmental standards related to coal combustion emissions;
•the impact of current and future regulations to address climate change, the discharge, disposal and clean-up of hazardous substances and wastes and employee health and safety on our operating costs as well as on the market for coal;
•the risks inherent in coal operations, including being subject to unexpected disruptions caused by adverse geological conditions, equipment failure, delays in moving longwall equipment, railroad derailments or strikes, security breaches or terroristic acts and other hazards, delays in the completion of significant construction or repair of equipment, fires, explosions, seismic activities, accidents and weather conditions;
•failure to obtain or renew surety bonds, letters of credit or insurance coverages on acceptable terms;
•the effects of coordinating our operations with oil and natural gas drillers and distributors operating on our land;
•our inability to obtain financing for capital expenditures on satisfactory terms;
•the effects of our securities being excluded from certain investment funds as a result of environmental, social and corporate governance (“ESG”) practices;
•the effects of global conflicts on commodity prices and supply chains;
•the effect of new or existing laws or regulations or tariffs and other trade measures;
•our inability to find suitable joint venture partners, acquisition targets or similar investments or integrating the operations of future acquisitions or investments into our operations;
•obtaining, maintaining and renewing government permits and approvals for our coal operations;
•the effects of asset retirement obligations, employee-related long-term liabilities and certain other liabilities;
•uncertainties in estimating our economically recoverable coal reserves;
•defects in our chain of title for our undeveloped reserves or failure to acquire additional property to perfect our title to coal rights;
•the outcomes of various legal proceedings, including those which are more fully described herein;
•the risk of our debt agreements, our debt and changes in interest rates affecting our operating results and cash flows;
•information theft, data corruption, operational disruption and/or financial loss resulting from a terrorist attack or cyber incident;
•the potential failure to retain and attract qualified personnel of the Company;
•failure to maintain effective internal control over financial reporting;
•uncertainty with respect to the Company’s common stock, potential stock price volatility and future dilution;
•uncertainty regarding the timing and value of any dividends we may declare;
•uncertainty as to whether we will repurchase shares of our common stock;
•inability of stockholders to bring legal action against us in any forum other than the state courts of Delaware;
•the risk that the businesses of the Company and Arch will not be integrated successfully after the closing of the Merger;
•the risk that the anticipated benefits of the Merger may not be realized or may take longer to realize than expected; and
•other unforeseen factors.
The above list of factors is not exhaustive or necessarily in order of importance. Additional information concerning factors that could cause actual results to differ materially from those in forward-looking statements include those discussed under “Risk Factors” elsewhere in this report. The Company disclaims any intention or obligation to update publicly any forward-looking statements, whether in response to new information, future events, or otherwise, except as required by applicable law.
ITEM 1. BUSINESS
General
We are a world-class producer and exporter of high-quality, low-cost coals, including metallurgical and thermal coals. We play an essential role in meeting the world’s growing need for energy, steel, cement and other infrastructure solutions. Our products have global access due to our ownership interests in two marine export terminals and access to several other third-party owned terminals.
We and our predecessors have been mining coal, primarily in the Appalachian Basin, since 1864. The Company was incorporated in Delaware on June 21, 2017 and became an independent, publicly-traded company on November 28, 2017 when our former parent separated its coal business and natural gas business into two independently traded public companies. We began regular-way trading under the name CONSOL Energy Inc. and ticker symbol CEIX on the New York Stock Exchange on November 29, 2017.
On January 14, 2025, we completed our all-stock merger of equals transaction with Arch pursuant to the Merger Agreement announced on August 21, 2024. Additionally, pursuant to the Merger Agreement, the Company was renamed “Core Natural Resources, Inc.” and began trading under the ticker symbol “CNR” on January 15, 2025.
The address of our principal executive offices is 275 Technology Drive, Suite 101, Canonsburg, Pennsylvania 15317. We maintain a website at http://www.corenaturalresources.com/. The information contained in or connected to the website will not be deemed to be incorporated in this Report, and you should not rely on any such information in making an investment decision.
All dollar amounts discussed in this section are in millions of U.S. dollars, except for per share amounts, and unless otherwise indicated.
Our Mission
The Company’s mission is to become the world’s leading provider of essential coal-based natural resources in support of human progress. We are committed to providing essential coal-based products necessary for infrastructure development, urbanization, transportation and reliable and affordable electric power generation. In doing so, we enable global prosperity and enhance the quality of life for people around the world. We are dedicated to the responsible utilization of vital natural resources, and we are committed to safe and sustainable practices that aim to reduce our environmental footprint, enhance our operations and create opportunities for our business and stakeholders. Our values of safety and compliance, continuous improvement and financial performance are the foundation of the Company’s identity and are the basis for how management defines continued success. We believe the Company’s rich resource base, coupled with our key values, will allow management to create long-term value for its stakeholders. We believe that the use of coal in industrial applications, including but not limited to the steel-making process, and as a fuel source for electricity will continue for many years.
Our Strategy
The Company continues to be focused on driving long-term value for its stakeholders and maximizing cash flow generation through the safe, compliant and efficient operation of our business, while maintaining a strong balance sheet and liquidity, returning capital through share repurchases and/or dividends and, when prudent, allocating capital toward compelling growth, diversification and innovation opportunities.
The Merger furthers this vision by combining best-in-sector metallurgical and thermal coal operating platforms anchored by high-quality, low-cost, long-lived longwall coal-mining assets. The Company has broad and diverse assets that produce coal with qualities and blends capable of serving multiple growth markets and geographies. In addition, the Company has strong North American logistics capabilities as well as export capabilities through ownership interests in two East Coast terminals and longstanding relationships with West Coast and Gulf Coast ports. The Company believes that the Merger will provide ongoing cash generation through a strong contracted thermal coal position coupled with meaningful opportunities across its metallurgical coal platform. The Company has the potential to return significant capital to stockholders while simultaneously making strategic investments in innovation and growth.
Leverage Our Low-Cost Assets and Diverse Product Qualities to Access Growing Export Metallurgical and Industrial Markets while Preserving the Revenue Visibility Provided by Coal Sales to Rail-Served Power Plants in Strategic Markets
We plan to minimize our market risk and maximize realizations by continuing to focus on placing a significant portion of our production in the export markets where we sell to metallurgical, industrial and electric power generation end-users.
This approach provides us pricing upside when markets are strong and with volume stability when markets are weak. The Company has broad and diverse assets that produce coal with qualities and blends capable of serving multiple growth markets and geographies. In addition, the Company has strong North American logistics and export capabilities through ownership interests in two East Coast terminals and longstanding relationships with West Coast and Gulf Coast ports.
Prior to the Merger, approximately 57% of the Company’s 2024 sales tons were sold to export markets and 43% were sold to domestic customers. Of the 2024 sales tons, 49% were sold in the electric power generation market, 33% were sold in the industrial market and 18% were sold in the metallurgical market. After the Merger, approximately 28% of the Company’s 2025 sales tons were sold to export markets and 72% were sold to domestic customers. Of the 2025 sales tons, 73% were sold in the electric power generation market, 16% were sold in the industrial market and 11% were sold in the metallurgical market.
The rapid expansion of artificial intelligence and the construction of new data centers are driving a significant increase in global power demand, which presents a unique opportunity for the Company to benefit, as data centers require reliable and substantial sources of electricity to operate efficiently. As more data centers are built to support the growing needs of artificial intelligence technologies, the Company is positioned to pivot its production to meet increased coal demand.
Drive Operational Excellence through Safety and Compliance, Continuous Improvement and Financial Performance
We continue to focus on our values of safety and compliance, continuous improvement and financial performance. Following the Merger, our 2025 average lost-time incident rate was more than 2.3 times better than the industry average (based on preliminary underground and surface bituminous mining industry averages through June 30, 2025). We believe that our focus on safety and compliance promotes greater reliability in our operations, which fosters long-term customer relationships and lower operating costs that support higher margins. We intend to continue to grow the economic competitiveness of our operations by proactively identifying, pursuing and implementing efficiency improvements and new technologies that can drive down unit costs without compromising safety or compliance.
Preserve and Increase Cash Generation
The Company has generated significant cash provided by operating activities since becoming a publicly-traded company. We believe that the Company will continue to generate significant cash provided by operating activities across a range of market environments through the combination of revenue from contracted thermal coal production and sales, coupled with a strong metallurgical coal platform. The Company’s diversified exposure to different coal types also enhances its ability to provide a more consistent capital allocation strategy aimed at enhancing stockholder value creation.
Maintain Liquidity and Ability to Access Capital Markets
We constantly seek to improve our ability to access capital markets to provide additional funds, if needed, to grow our business and fund capital expenditures. We believe that our Company can access capital markets to raise debt and equity financing from time to time depending on the market conditions.
On January 14, 2025, and in connection with the Merger, the Company entered into an amendment to its existing Revolving Credit Facility (as defined in Item 1A of this Report). The amendment increased the aggregate revolving commitments from $355 million to $600 million and extended the maturity date of the facility to April 30, 2029, provided that, under specified conditions, the maturity of the Revolving Credit Facility may be earlier. The Revolving Credit Facility now includes participation from 22 banks, including nine new lenders, and 37% of the total commitments came from new lenders, while 63% were from existing lenders. Additionally, the Company reduced the applicable interest rate margin by 75 basis points while further enhancing financial flexibility.
In addition, on January 14, 2025, and in connection with the Merger, a subsidiary of Arch, Arch Receivable Company, LLC, as seller, and another subsidiary of Arch, Arch Coal Sales Company, Inc., as initial servicer, amended Arch’s receivables purchase agreement, which supports the issuance of letters of credit and requests for cash advances. The amendment permits the receivables purchase agreement to remain outstanding following consummation of the Merger, including by amending the change of control provisions thereunder. On July 28, 2025, the Company amended and restated legacy Arch’s securitization facility in its entirety to, among other things, consolidate facilities, extend the maturity date to July 27, 2028 and simultaneously terminate legacy CONSOL’s securitization facility.
Also, the Company has successfully accessed the tax-free municipal bond markets. On March 27, 2025, the Company successfully refinanced its Series 2025 Bonds (as defined in Item 1A of this Report) totaling $307 million at favorable rates while also extending the maturity to initial terms of ten years.
Thirty-nine institutional investors participated in the transactions, which were more than six times oversubscribed on a cumulative basis.
Selectively Grow our Business to Maximize Stockholder Value by Capitalizing on Synergies with our Assets and Expertise
We plan to judiciously direct the cash generated by our operations toward those opportunities that create value for our stockholders, balancing shareholder returns with investments that leverage synergies with our asset base or the expertise of our management team. To that end, we intend to evaluate opportunities both for organic growth and for acquisitions, joint ventures and other business arrangements that complement our operations. For example, we are actively engaged in continuous improvement or research and development projects to improve the productivity of our mining operations through the use of technology, automation, data visualization and analytics.
Our management team has extensive experience in developing, operating and marketing a wide variety of coal and coal-related assets and, we believe, is well qualified to evaluate organic and external growth opportunities. We plan to carefully weigh capital investment decisions against alternate uses of the cash to help ensure we are delivering value to our stockholders.
The Company is also evaluating selective opportunities in critical minerals and advanced materials that leverage our extensive geological, mining, processing, technical and logistics expertise. These initiatives are intended to complement our existing coal asset portfolio and support long-term diversification, particularly in markets aligned with infrastructure development, advanced manufacturing, energy security and national strategic priorities. Rare earth elements (“REEs”), including but not limited to neodymium, praseodymium, dysprosium and terbium, are essential inputs for permanent magnets, electric vehicles, renewable energy systems, aerospace applications and defense technologies. The Company is assessing potential pathways to participate in portions of the rare earth value chain, including resource evaluation, recovery from coal-related feedstocks or waste streams, beneficiation and downstream processing technologies. These efforts are in early-stage evaluation and research phases and may include internal development, partnerships with academic institutions, government agencies, or third parties and potential strategic investments or joint ventures. Any such activities would be pursued in a disciplined manner, consistent with our capital allocation framework, environmental and safety standards and focus on generating long-term stockholder value. At this time, the Company has not recognized any material rare earth mineral reserves or resources under applicable Securities and Exchange Commission (“SEC”) reporting standards. The Company believes that its history and experience in large-scale resource extraction, materials handling, processing and compliance, together with its existing innovation platform, positions it to responsibly evaluate critical mineral opportunities as market conditions, technology readiness and regulatory frameworks continue to evolve.
We are also pursuing a variety of alternative and innovative uses of coal to diversify our business. These activities are led by CONSOL Innovations LLC (“Innovations”), our wholly-owned subsidiary with operations located in Triadelphia, WV, which is focused on creating long-term growth and diversification opportunities through sustainable innovations in the carbon products and materials and carbon management markets. For example, in 2022, we acquired the remaining equity stake in CFOAM Corp. (“CFOAM”), which manufactures high-performance carbon foam products from coal that can be used in the aerospace, military, industrial and commercial product markets. In 2023, we acquired the assets of Touchstone Advanced Composites (“TAC”), an innovative composite tooling supplier for the aerospace industry that uses our CFOAM product. Also in 2023, we expanded our research and development activities that are focused on using coal and coal mining/preparation plant waste streams for battery applications, including the development of battery anode materials, through an initial investment in C-BATT Innovations LLC (“C-BATT”). In 2024, we installed approximately 2,500 linear feet of our coal plastic composite decking product across several applications and entered aerospace parts manufacturing with the sale of our first TAC-manufactured parts. Additionally, two projects supported by our Innovations team were included on Time Magazine’s list of the 200 best inventions of 2024. In 2025, we continued to expand our aerospace parts manufacturing capabilities at TAC, became the majority owner of C-BATT and received a grant award from the Ohio Department of Development to help develop the first commercial-scale coal plastic composite deck board manufacturing line.
We also continue to partner with the U.S. Department of Energy (“DOE”) and certain industry and academic partners on several projects that are aligned with Innovations’ focus areas. Our DOE-sponsored REMEDY project seeks to develop an efficient, safe and cost-effective technology for mitigation of mine ventilation air methane that, if successful, could have broader market applicability.
Our Competitive Strengths
We believe we are well-positioned to successfully execute our business strategies because of the following competitive strengths:
World-Class, Well-Capitalized, Low-Cost Longwall Mining Complexes
Based on production per employee, the PAMC is a productive and efficient coal mining complex in the Northern Appalachian Basin (“NAPP”), averaging 7.45 tons of coal production per employee hour in 2025. We believe our substantial capital investment in the PAMC will enable us to maintain high production volumes, low operating costs and a strong safety and environmental compliance record, which we believe are key to supporting stable financial performance and cash flows throughout business and commodity price cycles.
Additionally, the Leer Complex longwall mines acquired through the Merger anchor our large-scale, first-quartile metallurgical franchise. The Leer Complex mines consistently rank among the lowest-cost U.S. metallurgical mines and produce a product quality that we believe is recognized and sought-after worldwide. These modern mines maintain a strong safety and environmental compliance record.
Extensive, High-Quality Reserve Base
The PAMC has extensive, high-quality reserves of bituminous coal. We mine our reserves from the Pittsburgh No. 8 Coal Seam, which is a large contiguous formation of high-Btu coal that is ideal for high-productivity, low-cost longwall operations. As of December 31, 2025, the PAMC included 529.0 million tons of recoverable coal reserves that are sufficient to support approximately 20 years of full-capacity production, based on our current estimates. The advantageous qualities of this product enable us to compete for demand from a broad range of the global industrial and electric power generation markets. In addition to the substantial reserve base associated with the PAMC, our Leer Complex includes 170.2 million tons of recoverable coal reserves that are sufficient to support more than 30 years of full-capacity production, based on our current estimates, and this product is highly desirable for use in the global steel industry. Our remaining thermal and metallurgical reserves and resources provide additional optionality for organic growth or monetization as market conditions allow.
Strategically Located Advanced Distribution Capabilities and Access to Key Logistics Infrastructure
The Company’s logistics capabilities, anchored by terminal ownership, dual rail access, geographic diversity and advanced loadout infrastructure, constitute a core strategic advantage. These assets enable the Company to reliably deliver large volumes of coal to a global customer base, optimize costs and flexibly respond to shifting market dynamics, securing its position as a leading, resilient supplier in the coal industry.
The Company wholly owns the Core Marine Terminal, which is the only major East Coast coal terminal served by both Norfolk Southern and CSX railroads. It has a storage capacity of 1.1 million tons and a throughput capacity of approximately 20 million tons per year, primarily serving international customers. The Company also has access to the Dominion Terminal in Newport News, Virginia, operated by DTA, in which the Company holds a 35% interest, which has a 20-million-ton annual throughput and 1.7 million tons of ground storage, serving principally international customers.
Core’s Eastern mining complexes are directly served by Norfolk Southern and CSX, providing flexible and cost-effective access to major U.S. power plants and export terminals. Core’s Western operations (i.e., Black Thunder, Coal Creek, and West Elk) are connected to Burlington Northern Santa Fe and Union Pacific railroads, enabling efficient delivery to both domestic and export markets.
The Company’s mines are strategically located in Pennsylvania, West Virginia, Wyoming and Colorado, allowing it to serve a broad range of markets and customers with varying coal quality requirements. The proximity to both East and West Coast ports, as well as Gulf Coast connections, enhances export flexibility, reduces transportation costs and provides blending capabilities at terminals providing tailored coal products to customer specifications, thus increasing marketability.
Strong, Well-Established Customer Base Supporting Contractual Volumes
We have a well-established and diverse customer base, comprised of both domestic and international industrial customers, metallurgical end-users and electric-power-producing companies. We have had success entering into multi-year coal sales agreements with our customers due to our longstanding relationships, reliability of production and delivery, competitive pricing and high coal quality. Approximately 95% of our sales in 2025 were to customers that were in both our and Arch’s 2024 portfolio.
We also have a growing international customer base due to favorable access to seaborne coal markets and our strong relationships with leading coal trading, brokering and international coal end-users. We have grown our exports of coal to the seaborne markets to 24.5 million tons (or approximately 62% of our annual high calorific value and metallurgical sales volume) in 2025 as a result of both growing our existing export business as well as the result of the Merger.
Highly-Experienced Management and Operating Teams
The Company is led by a proven and highly-experienced management team that combines the strengths and capabilities of both companies. Our management team is overseen by an experienced, majority-independent board of directors, currently comprised of six directors with a broad range of skills and experiences. Our management and operating teams have (i) significant expertise owning, developing and managing complex thermal and metallurgical coal mining operations, (ii) valuable relationships with customers, railroads and other participants across the coal industry, (iii) technical wherewithal and demonstrated success in developing new applications and customers for our coal products in industrial, metallurgical and electric power generation markets and (iv) a proven track record of successfully financing, building, enhancing and managing coal assets in a reliable and cost-effective manner throughout all parts of the commodity price cycles. We intend to leverage these qualities to continue to successfully develop our coal mining assets while efficiently and flexibly managing our operations to maximize operating cash flow and innovating to create long-term growth and diversification opportunities.
Focus on Free Cash Flow Generation Supported by Strong Margins and Optimized Production Levels
We intend to continue our focus on maintaining strong margins that drive generation of free cash flow by optimizing production from our high-quality reserves and leveraging our extensive logistics infrastructure and broad market reach. The Company has broad and diverse assets that produce coal with qualities and blends capable of serving multiple growth markets and geographies. To complement its coal portfolio, the Company has strong North American logistics and export capabilities through ownership interests in two East Coast terminals and longstanding relationships with West Coast and Gulf Coast ports. We believe that the Company is well-positioned from the Merger to provide ongoing cash generation through a strong contracted thermal coal position, coupled with meaningful opportunities through its expanded metallurgical coal platform.
For example, the PAMC’s low-cost structure, high-quality product, favorable access to rail and port infrastructure and diverse customer base allow it to move large volumes of coal at positive cash margins throughout a variety of market conditions and into multiple end-use markets. Additionally, the Leer Complex mines consistently rank among the lowest-cost U.S. metallurgical mines and produce a product quality that is recognized and sought-after worldwide. The Leer Complex is complemented by the Beckley, Mountain Laurel and Itmann continuous miner mines, which in aggregate provide us with a full suite of high-quality metallurgical products for sale into the global and domestic metallurgical markets. Additionally, the locations of our thermal mines in the Eastern and Western U.S. enable us to ship coal to most of the major domestic coal-fired power plants. Furthermore, our ability to enter into multi-year contracts with our longstanding customer base, as well as strategic industrial export customers, will enhance our ability to generate high margins in varied commodity price environments.
Principal Properties
Our significant tangible assets are the PAMC, the Leer Complex and the Core Marine Terminal, which have consistently generated strong free cash flows. As of December 31, 2025, the PAMC controlled 529.0 million tons of high-quality Pittsburgh seam reserves, enough to allow for an equivalent of approximately 20 years of full-capacity production, based on our current estimates. As of December 31, 2025, the Leer Complex included 170.2 million tons of recoverable coal reserves that are sufficient to support an equivalent of more than 30 years of full-capacity production, based on our current estimates.
After the Merger, our presence in the metallurgical coal market includes two longwall mines in the Leer Complex and three continuous miner mines, Beckley, Mountain Laurel and Itmann, all of which are in West Virginia. These mines produce a premium metallurgical product used in the global steel industry. We also operate thermal mines, including the PAMC, in Pennsylvania, Black Thunder and Coal Creek, in the PRB, as well as West Elk, in Colorado. The PRB mines produce thermal coal for sale into domestic and international markets. The PAMC and West Elk mines produce a high-quality, high calorific value thermal product that can compete effectively in seaborne markets where thermal coal demand remains robust. The Merger has also enabled the Company to gain access to a second export terminal, the Dominion Terminal, operated by DTA, in which the Company owns a 35% interest, on the U.S. Eastern seaboard, as well as strategic connectivity to ports on the West Coast and the Gulf of America.
We are a global leader, exceptionally well-positioned to compete and succeed in significant, high-potential market segments, including the global metallurgical and global high calorific value thermal coal markets as well as domestic thermal coal markets broadly.
A map showing the location of our material properties is below:
Thermal Mining Properties
Our active thermal mines are described below:
•Pennsylvania Mining Complex: The PAMC includes the Bailey, Enlow Fork and Harvey mines and the Central Preparation Plant. Coal from the PAMC is valued because of its high energy content (as measured in Btu per pound), relatively low levels of sulfur and other impurities and strong thermoplastic properties that enable it to be used in metallurgical, industrial and electric power generation applications. We mine our reserves from the Pittsburgh No. 8 Coal Seam, which is a large contiguous formation of high-Btu coal that is ideal for high productivity, low-cost longwall mining operations. The design of the PAMC is optimized to produce large quantities of coal on a cost-efficient basis. We can sustain high production volumes at comparatively low operating costs due to, among other things, our technologically-advanced longwall mining systems, logistics infrastructure and safety. All mines at the PAMC utilize longwall mining, which is a highly-automated underground mining technique that produces large volumes of coal at lower costs compared to other underground mining methods. We aggressively market coal from the PAMC to a broad global base of diverse and strategically-selected industrial and metallurgical end users. We are able to transport coal from the PAMC to our customers through an extensive logistical network, which is directly served by both the Norfolk Southern and CSX railroads, coupled with the operational synergies afforded by the Core Marine Terminal. We also continue to support power plant customers in the eastern U.S. and abroad.
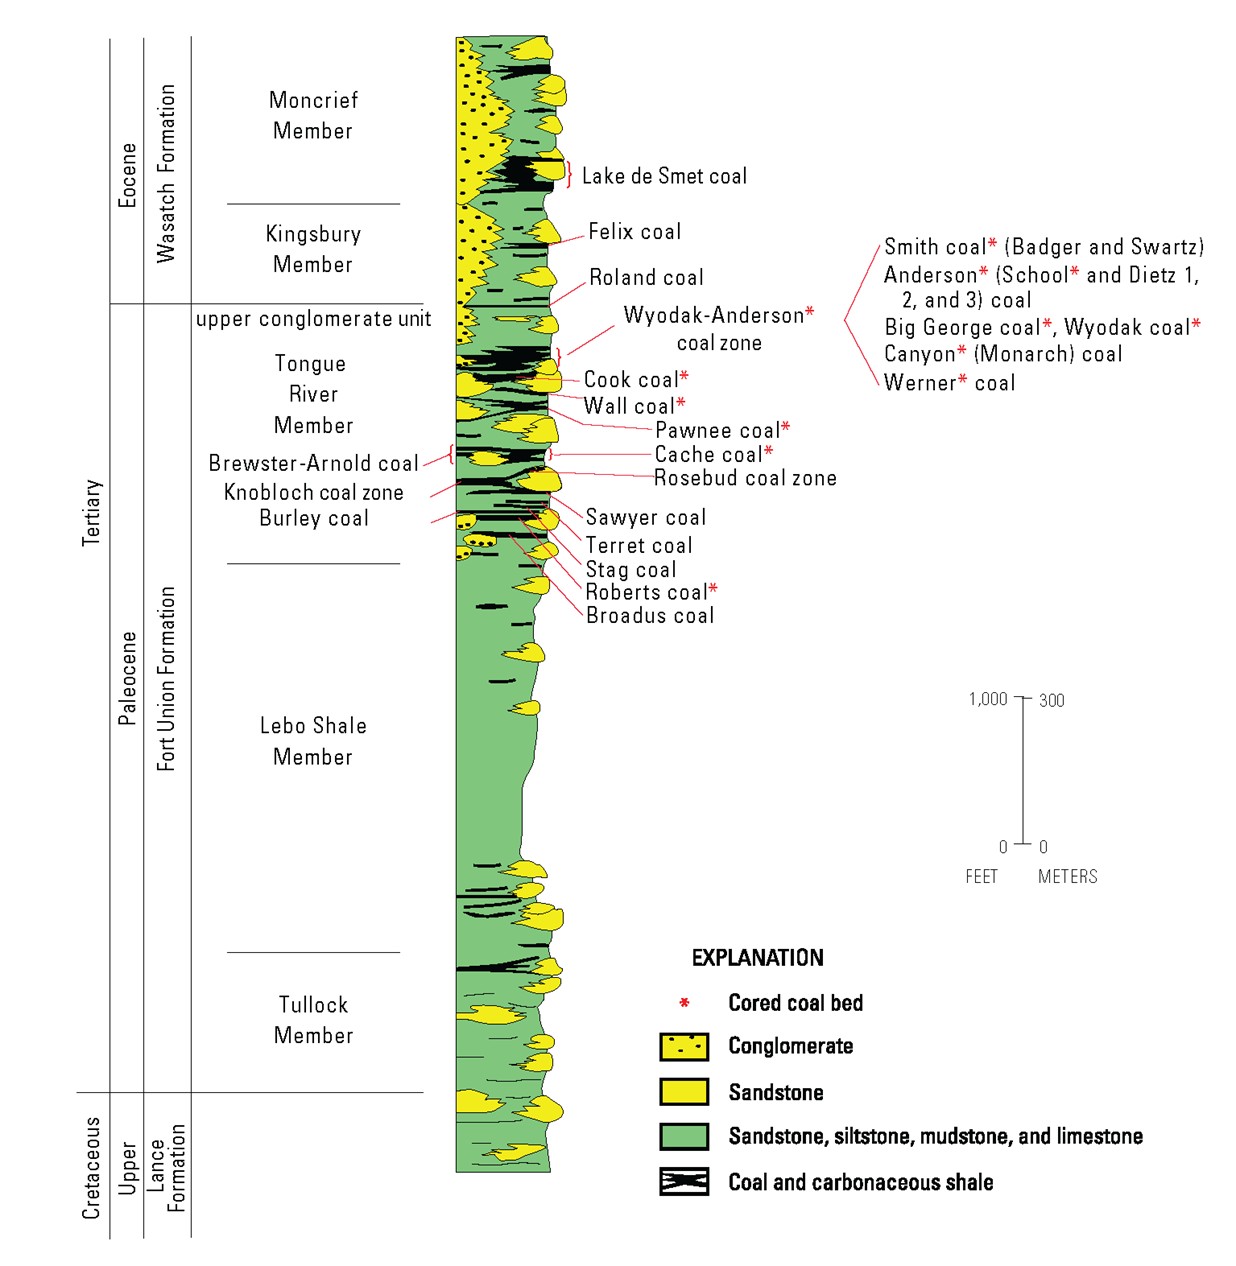
•Black Thunder: The Black Thunder surface mining complex, consisting of four active pit areas and two active loadout facilities, is located on approximately 35,300 acres in Campbell County, Wyoming and extracts thermal coal from the Upper Wyodak and Main Wyodak seams. It had approximately 331.5 million tons of proven and probable reserves at December 31, 2025. A significant portion of the coal reserves at Black Thunder are controlled through federal and state leases. We ship all of the coal raw to our customers via the Burlington Northern Santa Fe and Union Pacific railroads. We do not process the coal mined at this complex. Each of the loadout facilities can load a 15,000-ton train in less than two hours.
•Coal Creek: The Coal Creek surface mining complex, consisting of one active pit area and a loadout facility, is located on approximately 7,400 acres in Campbell County, Wyoming and extracts thermal coal from the Wyodak-R1 and Wyodak-R3 seams. We ship all of the coal raw to our customers via the Burlington Northern Santa Fe and Union Pacific railroads. We do not process the coal mined at this complex. The loadout facility can load a 15,000-ton train in less than three hours.
•West Elk: The West Elk mining complex, consisting of one longwall and supported by continuous miner sections, a preparation plant and a loadout facility, is located on approximately 19,000 acres in Gunnison County, Colorado and extracts thermal coal from the B seam. It had approximately 31.5 million tons of proven and probable reserves at December 31, 2025. A significant portion of the coal reserves at West Elk are controlled through federal and state leases. We ship most of the coal raw to our customers via the Union Pacific railroad. When required to improve the quality of some of our coal production, it is processed through the 800 ton-per-hour preparation plant. The loadout facility can load an 11,000-ton train in less than three hours.
Metallurgical Mining Properties
Our active metallurgical mines are described below:
•Leer: The Leer mining complex, consisting of one longwall, a preparation plant and a loadout facility, is located on approximately 32,600 acres in Taylor County, West Virginia and extracts coal primarily sold as High-Vol A metallurgical coal from the Lower Kittanning seam. It had approximately 29.4 million tons of proven and probable coal reserves as of December 31, 2025. The majority of the reserves at Leer are owned rather than leased from third parties. All production is processed through a 1,400 ton-per-hour preparation plant and loaded on the CSX railroad. A 15,000-ton train can be loaded in less than four hours.
•Leer South: The Leer South mining complex, consisting of one longwall operation, a preparation plant and a loadout facility, is located on approximately 26,400 acres in Barbour County, West Virginia and extracts coal primarily sold as High-Vol A metallurgical coal from the Lower Kitanning seam, similar to our Leer mining complex. It had approximately 57.0 million tons of proven and probable reserves at December 31, 2025. The majority of the reserves at Leer South are owned rather than leased from third parties. The 1,600 ton-per-hour preparation plant is located near the mine, and the loadout facility is served by the CSX railroad and connected to the plant by a 4,000 ton-per-hour conveyor system. The loadout facility is capable of loading a 15,000-ton unit train in less than four hours.
•Beckley: The Beckley mining complex is located on approximately 14,900 acres in Raleigh County, West Virginia and extracts high quality, Low-Vol metallurgical coal from the Pocahontas No. 3 seam. It had approximately 22.6 million tons of proven and probable reserves at December 31, 2025. A significant portion of the reserves at Beckley are leased from third parties rather than owned. Coal is conveyed from the mine to a 600 ton-per-hour preparation plant before shipping the coal via the CSX railroad. The loadout facility can load a 10,000-ton train in less than four hours.
•Mountain Laurel: The Mountain Laurel mining complex is located on approximately 38,300 acres in Logan County and Boone County, West Virginia and extracts High-Vol B metallurgical coal from the Alma and No. 2 Gas seams. It had approximately 16.3 million tons of proven and probable reserves at December 31, 2025. We process all of the coal through a 1,400 ton-per-hour preparation plant before shipping the coal to our customers via the CSX railroad. The loadout facility can load a 15,000-ton train in less than four hours.
•Itmann: The Itmann mining complex is located on approximately 21,000 acres in Wyoming County, West Virginia and extracts high quality, Low-Vol metallurgical coal from the Pocahontas 3 and Pocahontas 4 seams. The Itmann mining complex had approximately 27.1 million tons of proven and probable coal reserves at December 31, 2025. A significant portion of the reserves at Itmann are leased from third parties rather than owned. The preparation plant includes a rail loadout located on the Guyandotte Class I rail line, which can be served by both Norfolk Southern and CSX, and has the capability for processing up to an additional 750 thousand to 1 million saleable tons annually from third-parties and mining of our surrounding reserves. This additional processing revenue provides an avenue of growth for the Company.
Terminals
Our ownership interests in two East Coast terminals are described below:
•Core Marine Terminal: Through our wholly-owned subsidiary, Core Marine Terminals LLC, we provide coal export terminal services through the Port of Baltimore. The terminal can either store coal or load coal directly into vessels from rail cars. It is also the only major East Coast coal terminal served by two Class I railroads, Norfolk Southern and CSX. During the year ended December 31, 2025, approximately 18.1 million tons of coal were shipped through the Core Marine Terminal. Approximately 83% of the tonnage shipped was produced by the PAMC. The Core Marine Terminal has storage capacity of 1.1 million tons with more than 30 acres of capacity for stockpiles. The facility possesses blending capabilities, and it has transloaded approximately 16.3 million tons of coal per year on average over the past five years with a throughput capacity of approximately 20 million tons. The facility primarily serves international customers.
•Dominion Terminal: We own a 35% interest in DTA, a limited liability partnership that operates a ground storage-to-vessel coal transloading facility in Newport News, Virginia. The facility has a rated throughput capacity of 20 million tons of coal per year and ground storage capacity of approximately 1.7 million tons. The facility primarily
serves international customers and domestic coal users located along the Atlantic coast of the U.S. From time to time, we may lease a portion of our port capacity to third parties.
Non-Core Coal Assets and Surface Properties
We own significant coal assets and surface properties that are not in our short or medium-term development plans. We continually explore the monetization of these non-core assets by means of sale, lease, contribution to joint ventures or a combination thereof in order to bring the value of these assets forward for the benefit of our stockholders.
Mining Properties as of December 31, 2025
Information concerning our mining properties in this Report has been prepared in accordance with the requirements of subpart 1300 of Regulation S-K. Subpart 1300 of Regulation S-K requires us to disclose our mineral resources and our mineral reserves as of the end of our most recently completed fiscal year both in the aggregate and for each of our individually material mining properties.
As used in this Report, the terms “mineral resource,” “measured mineral resource,” “indicated mineral resource,” “inferred mineral resource,” “mineral reserve,” “proven mineral reserve” and “probable mineral reserve” are defined and used in accordance with subpart 1300 of Regulation S-K. Under subpart 1300 of Regulation S-K, mineral resources may not be classified as “mineral reserves” unless the determination has been made by a qualified person that the mineral resources can be the basis of an economically viable project. As such, you are cautioned that, except for that portion of mineral resources classified as mineral reserves, mineral resources do not have demonstrated economic value. Likewise, you are cautioned not to assume that all or any part of measured or indicated mineral resources will ever be converted to mineral reserves. We have used the term “coal” as in “coal reserves” and “coal resources” interchangeably with “mineral.”
The Company’s estimates of recoverable coal reserves and raw, in situ coal resources are estimated internally by professionals whom we believe to be competent, including engineers and geologists. These estimates are based on geological data, coal ownership information and current or proposed operating plans. The Company’s recoverable coal reserves are proven and probable reserves that could be economically and legally extracted or produced at the time of the reserve determination, considering all material modifying factors. These estimates are periodically updated to reflect past coal production, updated mine plans, new exploration information and other geological or mining data. Acquisitions or dispositions of coal properties will also change these estimates. Changes in mining methods or preparation plant processes may increase or decrease the recovery basis for the estimates. The ability to update or modify the estimates of the Company’s recoverable coal reserves is restricted to geologists and mining engineers whom we believe to be competent, and material modifications recommended by such geologists or engineers are documented by the Company. The Company’s estimates of recoverable coal reserves and raw, in situ coal resources and supporting information have been assessed by Weir International, Inc. and the John T. Boyd Company, qualified person firms, which conform to our requirements under subpart 1300 of Regulation S-K for qualified persons.
The information that follows relating to our material properties is derived, for the most part, from, and in some instances is an extract from, the technical report summary (“TRS”) relating to the property prepared in compliance with Item 601(b)(96) and subpart 1300 of Regulation S-K by Weir International, Inc. and the John T. Boyd Company. Portions of the following information are based on assumptions, qualifications and procedures that are not fully described herein. Reference should be made to the full text of the TRS, incorporated herein and made a part of this Report.
Recoverable coal reserves and raw, in situ coal resources are either owned or leased. The leases generally provide for renewal through the anticipated life of the associated mine. These renewals are exercisable by the payment of minimum royalties. Under current mining plans, reserves and resources reported will be mined out within the period of existing leases or within the time period of probable lease renewal periods.
The Company assigns coal reserves to mining complexes, and the amount of coal we assign to each mine is generally sufficient to support mining through the extent of our current mining permits. These permits were issued on various dates, and each are required to be renewed under federal law every five years. All assigned reserves either have their required permits or governmental approvals or there is a high probability that these approvals will be secured. In addition, our mines and mining complexes may have access to additional reserves that have not yet been assigned.
Some reserves may be accessible by more than one mine because of the proximity of many of our mines to one another. In the following tables, the reserves and resources indicated for a mine are based on our review of current mining plans and reflect our best judgment as to which mine is most likely to utilize the reserve. Certain reserves and resources in the following tables do not show balances for the comparative periods as these locations were acquired in the year ended December 31, 2025 in conjunction with the Merger.
The following tables provide a summary of all the Company’s coal reserves and resources as of the end of the fiscal year ended December 31, 2025 (tons in millions):
Summary Material Coal Reserves
as of December 31, 2025
|
|
|
|
|
|
|
|
|
|
|
|
|
|
|
|
|
|
|
|
|
|
|
|
|
|
|
|
|
|
|
|
|
|
|
Coal Reserves |
| Complex |
|
Proven |
|
Probable |
|
Total |
|
Realized Coal Price Per Ton |
|
Recovery Factor |
| PAMC: |
|
|
|
|
|
|
|
|
|
|
| Bailey |
|
72.2 |
|
72.7 |
|
144.9 |
|
$60 |
|
57% |
| Enlow Fork |
|
198.7 |
|
29.6 |
|
228.3 |
|
$60 |
|
55% |
| Harvey |
|
79.3 |
|
76.5 |
|
155.8 |
|
$60 |
|
56% |
| Total PAMC |
|
350.2 |
|
178.8 |
|
529.0 |
|
$60 |
|
56% |
|
|
|
|
|
|
|
|
|
|
|
| Leer Complex: |
|
|
|
|
|
|
|
|
|
|
| Leer |
|
24.6 |
|
4.8 |
|
29.4 |
|
$120 |
|
34% |
| Leer South |
|
46.4 |
|
10.6 |
|
57.0 |
|
$120 |
|
39% |
| Leer West |
|
69.8 |
|
14.0 |
|
83.8 |
|
— |
|
38% |
| Total Leer Complex |
|
140.8 |
|
29.4 |
|
170.2 |
|
$120 |
|
38% |
|
|
|
|
|
|
|
|
|
|
|
| Black Thunder |
|
329.5 |
|
2.0 |
|
331.5 |
|
$15 |
|
100% |
Summary Non-Material Coal Reserves
as of December 31, 2025
|
|
|
|
|
|
|
|
|
|
|
|
|
|
|
|
|
|
|
|
|
|
|
Coal Reserves |
| Complex |
|
Proven |
|
Probable |
|
Total |
| Beckley |
|
20.3 |
|
2.3 |
|
22.6 |
| Itmann |
|
15.4 |
|
11.7 |
|
27.1 |
| Mountain Laurel |
|
11.9 |
|
4.4 |
|
16.3 |
| West Elk |
|
29.8 |
|
1.7 |
|
31.5 |
| Other CAPP |
|
4.7 |
|
3.9 |
|
8.6 |
| Total |
|
82.1 |
|
24.0 |
|
106.1 |
Summary Coal Resources
as of December 31, 2025
|
|
|
|
|
|
|
|
|
|
|
|
|
|
|
|
|
|
|
|
|
|
|
|
|
|
|
|
|
|
|
|
|
|
|
Coal Resources (a) |
| Material |
|
Measured |
|
Indicated |
|
Measured + Indicated |
|
Inferred |
|
Total |
| Black Thunder |
|
200.0 |
|
5.0 |
|
205.0 |
|
— |
|
205.0 |
|
|
|
|
|
|
|
|
|
|
|
| Non-Material |
|
|
|
|
|
|
|
|
|
|
| Mason Dixon Mine |
|
221.8 |
|
314.3 |
|
536.1 |
|
16.6 |
|
552.7 |
| River Mine |
|
95.4 |
|
872.2 |
|
967.6 |
|
143.4 |
|
1,111.0 |
NAPP (b) |
|
33.4 |
|
65.0 |
|
98.4 |
|
0.4 |
|
98.8 |
CAPP (b) |
|
245.8 |
|
260.1 |
|
505.9 |
|
3.6 |
|
509.5 |
ILB (b) |
|
227.7 |
|
567.3 |
|
795.0 |
|
57.5 |
|
852.5 |
PRB (b) |
|
389.2 |
|
11.6 |
|
400.8 |
|
— |
|
400.8 |
Uinta (b) |
|
60.2 |
|
15.8 |
|
76.0 |
|
— |
|
76.0 |
| Total |
|
1,473.5 |
|
2,111.3 |
|
3,584.8 |
|
221.5 |
|
3,806.3 |
(a) All resource tons reported as raw, in situ tons
(b) Other resources (by U.S. coal basin)
Internal Controls Disclosure
The modeling and analysis of the Company’s reserves and resources has been developed by Company engineering and geology personnel and reviewed by several levels of internal management. This section summarizes the internal control considerations for the Company’s development of estimations, including assumptions, used in reserve and resource analysis and modeling.
Records from exploration drilling completed on the mining properties comprise the primary data used in the evaluation of the coal resources for each property. The Company maintains written field and exploration guidelines that cover standard procedures, including site safety, mapping and how to select proper drilling equipment, record accurate and detailed geological logs, perform coal sampling, supervise geophysical logging and plug drill holes once work is complete.
The Company maintains all control of coal core samples up to the point that samples are handed over to the lab performing testing. Once logging and sampling are complete, the sampled coal core intervals are transported to the Company’s headquarters by exploration personnel, at which time they are handed over to quality personnel. The quality personnel arrange pickup by the selected independent lab that will perform the required analyses. All analytical work is conducted to International Organization for Standardization or ASTM International standards.
Management also assesses risks inherent in coal reserve and resource estimates, such as the accuracy of geophysical data that are used to support mine planning, identify hazards and inform operations of the presence of mineable deposits. Also, management is aware of risks associated with potential gaps in assessing the completeness of mineral extraction licenses, entitlements or rights, or changes in laws or regulations that could directly impact the ability to assess coal reserves and resources or could impact production levels. The over- or underestimation of reserves can have certain impacts on financial performance, such as changes in amortizations that are based on life-of-mine estimates.
Pennsylvania Mining Complex - Material Thermal Reserves
Pennsylvania Mining Complex. The PAMC is located approximately 26 miles southwest of Pittsburgh, near the city of Washington and the borough of Waynesburg, all in Pennsylvania, and consists of three deep longwall mining operations - the Bailey Mine, the Enlow Fork Mine and the Harvey Mine - as well as a centralized preparation plant located at approximately 39°58’23.7” N latitude and 80°24’43.6” W longitude. The Company controls approximately 179,000 acres of mineral and surface rights as a complex collection of owned or leased tracts that range from less than an acre to several hundred acres in size covered by various coal deeds and coal lease agreements. Lease terms generally extend until all the coal is removed from the subject tract. Where applicable, royalty rates typically range from 3% to 8% of the gross sales price of the coal. The Company maintains the right to mine and remove almost all of the Pittsburgh Seam within the PAMC boundaries. As part of the PAMC, the Company controls surface rights to approximately 24,100 acres through fee simple ownership. This includes ownership of the property upon which the surface facilities for mine access, processing, storing and shipping are located, as well as approximately 3,500 permitted acres for coarse and fine refuse disposal facilities.
Despite a lengthy ownership history dating back to the 1920s with the acquisition of certain coal leases by the Company’s predecessor, commercial operations at the PAMC did not begin until 1984.
The design of the PAMC is optimized to produce large quantities of coal on a cost-efficient basis. The PAMC is able to sustain high production volumes at comparatively low operating costs due to, among other things, its technologically advanced longwall mining systems, logistics infrastructure and safety. All of the PAMC’s mines utilize longwall mining, which is a highly-automated underground mining technique that produces large volumes of coal at lower costs compared to other underground mining methods. The PAMC typically operates 4-5 longwalls with 15-17 continuous mining sections. The full-capacity production of the PAMC is approximately 28.5 million clean tons of coal annually. The central preparation plant is connected via conveyor belts to each of the PAMC’s mines and cleans and processes up to 8,200 raw tons of coal per hour. The PAMC’s on-site logistics infrastructure at the central preparation plant includes a dual-batch train loadout facility capable of loading up to 9,000 clean tons of coal per hour and 19.3 miles of track linked to separate Class I rail lines owned by Norfolk Southern and CSX, which significantly increases the PAMC’s efficiency in meeting its customers’ transportation needs. Sources of electrical power, water, supplies and materials are readily available. Electrical power is provided to the mines and facilities by regional utility companies. Water is supplied by public water services, surface impoundments or water wells.
Numerous permits are required by federal and state law for underground mining, coal preparation and related facilities and other incidental activities. Permits generally require that the Company post a performance bond in an amount established by the regulatory program to (1) provide assurance that any disturbance or liability created during mining operation is properly mitigated and (2) assure that all regulation requirements of the permit are fully satisfied.
Bailey Mine. As of December 31, 2025, the Bailey Mine’s assigned and accessible reserve base contained an aggregate of 144.9 million tons of clean recoverable coal with an average as-received gross heat content of approximately 12,948 Btu per pound and an approximate average pounds of sulfur dioxide per mmBtu of 3.65. The Bailey Mine was the first mine developed at the PAMC. Construction of the slope and initial air shaft began in 1982. The slope development reached the coal seam at a depth of approximately 600 feet, and, following development of the slope bottom, commercial coal production began in 1984. Longwall mining production commenced in 1985, and the second longwall was placed into operation in 1987. In 2010, a new slope and overland belt system was commissioned, which allowed a large percentage of the Bailey Mine to be sealed off. For the years ended December 31, 2025, 2024 and 2023, the Bailey Mine produced 11.7 million, 10.8 million and 11.2 million tons of coal, respectively.
Enlow Fork Mine. As of December 31, 2025, the Enlow Fork Mine’s assigned and accessible reserve base contained an aggregate of 228.3 million tons of clean recoverable coal with an average as-received gross heat content of approximately 13,005 Btu per pound and an approximate average pounds of sulfur dioxide per mmBtu of 3.08. The Enlow Fork Mine is located directly northeast of the Bailey Mine. Initial underground development started from the Bailey Mine while the Enlow Fork slope was being constructed. Once the slope bottom was developed and the slope belt became operational, seals were constructed to separate the two mines. Following development of the slope bottom, commercial coal production began in 1989. Longwall mining production commenced in 1991, and the second longwall came online in 1992. In 2014, a new slope and overland belt system was commissioned and a substantial portion of the Enlow Fork Mine was sealed. For the years ended December 31, 2025, 2024 and 2023, the Enlow Fork Mine produced 10.0 million, 9.2 million and 8.7 million tons of coal, respectively.
Harvey Mine. As of December 31, 2025, the Harvey Mine’s assigned and accessible reserve base contained an aggregate of 155.8 million tons of clean recoverable coal with an average as-received gross heat content of approximately 12,938 Btu per pound and an approximate average pounds of sulfur dioxide per mmBtu of 4.17. The Harvey Mine is located directly southeast of the Bailey and Enlow Fork Mines. Similar to the Enlow Fork Mine, the Harvey Mine was developed off of the Bailey Mine’s slope bottom. In order to separate the Harvey Mine from the existing Bailey Mine, seals were built around the original Bailey slope bottom, and the original slope was dedicated solely to the Harvey Mine. This transfer of infrastructure eliminated the need to make significant capital expenditures to develop, among other things, a new slope, airshaft and portal facility at the Harvey Mine. Development of the Harvey Mine began in 2009, and construction of the supporting surface facilities commenced in 2011. Longwall mining production commenced in March 2014. For the years ended December 31, 2025, 2024 and 2023, the Harvey Mine produced 5.6 million, 5.7 million and 6.2 million tons of coal, respectively.
The following table sets forth additional information regarding the recoverable coal reserves at the Pennsylvania Mining Complex (tons in millions):
|
|
|
|
|
|
|
|
|
|
|
|
|
|
|
|
|
|
|
|
|
|
|
|
|
|
|
|
|
|
|
|
|
|
|
|
|
|
|
|
|
|
|
|
|
|
|
|
|
Reserve Class |
|
As-Received Heat Value (Btu/lb) |
|
Owned (%) |
|
Leased (%) |
|
Recoverable Coal Reserves (As-Received) |
|
|
|
|
|
12/31/2025 |
|
12/31/2024 |
| Mine/Reserve |
|
Range |
|
|
|
Proven |
|
Probable |
|
Total |
|
Total |
| PA Mining Operations |
|
|
|
|
|
|
|
|
|
|
|
|
|
|
| Bailey |
Permitted |
|
12,670 – 13,200 |
|
76% |
|
24% |
|
58.7 |
|
52.5 |
|
111.2 |
|
92.1 |
|
Unpermitted |
|
12,790 – 13,180 |
|
100% |
|
—% |
|
13.5 |
|
20.2 |
|
33.7 |
|
33.8 |
| Enlow Fork |
Permitted |
|
12,670 – 13,320 |
|
100% |
|
—% |
|
69.0 |
|
6.7 |
|
75.7 |
|
85.6 |
|
Unpermitted |
|
12,890 – 13,160 |
|
98% |
|
2% |
|
129.7 |
|
22.9 |
|
152.6 |
|
153.6 |
| Harvey |
Permitted |
|
12,880 – 13,190 |
|
100% |
|
—% |
|
39.3 |
|
23.7 |
|
63.0 |
|
99.7 |
|
Unpermitted |
|
12,720 – 13,120 |
|
100% |
|
—% |
|
40.0 |
|
52.8 |
|
92.8 |
|
92.8 |
| Total Recoverable Coal Reserves |
|
|
|
|
|
|
|
350.2 |
|
178.8 |
|
529.0 |
|
557.6 |
Leer Complex - Material Metallurgical Reserves
Leer Complex. The Leer Complex is located on approximately 144,000 acres in Barbour, Taylor and Preston Counties, approximately 25 miles south of Morgantown, West Virginia. Within the complex, there are two active longwall operations, Leer Mine and Leer South Mine, and a third longwall reserve, Leer West. The Leer and Leer South operations run one longwall each and have separate independent preparation plants and train loadout facilities, each serviced by CSX railroad. Both the Leer and Leer South facilities are capable of loading a unit train in less than four hours.
Leer Mine. The Leer Mine is a single longwall operation located in Taylor County, West Virginia, approximately three miles east of the town of Grafton at approximately 39°19’52.62” N latitude and 79°57’48.26” W longitude. As of December 31, 2025, the Leer Mine’s reserves are estimated at approximately 29.4 million tons of High-Vol A metallurgical coal, mining the Lower Kittanning Seam, with an average dry coal product quality of 1.03% sulfur and 8.00% ash. The Company owns roughly 99% of all coal within Leer’s reserves area. Leer’s preparation plant processes up to 1,400 tons of raw coal per hour. For the year ended December 31, 2025, the Leer Mine produced 5.1 million tons of coal.
Leer South Mine. The Leer South Mine is a single longwall operation located in Barbour County, West Virginia, approximately three miles north of the town of Philippi at approximately 39°11’57.57” N latitude and 80°03’07.54” W longitude. As of December 31, 2025, Leer South’s reserves are estimated at approximately 57.0 million tons of High-Vol A metallurgical coal, mining the Lower Kittanning Seam, with an average dry coal product quality of 1.23% sulfur and 8.80% ash. The Company owns approximately 86% of all coal within Leer South’s reserves area, and leases the remaining 14%. Leer South’s preparation plant processes up to 1,600 tons of raw coal per hour. For the year ended December 31, 2025, the Leer South Mine produced 0.4 million tons of coal.
Leer West Mine. The Leer West Mine is a planned single longwall operation located in Taylor County, West Virginia, approximately four miles west of the town of Grafton. As of December 31, 2025, Leer West’s reserves are estimated at approximately 83.8 million tons of High-Vol A metallurgical coal, mining the Lower Kittanning Seam, with an average projected dry coal product quality of 1.18% sulfur and 9.90% ash. The Company owns approximately 96% of all coal within Leer West’s reserves area and leases the remaining 4%. There are no immediate plans to develop Leer West; however, the reserves abut the Leer South Mine, and its southern extent is accessible and may be mined from Leer South.
The following table sets forth additional information regarding the recoverable coal reserves at the Leer Complex (tons in millions):
|
|
|
|
|
|
|
|
|
|
|
|
|
|
|
|
|
|
|
|
|
|
|
|
|
|
|
|
|
|
|
|
|
|
|
|
|
|
|
|
|
|
|
|
|
|
|
|
|
|
|
|
|
|
|
|
|
|
|
|
|
|
|
|
|
Reserve Class |
|
|
|
|
|
|
|
Owned
(%) |
|
Leased
(%) |
|
Recoverable Coal Reserves (As-Received) |
|
|
|
Moisture Free Quality (%) |
|
|
|
12/31/2025 |
|
12/31/2024 |
| Mine/Reserve |
|
|
Sulfur |
|
Ash |
|
Vol |
|
|
|
Proven |
|
Probable |
|
Total |
|
Total |
| Leer Complex |
|
|
|
|
|
|
|
|
|
|
|
|
|
|
|
|
|
|
| Leer |
|
Permitted |
|
1.03 |
|
8.00 |
|
32.4 |
|
99% |
|
1% |
|
22.0 |
|
|
1.2 |
|
|
23.2 |
|
|
— |
|
|
|
Unpermitted |
|
1.01 |
|
7.90 |
|
32.0 |
|
100% |
|
—% |
|
2.6 |
|
|
3.6 |
|
|
6.2 |
|
|
— |
|
| Leer South |
|
Permitted |
|
1.23 |
|
8.80 |
|
34.3 |
|
86% |
|
14% |
|
46.4 |
|
|
10.6 |
|
|
57.0 |
|
|
— |
|
|
|
Unpermitted |
|
— |
|
— |
|
— |
|
—% |
|
—% |
|
— |
|
|
— |
|
|
— |
|
|
— |
|
| Leer West |
|
Permitted |
|
— |
|
— |
|
— |
|
—% |
|
—% |
|
— |
|
|
— |
|
|
— |
|
|
— |
|
|
|
Unpermitted |
|
1.18 |
|
9.90 |
|
33.7 |
|
96% |
|
4% |
|
69.8 |
|
|
14.0 |
|
|
83.8 |
|
|
— |
|
| Total Recoverable Coal Reserves |
|
|
|
|
|
140.8 |
|
|
29.4 |
|
|
170.2 |
|
|
— |
|
Black Thunder Surface Mine - Material Thermal Reserves
Black Thunder Surface Mine. The Black Thunder Surface Mine is located in Campbell County, Wyoming, approximately 11 miles east of the town of Wright at approximately 43°42’07.64” N latitude and 105°17’28.09” W longitude. The Company controls approximately 62,100 contiguous acres of mining rights through 18 state and federal leases. As of December 31, 2025, Black Thunder’s recoverable reserves are estimated at approximately 331.5 million tons. The mine produces sub-bituminous thermal coal via dragline and truck and shovel from the Wyodak and Upper Wyodak Seams in four active pit areas. It employs two train loadout facilities with a total combined loading capacity of 16,000 tons per hour and is serviced by both the Burlington Northern Santa Fe and Union Pacific railroads. For the year ended December 31, 2025, the Black Thunder Mine produced 47.4 million tons of coal.
The following table sets forth additional information regarding the recoverable coal reserves at the Black Thunder Surface Mine (tons in millions):
|
|
|
|
|
|
|
|
|
|
|
|
|
|
|
|
|
|
|
|
|
|
|
|
|
|
|
|
|
|
|
|
|
|
|
|
|
|
|
|
|
|
|
|
|
|
|
|
|
Reserve Class |
|
As-Received Heat Value (Btu/lb) |
|
Owned (%) |
|
Leased (%) |
|
Recoverable Coal Reserves (As-Received) |
|
|
|
|
|
12/31/2025 |
|
12/31/2024 |
| Mine/Reserve |
|
Range |
|
|
|
Proven |
|
Probable |
|
Total |
|
Total |
| Black Thunder Surface Mine |
|
|
|
|
|
|
|
|
|
|
|
|
|
|
| Black Thunder |
Permitted |
|
7,840 – 9,820 |
|
—% |
|
100% |
|
329.5 |
|
|
2.0 |
|
|
331.5 |
|
|
— |
|
|
Unpermitted |
|
— |
|
—% |
|
—% |
|
— |
|
|
— |
|
|
— |
|
|
— |
|
| Total Recoverable Coal Reserves |
|
|
|
|
|
|
|
329.5 |
|
|
2.0 |
|
|
331.5 |
|
|
— |
|
Itmann Mining Complex - Non-Material Metallurgical Reserves
Itmann No. 5 Mine. The Itmann No. 5 Mine is located in Wyoming County, West Virginia, approximately 2.5 miles northwest of the town of Itmann at approximately 37°35’23.65” N latitude and 81°27’14.43” W longitude. The Company controls approximately 20,200 contiguous acres of mining rights (comprising 270 tracts), by ownership or lease, to the Pocahontas 3 seam (P3) and the Pocahontas 4 seam (P4). The majority (approximately 92%) of the acreage is held under coal leases with lengthy terms that are subject to industry standard royalties.
In 2019, the Company commenced development of the new Itmann No. 5 Mine, including excavation of the box cut to access the P3 seam. The mine accesses the P3 and P4 seams using a box cut drift entrance near an outcrop along Still Run Hollow. As of December 31, 2025, the Itmann No. 5 Mine’s assigned reserve base contained an aggregate of 27.1 million tons of clean recoverable coal, enough to allow for more than 30 years of full-capacity production, based on our current estimates. These reserves contain an approximate average quality on a dry basis of 0.97% sulfur, 7.2% ash and 19.3% volatile matter. Coal from the Itmann No. 5 Mine is currently extracted by underground methods using two continuous miner units in one super section. For the years ended December 31, 2025, 2024 and 2023, the Itmann No. 5 Mine produced 453 thousand, 393 thousand and 316 thousand tons of coal, respectively.
The Itmann preparation plant was constructed in 2022 and began processing coal in late September 2022. Coal is shipped from the Itmann No. 5 Mine via tandem trucks to the 600 raw ton-per-hour processing facility, which is located approximately 2.5 miles west of the mine along WV State Route 10/16.
The plant includes clean coal material handling systems capable of handling up to 3,500 tons-per-hour of product along with a 3,500 ton-per-hour unit train loadout located on the Guyandotte Class I rail line, which can be served by both Norfolk Southern and CSX. Third-party coal is also trucked into the facility for processing, blending and shipment via rail or truck.
Beckley Mine - Non-Material Metallurgical Reserves
Beckley Mine. The Beckley Mine is located in Raleigh County, West Virginia, approximately one mile south of the town of Eccles at approximately 37°46’04.85” N latitude and 81°15’24.00” W longitude. The Company controls approximately 16,600 contiguous acres of mining rights by lease and ownership to the Pocahontas 3 seam (P3). As of December 31, 2025, Beckley’s recoverable reserves are estimated at approximately 22.6 million tons. The mine produces premium Low-Vol metallurgical coal, and recoverable reserves contain an approximate average quality on a dry basis of 1.00% sulfur, 6.16% ash and 18.0% volatile matter. Coal from the Beckley Mine is currently extracted by underground methods using ten continuous miner units in five super sections. For the year ended December 31, 2025, the Beckley Mine produced 1.2 million tons of coal. Beckley’s preparation plant can process 600 tons per hour. The mine’s rail loadout facility is serviced by the CSX railroad.
Mountain Laurel Mine - Non-Material Metallurgical Reserves
Mountain Laurel Mine. The Mountain Laurel Mine is located in Logan County, West Virginia, approximately two miles south of the town of Sharples at approximately 37°54’17.50” N latitude and 81°47’28.24” W longitude. The Company controls approximately 38,200 contiguous acres of mining rights by lease and ownership to the Alma and No. 2 Gas Seams. As of December 31, 2025, Mountain Laurel’s recoverable reserves are estimated at approximately 16.3 million tons. The mine produces High-Vol A metallurgical coal, and recoverable reserves contain an approximate average quality on a dry basis of 0.91% sulfur, 13.19% ash and 37.5% volatile matter. Coal from the Mountain Laurel Mine is currently extracted by underground methods using eight continuous miner units in three super sections and two conventional sections. For the year ended December 31, 2025, the Mountain Laurel Mine produced 1.2 million tons of coal. Mountain Laurel’s preparation plant can process 1,400 tons per hour, and the mine’s rail loadout facility is serviced by the CSX railroad.
West Elk Mine - Non-Material Thermal Reserves
West Elk Mine. The West Elk Mine is located in Gunnison County, Colorado, approximately one mile east of the town of Somerset at approximately 38°55’35.11” N latitude and 107°26’46.78” W longitude. The Company controls approximately 19,200 contiguous acres of mining rights by lease to the E, C and B Seams. As of December 31, 2025, West Elk’s recoverable reserves are estimated at approximately 31.5 million tons. The mine produces High-Vol thermal coal, and recoverable reserves contain an approximate average quality on an as-received basis of 0.59% sulfur, 10.05% ash and 11,644 Btu. Coal from the West Elk Mine is currently extracted by underground methods using one longwall. For the year ended December 31, 2025, the West Elk Mine produced 3.2 million tons of coal. West Elk typically runs product as run-of-mine, but it also has a preparation plant to partially run product to meet customer specifications. The mine’s rail loadout facility is serviced by the Union Pacific railroad.
Coal Creek Surface Mine - Non-Material Thermal Resources
Coal Creek Surface Mine. The Coal Creek Surface Mine is located in Campbell County, Wyoming approximately 24 miles south of the town of Gillette at approximately 43°58’16.85” N latitude and 105°16’59.19” W longitude. The Company controls approximately 7,400 contiguous acres of mining rights by lease to the R1 and R3 Splits of the Wyodak Seam. As of December 31, 2025, the Coal Creek Surface Mine’s raw, in situ resources are estimated at approximately 124.3 million tons. The mine produces sub-bituminous run-of-mine thermal coal via dragline and truck and shovel from one active pit area. It employs one train loadout facility and is serviced by both the Burlington Northern Santa Fe and Union Pacific railroads. For the year ended December 31, 2025, the Coal Creek Surface Mine produced 1.5 million tons of coal. The mine is in its reclamation phase and is scheduled to cease production by 2030.
The following table sets forth additional information regarding the non-material recoverable reserves and non-material raw, in situ resources at our other active operations (tons in millions):
|
|
|
|
|
|
|
|
|
|
|
|
|
|
|
|
|
|
|
|
|
|
|
|
|
|
|
|
|
|
|
|
|
|
|
|
|
|
|
|
|
|
|
|
|
|
|
|
|
|
|
|
|
|
|
|
|
|
|
|
|
|
|
|
|
|
|
|
|
|
|
|
|
|
|
|
|
Recoverable Coal Reserves (As-Received) |
|
|
Reserve
Class |
|
Moisture-Free Quality (%) |
|
Owned (%) |
|
Leased (%) |
|
12/31/2025 |
|
12/31/2024 |
| Mine/Reserve |
|
|
Sulfur |
|
Ash |
|
Vol |
|
|
|
Proven |
|
Probable |
|
Total |
|
Total |
| Itmann Mine |
|
|
|
|
|
|
|
|
|
|
|
|
|
|
|
|
|
|
|
|
| Itmann No. 5 |
|
Permitted |
|
0.97 |
|
7.19 |
|
19.3 |
|
8% |
|
92% |
|
15.4 |
|
11.7 |
|
27.1 |
|
3.9 |
|
|
Unpermitted |
|
— |
|
— |
|
— |
|
—% |
|
—% |
|
— |
|
— |
|
— |
|
23.6 |
| Beckley Mine |
|
|
|
|
|
|
|
|
|
|
|
|
|
|
|
|
|
|
|
|
| Beckley |
|
Permitted |
|
1.00 |
|
6.17 |
|
18.0 |
|
—% |
|
100% |
|
20.2 |
|
2.1 |
|
22.3 |
|
— |
|
|
Unpermitted |
|
0.79 |
|
5.44 |
|
18.9 |
|
—% |
|
100% |
|
0.1 |
|
0.2 |
|
0.3 |
|
— |
| Mountain Laurel Mine |
|
|
|
|
|
|
|
|
|
|
|
|
|
|
|
|
|
|
| Mountain Laurel |
|
Permitted |
|
0.86 |
|
5.96 |
|
34.8 |
|
47% |
|
53% |
|
11.2 |
|
4.1 |
|
15.3 |
|
— |
|
|
Unpermitted |
|
0.85 |
|
5.70 |
|
34.6 |
|
—% |
|
100% |
|
0.7 |
|
0.3 |
|
1.0 |
|
— |
|
|
|
|
|
|
|
|
|
|
|
|
|
|
|
|
|
|
|
|
|
|
|
|
|
|
|
|
|
|
|
|
|
|
|
Recoverable Coal Reserves (As-Received) |
|
|
Reserve
Class |
|
As-Received Quality (%) |
|
Owned (%) |
|
Leased (%) |
|
12/31/2025 |
|
12/31/2024 |
| Mine/Reserve |
|
|
Sulfur |
|
Ash |
|
SO2 |
|
|
|
Proven |
|
Probable |
|
Total |
|
Total |
| West Elk Mine |
|
|
|
|
|
|
|
|
|
|
|
|
|
|
|
|
|
|
|
|
| West Elk |
|
Permitted |
|
0.59 |
|
10.05 |
|
1.0 |
|
—% |
|
100% |
|
29.8 |
|
1.7 |
|
31.5 |
|
— |
|
|
|
|
|
|
|
|
|
|
|
|
|
|
|
|
|
|
|
|
|
|
|
|
|
|
|
|
|
|
|
|
|
|
|
Raw, In Situ Coal Resources (As-Received) |
|
|
Resource
Class |
|
As-Received Quality (%) |
|
Owned (%) |
|
Leased (%) |
|
12/31/2025 |
|
12/31/2024 |
| Mine/Resource |
|
|
Sulfur |
|
Ash |
|
SO2 |
|
|
|
Proven |
|
Probable |
|
Total |
|
Total |
| Coal Creek Surface Mine |
|
|
|
|
|
|
|
|
|
|
|
|
|
|
|
|
|
|
| Coal Creek |
|
Permitted |
|
0.35 |
|
6.14 |
|
0.9 |
|
—% |
|
100% |
|
102.6 |
|
0.6 |
|
103.2 |
|
— |
|
|
Unpermitted |
|
0.33 |
|
6.03 |
|
0.8 |
|
—% |
|
100% |
|
20.6 |
|
0.5 |
|
21.1 |
|
— |
Other Properties - Non-Material Resources as of December 31, 2025
The Company also holds other greenfield raw, in situ coal resources located in NAPP, the Central Appalachian Basin (“CAPP”), the Illinois Basin (“ILB”) and the PRB, which are not deemed individually material and had an estimated 3,400.9 million tons of raw, in situ resources. The Company’s estimate includes raw, in situ High-Vol, Mid-Vol or Low-Vol metallurgical coal resources of 608.4 million tons. Additionally, worldwide demand for metallurgical coal allows some of our raw, in situ resources, currently classified as thermal coal but that possess certain qualities, to be sold as metallurgical coal. The extent to which we can sell thermal coal as crossover metallurgical coal depends upon a number of factors, including the quality characteristics of the reserve or resource, the specific quality requirements and constraints of the end-use customer and market conditions, which affect whether customers are compelled to substitute lower-quality crossover coal for higher-quality metallurgical coal in their blends to realize economic benefits.
The following tables set forth our other non-material, non-operating, raw, in situ coal resources by region (tons in millions):
|
|
|
|
|
|
|
|
|
|
|
|
|
|
|
|
|
|
|
|
|
|
|
|
|
|
|
|
|
|
|
|
|
|
|
|
|
|
|
|
|
|
|
|
|
|
|
As Received Heat Value (Btu/lb) |
|
Owned (%) |
|
Leased (%) |
|
Recoverable Coal Reserves (As-Received) (a) |
|
|
|
|
|
12/31/2025 |
|
12/31/2024 |
| Property |
|
Range |
|
|
|
Proven |
|
Probable |
|
Total |
|
Total |
| NAPP |
|
11,400 – 13,400 |
|
—% |
|
—% |
|
— |
|
— |
|
— |
|
23.3 |
| CAPP |
|
12,400 – 14,100 |
|
—% |
|
—% |
|
— |
|
— |
|
— |
|
76.6 |
| Total Non-Operating Reserves |
|
|
|
|
|
|
|
— |
|
— |
|
— |
|
99.9 |
|
|
|
|
|
|
|
|
|
|
|
|
|
|
|
|
|
|
|
|
|
|
|
|
|
|
|
|
|
|
|
|
|
|
|
|
|
|
|
|
|
|
|
|
|
|
|
|
|
|
|
|
|
As Received Heat Value (Btu/lb) |
|
Owned
(%) |
|
Leased
(%) |
|
Raw, In Situ Coal Resources (As-Received) (b)(c) |
|
|
|
|
|
12/31/2025 |
|
12/31/2024 |
| Property |
|
Range |
|
|
|
Measured |
|
Indicated |
|
Inferred |
|
Total |
|
Total |
| Mason Dixon Mine |
|
12,250 – 13,060 |
|
96% |
|
4% |
|
221.8 |
|
314.3 |
|
16.6 |
|
552.7 |
|
273.9 |
| River Mine |
|
12,790 – 13,100 |
|
100% |
|
—% |
|
95.4 |
|
872.2 |
|
143.4 |
|
1,111.0 |
|
610.6 |
| NAPP |
|
11,400 – 13,400 |
|
100% |
|
—% |
|
33.4 |
|
65.0 |
|
0.4 |
|
98.8 |
|
— |
| CAPP |
|
12,400 – 14,100 |
|
79% |
|
21% |
|
245.8 |
|
260.1 |
|
3.6 |
|
509.5 |
|
112.5 |
| ILB |
|
11,600 – 12,000 |
|
80% |
|
20% |
|
227.7 |
|
567.3 |
|
57.5 |
|
852.5 |
|
244.9 |
| PRB |
|
8,100 – 9,200 |
|
—% |
|
100% |
|
266.0 |
|
10.4 |
|
— |
|
276.4 |
|
— |
| Total Non-Operating Resources |
|
1,090.1 |
|
2,089.3 |
|
221.5 |
|
3,400.9 |
|
1,241.9 |
(a) Certain projects reported on a clean, recoverable ton reserve basis for the year ended December 31, 2024 are now being reported on a raw, in situ resource basis for the year ended December 31, 2025.
(b) Information for the year ended December 31, 2025 includes properties acquired through the Merger.
(c) Information for the year ended December 31, 2024 is reported on a clean, recoverable ton basis.
Title to and the boundaries of the coal properties that we lease or purchase are verified by law firms retained by us at the time we lease or acquire the properties. Consistent with industry practice, abstracts and title reports are reviewed and updated approximately five years prior to planned development or mining of the property. If defects in title or boundaries of undeveloped resources are discovered in the future, control of and the right to mine resources could be adversely affected.
The following table sets forth the total royalty tonnage and the amount of income, net of related expenses, we received from royalty payments for the years ended December 31, 2025, 2024 and 2023.
|
|
|
|
|
|
|
|
|
|
|
|
| |
Total
Royalty Tonnage |
|
Total
Royalty Income (a)
|
| Years Ended December 31, |
(in thousands) |
|
(in thousands) |
| 2025 |
4,907 |
|
$ |
23,491 |
|
| 2024 |
1,985 |
|
$ |
17,633 |
|
| 2023 |
1,179 |
|
$ |
8,326 |
|
(a) Excludes advanced mining royalty, overriding royalty and flat fee royalty payments received of $7,957, $746 and $529 during the years ended December 31, 2025, 2024 and 2023, respectively.
Royalty tonnage leased to third parties is not included in the amounts of produced tons that we report, nor is it included in our reported recoverable reserves and resources.
Production as of December 31, 2025
The following table contains summary information for the Company’s mines:
|
|
|
|
|
|
|
|
|
|
|
|
|
|
|
|
|
|
|
|
|
|
|
|
|
|
|
|
|
|
|
|
|
|
|
|
|
|
|
|
|
|
|
|
|
|
|
|
|
|
|
| |
|
Loadout Facility Location |
|
Mine Type |
|
Mining Equipment |
|
Transportation |
|
Tons Produced
(in millions) |
|
Year Established or Acquired |
| Mine |
|
|
|
|
|
2025 |
|
2024 |
|
2023 |
|
| High CV Thermal |
|
|
|
|
|
|
|
|
|
|
|
|
|
|
|
|
| Bailey |
|
Enon, PA |
|
U |
|
LW/CM |
|
R R/B |
|
11.7 |
|
10.8 |
|
11.2 |
|
1984 |
| Enlow Fork |
|
Enon, PA |
|
U |
|
LW/CM |
|
R R/B |
|
10.0 |
|
9.2 |
|
8.7 |
|
1989 |
| Harvey |
|
Enon, PA |
|
U |
|
LW/CM |
|
R R/B |
|
5.6 |
|
5.7 |
|
6.2 |
|
2014 |
| West Elk |
|
Somerset, CO |
|
U |
|
LW/CM |
|
R R/B |
|
3.2 |
|
— |
|
— |
|
2025 |
| Total High CV Thermal |
|
|
|
|
|
|
|
|
|
30.5 |
|
25.7 |
|
26.1 |
|
|
|
|
|
|
|
|
|
|
|
|
|
|
|
|
|
|
|
| Metallurgical |
|
|
|
|
|
|
|
|
|
|
|
|
|
|
|
|
| Leer |
|
Grafton, WV |
|
U |
|
LW/CM |
|
R R/B |
|
5.1 |
|
— |
|
— |
|
2025 |
| Leer South |
|
Philippi, WV |
|
U |
|
LW/CM |
|
R R/B |
|
0.4 |
|
— |
|
— |
|
2025 |
| Beckley |
|
Eccles, WV |
|
U |
|
CM |
|
R R/B |
|
1.2 |
|
— |
|
— |
|
2025 |
| Mountain Laurel |
|
Sharples, WV |
|
U |
|
CM |
|
R R/B |
|
1.2 |
|
— |
|
— |
|
2025 |
| Itmann No. 5 Mine |
|
Itmann, WV |
|
U |
|
CM |
|
R/B T/R |
|
0.5 |
|
0.4 |
|
0.3 |
|
2020 |
| Total Metallurgical |
|
|
|
|
|
|
|
|
|
8.4 |
|
0.4 |
|
0.3 |
|
|
|
|
|
|
|
|
|
|
|
|
|
|
|
|
|
|
|
| PRB |
|
|
|
|
|
|
|
|
|
|
|
|
|
|
|
|
| Black Thunder |
|
Wright, WY |
|
S |
|
DTS |
|
R R/B |
|
47.4 |
|
— |
|
— |
|
2025 |
| Coal Creek |
|
Gillette, WY |
|
S |
|
DTS |
|
R R/B |
|
1.5 |
|
— |
|
— |
|
2025 |
| Total PRB |
|
|
|
|
|
|
|
|
|
48.9 |
|
— |
|
— |
|
|
|
|
|
|
|
|
|
|
|
|
|
|
|
|
|
|
|
| Total Company |
|
|
|
|
|
|
|
|
|
87.8 |
|
26.1 |
|
26.4 |
|
|
Table may not sum due to rounding.
|
|
|
|
|
|
|
|
|
| U |
— |
Underground |
| S |
— |
Surface |
| LW |
— |
Longwall |
| CM |
— |
Continuous Miner |
| DTS |
— |
Dragline, Truck and Shovel |
| R |
— |
Rail |
| R/B |
— |
Rail to Barge or Vessel |
| T/R |
— |
Truck to Rail |
Coal Marketing and Sales
The following table sets forth tons sold and average realized coal revenue per ton sold:
|
|
|
|
|
|
|
|
|
|
|
|
|
|
|
|
|
|
|
Year Ended December 31, |
|
2025 |
|
2024 |
|
2023 |
| Total Revenues (in millions) |
$ |
4,165 |
|
|
$ |
2,164 |
|
|
$ |
2,507 |
|
| High CV Thermal Operations Tons Sold (in millions) |
30.6 |
|
25.7 |
|
26.0 |
| Average Realized Coal Revenue per Ton Sold – High CV Thermal Operations |
$ |
60.34 |
|
|
$ |
65.54 |
|
|
$ |
77.74 |
|
| Metallurgical Operations Total Tons Sold (in millions) |
9.0 |
|
0.7 |
|
0.5 |
| Metallurgical Operations Coking Coal Tons Sold (in millions) |
7.6 |
|
0.7 |
|
0.5 |
| Average Realized Coal Revenue per Ton Sold – Metallurgical Operations |
$ |
102.36 |
|
|
$ |
153.10 |
|
|
$ |
158.71 |
|
| PRB Operations Tons Sold (in millions) |
48.9 |
|
0.0 |
|
0.0 |
| Average Realized Coal Revenue per Ton Sold – PRB Operations |
$ |
14.46 |
|
|
$ |
— |
|
|
$ |
— |
|
We sell coal produced by our mines and additional coal that we purchase from other producers. During the year ended December 31, 2025, approximately 37% of our coal revenue was from U.S. electric power generators, 56% was from export markets, comprising 8%, 20% and 28% from power generators, industrial and metallurgical customers, respectively, and 7% was from other domestic customers. During the year ended December 31, 2024, approximately 31% of our coal revenue was from U.S. electric power generators, 66% was from export markets, comprising 12%, 35% and 19% from power generators, industrial and metallurgical customers, respectively, and 3% was from other domestic customers. During the year ended December 31, 2023, approximately 27% of our coal revenue was from U.S. electric power generators, 71% was from export markets, comprising 16%, 40% and 15% from power generators, industrial and metallurgical customers, respectively, and 2% was from other domestic customers.
We made sales to approximately 110 customers from our coal operations during the past two years. During the year ended December 31, 2025, no customers comprised over 10% of our total sales. During the year ended December 31, 2024, two customers each comprised over 10% of our total sales, aggregating approximately 22% of our total sales.
Similarly, prior to the Merger, Arch marketed its metallurgical and thermal coal to domestic and foreign steel producers, domestic and foreign electric power generators, and other industrial facilities. For the year ended December 31, 2024, Arch derived approximately 16% of its total coal revenues from sales to its three largest customers.
Coal Contracts and Pricing
We sell coal to an established customer base through opportunities as a result of strong business relationships or through a formalized bidding process. Contract volumes range from a single shipment to multi-year agreements for millions of tons of coal. In the ordinary course of business, we make efforts to renew or extend contracts scheduled to expire. Although there are no guarantees, we generally have been successful in renewing or extending contracts in the past.
Domestic coal revenue tends to be derived from contracts that typically have a term of one year or longer, and the pricing is typically fixed. Historically, export coal revenue tended to be derived from spot or shorter-term contracts with pricing determined closer to the time of shipment or based on a market index; however, the Company has secured several long-term export contracts with varying pricing arrangements.
The volume of coal to be delivered is specified in each of our coal contracts. Although the volume to be delivered under the coal contracts is stipulated, the parties may vary the timing of the deliveries within specified limits. Coal contracts typically contain force majeure provisions allowing for the suspension of performance by either party for the duration of certain force majeure events. Force majeure events include, but are not limited to, unexpected significant geological conditions or natural disasters. Depending on the language in the contract, some contracts may terminate upon continuance of an event of force majeure that extends for a period greater than three to 12 months.
Of our 2025 sales tons, approximately 28% were sold to export markets and 72% were sold to domestic customers. Of our 2025 sales tons, 73% were sold in the electric power generation market, 16% were sold in the industrial market and 11% were sold in the metallurgical market.
The prices we are able to achieve in the domestic thermal market depend on a number of factors, including (i) the supply-demand balance for our products, (ii) prices for other competing sources of energy used for electric power generation, such as natural gas, (iii) power prices in the regions we serve, (iv) prices for coals from other basins that compete in these same regions and (v) pricing under our longer-term contracts, which may have been entered into under different market conditions.
Natural gas prices, coupled with increased capacity from new natural gas combined-cycle power plants and renewable energy sources, put pressure on power prices and on the demand for coal-fired electric power generation. These factors can affect the prices that we are able to achieve in the domestic thermal markets.
Similarly, imbalances in global supply and demand for energy fuels can cause substantial variability in pricing in the export markets we serve, which include industrial, metallurgical and electric power generation applications. The prices we are able to achieve in these export markets depend on a number of factors, including (i) the supply-demand balance of seaborne thermal coal, specifically high calorific value coals, (ii) the supply-demand balance of seaborne metallurgical coal, (iii) prices for other competing sources of energy used in certain industrial applications, such as petroleum coke and metallurgical coal, (iv) prices for other competing sources of energy used for electric power generation, such as natural gas, (v) prices for other export coals that compete in these same markets and (vi) pricing under our longer-term contracts, which may have been entered into under different market conditions.
Distribution
Coal is transported from the Company’s mining operations to customers predominantly by railroad cars and ocean vessels. Most customers coordinate their own transportation. For the remaining customers, our sales and logistics specialists negotiate freight and equipment agreements with various transportation suppliers, including railroads, barge lines, terminal operators, ocean vessel brokers and trucking companies.
Seasonality
Our business has historically experienced limited variability in its results due to the effect of seasonal changes. Demand for coal-fired electric power can increase due to unusually hot or cold weather as power consumers use more air conditioning or heating, respectively. Conversely, mild weather can result in weaker demand for our thermal coal. Adverse weather conditions, such as blizzards or floods, can impact our ability to transport coal with our overland conveyor systems and by rail.
Competition
The coal industry is highly competitive, with numerous producers selling into all markets that use coal. There are numerous large and small producers in all coal-producing basins of the U.S., and we compete with many of these producers, including those who export coal abroad. Potential changes to international trade agreements, trade concessions and tariffs or other political and economic arrangements may benefit coal producers operating in countries other than the U.S. We may be adversely impacted on the basis of price or other factors compared to companies that in the future may benefit from favorable foreign trade policies or other arrangements. In addition, coal is sold internationally in U.S. dollars and, as a result, general economic conditions in foreign markets and changes in foreign currency exchange rates may provide our international competitors with a competitive advantage. If our competitors’ currencies decline against the U.S. dollar or against our international customers’ local currencies, those competitors may be able to offer lower prices for coal to our customers. Furthermore, if the currencies of our overseas customers were to significantly decline in value in comparison to the U.S. dollar, those customers may seek decreased prices for the coal we sell to them. Consequently, currency fluctuations could adversely affect the competitiveness of our coal in international markets, which could have a material adverse effect on our business, financial condition, results of operations and cash flows.
The most important factors on which we compete are coal price, coal quality and characteristics, transportation costs and reliability of supply. Demand for coal and the prices that we will be able to obtain for our coal are closely linked to coal consumption patterns of international coal consumers and the domestic electric power generation industry. These coal consumption patterns are influenced by many factors that are beyond our control, including demand for cement and steel manufacturing, demand for electricity, which is significantly dependent upon economic activity and summer and winter temperatures, government regulation, technological developments and the location, quality, price and availability of competing fuel sources.
Indirect competition for sales of thermal coal from natural gas-fired power plants that are relatively more efficient, less expensive to construct and less difficult to permit than coal-fired power plants has the most potential to displace a significant amount of coal-fired electric power generation in the near term, particularly older, less efficient coal-fired electric power generators. Federal and state mandates for increased use of electricity derived from renewable energy sources can also affect demand for our coal. Such mandates, combined with falling costs for wind and solar energy technologies and other incentives to use renewable energy sources, such as tax credits, have made alternative fuel sources more competitive with coal. Additionally, competition for production of steel from non-coal sources, including electric arc furnaces or other alternative processes, or competition for production of cement from other sources, including petroleum coke, may limit demand for our product.
Human Capital Management
As of December 31, 2025, Core and its subsidiaries had 4,850 employees, of which 39 Core Marine Terminal employees were represented by a collective bargaining agreement. We believe our efforts in managing our workforce have been effective, evidenced by a strong culture and a good relationship between the Company and our employees.
Health and Safety. The success of our business is fundamentally connected to the well-being of our people. Accordingly, we are committed to the health, safety and wellness of our employees. We provide our employees and their families with access to health and welfare programs, including benefits that support their physical and mental health by providing tools and resources to help them improve or maintain their health status.
Talent. Through our long operating history and experience with technological innovation, we appreciate the importance of retention, growth and development of our employees. Our approach to talent is to both develop talent from within and supplement with external hires. We believe this method has yielded loyalty and commitment in our employee base, which in turn grows our business, while at the same time, adding new employees and external ideas supports a continuous improvement mindset and contributes to our goals of having a diverse and inclusive workforce. We believe that having approximately 39% of the Company’s workforce with at least ten years of company service, coupled with our average voluntary retention rate of 87% as of December 31, 2025 reflects the engagement of our employees.
Total Rewards. Our employees are critical to the success of our Company. As such, we offer market-competitive total rewards programs for our employees in order to attract and retain superior talent. In addition to competitive base wages, the Company has additional programs, which include bonus opportunities, a Company-matched 401(k) plan, healthcare and insurance benefits, health savings spending accounts, paid time off, family leave, flexible work schedules, employee wellness programs and employee assistance programs.
Employee Development. The Company provides its employees with tools and development resources to enhance their skills and careers at the Company, including (i) encouraging employees to discuss their professional development and identify interests or possible cross-training areas during annual performance reviews with their supervisors, (ii) providing a tuition aid program for educational pursuits related to present work or possible future positions, (iii) providing talent review and succession planning and (iv) providing opportunities for on-the-job growth through stretch assignments or temporary projects outside of an employee’s typical responsibilities.
Laws and Regulations
Overview
Our coal mining operations are subject to various federal, state and local environmental, health and safety regulations. Regulations relating to our operations require us to obtain permits and other licenses; reclaim and restore our properties after mining operations have been completed; store, transport and dispose of materials used or generated by our operations; manage surface subsidence from underground mining; control water and air emissions; protect wetlands and endangered plants and wildlife and ensure employee health and safety. Furthermore, the electric power generation industry, steel production industry and other users of our coal are subject to extensive regulation regarding the environmental impact of their activities, which could affect demand for our coal.
We seek to conduct our operations in compliance with applicable laws and regulations. However, from time to time, violations occur during operations, and we cannot assure that we have been or will be at all times in compliance with such laws and regulations. Compliance with these laws has substantially increased the cost of coal mining, and the possibility exists that new legislation or regulations may be adopted which would have a significant impact on our coal mining operations or our customers’ ability to use our coal and may require us or our customers to significantly modify operations or incur substantial costs. Additionally, these laws are subject to revision and may become increasingly stringent.
In addition, independent of the regulatory process, presidential administrations could issue executive orders or other presidential directives having the force of law that could immediately impact our business or our customers’ businesses. As part of a broad deregulatory strategy since taking office, President Trump has issued several executive orders aiming to suspend, revise or rescind regulatory actions from the prior administration. For example, on January 20, 2025, President Trump issued Executive Order 14154 “Unleashing American Energy” that directs all federal agency heads to identify any agency actions that “impose an undue burden on the identification, development, or use of domestic energy resources.” On March 12, 2025, the U.S. Environmental Protection Agency (“EPA”) announced its intention to take a variety of deregulatory actions to implement the administration’s environmental and energy policies (the “Rollback Plan,” discussed below).
The ultimate effect of these actions may not be predictable, as various associated regulations are still in development or subject to public notice, extensive comment or judicial review.
The following is a summary of the more significant existing environmental and worker health and safety laws and regulations to which we or our customers’ business operations are subject and for which compliance may have a material adverse effect on our business, results of operations, financial condition or demand for our coal. See Item 1A. “Risk Factors” included in this Report for additional discussion regarding laws and regulations affecting our business, operations and industry.
Environmental Laws
Clean Air Act. The U.S. federal Clean Air Act (“CAA”) and corresponding state and local laws and regulations affect multiple aspects of our business, both directly and indirectly. The CAA directly impacts our coal mining and coal export operations through permitting and emission control requirements for the construction, operation, modification or expansion of certain facilities, including our mines, coal preparation plants and export terminal operations. In certain cases, if emissions have the potential to exceed major source thresholds established by the EPA, an operating permit under Title V of the CAA is required to operate. To comply with emissions limits or other compliance requirements under Title V, we may be required to install capital-intensive pollution control devices, incur expenses associated with the purchase of emissions credits or curtail production. Such requirements could have a material adverse effect on our business, financial condition and results of operations.
Indirectly, the CAA affects the U.S. coal industry by extensively regulating the air emissions of coal-fired power plants or other industrial facilities operated by our customers. Coal impurities are released into the air when coal is burned, and the CAA regulates specific emissions, such as sulfur dioxide, nitrogen oxides, particulate matter, mercury and other substances, produced during that process. In addition, CAA programs such as Maximum Achievable Control Technology (“MACT”) emission limits for Hazardous Air Pollutants (“HAPs”), the Regional Haze Program, New Source Review permitting requirements and other federal rulemakings may directly or indirectly affect our operations. Such regulations restricting emissions from coal-fired power plants or other industrial facilities could increase the costs of operating and affect demand for coal as a fuel source, therefore potentially affecting the volume of our sales. Moreover, additional environmental regulations increase the likelihood that existing coal-fired power plants will be decommissioned or replaced with alternative sources of fuel and reduce the likelihood that new coal-fired power plants will be built in the future.
Mercury and Air Toxics Standards Rule. In 2012, the EPA promulgated a rule establishing National Emission Standards for Hazardous Air Pollutants (“NESHAP”) for new and existing coal- and oil-fired electric generating units (“EGUs”). The EPA’s 2012 Mercury and Air Toxics Standards rule (“2012 MATS Rule”) imposed MACT emissions limitations on Hazardous Air Pollutants, such as mercury, acid gas HAPs, HAP metals and organic HAPs, for applicable facilities. Following multiple regulatory actions, in May 2024, the EPA finalized amendments to the NESHAPs for coal- and oil-fired EGUs, further restricting emissions limitations and establishing a compliance date of July 8, 2027. In April 2025, President Trump signed a proclamation exempting certain sources from compliance with the 2024 MATS amendments for a period of 2 years. In June 2025, the EPA proposed a rule to repeal the 2024 MATS amendments, reverting certain emission standards and compliance requirements to those established in the 2012 MATS Rule.
National Ambient Air Quality Standards. The CAA requires the EPA to set National Ambient Air Quality Standards (“NAAQS”) for six “criteria pollutants” (including particulate matter (“PM”), nitrogen oxides (“NOx”), ozone, sulfur dioxide (“SO2”), lead and carbon monoxide) considered harmful to public health and the environment. The EPA must review these standards every five years. Areas that are not in compliance with the NAAQS are considered “non-attainment areas.” The designation of new non-attainment areas could prompt local changes to permitting or emissions control requirements, as prescribed by federally mandated state implementation plans (“SIPs”) that require emission source identification and emission reduction plans, which may include significant investment in emissions control technologies associated with our or our customers’ operations. Related to the PM NAAQS, the EPA published a final rule lowering the standard for fine particulate matter (“PM2.5”), which became effective in May 2024 and is subject to ongoing litigation in the D.C. Circuit Court of Appeals. As part of the Rollback Plan, the EPA announced it would reconsider the May 2024 PM2.5 rule, and in November 2025, the EPA filed a motion requesting the D.C. Circuit to vacate the rule. Review proceedings for NOx and ozone have also been announced and are in preliminary phases.
Cross State Air Pollution Rule (“CSAPR”) and Good Neighbor Plans. The CSAPR was finalized in 2011 to satisfy the “good neighbor” provisions of the CAA, which require upwind states to eliminate their contributions to downwind states’ non-attainment of the NAAQS. In February 2023, the EPA issued its final disapproval of SIPs submitted by 21 states to address interstate air pollution in furtherance of attaining the 2015 Ozone NAAQS. The EPA’s SIP disapprovals were challenged by several states in the respective jurisdictions’ federal court of appeals, and litigation is ongoing in most cases.
Following the SIP disapprovals, in March 2023, the EPA published the Good Neighbor Plan Federal Implementation Plan (“FIP”) for the 2015 Ozone NAAQS. The rule relies, in part, on a NOx allowance trading program and requires operation of existing, and installation of new, emissions control technologies for EGUs and other industrial sources. Upwind states challenged the FIP, and the Supreme Court issued a decision temporarily blocking its implementation while litigation is ongoing. In November 2024, the EPA issued an interim final rule that imposed a nationwide administrative stay on the Good Neighbor Rule. Separately, in June 2025, the Supreme Court issued its decision that the proper venue for challenging the EPA’s denial of SIPs is the associated regional circuit court. As part of the Rollback Plan, the EPA announced its intention to reconsider the Good Neighbor Plan.
Emission Guidelines for Greenhouse Gas Emissions from Existing Fossil Fuel-Fired Electricity Utility Generating Units under CAA Sections 111(d) and 111(b). In May 2024, the EPA published a suite of final rulemakings under CAA sections 111(d) and 111(b) establishing the National Pollutant Discharge Permit System for greenhouse gas (“GHG”) emissions from existing and new fossil fuel-fired EGUs, respectively. The final rule, referred to as the “Clean Power Plan 2.0,” replaced the Affordable Clean Energy rule, which was vacated and remanded to the EPA by the D.C. Circuit in 2021.
For existing coal-fired EGUs in operation on or after January 1, 2039, the rule requires EGUs to be equipped with Carbon Capture and Storage (“CCS”) with 90% capture on or before January 1, 2032. For coal-fired EGUs that will cease operations by January 1, 2039, the rule requires compliance with a numeric emission rate based on 40% co-firing natural gas with coal on or before January 1, 2030. Coal-fired EGUs planning to permanently cease operations before January 1, 2032 would not be subject to emissions guidelines.
To achieve compliance, our customers could be required to incur substantial capital investment and increased operating costs. Alternatively, EGU owners and operators may accelerate the closure of existing power plants or agree to curtail their use. The suite of rules was challenged and is subject to ongoing litigation before the D.C. Circuit. In October 2024, the Supreme Court denied emergency applications to stay the rule while litigation is ongoing. In June 2025, the EPA published a proposed rulemaking repealing GHG emissions standards for fossil fuel-fired EGUs established by the Clean Power Plan 2.0.
Global Climate Change
Our customers’ consumption of the coal we produce results in the emission of GHGs, particularly carbon dioxide (“CO2”). To date in the U.S., no legislation to comprehensively regulate global climate issues and GHG emissions has been signed into law. In August 2025, the EPA published a proposed rulemaking to rescind findings published in 2009 that concluded GHG emissions pose an endangerment to public health and the environment. If finalized, the EPA would lack statutory authority under Section 202(a) of the Clean Air Act to prescribe standards for GHG emissions.
During coal mining operations, GHG emissions are primarily tied to combustion of fuel from mining equipment used in production, consumption of electricity and the ventilation of methane from our coal mines to promote a safe working environment for our miners underground. Since 2011, the EPA has required active underground coal mines and certain support facilities exceeding a minimum GHG emission threshold, including our operations, to report annual emissions to the EPA under the GHG Mandatory Reporting Rule (“MRR”). In September 2025, the EPA published a proposed rule to permanently repeal the MRR for certain source categories, including underground coal mines.
Separately, federal, state and international jurisdictions have proposed or enacted laws and regulations requiring companies to disclose climate-related risks, certain climate-related financial metrics, an accounting of direct and indirect GHG emissions and details of climate change targets and goals. For example, on March 6, 2024, the Securities and Exchange Commission (“SEC”) adopted final rules requiring registrants to disclose certain climate-related information in their registration statements and annual reports. The rule has been stayed pending litigation; however, the Eighth Circuit has held the litigation in abeyance pending the SEC’s defense of the rule or undertaking of a formal rulemaking to withdraw the rule. Similar rules, such as those adopted in California and the European Union, impose reporting obligations related to climate-related metrics and impacts. Calculation of some GHG emissions can involve uncertainty and lack precision because of the absence of reliable inputs or methods to perform such calculations, which could give rise to litigation risk. While the California rules are subject to litigation, regulators are continuing to prepare for implementation; as such, we are unsure of the ultimate fate of these rules or the potential effects on the Company.
In the absence of sweeping federal legislation on GHG emissions in the U.S., a number of states, governors, mayors and businesses have committed to broad goals for GHG reductions or requirements to deploy carbon-free or renewable sources of electricity. Such goals include those announced by multiple domestic utilities, including some of our customers, pledging to substantially reduce or to achieve net zero GHG emissions or to increase generating capacity from renewable sources. These goals could ultimately affect the demand and prices for our coal as these customers seek to achieve such goals over time.
In addition, certain states have enacted requirements for utilities to provide a minimum percentage of power from renewable sources or mandatory cap-and-trade initiatives, seeking to limit CO2 emissions annually, in order to achieve a prescribed long-term emissions reduction target. In cap-and-trade scenarios, electric power generators or other GHG emitters are required to purchase allowances, available through auction or a secondary market, that are equal to one ton of CO2 emissions, thereby increasing the cost of electric power generation and incentivizing the power generator to limit their CO2 emissions by combusting fewer fossil fuels, including coal.
Taking a different approach, in 2024, the states of New York and Vermont passed legislation requiring fossil fuel companies to make contributions to state managed “climate superfunds” established to finance the cost of repairs and upgrades to public infrastructure in response to severe weather and other climatic events. Analogous “climate superfund” legislation has also been proposed in multiple states, including California, Connecticut, Hawaii, Maryland, Massachusetts, New Jersey, Oregon, Rhode Island and Virginia. Modeled after the Comprehensive Environmental Response, Compensation, and Liability Act (“CERCLA”), the climate superfunds retroactively impose strict liabilities on fossil fuel companies determined to be responsible for GHG emissions over defined time periods and quantitative thresholds, potentially exposing businesses to substantial financial liabilities associated with historical pollution. Similarly in 2024, legislation proposing to establish the “Fossil Fuel Transportation Fee and Mitigation Fund” was introduced in the Maryland House of Delegates. The legislation would impose a fee of 30 cents per mmBtu on companies transporting fossil fuels in Maryland and would establish the “Fossil Fuel Mitigation Fund” to support activities that reduce GHG emissions in the state. Any regulations or legislation imposing fees on the production, transportation or use of the coal we produce, or seeking damages or abatement for climate change impacts could and may have a material adverse effect on our business, financial condition and results of operations.
At both the federal and state levels, environmental organizations, third parties and regulators have challenged permitting actions associated with new fossil fuel infrastructure, power plants, pipelines and shipping terminals, citing GHG emissions or the failure to account for their climate change impacts. Challenges such as these could result in litigation, limit operational expansion efforts, create permitting delays or restrict coal shipments, any of which could materially impact production, cash flows and results of operations.
Foreign governments, including the European Union and member countries, have adopted regulations governing GHG emissions. Independent of regulation, the United Nations Framework Convention on Climate Change (“UNFCCC”) seeks to establish GHG emission reduction requirements for developed countries. The UNFCCC’s governing body, the Conference of the Parties (“COP”), meets annually to implement and refine a framework for the international Paris Agreement, a voluntary commitment to limit or reduce GHG emissions in order to limit global warming below 2 degrees Celsius from temperatures in the pre-industrial era. The U.S. has withdrawn from the Paris Agreement and, on January 7, 2026, President Trump issued an executive order calling for the withdrawal of the U.S. from the UNFCCC. However, the ultimate effect of these withdrawals is uncertain as it may incite various state and other policymakers to introduce stricter requirements.
Federal, state and international GHG and climate change initiatives, associated regulations or other voluntary commitments to reduce GHG emissions have and are expected to continue to result in (i) the decreased utilization or accelerated closure of existing coal-fired EGUs, (ii) the increased utilization of alternative fuels or generating systems, (iii) a reduction or elimination of new coal-fired power plant construction in certain countries or (iv) the advancement of technologies aimed toward replacing or minimizing the use of coal in industrial or metallurgical processes. Such initiatives and regulations could further reduce demand or prices for our coal in both domestic and international markets, could adversely affect our ability to produce coal and to develop our reserves, could reduce the value of our coal and coal reserves and may have a material adverse effect on our business, financial condition and results of operations.
Clean Water Act
The U.S. federal Clean Water Act (“CWA”) and corresponding state laws affect our coal and export terminal operations by regulating discharges into certain waters of the United States (“WOTUS”). CWA permits, issued either by the EPA or an analogous state agency, typically require regular monitoring and compliance with limitations on defined pollutants and impose related reporting requirements. Specific to the Company’s operations, CWA permits and corresponding state laws at times include, among other requirements, (i) treatment of discharges from coal mining properties and (ii) mandates to dispose of wastes at approved disposal facilities. Additional CWA requirements that could directly or indirectly affect our operations are summarized below.
Dredge and Fill Permits Under CWA Sections 401 and 404. In order to obtain a permit for certain coal mining activities, such as the construction of coal refuse areas and slurry impoundments that may result in impacts to waters of the U.S., an operator may need to obtain a permit for the discharge of fill material from the Army Corps of Engineers (“ACOE”) under Section 404 of the CWA. For specific categories of activities determined to have minimal effects, the Company may be required to comply with Nationwide Permits from the ACOE.
In addition, through the CWA Section 401 Certification Program, state regulators have approval authority over federal permits authorizing activities that could impact state water quality and must certify that the activity will comply with water quality standards or other applicable requirements. In 2023, the EPA issued the CWA Section 401 Water Quality Certification Improvement Rule (the “2023 Rule”) which broadened states’ review of water quality impacts. The 2023 Rule remains in effect and is subject to litigation in the U.S. District Court for the Western District of Louisiana. In January 2026, the EPA announced a proposed rule revising the 2023 Rule, to narrow the scope of certification and standardize certain associated procedures.
Definition of Waters of the United States. The scope of regulated waters has been subject to uncertainty, with the EPA and the ACOE finalizing multiple rulemakings to define WOTUS since 2015. Ultimately, in 2023, the Supreme Court issued its decision in Sackett v. EPA, which narrowed federal jurisdiction over wetlands under the CWA to those with a continuous surface connection to bodies that are waters of the U.S. In response, the EPA and the ACOE issued a final rule revising the definition of WOTUS to conform with the Sackett decision; however, the rule was only implemented in 24 states, the District of Columbia and the U.S. Territories due to ongoing litigation. In November 2025, the Trump administration proposed a rule seeking to narrow the definition of WOTUS to “relatively permanent” waters with a “continuous surface connection.”
Water Discharge Permits. The Company must obtain permits issued pursuant to the National Pollutant Discharge Elimination System (“NPDES”) from the appropriate federal or state permitting authority under Section 402 of the CWA. These permits establish effluent limitations for discharges to receiving waters that are protective of water quality standards. For discharges to receiving waters that are classified as either high-quality or impaired, stringent restrictions are established to ensure anti-degradation and compliance with water quality standards. Permitting such discharges under NPDES could increase the cost, time and difficulty of complying with permit requirements and may warrant costly treatment that could affect our operations.
Effluent Limitations Guidelines for the Steam Electric Power Generating Industry. The 2015 Effluent Limitations Guidelines and Standards (“ELG”) rule established the first federal limits on the levels of toxic metals in various power plant wastewater discharges and set zero-discharge requirements for certain waste streams. Revisions to the 2015 ELG rule were published in October 2020 (“Reconsideration Rule”) and established a voluntary incentive program which provides power plants until December 31, 2028 to (i) retire or (ii) implement changes required to achieve compliance with stringent effluent limits and standards. In May 2024, the EPA published the final Supplemental ELG Rule, further restricting the ELGs established by the Reconsideration Rule, incorporating limitations for additional waste streams and establishing procedural requirements for affected facilities to demonstrate permanent cessation of coal combustion or permanent retirement. The 2024 Supplemental ELG Rule was challenged in the Eighth Circuit Court of Appeals. Most recently, on December 31, 2025, the EPA published a final rule extending the deadline to December 31, 2031 for coal-fired power plants electing to permanently cease coal combustion by 2034. It also extended the deadlines to achieve compliance for certain waste streams by five years from December 31, 2029 to December 31, 2034. The final rule provides additional flexibility to prevent the premature retirement of coal-fired EGUs.
Other Environmental Laws and Regulations
Surface Mining Control and Reclamation Act. The U.S. federal Surface Mining Control and Reclamation Act (“SMCRA”) establishes minimum extraction, environmental, reclamation and closure standards for mining activities. While SMCRA is a comprehensive statute, it does not supersede other major statutes, such as the CAA, CWA, Endangered Species Act and other statutes discussed herein. To facilitate mining activities, operators must obtain SMCRA permits and permit renewals from the U.S. Office of Surface Mining or the applicable state agency. The timing of SMCRA permit issuance is largely at the discretion of the regulatory authorities and is often related to the size and complexity of the operation for which approval is sought. In addition, numerous other permits from applicable federal, state or local authorities are required to conduct mining operations. Timing of permit issuance can also be influenced by public engagement in the permitting process, such as through comment, hearings or legal interventions, which could affect our operations. Permits can also be delayed, refused or revoked if any entity under common ownership or control has unabated permit violations, including the mining and compliance history of officers, directors and principal owners of the entity seeking permit approval. Under the laws applicable to our operations, substantial fines and penalties, including suspension or revocation of permits, and in severe cases, criminal sanctions, may be imposed for failure to comply.
Under federal and state laws, including SMCRA, we are required to obtain surety bonds or other acceptable security to secure payment of our long-term obligations, including mine closure and reclamation, mine water treatment, federal and state workers’ compensation costs, coal leases or other miscellaneous obligations. Surety bonds are typically renewable on a yearly basis, and it is possible that surety bond issuers may refuse to renew bonds or may demand additional collateral. Over the past few years, the surety markets have been increasingly challenging, particularly for coal companies. We have experienced rising premiums, reduced coverage and fewer providers willing to underwrite policies and surety bonds. Terms have become generally unfavorable, including increases in the amount of collateral required to secure surety bonds. However, more recently, we have seen insurance rates and collateral requirements stabilize and even decrease on certain lines of coverage, as new insurance carriers have entered the market, although there is no assurance that this stabilization or decrease will be sustained or continued.
Any failure to maintain, or our inability to acquire, surety bonds required by federal and state laws or the related collateral required by bond issuers could have a material adverse effect on our ability to produce coal, adversely affecting our business, financial condition, liquidity, results of operations and cash flows. As of December 31, 2025, we posted an aggregated $859 million in surety bonds for mine closure purposes, as well as approximately $228 million in surety bonds and letters of credit to secure other obligations including workers compensation, black lung benefits, coal leases and other obligations.
Additionally, in October 2024, the Company and the Pennsylvania Department of Environmental Protection (“PADEP”) finalized agreements to form a Global Water Treatment Trust Fund, providing an approved alternative financial assurance mechanism for 22 legacy mine water treatment systems in Pennsylvania. The Company intends to make annual contributions of $2 million until the cash balance of the fund equals 100% of the present value of future operation, maintenance and recapitalization costs for the treatment systems, currently estimated to be $74.8 million. As the cash balance of the fund grows, surety bonds associated with the treatment systems will be adjusted or released by the PADEP, thereby reducing our exposure to surety bonds and related collateral requirements. Through December 31, 2025, the Company has contributed $14.1 million to the fund, and the PADEP has approved bond reductions totaling $66.3 million.
Separately, SMCRA imposes a reclamation fee on all current mining operations, the proceeds of which are deposited in the Abandoned Mine Reclamation Fund, which is used to restore mine lands mined, closed or abandoned before SMCRA’s adoption in 1977 and to pay health care benefit costs of orphan beneficiaries of the Combined Fund created by the Coal Industry Retiree Health Benefit Act of 1992. The current fees of $0.096 per ton and $0.224 per ton for underground and surface-mined coal, respectively, became effective in October 2021. We recognized expense related to Abandoned Mine Reclamation Fund fees of $14.5 million for the year ended December 31, 2025.
Endangered Species Act. The U.S. federal Endangered Species Act (“ESA”) and other related federal and state statutes protect species that have been classified as endangered, threatened with possible extinction or other protective designations. A number of species native to our operating areas are protected under the ESA or other related laws and regulations. Protection of these species could prohibit or delay authorization of mining activities or may place additional restrictions on our operations related to timbering, construction, vegetation or water discharges. In May 2024, the U.S. Fish and Wildlife Service and the National Marine Fisheries Service (collectively, the “Services”) promulgated final regulations related to procedures for listing threatened and endangered species and agency consultation. In November 2025, the Services proposed four rules to revise rules finalized under the previous administration. Imposition of more stringent or protective measures, or designation of additional critical habitat areas, could expose our operations to additional requirements, increased operating costs or delayed approval timeframes.
Comprehensive Environmental Response, Compensation, and Liability Act. The CERCLA imposes remediation requirements related to actual or threatened releases of hazardous substances into the environment. Under CERCLA or related state laws, joint and several liability may be imposed on generators of hazardous waste, site owners and certain previous owners, waste transporters or others regardless of fault associated with the original disposal activity. Although the EPA excludes most wastes generated during coal mining and processing from hazardous waste laws, such wastes may contain hazardous substances that are governed by CERCLA if released into the environment. Our current operations, operations of our predecessors or facilities to which we have sent waste materials could be subject to liability under CERCLA.
Resource Conservation and Recovery Act. The U.S. federal Resource Conservation and Recovery Act (“RCRA”) and corresponding state laws and regulations affect coal mining by imposing requirements for the treatment, storage, transportation and disposal of certain wastes. Certain waste streams created throughout the mining process, such as coal refuse and coal cleaning wastes, are excluded from the regulatory definition of hazardous waste. Further, coal operations authorized under SMCRA are exempt from RCRA permitting requirements. Other solid, residual or hazardous waste streams generated across our operating footprint are subject to state specific regulations and designations. Waste classification, reporting and management requirements vary by state and include measures such as waste classification, reporting and handling, as well as requirements to eliminate or reduce certain waste streams, which could increase our costs, create compliance risk or expose us to long term liability.
Coal Combustion Residuals. Byproducts of coal combustion, or coal combustion residuals (“CCR”), are regulated under RCRA. In April 2015, the EPA published regulations for the disposal of CCR and classified CCR as “non-hazardous” waste. Since 2015, the EPA has made subsequent revisions to CCR requirements, including a final revised rule mandating closure of unlined impoundments, with deadlines to initiate closures between 2021 and 2028, depending on site-specific circumstances. In December 2025, the EPA announced a proposed rule to extend the closure deadline for certain CCR surface impoundments by three years until October 2031. Due to the combined effect of the Trump administration’s rollback of the CCR and ELG regulations discussed above, the retirement date for certain coal-burning power plants could be extended and may positively impact the demand for our coal.
National Environmental Policy Act. The National Environmental Policy Act (“NEPA”) requires federal agencies to complete certain assessments of environmental impacts of certain proposed “major federal actions,” which includes various permitting decisions. NEPA analysis can be time-consuming and require additional compliance costs. Additionally, various environmental activists have historically used NEPA to challenge and stall projects they oppose, which could adversely impact our operations. While there have been various proposals to revise the scope of NEPA or limit associated reviews, we are unsure whether such proposals will be adopted or of their ultimate impact on our operations.
Other Environmental Regulations. We are required to comply with other federal, state and local environmental laws in addition to those discussed above. These laws include, for example, the Safe Drinking Water Act, the Emergency Planning and Community Right to Know Act, the Toxic Release Inventory and the rules governing the use and storage of explosives regulated by the U.S. Bureau of Alcohol, Tobacco and Firearms and the Department of Homeland Security. We are also subject to state specific laws, regulations and guidelines that impose strict compliance and operating requirements. For example, where we are required to plug oil and natural gas wells to facilitate underground mining activities, we must comply with laws such as the Pennsylvania Oil and Gas Act, the Pennsylvania Coal and Gas Resource Coordination Act and other related regulatory requirements. Compliance with these or other state specific requirements across our operations could increase costs or impact production, thereby having a material adverse effect on our business, financial condition and results of operations.
Health and Safety Laws
Mine Safety. Legislative and regulatory changes have required us to purchase additional safety equipment, construct stronger seals to isolate mined-out areas and engage in additional training. We have also experienced more aggressive inspection protocols, and with new regulations, the volume of civil penalties has increased. Recent actions taken by federal and state governments include requiring:
•the caching of additional supplies of self-contained self-rescuer devices underground;
•the purchase and installation of electronic communication and personal tracking devices underground;
•the purchase and installation of proximity detection devices on continuous miner machines;
•the placement of refuge chambers, which are structures designed to provide refuge for groups of miners during a mine emergency when evacuation from the mine is not possible, which will provide breathable air for 96 hours;
•the purchase of new fire-resistant conveyor belting underground;
•additional training and testing that creates the need to hire additional employees;
•more stringent rock dusting requirements; and
•the purchase of personal dust monitors for collecting respirable dust samples from certain miners.
In September 2015, the Mine Safety and Health Administration (“MSHA”) published proposed rules for underground coal mining operations concerning proximity detection systems for coal hauling machines and scoops. The rulemaking record for this proposed rule was closed in December 2016, but in January 2017, MSHA published a notice reopening the record and extending the comment period for this proposed rule for 30 days. MSHA has not issued a final rule regarding these proposed rules.
The final rule for respirable crystalline silica took effect on June 17, 2024. This final rule establishes a uniform permissible exposure limit (“PEL”) for respirable crystalline silica of 50 micrograms per cubic meter of air (µg/m³) over a full shift, calculated as an 8-hour time-weighted average (“TWA”) for all miners and requires operators to continue to sample if the results are above the action level of 25 µg/m³, but below the PEL within three months of the previous sample. The previous exposure limit for respirable crystalline silica during a coal miner’s shift was 100 µg/m³, reported as an equivalent full shift TWA concentration as measured by the Mining Research Establishment instrument. Mine operators are required to use laboratories accredited to ISO/IEC 17025 to analyze samples for respirable crystalline silica.
On November 26, 2025, MSHA announced it plans to “engage in limited rulemaking to reconsider and seek comments on portions of the Silica Rule.” The U.S. Court of Appeals for the Eighth Circuit required MSHA to provide an update on its rulemaking efforts by February 2, 2026. Ongoing litigation may continue the stay of the rule’s implementation for an unknown period of time.
Black Lung Legislation. Under federal black lung benefits legislation, each coal mine operator is required to make payments of black lung benefits or contributions to:
•current and former coal miners totally disabled from black lung disease;
•certain survivors of miners who have died from black lung disease; and
•a trust fund established by the U.S. Department of the Treasury known as the Black Lung Disability Trust Fund (the “trust fund”) for the payment of benefits and medical expenses to claimants whose last mine employment was before January 1, 1970, where no responsible coal mine operator has been identified for claims (where a miner’s
last coal employment was after December 31, 1969), or where the responsible coal mine operator has defaulted on the payment of such benefits. The trust fund is funded by an excise tax on U.S. production of coal, at a rate of up to $1.10 per ton for deep mined coal and up to $0.55 per ton for surface-mined coal, neither amount to exceed 4.4% of the gross sales price. The Company recognized expense related to the Black Lung Excise Tax of $40.8 million, $11.0 million and $10.9 million for the years ended December 31, 2025, 2024 and 2023, respectively.
In December 2021, the U.S. Government Accountability Office (“GAO”) published a report entitled “Black Lung Benefits Program: Continued Inaction on Coal Operator Self-Insurance Increases Financial Risk to Trust Fund.” This report notes that the U.S. Department of Labor (“DOL”) took certain steps to improve its oversight of self-insured coal mine operators, but these efforts were complicated by the COVID-19 pandemic. The GAO states in the report that the DOL has not taken necessary action to prevent additional benefit liabilities from being transferred to the trust fund and recommends that the DOL act on recommendations made in 2020. In January 2023, the DOL’s Office of Workers’ Compensation Programs (“OWCP”) issued a Notice of Proposed Rulemaking to update its regulations authorizing coal producers to self-insure and for determining appropriate security amounts and announced that it plans to solicit public comments for that proposal. A change in requirements for security posted for coal operator self-insurance could result in the Company being required to post additional security for its obligations.
In December 2024, the OWCP issued a final rule revising the regulations under the Black Lung Benefits Act related to self-insurance by coal mine operators. Under the new standard, self-insured coal mine operators are required to post additional security for the Black Lung benefit liabilities. The final rule requires a security amount equal to 100% of a self-insured operator’s projected black lung liabilities. The rule became effective on January 13, 2025, and operators were required to remit the increased security amount within one year. The final rule, including any assessments, is subject to appeal. In February 2025, the Company received letters from the OWCP that additional guidance regarding the final rule will be provided at a future date.
The Patient Protection and Affordable Care Act (“PPACA”) made two changes to the Federal Black Lung Benefits Act. First, it provided changes to the legal criteria used to assess and award claims by creating a legal presumption that miners are entitled to benefits if they have worked at least 15 years in underground coal mines, or in similar conditions, and suffer from a totally disabling lung disease. To rebut this presumption, a coal company would have to prove that a miner did not have black lung or that the disease was not caused by the miner’s work. Second, it changed the law so black lung benefits will continue to be paid to dependent survivors when the miner passes away, regardless of the cause of the miner’s death. The changes have increased the cost to us of complying with the Federal Black Lung Benefits Act. In addition to the federal legislation, we are also liable under various state statutes for our portion of black lung claims.
Ownership of Coal Rights
The Company acquires ownership or leasehold rights to coal properties prior to conducting operations on those properties. As is customary in the coal industry, we initially conduct a summary review of the title to coal rights that are not in our development plans but which we believe we control at the time of acquisition or as part of a review of our land records to determine control of coal rights. Prior to the commencement of development operations on coal properties, we conduct an additional title examination and perform curative work with respect to significant defects. We generally will not commence operations on a property until we have cured any material title defects on such property. We are typically responsible for the cost of curing any title defects. We have completed title work on substantially all of our coal producing properties and believe that we have satisfactory title to our producing properties in accordance with standards generally accepted in the industry.
Available Information
We maintain a website at www.corenaturalresources.com. We will make available, free of charge, on this website our future annual reports on Form 10-K, quarterly reports on Form 10-Q, current reports on Form 8-K and amendments to those reports filed or furnished pursuant to Section 13(a) or 15(d) of the Exchange Act, as soon as reasonably practicable after such reports are available, electronically filed with, or furnished to the SEC, and are also available on the SEC’s website, www.sec.gov. We also use our website to publish information which may be important to investors, such as presentations to analysts.
ITEM 1A. RISK FACTORS
You should carefully consider the following risks and other information in this Annual Report on Form 10-K in evaluating us and our common stock. The risk factors have been separated into three groups: risks related to our business, risks related to our common stock and the securities market and risks related to our Merger with Arch.
Any of the following risks could materially and adversely affect our financial condition, results of operations or cash flows. Our operations could be affected by various risks, many of which are beyond our control. Based on current information, we believe that the following list identifies the most significant risk factors (not necessarily in order of importance or probability of occurrence) that could affect our financial condition, results of operations or cash flows. There may be additional risks and uncertainties that adversely affect our financial condition, results of operations or cash flows in the future that are not presently known, are not currently believed to be material, or are not identified below because they are common to all businesses. Past financial performance may not be a reliable indicator of future performance and historical trends should not be used to anticipate results or trends in future periods. For more information, see “Forward-Looking Statements.”
Risk Factors Summary
The following is a summary of the principal risks that could adversely affect our business, operations and financial results:
Risks Related to Our Business
•deterioration in economic conditions in any of the industries in which our customers operate may decrease demand for our products, impair our ability to collect customer receivables and impair our ability to access capital;
•volatility and wide fluctuation in coal prices based upon a number of factors beyond our control including future plans to eliminate coal-fired electric power generation facilities, oversupply relative to the demand available for our products, weather and the price and availability of alternative fuels and technologies;
•an extended decline in the prices we receive for our coal affecting our operating results and cash flows;
•our customers extending existing contracts or not entering into new long-term contracts for coal on favorable terms;
•our reliance on major customers;
•decreases in demand and changes in coal consumption patterns of industrial end users, metallurgical coal users and electric power generators;
•decreases in steel production from blast furnaces or advancement of alternative steel production technologies;
•the availability and reliability of transportation facilities and other systems, disruption of rail, barge, processing and transportation facilities and other systems that deliver our coal to market and fluctuations in transportation costs;
•the risks and uncertainties arising from a significant portion of our production being sold in international markets and complying with foreign laws and regulations, including anti-corruption laws;
•the impact of potential, as well as any adopted, regulations to address pollution and climate change, including any requirements relating to greenhouse gas emissions, on our operating costs as well as on the market for coal;
•the risks inherent in coal operations, including being subject to unexpected disruptions caused by adverse geological conditions, equipment failure, delays in moving out longwall equipment, railroad derailments, security breaches or terroristic acts and other hazards, delays in the completion of significant construction or repair of equipment, fires, explosions, seismic activities, accidents and weather conditions;
•the potential for liabilities arising from environmental contamination or alleged environmental contamination in connection with our past or current coal operations;
•uncertainties in estimating our economically recoverable coal reserves;
•failure to obtain or renew surety bonds or insurance coverage on acceptable terms;
•exposure to employee-related long-term liabilities;
•the risk of our debt agreements, our debt, access to capital markets and changes in interest rates affecting our operating results and cash flows;
•retaliatory tariffs by our trading partners on the price of coal we receive; and
•tariffs on the cost of supplies we procure from overseas vendors or that include foreign components.
Risks Related to Our Common Stock and the Securities Market
•uncertainty with respect to the Company’s common stock, potential stock price volatility and future dilution;
•the consequences of a lack of, or negative, commentary about us published by securities analysts and media;
•uncertainty regarding the timing of any dividends we may declare;
•uncertainty as to whether we will repurchase shares of our common stock;
•restrictions on the ability to acquire us in our certificate of incorporation, bylaws and Delaware law and the resulting effects on the trading price of our common stock; and
•inability of stockholders to bring legal action against us in any forum other than the state courts of Delaware.
Risks Related to Our Merger with Arch
•uncertainties associated with the Merger may cause a loss of management personnel and other key employees;
•disruption of the Company’s business relationships due to uncertainty associated with the Merger;
•incurrence of significant costs in connection with the Merger and integration of Arch with the Company;
•failure to integrate the businesses and operations of the Company and Arch successfully in the expected time frame; and
•failure to realize all of the anticipated benefits of the Merger.
Risks Related to Our Business
Deterioration in the global economic conditions in any of the industries in which our customers operate, or a worldwide financial downturn, or negative credit market conditions may have a materially adverse effect on our liquidity, results of operations, cash flows, business and financial condition that we cannot predict.
Weakness in the economic conditions of any of the industries we serve or that are served by our customers could adversely affect our business, financial condition, results of operations, cash flows and liquidity in a number of ways. For example:
•demand for electricity in the U.S. is impacted by industrial production, which, if weakened, would negatively impact the revenues, margins and profitability of our coal business;
•demand for metallurgical coal depends on coke and steel demand in the U.S. and globally, which, if weakened, would negatively impact the revenues, margins and profitability of our metallurgical coal business or our thermal coal as higher priced high-volatile metallurgical coal;
•demand for coal used in industrial applications depends on demand for products such as cement and brick used in construction and infrastructure projects, which, if weakened, would negatively impact the revenues, margins and profitability of our coal business;
•the tightening of credit or lack of credit availability to our customers could adversely affect our ability to collect our trade receivables;
•our ability to access the capital markets may be restricted at a time when we would like, or need, to raise capital for our business including for exploration and/or development of our coal reserves, or for strategic acquisitions of assets; and
•a decline in our creditworthiness, which may require us to post letters of credit, cash collateral or surety bonds to secure certain obligations, all of which would have an adverse effect on our liquidity.
Prices for coal are volatile and can fluctuate widely based upon a number of factors beyond our control including oversupply relative to the demand available for our coal, weather, the price and availability of alternative fuels and technologies and plans by electric power generators to shut down or move away from coal-fired generation. A substantial or extended decline in the prices we receive for our coal will adversely affect our business, results of operations, financial condition and cash flows.
Our financial results are significantly affected by the prices we receive for our coal and depend, in part, on the margins that we receive on sales of our coal. Our margins reflect the price we receive for our coal over our cost of producing and transporting our coal. Prices and quantities under our multi-year sales contracts are generally based on expectations of future coal prices at the time the contract is entered into, renewed, extended or re-opened. The expectation of future prices for coal depends upon many factors. In addition, demand can fluctuate widely due to a number of matters beyond our control, including:
•the market price for coal;
•changes in the consumption pattern of industrial consumers, electric power generators and residential end-users of electricity;
•weather conditions in our markets which affect the demand for thermal coal;
•competition from other coal suppliers;
•the price and availability of alternative fuels and sources for electric power generation, especially natural gas and renewable energy sources;
•with respect to thermal coal, the price and availability of natural gas and the price and supply of imported liquefied natural gas and competing sources of energy used in certain industrial applications, such as petroleum coke and metallurgical coal;
•technological advances affecting energy consumption and those related to hydrogen-based steel production;
•with respect to metallurgical coal, the overall demand for steel, which may be affected by competition for production of steel from non-coal sources, including electric arc furnaces or other processes that may use alternatives to coking as a reduction agent, which may limit demand for coking coal;
•the costs, availability and capacity of transportation infrastructure;
•overall domestic and global economic conditions, including the supply of and demand for domestic and foreign coal;
•international developments impacting supply of thermal and metallurgical coal, including supply side reforms promulgated in China, and continued expected growth in demand for seaborne metallurgical coal in India;
•the imposition of tariffs, quotas, trade barriers and other trade protection measures; and
•the impact of domestic and foreign governmental laws and regulations, including environmental and climate change regulations and regulations affecting the coal mining industry, blast furnaces, and coal-fired power plants, and delays in the receipt of, failure to receive, failure to maintain or revocation of necessary governmental permits.
Any significant downtime of our major pieces of equipment at our strategic operations, or any inability to obtain equipment, parts and raw materials in a timely manner, in sufficient quantities or at reasonable costs, could impair our ability to satisfy our customer obligations and materially and adversely affect our results of operations.
We depend on several major pieces of mining equipment to produce, transport and prepare our coal for our customers, including, but not limited to, longwall mining systems, continuous mining units, our preparation plants and related facilities, conveyors and transloading facilities. If any of these pieces of equipment or facilities suffered major damage or were destroyed by fire, abnormal wear, flooding, incorrect operation or otherwise, we may be unable to replace or repair them in a timely manner or at a reasonable cost, which would impact our ability to produce and transport coal and materially and adversely affect our business, results of operations, financial condition and cash flows. We procure this equipment from a concentrated group of suppliers, and obtaining this equipment often involves long lead times. Occasionally, demand for such equipment by mining companies can be high, and some types of equipment may be in short supply. Delays in receiving or shortages of this equipment or the cancellation of our supply contracts under which we obtain equipment could limit our ability to obtain these supplies or equipment. Disruptions in supply chains, increased demand and other factors have recently led to increases in these lead times and delays, which could reduce our production and therefore adversely affect our results of operations, financial condition and cash flows.
Additionally, coal production, transportation and preparation consumes large quantities of commodities including steel, copper, explosives, rubber products and liquid fuels and requires the use of capital equipment. We also use significant amounts of diesel fuel, explosives and tires for trucks and other heavy machinery, particularly at our Black Thunder mining complex. Some commodities, such as steel, are needed to comply with roof control plans required by regulation. The prices we pay for commodities and capital equipment are strongly impacted by the global market. A rapid or significant increase in the costs of commodities or capital equipment we use in our operations, whether as a result of increased demand, shortages caused by supply chain disruptions or general inflationary pressures, could impact our mining operating costs because we may have a limited ability to negotiate lower prices, and, in some cases, may not have a ready substitute. In addition, if any of our suppliers experiences an adverse event, or decides to no longer do business with us, we may be unable to obtain sufficient equipment and raw materials in a timely manner or at a reasonable price to allow us to meet our production goals and our revenues may be adversely impacted. We use considerable quantities of steel in the mining process. If the price of steel or other materials increases substantially, the risk of which is currently elevated due to economy-wide high inflation, or if the value of the U.S. dollar declines relative to foreign currencies with respect to certain imported supplies or other products, our operating expenses could increase. Any of the foregoing events could materially and adversely impact our business, financial condition, results of operations and cash flows.
If our coal customers do not extend existing contracts or do not enter into new multi-year coal sales contracts on favorable terms, profitability of our operations could be adversely affected.
During the year ended December 31, 2025, approximately 69% of the coal the Company produced was sold under multi-year sales contracts. If a substantial portion of our multi-year sales contracts are modified or terminated, if force majeure clauses are exercised, or if we are unable to replace or extend the contracts or new contracts are priced at lower levels, our profitability would be adversely affected. In addition, if customers refuse to accept shipments of our coal for which they have existing contractual obligations, our revenues will decrease and we may have to reduce production at our mines until such customers honor their contractual obligations and begin accepting shipments of our coal again.
The profitability of our multi-year sales contracts to supply coal depends on a variety of factors, which vary from contract to contract and fluctuate during the contract term, including our production costs and other factors. Price changes, if any, provided in long-term supply contracts may not reflect our cost increases, and therefore, increases in our costs may reduce our profit margins. In addition, during periods of declining market prices, provisions in our long-term coal contracts for adjustment or renegotiation of prices and other provisions may increase our exposure to short-term coal price and electric power price volatility.
As a result, we may not be able to obtain long-term agreements at favorable prices compared to either market conditions, as they may change from time to time, or our cost structure, which may reduce our profitability.
We have customer concentration, so the loss of, or significant reduction in, purchases by our largest coal customers could adversely affect our business, financial condition, results of operations and cash flows.
A significant portion of our coal is sold in the export market, and we remain somewhat exposed to risks associated with a concentrated customer base both domestically and globally. There are inherent risks whenever a significant percentage of total revenues is concentrated with a limited number of customers. Revenues from our largest customers may fluctuate from time to time based on numerous factors, including market conditions, which may be outside of our control. If any of our largest customers experience declining revenues due to market, economic or competitive conditions, we could be pressured to reduce the prices that we charge for our coal, which could have an adverse effect on our margins, profitability, cash flows and financial position. If any customers were to significantly reduce their purchases of coal from us, including by failing to buy and pay for coal they committed to purchase in sales contracts, our business, financial condition, results of operations and cash flows could be adversely affected.
Our ability to collect payments from our customers could be impaired if their creditworthiness deteriorates.
Our ability to collect payments from our customers for coal sold and delivered could be impaired if their creditworthiness declines or if they fail to honor their contracts. If the creditworthiness of a significant customer declines or the customer significantly delays payments to us, our business, cash flows and financial condition could be materially and adversely affected. If we determine that a customer is not creditworthy, we may be able to withhold delivery under the customer’s coal sales contract. However, if this occurs, we may decide to sell the customer’s coal on the spot market, which may be at prices lower than the contracted price, or we may be unable to sell the coal at all. Furthermore, if customers refuse to accept shipments of our coal for which they have an existing contractual obligation or if we terminate a relationship with a significant customer due to credit risks, our revenue could decrease materially and we may have to reduce production at our mines until our customers’ contractual obligations are honored or we are able to replace a significant customer. In addition, our borrowing capacity under our receivables financing arrangement could be reduced if we experience prolonged and significant delays in payments by one or more material customers.
Also, our customer base may change if domestic utilities sell their power plants to their non-regulated affiliates or third parties that may be less creditworthy, thereby increasing the risk we bear for customer payment default. Some power plant owners may have credit ratings that are below investment grade or may become below investment grade after we enter into contracts with them. Furthermore, our metallurgical customers operate in a highly competitive and cyclical industry where their creditworthiness could deteriorate rapidly.
Our inability to acquire or develop additional coal reserves that are economically recoverable may have a material adverse effect on our future profitability.
Our profitability depends substantially on our ability to mine, in a cost-effective manner, coal reserves that possess the quality characteristics that our customers desire. Because our reserves decline as we mine our coal, our future profitability depends upon our ability to acquire additional coal reserves and surface land needed to ensure the reserves are economically recoverable to replace the reserves we produce. If we fail to acquire, gain access to or develop sufficient additional reserves over the long term to replace the reserves depleted by our production, our existing reserves will eventually be depleted, which may have a material adverse effect on our business, financial condition, results of operations and cash flows.
We face risks related to our pursuit of new lines of business, such as those involving sustainable innovations and rare earth minerals.
We have pursued, and will continue to pursue, a variety of new lines of business, including alternative and innovative uses of coal led by our subsidiary, CONSOL Innovations LLC, including, but not limited to, products with aerospace, defense, battery and building product applications, and potential new lines of business involving rare earth elements (“REEs”). Additional information regarding these new lines of business can be found in “Our Strategy” in Item 1 of this Report. Pursuing new lines of business subjects us to a number of material risks, including, but not limited to:
•the possibility that we may invest significant time and resources in our attempts to pursue new lines of business that may never be profitable;
•exposure to new laws and regulations with which we are not familiar and which may lead to increased litigation and regulatory risk;
•unanticipated liabilities or contingencies;
•difficulty in hiring personnel or acquiring the know-how needed to operate any new line of business; and
•failure of our management team to successfully manage new and shifting risk considerations, compliance obligations, competitors or market preferences.
In particular, as we continue to evaluate a potential new line of business involving REEs, our strategy may include expanding into the exploration, development, extraction, processing, separation, or commercialization of REEs and related downstream activities. These initiatives are subject to significant uncertainty and may require substantial capital investment, specialized technical expertise, proprietary or emerging processing technologies and extensive regulatory approvals. Volatility in commodity pricing and other market dynamics, competition from established participants and fluctuations in demand for REEs may adversely affect the economic viability of such new lines of business.
In addition, REE deposits often present complex mineralogy, low concentrations and challenging metallurgy, requiring specialized beneficiation, separation and refining processes. Even where REEs are identified, the economic feasibility of extraction and processing may be constrained by high operating and capital costs. Furthermore, recoveries of individual REEs may vary significantly, and unfavorable element mixes may reduce the overall economic value of a deposit. If the extraction, processing or sale of REEs proves to be economically unviable, we may be unable to recover any investments in REE-related initiatives, which may impact future profitability.
Decreases in coal consumption patterns for steel production, electric power generation and industrial applications could adversely affect our business.
Our business is closely linked to demand for electricity, and any changes in coal consumption by U.S. or international electric power generators would likely impact our business over the long term. According to the EIA, in 2025, the domestic electric power sector accounted for approximately 92% of total U.S. coal consumption. During the year ended December 31, 2025, the Company sold approximately 68% of its sales tons to U.S. electric power generators, and we have annual or multi-year contracts in place with many of these electric power generators for a significant portion of our future production. The amount of coal consumed by the electric power generation industry is affected by, among other things:
•general economic conditions, particularly those affecting industrial electric power demand, such as a downturn in the U.S. or international economy and financial markets;
•overall demand for electricity;
•indirect competition from alternative fuel sources for electric power generation, such as natural gas, fuel oil, nuclear, hydroelectric, wind and solar power, and the location, availability, quality and price of those alternative fuel sources;
•environmental and other governmental regulations, including those impacting coal-fired power plants;
•energy conservation efforts and related governmental policies; and
•other corporate environmental, social or governance initiatives to reduce dependency on and/or consumption of fossil fuels.
Changes in the coal industry that affect our customers, such as those caused by decreased electricity demand and increased competition, could also adversely affect our business. Indirect competition from natural gas-fired plants that are relatively more efficient, less expensive to construct and less difficult to permit than coal-fired power plants has displaced a significant amount of coal-fired electric power generation and may continue to do so in the near term, particularly older, less efficient coal-fired electric power generators. Federal and state mandates for increased use of electricity derived from renewable energy sources could also affect demand for our coal. Such mandates, combined with other incentives to use renewable energy sources, such as tax credits, could make alternative fuel sources more competitive with coal. A decrease in coal consumption by the electric power generation industry could adversely affect the price of coal, which could have a material adverse effect on our business, financial condition, results of operations and cash flows.
Other factors, such as efficiency improvements associated with new appliance standards in the buildings sectors and overall improvement in the efficiency of technologies powered by electricity, have slowed electricity demand growth and may contribute to slower growth in the future. Further decreases in the demand for electricity, such as decreases that could be caused by a worsening of current economic conditions, a prolonged economic recession, government-imposed lockdowns designed to slow or contain the spread of contagious diseases or other similar events, could have a material adverse effect on the demand for coal and on our business over the long term.
Coal sold into the industrial markets is used in the cement and brick manufacturing process. Any deterioration in the U.S. or foreign cement and brick industries, including a decrease in demand for such products or concerns regarding the continued financial viability of these industries, could reduce the demand for our coal sold into those markets and could adversely impact the creditworthiness of our U.S. or foreign industrial customers and our ability to receive timely payments from these customers. In addition, we compete heavily against the price of petroleum coke into these industries and as the price of petroleum coke changes, that could positively or negatively affect our financial condition, results of operations and cash flows.
The metallurgical coal that we produce is sold to domestic and export customers involved in the production of steel. Any deterioration in conditions in the U.S. or foreign steel industries, including a decrease in demand for steel or concerns regarding the continued financial viability of the industry, could reduce the demand for our metallurgical coal and could adversely impact the creditworthiness of our U.S. or foreign metallurgical coal customers and our ability to receive timely payments from these customers. In addition, the steel industry’s demand for coal is affected by a number of factors, including the variable nature of that industry’s business, technological developments in the steel-making process and the availability of substitutes for steel, such as aluminum, composites or plastics. When steel prices are lower, the prices that we charge steel industry customers for our metallurgical coal may decline, which could adversely affect our financial condition, results of operations and cash flows.
Also, premium High-Vol metallurgical coal generally commands a price premium over other forms of coal because of its value in use in blast furnaces for steel production. Premium High-Vol metallurgical coal has specific physical and chemical properties that can impact the efficiency of blast furnace operation. Alternative technologies are continually being investigated and developed with a view to reducing production costs or for other reasons, such as minimizing environmental or social impact. If competitive technologies emerge or are increasingly utilized that use other materials in place of our product or that diminish the required amount of our product, such as electric arc furnaces or pulverized coal injection processes, demand and price for our metallurgical coal might fall. Many of these alternative technologies are designed to use lower quality coals or other sources of carbon instead of higher cost High-Vol metallurgical coal. Over the longer term, the emergence of competitive technologies not reliant on High-Vol metallurgical coal could reduce demand and price premiums for High-Vol metallurgical coal.
The availability and reliability of modes of transportation and transportation facilities as well as fluctuations in transportation costs could affect the demand for our coal, and any significant damage to the Core Marine Terminal or the Dominion Terminal that impacts their use could impair our ability to supply coal to our customers.
Transportation logistics play a critical role in allowing us to supply coal to our customers. Any significant delays, interruptions or other limitations on the ability to transport our coal could negatively affect our operations. Our coal is transported from our mines primarily by rail. To reach markets and end customers, our coal may also be transported by barges or by ocean vessels loaded at terminals, including our wholly-owned Core Marine Terminal as well as the Dominion Terminal, operated by DTA, in which we own a 35% interest following the Merger. Disruption of transportation services because of weather-related problems, strikes, lock-outs, terrorism, governmental regulation, third-party action or other events could temporarily impair our ability to supply coal to customers and adversely affect our profitability. For example, after a container ship struck a support column of the Francis Scott Key Bridge in Baltimore, Maryland causing it to collapse on March 26, 2024, vessel access in and out of the Core Marine Terminal, which is located in the Port of Baltimore, was suspended. Until a channel was opened to normal operations on June 10, 2024, our inability to ship coal to our customers from the Core Marine Terminal temporarily negatively impacted our business, financial condition and results of operations. In addition, transportation costs represent a significant portion of the delivered cost of coal and, as a result, the cost of delivery is a critical factor in a customer’s purchasing decision. Increases in transportation costs, including increases resulting from emission control requirements and fluctuation in the price of diesel fuel and demurrage, could make our coal less competitive. Any disruption of the transportation services we use or increase in transportation costs could have a materially adverse effect on our business, financial condition, results of operations and cash flows. Disruption in shipment levels over longer periods of time at our East Coast terminals could cause our customers to look to other sources for their coal needs, negatively affecting our revenues and results of operations.
Competition within the coal industry may adversely affect our ability to sell coal. Increased competition or a loss of our competitive position could adversely affect our sales of, or prices for, our coal, which could impair our profitability. In addition, foreign currency fluctuations could adversely affect the competitiveness of our coal abroad.
We compete with other producers primarily on the basis of price, coal quality, transportation costs and reliability of delivery. We compete with coal producers in various regions of the U.S. and with some foreign coal producers for domestic sales primarily to electric power generators. We also compete with both domestic and foreign coal producers for sales in international markets. Demand for our coal by our principal customers is affected by the delivered price of competing coals, other fuel supplies such as natural gas and petcoke, and alternative generating sources, including nuclear, natural gas, oil and renewable energy sources, such as hydroelectric, wind and solar power.
We sell coal to foreign industrial end-users, electric power generators and to the more specialized metallurgical coal market, which are significantly affected by international demand and competition. The coal industry has experienced consolidation in recent years, including consolidation among some of our major competitors. Current or further consolidation in the coal industry or current or future bankruptcy proceedings of coal competitors may adversely affect us.
In addition, increases in coal prices could encourage existing producers to expand capacity or could encourage new producers to enter the market. If overcapacity results, the prices of and demand for our coal could significantly decline, which could have a material adverse effect on our business, financial condition, results of operations and cash flows.
In addition, we face competition from foreign producers that sell their coal in the export market. Potential changes to international trade agreements, trade concessions or other political and economic arrangements may benefit coal producers operating in countries other than the U.S. We may be adversely impacted on the basis of price or other factors with companies that in the future may benefit from favorable foreign trade policies or other arrangements. In addition, coal is sold internationally in U.S. dollars and, as a result, general economic conditions in foreign markets and changes in foreign currency exchange rates may provide our foreign competitors with a competitive advantage. If our competitors’ currencies decline against the U.S. dollar or against our foreign customers’ local currencies, those competitors may be able to offer lower prices for coal to our customers. Furthermore, if the currencies of our overseas customers were to significantly decline in value in comparison to the U.S. dollar, those customers may seek decreased prices for the coal we sell to them. Consequently, currency fluctuations could adversely affect the competitiveness of our coal in international markets, which could have a material adverse effect on our business, financial condition, results of operations and cash flows.
Inflation could result in higher costs and decreased profitability.
The U.S., European Union and other large economies have recently experienced inflation at a rate significantly higher than recent years. While inflation has been easing, there can be no guarantee that this trend will continue. Current and future inflationary effects may be driven by, among other things, governmental stimulus and monetary policies, supply chain disruptions and geopolitical instability. This recent inflation has resulted in rising prices, including increases in freight rates, prices for energy and other costs, and has adversely impacted us and may further impact us negatively in the future. Sustained inflation could result in higher costs for transportation, energy, materials, supplies and labor. Our ability to recover inflation-driven cost increases may be constrained by the terms of our contracts, the competitive nature of the contract bidding process and the economic and industry conditions prevailing in the countries to which we sell our export coal. Significant inflation may have an adverse impact on our business, financial position, results of operations and cash flows. Inflation has also resulted in higher interest rates in the U.S., which could increase our cost of debt borrowing in the future.
A significant portion of our production is sold in international markets, and our international sales may continue to grow, which exposes us to additional risks and uncertainties.
For the years ended December 31, 2025, 2024 and 2023, approximately 56%, 66% and 71%, respectively, of our annual coal revenue was derived from customers who exported our coal outside of the U.S., and we expect that international sales will continue to account for a large portion of our revenue as we seek international expansion opportunities. The international markets are subject to a number of material risks, including, but not limited to:
•changes in a specific country’s or region’s political, economic or other conditions;
•changes in U.S. government policy with respect to certain foreign countries may inhibit export of our products and limit potential customers’ access to U.S. dollars in a country or region in which those potential customers are located;
•we may experience difficulties in enforcing our legal contracts or the collecting of foreign accounts receivable in a timely manner, and we may be forced to write off these receivables;
•longer sales cycles and time to collection may produce large swings in working capital from period to period;
•tariffs and other international trade barriers may make our products less cost competitive;
•government currency controls;
•potentially adverse tax consequences to our customers may damage our cost competitiveness;
•customs, import/export and other regulations of the countries in which our international customers are located may adversely affect our business;
•currency fluctuations may make our coal less cost competitive, affecting overseas demand for our coal, or may indirectly expose us to currency fluctuation risk;
•geopolitical uncertainty or turmoil, including terrorism, war and natural disasters; and
•unexpected changes in diplomatic and trade relationships.
Our sales are also affected by general economic conditions in our international markets. A prolonged economic downturn in international markets could have a material adverse effect on our business. Negative developments in one or more countries or regions in which our coal is exported could result in a reduction in demand for our coal, the cancellation or delay of orders already placed, difficulties in delivering our products, difficulty in collecting receivables or a higher cost of doing business, any of which could negatively impact our business, financial condition, cash flows and results of operations. In addition, we may be exposed to legal risks under the laws of the countries outside the U.S. in which we do business, as well as the laws of the U.S. governing our business activities in those other countries, such as the U.S. Foreign Corrupt Practices Act.
Compliance with import and export requirements, the Foreign Corrupt Practices Act and other applicable anti-corruption laws may increase the risks of doing business internationally.
Because we sell a significant portion of our production in international markets, our operations and activities inside and outside the U.S., as well as the shipment of our products across international borders, require us to comply with a number of federal, state, local and foreign laws and regulations, which are complex and increase our risks of doing business internationally. These laws and regulations include import and export requirements, tariffs and other international trade barriers, government currency controls, economic sanction laws, customs laws, tax laws and anti-corruption laws, such as the U.S. Foreign Corrupt Practices Act and the U.K. Bribery Act. In addition, we have sales offices in Singapore and the United Kingdom which sell our coal to new international customers, which may present uncertainties and new risks, including potential liability under foreign anti-corruption and other laws. We cannot predict how these laws or their interpretation, administration and enforcement will change over time. There can be no assurance that our employees, contractors, agents, distributors, customers, payment parties or third parties working on our behalf will not take actions in violation of these laws. Any such violation could result in substantial fines, sanctions, civil and/or criminal penalties and curtailment of operations in certain jurisdictions, and might adversely affect our business, financial condition, results of operations and cash flows. In addition, actual or alleged violations could damage our reputation and ability to do business. Furthermore, detecting, investigating and resolving actual or alleged violations is expensive and can consume significant time and attention of our senior management.
The characteristics of coal may make it costly for electric power generators and other coal users to comply with various environmental standards regarding the emissions of impurities released when coal is burned, which could cause our customers to replace coal with alternative fuels.
Coal contains impurities, including sulfur, mercury, chlorine and other elements or compounds, many of which are released into the air along with fine particulate matter, nitrogen oxides and carbon dioxide when it is burned. Complying with regulations on these emissions can be costly for our customers, including those in the industrial, metallurgical and electric power generation markets. In order to comply with emissions standards promulgated under the federal Clean Air Act or similar state regulations seeking to limit the emissions that are generated as a result of coal combustion, coal users could be required to install costly emissions control devices, use or purchase emissions credits or allowances, curtail operations or switch to other fuels, each of which has limitations. Because thermal coal currently accounts for a significant portion of our sales, our results could be materially affected by the extent to which our customers incur costs associated with controlling or limiting emissions from the use of coal or switch to alternative fuels. Rulemakings such as the Cross State Air Pollution Rule (“CSAPR”), the National Ambient Air Quality Standards (“NAAQS”), or the New Source Performance Standards (“NSPS”) and other Clean Air Act regulations may decrease the demand for our coal in industrial, metallurgical or electric power generation markets in the future. For more information, please see “Laws and Regulations” under Item 1 above.
Regulation to address climate change (or emissions of GHGs including carbon dioxide and methane) and uncertainty regarding such regulation may affect us directly or indirectly by increasing our operating costs, reducing the value of our coal assets and adversely impacting the market for coal.
The issue of global climate change continues to attract considerable public and scientific attention with widespread concern about the impacts of human activity (especially the emissions of GHGs such as carbon dioxide and methane). Combustion of fossil fuels, such as the coal we produce, results in the emission of carbon dioxide into the atmosphere by coal end-users, such as coal-fired power plants. Additionally, methane released during our coal mining operations is ventilated to the atmosphere in order to promote a safe working environment for our miners underground.
Numerous proposals have been made and are likely to continue to be made at the international, national, regional and state levels of government that are intended to limit emissions of GHGs. Foreign governments, including the European Union and member countries, have adopted regulations governing GHG emissions. Independent of regulation, the UNFCCC seeks to establish GHG emissions reduction requirements for developed countries. The UNFCCC’s governing body, the Conference of the Parties (“COP”), meets annually to implement and refine a framework for the international Paris Agreement, a voluntary commitment to limit or reduce GHG emissions in order to limit global warming below 2 degrees Celsius from temperatures in the pre-industrial era. Nevertheless, the international community has been called upon to achieve a 43% reduction in GHG emissions by 2030 (compared to 2019 levels) through actions that drive the transition away from fossil fuels in energy systems. The U.S. has withdrawn from the Paris Agreement and, on January 7, 2026, President Trump issued an executive order calling for the withdrawal of the U.S. from the UNFCCC. However, the ultimate effect of these withdrawals is uncertain, as it may incite various state and other policymakers to introduce stricter requirements.
In addition, several individual U.S. states have already adopted measures requiring GHG emissions reductions or a shift to renewable energy sources within their boundaries. Other states have elected to participate in regional cap-and-trade programs like the Regional Greenhouse Gas Initiative (“RGGI”) in the northeastern U.S. Any significant legislative changes at the international, national, state or local levels designed to reduce GHG emissions could significantly affect our ability to produce and sell our coal and develop our reserves, could increase the cost of the production and sale of coal and could materially reduce the value of our coal and coal reserves.
These potential legislative changes, as well as concerted conservation and efficiency efforts that result in reduced electricity consumption, and consumer and corporate preferences for non-coal fuel sources, including natural gas and/or alternative energy sources, could cause coal prices and sales of our coal to materially decline and could cause our costs to increase. Further, climate change itself may cause more extreme weather conditions such as more intense hurricanes, thunderstorms, tornadoes and snow or ice storms, as well as rising sea levels and increased volatility in seasonal temperatures. Extreme weather conditions can interfere with our services and increase our costs, and damage resulting from extreme weather may not be fully insured. However, at this time, we are unable to determine the extent to which climate change may lead to increased storm or weather hazards affecting our operations.
Furthermore, adoption of comprehensive legislation or regulation focusing on climate change or GHG emissions reductions for the U.S. or other countries where we sell coal, or the inability of utilities to obtain financing in connection with coal-fired power plants, may make it more costly to operate coal-fired power plants and make coal less attractive for electric utility power plants in the future. Depending on the nature of the regulation or legislation, natural gas and/or alternative energy sources could gain added economic benefits versus coal-fired power generation, especially if such regulation or legislation makes our coal more expensive as a result of increased compliance, operating and maintenance costs. Apart from actual regulation, uncertainty over the extent of regulation of GHG emissions may inhibit utilities from investing in the building of new coal-fired power plants to replace older plants or investing in the upgrading of existing coal-fired power plants. Any reduction in the amount of coal consumed by electric power generators as a result of actual or potential regulation of GHG emissions could decrease demand for our fossil fuels, thereby reducing our revenues and materially and adversely affecting our business and results of operations. Our customers may also have to invest in carbon dioxide capture and storage technologies in order to burn coal and comply with future GHG emissions standards. Although we cannot predict the ultimate impact of any legislation or regulation, it is likely that any future laws, regulations or other policies aimed at reducing GHG emissions will negatively impact demand for our coal and could also negatively affect the value of our reserves and other assets.
Additionally, if emissions of methane from coal mines are regulated in the future, we would likely be required to install additional pollution control devices, pay fees or taxes for our emissions or incur expenses associated with the purchase of emissions credits in order to continue operation. Alternatively, we may need to curtail coal production. The magnitude of impact on our operations, capital expenditures, financial condition or cash flows would be dependent on the structure of any proposed regulation and the degree of emissions reduction prescribed.
We are subject to litigation seeking to hold energy companies accountable for the effects of climate change and may be subject to additional such litigation in the future.
Increasing attention to climate change risk has also resulted in governmental investigations and private litigation by local and state governmental agencies as well as private plaintiffs in an effort to hold energy companies accountable for the effects of climate change. Other public nuisance lawsuits have been brought in the past against power, coal, oil and gas companies alleging that their operations are contributing to climate change. The plaintiffs in these suits sought various remedies, including punitive and compensatory damages and injunctive relief. While the U.S. Supreme Court held that any federal common law had been displaced by the CAA and thus dismissed the public nuisance claims against the defendants in those cases, tort-type liabilities remain a possibility and a source of concern. For instance, we have been named as a defendant in multiple lawsuits brought by the City of Baltimore, the State of Delaware, the City of Annapolis, and Anne Arundel County, Maryland seeking to hold us and other energy companies liable for the effects of climate change caused by the release of GHGs. The outcome of this litigation is uncertain, due to the range of legal theories and the various court systems in which they are taking place, including for appeals. Even if we are ultimately successful, we could incur substantial legal costs associated with defending these and similar lawsuits in the future. Government entities in other states, as well as private plaintiffs, have brought similar claims seeking to hold a wide variety of companies that produce fossil fuels liable for climate-related impacts or for insufficient disclosure of associated risks, often seeking unspecified damages and abatement under various tort theories. We have not been made a party to these other suits, but it is possible that we could be included in similar future lawsuits initiated by state and local governments as well as private claimants.
Existing and future government laws, regulations and other legal requirements relating to protection of the environment and other laws that govern our business may increase our costs of doing business and may restrict our coal operations.
We are subject to laws, regulations and other legal requirements enacted or adopted by federal, state and local authorities, as well as foreign authorities, relating to the protection of the environment. These include legal requirements that govern discharges of substances into the air and water, the management and disposal of hazardous substances and wastes, the cleanup of contaminated sites, groundwater quality and availability, threatened and endangered plant and wildlife protection, reclamation and restoration of mining properties after mining is completed, the installation of various safety equipment in our mines, remediation of impacts of surface subsidence from underground mining, and work practices related to employee health and safety. Complying with these requirements, including the terms of our permits, has had, and will continue to have, a significant effect on our costs of operations and competitive position.
In addition, there is the possibility that we could incur substantial costs as a result of violations under environmental laws. Any additional laws, regulations and other legal requirements enacted or adopted by federal, state and local authorities, as well as foreign authorities, or new interpretations of existing legal requirements by regulatory bodies relating to the protection of the environment could further affect our costs of operations and competitive position.
Our business involves many hazards and operating risks, some of which may not be fully covered by insurance. The occurrence of a significant accident or other event that is not fully insured could curtail our operations and have a material adverse effect on our results of operations, financial condition and cash flows.
Certain of our coal mining operations are underground mines. Underground mining and related processing activities present inherent risks of injury or death to persons, damage to property and equipment and other potential legal or other liabilities. We also have surface mining operations that utilize explosives to remove the earth and rock covering the coal, which creates additional hazards. Our mines are subject to a number of operating risks that could disrupt operations, decrease production and increase the cost of mining at particular mines for varying lengths of time, thereby adversely affecting our operating results. In addition, if an operating risk occurs in our mining operations, we may not be able to produce sufficient amounts of coal to deliver under our multi-year coal contracts. Our inability to satisfy contractual obligations could result in our customers initiating claims against us or canceling their contracts. The operating risks that may have a significant impact on our coal operations include:
•variations in thickness of the layer, or seam, of coal;
•adverse geological conditions, including amounts of rock and other natural materials intruding into the coal seam that could affect the stability of the roof and the side walls of the mine;
•environmental hazards;
•equipment failures or unexpected maintenance problems;
•fires or explosions, including as a result of methane, coal, coal dust or other explosive materials and/or other accidents;
•inclement or hazardous weather conditions and natural disasters or other force majeure events;
•seismic activities, ground failures, rock bursts or structural cave-ins or slides;
•delays in moving our longwall equipment;
•railroad derailments and mandated delays;
•security breaches or terroristic acts; and
•other hazards that could also result in personal injury and loss of life, pollution and suspension of operations.
The occurrence of any of these risks at our coal mining operations could adversely affect our ability to conduct our operations or result in substantial loss to us, either of which could materially and adversely affect our business, financial condition, results of operations and cash flows. For example, in January 2025, the Company sealed the Leer South mine’s active longwall panel in order to extinguish isolated combustion-related activity at the mine and did not resume longwall operations until December 2025. In addition, the occurrence of any of these events in our coal mining operations which prevents our delivery of coal to a customer and which is not excusable as a force majeure event under our coal sales agreement could result in economic penalties, suspension or cancellation of shipments or ultimately termination of the coal sales agreement, any of which could have a material adverse effect on our business, financial condition, results of operations and cash flows.
In addition, we may not be insured or fully insured against the losses or liabilities that could arise from a significant accident in our coal operations. We may elect not to obtain insurance for any or all of these risks if we believe that the cost of available insurance is excessive relative to the risks presented. In addition, pollution and environmental risks generally are not fully insurable. Moreover, a significant mine accident could potentially cause a mine shutdown. The occurrence of an event that is not fully covered by insurance could have a material adverse effect on our business, financial condition, results of operations and cash flows.
Failure to obtain or renew surety bonds on acceptable terms could affect our ability to secure reclamation and coal lease obligations and failure to obtain adequate insurance coverages could both have a material adverse effect on our business and results of operations.
Federal and state laws require us to obtain surety bonds or post letters of credit to secure performance or payment of certain long-term obligations, such as mine closure or reclamation costs, federal and state workers’ compensation costs, coal leases and other obligations. Over the past few years, the insurance and surety markets have been increasingly challenging, particularly for coal companies. We have experienced rising premiums, reduced coverage and/or fewer providers willing to underwrite policies and surety bonds. Terms have generally become more unfavorable, including increases in the amount of collateral required to secure surety bonds. However, more recently, we have seen insurance rates and collateral requirements stabilize and even decrease on certain lines of coverage, as new insurance carriers have entered the market, although there is no assurance that this stabilization or decrease will be sustained or continued. In addition, federal and state regulators are considering making financial assurance requirements more stringent and costly with respect to self-insured coal workers’ pneumoconiosis, mine closure and reclamation security amounts. Because we are required by federal and state law to have these bonds in place before mining can commence or continue, our failure to maintain surety bonds, letters of credit or other guarantees or security arrangements would materially and adversely affect our ability to mine or lease coal, and incurring additional rising costs to obtain and maintain such arrangements could have a material adverse effect on our business, financial condition, results of operations and cash flows. Additionally, coal and other mining companies are increasingly struggling to obtain adequate insurance coverage for their business and operations. Our failure to obtain adequate insurance coverages could have a material adverse effect on our business and results of operations. Further cost burdens on our ability to maintain adequate insurance and bond coverage may adversely impact our operations, financial position and liquidity.
Our mines are located in areas containing oil and natural gas shale plays, and we may have conflicts with competing holders of mineral rights and rights to use adjacent, overlying or underlying lands.
Substantially all of our coal reserves are in areas containing shale oil and natural gas plays, including the Marcellus Shale, which are currently the subject of substantial exploration for oil and natural gas, particularly by horizontal drilling. If we have received a permit for our mining activities, then while we may have to coordinate our mining with such oil and natural gas drillers and transporters, our mining activities will have priority over any oil and natural gas drillers and transporters with respect to the land covered by our permit. Oil and natural gas drillers and transporters may be subject to laws and regulations that are enforced by regulators that do not have jurisdiction over our activities. Any conflict between our rights and the enforcement actions by any regulator of oil or natural gas-specific rights that conflict with our rights to mine could result in additional costs and possible delays to mining.
For reserves outside of our permits, we engage in discussions with drilling and transport companies on potential areas on which they can drill that may have a minimal effect on our mine plan. If a well is in the path of our mining for coal on land that has not yet been permitted for our mining activities, we may not be able to mine through the well unless we purchase it. The cost of purchasing a producing horizontal well could be substantially greater than that of a vertical well. Horizontal wells with multiple laterals extending from the well pad may access larger oil and natural gas reserves than a vertical well, which would typically result in a higher cost to acquire. The cost associated with purchasing oil and natural gas wells that are in the path of our coal mining activities could likewise make mining through those wells uneconomical, thereby effectively causing a loss of significant portions of our coal reserves, which could materially and adversely affect our business, financial condition, results of operations and cash flows.
Our operations may also face potential conflicts with holders of other mineral interests such as coalbed methane, natural gas and oil reserves. Some of these minerals are located on, or are adjacent to, some of our coal reserves and active operations, potentially creating conflicting interests between us and the holders of those interests. From time to time, we acquire these minerals ourselves to prevent conflicting interests from arising. If, however, conflicting interests arise and we do not acquire the competing mineral rights, we may be required to negotiate our ability to mine with the holder of the competing mineral rights. If we are unable to reach an agreement with the holders of such rights, or to do so on a cost-effective basis, we may incur increased costs, and our ability to mine could be impaired, which could materially and adversely affect our business, results of operations, financial condition and cash flows.
In order to maintain, grow and diversify our business, we will be required to make substantial capital expenditures. If we are unable to obtain needed capital or financing on satisfactory terms, our financial leverage could increase.
In order to maintain, grow and diversify our business, we will need to make substantial capital expenditures to fund our share of capital expenditures associated with our mines, acquisitions or other business development initiatives. Maintaining and expanding mines and infrastructure is capital intensive. Specifically, the exploration, permitting and development of coal reserves, mining costs, the maintenance of machinery and equipment and compliance with applicable laws and regulations requires substantial capital expenditures. While a significant amount of the capital expenditures required to build out our mining infrastructure has been spent, we must continue to invest capital to maintain or to increase our production.
Decisions to increase our production levels could also affect our capital needs. Our production levels may decrease or may not be able to generate sufficient cash flow, or we may not have access to sufficient financing to continue our production, exploration, permitting and development activities at or above our present levels, and we may be required to defer all or a portion of our capital expenditures. If we do not make sufficient or effective capital expenditures, we will be unable to maintain and grow our business. To fund our capital expenditures, we will be required to use cash from our operations, incur debt or sell additional equity securities. Our ability to obtain bank financing or our ability to access the capital markets for future equity or debt offerings may be limited by our financial condition at the time of any such financing or offering and the covenants in our existing debt agreements, as well as by general economic conditions, contingencies and uncertainties that are beyond our control, such as financial institutions and investors abandoning the thermal coal sector. In addition, incurring additional debt may significantly increase our interest expense and financial leverage, and issuing additional equity securities may result in significant stockholder dilution.
We are subject to various risks associated with scrutiny of companies’ management of ESG matters.
Certain organizations that provide corporate governance and other corporate risk information to investors and stockholders have developed scores and ratings to evaluate companies and investment funds based upon ESG or “sustainability” metrics. Currently, there are no universal standards for such scores or ratings, but companies in the energy industry, and in particular those focused on coal, natural gas or petroleum extraction and refining, often perform less well under ESG assessments compared to companies in other industries. The importance of sustainability evaluations is becoming more broadly accepted by investors and stockholders, and poor performance or perceived performance on various ESG matters could result in our securities, both debt and equity, being excluded from the portfolios of certain investment funds and investors. Additionally, many investment funds and investors are beginning to avoid securities issued by any company in the coal, natural gas or petroleum extraction or refining business, regardless of their particular ESG or sustainability score. Relatedly, banks and investment banks based both domestically and internationally have announced that they have adopted climate change guidelines for lenders. The guidelines require the evaluation of carbon risks in the financing of electric power plants which may make it more difficult for utilities to obtain financing for coal-fired power plants. The impact of such efforts may adversely affect the demand for and price of securities issued by us and impact our access to the capital and financial markets. As such, our access to capital to fund our continuing operations and growth and diversification opportunities could become more restricted. Additionally, various policymakers have adopted or are considering adopting requirements for certain disclosures or other actions regarding climate or other ESG-related matters. These regulations are not uniform, and other policymakers have advocated for positions to restrict companies’ consideration of ESG factors. Such regulations increase the cost and complexity of compliance and associated risks.
While we may publish voluntary disclosures regarding ESG matters or take other actions from time to time in an effort to improve the ESG profile of our operations or products, we cannot guarantee that these efforts will have the desired effect. For example, our voluntary disclosures may include statements based on assumptions, estimates or third-party information we believe to be reasonable, but which may be uncertain, variable or erroneous. In addition, we may commit to certain ESG initiatives over time, such as investing capital in projects and technologies to reduce our greenhouse gas emissions profile; however, we may not ultimately be able to achieve our goals or reach our commitments, either on the timeframes or costs initially anticipated or at all, due to factors within or outside of our control. Various business units or components of the Company have previously established climate change-related goals and targets. As a result of the Merger and continued efforts to harmonize policies across the new, combined company, the Company has suspended its previous goals and targets and is in the process of reevaluating those policies for the Company as a whole. However, stakeholder expectations vary and, at times, can conflict. Any failure to successfully address such expectations, including regulatory developments, may result in reputational damage, loss of customers or other adverse stakeholder engagement and an increased risk of litigation or activism, which could materially and adversely affect our business, financial condition and results of operations.
Finally, various of our customers and other stakeholders are subject to similar risks and expectations, which may augment or result in additional risks to us. For example, a part of our business plan is to regularly and rigorously evaluate opportunities for acquisitions, joint ventures and other business arrangements in the coal industry and related industries that complement our core operations. We may face greater difficulties in finding partners for such acquisitions, joint ventures or other business arrangements if these potential partners are less willing or unwilling to enter into transactions with companies that have a low ESG or sustainability score or companies that engage in fossil fuel activities, which could have a material adverse effect on our ability to expand our business, and therefore, our financial condition, results of operations and cash flows could be negatively impacted.
The Russia-Ukraine war, and sanctions brought by the U.S. and other countries against Russia, have caused significant market disruptions that may lead to increased volatility in the price of certain commodities, including oil, natural gas,
coal and other sources of energy. In addition, global unrest, including conflicts and political unrest in the Middle East and Venezuela, has the potential to cause disruption to the global supply chain that could adversely affect our exports.
The extent and duration of the military conflict involving Russia and Ukraine, resulting sanctions and future market or supply disruptions in the region are impossible to predict, but could be significant and may have a severe adverse effect on the region. Globally, various governments have banned imports from Russia including commodities such as oil, natural gas and coal. In addition, there have been a series of recent armed conflicts in the Middle East involving Israel, Iran, Lebanon, Iraq, Syria and Yemen, alongside armed non-state actors including Hezbollah, Hamas and the Houthis. There is also political instability in Venezuela after the U.S. captured and extradited Venezuela’s President Nicolas Maduro. These events have caused volatility in the aforementioned commodity markets. Although the Company has not experienced any material adverse effect on its results of operations, financial condition or cash flows as a result of these events or the resulting volatility as of the date of this Report, such volatility, including market expectations of potential changes in coal prices and inflationary pressures on steel products, may significantly affect prices for our coal or the cost of supplies and equipment, as well as the prices of competing sources of energy for our electric power plant customers, like natural gas.
These conflicts, trade and monetary sanctions, as well as any escalation of these conflicts and future developments, could significantly affect worldwide market prices and demand for our coal and cause turmoil in the capital markets and generally in the global financial system. In addition, due to the increasing importance of exports to our business, a disruption in the supply chain or network we rely on to export our coal could adversely affect our business and result in lost sales and increased expenses. Our ability to export coal is dependent on third-party ocean-going container ships, rail, barge, air and trucking systems and, therefore, disruption in these logistics services because of global conflicts, including recent attacks in the Middle East on container ships, could adversely affect our financial performance and financial condition, negatively impacting sales, profitability and cash flows. Either of these risks could have a material adverse effect on our business, financial condition and results of operations, along with our operating costs, making it difficult to execute our planned capital expenditure program. Additionally, the geopolitical and macroeconomic consequences of these conflicts and associated sanctions cannot be predicted but could severely impact the world economy. If any of these events occur, the resulting political instability and societal disruption could reduce overall demand for coal-fired electricity, steel made through the use of metallurgical coal or our coal generally, causing a reduction in our revenues or an increase in our costs and thereby materially and adversely affecting our results of operations, financial condition and cash flows.
New or existing tariffs and other trade measures could adversely affect our business, results of operations, financial condition and cash flows.
New or existing tariffs and other trade measures could adversely affect our business, results of operations, financial condition and cash flows, either directly or indirectly through various adverse impacts on our significant customers. During the last several years, the U.S. Government imposed tariffs on steel and aluminum and a broad range of other products imported into the U.S. In response to the tariffs imposed by the U.S., the European Union, Canada, Mexico and China have announced tariffs on U.S. goods and services. These actions are unprecedented and have caused substantial uncertainty and volatility in financial markets. These tariffs, along with any additional tariffs or trade restrictions that may be implemented by the U.S. or retaliatory trade measures or tariffs implemented by other countries, could result in reduced economic activity, increased costs in operating our business, reduced demand and changes in purchasing behaviors for thermal and metallurgical coal, limits on trade with the U.S. or other potentially adverse economic outcomes. Changes in tariffs and trade restrictions can be announced with little or no advance notice. The adoption and expansion of tariffs or other trade restrictions, increasing trade tensions, or other changes in governmental policies related to taxes, tariffs, trade agreements or policies are difficult to predict, which makes attendant risks difficult to anticipate and mitigate. If we are unable to navigate further changes in U.S. or international trade policy, it could have a material adverse impact on our business and results of operations. Additionally, we sell coal into the export thermal market and the export metallurgical market. Accordingly, our international sales may also be impacted by the tariffs and other restrictions on trade between the U.S. and other countries. Retaliatory tariffs by regions outside the U.S. may impact the prices of our exported products and the profit realized from these exports. In addition, on November 5, 2025, the U.S. Supreme Court heard oral arguments on tariffs imposed under the International Emergency Economic Powers Act (“IEEPA”). The court may provide tariff relief and the potential recovery of amounts previously paid. We are monitoring developments in this case and its impact on our future financial statements and business. We cannot predict further developments, and such existing or future tariffs could impact trade agreements entered into by the U.S. and the wider tariff environment in which we operate or have a material adverse effect on our business, results of operations, financial condition and cash flows.
We may be unsuccessful in finding suitable joint venture partners or acquisition targets or in integrating the operations of any future acquisitions, including acquisitions involving new lines of business, with our existing operations, and in realizing all or any part of the anticipated benefits of any such acquisitions.
From time to time, we may evaluate and acquire assets and businesses that we believe complement our existing assets and business. However, our ability to grow our business through acquisitions or the entry into joint ventures may be limited by both our ability to identify appropriate acquisition or partner candidates and our financial resources, including our available cash and borrowing capacity.
Additionally, the assets and businesses we acquire or in which we take an ownership stake through a joint venture may be dissimilar from our existing lines of business. Acquisitions and joint venture operations may require substantial capital or the incurrence of substantial indebtedness and potentially may not be on favorable terms. Our capitalization and results of operations may change significantly as a result of future acquisitions and joint ventures. Acquisitions, joint ventures and business expansions involve numerous risks, including the following:
•difficulties in the integration of the assets and operations of the acquired businesses;
•inefficiencies and difficulties that arise because of unfamiliarity with new assets and the businesses associated with them and new geographic areas;
•the possibility that we have insufficient expertise to engage in such activities profitably or without incurring inappropriate amounts of risk;
•potential lack of control over a joint venture’s business decisions and operations; and
•the diversion of management’s attention from other operating issues.
Further, unexpected costs and challenges may arise whenever businesses with different operations or management are combined, and we may experience unanticipated delays in realizing the benefits of an acquisition. Entry into certain lines of business may subject us to new laws and regulations with which we are not familiar and may lead to increased litigation and regulatory risk. Also, following an acquisition, we may discover previously unknown liabilities associated with the acquired business or assets for which we have no recourse under applicable indemnification provisions. If a new business generates insufficient revenue or if we are unable to efficiently manage our expanded operations, our results of operations may be adversely affected.
Additionally, our participation in joint venture arrangements necessarily involves risk. Whether or not we hold majority interests or maintain operational control in our joint ventures, our partners may, among other things, (1) have economic or business interests or goals that are inconsistent with, or opposed to, ours; (2) seek to block actions that we believe are in our or the joint venture’s best interests; or (3) be unable or unwilling to fulfill their obligations under the joint venture or other agreements, such as contributing capital, each of which may adversely impact our results of operations, financial condition, cash flows or impair our ability to recover our investment in the joint venture. Where our joint ventures are jointly controlled or not managed by us, we may provide expertise and advice but have limited control over compliance with our operational and other standards. Failure by non-controlled joint venture partners to adhere to operational standards that are equivalent to ours could unfavorably affect safety results, operating costs and productivity and accordingly, adversely impact our results of operations, financial condition and cash flows.
We must obtain, maintain and renew governmental permits and approvals which, if we cannot obtain in a timely manner, would reduce our production, cash flow and results of operations.
Our coal production is dependent on our ability to obtain various federal and state permits and approvals to mine our coal reserves. The permitting rules, and the interpretations of these rules, are complex, change frequently and are often subject to discretionary interpretations by regulators. For example, under Section 404 of the Clean Water Act, the Army Corps of Engineers (“Corps”) issues permits for the discharge of dredged or fill material into regulated waters and wetlands, and under Section 401 of the Clean Water Act, affected states must certify that proposed activity under Section 404 will comply with water quality standards or other applicable requirements. Corps permits and state certifications are required for construction of slurry ponds, refuse areas, impoundments, and for various other mining activities. The Section 404/401 permitting process has become subject to increasingly stringent regulatory requirements and challenges by environmental organizations. Where authorization by a federal agency is required, the federal agency may be required to complete reviews under the National Environmental Policy Act, which can require consideration of multiple facets of environmental impact including GHG emissions associated with the proposed project, and may incorporate such considerations in its approval or denial. In addition, the public, including non-governmental organizations and individuals, has certain statutory rights to comment upon and otherwise impact the permitting process, including through court intervention. It is possible that all permits required to commence new operations, or to expand or continue operations at existing facilities, may not be issued or renewed in a timely manner, or may not be approved at all. Furthermore, permits could be issued with operating requirements or special conditions that increase the cost of operations. Any of these circumstances could have significant negative effects and could materially and adversely affect our results of operations and cash flows.
Our mines are subject to stringent federal and state safety regulations that increase our cost of doing business at active operations and may place restrictions on our methods of operation. In addition, government inspectors, under certain circumstances, have the ability to order our operations to be shut down based on safety considerations.
The Federal Coal Mine Safety and Health Act and Mine Improvement and New Emergency Response Act impose stringent health and safety standards on mining operations. Regulations that have been adopted are comprehensive and affect numerous aspects of mining operations, including training of mine personnel, mining procedures, the equipment used in mine emergency procedures and other matters.
States in which we operate have programs for mine safety and health regulation and enforcement. The various requirements mandated by law or regulation can place restrictions on our methods of operations and potentially lead to penalties for the violation of such requirements, creating a significant effect on operating costs and productivity. In addition, government inspectors, under certain circumstances, have the ability to order our operations to be shut down based on safety considerations. If an incident were to occur at one of our coal mines, it could be shut down for an extended period of time and our reputation with our customers could be materially damaged.
Our operations may impact the environment or cause exposure to hazardous substances, and our properties may have environmental contamination, which could result in liabilities to us. In addition, government inspectors, under certain circumstances, have the ability to order our operations to be shut down based on environmental considerations.
Our operations currently use hazardous materials and generate limited quantities of hazardous wastes from time to time. Drainage flowing from or caused by mining activities can be acidic with elevated levels of dissolved metals, a condition referred to as “acid mine drainage.” We could become subject to claims for toxic torts, natural resource damages and other damages, as well as for the investigation and clean-up of soil, surface water, groundwater and other media. Such claims may arise, for example, out of conditions at sites that we currently own or operate, as well as at sites that we previously owned or operated, or may acquire. Our liability for such claims may be joint and several, so that we may be held responsible for more than our share of the contamination or other damages, or for the entire share. In addition, government inspectors, under certain circumstances, may have the ability to order our operations to be shut down based on a perceived or actual violation of regulations concerning hazardous substances and other matters related to environmental protection. These and other similar unforeseen impacts that our operations may have on the environment, as well as exposures to hazardous substances or wastes associated with our operations, could result in costs and liabilities that could adversely affect us.
Our operations include coal refuse disposal areas, slurry impoundments and other water retaining or dam structures, with multiple facilities classified as “high” or “significant” hazards, depending on the extent of damage or loss of life that could occur in the event of a failure. A failure of these structures would result in liabilities that could have a material impact on our business.
We maintain coal refuse disposal areas (“CRDAs”), slurry impoundments and other water retaining or dam structures that are active or in various stages of reclamation at our active mines and at certain legacy properties. Such areas and impoundments are subject to extensive regulation and are designed, constructed, operated and maintained according to stringent environmental, structural and safety standards. In addition to routine inspections conducted by multiple regulatory authorities, these facilities are also inspected by qualified third-party inspectors and are separately certified by an independent professional engineer where required by law or regulation. Structural failure of a CRDA, slurry impoundment or other dam structure classified as a high or significant hazard could result in extensive damage to the environment and natural resources, such as bodies of water, as well as liability for related personal injuries, property damages, injuries to wildlife or loss of life. Some of our impoundments overlie mined out areas, which can pose a heightened risk of failure and of damages arising out of failure. If one of these structures were to fail, we could be subject to claims for the resulting environmental contamination and associated liability, claims for personal injury or loss of life, and claims for physical property damage, as well as fines and penalties. These events could materially and adversely impact our business, financial condition, results of operations and cash flows.
We depend on the services of key executives, and any inability to attract and retain key management personnel could have a material adverse effect on our business.
Our future success depends upon the continued services of our executive officers, including our Chair and Chief Executive Officer as well as our President and Chief Financial Officer, who have critical experience and relationships in the coal industry that we rely on to implement our business plan and growth strategy. Our ability to retain senior management has in the past been, and may in the future be, impacted by volatility in commodity prices and uneven business performance, which have negatively impacted our stock price, and therefore, our ability to use equity compensation as a retention tool. Additionally, the recent efforts of certain members of the investment community, including investment advisors, sovereign wealth funds, public pension funds, universities and other groups, to promote divestment of fossil fuel equities, to encourage the consideration of ESG practices of companies in a manner that negatively affects coal companies and to pressure lenders to limit funding to companies engaged in the extraction of fossil fuel reserves may also negatively impact our ability to attract and retain key management personnel. Accordingly, we have entered into, and may need to enter into additional, retention or other arrangements that could be costly to maintain. While we have change-in-control agreements in place with our senior executives, there can be no assurance we will continue to retain their services, and we may become subject to significant severance payments if our relationship with these executives is terminated under certain circumstances. Further, turnover, planned or otherwise, in these or other key leadership positions may materially adversely affect our ability to manage our business efficiently and effectively, and such turnover can be disruptive and distracting to management, may lead to additional departures of existing personnel and could have a material adverse effect on our results of operations and future profitability.
Our ability to retain our key management personnel or to identify and attract additional management personnel or suitable replacements should any members of the management team leave or be terminated is dependent on a number of factors, including the competitive nature of the employment market and our industry. Any failure to retain key management personnel or to attract additional or suitable replacement personnel could cause uncertainty among investors, employees, customers and others concerning our future direction and performance and could have a material adverse effect on our business, financial condition and results of operations.
We have asset retirement obligations and obligations for long-term employee benefits. If the assumptions underlying our accruals are inaccurate, we could be required to expend greater amounts than anticipated.
The SMCRA and various state laws establish operational, reclamation and closure standards for all our coal mining operations and require us, under certain circumstances, to plug natural gas wells. We accrue for the costs of current mine disturbance, gas well plugging and of final mine closure, including the cost of treating mine water discharge where necessary. Estimates of our total asset retirement obligations, which are based upon permit requirements, engineering studies and our engineering expertise related to these requirements, were approximately $535 million at December 31, 2025. The amounts recorded are dependent upon a number of variables, including the estimated future expenditures, estimated mine lives, assumptions involving profit margins, inflation rates and the assumed credit-adjusted risk-free interest rates. If these accruals are insufficient, our future operating results could be adversely affected.
We also provide various long-term employee benefits to inactive and retired employees, and we accrue amounts for these obligations. At December 31, 2025, the current and non-current portions of these obligations included:
•postretirement medical and life insurance ($206 million);
•coal workers’ pneumoconiosis benefits ($286 million);
•non-qualified pension plan benefits ($23 million);
•workers’ compensation ($88 million); and
•long-term disability ($5 million).
Our management and engineers periodically review these estimates. However, if our assumptions are inaccurate, major operational changes are implemented or if government regulations change significantly, we could be required to expend greater amounts than anticipated. Salary retirement benefits are funded in accordance with Employer Retirement Income Security Act of 1974 (“ERISA”) regulations. The other obligations are unfunded. In addition, the federal government and several states in which we operate consider changes in workers’ compensation and black lung laws from time to time. Such changes, if enacted, could increase our benefit expense and our collateral requirements. Additionally, former miners and their family members asserting claims for pneumoconiosis benefits have generally been more successful asserting such claims in recent years as a result of the presumption within the PPACA of 2010 that a coal miner with 15 or more years of underground coal mining experience (or the equivalent) who develops a respiratory condition and meets the requirements for total disability under the Federal Act is presumed to be disabled due to coal dust exposure, thereby shifting the burden of proof from the employee to the employer/insurer to establish that this disability is not due to coal dust. The increasing success rate of such claims based upon the PPACA changed presumption and, as a result, the increasing expense incurred by us to insure against such claims could increase our expenses for long-term employee benefit obligations.
We face uncertainties in estimating our economically recoverable coal reserves, and inaccuracies in our estimates could result in lower-than-expected revenues, higher-than-expected costs and decreased profitability.
Coal reserves are economically recoverable when the price at which they are expected to be sold exceeds their expected cost of production and selling. Forecasts of our future performance are based on, among other things, estimates of our recoverable coal reserves. We base our coal reserve information on geological data, coal ownership information and current and proposed mine plans. These estimates are periodically updated to reflect past coal production, new drilling information and other geological or mining data. There are numerous uncertainties inherent in estimating quantities and qualities of economically recoverable coal reserves, including many factors beyond our control. As a result, estimates of economically recoverable coal reserves are by their nature uncertain. Information about our reserves consists of estimates based on engineering, economic and geological data assembled and analyzed by our staff and external consultants. Some of the factors and assumptions which impact economically recoverable coal reserve estimates include:
•geological and mining conditions;
•historical production from the area compared with production from other producing areas;
•the assumed effects of regulations and taxes by governmental agencies;
•our ability to obtain, maintain and renew all required permits;
•future improvements in mining technology;
•assumptions governing future prices; and
•future operating costs, including the cost of materials and capital expenditures.
In addition, we hold substantial coal reserves in areas containing Marcellus Shale and other shales. These areas are currently the subject of substantial exploration for oil and natural gas, particularly by horizontal drilling. If a natural gas well is in the path of our mining for coal, we may not be able to mine through the well unless we purchase it. The cost of purchasing a producing horizontal well could be substantial. Horizontal wells with multiple laterals extending from the well pad may access larger natural gas reserves than a vertical well which could result in higher costs. In future years, the cost associated with purchasing natural gas wells or other properties to which we do not hold access, or exclusive access, and are in the path of our coal mining may make mining through those areas uneconomical, thereby effectively causing a loss of significant portions of our coal reserves.
Each of the factors which impacts reserve estimation may vary considerably from the assumptions used in estimating the reserves. For these reasons, estimates of coal reserves may vary substantially. Actual production, revenues and expenditures with respect to our coal reserves will likely vary from estimates, and these variances may be material. As a result, our estimates may not accurately reflect our actual coal reserves.
Defects may exist in our chain of title for our undeveloped coal reserves where we have not done a thorough chain of title examination of our undeveloped coal reserves. We may incur additional costs and delays to mine coal because we have to acquire additional property rights to perfect our title to coal rights. If we fail to acquire additional property rights to perfect our title to coal rights, we may have to reduce our estimated reserves.
Title to most of our owned or leased properties and mineral rights is not usually verified until we make a commitment to mine a property, which may not occur until after we have obtained necessary permits and completed exploration of the property. In some cases, we rely on title information or representations and warranties provided by our lessors or grantors. Our right to mine certain of our reserves has in the past been, and may again in the future be, adversely affected if defects in title, boundaries or other rights necessary for mining exist or if a lease expires. Any challenge to our title or leasehold interests could delay the mining of the property and could ultimately result in the loss of some or all of our interest in the property. From time to time, we also may be in default with respect to leases for properties on which we have mining operations. In such events, we may have to close down or significantly alter the sequence of such mining operations which may adversely affect our future coal production and future revenues. If we mine on property that we do not own or lease, we could incur liability for such mining and be subject to regulatory sanction and penalties.
In order to obtain, maintain or renew leases or mining contracts to conduct our mining operations on property where these defects exist, we may in the future have to incur unanticipated costs. In addition, we may not be able to successfully negotiate new leases or mining contracts for properties containing additional reserves or maintain our leasehold interests in properties where we have not commenced mining operations during the term of the lease. As a result, our results of operations, business and financial condition may be materially adversely affected.
As a result of the Murray Energy bankruptcy, the Company could be required to pay for certain liabilities previously acquired by Murray in a 2013 transaction between Murray and our former parent.
In 2013, Murray Energy and its subsidiaries (“Murray”) entered into a stock purchase agreement (the “Murray sale agreement”) with our former parent, pursuant to which Murray acquired the stock of Consolidation Coal Company and certain subsidiaries and certain other assets and liabilities. At the time of sale, the liabilities included certain retiree medical liabilities under the Coal Industry Retiree Health Benefit Act of 1992 (“Coal Act”) and certain federal black lung liabilities under the Black Lung Benefits Act (“BLBA”).
Murray filed for Chapter 11 bankruptcy in October 2019. As part of the bankruptcy proceedings, Murray unilaterally entered into a settlement with the United Mine Workers of America 1992 Benefit Plan (the “1992 Benefit Plan”) to transfer retirees in the Murray Energy Section 9711 Plan to the 1992 Benefit Plan. This was approved by the bankruptcy court on April 30, 2020. On May 2, 2020, the 1992 Benefit Plan filed an action in the U.S. District Court for the District of Columbia asking the court to make a determination whether the Company’s former parent or the Company has any continuing retiree medical liabilities under the Coal Act (the “1992 Plan Lawsuit”). The Murray sale agreement includes indemnification by Murray with respect to the Coal Act and BLBA liabilities. In addition, the Company had agreed to indemnify its former parent relative to certain pre-separation liabilities. As of September 16, 2020, the Company entered into a settlement agreement with Murray and withdrew its claims in bankruptcy. On September 11, 2020, the defendants in the 1992 Plan Lawsuit filed a Motion to Dismiss Plaintiffs’ Second Amended Complaint which was denied by the Court on March 29, 2022. In October 2025, both parties filed a motion for summary judgment. In the 1992 Benefit Plan’s summary judgment motion, it alleged it is entitled to recover reimbursement for unpaid monthly benefits premiums from the beginning of the lawsuit to present in the amount of $64.8 million, plus interest and damages totaling $25.6 million, as well as an unspecified amount of attorneys’ fees.
Based upon limited information available at the time of the Murray bankruptcy, the Company estimated that the future annual servicing costs of these liabilities in 2026 are approximately $10.0 million, and the annual servicing cost would decline each year since the beneficiaries of the Coal Act consist principally of miners who retired prior to 1994.
We are subject to certain ongoing indemnification obligations related to our separation from our former parent that, if realized, could materially impact our financial condition, results of operations and cash flows.
Although we separated from our former parent more than eight years ago, we have certain ongoing indemnification obligations related to our separation that could materially impact our financial condition, results of operations and cash flows. Specifically, under the 2017 Separation and Distribution Agreement between the Company and its former parent, we could be required to indemnify our former parent for liabilities relating to our business, whether occurring prior to or after the separation and certain other amounts, including defense costs, settlement amounts and judgments. Likewise, our former parent may fail to indemnify us against certain liabilities related to its business as required by the separation and distribution agreement, or any such indemnity provided by our former parent may be insufficient to make us whole against any third-party claims brought against us in connection with such liabilities.
The provisions of our debt agreements and the risks associated with our debt could adversely affect our business, financial condition, liquidity and results of operations.
As of December 31, 2025, our total long-term indebtedness was approximately $459 million, consisting of:
•$106 million under our West Virginia Economic Development Authority (“WVEDA”) 5.45% Solid Waste Disposal Facility Revenue Bonds due March 2035 (“WVEDA Bonds”);
•$103 million under our Maryland Economic Development Corporation (“MEDCO”) 5.00% Port Facilities Refunding Revenue Bonds due March 2035 (“MEDCO Bonds”);
•$98 million under our Pennsylvania Economic Development Financing Authority (“PEDFA”) 5.45% Solid Waste Disposal Facility Revenue Bonds due March 2035 (“PEDFA Bonds,” and together with the WVEDA Bonds and the MEDCO Bonds, the “Series 2025 Bonds”);
•$80 million associated with various equipment financing arrangements;
•$58 million associated with finance leases due through 2030; and
•$14 million of miscellaneous debt.
On January 14, 2025, and in connection with the Merger, we entered into an amendment to our senior secured credit agreement to increase the aggregate revolving commitments from $355 million to $600 million (our “Revolving Credit Facility”). The amendment extended the stated maturity date and provides that, under specified conditions, the maturity of the Revolving Credit Facility may be earlier. At December 31, 2025, no borrowings were outstanding under our Revolving Credit Facility or our trade accounts receivable securitization facility. The degree to which we are leveraged could have important consequences, including, but not limited to:
•increasing our vulnerability to general adverse economic and industry conditions;
•requiring us to dedicate a substantial portion of our cash flow from operating activities to the payment of interest and principal due under our outstanding debt, which will limit our ability to obtain additional financing to fund future working capital, capital expenditures, share buy-back programs, acquisitions, pay dividends, development of our coal reserves or other general corporate requirements;
•limiting our flexibility in planning for, or reacting to, changes in our business and in the coal industry;
•placing us at a competitive disadvantage compared to our competitors with lower leverage and better access to capital resources; and
•limiting our ability to implement our business strategy.
Our senior secured credit agreement and the indentures associated with our Series 2025 Bonds (the “Series 2025 Bonds Indentures”) limit the incurrence of additional indebtedness unless specified tests or exceptions are met. In addition, our senior secured credit agreement and the Series 2025 Bonds Indentures subject us to financial and other restrictive covenants. Under our senior secured credit agreement, we must comply with certain financial covenants on a quarterly basis, including a maximum first lien gross leverage ratio, a maximum total net leverage ratio and a minimum interest coverage ratio, as defined therein. Our senior secured credit agreement and the Series 2025 Bonds Indentures impose a number of restrictions upon us, such as restrictions on granting liens on our assets, making investments, paying dividends, stock repurchases, selling assets and engaging in acquisitions. Failure to comply with these covenants could result in an event of default that, if not cured or waived, could have a material adverse effect on us.
If our cash flows and capital resources are insufficient to fund our debt service obligations, we may be forced to sell assets, seek additional capital or seek to restructure or refinance our indebtedness. These alternative measures may not be successful and may not permit us to meet our scheduled debt service obligations. In the absence of such operating results and resources, we could face substantial liquidity problems and might be required to sell material assets or operations to attempt to meet our debt service and other obligations. Our senior secured credit agreement and the Series 2025 Bonds Indentures restrict our ability to sell assets and use the proceeds from the sales. We may not be able to consummate those sales or to obtain the proceeds which we could realize from them and these proceeds may not be adequate to meet any debt service obligations then due.
Terrorist attacks or cyber incidents could result in information theft, data corruption, operational disruption, damage to our brand and reputation, legal liability and/or financial loss.
We have become increasingly dependent upon digital technologies, including information systems, hardware, software, infrastructure, networks and cloud applications and services (collectively, “IT Systems”) to operate our businesses, process and record financial and operating data, including proprietary and potentially sensitive data (collectively, “Confidential Information”), communicate with our employees and business partners, and estimate quantities of coal reserves, as well as other activities related to our businesses. We own and manage some of these IT Systems but also rely on third parties for a range of IT Systems and related products and services.
We face numerous and evolving cybersecurity risks that threaten the confidentiality, integrity and availability of our IT Systems and Confidential Information, including from diverse threat actors, such as state-sponsored organizations, opportunistic hackers and hacktivists, as well as through diverse attack vectors, such as social engineering, phishing, malware, including ransomware, malfeasance by insiders, human or technological error, and as a result of malicious code embedded in open-source software, or misconfigurations, bugs, or other vulnerabilities in commercial software that is integrated into our IT Systems, products or services, or those of our suppliers or service providers. Strategic targets, such as energy-related assets, may be at greater risk of future terrorist or cyber attacks than other targets in the U.S. Deliberate attacks on our IT Systems, or security breaches in our IT Systems, could lead to corruption or loss of our Confidential Information, delays in production or delivery, difficulty in completing and settling transactions, challenges in maintaining our books and records, environmental damage, communication interruptions, other operational disruptions and third-party liability. Similarly, our vendors or service providers could be the subject of such attacks or breaches that result in the risks of corruption or loss of our Confidential Information and/or the other disruptions as described above.
In addition to the existing risks, the adoption of new technologies, such as artificial intelligence (“AI”), by us, our customers or third parties may also increase our exposure to data breaches or our ability to detect and remediate effects of a breach. Further, as cyber incidents continue to increase in frequency and sophistication, particularly given the increasing availability and sophistication of AI, we may be required to expend additional resources to continue to modify or enhance our protective measures or to investigate and remediate any vulnerability to cyber incidents. As a result, we may be unable to detect, investigate, remediate or recover from future attacks or incidents, or to avoid a material adverse impact to our IT Systems, Confidential Information or business. There can also be no assurance that our cybersecurity risk management program and processes, including our policies, controls or procedures, will be fully implemented, complied with or effective in protecting our IT Systems and Confidential Information.
Any adverse impact to the availability, integrity or confidentiality of our IT Systems or Confidential Information can result in legal claims or proceedings, regulatory investigations and enforcement actions, fines and penalties, negative reputational impacts that cause us to lose existing or future customers and/or significant incident response, system restoration or remediation and future compliance costs. Any or all of the foregoing could materially adversely affect our business, financial condition and results of operations.
Certain provisions in our multi-year fixed-price coal sales contracts may provide limited protection during adverse economic conditions, may result in economic penalties to us or permit the customer to terminate the contract.
Price adjustment, “price reopener” and other similar provisions in our multi-year coal sales contracts may reduce the protection from coal price volatility traditionally provided by coal supply contracts. Price reopener provisions are present in several of our multi-year coal sales contracts. These price reopener provisions may automatically set a new price based on the prevailing market price or, in some instances, require the parties to agree on a new price, sometimes within a specified range of prices. In a limited number of agreements, failure of the parties to agree on a price under a price reopener provision can lead to termination of the contract. Any adjustment or renegotiations leading to a significantly lower contract price could adversely affect our profitability.
Most of our coal sales agreements contain provisions requiring us to deliver coal within certain ranges for specific coal quality characteristics such as heat content, sulfur, ash, moisture, volatile matter, grindability, ash fusion temperature, size consistency and certain metallurgical coal properties. Failure to meet these conditions could result in penalties or rejection of the coal at the election of the customer.
Our coal sales contracts also typically contain force majeure provisions allowing for the suspension of performance by either party for the duration of specified events. Force majeure events include, but are not limited to, floods, earthquakes, storms, fire, faults in the coal seam or other geological conditions, other natural catastrophes, wars, terrorist acts, civil disturbances or disobedience, strikes, railroad transportation delays caused by a force majeure event and actions or restraints by court order and governmental authority or arbitration award. Depending on the language of the contract, some contracts may terminate upon continuance of an event of force majeure that extends for a period greater than three to 12 months and some contracts may oblige us to perform notwithstanding what would typically be a force majeure event.
Our ability to operate our business effectively could be impaired if we fail to attract and retain qualified personnel, or if a meaningful segment of our employees becomes unionized.
Our ability to operate our business and implement our strategies depends, in part, on our continued ability to attract and retain the qualified personnel necessary to conduct our business. Efficient coal mining using modern techniques and equipment requires skilled employees in multiple disciplines such as electricians, equipment operators, mechanics, engineers and welders, among others. Although we have not historically encountered shortages for these types of skilled employees, competition in the future may increase for such positions, especially as it relates to the needs of other industries with respect to these positions, including oil and gas. If we experience shortages of skilled employees in the future, our labor and overall productivity or costs could be materially adversely affected. In the future, we may utilize a greater number of external contractors for portions of our operations. The costs of these contractors have historically been higher than that of our employees. If our labor and contractor prices increase, or if we experience materially increased health and benefit costs with respect to our employees, our results of operations could be materially adversely affected.
Except for 39 of our employees at the Core Marine Terminal who unionized in 2018, none of our employees are currently represented by a labor union or covered under a collective bargaining agreement, although many employers in our industry have employees who belong to a union. It is possible that employees at our other locations may join or seek recognition to form a labor union, or we may be required to become a labor agreement signatory. If some or all of our current non-union operations were to become unionized, we could incur an increased risk of work stoppages, reduced productivity and higher labor costs. Also, if we fail to maintain good relations with our employees at the Core Marine Terminal, we could potentially experience labor disputes, work stoppages or other disruptions in the business of the Core Marine Terminal, which could negatively impact the profitability of the Core Marine Terminal, and accordingly, have a material adverse effect on our business, results of operations and financial condition.
If we do not maintain effective internal control over financial reporting, we could fail to accurately report our financial results.
During the course of the preparation of our financial statements, we evaluate our internal controls to identify and correct deficiencies in our internal control over financial reporting. If we fail to maintain an effective system of disclosure controls or internal control over financial reporting, including satisfaction of the requirements of the Sarbanes-Oxley Act, we may not be able to accurately or timely report on our financial results or adequately identify and reduce fraud. As a result, the financial condition of our business could be adversely affected, current and potential future stockholders could lose confidence in us and/or our reported financial results, which may cause a negative effect on the trading price of our common stock, and we could be exposed to litigation or regulatory proceedings, which may be costly or divert management attention.
Risks Related to Our Common Stock and the Securities Market
Our stock price has fluctuated and may continue to fluctuate significantly.
The market price of our common stock may fluctuate significantly due to a number of factors, some of which may be beyond our control, including:
•our quarterly or annual earnings, or those of other companies in our industry;
•actual or anticipated fluctuations in our operating results;
•changes in earnings estimates by securities analysts or our ability to meet those estimates or our earnings guidance;
•the operating and stock price performance of other comparable companies;
•overall market fluctuations and domestic and worldwide economic conditions;
•volatility resulting from geopolitical events, inflation, changes in interest rates and other macroeconomic events; and
•other factors described in these “Risk Factors” and elsewhere in this Report.
Stock markets in general have experienced volatility that has often been unrelated to the operating performance of a particular company. These broad market fluctuations may adversely affect the trading price of our common stock. As a result of these factors, holders of our common stock or other securities may not be able to resell their shares at or above the market price at which they purchased their shares or may not be able to resell them at all. In addition, price volatility with our common stock may be greater if trading volume is low.
Furthermore, shares of our common stock are freely tradeable without restriction or further registration under the U.S. Securities Act of 1933, as amended (the “Securities Act”), unless the shares are owned by one of our “affiliates,” as that term is defined in Rule 405 under the Securities Act. As a result, a sale of a substantial amount of our common stock, or the perception that such a sale may take place, could cause our stock price to decline.
If securities analysts issue unfavorable commentary about us, downgrade our shares or fail to publish research or reports about our Company, the price of our shares could decline.
The trading market for our shares depends in part on the research and reports that third-party securities analysts publish about our Company and our industry. We may be unable or slow to attract research coverage, and if one or more analysts cease coverage of our Company, we could lose visibility in the market. The impact of the revised EU Markets in Financial Instruments Directive (“MiFID”), which requires that investment managers and investment advisors located in the EU “unbundle” research costs from commissions, may result in fewer securities analysts covering our Company. This is because investment firms subject to MiFID are no longer permitted to pay for research using client commissions or “soft dollars” and instead must pay such costs directly or through a research payment account funded by clients and governed by a budget that is agreed to by the client, thereby raising their costs of providing research coverage. In addition, one or more analysts providing research coverage of our Company could use estimation or valuation methods that we do not agree with, downgrade our shares or issue other negative commentary about our Company or our industry. As a result of one or more of these factors, the trading price of our shares could decline.
We cannot guarantee the timing, amount or payment of dividends on our common stock in the future or that we will continue to repurchase shares of our common stock.
The payment and amount of any future dividend following the closing of the Merger is at the discretion of our Board of Directors and will depend upon many factors, including our financial condition and prospects, our capital requirements and access to capital markets, covenants associated with certain of our debt obligations, legal requirements and other factors that our Board of Directors may deem relevant, and there can be no assurance regarding the timing, amount or payment of dividends on our common stock in the future. On February 18, 2025, the Company’s Board of Directors approved a new capital return framework that involves a mix of dividends and share repurchases. The repurchase program permits the repurchase, from time to time, of the Company’s outstanding shares of common stock in an aggregate amount of up to $1 billion, subject to certain covenants under the Revolving Credit Facility and the Series 2025 Bonds Indentures. The repurchase program does not obligate us to repurchase any specific number of shares of common stock and may be suspended from time to time or terminated at any time prior to its expiration. There can be no assurance that we will repurchase shares under the repurchase program in the future in any particular amounts or at all. A reduction in, or elimination of, share repurchases could have a negative effect on the trading price of our common stock.
Your percentage of ownership in the Company may be diluted in the future.
Your percentage of ownership in us may be diluted because of equity issuances for future acquisitions, capital market transactions or otherwise, including, without limitation, equity awards that we may be granting to our directors, officers and employees. We cannot predict the effect, if any, that market sales of these securities or the availability of the securities will have on the prevailing market price of our common stock. Substantial sales of shares of our common stock or other securities into the public market, or the perception that those sales could occur, may cause the market price of our common stock to decline. Future issuances of our common stock, or other securities convertible into our common stock, may result in significant dilution to the proportionate ownership and voting power of our existing stockholders and could have a dilutive effect on our earnings per share, which could adversely affect the market price of our common stock.
It is anticipated that the compensation committee of the Board of Directors of the Company will continue to grant additional equity awards to Company employees and directors, from time to time, under the Company’s compensation and employee benefit plans. These additional awards will have a dilutive effect on the Company’s earnings per share, which could adversely affect the market price of the Company’s common stock.
In addition, our amended and restated certificate of incorporation authorizes us to issue, without the approval of our stockholders, one or more classes or series of preferred stock, often called “blank check preferred stock,” having such designation, powers, preferences and relative, participating, optional and other special rights, including preferences over our common stock with respect to dividends and distributions, as our Board of Directors generally may determine. The terms of one or more classes or series of preferred stock could dilute the voting power or reduce the value of our common stock.
For example, we could grant the holders of preferred stock the right to elect some number of our directors in all events or on the happening of specified events or to veto specified transactions. Similarly, the repurchase or redemption rights or liquidation preferences we could assign to holders of preferred stock could affect the residual value of our common stock.
Certain provisions of our amended and restated certificate of incorporation and amended and restated bylaws, and of Delaware law, may prevent or delay an acquisition of us, which could decrease the trading price of our common stock.
The Company’s amended and restated certificate of incorporation and amended and restated bylaws and Delaware law contain provisions that are intended to deter coercive takeover practices and inadequate takeover bids by making such practices or bids unacceptably expensive to the bidder and to encourage prospective acquirers to negotiate with the Company’s Board of Directors rather than to attempt a hostile takeover. These provisions include, among others:
•the inability of our stockholders to act by written consent unless such written consent is unanimous;
•the inability of our stockholders to call special meetings;
•rules regarding how stockholders may present proposals or nominate directors for election at stockholder meetings;
•the right of our Board of Directors to issue preferred stock without stockholder approval; and
•the ability of our directors, and not stockholders, to fill vacancies (including those resulting from an enlargement of our Board of Directors) on our Board of Directors.
In addition, we are subject to Section 203 of the Delaware General Corporation Law (“DGCL”). Section 203 provides that, subject to limited exceptions, persons that (without prior board approval) acquire, or are affiliated with a person that acquires, more than 15% of the outstanding voting stock of a Delaware corporation shall not engage in any business combination with that corporation, including by merger, consolidation or acquisitions of additional shares, for a three-year period following the date on which that person or its affiliate becomes the holder of more than 15% of the corporation’s outstanding voting stock.
We believe these provisions will protect our stockholders from coercive or otherwise unfair takeover tactics by requiring potential acquirers to negotiate with our Board of Directors and by providing our Board of Directors with more time to assess any acquisition proposal. These provisions are not intended to make us immune from takeovers. However, these provisions could have the effect of delaying, deferring or preventing a change in control or the removal of the existing Board of Directors and/or management, of deterring potential acquirers from making an offer to our stockholders and of limiting any opportunity to realize premiums over prevailing market prices for our common stock in connection therewith. This could be the case, notwithstanding the fact that a majority of our stockholders might benefit from such a change in control or offer.
Our certificate of incorporation designates the State Courts of the State of Delaware as the sole and exclusive forum for certain types of actions and proceedings that may be initiated by our stockholders, which could limit our stockholders’ ability to obtain an alternative judicial forum for disputes with us or our directors, officers, employees or agents.
Our certificate of incorporation provides that unless we consent in writing to the selection of an alternative forum, a state court sitting in the State of Delaware (or, if no state court located within the State of Delaware has jurisdiction, the federal court for the District of Delaware) will, to the fullest extent permitted by applicable law, be the sole and exclusive forum for:
•any derivative action or proceeding brought on our behalf;
•any action asserting a claim of breach of a fiduciary duty owed by any of our directors, officers, employees or agents to us or our stockholders;
•any action asserting a claim arising pursuant to any provision of the DGCL, our amended and restated certificate of incorporation or our bylaws;
•any action asserting a claim that is governed by the internal affairs doctrine, in each such case subject to such Court of Chancery having personal jurisdiction over the indispensable parties named as defendants therein; or
•any action asserting an internal corporate claim as defined in Section 115 of the DGCL.
Any person or entity purchasing or otherwise holding any interest in shares of our common stock will be deemed to have received notice of, and consented to, the provisions of our certificate of incorporation described in the preceding sentence. This choice of forum provision may limit a stockholder’s ability to bring a claim in a judicial forum that it finds favorable for disputes with us or our directors, officers, employees or agents, which may discourage such lawsuits against us and such persons. Alternatively, if a court were to find these provisions of our amended and restated certificate of incorporation inapplicable to, or unenforceable in respect of, one or more of the specified types of actions or proceedings, we may incur additional costs associated with resolving such matters in other jurisdictions.
Risks Related to Our Merger with Arch
Uncertainties associated with the Merger may cause a loss of management personnel and other key employees, which could adversely affect the future business and operations of the Company.
The Company depends on the experience and industry knowledge of its officers and other key employees to execute its business plans. The success of the Company will depend in part on its ability to retain key management personnel and other key employees. Employees of the Company may experience uncertainty about their roles within the Company following the Merger or other concerns regarding the operations of the Company following the Merger, any of which may have an adverse effect on the ability of the Company to retain key management and other key personnel. If the Company is unable to retain personnel, including key management, who are critical to the future operations of the Company, the Company could face disruptions in its operations, loss of existing customers, loss of key information, expertise or know-how and unanticipated additional recruitment and training costs. In addition, the loss of key personnel could diminish the anticipated benefits of the Merger. No assurance can be given that the Company will be able to retain key management personnel and other key employees to the same extent that the Company has previously been able to retain its employees.
The business relationships of the Company may be subject to disruption due to uncertainty associated with the Merger, which could have a material effect on the business, financial condition, cash flows and results of operations of the Company.
Parties with which the Company does business may experience uncertainty associated with the Merger, including with respect to current or future business relationships with the Company. The Company’s business relationships may be subject to disruption as customers, distributors, suppliers, vendors, landlords, joint venture participants and other third parties with whom they do business may attempt to delay or defer entering into new business relationships, negotiate changes in existing business relationships or consider entering into business relationships with parties other than the Company. These disruptions could have a material and adverse effect on the business, financial condition, cash flows and results of operations of the Company, as well as a material and adverse effect on the Company’s ability to realize the expected cost savings and other benefits of the Merger.
The Company has incurred and expects to continue to incur significant costs in connection with the Merger and integration of Arch with the Company, which may be in excess of those anticipated by the Company.
The Company has incurred a number of non-recurring costs associated with negotiating and completing the Merger and combining Arch’s operations with the Company’s operations, and the Company expects to continue to incur a number of non-recurring costs. These expenses have been, and will continue to be, substantial. The substantial majority of non-recurring expenses will consist of transaction costs related to the Merger and include, among others, employee retention costs, fees paid to financial, legal and accounting advisors, severance and benefit costs, filing fees and debt restructuring costs.
The Company will also incur transaction costs related to formulating and implementing integration plans, including facilities and systems consolidation costs and employment-related costs. Expectations that the Company will offset integration-related costs over time by the elimination of duplicative costs, as well as the realization of other efficiencies related to the integration of the businesses, may not be achieved in the near term, or at all. The costs described above, as well as other unanticipated costs and expenses, could adversely affect the financial condition, cash flows and operating results of the Company.
The failure to integrate the businesses and operations of the Company and Arch successfully in the expected time frame may adversely affect the Company’s future results.
Prior to the completion of the Merger, Arch operated independently from the Company. Following the completion of the Merger, their respective businesses may not be integrated successfully. It is possible that the integration process could result in the loss of key employees; the loss of customers, service providers, vendors or other business counterparties; the disruption of ongoing businesses; inconsistencies in standards, controls, procedures and policies; potential unknown liabilities and unforeseen expenses, delays or regulatory conditions associated with and following completion of the Merger; or higher-than-expected integration costs and an overall post-completion integration process that takes longer than originally anticipated.
In addition, at times the attention of certain members of management and resources may be focused on completion of the Merger and the integration of the businesses of the two companies and diverted from day-to-day business operations or other opportunities that may be beneficial, which may disrupt each company’s ongoing operations and the operations of the Company.
Furthermore, the Board of Directors and executive leadership of the Company consists of former directors from each of the Company and Arch and former executive officers from each of the Company and Arch. Combining the boards of directors and management teams of each company into a single board and a single management team could require the reconciliation of differing priorities and philosophies.
The Company may fail to realize all of the anticipated benefits of the Merger.
The success of the Merger will depend, in part, on the Company’s ability to realize the anticipated benefits and cost savings from combining the Company’s and Arch’s businesses and operational synergies. The anticipated benefits and cost savings of the Merger may not be realized fully or at all, may take longer to realize than expected, or could have other adverse effects that the Company does not currently foresee, in which case, among other things, the Merger may not be accretive to free cash flow and may not generate significant discretionary cash flow to return to stockholders via share repurchases or other means. Some of the assumptions that the Company has made, such as the achievement of the anticipated benefits related to the geographic, commodity and asset diversification and the expected size, scale, inventory and financial strength of the Company, may not be realized. The integration process may result in the loss of key employees, the disruption of ongoing businesses or inconsistencies in standards, controls, procedures and policies. In addition, there could be potential unknown liabilities and unforeseen expenses associated with the Merger that could adversely impact the Company.
Additionally, certain operations may not realize the full potential that we anticipated at the Merger due to operational issues we have faced, including at our Leer South and West Elk locations in 2025. The Leer South longwall system had been idle since January 13, 2025, when combustion-related activity was detected in a previously mined area. In addition, our West Elk longwall mine in Colorado experienced a period of transition associated with its move to the B-Seam in the fourth quarter of 2025.
The Company’s ability to utilize its historic net operating loss carryforwards and certain other tax attributes may be limited.
As of December 31, 2025, the Company had U.S. federal net operating loss carryforwards (“NOLs”) of approximately $717.3 million, $112.6 million of which is subject to expiration, if not utilized, starting in 2037. The remaining carryforwards do not expire; however, they can only be used to offset 80% of U.S. federal taxable income in any taxable year. The Company’s ability to utilize these NOLs and other tax attributes to reduce future taxable income depends on many factors, including its future income, which cannot be assured. Section 382 of the Internal Revenue Code (“Section 382”) and Section 383 of the Internal Revenue Code generally impose an annual limitation on the amount of NOLs and certain other tax attributes that may be used to offset taxable income when a corporation has undergone an “ownership change” (as determined under Section 382). The Merger was deemed an ownership change and, as a result, utilization of these NOLs is subject to an annual limitation under Section 382, determined by multiplying (1) the fair market value of its stock at the time of the ownership change by (2) the long-term tax-exempt rate published by the IRS for the month in which the ownership change occurs, subject to certain adjustments. Any unused annual limitation may be carried over to later years.
ITEM 1B. UNRESOLVED STAFF COMMENTS
None.
ITEM 1C. CYBERSECURITY
Risk Management and Strategy
The Company has a cybersecurity risk program that is designed to align with industry standards and best practices, managed by a dedicated staff and specialists. This does not imply that we meet any particular technical standards, specifications or requirements, only that we use industry standards and best practices as a guide to help us identify, assess and manage cybersecurity risks relevant to our business. We have implemented a set of system, network and application-level controls designed to protect our corporate data and systems. These controls are monitored for cybersecurity risk events and incidents on a continuous basis by a dedicated staff of cybersecurity professionals and various third-party providers. These controls are updated as the Company deems necessary to protect the Company. In addition, the Company also takes a proactive approach by monitoring cybersecurity threat intelligence to stay informed regarding emerging risks.
The cybersecurity risk program also utilizes third-party assessors, consultants and auditors to perform various services, such as tabletop exercises and network penetration tests. The Company provides awareness training to its employees to help identify, avoid and mitigate cybersecurity threats. Employees with network access are required to participate in required training quarterly, including spear phishing and other awareness training. The program also has a policy in place related to the use of vendors and third-party risk. Cybersecurity risk is also evaluated during the acquisition process for new products and services.
The Company accounts for cybersecurity risk as a part of the Company’s overall business strategy and planning. The Audit Committee of the Company’s Board of Directors, which oversees all matters related to risk management and, in particular, the security of and risks related to the Company’s IT Systems, receives regular reports on the Company’s cybersecurity risk management efforts from various senior officers of the Company. The Company also has a corporate cybersecurity risk Steering Committee, which is a cross-functional group comprised of both senior management and other key business unit leaders that provides input to senior management on the Company’s cybersecurity risk program.
The Company has not experienced any material operational or financial impact as the result of a cybersecurity risk or incident, and, at this time, the Company has not identified risks from cybersecurity threats, including as a result of any prior cybersecurity incidents, that are reasonably likely to materially affect the Company’s business strategy, results of operations or financial condition. However, the Company faces risks from cybersecurity threats that, if realized, are reasonably likely to materially affect the Company, including its operations, business strategy, results of operations or financial condition, and it is prepared to mitigate and respond to such an event should it occur. The Company has prepared a Cybersecurity Incident Response Plan, as well as an Information Technology Disaster Recovery Plan. These plans are reviewed, updated and tested on a regular basis. Specifically, the Company conducts cybersecurity tabletop exercises that include participation by Audit Committee members, senior management and third-party cybersecurity consultants.
The Company faces a range of cybersecurity threats, including threats common to many industries such as ransomware and denial of service, as well as more advanced threats specific to critical infrastructure industries such as mining. The Company’s customers, equipment suppliers, transportation facility providers and joint venture partners face similar cybersecurity threats, and a cybersecurity incident affecting the Company or any of these entities could materially affect our operations, performance and results of operations. For more information regarding the risks we face from cybersecurity, please see the section titled “Risk Factors - Terrorist attacks or cyber incidents could result in information theft, data corruption, operational disruption and/or financial loss.”
Governance
The Company’s Board of Directors has assigned oversight of cybersecurity risk to the Audit Committee, as outlined in the Audit Committee’s charter. Updates on the cybersecurity risk program are provided at each Audit Committee meeting. Additionally, the Company’s senior management engages with the Audit Committee on a regular basis to provide updates on our cybersecurity risk program.
The Company has a Director of Cybersecurity who reports directly to the Director of Information Technology and is primarily responsible for assessing and managing material risks from cybersecurity threats. The Company’s Director of Cybersecurity has 25 years of industry experience and holds many relevant industry certifications. The Director of Cybersecurity has direct oversight of the cybersecurity risk program. Cybersecurity risk briefings are provided to the Audit Committee by the Director of Information Technology at all regular meetings. Additionally, the Director of Information Technology and Director of Cybersecurity communicate directly with the Audit Committee chair as needed to ensure adequate oversight of the program.
The Company’s management team takes steps to stay informed about and monitor efforts to prevent, detect, mitigate and remediate cybersecurity risks and incidents through various means, which may include briefings from internal security personnel, threat intelligence and other information obtained from governmental, public or private sources, including external consultants engaged by the Company and alerts and reports produced by security tools deployed in the Company’s information technology environment.
ITEM 2. PROPERTIES
See “Principal Properties” in Item 1 of this Report for a description of our mining properties and our terminals through which we provide coal and export terminal services, incorporated herein by this reference. See the map under “Principal Properties” in Item 1 of this Report for the location of the Company’s material properties. Our principal executive offices are located at 275 Technology Drive, Suite 101, Canonsburg, Pennsylvania 15317-9565.
ITEM 3. LEGAL PROCEEDINGS
Our operations are subject to a variety of risks and disputes normally incidental to our business. As a result, we may, at any given time, be a defendant in various legal proceedings and litigation arising in the ordinary course of business. We are not currently subject to any material litigation other than those described in Note 22—Commitments and Contingent Liabilities in the Notes to the Audited Consolidated Financial Statements in Item 8 of this Report, which descriptions are incorporated herein by this reference.
SEC regulations require us to disclose certain information about environmental proceedings if we reasonably believe that such proceedings may result in monetary sanctions above a stated threshold. We use a threshold of $1 million for purposes of determining whether disclosure of any such proceedings is required, as permitted pursuant to Item 103(c)(3)(iii) of Regulation S-K. No such environmental proceedings were pending or contemplated as of December 31, 2025.
ITEM 4. MINE SAFETY DISCLOSURES
Information concerning mine safety violations or other regulatory matters required by Section 1503(a) of the Dodd-Frank Wall Street Reform and Consumer Protection Act and Item 104 of Regulation S-K is included in Exhibit 95 to this Report.
PART II
ITEM 5. MARKET FOR REGISTRANT’S COMMON EQUITY, RELATED STOCKHOLDER MATTERS AND ISSUER PURCHASES OF EQUITY SECURITIES
Shares of the Company’s common stock are listed on the New York Stock Exchange and trade under the symbol “CNR” since January 15, 2025. Trading of the Company’s common stock began as “when-issued” trading on November 3, 2017 and began as “regular-way” trading on November 29, 2017, under the ticker symbol CEIX.
As of January 30, 2026, there were 66 holders of record of our common stock. A substantially greater number of holders of our common stock are “street name” or beneficial holders, whose shares of record are held by banks, brokers and other financial institutions.
The following performance graph compares the Company’s cumulative total shareholder return to that of the Company’s peer group and the Standard & Poor’s 500 Stock Index. The peer group, for the purposes of the information presented below, is comprised of Alliance Resource Partners LP, Alpha Metallurgical Resources, Inc., Hallador Energy Company, Peabody Energy Corporation, Ramaco Resources, Inc. and Warrior Met Coal, Inc. Our peer group was updated for 2025 to remove Arch in light of the Merger with the Company in January 2025.
The graph above assumes that the value of an initial investment in the Company’s common stock and each index was $100 at December 31, 2020. The graph also assumes that all dividends were reinvested and that the investments were held through December 31, 2025.
|
|
|
|
|
|
|
|
|
|
|
|
|
|
|
|
|
|
|
|
|
|
|
|
|
|
|
|
|
|
|
|
|
|
|
|
|
|
|
| |
|
2020 |
|
2021 |
|
2022 |
|
2023 |
|
2024 |
|
2025 |
| Core Natural Resources, Inc. |
|
100.0 |
|
315.0 |
|
927.7 |
|
1,491.1 |
|
1,589.5 |
|
1,326.0 |
| S&P 500 Stock Index |
|
100.0 |
|
128.7 |
|
105.4 |
|
133.1 |
|
166.4 |
|
196.2 |
| Peer Group |
|
100.0 |
|
315.7 |
|
701.6 |
|
1,121.7 |
|
1,067.1 |
|
1,308.8 |
The information above is being furnished pursuant to Item 201(e) of Regulation S-K.
Repurchases of Equity Securities
The following table sets forth repurchases of shares of the Company's common stock during the three months ended December 31, 2025:
|
|
|
|
|
|
|
|
|
|
|
|
|
|
|
|
|
|
|
|
|
|
|
|
|
|
|
|
|
|
| Period |
|
Total Number of Shares Purchased (a) |
|
Average Price Paid per Share |
|
Total Number of Shares Purchased as Part of Publicly Announced Plans or Programs |
|
Approximate Dollar Value of Shares that May Yet be Purchased Under the Plans or Programs (000s omitted) (b) |
|
| October 1, 2025 - October 31, 2025 |
|
— |
|
|
— |
|
|
— |
|
|
$ |
797,409 |
|
(c) |
| November 1, 2025 - November 30, 2025 |
|
88,362 |
|
|
$ |
78.28 |
|
|
88,362 |
|
|
$ |
790,492 |
|
(c) |
| December 1, 2025 - December 31, 2025 |
|
176,125 |
|
|
$ |
83.79 |
|
|
176,125 |
|
|
$ |
775,736 |
|
(c) |
| Total |
|
264,487 |
|
|
$ |
81.95 |
|
|
264,487 |
|
|
|
|
(a) On February 18, 2025, the Company's Board of Directors approved a capital return framework that involves a mix of dividends and share repurchases. The repurchase program permits the repurchase, from time to time, of the Company's outstanding shares of common stock in an aggregate amount of up to $1 billion, subject to certain covenants in the Revolving Credit Facility and the Series 2025 Bonds Indentures that limit the Company's ability to repurchase shares of its common stock. The repurchases will be effected from time to time on the open market, in privately negotiated transactions or under a Rule 10b5-1 plan. The program does not obligate the Company to acquire any particular amount of its common stock, and the program can be modified or suspended at any time at the Company's discretion.
(b) Management cannot estimate the number of shares that will be repurchased because purchases are made based upon the Company's stock price, the Company's financial outlook and alternative investment options.
(c) In the three months ended December 31, 2025, the Company utilized approximately $22 million to repurchase shares of its common stock.
Limitation on Payment of Dividends
The declaration and payment of dividends by the Company is at the discretion of the Company’s Board of Directors. The Revolving Credit Facility and the Series 2025 Bonds Indentures include certain covenants limiting the Company’s ability to declare and pay dividends. See “Total Equity and Dividends” in Item 7 of this Report for additional information.
Equity Compensation Plan Information
See Part III, Item 12. “Security Ownership of Certain Beneficial Owners and Management and Related Stockholder Matters” for information relating to our equity compensation plans.
ITEM 6. [RESERVED]
ITEM 7. MANAGEMENT’S DISCUSSION AND ANALYSIS OF FINANCIAL CONDITION AND RESULTS OF OPERATIONS
The Company’s discussion and analysis includes a comparison of the year ended December 31, 2025 to the year ended December 31, 2024. A similar discussion and analysis that compares the year ended December 31, 2024 to the year ended December 31, 2023 may be found in Item 7, “Management’s Discussion and Analysis of Financial Condition and Results of Operations,” of our Annual Report on Form 10-K for the year ended December 31, 2024, which is incorporated herein by reference.
All amounts discussed are in millions of U.S. dollars, unless otherwise indicated. All tons discussed are on a clean coal equivalent basis.
Recent Developments
Merger
On January 14, 2025, the Company completed the Merger with Arch. Pursuant to the terms of the Merger Agreement, Merger Sub merged with and into Arch, with Arch continuing as the surviving corporation and as a wholly-owned subsidiary of the Company. See Note 2—Merger with Arch in the Notes to the Audited Consolidated Financial Statements in Item 8 of this Report for additional information.
Prior to the completion of the Merger, the Company consisted of two reportable segments, the PAMC segment and the Core Marine Terminal segment. Following completion of the Merger, the Company adjusted its internal reporting structure, and the Company’s chief operating decision maker (“CODM”) changed the manner in which he measures financial performance and allocates resources. Thus, the Company reassessed its reporting segments, and the Company now consists of four reportable segments: (1) the High CV Thermal segment; (2) the Metallurgical segment; (3) the Powder River Basin (“PRB”) segment; and (4) the Core Marine Terminal segment. Accordingly, the manner in which the Company reports its operations has been changed retrospectively, and all relevant prior period amounts have been recast to reflect this change.
Combustion-Related Activity at Leer South Mine
On January 13, 2025, a combustion-related activity was reported at the Leer South mine, located in Barbour County, West Virginia. The Company temporarily sealed the Leer South mine’s active longwall panel in order to extinguish such activity. The Company resumed development work with continuous miners in February 2025, and Company personnel and regulatory officials re-entered the sealed area of the mine on June 10, 2025. Thereafter, ventilation to the full mine was re-established, hydraulic pressure along the longwall face was restored and an extensive evaluation of the mine’s major equipment and infrastructure was conducted. As expected, the longwall suffered insignificant damage by the combustion event, and major components and systems remain in good condition. On June 26, 2025, the operating team found it necessary to evacuate the mine again and begin restoring pumpable seals to the affected area in the wake of an increase in carbon monoxide levels. In December 2025, the Company recovered the major longwall mining equipment, repositioned it and resumed longwall operations. Following the repositioning, the Company permanently sealed the affected area.
The Company incurred fire extinguishment and idle costs of $101 million at Leer South in 2025 for which it is pursuing recoveries under its relevant insurance policies. The Company’s initial advancement of insurance proceeds was $19.4 million. The Company will continue to pursue all avenues for additional recoveries.
One Big Beautiful Bill Act
On July 4, 2025, the One Big Beautiful Bill Act (the “OBBBA”) was signed into law by the President of the U.S. Several provisions included in the OBBBA are expected to benefit the Company, including language designating U.S.-produced metallurgical coal as a “critical material” under Internal Revenue Code Section 45X (Advanced Manufacturing Production Credit), through which the Company will be eligible for a 2.5% monetizable tax credit on production-related costs beginning in 2026 and sunsetting at the end of 2029. The Company is currently evaluating the OBBBA provisions, and the determination as to the applicability and extent of the OBBBA’s provisions on the Company’s future results of operations and cash flows will be dependent upon interpretations of the law and revenue rulings issued by the U.S. Treasury Department.
Executive Orders
President Trump issued a series of executive orders in April 2025 intended to reduce the regulatory burden on U.S. coal-based power plants and to ensure the long-term preservation of the U.S. coal fleet. The Trump Administration views the coal fleet as essential to the security, resilience and reliability of the U.S. power system. Reduction of regulatory burden allows for any impediments to domestic thermal coal demand to be challenged and possibly removed so that the Company could have an increased chance to sell more of its thermal coals specifically within the U.S. The executive orders help to further de-risk the domestic thermal market in the near term.
How We Evaluate Our Operations
Our management team uses a variety of financial and operating metrics to analyze our performance. These metrics are significant factors in assessing our operating results and profitability. The metrics include: (i) coal production and sales volumes; (ii) realized coal revenue, a non-GAAP financial measure; (iii) realized coal revenue per ton sold, an operating ratio derived from non-GAAP financial measures; (iv) cash cost of coal sold, a non-GAAP financial measure; (v) cash cost of coal sold per ton, an operating ratio derived from non-GAAP financial measures; (vi) cash margin per ton sold, an operating ratio derived from non-GAAP financial measures, defined as realized coal revenue per ton sold less cash cost of coal sold per ton; and (vii) adjusted EBITDA, a non-GAAP financial measure.
We believe that realized coal revenue and realized coal revenue per ton sold better reflect our revenue for the quality of coal sold and our operating results by including all income from coal sales. We believe cash cost of coal sold, cash cost of coal sold per ton and cash margin per ton sold normalize the volatility contained within comparable measures prepared in accordance with accounting principles generally accepted in the U.S. (“GAAP”) by adjusting for certain non-operating or non-cash transactions. We believe that adjusted EBITDA provides a helpful measure of comparing our operating performance with the performance of other companies that have different financing, capital structures and tax rates than ours.
Each of these non-GAAP measures are used as supplemental financial measures by management and by external users of our financial statements, such as investors, industry analysts, lenders and ratings agencies, to assess:
•our operating performance compared to the operating performance of other companies in the coal industry, without regard to financing methods, historical cost basis, tax rates or capital structure;
•the ability of our assets to generate sufficient cash flow;
•our ability to incur and service debt and fund capital expenditures;
•the viability of acquisitions and other capital expenditure projects and the returns on investment of various investment opportunities; and
•the attractiveness of capital projects and acquisitions and the overall rates of return on alternative investment opportunities.
These non-GAAP financial measures should not be considered an alternative to revenues, cost of sales, net income (loss) or any other measure of financial performance presented in accordance with GAAP. These measures exclude some, but not all, items that affect measures presented in accordance with GAAP, and these measures and the way we calculate them may vary from those of other companies. As a result, the items presented below may not be comparable to similarly titled measures of other companies.
Reconciliation of Non-GAAP Financial Measures
We define realized coal revenue as revenues reported in the Consolidated Statements of (Loss) Income less transportation costs, transloading revenues and other revenues not directly attributable to coal sales. We define realized coal revenue per ton sold as realized coal revenue divided by tons sold. The following tables present reconciliations by reportable segment of realized coal revenue and realized coal revenue per ton sold to revenues, the most directly comparable GAAP financial measure (in thousands, except per ton information):
|
|
|
|
|
|
|
|
|
|
|
|
|
|
|
|
|
|
|
|
|
|
|
|
|
|
|
|
|
|
|
|
|
|
|
|
|
|
|
|
|
|
|
Year Ended December 31, 2025 |
|
High CV Thermal |
|
Metallurgical |
|
PRB |
|
Core Marine Terminal |
|
Idle and Other |
|
Eliminations |
|
Consolidated |
| Revenues |
$ |
2,208,643 |
|
|
$ |
1,202,055 |
|
|
$ |
718,783 |
|
|
$ |
87,680 |
|
|
$ |
13,817 |
|
|
$ |
(66,203) |
|
|
$ |
4,164,775 |
|
| Less: Adjustments to Reconcile to Segment Realized Coal Revenue |
|
|
|
|
|
|
|
|
|
|
|
|
|
| Transportation Costs, including Intersegment Transportation Costs |
364,888 |
|
|
276,935 |
|
|
11,317 |
|
|
— |
|
|
— |
|
|
— |
|
|
653,140 |
|
| Intersegment Terminal Revenues |
— |
|
|
— |
|
|
— |
|
|
66,203 |
|
|
— |
|
|
(66,203) |
|
|
— |
|
| Non-Coal Revenues |
— |
|
|
— |
|
|
— |
|
|
21,477 |
|
|
13,817 |
|
|
— |
|
|
35,294 |
|
| Segment Realized Coal Revenue |
$ |
1,843,755 |
|
|
$ |
925,120 |
|
|
$ |
707,466 |
|
|
$ |
— |
|
|
$ |
— |
|
|
$ |
— |
|
|
$ |
3,476,341 |
|
| Tons Sold |
30,558 |
|
|
9,038 |
|
|
48,940 |
|
|
|
|
|
|
|
|
|
| Realized Coal Revenue per Ton Sold |
$ |
60.34 |
|
|
$ |
102.36 |
|
|
$ |
14.46 |
|
|
|
|
|
|
|
|
|
The following table presents a breakdown of the realized coal revenue per ton sold for the metallurgical segment between coking coal and thermal byproduct (in thousands, except per ton information):
|
|
|
|
|
|
|
|
|
|
|
|
|
|
|
|
|
|
|
Year Ended December 31, 2025 |
|
Coking Coal |
|
Thermal Byproduct |
|
Total Metallurgical Segment |
| Segment Realized Coal Revenue |
$ |
864,084 |
|
|
$ |
61,036 |
|
|
$ |
925,120 |
|
| Tons Sold |
7,585 |
|
|
1,453 |
|
|
9,038 |
|
| Realized Coal Revenue per Ton Sold |
$ |
113.91 |
|
|
$ |
42.03 |
|
|
$ |
102.36 |
|
|
|
|
|
|
|
|
|
|
|
|
|
|
|
|
|
|
|
|
|
|
|
|
|
|
|
|
|
|
|
|
|
|
|
|
|
|
|
|
|
|
|
|
Year Ended December 31, 2024 |
|
High CV Thermal |
|
Metallurgical (a) |
|
PRB |
|
Core Marine Terminal |
|
Idle and Other |
|
Eliminations |
|
Consolidated |
| Revenues |
$ |
2,004,567 |
|
|
$ |
113,067 |
|
|
$ |
— |
|
|
$ |
87,746 |
|
|
$ |
15,708 |
|
|
$ |
(56,682) |
|
|
$ |
2,164,406 |
|
| Less: Adjustments to Reconcile to Segment Realized Coal Revenue |
|
|
|
|
|
|
|
|
|
|
|
|
|
| Transportation Costs, including Intersegment Transportation Costs |
321,367 |
|
|
9,341 |
|
|
— |
|
|
— |
|
|
— |
|
|
— |
|
|
330,708 |
|
| Intersegment Terminal Revenues |
— |
|
|
— |
|
|
— |
|
|
56,682 |
|
|
— |
|
|
(56,682) |
|
|
— |
|
| Non-Coal Revenues |
— |
|
|
— |
|
|
— |
|
|
31,064 |
|
|
15,708 |
|
|
— |
|
|
46,772 |
|
| Segment Realized Coal Revenue |
$ |
1,683,200 |
|
|
$ |
103,726 |
|
|
$ |
— |
|
|
$ |
— |
|
|
$ |
— |
|
|
$ |
— |
|
|
$ |
1,786,926 |
|
| Tons Sold |
25,682 |
|
|
678 |
|
|
— |
|
|
|
|
|
|
|
|
|
| Realized Coal Revenue per Ton Sold |
$ |
65.54 |
|
|
$ |
153.10 |
|
|
$ |
— |
|
|
|
|
|
|
|
|
|
(a) For the year ended December 31, 2024, all revenues in the metallurgical segment were from coking coal.
We evaluate our cash cost of coal sold on an aggregate basis by segment and our cash cost of coal sold per ton on a per-ton basis. Cash cost of coal sold includes items such as direct operating costs, royalty and production taxes and direct administration costs, and excludes transportation costs, indirect costs, other costs not directly attributable to the production of coal and depreciation, depletion and amortization costs on production assets. We define cash cost of coal sold per ton as cash cost of coal sold divided by tons sold. The following tables present reconciliations by reportable segment of cash cost of coal sold and cash cost of coal sold per ton to cost of sales, the most directly comparable GAAP financial measure (in thousands, except per ton information):
|
|
|
|
|
|
|
|
|
|
|
|
|
|
|
|
|
|
|
|
|
|
|
|
|
|
|
|
|
|
|
|
|
|
|
|
|
|
|
|
|
|
|
Year Ended December 31, 2025 |
|
High CV Thermal |
|
Metallurgical |
|
PRB |
|
Core Marine Terminal |
|
Idle and Other |
|
Eliminations |
|
Consolidated |
| Cost of Sales |
$ |
1,628,537 |
|
|
$ |
1,227,710 |
|
|
$ |
654,918 |
|
|
$ |
30,841 |
|
|
$ |
69,014 |
|
|
$ |
(66,203) |
|
|
$ |
3,544,817 |
|
| Less: Adjustments to Reconcile to Segment Cash Cost of Coal Sold |
|
|
|
|
|
|
|
|
|
|
|
|
|
| Transportation Costs |
303,602 |
|
|
272,018 |
|
|
11,317 |
|
|
— |
|
|
— |
|
|
— |
|
|
586,937 |
|
| Intersegment Transportation Costs |
61,286 |
|
|
4,917 |
|
|
— |
|
|
— |
|
|
— |
|
|
(66,203) |
|
|
— |
|
| Cost of Sales from Idled Operations |
11,124 |
|
|
101,286 |
|
|
— |
|
|
— |
|
|
24,145 |
|
|
— |
|
|
136,555 |
|
| Insurance Reimbursements - Fire Costs |
— |
|
|
(19,350) |
|
|
— |
|
|
— |
|
|
— |
|
|
— |
|
|
(19,350) |
|
| Terminal Operating Costs |
— |
|
|
— |
|
|
— |
|
|
30,841 |
|
|
— |
|
|
— |
|
|
30,841 |
|
| Other Non-Active Mining Costs |
— |
|
|
— |
|
|
— |
|
|
— |
|
|
44,869 |
|
|
— |
|
|
44,869 |
|
| Segment Cash Cost of Coal Sold |
$ |
1,252,525 |
|
|
$ |
868,839 |
|
|
$ |
643,601 |
|
|
$ |
— |
|
|
$ |
— |
|
|
$ |
— |
|
|
$ |
2,764,965 |
|
| Tons Sold |
30,558 |
|
|
9,038 |
|
|
48,940 |
|
|
|
|
|
|
|
|
|
| Cash Cost of Coal Sold per Ton |
$ |
40.99 |
|
|
$ |
96.13 |
|
|
$ |
13.15 |
|
|
|
|
|
|
|
|
|
|
|
|
|
|
|
|
|
|
|
|
|
|
|
|
|
|
|
|
|
|
|
|
|
|
|
|
|
|
|
|
|
|
|
|
|
|
|
|
|
|
|
|
Year Ended December 31, 2024 |
|
High CV Thermal |
|
Metallurgical |
|
PRB |
|
Core Marine Terminal |
|
Idle and Other |
|
Eliminations |
|
Consolidated |
| Cost of Sales |
$ |
1,294,506 |
|
|
$ |
137,786 |
|
|
$ |
— |
|
|
$ |
27,372 |
|
|
$ |
28,450 |
|
|
$ |
(56,682) |
|
|
$ |
1,431,432 |
|
| Less: Adjustments to Reconcile to Segment Cash Cost of Coal Sold |
|
|
|
|
|
|
|
|
|
|
|
|
|
| Transportation Costs |
266,393 |
|
|
7,633 |
|
|
— |
|
|
— |
|
|
— |
|
|
— |
|
|
274,026 |
|
| Intersegment Transportation Costs |
54,974 |
|
|
1,708 |
|
|
— |
|
|
— |
|
|
— |
|
|
(56,682) |
|
|
— |
|
| Cost of Sales from Idled Operations |
— |
|
|
— |
|
|
— |
|
|
— |
|
|
4,859 |
|
|
— |
|
|
4,859 |
|
| Terminal Operating Costs |
— |
|
|
— |
|
|
— |
|
|
27,372 |
|
|
— |
|
|
— |
|
|
27,372 |
|
| Other Non-Active Mining Costs |
— |
|
|
— |
|
|
— |
|
|
— |
|
|
23,591 |
|
|
— |
|
|
23,591 |
|
| Segment Cash Cost of Coal Sold |
$ |
973,139 |
|
|
$ |
128,445 |
|
|
$ |
— |
|
|
$ |
— |
|
|
$ |
— |
|
|
$ |
— |
|
|
$ |
1,101,584 |
|
| Tons Sold |
25,682 |
|
|
678 |
|
|
— |
|
|
|
|
|
|
|
|
|
| Cash Cost of Coal Sold per Ton |
$ |
37.89 |
|
|
$ |
189.58 |
|
|
$ |
— |
|
|
|
|
|
|
|
|
|
We define adjusted EBITDA as (i) net income (loss) plus income taxes, net interest expense and depreciation, depletion and amortization, as adjusted for (ii) certain non-cash items, such as loss on debt extinguishment and (iii) other adjustments, such as stock-based compensation and Merger-related expenses. Adjusted EBITDA may also be adjusted for items that may not reflect the trend of future results by excluding transactions that are not indicative of our operating performance or that arise outside of the ordinary course of our business. The following tables present reconciliations by reportable segment of adjusted EBITDA to net income (loss), the most directly comparable GAAP financial measure (in thousands):
|
|
|
|
|
|
|
|
|
|
|
|
|
|
|
|
|
|
|
|
|
|
|
|
|
|
|
|
|
|
|
|
|
|
|
|
|
Year Ended December 31, 2025 |
|
High CV Thermal |
|
Metallurgical |
|
PRB |
|
Core Marine Terminal |
|
Other and Corporate |
|
Consolidated |
| Net Income (Loss) |
$ |
372,215 |
|
|
$ |
(278,537) |
|
|
$ |
30,688 |
|
|
$ |
51,218 |
|
|
$ |
(328,800) |
|
|
$ |
(153,216) |
|
| Income Tax Benefit |
— |
|
|
— |
|
|
— |
|
|
— |
|
|
(80,487) |
|
|
(80,487) |
|
| Interest Expense, net |
— |
|
|
— |
|
|
— |
|
|
— |
|
|
14,234 |
|
|
14,234 |
|
| Depreciation, Depletion and Amortization |
207,891 |
|
|
252,882 |
|
|
33,177 |
|
|
5,621 |
|
|
121,496 |
|
|
621,067 |
|
| Loss on Debt Extinguishment |
— |
|
|
— |
|
|
— |
|
|
— |
|
|
11,680 |
|
|
11,680 |
|
| Other Adjustments |
— |
|
|
— |
|
|
— |
|
|
— |
|
|
98,788 |
|
|
98,788 |
|
| Adjusted EBITDA |
$ |
580,106 |
|
|
$ |
(25,655) |
|
|
$ |
63,865 |
|
|
$ |
56,839 |
|
|
$ |
(163,089) |
|
|
$ |
512,066 |
|
|
|
|
|
|
|
|
|
|
|
|
|
|
|
|
|
|
|
|
|
|
|
|
|
|
|
|
|
|
|
|
|
|
|
|
|
|
Year Ended December 31, 2024 |
|
High CV Thermal |
|
Metallurgical |
|
PRB |
|
Core Marine Terminal |
|
Other and Corporate |
|
Consolidated |
| Net Income (Loss) |
$ |
537,064 |
|
|
$ |
(32,964) |
|
|
$ |
— |
|
|
$ |
55,485 |
|
|
$ |
(273,180) |
|
|
$ |
286,405 |
|
| Income Tax Expense |
— |
|
|
— |
|
|
— |
|
|
— |
|
|
44,242 |
|
|
44,242 |
|
| Interest Expense, net |
— |
|
|
— |
|
|
— |
|
|
— |
|
|
2,969 |
|
|
2,969 |
|
| Depreciation, Depletion and Amortization |
172,997 |
|
|
8,635 |
|
|
— |
|
|
4,889 |
|
|
37,005 |
|
|
223,526 |
|
| Other Adjustments |
— |
|
|
— |
|
|
— |
|
|
— |
|
|
98,346 |
|
|
98,346 |
|
|
|
|
|
|
|
|
|
|
|
|
|
| Adjusted EBITDA |
$ |
710,061 |
|
|
$ |
(24,329) |
|
|
$ |
— |
|
|
$ |
60,374 |
|
|
$ |
(90,618) |
|
|
$ |
655,488 |
|
Results of Operations: Year Ended December 31, 2025 Compared with the Year Ended December 31, 2024
Revenues
The Company’s revenues primarily include sales to customers of coal produced at our operations and, to a lesser extent, coal purchased from third parties. The Company’s revenues also include transloading services at the Port of Baltimore, as well as other revenues generated from customers.
Our presence in the metallurgical coal market has expanded through the Merger with two longwall mines and two continuous miner mines in West Virginia that produce a premium metallurgical product used in the global steel industry. We also gained two thermal surface mines in the Powder River Basin, as well as another thermal longwall mine in Colorado. The thermal surface mines produce thermal coal for sale into domestic and international markets, while the thermal longwall mine produces a high-quality, high calorific value thermal product that can compete effectively in seaborne markets.
Consolidated revenues in the year ended December 31, 2025 were $2.0 billion greater than the year ended December 31, 2024. As a result of the Merger, the legacy Arch operations contributed $2,048 million of revenues in the year ended December 31, 2025, primarily from coal sales in the Metallurgical and PRB segments. The revenues of legacy CONSOL’s PAMC decreased $32 million in the period-to-period comparison, primarily due to reduced realization, which was partially offset by higher sales tons. The revenues of legacy CONSOL’s Itmann mine decreased $16 million in the period-to-period comparison, primarily due to lower sales tons and reduced metallurgical coal benchmark pricing. The revenues of the Core Marine Terminal were flat compared to the prior year. See the discussion in “Operational Performance” below for further information about segment results.
Cost of Sales
Cost of sales includes items such as direct operating costs, royalty and production taxes, direct administration costs and transportation costs. Our consolidated cost of sales in the year ended December 31, 2025 increased $2.1 billion compared to the year ended December 31, 2024. As a result of the Merger, the legacy Arch operations incurred cost of sales of $2,025 million during the year ended December 31, 2025. Cost of sales at legacy CONSOL’s PAMC and the Itmann mine increased $63 million in the period-to-period comparison, primarily due to increased sales tons. Cost of sales at the Core Marine Terminal increased $3 million in the period-to-period comparison, primarily due to increased throughput volumes. See the discussion in “Operational Performance” below for further information about segment results. The remaining $23 million increase in the period-to-period comparison was the result of additional operating overhead and certain actuarial costs as well as costs incurred at the Company’s idled locations during the year ended December 31, 2025.
Depreciation, Depletion and Amortization
On a consolidated basis, depreciation, depletion and amortization costs were $621 million for the year ended December 31, 2025, compared to $224 million for the year ended December 31, 2024, resulting in a $398 million increase. The assets acquired in the Merger resulted in an additional $382 million of depreciation, depletion and amortization expense in the year ended December 31, 2025. See Note 2—Merger with Arch in the Notes to the Audited Consolidated Financial Statements in Item 8 of this Report for additional information. The remaining increase was primarily the result of additional capital expenditures at the legacy CONSOL operations and adjustments to the Company’s asset retirement obligations in the year ended December 31, 2025, none of which were individually material.
General and Administrative Costs
On a consolidated basis, general and administrative costs were $215 million for the year ended December 31, 2025, compared to $115 million for the year ended December 31, 2024. The $100 million increase in the period-to-period comparison was primarily due to $66 million of non-recurring Merger-related transaction costs, including fees paid to financial, legal and accounting advisors, severance and benefit costs, filing fees and debt restructuring costs. The remaining increase related to increased headcount as a combined company and an increase in long-term incentive compensation recognized related to award modifications due to the Merger. See Note 2—Merger with Arch in the Notes to the Audited Consolidated Financial Statements in Item 8 of this Report for additional information.
Other Operating Income and Expense, net
Other operating income and expense, net changed by $77 million in the period-to-period comparison due to the following items:
|
|
|
|
|
|
|
|
|
|
|
|
|
|
|
|
|
|
|
Year Ended December 31, |
|
2025 |
|
2024 |
|
Variance |
| Royalty Income - Non-Operated Coal |
$ |
31 |
|
|
$ |
18 |
|
|
$ |
13 |
|
| Insurance Proceeds |
25 |
|
|
9 |
|
|
16 |
|
| Gain on Sale of Assets |
7 |
|
|
7 |
|
|
— |
|
| Rental Income |
4 |
|
|
3 |
|
|
1 |
|
| Contract Assessments |
— |
|
|
15 |
|
|
(15) |
|
| 1974 UMWA Pension Plan Litigation |
— |
|
|
(68) |
|
|
68 |
|
| Land Holding and Administrative Costs |
(26) |
|
|
(9) |
|
|
(17) |
|
| Other |
(7) |
|
|
(18) |
|
|
11 |
|
| Total Other Operating Income and Expense, net |
$ |
34 |
|
|
$ |
(43) |
|
|
$ |
77 |
|
Approximately $11 million of the increase in royalty income was due to royalty agreements acquired in the Merger. The remaining increase was largely attributable to additional leased coal volumes related to overriding royalty agreements or coal reserve leases between the Company and third-party operators.
In 2025, the Company settled with insurance carriers related to a claim filed as a result of the Francis Scott Key Bridge collapse on March 26, 2024, which restricted vessel access to, and export capability from, the Core Marine Terminal. The $9 million in the prior year period represents an advance payment related to this claim.
There were no contract assessments during the year ended December 31, 2025. Contract assessment income during the year ended December 31, 2024 was primarily the result of penalties and fees levied against customers that did not meet the purchase obligations under their contracts with the Company.
The 1974 UMWA Pension Plan litigation expense of $68 million represents the net present value of payments to be made over a five-year period to the United Mine Workers of America 1974 Pension Plan in accordance with a partial motion for summary judgment filed by the Supreme Court of the State of Delaware on November 8, 2024.
Land holding and administrative costs increased primarily due to the acquisition of various coal leases and land holdings as a result of the Merger, which totaled $16 million for the year ended December 31, 2025.
Interest Expense and Interest Income
On a consolidated basis, interest expense was $40 million for the year ended December 31, 2025, compared to $22 million for the year ended December 31, 2024. The $18 million increase in the period-to-period comparison was primarily due to interest incurred on the Series 2025 Bonds, as well as interest incurred on additional equipment financing arrangements and increased fees associated with the Company’s Revolving Credit Facility as a result of the January 2025 amendment.
Interest income increased $7 million in the period-to-period comparison primarily as a result of increased cash and cash equivalents.
Loss on Debt Extinguishment
Loss on debt extinguishment of $12 million was recognized in the year ended December 31, 2025 due to the amendment of the Company’s Revolving Credit Facility and the refinancing of the Series 2025 Bonds. See Note 13—Long-Term Debt in the Notes to the Audited Consolidated Financial Statements in Item 8 of this Report for additional information.
Non-Service Related Pension and Postretirement Benefit Costs
Non-service related pension and postretirement benefit costs increased $8 million in the period-to-period comparison, primarily due to the Merger as well as the impact of changes in actuarial assumptions made at the beginning of each year.
Operational Performance: Year Ended December 31, 2025 Compared with the Year Ended December 31, 2024
The Company consists of four reportable segments: (1) the High CV Thermal segment; (2) the Metallurgical segment; (3) the PRB segment; and (4) the Core Marine Terminal segment. The High CV Thermal segment consists of the Company’s Pennsylvania Mining Complex and the West Elk mine located in Colorado. The Metallurgical segment consists of the Company’s Leer, Leer South, Beckley, Mountain Laurel and Itmann coal mines in West Virginia. The PRB segment consists of the Company’s Black Thunder and Coal Creek surface mining complexes located in Wyoming. The Core Marine Terminal segment consists of the Company’s coal export terminal operations in the Port of Baltimore.
The Company evaluates the performance of its segments utilizing Adjusted EBITDA and various productivity metrics. Adjusted EBITDA measures the operating performance of the Company’s segments and is used to allocate resources to the Company’s segments. The following table presents results by reportable segment:
|
|
|
|
|
|
|
|
|
|
|
|
|
|
|
|
|
|
|
Year Ended December 31, |
|
2025 |
|
2024 |
|
Variance |
| High CV Thermal Segment |
|
|
|
|
|
| Total Tons Produced (in millions) |
30.5 |
|
25.7 |
|
4.8 |
|
| Total Tons Sold (in millions) |
30.6 |
|
25.7 |
|
4.9 |
|
Realized Coal Revenue per Ton Sold (a) |
$ |
60.34 |
|
|
$ |
65.54 |
|
|
$ |
(5.20) |
|
Cash Cost of Coal Sold per Ton (a) |
$ |
40.99 |
|
|
$ |
37.89 |
|
|
$ |
3.10 |
|
Cash Margin per Ton Sold (a) |
$ |
19.35 |
|
|
$ |
27.65 |
|
|
$ |
(8.30) |
|
Adjusted EBITDA (in thousands) (a) |
$ |
580,106 |
|
|
$ |
710,061 |
|
|
$ |
(129,955) |
|
|
|
|
|
|
|
| Metallurgical Segment |
|
|
|
|
|
| Total Tons Produced (in millions) |
8.9 |
|
0.7 |
|
8.2 |
|
| Total Tons Sold (in millions) |
9.0 |
|
0.7 |
|
8.3 |
|
Realized Coal Revenue per Ton Sold (a) |
$ |
102.36 |
|
|
$ |
153.10 |
|
|
$ |
(50.74) |
|
Cash Cost of Coal Sold per Ton (a) |
$ |
96.13 |
|
|
$ |
189.58 |
|
|
$ |
(93.45) |
|
Cash Margin per Ton Sold (a) |
$ |
6.23 |
|
|
$ |
(36.48) |
|
|
$ |
42.71 |
|
Adjusted EBITDA (in thousands) (a) |
$ |
(25,655) |
|
|
$ |
(24,329) |
|
|
$ |
(1,326) |
|
|
|
|
|
|
|
| PRB Segment |
|
|
|
|
|
| Total Tons Produced (in millions) |
48.9 |
|
— |
|
|
48.9 |
|
| Total Tons Sold (in millions) |
48.9 |
|
— |
|
|
48.9 |
|
Realized Coal Revenue per Ton Sold (a) |
$ |
14.46 |
|
|
$ |
— |
|
|
$ |
14.46 |
|
Cash Cost of Coal Sold per Ton (a) |
$ |
13.15 |
|
|
$ |
— |
|
|
$ |
13.15 |
|
Cash Margin per Ton Sold (a) |
$ |
1.31 |
|
|
$ |
— |
|
|
$ |
1.31 |
|
Adjusted EBITDA (in thousands) (a) |
$ |
63,865 |
|
|
$ |
— |
|
|
$ |
63,865 |
|
|
|
|
|
|
|
| Core Marine Terminal Segment |
|
|
|
|
|
| Throughput Tons (in millions) |
18.1 |
|
17.0 |
|
1.1 |
|
Adjusted EBITDA (in thousands) (a) |
$ |
56,839 |
|
|
$ |
60,374 |
|
|
$ |
(3,535) |
|
(a) Realized coal revenue per ton sold, cash cost of coal sold per ton and cash margin per ton sold are operating ratios derived from non-GAAP financial measures, and Adjusted EBITDA is a non-GAAP financial measure. See “How We Evaluate Our Operations - Reconciliation of Non-GAAP Financial Measures” above for definitions and reconciliations of these amounts to the most directly comparable GAAP measures.
HIGH CV THERMAL SEGMENT ANALYSIS:
Adjusted EBITDA decreased $130 million in the period-to-period comparison, primarily due to a $5.20 decrease in realized coal revenue per ton sold as international markets continued to soften, which weighed on Newcastle prices, coupled with weak demand in Europe, which weighed on API2 pricing. The reduced realization was partially offset by a 1.6 million ton increase in PAMC sales volumes year-over-year. Additionally, the West Elk mine was acquired in the Merger, which resulted in additional sales volumes of 3.2 million tons, realized coal revenue of $165 million and cash cost of coal sold of $160 million in the year ended December 31, 2025. In the fourth quarter of 2025, the West Elk mine also incurred $11 million of idling and other costs during the transition period associated with its move to the B-Seam.
METALLURGICAL SEGMENT ANALYSIS:
All Metallurgical segment operations, except Itmann, were acquired in the Merger, resulting in additional sales volumes of 8.4 million tons, realized coal revenue of $837 million and cash cost of coal sold of $775 million in the year ended December 31, 2025. However, realized coal revenue per ton sold was significantly impacted by reduced metallurgical coal benchmark prices during the year ended December 31, 2025, which remained challenged due to surplus production within the industry and weak demand.
Adjusted EBITDA was also impacted by $101 million of fire and idling costs incurred during the year ended December 31, 2025 related to the combustion incident at the Leer South mine, partially offset by $19 million of insurance reimbursements.
PRB SEGMENT ANALYSIS:
The PRB segment operations were acquired in the Merger, and, as such, there was no activity during the year ended December 31, 2024. During the year ended December 31, 2025, the PRB segment produced and sold 48.9 million tons, which resulted in Adjusted EBITDA of $64 million.
CORE MARINE TERMINAL SEGMENT ANALYSIS:
Adjusted EBITDA for the year ended December 31, 2025 was $57 million, compared to $60 million for the year ended December 31, 2024. Throughput volumes at the Core Marine Terminal were 18.1 million tons for the year ended December 31, 2025, compared to 17.0 million tons for the year ended December 31, 2024. Core Marine Terminal revenue and costs were $88 million and $31 million, respectively, for the year ended December 31, 2025, compared to $88 million and $27 million, respectively, for the year ended December 31, 2024. The expected benefit of the increased throughput tons in the year ended December 31, 2025 was offset by lower pricing, which resulted in flat revenue and higher expenses compared to the prior year.
Critical Accounting Estimates
The preparation of financial statements in conformity with GAAP requires management to make judgments, estimates and assumptions that affect reported amounts of assets and liabilities, revenues and expenses and related disclosure of contingent assets and liabilities. See Note 1—Significant Accounting Policies in the Notes to the Audited Consolidated Financial Statements in Item 8 of this Report for further discussion. The Company bases its estimates on historical experience and on various other assumptions that it believes are reasonable under the circumstances, the results of which form the basis for making the judgments about the carrying values of assets and liabilities that are not readily apparent from other sources. The Company evaluates its estimates on an on-going basis. Actual results could differ from those estimates upon subsequent resolution of identified matters. Management believes that the estimates utilized are reasonable. The following critical accounting policies are materially impacted by judgments, assumptions and estimates used in the preparation of the Consolidated Financial Statements in Item 8 of this Report.
Asset Retirement Obligations
The SMCRA established operational, reclamation and closure standards for all aspects of surface mining as well as most aspects of deep mining. The Company accrues for the costs of current coal mine disturbance and final coal mine and gas well closure, including the cost of treating mine water discharge where necessary. Estimates of the Company’s total asset retirement obligations, which are based upon permit requirements and Company engineering expertise related to these requirements, including the current portion, were approximately $535 million at December 31, 2025. This liability is reviewed annually, or when events and circumstances indicate an adjustment is necessary, by Company management and engineers. The estimated liability can significantly change if actual costs vary from assumptions or if governmental regulations change significantly.
Accounting for asset retirement obligations requires that the fair value of an asset retirement obligation be recognized in the period in which it is incurred if a reasonable estimate of fair value can be made. For active locations, the present value of the estimated asset retirement obligations is capitalized as part of the carrying amount of the long-lived asset. For locations that have been fully depleted or closed, the present value of a change in the estimated value of the obligation is recorded directly to earnings. Asset retirement obligations primarily relate to the reclamation of land upon mine closure, the treatment of mine water discharge where necessary and the plugging of gas wells acquired for mining purposes. Changes in the assumptions used to calculate the liabilities can have a significant effect on the asset retirement obligations. The amounts of assets and liabilities recorded are dependent upon a number of variables, including the estimated future expenditures, estimated mine lives, assumptions involving inflation rates and the assumed credit-adjusted risk-free interest rate.
Accounting for asset retirement obligations also requires depreciation of the capitalized asset retirement obligation and accretion of the asset retirement obligation over time. The depreciation will generally be determined on a units-of-production basis, whereas accretion will be recognized until the reclamation obligations are satisfied.
The Company believes that the accounting estimates related to asset retirement obligations are “critical accounting estimates” because the Company must assess the expected amount and timing of asset retirement obligations. In addition, the Company must determine the estimated present value of future liabilities.
Future results of operations for any particular quarterly or annual period could be materially affected by changes in the Company’s assumptions.
Income Taxes
Deferred tax assets and liabilities are recognized using enacted tax rates for the estimated future tax effects of temporary differences between the book and tax basis of recorded assets and liabilities. Deferred tax assets are reduced by a valuation allowance if it is more likely than not that some portion of the deferred tax asset will not be realized. At December 31, 2025, the Company had deferred tax liabilities in excess of deferred tax assets of approximately $130 million.
The Company evaluates all tax positions taken on the federal and state tax filings to determine if the position is more likely than not to be sustained upon examination. For positions that meet the more likely than not to be sustained criteria, an evaluation to determine the largest amount of benefit, determined on a cumulative probability basis, that is more likely than not to be realized upon ultimate settlement is determined. A previously recognized tax position is reversed when it is subsequently determined that a tax position no longer meets the more likely than not threshold to be sustained. The evaluation of the sustainability of a tax position and the probable amount that is more likely than not is based on judgment, historical experience and on various other assumptions that the Company believes are reasonable under the circumstances. The results of these estimates that are not readily apparent from other sources form the basis for recognizing an uncertain tax position. Actual results could differ from those estimates upon subsequent resolution of identified matters. At December 31, 2025, the Company had uncertain tax positions totaling $6 million, which reduced gross deferred tax assets. There were no amounts recorded for uncertain tax positions at December 31, 2024.
The Company believes that accounting estimates related to income taxes are “critical accounting estimates” because the Company must assess the likelihood that deferred tax assets will be recovered from future taxable income and exercise judgment regarding the amount of financial statement benefit to record for uncertain tax positions. When evaluating whether a valuation allowance must be established on deferred tax assets, the Company exercises judgment in determining whether it is more likely than not that some portion or all of the deferred tax assets will not be realized. The Company considers all available evidence, both positive and negative, to determine whether, based on the weight of the evidence, a valuation allowance is needed, including carrybacks, tax planning strategies, reversal of deferred tax assets and liabilities and forecasted future taxable income. In making the determination related to uncertain tax positions, the Company considers the amounts and probabilities of the outcomes that could be realized upon ultimate settlement of an uncertain tax position using the facts, circumstances and information available at the reporting date to establish the appropriate amount of financial statement benefit. To the extent that an uncertain tax position or valuation allowance is established or increased or decreased during a period, the Company must include an expense or benefit within tax expense in the income statement. Future results of operations for any particular quarterly or annual period could be materially affected by changes in the Company’s assumptions. At December 31, 2025, the Company had a valuation allowance of $75 million. No valuation allowance was recorded at December 31, 2024.
Impairment of Long-Lived Assets
The Company reviews the carrying value of its long-lived assets whenever events or changes in circumstances indicate that the carrying amount may not be recoverable. Long-lived assets are not reviewed for impairment unless an impairment indicator is noted. Examples of impairment indicators include:
•a significant decrease in the market price of a long-lived asset;
•a significant adverse change in the extent or manner in which a long-lived asset is being used or in its physical condition;
•a significant adverse change in legal factors or in the business climate that could affect the value of a long-lived asset, including an adverse action of assessment by a regulator;
•an accumulation of costs significantly in excess of the amount originally expected for the acquisition or construction of a long-lived asset;
•a current period operating or cash flow loss combined with a history of operating or cash flow losses or a projection or forecast that demonstrates continuing losses associated with the use of a long-lived asset; or
•a current expectation that, more likely than not, a long-lived asset will be sold or otherwise disposed of significantly before the end of its previously estimated useful life. The term more likely than not refers to a level of likelihood that is more than 50%.
The above factors are not comprehensive, and management routinely evaluates whether impairment indicators are present. If one or more of the above events or changes in circumstances occur, the Company performs a recoverability test, which compares the projected undiscounted cash flows from the use and eventual disposition of a long-lived asset or asset group to its carrying value. Individual assets are grouped for impairment review purposes based on the lowest level for which identifiable cash flows are largely independent of the cash flows of other groups of assets.
If the carrying value of a long-lived asset exceeds the future undiscounted cash flows expected from the asset, the amount of impairment recorded is measured as the difference between the asset’s carrying value and the estimated fair value of the asset, determined using discounted future cash flows. The fair value of impaired assets is typically determined based on various factors, including the present values of expected future cash flows using a risk-adjusted discount rate, the marketability of coal properties and the estimated fair value of assets that could be sold or used at other operations.
Assumptions about sales, operating margins, capital expenditures and sales prices are based on the Company’s forecasts, business plans, economic projections, and anticipated future cash flows. No indicators of impairment were present and, therefore, no impairment losses were recorded during the years ended December 31, 2025, 2024 and 2023.
Business Combinations
The Company accounts for business combinations using the acquisition method of accounting, which requires that once control is obtained, all the assets acquired and liabilities assumed are recorded at their respective fair values at the date of acquisition. The determination of fair values of identifiable assets and liabilities requires estimates and the use of valuation techniques when fair value is not readily available and requires a significant amount of management judgment. Although the Company believes its estimates of fair values are reasonable, actual financial results could differ from those estimates due to the inherent uncertainty involved in making such estimates. Changes in assumptions concerning future financial results or other underlying assumptions could have a significant impact on the determination of fair value of the assets acquired in the Merger. During the measurement period (a period not to exceed 12 months from the closing date of the Merger), the Company may record adjustments to the assets acquired and liabilities assumed due to the use of preliminary information in its initial estimates. Upon the conclusion of the measurement period, any subsequent adjustments are recorded to earnings.
Liquidity and Capital Resources
The Company's potential sources of liquidity include cash generated from operating activities, cash on hand, borrowings under the Revolving Credit Facility and Receivables Financing Agreement (which are discussed and defined below) and, if necessary, the ability to issue equity or debt securities. The Company believes that cash generated from these sources, without needing to issue equity or debt securities, will be sufficient to meet its short-term working capital requirements, long-term capital expenditure requirements and debt servicing obligations, as well as to provide required letters of credit or surety bonds necessary for the Company's operations.
On January 14, 2025, the Company completed the Merger with Arch pursuant to the Merger Agreement. In connection with the Merger, the Company entered into an amendment to its existing Revolving Credit Facility. The amendment increased the available revolving commitments from $355 million to $600 million and extended the scheduled maturity date of the Revolving Credit Facility to April 30, 2029, providing that, under specified conditions, the maturity of the Revolving Credit Facility may be earlier. Additionally, the Company reduced the interest rate margin by 75 basis points while further enhancing financial flexibility.
Our total liquidity as of December 31, 2025 was comprised of the following:
|
|
|
|
|
|
| (in millions) |
December 31, 2025 |
| Cash and Cash Equivalents |
$ |
432 |
|
| Receivables Financing Agreement - Current Availability |
185 |
|
| Revolving Credit Facility - Current Availability |
600 |
|
| Less: Letters of Credit Outstanding |
(268) |
|
| Total Liquidity |
$ |
949 |
|
Events that negatively impact our operations, overall financial condition and liquidity could result in our inability to comply with the Revolving Credit Facility's financial covenants. This could limit our ability to borrow under the Revolving Credit Facility if we are unable to obtain necessary waivers or amendments. The Company expects to maintain adequate liquidity through its net cash provided by operating activities and cash and cash equivalents on hand, as well as the Revolving Credit Facility and its Receivables Financing Agreement, to fund its working capital needs and capital expenditures in the short-term and long-term.
Uncertainty in the financial markets, tariffs and executive actions by the executive branch of the U.S. Government and certain other foreign nations or sovereignties bring additional potential risks to the Company. These risks could impact our ability to raise capital in the equity and debt markets or result in higher costs to obtain additional capital or credit, as well as increase potential counterparty defaults.
In addition, market disruptions and uncertainty, including as a result of potential tariffs and executive actions, high interest rates and sustained high inflation, may impact the Company's revenues and collection of trade receivables. The Company regularly monitors the creditworthiness of its customers and counterparties and manages credit exposure through payment terms, credit limits, prepayments and security.
The global landscape on rates and the scope of tariffs imposed on goods imported into and out of the U.S. from multiple countries around the world continues to evolve and be uncertain, as the U.S. Government continues to negotiate its position with multiple countries and across various industries and goods. While the evolving global trade landscape relating to tariffs and retaliatory trade measures imposed by other countries on U.S. goods has not yet had a significant impact on our business or results of operations as of December 31, 2025, this and the potential for additional changes in U.S. or international trade policy have increased uncertainty regarding the ultimate effect of the tariffs on economic conditions and could lead to further weakened business conditions for the coal industry.
Over the past few years, the insurance and surety markets have been increasingly challenging, particularly for coal companies. We have experienced rising premiums, reduced coverage and fewer providers willing to underwrite policies and surety bonds. Terms have become generally unfavorable, including increases in the amount of collateral required to secure surety bonds. However, more recently, we have seen insurance rates and collateral requirements stabilize and even decrease on certain lines of coverage, as new insurance carriers have entered the market. Further cost burdens on our ability to maintain adequate insurance and bond coverage may adversely impact our operations, financial position and liquidity.
At December 31, 2025, the Company had a $132 million fund in place that will cover, in part, future reclamation costs of the thermal assets in the PRB. Additionally, the Company maintains a $17 million Global Water Treatment Trust Fund that will fund future water treatment obligations in Pennsylvania, as well as replace surety bonds and related collateral requirements. The Company expects to continue to contribute a minimum of $2 million per year to the Global Water Treatment Trust Fund. These amounts are included in Funds for Asset Retirement Obligations on the Consolidated Balance Sheets.
In December 2024, the Office of Workers' Compensation Programs (the “OWCP”) issued a final rule revising the regulations under the Black Lung Benefits Act related to self-insurance by coal mine operators. Under the new standard, self-insured coal mine operators are required to post additional security for the Black Lung benefit liabilities. The final rule requires a security amount equal to 100% of a self-insured operator's projected black lung liabilities. The rule became effective on January 13, 2025, and operators were required to remit the increased security amount within one year. The final rule, including any assessments, is subject to appeal. In February 2025, the Company received letters from the OWCP that additional guidance regarding the final rule will be provided at a future date.
The Company participates in the UMWA Combined Benefit Fund and the 1992 Benefit Plan for which benefits are reflected in the Company’s consolidated financial statements when paid. These benefit arrangements may result in additional liabilities that are not recognized on the Consolidated Balance Sheet at December 31, 2025. The various multi-employer benefit plans are discussed in Note 17—Other Employee Benefit Plans in the Notes to the Audited Consolidated Financial Statements in Item 8 of this Report. The Company’s total contributions under the Coal Industry Retiree Health Benefit Act of 1992 were $3 million and $3 million for the years ended December 31, 2025 and 2024, respectively. Based on available information at December 31, 2025, the Company’s aggregate obligation for the UMWA Combined Benefit Fund and 1992 Benefit Plan is estimated to be approximately $30 million. The Company also uses a combination of surety bonds, corporate guarantees and letters of credit to secure its financial obligations for employee-related, environmental, performance and various other items which are not reflected on the Consolidated Balance Sheet at December 31, 2025. Management believes these items will expire without being funded. See Note 22—Commitments and Contingent Liabilities in the Notes to the Audited Consolidated Financial Statements in Item 8 of this Report for additional details of the various financial guarantees that have been issued by the Company.
Cash Flows (in millions)
|
|
|
|
|
|
|
|
|
|
|
|
|
|
|
|
|
|
|
Year Ended December 31, |
|
2025 |
|
2024 |
|
Variance |
| Net Cash Provided by Operating Activities |
$ |
306 |
|
|
$ |
476 |
|
|
$ |
(170) |
|
| Net Cash Provided by (Used in) Investing Activities |
$ |
48 |
|
|
$ |
(165) |
|
|
$ |
213 |
|
| Net Cash Used in Financing Activities |
$ |
(200) |
|
|
$ |
(107) |
|
|
$ |
(93) |
|
Net cash provided by operating activities decreased $170 million in the period-to-period comparison primarily due to the payment of non-recurring Merger-related expenditures in the year ended December 31, 2025.
Net cash provided by (used in) investing activities changed by $213 million in the period-to-period comparison primarily due to cash acquired in the Merger, partially offset by the purchase of Arch’s tax-exempt bonds. The Company liquidated its remaining U.S. Treasury securities during the year ended December 31, 2025, resulting in net proceeds of $75 million. Capital expenditures increased $107 million primarily due to $90 million of expenditures for operations acquired in the Merger during the year ended December 31, 2025.
Net cash used in financing activities increased $93 million in the period-to-period comparison. Cash outflows related to share repurchases totaled $224 million in the year ended December 31, 2025 compared to $71 million in the year ended December 31, 2024. In connection with the Merger, the Company amended its Revolving Credit Facility, refinanced its tax-exempt bonds and amended the legacy Arch securitization facility. Proceeds of $114 million were received in connection with the bond refinancing, and fees associated with these transactions totaled $20 million. Additionally, dividend payments increased $10 million year-over-year.
Revolving Credit Facility
In November 2017, the Company entered into a revolving credit facility with PNC Bank, N.A. (“PNC”) (as amended, the “Revolving Credit Facility”). The Revolving Credit Facility has been amended several times, the most recent of which occurred in January 2025 in connection with the Merger. The January 2025 amendment increased the available revolving commitments from $355 million to $600 million and extended the scheduled maturity date to April 30, 2029, provided that, if any of the MEDCO Bonds or PEDFA Bonds (as defined below) and any subsequent refinancings thereof remain outstanding 91 days prior to their stated maturity and our specified liquidity, as measured under the Revolving Credit Facility, is less than $250 million at that time, the maturity date of the Revolving Credit Facility will be such date. Additionally, the Company reduced the applicable interest rate margin on its borrowings and letters of credit under the Revolving Credit Facility by 75 basis points.
Borrowings under the Revolving Credit Facility may be used for general corporate purposes, including working capital, capital expenditures and permitted acquisitions. Amounts repaid under the Revolving Credit Facility may be reborrowed, subject to satisfaction of the conditions to each credit extension. The Revolving Credit Facility provides that up to the full amount of the facility may be used for the issuance of letters of credit (the “Letters of Credit”) by each lender under the Revolving Credit Facility, including Arch letters of credit that are deemed to be issued under the Revolving Credit Facility. The Company may increase the revolving credit commitments on the same terms or incur term “A” loans, in each case in an aggregate amount of up to $150 million.
Borrowings under the Revolving Credit Facility bear interest at a floating rate that is, at the Company’s option, either (i) the applicable term Secured Overnight Financing Rate (“SOFR”) plus a SOFR adjustment of 0.10% plus an applicable margin or (ii) an alternate base rate plus an applicable margin. The applicable margin for the Revolving Credit Facility ranges from 3.00% to 3.75% (for SOFR loans) and 2.00% to 2.75% (for alternate base rate loans), depending on the total net leverage ratio.
The Company’s obligations under the Revolving Credit Facility are fully and unconditionally guaranteed by subsidiaries of the Company that own any portion of the Company’s Pennsylvania Mining Complex, its marine terminal at the Port of Baltimore and specified coal reserves and, subject to certain customary exceptions, all other existing or future direct or indirect wholly-owned material restricted subsidiaries of the Company, including subsidiaries acquired pursuant to the Merger. The obligations under the Revolving Credit Facility are secured by, subject to certain exceptions (including a limitation on pledges of equity interests in certain subsidiaries and certain thresholds with respect to real property), a first-priority lien on the Company's and certain subsidiaries' significant assets.
The Revolving Credit Facility contains a number of customary affirmative covenants and a number of negative covenants, including (subject to certain exceptions) limitations on (among other things): indebtedness, liens, investments, acquisitions, asset dispositions, restricted payments, mergers, consolidations, divisions and other fundamental changes, transactions with affiliates and prepayments of junior indebtedness. The Revolving Credit Facility requires prepayment of Revolving Credit Loans and Swing Loans if (x) Excess Balance Sheet Cash is greater than $125 million and (y) the sum of Revolving Credit Loans, Swing Loans and Letter of Credit Obligations (other than in respect of undrawn Letters of Credit) is greater than 25% of the Revolving Credit Commitments, in each case as of the last day of any calendar month.
The Revolving Credit Facility also includes financial covenants, including (i) a maximum first lien gross leverage ratio, (ii) a maximum total net leverage ratio, and (iii) a minimum interest coverage ratio. Under the Revolving Credit Facility, the maximum first lien gross leverage ratio is 1.50 to 1.00, the maximum total net leverage ratio is 2.50 to 1.00 and the minimum interest coverage ratio is 3.00 to 1.00. The Revolving Credit Facility contains customary events of default, including failure to make payments when due, cross-default and cross-judgment default and certain bankruptcy and insolvency events.
The Company's first lien gross leverage ratio was 0.28 to 1.00 at December 31, 2025. The Company's total net leverage ratio was 0.03 to 1.00 at December 31, 2025. The Company's interest coverage ratio was 35.10 to 1.00 at December 31, 2025. The Company was in compliance with all covenants under the Revolving Credit Facility as of December 31, 2025.
At December 31, 2025, there were no borrowings outstanding under the Revolving Credit Facility. The Revolving Credit Facility is currently only used for providing letters of credit, with $110 million of letters of credit outstanding, leaving $490 million of unused capacity. From time to time, the Company is required to post financial assurances to satisfy contractual and other requirements generated in the normal course of business. Some of these assurances are posted to comply with federal, state or other government agencies’ statutes and regulations. The Company sometimes uses letters of credit to satisfy these requirements, and these letters of credit reduce the Company’s borrowing facility capacity.
Receivables Financing Agreement
Certain U.S. subsidiaries of the Company are parties to a trade accounts receivable securitization facility with financial institutions for the sale on a continuous basis of eligible trade accounts receivable. On July 28, 2025, the Company and certain of its subsidiaries entered into (i) that certain Receivables Financing Agreement (the “Receivables Financing Agreement”), by and among Core Receivable Company, LLC, as borrower (“Core Receivable”), Core Sales, LLC, as the initial servicer (the “Servicer”), PNC, as administrative agent and LC bank, PNC Capital Markets LLC (“PNC CM”), as structuring agent, and the lenders from time to time party thereto; (ii) that certain Third Amended and Restated Sale and Contribution Agreement (the “Sale and Contribution Agreement”), by and among Core Receivable, the Servicer and Arch, as transferor; (iii) that certain Third Amended and Restated Purchase and Sale Agreement (the “Purchase and Sale Agreement”), by and among Arch, the Servicer and the originators party thereto; and (iv) that certain Fifth Amended and Restated Performance Guaranty (the “Performance Guaranty” and, together with the Receivables Financing Agreement, the Sale and Contribution Agreement and the Purchase and Sale Agreement, the “Receivables Documents”), by the Company, in favor of PNC as administrative agent. With entry into the Receivables Documents, legacy Arch’s securitization facility was amended and restated in its entirety to, among other things, consolidate facilities and extend the maturity date to July 27, 2028, and legacy CONSOL’s securitization facility was terminated effective July 28, 2025.
Pursuant to the Receivables Documents, Core Sales, LLC; Mingo Logan Coal LLC; Mountain Coal Company, L.L.C.; ICG Beckley, LLC; ICG Tygart Valley, LLC; Wolf Run Mining LLC; Thunder Basin Coal Company, L.L.C.; CONSOL Pennsylvania Coal Company LLC; Core Marine Terminals LLC; and Itmann Mining Company LP, all wholly-owned subsidiaries of the Company, sell or contribute trade receivables to Core Receivable, a special purpose vehicle and wholly-owned subsidiary of the Company. Core Receivable, in turn, pledges its interests in the receivables to PNC and Regions Bank, each of which either makes loans or issues letters of credit on behalf of Core Receivable. The maximum amount of advances and letters of credit outstanding under the Receivables Financing Agreement may not exceed $250 million.
Loans under the Receivables Financing Agreement accrue interest at a reserve-adjusted market index rate equal to the applicable term SOFR rate plus ten basis points. Loans and letters of credit under the Receivables Financing Agreement also accrue a drawn fee and a letter of credit participation fee, respectively, of 2.00% per annum. In connection with the Receivables Financing Agreement, Core Receivable paid certain structuring fees to PNC CM and pays other customary fees to the lenders, including a fee on unused commitments equal to 0.60% per annum.
The Receivables Documents contain various customary representations and warranties, covenants and default provisions that provide for the termination and acceleration of the commitments and loans under the Receivables Financing Agreement in certain circumstances including, but not limited to, failure to make payments when due, breach of representation, warranty or covenant, certain insolvency events or failure to maintain the security interest in the trade receivables, and defaults under other material indebtedness. The Company guarantees the performance of the obligations of Arch; Core Sales, LLC; Mingo Logan Coal LLC; Mountain Coal Company, L.L.C.; ICG Beckley, LLC; ICG Tygart Valley, LLC; Wolf Run Mining LLC; Thunder Basin Coal Company, L.L.C.; CONSOL Pennsylvania Coal Company LLC; Core Marine Terminals LLC; and Itmann Mining Company LP under the securitization, and will guarantee the obligations of any additional originators or successor servicer that may become party to the Receivables Financing Agreement. However, neither the Company nor its affiliates will guarantee collectability of receivables or the creditworthiness of obligors thereunder.
At December 31, 2025, eligible accounts receivable yielded $185 million of borrowing capacity. At December 31, 2025, the Receivables Financing Agreement had no outstanding borrowings and approximately $158 million of letters of credit outstanding, leaving $27 million of unused capacity. The Company has not derecognized any receivables due to its continued involvement in the collections efforts.
Series 2025 Bonds
On March 27, 2025, the Company borrowed the proceeds of tax-exempt bonds issued by (i) the Pennsylvania Economic Development Financing Authority (“PEDFA”) in the aggregate principal amount of $98 million (the “PEDFA Bonds”), at a fixed rate of 5.45% for an initial term of ten years on an unsecured basis, pursuant to a Bond Purchase Agreement, dated March 19, 2025, by and among Jefferies LLC, as the representative acting on behalf of itself, KeyBanc Capital Markets Inc., PNC CM, Goldman Sachs & Co. LLC, B. Riley Securities, Inc. and TCBI Securities, Inc. (collectively, the “Underwriters”), PEDFA and the Company; (ii) the Maryland Economic Development Corporation (“MEDCO”) in the aggregate principal amount of $103 million (the “MEDCO Bonds”), at a fixed rate of 5.00% for an initial term of ten years on an unsecured basis, pursuant to a Bond Purchase Agreement, dated March 19, 2025, by and among the Underwriters, MEDCO and the Company; and (iii) the West Virginia Economic Development Authority (“WVEDA”) in the aggregate principal amount of $106 million (the “WVEDA Bonds” and together with the PEDFA Bonds and the MEDCO Bonds, the “Series 2025 Bonds”), at a fixed rate of 5.45% for an initial term of ten years on an unsecured basis, pursuant to a Bond Purchase Agreement, dated March 19, 2025, by and among the Underwriters, WVEDA and the Company.
The Company used (i) a portion of the proceeds of the PEDFA Bonds to finance and refinance the costs of acquisition, construction, improvement, installation and equipping of certain solid waste disposal facilities located at the Central Preparation Plant in West Finley, Pennsylvania in part by refunding in full PEDFA’s outstanding $75 million Solid Waste Disposal Revenue Bonds, Series 2021A (CONSOL Energy Inc. Project), (ii) the proceeds from the MEDCO Bonds to refinance the costs of acquisition, construction, improvement, installation and equipping of certain improvements, modifications and additions to a coal transshipment terminal located in the Canton area of the Port of Baltimore by refunding in full MEDCO’s outstanding $103 million Port Facilities Refunding Revenue Bonds (CNX Marine Terminals Inc. Port of Baltimore Facility) Series 2010 and (iii) a portion of the proceeds of the WVEDA Bonds to finance and refinance the costs of acquisition, construction, improvement, installation and equipping of certain solid waste disposal facilities relating to a longwall coal mining complex known as the Leer South Mine located in Barbour County, West Virginia in part by refunding in full WVEDA’s outstanding $53 million Solid Waste Disposal Facility Revenue Bonds (Arch Resources Project), Series 2020 and $45 million Solid Waste Disposal Facility Revenue Bonds (Arch Resources Project), Series 2021.
The (i) PEDFA Bonds were issued pursuant to an indenture (the “PEDFA Indenture”), dated March 1, 2025, by and between PEDFA and Wilmington Trust, National Association, as trustee (the “Trustee”), and PEDFA made a loan of the proceeds of the PEDFA Bonds to the Company pursuant to a Loan Agreement, dated March 1, 2025 (the “PEDFA Loan Agreement”), between PEDFA and the Company; (ii) MEDCO Bonds were issued pursuant to an indenture (the “MEDCO Indenture”), dated March 1, 2025, by and between MEDCO and the Trustee, and MEDCO made a loan of the proceeds of the MEDCO Bonds to the Company pursuant to a Loan Agreement, dated March 1, 2025 (the “MEDCO Loan Agreement”), between MEDCO and the Company; and (iii) WVEDA Bonds were issued pursuant to an indenture (the “WVEDA Indenture” and together with the PEDFA Indenture and the MEDCO Indenture, the “Series 2025 Bonds Indentures”), dated March 1, 2025, by and between WVEDA and the Trustee, and WVEDA made a loan of the proceeds of the WVEDA Bonds to the Company pursuant to a Loan Agreement, dated as of March 1, 2025 (the “WVEDA Loan Agreement” and together with the PEDFA Loan Agreement and MEDCO Loan Agreement, the “Loan Agreements”), between WVEDA and the Company. Under the terms of the Loan Agreements, the Company agreed to make all payments of principal, interest and other amounts at any time due on the respective Series 2025 Bonds or under the respective Series 2025 Bonds Indentures.
Material Cash Requirements
The Company expects to make the following payments in the next 12 months:
•$122 million on its long-term debt and operating and finance lease obligations, including interest (refer to Note 13—Long-Term Debt and Note 14—Leases for additional information);
•$69 million on its employee-related long-term liabilities, including obligations that the Company has under multi-employer plans (refer to Note 15—Pension and Other Postretirement Benefit Plans and Note 16—Coal Workers' Pneumoconiosis and Workers' Compensation for additional information); and
•$97 million on its environmental obligations and $179 million on its other current liabilities.
The Company believes it will be able to satisfy these material cash requirements with cash generated from operating activities, cash on hand, borrowings under the Revolving Credit Facility and Receivables Financing Agreement and, if necessary, cash generated from its ability to issue equity or debt securities.
Debt
At December 31, 2025, the Company had total long-term debt and finance lease obligations of $459 million outstanding, including the current portion of $98 million. This long-term debt consisted of:
•An aggregate principal amount of $106 million of WVEDA Bonds, which were issued to finance a coal refuse disposal area at the Leer South mine, bear interest at 5.45% per annum for an initial term of ten years and mature in January 2055. Interest on the WVEDA Bonds is payable on April 1 and October 1 of each year.
•An aggregate principal amount of $103 million of MEDCO Bonds, which were issued to finance the Core Marine Terminal, bear interest at 5.00% per annum for an initial term of ten years and mature in July 2048. Interest on the MEDCO Bonds is payable on February 1 and August 1 of each year.
•An aggregate principal amount of $98 million of PEDFA Bonds, which were issued to finance the ongoing expansion of the coal refuse disposal area at the Central Preparation Plant, bear interest at 5.45% per annum for an initial term of ten years and mature in January 2051. Interest on the PEDFA Bonds is payable on June 1 and December 1 of each year.
•An aggregate principal amount of $80 million of various equipment financing arrangements with a weighted-average interest rate of 7.55%.
•An aggregate principal amount of $58 million of finance leases with a weighted-average interest rate of 6.60%.
•Advanced royalty commitments of $11 million with a weighted-average interest rate of 8.04% per annum.
•An aggregate principal amount of $3 million of other debt arrangements.
At December 31, 2025, the Company had no borrowings outstanding and approximately $110 million of letters of credit outstanding under the $600 million Revolving Credit Facility. At December 31, 2025, the Company had no borrowings outstanding and approximately $158 million of letters of credit outstanding under the Receivables Financing Agreement.
Stock Repurchases
On February 18, 2025, the Company’s Board of Directors approved a capital return framework that involves a mix of dividends and share repurchases. The repurchase program permits the repurchase, from time to time, of the Company’s outstanding shares of common stock in an aggregate amount of up to $1 billion, subject to certain covenants in the Revolving Credit Facility and the Series 2025 Bonds Indentures that limit the Company’s ability to repurchase shares of its common stock.
During the year ended December 31, 2025, the Company repurchased and retired 3,088,520 shares of the Company’s common stock at an average price of $72.61 per share.
Total Equity and Dividends
Total equity attributable to the Company was $3,678 million at December 31, 2025 and $1,568 million at December 31, 2024. See the Consolidated Statements of Stockholders’ Equity in Item 8 of this Report for additional details.
The declaration and payment of dividends by the Company is at the discretion of the Company’s Board of Directors. The Revolving Credit Facility and the Series 2025 Bonds Indentures include certain covenants limiting the Company’s ability to declare and pay dividends.
The Company paid the following dividends during the year ended December 31, 2025:
|
|
|
|
|
|
|
|
|
|
|
|
|
|
|
|
|
|
|
|
|
| Per Share |
|
Total Paid (000s omitted) |
|
Payment Timing |
|
Shareholder of Record Date |
| $0.10 |
|
$5,364 |
|
March 17, 2025 |
|
March 3, 2025 |
| $0.10 |
|
$5,223 |
|
June 13, 2025 |
|
May 30, 2025 |
| $0.10 |
|
$5,128 |
|
September 15, 2025 |
|
August 29, 2025 |
| $0.10 |
|
$5,115 |
|
December 15, 2025 |
|
November 28, 2025 |
On February 12, 2026, the Company announced a $0.10 per share dividend in an aggregate amount of approximately $5.1 million, payable on March 16, 2026 to all stockholders of record as of March 2, 2026.
Recent Accounting Pronouncements
In November 2024, the Financial Accounting Standards Board issued Accounting Standards Update 2024-03 Income Statement—Reporting Comprehensive Income—Expense Disaggregation Disclosures (Subtopic 220-40). The amendments in this update improve the disclosures about a public business entity’s expenses and address requests from investors for more detailed information about the types of expenses in commonly presented expense captions. The amendments in this update require that public business entities, at each interim period and on an annual basis: (1) disclose the amounts of (a) purchases of inventory, (b) employee compensation, (c) depreciation, (d) intangible asset amortization and (e) depreciation, depletion, and amortization recognized as part of oil- and gas-producing activities (or other amounts of depletion expense) included in each relevant expense caption; (2) include certain amounts that are already required to be disclosed under current GAAP; (3) disclose a qualitative description of the amounts remaining in relevant expense captions that are not separately disaggregated quantitatively; and (4) disclose the total amount of selling expenses and, in annual reporting periods, an entity’s definition of selling expenses. The amendments in this update are effective for annual reporting periods beginning after December 15, 2026 and interim reporting periods beginning after December 15, 2027. Early adoption is permitted. These amendments may be applied either prospectively or retrospectively. Management is currently evaluating the impact of this guidance but, with the exception of the increased disclosures summarized above, does not expect this update to have a material impact on the Company’s financial statements.
ITEM 7A. QUANTITATIVE AND QUALITATIVE DISCLOSURES ABOUT MARKET RISK
In addition to the risks inherent in operations, the Company is exposed to financial, market, political and economic risks. The following discussion provides additional detail regarding the Company’s exposure to the risks related to changes in commodity prices, interest rates and foreign exchange rates.
Commodity Price Risk
The Company is exposed to market price risk in the normal course of selling coal. The Company sells coal in the spot market and under both short-term and multi-year contracts that may contain prices subject to pre-established price adjustments that reflect (i) variances in the quality characteristics of coal delivered to the customer beyond threshold quality characteristics specified in the applicable sales contract, (ii) the actual calorific value of coal delivered to the customer, (iii) changes in electric power prices in the markets in which the Company’s customers operate, as adjusted for any factors set forth in the applicable contract or (iv) changes in published indices. The Company has established risk management policies and procedures to strengthen the internal control environment of the marketing of commodities produced from its asset base.
Interest Rate Risk
At December 31, 2025, the Company’s aggregate principal amount of debt outstanding is predominantly under fixed-rate instruments, and only $73 million of outstanding debt is subject to interest rate sensitivity.
Foreign Exchange Rate Risk
All of the Company’s transactions are denominated in U.S. dollars, and, as a result, any fluctuations in currency exchange rates would have no impact to the Company’s current financial transactions. However, because coal is sold internationally in U.S. dollars, general economic conditions in foreign markets and changes in foreign currency exchange rates may provide the Company’s international competitors with a competitive advantage. If the Company’s competitors’ currencies decline against the U.S. dollar or against the Company’s international customers’ local currencies, those competitors may be able to offer lower prices for coal to the Company’s customers. Furthermore, if the currencies of the Company’s overseas customers were to significantly decline in value in comparison to the U.S. dollar, those customers may seek decreased prices for the coal the Company sells to them. Consequently, currency fluctuations could adversely affect the competitiveness of the Company’s coal in international markets.
ITEM 8. FINANCIAL STATEMENTS AND SUPPLEMENTARY DATA
INDEX TO CONSOLIDATED FINANCIAL STATEMENTS
|
|
|
|
|
|
|
Page |
Report of Independent Registered Public Accounting Firm (PCAOB ID: 42) |
|
Consolidated Statements of (Loss) Income for the Years Ended December 31, 2025, 2024 and 2023 |
|
Consolidated Statements of Comprehensive (Loss) Income for the Years Ended December 31, 2025, 2024 and 2023 |
|
Consolidated Balance Sheets at December 31, 2025 and 2024 |
|
Consolidated Statements of Stockholders’ Equity for the Years Ended December 31, 2025, 2024 and 2023 |
|
Consolidated Statements of Cash Flows for the Years Ended December 31, 2025, 2024 and 2023 |
|
| Notes to the Audited Consolidated Financial Statements |
|
Report of Independent Registered Public Accounting Firm
To the Stockholders and the Board of Directors of Core Natural Resources, Inc.
Opinion on the Financial Statements
We have audited the accompanying consolidated balance sheets of Core Natural Resources, Inc. (the Company) as of December 31, 2025 and 2024, the related consolidated statements of (loss) income, comprehensive (loss) income, stockholders’ equity and cash flows for each of the three years in the period ended December 31, 2025, and the related notes (collectively referred to as the “consolidated financial statements”). In our opinion, the consolidated financial statements present fairly, in all material respects, the financial position of the Company at December 31, 2025 and 2024, and the results of its operations and its cash flows for each of the three years in the period ended December 31, 2025, in conformity with U.S. generally accepted accounting principles.
We also have audited, in accordance with the standards of the Public Company Accounting Oversight Board (United States) (PCAOB), the Company’s internal control over financial reporting as of December 31, 2025, based on criteria established in Internal Control-Integrated Framework issued by the Committee of Sponsoring Organizations of the Treadway Commission (2013 framework), and our report dated February 17, 2026 expressed an unqualified opinion thereon.
Basis for Opinion
These financial statements are the responsibility of the Company’s management. Our responsibility is to express an opinion on the Company’s financial statements based on our audits. We are a public accounting firm registered with the PCAOB and are required to be independent with respect to the Company in accordance with the U.S. federal securities laws and the applicable rules and regulations of the Securities and Exchange Commission and the PCAOB.
We conducted our audits in accordance with the standards of the PCAOB. Those standards require that we plan and perform the audit to obtain reasonable assurance about whether the financial statements are free of material misstatement, whether due to error or fraud. Our audits included performing procedures to assess the risks of material misstatement of the financial statements, whether due to error or fraud, and performing procedures that respond to those risks. Such procedures included examining, on a test basis, evidence regarding the amounts and disclosures in the financial statements. Our audits also included evaluating the accounting principles used and significant estimates made by management, as well as evaluating the overall presentation of the financial statements. We believe that our audits provide a reasonable basis for our opinion.
Critical Audit Matters
The critical audit matters communicated below are matters arising from the current period audit of the financial statements that were communicated or required to be communicated to the audit committee and that: (1) relate to accounts or disclosures that are material to the financial statements and (2) involved our especially challenging, subjective or complex judgments. The communication of critical audit matters does not alter in any way our opinion on the consolidated financial statements, taken as a whole, and we are not, by communicating the critical audit matters below, providing separate opinions on the critical audit matters or on the accounts or disclosures to which they relate.
|
|
|
|
|
|
|
|
|
|
|
Asset Retirement Obligations |
|
|
|
| Description of the Matter |
|
The Company accrues for the costs of current coal mine disturbance and final coal mine and gas well closure, including the cost of treating mine water discharge where necessary. Estimates of the Company’s asset retirement obligations are based upon permit requirements and the Company’s assessment of these requirements. The total asset retirement obligations, including the current portion, were approximately $535 million at December 31, 2025. This liability is reviewed annually, or when events and circumstances indicate an adjustment is necessary, by the Company’s management and engineers. As discussed in Note 1 and Note 8 of the consolidated financial statements, the Company’s accounting for asset retirement obligations requires that the fair value of an asset retirement obligation be recognized in the period in which it is incurred if a reasonable estimate of fair value can be made.
Auditing the amounts recorded for certain of the Company’s asset retirement obligations is complex and judgmental due to the estimation that is required to determine the value of the asset retirement obligation. In particular, the estimation of the value of the asset retirement obligation involves certain subjective assumptions, including the estimated future expenditures. The estimated liability can significantly change if actual costs vary from the assumptions used in estimating the obligation.
|
|
|
|
| How We Addressed the Matter in Our Audit |
|
We tested controls that address the risk of material misstatement relating to the measurement of the asset retirement obligations. For example, we tested controls over management’s review of the estimates of asset retirement obligations, management’s review over the timing and amount of expected asset retirement costs and management’s review over the assumptions discussed above.
To test the asset retirement obligations, our audit procedures included, among others, evaluating the methodology used, testing the significant assumptions discussed above and testing the underlying data used by the Company in its analyses. We compared the expected amounts and timing of future expenditures to historical data and evaluated the changes in those amounts. For example, we evaluated management’s methodology for determining the amount and timing of asset retirement obligation costs which is utilized to measure the asset retirement obligation and analyzed current year activity, published pricing data and historical amounts. In addition, we involved our specialist to assist in our evaluation of management’s estimates of the asset retirement obligations, including review of assumptions, regulatory requirements, reclamation plans and estimated future expenditures. We also tested the completeness and accuracy of the data used in the estimation of the Company’s asset retirement obligations.
|
|
|
|
|
|
|
|
|
|
|
|
Merger with Arch |
|
|
|
| Description of the Matter |
|
As discussed in Note 2, on January 14, 2025, the Company completed the merger with Arch Resources, Inc. for total consideration of approximately $2.577 billion. The Company accounted for the merger as a business combination.
Auditing management’s accounting for the merger was challenging due to the significant estimation required by management to determine the fair values of mineral reserves (included in Property, Plant and Equipment, net) and significant judgment required to evaluate management’s estimate. These fair value estimates were sensitive to certain significant assumptions, including estimated realized coal prices in the determination of forecasted revenue. This significant assumption is forward-looking and could be affected by future market or economic conditions.
|
|
|
|
| How We Addressed the Matter in Our Audit |
|
We obtained an understanding, evaluated the design and tested the operating effectiveness of controls over the Company’s accounting for the merger and valuation of the acquired assets. For example, we tested controls over management’s review of the significant assumption described above to develop such estimates.
Our audit procedures included, among others, evaluating the Company's valuation methodology, significant assumptions used by the Company, and evaluating the completeness and accuracy of the underlying data supporting the significant assumptions and estimates. We involved our valuation specialists to assist with our evaluation of the selection and application of the valuation methodology used by the Company. Our audit procedures performed to assess the reasonableness of the estimated realized coal prices involved, among others, considering consistency with external market and industry data, current and past performance of the acquired business, and evidence obtained in other areas of the audit.
|
/s/ Ernst & Young LLP
We have served as the Company’s auditor since 2017.
Pittsburgh, Pennsylvania
February 17, 2026
CORE NATURAL RESOURCES, INC.
CONSOLIDATED STATEMENTS OF (LOSS) INCOME
(Dollars in thousands, except per share data)
|
|
|
|
|
|
|
|
|
|
|
|
|
|
|
|
|
|
|
Year Ended December 31, |
|
2025 |
|
2024 |
|
2023 |
| Revenues |
$ |
4,164,775 |
|
|
$ |
2,164,406 |
|
|
$ |
2,506,635 |
|
|
|
|
|
|
|
| Costs and Expenses: |
|
|
|
|
|
| Cost of Sales (exclusive of items shown separately below) |
3,544,817 |
|
|
1,431,432 |
|
|
1,377,623 |
|
| Depreciation, Depletion and Amortization |
621,067 |
|
|
223,526 |
|
|
241,317 |
|
| General and Administrative Costs |
214,856 |
|
|
115,224 |
|
|
103,470 |
|
| Other Operating Income and Expense, net |
(33,904) |
|
|
43,224 |
|
|
(19,111) |
|
|
4,346,836 |
|
|
1,813,406 |
|
|
1,703,299 |
|
|
|
|
|
|
|
| (Loss) Income from Operations |
(182,061) |
|
|
351,000 |
|
|
803,336 |
|
|
|
|
|
|
|
| Interest Expense |
(40,124) |
|
|
(22,192) |
|
|
(29,325) |
|
| Interest Income |
25,890 |
|
|
19,223 |
|
|
13,597 |
|
| Loss on Debt Extinguishment |
(11,680) |
|
|
— |
|
|
(2,725) |
|
| Non-Service Related Pension and Postretirement Benefit Costs |
(25,728) |
|
|
(17,384) |
|
|
(7,011) |
|
|
|
|
|
|
|
| (Loss) Earnings Before Income Tax |
(233,703) |
|
|
330,647 |
|
|
777,872 |
|
| Income Tax (Benefit) Expense (Note 5) |
(80,487) |
|
|
44,242 |
|
|
121,980 |
|
| Net (Loss) Income |
$ |
(153,216) |
|
|
$ |
286,405 |
|
|
$ |
655,892 |
|
|
|
|
|
|
|
| (Loss) Earnings per Share: |
|
|
|
|
|
| Total Basic (Loss) Earnings per Share |
$ |
(2.98) |
|
|
$ |
9.65 |
|
|
$ |
19.91 |
|
| Total Diluted (Loss) Earnings per Share |
$ |
(2.98) |
|
|
$ |
9.61 |
|
|
$ |
19.79 |
|
|
|
|
|
|
|
| Dividends Declared per Common Share |
$ |
0.40 |
|
|
$ |
0.50 |
|
|
$ |
2.20 |
|
The accompanying notes are an integral part of these financial statements.
CORE NATURAL RESOURCES, INC.
CONSOLIDATED STATEMENTS OF COMPREHENSIVE (LOSS) INCOME
(Dollars in thousands)
|
|
|
|
|
|
|
|
|
|
|
|
|
|
|
|
|
|
|
Year Ended December 31, |
|
2025 |
|
2024 |
|
2023 |
| Net (Loss) Income |
$ |
(153,216) |
|
|
$ |
286,405 |
|
|
$ |
655,892 |
|
| Other Comprehensive Income (Loss): |
|
|
|
|
|
| Actuarially Determined Long-Term Liability Adjustments: |
|
|
|
|
|
|
|
|
|
|
|
|
|
|
|
|
|
|
|
|
|
|
|
Recognition of Benefit Plan Credits (Costs) (net of tax: ($441), ($395), $1,049) |
1,506 |
|
|
1,371 |
|
|
(3,650) |
|
Unrecognized Benefit Plan Gains Arising During the Period (net of tax: ($2,888), ($3,792), ($1,232)) |
9,676 |
|
|
13,157 |
|
|
4,150 |
|
| Available-for-Sale Securities: |
|
|
|
|
|
Unrealized Gain (Loss) on Investments in Available-for-Sale Securities (net of tax: ($165), $12, ($23)) |
562 |
|
|
(41) |
|
|
80 |
|
| Other Comprehensive Income |
11,744 |
|
|
14,487 |
|
|
580 |
|
|
|
|
|
|
|
| Comprehensive (Loss) Income |
$ |
(141,472) |
|
|
$ |
300,892 |
|
|
$ |
656,472 |
|
The accompanying notes are an integral part of these financial statements.
CORE NATURAL RESOURCES, INC.
CONSOLIDATED BALANCE SHEETS
(Dollars in thousands, except share and per share data)
|
|
|
|
|
|
|
|
|
|
|
|
|
December 31,
2025 |
|
December 31,
2024 |
| ASSETS |
|
|
|
| Current Assets: |
|
|
|
| Cash and Cash Equivalents |
$ |
432,174 |
|
|
$ |
408,240 |
|
| Short-Term Investments (Note 6) |
— |
|
|
51,993 |
|
| Accounts and Notes Receivable: |
|
|
|
| Trade Receivables, net |
349,233 |
|
|
136,750 |
|
| Other Receivables, net |
53,928 |
|
|
25,900 |
|
| Inventories (Note 9) |
374,759 |
|
|
96,201 |
|
| Other Current Assets |
130,128 |
|
|
66,874 |
|
| Total Current Assets |
1,340,222 |
|
|
785,958 |
|
| Total Property, Plant and Equipment—Net (Note 10) |
4,386,882 |
|
|
1,921,699 |
|
| Other Assets: |
|
|
|
| Funds for Asset Retirement Obligations (Note 8) |
148,874 |
|
|
12,054 |
|
| Pension Benefits (Note 15) |
49,618 |
|
|
41,938 |
|
| Other Noncurrent Assets, net |
204,457 |
|
|
117,894 |
|
| Total Other Assets |
402,949 |
|
|
171,886 |
|
| TOTAL ASSETS |
$ |
6,130,053 |
|
|
$ |
2,879,543 |
|
The accompanying notes are an integral part of these financial statements.
CORE NATURAL RESOURCES, INC.
CONSOLIDATED BALANCE SHEETS
(Dollars in thousands, except share and per share data)
|
|
|
|
|
|
|
|
|
|
|
|
|
December 31,
2025 |
|
December 31,
2024 |
| LIABILITIES AND STOCKHOLDERS' EQUITY |
|
|
|
| Current Liabilities: |
|
|
|
| Accounts Payable |
$ |
335,623 |
|
|
$ |
143,635 |
|
| Current Portion of Long-Term Debt (Note 13) |
98,328 |
|
|
112,865 |
|
| Other Accrued Liabilities (Note 12) |
404,338 |
|
|
262,184 |
|
| Total Current Liabilities |
838,289 |
|
|
518,684 |
|
| Long-Term Debt: |
|
|
|
| Long-Term Debt (Note 13) |
317,267 |
|
|
79,524 |
|
| Finance Lease Obligations (Note 14) |
36,893 |
|
|
15,270 |
|
| Total Long-Term Debt |
354,160 |
|
|
94,794 |
|
| Deferred Credits and Other Liabilities: |
|
|
|
| Postretirement Benefits Other Than Pensions (Note 15) |
186,843 |
|
|
176,251 |
|
| Pneumoconiosis Benefits (Note 16) |
261,201 |
|
|
145,489 |
|
| Asset Retirement Obligations (Note 8) |
496,002 |
|
|
212,178 |
|
| Workers’ Compensation (Note 16) |
70,457 |
|
|
36,051 |
|
| Pension Benefits (Note 15) |
21,111 |
|
|
20,073 |
|
| Deferred Income Taxes (Note 5) |
130,113 |
|
|
49,214 |
|
| Other Noncurrent Liabilities |
93,643 |
|
|
58,562 |
|
| Total Deferred Credits and Other Liabilities |
1,259,370 |
|
|
697,818 |
|
| TOTAL LIABILITIES |
2,451,819 |
|
|
1,311,296 |
|
| Stockholders’ Equity: |
|
|
|
|
Common Stock, $0.01 Par Value; 125,000,000 Shares Authorized, 50,975,185 Shares Issued and Outstanding at December 31, 2025;
62,500,000 Shares Authorized, 29,407,830 Shares Issued and Outstanding at December 31, 2024
|
510 |
|
|
294 |
|
| Capital in Excess of Par Value |
2,982,077 |
|
|
540,412 |
|
| Retained Earnings |
818,476 |
|
|
1,162,114 |
|
| Accumulated Other Comprehensive Loss |
(122,829) |
|
|
(134,573) |
|
| TOTAL STOCKHOLDERS' EQUITY |
3,678,234 |
|
|
1,568,247 |
|
| TOTAL LIABILITIES AND STOCKHOLDERS' EQUITY |
$ |
6,130,053 |
|
|
$ |
2,879,543 |
|
The accompanying notes are an integral part of these financial statements.
CORE NATURAL RESOURCES, INC.
CONSOLIDATED STATEMENTS OF STOCKHOLDERS’ EQUITY
(Dollars in thousands, except share and per share data)
|
|
|
|
|
|
|
|
|
|
|
|
|
|
|
|
|
|
|
|
|
|
|
|
|
|
|
|
|
|
|
|
|
|
| |
Common
Stock |
|
Capital in
Excess
of Par
Value
|
|
Retained
Earnings |
|
Accumulated
Other
Comprehensive
(Loss) Income |
|
|
|
|
|
Total
Stockholders'
Equity |
| December 31, 2022 |
$ |
347 |
|
|
$ |
646,237 |
|
|
$ |
668,882 |
|
|
$ |
(149,640) |
|
|
|
|
|
|
$ |
1,165,826 |
|
| Net Income |
— |
|
|
— |
|
|
655,892 |
|
|
— |
|
|
|
|
|
|
655,892 |
|
Actuarially Determined Long-Term Liability Adjustments (Net of ($183) Tax) |
— |
|
|
— |
|
|
— |
|
|
500 |
|
|
|
|
|
|
500 |
|
Investments in Available-for-Sale Securities (Net of ($23) Tax) |
— |
|
|
— |
|
|
— |
|
|
80 |
|
|
|
|
|
|
80 |
|
| Comprehensive Income |
— |
|
|
— |
|
|
655,892 |
|
|
580 |
|
|
|
|
|
|
656,472 |
|
| Issuance of Common Stock |
4 |
|
|
(4) |
|
|
— |
|
|
— |
|
|
|
|
|
|
— |
|
Repurchases of Common Stock (5,224,016 Shares) |
(52) |
|
|
(95,587) |
|
|
(299,753) |
|
|
— |
|
|
|
|
|
|
(395,392) |
|
| Excise Tax on Repurchases of Common Stock |
— |
|
|
— |
|
|
(3,729) |
|
|
— |
|
|
|
|
|
|
(3,729) |
|
| Employee Stock-Based Compensation |
— |
|
|
10,046 |
|
|
— |
|
|
— |
|
|
|
|
|
|
10,046 |
|
| Shares Withheld for Taxes |
— |
|
|
(12,831) |
|
|
— |
|
|
— |
|
|
|
|
|
|
(12,831) |
|
Dividends on Common Shares ($2.20 per share) |
— |
|
|
— |
|
|
(75,474) |
|
|
— |
|
|
|
|
|
|
(75,474) |
|
| Dividend Equivalents Earned on Stock-Based Compensation Awards |
— |
|
|
— |
|
|
(1,476) |
|
|
— |
|
|
|
|
|
|
(1,476) |
|
| December 31, 2023 |
$ |
299 |
|
|
$ |
547,861 |
|
|
$ |
944,342 |
|
|
$ |
(149,060) |
|
|
|
|
|
|
$ |
1,343,442 |
|
| Net Income |
— |
|
|
— |
|
|
286,405 |
|
|
— |
|
|
|
|
|
|
286,405 |
|
Actuarially Determined Long-Term Liability Adjustments (Net of ($4,187) Tax) |
— |
|
|
— |
|
|
— |
|
|
14,528 |
|
|
|
|
|
|
14,528 |
|
Investments in Available-for-Sale Securities (Net of $12 Tax) |
— |
|
|
— |
|
|
— |
|
|
(41) |
|
|
|
|
|
|
(41) |
|
| Comprehensive Income |
— |
|
|
— |
|
|
286,405 |
|
|
14,487 |
|
|
|
|
|
|
300,892 |
|
| Issuance of Common Stock |
2 |
|
|
(2) |
|
|
— |
|
|
— |
|
|
|
|
|
|
— |
|
Repurchases of Common Stock (747,351 Shares) |
(7) |
|
|
(13,671) |
|
|
(53,200) |
|
|
— |
|
|
|
|
|
|
(66,878) |
|
| Excise Tax on Repurchases of Common Stock |
— |
|
|
— |
|
|
(537) |
|
|
— |
|
|
|
|
|
|
(537) |
|
| Employee Stock-Based Compensation |
— |
|
|
11,350 |
|
|
16 |
|
|
— |
|
|
|
|
|
|
11,366 |
|
| Shares Withheld for Taxes |
— |
|
|
(5,126) |
|
|
— |
|
|
— |
|
|
|
|
|
|
(5,126) |
|
Dividends on Common Shares ($0.50 per share) |
— |
|
|
— |
|
|
(14,697) |
|
|
— |
|
|
|
|
|
|
(14,697) |
|
| Dividend Equivalents Earned on Stock-Based Compensation Awards |
— |
|
|
— |
|
|
(215) |
|
|
— |
|
|
|
|
|
|
(215) |
|
| December 31, 2024 |
$ |
294 |
|
|
$ |
540,412 |
|
|
$ |
1,162,114 |
|
|
$ |
(134,573) |
|
|
|
|
|
|
$ |
1,568,247 |
|
| Net Loss |
— |
|
|
— |
|
|
(153,216) |
|
|
— |
|
|
|
|
|
|
(153,216) |
|
Actuarially Determined Long-Term Liability Adjustments (Net of ($3,329) Tax) |
— |
|
|
— |
|
|
— |
|
|
11,182 |
|
|
|
|
|
|
11,182 |
|
Investments in Available-for-Sale Securities (Net of ($165) Tax) |
— |
|
|
— |
|
|
— |
|
|
562 |
|
|
|
|
|
|
562 |
|
| Comprehensive (Loss) Income |
— |
|
|
— |
|
|
(153,216) |
|
|
11,744 |
|
|
|
|
|
|
(141,472) |
|
| Issuance of Common Stock |
4 |
|
|
(4) |
|
|
— |
|
|
— |
|
|
|
|
|
|
— |
|
| Merger with Arch |
243 |
|
|
2,481,125 |
|
|
— |
|
|
— |
|
|
|
|
|
|
2,481,368 |
|
Repurchases of Common Stock (3,088,520 Shares) |
(31) |
|
|
(56,755) |
|
|
(167,478) |
|
|
— |
|
|
|
|
|
|
(224,264) |
|
| Excise Tax on Repurchases of Common Stock |
— |
|
|
— |
|
|
(1,978) |
|
|
— |
|
|
|
|
|
|
(1,978) |
|
| Employee Stock-Based Compensation |
— |
|
|
32,918 |
|
|
— |
|
|
— |
|
|
|
|
|
|
32,918 |
|
| Shares Withheld for Taxes |
— |
|
|
(15,619) |
|
|
— |
|
|
— |
|
|
|
|
|
|
(15,619) |
|
Dividends on Common Shares ($0.40 per share) |
— |
|
|
— |
|
|
(20,830) |
|
|
— |
|
|
|
|
|
|
(20,830) |
|
| Dividend Equivalents Earned on Stock-Based Compensation Awards |
— |
|
|
— |
|
|
(136) |
|
|
— |
|
|
|
|
|
|
(136) |
|
| December 31, 2025 |
$ |
510 |
|
|
$ |
2,982,077 |
|
|
$ |
818,476 |
|
|
$ |
(122,829) |
|
|
|
|
|
|
$ |
3,678,234 |
|
The accompanying notes are an integral part of these financial statements.
CORE NATURAL RESOURCES, INC.
CONSOLIDATED STATEMENTS OF CASH FLOWS
(Dollars in thousands)
|
|
|
|
|
|
|
|
|
|
|
|
|
|
|
|
|
|
|
Year Ended December 31, |
|
2025 |
|
2024 |
|
2023 |
| Cash Flows from Operating Activities: |
|
|
|
|
|
| Net (Loss) Income |
$ |
(153,216) |
|
|
$ |
286,405 |
|
|
$ |
655,892 |
|
| Adjustments to Reconcile Net (Loss) Income to Net Cash Provided by Operating Activities: |
|
|
|
|
|
| Depreciation, Depletion and Amortization |
621,067 |
|
|
223,526 |
|
|
241,317 |
|
| Gain on Sale of Assets |
(7,027) |
|
|
(6,941) |
|
|
(8,981) |
|
| Stock-Based Compensation |
32,918 |
|
|
11,350 |
|
|
10,046 |
|
|
|
|
|
|
|
| Loss on Debt Extinguishment |
11,680 |
|
|
— |
|
|
2,725 |
|
| Deferred Income Taxes |
(80,971) |
|
|
8,820 |
|
|
14,121 |
|
| Loss from Equity Method Investments |
15,476 |
|
|
1,326 |
|
|
199 |
|
| Other Adjustments to Net (Loss) Income |
4,411 |
|
|
(371) |
|
|
1,851 |
|
| Changes in Operating Assets: |
|
|
|
|
|
| Accounts and Notes Receivable |
(64,045) |
|
|
(2,233) |
|
|
36,922 |
|
| Inventories |
28,661 |
|
|
(8,018) |
|
|
(21,540) |
|
| Other Current Assets |
(4,684) |
|
|
(444) |
|
|
(4,673) |
|
| Changes in Other Assets |
17,783 |
|
|
7,936 |
|
|
(11,725) |
|
| Changes in Operating Liabilities: |
|
|
|
|
|
| Accounts Payable |
(24,268) |
|
|
4,570 |
|
|
11,449 |
|
| Commodity Derivatives, net Liability |
— |
|
|
— |
|
|
(15,142) |
|
| Other Operating Liabilities |
(9,144) |
|
|
(25,420) |
|
|
3,063 |
|
| Payments on Asset Retirement Obligations |
(36,205) |
|
|
(30,089) |
|
|
(22,771) |
|
| Changes in Other Liabilities |
(46,684) |
|
|
5,973 |
|
|
(34,804) |
|
| Net Cash Provided by Operating Activities |
305,752 |
|
|
476,390 |
|
|
857,949 |
|
| Cash Flows from Investing Activities: |
|
|
|
|
|
| Capital Expenditures |
(284,581) |
|
|
(177,988) |
|
|
(167,791) |
|
| Proceeds from Sales of Assets |
7,514 |
|
|
7,396 |
|
|
4,255 |
|
|
|
|
|
|
|
| Proceeds from Sales of Short-Term Investments |
80,165 |
|
|
100,982 |
|
|
122,658 |
|
| Purchases of Short-Term Investments |
(4,802) |
|
|
(66,963) |
|
|
(200,870) |
|
| Net Cash and Restricted Cash Acquired from Merger |
368,726 |
|
|
— |
|
|
— |
|
| Purchase of Arch Tax-Exempt Bonds |
(98,225) |
|
|
— |
|
|
— |
|
| Investments in DTA |
(15,733) |
|
|
— |
|
|
— |
|
| Other Investing Activity |
(5,405) |
|
|
(28,458) |
|
|
(17,684) |
|
| Net Cash Provided by (Used in) Investing Activities |
47,659 |
|
|
(165,031) |
|
|
(259,432) |
|
| Cash Flows from Financing Activities: |
|
|
|
|
|
| Payments on Finance Lease Obligations |
(12,554) |
|
|
(10,518) |
|
|
(25,335) |
|
| Payments on Term Loan B |
— |
|
|
— |
|
|
(63,590) |
|
| Payments on Second Lien Notes |
— |
|
|
— |
|
|
(101,832) |
|
| Proceeds from Long-Term Debt Issuance |
114,439 |
|
|
— |
|
|
— |
|
| Payments on Other Debt |
(14,118) |
|
|
(955) |
|
|
(981) |
|
| Shares Withheld for Taxes |
(15,619) |
|
|
(5,126) |
|
|
(12,831) |
|
| Repurchases of Common Stock |
(224,264) |
|
|
(70,879) |
|
|
(399,379) |
|
| Debt-Related Financing Fees |
(20,477) |
|
|
— |
|
|
(2,779) |
|
| Payments of Excise Tax on Share Repurchases |
(934) |
|
|
(3,747) |
|
|
— |
|
| Dividends and Dividend Equivalents Paid |
(26,264) |
|
|
(15,860) |
|
|
(75,474) |
|
| Net Cash Used in Financing Activities |
(199,791) |
|
|
(107,085) |
|
|
(682,201) |
|
| Net Increase (Decrease) in Cash and Cash Equivalents and Restricted Cash |
153,620 |
|
|
204,274 |
|
|
(83,684) |
|
| Cash and Cash Equivalents and Restricted Cash at Beginning of Period |
447,542 |
|
|
243,268 |
|
|
326,952 |
|
| Cash and Cash Equivalents and Restricted Cash at End of Period |
$ |
601,162 |
|
|
$ |
447,542 |
|
|
$ |
243,268 |
|
The accompanying notes are an integral part of these financial statements.
CORE NATURAL RESOURCES, INC.
NOTES TO THE AUDITED CONSOLIDATED FINANCIAL STATEMENTS
NOTE 1—SIGNIFICANT ACCOUNTING POLICIES:
On January 14, 2025, CONSOL Energy Inc., a Delaware corporation, completed its previously announced all-stock merger of equals transaction (the “Merger”) with Arch Resources, Inc., a Delaware corporation (“Arch”), pursuant to that certain Agreement and Plan of Merger, dated as of August 20, 2024 (the “Merger Agreement”), by and among CONSOL Energy Inc., Mountain Range Merger Sub Inc., a Delaware corporation and wholly-owned subsidiary of CONSOL Energy Inc. (“Merger Sub”), and Arch. Pursuant to the terms of the Merger Agreement, Merger Sub merged with and into Arch, with Arch continuing as the surviving corporation and as a wholly-owned subsidiary of the Company. Additionally, pursuant to the Merger Agreement, the Company was renamed “Core Natural Resources, Inc.”
The information set forth herein does not include the results of operations or cash flows of Arch prior to January 14, 2025. Accordingly, unless otherwise specifically noted, references herein to “Core Natural Resources,” “Core,” “we,” “our,” “us,” “our Company” and “the Company” refer only to Core and its subsidiaries and do not include Arch and its subsidiaries prior to the Merger. See Note 2—Merger with Arch for further discussion of the unaudited pro forma information.
A summary of the significant accounting policies of the Company is presented below. These, together with the other notes that follow, are an integral part of these financial statements.
Basis of Presentation
The accompanying Consolidated Financial Statements have been prepared in accordance with accounting principles generally accepted in the U.S., and they include the accounts of the Company and its wholly-owned and majority-owned or controlled subsidiaries. All significant intercompany transactions and accounts have been eliminated in consolidation. Upon closing of the Merger with Arch (see Note 2 - Merger with Arch), the Company acquired a 35% interest in the Dominion Terminal, a ground storage-to-vessel coal transloading facility in Newport News, Virginia operated by DTA. The Company has the ability to exercise significant influence, but not control, over DTA and accordingly, the investment in DTA is accounted for under the equity method.
All dollar amounts discussed in these Notes to the Audited Consolidated Financial Statements are in thousands of U.S. dollars, except for share and per share amounts, and unless otherwise indicated.
Use of Estimates
The preparation of financial statements in conformity with accounting principles generally accepted in the U.S. requires management to make estimates and assumptions that affect the reported amounts of assets, liabilities, revenues and expenses, as well as various disclosures. Actual results could differ from those estimates.
Cash and Cash Equivalents
Cash and cash equivalents include cash on hand and on deposit at banking institutions as well as all highly liquid short-term securities with original maturities of three months or less.
Restricted Cash
Restricted cash includes cash pledged as collateral, which supports the Company’s surety bond portfolio and letters of credit issued under the Company’s accounts receivable securitization program. As of December 31, 2025, the Company had $168,988 in restricted cash. As of December 31, 2024, the Company had $39,302 in restricted cash. These restricted cash balances are included in Other Current Assets and Funds for Asset Retirement Obligations in the accompanying Consolidated Balance Sheets.
Trade Receivables and Allowance for Credit Losses
Trade receivables are recorded at the invoiced amount. Credit is extended based on the Company’s assessment of several factors, including, but not limited to, a customer’s financial condition and ability to perform its obligations. See Note 7—Credit Losses for additional information regarding the Company’s measurement of expected credit losses. There were no material financing receivables with a contractual maturity greater than one year at December 31, 2025 and 2024.
Inventories
Inventories are stated at the lower of cost or net realizable value. The cost of coal inventories is determined by the first-in, first-out method. Coal inventory costs include labor, supplies, equipment costs, operating overhead, depreciation, depletion, amortization and other related costs. The cost of supplies inventory is determined by the average cost method and includes operating and maintenance supplies to be used in the Company’s coal operations.
Property, Plant and Equipment
Property, plant and equipment is recorded at cost upon acquisition. Expenditures that extend the useful lives of existing plant and equipment are capitalized. Interest costs applicable to major asset additions are capitalized during the construction period. Costs of additional mine facilities required to maintain production after a mine reaches the production stage, generally referred to as “receding face costs,” are expensed as incurred; however, the costs of additional airshafts and new portals are capitalized. Planned major maintenance costs that do not extend the useful lives of existing plant and equipment are expensed as incurred.
Coal exploration costs are expensed as incurred. Coal exploration costs include those incurred to ascertain existence, location, extent or quality of ore or minerals before beginning the development stage of the mine. Costs of developing new underground mines and certain underground expansion projects are capitalized. Underground development costs, which are costs incurred to make the mineral physically accessible, include costs to prepare property for shafts, driving main entries for ventilation, haulage, personnel, construction of airshafts, roof protection and other facilities.
Airshafts and capitalized mine development associated with a coal reserve are amortized on a units-of-production basis as the coal is produced so that each ton of coal is assigned a portion of the unamortized costs. The Company employs this method to match costs with the related revenues realized in a particular period. Rates are updated when revisions to coal reserve estimates are made. Coal reserve estimates are reviewed when information becomes available that indicates a reserve change is needed, or at a minimum once a year. Any material effect from changes in estimates is disclosed in the period the change occurs. Amortization of development costs begins when the development phase is complete and the production phase begins. At an underground mine, the end of the development phase and the beginning of the production phase takes place when construction of the mine for economic extraction is substantially complete. Coal extracted during the development phase is incidental to the mine’s production capacity and is not considered to shift the mine into the production phase.
Coal reserves are either owned in fee or controlled by lease. The durations of the leases vary; however, the lease terms are generally extended automatically to the exhaustion of economically recoverable reserves, as long as active mining continues. Coal interests held by lease provide the same rights as fee ownership for mineral extraction and are legally considered real property interests. Depletion of leased coal interests is computed using the units-of-production method over recoverable coal reserves. The Company also makes advance payments, or advance mining royalties, to lessors under certain lease agreements that are recoupable against future production, and it makes payments that are generally based upon a specified rate per ton or a percentage of gross realization from the sale of the coal. The Company evaluates its properties, including advance mining royalties and leased coal interests, for impairment indicators whenever events or circumstances indicate that the carrying amount may not be recoverable.
Costs to obtain coal lands are capitalized based on the cost at acquisition and are amortized using the units-of-production method over all estimated recoverable reserve tons assigned and accessible to the mine. Recoverable coal reserves are estimated on a clean coal ton equivalent, which excludes nonrecoverable coal reserves and anticipated preparation plant processing refuse. Rates are updated when revisions to coal reserve estimates are made. Coal reserve estimates are reviewed when events and circumstances indicate a reserve change is needed, or at a minimum once a year. Amortization of coal interests begins when the coal reserve is produced. At an underground mine, a ton is considered produced once it reaches the surface area of the mine. Any material effect from changes in estimates is disclosed in the period the change occurs.
When properties are retired or otherwise disposed, the related cost and accumulated depreciation are removed from the respective accounts and any profit or loss on disposition is recognized in Other Operating Income and Expense, net in the Consolidated Statements of (Loss) Income.
Depreciation of plant and equipment is calculated using the straight-line method over the estimated useful lives or lease terms, generally as follows:
|
|
|
|
|
|
|
Years |
| Buildings and improvements |
10 to 45 |
| Machinery and equipment |
3 to 25 |
| Leasehold improvements |
Life of Lease |
Capitalization of Interest
Interest costs associated with the development of significant properties and projects are capitalized until the project is substantially complete and ready for its intended use. A weighted average cost of borrowing rate is used. For the years ended December 31, 2025, 2024 and 2023, capitalized interest totaled $5,564, $6,106 and $3,981, respectively.
Impairment of Long-lived Assets
Impairment of long-lived assets or asset groups is recorded when indicators of impairment are present and the undiscounted cash flows estimated to be generated by those assets are less than the respective assets’ or asset groups’ carrying value. The carrying value of the assets is then reduced to its estimated fair value, which is usually measured based on an estimate of future discounted cash flows. There were no indicators of impairment and, therefore, no impairment losses were recorded during the years ended December 31, 2025, 2024 and 2023.
Income Taxes
The Company files a consolidated federal income tax return and utilizes the asset and liability method to account for income taxes. The provision for income taxes represents amounts paid or estimated to be payable, net of amounts refunded or estimated to be refunded, for the current year and the change in deferred taxes, exclusive of amounts recorded in Other Comprehensive Income (Loss). Any refinements to prior years’ provisions made due to subsequent information are reflected as adjustments in the current period.
Deferred income tax assets and liabilities are determined based on temporary differences between the financial reporting and tax bases of assets and liabilities and are recognized using enacted tax rates for the effect of such temporary differences. Deferred tax assets are reduced by a valuation allowance if it is more likely than not that some portion or all of the deferred tax asset will not be realized.
In accounting for uncertainty in income taxes of a tax position taken or expected to be taken in a tax return, the Company utilizes a recognition threshold and measurement attribute for the financial statement recognition and measurement. The recognition threshold requires the Company to determine whether it is more likely than not that a tax position will be sustained upon examination, including resolution of any related appeals or litigation processes, based on the technical merits of the position in order to record any financial statement benefit. If it is more likely than not that a tax position will be sustained, then the Company must measure the tax position to determine the amount of benefit to recognize in the financial statements. The tax position is measured at the largest amount of benefit that is greater than 50% likely of being realized upon ultimate settlement.
Postretirement Benefits Other Than Pensions
Postretirement benefit obligations established by the Coal Industry Retiree Health Benefit Act of 1992 (the “Coal Act”) are treated as a multi-employer plan, which requires expense to be recorded for the associated obligations as payments are made. For postretirement benefits other than pensions, except for those established pursuant to the Coal Act, the Company accrues the cost of such retirement benefits for the employees’ active service periods. Such liabilities are determined on an actuarial basis, and the Company administers these liabilities through a combination of self-insured and fully-insured agreements. Differences between actual and expected results or changes in the value of obligations are recorded in Other Comprehensive Income (Loss).
Pneumoconiosis Benefits and Workers’ Compensation
The Company is required by federal and state statutes to provide benefits to certain current and former totally disabled employees or their dependents for awards related to coal workers’ pneumoconiosis. The Company is also required by various state statutes to provide workers’ compensation benefits for employees who sustain employment-related physical injuries or some types of occupational disease. Workers’ compensation benefits include compensation for disability, medical costs and, on some occasions, the cost of rehabilitation.
The Company is primarily self-insured for these benefits. The Company estimates provisions related to these benefits on an actuarial basis.
Asset Retirement Obligations
The Company recognizes the fair values of asset retirement obligations for mine closing costs and costs associated with dismantling and removing degasification facilities in the periods in which they are incurred if a reasonable estimate of fair value can be made. For active locations, the present value of the estimated asset retirement obligation is capitalized as part of the carrying amount of the related long-lived asset. For locations that have been fully depleted or closed, the present value of the change is recorded directly to earnings. Generally, the capitalized asset retirement obligation is depreciated on a units-of-production basis. Accretion of the asset retirement obligation is recognized over time and until the reclamation obligations are satisfied. Accretion is included in Depreciation, Depletion and Amortization on the Consolidated Statements of (Loss) Income. Asset retirement obligations primarily relate to the closure of mines, which includes treatment of water and the reclamation of land upon exhaustion of coal reserves. Accrued mine closing costs, perpetual water treatment costs, reclamation and costs associated with dismantling and removing degasification facilities are regularly reviewed by management and are revised for changes in future estimated costs and regulatory requirements, in each case if and as applicable.
Subsidence
Subsidence occurs when there is sinking or shifting of the ground surface due to the removal of underlying coal. Areas affected may include, but are not limited to, streams, property, roads, pipelines and other land and surface structures. Total estimated subsidence-related obligations are recognized in the period when the related coal has been extracted and are included in Cost of Sales on the Consolidated Statements of (Loss) Income and Other Accrued Liabilities on the Consolidated Balance Sheets. On occasion, the Company may elect to prepay for estimated damages prior to undermining the property in return for a release of liability. Prepayments are included as assets and are either recognized in Other Current Assets or Other Noncurrent Assets, net on the Consolidated Balance Sheets if the payment is made less than or greater than one year, respectively, prior to undermining the property.
Retirement Plans
The Company has non-contributory defined benefit retirement plans. The benefits for these plans are based primarily on years of service and employees’ pay. The costs of these retiree benefits are recognized over the employees’ service periods. In 2015, the Company’s qualified defined benefit retirement plan was frozen. The Company uses actuarial methods and assumptions in the valuation of defined benefit obligations and the determination of expense. Differences between actual and expected results or changes in the value of obligations and plan assets are recorded in Other Comprehensive Income (Loss).
Stock-Based Compensation
Eligible Company employees participate in equity-based compensation plans. The Company recognizes compensation expense for all stock-based compensation awards based on the estimated fair value at the grant date. The Company recognizes these compensation costs on a straight-line basis over the requisite service period of the award, which is generally the award’s vesting term. See Note 18—Stock-Based Compensation for additional information.
Revenue Recognition
Coal revenue is recognized when the performance obligation has been satisfied and the corresponding transaction price has been determined. Generally, title passes when coal is loaded at the coal preparation facilities, at terminal locations or other customer destinations. The Company’s coal contract revenue per ton is fixed or determinable based upon either fixed forward pricing or pricing derived from established indices and adjusted for nominal quality characteristics. Some coal contracts also contain positive electric power price-related adjustments, which represent market-driven price adjustments, in addition to a fixed base price per ton. The Company’s coal contracts generally do not allow for retroactive adjustments to pricing after title to the coal has passed and do not have significant financing components. See Note 3—Revenue from Contracts with Customers for additional information.
Contingencies
The Company is subject to various lawsuits and claims with respect to such matters as personal injury, wrongful death, damage to property, exposure to hazardous substances, governmental regulations including environmental remediation, employment and contract disputes and other claims and actions arising out of the normal course of business. Liabilities are recorded when it is probable that obligations have been incurred and the amounts can be reasonably estimated.
Estimates are developed through consultation with legal counsel involved in the defense of these matters and are based upon the nature of the lawsuit, progress of the case in court, view of legal counsel, prior experience in similar matters and management’s intended response. Environmental liabilities are not discounted or reduced by possible recoveries from third-parties. Legal fees associated with defending these various lawsuits and claims are expensed when incurred.
(Loss) Earnings per Share
Basic (loss) earnings per share are computed by dividing net (loss) income by the weighted-average number of shares outstanding during the reporting period. Diluted (loss) earnings per share are computed similarly to basic (loss) earnings per share, except that the weighted-average number of shares outstanding is increased to include additional shares from restricted stock units and performance share units, if dilutive. The number of additional shares is calculated by assuming that outstanding restricted stock units and performance share units were released, and that the proceeds from such activities, as applicable, were used to acquire shares of common stock at the average market price during the reporting period.
The table below sets forth the share-based awards that have been excluded from the computation of diluted (loss) earnings per share because their effect would be anti-dilutive:
|
|
|
|
|
|
|
|
|
|
|
|
|
|
|
|
|
|
|
Year Ended December 31, |
|
2025 |
|
2024 |
|
2023 |
| Anti-Dilutive Restricted Stock Units |
105,182 |
|
|
797 |
|
|
1,146 |
|
| Anti-Dilutive Performance Share Units |
83,809 |
|
|
— |
|
|
— |
|
|
188,991 |
|
|
797 |
|
|
1,146 |
|
The computations for basic and diluted (loss) earnings per share are as follows:
|
|
|
|
|
|
|
|
|
|
|
|
|
|
|
|
|
|
|
Year Ended December 31, |
|
2025 |
|
2024 |
|
2023 |
| Numerator: |
|
|
|
|
|
| Net (Loss) Income |
$ |
(153,216) |
|
|
$ |
286,405 |
|
|
$ |
655,892 |
|
|
|
|
|
|
|
| Denominator: |
|
|
|
|
|
| Weighted-average shares of common stock outstanding |
51,386,841 |
|
29,683,002 |
|
32,941,654 |
| Effect of dilutive shares |
— |
|
|
124,366 |
|
200,353 |
|
| Weighted-average diluted shares of common stock outstanding |
51,386,841 |
|
|
29,807,368 |
|
33,142,007 |
|
|
|
|
|
|
| (Loss) Earnings per Share: |
|
|
|
|
|
| Basic |
$ |
(2.98) |
|
|
$ |
9.65 |
|
|
$ |
19.91 |
|
| Diluted |
$ |
(2.98) |
|
|
$ |
9.61 |
|
|
$ |
19.79 |
|
As of December 31, 2025, the Company had 500,000 shares of preferred stock authorized, none of which were issued or outstanding.
Shares of common stock outstanding were as follows:
|
|
|
|
|
|
|
|
|
|
|
|
|
|
|
|
|
|
|
Year Ended December 31, |
|
2025 |
|
2024 |
|
2023 |
| Balance, Beginning of Year |
29,407,830 |
|
29,910,439 |
|
34,746,904 |
Retirement Related to Stock Repurchase (a) |
(3,088,520) |
|
|
(747,351) |
|
|
(5,224,016) |
|
Issuance Related to Merger with Arch (b) |
24,339,073 |
|
— |
|
|
— |
|
Issuance Related to Stock-Based Compensation (c) |
316,802 |
|
244,742 |
|
387,551 |
| Balance, End of Year |
50,975,185 |
|
29,407,830 |
|
29,910,439 |
(a) See Note 4—Stock and Debt Repurchases for additional information.
(b) See Note 2—Merger with Arch for additional information.
(c) See Note 18—Stock-Based Compensation for additional information.
Recent Accounting Pronouncements
In November 2024, the Financial Accounting Standards Board issued Accounting Standards Update (“ASU”) 2024-03 Income Statement—Reporting Comprehensive Income—Expense Disaggregation Disclosures (Subtopic 220-40). The amendments in this update improve the disclosures about a public business entity’s expenses and address requests from investors for more detailed information about the types of expenses in commonly presented expense captions. The amendments in this update require that public business entities, at each interim period and on an annual basis: (1) disclose the amounts of (a) purchases of inventory, (b) employee compensation, (c) depreciation, (d) intangible asset amortization and (e) depreciation, depletion, and amortization recognized as part of oil- and gas-producing activities (or other amounts of depletion expense) included in each relevant expense caption; (2) include certain amounts that are already required to be disclosed under current generally accepted accounting principles; (3) disclose a qualitative description of the amounts remaining in relevant expense captions that are not separately disaggregated quantitatively; and (4) disclose the total amount of selling expenses and, in annual reporting periods, an entity’s definition of selling expenses. The amendments in this update are effective for annual reporting periods beginning after December 15, 2026 and interim reporting periods beginning after December 15, 2027. Early adoption is permitted. These amendments may be applied either prospectively or retrospectively. Management is currently evaluating the impact of this guidance but, with the exception of the increased disclosures summarized above, does not expect this update to have a material impact on the Company’s financial statements.
Reclassifications
Certain amounts in prior periods have been reclassified to conform with the report classifications of the current period. These reclassifications had no effect on previously reported total net income (loss), assets, stockholders’ equity or cash flows from operating activities, nor do they affect key metrics used by the Company’s chief operating decision maker (“CODM”) to evaluate performance.
NOTE 2—MERGER WITH ARCH:
On January 14, 2025, Core completed its merger of equals transaction with Arch. Pursuant to the terms of the Merger Agreement, Merger Sub merged with and into Arch, with Arch continuing as the surviving corporation and as a wholly-owned subsidiary of the Company. In connection with the Merger, the Company issued 24.3 million shares of its common stock, which represents approximately 45% of the issued and outstanding shares of Company common stock after giving effect to such issuance. Based upon the closing price of the Company’s common stock on January 13, 2025, the equity portion of the purchase consideration was $2,481,368.
Prior to the closing of the Merger, on January 13, 2025, the Company purchased an aggregate principal amount of $98,075 of the outstanding (i) Solid Waste Disposal Facility Revenue Bonds (Arch Resources Project), Series 2020, and (ii) Solid Waste Disposal Facility Revenue Bonds (Arch Resources Project), Series 2021 (together, the “Arch Bonds”), which were issued by the West Virginia Economic Development Authority for the benefit of Arch (the “Arch Bond Purchase”). The Company also consented to the release of all liens, mortgages and security interests granted or purported to be granted pursuant to the security documents relating to the Arch Bonds and to the termination of all such security documents. The $98,075 of Arch Bonds purchased by the Company constituted all of the outstanding Arch Bonds. Upon the closing of the Merger, the pre-existing contractual relationship between the Company and Arch resulting from the Arch Bond Purchase became an intercompany relationship on a consolidated basis and, as such, was effectively settled upon the closing of the Merger on January 14, 2025. As such, total consideration transferred has been adjusted for the effect of the Arch Bond Purchase and assumed liabilities exclude the obligations that were effectively settled.
The settlement of this pre-existing relationship between the Company and Arch did not result in any material gain or loss. The Arch Bonds were successfully remarketed and reissued on March 27, 2025 to third-party investors. See Note 13—Long-Term Debt for additional information.
The Merger joined two proven leadership teams and operating platforms to establish Core, a premier North American coal producer and exporter of high-quality, low-cost coals with offerings ranging from metallurgical to high calorific value and other thermal coals. With mining operations and terminal facilities across six states, Core owns 11 mines, including one of the largest, lowest cost and highest calorific value thermal coal mining complexes in North America and one of the largest, lowest cost and highest quality metallurgical coal mine portfolios in the U.S. Core also has access to global markets via ownership interests in two export terminals on the U.S. Eastern seaboard, along with strategic connectivity to ports on the West Coast and the Gulf of America.
The Company recognized assets acquired and liabilities assumed at their fair value as of the closing date of the Merger. During the fourth quarter of 2025, the Company finalized the purchase price allocation. Adjustments to the purchase price allocation made during the year ended December 31, 2025 did not have a material impact on the Company’s financial results.
The following table presents the allocation of the aggregate purchase price based on the fair values of the assets acquired and liabilities assumed as of the closing date of the Merger:
|
|
|
|
|
|
|
|
|
|
|
Purchase Price Allocation |
| Total Equity Portion of Purchase Price Consideration |
|
$ |
2,481,368 |
|
| Effective Settlement of Pre-Existing Relationships |
|
95,636 |
|
| Total Consideration Transferred |
|
$ |
2,577,004 |
|
|
|
|
| Assets Acquired: |
|
|
| Cash and Cash Equivalents |
|
$ |
217,593 |
|
| Short-Term Investments |
|
22,969 |
|
| Trade Receivables, net |
|
161,670 |
|
| Other Receivables, net |
|
6,629 |
|
| Inventories |
|
307,175 |
|
| Other Current Assets |
|
13,366 |
|
| Property, Plant and Equipment, net |
|
2,607,835 |
|
| Funds for Asset Retirement Obligations |
|
150,033 |
|
| Other Noncurrent Assets, net |
|
152,553 |
|
| Total Assets Acquired |
|
$ |
3,639,823 |
|
| Liabilities Assumed: |
|
|
| Accounts Payable |
|
$ |
211,227 |
|
| Current Portion of Long-Term Debt |
|
4,104 |
|
| Other Accrued Liabilities |
|
154,651 |
|
| Long-Term Debt |
|
6,667 |
|
| Postretirement Benefits Other Than Pensions |
|
37,118 |
|
| Pneumoconiosis Benefits |
|
111,313 |
|
| Asset Retirement Obligations |
|
248,773 |
|
| Workers’ Compensation |
|
36,254 |
|
| Salary Retirement |
|
786 |
|
| Deferred Income Taxes |
|
158,471 |
|
| Other Noncurrent Liabilities |
|
93,455 |
|
| Total Liabilities Assumed |
|
$ |
1,062,819 |
|
| Net Assets Acquired |
|
$ |
2,577,004 |
|
The fair value and gross contractual amount of receivables acquired was $168,299, substantially all of which has been collected as of December 31, 2025.
The fair value of acquired property, plant and equipment, which primarily includes mineral reserves and real and personal property, was measured using a combination of cost and income approaches based on inputs that are not observable in the market and, as such, are Level 3 fair value measurements. Significant inputs used in the income approach included estimates of forecasted cash flows, which are impacted by estimates of realized coal prices in the determination of forecasted revenue, estimates of forecasted operating and capital expenditures, and others. Significant inputs used in the cost approach included, but were not limited to, the replacement costs for similar assets, relative age of the assets, and any potential economic or functional obsolescence associated with the assets. The application of purchase accounting resulted in fair value adjustments of approximately $1.4 billion.
As part of the purchase price allocation, the Company identified certain intangible assets and liabilities related to contracts for which the contractual terms were identified as being favorable or unfavorable in relation to current market terms. The fair values of the identified intangible assets and liabilities were approximately $84 million and $37 million, which were included in Other Noncurrent Assets, net and Other Noncurrent Liabilities, respectively, on the Consolidated Balance Sheet at December 31, 2025.
The fair values of the identified intangible assets and liabilities were determined using the income approach based on inputs that are not observable in the market and, as such, are Level 3 fair value measurements. Significant inputs to the valuation of the identified intangible assets and liabilities included future revenue estimates, future cost assumptions, estimated contract renewals, a discount rate assumption and an estimated required rate of return on the assets, among others. The identified intangible assets and liabilities are amortized over each contractual term, which ranges from one to five years, or a weighted-average period of 1.6 years, which reflects the pattern in which the Company expects to consume the economic benefits of the net assets. Amortization expense was approximately $32 million for the year ended December 31, 2025. The Company expects to recognize remaining amortization expense of approximately 16% of the total contract value in 2026, 16% in 2027 and the remaining 2% in 2028 and 2029.
The Consolidated Statement of (Loss) Income for the year ended December 31, 2025 includes Revenues of $2,048,154 and a Loss Before Income Tax of $431,393 attributable to Arch since the closing of the Merger on January 14, 2025.
The table below summarizes the Company’s results as though the Merger had been consummated on January 1, 2024:
|
|
|
|
|
|
|
|
|
|
|
|
|
|
|
|
|
Year Ended December 31, |
|
|
2025 |
|
2024 |
Revenues (a) |
|
$ |
4,215,482 |
|
|
$ |
4,599,302 |
|
Net (Loss) Income (a) |
|
$ |
(110,490) |
|
|
$ |
80,918 |
|
(a) Pro forma information for the year ended December 31, 2025 includes Arch’s historical results for the January 1, 2025 through January 13, 2025 period prior to the Merger excluding Merger-related costs.
The unaudited pro forma information is based on historical information and is adjusted for depreciation, depletion and amortization related to the fair value adjustments of property, plant and equipment and intangible assets (as discussed above), assuming the fair value adjustments had been applied from January 1, 2024.
The unaudited pro forma financial information for the year ended December 31, 2024 also includes $161,102 of non-recurring pro forma adjustments (before tax) directly attributable to the Merger, which are comprised primarily of $92,698 of transaction and employee-related costs incurred by Arch and the Company prior to the closing of the Merger and $65,845 of Merger-related costs incurred subsequent to the closing of the Merger and $2,559 of non-recurring expense related to the fair value adjustment to inventory. The Merger-related costs and non-recurring expense related to the fair value adjustment to inventory incurred subsequent to the closing of the Merger are included in General and Administrative Costs and Cost of Sales, respectively, in the accompanying Consolidated Statement of (Loss) Income for the year ended December 31, 2025, but, for the purpose of presenting the unaudited pro forma financial information above, have been removed from the 2025 period and included in the year ended December 31, 2024 to give effect to the Merger as if it closed on January 1, 2024. Pro forma adjustments were tax-effected at the statutory tax rate of 21% for purposes of calculating net (loss) income in the table above.
The pro forma information does not include any anticipated cost savings or other effects of the Merger. Accordingly, the unaudited pro forma information does not necessarily reflect the actual results that would have occurred, nor is it necessarily indicative of future results of operations.
NOTE 3—REVENUE FROM CONTRACTS WITH CUSTOMERS:
The following tables disaggregate the Company’s revenue from contracts with customers by product type and market:
|
|
|
|
|
|
|
|
|
|
|
|
|
|
|
|
|
|
|
Year Ended December 31, 2025 |
|
Domestic |
|
Export |
|
Total |
| Power Generation |
$ |
1,531,509 |
|
|
$ |
328,918 |
|
|
$ |
1,860,427 |
|
| Industrial |
132,628 |
|
|
807,540 |
|
|
940,168 |
|
| Metallurgical |
157,183 |
|
|
1,171,703 |
|
|
1,328,886 |
|
| Total Coal Revenue |
1,821,320 |
|
|
2,308,161 |
|
|
4,129,481 |
|
| Third-Party Terminal Revenue |
|
|
|
|
21,477 |
|
| Other Revenue |
|
|
|
|
13,817 |
|
| Total Revenue from Contracts with Customers |
|
|
|
|
$ |
4,164,775 |
|
|
|
|
|
|
|
|
|
|
|
|
|
|
|
|
|
|
|
|
Year Ended December 31, 2024 |
|
Domestic |
|
Export |
|
Total |
| Power Generation |
$ |
649,056 |
|
|
$ |
257,065 |
|
|
$ |
906,121 |
|
| Industrial |
19,811 |
|
|
732,806 |
|
|
752,617 |
|
| Metallurgical |
44,861 |
|
|
414,035 |
|
|
458,896 |
|
| Total Coal Revenue |
713,728 |
|
|
1,403,906 |
|
|
2,117,634 |
|
| Third-Party Terminal Revenue |
|
|
|
|
31,064 |
|
| Other Revenue |
|
|
|
|
15,708 |
|
| Total Revenue from Contracts with Customers |
|
|
|
|
$ |
2,164,406 |
|
|
|
|
|
|
|
|
|
|
|
|
|
|
|
|
|
|
|
|
Year Ended December 31, 2023 |
|
Domestic |
|
Export |
|
Total |
| Power Generation |
$ |
672,509 |
|
|
$ |
399,506 |
|
|
$ |
1,072,015 |
|
| Industrial |
34,453 |
|
|
965,537 |
|
|
999,990 |
|
| Metallurgical |
10,671 |
|
|
376,059 |
|
|
386,730 |
|
| Total Coal Revenue |
717,633 |
|
|
1,741,102 |
|
|
2,458,735 |
|
| Third-Party Terminal Revenue |
|
|
|
|
47,900 |
|
|
|
|
|
|
|
| Total Revenue from Contracts with Customers |
|
|
|
|
$ |
2,506,635 |
|
Coal Revenue
The Company has disaggregated its coal revenue between domestic and export revenues, as well as between the industrial, power generation and metallurgical markets. Domestic coal revenue tends to be derived from contracts that typically have a term of one year or longer, and the pricing is typically fixed. Historically, export coal revenue tended to be derived from spot or shorter-term contracts with pricing determined closer to the time of shipment or based on a market index; however, the Company has secured several long-term export contracts with varying pricing arrangements.
The estimated transaction price from each of the Company’s contracts is based on the total amount of consideration to which the Company expects to be entitled under the contract. Included in the transaction price for certain coal supply contracts is the impact of variable consideration, including quality price adjustments, handling services and per ton price fluctuations based on certain coal sales price indices. The estimated transaction price for each contract is allocated to the Company’s performance obligations based on relative stand-alone selling prices determined at contract inception. The Company has determined that each ton of coal represents a separate and distinct performance obligation.
While the Company does, from time to time, experience costs of obtaining coal customer contracts with amortization periods greater than one year, those costs are generally immaterial. At December 31, 2025 and 2024, the Company did not have any capitalized costs to obtain customer contracts on its Consolidated Balance Sheets. For the years ended December 31, 2025, 2024 and 2023, the Company has not recognized any amortization of previously existing capitalized costs of obtaining customer contracts.
Further, the Company has not recognized any coal revenue in the current period that is not a result of current period performance.
Terminal Revenue
Terminal revenues are attributable to the Company’s Core Marine Terminal and include revenues earned from providing receipt and unloading of coal from rail cars, transporting coal from the receipt point to temporary storage or stockpile facilities located at the terminal, stockpiling, blending, weighing, sampling, redelivery and loading of coal onto vessels. Revenues for these services are earned and performance obligations are considered fulfilled as the services are performed.
The Core Marine Terminal does not normally experience material costs of obtaining customer contracts with amortization periods greater than one year. At December 31, 2025 and 2024, the Company did not have any capitalized costs to obtain customer contracts on its Consolidated Balance Sheets. For the years ended December 31, 2025, 2024 and 2023, the Company has not recognized any amortization of previously existing capitalized costs of obtaining terminal customer contracts. Further, the Company has not recognized any terminal revenue in the current period that is not a result of current period performance.
Other Revenue
Other revenue consists of revenue generated from carbon products and materials businesses led by CONSOL Innovations LLC, our wholly-owned subsidiary. This revenue is primarily comprised of sales of carbon-based tools, parts and materials that are used in the aerospace and other industries. Revenues for these products are earned and recognized as the tools are built and progress toward product completion. Additionally, other revenue consists of revenue generated from the processing of third-party coal at various mining complexes. Revenues for these services are earned and performance obligations are considered fulfilled as the services are performed.
Contract Balances
Contract assets, when present, are recorded separately from trade receivables in the Company’s Consolidated Balance Sheets and are reclassified to trade receivables as title passes to the customer and the Company’s right to consideration becomes unconditional. Credit is extended based on the Company’s assessment of several factors, including, but not limited to, a customer’s financial condition and ability to perform its obligations. The Company typically does not have material contract assets that are stated separately from trade receivables since the Company’s performance obligations are satisfied as control of the goods or services passes to the customer, thereby granting the Company an unconditional right to receive consideration. Contract liabilities relate to consideration received in advance of the satisfaction of the Company’s performance obligations. Contract liabilities are recognized as revenue at the point in time when control of the goods passes to the customer, or over time when services are provided.
Outstanding Performance Obligations
As of December 31, 2025, the Company had outstanding performance obligations to deliver coal related to contracts with customers. For contracts in which volumes and prices per ton were fixed or reasonably estimable, future estimated revenue totaled approximately $3.5 billion. The Company expects to satisfy approximately 52% of these performance obligations in 2026 with the remainder thereafter. Actual revenue recognized related to these contracts may differ materially due to price adjustments for coal quality and cost escalations, volume optionality provisions or other contractual terms. Revenue associated with contracts containing variable-based pricing mechanisms has been excluded from the figures above as it cannot be reasonably estimated.
NOTE 4—STOCK AND DEBT REPURCHASES:
In December 2017, the Company’s Board of Directors approved a program to repurchase, from time to time, the Company’s outstanding shares of common stock or its 11.00% Senior Secured Second Lien Notes due 2025 (the “Second Lien Notes”). This program terminated on December 31, 2024.
On February 18, 2025, the Company’s Board of Directors approved a capital return framework that involves a mix of dividends and share repurchases. The repurchase program permits the repurchase, from time to time, of the Company’s outstanding shares of common stock in an aggregate amount of up to $1 billion, subject to certain covenants under the Revolving Credit Facility and the Series 2025 Bonds Indentures (as defined in Note 13—Long-Term Debt) that may limit or restrict the Company’s ability to repurchase shares of its common stock.
Under the terms of the program, consistent with the previous program, the Company is permitted to make repurchases in the open market, in privately negotiated transactions, accelerated repurchase programs or in structured share repurchase programs. The Company is also authorized to enter into one or more 10b5-1 plans with respect to any of the repurchases. Any repurchases are to be funded from available cash on hand or short-term borrowings. The program does not obligate the Company to make any repurchases, and the program can be modified or suspended at any time at the Company’s discretion. The program is conducted in compliance with applicable legal requirements as well as any covenants or other requirements included in the Company’s credit agreements, receivables purchase agreements and indentures.
During the years ended December 31, 2025, 2024 and 2023, the Company repurchased and retired 3,088,520, 747,351 and 5,224,016 shares, respectively, of the Company’s common stock at an average price of $72.61, $89.49 and $75.69 per share, respectively. All remaining outstanding Second Lien Notes were redeemed by the Company during the year ended December 31, 2023, and thus, no open market repurchases of the Company’s Second Lien Notes were made during the years ended December 31, 2024 and 2023.
NOTE 5—INCOME TAXES:
The components of income tax (benefit) expense were as follows:
|
|
|
|
|
|
|
|
|
|
|
|
|
|
|
|
|
|
| |
Year Ended December 31, |
| |
2025 |
|
2024 |
|
2023 |
| Current: |
|
|
|
|
|
| U.S. Federal |
$ |
349 |
|
|
$ |
34,009 |
|
|
$ |
100,572 |
|
| U.S. State |
135 |
|
|
1,413 |
|
|
7,287 |
|
| |
484 |
|
|
35,422 |
|
|
107,859 |
|
| Deferred: |
|
|
|
|
|
| U.S. Federal |
(76,470) |
|
|
9,557 |
|
|
12,528 |
|
| U.S. State |
(4,501) |
|
|
(737) |
|
|
1,593 |
|
| |
(80,971) |
|
|
8,820 |
|
|
14,121 |
|
| |
|
|
|
|
|
| Total Income Tax (Benefit) Expense |
$ |
(80,487) |
|
|
$ |
44,242 |
|
|
$ |
121,980 |
|
During the year ended December 31, 2025, the Company adopted ASU 2023-09 Income Taxes prospectively. A reconciliation of income tax benefit and the amount computed by applying the statutory federal income tax rate of 21% to loss before income tax for the year ended December 31, 2025 is as follows:
|
|
|
|
|
|
|
|
|
|
|
|
|
|
|
|
|
|
|
|
|
Year Ended December 31, |
|
2025 |
|
|
|
|
|
Amount |
|
Percent |
|
|
|
|
|
|
|
|
| Statutory U.S. federal income tax rate |
$ |
(49,078) |
|
|
21.0 |
% |
|
|
|
|
|
|
|
|
State income taxes, net of federal tax benefit (a) |
(3,449) |
|
|
1.5 |
|
|
|
|
|
|
|
|
|
|
|
|
|
|
|
|
|
|
|
|
|
|
|
|
|
|
|
|
|
|
|
|
|
|
|
|
|
|
|
|
|
|
|
|
|
|
|
|
|
|
|
|
|
|
|
|
|
|
|
|
|
|
|
|
|
|
|
|
|
|
|
|
|
|
|
|
|
|
|
|
|
|
|
|
|
|
|
|
|
|
|
|
|
| Research and development tax credits |
(750) |
|
|
0.3 |
|
|
|
|
|
|
|
|
|
|
|
|
|
|
|
|
|
|
|
|
|
| Nontaxable or nondeductible items: |
|
|
|
|
|
|
|
|
|
|
|
| Excess tax depletion |
(36,346) |
|
|
15.6 |
|
|
|
|
|
|
|
|
|
| Compensation |
6,896 |
|
|
(3.0) |
|
|
|
|
|
|
|
|
|
| Other |
2,017 |
|
|
(0.9) |
|
|
|
|
|
|
|
|
|
| Changes in unrecognized tax positions |
(843) |
|
|
0.4 |
|
|
|
|
|
|
|
|
|
| Other adjustments |
1,066 |
|
|
(0.5) |
|
|
|
|
|
|
|
|
|
| Income Tax Benefit / Effective Rate |
$ |
(80,487) |
|
|
34.4 |
% |
|
|
|
|
|
|
|
|
(a) State taxes in Pennsylvania, Maryland and West Virginia made up the majority of the tax effect in this category for the year ended December 31, 2025.
A reconciliation of income tax expense and the amount computed by applying the statutory federal income tax rate of 21% to earnings before income tax for the years ended December 31, 2024 and 2023 is as follows:
|
|
|
|
|
|
|
|
|
|
|
|
|
|
|
|
|
|
|
|
|
|
|
|
| |
Year Ended December 31, |
| |
2024 |
|
2023 |
| |
Amount |
|
Percent |
|
Amount |
|
Percent |
| Statutory U.S. federal income tax rate |
$ |
69,436 |
|
|
21.0 |
% |
|
$ |
163,353 |
|
|
21.0 |
% |
| State income taxes, net of federal tax benefit |
3,017 |
|
|
0.9 |
|
|
7,618 |
|
|
1.0 |
|
|
|
|
|
|
|
|
|
| Excess tax depletion |
(22,397) |
|
|
(6.8) |
|
|
(26,802) |
|
|
(3.5) |
|
| Foreign derived intangible income |
(4,501) |
|
|
(1.4) |
|
|
(23,545) |
|
|
(3.0) |
|
| Uncertain tax positions |
(1,452) |
|
|
(0.4) |
|
|
36 |
|
|
— |
|
| Compensation |
1,480 |
|
|
0.5 |
|
|
2,284 |
|
|
0.3 |
|
|
|
|
|
|
|
|
|
| Tax credits |
(1,000) |
|
|
(0.3) |
|
|
(700) |
|
|
(0.1) |
|
| State rate change and prior period adjustments |
(644) |
|
|
(0.2) |
|
|
(809) |
|
|
(0.1) |
|
| Other |
303 |
|
|
0.1 |
|
|
545 |
|
|
0.1 |
|
| Income Tax Expense / Effective Rate |
$ |
44,242 |
|
|
13.4 |
% |
|
$ |
121,980 |
|
|
15.7 |
% |
Significant components of deferred tax assets and liabilities were as follows:
|
|
|
|
|
|
|
|
|
|
|
|
| |
December 31, |
| |
2025 |
|
2024 |
| Deferred Tax Asset: |
|
|
|
| Net operating loss |
$ |
222,317 |
|
|
$ |
1,097 |
|
| Pneumoconiosis benefits |
59,729 |
|
|
31,663 |
|
| Postretirement benefits other than pensions |
44,587 |
|
|
40,226 |
|
| Asset retirement obligations |
43,406 |
|
|
40,445 |
|
|
|
|
|
|
|
|
|
|
|
|
|
|
|
|
|
|
|
|
|
|
|
|
|
|
|
|
|
|
|
|
|
|
|
|
|
| Other |
55,568 |
|
|
43,638 |
|
| Total Deferred Tax Asset |
425,607 |
|
|
157,069 |
|
| Valuation Allowance |
(75,338) |
|
|
— |
|
| Net Deferred Tax Asset |
350,269 |
|
|
157,069 |
|
| |
|
|
|
| Deferred Tax Liability: |
|
|
|
| Equity Partnerships |
(410,966) |
|
|
(155,039) |
|
| Property, plant and equipment |
(54,626) |
|
|
(39,154) |
|
| Other |
(14,790) |
|
|
(12,090) |
|
|
|
|
|
|
|
|
|
|
|
|
|
| Total Deferred Tax Liability |
(480,382) |
|
|
(206,283) |
|
| |
|
|
|
| Net Deferred Tax Liability |
$ |
(130,113) |
|
|
$ |
(49,214) |
|
At December 31, 2025, the Company had gross federal net operating loss carryforwards of $717,286. Of these carryforwards, $112,605 will expire, if not utilized, starting in 2037. The remaining carryforwards have no expiration; however, they can only be used to offset 80% of the Company’s U.S. federal taxable income in any taxable year.
At December 31, 2025, the net operating loss deferred tax asset of $222,317 comprised federal and state components of $150,636 and $71,681, respectively. Certain state net operating loss carryforwards will begin to expire starting in 2026.
The Company assesses the need for a valuation allowance against its deferred tax assets, including temporary differences and tax attributes, through a review of all available positive and negative evidence. On the basis of this assessment, as of December 31, 2025, the Company had a valuation allowance against certain state net operating loss and capital loss carryforwards.
A reconciliation of the beginning and ending amount of the valuation allowance is as follows:
|
|
|
|
|
|
|
|
|
|
| |
Year Ended December 31, |
| |
2025 |
|
|
|
|
| Balance at January 1 |
$ |
— |
|
|
|
|
|
| Valuation Allowance Acquired in Merger |
77,269 |
|
|
|
|
|
|
|
|
|
|
|
| Deductions |
(1,931) |
|
|
|
|
|
Balance at December 31 (a) |
$ |
75,338 |
|
|
|
|
|
(a) There were no valuation allowances during the years ended December 31, 2024 and 2023.
Income Taxes Paid
Income taxes paid by jurisdiction were as follows:
|
|
|
|
|
|
|
|
|
|
|
Year Ended December 31, |
|
2025 |
|
|
|
|
| U.S. federal income taxes paid, net of refunds received |
$ |
450 |
|
|
|
|
|
| State and local income taxes paid, net of refunds received |
50 |
|
|
|
|
|
|
|
|
|
|
|
|
|
|
|
|
|
|
|
|
|
|
|
| Total Income Taxes Paid |
$ |
500 |
|
|
|
|
|
Unrecognized Tax Benefits
The Company utilizes the “more likely than not” standard in recognizing a tax benefit in its financial statements. A reconciliation of the beginning and ending amount of unrecognized tax benefits is as follows:
|
|
|
|
|
|
|
|
|
|
|
|
|
|
|
|
|
|
| |
Year Ended December 31, |
| |
2025 |
|
2024 |
|
2023 |
| Balance at January 1 |
$ |
— |
|
|
$ |
1,987 |
|
|
$ |
1,941 |
|
| Additions based on tax positions related to the current year |
— |
|
|
— |
|
|
22 |
|
| Additions for tax positions of prior years |
6,808 |
|
|
— |
|
|
24 |
|
|
|
|
|
|
|
| Reductions due to the statute of limitations |
(855) |
|
|
— |
|
|
— |
|
| Settlements |
— |
|
|
(1,987) |
|
|
— |
|
| Balance at December 31 |
$ |
5,953 |
|
|
$ |
— |
|
|
$ |
1,987 |
|
If recognized, the Company’s unrecognized tax benefits at December 31, 2025 would impact the effective tax rate. The Company recognizes interest and penalties related to unrecognized tax benefits in income tax expense. The Company had no accrued interest and penalties at December 31, 2025 and 2024.
The Company expects a decrease in its net unrecognized tax benefits of $844 during the next 12 months due to the expiration of statutes.
The Company is primarily subject to taxation in the U.S. and its various states. Due to the existence of federal and state net operating losses, the Company’s federal and state income tax returns may be open to examination beyond the typical statutes of limitations periods.
NOTE 6—CASH AND CASH EQUIVALENTS, RESTRICTED CASH AND SHORT-TERM INVESTMENTS:
The following table disaggregates the Company’s cash, cash equivalents and restricted cash, which reconciles to the total shown on the Consolidated Statements of Cash Flows:
|
|
|
|
|
|
|
|
|
|
|
|
|
December 31, |
|
2025 |
|
2024 |
| Cash and Cash Equivalents |
$ |
432,174 |
|
|
$ |
408,240 |
|
Restricted Cash - Current (a) |
37,403 |
|
|
39,302 |
|
Restricted Cash - Noncurrent (a) |
131,585 |
|
|
— |
|
| Cash and Cash Equivalents and Restricted Cash |
$ |
601,162 |
|
|
$ |
447,542 |
|
(a) Restricted Cash - Current and Restricted Cash - Noncurrent are included in Other Current Assets and Funds for Asset Retirement Obligations, respectively, in the accompanying Consolidated Balance Sheets.
The Company had invested in marketable debt securities, primarily comprised of highly liquid U.S. Treasury securities. These investments were held in the custody of financial institutions. The securities outstanding were classified as available-for-sale securities, matured within 12 months of the acquisition date and were classified as current assets accordingly. During the first quarter of 2025, the Company liquidated its remaining investments in U.S. Treasury securities.
The Company’s investments in available-for-sale securities were as follows:
|
|
|
|
|
|
|
|
|
|
|
|
|
|
|
|
|
|
|
|
|
|
|
|
|
|
|
|
|
|
|
December 31, 2024 |
|
Amortized Cost |
|
Allowance for Credit Losses |
|
Gross Unrealized |
|
|
|
|
|
Gains |
|
Losses |
|
Fair Value |
| U.S. Treasury Securities |
$ |
51,885 |
|
|
$ |
— |
|
|
$ |
120 |
|
|
$ |
(12) |
|
|
$ |
51,993 |
|
Available-for-sale investments are reported at fair value in the accompanying Consolidated Balance Sheets, and any unrealized gains or losses are recognized in Accumulated Other Comprehensive Loss. Any unrealized gains or losses in the Company’s portfolio are a result of normal market fluctuations. Interest and dividends are included in net income when earned.
NOTE 7—CREDIT LOSSES:
Trade receivables are recorded at the invoiced amount. Credit is extended based on the Company’s assessment of several factors, including, but not limited to, a customer’s financial condition and ability to perform its obligations. Trade receivable balances are monitored against approved credit terms. Credit terms are reviewed and adjusted as considered necessary based on changes to a customer’s credit profile. If a customer’s credit deteriorates, the Company may reduce credit risk exposure by reducing credit terms, obtaining letters of credit, obtaining credit insurance or requiring pre-payment for shipments. Other non-trade contractual arrangements consist primarily of overriding royalty agreements and other financial arrangements between the Company and various counterparties.
The Company may be at risk of exposure to credit losses primarily through sales of products and services. The Company’s expected loss allowance methodology for accounts receivable is developed using historical collection experience, current and future economic and market conditions and a review of the current status of customers’ trade and other accounts receivables. Due to the short-term nature of such receivables, the estimate of the amount of accounts receivable that may not be collected is based on an aging of the accounts receivable balances and the financial condition of customers. Additionally, specific allowance amounts may be necessary from time to time and are established to record the appropriate provision for customers that have a higher probability of default. The Company’s monitoring activities include timely account reconciliations, dispute resolution, payment confirmation and consideration of macroeconomic conditions and customers’ financial conditions. Balances are written off when deemed uncollectible.
Management estimates the allowance balance using relevant available information, from internal and external sources, relating to past events, current conditions and reasonable and supportable forecasts. Historical credit loss experience provides the basis for the estimation of expected credit losses. Adjustments to historical loss information are made for changes to the assessment of anticipated payment, changes in economic conditions, current industry trends in the markets the Company serves and changes in the financial health of the Company’s counterparties.
The following table provides a reconciliation of the allowance for credit losses that is deducted from the amortized cost basis of accounts receivable and other non-trade contractual arrangements to present the net amount expected to be collected:
|
|
|
|
|
|
|
|
|
|
|
|
| |
Trade Receivables |
|
Other Non-Trade
Contractual Arrangements |
| Beginning Balance, December 31, 2024 |
$ |
1,265 |
|
|
$ |
7,625 |
|
| Provision for expected credit losses |
(620) |
|
|
(132) |
|
| Write-off of uncollectible accounts |
— |
|
|
(740) |
|
| Ending Balance, December 31, 2025 |
$ |
645 |
|
|
$ |
6,753 |
|
NOTE 8—ASSET RETIREMENT OBLIGATIONS:
The reconciliation of changes in the Company’s asset retirement obligations is as follows:
|
|
|
|
|
|
|
|
|
|
|
|
| |
December 31, |
| |
2025 |
|
2024 |
| Balance at Beginning of Period |
$ |
247,732 |
|
|
$ |
241,192 |
|
| Accretion Expense |
42,297 |
|
|
19,727 |
|
| Payments |
(36,205) |
|
|
(30,089) |
|
| Revisions in Estimated Cash Flows |
26,442 |
|
|
16,902 |
|
| Obligations Assumed in Merger |
254,474 |
|
|
— |
|
|
|
|
|
Balance at End of Period (a) |
$ |
534,740 |
|
|
$ |
247,732 |
|
(a) Includes current portion of $38,738 and $35,554 at December 31, 2025 and 2024, respectively.
Through December 31, 2025, the Company has contributed $131,585 to a fund that will serve to defease the long-term asset retirement obligation for its Powder River Basin thermal asset base; this amount is included in Funds for Asset Retirement Obligations on the Consolidated Balance Sheets.
On October 2, 2024, three Company subsidiaries voluntarily entered into a Post-Mining Discharge Treatment Trust Consent Order and Agreement (“CO&A”) with the Pennsylvania Department of Environmental Protection (“PADEP”). The CO&A serves as an approved alternative financial assurance mechanism associated with the Company’s perpetual water treatment obligations located in Pennsylvania and establishes a Global Water Treatment Trust Fund (“WTTF”). The WTTF is a long-term funding mechanism for 22 legacy mine water treatment systems (“treatment systems”) in Pennsylvania. The Company intends to make minimum annual contributions of $2,000 until the cash balance of the fund equals 100% of the present value of future operation, maintenance and recapitalization costs for the treatment systems, currently estimated to be $74,795. As the cash balance of the fund grows, surety bonds associated with the treatment systems will be adjusted or released by the PADEP, thereby reducing the Company’s exposure to surety bonds and related collateral requirements. Through December 31, 2025, the Company has contributed $14,066 to the fund, and the PADEP has approved bond reductions totaling $66,294.
During the years ended December 31, 2025 and 2024, the Company’s contributions into the WTTF were managed and invested, at the direction of the trustee in accordance with the trust agreement, into various debt and equity securities. These investments are held in the custody of the WTTF trustee. These investments are classified as available-for-sale securities.
The Company’s investments in available-for-sale securities are as follows:
|
|
|
|
|
|
|
|
|
|
|
|
|
|
|
|
|
|
|
|
|
|
|
|
|
|
|
|
|
|
|
Amortized Cost |
|
Allowance for Credit Losses |
|
Gross Unrealized |
|
|
| Funds for Asset Retirement Obligations |
|
|
Gains |
|
Losses |
|
Fair Value |
| December 31, 2025 |
$ |
15,546 |
|
|
$ |
— |
|
|
$ |
2,403 |
|
|
$ |
(660) |
|
|
$ |
17,289 |
|
| December 31, 2024 |
$ |
12,112 |
|
|
$ |
— |
|
|
$ |
87 |
|
|
$ |
(145) |
|
|
$ |
12,054 |
|
Available-for-sale investments are reported at fair value in the accompanying Consolidated Balance Sheets, and any unrealized gains or losses are recognized in Other Comprehensive Income (Loss), net of tax. Any unrealized gains or losses in the Company’s portfolio are a result of normal market fluctuations. Interest, dividends and realized gains or losses are included in net income when earned.
NOTE 9—INVENTORIES:
Inventories consisted of the following:
|
|
|
|
|
|
|
|
|
|
|
|
| |
December 31, |
| |
2025 |
|
2024 |
| Coal |
$ |
148,891 |
|
|
$ |
17,480 |
|
| Supplies |
225,868 |
|
|
78,721 |
|
| Total Inventories |
$ |
374,759 |
|
|
$ |
96,201 |
|
NOTE 10—PROPERTY, PLANT AND EQUIPMENT:
Property, plant and equipment consisted of the following:
|
|
|
|
|
|
|
|
|
|
|
|
| |
December 31, |
| |
2025 |
|
2024 |
| Plant and Equipment |
$ |
4,876,926 |
|
|
$ |
3,633,741 |
|
| Coal Properties and Surface Lands |
2,241,915 |
|
|
913,819 |
|
| Airshafts |
591,146 |
|
|
521,334 |
|
| Mine Development |
690,845 |
|
|
366,260 |
|
| Advance Mining Royalties |
329,970 |
|
|
328,927 |
|
| Total Property, Plant and Equipment |
8,730,802 |
|
|
5,764,081 |
|
| Less: Accumulated Depreciation, Depletion and Amortization |
4,343,920 |
|
|
3,842,382 |
|
| Total Property, Plant and Equipment - Net |
$ |
4,386,882 |
|
|
$ |
1,921,699 |
|
As of December 31, 2025 and 2024, property, plant and equipment included gross assets under finance leases of $71,462 and $40,804, respectively. Accumulated amortization for finance leases was $15,230 and $16,929 at December 31, 2025 and 2024, respectively. Amortization expense for assets under finance leases was $13,147, $9,814 and $25,400 for the years ended December 31, 2025, 2024 and 2023, respectively, and is included in Depreciation, Depletion and Amortization in the accompanying Consolidated Statements of (Loss) Income. See Note 14—Leases for further discussion of finance leases.
NOTE 11—ACCOUNTS RECEIVABLE SECURITIZATION:
Certain U.S. subsidiaries of Core Natural Resources, Inc. are parties to a trade accounts receivable securitization facility with financial institutions for the sale on a continuous basis of eligible trade accounts receivable. On July 28, 2025, the Company and certain of its subsidiaries entered into (i) that certain Receivables Financing Agreement (the “Receivables Financing Agreement”), by and among Core Receivable Company, LLC, as borrower (“Core Receivable”), Core Sales, LLC, as the initial servicer (the “Servicer”), PNC Bank, National Association (“PNC”), as administrative agent and LC bank, PNC Capital Markets LLC (“PNC CM”), as structuring agent, and the lenders from time to time party thereto; (ii) that certain Third Amended and Restated Sale and Contribution Agreement (the “Sale and Contribution Agreement”), by and among Core Receivable, the Servicer and Arch, as transferor; (iii) that certain Third Amended and Restated Purchase and Sale Agreement (the “Purchase and Sale Agreement”), by and among Arch, the Servicer and the originators party thereto; and (iv) that certain Fifth Amended and Restated Performance Guaranty (the “Performance Guaranty” and, together with the Receivables Financing Agreement, the Sale and Contribution Agreement and the Purchase and Sale Agreement, the “Receivables Documents”), by the Company, in favor of PNC as administrative agent. With entry into the Receivables Documents, legacy Arch’s securitization facility was amended and restated in its entirety to, among other things, consolidate facilities and extend the maturity date to July 27, 2028, and legacy CONSOL’s securitization facility was terminated effective July 28, 2025.
Pursuant to the Receivables Documents, Core Sales, LLC; Mingo Logan Coal LLC; Mountain Coal Company, L.L.C.; ICG Beckley, LLC; ICG Tygart Valley, LLC; Wolf Run Mining LLC; Thunder Basin Coal Company, L.L.C.; CONSOL Pennsylvania Coal Company LLC; Core Marine Terminals LLC; and Itmann Mining Company LP, all wholly-owned subsidiaries of the Company, sell or contribute trade receivables to Core Receivable, a special purpose vehicle and wholly-owned subsidiary of the Company (together with the special purpose vehicle associated with legacy CONSOL’s securitization facility, the “SPVs”). Core Receivable, in turn, pledges its interests in the receivables to PNC and Regions Bank, each of which either makes loans or issues letters of credit on behalf of Core Receivable. The maximum amount of advances and letters of credit outstanding under the Receivables Financing Agreement may not exceed $250 million.
Loans under the Receivables Financing Agreement accrue interest at a reserve-adjusted market index rate equal to the applicable term Secured Overnight Financing Rate (“SOFR”) plus ten basis points. Loans and letters of credit under the Receivables Financing Agreement also accrue a drawn fee and a letter of credit participation fee, respectively, of 2.00% per annum. In connection with the Receivables Financing Agreement, Core Receivable paid certain structuring fees to PNC CM and pays other customary fees to the lenders, including a fee on unused commitments equal to 0.60% per annum.
At December 31, 2025, the Company’s eligible accounts receivable yielded $185,122 of borrowing capacity. At December 31, 2025, the facility had no outstanding borrowings and $158,282 of letters of credit outstanding, leaving available borrowing capacity of $26,840. At December 31, 2024, the Company’s eligible accounts receivable yielded $71,964 of borrowing capacity. At December 31, 2024, the facility had no outstanding borrowings and $71,922 of letters of credit outstanding, leaving available borrowing capacity of $42. Costs associated with the Receivables Financing Agreement totaled $3,672, $1,444 and $1,423 for the years ended December 31, 2025, 2024 and 2023, respectively. The Company has not derecognized any receivables due to its continued involvement in the collections efforts.
NOTE 12—OTHER ACCRUED LIABILITIES:
Other accrued liabilities consisted of the following:
|
|
|
|
|
|
|
|
|
|
|
|
| |
December 31, |
| |
2025 |
|
2024 |
| Subsidence Liability |
$ |
113,352 |
|
|
$ |
88,259 |
|
| Accrued Compensation and Benefits |
73,783 |
|
|
54,138 |
|
| Accrued Other Taxes |
53,038 |
|
|
6,973 |
|
| Other |
63,951 |
|
|
31,928 |
|
| Current Portion of Long-Term Liabilities: |
|
|
|
| Asset Retirement Obligations |
38,738 |
|
|
35,554 |
|
| Pneumoconiosis Benefits |
24,539 |
|
|
16,389 |
|
| Postretirement Benefits Other than Pensions |
18,696 |
|
|
17,887 |
|
| Workers' Compensation |
18,241 |
|
|
11,056 |
|
| Total Other Accrued Liabilities |
$ |
404,338 |
|
|
$ |
262,184 |
|
NOTE 13—LONG-TERM DEBT:
Long-term debt consisted of the following:
|
|
|
|
|
|
|
|
|
|
|
|
|
December 31, |
|
2025 |
|
2024 |
WVEDA Solid Waste Disposal Facility Revenue Bonds due March 2035 at 5.45% |
$ |
106,355 |
|
|
$ |
— |
|
MEDCO Port Facilities Refunding Revenue Bonds due March 2035 at 5.00% and 5.75% at December 31, 2025 and 2024, respectively |
102,865 |
|
|
102,865 |
|
PEDFA Solid Waste Disposal Facility Revenue Bonds due March 2035 at 5.45% and 9.00% at December 31, 2025 and 2024, respectively |
97,560 |
|
|
75,000 |
|
Equipment Financing (7.55% Weighted-Average Interest Rate) |
79,665 |
|
|
— |
|
Advance Royalty Commitments (8.04% and 8.10% Weighted-Average Interest Rate at December 31, 2025 and 2024, respectively) |
11,407 |
|
|
6,148 |
|
| Other Debt Arrangements |
3,509 |
|
|
664 |
|
| Less: Unamortized Debt Issuance Costs |
(6,539) |
|
|
(1,213) |
|
|
394,822 |
|
|
183,464 |
|
Less: Current Portion of Long-Term Debt (a) |
(77,555) |
|
|
(103,940) |
|
| Long-Term Debt |
$ |
317,267 |
|
|
$ |
79,524 |
|
(a) Excludes current portion of Finance Lease Obligations of $20,773 and $8,925 at December 31, 2025 and 2024, respectively.
Annual undiscounted maturities on the Company’s debt instruments as of December 31, 2025 were as follows:
|
|
|
|
|
|
| Year ended December 31, |
Amount |
| 2026 |
$ |
77,555 |
|
| 2027 |
2,626 |
|
| 2028 |
2,214 |
|
| 2029 |
2,003 |
|
| 2030 |
6,532 |
|
| Thereafter |
310,431 |
|
| Total Long-Term Debt Maturities |
$ |
401,361 |
|
Revolving Credit Facility
In November 2017, the Company entered into a revolving credit facility with PNC (as amended, the “Revolving Credit Facility”). The Revolving Credit Facility has been amended several times, the most recent of which occurred in January 2025 in connection with the Merger. This amendment increased the available revolving commitments from $355 million to $600 million and extended the scheduled maturity date to April 30, 2029, provided that, if any of the MEDCO Bonds or PEDFA Bonds (as defined below) and any subsequent refinancings thereof remain outstanding 91 days prior to their stated maturity and our specified liquidity, as measured under the Revolving Credit Facility, is less than $250 million at that time, the maturity date of the Revolving Credit Facility will be such date. Additionally, the Company reduced the applicable interest rate margin on its borrowings and letters of credit under the Revolving Credit Facility by 75 basis points.
Borrowings under the Revolving Credit Facility bear interest at a floating rate that is, at the Company’s option, either (i) SOFR plus a SOFR adjustment of 0.10% plus an applicable margin or (ii) an alternate base rate plus an applicable margin. The applicable margin for the Revolving Credit Facility depends on the Company’s total net leverage ratio, and this rate resets quarterly. Obligations under the Revolving Credit Facility are guaranteed by (i) all owners of the PAMC held by the Company and (ii) subject to certain customary exceptions and agreed materiality thresholds, all other existing or future direct or indirect wholly-owned restricted subsidiaries of the Company, including subsidiaries acquired pursuant to the Merger. The obligations are secured by, subject to certain exceptions (including a limitation on pledges of equity interests in certain subsidiaries and certain thresholds with respect to real property), a first-priority lien on the Company’s and certain subsidiaries’ significant assets.
The Revolving Credit Facility contains a number of customary affirmative covenants and a number of negative covenants, including (subject to certain exceptions) limitations on (among other things): indebtedness, liens, investments, acquisitions, dispositions, restricted payments and prepayments of junior indebtedness.
The Revolving Credit Facility also includes covenants relating to (i) a maximum first lien gross leverage ratio, (ii) a maximum total net leverage ratio, and (iii) a minimum interest coverage ratio. The maximum first lien gross leverage ratio is calculated as the ratio of Consolidated First Lien Debt to Consolidated EBITDA. Consolidated EBITDA, as used in the covenant calculation, excludes non-cash compensation expenses, non-recurring transaction expenses, extraordinary gains and losses, gains and losses on discontinued operations and gains and losses on debt extinguishment. The maximum total net leverage ratio is calculated as the ratio of Consolidated Indebtedness, minus Cash on Hand, to Consolidated EBITDA. The minimum interest coverage ratio is calculated as the ratio of Consolidated EBITDA to Consolidated Cash Interest Expense. Consolidated Cash Interest Expense, as used in the covenant calculation, includes cash interest payments, net of any cash interest income. Under the Revolving Credit Facility, the maximum first lien gross leverage ratio shall be 1.50 to 1.00, the maximum total net leverage ratio shall be 2.50 to 1.00 and the minimum interest coverage ratio shall be 3.00 to 1.00.
The Company’s first lien gross leverage ratio was 0.28 to 1.00 at December 31, 2025. The Company’s total net leverage ratio was 0.03 to 1.00 at December 31, 2025. The Company’s interest coverage ratio was 35.10 to 1.00 at December 31, 2025. The Company was in compliance with all covenants under the Revolving Credit Facility as of December 31, 2025.
At December 31, 2025, the Revolving Credit Facility had no borrowings outstanding and $110,098 of letters of credit outstanding, leaving $489,902 of unused capacity. At December 31, 2024, the Revolving Credit Facility had no borrowings outstanding and $107,087 of letters of credit outstanding, leaving $247,913 of unused capacity. From time to time, the Company is required to post financial assurances to satisfy contractual and other requirements generated in the normal course of business. Some of these assurances are posted to comply with federal, state or other government agencies’ statutes and regulations. The Company sometimes uses letters of credit to satisfy these requirements, and these letters of credit reduce the Company’s borrowing facility capacity.
The SPVs are not guarantors of the Revolving Credit Facility, and the SPVs hold the assets pledged to the lenders or sell the assets to the lenders in the securitization facility. The SPVs had total assets of $350,156 and $133,853, comprised mainly of $347,093 and $133,694 trade receivables, net, at December 31, 2025 and 2024, respectively. For the years ended December 31, 2025, 2024 and 2023, net income attributable to the SPVs was $10,575, $46 and $5,129, respectively, which was primarily attributable to intercompany fees paid to purchase the receivables, which have been eliminated in the Consolidated Financial Statements in this Report. During the years ended December 31, 2025, 2024 and 2023, there were no borrowings or payments under the accounts receivable securitization facilities. See Note 11—Accounts Receivable Securitization for additional information.
Series 2025 Bonds
In connection with the Merger, on January 13, 2025, the Company purchased the Arch Bonds. The Company also consented to the release of all liens, mortgages and security interests granted or purported to be granted pursuant to the security documents relating to the Arch Bonds and to the termination of all such security documents. The $98,075 of Arch Bonds purchased by the Company constituted all of the outstanding Arch Bonds.
On March 27, 2025, the Company borrowed the proceeds of tax-exempt bonds issued by (i) the Pennsylvania Economic Development Financing Authority (“PEDFA”) in the aggregate principal amount of $97,560 (the “PEDFA Bonds”), at a fixed rate of 5.45% for an initial term of ten years on an unsecured basis, pursuant to a Bond Purchase Agreement, dated March 19, 2025, by and among Jefferies LLC, as the representative acting on behalf of itself, KeyBanc Capital Markets Inc., PNC CM, Goldman Sachs & Co. LLC, B. Riley Securities, Inc. and TCBI Securities, Inc. (collectively, the “Underwriters”), PEDFA and the Company; (ii) the Maryland Economic Development Corporation (“MEDCO”) in the aggregate principal amount of $102,865 (the “MEDCO Bonds”), at a fixed rate of 5.00% for an initial term of ten years on an unsecured basis, pursuant to a Bond Purchase Agreement, dated March 19, 2025, by and among the Underwriters, MEDCO and the Company; and (iii) the West Virginia Economic Development Authority (“WVEDA”) in the aggregate principal amount of $106,355 (the “WVEDA Bonds” and together with the PEDFA Bonds and the MEDCO Bonds, the “Series 2025 Bonds”), at a fixed rate of 5.45% for an initial term of ten years on an unsecured basis, pursuant to a Bond Purchase Agreement, dated March 19, 2025, by and among the Underwriters, WVEDA and the Company.
The Company used (i) a portion of the proceeds of the PEDFA Bonds to finance and refinance the costs of acquisition, construction, improvement, installation and equipping of certain solid waste disposal facilities located at the Central Preparation Plant in West Finley, Pennsylvania in part by refunding in full PEDFA’s outstanding $75,000 Solid Waste Disposal Revenue Bonds, Series 2021A (CONSOL Energy Inc. Project), (ii) the proceeds from the MEDCO Bonds to refinance the costs of acquisition, construction, improvement, installation and equipping of certain improvements, modifications and additions to a coal transshipment terminal located in the Canton area of the Port of Baltimore by refunding in full MEDCO’s outstanding $102,865 Port Facilities Refunding Revenue Bonds (CNX Marine Terminals Inc.
Port of Baltimore Facility) Series 2010 and (iii) a portion of the proceeds of the WVEDA Bonds to finance and refinance the costs of acquisition, construction, improvement, installation and equipping of certain solid waste disposal facilities relating to a longwall coal mining complex known as the Leer South Mine located in Barbour County, West Virginia in part by refunding in full WVEDA’s outstanding $53,090 Solid Waste Disposal Facility Revenue Bonds (Arch Resources Project), Series 2020 and $44,985 Solid Waste Disposal Facility Revenue Bonds (Arch Resources Project), Series 2021.
The (i) PEDFA Bonds were issued pursuant to an indenture (the “PEDFA Indenture”), dated March 1, 2025, by and between PEDFA and Wilmington Trust, National Association, as trustee (the “Trustee”), and PEDFA made a loan of the proceeds of the PEDFA Bonds to the Company pursuant to a Loan Agreement, dated March 1, 2025 (the “PEDFA Loan Agreement”), between PEDFA and the Company; (ii) MEDCO Bonds were issued pursuant to an indenture (the “MEDCO Indenture”), dated March 1, 2025, by and between MEDCO and the Trustee, and MEDCO made a loan of the proceeds of the MEDCO Bonds to the Company pursuant to a Loan Agreement, dated March 1, 2025 (the “MEDCO Loan Agreement”), between MEDCO and the Company; and (iii) WVEDA Bonds were issued pursuant to an indenture (the “WVEDA Indenture” and together with the PEDFA Indenture and the MEDCO Indenture, the “Series 2025 Bonds Indentures”), dated March 1, 2025, by and between WVEDA and the Trustee, and WVEDA made a loan of the proceeds of the WVEDA Bonds to the Company pursuant to a Loan Agreement, dated as of March 1, 2025 (the “WVEDA Loan Agreement” and together with the PEDFA Loan Agreement and MEDCO Loan Agreement, the “Loan Agreements”), between WVEDA and the Company. Under the terms of the Loan Agreements, the Company agreed to make all payments of principal, interest and other amounts at any time due on the respective Series 2025 Bonds or under the respective Series 2025 Bonds Indentures.
As a result of these transactions, a loss of $11,680 was incurred and is recorded in Loss on Debt Extinguishment on the Consolidated Statements of (Loss) Income for the year ended December 31, 2025.
NOTE 14—LEASES:
The Company has operating leases for mining and other equipment used in operations and office space. Many leases include one or more options to renew, some of which include options to extend, and some leases include options to terminate or buy out the leases within a set period of time. In certain of the Company’s lease agreements, the rental payments are adjusted periodically to reflect actual charges incurred for inflation or changes in other indexes. Historically, many of the Company’s operating lease payments for mining equipment contained a variable component which was calculated based upon production metrics such as feet of advance or raw tonnage mined. While most of the Company’s leases contain clauses regarding the general condition of the equipment upon lease termination, they do not contain residual value guarantees.
The Company determines if an arrangement is an operating or finance lease at inception of the applicable lease. Right of Use (“ROU”) assets represent the Company’s right to use an underlying asset for the lease term and lease liabilities represent an obligation to make lease payments arising from the lease. ROU assets and lease liabilities are recognized at the lease commencement date based on the present value of lease payments over the lease term. As most of the Company’s leases do not provide an implicit interest rate, the Company uses its incremental borrowing rate based on the information available on the commencement date in determining the present value of lease payments. The ROU asset also consists of any prepaid lease payments, lease incentives received and costs which will be incurred in exiting a lease. The lease terms used to calculate the ROU asset and related lease liability include options to extend or terminate the lease when it is reasonably certain that the Company will exercise that option. Lease expense for operating leases is recognized on a straight-line basis over the lease term as an operating expense while the expense for finance leases is recognized as depreciation expense and interest expense using the interest method of recognition. Further, the Company made an accounting policy election not to apply the recognition and measurement requirements to short-term leases, defined as leases with an initial term of 12 months or less. For the years ended December 31, 2025, 2024 and 2023, these short-term leases were not material to the Company’s financial statements.
The components of operating lease expense were as follows:
|
|
|
|
|
|
|
|
|
|
|
|
|
|
|
|
|
|
| |
Year Ended December 31, |
| |
2025 |
|
2024 |
|
2023 |
| Fixed operating lease expense |
$ |
3,385 |
|
|
$ |
4,850 |
|
|
$ |
6,447 |
|
| Variable operating lease expense |
— |
|
|
6,373 |
|
|
8,358 |
|
| Total operating lease expense |
$ |
3,385 |
|
|
$ |
11,223 |
|
|
$ |
14,805 |
|
Supplemental cash flow information related to the Company’s operating leases was as follows:
|
|
|
|
|
|
|
|
|
|
|
|
|
|
|
|
|
|
|
Year Ended December 31, |
|
2025 |
|
2024 |
|
2023 |
| Cash paid for amounts included in the measurement of operating lease liabilities |
$ |
3,483 |
|
|
$ |
4,787 |
|
|
$ |
6,148 |
|
The following table presents the lease balances within the Consolidated Balance Sheets, the weighted-average lease term and the weighted-average discount rate related to the Company’s operating leases:
|
|
|
|
|
|
|
|
|
|
|
|
|
|
|
|
|
|
| |
|
|
December 31, |
| Lease Assets and Liabilities |
Balance Sheet Classification |
|
2025 |
|
2024 |
| Assets: |
|
|
|
|
|
| Operating Lease ROU Assets |
Other Noncurrent Assets, net |
|
$ |
12,520 |
|
|
$ |
5,513 |
|
| |
|
|
|
|
|
| Liabilities: |
|
|
|
|
|
| Current: |
|
|
|
|
|
| Operating Lease Liabilities |
Other Accrued Liabilities |
|
$ |
2,624 |
|
|
$ |
612 |
|
| Long-Term: |
|
|
|
|
|
| Operating Lease Liabilities |
Other Noncurrent Liabilities |
|
10,819 |
|
|
5,466 |
|
| Total Operating Lease Liabilities |
|
$ |
13,443 |
|
|
$ |
6,078 |
|
| |
|
|
|
|
|
| Weighted-average remaining lease term (in years) |
|
8.58 |
|
7.92 |
| Weighted-average discount rate |
|
7.59 |
% |
|
7.74 |
% |
The Company also enters into finance leases for certain mining equipment and automobiles. Assets arising from finance leases are included in property, plant and equipment-net and the liabilities are included in current portion of long-term debt and long-term debt in the accompanying Consolidated Balance Sheets.
The components of finance lease expense were as follows:
|
|
|
|
|
|
|
|
|
|
|
|
|
|
|
|
|
|
| |
Year Ended December 31, |
| |
2025 |
|
2024 |
|
2023 |
| Amortization of right of use assets |
$ |
13,147 |
|
|
$ |
9,814 |
|
|
$ |
25,400 |
|
| Interest expense |
2,526 |
|
|
1,079 |
|
|
1,712 |
|
| Total finance lease expense |
$ |
15,673 |
|
|
$ |
10,893 |
|
|
$ |
27,112 |
|
The following table presents the weighted-average lease term and weighted-average discount rate related to the Company’s finance leases:
|
|
|
|
|
|
|
|
|
|
|
|
|
December 31, |
| |
2025 |
|
2024 |
| Weighted-average remaining lease term (in years) |
2.66 |
|
2.93 |
| Weighted-average discount rate |
6.60 |
% |
|
6.59 |
% |
The following table presents the future maturities of the Company’s operating and finance lease liabilities, together with the present value of the net minimum lease payments, at December 31, 2025:
|
|
|
|
|
|
|
|
|
|
|
|
| |
Finance
Leases |
|
Operating
Leases |
| 2026 |
$ |
23,824 |
|
|
$ |
3,529 |
|
| 2027 |
23,639 |
|
|
2,507 |
|
| 2028 |
14,593 |
|
|
1,345 |
|
| 2029 |
854 |
|
|
1,368 |
|
| 2030 |
60 |
|
|
1,391 |
|
| Thereafter |
— |
|
|
8,482 |
|
| Total minimum lease payments |
62,970 |
|
|
18,622 |
|
| Less: amount representing interest |
5,304 |
|
|
5,179 |
|
| Present value of minimum lease payments |
$ |
57,666 |
|
|
$ |
13,443 |
|
NOTE 15—PENSION AND OTHER POSTRETIREMENT BENEFIT PLANS:
Pension
The Company has non-contributory defined benefit retirement plans. The benefits for these plans are based primarily on years of service and employees’ pay. The Company’s qualified defined benefit retirement plan (the “Pension Plan”) allows for lump-sum distributions of benefits earned up until December 31, 2005, at the employees’ election. In 2015, the Pension Plan was frozen.
If the lump sum distributions made during a plan year, which for the Company is January 1 to December 31, exceed the total of the projected service cost and interest cost for the plan year, the Company applies settlement accounting. Lump sum payments did not exceed this threshold during the years ended December 31, 2025, 2024 and 2023. The Company’s non-qualified pension plan was frozen as of December 31, 2024.
Other Postretirement
Certain subsidiaries of the Company provide medical and prescription drug benefits to retired employees covered by either the Coal Act or the National Bituminous Coal Wage Agreement of 2011. During the year ended December 31, 2025, the postretirement medical and prescription benefit obligations acquired through the Merger were combined into one surviving plan, the Retiree Health & Welfare Plan (the “OPEB Plan”).
The reconciliation of changes in the benefit obligation, plan assets and funded status of these plans is as follows:
|
|
|
|
|
|
|
|
|
|
|
|
|
|
|
|
|
|
|
|
|
|
|
|
|
Pension Benefits |
|
Other Postretirement Benefits |
| |
December 31, |
|
December 31, |
| |
2025 |
|
2024 |
|
2025 |
|
2024 |
| Change in benefit obligation: |
|
|
|
|
|
|
|
| Benefit obligation at beginning of period |
$ |
491,664 |
|
|
$ |
525,086 |
|
|
$ |
194,138 |
|
|
$ |
227,235 |
|
| Service cost |
1,100 |
|
|
1,208 |
|
|
146 |
|
|
— |
|
| Interest cost |
25,373 |
|
|
25,724 |
|
|
11,876 |
|
|
11,031 |
|
| Benefit obligations assumed in Merger |
894 |
|
|
— |
|
|
41,365 |
|
|
— |
|
| Plan curtailments |
— |
|
|
(217) |
|
|
— |
|
|
— |
|
| Actuarial loss (gain) |
11,094 |
|
|
(14,615) |
|
|
(23,753) |
|
|
(27,445) |
|
| Benefits and other payments |
(41,073) |
|
|
(45,522) |
|
|
(18,233) |
|
|
(16,683) |
|
| Benefit obligation at end of period |
$ |
489,052 |
|
|
$ |
491,664 |
|
|
$ |
205,539 |
|
|
$ |
194,138 |
|
| |
|
|
|
|
|
|
|
| Change in plan assets: |
|
|
|
|
|
|
|
| Fair value of plan assets at beginning of period |
$ |
511,472 |
|
|
$ |
549,571 |
|
|
$ |
— |
|
|
$ |
— |
|
| Actual return on plan assets |
43,278 |
|
|
5,695 |
|
|
— |
|
|
— |
|
| Company contributions |
1,730 |
|
|
1,728 |
|
|
18,233 |
|
|
16,683 |
|
| Benefits and other payments |
(41,073) |
|
|
(45,522) |
|
|
(18,233) |
|
|
(16,683) |
|
| Fair value of plan assets at end of period |
$ |
515,407 |
|
|
$ |
511,472 |
|
|
$ |
— |
|
|
$ |
— |
|
| |
|
|
|
|
|
|
|
| Funded status: |
|
|
|
|
|
|
|
| Noncurrent assets |
$ |
49,618 |
|
|
$ |
41,938 |
|
|
$ |
— |
|
|
$ |
— |
|
| Current liabilities |
(2,152) |
|
|
(2,057) |
|
|
(18,696) |
|
|
(17,887) |
|
| Noncurrent liabilities |
(21,111) |
|
|
(20,073) |
|
|
(186,843) |
|
|
(176,251) |
|
| Net asset (obligation) recognized |
$ |
26,355 |
|
|
$ |
19,808 |
|
|
$ |
(205,539) |
|
|
$ |
(194,138) |
|
| |
|
|
|
|
|
|
|
| Amounts recognized in accumulated other comprehensive (loss) income consist of: |
|
|
|
|
|
|
|
| Net actuarial loss (gain) |
$ |
243,082 |
|
|
$ |
253,641 |
|
|
$ |
(74,435) |
|
|
$ |
(53,416) |
|
| Prior service credit |
— |
|
|
— |
|
|
(6,519) |
|
|
(8,924) |
|
| Net amount recognized (before tax effect) |
$ |
243,082 |
|
|
$ |
253,641 |
|
|
$ |
(80,954) |
|
|
$ |
(62,340) |
|
The components of net periodic benefit cost (credit) are as follows:
|
|
|
|
|
|
|
|
|
|
|
|
|
|
|
|
|
|
|
|
|
|
|
|
|
|
|
|
|
|
|
|
|
|
|
|
| |
Pension Benefits |
|
Other Postretirement Benefits |
| |
Year Ended December 31, |
|
Year Ended December 31, |
| |
2025 |
|
2024 |
|
2023 |
|
2025 |
|
2024 |
|
2023 |
| Service cost |
$ |
1,100 |
|
|
$ |
1,208 |
|
|
$ |
1,217 |
|
|
$ |
146 |
|
|
$ |
— |
|
|
$ |
— |
|
| Interest cost |
25,373 |
|
|
25,724 |
|
|
27,027 |
|
|
11,876 |
|
|
11,031 |
|
|
13,044 |
|
| Expected return on plan assets |
(30,258) |
|
|
(31,964) |
|
|
(39,470) |
|
|
— |
|
|
— |
|
|
— |
|
| Amortization of prior service credits |
— |
|
|
— |
|
|
— |
|
|
(2,405) |
|
|
(2,405) |
|
|
(2,405) |
|
| Recognized net actuarial loss (gain) |
8,633 |
|
|
6,265 |
|
|
741 |
|
|
(2,734) |
|
|
(278) |
|
|
— |
|
|
|
|
|
|
|
|
|
|
|
|
|
| Curtailment gain recognized |
— |
|
|
(217) |
|
|
— |
|
|
— |
|
|
— |
|
|
— |
|
| Net periodic benefit cost (credit) |
$ |
4,848 |
|
|
$ |
1,016 |
|
|
$ |
(10,485) |
|
|
$ |
6,883 |
|
|
$ |
8,348 |
|
|
$ |
10,639 |
|
Service costs related to pension and other post-employment benefits are reflected in Cost of Sales in the Consolidated Statements of (Loss) Income. All other expenses related to pension and other post-employment benefits are reflected in Non-Service Related Pension and Postretirement Benefit Costs in the Consolidated Statements of (Loss) Income. Amounts reclassified out of accumulated other comprehensive (loss) income are reflected in Non-Service Related Pension and Postretirement Benefit Costs in the Consolidated Statements of (Loss) Income.
The Company utilizes a corridor approach to amortize actuarial gains and losses that have been accumulated under the Pension Plan. Cumulative gains and losses that are in excess of 10% of the greater of either the projected benefit obligation or the market-related value of plan assets are amortized over the expected remaining future lifetime of all plan participants for the Pension Plan. Actuarial gains or losses can result from discount rate changes, changes in underlying assumptions that affect the projected benefit obligation, changes in underlying assumptions that affect the market-related value of plan assets, as well as actual fluctuations in the market value of plan assets.
The Company also utilizes a corridor approach to amortize actuarial gains and losses that have been accumulated under the OPEB Plan. Cumulative gains and losses that are in excess of 10% of the accumulated postretirement benefit obligation are amortized over the average future remaining lifetime of the current inactive population for the OPEB Plan.
The following table provides information related to pension plans with an accumulated benefit obligation in excess of plan assets:
|
|
|
|
|
|
|
|
|
|
|
|
| |
December 31, |
| |
2025 |
|
2024 |
| Projected benefit obligation |
$ |
23,263 |
|
|
$ |
22,130 |
|
| Accumulated benefit obligation |
$ |
23,263 |
|
|
$ |
22,130 |
|
| Fair value of plan assets |
$ |
— |
|
|
$ |
— |
|
Assumptions
The weighted-average assumptions used to determine benefit obligations are as follows:
|
|
|
|
|
|
|
|
|
|
|
|
|
|
|
|
|
|
|
|
|
|
|
|
|
Pension Benefits |
|
Other Postretirement Benefits |
| |
December 31, |
|
December 31, |
| |
2025 |
|
2024 |
|
2025 |
|
2024 |
| Discount rate |
5.46 |
% |
|
5.66 |
% |
|
5.33 |
% |
|
5.60 |
% |
| Rate of compensation increase |
4.10 |
% |
|
4.04 |
% |
|
— |
|
|
— |
|
The discount rates are determined using a Company-specific yield curve model (above-mean) developed with the assistance of an external actuary. The Company-specific yield curve models (above-mean) use a subset of the expanded bond universe to determine the Company-specific discount rate. Bonds used in the yield curve are rated AA by Moody’s or Standard & Poor’s as of the measurement date. The yield curve models parallel the plans’ projected cash flows, and the underlying cash flows of the bonds included in the models exceed the cash flows needed to satisfy the Company’s plans.
The weighted-average assumptions used to determine net periodic benefit costs are as follows:
|
|
|
|
|
|
|
|
|
|
|
|
|
|
|
|
|
|
|
|
|
|
|
|
|
|
|
|
|
|
|
|
|
|
|
|
|
Pension Benefits |
|
Other Postretirement Benefits |
| |
Year Ended December 31, |
|
Year Ended December 31, |
| |
2025 |
|
2024 |
|
2023 |
|
2025 |
|
2024 |
|
2023 |
| Discount rate |
5.65 |
% |
|
5.14 |
% |
|
5.41 |
% |
|
5.66 |
% |
|
5.14 |
% |
|
5.43 |
% |
| Expected long-term return on plan assets |
6.15 |
% |
|
5.59 |
% |
|
5.81 |
% |
|
— |
|
|
— |
|
|
— |
|
| Rate of compensation increase |
4.04 |
% |
|
3.93 |
% |
|
3.89 |
% |
|
— |
|
|
— |
|
|
— |
|
The long-term rate of return is the sum of the portion of total assets in each asset class held multiplied by the expected return for that class, adjusted for expected expenses to be paid from the assets. The expected return for each class is determined using the plan asset allocation at the measurement date and a distribution of compound average returns over a 20-year time horizon. The model uses asset class returns, variances and correlation assumptions to produce the expected return for each portfolio. The return assumptions used forward-looking gross returns influenced by the current Treasury yield curve.
These returns recognize current bond yields, corporate bond spreads and equity risk premiums based on current market conditions.
The assumed health care cost trend rates are as follows:
|
|
|
|
|
|
|
|
|
|
|
|
| |
December 31, |
| |
2025 |
|
2024 |
| Health care cost trend rate for next year |
5.62 |
% |
|
6.01 |
% |
| Rate to which the cost trend is assumed to decline (ultimate trend rate) |
4.00 |
% |
|
4.00 |
% |
| Year that the rate reaches ultimate trend rate |
2048 |
|
2048 |
Plan Assets
The Company’s overall investment strategy is to meet current and future benefit payment needs through diversification across asset classes, fund strategies and fund managers to achieve an optimal balance between risk and return and between income and growth of assets through capital appreciation. Consistent with the objectives of the pension plan trust (the “Trust”) and in consideration of the Trust’s current funded status and the current level of market interest rates, the Retirement Board, as appointed by the Company’s Board of Directors (the “Retirement Board”) has approved an asset allocation strategy that will change over time in response to future improvements in the Trust’s funded status or changes in market interest rates. Such changes in asset allocation strategy are intended to allocate additional assets to the fixed income asset class should the Trust’s funded status improve. In this framework, the current target allocation for plan assets is 10% diversified growth assets and 90% liability hedging fixed income. Both the equity and fixed income portfolios are comprised of both active and passive investment strategies. The Trust is primarily invested in Mercer Common Collective Trusts. Equity securities consist of investments in large-, mid- and small-cap companies; non-U.S. equities are derived from both developed and emerging markets. Fixed income securities consist primarily of U.S. long duration fixed income corporate and U.S. Treasury instruments. The average quality of the fixed income portfolio must be rated at least “investment grade” by nationally recognized rating agencies. Within the fixed income asset class, investments are invested primarily across various strategies such that the overall profile strongly correlates with the interest rate sensitivity of the Trust’s liabilities in order to reduce the volatility resulting from the risk of changes in interest rates and the impact of such changes on the Trust’s overall financial status. Derivatives, interest rate swaps, options and futures are permitted investments for the purpose of reducing risk and to extend the duration of the overall fixed income portfolio; however, they may not be used for speculative purposes. All or a portion of the assets may be invested in mutual funds or other commingled vehicles so long as the pooled investment funds have an adequate asset base relative to their asset class; are invested in a diversified manner; and have management or oversight by an Investment Advisor registered with the SEC. The Retirement Board reviews the investment program on an ongoing basis including asset performance, current trends and developments in capital markets, changes in Trust liabilities and ongoing appropriateness of the overall investment policy.
There were no investments in Company stock held by the Pension Plan or the OPEB Plan at December 31, 2025 or 2024. There were no assets in the OPEB Plan at December 31, 2025 or 2024. The fair values of assets of the Pension Plan by asset category were as follows:
|
|
|
|
|
|
|
|
|
|
|
|
|
|
|
|
|
|
|
|
|
|
|
|
|
|
|
|
|
|
|
|
|
|
|
|
|
|
|
|
|
|
|
|
|
|
|
|
| |
Fair Value Measurements at December 31, 2025 |
|
Fair Value Measurements at December 31, 2024 |
| |
Total |
|
Quoted Prices in Active Markets for Identical Assets
(Level 1) |
|
Significant Observable Inputs
(Level 2) |
|
Significant Unobservable Inputs
(Level 3) |
|
Total |
|
Quoted Prices in Active Markets for Identical Assets
(Level 1) |
|
Significant Observable Inputs
(Level 2) |
|
Significant Unobservable Inputs
(Level 3) |
| Asset Category |
|
|
|
|
|
|
|
|
|
|
|
|
|
|
|
| Cash/Accrued Income |
$ |
30 |
|
|
$ |
30 |
|
|
$ |
— |
|
|
$ |
— |
|
|
$ |
103 |
|
|
$ |
103 |
|
|
$ |
— |
|
|
$ |
— |
|
Mercer Common Collective Trusts (a) |
515,377 |
|
|
— |
|
|
— |
|
|
— |
|
|
511,369 |
|
|
— |
|
|
— |
|
|
— |
|
| Total |
$ |
515,407 |
|
|
$ |
30 |
|
|
$ |
— |
|
|
$ |
— |
|
|
$ |
511,472 |
|
|
$ |
103 |
|
|
$ |
— |
|
|
$ |
— |
|
(a) In accordance with Subtopic 820-10, certain investments that were measured using the net asset value per share (or its equivalent) practical expedient for fair value have not been classified in the fair value hierarchy. The fair value amounts presented in this table are intended to permit reconciliation of the fair value hierarchy to the total plan assets.
Cash Flows
If necessary, the Company intends to contribute to the Trust using prudent funding methods. However, the Company does not expect to contribute to the Trust in 2026. Pension benefit payments are primarily funded from the Trust. The Company expects to contribute $2,152 to the non-qualified pension plan in 2026 for benefit payments. The Company does not expect to contribute to the OPEB Plan in 2026 and intends to pay benefit claims as they become due.
The following benefit payments are expected to be paid in accordance with plan documents:
|
|
|
|
|
|
|
|
|
|
|
|
| |
Pension
Benefits |
|
Other
Postretirement
Benefits |
| 2026 |
$ |
40,158 |
|
|
$ |
18,696 |
|
| 2027 |
$ |
38,764 |
|
|
$ |
18,261 |
|
| 2028 |
$ |
38,937 |
|
|
$ |
17,941 |
|
| 2029 |
$ |
38,581 |
|
|
$ |
17,458 |
|
| 2030 |
$ |
37,355 |
|
|
$ |
17,053 |
|
| Years 2031-2035 |
$ |
180,360 |
|
|
$ |
80,352 |
|
NOTE 16—COAL WORKERS' PNEUMOCONIOSIS AND WORKERS' COMPENSATION:
Coal Workers’ Pneumoconiosis
Under the Federal Coal Mine Health and Safety Act of 1969, as amended, the Company is responsible for medical and disability benefits to employees and their dependents resulting from occurrences of coal workers’ pneumoconiosis (“CWP”) disease. The Company is also responsible under various state statutes for CWP benefits. The Company primarily provides for these claims through a self-insurance program. The calculation of the actuarial present value of the estimated CWP obligation is based on an annual actuarial study by independent actuaries and uses assumptions regarding disability incidence, medical costs, indemnity levels, mortality, death benefits, dependents and interest rates, which are derived from actual company experience and outside sources. Actuarial gains or losses can result from discount rate changes, differences in incident rates and severity of claims filed as compared to original assumptions.
In December 2024, the Office of Workers’ Compensation Programs (“OWCP”) issued a final rule revising the regulations under the Black Lung Benefits Act related to self-insurance by coal mine operators. Under the new standard, self-insured coal mine operators are required to post additional security for the Black Lung benefit liabilities. The final rule requires a security amount equal to 100% of a self-insured operator’s projected black lung liabilities. The rule became effective on January 13, 2025, and operators were required to remit the increased security amount within one year. The final rule, including any assessments, is subject to appeal. In February 2025, the Company received letters from the OWCP that additional guidance regarding the final rule will be provided at a future date.
Workers’ Compensation
The Company must also compensate individuals who sustain employment-related physical injuries or some types of occupational diseases and, on some occasions, for costs of their rehabilitation. Workers’ compensation programs will also compensate survivors of workers who suffer employment-related deaths. Workers’ compensation laws are administered by state agencies, and each state has its own set of rules and regulations regarding compensation owed to an employee that is injured in the course of employment. The Company primarily provides for these claims through a self-insurance program. The Company recognizes an actuarial present value of the estimated workers’ compensation obligation calculated by independent actuaries. The calculation is based on claims filed and an estimate of claims incurred but not yet reported as well as various assumptions, including discount rate, future healthcare trend rate, benefit duration and recurrence of injuries. Actuarial gains or losses associated with workers’ compensation have resulted from discount rate changes and differences in claims experience and incident rates as compared to prior assumptions.
The reconciliation of changes in the benefit obligation and funded status of these plans is as follows:
|
|
|
|
|
|
|
|
|
|
|
|
|
|
|
|
|
|
|
|
|
|
|
|
|
CWP |
|
Workers’ Compensation |
| |
December 31, |
|
December 31, |
| |
2025 |
|
2024 |
|
2025 |
|
2024 |
| Change in benefit obligation: |
|
|
|
|
|
|
|
| Benefit obligation at beginning of period |
$ |
161,878 |
|
|
$ |
170,014 |
|
|
$ |
46,107 |
|
|
$ |
48,153 |
|
| State administrative fees and insurance bond premiums |
— |
|
|
— |
|
|
1,730 |
|
|
1,837 |
|
| Service cost |
7,812 |
|
|
2,985 |
|
|
6,912 |
|
|
5,857 |
|
| Interest cost |
14,462 |
|
|
8,264 |
|
|
2,220 |
|
|
2,289 |
|
| Benefit obligations assumed in Merger |
118,585 |
|
|
— |
|
|
— |
|
|
— |
|
| Actuarial loss (gain) |
11,293 |
|
|
(2,145) |
|
|
1,521 |
|
|
1,203 |
|
| Benefits paid |
(28,290) |
|
|
(17,240) |
|
|
(11,682) |
|
|
(13,232) |
|
| Benefit obligation at end of period |
$ |
285,740 |
|
|
$ |
161,878 |
|
|
$ |
46,808 |
|
|
$ |
46,107 |
|
| |
|
|
|
|
|
|
|
| Funded status: |
|
|
|
|
|
|
|
| Current assets |
$ |
— |
|
|
$ |
— |
|
|
$ |
766 |
|
|
$ |
1,000 |
|
| Current liabilities |
(24,539) |
|
|
(16,389) |
|
|
(12,611) |
|
|
(11,056) |
|
| Noncurrent liabilities |
(261,201) |
|
|
(145,489) |
|
|
(34,963) |
|
|
(36,051) |
|
| Net obligation recognized |
$ |
(285,740) |
|
|
$ |
(161,878) |
|
|
$ |
(46,808) |
|
|
$ |
(46,107) |
|
| |
|
|
|
|
|
|
|
| Amounts recognized in accumulated other comprehensive (loss) income consist of: |
|
|
|
|
|
|
|
| Net actuarial loss (gain) |
$ |
12,761 |
|
|
$ |
1,638 |
|
|
$ |
(18,874) |
|
|
$ |
(22,234) |
|
| Net amount recognized (before tax effect) |
$ |
12,761 |
|
|
$ |
1,638 |
|
|
$ |
(18,874) |
|
|
$ |
(22,234) |
|
The components of net periodic benefit cost are as follows:
|
|
|
|
|
|
|
|
|
|
|
|
|
|
|
|
|
|
|
|
|
|
|
|
|
|
|
|
|
|
|
|
|
|
|
|
|
CWP |
|
Workers’ Compensation |
| |
Year Ended December 31, |
|
Year Ended December 31, |
| |
2025 |
|
2024 |
|
2023 |
|
2025 |
|
2024 |
|
2023 |
| Service cost |
$ |
7,812 |
|
|
$ |
2,985 |
|
|
$ |
2,313 |
|
|
$ |
6,912 |
|
|
$ |
5,857 |
|
|
$ |
5,597 |
|
| Interest cost |
14,462 |
|
|
8,264 |
|
|
8,285 |
|
|
2,220 |
|
|
2,289 |
|
|
2,514 |
|
| Recognized net actuarial loss (gain) |
170 |
|
|
434 |
|
|
(1,045) |
|
|
(1,839) |
|
|
(2,160) |
|
|
(2,049) |
|
| State administrative fees and insurance bond premiums |
— |
|
|
— |
|
|
— |
|
|
1,730 |
|
|
1,837 |
|
|
1,953 |
|
| Net periodic benefit cost |
$ |
22,444 |
|
|
$ |
11,683 |
|
|
$ |
9,553 |
|
|
$ |
9,023 |
|
|
$ |
7,823 |
|
|
$ |
8,015 |
|
| Insured workers’ compensation fees and assessments |
|
|
|
|
|
|
6,407 |
|
|
— |
|
|
— |
|
| Total workers’ compensation expense |
|
|
|
|
|
|
$ |
15,430 |
|
|
$ |
7,823 |
|
|
$ |
8,015 |
|
Service costs, state administrative fees and insurance bond premiums related to CWP and workers’ compensation are reflected in Cost of Sales in the Consolidated Statements of (Loss) Income. All other expenses related to CWP and workers’ compensation are reflected in Non-Service Related Pension and Postretirement Benefit Costs in the Consolidated Statements of (Loss) Income. Amounts reclassified out of accumulated other comprehensive (loss) income are reflected in Non-Service Related Pension and Postretirement Benefit Costs in the Consolidated Statements of (Loss) Income.
The Company utilizes a corridor approach to amortize actuarial gains and losses that have been accumulated under the CWP and Workers’ Compensation plans. Cumulative gains and losses that are in excess of 10% of the greater of either the estimated liability or the market-related value of plan assets are amortized over the expected average remaining future service of the current active membership of the CWP and Workers’ Compensation plans.
In addition to the obligations included above, the Company also has workers’ compensation obligations related to an insured plan acquired through the Merger. As of December 31, 2025, these obligations totaled $40,971, a portion of which is reimbursable under various insurance policies purchased by the Company totaling $4,480. The insured workers’ compensation fees and assessments associated with these obligations, included in the table above, are reflected in Cost of Sales in the Consolidated Statements of (Loss) Income.
Assumptions
The weighted-average discount rates used to determine benefit obligations and net periodic benefit costs are as follows:
|
|
|
|
|
|
|
|
|
|
|
|
|
|
|
|
|
|
|
|
|
|
|
|
|
|
|
|
|
|
|
|
|
|
|
|
|
CWP |
|
Workers’ Compensation |
| |
Year Ended December 31, |
|
Year Ended December 31, |
| |
2025 |
|
2024 |
|
2023 |
|
2025 |
|
2024 |
|
2023 |
| Benefit obligations |
5.57 |
% |
|
5.65 |
% |
|
5.14 |
% |
|
5.36 |
% |
|
5.58 |
% |
|
5.12 |
% |
| Net periodic benefit cost |
5.65 |
% |
|
5.14 |
% |
|
5.40 |
% |
|
5.58 |
% |
|
5.12 |
% |
|
5.38 |
% |
Discount rates are determined using a Company-specific yield curve model (above-mean) developed with the assistance of an external actuary. The Company-specific yield curve models (above-mean) use a subset of the expanded bond universe to determine the Company-specific discount rate. Bonds used in the yield curve are rated AA by Moody’s or Standard & Poor’s as of the measurement date. The yield curve models parallel the plans’ projected cash flows, and the underlying cash flows of the bonds included in the models exceed the cash flows needed to satisfy the Company’s plans.
Cash Flows
The Company does not intend to make contributions to the CWP or Workers’ Compensation plans in 2026, but it intends to pay benefit claims as they become due.
The following benefit payments, which reflect expected future claims as appropriate, are expected to be paid:
|
|
|
|
|
|
|
|
|
|
|
|
|
|
|
|
|
|
|
|
|
|
|
|
| |
|
|
Workers' Compensation |
| |
CWP
Benefits |
|
Total
Benefits |
|
Actuarial
Benefits |
|
Other
Benefits |
| 2026 |
$ |
24,539 |
|
|
$ |
13,460 |
|
|
$ |
11,845 |
|
|
$ |
1,615 |
|
| 2027 |
$ |
23,669 |
|
|
$ |
15,222 |
|
|
$ |
13,566 |
|
|
$ |
1,656 |
|
| 2028 |
$ |
22,956 |
|
|
$ |
16,397 |
|
|
$ |
14,700 |
|
|
$ |
1,697 |
|
| 2029 |
$ |
22,207 |
|
|
$ |
17,182 |
|
|
$ |
15,442 |
|
|
$ |
1,740 |
|
| 2030 |
$ |
21,682 |
|
|
$ |
17,835 |
|
|
$ |
16,052 |
|
|
$ |
1,783 |
|
| Years 2031-2035 |
$ |
108,676 |
|
|
$ |
98,643 |
|
|
$ |
89,036 |
|
|
$ |
9,607 |
|
NOTE 17—OTHER EMPLOYEE BENEFIT PLANS:
UMWA Benefit Trusts
The Coal Act created two multi-employer benefit plans: (1) the United Mine Workers of America (the “UMWA”) Combined Benefit Fund (the “Combined Fund”) into which the former UMWA Benefit Trusts were merged, and (2) the UMWA 1992 Benefit Plan (the “1992 Benefit Plan”). The Company accounts for required contributions to these multi-employer trusts as expense when incurred.
The Combined Fund provides medical and death benefits for all beneficiaries of the former UMWA Benefit Trusts who were actually receiving benefits as of July 20, 1992. The 1992 Benefit Plan provides medical and death benefits to orphan UMWA-represented members eligible for retirement on February 1, 1993 and for those who retired between July 20, 1992 and September 30, 1994. The Coal Act provides for the assignment of beneficiaries to former employers and the allocation of unassigned beneficiaries (referred to as orphans) to companies using a formula set forth in the Coal Act. The Coal Act requires that responsibility for funding the benefits to be paid to beneficiaries be assigned to their former signatory employers or related companies.
This cost is recognized when contributions are assessed. The Company’s total contributions under the Coal Act were $3,157, $3,040 and $3,552 for the years ended December 31, 2025, 2024 and 2023, respectively. Based on available information at December 31, 2025, the Company’s aggregate obligation for the Combined Fund and 1992 Benefit Plan is estimated to be approximately $29,913.
Pursuant to the provisions of the Tax Relief and Healthcare Act of 2006 (the “2006 Act”) and the 1992 Benefit Plan, the Company is required to provide security in an amount based on the annual cost of providing health care benefits for all individuals receiving benefits from the 1992 Benefit Plan who are attributable to the Company, plus all individuals receiving benefits from an individual employer plan maintained by the Company who are entitled to receive such benefits. In accordance with the terms of the 2006 Act and the 1992 Benefit Plan, the Company must secure its obligations by posting letters of credit, which were $12,258, $12,315 and $12,890 at December 31, 2025, 2024 and 2023, respectively. These security amounts were based on the annual cost of providing health care benefits and included a reduction in the number of eligible employees.
Investment Plan
The Company has an investment plan, the Core Natural Resources, Inc. 401(k) Plan (the “401(k) Plan”), available to most non-represented employees. The 401(k) Plan includes company matching of up to 6% of eligible compensation contributed by eligible Company employees. Total company matching contributions were $32,116, $13,179 and $12,348 for the years ended December 31, 2025, 2024 and 2023, respectively.
The Company may also make discretionary contributions to the 401(k) Plan ranging from 1% to 6% of eligible compensation for eligible employees, as defined by the 401(k) Plan. No such discretionary contributions were accrued for at December 31, 2025 and 2024.
Long-Term Disability
The Company has a Long-Term Disability Plan available to all eligible full-time salaried employees. The benefits for this plan are based on a percentage of monthly earnings, offset by all other income benefits available to the disabled.
|
|
|
|
|
|
|
|
|
|
|
|
|
|
|
|
|
|
| |
Year Ended December 31, |
| |
2025 |
|
2024 |
|
2023 |
| Net periodic benefit costs |
$ |
663 |
|
$ |
869 |
|
$ |
534 |
| Discount rate assumption used to determine net periodic benefit costs |
5.29 |
% |
|
5.03 |
% |
|
5.34 |
% |
Liabilities incurred under the Long-Term Disability Plan are included in Other Accrued Liabilities and Other Noncurrent Liabilities in the Consolidated Balance Sheets and totaled $5,332 and $5,954 at December 31, 2025 and 2024, respectively.
NOTE 18—STOCK-BASED COMPENSATION:
The Company adopted the CONSOL Energy Inc. Omnibus Performance Incentive Plan (the “Performance Incentive Plan”) on November 22, 2017. On February 18, 2025, the Performance Incentive Plan was amended to change the name of the plan to the Core Natural Resources, Inc. Equity Plan and to assume the shares of Arch common stock, par value $0.01, that were available for grant under the Arch Resources, Inc. 2016 Omnibus Incentive Plan, as amended from time to time, immediately prior to the consummation of the Merger (such shares, after appropriate adjustment to reflect the Merger, the “Remaining Arch Plan Shares”) so that the Remaining Arch Plan Shares are available for issuance under the Performance Incentive Plan in accordance with, and subject to the terms and conditions of, the New York Stock Exchange Listed Company Manual (including Rule 303A.08 thereof).
The Performance Incentive Plan provides for grants of stock-based awards to employees, including any officer or employee-director of the Company, who is not a member of the Compensation Committee. These awards are intended to compensate the recipients thereof based on the performance of the Company’s stock and the recipients’ continued services during the vesting period, as well as align the recipients’ long-term interests with those of the Company’s stockholders. The Company is responsible for the cost of awards granted under the Performance Incentive Plan, and all determinations with respect to awards to be made under the Performance Incentive Plan will be made by the board of directors or a committee as delegated by the board of directors.
The Performance Incentive Plan generally limits the number of shares that may be delivered pursuant to vested awards to 4,290,278 shares, which includes 1,690,278 shares from the Remaining Arch Plan Shares that can be granted subject to awards until October 5, 2026. The share pool is subject to proportionate adjustment in the event of stock splits, stock dividends, recapitalizations, and other similar transactions or events. Shares subject to awards that are canceled, forfeited, withheld to satisfy exercise prices or tax withholding obligations or otherwise terminate without delivery will be available for delivery pursuant to other awards.
For only those shares expected to vest, the Company recognizes stock-based compensation costs on a straight-line basis over the requisite service period of the award as specified in the award agreement, which is generally the vesting term. The vesting of all awards will accelerate in the event of death and disability and may accelerate upon a change in control of the Company. Some awards may accelerate based on retirement age. The Company accounts for forfeitures of stock-based compensation as they occur. The total stock-based compensation expense recognized during the years ended December 31, 2025, 2024 and 2023 was $32,943, $11,350, and $10,046, respectively, and was included in General and Administrative Costs on the Consolidated Statements of (Loss) Income. This includes expense specifically related to the Performance Incentive Plan. The related deferred tax benefit totaled $7,464, $2,539 and $2,244 for the years ended December 31, 2025, 2024 and 2023, respectively.
As of December 31, 2025, the Company has $10,129 of unrecognized compensation cost related to all nonvested stock-based compensation awards, which is expected to be recognized over a weighted-average period of 1.66 years. The vesting of all nonvested stock-based compensation awards was accelerated in accordance with the terms of the Merger Agreement at the effective time of the closing of the Merger. When restricted stock and performance share unit awards become vested, the issuances are made from the Company’s common stock shares.
Restricted Stock Units
The Company grants certain employees and non-employee directors restricted stock units, which entitle the holder to shares of common stock as the award vests. Compensation expense is recognized on a straight-line basis over the requisite service period of the award. The total fair value of restricted stock units vested during the years ended December 31, 2025, 2024 and 2023 was $23,323, $17,710 and $8,359, respectively. The following table represents the nonvested restricted stock units and their corresponding fair value (based upon the closing share price) at the date of grant:
|
|
|
|
|
|
|
|
|
|
|
|
| |
Number of Shares |
|
Weighted-Average Grant Date Fair Value |
| Nonvested at December 31, 2024 |
373,464 |
|
$ |
55.43 |
|
| Granted |
205,420 |
|
$ |
78.60 |
|
| Vested |
(408,637) |
|
$ |
57.27 |
|
| Forfeited |
(3,329) |
|
$ |
78.60 |
|
| Nonvested at December 31, 2025 |
166,918 |
|
$ |
78.30 |
|
Performance Share Units
The Company grants certain employees performance share unit awards, which entitle the holder to shares of common stock subject to the achievement of certain market and performance goals. Compensation expense is recognized over the service period of awards and adjusted for the probability of achievement of performance-based goals. The total fair value of performance share units vested during the years ended December 31, 2025, 2024 and 2023 was $4,739, $1,090 and $1,161, respectively. The following table represents the nonvested performance share units and their corresponding fair value (based upon the closing share price or a Monte Carlo simulation) on the date of grant:
|
|
|
|
|
|
|
|
|
|
|
|
| |
Number of Shares |
|
Weighted-Average Grant Date Fair Value |
| Nonvested at December 31, 2024 |
57,614 |
|
$ |
75.64 |
|
| Granted |
230,994 |
|
$ |
82.61 |
|
| Vested |
(63,708) |
|
$ |
74.38 |
|
| Forfeited |
(53,203) |
|
|
$ |
80.90 |
|
| Nonvested at December 31, 2025 |
171,697 |
|
$ |
83.86 |
|
NOTE 19—SUPPLEMENTAL CASH FLOW INFORMATION:
The following are non-cash transactions that impact the investing and financing activities of the Company:
The Company entered into non-cash finance lease arrangements of $53,722, $20,835 and $1,842 during the years ended December 31, 2025, 2024 and 2023, respectively. The Company entered into non-cash equipment financing arrangements of $80,087 during the year ended December 31, 2025.
As of December 31, 2025, 2024 and 2023, the Company purchased goods and services related to capital projects in the amount of $51,036, $14,690 and $9,833, respectively, which are included in Accounts Payable, Other Accrued Liabilities and Other Noncurrent Liabilities on the Consolidated Balance Sheets.
Cash paid for interest and income taxes was as follows:
|
|
|
|
|
|
|
|
|
|
|
|
|
|
|
|
|
|
| |
Year Ended December 31, |
| |
2025 |
|
2024 |
|
2023 |
| Interest (net of amounts capitalized) |
$ |
37,204 |
|
|
$ |
23,790 |
|
|
$ |
29,251 |
|
| Income taxes (net of refunds received) |
$ |
500 |
|
|
$ |
39,250 |
|
|
$ |
111,304 |
|
NOTE 20—CONCENTRATION OF CREDIT RISK AND MAJOR CUSTOMERS:
The Company exports coal to international markets. For the years ended December 31, 2025, 2024 and 2023, approximately 56%, 66% and 71%, respectively, of the Company’s coal revenues were derived from exports. The Company uses the end usage point as the basis for attributing tons to individual countries. Because title to the Company’s export shipments typically transfers to customers at a point that does not necessarily reflect the end usage point, the Company attributes export tons to the country with the end usage point, if known. India was attributed greater than 10% of total revenue during the year ended December 31, 2025. India and China were each attributed greater than 10% of total revenue during the year ended December 31, 2024. India was attributed greater than 10% of total revenue during the year ended December 31, 2023. The Company also markets its thermal coal to electric power producers in the U.S. Coal revenues generated from electric power producers and other customers in the U.S. were 44%, 34% and 29% for the years ended December 31, 2025, 2024 and 2023, respectively.
During the year ended December 31, 2025, there were no customers whose revenues exceeded 10% of consolidated revenues, and one of the Company’s customers had an outstanding balance in excess of 10% of the total trade receivables balance as of December 31, 2025. During the years ended December 31, 2024 and 2023, revenues from two customers each exceeded 10% of consolidated revenues, aggregating approximately 22% and 23%, respectively. Additionally, two of the Company’s customers each had outstanding balances in excess of 10% of the total trade receivables balance as of December 31, 2024.
Concentrations of credit risk in outstanding trade receivables were as follows:
|
|
|
|
|
|
|
|
|
|
|
|
| |
December 31, |
| |
2025 |
|
2024 |
| Electric coal utilities |
$ |
64,704 |
|
|
$ |
30,162 |
|
| Coal exporters and industrial customers |
122,879 |
|
|
69,630 |
|
| Steel and coke producers |
158,887 |
|
|
33,126 |
|
| Other |
3,408 |
|
|
5,097 |
|
| Total Trade Receivables |
349,878 |
|
|
138,015 |
|
| Less: Allowance for credit losses |
(645) |
|
|
(1,265) |
|
| Total Trade Receivables, net |
$ |
349,233 |
|
|
$ |
136,750 |
|
NOTE 21—FAIR VALUE OF FINANCIAL INSTRUMENTS:
The Company determines the fair value of assets and liabilities based on the exchange price that would be received for an asset or paid to transfer a liability (an exit price) in the principal or most advantageous market for the asset or liability in an orderly transaction between market participants. The fair values are based on assumptions that market participants would use when pricing an asset or liability, including assumptions about risk and the risks inherent in valuation techniques and the inputs to valuations. The fair value hierarchy is based on whether the inputs to valuation techniques are observable or unobservable. Observable inputs reflect market data obtained from independent sources, including SOFR-based discount rates and U.S. Treasury-based rates, while unobservable inputs reflect the Company’s own assumptions of what market participants would use.
The fair value hierarchy includes three levels of inputs that may be used to measure fair value as described below:
Level 1 - Quoted prices for identical instruments in active markets. The Company’s Level 1 assets include marketable securities.
Level 2 - The fair values of the assets and liabilities included in Level 2 are based on standard industry income approach models that use significant observable inputs, including SOFR-based discount rates and U.S. Treasury-based rates.
Level 3 - Unobservable inputs significant to the fair value measurement supported by little or no market activity.
In those cases when the inputs used to measure fair value meet the definition of more than one level of the fair value hierarchy, the lowest level input that is significant to the fair value measurement in its totality determines the applicable level in the fair value hierarchy.
The financial instruments measured at fair value on a recurring basis are summarized below:
|
|
|
|
|
|
|
|
|
|
|
|
|
|
|
|
|
|
|
|
|
|
|
|
|
|
|
|
|
|
|
|
|
|
|
|
| |
Fair Value Measurements at
December 31, 2025 |
|
Fair Value Measurements at
December 31, 2024 |
| Description |
Level 1 |
|
Level 2 |
|
Level 3 |
|
Level 1 |
|
Level 2 |
|
Level 3 |
| U.S. Treasury Securities |
$ |
— |
|
|
$ |
— |
|
|
$ |
— |
|
|
$ |
51,993 |
|
|
$ |
— |
|
|
$ |
— |
|
| Funds for Asset Retirement Obligations |
$ |
17,289 |
|
|
$ |
— |
|
|
$ |
— |
|
|
$ |
12,054 |
|
|
$ |
— |
|
|
$ |
— |
|
The following methods and assumptions were used to estimate the fair value for which the fair value option was not elected:
Long-term debt: The fair value of long-term debt is measured using unadjusted quoted market prices or estimated using discounted cash flow analyses. The discounted cash flow analyses are based on current market rates for instruments with similar cash flows.
The carrying amounts and fair values of financial instruments for which the fair value option was not elected are as follows:
|
|
|
|
|
|
|
|
|
|
|
|
|
|
|
|
|
|
|
|
|
|
|
|
| |
December 31, 2025 |
|
December 31, 2024 |
| |
Carrying Amount |
|
Fair
Value |
|
Carrying Amount |
|
Fair
Value |
| Long-Term Debt (Excluding Debt Issuance Costs) |
$ |
401,361 |
|
|
$ |
417,310 |
|
|
$ |
184,677 |
|
|
$ |
199,052 |
|
Certain of the Company’s debt is actively traded on a public market and, as a result, constitutes Level 1 fair value measurements. The portion of the Company’s debt obligations that is not actively traded is valued through reference to the applicable underlying benchmark rate and, as a result, constitutes Level 2 fair value measurements.
NOTE 22—COMMITMENTS AND CONTINGENT LIABILITIES:
The Company is subject to various lawsuits and claims with respect to such matters as personal injury, wrongful death, damage to property, exposure to hazardous substances, governmental regulations including environmental remediation, employment and contract disputes and other claims and actions arising out of the normal course of business. The Company accrues the estimated loss for these lawsuits and claims when the loss is probable and reasonably estimable. The Company’s estimated accruals related to pending claims not discussed below, individually and in the aggregate, are immaterial to the financial position, results of operations or cash flows of the Company as of December 31, 2025. It is possible that the aggregate loss in the future with respect to these lawsuits and claims could ultimately be material to the Company’s financial position, results of operations or cash flows; however, such amounts cannot be reasonably estimated. The amount claimed against the Company as of December 31, 2025 is disclosed below when an amount is expressly stated in the lawsuit or claim, which is not often the case.
United Mine Workers of America 1992 Benefit Plan Litigation: In 2013, Murray Energy and its subsidiaries (“Murray”) entered into a stock purchase agreement (the “Murray sale agreement”) with the Company’s former parent, pursuant to which Murray acquired the stock of Consolidation Coal Company and certain subsidiaries and certain other assets and liabilities. At the time of sale, the liabilities included certain retiree medical liabilities under the Coal Industry Retiree Health Benefit Act of 1992 (“Coal Act”) and certain federal black lung liabilities under the Black Lung Benefits Act (“BLBA”). Murray filed for Chapter 11 bankruptcy in October 2019. As part of the bankruptcy proceedings, Murray unilaterally entered into a settlement with the United Mine Workers of America 1992 Benefit Plan (the “1992 Benefit Plan”) to transfer retirees in the Murray Energy Section 9711 Plan to the 1992 Benefit Plan. This was approved by the bankruptcy court on April 30, 2020. On May 2, 2020, the 1992 Benefit Plan filed an action in the U.S. District Court for the District of Columbia asking the court to make a determination whether the Company’s former parent or the Company has any continuing retiree medical liabilities under the Coal Act (the “1992 Plan Lawsuit”). The Murray sale agreement includes indemnification by Murray with respect to the Coal Act and BLBA liabilities. In addition, the Company had agreed to indemnify its former parent relative to certain pre-separation liabilities. As of September 16, 2020, the Company entered into a settlement agreement with Murray and withdrew its claims in bankruptcy. On September 11, 2020, the defendants in the 1992 Plan Lawsuit filed a Motion to Dismiss Plaintiffs’ Second Amended Complaint which was denied by the Court on March 29, 2022. In October 2025, both parties filed a motion for summary judgment. In the 1992 Benefit Plan’s summary judgment motion, it alleged it is entitled to recover reimbursement for unpaid monthly benefits premiums from the beginning of the lawsuit to present in the amount of $64.8 million, plus interest and damages totaling $25.6 million, as well as an unspecified amount of attorneys’ fees. Based upon limited information available at the time of the Murray bankruptcy, the Company estimated that the future annual servicing costs of these liabilities in 2026 are approximately $10.0 million, and the annual servicing cost would decline each year since the beneficiaries of the Coal Act consist principally of miners who retired prior to 1994. No ruling has been issued by the judge. The Company will continue to vigorously defend any claims that attempt to transfer any of such liabilities directly or indirectly to the Company, including raising all applicable defenses against the 1992 Benefit Plan’s suit. With respect to this lawsuit, while a loss is reasonably possible, it is not probable and, as a result, no accrual has been recorded.
The Company and various subsidiaries are defendants in certain other legal proceedings. In the opinion of management, based upon an investigation of these matters and discussion with legal counsel, the ultimate outcome of such other legal proceedings, individually and in the aggregate, is not expected to have a material adverse effect on the Company’s financial position, results of operations or liquidity.
Employee-related financial guarantees have primarily been provided to support the 1992 Benefit Plan and federal black lung and various state workers’ compensation self-insurance programs. Environmental financial guarantees have primarily been provided to support various performance bonds related to reclamation and other environmental issues.
Other financial guarantees have been extended to support sales contracts, insurance policies, surety indemnity agreements, legal matters, full and timely payments of mining equipment leases, and various other items necessary in the normal course of business. These amounts represent the maximum potential of total future payments that the Company could be required to make under these instruments. Certain letters of credit included in the table below were issued against other commitments included in this table. These amounts have not been reduced for potential recoveries under recourse or collateralization provisions. Generally, recoveries under reclamation bonds would be limited to the extent of the work performed at the time of the default. No amounts related to these commitments are recorded as liabilities in the financial statements. The Company’s management believes that these commitments will not have a material adverse effect on the Company’s financial condition. The following is a summary of the financial guarantees and letters of credit to certain third parties as of December 31, 2025:
|
|
|
|
|
|
|
|
|
|
|
|
|
|
|
|
|
|
|
|
|
|
|
|
|
|
|
|
|
|
| |
Amount of Commitment Expiration per Period |
| |
Total
Amounts
Committed |
|
Less Than
1 Year |
|
1-3 Years |
|
3-5 Years |
|
Beyond
5 Years |
| Letters of Credit: |
|
|
|
|
|
|
|
|
|
| Employee-Related |
$ |
121,970 |
|
|
$ |
98,666 |
|
|
$ |
23,304 |
|
|
$ |
— |
|
|
$ |
— |
|
| Environmental |
398 |
|
|
— |
|
|
398 |
|
|
— |
|
|
— |
|
| Other |
146,012 |
|
|
140,920 |
|
|
5,092 |
|
|
— |
|
|
— |
|
| Total Letters of Credit |
$ |
268,380 |
|
|
$ |
239,586 |
|
|
$ |
28,794 |
|
|
$ |
— |
|
|
$ |
— |
|
| Surety Bonds: |
|
|
|
|
|
|
|
|
|
| Employee-Related |
$ |
116,978 |
|
|
$ |
115,678 |
|
|
$ |
1,300 |
|
|
$ |
— |
|
|
$ |
— |
|
| Environmental |
859,358 |
|
|
796,684 |
|
|
62,674 |
|
|
— |
|
|
— |
|
| Other |
95,693 |
|
|
95,446 |
|
|
247 |
|
|
— |
|
|
— |
|
| Total Surety Bonds |
$ |
1,072,029 |
|
|
$ |
1,007,808 |
|
|
$ |
64,221 |
|
|
$ |
— |
|
|
$ |
— |
|
|
|
|
|
|
|
|
|
|
|
|
|
|
|
|
|
|
|
|
|
The Company regularly evaluates the likelihood of default for all guarantees based on an expected loss analysis and records the fair value, if any, of its guarantees as an obligation in the financial statements.
Business Interruption Insurance Recoveries
On March 26, 2024, a container ship struck a support column of the Francis Scott Key Bridge in Baltimore, Maryland causing it to collapse, which suspended vessel access to, and export capability from, the Core Marine Terminal, located in the Port of Baltimore. On May 20, 2024, a limited access channel in the Chesapeake Bay was opened to commercial vessel traffic; the permanent 700-foot wide, 50-foot deep channel was restored and opened on June 10, 2024.
In the year ended December 31, 2024, the Company recorded insurance recoveries of $9,003, which represents an advancement from the Company’s insurance carriers related to the Francis Scott Key Bridge collapse business interruption insurance claim. In the year ended December 31, 2025, the Company recorded insurance recoveries of $24,862, which represents a portion of the total settlement related to the Francis Scott Key Bridge collapse business interruption insurance claim. These amounts were recorded in Other Operating Income and Expense, net on the Consolidated Statements of (Loss) Income.
NOTE 23—SEGMENT INFORMATION:
Prior to the completion of the Merger, the Company consisted of two reportable segments, the PAMC segment and the Core Marine Terminal segment. Following completion of the Merger, the Company adjusted its internal reporting structure and the Company’s CODM changed the manner in which he measures financial performance and allocates resources. Thus, the Company reassessed its reporting segments, and the Company now consists of four reportable segments: (1) the High CV Thermal segment; (2) the Metallurgical segment; (3) the Powder River Basin (“PRB”) segment; and (4) the Core Marine Terminal segment. Accordingly, the manner in which the Company reports its operations has been changed retrospectively, and all relevant prior period amounts have been recast to reflect this change.
The Company reports segment information based on the “management” approach. The management approach designates the internal reporting used by management to make decisions on and assess performance of the Company’s reportable segments. The Company manages its segments by market and coal quality, not by individual mining complex or geographic region.
The High CV Thermal segment contains the Company’s High CV Thermal operations in Pennsylvania, West Virginia, and Colorado; the Metallurgical segment contains the Company’s metallurgical operations in West Virginia; the PRB segment contains the Company’s surface mining complexes in Wyoming; and the Core Marine Terminal segment contains the Company’s coal export terminal operations in the Port of Baltimore.
The Company’s CODM is the chief executive officer, who utilizes Adjusted EBITDA to monitor each segment. Adjusted EBITDA removes financial activity not related to ongoing operations, which allows for a review of more streamlined operating results. It is used by the CODM to review the budget versus actual results and to evaluate the operating performance of each segment. This review and evaluation is utilized by the CODM to determine the best allocation of resources across the segments and for other business purposes.
Reportable segment results for the year ended December 31, 2025 are:
|
|
|
|
|
|
|
|
|
|
|
|
|
|
|
|
|
|
|
|
|
|
|
|
|
|
|
|
|
|
|
High CV Thermal |
|
Metallurgical |
|
PRB |
|
Core Marine Terminal |
|
Total |
| Revenues from External Customers |
$ |
2,208,643 |
|
|
$ |
1,202,055 |
|
|
$ |
718,783 |
|
|
$ |
21,477 |
|
|
|
| Intersegment Revenues |
— |
|
|
— |
|
|
— |
|
|
66,203 |
|
|
|
|
2,208,643 |
|
|
1,202,055 |
|
|
718,783 |
|
|
87,680 |
|
|
$ |
4,217,161 |
|
| Reconciliation of Revenue |
|
|
|
|
|
|
|
|
|
Other Revenues (a) |
|
|
|
|
|
|
|
|
13,817 |
|
| Elimination of Intersegment Revenues |
|
|
|
|
|
|
|
|
(66,203) |
|
| Total Consolidated Revenues |
|
|
|
|
|
|
|
|
4,164,775 |
|
Less: (b) |
|
|
|
|
|
|
|
|
|
| Cash Costs of Revenue |
1,252,525 |
|
|
868,839 |
|
|
643,601 |
|
|
30,841 |
|
|
|
| Transportation Costs |
364,888 |
|
|
276,935 |
|
|
11,317 |
|
|
— |
|
|
|
Other Segment Items (c) |
11,124 |
|
|
81,936 |
|
|
— |
|
|
— |
|
|
|
| Adjusted EBITDA |
$ |
580,106 |
|
|
$ |
(25,655) |
|
|
$ |
63,865 |
|
|
$ |
56,839 |
|
|
$ |
675,155 |
|
|
|
|
|
|
|
|
|
|
|
| Reconciliation of segment profit or loss measure to consolidated loss before income tax: |
Other Profit or Loss (a) |
|
|
|
|
|
|
|
|
2,940 |
|
| Depreciation, Depletion and Amortization |
|
(621,067) |
|
| General and Administrative Costs |
|
|
|
|
|
|
|
|
(214,856) |
|
| Interest Expense |
|
|
|
|
|
|
|
|
(40,124) |
|
| Interest Income |
|
|
|
|
|
|
|
|
25,890 |
|
| Loss on Debt Extinguishment |
|
|
|
|
|
|
|
|
(11,680) |
|
| Non-Service Related Pension and Postretirement Benefit Costs |
|
|
|
|
|
|
|
|
(25,728) |
|
| Idle Mine Costs |
|
|
|
|
|
|
|
|
(24,145) |
|
| Other Operating Income, net |
|
|
|
|
|
|
|
|
33,904 |
|
| Other Costs |
|
|
|
|
|
|
|
|
(33,992) |
|
| Loss Before Income Tax |
|
|
|
|
|
|
|
|
$ |
(233,703) |
|
(a) Revenue and profit or loss from segments below the quantitative thresholds are attributable to the revenue and expense from various corporate and diversified business activities excluded from our reportable segments.
(b) The significant expense categories and amounts align with the segment-level information that is regularly provided to the CODM.
(c) Other segment items include other non-operating income and expenses that are not part of each segment’s ongoing operations.
|
|
|
|
|
|
|
|
|
|
|
|
|
|
|
|
|
|
|
|
|
|
|
|
|
|
|
|
|
|
|
|
|
|
|
|
|
High CV Thermal |
|
Metallurgical |
|
PRB |
|
Core Marine Terminal |
|
Corporate and Other (a) |
|
Consolidated |
Segment Assets (b) |
$ |
2,107,970 |
|
|
$ |
2,020,450 |
|
|
$ |
261,193 |
|
|
$ |
91,930 |
|
|
$ |
1,648,510 |
|
|
$ |
6,130,053 |
|
| Depreciation, Depletion and Amortization |
$ |
207,891 |
|
|
$ |
252,882 |
|
|
$ |
33,177 |
|
|
$ |
5,621 |
|
|
$ |
121,496 |
|
|
$ |
621,067 |
|
| Capital Expenditures |
$ |
174,153 |
|
|
$ |
73,107 |
|
|
$ |
8,126 |
|
|
$ |
7,473 |
|
|
$ |
21,722 |
|
|
$ |
284,581 |
|
(a) Includes various corporate and diversified business activities excluded from our reportable segments to reconcile to consolidated totals.
(b) Represents assets as of December 31, 2025.
Reportable segment results for the year ended December 31, 2024 are:
|
|
|
|
|
|
|
|
|
|
|
|
|
|
|
|
|
|
|
|
|
|
|
|
|
|
|
|
|
|
|
High CV Thermal |
|
Metallurgical |
|
PRB |
|
Core Marine Terminal |
|
Total |
| Revenues from External Customers |
$ |
2,004,567 |
|
|
$ |
113,067 |
|
|
$ |
— |
|
|
$ |
31,064 |
|
|
|
| Intersegment Revenues |
— |
|
|
— |
|
|
— |
|
|
56,682 |
|
|
|
|
2,004,567 |
|
|
113,067 |
|
|
— |
|
|
87,746 |
|
|
$ |
2,205,380 |
|
| Reconciliation of Revenue |
|
|
|
|
|
|
|
|
|
Other Revenues (a) |
|
|
|
|
|
|
|
|
15,708 |
|
| Elimination of Intersegment Revenues |
|
|
|
|
|
|
|
|
(56,682) |
|
| Total Consolidated Revenues |
|
|
|
|
|
|
|
|
2,164,406 |
|
Less: (b) |
|
|
|
|
|
|
|
|
|
| Cash Costs of Revenue |
973,139 |
|
|
128,445 |
|
|
— |
|
|
27,372 |
|
|
|
| Transportation Costs |
321,367 |
|
|
9,341 |
|
|
— |
|
|
— |
|
|
|
Other Segment Items (c) |
— |
|
|
(390) |
|
|
— |
|
|
— |
|
|
|
| Adjusted EBITDA |
$ |
710,061 |
|
|
$ |
(24,329) |
|
|
$ |
— |
|
|
$ |
60,374 |
|
|
$ |
746,106 |
|
|
|
|
|
|
|
|
|
|
|
| Reconciliation of segment profit or loss measure to consolidated earnings before income tax: |
Other Profit or Loss (a) |
|
|
|
|
|
|
|
|
4,731 |
|
| Depreciation, Depletion and Amortization |
|
(223,526) |
|
| General and Administrative Costs |
|
(115,224) |
|
| Interest Expense |
|
|
|
|
|
|
|
|
(22,192) |
|
| Interest Income |
|
|
|
|
|
|
|
|
19,223 |
|
|
|
|
|
|
|
|
|
|
|
| Non-Service Related Pension and Postretirement Benefit Costs |
|
|
|
|
|
|
|
|
(17,384) |
|
| Idle Mine Costs |
|
|
|
|
|
|
|
|
(4,859) |
|
| Other Operating Expense, net |
|
|
|
|
|
|
|
|
(43,224) |
|
| Other Costs |
|
(13,004) |
|
| Earnings Before Income Tax |
|
|
|
|
|
|
|
|
$ |
330,647 |
|
(a) Revenue and profit or loss from segments below the quantitative thresholds are attributable to the revenue and expense from various corporate and diversified business activities excluded from our reportable segments.
(b) The significant expense categories and amounts align with the segment-level information that is regularly provided to the CODM.
(c) Other segment items include other non-operating income and expenses that are not part of each segment’s ongoing operations.
|
|
|
|
|
|
|
|
|
|
|
|
|
|
|
|
|
|
|
|
|
|
|
|
|
|
|
|
|
|
|
|
|
|
|
|
|
High CV Thermal |
|
Metallurgical |
|
PRB |
|
Core Marine Terminal |
|
Corporate and Other (a) |
|
Consolidated |
Segment Assets (b) |
$ |
1,739,792 |
|
|
$ |
140,798 |
|
|
$ |
— |
|
|
$ |
88,146 |
|
|
$ |
910,807 |
|
|
$ |
2,879,543 |
|
| Depreciation, Depletion and Amortization |
$ |
172,997 |
|
|
$ |
8,635 |
|
|
$ |
— |
|
|
$ |
4,889 |
|
|
$ |
37,005 |
|
|
$ |
223,526 |
|
| Capital Expenditures |
$ |
149,021 |
|
|
$ |
13,614 |
|
|
$ |
— |
|
|
$ |
8,350 |
|
|
$ |
7,003 |
|
|
$ |
177,988 |
|
(a) Includes various corporate and diversified business activities excluded from our reportable segments to reconcile to consolidated totals.
(b) Represents assets as of December 31, 2024.
Reportable segment results for the year ended December 31, 2023 are:
|
|
|
|
|
|
|
|
|
|
|
|
|
|
|
|
|
|
|
|
|
|
|
|
|
|
|
|
|
|
|
High CV Thermal |
|
Metallurgical |
|
PRB |
|
Core Marine Terminal |
|
Total |
| Revenues from External Customers |
$ |
2,359,796 |
|
|
$ |
98,939 |
|
|
$ |
— |
|
|
$ |
47,900 |
|
|
|
| Intersegment Revenues |
— |
|
|
— |
|
|
— |
|
|
58,266 |
|
|
|
|
2,359,796 |
|
|
98,939 |
|
|
— |
|
|
106,166 |
|
|
$ |
2,564,901 |
|
| Reconciliation of Revenue |
|
|
|
|
|
|
|
|
|
|
|
|
|
|
|
|
|
|
|
| Elimination of Intersegment Revenues |
|
|
|
|
|
|
|
|
(58,266) |
|
| Total Consolidated Revenues |
|
|
|
|
|
|
|
|
2,506,635 |
|
Less: (b) |
|
|
|
|
|
|
|
|
|
| Cash Costs of Revenue |
939,892 |
|
|
98,803 |
|
|
— |
|
|
27,259 |
|
|
|
| Transportation Costs |
335,186 |
|
|
17,183 |
|
|
— |
|
|
— |
|
|
|
Other Segment Items (c) |
(429) |
|
|
(73) |
|
|
— |
|
|
— |
|
|
|
| Adjusted EBITDA |
$ |
1,085,147 |
|
|
$ |
(16,974) |
|
|
$ |
— |
|
|
$ |
78,907 |
|
|
$ |
1,147,080 |
|
|
|
|
|
|
|
|
|
|
|
| Reconciliation of segment profit or loss measure to consolidated earnings before income tax: |
Other Profit or Loss (a) |
|
|
|
|
|
|
|
|
(663) |
|
| Depreciation, Depletion and Amortization |
|
(241,317) |
|
| General and Administrative Costs |
|
(103,470) |
|
| Interest Expense |
|
|
|
|
|
|
|
|
(29,325) |
|
| Interest Income |
|
|
|
|
|
|
|
|
13,597 |
|
| Loss on Debt Extinguishment |
|
|
|
|
|
|
|
|
(2,725) |
|
| Non-Service Related Pension and Postretirement Benefit Costs |
|
|
|
|
|
|
|
|
(7,011) |
|
| Idle Mine Costs |
|
|
|
|
|
|
|
|
(4,515) |
|
| Other Operating Income, net |
|
|
|
|
|
|
|
|
19,111 |
|
| Other Costs |
|
|
|
|
|
|
|
|
(12,890) |
|
| Earnings Before Income Tax |
|
|
|
|
|
|
|
|
$ |
777,872 |
|
(a) Profit or loss from segments below the quantitative thresholds are attributable to the revenue and expense from various corporate and diversified business activities excluded from our reportable segments.
(b) The significant expense categories and amounts align with the segment-level information that is regularly provided to the CODM.
(c) Other segment items include other non-operating income and expenses that are not part of each segment’s ongoing operations.
|
|
|
|
|
|
|
|
|
|
|
|
|
|
|
|
|
|
|
|
|
|
|
|
|
|
|
|
|
|
|
|
|
|
|
|
|
High CV Thermal |
|
Metallurgical |
|
PRB |
|
Core Marine Terminal |
|
Corporate and Other (a) |
|
Consolidated |
Segment Assets (b) |
$ |
1,582,434 |
|
|
$ |
126,865 |
|
|
$ |
— |
|
|
$ |
83,322 |
|
|
$ |
882,382 |
|
|
$ |
2,675,003 |
|
| Depreciation, Depletion and Amortization |
$ |
191,391 |
|
|
$ |
8,235 |
|
|
$ |
— |
|
|
$ |
4,227 |
|
|
$ |
37,464 |
|
|
$ |
241,317 |
|
| Capital Expenditures |
$ |
144,550 |
|
|
$ |
12,656 |
|
|
$ |
— |
|
|
$ |
4,568 |
|
|
$ |
6,017 |
|
|
$ |
167,791 |
|
(a) Includes various corporate and diversified business activities excluded from our reportable segments to reconcile to consolidated totals.
(b) Represents assets as of December 31, 2023.
Revenues from customers that exceeded 10% of consolidated revenues were as follows:
|
|
|
|
|
|
|
|
|
|
|
|
|
|
|
|
|
|
| |
Year Ended December 31, |
| |
2025 |
|
2024 |
|
2023 |
Customer A (a) |
(b) |
|
$ |
240,990 |
|
|
$ |
283,115 |
|
Customer B (a) |
(b) |
|
$ |
220,537 |
|
|
$ |
286,041 |
|
|
|
|
|
|
|
|
|
|
|
|
|
|
|
|
|
|
|
(a) Revenues from this customer were principally included in the High CV Thermal segment.
(b) Revenues during these periods were less than 10% of the Company’s consolidated revenues.
Enterprise-Wide Disclosures
For the year ended December 31, 2025, the U.S. was attributed greater than 40% of total revenue, and India was attributed greater than 10% of total revenue. For the year ended December 31, 2024, India and the U.S. were each attributed greater than 30% of total revenue, and China was attributed greater than 10% of total revenue. For the year ended December 31, 2023, India and the U.S. were each attributed greater than 30% of total revenue.
The Company’s property, plant and equipment is predominantly located in the U.S. At December 31, 2025 and 2024, less than 1% of the Company’s net property, plant and equipment was located in Canada.
NOTE 24—SUBSEQUENT EVENTS:
On February 12, 2026, the Company announced a $0.10 per share dividend in an aggregate amount of approximately $5.1 million, payable on March 16, 2026 to all stockholders of record as of March 2, 2026.
ITEM 9. CHANGES IN AND DISAGREEMENTS WITH ACCOUNTANTS ON ACCOUNTING AND FINANCIAL DISCLOSURE
None.
ITEM 9A. CONTROLS AND PROCEDURES
Disclosure controls and procedures. The Company, under the supervision and with the participation of its management, including the Company’s principal executive officer and principal financial officer, evaluated the effectiveness of the Company’s “disclosure controls and procedures,” as such term is defined in Rule 13a-15(e) under the Exchange Act, as of the end of the period covered by this Report. Based on that evaluation, the Company’s principal executive officer and principal financial officer have concluded that the Company’s disclosure controls and procedures are effective as of December 31, 2025 to ensure that information required to be disclosed by the Company in reports that it files or submits under the Exchange Act is recorded, processed, summarized and reported within the time periods specified in SEC rules and forms, and includes controls and procedures designed to ensure that information required to be disclosed by the Company in such reports is accumulated and communicated to the Company’s management, including the Company’s principal executive officer and principal financial officer, as appropriate to allow timely decisions regarding required disclosure.
Management’s Annual Report on Internal Control Over Financial Reporting. The Company’s management is responsible for establishing and maintaining adequate internal control over financial reporting. The Company’s internal control over financial reporting is a process designed to provide reasonable assurance regarding the reliability of financial reporting and the preparation of financial statements for external purposes in accordance with generally accepted accounting principles.
The Company’s internal control over financial reporting includes policies and procedures that (1) pertain to the maintenance of records that, in reasonable detail, accurately and fairly reflect transactions and dispositions of assets of the Company; (2) provide reasonable assurances that transactions are recorded as necessary to permit preparation of financial statements in accordance with generally accepted accounting principles, and that receipts and expenditures are being made only in accordance with authorizations of management and the directors of the Company; and (3) provide reasonable assurance regarding prevention or timely detection of unauthorized acquisition, use or disposition of the Company’s assets that could have a material effect on our financial statements.
Because of its inherent limitations, internal control over financial reporting may not prevent or detect misstatements. Accordingly, even effective controls can provide only reasonable assurance with respect to financial statement preparation and presentation. Also, projections of any evaluation of effectiveness to future periods are subject to the risk that controls may become inadequate because of changes in conditions, or that the degree of compliance with the policies or procedures may deteriorate.
Management assessed the effectiveness of the Company’s internal control over financial reporting as of December 31, 2025. In making this assessment, management used the criteria set forth by the Committee of Sponsoring Organizations of the Treadway Commission (2013 framework) (COSO) in Internal Control-Integrated Framework. Based on our assessment and those criteria, management has concluded that the Company maintained effective internal control over financial reporting as of December 31, 2025. Management’s assessment of, and conclusion on, the effectiveness of internal control over financial reporting excluded the internal controls of Arch Resources, Inc. Arch Resources, Inc.’s total assets represented approximately 60% of our total assets at December 31, 2025, and its total revenues represented approximately 49% of our total revenues for the year ended December 31, 2025.
Ernst & Young LLP, our independent registered public accounting firm that has audited the financial statements contained in this Report, has issued an attestation report on the Company’s internal control over financial reporting, which is on page
131 of this Report.
Changes in internal control over financial reporting. There was no change in the Company’s internal control over financial reporting, as such term is defined in Rule 13a-15(f) of the Exchange Act, that materially affected, or is reasonably likely to materially affect, the Company’s internal control over financial reporting.
It should be noted that any system of controls, however well designed and operated, can provide only reasonable, and not absolute, assurance that the objectives of the system will be met. In addition, the design of any control system is based in part upon certain assumptions about the likelihood of future events.
Report of Independent Registered Public Accounting Firm
To the Stockholders and the Board of Directors of Core Natural Resources, Inc.
Opinion on Internal Control Over Financial Reporting
We have audited Core Natural Resources, Inc.’s internal control over financial reporting as of December 31, 2025, based on criteria established in Internal Control-Integrated Framework issued by the Committee of Sponsoring Organizations of the Treadway Commission (2013 framework) (the COSO criteria). In our opinion, Core Natural Resources, Inc. (the Company) maintained, in all material respects, effective internal control over financial reporting as of December 31, 2025, based on the COSO criteria.
As indicated in the accompanying Management’s Annual Report on Internal Control Over Financial Reporting, management’s assessment of and conclusion on the effectiveness of internal control over financial reporting did not include the internal controls of Arch Resources, Inc. which is included in the 2025 consolidated financial statements of the Company and constituted approximately 60% of total assets as of December 31, 2025 and approximately 49% of total revenues for the year then ended. Our audit of internal control over financial reporting of the Company also did not include an evaluation of the internal control over financial reporting of Arch Resources, Inc.
We also have audited, in accordance with the standards of the Public Company Accounting Oversight Board (United States) (PCAOB), the consolidated balance sheets of the Company as of December 31, 2025 and 2024, the related consolidated statements of (loss) income, comprehensive (loss) income, stockholders’ equity and cash flows for each of the three years in the period ended December 31, 2025, and the related notes and our report dated February 17, 2026 expressed an unqualified opinion thereon.
Basis for Opinion
The Company’s management is responsible for maintaining effective internal control over financial reporting and for its assessment of the effectiveness of internal control over financial reporting included in the accompanying Management’s Annual Report on Internal Control Over Financial Reporting. Our responsibility is to express an opinion on the Company’s internal control over financial reporting based on our audit. We are a public accounting firm registered with the PCAOB and are required to be independent with respect to the Company in accordance with the U.S. federal securities laws and the applicable rules and regulations of the Securities and Exchange Commission and the PCAOB.
We conducted our audit in accordance with the standards of the PCAOB. Those standards require that we plan and perform the audit to obtain reasonable assurance about whether effective internal control over financial reporting was maintained in all material respects.
Our audit included obtaining an understanding of internal control over financial reporting, assessing the risk that a material weakness exists, testing and evaluating the design and operating effectiveness of internal control based on the assessed risk, and performing such other procedures as we considered necessary in the circumstances. We believe that our audit provides a reasonable basis for our opinion.
Definition and Limitations of Internal Control Over Financial Reporting
A company’s internal control over financial reporting is a process designed to provide reasonable assurance regarding the reliability of financial reporting and the preparation of financial statements for external purposes in accordance with generally accepted accounting principles. A company’s internal control over financial reporting includes those policies and procedures that (1) pertain to the maintenance of records that, in reasonable detail, accurately and fairly reflect the transactions and dispositions of the assets of the company; (2) provide reasonable assurance that transactions are recorded as necessary to permit preparation of financial statements in accordance with generally accepted accounting principles, and that receipts and expenditures of the company are being made only in accordance with authorizations of management and directors of the company; and (3) provide reasonable assurance regarding prevention or timely detection of unauthorized acquisition, use, or disposition of the company’s assets that could have a material effect on the financial statements.
Because of its inherent limitations, internal control over financial reporting may not prevent or detect misstatements. Also, projections of any evaluation of effectiveness to future periods are subject to the risk that controls may become inadequate because of changes in conditions, or that the degree of compliance with the policies or procedures may deteriorate.
/s/ Ernst & Young LLP
Pittsburgh, Pennsylvania
February 17, 2026
ITEM 9B. OTHER INFORMATION
Rule 10b5-1 Trading Plans
Our executive officers and directors may from time to time enter into plans or arrangements for the purchase or sale of our Common Stock that are intended to satisfy the affirmative defense conditions of Rule 10b5-1(c) under the Exchange Act. During the three months ended December 31, 2025, no director or officer of the Company adopted or terminated a “Rule 10b5-1 trading arrangement” or “non-Rule 10b5-1 trading arrangement,” as each term is defined in Item 408 of Regulation S-K.
Severance Agreements
On February 16, 2026, we entered into a Severance Agreement (each, a “Severance Agreement”) with each of our current executive officers, including our named executive officers, consisting of Mr. Brock, Mr. Thakkar, Mr. Braithwaite, Ms. Klein, Mr. Salvatori, Mr. Schuller and Mr. Slone.
Pursuant to the Severance Agreements, if we terminate the executive officer without “cause” or if such executive officer resigns for “good reason” (each as defined in the Severance Agreements) (a “qualifying termination”) outside of the CIC Protection Period (as defined below), and subject to the executive officer signing and not revoking a general release of claims in favor of the Company and continued compliance with certain confidentiality and post-termination restrictive covenants, the executive officer would be entitled to receive (i) an amount in cash equal to 1.5-2.0 times the executive officer’s annual base salary (2.0-3.0 times in the CIC Protection Period); (ii) to the extent unpaid, the annual bonus earned for the year prior to the year of termination, based on actual performance (with any metric based on individual performance based on the higher of actual performance and target); (iii) a pro-rated portion of the annual bonus for the year of termination based on actual performance for the year (with any metric based on individual performance based on the higher of actual performance and target); (iv) an amount in cash equal to 1.5-2.0 times (2.0-3.0 times in the CIC Protection Period) the higher of (x) the executive officer’s most recent annual bonus, (y) the average annual bonus for the three years preceding the date of termination and (z) the executive officer’s target annual bonus; (v) a cash payment equal to 12 -18 times the executive officer’s applicable monthly COBRA rate (18 times in the CIC Protection Period); (vi) a cash payment equal to 12-24 times the executive officer’s applicable monthly life insurance premium rate (24-36 times in the CIC Protection Period); (vii) the matching contribution under our 401(k) plan as if the executive officer continued to participate in the plan for a period of 12-24 months (24-36 months in the CIC Protection Period); (viii) $25,000 for outplacement services; (ix) payout for any unused vacation time; and (x) all unvested equity awards under any of our equity compensation plans will be governed by the terms of the applicable award agreement, except during the CIC Protection Period, all unvested equity awards under any of our equity compensation plans that were granted prior to the change in control shall become 100% vested as to any service or time-vesting component. In addition, if the executive officer experiences a qualifying termination during the CIC Protection Period, the executive officer would also be entitled to receive the matching contribution under our nonqualified deferred compensation restoration plan as if the executive officer continued to participate in the plan for a period of 18 months. The “CIC Protection Period” is the period beginning three months prior to the date of a “change in control” (as defined in the Severance Agreements) and ending on (and including) the two-year anniversary of the date of a change in control.
The Severance Agreements contain confidentiality provisions for the benefit of the Company and post-termination restrictive covenants that prohibit the executive officers from competing with us for a period of up to 12 months following termination or soliciting our employees for a period of up to three months following termination.
The Severance Agreements do not supersede any prior employment, severance or change in control agreement between any executive officer and the Company or any of its affiliates (including Arch Resources, Inc.) with respect to the executive officer’s termination of employment that occurs on or within two years following the Merger. If the executive officer is a party to any such agreement, their Severance Agreement will only become effective upon the expiration of two years following the Merger.
The above description is qualified in its entirety by reference to the Severance Agreements, the form of which is filed as Exhibit 10.72 hereto and is incorporated herein by reference.
ITEM 9C. DISCLOSURE REGARDING FOREIGN JURISDICTIONS THAT PREVENT INSPECTIONS
Not applicable.
PART III
ITEM 10. DIRECTORS, EXECUTIVE OFFICERS AND CORPORATE GOVERNANCE
The information required by this Item is incorporated by reference from the information under the captions “Proposal No. 1 - Election of Directors,” “Executive Officers,” “Beneficial Ownership of Securities” and “Board of Directors and Compensation Information - Board of Directors and its Committees” in the Company’s Proxy Statement on Schedule 14A for its 2026 Annual Meeting of Stockholders (the “Proxy Statement”).
Code of Ethics
The Company has a written Code of Business Conduct and Ethics that applies to the Company’s Chair and Chief Executive Officer (Principal Executive Officer), President and Chief Financial Officer (Principal Financial Officer), Chief Accounting Officer (Principal Accounting Officer) and others. The Code of Business Conduct and Ethics is available on the Company’s website at www.corenaturalresources.com. Any amendments to, or waivers from, a provision of our Code of Business Conduct and Ethics that applies to our Principal Executive Officer, Principal Financial Officer and Principal Accounting Officer and that relates to any element of the code of ethics enumerated in paragraph (b) of Item 406 of Regulation S-K shall be disclosed by posting such information on our website at www.corenaturalresources.com.
Insider Trading Policies and Procedures
The Company has adopted an Insider Trading Compliance Policy governing the purchase, sale or other disposition of our securities by the Company’s directors, officers and employees, entities controlled by the Company’s directors, officers and employees, and contractors, consultants and other persons designated by the Company, which we believe is reasonably designed to promote compliance with insider trading laws, rules and regulations and applicable listing standards. A copy of our Insider Trading Compliance Policy was filed as Exhibit 19 to the Company’s Annual Report on Form 10-K for the year ended December 31, 2024, filed with the SEC on February 20, 2025.
ITEM 11. EXECUTIVE COMPENSATION
The information required by this Item is incorporated by reference from the information under the captions “Board of Directors and Compensation Information,” “Executive Compensation Information” and “Compensation Committee Interlocks and Insider Participation” in the Proxy Statement.
ITEM 12. SECURITY OWNERSHIP OF CERTAIN BENEFICIAL OWNERS AND MANAGEMENT AND RELATED STOCKHOLDER MATTERS
The information required by this Item is incorporated by reference from the information under the captions “Beneficial Ownership of Securities” and “Securities Authorized for Issuance Under the Core Natural Resources, Inc. Equity Compensation Plan” in the Proxy Statement.
ITEM 13. CERTAIN RELATIONSHIPS AND RELATED TRANSACTIONS, AND DIRECTOR INDEPENDENCE
The information required by this Item is incorporated by reference from the information under the captions “Related Person Transaction Policy and Procedures and Related Person Transactions” and “Board of Directors and Compensation Information - Board of Directors and its Committees - Determination of Director Independence” in the Proxy Statement.
ITEM 14. PRINCIPAL ACCOUNTANT FEES AND SERVICES
The information required by this Item is incorporated by reference from the information under the caption “Audit Committee and Audit Fees - Independent Registered Public Accounting Firm” in the Proxy Statement.
PART IV
ITEM 15. EXHIBITS AND FINANCIAL STATEMENT SCHEDULES
In reviewing any agreements incorporated by reference in this Form 10-K or filed with this Form 10-K, please remember that such agreements are included to provide information regarding their terms. They are not intended to be a source of financial, business or operational information about the Company or any of its subsidiaries or affiliates. The representations, warranties and covenants contained in these agreements are made solely for purposes of the agreements and are made as of specific dates; are solely for the benefit of the parties; may be subject to qualifications and limitations agreed upon by the parties in connection with negotiating the terms of the agreements, including being made for the purpose of allocating contractual risk between the parties instead of establishing matters as facts; and may be subject to standards of materiality applicable to the contracting parties that differ from those applicable to investors or security holders. Investors and security holders should not rely on the representations, warranties and covenants or any description thereof as characterizations of the actual state of facts or condition of the Company or any of its subsidiaries or affiliates or, in connection with acquisition agreements, of the assets to be acquired. Moreover, information concerning the subject matter of the representations, warranties and covenants may change after the date of the agreements. Accordingly, these representations and warranties alone may not describe the actual state of affairs as of the date they were made or at another time.
The following documents are filed as part of this report:
Financial Statements:
Report of Independent Registered Public Accounting Firm
Consolidated Statements of (Loss) Income for the Years Ended December 31, 2025, 2024 and 2023
Consolidated Statements of Comprehensive (Loss) Income for the Years Ended December 31, 2025, 2024 and 2023
Consolidated Balance Sheets at December 31, 2025 and 2024
Consolidated Statements of Stockholders’ Equity for the Years Ended December 31, 2025, 2024 and 2023
Consolidated Statements of Cash Flows for the Years Ended December 31, 2025, 2024 and 2023
Notes to the Audited Consolidated Financial Statements
Schedules:
None
Index to Exhibits
|
|
|
|
|
|
|
|
|
|
|
|
| Exhibits |
Description |
|
Method of Filing |
|
Separation and Distribution Agreement, dated as of November 28, 2017, by and between the Company and CNX |
|
Filed as Exhibit 2.1 to Form 8-K (File No. 001-38147) filed on December 4, 2017 |
|
Tax Matters Agreement, dated as of November 28, 2017, by and between the Company and CNX |
|
Filed as Exhibit 2.2 to Form 8-K (File No. 001-38147) filed on December 4, 2017 |
|
Employee Matters Agreement, dated as of November 28, 2017, by and between the Company and CNX |
|
Filed as Exhibit 2.3 to Form 8-K (File No. 001-38147) filed on December 4, 2017 |
|
Intellectual Property Matters Agreement, dated as of November 28, 2017, by and between the Company and CNX |
|
Filed as Exhibit 2.4 to Form 8-K (File No. 001-38147) filed on December 4, 2017 |
|
Agreement and Plan of Merger, dated as of October 22, 2020, by and among CONSOL Energy Inc., Transformer LP Holdings Inc., Transformer Merger Sub LLC, CONSOL Coal Resources LP and CONSOL Coal Resources GP LLC |
|
Filed as Exhibit 2.1 to Form 8-K (File No. 001-38147) filed on October 23, 2020 |
|
Agreement and Plan of Merger, dated August 20, 2024, among CONSOL Energy Inc., Mountain Range Merger Sub Inc. and Arch Resources, Inc.# |
|
Filed as Exhibit 2.1 to Form 8-K (File No. 001-38147) filed on August 21, 2024 |
|
Debtors’ Fourth Amended Joint Plan of Reorganization Under Chapter 11 of the Bankruptcy Code |
|
Filed as Exhibit 2.1 to Arch Resources’ Form 8-K (File No. 001-13105) filed on September 15, 2016 |
|
Order Confirming Debtors’ Fourth Amended Joint Plan of Reorganization Under Chapter 11 of the Bankruptcy Code on September 13, 2016 |
|
Filed as Exhibit 2.2 to Arch Resources’ Form 8-K (File No. 001-13105) filed on September 15, 2016 |
|
|
|
|
|
|
|
|
|
|
|
|
|
Amended and Restated Certificate of Incorporation of the Company |
|
Filed as Exhibit 3.1 to Form 8-K (File No. 001-38147) filed on December 4, 2017 |
|
Certificate of Amendment to Amended and Restated Certificate of Incorporation of the Company |
|
Filed as Exhibit 3.1 to Form 8-K (File No. 001-38147) filed on May 8, 2020 |
|
Second Certificate of Amendment to Amended and Restated Certificate of Incorporation of the Company |
|
Filed as Exhibit 3.1 to Form 8-K (File No. 001-38147) filed on May 6, 2024 |
|
Certificate of Amendment to Amended and Restated Certificate of Incorporation of the Company |
|
Filed as Exhibit 3.1 to Form 8-K (File No. 001-38147) filed on January 15, 2025 |
|
Fourth Amended and Restated Bylaws of the Company |
|
Filed as Exhibit 3.2 to Form 8-K (File No. 001-38147) filed on January 15, 2025 |
|
Indenture dated as of November 13, 2017 by and between CONSOL Energy Inc. (formerly known as CONSOL Mining Corporation) and UMB Bank, N.A., as Trustee and Collateral Trustee (including form of supplemental indenture on subsidiary guarantors). |
|
Filed as Exhibit 4.1 to Form 8-K (File No. 001-38147) filed on November 15, 2017 |
|
Description of Capital Stock |
|
Filed as Exhibit 4.2 to Form 10-K (File No. 001-38147) filed on February 20, 2025 |
|
Transition Services Agreement, dated as of November 28, 2017, by and between the Company and CNX |
|
Filed as Exhibit 10.1 to Form 8-K (File No. 001-38147) filed on December 4, 2017 |
|
CNX Resources Corporation to CONSOL Energy Inc. Trademark License Agreement dated as of November 28, 2017, by and between the Company and CNX |
|
Filed as Exhibit 10.2 to Form 8-K (File No. 001-38147) filed on December 4, 2017 |
|
CONSOL Energy Inc. to CNX Resources Corporation Trademark License Agreement, dated as of November 28, 2017, by and between the Company and CNX |
|
Filed as Exhibit 10.3 to Form 8-K (File No. 001-38147) filed on December 4, 2017 |
|
First Amendment to Water Supply and Services Agreement, dated as of November 28, 2017 by and between CNX Water Assets LLC and CONSOL Thermal Holdings LLC (formerly known as CNX Thermal Holdings LLC) |
|
Filed as Exhibit 10.6 to Form 8-K (File No. 001-38147) filed on December 4, 2017 |
|
Second Amendment to the Pennsylvania Mine Complex Operating Agreement, dated as of November 28, 2017, by and among CONSOL Pennsylvania Coal Company LLC, Conrhein Coal Company, CONSOL Thermal Holdings LLC and CONSOL Coal Resources LP |
|
Filed as Exhibit 10.7 to Form 8-K (File No. 001-38147) filed on December 4, 2017 |
|
Credit Agreement, dated as of November 28, 2017, by and among the Company, the various financial institutions from time to time party thereto, PNC Bank, N.A., as administrative agent for the Revolving Lenders and Term A Lenders, Citibank, N.A., as administrative agent for the Term B Lenders and PNC Bank, N.A., as collateral agent for the Lenders and the other Secured Parties referred to therein# |
|
Filed as Exhibit 10.8 to Form 8-K (File No. 001-38147) filed on December 4, 2017 |
|
Amendment No. 1, dated as of March 28, 2019, to Credit Agreement, dated as of November 28, 2017, among the Company, the various financial institutions from time to time party thereto, PNC Bank, N.A., as administrative agent for the Revolving Lenders and Term A Lenders, Citibank, N.A., as administrative agent for the Term B Lenders and PNC Bank, N.A., as collateral agent for the Lenders and the Other Secured Parties referred to therein# |
|
Filed as Exhibit 10.1 to Form 8-K (File No. 001-38147) filed on April 3, 2019 |
|
|
|
|
|
|
|
|
|
|
|
|
|
Amendment No. 2, dated as of June 5, 2020, to Credit Agreement, dated as of November 28, 2017, among the Company, the various financial institutions from time to time party thereto, PNC Bank, N.A., as administrative agent for the Revolving Lenders and Term A Lenders, Citibank, N.A., as administrative agent for the Term B Lenders and PNC Bank, N.A., as collateral agent for the Lenders and the Other Secured Parties referred to therein# |
|
Filed as Exhibit 10.1 to Form 8-K (File No. 001-38147) filed on June 11, 2020 |
|
Amendment No. 3, dated as of March 29, 2021, to Credit Agreement, dated as of November 28, 2017, among the Company, the various financial institutions from time to time party thereto, PNC Bank, N.A., as administrative agent for the Revolving Lenders and Term A Lenders, Citibank, N.A., as administrative agent for the Term B Lenders and PNC Bank, N.A., as collateral agent for the Lenders and the Other Secured Parties referred to therein# |
|
Filed as Exhibit 10.1 to Form 8-K (File No. 001-38147) filed on March 31, 2021 |
|
Amendment No. 4, dated as of July 18, 2022, to Credit Agreement, dated as of November 28, 2017, among the Company, the various financial institutions from time to time party thereto, PNC Bank, N.A., as administrative agent for the Revolving Lenders and Term A Lenders, Citibank, N.A., as administrative agent for the Term B Lenders and PNC Bank, N.A., as collateral agent for the Lenders and the Other Secured Parties referred to therein# |
|
Filed as Exhibit 10.1 to Form 8-K (File No. 001-38147) filed on July 25, 2022 |
|
Amendment No. 5, dated as of June 12, 2023, to Credit Agreement, dated as of November 28, 2017, among the Company, the various financial institutions from time to time party thereto, PNC Bank, N.A., as administrative agent for the Revolving Lenders and Term A Lenders, Citibank, N.A., as administrative agent for the Term B Lenders and PNC Bank, N.A., as collateral agent for the Lenders and the Other Secured Parties referred to therein# |
|
Filed as Exhibit 10.1 to Form 8-K (File No. 001-38147) filed on June 13, 2023 |
|
Amendment No. 6, dated as of January 14, 2025, to Credit Agreement, dated as of November 28, 2017, among the Company, the various financial institutions from time to time party thereto, PNC Bank, N.A., as administrative agent for the Revolving Lenders and Term A Lenders, Citibank, N.A., as administrative agent for the Term B Lenders and PNC Bank, N.A., as collateral agent for the Lenders and the Other Secured Parties referred to therein# |
|
Filed as Exhibit 10.1 to Form 8-K (File No. 001-38147) filed on January 15, 2025 |
|
CONSOL Energy Inc. Omnibus Performance Incentive Plan* |
|
Filed as Exhibit 4.3 to Form S-8 (File No. 333-221727) filed on November 22, 2017 |
|
Second Amendment and Restatement of Master Cooperation and Safety Agreement by and among CONSOL Energy Inc., CNX Gas Company LLC, CNX Resources Holdings LLC and certain other parties thereto |
|
Filed as Exhibit 10.5 to Form 10-12B/A (File No. 001-38147) filed on October 27, 2017 |
| 10.15 |
Coal Lease Agreement dated as of March 31, 1992, among Allegheny Land Company, as lessee, and UAC and Phoenix Coal Corporation, as lessors, and related guarantee |
|
Filed by Ashland Coal, Inc. on Form 8-K on April 6, 1992 |
|
Federal Coal Lease dated as of January 24, 1996 between the U.S. Department of the Interior and the Thunder Basin Coal Company |
|
Filed as Exhibit 10.20 to Arch Resources’ Form 10-K (File No. 001-13105) for the year ended December 31, 1998 filed on March 2, 1999 |
|
Federal Coal Lease dated as of November 1, 1967 between the U.S. Department of the Interior and the Thunder Basin Coal Company |
|
Filed as Exhibit 10.21 to Arch Resources’ Form 10-K (File No. 001-13105) for the year ended December 31, 1998 filed on March 2, 1999 |
|
|
|
|
|
|
|
|
|
|
|
|
|
Federal Coal Lease effective as of June 9, 1995 between the U.S. Department of the Interior and Mountain Coal Company |
|
Filed as Exhibit 10.22 to Arch Resources’ Form 10-K (File No. 001-13105) for the year ended December 31, 1998 filed on March 2, 1999 |
|
Federal Coal Lease dated as of January 1, 1999 between the U.S. Department of the Interior and Ark Land Company |
|
Filed as Exhibit 10.23 to Arch Resources’ Form 10-K (File No. 001-13105) for the year ended December 31, 1998 filed on March 2, 1999 |
|
Federal Coal Lease effective as of March 1, 2005 by and between the United States of America and Arch Land LT, Inc. covering the tract of land known as “Little Thunder” in Campbell County, Wyoming |
|
Filed as Exhibit 99.1 to Arch Resources’ Form 8-K (File No. 001-13105) filed on February 10, 2005 |
|
Modified Coal Lease (WYW71692) executed January 1, 2003 by and between the United States of America, through the Bureau of Land Management, as lessor, and Triton Coal Company, LLC, as lessee, covering a tract of land known as “North Rochelle” in Campbell County, Wyoming |
|
Filed as Exhibit 10.24 to Arch Resources’ Form 10-K (File No. 001-13105) for the year ended December 31, 2004 filed on March 11, 2005 |
|
Coal Lease (WYW127221) executed January 1, 1998 by and between the United States of America, through the Bureau of Land Management, as lessor, and Triton Coal Company, LLC, as lessee, covering a tract of land known as “North Roundup” in Campbell County, Wyoming |
|
Filed as Exhibit 10.25 to Arch Resources’ Form 10-K (File No. 001-13105) for the year ended December 31, 2004 filed on March 11, 2005 |
|
CONSOL Energy Inc. Deferred Compensation Plan for Non-Employee Directors* |
|
Filed as Exhibit 10.2 to Form 10-Q (File No. 001-38147) filed on November 1, 2018 |
|
Employment Agreement of James A. Brock* |
|
Filed as Exhibit 10.1 to Form 10-Q (File No. 001-38147) filed on May 3, 2018 |
|
Change in Control Severance Agreement for Kurt Salvatori* |
|
Filed as Exhibit 10.5 to Form 10-Q (File No. 001-38147) filed on May 3, 2018 |
|
Change in Control Severance Agreement for John Rothka* |
|
Filed as Exhibit 10.6 to Form 10-Q (File No. 001-38147) filed on May 3, 2018 |
|
Form of Employment Agreement for Executive Officers of Arch and assumed by Core* |
|
Filed as Exhibit 10.4 of Arch Resources’ Form 10-K (File No. 001-13105) for the year ended December 31, 2011 filed on February 29, 2012 |
|
Form Notice of Restricted Stock Unit Award and Terms and Conditions* |
|
Filed as Exhibit 10.7 to Form 10-Q (File No. 001-38147) filed on May 3, 2018 |
|
Form Notice of Performance-based Restricted Stock Unit Award and Terms and Conditions* |
|
Filed as Exhibit 10.8 to Form 10-Q (File No. 001-38147) filed on May 3, 2018 |
|
Form Notice of Restricted Stock Unit Award and Terms and Conditions for Spin Recognition (Non-Employee Director)* |
|
Filed as Exhibit 10.9 to Form 10-Q (File No. 001-38147) filed on May 3, 2018 |
|
Form Notice of Restricted Stock Unit Award and Terms and Conditions for Spin Recognition* |
|
Filed as Exhibit 10.10 to Form 10-Q (File No. 001-38147) filed on May 3, 2018 |
|
Form Notice of Restricted Stock Unit Award and Terms and Conditions* |
|
Filed as Exhibit 10.4 to Form 10-Q (File No. 001-38147) filed on May 8, 2019 |
|
Form Notice of Performance-based Restricted Stock Unit Award and Terms and Conditions* |
|
Filed as Exhibit 10.5 to Form 10-Q (File No. 001-38147) filed on May 8, 2019 |
|
Change in Control Severance Agreement for Mitesh Thakkar* |
|
Filed as Exhibit 10.30 to Form 10-K (File No. 001-38147) filed on February 11, 2022 |
|
Form of Notice of Restricted Stock Unit Award Terms and Conditions* |
|
Filed as Exhibit 10.3 to Form 10-Q (File No. 001-38147) filed on May 11, 2020 |
|
Form of Notice of Performance-Based Restricted Stock Unit Award Terms and Conditions for James A. Brock*# |
|
Filed as Exhibit 10.4 to Form 10-Q (File No. 001-38147) filed on May 11, 2020 |
|
Form of Notice of Performance-Based Cash Award*# |
|
Filed as Exhibit 10.5 to Form 10-Q (File No. 001-38147) filed on May 11, 2020 |
|
|
|
|
|
|
|
|
|
|
|
|
|
CONSOL Energy Inc. 2020 Amended and Restated Omnibus Performance Incentive Plan* |
|
Filed as Exhibit 4.4 to Registration Statement on Form S-8 (file No. 333-238173) filed on May 11, 2020 |
|
Form of Notice of Restricted Stock Unit Award Terms and Conditions for Non-Employee Directors* |
|
Filed as Exhibit 10.5 to Form 10-Q (File No. 001-38147) filed on August 10, 2020 |
|
Form Notice of Performance-based Cash Award and Terms and Conditions* |
|
Filed as Exhibit 10.2 to Form 10-Q (File No. 001-38147) filed on May 4, 2021 |
|
Form Notice of Performance-based Market Share Units and Terms and Conditions* |
|
Filed as Exhibit 10.3 to Form 10-Q (File No. 001-38147) filed on May 4, 2021 |
|
Form of Notice of Restricted Stock Unit Award Terms and Conditions for Non-Employee Directors* |
|
Filed as Exhibit 10.1 to Form 10-Q (File No. 001-38147) filed on August 3, 2021 |
|
Amendment to CONSOL Energy Inc. 2020 Amended and Restated Omnibus Performance Incentive Plan, effective as of December 30, 2020 (incorporated by reference to Exhibit 4.5 to the Company’s Registration Statement on Form S-8 filed on December 31, 2020) |
|
Filed as Exhibit 4.5 to Form S-8 (File No. 001-38147) filed on December 31, 2020 |
|
First Amendment to Employment Agreement of James A. Brock* |
|
Filed as Exhibit 10.45 to Form 10-K (File No. 001-38147) filed on February 12, 2021 |
|
Second Amendment to Employment Agreement of James A. Brock* |
|
Filed as Exhibit 10.44 to Form 10-K (File No. 001-38147) filed on February 11, 2022 |
|
Form of Notice of Restricted Stock Unit Award Terms and Conditions for Non-Employee Directors* |
|
Filed as Exhibit 10.4 to Form 10-Q (File No. 001-38147) filed on August 4, 2022 |
|
Form Notice of Performance Based Cash Award and Terms and Conditions* |
|
Filed as Exhibit 10.2 to Form 10-Q (File No. 001-38147) filed on May 3, 2022 |
|
Form Notice of Restricted Stock Unit Award and Terms and Conditions* |
|
Filed as Exhibit 10.3 to Form 10-Q (File No. 001-38147) filed on May 3, 2022 |
|
2022 Executive Short-Term Incentive Program Terms and Conditions* |
|
Filed as Exhibit 10.4 to Form 10-Q (File No. 001-38147) filed on May 3, 2022 |
|
Third Amendment to Employment Agreement of James A. Brock* |
|
Filed as Exhibit 10.52 to Form 10-K (File No. 001-38147) filed on February 10, 2023 |
|
Change in Control Severance Agreement for Mitesh Thakkar* |
|
Filed as Exhibit 10.53 to Form 10-K (File No. 001-38147) filed on February 10, 2023 |
|
Form Notice of Restricted Stock Unit Award and Terms and Conditions for Non-Employee Directors* |
|
Filed as Exhibit 10.2 to Form 10-Q (File No. 001-38147) filed on August 8, 2023 |
|
Form Notice of Performance-based Restricted Stock Unit Award and Terms and Conditions* |
|
Filed as Exhibit 10.3 to Form 10-Q (File No. 001-38147) filed on August 8, 2023 |
|
Form Notice of Service-based Restricted Stock Unit Award and Terms and Conditions* |
|
Filed as Exhibit 10.4 to Form 10-Q (File No. 001-38147) filed on August 8, 2023 |
|
2023 Executive Short-Term Incentive Program Terms and Conditions* |
|
Filed as Exhibit 10.5 to Form 10-Q (File No. 001-38147) filed on August 8, 2023 |
|
Form Notice of Performance-based Restricted Stock Unit Award Terms and Conditions* |
|
Filed as Exhibit 10.1 to Form 10-Q (File No. 001-38147) filed on May 7, 2024 |
|
Form Notice of Service-based Restricted Stock Unit Award and Terms and Conditions* |
|
Filed as Exhibit 10.2 to Form 10-Q (File No. 001-38147) filed on May 7, 2024 |
|
2024 Executive Short-Term Incentive Program Terms and Conditions* |
|
Filed as Exhibit 10.3 to Form 10-Q (File No. 001-38147) filed on May 7, 2024 |
|
Form Notice of Restricted Stock Unit Award and Terms and Conditions for Non-Employee Directors* |
|
Filed as Exhibit 10.1 to Form 10-Q (File No. 001-38147) filed on August 8, 2024 |
|
Waiver, Acknowledgement and Amendment, dated August 20, 2024, by and between CONSOL Energy Inc. and James A. Brock |
|
Filed as Exhibit 10.1 to Form 8-K (File No. 001-38147) filed on August 21, 2024 |
|
Form of Indemnification and Advancement Agreement* |
|
Filed as Exhibit 10.3 to Form 8-K (File No. 001-38147) filed on January 15, 2025 |
|
Form of Performance Restricted Stock Unit Award Agreement (Executive 2025 Annual Award)* |
|
Filed as Exhibit 10.96 to Form 10-Q (File No. 001-38147) filed on May 8, 2025 |
|
|
|
|
|
|
|
|
|
|
|
|
|
Form of Restricted Stock Unit Award Agreement (Executive 2025 Annual Award)* |
|
Filed as Exhibit 10.97 to Form 10-Q (File No. 001-38147) filed on May 8, 2025 |
|
Form of Performance Restricted Stock Unit Award Agreement (Executive Start-Up Grant)* |
|
Filed as Exhibit 10.98 to Form 10-Q (File No. 001-38147) filed on May 8, 2025 |
|
Form of Restricted Stock Unit Award Agreement (Executive Start-Up Grant)* |
|
Filed as Exhibit 10.99 to Form 10-Q (File No. 001-38147) filed on May 8, 2025 |
|
Form of Restricted Stock Unit Award Agreement (Non-Employee Directors 2025 Annual Award and Start-Up Grant)* |
|
Filed as Exhibit 10.100 to Form 10-Q (File No. 001-38147) filed on May 8, 2025 |
|
Receivables Financing Agreement, dated as of July 28, 2025, by and among Core Receivable Company, LLC, as borrower, Core Sales, LLC, as the initial servicer, PNC, as administrative agent and LC bank, PNC CM, as structuring agent, and the lenders from time to time party thereto#^ |
|
Filed as Exhibit 10.1 to Form 8-K (File No. 001-38147) filed on July 31, 2025 |
|
Third Amended and Restated Sale and Contribution Agreement, dated as of July 28, 2025, by and among Core Receivable Company, LLC, Core Sales, LLC, as the initial servicer, and Arch as transferor# |
|
Filed as Exhibit 10.2 to Form 8-K (File No. 001-38147) filed on July 31, 2025 |
|
Third Amended and Restated Purchase and Sale Agreement, dated as of July 28, 2025, by and among Arch, as buyer, Core Sales, LLC, as the initial servicer, and the originators party thereto# |
|
Filed as Exhibit 10.3 to Form 8-K (File No. 001-38147) filed on July 31, 2025 |
|
Fifth Amended and Restated Performance Guaranty, dated as of July 28, 2025, by Core in favor of PNC for the benefit of the secured parties under the Receivables Financing Agreement# |
|
Filed as Exhibit 10.4 to Form 8-K (File No. 001-38147) filed on July 31, 2025 |
|
Separation and Release Agreement, by and between the Company and Paul Lang* |
|
Filed as Exhibit 10.75 to Form 10-Q (File No. 001-38147) filed on November 6, 2025 |
|
Form of Core Natural Resources, Inc. Severance Agreement* |
|
Filed herewith |
|
Core Natural Resources, Inc. Insider Trading Policy |
|
Filed as Exhibit 19 to Form 10-K (File No. 001-38147) filed on February 20, 2025 |
|
Subsidiaries of Core Natural Resources, Inc. |
|
Filed herewith |
|
Consent of Ernst & Young LLP |
|
Filed herewith |
|
Consent of Weir International, Inc. |
|
Filed herewith |
|
Consent of The John T. Boyd Company |
|
Filed herewith |
|
Power of Attorney |
|
Filed herewith |
|
Certification of Chief Executive Officer pursuant to Section 302 of Sarbanes-Oxley Act of 2002 |
|
Filed herewith |
|
Certification of Chief Financial Officer pursuant to Section 302 of the Sarbanes-Oxley Act of 2002 |
|
Filed herewith |
|
Certification of Chief Executive Officer pursuant to 18 U.S.C. Section 1350, as adopted pursuant to Section 906 of the Sarbanes-Oxley Act of 2002 |
|
Furnished herewith |
|
Certification of Chief Financial Officer pursuant to 18 U.S.C. Section 1350, as adopted pursuant to Section 906 of the Sarbanes-Oxley Act of 2002 |
|
Furnished herewith |
|
Mine Safety Disclosure |
|
Filed herewith |
|
Technical Report Summary, Coal Resources and Coal Reserves, Leer Complex, West Virginia |
|
Filed herewith |
|
Technical Report Summary, Coal Resources and Coal Reserves, Black Thunder, Wyoming |
|
Filed herewith |
|
Technical Report Summary, Coal Resources and Coal Reserves, Pennsylvania Mining Complex, Pennsylvania and West Virginia |
|
Filed as Exhibit 96.1 to Form 10-K (File No. 001-38147) filed on February 20, 2025 |
|
Core Natural Resources, Inc. Compensation Recoupment Policy |
|
Filed as Exhibit 97 to Form 10-K (File No. 001-38147) filed on February 20, 2025 |
|
|
|
|
|
|
|
|
|
|
|
|
| 101 |
Interactive Data File (Form 10-K for the year ended December 31, 2025, furnished in Inline XBRL) |
|
Filed herewith |
| 104 |
Cover Page Interactive Data File (formatted as Inline XBRL and contained in Exhibit 101) |
|
Filed herewith |
* Indicates management contract or compensatory plan or arrangement.
** The schedules have been omitted pursuant to Item 601(b)(2) of Regulation S-K and will be provided to the Securities and Exchange Commission upon request.
# Schedules and attachments to this Exhibit have been omitted pursuant to Item 601(a)(5) of Regulation S-K. The Company hereby undertakes to furnish supplementally copies of any of the omitted schedules upon request by the Securities and Exchange Commission.
^ Portions of this exhibit have been omitted pursuant to Item 601(b)(10) of Regulation S-K because they are both (i) not material and (ii) contain the type of information that the Company customarily and actually treats as private or confidential. Such omitted information is indicated by brackets “[***]” in this exhibit.
Supplemental Information
In accordance with Item 601(b)(32)(ii), Exhibits 32.1 and 32.2 are being furnished and not filed.
ITEM 16. FORM 10-K SUMMARY
None.
SIGNATURES
Pursuant to the requirements of Section 13 or 15(d) of the Securities Exchange Act of 1934, the registrant has duly caused this report to be signed on its behalf by the undersigned, thereunto duly authorized, as of the 17th day of February, 2026.
|
|
|
|
|
|
| CORE NATURAL RESOURCES, INC. |
| |
|
| By: |
/s/ JAMES A. BROCK |
| |
James A. Brock |
| |
Chair and Chief Executive Officer |
| |
(Principal Executive Officer) |
| |
|
| By: |
/s/ MITESHKUMAR B. THAKKAR |
| |
Miteshkumar B. Thakkar |
| |
President and Chief Financial Officer |
| |
(Principal Financial Officer) |
Pursuant to the requirements of the Securities Exchange Act of 1934, this report has been signed as of the 17th day of February, 2026, by the following persons on behalf of the registrant in the capacities indicated:
|
|
|
|
|
|
|
|
|
| Signature |
|
Title |
| |
|
|
| /s/ JAMES A. BROCK |
|
Chair and Chief Executive Officer |
| James A. Brock |
|
(Principal Executive Officer) |
| |
|
|
| /s/ MITESHKUMAR B. THAKKAR |
|
President and Chief Financial Officer |
| Miteshkumar B. Thakkar |
|
(Principal Financial Officer) |
| |
|
|
| /s/ JOHN M. ROTHKA |
|
Chief Accounting Officer |
| John M. Rothka |
|
(Principal Accounting Officer) |
| |
|
|
| * |
|
Lead Independent Director |
| Richard A. Navarre |
|
|
|
|
|
| * |
|
Director |
| Valli Perera |
|
|
| |
|
|
| * |
|
Director |
| Joseph P. Platt |
|
|
| |
|
|
| * |
|
Director |
| Patrick A. Kriegshauser |
|
|
|
|
|
| * |
|
Director |
| Holly Keller Koeppel |
|
|
|
|
|
*By /s/ ROSEMARY L. KLEIN |
|
|
| Rosemary L. Klein, |
|
|
| Attorney-in-Fact |
|
|
EX-10.72
2
cnr12312025-exhibit1072.htm
EX-10.72
Document
Exhibit 10.72
SEVERANCE AGREEMENT
THIS SEVERANCE AGREEMENT (“Agreement”) is made as of [ ò ] (the “Effective Date”), by and between Core Natural Resources, Inc. (together with its subsidiaries, the “Company”) and [ ò ] (the “Employee”).
WHEREAS, the Company considers Employee to be a valuable member of the Company’s business and an important part of the continued growth and success of the Company’s business and, accordingly, in order to provide an incentive for Employee to remain employed with the Company, the Company is providing Employee with the following severance award (the “Severance Award”) on the terms set forth in this Agreement.
NOW THEREFORE, in consideration of the mutual covenants hereinafter contained and other good and valuable consideration, the receipt and sufficiency of which is hereby acknowledged, including but not limited to the grant of the Severance Award, Employee’s continued employment with the Company, and the parties intending to be legally bound, the parties hereto agree as follows:
1.Position; Compensation and Benefits.
(a)Position and Duties. As of the Effective Date, Employee shall serve as the [Title] of the Company. In such capacity, Employee shall have such responsibilities, powers and duties customarily associated with such position or as may from time to time be prescribed by the Chief Executive Officer of the Company]1; provided that such prescribed responsibilities, powers and duties are substantially consistent with those customarily assigned to individuals serving in such positions at comparable companies or as may be reasonably required by the conduct of the business of the Company.
(b)Base Salary. During Employee’s term of employment with the Company, Employee will receive an annual base salary, payable in accordance with the normal payroll practices of the Company.
(c)Bonuses. During Employee’s term of employment with the Company, Employee will be eligible to receive an annual cash bonus on such terms established from time to time by the Board or the Compensation Committee of the Board, as applicable.
(d)Long-Term Incentive Plan. During Employee’s term of employment with the Company, Employee will be eligible to participate in any long-term incentive compensation plan maintained by the Company from time to time, on the terms established by the Board or the Compensation Committee of the Board, as applicable.
(e)Benefits. During Employee’s term of employment with the Company, Employee will be entitled to participate in all employee benefit and fringe benefit plans and arrangements made available by the Company to its executives and key management employees, upon the terms and subject to the conditions set forth in the applicable plan or arrangement.
2.Severance Award.
(a)Severance upon Non-CIC Qualifying Termination. The Company agrees that if Employee’s employment is terminated by the Company without Cause or Employee resigns for Good Reason, and such termination or resignation does not occur during the CIC Protection Period (a “Non-
1 For Executive Chair/CEO agreement, the Board of Directors has this responsibility.
CIC Qualifying Termination”) then, subject to Section 2(d) and the other terms of this Agreement, Employee will be entitled to receive the following payments and benefits:
(i)an amount in cash equal to 1.5 times Employee’s Annual Base Salary, which amount shall be payable in a single lump sum within sixty (60) days following the Date of Termination;2
(ii)to the extent unpaid as of the Date of Termination, an amount in cash equal to the annual bonus earned by Employee for the calendar year prior to the calendar year in which the Date of Termination occurs, based on actual performance for such year, provided that any metric based upon individual performance (as opposed to Company performance) shall be based upon the higher of such Employee’s actual performance and target; which amount shall be payable in a single lump sum within sixty (60) days following the Date of Termination;
(iii) an amount in cash equal to a pro-rata portion of the annual bonus for the calendar year in which the Date of Termination occurs, determined by multiplying (x) the annual bonus amount based on actual performance for the year, provided that any metric based upon individual performance (as opposed to Company performance) shall be based upon the higher of such Employee’s actual performance and target, by (y) a fraction, using the number of days of the calendar year elapsed prior to the Date of Termination as the numerator and the number of days in such calendar year as the denominator, payable no later than March 15 of the calendar year following the calendar year in which the Date of Termination occurs;
(iv)an amount in cash equal to 1.5 times Employee’s Average Annual Bonus, which amount shall be payable in a single lump sum within sixty (60) days following the Date of Termination;3
(v) an amount in cash equal to the product of (x) 12 and (y) the monthly COBRA rate in effect from time to time for Employee and Employee’s eligible dependents for coverage under the Company’s health plans, which amount shall be payable in a single lump sum within sixty (60) days following the Date of Termination;4
(vi)an amount in cash equal to the product of (x) 12 and (y) the monthly premium rate applicable upon conversion of Employee’s non-optional Company-group life insurance to individual coverage at the rate applicable to the converted policy assuming timely application to the insurance company for conversion and, if Employee has not timely applied for conversion, then at the group rate on the Date of Termination, which amount shall be payable in a single lump sum within sixty (60) days following the Date of Termination;5
(vii) an amount in cash equal to the matching contribution Employee would have received under the Company’s 401(k) plan as if Employee had been contributing the same percentage of Employee’s eligible compensation under such plans as in effect on the Date of Termination during the 12-month period following such Date of Termination. For purposes of this calculation, payments made pursuant to Section 2(a)(i) through 2(a)(iv) of this Agreement shall be deemed includable compensation under this plan to the same extent as if Employee had
2 Agreement for CEO/Executive Chair is 2x in lieu of 1.5x.
3 Agreement for CEO/Executive Chair is 2x in lieu of 1.5x.
4 Agreement for CEO/Executive Chair is 18 months in lieu of 12 months.
5 Agreement for CEO/Executive Chair is 24 months in lieu of 12 months.
remained an active employee of the Company and the payments were made for base salary and annual bonus during the period following the Date of Termination;6
(viii)$25,000 in lieu of the Company providing outplacement services, which amount shall be payable in a single lump sum within sixty (60) days following the Date of Termination;
(ix)an amount in cash equal to the value of all unused, earned and accrued vacation as of the Date of Termination; and
(x)all unvested equity or equity-based awards held by Employee under any Company equity compensation plans shall be governed by the terms of the applicable award agreement.
(b)Severance upon CIC Qualifying Termination. The Company agrees that if Employee’s employment is terminated by the Company without Cause or Employee resigns for Good Reason, and such termination or resignation occurs during the CIC Protection Period (a “CIC Qualifying Termination”), then, subject to Section 2(d) and other terms of this Agreement, Employee will be entitled to receive the following payments and benefits:
(i)an amount in cash equal to 2.0 times Employee’s Annual Base Salary7;
(ii)to the extent unpaid as of the Date of Termination, an amount in cash equal to the annual bonus earned by Employee for the calendar year prior to the calendar year in which the Date of Termination occurs, based on actual performance for such year, provided that any metric based upon individual performance (as opposed to Company performance) shall be based upon the higher of such Employee’s actual performance and target, which amount shall be payable in a single lump sum within sixty (60) days following the Date of Termination;
(iii)an amount in cash equal to a pro-rata portion of the annual bonus for the calendar year in which the Date of Termination occurs, determined by multiplying (x) the annual bonus amount based on actual performance for the year, provided that any metric based upon individual performance (as opposed to Company performance) shall be based upon the higher of such Employee’s actual performance and target, by (y) a fraction, using the number of days of the calendar year elapsed prior to the Date of Termination as the numerator and the number of days in such calendar year as the denominator, payable no later than March 15 of the calendar year following the calendar year in which the Date of Termination occurs;
(iv)an amount in cash equal to 2.0 times Employee’s Average Annual Bonus8;
(v) an amount in cash equal to the product of (x) 18 and (y) the monthly COBRA rate in effect from time to time for Employee and Employee’s eligible dependents for coverage under the Company’s health plans;
(vi)an amount in cash equal to the product of (x) 24 and (y) the monthly premium rate applicable upon conversion of Employee’s non-optional Company-group life insurance to individual coverage at the rate applicable to the converted policy assuming timely application to
6 Agreement for CEO/Executive Chair is 24 months in lieu of 12 months.
7 Agreement for CEO/Executive Chair is 3x and agreement for President is 2.5x (in lieu of 2x).
8 Agreement for CEO/Executive Chair is 3x and agreement for President is 2.5x (in lieu of 2x).
the insurance company for conversion and, if Employee has not timely applied for conversion, then at the group rate on the Date of Termination9;
(vii) an amount in cash equal to the matching contribution Employee would have received under the Company’s 401(k) plan as if Employee had been contributing the same percentage of Employee’s eligible compensation under such plans as in effect on the Date of Termination during the 24-month period following such Date of Termination. For purposes of this calculation, payments made pursuant to Section 2(b)(i) through 2(b)(iv) of this Agreement shall be deemed includable compensation under this plan to the same extent as if Employee had remained an active employee of the Company and the payments were made for base salary and annual bonus during the period following the Date of Termination10;
(viii) an amount in cash equal to the matching contribution Employee would have received under the Company’s nonqualified deferred compensation restoration plan as if Employee had been contributing the same percentage of Employee’s eligible compensation under such plan as in effect on the Date of Termination during the 18-month period following the Date of Termination. For purposes of this calculation, payments made pursuant to Section 2(b)(i) through 2(b)(iv) of this Agreement shall be deemed includable compensation under this plan to the same extent as if Employee had remained an active employee of the Company and the payments were made for base salary and annual bonus during the period following the Date of Termination;
(ix)$25,000 in lieu of the Company providing outplacement services, which amount shall be payable in a single lump sum within sixty (60) days following the Date of Termination;
(x)an amount in cash equal to the value of all unused, earned and accrued vacation as of the Date of Termination pursuant to the Company’s policies in effect immediately prior to the Change in Control and
(xi)all unvested equity or equity-based awards held by Employee under any Company equity compensation plans that were granted prior to the Change in Control shall become 100% vested as to any service or time-vesting component; provided that, (i) if the Date of Termination precedes the Change in Control, all such unvested awards shall remain outstanding and eligible to vest in accordance with this Section if a Change in Control occurs within three (3) months following the Date of Termination (and will automatically terminate upon expiration of such three (3) month period if no Change in Control occurs); and (ii) in no event will any such award remain outstanding beyond the final expiration date of the award. For the avoidance of doubt, any such awards that vest in whole or in part based upon the attainment of performance-vesting conditions shall be governed by the terms of the applicable award agreement.
Except as otherwise provided under this Section 2(b), and subject to Section 6(e), the amounts payable under this Section 2(b) will be paid in a single lump sum within sixty (60) days following the later of the Date of Termination and the date of the Change in Control; provided, that (i) if the sixty (60) day period begins in one calendar year and ends in a second calendar year, such payments, to the extent they qualify as “non-qualified deferred compensation” within the meaning of Section 409A, shall be paid in the second calendar year and (ii) if the Date of Termination occurs during the three (3) month period prior to the date of the Change in Control, Employee shall be paid the Severance Award in accordance with
9 Agreement for CEO/Executive Chair is 36 months in lieu of 24 months.
10 Agreement for CEO/Executive Chair is 36 months in lieu of 24 months.
Section 2(a) and any amounts payable under this Section 2(b) that exceed what Employee received under Section 2(a) will be paid in a lump sum by the later of sixty (60) days after the Date of Termination and ten (10) days after the date of the Change in Control.
(c)Eligibility for Severance Award; Accrued Obligations. For the avoidance of doubt, (i) Employee shall not be eligible or entitled to any Severance Award if Employee resigns for any reason other than for Good Reason, except as provided with respect to unvested equity or equity-based awards held by Employee under any Company equity compensation plans as set forth in the applicable award agreement; and (ii) a CIC Qualifying Termination shall not be triggered by reason of Employee’s termination by the Company without Cause or resignation for Good Reason that occurs on or within two (2) years following the transaction whereby the Company acquired Arch Resources, Inc.; provided, however, that Employee shall be entitled to severance payments for such two (2) years under any Prior CIC Agreement in accordance with Section 6(i).
(d)Waiver and Release of Claims. Employee’s right to receive the payments and benefits in Section 2(a) or Section 2(b), as applicable, is subject to and conditioned upon Employee’s (i) timely execution of a waiver and release of claims, which shall be substantially in the form used by the Company on the Date of Termination, which releases the Company to the fullest extent permitted by law from all claims Employee may have against the Company on the Date of Termination except for claims related to (x) Employee’s right to, or the amount of, the Severance Award or other benefits to which Employee is entitled under this Agreement or any Equity Awards and (y) claims that cannot be released as a matter of law, including any applicable worker’s compensation or unemployment compensation; and (ii) such waiver and release of claims becoming effective and non-revocable within seven (7) days after its execution (if applicable).
(e)Other Benefits. Employee does not relinquish eligibility for any other benefits by virtue of the grant of the Severance Award except that any severance payment Employee is eligible to receive under this Agreement is a substitute for and not in addition to any severance benefits that may be available under any practice, plan or policy of the Company in effect at the time of Employee’s termination of employment, except as provided with respect to unvested equity or equity-based awards held by Employee under any Company equity compensation plans as set forth in the applicable award agreement (collectively the “Equity Awards”).
3.Definitions. For purposes of this Agreement, the following terms shall have the meanings set forth below:
(a)“Annual Base Salary” means the highest of Employee’s (i) annual base salary immediately prior to the Date of Termination, and (ii) highest annual base salary during the three calendar years preceding the calendar year in which the Date of Termination occurs.
(b)“Average Annual Bonus” means the highest of (i) the most recent annual bonus paid to Employee prior to the Date of Termination, (ii) the average annual bonus paid to Employee during the three full calendar years preceding the Date of Termination and (iii) Employee’s target annual bonus. If Employee has not been employed by the Company (including Arch Resources, Inc.) for three full calendar years prior to the Date of Termination, the Average Annual Bonus shall mean the higher of clause (i) and (iii).
(c)“Board” means the Board of Directors of the Company.
(d)“Cause” means (i) gross negligence in the performance of Employee’s duties which results in material financial harm to the Company; (ii) Employee’s conviction of, or plea of guilty or nolo contendere to, a felony or any misdemeanor involving fraud, embezzlement or theft; (iii) Employee’s willful failure to substantially perform Employee’s duties and responsibilities with the Company, without the same being corrected by Employee within thirty (30) days of written notice by the Company which specifies such failure and any reasonably required corrective actions; (iii) Employee’s willful and material breach of the Restrictive Covenants; (iv) Employee’s willful engagement in conduct that is demonstrably and materially injurious to the Company, including the willful violation of a material provision of the Company’s code of conduct for executive and management employees. For purposes of this definition, no act, or failure to act, on Employee’s part shall be considered “willful” unless done, or omitted to be done, by Employee not in good faith and without reasonable belief that Employee’s action or omission was in the best interest of the Company.
(e)“Change in Control” means, following the Effective Date, the earliest to occur of: (i) any one “person” as such term is used in Sections 13(d) and 14(d) of the Securities Exchange Act of 1934, as amended (the “Exchange Act”) (other than (x) the Company, (y) any trustee or other fiduciary holding securities under an employee benefit plan of the Company, and (z) any corporation owned, directly or indirectly, by the stockholders of the Company in substantially the same proportions as their ownership of shares of common stock of the Company (“Shares”)), or more than one “person” acting as a “group,” is or becomes the “beneficial owner” (as defined in Rule 13d-3 under the Exchange Act) of Shares that, together with the Shares held by such “person” or “group,” possess more than 40% of the total fair market value or total voting power of the Shares and other stock of the Company; (ii) a majority of the members of the Board is replaced during any twelve (12) month period by directors whose appointment or election is not endorsed by a majority of the members of the Board prior to the date of the appointment or election; or (iii) the sale of all or substantially all of the Company’s assets (which shall be determined in the sole discretion of the Board). For the avoidance of doubt, references within this definition of “Change in Control” to the “Company” are solely to Core Natural Resources, Inc., such that a sale of a subsidiary of Core Natural Resources, Inc. shall not constitute a “Change in Control” under this Agreement unless otherwise determined in the sole discretion of the Board.
(f)“CIC Protection Period” means the period beginning on and including three (3) months prior to the date of a Change in Control and ending on and including the two-year anniversary of the date of a Change in Control.
(g)“Competitive Activity” means Employee’s participation, without the written consent of the Chief Legal Officer of the Company (or an authorized officer of the Company if Employee is the Chief Legal Officer), in the management of any Competitive Operation. Competitive Activity will not include (i) the mere ownership of securities in any enterprise or (ii) participation in the management of any enterprise or any business operation thereof, other than in connection with a Competitive Operation of such enterprise.
(h)“Competitive Operation” means the business operation of any enterprise if such operation engages in substantial and direct competition with any business operation actively conducted by the Company or its divisions and subsidiaries on the date of Employee’s termination of employment. A business operation will be considered a Competitive Operation if such business sells a competitive product or service that constitutes (i) 15% of that business’s total sales or (ii) 15% of the total sales of any individual subsidiary or division of that business and, in either event, the Company’s sales of a similar product or service constitutes 15% of the total sales of the Company.
(i)“Confidential Information” means information relating to the Company’s, its divisions’ and subsidiaries’ and their successors’ business practices and business interests, including, but not limited to, customer and supplier lists, business forecasts, business and strategic plans, financial and sales information, information relating to products, process, equipment, operations, marketing programs, research or product development, engineering records, computer systems and software, personnel records or legal records.
(j)“Date of Termination” means the effective date of Employee’s Non-CIC Qualifying Termination or CIC Qualifying Termination, as applicable.
(k)“Good Reason” means (i) an adverse change in Employee’s title with the Company, a material adverse change in Employee’s reporting structure, or the material diminution of Employee’s duties or responsibilities, including the assignment of any duties or responsibilities materially inconsistent with Employee’s position (but excluding any loss of any position with any subsidiary of the Company to which Employee is not separately compensated); (ii) a material reduction by the Company in Employee’s annual total compensation (including base salary, target bonus and target long-term incentive compensation value), other than a reduction of annual base salary by less than 10% or in connection with an across the board reduction of annual base salary for all, or substantially all, executive-level employees of the Company; (iii) a relocation of Employee’s primary work location without Employee’s written consent by more than 50 miles, except for required travel on the Company’s business; or (iv) any breach by the Company of any material provision of this Agreement or any other material written agreement between Employee and the Company. Notwithstanding the foregoing, Employee’s resignation of employment shall not be a resignation of employment for Good Reason unless (x) Employee gives notice to the Company of the condition giving rise to such resignation within 60 days of its initial existence; (y) the Company does not cure the condition giving rise to such resignation within the 30 day period beginning on the date it receives notice from Employee of such condition; and (z) such resignation occurs within 60 days following such cure period.
(l)“Solicitation Activity” means Employee’s solicitation for employment or hiring, without the written consent of the Chief Legal Officer of the Company (or an authorized officer of the Company if Employee is the Chief Legal Officer), of any person employed by the Company on the date of Employee’s termination of employment.
4.Restrictive Covenants. In consideration of the grant of the Severance Award and other good and valuable consideration, Employee agrees to the following restrictive covenants:
(a)Non-Competition and Non-Solicitation. During the period beginning on the Effective Date and ending on the earlier of (i) the first anniversary of Employee’s termination of employment for any reason or (ii) the date on which a Change in Control occurs, Employee will not engage in any Competitive Activity. During the period beginning on the Effective Date and ending on the earlier of (i) the three month anniversary of Employee’s termination of employment for any reason or (ii) the date on which a Change in Control occurs, Employee will not engage in any Solicitation Activity.
(b)Confidentiality. Employee will at all times keep secret and confidential all Confidential Information that Employee acquires or has acquired in connection with or as a result of the performance of services for the Company unless (i) the Company otherwise consents or (ii) Employee is legally required to disclose such Confidential Information by a court of competent jurisdiction. Notwithstanding anything to the contrary contained herein, nothing in this Agreement or any previous agreement with the Company shall prohibit Employee from reporting possible violations of federal law or regulation to or otherwise cooperating with or providing information requested by any governmental agency or entity, including, but not limited to, the Department of Justice, the Securities and Exchange Commission, the Congress and any agency Inspector General, or making other disclosures that are protected under the whistleblower provisions of federal law or regulation. Employee does not need the prior authorization of the Company to make any such reports or disclosures and Employee is not required to notify the Company that Employee has made such reports or disclosures.
(c)Non-Disparagement. Employee will not knowingly make any statement, written or oral, that disparages the business or reputation of the Company or any of its subsidiaries or the officers or directors of any of them. The Company’s officers and directors will not knowingly make any statement, written or oral, that disparages the business or reputation of Employee.
5.The restrictive covenants set forth in this Section 4 (the “Restrictive Covenants”) shall supersede any other restrictive covenants set forth in any agreement between Employee and the Company or any of its subsidiaries.
6.Injunctive Relief. Employee acknowledges and agrees that the remedy of the Company at law for any breach of the covenants and agreements contained in Section 4 will be inadequate, and that the Company will be entitled to injunctive relief against any such breach or any threatened, imminent, probable or possible breach. Employee represents and agrees that such injunctive relief shall not prohibit Employee from earning a livelihood acceptable to Employee.
7.Other Terms and Conditions.
(a)Taxes and Other Benefits. All forms of compensation referred to in this Agreement are subject to reduction to reflect applicable withholding and payroll taxes and other deductions required by law. Except as otherwise expressly provided in Section 2(a) or Section 2(b), no payments made pursuant to this Agreement will be considered when determining Employee’s benefits under the Company’s other benefit plans (e.g., 401(k) plan, defined benefit pension plan, etc.).
(b)Legal Fees and Expenses. Any other provision of this Agreement notwithstanding, the Company shall pay all legal fees and expenses which Employee may incur as a result of the Company’s contesting of the validity, enforceability or Employee’s interpretation of, or determinations under, any part of this Agreement. The Company shall make payment of such reimbursement within thirty (30) days of Employee’s submission of reasonable documentation of such expenses; provided Employee timely submits such expenses, but in no event later than the last day of November of the calendar year following the calendar year in which the expenses are incurred. In the event Employee is not the prevailing party in any such contest, Employee must pay back any reimbursements made by the Company under this Section within thirty (30) days of final disposition of the contest.
(c)At-Will Employment. This Agreement does not modify or alter, in any way, the at-will nature of Employee’s employment with the Company, meaning that either Employee or the Company can terminate the employment relationship at any time, for any reason or for no reason, with or without Cause.
(d)Parachute Payments.
(i)Notwithstanding any other provisions of this Agreement, in the event that any payment or benefit by the Company or otherwise to or for Employee’s benefit, whether paid or payable or distributed or distributable pursuant to the terms of this Agreement or otherwise (all such payments and benefits, including the Severance Award, being hereinafter referred to as the “Total Payments”), would be subject (in whole or in part) to the excise tax imposed by Section 4999 (the “Excise Tax”) of the Internal Revenue Code of 1986, as amended (the “Code”), then the Total Payments shall be reduced (in the order provided in Section 6(d)(ii) below) to the minimum extent necessary to avoid the imposition of the Excise Tax on the Total Payments, but only if (x) the net amount of such Total Payments, as so reduced (and after subtracting the net amount of federal, state and local income and employment taxes on such reduced Total Payments and after taking into account the phase out of itemized deductions and personal exemptions attributable to such reduced Total Payments), is greater than or equal to (y) the net amount of such Total Payments without such reduction (but after subtracting the net amount of federal, state and local income and employment taxes on such Total Payments and the amount of the Excise Tax to which Employee would be subject in respect of such unreduced Total Payments and after taking into account the phase out of itemized deductions and personal exemptions attributable to such unreduced Total Payments).
(ii)The Total Payments shall be reduced in the following order: (A) reduction on a pro-rata basis of any cash severance payments that are exempt from Section 409A; (B) reduction on a pro-rata basis of any non-cash severance payments or benefits that are exempt from Section 409A; (C) reduction on a pro-rata basis of any other payments or benefits that are exempt from Section 409A; and (D) reduction of any payments or benefits otherwise payable to Employee on a pro-rata basis or such other manner that complies with Section 409A; provided, in the case of clauses (B), (C) and (D), that reduction of any payments attributable to the acceleration of vesting of Company equity awards shall be first applied to Company equity awards that would otherwise vest last in time.
(iii)All determinations regarding the application of this Section shall be made by an accounting firm or consulting group with experience in performing calculations regarding the applicability of Section 280G of the Code and the Excise Tax selected by the Company (the “Independent Advisors”). For purposes of determinations, no portion of the Total Payments shall be taken into account which, in the opinion of the Independent Advisors, (x) does not constitute a “parachute payment” within the meaning of Section 280G(b)(2) of the Code (including by reason of Section 280G(b)(4)(A) of the Code) or (y) constitutes reasonable compensation for services actually rendered, within the meaning of Section 280G(b)(4)(B) of the Code, in excess of the “base amount” (as defined in Section 280G(b)(3) of the Code) allocable to such reasonable compensation. The costs of obtaining such determination and all related fees and expenses (including related fees and expenses incurred in any later audit) shall be borne by the Company.
(iv)In the event it is later determined that a greater reduction in the Total Payments should have been made to implement the objective and intent of this Section, Employee shall immediately return the excess amount to the Company.
(e)Section 409A. The parties hereto acknowledge and agree that this Agreement and the payments and benefits herein, are intended to comply with, or be exempt from, Section 409A of the Code and the regulations and guidance promulgated thereunder (collectively, “Section 409A”) and shall be interpreted accordingly. In no event whatsoever shall the Company or any of its affiliates be liable for any additional tax, interest or penalties that may be imposed on Employee as a result of Section 409A. Notwithstanding anything in this Agreement to the contrary, any compensation or benefit payable under this Agreement that is designated as payable upon Employee’s termination of employment shall be payable only upon Employee’s “separation from service” with the Company (a “Separation from Service”) within the meaning of Section 409A, and except as provided below, any such compensation or benefits shall not be paid until the 60th day following Employee’s Separation from Service. Notwithstanding anything in this Agreement to the contrary, if Employee is deemed by the Company at the time of Employee’s Separation from Service to be a “specified employee” for purposes of Section 409A, to the extent delayed commencement of any portion of the benefits to which Employee is entitled under this Agreement is required in order to avoid a prohibited distribution under Section 409A, such portion of Employee’s benefits shall not be provided to Employee prior to the earlier of (i) the expiration of the six-month period measured from the date of Employee’s Separation from Service with the Company or (ii) the date of Employee’s death. Upon the first business day following the expiration of the applicable Section 409A period, all payments deferred pursuant to the preceding sentence shall be paid in a lump sum to Employee (or Employee’s estate or beneficiaries), and any remaining payments due to Employee under this Agreement shall be paid as otherwise provided herein. Employee’s right to receive any installment payments under this Agreement shall be treated as a right to receive a series of separate payments and, accordingly, each such installment payment shall at all times be considered a separate and distinct payment as permitted under Section 409A. Except as otherwise permitted under Section 409A, no payment hereunder shall be accelerated or deferred unless such acceleration or deferral would not result in additional tax or interest pursuant to Section 409A.
(f)Assumption of Agreement. To the extent this Agreement does not transfer automatically by operation of law, the Company will require any successor (whether direct or indirect, by purchase, merger, consolidation, share exchange or otherwise) to all or substantially all of the business and/or assets of the Company expressly to assume and agree to perform this Agreement in the same manner and to the same extent that the Company would be required to perform it if no such succession had taken place.
(g)Arbitration. Any controversy or claim arising out of or relating to this Agreement, or the breach thereof, shall be settled exclusively by arbitration in accordance with the American Arbitration Association (or such other rules as may be agreed upon by Employee and the Company), and judgment upon the award rendered by the arbitrator(s) may be entered in any court having jurisdiction thereof. Notwithstanding the foregoing, the Company shall not be restricted from seeking equitable relief, including injunctive relief as set forth in Section 5, in the appropriate forum. Any cost of arbitration will be paid by the Company. In the event of a good faith dispute over the existence of Good Reason or Cause, the Company shall continue to pay Employee the Severance Award, subject to the terms of this Agreement, pending the resolution of the dispute.
(h)Entire Agreement. Except with respect to the Restrictive Covenants or as provided in Section 6(i) below, Employee and the Company understand that this Agreement constitutes the entire agreement between them regarding the subject matters set forth herein and supersedes any previous oral or written communications, representations, understandings or agreements between them concerning the subject matter hereof, except for any applicable Prior CIC Agreement as set forth in Section 6(i). Each party to this Agreement acknowledges that no representations, inducements, promises, or agreements, oral or otherwise, have been made by any party, or anyone acting on behalf of any party, which are not embodied herein, and that no other agreement, statement, or promise not contained in this Agreement regarding the subject matters set forth herein shall be valid and binding. Notwithstanding the foregoing, Employee and the Company acknowledge and agree that the terms of this Agreement are intended to be in addition to the vesting provisions of any equity or equity-based awards have been and may be granted to Employee under any equity compensation plans of the Company and award agreements related to such plans, and are not intended to diminish any vesting rights contained in such awards.
(i)Prior Change in Control Agreements. Notwithstanding anything in this Agreement to the contrary, this Agreement does not supersede any prior employment, severance or change in control letter or agreement between Employee and the Company or any of its affiliates (including Arch Resources, Inc.) (a “Prior CIC Agreement”) with respect to Employee’s termination of employment that occurs on or within two (2) years following the transaction whereby the Company acquired Arch Resources, Inc. (the “Prior CIC Protection Period”). If Employee is a party to a Prior CIC Agreement, this Agreement shall only become effective upon, and Employee shall not be entitled to any Severance Award under this Agreement until, the expiration of the Prior CIC Protection Period. Employee acknowledges and agrees that any Prior CIC Agreement shall terminate and have no further force or effect upon the expiration of the Prior CIC Protection Period and Employee will no longer be entitled to any payments or benefits under such Prior CIC Agreement upon expiration of the Prior CIC Protection Period, except with respect to those payments or benefits to which Employee is entitled under such Prior CIC Agreement due to a qualifying termination that occurred during the Prior CIC Protection Period.
(j)Miscellaneous. This Agreement may not be changed, modified, released, discharged, abandoned or otherwise amended, in whole or in part, except by an instrument in writing, signed by Employee and an authorized officer of the Company. This Agreement shall be construed in accordance with and governed by the laws of the Commonwealth of Pennsylvania. This Agreement may be executed in two or more counterparts, each of which shall be an original and all of which together shall constitute one and the same instrument. If any article, section, subsection, or provision of this Agreement is adjudged by any court of law to be void or unenforceable, in whole or in part, such adjudication shall not be deemed to affect the validity of the remainder of the Agreement or the reminder of the article, section, subsection, or provision. Each article, section, subsection, and provision of this Agreement is declared to be separable from every other article, section, subsection, and provision and constitutes a separate and distinct covenant. Any notice, request, claim, demand, document or other communication hereunder to any party shall be effective upon receipt (or refusal of receipt) and shall be in writing and delivered personally or sent by certified mail (return receipt requested, postage prepaid) or email (i) if the Company, then to the attention of the Chief Legal Officer (“CLO”) of the Company (or the Company’s Chief Administrative Officer, in the event Employee is the CLO) at the Company’s principal executive offices, (ii) if to Employee, then to the most recent permanent address or email address for Employee in the Company’s personnel files or (iii) to such other address or email address as one party shall designate to the other in accordance with the provisions of this Section.
(k)Successors and Assigns. This Agreement shall be binding upon, and inure to the benefit of, the Company, its affiliates and their respective transferees, successors, or assigns. This Agreement, being personal in nature, cannot be assigned by Employee. This Agreement may be assigned by the Company.
[Signature Page Follows]
IN WITNESS WHEREOF, intending to be legally bound, Employee and the Company have executed this Agreement effective as of the day and year first written above.
CORE NATURAL RESOURCES, INC.
By:
Name:
Title:
EMPLOYEE
[ ò ]
EX-21
3
cnr12312025-exhibit21.htm
EX-21
Document
Exhibit 21
Core Natural Resources, Inc.
SUBSIDIARIES
As of February 17, 2026
(In alphabetical order)
|
|
|
| ACI Terminal, LLC (a Delaware limited liability company) |
| Allegheny Land LLC (a Delaware limited liability company) |
| AMVEST Gas Resources, LLC (a Virginia limited liability company) |
| AMVEST LLC (a Virginia limited liability company) |
| AMVEST West Virginia Coal, L.L.C. (a West Virginia limited liability company) |
| Arch Coal Australia Holdings PTY LTD (an Australian proprietary limited company) |
| Arch Coal Australia PTY LTD (an Australia proprietary limited company) |
| Arch Coal Group, LLC (a Delaware limited liability company) |
| Arch Coal Operations LLC (a Delaware limited liability company) |
| Arch Coal West, LLC (a Delaware limited liability company) |
| Arch of Australia PTY LTD (an Australian proprietary limited company) |
| Arch of Wyoming, LLC (a Delaware limited liability company) |
| Arch Reclamation Services LLC (a Delaware limited liability company) |
| Arch Resources, Inc. (a Delaware corporation) |
| Arch Western Acquisition Corporation (a Delaware corporation) |
| Arch Western Acquisition, LLC (a Delaware limited liability company) |
| Arch Western Bituminous Group, LLC (a Delaware limited liability company) |
| Arch Western Resources, LLC (a Delaware limited liability company) |
| Ark Land KH LLC (a Delaware limited liability company) |
| Ark Land LLC (a Delaware limited liability company) |
| Ark Land LT LLC (a Delaware limited liability company) |
| Ark Land WR LLC (Delaware limited liability company) |
| Ashland Terminal, Inc. (a Delaware corporation) |
| Atlantic Holdings JV LLC (a Delaware limited liability company) |
| Braxton-Clay Land & Mineral, LLC (a West Virginia limited liability company) |
| Bronco Mining Company LLC (a West Virginia limited liability company) |
| Catenary Coal Holdings LLC (a Delaware limited liability company) |
| CFOAM LLC (a Delaware limited liability company) |
| CoalQuest Development LLC (a Delaware limited liability company) |
| Conrhein Coal Company (a Pennsylvania general partnership) |
| CONSOL Amonate Facility LLC (a Delaware limited liability company) |
| CONSOL Amonate Mining Company LLC (a Delaware limited liability company) |
| CONSOL Coal Finance Corp. (a Delaware corporation) |
| CONSOL Energy Canada Ltd. (a Canadian corporation) |
| CONSOL Energy Sales Company LLC (formerly CONSOL Sales Company) (a Delaware limited liability company) |
| CONSOL Funding LLC (a Delaware limited liability company) |
| CONSOL Innovations LLC (a Delaware limited liability company) |
| CONSOL Met Coal Holding Company LLC (a Delaware limited liability company) |
| CONSOL Mining Company LLC (a Delaware limited liability company) |
| CONSOL Mining Holding Company LLC (a Delaware limited company) |
| CONSOL of Canada LLC (a Delaware limited liability company) |
| CONSOL of Kentucky LLC (a Delaware limited liability company) |
| CONSOL Operating LLC (a Delaware limited liability company) |
| Consol Pennsylvania Coal Company LLC (formerly Consol Pennsylvania Coal Company) (a Delaware limited liability company) |
| CONSOL Pennsylvania Mine Holding LLC (a Delaware limited liability company) |
|
|
|
| CONSOL RCPC LLC (a Delaware limited liability company) |
| CONSOL Thermal Holdings LLC (a Delaware limited liability company) |
| Core Global LLC (a Delaware limited liability company) |
| Core Land LLC (a Delaware limited liability company) |
| Core Marine Terminals LLC (a Delaware limited liability company) |
| Core Natural Resources Asia-Pacific PTE. LTD. (a Singapore private limited company) |
| Core Natural Resources Europe Limited (an England and Wales private limited company) |
| Core Purchasing LLC (a Delaware limited liability company) |
| Core Receivable Company, LLC (Delaware limited liability company) |
| Core Sales, LLC (a Delaware limited liability company) |
| Energy Development LLC (an Iowa limited liability company) |
| Fola Coal Company, L.L.C. d/b/a Powellton Coal Company (a West Virginia limited liability company) |
| Hawthorne Coal Company LLC (a West Virginia limited liability company) |
| Helvetia Coal Company LLC (a Pennsylvania limited liability company) |
| Hunter Ridge Coal LLC (a Delaware limited liability company) |
| Hunter Ridge Holdings, Inc. (a Delaware corporation) |
| Hunter Ridge LLC (a Delaware limited liability company) |
| ICG Beckley, LLC (a Delaware limited liability company) |
| ICG East Kentucky, LLC (a Delaware limited liability company) |
| ICG Eastern Land, LLC (a Delaware limited liability company) |
| ICG Eastern, LLC (a Delaware limited liability company) |
| ICG Natural Resources, LLC (a Delaware limited liability company) |
| ICG Tygart Valley, LLC (a Delaware limited liability company) |
| ICG, LLC (a Delaware limited liability company) |
| International Energy Group, LLC (a Delaware limited liability company) |
| Island Creek Coal Company LLC (a Delaware limited liability company) |
| Itmann Mining Company GP LLC (a Delaware limited liability company) |
| Itmann Mining Company LP (a Delaware limited partnership) |
| Juliana Mining Company LLC (a West Virginia limited liability company) |
| King Knob Coal Co. LLC (a West Virginia limited liability company) |
| Laurel Run Mining Company LLC (a Virginia limited liability company) |
| Leatherwood, LLC (a Pennsylvania limited liability company) |
| Little Eagle Coal Company, L.L.C. (a West Virginia limited liability company) |
| Maidsville Landing Terminal, LLC (a Delaware limited liability company) |
| Marine Coal Sales LLC (a Delaware limited liability company) |
| Meadow Coal Holdings, LLC (a Delaware limited liability company) |
| Melrose Coal Company LLC (a West Virginia limited liability company) |
| Mingo Logan Coal LLC (a Delaware limited liability company) |
| Mountain Coal Company, L.L.C. (a Delaware limited liability company) |
| Mountain Gem Land LLC (a West Virginia limited liability company) |
| Mountain Mining LLC (a Delaware limited liability company) |
| Mountaineer Land LLC (a Delaware limited liability company) |
| MTB LLC (a Delaware limited liability company) |
| Nicholas-Clay Land & Mineral, LLC (a Virginia limited liability company) |
| Otter Creek Coal, LLC (a Delaware limited liability company) |
| PA Mining Complex GP LLC (a Delaware limited liability company) |
| PA Mining Complex LP (a Delaware limited partnership) |
| Patriot Mining Company LLC (a West Virginia limited liability company) |
| Prairie Holdings, Inc. (a Delaware corporation) |
| R&PCC LLC (a Pennsylvania limited liability company) |
| Shelby Run Mining Company, LLC (a Delaware limited liability company) |
|
|
|
| TECPART LLC (a Delaware limited liability company) |
| Terry Eagle Coal Company, L.L.C. (a West Virginia limited liability company) |
| Terry Eagle Limited Partnership (a West Virginia limited partnership) |
| The Sycamore Group, LLC (a West Virginia limited liability company) |
| Thunder Basin Coal Company, L.L.C. (a Delaware limited liability company) |
| Transformer LP Holdings Inc. (a Delaware corporation) |
| Triton Coal Company, LLC (a Delaware limited liability company) |
| Upshur Property LLC (a Delaware limited liability company) |
| Vaughan Railroad Company LLC (a West Virginia limited liability company) |
| Vindex Energy LLC (a West Virginia limited liability company) |
| Western Energy Resources LLC (a Delaware limited liability company) |
| White Wolf Energy LLC (a Virginia limited liability company) |
| Windsor Coal Company LLC (a West Virginia limited liability company) |
| Wolf Run Mining LLC (a West Virginia limited liability company) |
| Wolfpen Knob Development Company LLC (a Virginia limited liability company) |
EX-23.1
4
cnr12312025-exhibit231.htm
EX-23.1
Document
Exhibit 23.1
Consent of Independent Registered Public Accounting Firm
We consent to the incorporation by reference in the following Registration Statements:
|
|
|
|
|
|
|
|
|
|
• |
Registration Statement (Form S-8 No. 333-221727) pertaining to the CONSOL Energy Inc. 2020 Amended and Restated Omnibus Performance Incentive Plan, |
|
• |
Registration Statement (Form S-8 No. 333-251852) pertaining to the CONSOL Energy Inc. 2020 Amended and Restated Omnibus Performance Incentive Plan, and |
|
• |
Registration Statement (Form S-8 No. 333-238173) pertaining to the CONSOL Energy Inc. 2020 Amended and Restated Omnibus Performance Incentive Plan; |
of our reports dated February 17, 2026, with respect to the consolidated financial statements of Core Natural Resources, Inc. and the effectiveness of internal control over financial reporting of Core Natural Resources, Inc. included in this Annual Report (Form 10-K) of Core Natural Resources, Inc. for the year ended December 31, 2025.
/s/ Ernst & Young LLP
Pittsburgh, Pennsylvania
February 17, 2026
EX-23.2
5
cnr12312025-exhibit232.htm
EX-23.2
Document
Exhibit 23.2
CONSENT OF THIRD-PARTY QUALIFIED PERSON
February 16, 2026
Via Email: MichaelBohan@coreresources.com
Executive Towers West I
1431 Opus Place, Suite 210
Downers Grove, Illinois 60515
USA
Mr. Mike Bohan
Core Natural Resources, Inc.
275 Technology Drive
Canonsburg, Pennsylvania 15317
Reference: Consent of Independent Experts
Dear Mr. Bohan:
With respect to the SEC filings by Core Natural Resources, Inc. (the "Company"), including but not limited to its Annual Report on Form 10-K for the year ended December 31, 2025, Weir International, Inc., as independent mining engineers and geologists, hereby consents to the use of information contained in the Technical Report Summaries for each of the Black Thunder and Leer Complex, dated February 16, 2026. We also consent to the reference to Weir International, Inc. in those filings and any amendments thereto.
We further wish to advise that Weir International, Inc. was not employed on a contingent basis and that at the time of preparation of our report, as well as at present, neither Weir International, Inc. nor any of its employees had, or now has, a substantial interest in Core Natural Resources, Inc. or any of its affiliates or subsidiaries.
Respectfully submitted,
Weir International, Inc.
/s/ Fran X. Taglia
Fran X. Taglia
President
EX-23.3
6
cnr12312025-exhibit233.htm
EX-23.3
Document
Exhibit 23.3
CONSENT OF THIRD-PARTY QUALIFIED PERSON
John T. Boyd Company
4000 Town Center Boulevard, Suite 300
Canonsburg, PA 15317
The John T. Boyd Company (“BOYD”) in connection with the filing of the Core Natural Resources, Inc. (formerly known as CONSOL Energy Inc.) Annual Report on Form 10-K (the “Form 10-K”), consent to:
|
|
|
|
|
|
|
|
|
| |
● |
the filing and use of the technical report summary titled “Technical Report Summary, Coal Resources and Coal Reserves, Pennsylvania Mining Complex, Pennsylvania and West Virginia” (the “Technical Report”), with an effective date of December 31, 2024, as an exhibit to and referenced in the Form 10-K; |
|
|
|
|
|
|
|
|
|
| |
● |
the use of and references to our name, including our status as an expert or “qualified person” (as defined in Subpart 1300 of Regulation S-K promulgated by the Securities and Exchange Commission), in connection with the Form 10-K and the Technical Report; and |
|
|
|
|
|
|
|
|
|
| |
● |
the information derived, summarized, quoted or referenced from the Technical Report, or portions thereof, that was prepared by BOYD, that BOYD supervised the preparation of and/or that was reviewed and approved by BOYD, that is included or incorporated by reference in the Form 10-K. |
BOYD is responsible for authoring, and this consent pertains to, the Technical Report. BOYD certifies that it has read the Form 10-K and that it fairly and accurately represents the information in the sections of the Technical Reports for which BOYD is responsible.
BOYD also consents to the incorporation by reference in Core Natural Resources, Inc.’s registration statements on Form S-8 (Nos. 333-221727, 333-238173 and 333-251852) of the above items as included in the Form 10-K.
The John T. Boyd Company
/s/ Ronald L. Lewis
Managing Director and COO
February 16, 2026
EX-24.1
7
cnr12312025-exhibit241.htm
EX-24.1
Document
Exhibit 24.1
Power of Attorney
KNOW ALL PERSONS BY THESE PRESENTS: That each of the undersigned directors and/or officers of Core Natural Resources, Inc., a Delaware corporation (“Core”), hereby constitutes and appoints James A. Brock, Mitesh B. Thakkar and Rosemary L. Klein, and each of them, his or her true and lawful attorneys-in-fact and agents, with full power to act without the other, to sign Core’s Annual Report on Form 10-K for the year ended December 31, 2025, to be filed with the Securities and Exchange Commission under the provisions of the Securities Exchange Act of 1934, as amended; to file such report and the exhibits thereto and any and all other documents in connection therewith, including without limitation, amendments thereto, with the Securities and Exchange Commission; and to do and perform any and all other acts and things requisite and necessary to be done in connection with the foregoing as fully as he or she might or could do in person, hereby ratifying and confirming all that said attorneys-in-fact and agents, or any of them, may lawfully do or cause to be done by virtue hereof.
DATED: February 4, 2026
/s/ James A. Brock
___________________________________
James A. Brock
/s/ Holly Keller Koeppel
___________________________________
Holly Keller Koeppel
/s/ Patrick A. Kriegshauser
__________________________________
Patrick A. Kriegshauser
/s/ Richard A. Navarre
___________________________________
Richard A. Navarre
/s/ Valli Perera
___________________________________
Valli Perera
/s/ Joseph P. Platt
___________________________________
Joseph P. Platt
EX-31.1
8
cnr12312025-exhibit311.htm
EX-31.1
Document
Exhibit 31.1
CERTIFICATIONS
I, James A. Brock, certify that:
1.I have reviewed this annual report on Form 10-K of Core Natural Resources, Inc.;
2.Based on my knowledge, this report does not contain any untrue statement of a material fact or omit to state a material fact necessary to make the statements made, in light of the circumstances under which such statements were made, not misleading with respect to the period covered by this report;
3.Based on my knowledge, the financial statements, and other financial information included in this report, fairly present in all material respects the financial condition, results of operations and cash flows of the registrant as of, and for, the periods presented in this report;
4.The registrant's other certifying officer(s) and I are responsible for establishing and maintaining disclosure controls and procedures (as defined in Exchange Act Rules 13a-15(e) and 15d-15(e)) and internal control over financial reporting (as defined in Exchange Act Rules 13a-15(f) and 15d-15(f)) for the registrant and have:
(a)Designed such disclosure controls and procedures, or caused such disclosure controls and procedures to be designed under our supervision, to ensure that material information relating to the registrant, including its consolidated subsidiaries, is made known to us by others within those entities, particularly during the period in which this report is being prepared;
(b)Designed such internal control over financial reporting, or caused such internal control over financial reporting to be designed under our supervision, to provide reasonable assurance regarding the reliability of financial reporting and the preparation of financial statements for external purposes in accordance with generally accepted accounting principles;
(c)Evaluated the effectiveness of the registrant's disclosure controls and procedures and presented in this report our conclusions about the effectiveness of the disclosure controls and procedures, as of the end of the period covered by this report based on such evaluation; and
(d)Disclosed in this report any change in the registrant's internal control over financial reporting that occurred during the registrant's most recent fiscal quarter (the registrant's fourth fiscal quarter in the case of an annual report) that has materially affected, or is reasonably likely to materially affect, the registrant's internal control over financial reporting; and
5.The registrant's other certifying officer(s) and I have disclosed, based on our most recent evaluation of internal control over financial reporting, to the registrant's auditors and the audit committee of the registrant's board of directors (or persons performing the equivalent functions):
(a)All significant deficiencies and material weaknesses in the design or operation of internal control over financial reporting which are reasonably likely to adversely affect the registrant's ability to record, process, summarize and report financial information; and
(b)Any fraud, whether or not material, that involves management or other employees who have a significant role in the registrant's internal control over financial reporting.
|
|
|
|
|
|
|
|
|
| Date: |
February 17, 2026 |
|
|
|
|
| /s/ James A. Brock |
|
| James A. Brock |
|
| Chair and Chief Executive Officer |
|
| (Principal Executive Officer) |
|
EX-31.2
9
cnr12312025-exhibit312.htm
EX-31.2
Document
Exhibit 31.2
CERTIFICATIONS
I, Miteshkumar B. Thakkar, certify that:
1.I have reviewed this annual report on Form 10-K of Core Natural Resources, Inc.;
2.Based on my knowledge, this report does not contain any untrue statement of a material fact or omit to state a material fact necessary to make the statements made, in light of the circumstances under which such statements were made, not misleading with respect to the period covered by this report;
3.Based on my knowledge, the financial statements, and other financial information included in this report, fairly present in all material respects the financial condition, results of operations and cash flows of the registrant as of, and for, the periods presented in this report;
4.The registrant's other certifying officer(s) and I are responsible for establishing and maintaining disclosure controls and procedures (as defined in Exchange Act Rules 13a-15(e) and 15d-15(e)) and internal control over financial reporting (as defined in Exchange Act Rules 13a-15(f) and 15d-15(f)) for the registrant and have:
(a)Designed such disclosure controls and procedures, or caused such disclosure controls and procedures to be designed under our supervision, to ensure that material information relating to the registrant, including its consolidated subsidiaries, is made known to us by others within those entities, particularly during the period in which this report is being prepared;
(b)Designed such internal control over financial reporting, or caused such internal control over financial reporting to be designed under our supervision, to provide reasonable assurance regarding the reliability of financial reporting and the preparation of financial statements for external purposes in accordance with generally accepted accounting principles;
(c)Evaluated the effectiveness of the registrant's disclosure controls and procedures and presented in this report our conclusions about the effectiveness of the disclosure controls and procedures, as of the end of the period covered by this report based on such evaluation; and
(d)Disclosed in this report any change in the registrant's internal control over financial reporting that occurred during the registrant's most recent fiscal quarter (the registrant's fourth fiscal quarter in the case of an annual report) that has materially affected, or is reasonably likely to materially affect, the registrant's internal control over financial reporting; and
5.The registrant's other certifying officer(s) and I have disclosed, based on our most recent evaluation of internal control over financial reporting, to the registrant's auditors and the audit committee of the registrant's board of directors (or persons performing the equivalent functions):
(a)All significant deficiencies and material weaknesses in the design or operation of internal control over financial reporting which are reasonably likely to adversely affect the registrant's ability to record, process, summarize and report financial information; and
(b)Any fraud, whether or not material, that involves management or other employees who have a significant role in the registrant's internal control over financial reporting.
|
|
|
|
|
|
|
|
|
| Date: |
February 17, 2026 |
|
|
|
|
| /s/ Miteshkumar B. Thakkar |
|
| Miteshkumar B. Thakkar |
|
| President and Chief Financial Officer |
|
| (Principal Financial Officer) |
|
EX-32.1
10
cnr12312025-exhibit321.htm
EX-32.1
Document
Exhibit 32.1
CERTIFICATION
Pursuant to Section 906 of the Sarbanes-Oxley Act of 2002,
18 U.S.C. Section 1350
I, James A. Brock, Chief Executive Officer (principal executive officer) of Core Natural Resources, Inc. (the “Registrant”), certify that to my knowledge, based upon a review of the Annual Report on Form 10-K for the year ended December 31, 2025, of the Registrant (the “Report”):
(1)The Report fully complies with the requirements of Section 13(a) or 15(d) of the Securities Exchange Act of 1934, as amended; and
(2)The information contained in the Report fairly presents, in all material respects, the financial condition and results of operations of the Registrant.
|
|
|
|
|
|
|
|
|
| Date: |
February 17, 2026 |
|
|
|
|
| /s/ James A. Brock |
|
| James A. Brock |
|
| Chair and Chief Executive Officer |
|
| (Principal Executive Officer) |
|
EX-32.2
11
cnr12312025-exhibit322.htm
EX-32.2
Document
Exhibit 32.2
CERTIFICATION
Pursuant to Section 906 of the Sarbanes-Oxley Act of 2002,
18 U.S.C. Section 1350
I, Miteshkumar B. Thakkar, Chief Financial Officer (principal financial officer) of Core Natural Resources, Inc. (the “Registrant”), certify that to my knowledge, based upon a review of the Annual Report on Form 10-K for the year ended December 31, 2025, of the Registrant (the “Report”):
(1)The Report fully complies with the requirements of Section 13(a) or 15(d) of the Securities Exchange Act of 1934, as amended; and
(2)The information contained in the Report fairly presents, in all material respects, the financial condition and results of operations of the Registrant.
|
|
|
|
|
|
|
|
|
| Date: |
February 17, 2026 |
|
|
|
|
| /s/ Miteshkumar B. Thakkar |
|
| Miteshkumar B. Thakkar |
|
| President and Chief Financial Officer |
|
| (Principal Financial Officer) |
|
EX-95
12
cnr12312025-exhibit95.htm
EX-95
Document
Exhibit 95
Mine Safety and Health Administration Safety Data
We believe that Core Natural Resources, Inc. (the Company) is one of the safest mining companies in the world. The Company has in place health and safety programs that include extensive employee training, accident prevention, workplace inspection, emergency response, accident investigation, regulatory compliance and program auditing. The objectives of our health and safety programs are to eliminate workplace incidents, comply with all mining-related regulations and provide support for both regulators and the industry to improve mine safety.
The operation of our mines is subject to regulation by the federal Mine Safety and Health Administration (MSHA) under the Federal Mine Safety and Health Act of 1977 (Mine Act). MSHA inspects our mines on a regular basis and issues various citations, orders and violations when it believes a violation has occurred under the Mine Act. We present information below regarding certain mining safety and health violations, orders and citations, issued by MSHA and related assessments and legal actions and mine-related fatalities with respect to our coal mining operations. In evaluating this information, consideration should be given to factors such as: (i) the number of violations, orders and citations will vary depending on the size of the coal mine, (ii) the number of violations, orders and citations issued will vary from inspector to inspector and mine to mine, and (iii) violations, orders and citations can be contested and appealed, and in that process, are often reduced in severity and amount, and are sometimes dismissed.
The table below sets forth for the year ended December 31, 2025 for each coal mine of the Company and its subsidiaries, the total number of: (i) violations of mandatory health or safety standards that could significantly and substantially contribute to the cause and effect of a coal or other mine safety or health hazard under section 104 of the Mine Act for which the operator received a citation from MSHA; (ii) orders issued under section 104(b) of the Mine Act; (iii) citations and orders for unwarrantable failure of the mine operator to comply with mandatory health or safety standards under section 104(d) of the Mine Act; (iv) flagrant violations under section 110(b)(2) of the Mine Act; (v) imminent danger orders issued under section 107(a) of the Mine Act; (vi) the total dollar value of proposed assessments from MSHA (regardless of whether the Company has challenged or appealed the assessment); (vii) the total number of mining-related fatalities; (viii) notices from MSHA of a pattern of violations of mandatory health or safety standards that are of such nature as could have significantly and substantially contributed to the cause and effect of coal or other mine health or safety hazards under section 104(e) of the Mine Act; (ix) notices from MSHA regarding the potential to have a pattern of violations as referenced in (viii) above; and (x) pending legal actions before the Federal Mine Safety and Health Review Commission (as of December 31, 2025) involving such coal or other mine, as well as the aggregate number of legal actions instituted and the aggregate number of legal actions resolved during the reporting period.
|
|
|
|
|
|
|
|
|
|
|
|
|
|
|
|
|
|
|
|
|
|
|
|
|
|
|
|
|
|
|
|
|
|
|
|
|
|
|
|
|
|
|
|
|
|
|
|
|
|
|
|
|
|
|
|
|
|
|
|
|
|
|
|
|
|
|
|
|
|
|
|
|
|
|
|
|
|
|
|
|
| Mine or Operating Name/MSHA Identification Number |
|
Section 104 S&S Citations |
|
Section 104(b) Orders |
|
Section 104(d) Citations and Orders |
|
Section 110(b)(2) Violations |
|
Section 107(a) Orders |
|
Total Dollar Value of MSHA Assessments Proposed (In Dollars) |
|
Total Number of Mining-Related Fatalities |
|
Received Notice of Pattern of Violations Under Section 104(e) |
|
Received Notice of Potential to have Pattern Under Section 104(e) |
|
Legal Actions Pending as of Last Day of Period (1) |
|
Legal Actions Initiated During Period |
|
Legal Actions Resolved During Period |
| Bailey Mine |
|
3607230 |
|
42 |
|
— |
|
— |
|
— |
|
— |
|
218,061 |
|
— |
|
No |
|
No |
|
5 |
|
8 |
|
7 |
| Beckley Pocahontas Mine |
|
4605252 |
|
36 |
|
— |
|
— |
|
— |
|
— |
|
232,374 |
|
— |
|
No |
|
No |
|
1 |
|
10 |
|
12 |
| Beckley Pocahontas Prep Plant |
|
4609216 |
|
2 |
|
— |
|
— |
|
— |
|
— |
|
1,833 |
|
— |
|
No |
|
No |
|
— |
|
1 |
|
1 |
| Black Thunder Mine |
|
4800977 |
|
13 |
|
— |
|
— |
|
— |
|
— |
|
48,929 |
|
— |
|
No |
|
No |
|
1 |
|
1 |
|
— |
| Cardinal Preparation Plant |
|
4609046 |
|
1 |
|
— |
|
— |
|
— |
|
— |
|
5,016 |
|
— |
|
No |
|
No |
|
— |
|
2 |
|
2 |
| Coal Creek Mine |
|
4801215 |
|
— |
|
— |
|
— |
|
— |
|
— |
|
8,551 |
|
— |
|
No |
|
No |
|
— |
|
— |
|
— |
| Eccles Refuse Area |
|
4609023 |
|
— |
|
— |
|
— |
|
— |
|
— |
|
— |
|
— |
|
No |
|
No |
|
— |
|
— |
|
— |
| Enlow Fork Mine |
|
3607416 |
|
11 |
|
— |
|
— |
|
— |
|
— |
|
71,191 |
|
— |
|
No |
|
No |
|
4 |
|
4 |
|
5 |
| Harvey Mine |
|
3610045 |
|
9 |
|
— |
|
— |
|
— |
|
— |
|
39,277 |
|
— |
|
No |
|
No |
|
3 |
|
3 |
|
2 |
| Itmann No 5 Mine |
|
4609569 |
|
65 |
|
1 |
|
2 |
|
— |
|
— |
|
200,706 |
|
— |
|
No |
|
No |
|
6 |
|
12 |
|
11 |
| Itmann No 5 Prep Plant |
|
4609598 |
|
2 |
|
— |
|
— |
|
— |
|
— |
|
1,071 |
|
— |
|
No |
|
No |
|
— |
|
1 |
|
1 |
| Leer Mine |
|
4609192 |
|
38 |
|
— |
|
— |
|
— |
|
— |
|
283,554 |
|
— |
|
No |
|
No |
|
4 |
|
7 |
|
3 |
| Leer Prep Plant |
|
4609191 |
|
2 |
|
— |
|
— |
|
— |
|
— |
|
1,170 |
|
— |
|
No |
|
No |
|
— |
|
— |
|
— |
| Leer South Mine |
|
4604168 |
|
23 |
|
— |
|
— |
|
— |
|
— |
|
157,029 |
|
— |
|
No |
|
No |
|
4 |
|
5 |
|
1 |
| Leer South Preparation Plant |
|
4608777 |
|
1 |
|
— |
|
— |
|
— |
|
— |
|
906 |
|
— |
|
No |
|
No |
|
— |
|
— |
|
— |
| Meigs #31 Mine |
|
3301172 |
|
1 |
|
— |
|
— |
|
— |
|
— |
|
1,034 |
|
— |
|
No |
|
No |
|
— |
|
— |
|
— |
| Mountaineer II Mine |
|
4609029 |
|
60 |
|
1 |
|
— |
|
— |
|
— |
|
731,051 |
|
— |
|
No |
|
No |
|
3 |
|
7 |
|
7 |
| Robena Preparation Plant |
|
3604175 |
|
— |
|
— |
|
— |
|
— |
|
— |
|
— |
|
— |
|
No |
|
No |
|
— |
|
— |
|
— |
| Upshur Complex |
|
4605823 |
|
— |
|
— |
|
— |
|
— |
|
— |
|
— |
|
— |
|
No |
|
No |
|
— |
|
— |
|
— |
| West Elk Mine |
|
0503672 |
|
18 |
|
— |
|
3 |
|
— |
|
— |
|
322,281 |
|
— |
|
No |
|
No |
|
6 |
|
8 |
|
2 |
| |
|
|
|
324 |
|
2 |
|
5 |
|
— |
|
— |
|
2,324,034 |
|
— |
|
|
|
|
|
37 |
|
69 |
|
54 |
(1) See table below for additional details regarding Legal Actions Pending as of December 31, 2025. With respect to Contests of Proposed Penalties, we have included the number of dockets (as opposed to citations) when counting the number of Legal Actions Pending as of December 31, 2025.
|
|
|
|
|
|
|
|
|
|
|
|
|
|
|
|
|
|
|
|
|
|
|
|
|
|
|
|
|
|
|
|
|
|
|
|
|
|
|
|
|
|
|
|
|
|
|
|
|
|
|
Mine or Operating Name/
MSHA Identification Number |
|
Contests of Citations, Orders
(as of 12.31.2025) |
|
Contests of Proposed Penalties
(as of 12.31.2025)
(b) |
|
Complaints for Compensation
(as of 12.31.2025) |
|
Complaints of Discharge, Discrimination or Interference
(as of 12.31.2025) |
|
Applications for Temporary Relief
(as of 12.31.2025) |
|
Appeals of Judges' Decisions or Orders
(as of 12.31.2025) |
|
(a) |
|
Dockets |
|
Citations |
|
(c) |
|
(d) |
|
(e) |
|
(f) |
| Bailey Mine |
|
3607230 |
|
— |
|
5 |
|
17 |
|
— |
|
— |
|
— |
|
1 |
| Beckley Pocahontas Mine |
|
4605252 |
|
— |
|
1 |
|
16 |
|
— |
|
— |
|
— |
|
— |
| Beckley Pocahontas Prep Plant |
|
4609216 |
|
— |
|
— |
|
— |
|
— |
|
— |
|
— |
|
— |
| Black Thunder Mine |
|
4800977 |
|
— |
|
1 |
|
3 |
|
— |
|
— |
|
— |
|
— |
| Cardinal Preparation Plant |
|
4609046 |
|
— |
|
— |
|
— |
|
— |
|
— |
|
— |
|
— |
| Coal Creek Mine |
|
4801215 |
|
— |
|
— |
|
— |
|
— |
|
— |
|
— |
|
— |
| Eccles Refuse Area |
|
4609023 |
|
— |
|
— |
|
— |
|
— |
|
— |
|
— |
|
— |
| Enlow Fork Mine |
|
3607416 |
|
— |
|
4 |
|
5 |
|
— |
|
— |
|
— |
|
1 |
| Harvey Mine |
|
3610045 |
|
— |
|
3 |
|
6 |
|
— |
|
— |
|
— |
|
— |
| Itmann No 5 Mine |
|
4609569 |
|
— |
|
6 |
|
86 |
|
— |
|
— |
|
— |
|
— |
| Itmann No 5 Prep Plant |
|
4609598 |
|
— |
|
— |
|
— |
|
— |
|
— |
|
— |
|
— |
| Leer Mine |
|
4609192 |
|
— |
|
4 |
|
18 |
|
— |
|
— |
|
— |
|
— |
| Leer Prep Plant |
|
4609191 |
|
— |
|
— |
|
— |
|
— |
|
— |
|
— |
|
— |
| Leer South Mine |
|
4604168 |
|
— |
|
4 |
|
38 |
|
— |
|
— |
|
— |
|
— |
| Leer South Preparation Plant |
|
4608777 |
|
— |
|
— |
|
— |
|
— |
|
— |
|
— |
|
— |
| Meigs #31 Mine |
|
3301172 |
|
— |
|
— |
|
— |
|
— |
|
— |
|
— |
|
— |
| Mountaineer II Mine |
|
4609029 |
|
— |
|
3 |
|
29 |
|
— |
|
— |
|
— |
|
— |
| Robena Preparation Plant |
|
3604175 |
|
— |
|
— |
|
— |
|
— |
|
— |
|
— |
|
— |
| Upshur Complex |
|
4605823 |
|
— |
|
— |
|
— |
|
— |
|
— |
|
— |
|
— |
| West Elk Mine |
|
0503672 |
|
— |
|
6 |
|
15 |
|
— |
|
— |
|
— |
|
— |
| |
|
|
|
— |
|
37 |
|
233 |
|
— |
|
— |
|
— |
|
2 |
(a) Represents (if any) contests of citations and orders, which typically are filed prior to an operator's receipt of a proposed penalty assessment from MSHA or relate to orders for which penalties are not assessed (such as imminent danger orders under Section 107 of the Mine Act). This category includes: (i) contests of citations or orders issued under section 104 of the Mine Act, (ii) contests of imminent danger withdrawal orders under section 107 of the Mine Act, and (iii) Emergency response plan dispute proceedings (as required under the Mine Improvement and New Emergency Response Act of 2006, Pub. L. No. 109-236, 120 Stat. 493).
(b) Represents (if any) contests of proposed penalties, which are administrative proceedings before the Federal Mine Safety and Health Review Commission (“FMSHRC”) challenging a civil penalty that MSHA has proposed for the violation contained in a citation or order.
(c) Represents (if any) complaints for compensation, which are cases under section 111 of the Mine Act that may be filed with the FMSHRC by miners idled by a closure order issued by MSHA who are entitled to compensation.
(d) Represents (if any) complaints of discharge, discrimination or interference under section 105 of the Mine Act, which cover: (i) discrimination proceedings involving a miner's allegation that he or she has suffered adverse employment action because he or she engaged in activity protected under the Mine Act, such as making a safety complaint, and (ii)
temporary reinstatement proceedings involving cases in which a miner has filed a complaint with MSHA stating that he or she has suffered such discrimination and has lost his or her position. Complaints of Discharge, Discrimination, or Interference are also included in Contests of Proposed Penalties, Column B.
(e) Represents (if any) applications for temporary relief, which are applications under section 105(b)(2) of the Mine Act for temporary relief from any modification or termination of any order or from any order issued under section 104 of the Mine Act (other than citations issued under section 104(a) or (f) of the Mine Act).
(f) Represents (if any) appeals of judges' decisions or orders to the FMSHRC, including petitions for discretionary review and review by the FMSHRC on its own motion.
EX-96.1
13
cnr12312025-exhibit961.htm
EX-96.1
Document
Weir Technical Report Summary
Leer Complex
Prepared for Core Natural Resources, Inc.
Exhibit 96.1
Prepared for
Core Natural Resources, Inc.
February 2026
Project No. 6445
Weir Technical Report Summary
Leer Complex
Prepared for Core Natural Resources, Inc.
Notice
Technical Report Summary Leer Complex Weir International, Inc. (WEIR) was retained by Core Natural Resources, Inc. (Core) to prepare this Technical Report Summary (TRS) related to Core’s Leer Complex. This report provides a statement of Core’s coal reserves and resources at its Leer Complex, and has been prepared in accordance with the United States Securities and Exchange Commission (SEC), Regulation S-K 1300 for Mining Property Disclosure (S-K 1300) and 17 Code of Federal Regulations (CFR) § 229.601(b)(96)(iii)(B) reporting requirements. This report was prepared for the sole use of Core and its affiliates and is effective as of December 31, 2025.
This report was prepared by full-time WEIR personnel who meet the SEC’s definition of Qualified Persons (QPs), with sufficient experience in the relevant type of mineralization and deposit under consideration in this report.
In preparing this report, WEIR relied upon data, written reports, and statements provided by Core. WEIR has taken all appropriate steps, in its professional opinion, to ensure information provided by Core is reasonable and reliable for use in this report.
The accuracy of reserve and resource estimates are, in part, a function of the quality and quantity of available data at the time this report was prepared. Estimates presented herein are considered reasonable, however, the estimates should be accepted with the understanding that with additional data and analysis subsequent to the date of this report, the estimates may necessitate revision which may be material. Certain information set forth in this report contains “forward-looking information”, including production, productivity, operating costs, capital costs, sales prices, and other assumptions. These statements are not guarantees of future performance and undue reliance should not be placed on this information. The assumptions used to develop the forward-looking information and the risks that could cause the actual results to differ materially are detailed in the body of this report.
WEIR and its personnel are not affiliates of Core or any other entity with ownership, royalty or other interest in the subject property of this report.
WEIR hereby consents (i) to the use of Core’s Leer Complex coal reserve and resource estimates as of December 31, 2025, (ii) to the use of WEIR’s name, any quotation from or summarization of this TRS in Core’s SEC filings, and (iii) to the filing of this TRS as an exhibit to Core’s SEC filings.
Qualified Person: /s/ Weir International, Inc
Date: February 6, 2026
Address: Weir International, Inc.
1431 Opus Place, Suite 210
Downers Grove, Illinois 60515
Weir Technical Report Summary
Leer Complex
Prepared for Core Natural Resources, Inc.
List of abbreviations
A&O Appalachian and Ohio Railroad
ACPS Analysis of Coal Pillar Stability
AHSM Analysis of Horizontal Stress Effects in Mining
ALPS Analysis of Longwall Pillar Study
AMSS Analysis of Multiple Seam Stability
AOC Approximate Original Contour
ar As received
Arch Arch Resources, Inc. and its subsidiaries
ARMPS Analysis of Retreat Mining Pillar Stability
ARNU Audibert-Arnu Maximum Dilation
ARO Asset Retirement Obligation
ASTM American Society for Testing and Materials
CAPP Central Appalachia Coal Producing Region
CCR Coarse Coal Refuse
CFR Code of Federal Regulations
CMT CONSOL Marine Terminal
CORE Core Natural Resources
CSX CSX Railroad
db Dry Basis
DDPM Dial Divisions Per Minute
DTA Dominion Terminal Associates LLP
EIA US Energy Information Administration
EPA US Environmental Protection Agency
FCR Fine Coal Refuse
FIPS Federal Information Processing Standard
FOB Free on board
G/A Geo/Environmental Associates
GSP Gross Sales Price
High Vol A High Volatile A (greater than 31% volatile matter, Btu/lb greater than 14,000)
High Vol B High Volatile B (greater than 31% volatile matter, Btu/lb between 13,000-14,000)
IRR Internal Rate of Return)
lb Pound
LOM Life of Mine
LV Low volatile
met Metallurgical
MM&A Marshall Miller & Associates, Inc.
MMBtu Million British thermal units
MSHA Mine Safety and Health Administration (US Department of Labor)
MV Mid volatile
NAPP Northern Appalachia Coal Producing Region
NFDL Non Fatal Days Lost
NIOSH National Institute for Occupational Safety and Health
February 6, 2026
Page iii
Weir Technical Report Summary
Leer Complex
Prepared for Core Natural Resources, Inc.
List of abbreviations (continued)
NPDES National Pollutant Discharge Elimination System
NPV Net Present Value
NYSE New York Stock Exchange
OSD Out of Seam Dilution
PCI Pulverized coal injection
PFS Preliminary Feasibility Study
PRB Powder River Basin
QP Qualified Person
ROM Run of Mine
ROI Return on Investment
RQD Rock Quality Designation
S-K 1300 Regulation S-K 1300 for Mining Property Disclosure
SAPP Southern Appalachia Coal Producing Region
SEC US Securities and Exchange Commission
SGS SGS North America, Inc.
SMCRA Surface Mining Control and Reclamation Act
SO2 Sulfur dioxide
Ton Short ton (2,000 lbs)
Tonne Metric ton (2,205 lbs)
tph Tons per hour
TRS Technical Report Summary
WEIR Weir International, Inc.
WVDEP West Virginia Department of Environmental Protection
Weir Technical Report Summary
Leer Complex
Prepared for Core Natural Resources, Inc.
TABLE OF CONTENTS
Page
Weir Technical Report Summary
Leer Complex
Prepared for Core Natural Resources, Inc.
Weir Technical Report Summary
Leer Complex
Prepared for Core Natural Resources, Inc.
February 6, 2026
Page vii
Weir Technical Report Summary
Leer Complex
Prepared for Core Natural Resources, Inc.
FIGURES
Figure 1.1-1 General Location Map 2
Figure 6.3-1 Stratigraphic Column 39
Figure 6.3-2 Lower Kittanning Seam Cross Section SW to NE 40
Figure 7.5-1 Drillhole Collar Locations 46
Figure 11.1-1 Washed Ash at 1.5 S.G., Dry Basis 60
Figure 11.1-2 Washed Sulfur at 1.5 S.G., Dry Basis 61
Figure 11.1-3 Volatile Matter at 1.5 S.G., Dry Basis 62
Figure 11.1-4 Lower Kittanning Seam Thickness 63
Figure 12.4-1 Reserve Classifications 77
Figure 13.5-1 Leer Life of Mine Plan 96
Figure 13.5-2 Leer South Life of Mine Plan 97
Figure 13.5-3 Leer West Mine Life of Mine Plan 98
Figure 15.7-1 Leer Mine Infrastructure 107
Figure 15.7-2 Leer South Mine Infrastructure 108
Figure 15.7-3 Leer West Mine Planned Infrastructure 109
Figure 16.1-1 Metallurgical Coal Sales Prices 111
February 6, 2026
Page viii
Weir Technical Report Summary
Leer Complex
Prepared for Core Natural Resources, Inc.
Figure 16.1-2 Historical and Forecast Coal Sales Price 113
Figure 19.1-1 Coal Sales Price Forecast 128
Figure 19.2-1 Annual Cash Flow Forecast 129
Figure 19.3-1 Net Present Value Sensitivity Analysis 131
TABLES
Table 1.4-1 Leer and Leer South Mines Historical Production 6
Table 1.4-2 Typical Metallurgical Coal Product Specifications 7
Table 1.5-1 In-Place Coal Resource Tonnage and Quality Estimate as of December 31, 2025 9
Table 1.5-2 Recoverable Coal Reserve Tonnage and Quality Estimate as of December 31, 2025 10
Table 1.6-1 Key Operating Statistics 11
Table 1.7-1 Leer Complex Mining and NPDES Permits 12
Table 1.7-2 Leer Complex Permitted Area, Reclamation Liability and Bonds 13
Table 3.3-1 Property Control 22
Table 3.4-1 Lower Kittanning Seam Mineral Control Contracts 23
Table 3.5-1 Permit List 29
Table 5.2-1 Previous Exploration 35
Table 7.4-1 Geotechnical Sample Data 44
Table 7.4-2 Geotechnical Test Results 45
Table 11.1-1 Stratigraphic Model Interpolators 58
Table 11.1-2 Drillhole Statistics 58
Table 11.2-1 In-Place Coal Resource Tonnage and Quality Estimate as of December 31, 2025 65
Table 12.1-3 Recoverable Coal Reserve Tonnage and Quality Estimate as of December 31, 2025 74
Table 12.1-4 Reserve Validation 75
Table 12.5-1 Average Reserve Quality 78
Table 13.2-1 Leer Complex Historical Production Metrics 86
Table 13.2-2 Leer Complex LOM Plans Projected Clean Production 87
Table 13.4-1 Continuous Miner Section Equipment 91
Table 13.4-2 Longwall Mining Equipment 92
Table 13.4-3 Leer Mine Safety Statistics 93
Table 13.4-4 Leer Preparation Plant Safety Statistics 94
Table 13.4-5 Leer South Mine Safety Statistics 95
Table 13.4-6 Leer South Preparation Plant Safety Statistics 95
Table 14.1-1 Preparation Plant Process Size Fractions and Circuits 99
Table 16.1-1 Typical Metallurgical Coal Product Specifications 110
Table 16.2-1 Historical Coal Sales 114
Table 17.3-1 Leer Complex Mining and NPDES Permits 117
Table 17.3-2 Leer Complex Permitted Area, Reclamation Liability and Bonds 118
Table 18.1-1 Leer Complex Historical and Projected LOM Plan Capital Expenditures 121
Table 18.1-2 Leer Complex Historical and Projected LOM Plan Operating Costs 124
Table 19.2-1 After-Tax NPV, IRR Cumulative Cash Flow, and ROI 129
Table 19.2-2 Key Operating Statistics 130
Table 22.2-1 Leer Complex Risk Assessment Summary 136
Table 25.1 Information Relied Upon From Registrant 141
Weir Technical Report Summary
Leer Complex
Prepared for Core Natural Resources, Inc.
1.0 EXECUTIVE SUMMARY
Weir International, Inc. (WEIR) was retained by Core Natural Resources, Inc. (Core) to prepare the Leer Complex Technical Report Summary (TRS). This report has been prepared in accordance with the United States Securities and Exchange Commission (SEC), Regulation S-K 1300 for Mining Property Disclosure (S-K 1300) and 17 Code of Federal Regulations (CFR) § 229.601(b)(96)(iii)(B) reporting requirements.
Core (NYSE: CNR) is a world-class producer of high-quality metallurgical coal and high calorific value thermal coal for the domestic and globally traded markets. Core’s highly skilled workforce operates a best-in-sector portfolio of large-scale, low-cost longwall mines, including the Pennsylvania Mining Complex, Leer, Leer South, and West Elk mines, along with one of the world’s largest and most productive surface mines, Black Thunder. The company plays an essential role in meeting the world’s growing need for steel, infrastructure, and energy, while simultaneously serving the resurgent requirements of the United States power generation fleet. Core has an extensive and strategic logistical network, anchored by ownership positions in two East Coast marine export terminals that provide reliable and efficient access to seaborne markets. The company’s deeply ingrained culture is grounded in safety and compliance, continuous improvement, and financial performance, with an emphasis on stakeholder engagement and shareholder returns. Core was created in January 2025 via the merger of CONSOL Energy Inc. and Arch Resources, Inc. (Arch) and is based in Canonsburg, Pennsylvania.
1.1 PROPERTY DESCRIPTION
The Leer Complex is located in northern West Virginia, in Barbour, Harrison, Preston, and Taylor Counties, approximately 25 miles south of Morgantown, West Virginia, and 12 miles east of Clarksburg, West Virginia. It is developed within the Northern West Virginia coal field of the Northern Appalachia Coal Producing (NAPP) Region of the United States (see Figure 1.1-1).
The Leer Complex boundary comprises approximately 225 square miles (144,700 acres), which are a combination of owned and leased acreage. Approximately 77 percent is owned, 6 percent is leased and 17 percent is uncontrolled. Longwall mining operations of Leer, Leer South, and the future Leer West reserve are contained within the complex.
Weir Technical Report Summary
Leer Complex
Prepared for Core Natural Resources, Inc.
Figure 1.1-1 General Location Map
Weir Technical Report Summary
Leer Complex
Prepared for Core Natural Resources, Inc.
1.2 GEOLOGICAL SETTING AND MINERALIZATION
The strata of the Tygart Valley River in Barbour, Harrison, Preston, and Taylor Counties, West Virginia consists of Pennsylvanian Aged sedimentary strata of the Monongahela Group, the Conemaugh Group, and the Allegheny Formation. The Monongahela Group includes the Sewickley, Redstone, and Pittsburgh coal seams. The Pittsburgh Seam has been extensively surface and underground mined at higher elevations in the Tygart Valley River region. The Conemaugh Group coal seams include the Elk Lick, Harlem, Bakerstown, and Brush Creek. No known large-scale mining has taken place within the Conemaugh Group coal seams in the Tygart Valley River region. The Allegheny Formation includes the Upper Freeport, Lower Freeport, Upper Kittanning, Lower Kittanning, and Clarion coal seams. The Johnstown Limestone is situated between the Upper Kittanning and the Lower Kittanning coal seams. The Upper Freeport, Upper Kittanning, Lower Kittanning, and Clarion coal seams have been previously mined in the Tygart Valley River region. All other coal seams of the Allegheny Formation in the area occur in limited areal extent and are generally of insufficient thickness for mining.
The principal minable coal seam in and surrounding the Leer Complex is the Lower Kittanning Seam as this seam occurs on a larger footprint, with more pronounced seam thickness than other aforementioned coal seams throughout the property.
Leer Mine
The Leer Mine (Leer), an active longwall mine that is developed in the eastern portion of Leer Complex, and is separated from Leer West Mine (Leer West) by the Tygart River. The extent of its Lower Kittanning Seam reserve area is situated between the towns of Grafton and Thornton, West Virginia and covers an area of approximately 26 square miles (approximately 16,640 acres). Across the reserve, the Lower Kittanning Seam consists of primarily a single bench of coal (4.7 feet average thickness) but can include a rider coal. When a rider coal is present, total seam thickness can reach approximately 10.5 feet. Exploration within Leer’s reserves show that the Lower Kittanning Seam thins to less than 3.0 feet to the south, east, and locally northward.
Leer South Mine
Leer South Mine (Leer South) is an active longwall mine situated in the southern portion of Leer Complex. The Leer South reserve in the Lower Kittanning Seam is lies over portions of the old underlying Clarion Seam workings of the closed Sentinel Mine. The Leer South reserve extends over 55 square miles (approximately 35,200 acres) from near Philippi, West Virginia toward Bridgeport, West Virginia.
Weir Technical Report Summary
Leer Complex
Prepared for Core Natural Resources, Inc.
The Lower Kittanning Seam averages 4.83 feet in thickness across its reserve area, and thins to the south and west to less than 3.0 feet.
Leer West Mine
Leer West is a planned longwall mine that is separated from Leer to the east by the Tygart River. The Leer and Leer South Life of Mine (LOM) Plan areas can both mine portions of the Leer West reserves. Leer West reserves in the Lower Kittanning Seam cover an area of approximately 63 square miles (40,320 acres) and are situated between the towns of Rosemont and Phillipi, West Virginia. The Lower Kittanning Seam averages 4.66 feet in thickness across the reserve area. The Lower Kittanning Seam thins to the north to less than 3.0 feet.
1.3 EXPLORATION
Historical exploration at the Leer Complex has relied exclusively upon continuous core drilling performed by competent contract drilling companies. Coreholes at the Leer Complex are typically 3.76-inch diameter (yielding 2.5-inch diameter core samples). Exploration drilling provides core samples of roof, coal seam, and floor strata. Core geologists utilize geophysical logs within exploration drilling to ensure strata and seam thickness accuracy over the Lower Kittanning Seam and to confirm core recovery. Drillholes with core recovery of less than 80 percent are noted and subsequently reviewed and potentially excluded from geological and coal quality modeling. WEIR did not exclude any Lower Kittanning Seam holes for poor core recovery, as all of the holes within the reserve area attained core recovery of at least 80 percent.
Coal seam core samples are sent to laboratories for quality analyses. If drill site and drillhole conditions allow, caliper, density, gamma, resistivity, and sonic downhole geophysical logs are completed. Each drillhole collar location is surveyed for accurate map coordinate and elevation data.
Typically, three samples of roof and one sample of floor strata from each target seam are taken for strength testing where solid unbroken lengths of core exist. Specific tests on core samples include Uniaxial Compressive Strength, Brazilian Indirect Tensile strength, Bulk Density, Specific Gravity, and Point Load index strength. Samples are prepared at a laboratory where the samples are machined into cylinders according to the appropriate American Society for Testing and Materials (ASTM) standards.
Weir Technical Report Summary
Leer Complex
Prepared for Core Natural Resources, Inc.
WEIR reviewed sample preparation, security, and analytical procedures for holes that were drilled after the property was acquired in 2011. It is WEIR’s opinion that the sample preparation, security, and analytical procedures utilized are acceptable and meet ASTM standards.
The adequacy of sample preparation, security, and analytical procedures utilized prior to the 2011 acquisition are generally unknown. However, the geologist’s logs for these holes contain sampling descriptions and lithologic descriptions that are sufficiently detailed to ascertain that an experienced geologist supervised the drilling and sampling. Coal quality analysis within historical exploration (prior to the 2011 acquisition) by Republic Steel, CT&E, Coal Operators Analytical Laboratory, Inc., appears to be in-line with Core’s current regiment of analyses performed by Standard Laboratories, Inc, as detailed in Section 8.0 of this TRS. However, this legacy drillhole information was included as the samples matched the coal seam intervals and reported similar quality results. Model verifications further support WEIR’s high level of confidence that a representative, valid, and accurate drillhole database and geological model has been generated for the Leer Complex that can be relied upon to accurately estimate coal resources and reserves.
1.4 OPERATIONS AND DEVELOPMENT
Leer is a permitted underground longwall mine that commenced production of metallurgical coal from the Lower Kittanning Seam in the fourth quarter of 2011. The longwall mining method has been successfully utilized in the NAPP Region, and in other coal producing regions of the United States since the 1960s. Longwall mining has the highest mining recovery of modern-day underground mining methods. Longwall mining includes room and pillar continuous mining to develop main entries, and longwall headgates and tailgates.
Leer South is a permitted underground longwall mine that commenced production of metallurgical coal from the Lower Kittanning Seam in 2018. Leer South is currently mining the Lower Kittanning Seam and parting interval within the seam, utilizing continuous miners to develop longwall panels to be mined using a longwall mining system.
Weir Technical Report Summary
Leer Complex
Prepared for Core Natural Resources, Inc.
Leer West is a planned, permitted underground longwall mine that has not yet commenced production of metallurgical coal, as of December 31, 2025.
Historical coal production from the Leer and Leer South mines are summarized in Table 1.4-1 as follows:
Table 1.4-1 Leer and Leer South Mines Historical Production
|
|
|
|
|
|
|
|
|
|
|
|
|
|
|
|
|
2024 |
|
2025 (1) |
| Mine |
|
Saleable Tons (000) |
| Leer |
|
3,650 |
|
3,956 |
| Leer South |
|
2,556 |
|
307 |
|
|
6,207 |
|
4,264 |
|
|
|
|
|
| (1) YTD Through September 30, 2025 |
Leer South’s production in 2025 was impacted by elevated carbon monoxide levels in the longwall gob that necessitated sealing the longwall panel, which resulted in the use of continuous miners to develop a new longwall face. In December 2025, seals were breached within the affected longwall panel and all longwall face equipment was recovered and relocated to the new longwall setup face. The new longwall commenced mining on December 17, 2025.
Historically, the market for metallurgical coal from the Leer Complex has been domestic metallurgical coal consumers and the global seaborne metallurgical coal market. High volatile metallurgical coal contains more than 31 percent volatile matter and is typically represented as High Vol A and High Vol B coal. High volatile metallurgical coal, primarily High Vol A and B coals, serve both the domestic and global seaborne metallurgical coal markets. The Leer Complex mines produce and sell a High Vol A metallurgical coal product, as well as a high ash middlings product.
The typical metallurgical coal product specifications for the Leer, Leer South and planned Leer West mines are summarized in Table 1.4-2 as follows:
Weir Technical Report Summary
Leer Complex
Prepared for Core Natural Resources, Inc.
Table 1.4-2 Typical Metallurgical Coal Product Specifications
|
|
|
|
|
|
|
|
|
|
|
|
|
|
|
|
|
|
|
|
|
|
|
|
|
Leer |
|
Leer |
|
|
Leer |
|
South |
|
West (1) |
| Moisture |
%, ar |
8.5 |
|
8 |
|
8.5 |
| Ash |
%, db |
7.5 |
|
7.5 |
|
7.5 |
| Vloatile Matter |
%, db |
33.2 |
|
33.9 |
|
33.4 |
| Fixed Carbon |
%, db |
59.3 |
|
58.6 |
|
59.1 |
| Sulfur |
%, db |
1.1 |
|
1.1 |
|
1.1 |
| Reflectance |
%Ro |
1.03 |
|
1 |
|
1.02 |
| Max Fluidity |
DDPM |
30,000 |
|
|
30,000 |
|
|
30,000 |
|
| FSI |
|
8 |
|
8 |
|
8 |
| CSR |
|
69 |
|
68 |
|
68 |
|
|
|
|
|
|
|
| (1) Projected |
|
|
|
|
|
|
WEIR evaluated LOM Plans for each of the Leer Complex mining operations. It is important to note that these LOM Plans are based on information provided by the company and do not contemplate the development of surrounding resource areas the company currently controls or contiguous resource areas the company could acquire in the future. Also, the plans do not assume any productivity improvements, technological innovations and/or operating efficiencies that the company has achieved historically.
The Leer LOM Plan projects mining through 2035, an expected mine life of nine years. Core projects annual mine production to range from 2.7 to 3.6 million clean tons when the longwall and three continuous miner units are operating (2026 to 2033). The continuous miner units decrease to one unit in 2034, with 2.1 million clean tons produced in 2035.
The Leer South LOM Plan projects mining through 2042, an expected mine life of 17 years. Core projects annual mine production to range from 2.7 to 4.0 million clean tons when the longwall and continuous miner units are operating (2026 to 2041), and 3.6 million clean tons in 2042 after the continuous miner units cease production.
The start date of Leer West has yet to be determined by Core. For purposes of determining economic viability of Leer West, WEIR assumed that mining would occur from 2031 through 2063; an expected mine life of 33 years. Annual mine production is projected to range from 1.9 to 3.3 million clean tons when the longwall and continuous miner units are operating (2034 to 2062), and 2.8 million clean tons in 2063 after the continuous miners cease production in 2062.
Weir Technical Report Summary
Leer Complex
Prepared for Core Natural Resources, Inc.
All Run-of-Mine (ROM) coal from Leer is washed at the Leer Preparation Plant. The preparation plant was designed with two identical processing circuits, which can be operated simultaneously or one circuit at a time. Each circuit can process 700 ROM tons per hour (tph) for a total design feed rate of 1,400 ROM tph, although the preparation plant typically operates at 1,500 ROM tph (750 to 775 ROM tph per circuit). The preparation plant feed rate is adjusted based on the desired product quality, which often results in the preparation plant’s processing rate to be higher than its design rate.
All ROM coal from Leer South is washed at the Leer South Preparation Plant. The preparation plant was designed with two processing circuits, which can be operated simultaneously or one circuit at a time. One circuit, Circuit A, can process 600 ROM tph and the other circuit, Circuit B, can process 1,000 ROM tph for a total design feed rate of 1,600 ROM tph. The preparation plant feed rate is adjusted based on the desired product quality, which often results in the preparation plant’s processing rate to be higher than the design rate.
The ROM coal from Leer West is projected to be washed at a preparation plant yet to be constructed. The preparation plant design is likely to be similar to the Leer preparation plant, with two identical processing circuits, which can be operated simultaneously or one at a time. Each circuit is planned to process 700 ROM tons per hour (tph) of ROM coal for a total design feed rate of 1,400 ROM tph.
1.5 MINERAL RESERVE AND RESOURCE ESTIMATE
The Leer Complex coal resources, as of December 31, 2025, are summarized below and reported as in-place resources and are inclusive of reported coal reserve tons. Resources are reported in categories of Measured, Indicated and Inferred tonnage and are in accordance with Regulation S-K Item 1302(d), summarized in Table 1.5-1 as follows:
Weir Technical Report Summary
Leer Complex
Prepared for Core Natural Resources, Inc.
Table 1.5-1 In-Place Coal Resource Tonnage and Quality Estimate as of December 31, 2025
|
|
|
|
|
|
|
|
|
|
|
|
|
|
|
|
|
|
|
|
|
|
|
|
|
|
|
|
|
|
|
|
|
|
|
|
|
|
|
|
|
|
|
|
|
|
|
|
|
|
|
|
|
|
|
|
|
|
|
|
|
|
|
|
|
|
|
|
|
|
|
|
|
|
|
Coal Quality |
|
|
|
|
|
|
|
|
|
|
|
|
|
|
|
|
|
|
(As Received) |
|
|
|
|
|
|
|
|
Average Coal |
|
In-Place Tons (000) |
|
Raw |
| Mine |
|
|
|
|
|
Area |
|
Thickness |
|
Resources (As Received) |
|
Ash |
| Area |
|
|
|
Seam |
|
(Acres) |
|
(Feet) |
|
Measured |
|
Indicated |
|
Total |
|
Inferred |
|
(%) |
| Leer |
|
Inclusive of Reserves |
|
Lower Kittanning |
|
5,730 |
|
4.7 |
|
46,000 |
|
8,400 |
|
54,400 |
|
— |
|
24.7 |
| Leer South |
|
Inclusive of Reserves |
|
Lower Kittanning |
|
9,850 |
|
4.8 |
|
80,200 |
|
19,300 |
|
99,500 |
|
— |
|
19.5 |
| Leer West |
|
Inclusive of Reserves |
|
Lower Kittanning |
|
15,600 |
|
4.7 |
|
128,000 |
|
26,500 |
|
154,500 |
|
— |
|
22.7 |
|
|
|
|
|
|
31,180 |
|
4.8 |
|
254,200 |
|
54,200 |
|
308,400 |
|
|
|
22.0 |
Notes:
•All Mineral Resources reported above meet the threshold for reserve modifying factors, such as estimated economic viability, that allow for conversion to Mineral Reserves.
•Resources stated as contained within a potentially economically mineable underground mine assuming a 3.0 feet minimum seam thickness, a High Vol A coal product and middling coal product realizing an average sales price of $122.00 per ton FOB Mine, with an operating cost of $71.67 per ton.
•Numbers in the table have been rounded to reflect the accuracy of the estimate and may not sum due to rounding
The conversion of resources to reserves at Leer, Leer South, and Leer West considers the effects of projected dilution and loss of product coal quality, projected mineral prices and operating costs, regulatory compliance requirements, and mineral control to determine if the saleable coal product will be economically mineable. The design of an executable mine layout that accommodates the planned mining equipment and provides a safe underground work environment is also considered.
The coal reserve tonnage representing the economically viable tonnage controlled and uncontrolled by Core, and estimated in accordance with Regulation S-K Item 1302(e), is summarized in Table 1.5-2 as follows:
Weir Technical Report Summary
Leer Complex
Prepared for Core Natural Resources, Inc.
Table 1.5-2 Recoverable Coal Reserve Tonnage and Quality Estimate as of December 31, 2025
|
|
|
|
|
|
|
|
|
|
|
|
|
|
|
|
|
|
|
|
|
|
|
|
|
|
|
|
|
|
|
|
|
|
|
|
|
|
|
|
|
|
|
|
|
|
|
|
|
|
|
|
|
|
|
|
|
|
|
|
|
|
|
|
|
|
|
|
|
|
|
|
|
|
|
|
|
Average Product Quality @ 1.50 S.G. (Dry Basis) |
|
|
|
|
|
|
|
|
Average Coal |
|
Saleable Tons (000) |
|
|
|
|
|
Volatile |
|
|
| Mine |
|
|
|
Area |
|
Thickness |
|
Reserves (As Received) |
|
Ash |
|
Sulfur |
|
Matter |
|
Overall |
| Area |
|
Seam |
|
(Acres) |
|
(Feet) |
|
Proven |
|
Probable |
|
Total |
|
(%) |
|
(%) |
|
(%) |
|
Yield (%) |
| Leer |
|
Lower Kittanning |
|
5,730 |
|
4.7 |
|
24,700 |
|
4,700 |
|
29,400 |
|
8.0 |
|
1.03 |
|
32.3 |
|
34 |
| Leer South |
|
Lower Kittanning |
|
9,850 |
|
4.8 |
|
46,400 |
|
10,600 |
|
57,000 |
|
8.8 |
|
1.23 |
|
34.3 |
|
39 |
| Leer West |
|
Lower Kittanning |
|
15,600 |
|
4.7 |
|
69,800 |
|
14,000 |
|
83,800 |
|
9.9 |
|
1.18 |
|
33.7 |
|
38 |
|
|
|
|
31,180 |
|
4.7 |
|
140,900 |
|
29,300 |
|
170,200 |
|
9.3 |
|
1.17 |
|
33.7 |
|
|
Notes:
•Clean recoverable Reserve tonnage based on mining recovery of 42 percent for continuous miner mining, 100 percent for longwall mining, modeled preparation plant yield, and a 95 percent preparation plant efficiency.
•Overall Yield reported above incorporates the inclusion of out of seam dilution estimated in the LOM Plan.
•Uncontrolled tons are reported for informational purposes only and are not part of the reserves. Uncontrolled tonnages are contained within small mineral tracts which must be acquired for execution of the LOM. As such, uncontrolled tonnages are included in the LOM financial model. There are approximately 8.6 million in-place uncontrolled tons within the Leer complex that will be acquired as mining progresses.
•Mineral Reserves estimated at a High Vol A coal product and middling coal product realizing an average sales price of $122.00 per ton FOB Mine, with an operating cost of $71.67 per ton.
•Numbers in the table have been rounded to reflect the accuracy of the estimate and may not sum due to rounding.
•Mineral Reserves are reported inclusive of Mineral Resources.
•Coal quality listed includes coal that is to be processed into both the middlings product and the metallurgical product and does not represent actual shipped products, which can vary for many reasons, including variations in coal depositional characteristics, non-coal parting and Out of Seam Dilution (OSD) quality characteristics and preparation plant separation specific gravities. As part of the preparation plant processing, the poorer quality middlings product is removed from the remaining clean coal, resulting in a higher quality metallurgical product.
WEIR depleted LOM reserve tonnage by reviewing actual mine workings through November 30, 2025, and subtracting actual production, reported by Core, for the remainder of the year to arrive at reserves as of December 31, 2025.
1.6 ECONOMIC EVALUATION
WEIR prepared a Preliminary Feasibility Study (PFS) financial model in order to assess the economic viability of the Leer Complex LOM Plans. Specifically, plans were evaluated using discounted cash flow analysis, which consists of annual revenue projections for the Leer Complex LOM Plans. Cash outflows such as capital, including preproduction costs, sustaining capital costs, operating costs, transportation costs, royalties, and taxes are subtracted from the inflows to produce the annual cash flow projections. No adjustments are made for inflation, and all cash flows are in 2025 U.S. dollars. WEIR’s study was conducted on an un-levered basis, excluding costs associated with any debt servicing requirements.
Weir Technical Report Summary
Leer Complex
Prepared for Core Natural Resources, Inc.
In its assessment of Net Present Value (NPV), WEIR utilized a discount rate of 12.5 percent.
The PFS financial model developed for use in this TRS was meant to evaluate the prospects of economic extraction of coal within the Leer Complex. This economic evaluation is not meant to represent a project valuation. Furthermore, optimization of the LOM Plans was outside of the scope of this engagement.
The projected coal sales price is based on a High Vol A benchmark for metallurgical coal of $176.96 per metric tonne. Once converted to short tons, adjusted for transportation and the inclusion of middling coal sales, the estimated LOM Plan Free on Board (FOB) Mine price is $122.00 per ton.
The results of WEIR’s PFS demonstrated an after-tax NPV of $1.3 billion for the Leer Complex LOM Plans. Key operational statistics for the LOM Plans, on an after-tax basis, are summarized in Table 1.6-1 as follows:
Table 1.6-1 Key Operating Statistics
|
|
|
|
|
|
|
LOM Plans |
| ROM Tons Produced (000) |
474,776 |
|
| Clean Tons Produced (000) |
179,290 |
|
| Preparation Plant Yield (%) |
37.8 |
| Marketable Tons Sold (000) |
180,542 |
|
|
|
| Cash Operating Cost (000) |
12,939,634 |
|
| Capital Expenditures (000) |
1,952,635 |
|
|
|
|
($ Per Ton) |
| Coal Sales Realization |
122.00 |
|
|
| Cash Costs |
71.67 |
| Non-cash Costs |
22.85 |
| Total Cost of Sales |
94.52 |
|
|
| Profit / (Loss) |
27.48 |
|
|
| EBITDA |
50.33 |
|
|
| Capital Expenditures |
10.89 |
A sensitivity analysis was undertaken to examine the influence of changes to assumptions for coal sales price, preparation plant yield, operating cost, capital expenditures, and discount rate on the base case after-tax NPV. The sensitivity analysis range (±25 percent) was designed to capture the bounds of reasonable variability for each element analyzed.
Weir Technical Report Summary
Leer Complex
Prepared for Core Natural Resources, Inc.
The Leer Complex NPV is most sensitive to changes in coal sales price, operating cost, and preparation plant yield. It is less sensitive to changes in discount rate and capital expenditures.
1.7 ENVIRONMENTAL STUDIES AND PERMITTING REQUIREMENTS
As part of the permitting process required by the West Virginia Department of Environmental Protection (WVDEP), numerous baseline studies or impact assessments were undertaken by Core. These baseline studies or impact assessments included in the permit are summarized as follows:
•Groundwater Inventory
•Surface Water Quality and Quantity
•Probable Hydrologic Consequences
The Leer, Leer South, and planned Leer West mines have been issued mining permits, and associated NPDES permits, by the WVDEP as shown in Table 1.7-1 as follows:
Table 1.7-1 Leer Complex Mining and NPDES Permits
|
|
|
|
|
|
|
|
|
|
|
|
|
|
|
|
|
|
|
|
|
|
|
|
|
|
|
|
|
|
|
Permitted |
|
|
|
|
|
|
|
|
Surface |
|
|
|
|
|
|
|
|
Area |
|
Issue |
|
NPDES |
| Complex |
|
Permit Number |
|
(Acres) |
|
Date |
|
Permit No. |
| Leer |
|
U-2004-06 |
|
201.10 |
|
10/8/2025 |
|
WV1017764 |
|
|
O-2017-06 |
|
315.14 |
|
4/18/2022 |
|
WV1017764 |
|
|
O-2001-24 |
|
251.67 |
|
Pending |
|
|
|
|
|
|
767.91 |
|
|
|
|
|
|
|
|
|
|
|
|
|
| Leer South |
|
U-15-83 |
|
209.45 |
|
1/24/1983 |
|
WV0043273 |
|
|
O-113-83 |
|
461.73 |
|
8/11/1983 |
|
WV0043273 |
|
|
|
|
671.18 |
|
|
|
|
|
|
|
|
|
|
|
|
|
| Leer West |
|
U-2006-12 |
|
207.65 |
|
6/22/2022 |
|
WV1025783 |
|
|
O-2001-17 |
|
239.00 |
|
12/10/2019 |
|
WV1025783 |
|
|
|
|
446.65 |
|
|
|
|
Weir Technical Report Summary
Leer Complex
Prepared for Core Natural Resources, Inc.
The current permit numbers, bond amounts and reclamation liability for each permit are shown in Table 1.7-2 as follows:
Table 1.7-2 Leer Complex Permitted Area, Reclamation Liability and Bonds
|
|
|
|
|
|
|
|
|
|
|
|
|
|
|
|
|
|
|
|
|
|
|
|
|
|
|
|
|
|
|
Permitted |
|
|
|
|
|
|
|
|
Surface |
|
Reclamation |
|
Bond |
|
|
Permit |
|
Area |
|
Liability (1) |
|
Amount |
| Complex |
|
Number |
|
(Acres) |
|
($000) |
|
($000) |
| Leer |
|
U-2004-06 |
|
201.10 |
|
14,217 |
|
8,079 |
|
|
O-2017-06 |
|
315.14 |
|
9,349 |
|
1,155 |
|
|
Highway Use Bonds |
|
— |
|
— |
|
375 |
|
|
Gas Well Bond |
|
— |
|
— |
|
50 |
|
|
|
|
516.24 |
|
23,566 |
|
9,659 |
|
|
|
|
|
|
|
|
|
| Leer South |
|
U-15-83 |
|
209.45 |
|
5,414 |
|
393 |
|
|
O-113-83 |
|
461.73 |
|
15,405 |
|
1,516 |
|
|
Highway Use Bonds |
|
— |
|
— |
|
128 |
|
|
Gas Well Bond |
|
— |
|
— |
|
50 |
|
|
|
|
671.18 |
|
20,819 |
|
2,087 |
|
|
|
|
|
|
|
|
|
| Leer West |
|
U-2006-12 |
|
207.65 |
|
— |
|
14 |
|
|
O-2001-17 |
|
239.00 |
|
— |
|
126 |
|
|
|
|
446.65 |
|
|
|
140 |
|
|
|
|
|
|
|
|
|
| Leer Complex |
|
|
|
1,634 |
|
44,386 |
|
11,885 |
|
|
|
|
|
|
|
|
|
| (1) Represents the undiscounted cash flows to satisfy reclamation as of July 2025 |
Core currently employs approximately 425 to 500 personnel at Leer and Leer South. Hourly labor at both mines remains non-union and no change in this labor arrangement is anticipated.
The Leer Complex also creates substantial economic value with its third-party service and supply providers, utilities and through payment of taxes and fees to governmental agencies. The Leer Complex operations maintain a positive presence within the surrounding communities. As a result, the risk of community challenges to permits or operational plans is generally low. Based on WEIR’s review of Core’s plans for environmental compliance, permit compliance and conditions, and dealings with local individuals and groups, Core’s efforts appear to be adequate and reasonable in order to obtain approvals necessary relative to the execution of the Leer Complex LOM Plans.
Weir Technical Report Summary
Leer Complex
Prepared for Core Natural Resources, Inc.
1.8 CONCLUSIONS AND RECOMMENDATIONS
Among other United States underground mines, the Leer Complex is consistently ranked higher than average, as measured by mine productivity in tons produced per employee hour worked, as reported by the Mining Safety and Health Administration (MSHA). Additionally, Core has a long and successful operating history of resource exploration, mine development, and mining operations at Leer and Leer South mines. Extensive exploration data such as drillholes, in-mine seam thickness and elevation measurements, and in-mine channel samples support the determination of mineral resource and reserve estimates, and projected economic viability. The data has been reviewed and analyzed by WEIR and determined to be adequate in quantity and reliability to support the coal resource and coal reserve estimates in this TRS.
The LOM Plans include projected mining in a number of small tracts of land that will be encountered in later years of the LOM Plan where Core does not have mineral control. Most of these areas are expected to be acquired by Core, in adequate time, before the areas are scheduled to be mined. However, if those areas cannot be acquired, adjustments could be made to the scheduled LOM Plan to avoid those areas.
The coal resource and reserve estimates supporting the PFS were prepared in accordance with Regulation S-K 1300 requirements. There are 308.4 million in place tons of Measured and Indicated coal resources (inclusive of reserves) and 170.2 million clean recoverable tons of underground mineable reserves within the Leer Complex as of December 31, 2025.
Reasonable prospects for economic extraction were established through the development of a PFS relative to Leer, Leer South and Leer West LOM Plans. Core has not determined a commencement date for the Leer West mine, however, for the purposes of the PFS and determination of economic viability, WEIR projected the Leer West production for longwall to commence in 2031. The PFS considers historical mining performance, historical and projected metallurgical coal sales prices, historical and projected mine operating costs, and recognizing reasonable and sufficient capital expenditures.
Weir Technical Report Summary
Leer Complex
Prepared for Core Natural Resources, Inc.
The ability of Core, or any coal company, to achieve production and financial projections is dependent on numerous factors. These factors primarily include site-specific geological conditions, the capabilities of management and mine personnel, level of success in acquiring reserves and surface properties, coal sales prices and market conditions, environmental issues, securing permits and bonds, and developing and operating mines in a safe and efficient manner. Unforeseen changes in legislation and new industry developments could substantially alter the performance of any mining company.
Coal mining is carried out in an environment where not all events are predictable. While an effective management team can identify known risks and take measures to manage and/or mitigate these risks, there is still the possibility of unexpected and unpredictable events occurring. It is not possible to totally remove all risks or state with certainty that an event that may have a material impact on the operation of a coal mine will not occur.
WEIR assessed risks associated with the economic mineability of the Leer Complex mining operations. Based on the review, these risks are low to moderate and can be managed and/or mitigated with proper planning and monitoring of the mining operations. Leer West has lower EBITDA per ton than the other mines within the complex, making its ability to achieve positive economics more dependent on anticipated coal sales prices.
WEIR recommends that any future exploration work and mineral property acquisition should include what has historically been implemented related to the following:
Geology
•Experienced geologists should log core holes, measure core recovery, and complete sampling.
•Geophysically log core holes to verify seam thickness, coal thickness, and core recovery.
•Geophysically log rotary holes to verify strata and coal thickness.
•Continue to prepare laboratory sample analysis at a 1.40, 1.50 and 1.60 specific gravity to better match the preparation plant specific gravity when processing a metallurgical coal.
•Continue collecting channel samples (include parting).
Mineral Property
•Acquire or obtain leases of uncontrolled properties prior to the projected mining date.
Weir Technical Report Summary
Leer Complex
Prepared for Core Natural Resources, Inc.
2.0 INTRODUCTION
2.1 REGISTRANT
WEIR was retained by Core Natural Resources Inc. (NYSE: CNR) to prepare a TRS related to Core’s Leer Complex, which includes the currently operating Leer and Leer South and the planned Leer West. The Leer Complex is located approximately 25 miles south of the city of Morgantown, primarily in Barbour, Harrison, Preston and Taylor Counties, West Virginia (see Figure 1.1-1).
2.2 TERMS OF REFERENCE AND PURPOSE
This TRS was prepared specifically for Core’s Leer Complex. The Lower Kittanning Seam resources at the Leer, Leer South, and Leer West mines have been herein classified in accordance with SEC mining property disclosure rules under Subpart 1300 and Item 601 (96)(B)(iii) of Regulation S-K. Unless otherwise stated, all volumes, grades, distances, and currencies are expressed in United States customary units.
The accuracy of reserve and resource estimates are, in part, a function of the quality and quantity of available data at the time this report was prepared. Estimates presented herein are considered reasonable. However, the estimates should be accepted with the understanding that with additional data and analysis available subsequent to the date of this report, the estimates may necessitate revision which may be material. Certain information set forth in this report contains “forward-looking information”, including production, productivity, operating costs, capital costs, sales prices, and other assumptions. These statements are not guarantees of future performance and undue reliance should not be placed on this information. The assumptions used to develop the forward-looking information and the risks that could cause the actual results to differ materially are detailed in the body of this report.
Leer is a permitted underground longwall mine that commenced production of metallurgical coal in the fourth quarter of 2011. Longwall mining commenced in 2013.
Leer South is a permitted underground longwall mine that commenced production of metallurgical coal in 2018. Longwall mining commenced in August 2021.
Weir Technical Report Summary
Leer Complex
Prepared for Core Natural Resources, Inc.
The Leer West Mine is a planned underground longwall mine that has not commenced production of metallurgical coal as of the fourth quarter of 2025.
This Leer Complex TRS reports both mineral reserves and resources (inclusive of reserves). Supporting the assessment of the economic mineability of reported reserves and prospects of economically feasible extraction of reported resources, this report includes summary detail of a PFS conducted relative to Leer, Leer South, and Leer West.
WEIR’s evaluation of coal reserves and resources was conducted in accordance with Regulation S-K 1300 definitions for Mineral Resource, Mineral Reserve, and Preliminary Feasibility Study as follows:
•Mineral Resource is a concentration or occurrence of material of economic interest in or on the earth’s crust in such form, grade or quality, and quantity that there are reasonable prospects for economic extraction. A mineral resource is a reasonable estimate of mineralization, taking into account relevant factors such as cut-off grade, likely mining dimensions, location or continuity, that with the assumed and justifiable technical and economic conditions, are likely to, in whole or in part, become economically extractable. It is not merely an inventory of all mineralization drilled or sampled.
•Mineral Reserve is an estimate of tonnage and grade or quality of indicated and measured mineral resources that, in the opinion of the Qualified Person, can be the basis of an economically viable project. More specifically, it is the economically mineable part of a measured or indicated mineral resource, which includes diluting materials and allowances for losses that may occur when the material is mined or extracted.
•Preliminary Feasibility Study is a comprehensive study of a range of options for the technical and economic viability of a mineral project that has advanced to a stage where a Qualified Person has determined (in the case of underground mining) a preferred mining method, or (in the case of surface mining) a pit configuration, and in all cases has determined an effective method of mineral processing and an effective plan to sell the product.
Weir Technical Report Summary
Leer Complex
Prepared for Core Natural Resources, Inc.
2.3 SOURCES OF INFORMATION AND DATA
The primary information used in this study was obtained from the following sources:
•Geological data that was exclusively provided by Core geology and engineering staff. The geological data includes drillhole information such as driller’s logs, geologist’s logs, both full and partial scans of geophysical logs, survey data, coal quality laboratory certificates, and MS Excel™ (Excel) versions of drillhole survey, lithology, and quality data. Additionally, WEIR was provided with modeled coal seam floor elevations and seam thickness contours, topography contours, in-mine seam measurement thicknesses, mine channel quality samples, and other base geological data.
•Mineral and surface ownership maps, and supplemental files were provided exclusively by Ark Land LLC, a subsidiary of Core.
•Site visits by WEIR Qualified Persons (QPs) on January 28 and 29th, 2026.
•Interviews between WEIR personnel and Core personnel including
Assistant Director of Engineering - Leer and Leer South
Manager of Engineering - Leer South
Mine Manager - Leer and Leer South
Business Manager - Leer and Leer South
Geotechnical Engineer, Leer South
Geologist, Corporate
Geologist, Leer South
•Historical production, productivity, staffing levels, operating costs, capital expenditures, and coal sales revenue provided by Core.
•LOM projections and cost model provided by Core.
•Coal processing and handling facilities plot plans and flow sheets.
•Health, safety, and environmental matters discussed during interviews between WEIR and Core personnel.
•Current mine permits, in addition to recent permit revisions and renewals provided by Core.
•Current and projected mine plans, including production, productivity, operating costs, and capital expenditures required to sustain projected levels of production for the Leer Complex, provided by Core. They were all reviewed for reasonableness by WEIR.
•Market outlook and coal sales price projections provided by Core
•Projected reclamation costs for mine closure activities provided by Core.
Weir Technical Report Summary
Leer Complex
Prepared for Core Natural Resources, Inc.
A detailed list of all data received and reviewed for this study is provided in Sections 24.0 and 25.0 of this TRS.
2.4 DETAILS OF THE PERSONAL INSPECTION OF THE PROPERTY
WEIR’s mining and geology QP’s previously visited Leer on August 17, 2021. WEIR has also performed numerous annual audits of the Leer reserves for Core’s annual SEC 10K filings.
WEIR held initial discussions with engineering management on September 3, 2025, to review questions WEIR had relative to the property’s geology, mine plans and operations. Several phone calls and meetings followed over the next three months with management, discussions included key topics as follows:
•Geology
•Property
•Infrastructure
•Mine Plan, Production and Productivity
•Preparation Plant
•Operating Costs and Capital expenditures
•Marketing
•Environmental Compliance
•Risks and Uncertainties
Subsequently, WEIR’s mining and geology QPs visited Leer South on January 28, 2026. Areas of Leer South visited included the following:
•Mine Office and Bathhouse
•Warehouse
•Preparation Plant and Stockpiles
•Rail Loadout
•Refuse Impoundment
•Underground Areas, including Longwall 9 in District 2 and Headgate 12
Areas of Leer visited by WEIR’s same QPs on January 29, 2026 included the following:
•Mine Office and Bathhouse
•Warehouse
Weir Technical Report Summary
Leer Complex
Prepared for Core Natural Resources, Inc.
•Preparation Plant and Stockpiles
•Rail Loadout
•Refuse Impoundment
•Underground Areas, including Longwall 15 in District 8 and Headgate 4
In addition to observance of mine infrastructure, surface facilities and mining conditions, WEIR discussed the Leer, Leer South, and Leer West LOM Plans with mine management personnel.
2.5 PREVIOUS TRS
This TRS is an update to separate TRSs filed for Leer and prepared by WEIR in February 2022 and a TRS for Leer South prepared by Marshall Miller and Associates (MM&A) in February 2024, each for Arch Resources. Both previous TRSs were completed before the merger of Arch Resources and CONSOL Energy.
Weir Technical Report Summary
Leer Complex
Prepared for Core Natural Resources, Inc.
3.0 PROPERTY DESCRIPTION
3.1 PROPERTY LOCATION
The Leer Complex is located approximately 25 miles south of Morgantown, West Virginia, primarily in Barbour, Harrison, Preston and Taylor Counties, within the Northern West Virginia coal field of the NAPP Region of the United States (see Figure 1.1-1). The approximate center point of the Leer Complex is located at 39 17’ 00”N Latitude 80 03’ 00”W Longitude. The USGS 7.5-minute quadrangle map sheets are Brownton, Fairmont East, Gladesville, Grafton, Philippi, Rosemont and Thornton.
3.2 PROPERTY AREA
The Leer Complex boundary comprises approximately 225 square miles (144,700 acres), which is a mixture of owned and leased acreage. Approximately 77 percent is owned, 6 percent is leased, and 17 percent is uncontrolled. Longwall mining operations of Leer, Leer South, and the future Leer West reserve are contained within the complex.
Leer’s surface facilities are located near the central point of its permit area. The surface facilities include mine administration, engineering and operations offices, coal preparation plant, rail loadout, mine maintenance facilities, warehouse facilities, parking lots, preparation plant waste disposal, settling ponds, and the Leer slope portal access. The total disturbed area for the surface facilities is approximately 516 acres.
Leer South’s surface facilities are located within the Leer South permit area, near the southeast portion of the permit boundary. The surface facilities include mine administration, engineering and operations offices, coal preparation plant, rail loadout, mine maintenance facilities, warehouse facilities, parking lots, preparation plant waste disposal, settling ponds, and the Leer South slope portal access. The total disturbed area for the surface facilities is approximately 400 acres.
Leer West’s surface facilities have not been constructed as of December 2025, however, the surface facilities are designed and have been included in the approved permit. A construction date has not been determined by Core, however, for the purposes of determining economic viability, WEIR has assumed a planned construction commencement in 2028. The surface facilities will include mine administration, engineering and operations offices, coal preparation plant, rail loadout, mine maintenance facilities, warehouse facilities, parking lots, preparation plant waste disposal, settling ponds, and the Leer West slope portal access.
Weir Technical Report Summary
Leer Complex
Prepared for Core Natural Resources, Inc.
The total disturbed area for the surface facilities is approximately 239 acres.
3.3 PROPERTY CONTROL
The Leer Complex reserve boundary comprises approximately 225 square miles (144,700 acres). Within that boundary, Core controls surface and mineral rights through approximately 443 contracts. Core controls the Lower Kittanning Seam through 60 leases and 142 deeds, including commissioner’s deeds, general warranty deeds, and quitclaim deeds. A table that describes the various property control contracts is shown in Table 3.3-1. Note that each individual contract may include more than one type of property control.
Table 3.3-1 Property Control
|
|
|
|
|
|
|
|
|
| Document Type |
|
Quantity |
| Access Easement Agreement |
|
2 |
| Aknowledgement of Rights |
|
3 |
| Agreements |
|
1 |
| Assignments |
|
1 |
| Coal Deeds |
|
13 |
| Coal Leases |
|
29 |
| Deeds |
|
50 |
| Easements |
|
2 |
| Powerline Easements |
|
12 |
| Facility Encroachment Agreement |
|
4 |
| Future Refuse Storage - General Warranty Deed |
|
1 |
| General Warranty Deed |
|
88 |
| Leases |
|
56 |
| Option to Purchase |
|
7 |
| Outdeed |
|
13 |
| Overriding Royalty Agreement |
|
4 |
| Pipeline Right of Way |
|
5 |
| Sidetrack Agreement |
|
1 |
| Quit Claim Deed |
|
59 |
| Quit Claim Deed - Out |
|
1 |
| Right of Entry |
|
2 |
| Special Commissioner's Deed |
|
6 |
| Special Warranty Deed |
|
9 |
| Surface Lease |
|
1 |
| Surface Use and Access Agreement |
|
6 |
| Track Agreement |
|
1 |
| Trustee's Deed |
|
1 |
| Waiver and Release of Rights |
|
64 |
| Wireline Crossing Agreement |
|
1 |
Weir Technical Report Summary
Leer Complex
Prepared for Core Natural Resources, Inc.
3.4 MINERAL CONTROL
All 60 coal leases controlling the Lower Kittanning Seam, indicated above, have a minimum annual royalty payment ranging from $45 to $1,000,000 per year. Core controls other seams through additional coal leases. Core’s production royalty rates range from 1.5 percent to 10 percent of the Gross Sales Price (GSP). The details of the Lower Kittanning Seam mineral control contracts are listed in Table 3.4-1.
Table 3.4-1 Lower Kittanning Seam Mineral Control Contracts
|
|
|
|
|
|
|
|
|
|
|
|
|
|
|
|
|
|
|
|
|
| Arch Land |
|
Document |
|
|
|
Expiration |
| File Number |
|
Type |
|
Seams |
|
Date (1) |
|
|
|
|
|
|
|
| LN-001-1 |
|
Deed |
|
Lower Kittanning (Owned) |
|
N/A |
| CQT-001 |
|
Deed |
|
All seams |
|
N/A |
| CQT-004 |
|
Deed |
|
All seams except Pittsburgh and above |
|
N/A |
| LN-003 |
|
Coal Lease |
|
Lower Kittanning (Leased) |
|
Exhaustion of mineable and merchantable coal |
| SM-003 |
|
Lease |
|
All seams except Pittsburgh |
|
Exhaustion of mineable and merchantable coal |
| SM-016 |
|
Lease |
|
Percentage interest in all seams |
|
Exhaustion of mineable and merchantable coal |
| SM-027 |
|
Lease |
|
All seams |
|
Exhaustion of mineable and merchantable coal |
| SM-028 |
|
Lease |
|
Seams below level of Elk Creek are leased, which for our purposes are the Elk Lick seams and all seams below the Elk Lick (essentially all seams below the Pittsburgh seam). |
|
Exhaustion of mineable and merchantable coal |
| SM-033; SM-033-1 |
|
Leases |
|
All seams |
|
Exhaustion of mineable and merchantable coal |
| SM-033-2 |
|
Lease |
|
All seams |
|
Exhaustion of mineable and merchantable coal |
SM-035;
SM-035-1
(Lease Tract 1A) |
|
Leases |
|
All seams |
|
Exhaustion of mineable and merchantable coal |
SM-035-2;
SM-035-4
(Lease Tract 1B) |
|
Leases |
|
All seams except Pittsburgh and above |
|
Exhaustion of mineable and merchantable coal |
SM-035-3
(Lease Tract 2) |
|
Lease |
|
All seams |
|
Exhaustion of mineable and merchantable coal |
| SM-035-5 |
|
Lease |
|
All seams except Pittsburgh and above |
|
Exhaustion of mineable and merchantable coal |
| SM-040 |
|
Lease |
|
All seams |
|
Exhaustion of mineable and merchantable coal |
| SM-061 |
|
Lease |
|
Kittanning seam |
|
Exhaustion of mineable and merchantable coal |
| SM-062 |
|
Lease |
|
Kittanning seam |
|
Exhaustion of mineable and merchantable coal |
SM-065 thru
SM-065-4 |
|
Leases |
|
Percentage interest in all seams |
|
Exhaustion of mineable and merchantable coal |
| SM-065-5 |
|
Deed |
|
Percentage interest in all seams |
|
N/A |
| SM-066 |
|
Lease |
|
Upper and lower Kittanning seams |
|
Exhaustion of mineable and merchantable coal |
SM-068;
SM-068-1 |
|
Lease |
|
Clarion and lower Kittanning seams |
|
Exhaustion of mineable and merchantable coal |
| SM-073 |
|
Deed |
|
All seams |
|
N/A |
| SM-075 |
|
Deed |
|
All seams |
|
N/A |
| SM-076 |
|
Deed |
|
All seams |
|
N/A |
| SM-077 |
|
Deed |
|
Kittanning seam |
|
N/A |
| SM-078 |
|
Deed |
|
Kittanning seam |
|
N/A |
| SM-080 |
|
Deed |
|
Kittanning seam |
|
N/A |
| SM-081 |
|
Deed |
|
Most coal all seams; .85 acres of coal - Pittsburgh seam only |
|
N/A |
SM-083-24
(Tract Z-60) |
|
Leases |
|
All seams except Pittsburgh |
|
Exhaustion of mineable and merchantable coal |
SM-083-25
(Tract Z-52) |
|
Leases |
|
All seams except Pittsburgh |
|
Exhaustion of mineable and merchantable coal |
Weir Technical Report Summary
Leer Complex
Prepared for Core Natural Resources, Inc.
|
|
|
|
|
|
|
|
|
|
|
|
|
|
|
|
|
|
|
|
|
| Arch Land |
|
Document |
|
|
|
Expiration |
| File Number |
|
Type |
|
Seams |
|
Date (1) |
SM-083-26
(Tract Z-62) |
|
Leases |
|
All seams except Pittsburgh |
|
Exhaustion of mineable and merchantable coal |
SM-083-27
(Tract Z-44) |
|
Leases |
|
All seams except Pittsburgh |
|
Exhaustion of mineable and merchantable coal |
SM-156 thru
SM-156-7 |
|
Leases |
|
All seams except Pittsburgh and above |
|
Exhaustion of mineable and merchantable coal |
| SM-159 |
|
Lease |
|
All seams except Pittsburgh and above |
|
Exhaustion of mineable and merchantable coal |
| SM-180 |
|
Lease |
|
All seams except Pittsburgh |
|
Exhaustion of mineable and merchantable coal |
| SM-196 |
|
Lease |
|
Clarion and Kittanning Seams |
|
Exhaustion of mineable and merchantable coal |
SM-211 thru
SM-211-2 |
|
Leases |
|
Clarion and Kittanning Seams |
|
46043 |
SM-232 thru
SM-232-1 |
|
Leases |
|
All seams |
|
Exhaustion of mineable and merchantable coal |
SM-232-2 thru
SM-232-4 |
|
Deed |
|
All seams |
|
N/A |
| SM-239 |
|
Deed |
|
Lower Kittanning Seam |
|
N/A |
| SM-256-1 |
|
Coal Lease |
|
All Seams |
|
Exhaustion of mineable and merchantable coal |
| SM-270 |
|
Deed |
|
All seams except Pittsburgh |
|
N/A |
| SM-300 |
|
General Warranty Deed |
|
All seams |
|
N/A |
| SM-301 |
|
General Warranty Deed |
|
All seams |
|
N/A |
| SM-302 |
|
General Warranty Deed |
|
All seams |
|
N/A |
| SM-306 |
|
Coal Lease |
|
All seams |
|
Exhaustion of mineable and merchantable coal |
SM-310 thru
SM-310-1 |
|
Coal Lease |
|
All seams |
|
Exhaustion of mineable and merchantable coal |
| SM-313 |
|
Quit Claim Deed |
|
All seams |
|
N/A |
| SM-314 |
|
General Warranty Deed - Coal |
|
All seams |
|
N/A |
| SM-315 |
|
General Warranty Deed - Coal |
|
All seams |
|
N/A |
SM-316 thru
SM-316-2 |
|
Coal Lease |
|
All seams |
|
Exhaustion of mineable and merchantable coal |
| SM-331 |
|
Lease |
|
All seams |
|
Exhaustion of mineable and merchantable coal |
| SM-338 |
|
Lease |
|
All seams |
|
Exhaustion of mineable and merchantable coal |
| SM-340 |
|
Lease |
|
All seams |
|
Exhaustion of mineable and merchantable coal |
| SM-346 |
|
Lease |
|
Lower Kittanning Seam Only |
|
Exhaustion of mineable and merchantable coal |
| SM-349 |
|
Quit Claim Deed |
|
All seams |
|
N/A |
| SM-353 |
|
QuitClaim Deed |
|
All seams |
|
N/A |
| SR-059 |
|
Coal Lease |
|
All seams (Leased) |
|
Exhaustion of mineable and merchantable coal |
| TV-001 |
|
Lease |
|
Upper Freeport and all seams below |
|
Exhaustion of mineable and merchantable coal |
| TV-004 |
|
Deed |
|
Kittanning seams only |
|
N/A |
| TV-004 |
|
Deed |
|
All seams except Pittsburgh and above |
|
N/A |
| TV-005 |
|
Deed |
|
All seams |
|
N/A |
| TV-006 |
|
Deed |
|
Kittanning seams only |
|
N/A |
| TV-007 |
|
Deed |
|
All seams |
|
N/A |
| TV-036; TV-036-3 thru TV-036-21 |
|
Deed |
|
Partial ownership in all seams |
|
N/A |
| TV-052 |
|
Coal Lease |
|
All seams (Leased) |
|
Exhaustion of mineable and merchantable coal |
| TV-078 |
|
Deed |
|
All seams |
|
N/A |
| TV-125 |
|
Coal Lease |
|
All seams (Leased) |
|
Exhaustion of mineable and merchantable coal |
| TV-307 |
|
General Warranty Deed |
|
All seams |
|
N/A |
TV-333 thru
TV-333-2 |
|
Coal Lease |
|
All seams |
|
Exhaustion of mineable and merchantable coal |
TV-338 thru
TV-338-5; TV-338-8 thru TV-338-17;
TV-338-19 thru
TV-338-21; TV-338-23 thru TV-338-33 |
|
Coal Deed |
|
Partial interest in all seams
(Remainder is leased under TV-338-6, TV-338-7, and TV-338-22) |
|
N/A |
| TV-338-6,TV-338-7,TV-338-22 |
|
Coal Lease |
|
Partial interest in all seams
(Remainder is owned under other provisions of TV-338) |
|
Exhaustion of mineable and merchantable coal |
Weir Technical Report Summary
Leer Complex
Prepared for Core Natural Resources, Inc.
|
|
|
|
|
|
|
|
|
|
|
|
|
|
|
|
|
|
|
|
|
| Arch Land |
|
Document |
|
|
|
Expiration |
| File Number |
|
Type |
|
Seams |
|
Date (1) |
| TV-343 |
|
Coal Lease |
|
All seams |
|
Exhaustion of mineable and merchantable coal |
| TV-355 |
|
Coal Lease |
|
All seams |
|
Exhaustion of mineable and merchantable coal |
| TV-356 |
|
Deed |
|
All seams |
|
N/A |
| TV-368 |
|
General Warranty Deed |
|
All seams |
|
N/A |
| TV-383-1 |
|
Coal Lease |
|
All seams |
|
Exhaustion of mineable and merchantable coal |
| TV-399 |
|
Coal Lease |
|
Lower Kittanning seam only |
|
Exhaustion of mineable and merchantable coal |
| TV-402 |
|
Coal Lease |
|
Lower Kittanning seam only |
|
46538 |
| TV-404 |
|
Coal Lease |
|
All seams |
|
Exhaustion of mineable and merchantable coal |
| TV-410 |
|
Coal Lease |
|
All seams |
|
Exhaustion of mineable and merchantable coal |
| TV-410-1 |
|
Coal Lease |
|
All seams |
|
Exhaustion of mineable and merchantable coal |
| TV-412 |
|
Coal Lease |
|
All seams |
|
Exhaustion of mineable and merchantable coal |
| TV-414 |
|
Coal Lease |
|
Kittanning seams only |
|
Exhaustion of mineable and merchantable coal |
| TV-415 |
|
Quit Claim Deed |
|
All seams |
|
N/A |
| TV-415-1 |
|
Quit Claim Deed |
|
All seams |
|
N/A |
| TV-415-10 |
|
Quit Claim Deed |
|
All seams |
|
N/A |
| TV-415-11 |
|
Quit Claim Deed |
|
All seams |
|
N/A |
| TV-415-12 |
|
Quit Claim Deed |
|
All seams |
|
N/A |
| TV-415-13 |
|
Quit Claim Deed |
|
All seams |
|
N/A |
| TV-415-14 |
|
Quit Claim Deed |
|
All seams |
|
N/A |
| TV-415-15 |
|
Quit Claim Deed |
|
All seams |
|
N/A |
| TV-415-16 |
|
Quit Claim Deed |
|
All seams |
|
N/A |
| TV-415-18 |
|
Quit Claim Deed |
|
All seams |
|
N/A |
| TV-415-2 |
|
Quit Claim Deed |
|
All seams |
|
N/A |
| TV-415-20 |
|
Quit Claim Deed |
|
All seams |
|
N/A |
| TV-415-21 |
|
Quit Claim Deed |
|
All seams |
|
N/A |
| TV-415-22 |
|
Quit Claim Deed |
|
All seams |
|
N/A |
| TV-415-23 |
|
Quit Claim Deed |
|
All seams |
|
N/A |
| TV-415-24 |
|
Quit Claim Deed |
|
All seams |
|
N/A |
| TV-415-25 |
|
Quit Claim Deed |
|
All seams |
|
N/A |
| TV-415-26 |
|
Quit Claim Deed |
|
All seams |
|
N/A |
| TV-415-27 |
|
Quit Claim Deed |
|
All seams |
|
N/A |
| TV-415-28 |
|
Quit Claim Deed |
|
All seams |
|
N/A |
| TV-415-29 |
|
Quit Claim Deed |
|
All seams |
|
N/A |
| TV-415-3 |
|
Quit Claim Deed |
|
All seams |
|
N/A |
| TV-415-30 |
|
Quit Claim Deed |
|
All seams |
|
N/A |
| TV-415-31 |
|
Quit Claim Deed |
|
All seams |
|
N/A |
| TV-415-32 |
|
Quit Claim Deed |
|
All seams |
|
N/A |
| TV-415-33 |
|
Quit Claim Deed |
|
All seams |
|
N/A |
| TV-415-34 |
|
Quit Claim Deed |
|
All seams |
|
N/A |
| TV-415-35 |
|
Quit Claim Deed |
|
All seams |
|
N/A |
| TV-415-36 |
|
Quit Claim Deed |
|
All seams |
|
N/A |
| TV-415-37 |
|
Quit Claim Deed |
|
All seams |
|
N/A |
| TV-415-38 |
|
Quit Claim Deed |
|
All seams |
|
N/A |
| TV-415-39 |
|
Quit Claim Deed |
|
All seams |
|
N/A |
| TV-415-4 |
|
Quit Claim Deed |
|
All seams |
|
N/A |
| TV-415-40 |
|
Quit Claim Deed |
|
All seams |
|
N/A |
| TV-415-41 |
|
Quit Claim Deed |
|
All seams |
|
N/A |
| TV-415-42 |
|
Quit Claim Deed |
|
All seams |
|
N/A |
| TV-415-43 |
|
Quit Claim Deed |
|
All seams |
|
N/A |
| TV-415-44 |
|
Quit Claim Deed |
|
All seams |
|
N/A |
| TV-415-45 |
|
Quit Claim Deed |
|
All seams |
|
N/A |
| TV-415-46 |
|
Quit Claim Deed |
|
All seams |
|
N/A |
| TV-415-47 |
|
Coal Lease |
|
All seams |
|
Exhaustion of mineable and merchantable coal |
| TV-415-48 |
|
Coal Lease |
|
All seams |
|
Exhaustion of mineable and merchantable coal |
Weir Technical Report Summary
Leer Complex
Prepared for Core Natural Resources, Inc.
|
|
|
|
|
|
|
|
|
|
|
|
|
|
|
|
|
|
|
|
|
| Arch Land |
|
Document |
|
|
|
Expiration |
| File Number |
|
Type |
|
Seams |
|
Date (1) |
| TV-415-49 |
|
Coal Lease |
|
All seams |
|
Exhaustion of mineable and merchantable coal |
| TV-415-5 |
|
Quit Claim Deed |
|
All seams |
|
N/A |
| TV-415-50 |
|
Coal Lease |
|
All seams |
|
Exhaustion of mineable and merchantable coal |
| TV-415-51 |
|
Special Commissioner's Deed |
|
All seams |
|
N/A |
| TV-415-52 |
|
Special Commissioner's Deed |
|
All seams |
|
N/A |
| TV-415-53 |
|
Special Commissioner's Deed |
|
All seams |
|
N/A |
| TV-415-54 |
|
Special Commissioner's Deed |
|
All seams |
|
N/A |
| TV-415-55 |
|
Special Commissioner's Deed |
|
All seams |
|
N/A |
| TV-415-56 |
|
Special Commissioner's Deed |
|
All seams |
|
N/A |
| TV-415-6 |
|
Quit Claim Deed |
|
All seams |
|
N/A |
| TV-415-7 |
|
Quit Claim Deed |
|
All seams |
|
N/A |
| TV-415-8 |
|
Quit Claim Deed |
|
All seams |
|
N/A |
| TV-415-9 |
|
Quit Claim Deed |
|
All seams |
|
N/A |
| TV-423 |
|
Coal Lease |
|
All seams |
|
Exhaustion of mineable and merchantable coal |
| TV-423-1 |
|
Coal Lease |
|
All seams |
|
Exhaustion of mineable and merchantable coal |
TV-424 thru
TV-424-2 |
|
Coal Lease |
|
All seams |
|
Exhaustion of mineable and merchantable coal |
| TV-429 |
|
Coal Lease |
|
All seams |
|
Exhaustion of mineable and merchantable coal |
| TV-455 |
|
Option to Purchase |
|
All seams |
|
46106 |
| TV-458 |
|
Option to Purchase |
|
Kittanning seams and above |
|
45756 |
TV-464 thru
TV-464-3 |
|
Coal Deed |
|
All seams |
|
N/A |
| TV-469 |
|
Coal Deed |
|
All seams |
|
N/A |
| CQT-001 |
|
Deed |
|
Owned coal |
|
N/A |
| CQT-004 |
|
Deed |
|
Owned coal |
|
N/A |
| CQT-006 |
|
Deed |
|
Owned coal |
|
N/A |
| PMC-075 |
|
Deed |
|
Owned coal and oil and gas |
|
N/A |
| SM-080 |
|
Deed |
|
Owned coal, oil and gas, surface, and timber |
|
N/A |
| SR-002 |
|
Deed |
|
Owned coal and surface |
|
N/A |
| SR-024 |
|
Deed |
|
Owned coal, oil and gas, surface, and timber |
|
N/A |
| SR-025 |
|
Deed for Purchase |
|
Owned coal and surface |
|
N/A |
SR-027 thru
SR-027-2 |
|
Deed |
|
Owned coal |
|
N/A |
| SR-029 |
|
Deed |
|
Owned coal, oil and gas, surface, and timber |
|
N/A |
| SR-037 |
|
Deed |
|
Owned coal and surface |
|
N/A |
| SR-039 |
|
General Warranty Deed |
|
Owned coal and surface |
|
N/A |
SR-042 thru
SR-042-1 |
|
Deed |
|
Owned coal |
|
N/A |
SR-050 thru
SR-050-8 |
|
Deed |
|
Owned coal |
|
N/A |
| SR-051 |
|
Deed |
|
Owned coal, oil and gas, surface, and timber |
|
N/A |
| SR-052 |
|
Deed |
|
Owned coal |
|
N/A |
| SR-056 |
|
Deed 1/3 UDI |
|
Owned coal (partial interest) |
|
N/A |
| SR-058 |
|
Deed |
|
Owned coal |
|
N/A |
| SR-061 |
|
Quitclaim Deed |
|
Owned coal and surface |
|
N/A |
| SR-062 |
|
Deed |
|
Owned coal |
|
N/A |
| SR-069 |
|
General Warranty Deed |
|
Owned coal and surface |
|
N/A |
| SR-080 |
|
Coal Deed |
|
Owned coal and surface |
|
N/A |
| SR-081 |
|
Coal Deed |
|
Owned coal and surface |
|
N/A |
| SR-082 |
|
Deed |
|
Owned coal and surface |
|
N/A |
| SR-086 |
|
Coal Deed |
|
Owned coal and surface |
|
N/A |
| SR-089 |
|
Quitclaim Deed |
|
Owned coal |
|
N/A |
| SR-095 |
|
General Warranty Deed |
|
Owned coal and surface |
|
N/A |
| SR-098 |
|
General Warranty Deed |
|
Owned coal, oil and gas, and surface |
|
N/A |
| SR-099 |
|
General Warranty Deed |
|
Owned coal, oil and gas, and surface |
|
N/A |
Weir Technical Report Summary
Leer Complex
Prepared for Core Natural Resources, Inc.
|
|
|
|
|
|
|
|
|
|
|
|
|
|
|
|
|
|
|
|
|
| Arch Land |
|
Document |
|
|
|
Expiration |
| File Number |
|
Type |
|
Seams |
|
Date (1) |
| SR-102 |
|
Coal Deed |
|
Owned coal and surface |
|
N/A |
| SR-103 |
|
General Warranty Deed |
|
Owned coal, oil and gas, and surface |
|
N/A |
| SR-104 |
|
Coal Deed |
|
Owned coal and surface |
|
N/A |
| SR-105 |
|
Coal Deed |
|
Owned coal and surface |
|
Exhaustion of mineable and merchantable coal |
| SR-107 |
|
Coal Deed |
|
Owned coal |
|
N/A |
| SR-108 |
|
Coal Deed |
|
Owned coal |
|
N/A |
| SR-110-1 |
|
Quitclaim Deed |
|
Owned coal, oil and gas, and surface |
|
N/A |
| SR-110-2 |
|
Quitclaim Deed |
|
Owned coal, oil and gas, and surface |
|
N/A |
| SR-112 |
|
General Warranty Deed |
|
Owned coal and surface |
|
N/A |
| SR-113 |
|
Special Warranty Deed |
|
Owned coal and surface |
|
N/A |
| SR-118 |
|
Quit Claim Deed 86.66% interest (out of TV-004) |
|
Partial coal ownership |
|
N/A |
| SR-119 |
|
General Warranty Deed |
|
Owned coal and surface |
|
N/A |
| SR-126 |
|
General Warranty Deed |
|
Owned coal and surface |
|
N/A |
| SR-128 |
|
Coal Deed |
|
Owned coal |
|
N/A |
| SR-164 |
|
Deed |
|
Owned coal and surface |
|
N/A |
| SR-169 |
|
Deed |
|
Owned coal |
|
N/A |
SR-170 thru
SR-170-3 |
|
Deed |
|
Owned coal |
|
N/A |
| SR-172 |
|
General Warranty Deed |
|
Owned coal and surface |
|
N/A |
| SR-176 |
|
Deed |
|
Owned coal and surface |
|
N/A |
| SR-177 |
|
Deed |
|
Owned coal and surface |
|
N/A |
| SR-179 |
|
Deed |
|
Owned coal and surface |
|
N/A |
| SR-179-1 |
|
Deed |
|
Owned coal and surface |
|
N/A |
| SR-190 |
|
General Warranty Deed |
|
Owned coal; subsidence rights |
|
N/A |
SR-194 thru
SR-194-5 |
|
Coal Lease |
|
Partial lease of coal |
|
Exhaustion of mineable and merchantable coal |
| SR-196 |
|
Coal Deed |
|
Owned coal; subsidence rights |
|
N/A |
SR-226 thru
SR-226-12 |
|
Deed |
|
Partial coal ownership |
|
N/A |
| SR-228 |
|
General Warranty Deed |
|
Owned coal |
|
N/A |
| SR-234 |
|
Quit Claim Deed |
|
Owned coal |
|
N/A |
| TV-004 |
|
Deed |
|
Owned coal, oil and gas, surface, and timber |
|
N/A |
|
|
|
|
|
|
|
| (1) Expiration dates on leases can be extended. |
|
|
|
|
|
|
Weir Technical Report Summary
Leer Complex
Prepared for Core Natural Resources, Inc.
3.5 SIGNIFICANT PROPERTY ENCUMBRANCES
Small, isolated uncontrolled properties, within all the LOM Plans will need to be acquired, by lease or purchase, to avoid the need to revise the mine plan. The tons associated with these uncontrolled properties have not been included in the reserve estimates but are listed in table 12.1.3 for informational purposes only.
Two property leases within the Leer Complex require a payment to be made based on transport of other coal (i.e. coal not mined within that lease) or refuse across the lease boundary (wheelage).
Acquisition of relatively small blocks of uncontrolled mineral resources is on-going by Core. Uncontrolled properties within a mine plan are not uncommon and are mitigated as needed or, in rare cases, the mine plans are adjusted to avoid the uncontrolled properties.
Approximately 150 acres (1.6 percent) of uncontrolled property exist within the Leer LOM Plan, approximately 685 acres (3.7 percent) of uncontrolled property exist within the Leer South LOM Plan, and approximately 965 acres (3.5 percent) of uncontrolled property exist within the Leer West LOM Plan.
WEIR is not aware of any obstacles to obtaining necessary property rights, and reasonably believes that the chances of obtaining such rights in a timely manner are highly likely. Given prior successes in Core’s property acquisition efforts, and relatively small tonnage impacts for unsuccessful reserve property acquisitions, this risk appears relatively low.
A list of Core’s permits is shown in Table 3.5-1, with a more detailed description of permits discussed in Section 17.3.
Weir Technical Report Summary
Leer Complex
Prepared for Core Natural Resources, Inc.
Table 3.5-1 Permit List
|
|
|
|
|
|
|
|
|
|
|
|
|
|
|
|
|
|
|
|
|
|
|
|
|
|
|
|
|
|
|
Permitted |
|
|
|
|
|
|
|
|
Surface |
|
|
|
|
|
|
|
|
Area |
|
Issue |
|
NPDES |
| Complex |
|
Permit Number |
|
(Acres) |
|
Date |
|
Permit No. |
| Leer |
|
U-2004-06 |
|
201.10 |
|
10/8/2025 |
|
WV1017764 |
|
|
O-2017-06 |
|
315.14 |
|
4/18/2022 |
|
WV1017764 |
|
|
O-2001-24 |
|
251.67 |
|
Pending |
|
|
|
|
|
|
767.91 |
|
|
|
|
|
|
|
|
|
|
|
|
|
| Leer South |
|
U-15-83 |
|
209.45 |
|
1/24/1983 |
|
WV0043273 |
|
|
O-113-83 |
|
461.73 |
|
8/11/1983 |
|
WV0043273 |
|
|
|
|
671.18 |
|
|
|
|
|
|
|
|
|
|
|
|
|
| Leer West |
|
U-2006-12 |
|
207.65 |
|
6/22/2022 |
|
WV1025783 |
|
|
O-2001-17 |
|
239.00 |
|
12/10/2019 |
|
WV1025783 |
|
|
|
|
446.65 |
|
|
|
|
A permit amendment will be required, by January 2028, for Permit O-2017-06 to add the Rocky Branch Impoundment. Permit approval is expected in first quarter 2026. In addition to the permitting actions, reclamation surety bonds, as discussed in Section 17, are in place in accordance with West Virginia state regulations.
3.6 SIGNIFICANT PROPERTY FACTORS AND RISKS
Given Core’s controlled interests within the Leer Complex, which relate to property that is held, by and large, by Core and private individuals, WEIR assesses there are no significant issues affecting access to the coal interests or the ability of Core to execute its LOM Plans.
3.7 ROYALTY INTEREST
Core holds no royalty or similar interest in property within the Leer Complex which is owned or operated by another party.
Weir Technical Report Summary
Leer Complex
Prepared for Core Natural Resources, Inc.
4.0 ACCESSIBILITY, CLIMATE, LOCAL RESOURCES, INFRASTRUCTURE, AND PHYSIOGRAPHY
4.1 TOPOGRAPHY, ELEVATION, AND VEGETATION
The Leer Complex is located on the Appalachian Plateau. The topography of the property consists of steep slopes, rising from the Tygart Valley River and its associated tributaries. The Tygart Valley River extends from Pocahontas County, West Virginia through Randolph, Barbour, Taylor, and Marion Counties.
The Leer property is located near the Three Fork Creek tributary of the Tygart Valley River near Grafton, West Virginia. The upper elevations consist of rolling terrain, with scattered knobs of higher elevation. The terrain drops off from the higher elevations, with steep slopes down to Three Fork Creek to the north, Tygart Lake to the west and south, and Little Sandy Creek to the southeast and east.
The Leer South property is located to the west of the Tygart River and northwest of the town of Philippi, West Virginia. The terrain drops from the higher elevations with steep slopes down to Foxgrape Run, Little Hackers Creek, Hackers Creek, and Shooks Run to the south. The drainages of Stewart Run, Spaw Lick and Brushy Fork are found to the southwest. Pleasant Creek, Simpson Creek, Camp Run, Stillhouse Run, Bartlett Run and Beards Run are located to the north.
The Leer West Property is located to the west of the Tygart Valley River, south of Pruntytown in Taylor County, West Virginia.
There are scattered areas of relatively flat lying pastureland along the river and stream floodplain terraces. Maximum relief of the property is approximately 900 feet, with elevations ranging from 1,004 feet on Three Fork Creek to 1,905 feet on an isolated knob between Stewart Run and the head of Simpson Creek. Topography and other features of the area are shown on Figure 7.5-1.
The Leer Complex consists mostly of unmanaged forestland and scattered pastureland. The forestland consists of typical West Virginia forest, with Oak/Hickory as the dominant forest-type group and a lesser percentage of the Maple/Beech/Birch forest-type group, (USDA Resource update FS-123).
Weir Technical Report Summary
Leer Complex
Prepared for Core Natural Resources, Inc.
4.2 PROPERTY ACCESS
The main road near Leer’s surface facilities is US Route 50, which runs east/west and is less than a mile north of the Leer facilities. The mine access road (Tygart Drive) is approximately two miles west of the small town of Thornton, West Virginia, and approximately three miles east of Grafton, West Virginia. The nearest larger towns are Morgantown, West Virginia, located approximately 25 miles to the north, and Bridgeport, West Virginia, located approximately 16 miles to the west of the property.
The main road near Leer South’s office and surface facilities is US Route 119, which runs north/south and is less than three miles north of the town of Philippi West Virginia. The nearest larger towns are Morgantown, West Virginia, located approximately 43 miles to the north, and Bridgeport, West Virginia, located approximately 26 miles to the south of the property. The distance between Leer and Leer South is approximately 15 miles via US Route 119.
The main road near Leer West is WV Route 38, south of the town of Pruntytown in Taylor County, West Virginia. The nearest larger towns are: Morgantown, West Virginia to the north (29 miles), the city of Clarksburg, West Virginia to the west, and Bridgeport, West Virginia (10.5 miles) to the west. The property can be accessed from Morgantown via WV Route 119 to WV Route 38 (Shelby Run Road) at the town of Webster. The property can be accessed from Bridgeport via WV Rt. 50 and Shelby Run Road and a new access road is planned to be constructed off of U.S. Route 250.
The Mountain Subdivision rail line, owned and operated by the CSX Railroad (CSX), passes directly by the mine surface facilities and has a separate rail loadout spur for Leer. There are dual main rail lines adjacent to the mine, which helps reduce rail line congestion. The Mountain Subdivision rail line extends from Cumberland, Maryland to Grafton, West Virginia. CSX also owns and operates a rail yard in Grafton, West Virginia.
Leer South transports coal to the CSX rail line via the Appalachian and Ohio Railroad (A&O). A&O operates 158 miles of shortline from Cowen, West Virginia to Grafton, West Virginia.
Weir Technical Report Summary
Leer Complex
Prepared for Core Natural Resources, Inc.
Leer West plans to transport coal to the CSX line via a rail spur that will be constructed prior to the opening of the mine.
The surrounding waterways are not navigable for commercial traffic.
The nearest airport is the North Central West Virginia Airport (CKB), which is located in Bridgeport, West Virginia. The North Central West Virginia Airport is 16 miles from Grafton, West Virginia. The Morgantown Municipal Airport (MGW) is located in Morgantown, West Virginia, 35 miles from the Leer Complex.
4.3 CLIMATE AND OPERATING SEASON
The climate associated with the Leer Complex is classified as humid continental, characterized by hot, humid summers and moderately cold winters. Climate conditions vary greatly in the state of West Virginia due to the influence of rugged topography. Average high temperatures range from 82 to 87 degrees Fahrenheit in the summer, with average low temperatures ranging from 15 to 25 degrees Fahrenheit in winter. Average yearly rainfall measured in Grafton, West Virginia is 48 inches per year. Leer and Leer South currently operate year-round, regardless of weather conditions.
4.4 INFRASTRUCTURE
Power
Electrical power for Leer and Leer South is provided by a FirstEnergy Corp. subsidiary, Mon Power, through a 138 kV transmission line.
Water
The Tygart Valley River lies to the west of the Leer Mine Property and to the east of the Leer West Property. Over one half of the water required for mine operations such as mine dust suppression and preparation plant is provided by recycling. The remainder is provided by a pump station installed beside Three Fork Creek, a tributary of the Tygart Valley River, and is pumped to a million-gallon head tank. There is no contract or monthly charge for the water from Three Fork Creek. Potable water for the facilities is obtained from the Taylor County Public Service District.
Weir Technical Report Summary
Leer Complex
Prepared for Core Natural Resources, Inc.
Water for Leer South is sourced from local streams and groundwater from an old abandoned mine. Additional water may be obtained from the toe of the refuse impoundment for use in the mine and plant.
Personnel
The northern West Virginia area surrounding Leer and Leer South has a long history of underground coal mining. Attracting mining personnel with qualified skills has not been an issue. Core currently employs between 425 to 500 personnel at both Leer and Leer South, which will continue over the LOM. The hourly labor force at both mines remains non-union and no change in this labor arrangement is anticipated. Leer West, once operating, is also projected to have approximately 425 to 500 personnel.
Supplies
Supplies for the mining operations are available from multiple vendors that service the coal industry in the NAPP Region. The main vendors utilized by Core to supply the Leer Complex include United Central Industrial Supply, Komatsu America Corp. (Joy Global), Jennmar Corporation, Strata Worldwide, Polydeck, Chemstream Inc., Richwood Industries, Inc., Conn-weld Industries, LLC, Coalfield Services Inc., Minova Global, Airtite Mine Products, LLC, Schauenburg Flexadux Corp., Contitech USA Inc., Greer Industries, Inc., and American Block Co., Inc.
Weir Technical Report Summary
Leer Complex
Prepared for Core Natural Resources, Inc.
5.0 HISTORY
5.1 PREVIOUS OPERATIONS
Prior to the development of Leer, there was very little mining that occurred on the property. A small underground coal mine operated by the Thornton Fire Brick Company was located in the Upper Freeport Seam to the southeast of Thornton, West Virginia. This mine was located off of Three Fork Creek and operated in the early 1900s. The Thornton Fire Brick Company also operated a surface mine or “clay pit” near Thornton, West Virginia, mining fireclay for brickmaking in the early 1900s. Available maps show an underground mine, of limited extent, in the Lower Kittanning Seam to the south of Leer on the east side of Frog Run. Available data shows this as Sterling Coal Company’s Cecil coal mine, with mining shown to have occurred in the early 1900s.
Prior to the development of the Leer South, there were several mines operating within the general area. Available maps show mines along the Tygart River near the Leer South property. Available data shows the Midland Coal and Coke No. 1 mine (1905), Bar-Jay Coal’s Morral No. 1 and No. 2 Mines (1957), Ketchum Coal Company’s Mine No. 1 (1964), Johnson Coal Company (1974), and Pittston Coal Group / Badger Coal Company No. 13 and No. 14 mines (1974, 1984).
5.2 PREVIOUS EXPLORATION AND DEVELOPMENT
Prior to Core’s control of the property in 2011, previous exploration included 153 continuous drillholes drilled in proximity to Leer, 289 drillholes in proximity to the Leer South, and 166 drillholes in proximity to Leer West. There are approximately an additional 457 drillholes within the Leer Complex boundary but not within the three main areas of interest. Prior exploration activity dates back to 1922, with a list of prior companies conducting exploration, number of core holes drilled, seam thickness range, laboratories utilized for quality analysis, and dates are listed in Table 5.2-1.
Weir Technical Report Summary
Leer Complex
Prepared for Core Natural Resources, Inc.
Table 5.2-1 Previous Exploration
|
|
|
|
|
|
|
|
|
|
|
|
|
|
|
|
|
|
|
|
|
| Company |
|
Drill Holes |
|
Quality Laboratory |
|
Year Drilled |
| Mohawk Smokeless Coal Company |
|
1 |
|
None |
|
Unknown |
| Koppers Company |
|
8 |
|
Unknown |
|
1922 |
| Simpson Creek Collieries |
|
1 |
|
None |
|
1955 |
| Badger Coal Company |
|
71 |
|
Badger Coal CO Lab |
|
1955-1978 |
| Island Creek Coal Company |
|
1 |
|
Island Creek Co. Lab |
|
1957 |
| Eastern Gas & Fuel Associates |
|
41 |
|
Eastern Associated Coal Corp. |
|
1960-1964 |
| Mountaineer Coal Company |
|
3 |
|
None |
|
1968 |
| Tygart West Inc./Hillman Coal Corp. |
|
6 |
|
Unknown |
|
1973-1974 |
| Tygart West Inc./Atlantic Richfield Co. |
|
4 |
|
Unknown |
|
1974 |
| Bethlehem Mines Corporation |
|
1 |
|
Bethlehem Mines Corp Chemlab |
|
1975 |
| Hillman Coal Company |
|
57 |
|
Unknown |
|
1970-1987 |
| Consol Energy, Inc. |
|
2 |
|
None |
|
1977-1978 |
| Republic Steel Corporation |
|
81 |
|
Commercial Testing and Engineering Co. |
|
1978-1982 |
| Petroleum Development Corp. |
|
1 |
|
None |
|
1979 |
| Eastern Associated Coal Corp. |
|
3 |
|
Eastern Associated Coal Corp. |
|
1982 |
| Tygart West Inc./Anaconda Minerals Co. |
|
29 |
|
Colorado School of Mines |
|
1982 |
| Kitt Energy Corporation |
|
10 |
|
None |
|
1983 |
| Anker Energy |
|
12 |
|
Unknown |
|
1986-2005 |
| Unkown |
|
1 |
|
None |
|
1993 |
| Ryanstone Coal Company |
|
3 |
|
Standard Labs, Inc. |
|
2002 |
| CDX Gas, LLC |
|
35 |
|
None |
|
2004-2008 |
| International Coal Group |
|
70 |
|
SGS |
|
2005-2009 |
| Patriot Coal |
|
1 |
|
None |
|
Unknown |
Weir Technical Report Summary
Leer Complex
Prepared for Core Natural Resources, Inc.
6.0 GEOLOGICAL SETTING, MINERALIZATION, AND DEPOSIT
6.1 REGIONAL, LOCAL, AND PROPERTY GEOLOGY
6.1.1 Regional Geology
The strata of the Tygart Valley River in Barbour, Harrison, Preston, and Taylor, West Virginia consists of Pennsylvanian Aged sedimentary strata of the Monongahela Group, the Conemaugh Group, and the Allegheny Formation (see Figure 6.3-1). The gently dipping, stratiform or layered strata consists of shale, sandstone, claystone, fireclay, and coal seams. At present, economic sedimentary deposits are limited to coal seams of the Tygart Valley River. Limited scale mining of fireclay occurred in several areas near Grafton, West Virginia during the early 1900s.
The Monongahela Group includes the Sewickley, Redstone, and Pittsburgh coal seams. The Pittsburgh Seam has been extensively surface and underground mined at higher elevations in the Tygart Valley River region. The Conemaugh Group coal seams include the Elk Lick, Harlem, Bakerstown, and Brush Creek. No known large-scale mining has taken place within the Conemaugh Group coal seams in the Tygart Valley River region. The Allegheny Formation includes the Upper Freeport, Lower Freeport, Upper Kittanning, Lower Kittanning, and Clarion coal seams. The Johnstown Limestone is situated between the Upper Kittanning and Lower Kittanning coal seams. The Upper Freeport, Upper Kittanning, Lower Kittanning, and Clarion seams have been previously mined in the Tygart Valley River region. All other coal seams of the Allegheny Formation in the area occur in limited areal extent and are generally of insufficient thickness for mining.
6.1.2 Local Geology
The Monongahela Group strata is not present on the Leer property due to the lower elevations of the property. However, it is present at Leer South and Leer West. The strata present on the Leer Complex consists of the Conemaugh Group and the Allegheny Formation. All coal seams of the Conemaugh Group are thin and discontinuous. The Upper Freeport, Lower Freeport, Upper Kittanning, and Clarion coal seams are discontinuous and of limited extent on the Leer Complex property.
Weir Technical Report Summary
Leer Complex
Prepared for Core Natural Resources, Inc.
6.1.3 Property Geology
The principal minable coal seam on the Leer Complex is the Lower Kittanning Seam, which both Leer and Leer South are actively mining. The Lower Kittanning Seam occurs in a larger area, with a higher seam thickness than all other listed seams. Leer South has also mined the Clarion Seam in the past and transports the mined Lower Kittanning Seam through the Clarion Seam to the preparation plant. The Lower Kittanning Seam reserve extends from Grafton, West Virginia south toward Phillippi, West Virginia. The Leer Complex reserve area is approximately 17 miles in length and approximately 18 miles wide.
The Lower Kittanning Seam consists primarily of a single horizon of coal with a bone coal parting, except in eastern areas of Leer where thick coal is mined due to a rider coal seam merging with the main bench. Drillholes show seam thickness ranging from 0.0 to 10.5 feet within the Leer Complex. The seam thins (< 3.0 feet) locally in pockets, to the south and east of the Leer LOM Plan and to the north and east of the northern extension of the Leer LOM Plan, as well as the western extent of both the Leer South and Leer West LOM Plans. The mineable coal seam is typically a low-ash, high thermal content, High Vol A bituminous metallurgical coal product. Parting does occur within the property and generally is between one and three feet thick. The parting does not affect the clean coal product since the coal is washed. The seam is generally continuous but is absent in areas outside the Leer Complex LOM Plans and in an area that was mined around in Leer.
6.2 MINERAL DEPOSIT TYPE AND GEOLOGICAL MODEL
The Leer Complex reserves are relatively flat lying, sedimentary deposit of Pennsylvanian Age. Leer and Leer South are actively mining a single coal seam, the Lower Kittanning. Leer West is projected to develop the Lower Kittanning Seam through longwall mining.
Exploration consists of core drilling for the Lower Kittanning Seam carried out each year in advance of mining, to refine the reserve boundary and to define limits of the mine plan. For internal purposes, Previously, reserves were modelled using the Geovia Minex® mine planning software package, completing model updates subsequent to each phase of exploration drilling. Core currently utilizes Carlson Software for geological modelling and AutoCAD for mine planning purposes. WEIR modeled the reserves and resources using Datamine MineScape® Stratmodel geological modeling software.
Weir Technical Report Summary
Leer Complex
Prepared for Core Natural Resources, Inc.
The WEIR model is discussed in more detail in Section 9.1.
6.3 STRATIGRAPHIC COLUMN AND CROSS SECTION
Figure 6.3-1 and Figure 6.3-2 show the stratigraphic column and the Lower Kittanning Seam cross section related to the Leer Complex.
Weir Technical Report Summary
Leer Complex
Prepared for Core Natural Resources, Inc.
Figure 6.3-1 Stratigraphic Column
Weir Technical Report Summary
Leer Complex
Prepared for Core Natural Resources, Inc.
Figure 6.3-2 Lower Kittanning Seam Cross Section SW to NE
Weir Technical Report Summary
Leer Complex
Prepared for Core Natural Resources, Inc.
7.0 EXPLORATION
7.1 NON-DRILLING EXPLORATION
Drilling has served as the primary form of exploration carried out at the Leer Complex. In addition, mine measurements are taken at intervals of between 100 and 300 feet throughout both Leer and Leer South. A total of 1,505 of these mine measurements were recorded. Core also provided details of 336 channel samples within Leer and Leer South. The channel samples are taken at an average interval of approximately 1,000 feet but can be as close as 100 feet in some areas. The channel samples are used in conjunction with the drillholes to model clean coal quality and therefore occur in congruence with the drill holes. The channel samples are subject to the same collection and testing procedures as surface drilling and are discussed in Section 7.2.
7.2 DRILLING
Historical exploration at the Leer Complex has relied exclusively upon continuous core drilling performed by competent contract drilling companies. Coreholes at the Leer Complex are typically 3.76-inch diameter (yielding 2.5-inch diameter core samples). Exploration drilling provides core samples of roof strata, the coal seam and floor strata. The geologist’s seam thickness measurements are checked against the geophysical logs for thickness accuracy and to confirm core recovery. A hole with significant lost core or crushed core can result in misleading data. Drillholes with core recovery of less than 80 percent are noted and subsequently reviewed and potentially excluded from geological and coal quality modeling.
WEIR did not exclude any holes for poor core recovery, as all of the holes within the project area obtained core recovery of at least 80 percent. Core’s standard procedures state that holes with less than 80 percent core recovery are re-drilled in the same boring, using a wedge above the seam, so that offset drilling of a new hole is not required. During core drilling, all core samples are boxed, photographed, and stored. Typically, 24 feet of roof and 8.0 feet of floor strata core samples are sent to laboratories for geotechnical strength tests. Coal seam core samples are sent to laboratories for quality analyses. Caliper, density, gamma, resistivity, and sonic downhole geophysical logs are completed as drill site and hole conditions allow. Each drillhole collar location is surveyed for accurate map coordinates and elevation data.
Weir Technical Report Summary
Leer Complex
Prepared for Core Natural Resources, Inc.
All original drillhole, survey, geological, geophysical, and quality data are scanned and stored on a Core server, which is backed up nightly, so it can be accessed by select Core personnel and quickly checked against the database, the geological model, or mine mappings. The original copies are stored in an offsite warehouse.
WEIR did not have direct involvement with the planning, implementation or supervision of Core’s drilling programs. However, having reviewed the details of each drilling program, WEIR finds the results to be consistent with industry standards and sufficient for use in the estimation of reserves and resources.
WEIR did not observe core samples in person, however, Core provided photos of core logs. In review of these photos, WEIR found the cores to be representative of the data reported for each drillhole.
7.3 HYDROGEOLOGY
The Leer Complex is situated in the northern part of the Tygart Valley River watershed within the Monongahela sub-basin, both being part of the greater Ohio Regional drainage basin. Drainages in the Leer permit area include several named and unnamed, ephemeral and perennial tributaries. Three Fork Creek flows westward along the current Leer permit boundary to its confluence with the Tygart Valley River at Grafton. To the south, Sandy Creek flows west along the Taylor-Barbour County border, draining into Tygart Lake to the southwest.
Principal aquifers within the Leer permit area include the Buffalo and Mahoning sandstones at middle and lower elevations. These Pennsylvanian Age sandstones are typically confined by the less permeable Pittsburgh redbed strata capping the surrounding hilltops (see Figure 6.3-2). The Tygart Valley River and regional groundwater flow direction is generally south to north, as water in the basin drains from the higher elevations in the Allegheny Mountain Province to the lower elevations of the Appalachian Plateau. Within the Leer permit area, the gradient dips gently to northwest, with head elevation of 1,200 feet.
Core has engaged in extensive surveying to characterize site hydrogeology and to determine groundwater inventories, water quality, and potential impacts to local usage as part of its Surface Mining Control and Reclamation Act (SMCRA) permitting process with the WVDEP.
Weir Technical Report Summary
Leer Complex
Prepared for Core Natural Resources, Inc.
Baseline flow and quality parameters for surface and groundwater inventory have been established and monitored as required by WVDEP since 2005.
Groundwater inventories, water quality data, water balance, recharge and seepage rates have been reviewed in the approved permit and current permit revisions, including hydrologic impact assessments outlining risks, monitoring program detail, and mitigation obligations. Core’s approach to obtaining and managing its surface and groundwater data for the Leer Complex has been demonstrated to be adequate and aligned with regulatory requirements and standard industry practices. WEIR finds no material barriers to the continued success of the Leer Complex regarding hydrologic impact or compliance.
The Leer South mining operation in the Lower Kittanning Seam is below surface drainage. In general, the hydrogeologic system for Leer South is similar to that of longwall mining in Leer to the north. As such, longwall mining in the Lower Kittanning Seam in Leer South is expected to involve stream undermining, undermining of aquifers, and mining through coalbed methane wells. In addition, longwall mining in Leer South will occur beneath previous above-drainage mining in the Pittsburgh coal seam; however, with an average interburden thickness of approximately 800 feet between the Lower Kittanning Seam and the Pittsburgh Seam, the potential for adverse interaction is not expected.
7.4 GEOTECHNICAL DATA
During core drilling, roof and floor strata of target coal seams are boxed, photographed and stored. Typically, three samples of roof and one sample of floor strata from each target seam are taken for strength testing where solid unbroken lengths of core exist. The samples are sent to the Appalachian Mining & Engineering laboratory in Lexington, Kentucky. Specific tests ran on core samples include Uniaxial Compressive Strength, Brazilian Indirect Tensile strength, Bulk Density, Specific Gravity, and Point Load index strength. Samples are prepared at the laboratory where the samples are machined into cylinders according to the appropriate ASTM specifications. Axial strain measurements are obtained using a hydraulic testing frame under a prescribed, constant load. Bulk density and specific gravity are determined by the weight, height, and diameter of the specimen used in the uniaxial strength test. Point load index strengths are obtained using a test frame with cones either perpendicular to, or parallel with, the specimen’s bedding plane.
Weir Technical Report Summary
Leer Complex
Prepared for Core Natural Resources, Inc.
In addition to core strength testing, downhole sonic logging is performed on drillhole sidewalls to estimate compressive strength for rock strata. Sonic logs are generated using a high frequency sonic transducer that produces high-resolution imagery and reports strata characteristics such as fractures, compaction degree, and bedding plane orientation. Where available, the sonic logs are correlated with uniaxial strength measurements made on specimens from the same drillhole to estimate compression strength of roof strata. Sonic logging is a commonly used geophysical technique that provides valuable, low-cost data for ground control design.
A sample of the geotechnical data used in a geotechnical study, Longwall Chain Pillar Design for ICG’s Tygart No. 1 Mine in the Lower Kittanning Seam (WVU Pillar Study), commissioned with West Virginia University by Core’s predecessor company that controlled the Leer Property is shown in Table 7.4-1 as follows:
Table 7.4-1 Geotechnical Sample Data
In addition to the WVU Pillar Study, Core commissioned M. Heib (Heib Study) in February 2018 to conduct geotechnical testing and analysis of core holes in the Leer and Sentinel (now Leer South) mines. The report provides information related to horizontal stresses by roof strata, horizontal strain, Brinell Hardness, fracture trend analysis, Poisson’s Ratio, uniaxial compressive strength, and Young’s Modulus.
Weir Technical Report Summary
Leer Complex
Prepared for Core Natural Resources, Inc.
A summary of the geotechnical data is shown in Table 7.4-2, as follows:
Table 7.4-2 Geotechnical Test Results
|
|
|
|
|
|
|
|
|
|
|
|
|
|
|
|
|
|
|
|
|
|
|
|
|
|
|
|
|
|
|
|
|
|
|
|
|
|
|
|
|
|
|
|
|
|
|
|
|
|
|
|
|
|
|
|
|
|
|
|
|
|
|
|
|
|
|
|
|
|
|
|
|
|
|
|
|
|
|
Youngs |
|
Poisson's |
|
Unconfined |
|
|
|
|
|
|
|
|
|
|
Principle Stress |
|
|
|
Modulus |
|
Ratio |
|
Compressive |
|
|
|
|
|
|
Depth |
|
Azimuth |
|
Major |
|
Minor |
|
|
|
E |
|
ν |
|
Strength |
| Hole |
|
Sample |
|
Included |
|
(feet) |
|
(degrees) |
|
(psi) |
|
(psi) |
|
Lithology |
|
(psi) |
|
|
|
(psi) |
| HT101-13 |
|
UC-22 |
|
Yes |
|
834.2 |
|
53 |
|
1,362 |
|
730 |
|
Shale |
|
2.05E+06 |
|
0.17 |
|
3,714 |
| HT101-13 |
|
UC-21 |
|
No |
|
N/A |
|
120 |
|
— |
|
— |
|
Sandy Shale |
|
3.43E+06 |
|
0.01 |
|
6,755 |
| HT101-13 |
|
UC-25 |
|
Yes |
|
1008.3 |
|
83 |
|
2,873 |
|
1,712 |
|
Shale; fossils |
|
5.56E+06 |
|
0.23 |
|
2,867 |
| HT101-13 |
|
UC-32 |
|
No |
|
N/A |
|
53 |
|
— |
|
— |
|
Shale |
|
6.32E+06 |
|
0.57 |
|
10,426 |
| HT106-13 |
|
UC-30 |
|
Yes |
|
422.7 |
|
118 |
|
815 |
|
413 |
|
Shale |
|
2.49E+06 |
|
0.14 |
|
12,746 |
| HT106-13 |
|
UC-37 |
|
Yes |
|
436.6 |
|
73 |
|
1,555 |
|
806 |
|
Sandy Shale |
|
2.96E+06 |
|
0.17 |
|
10,266 |
| HT106-13 |
|
UC-34 |
|
Yes |
|
498.6 |
|
107 |
|
1,330 |
|
693 |
|
Sandstone w/ shale streaks |
|
2.64E+06 |
|
0.14 |
|
11,220 |
| HT117-13 |
|
UC-24 |
|
Yes |
|
359.8 |
|
35 |
|
385 |
|
155 |
|
Shale |
|
5.55E+06 |
|
0.07 |
|
5,301 |
| HT117-13 |
|
UC-23 |
|
No |
|
N/A |
|
32 |
|
— |
|
— |
|
Shale |
|
6.48E+06 |
|
0.46 |
|
8,515 |
| HT117-13 |
|
UC-36 |
|
Yes |
|
422.7 |
|
70 |
|
2,719 |
|
1,618 |
|
Sandy Shale |
|
8.18E+06 |
|
0.27 |
|
6,717 |
| PD62-15 |
|
UC-29 |
|
No |
|
N/A |
|
155 |
|
— |
|
— |
|
Shale |
|
3.35E+06 |
|
0.26 |
|
4,131 |
| RM1602 |
|
UC-27 |
|
No |
|
N/A |
|
61 |
|
— |
|
— |
|
Shale |
|
4.51E+06 |
|
0.24 |
|
7,924 |
| RM1602 |
|
UC-26 |
|
No |
|
N/A |
|
65 |
|
— |
|
— |
|
Gray Sandstone |
|
4.46E+07 |
|
0.03 |
|
10,388 |
|
|
|
|
|
|
Average |
|
78.8 |
|
1,577 |
|
875 |
|
|
|
|
|
|
|
|
The results of the WVU Study and Heib Study have been incorporated by Core into the mine designs for both Leer and Leer South as further described in Section 13.1.1 of this TRS.
Since 2011, Core has drilled approximately 266 core holes in the Lower Kittanning Seam in the Leer Complex. All drillholes were cored, with core samples sent to Standard Labs for quality analyses. The thickness of the Lower Kittanning Seam identified in these drillholes ranged from 0.00 to 10.5 feet.
7.5 SITE MAP AND DRILLHOLE LOCATIONS
A map showing the location of all drillholes within the Leer Complex is shown on Figure 7.5-1.
Weir Technical Report Summary
Leer Complex
Prepared for Core Natural Resources, Inc.
Figure 7.5-1 Drillhole Collar Locations
Weir Technical Report Summary
Leer Complex
Prepared for Core Natural Resources, Inc.
7.6 DRILLING DATA
Core generally uses Hamon Core Drilling, Inc. located in Craigsville, West Virginia to drill core holes. Downhole geophysical logging is performed by MM&A, located in Bluefield, Virginia. Coal quality analyses are currently performed by Standard Laboratories, Inc. (Standard Labs) located in Belington, West Virginia.
Weir Technical Report Summary
Leer Complex
Prepared for Core Natural Resources, Inc.
8.0 SAMPLE PREPARATION, ANALYSES, AND SECURITY
8.1 SAMPLE PREPARATION METHODS AND QUALITY CONTROL
Relative to the drilling conducted by Core, once the target coal seam has been drilled, the coal core is pushed from the core barrel into a plastic lined wooden core box. The coal seam is measured initially by the driller, then later described by the geologist. The coal sample is then covered in plastic and the wooden box sealed. Cardboard dividers and foam tubing are used to tightly pack and cushion the coal sample within the wooden box. The coal core boxes are transported to the Core core shed at Tucker Run where the core boxes are locked in a secure building. The geologist’s seam thickness measurements are checked against the geophysical logs for thickness accuracy and to confirm core recovery. Typically within two weeks of completion of the core hole, the coal samples are removed from the wooden core boxes and placed in sealed plastic bags and shipped to the lab. The samples are coded and labeled with sample identification numbers based on drillhole id (e.g. DT2001), sample sequence (A, B, C, etc.), and sample number, (1, 2, 3 etc.). For example, DT2001A1 is the first sample from the first seam in drillhole DT2001.
Once satisfied the data reports are accurate, the quality analyses are entered into the Core coal database. Upon data entry completion, the modeling geologists export the data and inspect the data for variance from expected norms. If any data shows outside the norm for the property, the data is checked against laboratory results to ensure proper data entry. Quality data is then gridded and mapped. Any anomalies in the data mapping are investigated. If anomalies are accurate, those items are brought to the attention of the mine engineers and sales staff.
8.2 LABORATORY SAMPLE PREPARATION, ASSAYING, AND ANALYTICAL PROCEDURES
8.2.1 Standard Laboratories, Inc.
Once quality samples are bagged and labeled, the samples are delivered to an independent laboratory, Standard Labs, located in Belington, West Virginia for quality analyses. The samples are first prepared by crushing, splitting, and sizing. The analyses performed include Proximate, Washability, Ash Fusion, Ultimate, Ash Mineral, Dilatometer, Plastometer, Trace Elements, and Petrographics.
Weir Technical Report Summary
Leer Complex
Prepared for Core Natural Resources, Inc.
Standard Labs is certified via ANSI National Accreditation Board to the ISO/IEC 17025:2017 and located at 1196 Whitman Run Road, Belington, West Virginia 26250.
8.2.2 SGS North America, Inc.
Standard Labs ships splits of the samples to another independent laboratory, SGS North America, Inc. Mineral Services Division (SGS), located in Sophia, West Virginia for petrographic analyses. Petrographic analysis provides a clear understanding of the characteristics of the coal blend and is necessary to evaluate how coking operations will impact the final product.
SGS is certified via ISO/IEC 17025:2017 by A2LA and located at 151 Eastern Drive, Sophia, West Virginia 25921.
8.3 QUALITY CONTROL PROCEDURES AND QUALITY ASSURANCE
Quality control procedures followed by Core geologists are clearly defined. Core’s field geologists take specified steps to protect sample integrity and to ensure core samples are always under Core geologist’s control. These steps include the following:
•Field geologist visits drill site every day whenever drilling is occurring
•Geologist’s log to be created for each drillhole
•Rock-quality designation (RQD) logs to be prepared for roof and floor strata for all underground mineable seams
•Each drillhole to be logged using geophysical methods
•Underground mineable seams are sonic logged if drillhole conditions allow
•Geologist to compare field geologist’s logs to the e-log data
•Geologist to compare the core samples against both field geologist’s logs and e-logs to confirm coal thickness
•All immediate roof, coal and immediate floor core are to be boxed and photographed
•Quality sample sheets to be filled out, provided to a supervisor for approval and shipped to the laboratory
•Once core samples have been analyzed, field geologists scrutinize the resulting quality data for accuracy
Weir Technical Report Summary
Leer Complex
Prepared for Core Natural Resources, Inc.
•Based on the homogeneity of the deposit and the consistent quality of the reserve area as evidenced from the product produced from this active mine, analytical laboratories are instructed to divide the samples and retain the second split for additional analysis should the original test report any anomalies.
8.4 SAMPLE PREPARATION, SECURITY, AND ANALYTICAL PROCEDURES ADEQUACY
Core’s procedures for quality analyses provide a full range of coal quality analyses so engineers and sales staff working with the data have a complete listing of the coal seam quality for each drillhole completed by Core.
Drillhole core samples are assigned a sample ID number and a sample label is created. The label includes drillhole ID, sample ID number, and the to and from depths of the sample. The sample is then placed in a bag with the label and sealed using zip ties or tape. This is the beginning of the chain of custody. The samples do not leave the geologist’s possession once removed from the core barrel. The samples remain with the geologist or are stored in a locked facility that only Core geologists have access to, until delivery of the samples to the contracted laboratory. The delivery of the samples is carried out within two weeks of drillhole completion. Once in possession of the certified laboratory, the laboratory’s security procedures are followed. After the sample has been tested, reviewed, and accepted, the disposal of the sample is done in accordance with local state and EPA approved methods.
WEIR has determined the sample preparation, security, and analysis procedures used for the Leer Complex drillhole samples meet current coal industry standards and practices for quality testing. The laboratory results are also determined to be suitable to use for geological modeling, mineral resource estimation and economic evaluation.
Weir Technical Report Summary
Leer Complex
Prepared for Core Natural Resources, Inc.
9.0 DATA VERIFICATION
9.1 DATA VERIFICATION PROCEDURES
Core provided WEIR copies of all drilling records in the Leer Complex, which included Excel spreadsheets, driller’s log, field geologist’s logs, quality results sheets (from the coal quality laboratories), mine measurement tables, as well as drawing files or PDFs of the e-logs. Each hole in the database was individually checked by WEIR against a copy of the driller’s and/or geologist’s log to confirm data accuracy.
Geological reviews performed by WEIR included:
•Drillhole lithology database comparison to geophysical logs
•Drillhole coal quality database comparison to quality certificates
•Channel sample coal quality database comparison to quality certificates
After completing the precursory verifications and validations described above, the drillhole data was loaded into Datamine’s MineScape® Stratmodel, a geological modeling package. MineScape provides robust error checking features during the initial data load, which include confirmations of seam continuity, total depth versus hole header file data, interval overlap, and quality sample continuity with coal seams. Once the drillhole data was loaded, a stratigraphic model was created.
Several further verifications were then possible, which include:
•Creating cross sections through the model to visually inspect if anomalies occur due to miscorrelation of seams
•Creating structural and quality contour plots to visually check for other anomalies due to faulty seam elevations or quality data entry mistakes in the drillhole database
Typical errors which may impact reserve and resource estimation relate to discrepancies in original data entry. These errors may include:
•Incorrect drillhole coordinates (including elevation)
•Mislabeled drillhole lithology
•Unnoticed erroneous quality analyses where duplicate analyses were not requested
•Unrecorded drillhole core loss
Weir Technical Report Summary
Leer Complex
Prepared for Core Natural Resources, Inc.
WEIR conducted a detailed independent geological evaluation of data provided by Core designed to identify and correct errors of the nature listed above. Where errors are identified and cannot be successfully resolved, it is WEIR’s policy to exclude that data from the geological model. Based on its geological evaluation of data provided, WEIR did not exclude any holes within the Leer Complex.
9.2 DATA VERIFICATION LIMITATIONS
WEIR did not conduct an independent verification of property control surveys, nor has it independently surveyed the mining locations. Rather, WEIR has relied on information compiled from maps and summaries of the owned and leased property control prepared by Core. WEIR did not conduct a legal title investigation related to Core’s mineral and surface rights.
9.3 ADEQUACY OF DATA
It is WEIR’s opinion that the adequacy of sample preparation, security, and analytical procedures for drillholes that were drilled by Core after acquiring the property is acceptable and that these methods meet typical industry standards. Core employs detailed process and procedures, described in Section 8.4 of this TRS, that are followed each time a core hole is to be sampled. The Core geologist’s logs for these holes contain sampling descriptions and lithologic descriptions that are sufficiently detailed to ascertain that an experienced geologist supervised the drilling and sampling. Core coal quality analyses were performed to ASTM standards by qualified laboratories, as detailed in Section 8.0 of this TRS.
The adequacy of sample preparation, security, and analytical procedures are generally unknown for drillholes that were drilled prior to Core acquiring the property in 2011. However, the geologist’s logs for these holes contain sampling descriptions and lithologic descriptions that are sufficiently detailed to ascertain that an experienced geologist supervised the drilling and sampling. It is unknown if coal quality analyses were performed to ASTM standards by qualified laboratories, as detailed in Section 8.0 of this TRS, however, this legacy drillhole information was included as the samples matched the coal seam intervals and reported similar quality data. Model verifications further support WEIR’s high level of confidence that a representative, valid, and accurate drillhole database and geological model has been generated for the Leer Complex that can be relied upon to accurately estimate coal resources and reserves.
Weir Technical Report Summary
Leer Complex
Prepared for Core Natural Resources, Inc.
Weir Technical Report Summary
Leer Complex
Prepared for Core Natural Resources, Inc.
10.0 MINERAL PROCESSING AND METALLURGICAL TESTING
10.1 MINERAL PROCESSING TESTING AND ANALYTICAL PROCEDURES
Daily sampling is performed for plant feed and all stacking points prior to shipping clean coal products. The analyses performed include moisture, ash, sulfur, and Btu/lb on both an as-received and dry basis. These results help ensure both proper plant operation and coal product classification. Coal tonnages for raw and post-processed products are estimated using standard belt scales, which are calibrated monthly against the end of month survey data summary reports.
Efficiency testing is performed on all critical preparation plant circuitry on a bi-monthly basis to help ensure proper coal and non-coal separations are occurring throughout the plant operation. This performance testing is extensive and involves measuring flow rates, pressures, moistures, reagent application rates, size fractions, specific gravities, and coal qualities at specific processing points, from raw feed all the way through products and tailings.
10.2 MINERALIZATION SAMPLE REPRESENTATION
Coal deposits originate in flat, low-lying ground within deltas, alluvial plains, and coastal systems, and as such are a relatively homogeneous, sedimentary mineral occurrence. The deposit within the Leer Complex area exhibits homogeneous characteristics and does not show any substantial variations in mineralization types or styles that would affect processing of the coal. Sample data are well representative of the deposit as a whole. Sampling, testing procedures and the labs that perform the analyis are discussed in Section 8.
10.3 RELEVANT RESULTS AND PROCESSING FACTORS
Coal recovery and resulting product quality are primary concerns for any coal preparation plant. A coal preparation plant’s recovery and resulting product quality are dependent on ROM coal quality and the efficiency at which raw ash may be removed by the preparation plant process. Tracking and adjusting throughput rates for different plant circuitry based on ROM coal feed quality is critical to plant efficiency and product quality.
Weir Technical Report Summary
Leer Complex
Prepared for Core Natural Resources, Inc.
While variable, preparation plant recovery is projected based on modeled OSD based on well-defined seam structural grids. Projected preparation plant recovery reflects modeled changes in the ratio between mining height and coal seam height. Product qualities are expected to track closely with the modeled recovery from raw coal analysis, once adjusted for OSD material to be mined by the continuous miners and longwall.
Historical preparation plant performance from 2024 through September 2025, based on 27.6 million preparation plant feed tons, processed 10.9 million clean tons, with a resulting yield of 46.6 percent. Projected LOM Plan preparation plant recovery is estimated to range from 30.2 to 55.5 percent, averaging 40 percent over the Leer Complex LOM Plan.
10.4 DATA ADEQUACY
Core employs testing and analytical procedures in accordance with industry standards, which result in efficient preparation plant operations and provides the necessary quality control to meet product quality and quantity projections. The testing performed is sufficient to support the projected preparation plant yield and saleable product quality for the LOM Plan.
Weir Technical Report Summary
Leer Complex
Prepared for Core Natural Resources, Inc.
11.0 MINERAL RESOURCE ESTIMATES
The coal resources, as of December 31, 2025, summarized below are reported as in-place resources and are inclusive of reported coal reserve tons (see Section 12.0 for reserve tonnage estimates). There are no resources reported exclusive of reserve tons. Resources are reported in categories of Measured, Indicated, and Inferred tonnage and in accordance with Regulation S-K Item 1302(d).
11.1 KEY ASSUMPTIONS, PARAMETERS, AND METHODS
Data Sources
Planimetric data was provided by Core in AutoCAD format and primarily included base map information such as rivers, drainages, roads, mine features, and property boundaries.
The drillhole data provided to WEIR by Core included lithology, coal quality and survey data, and was provided in different formats including Excel, ASCII files, and PDFs. Geophysical logs, coal quality certificates, driller’s logs, geologist’s logs, downhole deviation data, and drillhole survey records were provided as scanned PDF files and AutoCAD drawing files. Data was provided for 1,330 drillholes, all of which are included in the structural model.
In-mine seam thickness and floor measurement at the Leer Complex, were provided in tabular file format. These mine measurements included 1,505 data points. In-mine coal thickness data points were generally measured every 100 to 300 feet in the mined-out areas. Mine measurement data points were used to model thickness and structure but were not used as points of observations in estimating resource confidence.
Coal quality data for 625 drillholes was provided for the Leer Complex and all were used in the quality model. Data was provided in Excel format along with quality certificates in PDF format. Reasons for excluding drillhole quality samples in the modeling process included:
•Poor core recovery noted in the driller’s logs.
•Quality logs that could not be matched to a drillhole.
•The qualities listed for the hole were not relevant to the model (for example raw Btu/lb. or sulfur were supplied, but not final product Btu/lb. or sulfur). The only relevant
Weir Technical Report Summary
Leer Complex
Prepared for Core Natural Resources, Inc.
raw values used are specific gravity and raw ash. Both are derivable from one another and have bearing on estimated in-place tons.
Geological Model
The Leer Complex geological model was constructed by using seam surface grids that were created in Datamine’s MineScape® Stratmodel (MineScape) geological modeling package.
Topography data was gridded using MineScape software and a grid cell size of 50 feet by 50 feet. Topographic contours from the USGS were provided by Core, in CAD format, in 20-foot intervals. The contours were provided in the NAD27, West Virginia North State Plane coordinate system (FIPS 4701). The gridded USGS topography contours were compared to drillhole collars, and showed that there are differences between the two sets of elevation data. On average, the drillhole collars are less than five feet above or below the USGS topography grid, with the maximum difference of 98 feet. These differences are not uncommon when comparing a national data set to localized collar elevations. For this reason, WEIR has not excluded any of the holes that have a large difference.
The Lower Kittanning Seam does outcrop near the Tygart River in the north central area within the Leer Complex.
The seam surfaces and thicknesses were created by loading the drilling and mine measurement data into MineScape and gridding the seam intercepts using a grid cell size of 50 feet by 50 feet. The parameters used to create the model are defined in the MineScape modeling schema, which is a specification of modeling rules that is created for the site. The MineScape interpolators that were used in this study are common in most mine planning software packages. The Planar interpolator is a triangulation method with extrapolation enabled. The Height interpolator is a variant on the trend surface and inverse distance interpolators. The data points are weighted, thus producing a different plane at each sample point. By using a weighting curve that is infinite at zero distance, data honoring can be assured. Due to the least squares fit, the effect of data clustering is minimized. A trend surface is used in MineScape to promote conformability for the modeled seams to regional structures such as synclines, anticlines, or seam dip. MineScape caters to using different interpolators for thickness, roofs and floors (surfaces), and the selected trend surface as they are all modeled separately. The interpolator used for each of these items is selected on the basis of appropriateness to the data sets involved, as well as modeling experience. Stratigraphic Model Interpolators are shown in Table 11.1-1 as follows:
Weir Technical Report Summary
Leer Complex
Prepared for Core Natural Resources, Inc.
Table 11.1-1 Stratigraphic Model Interpolators
|
|
|
|
|
|
|
|
|
|
|
|
|
|
|
| Interpolator |
|
Parameter |
|
Power/Order |
| Planar |
|
Thickness |
|
0 |
| Height |
|
Surface |
|
4 |
| Planar |
|
Trend |
|
0 |
The Lower Kittanning coal seam was the only one modeled for this TRS. Core controls several other seams above and below the Lower Kittanning Seam that were loaded into the geological model, however, resources were not estimated for these additional seams.
A summary of drilling statistics for the Lower Kittanning Seam is shown in Table 11.1-2.
Table 11.1-2 Drillhole Statistics
|
|
|
|
|
|
|
|
|
|
|
|
|
|
|
|
|
|
|
|
|
|
|
|
|
|
|
|
|
|
|
|
|
|
|
|
|
|
|
|
|
|
|
|
|
|
|
|
|
|
|
|
|
|
|
|
|
Average |
|
Minimum |
|
Maximum |
|
Standard |
|
|
In Mine |
|
Number of |
|
Thickness |
|
Hole |
|
Thickness |
|
Hole |
|
Thickness |
|
Deviation |
| Seam |
|
Plan |
|
Intercepts |
|
(Feet) |
|
Name |
|
(Feet) |
|
Name |
|
(Feet) |
|
(Feet) |
| Lower Kitanning |
|
Yes |
|
1,779 |
|
5.61 |
|
LR1907 |
|
0.00 |
|
MML1814 |
|
10.50 |
|
1.16 |
The gridded structure surfaces and coal seam thicknesses were validated against drillhole information to ensure that the data was properly modeled. Inconsistencies between modeled seam surfaces and surrounding drillholes were investigated and any confirmed errors in the drillhole data or model parameters were corrected. This process was repeated until a final version of the model was developed.
Coal Quality Model
The drillhole and channel sample quality data described previously in this report were used to create a washed coal quality model that included raw ash and raw relative density. The washed quality model values were based on a specific gravity of 1.50.
The drillholes were verified to ensure that the seam depths used in the lithology file matched the sample depths in the quality file. Twenty-five holes were found to have a fully sampled interval that included the Lower Kittanning Rider Seam, parting, and the Lower Kittanning Seam.
Weir Technical Report Summary
Leer Complex
Prepared for Core Natural Resources, Inc.
In each of these 25 holes, the samples were composited and added to the quality model since the combined thickness of the three plies was less than the maximum mining height.
Coal quality samples were loaded into MineScape and composited against the drillhole thicknesses. The composited values were then gridded using a grid cell size of 50 feet by 50 feet and the inverse distance weighted (squared) interpolator. The following quality data was modeled for the Lower Kittanning Seam:
•Raw
Ash, Dry, weight percent
Relative Density
•Float @ 1.50 Specific Gravity
Ash, Dry, weight percent
Calorific Value, Dry, Btu/lb
Total Sulfur, Dry, weight percent
Volatile Matter, Dry, weight percent
Audibert-Arnu Maximum Dilation (ARNU), Dry, percent
Gieseler Maximum Fluidity, Dry, DDPM
Hargrove Grindability Index, Dry
Yield, weight percent
Quality contours were generated from the grids to check outlier values. Maps showing average washed coal quality at a 1.50 float specific gravity are shown below on Figures 11-1.1 through 11.1-3.
Weir Technical Report Summary
Leer Complex
Prepared for Core Natural Resources, Inc.
Figure 11.1-1 Washed Ash at 1.5 S.G., Dry Basis
Weir Technical Report Summary
Leer Complex
Prepared for Core Natural Resources, Inc.
Figure 11.1-2 Washed Sulfur at 1.5 S.G., Dry Basis
Weir Technical Report Summary
Leer Complex
Prepared for Core Natural Resources, Inc.
Figure 11.1-3 Volatile Matter at 1.5 S.G., Dry Basis
Weir Technical Report Summary
Leer Complex
Prepared for Core Natural Resources, Inc.
Figure 11.1-4 Lower Kittanning Seam Thickness
Weir Technical Report Summary
Leer Complex
Prepared for Core Natural Resources, Inc.
Additional Resource Criteria and Parameters
Based on WEIR’s review and evaluation of the data and plans relative to the Leer Complex, resource estimation criteria were applied to ensure reported mineral resource tonnage has a reasonable prospect for economic extraction. Resource criteria and parameters for the Leer Complex are as follows:
•Resources were estimated as of December 31, 2025.
•Coal density is based on specific gravity data from drillholes and channel samples, where available or raw coal ash (dry basis) using the formula [1.25+(Ash/100)] x 62.4 pounds per cubic foot.
•Core provided the average Shipped Moisture for each Mine and this was used to convert Dry tons to As Received/As Shipped.
•Areas where coal thickness did not meet a minimum thickness of 3.0 feet were excluded from the resource estimate.
•Areas within 200 feet of old mine workings were excluded from resource estimates.
•Areas with less than 200 feet of cover were excluded from resource estimates.
•Tonnages associated with uncontrolled areas within the inclusive resource areas are excluded in resource estimates.
•Areas not considered feasibly accessible because of geometry and location in relation to previous mine workings were excluded from resource estimates.
•Areas that are currently covered by refuse, or planned refuse, were excluded from the resource estimate.
11.2 ESTIMATES OF MINERAL RESOURCES
The Mineral Resources, as of December 31, 2025, are reported as in-place resources and are inclusive of reported coal reserve tons (see Section 12.0). There are no areas of Mineral Resources that are exclusive of Mineral Reserves within the Leer Complex. Resources are reported based on the coal resource estimate methodology described and are summarized in Table 11.2-1 as follows:
Weir Technical Report Summary
Leer Complex
Prepared for Core Natural Resources, Inc.
Table 11.2-1 In-Place Coal Resource Tonnage and Quality Estimate as of December 31, 2025
|
|
|
|
|
|
|
|
|
|
|
|
|
|
|
|
|
|
|
|
|
|
|
|
|
|
|
|
|
|
|
|
|
|
|
|
|
|
|
|
|
|
|
|
|
|
|
|
|
|
|
|
|
|
|
|
|
|
|
|
|
|
|
|
|
|
|
|
|
|
|
|
|
|
|
Coal Quality |
|
|
|
|
|
|
|
|
|
|
|
|
|
|
|
|
|
|
(As Received) |
|
|
|
|
|
|
|
|
Average Coal |
|
In-Place Tons (000) |
|
Raw |
| Mine |
|
|
|
|
|
Area |
|
Thickness |
|
Resources (As Received) |
|
Ash |
| Area |
|
|
|
Seam |
|
(Acres) |
|
(Feet) |
|
Measured |
|
Indicated |
|
Total |
|
Inferred |
|
(%) |
| Leer |
|
Inclusive of Reserves |
|
Lower Kittanning |
|
5,730 |
|
4.7 |
|
46,000 |
|
8,400 |
|
54,400 |
|
— |
|
24.7 |
| Leer South |
|
Inclusive of Reserves |
|
Lower Kittanning |
|
9,850 |
|
4.8 |
|
80,200 |
|
19,300 |
|
99,500 |
|
— |
|
19.5 |
| Leer West |
|
Inclusive of Reserves |
|
Lower Kittanning |
|
15,600 |
|
4.7 |
|
128,000 |
|
26,500 |
|
154,500 |
|
— |
|
22.7 |
|
|
|
|
|
|
31,180 |
|
4.8 |
|
254,200 |
|
54,200 |
|
308,400 |
|
|
|
22.0 |
Notes:
•All Mineral Resources reported above meet the threshold for reserve modifying factors, such as estimated economic viability, that allow for conversion to Mineral Reserves.
•Resources stated as contained within a potentially economically mineable underground mine assuming a 3.0 feet minimum seam thickness, a High Vol A coal product and middling coal product realizing an average sales price of $122.00 per ton FOB Mine, with an operating cost of $71.67 per ton.
•Numbers in the table have been rounded to reflect the accuracy of the estimate and may not sum due to rounding
11.3 TECHNICAL AND ECONOMIC FACTORS FOR DETERMINING PROSPECTS OF ECONOMIC EXTRACTION
A PFS was conducted to assess the prospects for economic extraction of coal within the Leer Complex.
The Free on Board (FOB) Mine coal sales price used in assessing the economic mineability of the Leer Complex is based on sales of primarily High Vol A metallurgical coal product and minor amount (15 percent) of high ash middling coal (thermal). This averaged $125.32 in 2024 and $93.81 per ton from January to September 2025 and is projected to average $122.00 per ton over the Leer Complex LOM Plan. The overall coal sales price is based on a High Vol A benchmark of $176.96 per metric tonne. Once converted to short tons, adjusted for transportation and the inclusion of middling coal sales, the estimated LOM Plan FOB Mine coal sales price is $122.00 per ton.
The sales price is further supported in Section 16.0 of this report.
Capital expenditures are discussed in further detail in Section 18.1 of this TRS and are projected to average $10.89 per ton over the Leer LOM Plan compared to actual capital expenditures of $7.79 per ton for the period January through September 2025.
Weir Technical Report Summary
Leer Complex
Prepared for Core Natural Resources, Inc.
Operating costs are discussed in further detail in Section 18.2 of this TRS and are projected to average $71.67 per ton over the Leer LOM Plan compared to actual operating cost that averaged $80.28 per ton from January through September 2025.
Total projected capital expenditures and operating cost of $82.56 per ton and the coal sales price of $122.00 per ton, provide a reasonable basis for WEIR to determine that all coal of thickness greater than 3.0 feet has prospects of economic extraction within Leer, Leer South, and Leer West.
WEIR estimated a breakeven NPV would result from the LOM Plans with an average coal thickness of 3.09 feet. Therefore, a minimum coal thickness cutoff of 3.0 feet would ensure that the Leer Complex LOM Plans average coal thickness would be greater than 3.0 feet, resulting in likely prospects for economic extraction. Relatively small areas within the LOM Plan have coal that may be thinner than the 3.0 feet cutoff and are evaluated on a case-by-case basis to determine if they are deemed to have prospects of economic extraction based on the economic benefit from mining these less than 3.0 feet areas to access and recover areas with higher coal thickness.
11.4 MINERAL RESOURCE CLASSIFICATION
Mineral Resource estimates prepared for the Leer Complex are based on the Regulation S-K 1300 Item 1302(d), which established definitions and guidance for mineral resources, mineral reserves, and mining studies used in the United States. The definition standards relative to resources are as follows:
Mineral Resource:
Mineral resource is a concentration or occurrence of material of economic interest in or on the Earth's crust in such form, grade or quality, and quantity that there are reasonable prospects for economic extraction. A mineral resource is a reasonable estimate of mineralization, taking into account relevant factors such as cut-off grade, likely mining dimensions, location or continuity, that, with the assumed and justifiable technical and economic conditions, is likely to, in whole or in part, become economically extractable. It is not merely an inventory of all mineralization drilled or sampled.
Weir Technical Report Summary
Leer Complex
Prepared for Core Natural Resources, Inc.
•Inferred mineral resource is that part of a mineral resource for which quantity and grade or quality are estimated on the basis of limited geological evidence and sampling. The level of geological uncertainty associated with an inferred mineral resource is too high to apply relevant technical and economic factors likely to influence the prospects of economic extraction in a manner useful for evaluation of economic viability. Because an inferred mineral resource has the lowest level of geological confidence of all mineral resources, which prevents the application of the modifying factors in a manner useful for evaluation of economic viability, an inferred mineral resource may not be considered when assessing the economic viability of a mining project, and may not be converted to a mineral reserve.
•Indicated mineral resource is that part of a mineral resource for which quantity and grade or quality are estimated on the basis of adequate geological evidence and sampling. The level of geological certainty associated with an indicated mineral resource is sufficient to allow a qualified person to apply modifying factors in sufficient detail to support mine planning and evaluation of the economic viability of the deposit. Because an indicated mineral resource has a lower level of confidence than the level of confidence of a measured mineral resource, an indicated mineral resource may only be converted to a probable mineral reserve.
•Measured mineral resource is that part of a mineral resource for which quantity and grade or quality are estimated on the basis of conclusive geological evidence and sampling. The level of geological certainty associated with a measured mineral resource is sufficient to allow a Qualified Person to apply modifying factors, as defined in this section, in sufficient detail to support detailed mine planning and final evaluation of the economic viability of the deposit. Because a measured mineral resource has a higher level of confidence than the level of confidence of either an indicated mineral resource or an inferred mineral resource, a measured mineral resource may be converted to a proven mineral reserve or to a probable mineral reserve.
Geostatistical methods were applied to drillhole and mine measurement coal thickness data for the Lower Kittanning Seam at Leer to develop variogram ranges (radii) used for resource classification.
The theoretical ranges estimated for Measured (to 1,650 feet) and Indicated (to 5,000 feet) resources in WEIR’s variographic and quality analysis demonstrates the spatial continuity of mineable coal seam thickness and quality in the Lower Kittanning Seam at Leer.
Weir Technical Report Summary
Leer Complex
Prepared for Core Natural Resources, Inc.
WEIR has a high level of geological confidence in this data and considers it sufficient to allow for the application of modifying factors to support detailed mine planning and evaluation of the economic viability of the deposit within the Measured and Indicated ranges for Leer, Leer South and Leer West.
Classification radii utilized by WEIR in this study are as follows:
•Measured: 0 - 1,650 feet (based on 1,769 observations informing estimate of coal thickness within this range)
•Indicated: 1,650 - 5,000 feet (based on 1,769 observations informing estimate of coal thickness within this range)
•Inferred: greater than 5,000 feet (based on 1,769 observations informing estimate of coal thickness within this range)
11.5 UNCERTAINTY IN ESTIMATES OF MINERAL RESOURCES
Mining is a high risk, capital-intensive venture and each mineral deposit is unique in its geographic, social, economic, political, environmental, and geologic aspects. At the base of any mining project is the mineral resource itself. Potential risk factors and uncertainties in the geologic data serving as the basis for deposit volume and quality estimations are significant considerations when assessing the potential success of a mining project.
Geological confidence may be considered in the framework of both the natural variability of the mineral occurrence and the uncertainty in the estimation process and data behind it. The mode of mineralization, mineral assemblage, geologic structure, and homogeneity naturally vary for each deposit. Structured variability like cyclic depositional patterns in sedimentary rock can be delineated mathematically with solutions like trend surface analysis or variography. Unstructured variability, in the distribution of igneous rock composition, for example, is more random and less predictable.
The reliability of mineral resource estimation is related to uncertainties introduced at different phases of exploration. Resources meeting criteria for Measured, Indicated, and Inferred categories are determined by the quality of modeled input data, both raw and interpreted. An exploration program comprises several stages of progressive data collection, analysis, and estimation, including:
Weir Technical Report Summary
Leer Complex
Prepared for Core Natural Resources, Inc.
⦁ Geological data collection
⦁ Geotechnical data collection
⦁ Sampling and assaying procedures
⦁ Bulk density determination
⦁ Geological interpretation and modeling
⦁ Volume and quality estimation
⦁ Validation
⦁ Resource classification and estimation
Error may be introduced at any phase. Data acquisition and methodologies should be properly documented and subject to regular quality control and assurance protocols at all stages, from field acquisition through resource estimation. Managing uncertainty requires frequent review of process standards, conformance, correctional action, and continuous improvement planning. Risk can be minimized with consistent exploration practices that provide transparent, backwards traceable results that ultimately deliver admissible resource estimates for tonnage and quality.
Less dense drillhole coverage in the northwestern portion of the northern extension of Leer is a source of uncertainty, however that uncertainty is reflected in the classification of Indicated and Inferred resources versus Measured resources.
As discussed in Sections 8.0, 9.0, and 10.0, it is WEIR’s opinion that Core’s methodologies of data acquisition, record-keeping, and QA/QC protocols are adequate and reasonable for resource estimation at the Leer Complex.
In summary, WEIR has reviewed all geologic and geotechnical data inputs, collection protocols, sampling, assaying, and laboratory procedures serving as the basis for the deposit model, its interpretation, and the estimation and validation of the volume and quality of coal resources at the Leer Complex. The spatial continuity of the Lower Kittanning Seam coal deposit at the Leer Complex is well demonstrated by professionally developed, well maintained, quantitative and qualitative data. WEIR finds no material reason regarding geologic uncertainty that prohibits acceptably accurate estimation of mineral resources.
Weir Technical Report Summary
Leer Complex
Prepared for Core Natural Resources, Inc.
11.6 ADDITIONAL COMMODITIES OR MINERAL EQUIVALENT
There are no other commodities or minerals of interest within the Leer Complex other than the coal deposit discussed in this TRS.
11.7 RISK AND MODIFYING FACTORS
Sporadic, significant thicknesses of fireclay floors have been present in some of the previously mined areas but did not adversely affect mining operations. Mine management recognizes that it is important to keep water out of these areas so that normal operations are not negatively affected. Hard sandstone or sandy fireclay in the floor and hard sandstone in the immediate roof have caused cuttability problems which have affected mining operations in the past. There are similar such sporadic areas in future planned panels, which based on prior experience, are also not expected to adversely affect mining operations.
The successful acquisition of required property rights in the future could affect some of the longwall panels. While the uncontrolled property within the Leer Complex resource boundaries represents relatively small areas (approximately 150 acres in Leer, 685 acres in Leer South and 965 acres in Leer West), moving the longwall system around uncontrolled property would likely result in significant production downtime. In some cases, portions of the lost longwall panel adjacent to the uncontrolled property can be recovered utilizing continuous miners. WEIR is not aware of any obstacles to obtaining necessary property rights and reasonably believes that the chances of obtaining such rights in a timely manner are highly likely. Given prior successes in Core’s property acquisition efforts, and relatively small tonnage impacts for unsuccessful reserve property acquisitions, this risk appears relatively low as well.
For purposes of the economic evaluation of the LOM Plans, WEIR assumes Core will acquire the rights to mine these uncontrolled tracts. The cost of acquiring these uncontrolled tracts are included within the economic model. The approximately 1,800 acres of uncontrolled property within the Leer Complex LOM Plans and are discussed in Section 12.6 of this TRS.
Risk is also associated with volatility of coal market prices. However, even significant variations in operating costs, capital expenditures, and productivity would not likely preclude the economic mineability of the Leer Complex, at projected metallurgical coal market prices.
Weir Technical Report Summary
Leer Complex
Prepared for Core Natural Resources, Inc.
Unforeseen changes in legislation and new industry developments could alter the performance of Core by impacting coal consumer demand, regulation, and taxes. Including those aimed at reducing emissions of elements such as mercury, sulfur dioxides, nitrogen oxides, particulate matter, or greenhouse gases. The emphasis on reducing emissions, however, is more of a concern for mines producing a thermal coal product, as opposed to the core metallurgical coal produced from the Leer Complex.
Weir Technical Report Summary
Leer Complex
Prepared for Core Natural Resources, Inc.
12.0 MINERAL RESERVE ESTIMATES
12.1 KEY ASSUMPTIONS, PARAMETERS, AND METHODS
The conversion of resources to reserves at the Leer Complex considers the effects of projected dilution and loss of product coal quality, projected mineral prices and operating costs, regulatory compliance requirements, and mineral control to determine if the saleable coal product will be economically mineable. The design of an executable mine layout that accommodates the planned mining equipment and provides a safe underground work environment is also considered.
It is important to note that the LOM Plans are based on information provided by the company and the plans do not contemplate development of any additional surrounding reserves not included in this report that the company currently controls or contiguous reserves the company could acquire in the future. Nor do the plans assume any productivity improvements, technological innovations, and/or operating efficiencies that the company has achieved historically.
The Leer Complex LOM Plans layouts have several key variables that will largely impact coal recovery. Pillar and panel dimensions are based on minimum, maximum, and optimal equipment operating parameters, as well as geotechnical considerations for mine operations safety and subsidence predictions.
Based on the individual mine’s historical performance and projected mineral continuity, the mine design is the primary consideration, apart from mineral resource classification, whereupon resources are converted to reserves at the Leer Complex mines.
Based on WEIR’s review and evaluation of the Leer Complex LOM Plans, the justification for conversion of resources to reserves were based on specific criteria. The following criteria were used to estimate reserves for the Leer Complex:
•Reserves were estimated as of December 31, 2025.
•Coal density was based on specific gravity data from drillholes and channel samples.
•Minimum mining height of 8.0 feet (96 inches) for continuous miners and 6.5 feet (78 inches) for the longwall.
Weir Technical Report Summary
Leer Complex
Prepared for Core Natural Resources, Inc.
•Maximum mining height of 8.0 feet (96 inches) for the longwall. Continuous miner can mine total thickness of the Lower Kittanning Seam throughout the Leer Complex.
•The different mining methods at the Leer Complex result in different aerial recoveries. Since seam heights are almost exclusively less than maximum longwall mining equipment mining heights, a recovery of 100 percent is applied for the longwall operations, as is typical in the industry. The continuous miner recoveries involve a smaller percentage of the total mined coal, and have variable recovery that is calculated based on development type (i.e. gateroads, main entries, supersections). The resulting recoveries for the continuous miners are based on pillar design sizes and range from approximately 30 to 55 percent. Mining recovery based on measured coal recovery by type of mining, are applied as follows:
Longwall - 100 percent
Continuous Miner - 42 percent
•For mine design purposes, it is assumed that acquisition of mineral control for currently uncontrolled areas will be successful, as it has been historically. LOM Plan design includes these uncontrolled areas, and acquisition cost as well as revenue from the sale of uncontrolled tonnage associated with these areas is included in the PFS.
•Core’s mineral rights over the Leer Complex coal deposits supersedes the mineral rights for oil and gas wells on the property. Core maintains the right to have the wells plugged and mine through them. Core is required to compensate the well owner when the revenue stream from a well ceases. Typical acquisition cost of a well is $75,000 to $100,000, while plugging a gas well to MSHA standards, in order to mine through a well, ranges from $200,000 to $300,000 (included in capital costs). Therefore, coal tonnage surrounding the oil and gas wells has been included in the reserve estimates.
•The point of reference of reserve estimates is post-preparation plant processing and recoverable tons were adjusted for a theoretical preparation plant yield based on drillhole and channel sample analyses washed at a 1.50 specific gravity. The average theoretical yield for the Leer Complex is approximately 80.3 percent.
•A conservative preparation plant efficiency factor of 95.0 percent was applied to reflect actual performance of the preparation plant, compared to theoretical laboratory results at a 1.50 specific gravity.
•The estimate of Reserve tons includes areas that are exclusively within the current Leer Complex LOM Plans.
Weir Technical Report Summary
Leer Complex
Prepared for Core Natural Resources, Inc.
12.2 ESTIMATES OF MINERAL RESERVES
The coal reserves, as of December 31, 2025, that represent the economically viable tonnage controlled and uncontrolled by Core, based on the coal reserve estimate methodology described and independent evaluation of the geology, are shown in Table 12.1-3 as follows:
Table 12.1-3 Recoverable Coal Reserve Tonnage and Quality Estimate as of December 31, 2025
|
|
|
|
|
|
|
|
|
|
|
|
|
|
|
|
|
|
|
|
|
|
|
|
|
|
|
|
|
|
|
|
|
|
|
|
|
|
|
|
|
|
|
|
|
|
|
|
|
|
|
|
|
|
|
|
|
|
|
|
|
|
|
|
|
|
|
|
|
|
|
|
|
|
|
|
|
Average Product Quality @ 1.50 S.G. (Dry Basis) |
|
|
|
|
|
|
|
|
Average Coal |
|
Saleable Tons (000) |
|
|
|
|
|
Volatile |
|
|
| Mine |
|
|
|
Area |
|
Thickness |
|
Reserves (As Received) |
|
Ash |
|
Sulfur |
|
Matter |
|
Overall |
| Area |
|
Seam |
|
(Acres) |
|
(Feet) |
|
Proven |
|
Probable |
|
Total |
|
(%) |
|
(%) |
|
(%) |
|
Yield (%) |
| Leer |
|
Lower Kittanning |
|
5,730 |
|
4.7 |
|
24,700 |
|
4,700 |
|
29,400 |
|
8.0 |
|
1.03 |
|
32.3 |
|
34 |
| Leer South |
|
Lower Kittanning |
|
9,850 |
|
4.8 |
|
46,400 |
|
10,600 |
|
57,000 |
|
8.8 |
|
1.23 |
|
34.3 |
|
39 |
| Leer West |
|
Lower Kittanning |
|
15,600 |
|
4.7 |
|
69,800 |
|
14,000 |
|
83,800 |
|
9.9 |
|
1.18 |
|
33.7 |
|
38 |
|
|
|
|
31,180 |
|
4.7 |
|
140,900 |
|
29,300 |
|
170,200 |
|
9.3 |
|
1.17 |
|
33.7 |
|
|
Notes:
•Clean recoverable Reserve tonnage based on mining recovery of 42 percent for continuous miner mining, 100 percent for longwall mining, modeled preparation plant yield, and a 95 percent preparation plant efficiency.
•Overall Yield reported above incorporates the inclusion of out of seam dilution estimated in the LOM Plan.
•Uncontrolled tons are reported for informational purposes only and are not part of the reserves. Uncontrolled tonnages are contained within small mineral tracts which must be acquired for execution of the LOM. As such, uncontrolled tonnages are included in the LOM financial model. There are approximately 8.6 million in-place uncontrolled tons within the Leer complex that will be acquired as mining progresses.
•Mineral Reserves estimated at a High Vol A coal product and middling coal product realizing an average sales price of $122.00 per ton FOB Mine, with an operating cost of $71.67 per ton. See Section 12.5 for additional detail.
•Numbers in the table have been rounded to reflect the accuracy of the estimate and may not sum due to rounding.
•Mineral Reserves are reported inclusive of Mineral Resources.
•Coal quality listed includes coal that is to be processed into both the middlings product and the metallurgical product and does not represent actual shipped products, which can vary for many reasons, including variations in coal depositional characteristics, non-coal parting and OSD quality characteristics and preparation plant separation specific gravities. As part of the preparation plant processing, the poorer quality middlings product is removed from the remaining clean coal, resulting in a higher quality metallurgical product.
WEIR depleted LOM Plan reserve tonnage using actual mine workings through November 30, 2025, and subtracted actual production, reported by Core, for the remainder of the year to arrive at reserves as of December 31, 2025.
WEIR completed a validation check of its model by using the model to calculate the theoretical tonnage of the Leer areas mined in September, October, and November of 2025 and compared the results to the actual production tonnage for that same time frame. The results were within a variance of 2.9 percent and can be explained in part by the differing methods of calculating tons.
Weir Technical Report Summary
Leer Complex
Prepared for Core Natural Resources, Inc.
The WEIR model used a constant 42 percent mining recovery for all continuous miner development, whereas Core’s mining recovery ranged from 30 to 55 percent, based on whether mining gateroads or mains. The results of the validation are shown in Table 12.1-4.
Table 12.1-4 Reserve Validation
|
|
|
|
|
|
|
|
|
|
|
|
|
|
|
|
|
|
|
|
|
|
|
|
|
|
|
| Mine Area |
|
Seam |
|
Sept 2025 - Nov 2025 Actual |
|
Estimated
Model Tonnage |
|
Variance
(%) |
| Leer |
|
Lower Kittanning |
|
1,162,055 |
|
1,129,195 |
|
2.90 |
12.3 ESTIMATES OF RESERVE CUT-OFF GRADE
WEIR estimated an average coal thickness of 3.09 feet would result in a breakeven NPV. Therefore, a coal thickness cutoff of 3.0 feet would ensure that the Leer Complex LOM Plans average coal thickness would be greater than 3.0 feet and result in positive NPV.
Based on WEIR’s review and evaluation of the Leer Complex LOM Plans, mining coal less than 3.0 feet in thickness is minimal and only conducted on a case-by-case basis. Approximately 10 acres of coal with less than 3.0 feet thickness within Leer South and an additional 50 acres with less than 3.0 feet within Leer West has been included in the reserve estimate.
Based on historical product coal quality, current coal sales contracts, and projected coal quality modeled by WEIR, WEIR does not foresee future coal quality deviations from the present that would adversely affect the saleable coal product.
12.4 MINERAL RESERVE CLASSIFICATION
WEIR prepared the Leer Complex reserve estimates in accordance with Regulation S-K Item 1302(e), which establishes guidance and definitions for mineral reserves to be used in the United States. The SEC Regulation S-K Definition Standards relative to reserves are as follows:
Modifying factors are the factors that a qualified person must apply to indicated and measured mineral resources and then evaluate to establish the economic viability of mineral reserves.
Weir Technical Report Summary
Leer Complex
Prepared for Core Natural Resources, Inc.
A qualified person must apply and evaluate modifying factors to convert measured and indicated mineral resources to proven and probable mineral reserves. These factors include but are not restricted to: Mining; processing; metallurgical; infrastructure; economic; marketing; legal; environmental compliance; plans, negotiations, or agreements with local individuals or groups; and governmental factors. The number, type, and specific characteristics of the modifying factors applied will necessarily be a function of and depend upon the mineral, mine, property, or project.
A mineral reserve is an estimate of tonnage and grade or quality of indicated and measured mineral resources that, in the opinion of the qualified person, can be the basis of an economically viable project. More specifically, it is the economically mineable part of a measured or indicated mineral resource, which includes diluting materials and allowances for losses that may occur when the material is mined or extracted.
•Probable mineral reserve is the economically mineable part of an indicated and, in some cases, a measured mineral resource.
•Proven mineral reserve is the economically mineable part of a measured mineral resource and can only result from conversion of a measured mineral resource.
Within the extent of the LOM Plans for the Leer Complex, Measured Resources were converted to Proven Reserves and Indicated Resources were converted to Probable Reserves.
A map showing the reserve classification polygons is shown below on Figure 12.4-1.
Weir Technical Report Summary
Leer Complex
Prepared for Core Natural Resources, Inc.
Figure 12.4-1 Reserve Classifications
Weir Technical Report Summary
Leer Complex
Prepared for Core Natural Resources, Inc.
12.5 COAL RESERVE QUALITY AND SALES PRICE
Leer Complex coal quality was determined by modeling the drillhole coal quality analyses for the reserve areas. The average dry basis coal quality, for raw coal and washed coal at a 1.50 specific gravity, for the reserves is shown in Table 12.5-1 as follows:
Table 12.5-1 Average Reserve Quality
|
|
|
|
|
|
|
|
|
|
|
|
|
|
|
|
|
|
|
|
|
|
|
|
|
|
|
|
|
|
|
|
|
|
|
|
|
|
|
|
|
|
|
|
|
|
|
|
|
|
|
|
|
|
|
|
|
|
|
|
|
|
|
|
|
Coal Quality (Dry Basis) |
|
|
Raw |
|
Washed @ 1.50 Specific Gravity |
|
|
|
|
Relative |
|
|
|
|
|
|
|
Calorific |
|
Theoretical |
|
Audibert-Arnu |
|
|
|
Hardgrove |
|
|
Ash |
|
Density |
|
Ash |
|
Sulfur |
|
Volatile |
|
Value |
|
Plant |
|
Maximum Dilation |
|
Fluidity |
|
Grindability |
| Seam |
|
(%) |
|
(Lbs/Cu.Ft.) |
|
(%) |
|
(%) |
|
Matter |
|
(Btu/lb.) |
|
Yield (%) |
|
(%) |
|
DDPM |
|
Index |
| Lower Kittanning |
|
21.4 |
|
91.1 |
|
9.3 |
|
1.17 |
|
33.7 |
|
13,990 |
|
80.4 |
|
188 - 320 |
|
30,000 |
|
68.2 |
The table above includes coal that is to be processed into both the middlings product and the metallurgical product and as such is a predictive measure but does not represent actual shipped products. Which can vary for many reasons, including variations in coal depositional characteristics, non-coal parting and OSD quality characteristics and preparation plant separation specific gravities. As part of the preparation plant processing, the poorer quality middlings product is removed from the remaining clean coal, resulting in a higher quality metallurgical product.
Even though the middlings product will be separated from the metallurgical product, the average quality (inclusive of the middlings product) for the reserve tons show that the Leer Complex is a high volatile metallurgical coal product, with good coking properties. The range of washed volatile matter is between approximately 30 and 36 percent, with an average of 33.7 percent. The average quality is low ash, low sulfur, very low moisture, and high fluidity, all of which indicate good coking coal qualities.
The projected coal sales price in the PFS is based on a High Vol A benchmark of $176.96 per metric tonne. Once converted to short tons, adjusted for transportation and the inclusion of middling coal sales, the estimated LOM Plan FOB Mine coal sales price is $121.96 per ton. As detailed previously, average sales price of High Vol A metallurgical coal and middling products was $125.32 in 2024 and $93.81 per ton from January to September 2025. The coal sales price is further supported in Section 16.0 of this TRS.
Weir Technical Report Summary
Leer Complex
Prepared for Core Natural Resources, Inc.
12.6 RISK AND MODIFYING FACTORS
The estimate of reserve tons includes areas that are exclusively within the Leer Complex LOM Plans. The concentration of valid drilling data points within the Leer Complex are generally less than 500 feet from the next nearest data point, resulting in a high confidence. All reserves within the Leer Complex LOM Plans area are within the Proven and Probable classifications determined using the geostatistical variographic study discussed in Section 12.4-1 of this TRS. It is WEIR’s recommendation to add additional drilling data points within the Leer Complex to increase the confidence of the reserve area and potentially reclassify the Inferred Resource tons to a Probable Reserve.
Due to the relatively simple geology in the area, and the relatively high continuity of the Lower Kittanning Seam within the Leer Complex LOM Plans (both structure and quality), geologic uncertainties do not appear to pose a significant risk to the project. However, as mentioned in Section 11.7, relatively thick intervals of fire clay in the floor of some areas will require planning to avoid soft floor conditions which could potentially, in turn, cause adverse mining conditions. Keeping a dry mine in these areas will be important and should prove to be effective to avoid adverse floor conditions that could potentially hinder mine operations otherwise.
The Leer and Leer South mines have an excellent safety record and maintain diligent regulatory compliance. Workforce staffing levels have shown minimal variability historically and are expected to remain stable throughout the planned operating period. The primary mining equipment is well-maintained and has sufficient capacities to attain projected levels of productivity and production. This further contributes to Leer and Leer South mines being relatively low risk mining operations.
Property acquisition problems in the future could affect some of the longwall panels. Even though the remaining reserves within the uncontrolled property are relatively small (approximately 150 acres in Leer, 685 acres in Leer South and 965 acres in Leer West), moving the longwall system around uncontrolled property would likely result in significant production down time. In some cases, portions of the lost longwall panel adjacent to the uncontrolled property can be recovered utilizing continuous miners. WEIR is not aware of any obstacles to obtaining necessary property rights, and reasonably believes that the chances of obtaining such rights in a timely manner are highly likely. Given prior successes in Core’s property acquisition efforts, and relatively small tonnage impacts for unsuccessful reserve property acquisitions, this risk appears relatively low, as well.
Weir Technical Report Summary
Leer Complex
Prepared for Core Natural Resources, Inc.
Approximately 8.6 million tons of uncontrolled reserves were not included within the reserve estimate across the Leer Complex. These estimated tons are within the uncontrolled properties that exist within the Leer, Leer South and Leer West LOM Plans. Acquisition of these relatively small blocks of mineral resource is on-going by Core and not dissimilar to other mining companies’ property control tasks involving relatively small areas. For purposes of the economic evaluation of the LOM Plans, WEIR assumes Core will acquire the rights to mine these uncontrolled tracts. The cost of acquiring these uncontrolled tracts is included within the economic model.
Coal recovery is an important aspect in assessing the economic viability of a mine. Based on Core’s historical extraction rates and generally conservative pillar design, WEIR does not anticipate significant deviation of product recovery in the future. Continuous miner recovery of 50 percent, without second mining, is a general industry mining recovery. However, given that the Leer Complex continuous miners are mostly developing gate roads with more conservative pillar sizing for support of longwall panels, the LOM Plan continuous miner recovery is expected to range from approximately 30 to 55 percent, and average 42 percent. The recovery is based on the pillar size that has been designed for the particular work the continuous miners are completing. As noted above, the pillars’ design is most importantly intended to provide safe operation of the primary coal extraction efforts which involve the longwall machinery. WEIR utilized a weighted average mining recovery of 42 percent for the Leer Complex continuous miners in its estimation of recoverable reserves, based on the pillar size required for the type of continuous miner development. The 100 percent longwall panel recovery is also a typical industry longwall mining recovery (when excluding headgates, tailgates and bleeder entries).
Risk is also associated with the volatility of coal market prices. Even significant variations in operating costs, capital expenditures, and productivity would not likely preclude the economic mineability of the Leer Complex, at projected metallurgical coal sales prices.
Weir Technical Report Summary
Leer Complex
Prepared for Core Natural Resources, Inc.
13.0 MINING METHODS
The mining method utilized by the Leer Complex is longwall mining, with room and pillar continuous mining to develop main entries, longwall headgates and tailgates, and retreat mining production panels. The longwall mining method has been successfully utilized in the NAPP Region, and in other coal producing regions of the United States, since the 1960s. Longwall mining has the highest mining recovery of modern-day underground mining methods.
Leer and Leer South are mining the Lower Kittanning Seam and parting interval within the seam utilizing continuous miners to develop longwall panels to be mined using a longwall mining system. The Leer Complex mining operations develop longwall districts (sets of adjacent longwall panels) with alphabetic designations. As of September 2025, Leer had completed mining in 28 longwall panels and was mining the 29th longwall panel (24A) in the 8th longwall district (see Figure 13.5-1). Leer South completed mining the 8th longwall panel and was mining the 9th longwall panel (HG9) in the 4th longwall district (see Figure 13.5-2). The start of development of Leer West has not been determined by Core, however for the purposes of determining economic viability, WEIR assumes that 51 longwall panels would be mined in the LOM Plan (see Figure 13.5-3).
13.1 GEOTECHNICAL AND HYDROLOGICAL MODELS
13.1.1 Geotechnical Model
The WVU Pillar Study described chain pillar designs for three and four entry gateroad systems, using the Analysis of Longwall Pillar Study (ALPS) and computer numerical methods. The WVU Pillar Study concluded, based on the geotechnical information from Section 7.4, that four entry gateroads with square pillars on 80 feet centers would be stable during different stages of mining and square pillars with 90 feet centers recommended when developing three entry gateroads. The current Leer gateroad pillars exceed the pillar dimensions in the study, with gateroad pillars on 90 x 140 feet centers for the four entry gateroads and pillars 102 feet x 140 feet centers between the No. 1 and No. 2 entries, and 80 feet x 140 feet centers between the No. 2 and No. 3 entries, or 90 x 140 feet centers, for the three entry gateroads.
Weir Technical Report Summary
Leer Complex
Prepared for Core Natural Resources, Inc.
In addition, the Heib Study was commissioned in February 2018 to conduct geotechnical testing and analysis of core holes in the Leer and Sentinel (now Leer South) mines. The report provides information related to horizontal stresses by roof strata, horizontal strain, Brinell Hardness, fracture trend analysis, Poisson’s Ratio, uniaxial compressive strength, and Young’s Modulus, which was summarized in Section 7.4 of this TRS. This report provides information that supports the preparation of well-designed mine plans recognizing local horizontal stresses, and design roof support measures to provide adequate roof control for the LOM Plan. The WVU Pillar Study was utilized to determine minimum pillar sizes and the Heib Study to determine orientation of maximum horizontal stresses for the LOM Plan.
The mine plans for Leer South were developed by Core and reviewed by MM&A. Pillar stability in the Lower Kittanning Seam was checked by MM&A using the Analysis of Coal Pillar Stability (ACPS) program, which integrates the original NIOSH-developed ARMPS, ALPS, and AMSS software packages into a single pillar design framework. MM&A also utilized AHSM (developed by NIOSH) to check the orientation of the proposed mining in relation to available principal horizontal stress directions for the region. Historical knowledge of mining in the area and observations from an October 2020 mine visit by MM&A indicate that horizontal stress conditions are likely to be present during mining in Leer South. As observed by MM&A, current Leer South operations are taking steps to mitigate the horizontal stress, including enhanced ground control measures and strategic mine layout.
13.1.2 Hydrogeological Model
Under the original approved mining plan, the Leer Mine was expected, upon completion of mining, to become fully inundated with water, with no gravity discharge. Because of this, the mine pool was expected to increase to 1,320 feet, creating the potential for unconfined seepage. The permit was modified in Revision No. 18 to include a long-term artesian discharge via a wet seal at 1,180 feet. In Revision No. 21, the discharge concept was modified to change the location and elevation of the planned artesian discharge. The water to be discharged at the elevation of the dewatering borehole is expected to be of good quality, with circumneutral pH and total iron concentrations that can readily settle without the use of chemical treatment. Therefore, the additional mining area added in Revision No. 21 will not create a perpetual discharge of water requiring treatment to meet water quality standards. Moreover, the planned artesian discharge will alleviate potential seepage along Three Fork Creek and will allow for centralized management of the effluent from the Leer Mine.
Weir Technical Report Summary
Leer Complex
Prepared for Core Natural Resources, Inc.
The average water infiltration rate into the Leer Mine void, based upon the expanded reserve area in Revision No. 21, ranges from 1,125 gallons per minute (gpm) to 1,515 gpm based upon two accepted procedures (McCoy and Leavitt equations) for estimating average infiltration. The average of the two infiltration rates, from both methods, would equate to 1,320 gpm. However, for design of the dewatering system and timing requirements, the projected average infiltration rate was increased by 180 percent, resulting in an average infiltration rate of 2,390 gpm.
Projected infiltration rates in response to rainfall, artesian discharge, and pool elevations were determined by Core utilizing the rainfall distribution by calendar day. The elevation of the starting pool was set at the collar elevation of the dewatering borehole (1,058.7 feet). Most of the increase in the underground pool elevation is a function of the driving head building up to push water out of the artesian system. The evaluation of projected water infiltration rate considered two different situations, one without any of the artesian flow being recirculated into the mine void and one with the pool discharge limited to 3,465 gpm, with any artesian flow above that being recirculated back into the mine. The projected maximum pool elevation would reach 1,061.6 feet.
Core had detailed aerial mapping prepared along the area of Three Fork Creek, and MMA was retained to prepare a subsidence prediction model in that area. The results of the report indicated that the lowest line of zero subsidence from the longwall panels intercepts the surface at a surface elevation of 1,070 feet. Similarly, utilizing the 15-degree angle of critical deformation from the longwall panels, the projected lowest elevation the angle of critical deformation intercepts the surface is 1,068 feet. Utilizing the 1,068 feet elevation as the limiting elevation, the projected maximum pool elevation is 6.41 feet below the projected line of zero subsidence.
To maintain the underground mine pool at or below a maximum elevation of 1,062 feet, it will be necessary to install two angular 18-inch diameter dewatering boreholes. The angular boreholes will provide three benefits: (1) establish a fixed discharge elevation to maximize the recoverable coal resource; (2) eliminate the potential to create an uncontrolled discharge; and (3) significantly reduce or eliminate potential diffuse seepage along the flanks of Three Fork Creek as authorized in the original permit for the Leer mine. The angular boreholes will be installed at the present location of the clean coal stockpile within the currently permitted area in the Rocky Fork tributary of Three Fork Creek, after completion of mining. A flow control valve will be installed at the collar of the dewatering boreholes to regulate the flow, if needed for maintenance activities.
Weir Technical Report Summary
Leer Complex
Prepared for Core Natural Resources, Inc.
The dewatering boreholes will have an elevation at the surface of 1,058.7 feet, which with exception of periods of prolonged drought will be the minimum underground pool elevation. The boreholes will penetrate the mine reservoir at an approximate elevation of 890 feet.
The boreholes will have an artesian discharge, with no pumping necessary to maintain the underground mine pool at a desired elevation. The artesian flow will discharge into two separate retention ponds that are constructed in series. Each pond will be designed and constructed to provide 19 acre-feet of storage capacity.
An additional step to ensure long-term compliance with water quality-based effluent limits (WQBEL) is incorporated into the permit. A pump system designed to limit the discharge from retention ponds to 3,465 gpm will be installed to transfer excess pond decant water back to the slope and return the water to the underground mine void. The pump will be operated as necessary to maintain compliance with effluent limits. The results of the treatability tests and long-term water quality trends, along with the retention time in the designed storage ponds, indicate that that the operating time and rates on the return pumping system will be limited.
Core has a work practice that outlines the procedures for properly obtaining field measurements (e.g., pH, flow, etc.) and collecting representative water samples at the Leer Mine permitted property. The procedures described in the work practice pertain to water sampling at the outfalls/outlets and stream monitoring locations. The sampling frequency, outlets/outfalls, stream monitoring locations and associated parameters are summarized in the Leer Mine permits, as well as Core’s Water Discharge Permit Environmental Operating Procedure (EOP). This work practice is intended to improve overall water quality compliance by providing a comprehensive summary of applicable monitoring requirements in the permit, the WV/NPDES rules for coal mining facilities at Title 47, Series 30 (47CSR30), and the EPA regulations under 40 CFR Part 136.
For sample analysis, Core uses laboratories that follow the most recent approved EPA sampling methodology and procedures. The laboratories have internal quality control and quality assurance protocols that are followed before delivering sample results to the Core Engineering Department. The Engineering Department then reviews the sample results once again, as a second check for quality control and quality assurance before the results are published.
Weir Technical Report Summary
Leer Complex
Prepared for Core Natural Resources, Inc.
The hydrogeologic conditions to be encountered by mining at Leer South are expected to be generally similar to those at Leer. The Leer South mine is located below drainage and involves the undermining of surface streams and groundwater aquifers. The Leer South mine is also undermining previous above-drainage mine workings in the Pittsburgh coal seam; however, with the average interburden between the Lower Kittanning and the Pittsburgh seams being approximately 800 feet, the potential for interaction is considered minimal.
WEIR did not observe any adverse hydrogeologic conditions in the existing portions of Leer or Leer South during the January 2026 mine visit.
13.1.3 Other Mine Design and Planning Parameters
Based on geotechnical studies conducted by Core, longwall gateroads developed by the continuous miner sections typically consist of three entries. The gateroads are typically developed on 90 to 125 feet centers, crosscut centers are typically 140 to 180 feet, and typical entry widths are 18 to 19 feet.
Mains will be developed on entry centers of 70 to 80 feet and crosscut centers of 120 feet to 180 feet.
The approved MSHA roof control plan allows maximum entry width of 24.5 feet for the longwall face set up entry, and widths up to 23 feet for dual track spurs where additional roof support will be installed.
The longwall panels will vary in width from 662 feet to a maximum width of 1,250 feet, with longwall panel lengths that vary based on panel geometries constrained by property control or coal thickness less than 3.0 feet. The projected longwall panel lengths range from 2,762 feet to 16,906 feet.
13.2 PRODUCTION, MINE LIFE, DIMENSIONS, DILUTION, AND RECOVERY
13.2.1 Production Rates
Projected continuous miner productivity is 98 to 120 feet per shift for gateroad development and 170 feet per shift for the continuous miner supersections. Supersections are continuous miner sections with split ventilation that allows two continuous miners to operate simultaneously.
Weir Technical Report Summary
Leer Complex
Prepared for Core Natural Resources, Inc.
Longwall projected productivity is typically 50 to 54 feet of retreat per day (25 to 27 feet per shift).
The longwalls at the Leer Complex work two production shifts per day, seven days per week. The continuous miners work two production shifts per day, five- and one-half days per week (every other Saturday). The production crews have a hot seat change at the section face. There are four longwall crews that work a five days on, three days off schedule, rotating shifts every six weeks. A third shift per day for the longwall and continuous miner units is utilized for maintenance.
Actual ROM and clean production, and preparation plant yield achieved by the Leer Complex mining units for 2024 and September 2025 YTD are shown in Table 13.2-1 as follows:
Table 13.2-1 Leer Complex Historical Production Metrics
|
|
|
|
|
|
|
|
|
|
|
|
|
|
|
|
|
|
|
|
|
|
|
|
|
|
|
|
|
|
|
|
|
|
|
|
|
Leer |
|
Leer South |
|
Leer Complex |
|
2024 |
|
2025 (1) |
|
2024 |
|
2025 (1) |
|
2024 |
|
2025 (1) |
| ROM Tons (000s) |
6,698 |
|
6,488 |
|
6,786 |
|
1,000 |
|
13,484 |
|
7,488 |
| Clean Tons (000s) |
3,650 |
|
3,956 |
|
2,556 |
|
307 |
|
6,206 |
|
4,264 |
| Preparation Plant Yield (%) |
54.5 |
|
61.0 |
|
37.7 |
|
30.7 |
|
46.0 |
|
56.9 |
|
|
|
|
|
|
|
|
|
|
|
|
| (1) September 2025 YTD |
|
|
|
|
|
|
|
|
|
|
|
Production from the longwall mining units is projected to range from 210,187 to 417,089 clean tons per month, except for months having a longwall move or holidays. Annual longwall production will vary depending on coal seam thickness, mining height, and the number of longwall moves each year. A typical production delay of 12 days is projected for longwall moves.
Production from the continuous miner units is projected to reach 28,411 clean tons per month per unit, depending on the number of shifts required to develop main entries and gateroads to support longwall mining. Planned mining height for the continuous miners is 8.0 feet at Leer and Leer South and projected to be 6.5 feet at Leer West.
Leer produced approximately 3.7 million clean tons in 2024 and 4.0 million clean tons in 2025 September YTD. The Leer LOM Plan projects mining through 2035; an expected mine life of nine years. Core projects total mine production to range from 2.7 to 3.6 million clean tons when the longwall and continuous miner units are operating (2026 to 2033). The continuous miner units decrease to one unit in 2034 and 2.1 million clean tons are produced in 2035.
Weir Technical Report Summary
Leer Complex
Prepared for Core Natural Resources, Inc.
Leer South produced approximately 2.6 million clean tons in 2024 and 0.3 million clean tons in 2025 September YTD. The Leer South LOM Plan projects total mine production to range from 2.7 to 4.0 million clean tons when the longwall and continuous miner units are operating (2026 to 2041) and 3.6 million clean tons in 2042 after the continuous miner units cease production.
For the purposes of determining economic viability, WEIR projects the Leer West total mine production to range from 1.9 to 3.3 million clean tons when the longwall and continuous miner units are operating (2034 to 2062) and 2.8 million clean tons in 2063 after the continuous miners cease production in 2062.
Core’s projected clean production for Leer Complex LOM Plans are shown in Table 13.2-2 as follows:
Table 13.2-2 Leer Complex LOM Plans Projected Clean Production
|
|
|
|
|
|
|
|
|
|
|
|
|
|
|
|
|
|
|
|
|
|
|
|
|
|
|
|
|
|
|
|
|
|
|
|
|
|
|
|
|
|
|
|
|
|
|
2026 |
2027 |
2028 |
2029 |
2030 |
2031 |
2032 |
2033 |
2034 |
2035 |
2036 |
2037 |
2038 |
| Clean Tons (000) |
|
|
|
|
|
|
|
|
|
|
|
|
|
|
| Leer |
|
3,504 |
|
3,570 |
|
3,456 |
|
3,115 |
|
3,006 |
|
2,903 |
|
2,718 |
|
3,169 |
|
2,897 |
|
2,093 |
|
— |
|
— |
|
— |
|
| Leer South |
|
3,304 |
|
3,618 |
|
3,663 |
|
3,476 |
|
4,047 |
|
4,041 |
|
3,417 |
|
3,615 |
|
3,460 |
|
3,987 |
|
3,754 |
|
3,401 |
|
3,011 |
|
| Leer West |
|
— |
|
— |
|
— |
|
— |
|
— |
|
13 |
|
79 |
|
420 |
|
1,937 |
|
2,995 |
|
3,168 |
|
3,227 |
|
3,123 |
|
|
|
6,808 |
|
7,188 |
|
7,119 |
|
6,591 |
|
7,053 |
|
6,957 |
|
6,214 |
|
7,204 |
|
8,294 |
|
9,074 |
|
6,922 |
|
6,627 |
|
6,134 |
|
|
|
|
|
|
|
|
|
|
|
|
|
|
|
|
|
|
|
|
|
|
|
|
|
|
|
|
|
|
|
|
|
2039 |
2040 |
2041 |
2042 |
2043 |
2044 |
2045 |
2046 |
2047 |
2048 |
2049 |
2050 |
2051 |
| Clean Tons (000) |
|
|
|
|
|
|
|
|
|
|
|
|
|
|
| Leer |
|
— |
|
— |
|
— |
|
— |
|
— |
|
— |
|
— |
|
— |
|
— |
|
— |
|
— |
|
— |
|
— |
|
| Leer South |
|
3,584 |
|
3,387 |
|
3,335 |
|
3,560 |
|
— |
|
— |
|
— |
|
— |
|
— |
|
— |
|
— |
|
— |
|
— |
|
| Leer West |
|
2,870 |
|
2,810 |
|
2,714 |
|
2,775 |
|
2,821 |
|
3,087 |
|
3,019 |
|
3,304 |
|
2,834 |
|
2,852 |
|
3,175 |
|
3,062 |
|
2,972 |
|
|
|
6,455 |
|
6,197 |
|
6,049 |
|
6,335 |
|
2,821 |
|
3,087 |
|
3,019 |
|
3,304 |
|
2,834 |
|
2,852 |
|
3,175 |
|
3,062 |
|
2,972 |
|
|
|
|
|
|
|
|
|
|
|
|
|
|
|
|
|
|
|
|
|
|
|
|
|
|
|
|
|
|
|
|
|
2052 |
2053 |
2054 |
2055 |
2056 |
2057 |
2058 |
2059 |
2060 |
2061 |
2062 |
2063 |
LOM |
| Clean Tons (000) |
|
|
|
|
|
|
|
|
|
|
|
|
|
|
| Leer |
|
— |
|
— |
|
— |
|
— |
|
— |
|
— |
|
— |
|
— |
|
— |
|
— |
|
— |
|
— |
|
30,430 |
|
| Leer South |
|
— |
|
— |
|
— |
|
— |
|
— |
|
— |
|
— |
|
— |
|
— |
|
— |
|
— |
|
— |
|
60,660 |
|
| Leer West |
|
2,878 |
|
3,258 |
|
3,262 |
|
3,275 |
|
2,629 |
|
2,791 |
|
2,739 |
|
2,617 |
|
2,915 |
|
2,915 |
|
2,915 |
|
2,750 |
|
88,200 |
|
|
|
2,878 |
|
3,258 |
|
3,262 |
|
3,275 |
|
2,629 |
|
2,791 |
|
2,739 |
|
2,617 |
|
2,915 |
|
2,915 |
|
2,915 |
|
2,750 |
|
179,290 |
|
13.2.2 Expected Mine Life
Weir Technical Report Summary
Leer Complex
Prepared for Core Natural Resources, Inc.
The Leer LOM Plan projects mining through 2035, an expected mine life of nine years (see Figure 13.5-1).
The Leer South LOM Plan projects mining through 2042, an expected mine life of 17 years (see Figure 13.5-2).
For the purposes of determining economic viability, WEIR projects the Leer West LOM Plan to mine from 2031 through 2063, an expected mine life of 33 years (see Figure 13.5-3).
It is important to note that the LOM Plan is based on information provided by the company and does not contemplate development of surrounding reserves the company currently controls or contiguous reserves the company could acquire in the future, nor does it assume any productivity improvements, technological innovations, and/or operating efficiencies that the company has achieved historically.
13.2.3 Mine Design Dimensions
The longwall panels will typically be 1,204 feet wide, with panel lengths ranging from 2,762 feet to 16,906 feet in the LOM Plans. Several of the longwall panels are narrower than 1,204 feet, having widths ranging from 662 feet to 1,250 feet to accommodate resource geometry and seam thickness variations.
The projected mining for the LOM Plans is shown on Figures 13.5-1, 13.5-2, and 13.5-3.
Mine design criteria utilized in the LOM Plans is as follows:
•Gas Wells
State Permit required to mine within 500 feet of a well
MSHA Permit required to mine within 150 feet of a well
Active Well Buffer - tangent of 8 degrees x depth of cover or 50 feet, whichever is greater
Inactive Well Buffer - tangent of 4 degrees x depth of cover or 50 feet, whichever is greater
Plugged Wells - mine through permitted with State and MSHA Approval ACPS stability factor of 2.5 or greater for mining under public buildings or impoundments.
•Pillar Size
Weir Technical Report Summary
Leer Complex
Prepared for Core Natural Resources, Inc.
ACPS stability factor of 2.0 or greater for long life areas and under residences in areas where subsidence is not planned.
ACPS stability factor of 1.5 or greater for all other room and pillar development.
ACPS tailgate loading stability factor of 1.3 or greater for longwall mining.
•Depth of Cover
In general, longwall mining will not be conducted in areas with less than 200 feet of cover. This may be evaluated on a case-by-case basis.
•Areas without Subsidence Rights
ACPS stability factors of 2.0 or greater will be maintained during first mining.
Retreat mining will come no closer than a tangent of 30 degrees times depth of cover to the property boundary.
•Coal Thickness
In general, mining will not be planned in areas of coal less than 3.0 feet in thickness. This may be evaluated on a case-by-case basis.
Continuous miner units are assumed to mine entire seam thickness (averaging 5.0 feet, ranging from 0.0 to 9.0 feet). Mining height required for ventilation tubing and longwall equipment transportation is a minimum of 8.0 feet.
Longwall is assumed to mine the entire seam up to 8.0 feet (maximum mining height is 8.5 feet). Seam height above 8.5 feet is assumed to be left unmined. Typical mining height for the longwall is 6.5 feet.
13.2.4 Mining Dilution
OSD on continuous miner units is typically 2.0 to 3.0 feet from roof or floor. Longwall OSD is based on a minimum mining height of 6.5 feet, which typically results in OSD of 0.5 to 1.5 feet from roof or floor. Minimum dilution is 0.5 feet when the seam height is greater than the minimum mining height and typically involves floor material.
13.2.5 Mining Recovery
The longwall is projected to recover 100 percent of the in-place coal within the area projected to be mined from the starting and stopping point between the two gateroads. Typically, the longwall mines the coal seam up to a maximum mining height of 8.5 feet.
Weir Technical Report Summary
Leer Complex
Prepared for Core Natural Resources, Inc.
The continuous miner recovery is based on the pillar design and varies based on whether the panel is a gateroad, main entry or production panels. Typical continuous miner aerial recovery varies from approximately 30 to 55 percent for the LOM Plan. The continuous miners’ maximum mining height capabilities will have the capacity to recover the entire seam thickness over the entire LOM Plan.
13.3 DEVELOPMENT AND RECLAMATION REQUIREMENTS
13.3.1 Underground Development Requirements
The Leer and Leer South mines are active mining operations. As the mines expand, future development will be required for extensions of belt conveyors, mine power, pipelines, track, and ventilation overcasts. In addition, development into the reserve areas will require additional ventilation shafts and infrastructure facilities. As these are underground mines, the only surface disturbance required in the future is for the shaft sites and refuse sites. In addition, the mine surface facilities, preparation plant, railroad, and loadout for Leer West will disturb the surface.
Future bleeder shafts are anticipated for each of the remaining longwall districts. Existing fans will be decommissioned from one longwall district and moved to the next to save costs. Each bleeder shaft and fan installation will be completed just prior to starting the longwall in each district.
A new refuse disposal facility at Leer will be needed by 2028. It is estimated that the new refuse disposal site will cost approximately $20 million to develop. This includes land acquisition, geotechnical investigations, permitting, clearing, and starter dam construction. WEIR is not aware of any obstacles or concerns that may impair Core’s ability to secure approvals and construct this facility.
13.3.2 Reclamation (Backfilling) Requirements
Upon mine closure, selected areas will be reclaimed in accordance with the abandonment plans approved by the applicable regulatory agencies. Regrading and backfilling activities will commence within 180 days after the mining operations are complete. Dry conventional types of seals are proposed for all openings to the underground mine workings.
Weir Technical Report Summary
Leer Complex
Prepared for Core Natural Resources, Inc.
13.4 MINING EQUIPMENT AND PERSONNEL
13.4.1 Mining Equipment
Currently at Leer, there are three longwall development (gateroad) continuous miner sections and two continuous miner supersections, developing mains and production panels. Leer South has two longwall development (gateroad) continuous miner sections and one continuous miner supersection, developing mains and production panels.
The Leer and Leer South mines are currently utilizing the following industry standard mining equipment on the continuous miner units, as shown in Table 13.4-1.
Table 13.4-1 Continuous Miner Section Equipment
|
|
|
|
|
|
|
|
|
|
|
|
|
|
|
| Gateroad Continuous Miner Unit |
|
Continuous Miner Supersection Unit |
| 1 - |
Joy 14CM15 Continuous Miner |
|
2 - |
Joy 14CM15 Continuous Miners |
| 2 - |
Narco 10SC32 Shuttle Cars |
|
3 - |
Narco 10SC32 Shuttle Cars |
| 1 - |
Fletcher CHDDR15 Roof Bolters |
|
2 - |
Fletcher CHDDR15 Roof Bolters |
| 1 - |
Fairchild 35C Battery Scoop |
|
2 - |
Fairchild 35C Battery Scoops |
| 1 - |
Feeder Breaker |
|
1 - |
Feeder Breaker |
| 2 - |
Auxiliary Face Fans |
|
4 - |
Auxiliary Face Fans |
Leer West is expected to employ similar continuous mining equipment.
Core purchased and installed a state-of-the-art Joy longwall mining system for the Leer and Leer South mines, which incorporates technological advances in equipment component capacity, strength and durability. The longwall mining system consists of the following equipment shown in Table 13.4-2.
Weir Technical Report Summary
Leer Complex
Prepared for Core Natural Resources, Inc.
Table 13.4-2 Longwall Mining Equipment
|
|
|
|
|
|
| Longwall Section |
| 212 - |
Joy Roof Support Face Shields, 1,040-Ton Capacity (1.5 meter wide) |
| 1 - |
Joy 7LS1D Shearer |
| 1 - |
Joy Armored Face Conveyor (1,200 feet) |
| 1 - |
Stageloader |
| 1 - |
Crusher |
| 1 - |
Tailpiece with Pontoons |
| 1 - |
Scoop |
| 1 - |
Power Center, 7,000 KVA |
| 1 - |
Power Center, 3,000 KVA |
| 4 - |
Kamat Pressure Pumps, 100 gpm each |
The Leer and Leer South mines longwall mining systems are capable of operating at the widths and lengths projected by Core. Leer West is expected to employ similar longwall mining equipment.
No changes are planned in the type of mining equipment used during the Leer Complex LOM Plans. The longwall is projected to cease operation in 2035 at Leer and in 2039 at Leer South, after mining all the projected longwall panels.
13.4.2 Staffing
Core currently employs approximately 425 to 500 personnel at both Leer and Leer South, which will continue over the LOM. The hourly labor force at both mines remains non-union and no change in this labor arrangement is anticipated. Leer West, once operating, is also projected to have approximately 425 to 500 personnel.
Leer and Leer South are scheduled to produce coal two production shifts each day, A Shift and B Shift. Crews on the Owl or idle shift provide support services including production unit moves, off-shift maintenance and other support functions as required. In addition, general underground support crews work each shift performing routine supply, belt maintenance and outby support functions.
The preparation plant at each mine is staffed with four crews to process ROM coal 24 hours per day, 6.0 to 6.5 days per week. Shut down periods are typically July 4th week, Thanksgiving week, Christmas Eve, and Christmas Day.
Weir Technical Report Summary
Leer Complex
Prepared for Core Natural Resources, Inc.
The projected staffing level for the LOM Plan is expected to remain similar to the current staffing level through 2032 and then will taper off through the end of the LOM Plan in 2035 for Leer and through the end of Leer South’s LOM Plan in 2041.
Most of the employees live nearby in Barbour, Harrison, Marion, Preston, Taylor, and Upshur counties. Core has had no major issues hiring qualified candidates for open positions and relies considerably on employee referrals.
Mine Safety
An industry standard metric used by the MSHA for safety performance is the Non-Fatal Days Lost (NFDL) Incidence Rate, which is determined by the number of lost time injuries multiplied by 200,000 divided by the manhours worked.
Leer (excluding the preparation plant) manhours worked, NFDL injuries, and NFDL Incidence Rate reported to the MSHA for 2022 through Third Quarter 2025, compared to the national average NFDL Incidence Rate for United States underground bituminous coal mines are shown in Table 13.4-3 as follows:
Table 13.4-3 Leer Mine Safety Statistics
|
|
|
|
|
|
|
|
|
|
|
|
|
|
|
|
|
|
|
|
|
|
|
|
|
|
|
|
|
|
|
|
|
|
|
|
|
|
|
|
|
NFDL |
|
|
|
|
|
|
|
|
Incidence Rate |
|
|
Manhours |
|
NFDL Injuries |
|
|
|
National |
|
|
Worked |
|
Leer |
|
Contractor |
|
Leer |
|
Average |
| 2022 |
|
1,175,620 |
|
2 |
|
0 |
|
0.34 |
|
3.31 |
| 2023 |
|
1,202,719 |
|
2 |
|
1 |
|
0.33 |
|
3.22 |
| 2024 |
|
1,323,744 |
|
4 |
|
0 |
|
0.60 |
|
3.26 |
| 2025 (1) |
|
989,423 |
|
3 |
|
1 |
|
0.61 |
|
3.16 |
|
|
|
|
|
|
|
|
|
|
|
| (1) As of Third Quarter YTD, except national average NFDL rate through Second Quarter YTD |
The Leer NFDL Incidence Rate was significantly lower than the national average from 2022 through Third Quarter 2025. Leer received the Sentinels of Safety Award, an industry accolade, in the large underground mine category, having worked all of 2019, and a total of more than two million manhours, without a lost time incident. There were two fatalities in 2024.
Weir Technical Report Summary
Leer Complex
Prepared for Core Natural Resources, Inc.
The Leer Preparation Plant manhours worked, NFDL injuries, and NFDL Incidence Rate reported to the MSHA for 2022 through Third Quarter 2025, compared to the national average NFDL Incidence Rate for United States preparation plants are shown in Table 13.4-4 as follows:
Table 13.4-4 Leer Preparation Plant Safety Statistics
|
|
|
|
|
|
|
|
|
|
|
|
|
|
|
|
|
|
|
|
|
|
|
|
|
|
|
|
|
|
|
|
|
|
|
|
|
|
|
|
|
NFDL |
|
|
|
|
|
|
|
|
Incidence Rate |
|
|
Manhours |
|
NFDL Injuries |
|
Leer |
|
National |
|
|
Worked |
|
Leer Plant |
|
Contractor |
|
Plant |
|
Average |
| 2022 |
|
112,324 |
|
— |
|
2 |
|
— |
|
0.90 |
| 2023 |
|
112,914 |
|
— |
|
— |
|
— |
|
0.91 |
| 2024 |
|
116,106 |
|
— |
|
— |
|
— |
|
0.52 |
| 2025 (1) |
|
83,223 |
|
1 |
|
— |
|
2.40 |
|
0.64 |
|
|
|
|
|
|
|
|
|
|
|
| (1) As of Third Quarter YTD, except national average NFDL rate through Second Quarter YTD |
Only one lost time injury was incurred at the preparation plant in 2025, which resulted in the NFDL Incidence Rate greater than the national average.
Leer management personnel are very proactive in providing a safe working environment for all personnel. Breathing apparatus to be used in case of mine evacuation, include the Ocenco M-20 units, providing 10 minutes of oxygen are worn on the miner’s belts and the Ocenco EBA 6.5 SCSRs, providing 60 minutes oxygen, which are available on the underground transport vehicles, at 5,700 feet intervals along the escapeway, and at the underground belt drives.
Leer South (excluding the preparation plant) manhours worked, NFDL injuries, and NFDL Incidence Rate reported to the MSHA for 2022 through Third Quarter 2025, compared to the national average NFDL Incidence Rate for United States underground coal mines are shown in Table 13.4-5 as follows:
Weir Technical Report Summary
Leer Complex
Prepared for Core Natural Resources, Inc.
Table 13.4-5 Leer South Mine Safety Statistics
|
|
|
|
|
|
|
|
|
|
|
|
|
|
|
|
|
|
|
|
|
|
|
|
|
|
|
|
|
|
|
|
|
|
|
|
|
|
|
|
|
NFDL |
|
|
|
|
|
|
|
|
Incidence Rate |
|
|
Manhours |
|
NFDL Injuries |
|
Leer |
|
National |
|
|
Worked |
|
Leer South |
|
Contractor |
|
South |
|
Average |
| 2022 |
|
1,420,096 |
|
4 |
|
— |
|
0.56 |
|
3.31 |
| 2023 |
|
1,417,420 |
|
2 |
|
4 |
|
0.28 |
|
3.22 |
| 2024 |
|
1,419,009 |
|
4 |
|
— |
|
0.56 |
|
3.26 |
| 2025 (1) |
|
706,943 |
|
2 |
|
— |
|
0.57 |
|
3.16 |
|
|
|
|
|
|
|
|
|
|
|
| (1) As of Third Quarter YTD, except national average NFDL rate through Second Quarter YTD |
Leer South’s NFDL Incidence Rate was significantly lower than the national average from 2022 through Third Quarter 2025.
The Leer South Preparation Plant manhours worked, NFDL injuries, and NFDL Incidence Rate reported to the MSHA for 2022 through Third Quarter 2025, compared to the national average NFDL Incidence Rate for United States preparation plants are shown in Table 13.4-6 as follows:
Table 13.4-6 Leer South Preparation Plant Safety Statistics
|
|
|
|
|
|
|
|
|
|
|
|
|
|
|
|
|
|
|
|
|
|
|
|
|
|
|
|
|
|
|
|
|
|
|
|
|
|
|
|
|
NFDL |
|
|
|
|
NFDL Injuries |
|
Incidence Rate |
|
|
Manhours Worked |
|
Leer South Plant |
|
Contractor |
|
Leer South Plant |
|
National Average |
| 2022 |
|
93,638 |
|
— |
|
1 |
|
— |
|
0.90 |
| 2023 |
|
140,551 |
|
— |
|
— |
|
— |
|
0.91 |
| 2024 |
|
138,077 |
|
— |
|
— |
|
— |
|
0.52 |
| 2025 (1) |
|
83,131 |
|
— |
|
— |
|
— |
|
0.64 |
|
|
|
|
|
|
|
|
|
|
|
| (1) As of Third Quarter YTD, except national average NFDL rate through Second Quarter YTD |
No injuries were incurred at the preparation plant in 2022 through Third Quarter 2025, with the NFDL rate significantly lower than the national average.
13.5 LIFE OF MINE PLAN MAP
The projected mining area for the Leer LOM Plan is shown on Figure 13.5-1, Leer South is shown on Figure 13.5-2, and Leer West on Figure 13.5-3.
Weir Technical Report Summary
Leer Complex
Prepared for Core Natural Resources, Inc.
Figure 13.5-1 Leer Life of Mine Plan
Weir Technical Report Summary
Leer Complex
Prepared for Core Natural Resources, Inc.
Figure 13.5-2 Leer South Life of Mine Plan
Weir Technical Report Summary
Leer Complex
Prepared for Core Natural Resources, Inc.
Figure 13.5-3 Leer West Mine Life of Mine Plan
Weir Technical Report Summary
Leer Complex
Prepared for Core Natural Resources, Inc.
14.0 PROCESSING AND RECOVERY METHODS
14.1 PLANT PROCESS
The Leer and Leer South preparation plants each consist of two processing circuits, with primary heavy media vessel (Leer South only) or primary heavy media cyclones and secondary heavy media cyclones, classifying cyclones, spirals, reflux classifiers, stackcell flotation (Leer only) and column flotation. The ROM material size fractions and circuits utilized are summarized in Table 14.1-1 and are more fully described in Section 14.2.
Table 14.1-1 Preparation Plant Process Size Fractions and Circuits
|
|
|
|
|
|
|
|
|
|
|
|
|
|
|
| Size |
|
|
|
|
| Fraction |
|
Size |
|
Circuit |
| Leer Preparation Plant |
| Coarse |
|
2 in. x 1mm |
|
Heavy Media Cyclone |
| Fine |
|
1mm x 100 Mesh |
|
Reflux Classifiers |
| Ultrafine |
|
100 Mesh x 325 Mesh |
|
Column Flotation |
| Ultrafine |
|
325 Mesh x 0 |
|
Stackcell Flotation |
|
|
|
|
|
| Secondary |
|
2 in. x 1mm |
|
Heavy Media Cyclone |
|
|
|
|
|
| Leer South Preparation Plant |
| Coarse |
|
+1/2 in. |
|
Heavy Media Vessel |
| Coarse |
|
1/2 in. x 1mm |
|
Heavy Media Cyclone |
| Fine |
|
1mm x 100 Mesh |
|
Spirals |
| Ultrafine |
|
100 Mesh x 325 Mesh |
|
Column Flotation |
| Ultrafine |
|
325 Mesh x 0 |
|
Discard |
|
|
|
|
|
| Secondary |
|
1/2 in. x 1mm |
|
Heavy Media Cyclone |
14.2 PLANT PROCESSING DESIGN, EQUIPMENT CHARACTERISTICS AND SPECIFICATIONS
The Leer Preparation Plant, built by Powell Construction, is a well-designed and constructed preparation plant utilizing state-of-the-art technology. The preparation plant was designed with two identical processing circuits, which can be operated simultaneously or one at a time. Each circuit can process 700 ROM tph of raw coal for a total design feed rate of 1,400 ROM tph, although the preparation plant typically operates at 1,500 ROM tph (750 to 775 ROM tph per circuit). The preparation plant feed rate is adjusted based on the desired product quality, which often results in the preparation plant’s processing rate to be higher than the design rate.
Weir Technical Report Summary
Leer Complex
Prepared for Core Natural Resources, Inc.
ROM material is conveyed from the slope belt conveyor to the Raw Coal #1 or Raw Coal #2 stacking tube. The ROM material is reclaimed from the stacking tubes and is sized at a nominal 2-inch top size. All of the -2-inch material reports to the plant feed conveyor where it is conveyed to the plant feed surge bin prior to processing.
The material from the surge bin reports to the raw coal screens where it is screened at +2-inch, 2-inch x 1mm and 1mm x 0. The +2 inch is discarded onto the rejects conveyor. The 2-inch x 1mm is washed in a heavy media cyclone at 2-inch x 1mm. The fine 1mm x 100 mesh material is washed via reflux classifiers. The ultrafine 100 mesh x 325 mesh material is cleaned by column flotation. The +1mm material is washed at a high gravity first to reject the rock. This +1mm product is then re-washed at a low specific gravity in a heavy media cyclone resulting in a metallurgical coal product and a secondary middlings product.
Coarse reject material is conveyed to and stored in a bin, then trucked to the refuse disposal site. Fine reject material is pumped from the thickener to the impoundment for disposal.
To ensure the desired, saleable product quality is being produced from the preparation plant, daily proximate analyses, weekly petrographic analyses, bi-weekly ash/mineral analyses, and bi-monthly plant efficiency testing are conducted.
The middlings product contains coal that is typically 9,000 to 11,500 Btu/lb, with an ash level of 17 to 30 percent, and sulfur content of 1.8 to 2.2 percent. This product is primarily utilized by power plants as a blend with other feed coals.
The preparation plant washes all the ROM coal and can process ROM coal to a 100 percent metallurgical coal product, or to an 85 percent metallurgical coal and 15 percent middlings product.
The preparation plant operates two, 12-hour shifts per day, six to six and one-half days per week, and typically processes 35,000 to 36,000 ROM tons per day. Shut down periods are typically July 4th week, Thanksgiving Week, Christmas Eve, and Christmas Day.
All ROM coal for Leer South is washed at the Leer South Preparation Plant. The preparation plant was designed with two processing circuits, which can be operated simultaneously or one at a time.
Weir Technical Report Summary
Leer Complex
Prepared for Core Natural Resources, Inc.
One circuit, Circuit A, can process 600 ROM tph and the other circuit, Circuit B, can process 1,000 ROM tph for a total design feed rate of 1,600 ROM tph. The preparation plant feed rate is adjusted based on the desired product quality, which often results in the preparation plant’s processing rate to be higher than the design rate.
The Leer South ROM coal is conveyed from the slope to Raw Coal No. 1 stacking tube. The ROM coal is reclaimed and screened at 3.0 inches and oversized material reports to a rotary breaker. Material passing the screen and rotary breaker is conveyed to Raw Coal No.2 stacking tube for further processing. The material from Raw Coal No. 2 stacking tube feeds the Leer South Preparation Plant at a rate of approximately 1,600 ROM tph.
The Leer South Preparation Plant circuitry includes a heavy media vessel (plus ½ inch material), heavy media cyclone (1/2 inch by 1mm material), spirals (1mm by 100 mesh), and column flotation (100 mesh by 325 mesh). All vessel and cyclone materials are initially washed at a high gravity to discard high ash non-coal material. This material is then re-washed at a lower gravity in a heavy media cyclone to make a metallurgical product and a secondary middlings thermal product.
14.3 ENERGY, WATER, PROCESS MATERIALS, AND PERSONNEL REQUIREMENTS
The Leer and Leer South preparation plants consume electricity provided by Mon Power, a regulated electric utility headquartered in West Virginia. It is a subsidiary of FirstEnergy Corp., one of the largest investor-owned electric systems in the United States.
Make-up water for the Leer Preparation Plant is sourced utilizing a closed-loop water system. The preparation plant pumps fine slurry to the refuse slurry impoundment and then clarified water is pumped from the refuse slurry impoundment back to the plant. The Leer South Preparation Plant make-up water is sourced from a nearby underground mine and local streams.
Other process materials and supplies such as magnetite and flocculent are used within both the Leer and Leer South Preparation Plants and are readily available from local suppliers.
Personnel have been sourced from nearby in Barbour, Harrison, Marion, Preston, Taylor and Upshur counties. The area has historically supported coal mining communities and Core has had no major issues hiring qualified candidates for open positions and relies considerably on employee referrals.
Weir Technical Report Summary
Leer Complex
Prepared for Core Natural Resources, Inc.
Weir Technical Report Summary
Leer Complex
Prepared for Core Natural Resources, Inc.
15.0 INFRASTRUCTURE
15.1 ROADS
The main road near the Leer surface facilities is US Route 50, which runs east/west and is less than a mile north of the Leer facilities. The mine access road (Tygart Drive) is approximately two miles west of the small town of Thornton, West Virginia, and approximately three miles east of Grafton, West Virginia. The nearest larger towns are Morgantown, West Virginia, located approximately 25 miles to the north, and Bridgeport, West Virginia, located approximately 16 miles to the west of the property.
The main road near the Leer South Office and surface facilities is US Route 119, which runs north/south and is less than three miles north of the town of Philippi West Virginia. The nearest larger towns are Morgantown, West Virginia, located approximately 43 miles to the north, and Bridgeport, West Virginia, located approximately 26 miles to the south of the property. The distance between Leer and Leer South is approximately 15 miles via US Route 119.
The main road near Leer West is WV Route 38, south of the town of Pruntytown in Taylor County, West Virginia. The nearest larger towns are Morgantown, West Virginia to the north and the cities of Clarksburg and Bridgeport, West Virginia to the west. The property can be accessed from Morgantown via WV Route 119 to WV Route 38. Morgantown is located 29 miles to the north of the property. The property can be accessed from Bridgeport via WV Rt. 50 and Shelby Run Road. Bridgeport is located 10.5 miles to the west of Pruntytown.
15.2 RAIL
The Mountain Subdivision rail line, owned and operated by CSX, passes directly by the mine surface facilities, and has a separate rail loadout spur for Leer. There are dual main rail lines adjacent to the mine, which helps reduce rail line congestion. The Mountain Subdivision rail line extends from Cumberland, Maryland to Grafton, West Virginia. CSX also owns and operates a rail yard at Grafton, West Virginia.
Weir Technical Report Summary
Leer Complex
Prepared for Core Natural Resources, Inc.
Leer South transports coal to the CSX rail line via the Appalachian and Ohio Railroad (A&O). A&O operates 158 miles of shortline railroad from Cowen, West Virginia to Grafton West Virginia.
Leer West plans to transport coal to the CSX line via a rail spur that will be constructed prior to the opening of the mine.
15.3 POWER
Electrical power for Leer and Leer South is provided by FirstEnergy Corp. subsidiary Mon Power through a 138 kV transmission line.
15.4 WATER
The Tygart Valley River lies to the west of the Leer Property. The Tygart Valley River is not navigable for commercial traffic. Over half of the water required for mine operations such as mine dust suppression and preparation plant make up water is provided by recycling. The remainder is provided by a pump station installed beside Three Fork Creek, a tributary of Tygart Valley River, and is pumped to a million-gallon head tank. There is no contract or monthly charge for the water from Three Fork Creek. Potable water for the facilities is obtained from the Taylor County Public Service District at an average monthly charge of $12,000.
Water for Leer South is sourced from local streams and groundwater from an old abandoned mine. Additional water may be obtained from the toe of the refuse impoundment for use in the mine and plant.
15.5 PIPELINES
A water pipeline from the Taylor County Public Service District provides potable water to the Leer offices and bathhouse facilities.
There is no natural gas service to any of the Leer Complex facilities.
Weir Technical Report Summary
Leer Complex
Prepared for Core Natural Resources, Inc.
15.6 PORT FACILITIES, DAMS, AND REFUSE DISPOSAL
Port Facilities
Core ships the Leer and Leer South metallurgical coal to either the CONSOL Marine Terminal, CSX Chesapeake Coal Terminal, or the Dominion Terminal Associates LLP (DTA) for export to customers.
The CONSOL Marine Terminal (CMT) is 100 percent owned by Core and is located at the Port of Baltimore. CMT can either store coal or load coal directly into vessels from rail cars. It is also the only major east coast United States coal terminal served by two Class I railroads, Norfolk Southern and CSX. The CONSOL Marine Terminal has storage capacity of 1.1 million tons with more than thirty acres of capacity for stockpiles. The facility possesses blending capabilities, and it has transloaded approximately 14.7 million tons of coal per year on average over the past five years, with a throughput capacity of approximately 20 million tons. The facility primarily serves international customers.
CSX owns and operates the CSX Chesapeake Coal Terminal transshipping facility located at Curtis Bay, Maryland and is the primary facility used by the Leer and Leer South mines. Core Sales, LLC, (Core Sales) a subsidiary of Core, has a rail contract and throughput arrangement with CSX, with dedicated storage capacity of approximately 200,000 tons of saleable coal. The CSX Chesapeake Coal Terminal serves as a transload facility for the export of utility and metallurgical coals and is served by the CSX rail line. Annual throughput capacity of the CSX facility is 11 to 13 million tons.
The DTA coal shipping and ground storage facility is located in the port of Hampton Roads on the East Bank of the James River in Newport News, Virginia. DTA has state-of-the-art sampling and blending systems. Core, through its subsidiary, Ashland Terminals, owns 35 percent of DTA, with the remainder owned by Alpha Metallurgical Resources, Inc. CSX delivers unit trains from eastern United States coal mines and DTA has ground storage capacity of 1.7 million tons, with coal segregated in storage areas by coal type and shipper. Core controls approximately 600,000 square feet of ground storage space and depending on the number of stockpiles can store between 350,000 and 560,000 tons of coal.
DTA accommodates seagoing vessels, coastal barges, and colliers of up to 177,000 DWT. The pier length is 1,162 feet with berths for loading on either side. Both berths are dredged to a mean low water depth of 50 feet to match the harbor channel.
Weir Technical Report Summary
Leer Complex
Prepared for Core Natural Resources, Inc.
Dams and Refuse Disposal
At both Leer and Leer South, coarse refuse is conveyed to the refuse disposal site and fine refuse is pumped from the preparation plant thickener to a designed slurry cell at the refuse disposal area. Coarse refuse capacity at Leer is projected to last through May 2031 at which time Leer will have permitted and constructed a new refuse site in Rocky Branch. The Rocky Branch Impoundment WVDEP Article 3 permit is expected in the first quarter of 2026 and 404 permit in 2027, with construction of the embankment for the new impoundment expected to begin in January 2028. There is adequate coarse and fine refuse disposal capacity at Rocky Branch to serve the Leer LOM Plan.
The Leer South Refuse site is currently working on Stage 5D and also placing coarse refuse in the Sidehill Fill and Rear Hollow Fills A and B, while the permit is currently approved through Stage 7. The permit for Stages 8 & 9 will be submitted in the first quarter of 2026.
Leer West will likely construct a combined refuse pile.
15.7 MAP OF INFRASTRUCTURE
The Leer infrastructure is summarized below on Figure 15.7-1, with a detailed map provided on Exhibit 15.7.-1.
The Leer South infrastructure is summarized below on Figure 15.7-2, with a detailed map provided on Exhibit 15.7.-2.
The Leer West infrastructure is summarized below on Figure 15.7-3, with a detailed map provided on Exhibit 15.7.-3.
Weir Technical Report Summary
Leer Complex
Prepared for Core Natural Resources, Inc.
Figure 15.7-1 Leer Mine Infrastructure
Weir Technical Report Summary
Leer Complex
Prepared for Core Natural Resources, Inc.
Figure 15.7-2 Leer South Mine Infrastructure
Weir Technical Report Summary
Leer Complex
Prepared for Core Natural Resources, Inc.
Figure 15.7-3 Leer West Mine Planned Infrastructure
Weir Technical Report Summary
Leer Complex
Prepared for Core Natural Resources, Inc.
16.0 MARKET STUDIES
16.1 MARKETS
Overview
Leer and Leer South produce a high quality, High Vol metallurgical coal. Historically, the market for metallurgical coal from the Leer Complex has been domestic metallurgical coal consumers and the global seaborne metallurgical coal market. Production from the Leer and Leer South mines is a High Vol A coal, as well as a middlings product.
High Vol metallurgical coal contains more than 31 percent volatile matter and is typically represented as High Vol A and High Vol B coal. High Vol metallurgical coal, primarily High Vol A and B coals, serve both the domestic and global seaborne metallurgical coal markets.
The typical metallurgical coal product specifications for the Leer, Leer South and planned Leer West mines are summarized in Table 16.1-1 as follows:
Table 16.1-1 Typical Metallurgical Coal Product Specifications
|
|
|
|
|
|
|
|
|
|
|
|
|
|
|
|
|
|
|
|
|
|
|
|
|
Leer |
|
Leer |
|
|
Leer |
|
South |
|
West (1) |
| Moisture |
%, ar |
8.5 |
|
|
8.0 |
|
|
8.5 |
|
| Ash |
%, db |
7.5 |
|
|
7.5 |
|
|
7.5 |
|
| Volatile Matter |
%, db |
33.2 |
|
|
33.9 |
|
|
33.4 |
|
| Fixed Carbon |
%, db |
59.3 |
|
|
58.6 |
|
|
59.1 |
|
| Sulfur |
%, db |
1.1 |
|
|
1.1 |
|
|
1.1 |
|
| Reflectance |
%Ro |
1.03 |
|
|
1.00 |
|
|
1.02 |
|
| Max Fluidity |
DDPM |
30,000 |
|
|
30,000 |
|
|
30,000 |
|
| FSI |
|
8 |
|
|
8 |
|
|
8 |
|
| CSR |
|
69 |
|
|
68 |
|
|
68 |
|
|
|
|
|
|
|
|
| (1) Projected |
|
|
|
|
|
|
Metallurgical Historical Coal Sales Prices
Coal sales prices are influenced by many factors, including domestic supply and demand, global supply and demand dynamics, productivity, cost of competing fuels, transportation, and inflation, both mining cost inflation and general inflation.
Weir Technical Report Summary
Leer Complex
Prepared for Core Natural Resources, Inc.
The market for United States metallurgical coal consists of both domestic metallurgical coal consumers and exports into the global seaborne metallurgical coal market. The United States Energy Information Administration (EIA) compiles average historical price data for metallurgical coal delivered to domestic coke plants and metallurgical coal delivered to tidewater terminals for export. Note that the EIA data includes all classifications of metallurgical coal (high, mid and low volatile) as well as both spot and contract sales prices. The historical prices for metallurgical coal are shown on Figure 16.1-1 as follows:
Figure 16.1-1 Metallurgical Coal Sales Prices
Source: EIA Quarterly Coal Report
Between 2020 and Second Quarter 2025, export prices (FOB Port) and domestic coke plant prices (delivered cost) have averaged $180.10 and 170.53 per ton, respectively.
Strong ongoing demand is expected for the Leer Complex metallurgical coal over the next two decades and across the remaining life of the Leer Complex reserve base. The primary driver for this is a positive outlook on global steel production over this timeframe, coupled with ongoing degradation and depletion of high-quality metallurgical coal reserves around the world. While new metallurgical coal mines have come online (Warrior Coal’s Blue Creek Mine and Allegheny Met’s Longview Mine), numerous other metallurgical coal producers have announced idling and/or curtailing production at their mines in 2025 (Alpha Metallurgical Resources, Civil, LLC, Coronado Coal, Ramaco Resources, and United Coal Company).
Weir Technical Report Summary
Leer Complex
Prepared for Core Natural Resources, Inc.
On the demand side, it is expected that there will be robust, ongoing increases in steel production in developing economies such as India, coupled with relatively stable demand requirements in already developed economies such as Europe and the United States. Importantly, the developing world is expected to continue to be highly reliant on “new steel” (i.e. steel produced in blast furnaces using coke made from metallurgical coal) as opposed to recycled steel produced in electric arc furnaces that rely primarily on electricity and scrap metal. This assumption is based on the understanding that developing economies are still at the outset of the industrial development curve and have little scrap available for recycling purposes. Moreover, high-quality steel produced in blast furnaces is expected to continue to dominate key steel market segments, including automotive.
In 2025, integrated steel production using coke made from metallurgical coal is responsible for 70 percent of global steel supply, and this is expected to remain relatively stable in the near to intermediate term0F1. In addition, a significant amount of new steel will be required in a de-carbonizing world, given steel’s importance in urbanization, infrastructure replacement and the construction of essential de-carbonization tools such as mass transit systems, wind turbines and electric vehicles. Moreover, the highest-quality metallurgical coals will continue to enjoy a significant advantage in the marketplace, for several reasons. First, the use of high-quality coking coals in coke blends facilitates the most efficient, and thus lowest carbon, steel-making process. Second, the Leer Complex metallurgical coal product is particularly valuable to steelmakers seeking to produce a strong coke despite the use of a wide range of metallurgical coals in their coke blends. Finally, the highly competitive cost structure of the Leer Complex means that it can remain competitive, and continue to earn an attractive margin, even during challenging market environments, or in the event that metallurgical demand should begin to contract at some point in the future.
The 2024 through September 2025 actual and 2026 through 2063 forecasted coal sales price for the Leer Complex utilized in the LOM Plan financial model is shown on Figure 16.1-2.
1 Article from Cabaro Group, A Global Perspective: World Steel Production by Process
Weir Technical Report Summary
Leer Complex
Prepared for Core Natural Resources, Inc.
Figure 16.1-2 Historical and Forecast Coal Sales Price
Note: 2024 through September 2025 are actual
The projected coal sales price in the PFS is based on a High Vol A benchmark of $176.96 per metric tonne. Once converted to short tons, adjusted for transportation and the inclusion of middling coal sales at $35.00 per ton, the estimated LOM Plan FOB Mine price is $122.00 per ton.
16.2 MATERIAL CONTRACTS
The Leer Complex saleable product is marketed by Core Sales LLC, a subsidiary of Core. Core Sales is located in Canonsburg, Pennsylvania. Most of the sales contracts are 12 months in length. North American contracts are typically on a calendar year basis while most of the international coal sales contracts are on a fiscal year beginning in April.
The Leer Complex 2024 and 2025 metallurgical and middling coal sales by mine are shown in Table 16.2-1.
Weir Technical Report Summary
Leer Complex
Prepared for Core Natural Resources, Inc.
Table 16.2-1 Historical Coal Sales
|
|
|
|
|
|
|
|
|
|
|
|
|
|
|
|
|
Sales (000 tons) |
| Mine |
|
2024 |
|
2025 (1) |
| Leer |
|
3,828 |
|
3,803 |
| Leer South |
|
2,625 |
|
500 |
|
|
6,453 |
|
4,303 |
|
|
|
|
|
| (1) Actual through September. |
Core Sales has a long-term contract with CSX Corporation for export shipments and throughput at the Curtis Bay Terminal in Baltimore, Maryland. In addition, Core owns the Consol Marine Terminal in Baltimore, Maryland, which is also used for exporting the Leer Complex coal. As a general rule, most North American customers hold their own rail contracts.
16.3 PRICE FORECAST
Leveraging the historical marketing and selling of Leer Complex coal production, WEIR prepared coal sales forecasts for the planned LOM production. The Leer Complex High Vol A metallurgical and middlings product overall average price realization per ton from 2026 through 2063 for the Leer Complex is expected to be $122.00 per ton.
Weir Technical Report Summary
Leer Complex
Prepared for Core Natural Resources, Inc.
17.0 ENVIRONMENTAL STUDIES, PERMITTING, AND LOCAL INDIVIDUALS OR GROUPS AGREEMENTS
17.1 ENVIRONMENTAL STUDIES
As part of the permitting process required by the WVDEP, numerous baseline studies or impact assessments were undertaken by Core. These baseline studies or impact assessments included in the permit are summarized as follows:
•Groundwater Inventory
•Surface Water Quality and Quantity
•Probable Hydrologic Consequences
WEIR has reviewed the Leer Complex permits but have not independently conducted any environmental studies. WEIR is familiar with Core’s environmental practices, which are consistent with industry standards regarding compliance with applicable mining, water quality, and environmental regulations.
17.2 REFUSE DISPOSAL AND WATER MANAGEMENT
Refuse Disposal
The Leer Slurry Impoundment (MSHA ID No. WV03-09191-01) is classified as a high hazard potential structure that provides for the disposal of about 38 million cubic yards of coarse coal refuse (CCR) and 17 million cubic yards of fine coal refuse (FCR) over the anticipated life of Leer. Both CCR and FCR will be placed in the Leer Slurry Impoundment. The current impoundment plan provides for 10 stages of refuse disposal construction.
Construction of the Rocky Branch impoundment is expected to commence in January 2028. Total cumulative FCR and CCR storage through the LOM Plan is estimated at 94.2 million tons. If required, the Rocky Branch site could store an additional 62.0 million tons of FCR and CCR.
Leer South developed a slurry impoundment south of the preparation plant. The Leer South refuse site is currently constructing Stage 5d, with 7 stages approved. Expansion to Stages 8 and 9 is planned, with permitting to commence in 2026. Based on projected recovery rates, Core reports that the impoundment will be sufficient to contain life-of-mine capacity requirements.
Weir Technical Report Summary
Leer Complex
Prepared for Core Natural Resources, Inc.
Water Management
Water monitoring and management at the Leer Complex is conducted consistent with approved operating permits. To enhance compliance and operational efficiency, Leer has installed a remote monitoring and management system. Leer's water management program is further supported by internal work practice and environmental operating procedures. Cameras and lights have been installed at strategic locations to allow for visual monitoring of chemical tanks, ponds, and outlets 24 hours a day.
Post-closure water management will be conducted per the operating permits as detailed in Section 17.5.
17.3 PERMITS AND BONDING
Coal mines in West Virginia are required to file applications for and receive approval of mining permits issued by the WVDEP to conduct surface disturbance and mining activities. Mining permits generally require that the permittee post a performance bond in an amount established by the regulatory program to provide assurance that any disturbance or liability created during mining operations is properly restored to an approved post-mining land use and that all regulations and requirements of the permits are fully satisfied before the bond is returned to the permittee. Significant penalties exist for any permittee who fails to meet the obligations of the permits including cessation of mining operations, which can lead to potential forfeiture of the bond. Any company, and its directors, owners and officers, which are subject to bond forfeiture can be denied future permits under the program according to the Applicant Violator System administered by the Federal Office of Surface Mining.
The Leer Complex has been issued mining permits and associated NPDES permits by the WVDEP as shown in Table 17.3-1 as follows:
Weir Technical Report Summary
Leer Complex
Prepared for Core Natural Resources, Inc.
Table 17.3-1 Leer Complex Mining and NPDES Permits
|
|
|
|
|
|
|
|
|
|
|
|
|
|
|
|
|
|
|
|
|
|
|
|
|
|
|
|
|
|
|
Permitted |
|
|
|
|
|
|
|
|
Surface |
|
|
|
|
|
|
|
|
Area |
|
Issue |
|
NPDES |
| Complex |
|
Permit Number |
|
(Acres) |
|
Date |
|
Permit No. |
| Leer |
|
U-2004-06 |
|
201.10 |
|
10/8/2025 |
|
WV1017764 |
|
|
O-2017-06 |
|
315.14 |
|
4/18/2022 |
|
WV1017764 |
|
|
O-2001-24 |
|
251.67 |
|
Pending |
|
|
|
|
|
|
767.91 |
|
|
|
|
|
|
|
|
|
|
|
|
|
| Leer South |
|
U-15-83 |
|
209.45 |
|
1/24/1983 |
|
WV0043273 |
|
|
O-113-83 |
|
461.73 |
|
8/11/1983 |
|
WV0043273 |
|
|
|
|
671.18 |
|
|
|
|
|
|
|
|
|
|
|
|
|
| Leer West |
|
U-2006-12 |
|
207.65 |
|
6/22/2022 |
|
WV1025783 |
|
|
O-2001-17 |
|
239.00 |
|
12/10/2019 |
|
WV1025783 |
|
|
|
|
446.65 |
|
|
|
|
The permits designated with a U include the areas for the preparation plant, underground mine and associated support facilities and infrastructure. Permits designated with an O include the area for the coarse refuse or slurry cell and associated drainage structures.
The associated NPDES permits are required to allow discharges of water from the permit areas and require submittal of bi-monthly water samples to ensure the discharges are within allowable water quality standards.
Core has the necessary permits in place to support current production at the Leer Complex, but future permits or permit revisions will be required to maintain and expand production. Exploration permits will likely be required from time to time. Property under lease includes provisions for exploration among the terms of the lease.
New or modified mining permits are subject to a public advertisement process and comment period, and the public is provided an opportunity to raise objections to any proposed mining operation. WEIR is not aware of any specific prohibition of mining on the Leer Complex property and given sufficient time and planning, Core should be able to secure new permits to maintain its planned mining operations according to current regulations.
The current permit numbers, bond amounts and reclamation liability for each permit are shown in Table 17.3-2 as follows:
Weir Technical Report Summary
Leer Complex
Prepared for Core Natural Resources, Inc.
Table 17.3-2 Leer Complex Permitted Area, Reclamation Liability and Bonds
|
|
|
|
|
|
|
|
|
|
|
|
|
|
|
|
|
|
|
|
|
|
|
|
|
|
|
|
|
|
|
Permitted |
|
|
|
|
|
|
|
|
Surface |
|
Reclamation |
|
Bond |
|
|
Permit |
|
Area |
|
Liability (1) |
|
Amount |
| Complex |
|
Number |
|
(Acres) |
|
($000) |
|
($000) |
| Leer |
|
U-2004-06 |
|
201.10 |
|
14,217 |
|
8,079 |
|
|
O-2017-06 |
|
315.14 |
|
9,349 |
|
1,155 |
|
|
Highway Use Bonds |
|
— |
|
— |
|
375 |
|
|
Gas Well Bond |
|
— |
|
— |
|
50 |
|
|
|
|
516.24 |
|
23,566 |
|
9,659 |
|
|
|
|
|
|
|
|
|
| Leer South |
|
U-15-83 |
|
209.45 |
|
5,414 |
|
393 |
|
|
O-113-83 |
|
461.73 |
|
15,405 |
|
1,516 |
|
|
Highway Use Bonds |
|
— |
|
— |
|
128 |
|
|
Gas Well Bond |
|
— |
|
— |
|
50 |
|
|
|
|
671.18 |
|
20,819 |
|
2,087 |
|
|
|
|
|
|
|
|
|
| Leer West |
|
U-2006-12 |
|
207.65 |
|
— |
|
14 |
|
|
O-2001-17 |
|
239.00 |
|
— |
|
126 |
|
|
|
|
446.65 |
|
|
|
140 |
|
|
|
|
|
|
|
|
|
| Leer Complex |
|
|
|
1,634 |
|
44,386 |
|
11,885 |
|
|
|
|
|
|
|
|
|
| (1) Represents the undiscounted cash flows to satisfy reclamation as of July 2025 |
17.4 LOCAL STAKEHOLDERS
As previously stated in Section 13.5 of this TRS, Core currently employs approximately 425 to 500 personnel at each of the mining operations. Leer West, once operating, is also projected to have approximately 425 to 500 personnel. The mines also create substantial economic value with its third-party service and supply providers, utilities and through payment of taxes and fees to governmental agencies.
The Leer Complex is located in a rural and fairly isolated area of West Virginia. Reportedly there have been no social or community impact issues relative to the Leer Complex for several years.
Weir Technical Report Summary
Leer Complex
Prepared for Core Natural Resources, Inc.
17.5 MINE CLOSURE PLANS
Applicable regulations require that mines be properly closed, and reclamation commenced immediately upon abandonment. Within 180 days after the mining operations are complete, site reclamation activities will commence, which include removal of structures, backfilling, regrading, including selected areas that will be reclaimed to near Approximate Original Contour (AOC) configuration. Other areas will be left in place as per the approved alternate post-mining land use requests. After the permit area has been graded, soil analysis will be performed to determine the quantity of agricultural limestone, or an equivalent supplement, and fertilizer necessary to achieve the post-mining land use. A soil analysis will be performed prior to seeding for each phase of mine reclamation.
In general, sediment control is required during the re-establishment of vegetation, and bond release generally requires a minimum five-year period of site maintenance, water sampling, and sediment control following mine completion. Reclamation of underground mines includes closure and sealing of mine openings such as portals and shafts in addition to the items listed above.
Estimated costs for mine closure, including water quality monitoring during site reclamation, are included in the preliminary feasibility model. WEIR found Core’s Asset Retirement Obligations (ARO) estimations to be reasonable. As with all mining companies, an accretion calculation is performed annually so the necessary ARO can be shown as a Liability on the company’s Balance Sheet.
The current permit number, permitted surface area, end of mine reclamation liability estimated by Core, bond number, and bond amount is shown above in Table 17.3-2. The Leer Complex total bond amount of $11.9 million is based on the WVDEP bond requirements.
17.6 ENVIRONMENTAL COMPLIANCE, PERMITTING, AND LOCAL INDIVIDUALS OR GROUPS ISSUES
The Leer Complex has a good compliance record without a history of significant fines or violations. The last violation at Leer was in June 2025 with an assessed penalty of $4,663. Leer South has not had an environmental violation since March of 2022 and there have been no violations issued for Leer West. As an indicator of Leer’s attention to environmental compliance, Leer was presented the Good Neighbor Award from the Office of Surface Mining Reclamation & Enforcement on October 21, 2019.
Weir Technical Report Summary
Leer Complex
Prepared for Core Natural Resources, Inc.
The number of environmental violations issued is low for a coal mining operation the size of the Leer Complex.
As is common with all mining permits, the potential exists for third parties, such as non-governmental and watershed organizations, to appeal permit decisions issued by the WVDEP. Historically, objections alleging that mining operations have the potential to cause material environmental damage have not prevented permit issuance.
Based on WEIR’s review of Core’s plans for environmental compliance, permit compliance and conditions, and dealings with local individuals and groups, Core’s efforts appear to be adequate and reasonable in order to maintain and obtain approvals necessary relative to the execution of the Leer Complex LOM Plans.
17.7 LOCAL PROCUREMENT AND HIRING COMMITMENTS
While no targets for local procurement and hiring have been formalized, the majority of the workforce at the Leer and Leer South mines reside in the local areas. In addition, to further support the local economies, the mines routinely utilize the services of vendors and suppliers located in the vicinity of the operations.
Weir Technical Report Summary
Leer Complex
Prepared for Core Natural Resources, Inc.
18.0 CAPITAL AND OPERATING COSTS
Core provided historical operating costs and capital expenditures for the Leer Complex, which were an adequate check and basis for the LOM Plan cost projections. The operating costs and capital expenditures are included in the financial statements that are audited annually by Ernst & Young LLP for Core’s 10-K reporting to the SEC. The auditing performed by Ernst & Young, LLP is conducted in accordance with the standards of the Public Company Accounting Oversight Board.
18.1 CAPITAL EXPENDITURES
The Leer Complex will require capital to be expended each year for infrastructure additions/extensions, as well as for mining equipment rebuilds/replacements to continue to produce coal at currently projected annual levels of production.
Actual capital expenditures for 2024 through September 2025 and projected capital expenditures, in 2025 dollars, for 2026 through 2063, are shown in Table 18.1-1.
Table 18.1-1 Leer Complex Historical and Projected LOM Plan Capital Expenditures
|
|
|
|
|
|
|
|
|
|
|
|
|
|
|
|
|
|
|
|
|
Capital Expenditures |
|
|
|
($000) |
|
($/Ton) |
| Actual |
2024 |
|
89,740 |
|
13.91 |
|
2025 (1) |
|
47,236 |
|
10.98 |
|
|
|
136,976 |
|
12.73 |
|
|
|
|
|
|
| LOM Plan (2) |
2026 |
|
81,789 |
|
12.01 |
|
2027 |
|
110,020 |
|
15.31 |
|
2028 |
|
72,894 |
|
10.24 |
|
2029 |
|
74,426 |
|
11.29 |
|
2030 |
|
126,656 |
|
17.96 |
|
2031 |
|
132,326 |
|
19.02 |
|
2032 |
|
281,437 |
|
45.29 |
|
2033 |
|
283,961 |
|
39.42 |
|
2034 |
|
68,477 |
|
8.26 |
|
2035 |
|
67,154 |
|
7.40 |
|
2036 |
|
50,726 |
|
7.33 |
|
2037 |
|
47,706 |
|
7.20 |
|
2038 |
|
44,379 |
|
7.24 |
|
2039 |
|
49,277 |
|
7.63 |
|
2040 |
|
33,127 |
|
5.35 |
Weir Technical Report Summary
Leer Complex
Prepared for Core Natural Resources, Inc.
|
|
|
|
|
|
|
|
|
|
|
|
|
|
|
|
|
|
|
|
|
Capital Expenditures |
|
|
|
($000) |
|
($/Ton) |
|
2041 |
|
32,906 |
|
5.44 |
|
2042 |
|
20,186 |
|
3.19 |
|
2043 |
|
18,666 |
|
6.62 |
|
2044 |
|
18,666 |
|
6.05 |
|
2045 |
|
18,666 |
|
6.18 |
|
2046 |
|
18,666 |
|
5.65 |
|
2047 |
|
18,666 |
|
6.59 |
|
2048 |
|
18,666 |
|
6.55 |
|
2049 |
|
18,666 |
|
5.88 |
|
2050 |
|
18,666 |
|
6.10 |
|
2051 |
|
18,666 |
|
6.28 |
|
2052 |
|
18,666 |
|
6.49 |
|
2053 |
|
18,666 |
|
5.73 |
|
2054 |
|
18,666 |
|
5.72 |
|
2055 |
|
18,666 |
|
5.70 |
|
2056 |
|
18,666 |
|
7.10 |
|
2057 |
|
18,666 |
|
6.69 |
|
2058 |
|
18,666 |
|
6.81 |
|
2059 |
|
18,666 |
|
7.13 |
|
2060 |
|
18,666 |
|
6.40 |
|
2061 |
|
18,666 |
|
6.40 |
|
2062 |
|
18,666 |
|
6.40 |
|
2063 |
|
1,867 |
|
0.68 |
|
LOM Plan |
|
1,952,635 |
|
10.89 |
|
|
|
|
|
|
| (1) September 2025 YTD |
| (2) Includes 10 percent contingency |
Core mine management has had several years of experience estimating capital expenditures for longwall mining and the risk of inaccurate estimates is low. The LOM Plan projected average capital cost of $10.89 per ton is $0.57 per ton lower than the historical average of $11.46 per ton. Capital expenditures estimates per annual ton have an accuracy within ±15.0 percent with a contingency of 10 percent.
Contingency costs account for undeveloped scope and insufficient data. Contingency for required major projects and mining equipment is estimated at ±10 percent and is intended to cover unallocated costs from lack of detailing in scope items. It is a compilation of aggregate risk from estimated cost areas.
18.2 OPERATING COSTS AND RISKS
Weir Technical Report Summary
Leer Complex
Prepared for Core Natural Resources, Inc.
Operating costs are projected based on historical operating costs and adjusted based on projected changes in staffing, hours worked, production, and productivity for mining areas in the LOM Plan. The Leer and Leer South mines actual and the Leer Complex LOM Plan projected operating costs in dollars per ton sold, are shown in Table 18.2-1.
Weir Technical Report Summary
Leer Complex
Prepared for Core Natural Resources, Inc.
Table 18.1-2 Leer Complex Historical and Projected LOM Plan Operating Costs
|
|
|
|
|
|
|
|
|
|
|
|
|
|
|
|
|
|
|
|
|
|
|
Operating Cost |
|
|
Cash |
|
Non-Cash |
|
Total |
| 2024 (1) |
|
78.92 |
|
23.96 |
|
102.88 |
| 2025 (2) |
|
80.28 |
|
34.34 |
|
114.62 |
| 2026 |
|
80.74 |
|
31.56 |
|
112.30 |
| 2027 |
|
72.93 |
|
31.47 |
|
104.40 |
| 2028 |
|
73.32 |
|
31.33 |
|
104.65 |
| 2029 |
|
79.05 |
|
32.50 |
|
111.55 |
| 2030 |
|
79.14 |
|
31.25 |
|
110.39 |
| 2031 |
|
79.90 |
|
32.13 |
|
112.03 |
| 2032 |
|
91.74 |
|
37.47 |
|
129.21 |
| 2033 |
|
84.32 |
|
33.61 |
|
117.93 |
| 2034 |
|
66.21 |
|
29.52 |
|
95.73 |
| 2035 |
|
74.19 |
|
27.27 |
|
101.46 |
| 2036 |
|
73.52 |
|
19.14 |
|
92.66 |
| 2037 |
|
76.12 |
|
20.40 |
|
96.52 |
| 2038 |
|
81.11 |
|
22.48 |
|
103.59 |
| 2039 |
|
76.96 |
|
21.78 |
|
98.74 |
| 2040 |
|
78.64 |
|
23.11 |
|
101.75 |
| 2041 |
|
77.98 |
|
23.67 |
|
101.65 |
| 2042 |
|
69.47 |
|
23.02 |
|
92.49 |
| 2043 |
|
70.54 |
|
16.59 |
|
87.13 |
| 2044 |
|
65.37 |
|
15.16 |
|
80.53 |
| 2045 |
|
67.14 |
|
15.50 |
|
82.64 |
| 2046 |
|
61.51 |
|
14.16 |
|
75.67 |
| 2047 |
|
65.51 |
|
16.51 |
|
82.02 |
| 2048 |
|
64.08 |
|
16.41 |
|
80.49 |
| 2049 |
|
60.38 |
|
14.74 |
|
75.12 |
| 2050 |
|
62.82 |
|
15.28 |
|
78.10 |
| 2051 |
|
63.91 |
|
15.74 |
|
79.65 |
| 2052 |
|
65.55 |
|
16.26 |
|
81.81 |
| 2053 |
|
59.11 |
|
14.36 |
|
73.47 |
| 2054 |
|
58.37 |
|
14.13 |
|
72.50 |
| 2055 |
|
58.24 |
|
13.14 |
|
71.38 |
| 2056 |
|
66.27 |
|
15.19 |
|
81.46 |
| 2057 |
|
65.71 |
|
10.96 |
|
76.67 |
| 2058 |
|
65.54 |
|
7.79 |
|
73.33 |
| 2059 |
|
69.72 |
|
8.15 |
|
77.87 |
| 2060 |
|
63.53 |
|
7.32 |
|
70.85 |
| 2061 |
|
55.38 |
|
7.32 |
|
62.70 |
| 2062 |
|
54.23 |
|
7.32 |
|
61.55 |
| 2063 |
|
53.66 |
|
6.79 |
|
60.45 |
|
|
71.67 |
|
22.85 |
|
94.52 |
|
|
|
|
|
|
|
| (1) Actual |
| (2) Actual through September |
Weir Technical Report Summary
Leer Complex
Prepared for Core Natural Resources, Inc.
Descriptions or explanations of the operating costs considered in the LOM Plan are as follows:
Cash Cost:
•Labor cost includes wages and benefits for hourly and salary personnel at the mine and preparation plant
•Contract mining includes payments for third party companies providing mining labor, although not projected in the LOM Plan
•Maintenance and repair are expenses related to upkeep of mining equipment and associated infrastructure
•Tires and Tubes are expenses primarily related to rubber tired mobile equipment
•Operating supplies are various items used for mine operations and the preparation plant
•Drilling and Roof Support are expenses related to installation of roof bolts, timbers and crib material
•Explosives are expenses related to blasting rock material when mining equipment becomes stuck between the roof and floor or to create additional cavity height for ventilation overcasts or belt conveyor drives
•Utilities are expenses related primarily to purchase of power to operate electrical equipment in the mine and preparation plant, telephone and data lines, water, and garbage services
•Fuels and lubes are expenses related to diesel fuel, gasoline, motor oil and grease
•Equipment leases and rent are expenses related to copier machines, roller for the refuse area and occasionally rental of a telehandler
•Taxes and insurance are expenses related to sales taxes on purchased goods and services and to property and liability insurance for risk management purposes
•Miscellaneous/contract services include items such as security services and fines and penalties
•Capitalized costs primarily include longwall items that are replaced or rebuilt between longwall panels that are amortized over the life of the longwall panel
•Coal Inventory change represents the difference in value of the coal and parts and supplies inventory between one accounting period and the next period
•Black Lung Excise Tax, OSM and West Virginia Reclamation Tax, and West Virginia Severance Tax
•Royalties are expenses paid to mineral owners that lease property to the Leer Complex
Weir Technical Report Summary
Leer Complex
Prepared for Core Natural Resources, Inc.
Non-Cash Costs:
•Reclamation change, Depreciation, Development, and Depletion
The LOM Plan projected cost of sales of $71.67 per ton is $7.79 per ton lower than the 2024 through September 2025 historical average of $79.46 per ton. With the long history of cost of sales, no contingency is included, although the accuracy of the LOM Plan projected cost of sales should be considered to be within 10 percent of the historical average.
Capital and Operating Cost Estimation Risk
The Leer and Leer South mines commenced operations in 2011 and 2018, respectively, and therefore have substantial experience in estimating capital and operating costs of the mines. Since the mining operations will continue in the same coal seam and mined in the same manner as historically, there is little risk associated with the specific engineering estimation methods used to arrive at projected capital and operating costs. An assessment of accuracy of estimation methods is reflected in the sensitivity analysis in Section 19.3 of this TRS.
For purposes of the PFS completed relative to the Leer Complex LOM Plan, capital costs are estimated to an accuracy of ±15 percent with a contingency of 10 percent and operating costs are estimated with an accuracy of ±10 percent with no contingency.
Weir Technical Report Summary
Leer Complex
Prepared for Core Natural Resources, Inc.
19.0 ECONOMIC ANALYSIS
19.1 ASSUMPTIONS, PARAMETERS, AND METHODS
WEIR prepared a PFS financial model in order to assess the economic viability of the Leer Complex LOM Plan reserves. Specifically, plans were evaluated using discounted cash flow analysis, which consists of annual revenue projections for the Leer Complex LOM Plans. Cash outflows such as capital, including preproduction costs, sustaining capital costs, operating costs, transportation costs, and taxes are subtracted from the inflows to produce the annual cash flow projections. Non-cash charges are also considered to determine pre-tax income. Income taxes are calculated for periods with positive income. After tax cash flows are recognized to occur at the end of each period. There is no adjustment for inflation in the financial model, all cash flows are in 2025 dollars. WEIR’s study is conducted on an un-levered basis, excluding costs associated with any debt service requirements.
To reflect the time value of money, annual net cash flow projections are discounted back to the project valuation date, using a discount rate of 12.5 percent. The discount rate appropriate to a specific project depends on many factors, including the type of commodity and the level of project risks, such as market risk, technical risk, and political risk. The discounted present values of the cash flows are summed to arrive at the project’s NPV.
Projected cash flows do not include allowance of any potential salvage value. Additionally, capital previously expended (sunk cost) is not included in the assessment of economic returns.
Royalties are forecasted based on mineral lease rates and anticipated mine plan progression through various lease boundaries within the Leer Complex resource area.
In addition to NPV, the IRR is also calculated. The IRR is defined as the discount rate that results in an NPV equal to zero. Payback Period is calculated as the time required to achieve positive cumulative cash flow for the project at a 12.5 percent discount rate. As the Leer Complex is ongoing with no initial investment required (i.e. already sunk cost), payback period is less than one year.
Weir Technical Report Summary
Leer Complex
Prepared for Core Natural Resources, Inc.
The PFS financial model developed for use in this TRS is meant to evaluate the prospects of economic extraction of coal within the Leer Complex resource area. This economic evaluation is not meant to represent a project valuation. Furthermore, optimization of the LOM plans was outside of the scope of this engagement.
The Leer Complex actual and LOM Plan coal sales price forecasts used to estimate revenue are shown on Figure 19.1-1.
Figure 19.1-1 Coal Sales Price Forecast
Note: 2024 through September 2025 are actual
The projected coal sales price in the PFS is based on a High Vol A benchmark for metallurgical coal of $141.32 per metric tonne. Once converted to short tons, adjusted for transportation and the inclusion of middling coal sales, the estimated LOM Plan FOB Mine price is $122.00 per ton.
19.2 ECONOMIC ANALYSIS AND ANNUAL CASH FLOW FORECAST
The annual cash flow for the Leer Complex LOM Plan is shown on Figure 19.2-1 as follows:
Weir Technical Report Summary
Leer Complex
Prepared for Core Natural Resources, Inc.
Figure 19.2-1 Annual Cash Flow Forecast
The negative cashflows in 2032 and 2033 are associated with the projected development and startup of Leer West while the negative cashflows shown in 2064 and 2065 are associated with the final closure and reclamation of Leer West following completion of planned coal mining in 2063.
The Leer Complex LOM Plan has an after-tax NPV of $1.3 billion, at the base case discount rate of 12.5 percent (Table 19.2-1). As the Leer Complex is ongoing with no initial investment required (i.e. already sunk cost), the IRR is infinite. Core has not determined a commencement date of Leer West, however, for the purposes of determining economic viability, WEIR projected production commencing in 2031. Cumulative (undiscounted) cash flow over the LOM Plan is positive, at $5.7 billion. The Return on Investment (ROI), at the 12.5 percent discount rate, is 60 percent.
The after-tax NPV, IRR, cumulative cash flow and ROI are summarized in Table 19.2-1 as follows:
Table 19.2-1 After-Tax NPV, IRR Cumulative Cash Flow, and ROI
|
|
|
|
|
|
|
LOM Plan |
| NPV ($000) |
1,269,365 |
| IRR (%) |
Infinite |
| Cumulative Cash Flow ($000) |
5,747,140 |
| Return on Investment (%) |
60 |
Weir Technical Report Summary
Leer Complex
Prepared for Core Natural Resources, Inc.
Table 19.2-2 presents key operational statistics for the LOM Plan on an after-tax basis. Throughout the LOM Plan, the average cost of sales is $94.52 per clean ton sold. Operating costs include direct cash costs, other cash costs, and non-cash costs.
Table 19.2-2 Key Operating Statistics
|
|
|
|
|
|
|
|
|
|
|
LOM Plan |
| ROM Tons Produced (000) |
|
474,776 |
| Clean Tons Produced (000) |
|
179,290 |
| Preparation Plant Yield (%) |
|
38 |
| Marketable Tons Sold (000) |
|
180,542 |
|
|
|
| Cash Operating Cost (000) |
|
12,939,634 |
| Capital Expenditures (000) |
|
1,952,635 |
|
|
|
|
|
($ Per Ton) |
| Coal Sales Realization |
|
122.00 |
|
|
|
| Cash Costs |
|
71.67 |
| Non-cash Costs |
|
22.85 |
| Total Cost of Sales |
|
94.52 |
|
|
|
| Profit / (Loss) |
|
27.48 |
|
|
|
| EBITDA |
|
50.33 |
|
|
|
| Capital Expenditures |
|
10.89 |
19.3 SENSITIVITY ANALYSIS
A sensitivity analysis was undertaken to examine the influence of changes to assumptions for coal sales prices, preparation plant yield, operating cost, capital expenditures, and the discount rate on the base case after-tax NPV. The sensitivity analysis range (±25 percent) was designed to capture the bounds of reasonable variability for each element analyzed. The basis for reasonable variability for each element analyzed is summarized as follows:
•Sales Price - Historical coal sales price variability of 25 percent between 2024 and September 2025
•Preparation Plant Yield - Variability in preparation plant yield data of up to 11 percent from the 2024 through September 2025 average yield
•Operating Cost - Estimated accuracy of 10 percent
Weir Technical Report Summary
Leer Complex
Prepared for Core Natural Resources, Inc.
•Capital Costs - Assumed accuracy of ±15 percent with 10 percent contingency
•Discount Rate - based on range of variability from 7.5 to 12.5 percent
Figure 19.3-1 depicts the results of the NPV sensitivity analysis.
Figure 19.3-1 Net Present Value Sensitivity Analysis
The chart above shows that the project NPV is most sensitive to changes in coal sales price, operating cost, and preparation plant yield. It is less sensitive to changes in discount rate and capital expenditures.
Weir Technical Report Summary
Leer Complex
Prepared for Core Natural Resources, Inc.
20.0 ADJACENT PROPERTIES
Geological data from Core properties outside of the Leer Complex was provided to WEIR for inclusion in the report analysis. WEIR evaluated this data using the same verification procedures WEIR used on all drillhole data within the Leer Complex. These data points have been used in the geological structure and quality modeling but are not included in Leer Complex summaries of minimum and maximum coal thicknesses and/or standard deviations. Additionally, these data points were not utilized as points of observation relative to applying resource confidence intervals. Utilizing the data outside of the Leer Complex assists in trending data through the extremities of the reserve and resource boundaries, which in turn provides a more realistic estimation of tonnage and quality along the borders of the property.
Weir Technical Report Summary
Leer Complex
Prepared for Core Natural Resources, Inc.
21.0 OTHER RELEVANT DATA AND INFORMATION
Conducting a due diligence investigation relative to the mineral and surface rights of Core’s mining operations was not part of WEIR’s scope of work. This TRS is based on Core controlling, by lease or ownership, or having the ability to acquire the coal reserves and surface lands necessary to support its mine plans.
The ability of Core, or any coal company, to achieve production and financial projections is dependent on numerous factors. These factors primarily include site-specific geological conditions, the capabilities of management and mine personnel, level of success in acquiring mineral rights and surface properties, coal sales prices and market conditions, environmental issues, securing permits and bonds, and developing and operating mines in a safe and efficient manner. Unforeseen changes in legislation and new industry developments could substantially alter the performance of any mining company.
Coal mining is carried out in an environment where not all events are predictable. While an effective management team can identify known risks and take measures to manage and/or mitigate these risks, there is still the possibility of unexpected and unpredictable events occurring. It is not possible therefore to totally remove all risks or state with certainty that an event that may have a material impact on the operation of a coal mine will not occur.
Weir Technical Report Summary
Leer Complex
Prepared for Core Natural Resources, Inc.
22.0 INTERPRETATIONS AND CONCLUSIONS
22.1 SUMMARY OF INTERPRETATIONS AND CONCLUSIONS
Interpretation
Among other United States underground metallurgical coal mines, the Leer Complex is consistently ranked within the top quartile as measured by mine productivity (tons produced per employee hour worked, as reported by MSHA). Additionally, Core has a long operating history of resource exploration, mine development, and mining operations at the Leer and Leer South mines, with extensive exploration data including drillholes, in-mine seam thickness and elevation measurements, and in-mine channel samples supporting the determination of mineral resource and reserve estimates, and projected economic viability. The data has been reviewed and analyzed by WEIR and determined to be adequate in quantity and reliability to support the coal resource and coal reserve estimates in this TRS.
The LOM Plans include projected mining in a limited number of small areas that will be encountered in later years of the LOM Plans where Core does not have mineral control. Most of these areas are expected to be acquired by Core, in adequate time, before the areas are scheduled to be mined. However, if those areas cannot be acquired, adjustments could be made to the scheduled LOM Plan to avoid those areas.
Conclusion
The coal resource and coal reserve estimates and supporting PFS were prepared in accordance with Regulation S-K 1300 requirements. There are 308.4 million in-place tons of Measured and Indicated coal resources, inclusive of reserves, and 170.2 million clean recoverable tons of underground mineable reserves within the Leer Complex, as of December 31, 2025. Reasonable prospects for economic extraction were established through the development of a PFS relative to Leer, Leer South and Leer West LOM Plans, considering historical mining performance, historical and projected metallurgical coal sales prices, historical and projected mine operating costs, and recognizing reasonable and sufficient capital expenditures.
22.2 SIGNIFICANT RISKS AND UNCERTAINTIES
Risk, as defined for this study, is a hazard, condition, or event related to geology and reserves, mine operations and planning, environmental issues, health and safety, and general business issues that when taken individually, or in combination, have an adverse impact on Core’s development of the Leer Complex.
Weir Technical Report Summary
Leer Complex
Prepared for Core Natural Resources, Inc.
Risks can disrupt operations, adversely affect production and productivity, and result in increased operating cost and/or increased capital expenditures.
In the context of this TRS, the likelihood of a risk is a subjective measure of the probability of the risk occurring, recognizing the magnitude of the risk defined as follows:
Low Risk indicates that the combined probabilities (low/medium/high) together with the economic impact (minimal/significant/adverse), if conditions exist, should not have any material adverse effect on the economic viability of the project.
Moderate Risk indicates that the combined probabilities (low/medium/high) together with the economic impact (minimal/significant/adverse), if conditions exist, could have a detrimental effect on the economic viability of the project.
High Risk indicates that the combined probabilities (low/medium/high) together with the economic impact (minimal/significant/adverse), if conditions exist, could have a seriously adverse effect on the economic viability of the project.
Based on a review of available information and discussions with Core personnel, WEIR identified potential risks associated with the Leer Complex LOM Plans. The risks, WEIR’s assessment of risk magnitude, and comments based on WEIR’s experience with underground mining operations are summarized in Table 22.2-1 as follows:
Weir Technical Report Summary
Leer Complex
Prepared for Core Natural Resources, Inc.
Table 22.2-1 Leer Complex Risk Assessment Summary
|
|
|
|
|
|
|
|
|
|
|
|
|
|
|
|
|
WEIR Risk |
|
|
| Area of Risk |
|
Assessment |
|
Comments |
|
|
|
|
|
| Geology and Coal Reserves |
|
Low |
|
The Lower Kittanning Seam has been extensively mined by the Leer Cpmplex. This mining has not indicated any anomalies in the seam other than normal thinning and thickening, and encountering expected minimal water originating from overlying sandstone strata. |
|
|
|
|
|
| Horizontal Stress |
|
Low |
|
Areas of the mine plans have longwall panels oriented approximately perpendicular to the current northeast/southwest orientation. Geotechnical studies undertaken indicate no anticipated problems. |
|
|
|
|
|
| Land Acquisition |
|
Low |
|
To fully develop the Lower Kittanning Seam, it will be necessary to acquire additional mineral control. Planning will be necessary to assure that these additional mineral leases are acquired prior to longwall panel development. |
|
|
|
|
|
| Methane |
|
Low |
|
Although methane gas is present in the Lower Kittanning Seam, gas liberation experienced to date has been low to undetectable and is expected to remain low, undetectable or at levels that can be safely mitigated during mining. Procedures and continuous gas monitoring are in place to prevent, to the extent possible, methane ignitions and mine fires. |
|
|
|
|
|
| Overburden Stress |
|
Low |
|
The potential for a coal pillar bump or release of stress when mining will be monitored as a part of the normal mining operation. Maximum overburden is approximately 850 feet, and the risk of bumps occurring is minimal, since coal outbursts, as a result of sudden release of energy, are typically associated with depth of cover of 1,500 to plus 2,000 feet. |
|
|
|
|
|
| Qualified Employees |
|
Low to Moderate |
|
In five to eight years, there may be as many as four longwall mines producing in the region. This will increase competition for skilled workers although the Leer Complex typically hires a small number of redhat miners to train each year. |
|
|
|
|
|
| Rail Lines |
|
Low to Moderate |
|
In approximately five years, there may be as many as four longwall mines producing in the region. This may increase competition for rail line capacity. The potential for up to 16 million tons annually with only one CSX rail line in the region may cause congestion and/or increase shipping costs. |
|
|
|
|
|
| Refuse Disposal |
|
Low |
|
Additional refuse disposal area will need to be permitted and developed at the Leer Mine for use in 2028 and beyond. |
|
|
|
|
|
| Roof Lithology |
|
Low to Moderate |
|
All underground coal mines have the potential to experience unstable roof conditions. Both Leer and Leer South mines have minor issues related to a rider coal seam that merges with the main bench of the Lower Kittanning Seam and results in thicker coal but also some roof instability in the transition zone. This potential risk can be kept in the low range through proper ground control engineering and following approved roof control plans. |
|
|
|
|
|
| Seam Dip |
|
Low |
|
The structure of the Lower Kittanning Seam has a relatively gentle dip, with some localized small areas of relatively steeper dips. |
|
|
|
|
|
| Spontaneous Combustion |
|
Low to Moderate |
|
The Lower Kittanning Seam has a low potential for spontaneous combustion, and the Leer Mine has not, to date, experienced any loss of production due to spontaneous combustion, since each longwall district is sealed as mining is completed to mitigate the potential of spontaneous combustion. The atmosphere in each sealed area is monitored and made inert with injection of nitrogen gas, if needed. |
|
|
|
|
|
| Water Inflow |
|
Low to Moderate |
|
There have been areas where the Leer Complex has encountered water inflow from the water-bearing sandstone overburden. Normal mine development has and will need to continually address any water encountered through the current and expanded pumping system to adequately handle water encountered in the mine workings. |
Weir Technical Report Summary
Leer Complex
Prepared for Core Natural Resources, Inc.
It is WEIR’s opinion that the majority of the risks can be kept low and/or mitigated with proper mine engineering, planning and monitoring of the mining operation.
Weir Technical Report Summary
Leer Complex
Prepared for Core Natural Resources, Inc.
23.0 RECOMMENDATIONS
The Leer Complex has sufficient geologic exploration data to determine mineral reserves. Future exploration work will be undertaken by Core to continuously provide geological data primarily for use by mine operations personnel related to effective implementation of the LOM Plan. Future exploration work and mineral property acquisition should include what has been historically implemented related to the following:
Geology
•Have an experienced geologist log core holes, measure core recovery, complete sampling. Geophysically log core holes to verify seam and coal thickness and core recovery.
•Geophysically log rotary holes to verify strata and coal thickness.
•Continue to prepare laboratory sample analysis at a 1.40, 1.50 and 1.60 specific gravity to better match the preparation plant specific gravity when processing a metallurgical coal.
•Continue collecting channel samples (include parting).
•Obtain a survey coordinate where a channel sample has been collected.
Mineral Property
•Acquire or obtain leases of uncontrolled properties at least two years before the projected mining date.
Permitting and Regulatory Approvals
•Continue permitting and construction efforts relative to a new refuse disposal facility
Weir Technical Report Summary
Leer Complex
Prepared for Core Natural Resources, Inc.
24.0 REFERENCES
References used in preparation of this TRS are as follows:
•Syd S. Peng and Asmaa Yassien. 2010. Longwall Chain Pillar Design for ICG’s Tygart No. 1 Mine in the Lower Kittanning Seam
•Monty Heib. 2018. Report of Diametral Strain Measurement (DSM): Core Holes PD62-15, RM1602, RM1606 (Barbour County, WV)
•Josuha Bonner. 2019. Cumulative Hydrologic Impact Assessment Update
•James Sumner. 2020. Roof Control Plan Update
•James Sumner. 2020. Updated Ventilation Plan
•Syd S. Peng and William Nan. 2008. Shield Support Design for Tygart 1 Reserve Area
•Core. 2020. Underground Mine Abandonment Plan
•Core. 2020. Surface and Coal Control drawings
•Core. 2020. Property control Summary Information spreadsheet
•Core. 2020. Clean Coal Handling Facility Drawing 11401-46100
•Core. 2020. Loadout Facility Drawing 11401-47100
•Core. 2020. Raw Coal Handling Facility Drawing 11401-11100
•Core. 2020. Raw Coal Handling Facility Drawing 11401-22100
•Core. 2020. Stockpile Capacities drawing
•Core. 2020. Leer Mine Map as of October 7, 2025
•Core. 2020. Leer Mine LOM Timing Map
•Core. 2020. Leer Mine Infrastructure Map
•Core. 2020. Leer South Mine Map as of October 7, 2025
•Core. 2020. Leer South Mine LOM Timing Map
•Core. 2020. Leer South Mine Infrastructure Map
•Core. 2020. Leer West Mine Map as of October 7, 2025
•Core. 2020. Leer West Mine LOM Timing Map
•Core. 2020. Leer West Mine Infrastructure Map
•MM&A. 2024 Statement of Coal Resources and Reserves for the Leer South Complex
Websites Referenced:
•Securities and Exchange Commission - Modernization of Property Disclosures for Mining Registrants - Final Rule Adoption
Weir Technical Report Summary
Leer Complex
Prepared for Core Natural Resources, Inc.
https://www.sec.gov/rules/final/2018/33-10570.pdf
•MSHA Data Retrieval Site
https://www.msha.gov/mine-data-retrieval-system
•WVDEP Permits No. O-2017-06 and U-2004-06
https://apps.dep.wv.gov/webapp/_dep/securearea/public_query/ePermittingApplicationSearchPage.cfm
Weir Technical Report Summary
Leer Complex
Prepared for Core Natural Resources, Inc.
25.0 RELIANCE ON INFORMATION PROVIDED BY THE REGISTRANT
In preparing this report, WEIR relied upon data, written reports and statements provided by the registrant. It is WEIR’s belief that the underlying assumptions and facts supporting information provided by the registrant are factual and accurate, and WEIR has no reason to believe that any material facts have been withheld or misstated. WEIR has taken all appropriate steps, in its professional opinion, to ensure information provided by the registrant is reasonable and reliable for use in this report.
The registrant’s technical and financial personnel provided information as summarized in Table 25.1 as follows:
Table 25.1 Information Relied Upon From Registrant
|
|
|
|
|
|
|
|
|
|
|
|
|
|
|
| Category |
|
Information |
|
Report Section |
| Legal |
|
Mineral control and surface rights |
|
3 |
|
|
|
|
|
| Geotechnical |
|
Pillar design, roof control plans, and rock quality analyses |
|
13.1.1 |
|
|
|
|
|
| Hydrogeological |
|
Hydrogeological analysis including inflow rates, permeability and tranmissivity calculations, and watershed analysis |
|
13.1.2 |
|
|
|
|
|
| Marketing |
|
Coal sales price projections |
|
16 |
|
|
|
|
|
| Environmental |
|
Permits, bond, and reclamation liability |
|
17 |
|
|
|
|
|
| Macroeconomic |
|
Real price growth (coal sales, labor and other cash costs) |
|
18 |
Weir Technical Report Summary
Leer Complex
Prepared for Core Natural Resources, Inc.
WEIR
Weir International, Inc.
Mining, Geology and Energy Consultants
Executive Towers West I 1431 Opus Place, Suite 210
Downers Grove, Illinois 60515
Phone: (630) 968-5400
Email: info@weirintl.com
Website: www.weirintl.com
EX-96.2
14
cnr12312025-exhibit962.htm
EX-96.2
Document
Weir Technical Report Summary
Black Thunder Mine
Prepared for Core Resources, Inc.
Exhibit 96.2
Technical Report Summary
Black Thunder Mine
Prepared for
Core Natural Resources, Inc.
February 2026
Project No. 6452
Weir Technical Report Summary
Black Thunder Mine
Prepared for Core Resources, Inc.
Notice
Weir International, Inc. (WEIR) was retained by Core Natural Resources, Inc. (Core) to prepare this Technical Report Summary (TRS) related to Core’s Black Thunder Mine. This report provides a statement of Core’s mineral reserves and resources at its Black Thunder Mine, and has been prepared in accordance with the United States Securities and Exchange Commission (SEC), Regulation S-K 1300 for Mining Property Disclosure (S-K 1300) and 17 Code of Federal Regulations (CFR) § 229.601(b)(96)(iii)(B) reporting requirements. This report was prepared for the sole use of Core and its affiliates and is effective as of December 31, 2025.
This report was prepared by full-time WEIR personnel who meet the SEC’s definition of Qualified Persons (QPs) with sufficient experience in the relevant type of mineralization and deposit under consideration in this report.
In preparing this report, WEIR relied upon data, written reports and statements provided by Core. WEIR has taken all appropriate steps, in its professional opinion, to ensure information provided by Core is reasonable and reliable for use in this report.
The accuracy of reserve and resource estimates are, in part, a function of the quality and quantity of available data at the time this report was prepared. Estimates presented herein are considered reasonable. However, they should be accepted with the understanding that with additional data and analysis available subsequent to the date of this report, the estimates may necessitate revision which may be material. Certain information set forth in this report contains “forward-looking information;” including production, productivity, operating costs, capital costs, sales prices, and other assumptions. These statements are not guarantees of future performance and undue reliance should not be placed on this information. The assumptions used to develop the forward-looking information and the risks that could cause the actual results to differ materially are detailed in the body of this report.
WEIR and its personnel are not affiliates of Core or any other entity with ownership, royalty or other interest in the subject property of this report.
WEIR hereby consents (i) to the use of Core’s Black Thunder Mine coal reserve and resource estimates as of December 31, 2025, (ii) to the use of WEIR’s name, any quotation from or summarization of this TRS in Core’s SEC filings, and (iii) to the filing of this TRS as an exhibit to Core’s SEC filings.
Qualified Person: /s/ Weir International, Inc
Date: February 9, 2026
Address: Weir International, Inc.
1431 Opus Place, Suite 210
Downers Grove, IL 60515
Weir Technical Report Summary
Black Thunder Mine
Prepared for Core Resources, Inc.
List of abbreviations
Arch Arch Resources, Inc. and its subsidiaries
ARD Apparent Relative Density
ARCO Atlantic Richfield Company
ARO Asset Retirement Obligation
ASTM American Society for Testing and Materials
Barr Barr Engineering
Black Thunder Black Thunder Mine
BNSF Burlington Northern Santa Fe Railroad
CFR Code of Federal Regulations
cfs Cubic feet per second
CMT CONSOL Marine Terminal
Core Core Natural Resources
DEQ Wyoming Department of Environmental Quality
DTA Dominion Terminal Associates LLP
EIA US Energy Information Administration
EOP Environmental Operating Plan
EPA US Environmental Protection Agency
FEM Finite Element Analysis
FIPS Federal Information Processing Standard
FOB Free on board
GCP Ground Control Plan
gpm Gallons per minute
GSP Gross Sales Price
IRR Internal Rate of Return
lbs Pounds
LOM Life of Mine
LQD Wyoming DEQ, Land Quality Division
mph Miles per hour
MMBtu Million British Thermal Units
MSHA Mine Safety and Health Administration (US Department of Labor)
MSL Mean Sea Level
NFDL Non-Fatal Days Lost Incidence Rate
NOL Net Operating Loss
NPDES National Pollutant Discharge Elimination System
NPV Net Present Value
NYSE New York Stock Exchange
PFS Preliminary Feasibility Study
PRB Powder River Basin
PREC Powder River Energy Corporation
OSD Out of Seam Dilution
QP Qualified Person
ROI Return on Investment
Weir Technical Report Summary
Black Thunder Mine
Prepared for Core Resources, Inc.
List of abbreviations (continued)
ROM Run of Mine
SO2 Sulfur dioxide
SEC U.S. Securities and Exchange Commission
SET Soil Engineering Testing
S-K 1300 Regulation S-K 1300 for Mining Property Disclosure
SMCRA Surface Mining Control and Reclamation Act
Standard Standard Laboratories, Inc.
tph Tons per hour
Ton Short ton (2,000 lbs)
TRS Technical Report Summary
UP Union Pacific Railroad
WEIR Weir International, Inc.
Weir Technical Report Summary
Black Thunder Mine
Prepared for Core Resources, Inc.
TABLE OF CONTENTS
Page
Weir Technical Report Summary
Black Thunder Mine
Prepared for Core Resources, Inc.
Weir Technical Report Summary
Black Thunder Mine
Prepared for Core Resources, Inc.
Weir Technical Report Summary
Black Thunder Mine
Prepared for Core Resources, Inc.
FIGURES
Figure 1.1-1 General Location Map 3
Figure 6.3-1 Stratigraphic Column 29
Figure 6.3-2 Wyodak Seam Cross Section Northwest to Southeast 30
Figure 7.5-1 Drillhole Collar Locations 36
Figure 11.1-1 Wyodak - Upper Seam Raw Ash, as Received 50
Figure 11.1-2 Wyodak - Upper Seam Raw BTU, as Received 51
Figure 11.1-3 Wyodak - Upper Seam Raw Sulfur, as Received 52
Figure 11.1-4 Wyodak - Main Seam Raw Ash, as Received 53
Figure 11.1-5 Wyodak - Main Seam Raw BTU, as Received 54
Figure 11.1-6 Wyodak - Main Seam Raw Sulfur, as Received 55
Figure 13.5-1 Life of Mine Plan 76
Figure 14.1-1 Simplified Material Handling Flowsheets 79
Figure 15.7-1 Mine Infrastructure 83
Figure 16.1-1 Historical PRB Spot Price 85
Figure 16.1-2 Historical and Projected Coal Sales Price 86
Figure 19.1-1 Black Thunder Mine Historical and Projected Coal Sales Price 100
Figure 19.2-1 Annual Cash Flow Forecast 101
Figure 19.3-1 Net Present Value Sensitivity Analysis 103
Weir Technical Report Summary
Black Thunder Mine
Prepared for Core Resources, Inc.
TABLES
Table 1.5-1 In-Place Coal Resource Tonnage and Quality Estimate, as of December 31, 2025 6
Table 1.5-2 Recoverable Coal Reserve Tonnage and Quality Estimate, as of December 31, 2025 7
Table 1.6-1 Key Operating Statistics 8
Table 1.7-1 Black Thunder Mining and NPDES Permits 9
Table 1.7-2 Black Thunder Permitted Area, Reclamation Liability, and Bonds 9
Table 3.3-1 Property Control 17
Table 3.4-1 Mineral Control 18
Table 3.5-1 Permit List 18
Table 11.1-1 Stratigraphic Model Interpolators 47
Table 11.1-2 Drillhole Statistics 48
Table 11.2-1 In-Place Coal Resource Tonnage and Quality Estimate, as of December 31, 2025 56
Table 11.4-1 Theoretical Variogram Ranges 58
Table 12.2-1 Recoverable Coal Reserve Tonnage and Quality Estimate as of December 31, 2021 63
Table 12.2-2 Reserve Validation 64
Table 12.5-1 Average Reserve Quality 65
Table 13.2-1 Black Thunder Mine Historical Saleable Tons Produced 69
Table 13.2-2 Black Thunder Mine LOM Plan Projected Saleable Tons Produced 70
Table 13.4-1 Mining Equipment 74
Table 13.4-2 Black Thunder Mine Safety Statistics 75
Table 17.3-1 Black Thunder Mining and NPDES Permits 92
Table 17.3-2 Black Thunder Mine Permitted Area, Reclamation Liability, and Bonds 93
Table 17.6-1 Environmental Achievements 94
Table 18.1-1 Historical and Projected LOM Plan Capital Expenditures 96
Table 18.2-1 Black Thunder Mine Historical and LOM Plan Operating Costs 97
Table 19.2-1 After-Tax NPV, IRR, Cumulative Cash Flow, and ROI 101
Table 19.2-2 Key Operating Statistics 102
Table 22.2-1 Black Thunder Mine Risk Assessment Summary 107
Table 25.1 Information Relied Upon from Registrant 111
Weir Technical Report Summary
Black Thunder Mine
Prepared for Core Resources, Inc.
1.0 EXECUTIVE SUMMARY
WEIR was retained by Core Natural Resources, Inc. (Core) to prepare a Technical Report Summary (TRS) related to Core’s Black Thunder Mine (Black Thunder). This report has been prepared in accordance with the United States Securities and Exchange Commission (SEC), Regulation S-K 1300 for Mining Property Disclosure (S-K 1300) and Title 17 Code of Federal Regulations (CFR) §229.601(b)(96)(iii)(B) reporting requirements.
Core (NYSE: CNR) is a world-class producer of high-quality metallurgical coal and high calorific value thermal coal for the domestic and globally traded markets. Core’s highly skilled workforce operates a best-in-sector portfolio of large-scale, low-cost longwall mines, including the Pennsylvania Mining Complex, Leer, Leer South, and West Elk mines, along with one of the world’s largest and most productive surface mines, Black Thunder. The company plays an essential role in meeting the world’s growing need for steel, infrastructure, and energy, while simultaneously serving the resurgent requirements of the United States power generation fleet. Core has an extensive and strategic logistical network, anchored by ownership positions in two East Coast marine export terminals, that provide reliable and efficient access to seaborne markets. The company’s deeply ingrained culture is grounded in safety and compliance, continuous improvement, and financial performance, with an emphasis on stakeholder engagement and shareholder returns. Core was created in January 2025 via the merger of CONSOL Energy Inc. (CONSOL) and Arch Resources, Inc. (Arch) and is based in Canonsburg, Pennsylvania.
Weir Technical Report Summary
Black Thunder Mine
Prepared for Core Resources, Inc.
1.1PROPERTY DESCRIPTION
Black Thunder is located approximately 50 miles south of Gillette, in Campbell County, Wyoming. It is developed within the Powder River Basin (PRB) coal producing region of the United States (see Figure 1.1-1).
Black Thunder’s permit and reserve boundary area includes approximately 62,100 acres of controlled mineral property. Within that boundary, Core controls the Upper and Main splits of the Wyodak Seam through 17 coal leases.
Weir Technical Report Summary
Black Thunder Mine
Prepared for Core Resources, Inc.
Figure 1.1-1 General Location Map
Weir Technical Report Summary
Black Thunder Mine
Prepared for Core Resources, Inc.
1.2 GEOLOGICAL SETTING AND MINERALIZATION
The Powder River Coal Basin (PRB) of northeastern Wyoming lies entirely within the boundaries of the Powder River structural and topographic basin. Coal-bearing strata range in age from Upper Cretaceous in the Mesa Verde Formation to Eocene in the Wasatch Formation. The PRB covers parts of Campbell, Converse, Crook, Natrona, Niobrara, Johnson, and Weston Counties and is the largest coal basin in Wyoming.
The economically mineable coal in Campbell County occurs within the Tongue River Member of the Fort Union Formation. The Wyodak coal seam occurs at the top of the Fort Union Formation and is overlain by the Wasatch Formation. The coal is low sulfur, low ash, and is subbituminous C in rank. Surface mineable coal deposits occur along the north-northwesterly striking subcrop of the Wyodak coal seam. The coal seam subcrops on the eastern edge of the lease and dips approximately two to three degrees to the west, with some slight rolling. This seam contains multiple benches or plys of coal of variable thickness, although in some local areas, it becomes one seam that reaches a thickness in excess of 100 feet. Across the permit area, the Wyodak Seam ranges in thickness from 10 feet to 100 feet, averaging approximately 70 feet.
1.3 EXPLORATION
Core’s exploration activities exclusively involve drilling performed by competent contract drilling companies. Exploration drilling at Black Thunder has been a two-stage approach. Initial spot core drilling is conducted on a one-half mile grid pattern in order to delineate potential lease areas. Once the area has been leased, exploration drilling is conducted three to five years in advance of pit development. Development drilling is generally conducted on a 500 feet north/south grid, with alternating rotary and spot core holes, in conjunction with dewatering endeavors. This arrangement results in a seam geometry data spacing of 500 feet and a coal quality data spacing of 1,000 feet. Drilling is conducted with rotary table drill rigs capable of drilling to depths of 1,000 feet.
All holes are geophysically logged with a standard coal suite tool consisting of gamma, density, caliper, and resistivity.
Coal sampling for the Upper split of the Wyodak Seam is in 1.0 foot increments for the top and bottom of the seam, and evenly proportioned samples of 5 to 10 feet for the remainder of the seam. Sampling for the Main split of the Wyodak Seam is in 1.5 feet increments for the top and bottom of the seam and 10 feet increments for the remainder of the seam.
Weir Technical Report Summary
Black Thunder Mine
Prepared for Core Resources, Inc.
All partings encountered, down to a thickness of 0.4 foot, are sampled separately.
A hole with significant lost core or crushed core can result in misleading data. Drillholes with core recovery of less than 90 percent are noted and subsequently reviewed, and potentially excluded from geological and coal quality modeling. WEIR did not exclude any holes for poor core recovery, as all of the drillholes within the Black Thunder permit area attained core recovery of at least 90 percent.
WEIR finds the planning, implementation and supervision of Core’s drilling programs, with all data derived from the drilling programs, to be consistent with industry standards, and sufficient and relevant for use in the estimation of reserves and resources.
1.4 DEVELOPMENT AND OPERATIONS
The mining method at Black Thunder is surface mining utilizing draglines and truck/shovel mining equipment. The surface mining method has been successfully utilized in the PRB since the 1970s, and in other coal producing regions of the United States.
Black Thunder is mining the Upper and Main splits of the Wyodak Seam, and parting interval within the seam, utilizing draglines, shovels, front-end loaders, trucks, and dozers or scrapers.
Historical coal production from the Black Thunder Mine is summarized as follows:
•60.6 million tons in 2023
•44.5 million tons in 2024
•35.1 million tons in 2025 September YTD
The Black Thunder Life of Mine (LOM) Plan projects mining through 2038 with an expected mine life of 13 years. The LOM Plan projects mining from four pits at Black Thunder; the North, Northeast, West, and South pits.
Black Thunder currently operates a fleet of five draglines and 10 shovels for overburden removal, and four shovels for coal removal from the four pits. The pits will typically be 200 to 230 feet wide, with pit lengths ranging from 2,600 feet to 9,800 feet in the LOM Plan. The typical pit configuration is an initial truck/shovel pass(s) for prestrip, since the draglines cannot effectively handle the total burden.
Weir Technical Report Summary
Black Thunder Mine
Prepared for Core Resources, Inc.
Cast blasting is normally implemented in the next pass prior to the dragline pass, with this pass sequence requiring significant dozer material handling utilizing Black Thunder’s remote control dozer fleet. Subsequently, the dragline handles the quantity of material for which it was designed, in the next pass. The dragline performs multiple passes typically using a modified extended bench, which results in a spoil-side pass before the main split of the Wyodak Seam is mined.
Mining progresses in an orderly and sequential fashion to meet required sales tonnage and coal quality. The current mining sequence south of State Highway 450 progresses in an east to west direction. North of State Highway 450, mining advances from south to north. Recovery of coal beneath the existing rail spurs, mine facilities, and State Highway 450 is deferred to the later years of the LOM Plan in order to utilize the existing surface facilities for as long as possible.
1.5 MINERAL RESERVE AND RESOURCE ESTIMATE
Black Thunder mineral resources, as of December 31, 2025, are reported as in-place resources and are exclusive of reported coal reserve tons. Resources are reported in categories of Measured, Indicated and Inferred tonnage in accordance with Regulation S-K Item 1302(d), and summarized in Table 1.5-1 as follows:
Table 1.5-1 In-Place Coal Resource Tonnage and Quality Estimate,
as of December 31, 2025
|
|
|
|
|
|
|
|
|
|
|
|
|
|
|
|
|
|
|
|
|
|
|
|
|
|
|
|
|
|
|
|
|
|
|
|
|
|
|
|
|
|
|
|
|
|
|
|
|
|
|
|
|
|
|
|
|
|
|
|
|
|
|
|
|
|
|
|
|
|
|
|
|
|
|
|
|
Raw Coal Quality (As Received) |
|
|
|
|
Average Coal |
|
|
|
|
|
|
|
Average |
|
|
|
|
|
|
|
Calorific |
|
|
Area |
|
Thickness |
|
In-Place Resources (000 Tons) |
|
Stripping Ratio |
|
Ash |
|
Sulfur |
|
Volatile |
|
Value |
| Seam |
|
(Acres) |
|
(Feet) |
|
Measured |
|
Indicated |
|
Total |
|
(BCY/T) |
|
(%) |
|
(%) |
|
Matter |
|
(Btu/lb) |
| WYODAK - Upper |
|
1,200 |
|
13.49 |
|
25,000 |
|
— |
|
25,000 |
|
— |
|
5.1 |
|
0.55 |
|
33.1 |
|
8,950 |
| WYODAK - Main |
|
1,375 |
|
73.12 |
|
175,000 |
|
5,000 |
|
180,000 |
|
— |
|
4.0 |
|
0.23 |
|
31.9 |
|
8,990 |
|
|
|
|
|
|
200,000 |
|
5,000 |
|
205,000 |
|
4:1 |
|
4.1 |
|
0.27 |
|
32.0 |
|
8,980 |
Notes:
•Mineral Resources reported above are not Mineral Reserves and do not meet the threshold for reserve modifying factors, such as estimated economic viability, that would allow for conversion to mineral reserves. There is no certainty that any part of the Mineral Resources estimated will be converted into Mineral Reserves. Mineral Resources reported here are exclusive of Mineral Reserves.
•Resources stated as contained within a potentially economically mineable surface mine assuming a thermal coal product realizing a sales price of $15.77 per ton FOB Mine and operating cost of $14.56 per ton
•Numbers in the table have been rounded to reflect the accuracy of the estimate and may not sum due to rounding
The conversion of resources to reserves at Black Thunder considers the effects of projected dilution and loss of product coal quality, projected mineral prices and operating costs, regulatory compliance requirements, and mineral control to determine if the saleable coal product will be economically mineable.
Weir Technical Report Summary
Black Thunder Mine
Prepared for Core Resources, Inc.
The design of an executable mine plan that accommodates the planned mining equipment and provides a safe work environment is also considered.
The coal reserve tonnage representing the economically viable tonnage controlled by Core, and estimated in accordance with Regulation S-K Item 1302(e), is summarized in Table 1.5-2 as follows:
Table 1.5-2 Recoverable Coal Reserve Tonnage and Quality Estimate,
as of December 31, 2025
|
|
|
|
|
|
|
|
|
|
|
|
|
|
|
|
|
|
|
|
|
|
|
|
|
|
|
|
|
|
|
|
|
|
|
|
|
|
|
|
|
|
|
|
|
|
|
|
|
|
|
|
|
|
|
|
|
|
|
|
|
|
|
|
|
|
|
|
|
|
|
|
|
|
|
|
|
|
|
|
|
Average |
|
|
|
|
|
|
|
|
|
Raw Coal Quality (As Received) |
|
|
|
|
|
|
Coal |
|
Saleable Tons (000) |
|
Average |
|
|
|
|
|
|
|
|
|
Calorific |
|
|
|
|
Area |
|
Thickness |
|
(As Received) Reserves |
|
Stripping Ratio |
|
Moisture |
|
Ash |
|
Sulfur |
|
Volatile |
|
Value |
| Seam |
|
Product Quality |
|
(Acres) |
|
(Feet) |
|
Proven |
|
Probable |
|
Total |
|
(BCY/T) |
|
(%) |
|
(%) |
|
(%) |
|
Matter |
|
(Btu/lb) |
| WYODAK - Upper |
|
Subbituminous |
|
3,700 |
|
12.7 |
|
32,000 |
|
— |
|
32,000 |
|
— |
|
25.8 |
|
6.1 |
|
0.65 |
|
33.1 |
|
8,890 |
| WYODAK - Main |
|
Subbituminous |
|
4,590 |
|
71.8 |
|
297,500 |
|
2,000 |
|
299,500 |
|
— |
|
25.8 |
|
4.6 |
|
0.26 |
|
32.0 |
|
8,910 |
|
|
|
|
|
|
|
|
329,500 |
|
2,000 |
|
331,500 |
|
3.5:1 |
|
25.8 |
|
4.8 |
|
0.30 |
|
31.9 |
|
8,910 |
Notes:
•Raw recoverable Reserve tonnage based on mining recovery of 85 percent for surface mining the Upper split of the Wyodak Seam, and 92 percent for surface mining the Main split of the Wyodak Seam.
•Mineral Reserves estimated at a sales price of $15.77 per ton FOB Mine and operating cost of $14.57 per ton
•Numbers in the table have been rounded to reflect the accuracy of the estimate and may not sum due to rounding
•Mineral Reserves are reported exclusive of Mineral Resources
WEIR depleted LOM Plan reserve tonnage using actual mine workings through October 31, 2025 and subtracted actual production, reported by Core, for the remainder of the year to arrive at reserves as of December 31, 2025.
1.6 ECONOMIC EVALUATION
WEIR prepared a Preliminary Feasibility Study (PFS) financial model in order to assess the economic viability of the Black Thunder LOM Plan. Specifically, plans were evaluated using discounted cash flow analysis, which consists of annual revenue projections for the Black Thunder LOM Plan. Cash outflows such as capital, including preproduction costs, sustaining capital costs, operating costs, transportation costs, royalties, and taxes are subtracted from the inflows to produce the annual cash flow projections. No adjustments are made for inflation and all cash flows are in 2025 United States dollars. WEIR’s study was conducted on an un-levered basis, excluding costs associated with any debt servicing requirements.
Weir Technical Report Summary
Black Thunder Mine
Prepared for Core Resources, Inc.
In its assessment of Net Present Value (NPV), WEIR utilized a discount rate of 12.5 percent.
The PFS financial model developed for use in this TRS was meant to evaluate the prospects of economic extraction of coal within the Black Thunder resource area. This economic evaluation is not meant to represent a project valuation. Furthermore, optimization of the LOM Plan was outside of the scope of this engagement.
The results of WEIR’s PFS demonstrated an after-tax NPV of $96.1 million for the Black Thunder LOM Plan. Key operational statistics for the LOM Plan, on an after-tax basis, are summarized in Table 1.6-1 as follows:
Table 1.6-1 Key Operating Statistics
|
|
|
|
|
|
|
|
|
|
|
LOM Plan |
| Clean Tons Produced (000s) |
|
331,500 |
| Marketable Tons Sold (000s) |
|
331,548 |
|
|
|
|
|
($ Per Ton) |
| Coal Sales Realization |
|
15.77 |
|
|
|
| Cash Costs |
|
14.65 |
| Non-cash Costs |
|
0.76 |
| Total Cost of Sales |
|
15.41 |
|
|
|
| Profit / (Loss) |
|
0.36 |
|
|
|
| EBITDA |
|
1.12 |
|
|
|
| CAPEX |
|
0.37 |
A sensitivity analysis was undertaken to examine the influence of changes to assumptions for coal sales price, operating cost, capital expenditures, and discount rate on the base case after-tax NPV. The sensitivity analysis range (±25 percent) was designed to capture the bounds of reasonable variability for each element analyzed.
The Black Thunder NPV is most sensitive to changes in coal sales price and operating cost. It is least sensitive to changes in discount rate and capital expenditures.
1.7 ENVIRONMENTAL STUDIES AND PERMITTING REQUIREMENTS
As part of the permitting process required by the Wyoming Department of Environmental Quality (DEQ), numerous baseline studies and impact assessments were undertaken by Core.
Weir Technical Report Summary
Black Thunder Mine
Prepared for Core Resources, Inc.
These baseline studies and impact assessments included in the permit are summarized as follows:
•Groundwater Inventory
•Surface Water Quality and Quantity
•Probable Hydrologic Consequences
Black Thunder has been issued mining permits and associated National Pollutant Discharge Elimination System (NPDES) permits by the DEQ as shown in Table 1.7-1 as follows:
Table 1.7-1 Black Thunder Mining and NPDES Permits
|
|
|
|
|
|
|
|
|
|
|
|
|
|
|
|
|
|
|
|
|
|
|
Permitted |
|
|
|
|
|
|
Surface |
|
|
|
|
| Permit |
|
Area |
|
Issue |
|
NPDES |
| Number |
|
(Acres) |
|
Date |
|
Permit No. |
| 233 |
|
62,066.12 |
|
12/3/1974 |
|
WY0024091 |
The permitted area, bond amounts and reclamation liability for Permit No. 233 is shown in Table 1.7-2 as follows:
Table 1.7-2 Black Thunder Permitted Area, Reclamation Liability, and Bonds
|
|
|
|
|
|
|
|
|
|
|
|
|
|
|
|
|
|
|
|
|
|
|
Permitted |
|
|
|
|
|
|
Surface |
|
Reclamation |
|
Bond |
| Permit |
|
Area |
|
Liability (1) |
|
Amount |
| Number |
|
(Acres) |
|
($000) |
|
($000) |
| 233 |
|
62,066 |
|
269,050 |
|
414,700 |
|
|
|
|
|
|
|
|
(1) Represents the undiscounted cash flows to satisfy
reclamation as of December 2025
|
Core currently employs approximately 650 to 750 personnel at Black Thunder. The mine also creates substantial economic value with its third-party service and supply providers, utilities and through payment of taxes and fees to governmental agencies.
Permit No. 233 has not been cited for any permit violations since 2014, which is exceptional for a coal mining operation the size of Black Thunder. Permit No. 233 was renewed in February 2025.
Based on WEIR’s review of Core’s plans for environmental compliance, permit compliance and conditions, and dealings with local individuals and groups, Core’s efforts are adequate and reasonable in order to obtain approvals necessary relative to the execution of the Black Thunder LOM Plan.
Weir Technical Report Summary
Black Thunder Mine
Prepared for Core Resources, Inc.
1.8 CONCLUSIONS AND RECOMMENDATIONS
Core has a long operating history of resource exploration, mine development, and mining operations at Black Thunder, with extensive exploration data utilizing drillholes, supporting the determination of mineral resource and reserve estimates, and projected economic viability. The data has been reviewed and analyzed by WEIR and determined to be adequate in quantity and reliability to support the coal resource and coal reserve estimates in this TRS.
The coal resource and coal reserve estimates and supporting PFS were prepared in accordance with Regulation S-K 1300 requirements. There are 205.0 million in-place tons of measured and indicated mineral resources, exclusive of reserves, and 331.5 million clean recoverable tons of surface mineable reserves within the Black Thunder property as of December 31, 2025. Reasonable prospects for economic extraction were established through the development of a PFS relative to the Black Thunder LOM Plan, considering historical mining performance, historical and projected thermal coal sales prices, historical and projected mine operating costs, and recognizing reasonable and sufficient capital expenditures.
The ability of Core, or any coal company, to achieve production and financial projections is dependent on numerous factors. These factors primarily include site-specific geological conditions, the capabilities of management and mine personnel, level of success in acquiring reserves and surface properties, coal sales prices and market conditions, environmental issues, securing permits and bonds, and developing and operating mines in a safe and efficient manner. Unforeseen changes in legislation and new industry developments could substantially alter the performance of any mining company.
Coal mining is carried out in an environment where not all events are predictable. While an effective management team can identify known risks and take measures to manage and/or mitigate these risks, there is still the possibility of unexpected and unpredictable events occurring. It is not possible therefore to totally remove all risks or state with certainty that an event that may have a material impact on the operation of a coal mine will not occur.
Weir Technical Report Summary
Black Thunder Mine
Prepared for Core Resources, Inc.
WEIR assessed risks associated with the economic mineability of Black Thunder to be low to moderate and adds that the majority of the risks can be kept low and/or mitigated with proper planning and monitoring of the mining operations.
WEIR recommends that any future exploration work and mineral property acquisition should include what has been historically implemented related to the following:
Geology
•Have an experienced geologist log core holes, measure core recovery, complete sampling. Geophysically log core holes to verify seam and coal thickness and core recovery.
•Geophysically log rotary holes to verify strata and coal thickness.
•Continue to prepare laboratory analysis of any core hole samples.
Mine Plan
•Continue to monitor the results of the dewatering wells to minimize groundwater flows and adverse impact on highwall stability.
Weir Technical Report Summary
Black Thunder Mine
Prepared for Core Resources, Inc.
2.0 INTRODUCTION
2.1 REGISTRANT
WEIR was retained by Core (NYSE: CNR) to prepare the Black Thunder TRS related to Core’s currently operating Black Thunder mining operation. Black Thunder is located approximately 50 miles south of Gillette, Wyoming, in Campbell County within the PRB coal producing region of the United States (see Figure 1.1-1).
2.2 TERMS OF REFERENCE AND PURPOSE
This TRS was prepared specifically for Core’s Black Thunder mining operations. The Upper and Main splits of the Wyodak Seam resources at Black Thunder have been classified in accordance with SEC mining property disclosure rules under Subpart 1300 and Item 601 (96)(B)(iii) of Regulation S-K. Unless otherwise stated, all volumes, grades, distances, and currencies are expressed in United States customary units.
The accuracy of reserve and resource estimates are, in part, a function of the quality and quantity of available data at the time this report was prepared. Estimates presented herein are considered reasonable. However, estimates should be accepted with the understanding that with additional data and analysis subsequent to the date of this report, the estimates may necessitate revision which may be material. Certain information set forth in this report contains “forward-looking information”, including production, productivity, operating costs, capital costs, sales prices, and other assumptions. These statements are not guarantees of future performance and undue reliance should not be placed on this information. The assumptions used to develop the forward-looking information and the risks that could cause the actual results to differ materially are detailed in the body of this report.
Black Thunder is a permitted surface mine that commenced production of thermal coal in the fourth quarter of 1977.
For Black Thunder, as an established producing mine, this TRS reports both mineral reserves and resources (exclusive of reserves). Supporting the assessment of the economic mineability of reported reserves and prospects of economically feasible extraction of reported resources, this report includes summary detail of a PFS conducted relative to Black Thunder.
Weir Technical Report Summary
Black Thunder Mine
Prepared for Core Resources, Inc.
WEIR’s evaluation of Core’s mineral reserves and resources was conducted in accordance with SEC S-K 1300 definitions for Mineral Resource, Mineral Reserve and Preliminary Feasibility Study as follows:
•Mineral Resource is a concentration or occurrence of material of economic interest in or on the earth’s crust in such form, grade or quality, and quantity that there are reasonable prospects for economic extraction. A mineral resource is a reasonable estimate of mineralization, taking into account relevant factors such as cut-off grade, likely mining dimensions, location or continuity, that, with the assumed and justifiable technical and economic conditions, is likely to, in whole or in part, become economically extractable. It is not merely an inventory of all mineralization drilled or sampled.
•Mineral Reserve is an estimate of tonnage and grade or quality of indicated and measured mineral resources that, in the opinion of the QP, can be the basis of an economically viable project. More specifically, it is the economically mineable part of a measured or indicated mineral resource, which includes diluting materials and allowances for losses that may occur when the material is mined or extracted.
•Preliminary Feasibility Study is a comprehensive study of a range of options for the technical and economic viability of a mineral project that has advanced to a stage where a QP has determined (in the case of underground mining) a preferred mining method, or (in the case of surface mining) a pit configuration, and in all cases has determined an effective method of mineral processing and an effective plan to sell the product.
2.3 SOURCES OF INFORMATION AND DATA
The primary information evaluated for this study, including but not limited to maps, plans, schematics, drawings, and discussions, was as follows:
•Geological data that was exclusively provided by Core geology and engineering staff. The geological data includes drillhole information such as driller’s logs, geologist’s logs, both full and partial scans of geophysical logs, survey data, coal quality laboratory certificates, and MS Excel™ (Excel) versions of drillhole survey, lithology, and quality data. Additionally, WEIR was provided with modelled coal seam floor elevations and seam thickness contours, topography contours, and other base geological data.
Weir Technical Report Summary
Black Thunder Mine
Prepared for Core Resources, Inc.
•Mineral and surface ownership maps, and supplemental files were provided exclusively by Core Land LLC, a subsidiary of Core.
•Site visits by WEIR QPs on March 18, 2025.
•Interviews between WEIR personnel and Core personnel including;
President of Wyoming Operations
Vice President of Geology & Exploration
Director of Financial Analysis and Support
Engineering Manager
Senior Engineer
Senior Geologist
•Historical production, productivity, staffing levels, operating costs, capital expenditures, and coal sales revenue provided by Core.
•LOM projections and cost model provided by Core.
•Health, safety, and environmental issues discussed during interviews between WEIR personnel and Core personnel.
•Current mine permits, in addition to recent permit revisions and renewals provided by Core.
•Current and projected mine plans, including production, productivity, operating costs, and capital expenditures required to sustain projected levels of production for Black Thunder, provided by Core, and which were all reviewed for reasonableness by WEIR.
•Market outlook and coal sales price projections provided by Core
•Projected reclamation costs for mine closure activities provided by Core.
A detailed list of all data received and reviewed for this study is provided in Sections 24.0 and 25.0 of this TRS.
2.4 DETAILS OF THE PERSONAL INSPECTION OF THE PROPERTY
WEIR’s QPs previously visited Black Thunder on August 19, 2021. WEIR has also performed numerous annual audits of Black Thunder reserves for Arch Resources, Inc. annual SEC 10-K filings.
WEIR’s QPs held discussions with Black Thunder personnel on March 18, 2025, to review questions relative to Black Thunder’s geology, mine plans and operations, the management discussions included key topics as follows:
Weir Technical Report Summary
Black Thunder Mine
Prepared for Core Resources, Inc.
•Geology
•Property
•Infrastructure
•Mine Plan, Production and Productivity
•Operating Costs and Capital Expenditures
•Marketing
•Environmental and Compliance
•Risks and Uncertainties
Subsequently, WEIR’s mining QP visited the Black Thunder Mine on March 18, 2025. Areas of the mine visited included the following:
•Mine Office and bathhouse
•Warehouse
•Stockpiles
•Rail Loadout
•North, Northeast, South, and West Pits
In addition to observance of mine infrastructure, surface facilities and mining conditions, WEIR discussed Black Thunder LOM Plan with mine management personnel.
2.5 PREVIOUS TRS
This TRS is an update to the first Black Thunder TRS prepared by WEIR, dated February 10, 2021, which was prepared for Arch Resources, Inc. The previous TRS was completed before the merger of Arch Resources, Inc. and CONSOL Energy, Inc.
Weir Technical Report Summary
Black Thunder Mine
Prepared for Core Resources, Inc.
3.0 PROPERTY DESCRIPTION
3.1 PROPERTY LOCATION
Black Thunder is located approximately 50 miles south of Gillette, Wyoming in Campbell County, within the PRB coal producing region of the United States (see Figure 1.1-1). The approximate location Black Thunder is 43 42’ 00” N Latitude 105 17’ 30” W Longitude. The United States Geological Survey (USGS) 7.5-minute quadrangle map sheets, upon which Black Thunder can be found, are Hilight, Open A Ranch, Reno Reservoir, Piney Canyon NW, Teckla and Piney Canyon SW.
3.2 PROPERTY AREA
The Black Thunder permit area and reserve boundary includes approximately 62,100 acres of controlled mineral property.
The Black Thunder surface facilities are located within the Black Thunder permit area, near the central area of the north boundary of the permit. The surface facilities include mine administration, engineering, and operations offices, mine roads, laydown areas, ponds, crushers, rail loadouts, mine maintenance facilities, warehouse facilities, and parking lots. The disturbed area for Black Thunder surface facilities is approximately 3,230 acres. The coal, backfill, and topsoil stockpiles represent approximately 5,300 additional acres of disturbed area.
3.3 PROPERTY CONTROL
Within Black Thunder’s permit and reserve boundary, Core controls the Upper and Main splits of the Wyodak Seam through 17 coal leases covering approximately 62,100 acres, described in Table 3.4-1. Table 3.3-1 describes the various property control contracts.
Weir Technical Report Summary
Black Thunder Mine
Prepared for Core Resources, Inc.
Table 3.3-1 Property Control
|
|
|
|
|
|
|
|
|
| Document Type |
|
Quantity |
| Agreements |
|
19 |
| Grazing Lease |
|
2 |
| Coal Leases |
|
2 |
| Federal Coal Leases |
|
6 |
| State Coal Leases |
|
9 |
| Deeds |
|
26 |
| Overstrip Agreement |
|
3 |
| Surface Rights |
|
1 |
| Water Rights |
|
13 |
Each individual contract shown above may include more than one type of property control.
3.4 MINERAL CONTROL
Coal seam mineral rights are controlled by two coal leases, six federal leases, and nine state leases. All but two leases have minimum annual rental payments ranging from $480 to $18,225. All of the leases have a production royalty rate of 12.5 percent of the Gross Sales Price (GSP). The leases have a minimum royalty that must be paid annually in order to maintain the lease, with the exception of one lease, which has a one-time minimum royalty payment. Three leases have additional annual rental agreements. Federal legislation signed in July 2024 significantly reduced the Federal coal royalty rate from 12.5 percent to 7 percent, effective July 2024 through September 2034. The details of the mineral control contracts are listed in Table 3.4-1.
Weir Technical Report Summary
Black Thunder Mine
Prepared for Core Resources, Inc.
Table 3.4-1 Mineral Control
|
|
|
|
|
|
|
|
|
|
|
|
|
|
|
|
|
|
|
|
|
| Core |
|
Document |
|
|
|
Expiration |
| File Number |
|
Type |
|
Seams |
|
Date |
| FCL-001 |
|
Federal Coal Lease |
|
All seams leased |
|
Upon Exhaustion |
| FCL-002 |
|
Federal Coal Lease |
|
All seams leased |
|
Upon Exhaustion |
| C-1 |
|
Coal Lease |
|
All seams leased |
|
Upon Exhaustion |
| SCL-001 |
|
State Coal Lease |
|
All seams leased |
|
Upon Exhaustion |
| SCL-002 |
|
State Coal Lease |
|
All seams leased |
|
Upon Exhaustion |
| SCL-003 |
|
State Coal Lease |
|
All seams leased |
|
Upon Exhaustion |
| SCL-004 |
|
State Coal Lease |
|
All seams leased |
|
Upon Exhaustion |
| SCL-005 |
|
State Coal Lease |
|
All seams leased |
|
Upon Exhaustion |
| FCL-003 |
|
Federal Coal Lease |
|
All seams leased |
|
Upon Exhaustion |
| SCL-006 |
|
State Coal Lease |
|
All seams leased |
|
Upon Exhaustion |
| CL-2 |
|
Coal Lease Agreement |
|
All seams leased |
|
Upon Exhaustion |
| FCL-004 |
|
Federal Coal Lease |
|
All seams leased |
|
Upon Exhaustion |
| FCL-005 |
|
Federal Coal Lease |
|
All seams leased
Surface mineable coal reserves in the Wyodak-Anderson coal zone.
Generally contains two recoverable seams, the Upper Wyodak and the Middle Wyodak. |
|
Upon Exhaustion |
| FCL-006 |
|
Federal Coal Lease |
|
All seams leased |
|
Upon Exhaustion |
| SCL-007 |
|
State Coal Lease |
|
All seams leased |
|
Upon Exhaustion |
| SCL-008 |
|
State Coal Lease |
|
All seams leased |
|
Upon Exhaustion |
| SCL-009 |
|
State Coal Lease |
|
All seams leased |
|
Upon Exhaustion |
3.5 SIGNIFICANT PROPERTY ENCUMBRANCES
The Black Thunder LOM Plan area is permitted with the Wyoming DEQ, Land Quality Division (LQD).
Black Thunder’s mining permit and NPDES permit are shown in Table 3.5-1, with a more detailed description of the permits discussed in Section 17.3 of this TRS.
Table 3.5-1 Permit List
|
|
|
|
|
|
|
|
|
|
|
|
|
|
|
|
|
|
|
|
|
|
|
Permitted |
|
|
|
|
|
|
Surface |
|
|
|
|
| Permit |
|
Area |
|
Issue |
|
NPDES |
| Number |
|
(Acres) |
|
Date |
|
Permit No. |
| 233 |
|
62,066.12 |
|
12/3/1974 |
|
WY00224091 |
Since 2014, Black Thunder has not had a regulatory fine or violation from the Wyoming LQD. Permit No. 233 was renewed in February 2025.
Weir Technical Report Summary
Black Thunder Mine
Prepared for Core Resources, Inc.
3.6 SIGNIFICANT PROPERTY FACTORS AND RISKS
Given Core’s controlled interests at Black Thunder, which relate to property that is held, by and large, by Core and the BLM, WEIR finds there are no significant issues affecting access to the coal interests, or the ability of Core to execute the Black Thunder LOM Plan.
3.7 ROYALTY INTEREST
Core, at the Black Thunder mining operation, holds no royalty or similar interest in property that is owned or operated by another party.
Weir Technical Report Summary
Black Thunder Mine
Prepared for Core Resources, Inc.
4.0 ACCESSIBILITY, CLIMATE, LOCAL RESOURCES, INFRASTRUCTURE, AND PHYSIOGRAPHY
4.1 TOPOGRAPHY, ELEVATION, AND VEGETATION
The Black Thunder property is located within the eastern flank of the PRB on the Missouri Plateau of the Northern Great Plains Province. The PRB is a topographic depression between the Big Horn Mountains on the west and the Black Hills on the east. The topography of the property is comprised of rolling and rugged hills, with 500 to 1,000 feet of vertical relief in the northern part of the basin, and gentle plains, with up to 500 feet of relief in the southern part. Surface elevations range from 4,000 feet above mean sea level (MSL) in the north to 5,000 feet above MSL in the south.
Within the mine permit area, the terrain is gently rolling, except along the eastern edge of the property and to the south of Little Thunder Creek. In these two areas, the property is transected by steep-sided, irregular gullies and washes, which drain into Little Thunder Creek, forming breaks in the plateau. Elevations within the mine permit area range from approximately 4,570 feet to 5,030 feet. The surface of the mine permit area is made up of eroded shale slopes, alluvial terraces and small playas, minor sheet wash, and floodplains. Scoria (clinker) ledges occur near “burn” lines.
The Black Thunder property consists mostly of two major vegetation types. These major vegetation types are Mixed Grass Prairie (Upland Grassland) and the Big Sagebrush Shrubland.
The Mixed Grass Prairie vegetation is generally found on moderately deep to deep soils on gently rolling to flat topography. Perennial grasses are the dominant vegetative type here. Western wheatgrass (Agropyron smithii), needle-and-thread (Stipa comata), blue grama (Bouteloua gracilis), prairie Junegrass (Koeleria macrantha), Sandberg bluegrass (Poa secunda) and threadleaf sedge (Carex filifolia) are generally the most common species encountered. Cheatgrass (Bromus tectorum) is a common annual invasive species of grass that may be found during years favoring growth of this species.
The Big Sagebrush Shrubland plant community is found on a variety of soils in the area ranging from very poor and shallow to loamy and deep. This vegetation type is also found on a wide range of topographies from very steep and rolling too relatively flat.
Weir Technical Report Summary
Black Thunder Mine
Prepared for Core Resources, Inc.
Perennial grasses also dominate the Big Sagebrush Shrubland vegetation, but big sagebrush (Artemisia tridentata) is the single most common individual species. Other common perennial species on the Big Sagebrush Shrubland include needle-and-thread, western wheatgrass, prairie Junegrass and blue grama. Annual species such as cheatgrass may also be common on the Big Sagebrush Shrubland in certain years.
4.2 PROPERTY ACCESS
Black Thunder is accessed from Interstate 90 in Gillette, Wyoming by traveling south on Wyoming State Highway 59 for 41.0 miles, then turning east and traveling on Wyoming State Highway 450 for 9.7 miles. The mine entrance is located on the south side of the highway. The nearest town is Wright, Wyoming, which is located 1.9 miles north of Wyoming State Highway 450.
Rail transportation is provided by both the UP and BNSF railroads with the main line running directly along the west side of the mine and spurs connecting to all three load outs. There is no river transportation available near Black Thunder.
The nearest airport is the Northeast Regional Airport located along Wyoming State Highway 59/ US Highway 14 on the north side of Gillette, Wyoming. Flights are available to Rapid City Regional Airport and Denver International Airport.
4.3 CLIMATE AND OPERATING SEASON
The Black Thunder property lies on the rolling high plains of northeastern Wyoming. The property is approximately 200 miles east-northeast of the low-level Continental Divide of southeastern Wyoming, approximately 60 miles west of the Black Hills, and approximately 70 miles east of the Big Horn Mountains. Climate in the high plains of northeastern Wyoming is influenced primarily by cold, dense air masses that flow across the Continental Divide from the west and northwest. Since there are no mountains north of the high plains region, the plains are subjected to periodic outbreaks of Arctic air masses during the autumn, winter, and spring. Each outbreak causes abrupt changes in weather such as northerly winds, dropping temperatures, and snow. During the winter, cold, dense air masses originating from the Great Basin (a large basin that lies between the Sierra Nevada and Rocky Mountain ranges) frequently drain across the low-level Continental Divide through southern Wyoming and down into the North Platte Valley.
Weir Technical Report Summary
Black Thunder Mine
Prepared for Core Resources, Inc.
The air accelerates to higher velocities and spreads over eastern Wyoming. Some of this air moves northeastward toward Black Thunder, however, the prevailing northwesterly, westerly, and southeasterly surface wind flows observed at the mine property are due to the channeling of drainage winds between the Big Horn Mountains and the Black Hills.
The summer climate is typical for the high plains with light to moderate surface winds and occasional violent thunderstorms. The thunderstorms generate most of the annual precipitation. Wind gusts, from the occasionally severe thunderstorms, sometimes reach 60 to 80 miles per hour (mph) and may be followed by hail. The climate of northeastern Wyoming can be classified as semi-arid since mean annual precipitation is approximately 13 inches and relative humidity is rather low, being less than 50 percent on an annual average.
The mean monthly temperature recorded at Gillette 2E, a meteorological station in the vicinity of Black Thunder, ranges from 72 degrees Fahrenheit (°F) in July to 22°F in January. The average frost-free growing season is 127 days. The average last spring freeze date, recorded at Gillette, is May 21, and the average first freeze date is September 25.
Although extreme weather is experienced at Black Thunder during all seasons, there is no seasonal limitation to mining operations at Black Thunder.
4.4 INFRASTRUCTURE
Power
Electrical power for Black Thunder is provided by Powder River Energy Corporation (PREC), through a 69 kV transmission line. PREC’s average industrial price is 6.41 cents per KWH.
Water
The water used for dust suppression is obtained from the mine’s own highwall dewatering program. This dewatering program is able to produce 500 to 800 million gallons of water per year. Potable water for the facilities is obtained from two onsite deep-water wells. This water is treated at a flat rate of $3,520 per month. In 2025, Black Thunder’s average water usage was approximately 49 million gallons per month for haul road dust suppression and facilities washdown.
Personnel
Weir Technical Report Summary
Black Thunder Mine
Prepared for Core Resources, Inc.
The northern Wyoming area surrounding Black Thunder has a long history of surface coal mining and attracting and hiring mining personnel with qualified skills has not been an issue. Black Thunder employs approximately 650 to 750 personnel, as of November 1, 2025. The hourly labor force at Black Thunder remains non-union and no change in this labor arrangement is anticipated.
Supplies
Supplies for the Black Thunder mining operation are available from multiple vendors that service the coal mining industry in the PRB Region. The nearest Caterpillar mining equipment dealerships are located in Gillette and Casper, Wyoming, and there is a Komatsu mining equipment dealership, located in Gillette.
Weir Technical Report Summary
Black Thunder Mine
Prepared for Core Resources, Inc.
5.0 HISTORY
5.1 PREVIOUS OPERATIONS
Prior to the development of Black Thunder, there was no mining that occurred on the property. Black Thunder is a surface coal mine utilizing draglines and truck/shovel mining equipment for overburden removal. The mine was opened by Atlantic Richfield Company (ARCO) in 1977 and has been operated under Thunder Basin Coal Company, LLC since that time. In 1998, Arch Coal, Inc. purchased all of ARCO’s domestic coal operations, which included the Thunder Basin Coal Company, LLC’s Black Thunder mining operation.
In 2004, Arch Coal, Inc. purchased the adjacent North Rochelle Mine from Triton Coal Company and merged it into Black Thunder Mine. The former North Rochelle Mine facilities and reserves were subsequently sold to Peabody Energy in 2006.
In 2009, Arch purchased the adjacent Jacobs Ranch Mine from Rio Tinto Coal and merged it into Black Thunder, which created a mining complex that produced 116.2 million tons of coal in 2010.
In January 2025, Arch Resources, Inc. and Consol Energy, Inc. merged to form one company Core Natural Resources, Inc.
5.2 PREVIOUS EXPLORATION AND DEVELOPMENT
Exploration work conducted by ARCO included both pre-lease, Federal Exploration License drilling and post-lease development drilling. Pre-lease drilling was generally done on a one-half mile spacing, or one hole per quarter section, which corresponded with the requirements of the BLM for leasing Federal coal. Most development drilling was done two to three years ahead of mining on a nominal 600 foot spacing with alternating rows offset one-half the spacing resulting in a 45-degree rotated grid interval of 424 feet and included over 1,500 drillholes.
Exploration work conducted by the Jacobs Ranch Mine also included both pre-lease, Federal Exploration License drilling and post-lease development drilling. Pre-lease drilling was also generally done on a one-half mile spacing, or one hole per quarter section, which corresponded with the requirements of the BLM for leasing Federal coal.
Weir Technical Report Summary
Black Thunder Mine
Prepared for Core Resources, Inc.
Most development drilling was done three to five years in advance of mining and was mostly done on a nominal 800 foot spacing, with alternating rows offset one-half of the spacing resulting in a 45-degree rotated grid interval of 565 feet and included over 2,600 drillholes.
Other exploration work conducted prior to Arch Coal Inc.’s acquisition included regional USGS reconnaissance drilling of unleased Federal coal, prior to ARCO’s, at a density of one to two holes per section and coalbed methane production drilling that was done on a density of anywhere between one and sixteen holes per section. The coalbed methane drillholes and most of the USGS drillholes were rotary drilled.
Mine facilities built by ARCO included a rail spur and loadout loop, a loadout with two 12,500-ton silos, a 100,000-ton slot storage barn, two crusher locations, a coal analysis lab, maintenance shop, warehouse, bathhouse, reclamation shop, and an administrative building.
Initial pit development was conducted with truck/shovel mining equipment, but ARCO subsequently added three draglines by the time the mine was acquired by Arch Coal, Inc., including a Bucyrus-Erie 1300W with a 45 cubic yard bucket, a Bucyrus-Erie 1570W with a 90 cubic yard bucket, and a Bucyrus-Erie 2570WS with a 160 cubic yard bucket.
The Jacobs Ranch Mine also constructed mine facilities similar to those constructed by ARCO, however, as time progressed and mining moved farther west, these facilities, including the loadout, have been idled.
The Jacobs Ranch Mine was historically one of the larger truck/shovel mines operating in the PRB until a Bucyrus-Erie 2570W dragline, with a 120 cubic yard bucket, was brought on-line in 2006.
Weir Technical Report Summary
Black Thunder Mine
Prepared for Core Resources, Inc.
6.0 GEOLOGICAL SETTING, MINERALIZATION, AND DEPOSIT
6.1 REGIONAL, LOCAL, AND PROPERTY GEOLOGY
6.1.1 Regional Geology
The Powder River Coal Basin of northeastern Wyoming lies entirely within the boundaries of the Powder River structural and topographic basin. Coal-bearing strata range in age from Upper Cretaceous in the Mesa Verde Formation to Eocene in the Wasatch Formation. The Powder River Coal Basin covers parts of Campbell, Converse, Crook, Natrona, Niobrara, Johnson, and Weston Counties and is the largest coal basin in Wyoming.
The basin is a broad asymmetric syncline bounded on the west by the Big Horn Mountains, on the east by the Black Hills, and to the south by the Casper Core, Laramie Mountains, and the Hartville Uplift. The basin continues north into Montana where the Miles City Core separates it from the Williston Basin.
The axis of the syncline is slightly west of the center of the basin. Flanking dips are gentle on the eastern limb (two to three degrees) but dip more steeply on the western limb. Faulting occurs in many localities, especially around the basin edge and is in association with folding. Vertical displacements can be several hundred feet. Faulting is more common on the western limb of the syncline than on the eastern limb.
Stratigraphic units of interest in the Black Thunder permit area, from youngest to oldest, include recent alluvial deposits, the Eocene Wasatch Formation, and the Paleocene Fort Union Formation. Locally, the strata dip two degrees to the west-southwest. There is no evidence of major faulting, or folding, within the permit area; although, localized warps and minor faults, probably compactional in nature, in the main coal seams have been indicated by exploration work and during the mining process.
An alluvial covering is present in the drainage patterns and in the slope wash areas adjacent to the drainages. The alluvial deposits are of recent age and consist of primarily unconsolidated, discontinuous lenses of clays, silts, and sands. Locally, recent stream channeling has removed portions of the coal seam with subsequent channel infilling of sediment.
Weir Technical Report Summary
Black Thunder Mine
Prepared for Core Resources, Inc.
Varying amounts of oxidized coal are present when alluvium is in contact with the seam.
The lower Eocene Wasatch Formation consists of interbedded, lenticular clays, silty clays, sandy clays, thin, discontinuous coals, mudstones, and dirty sandstones. Correlation of individual strata is difficult due to the discontinuous and lens-like nature of the units which is inherent in fluvial deposition, e.g., channel sand deposits.
The Upper Paleocene Fort Union Formation underlies the Wasatch Formation. The Fort Union Formation consists of non-carbonaceous to highly-carbonaceous clays, mudstones, sandstones, and coal. The top of the Fort Union Formation is designated as the top of the Wyodak Seam. The Wyodak Seam is the main coal seam, and it lies atop lensoidal clay, silt, and sand beds. The seam base is variable due to changes in the environment of deposition, from the non-coal forming environment of the sands, clays, and silts, to the fringes of the coal forming, swampy conditions in which the Wyodak Seam was deposited.
Clinker (locally known as scoria), a baked or fused rock, is present along the coal outcrop on the eastern edge of Black Thunder’s permit area. This fused material was formed by prehistoric burning of the Main Wyodak coal seam. Both the Wasatch and the Fort Union formations have been affected by this prehistoric burning and have contributed to the volume of baked material present. Mining conditions often deteriorate in proximity of these clinker deposits.
The mudstone is a uniformly textured material composed of 40 to 80 percent clay, and generally 5 to 40 percent silt; the remainder being sand. It is generally medium to dark gray with occasional brown and tan oxidized zones. The mudstone is basically soft to medium stiff with some extremely stiff waxy mudstone throughout much of the area. The mudstone contains some carbonaceous material and thin coal partings.
Sandstone is a major lithologic component of the overburden in the mine area. It is generally weakly cemented with clay, but occasionally well-cemented resistant beds are encountered. Sandstone occurs in discontinuous zones interbedded with similarly discontinuous mudstone and siltstone. It is very fine to medium grained, gray to dark gray in color, with brown and tan oxidized zones. The sandstone ranges from well-graded, poorly-sorted silty sand to clean, uniform, poorly-graded material, consisting of over 80 percent sand in some instances. Sandstone overlies the coal in some areas.
Weir Technical Report Summary
Black Thunder Mine
Prepared for Core Resources, Inc.
Siltstone constitutes approximately 15 percent of the overburden by volume. Like the mudstone, it is uniformly textured with 20 to 55 percent silt, and generally 20 to 60 percent clay, the remainder being sand. It is light to medium gray color and slightly more consolidated than mudstone. Like other overburden lithologic units, the siltstone is discontinuous and occurs interbedded with mudstone and sandstone, and in some areas overlies the coal.
6.1.2 Local Geology
Regionally, the most economical coal seams are contained in the Paleocene Fort Union Formation and the Eocene Wasatch Formation. Individual seams range to greater than 100 feet in thickness. Large quantities of potentially surface-mineable coal are contained in these formations.
6.1.3 Property Geology
The economically mineable coal in Campbell County occurs within the Tongue River Member of the Fort Union Formation. The Wyodak coal seam occurs at the top of the Fort Union Formation and is overlain by the Wasatch Formation. The coal is low sulfur, low ash, and is subbituminous C in rank. Surface mineable coal deposits occur along the north-northwesterly striking subcrop of the Wyodak coal seam. The coal seam subcrops on the eastern edge of the lease and dips about two to three degrees to the west, with some slight rolling. This seam contains multiple benches or plys of coal of variable thicknesses, although in some local areas, it becomes one seam that reaches a thickness in excess of 100 feet. Across the mine permit area, the Wyodak Seam ranges in thickness from 10 feet to 100 feet, averaging approximately 70 feet.
6.2 MINERAL DEPOSIT TYPE AND GEOLOGICAL MODEL
The Black Thunder reserve area is a relatively flat lying sedimentary deposit of Paleocene Age. Black Thunder is actively mining a single coal seam, the Wyodak, that can be comprised of several splits, the Upper and Main splits of the Wyodak Seam. Exploration consists of core drilling for the Upper and Main splits carried out each year in advance of mining, to refine the reserve boundary and to define limits of the mine plan. For internal purposes, Core models the reserve using the Geovia Minex® mine planning software package, completing model updates subsequent to each phase of exploration drilling. WEIR modeled the reserves and resources using Datamine MineScape® Stratmodel geological modeling software. The WEIR model is discussed in more detail in Section 9.1 of this TRS.
Weir Technical Report Summary
Black Thunder Mine
Prepared for Core Resources, Inc.
6.3 STRATIGRAPHIC COLUMN AND CROSS SECTION
Figure 6.3-1 and Figure 6.3-2 show the stratigraphic column and the Upper and Main Wyodak splits cross section related to Black Thunder.
Figure 6.3-1 Stratigraphic Column
Source: U.S. Geological Survey Open-File Report 98-0789B-B (1998)
Weir Technical Report Summary
Black Thunder Mine
Prepared for Core Resources, Inc.
Figure 6.3-2 Wyodak Seam Cross Section Northwest to Southeast
Source: Ark Land Company
Weir Technical Report Summary
Black Thunder Mine
Prepared for Core Resources, Inc.
7.0 EXPLORATION
7.1 NON-DRILLING EXPLORATION
Drilling has served as the sole form of exploration carried out on the Black Thunder property.
7.2 DRILLING
Exploration activities exclusively involve drilling performed by competent contract drilling companies. Exploration drilling at Black Thunder has been a two-stage approach. Initial spot core drilling is conducted on a widely spaced, one-half mile, pattern in order to delineate potential lease areas. Once the area has been leased, development drilling is conducted three to five years in advance of pit development. This drilling is generally on a 500 feet north/south grid with alternating rotary and spot core holes and is done in conjunction with dewatering endeavors. This arrangement results in a seam geometry data spacing of 500 feet and a coal quality data spacing of 1,000 feet. Drilling is conducted with rotary drilling rigs capable of 1,000 feet depths.
All holes are geophysically logged with a standard coal suite tool consisting of gamma, density, caliper, and resistivity. Geophysical logging contractors provide paper copies, .TIF files, and .LAS files.
Spot core holes are rotary drilled to a core point which is projected from the geologic computer model and may be adjusted in the field as drilling progresses. A 3-inch diameter core is then extracted in roughly 20 feet core runs by tripping pipe out of the hole for each core run.
Upon reaching the surface, the split-tube core barrel is opened, core is washed down if necessary, and the driller’s reported length of core that was actually cut is compared to the measured length of core actually recovered. Total core loss for the entire seam is generally less than two feet. If a section of core greater than 10 feet, or less if in a critical zone, is lost, then the hole is re-drilled to recover the lost interval.
Coal sampling for the Upper split of the Wyodak Seam is in 1.0 foot increments for the top and bottom of the seam and evenly proportioned samples of 5 to 10 feet for the remainder of the seam. Sampling for the Main split of the Wyodak Seam is in 1.5 feet increments for the top and bottom of the seam, and 10 feet increments for the remainder of the seam.
Weir Technical Report Summary
Black Thunder Mine
Prepared for Core Resources, Inc.
All partings encountered, down to a thickness of 0.4 foot, are sampled separately.
A hole with significant lost core or crushed core can result in misleading data. Drillholes with core recovery of less than 90 percent are to be noted and subsequently reviewed and potentially excluded from geological and coal quality modeling. WEIR did not exclude any drillholes for poor core recovery, as all of the holes within Black Thunder mine property attained core recovery of at least 90 percent. During core drilling, all core samples are boxed, photographed, and stored. Roof and floor strata core samples are sent to laboratories for geotechnical strength tests. Coal seam core samples are sent to laboratories for quality analyses. Caliper, density, gamma, resistivity, and sonic downhole geophysical logs are completed as drill site and hole conditions allow. Each drillhole collar location is surveyed for accurate map coordinate and elevation data.
All original drillhole, survey, geological, geophysical, and quality data is scanned and stored on a Core server, which is backed up nightly, and can be accessed by select Core personnel and quickly checked against the database, the geological model, or mine mappings. The original copies are stored in an offsite warehouse.
WEIR did not have direct involvement with the planning, implementation or supervision of Core’s drilling programs. However, having reviewed the details of each drilling program, WEIR finds the planning, implementation and supervision of Core’s drilling programs, with all data derived from the drilling programs, to be consistent with industry standards, and sufficient and relevant for use in the estimation of reserves and resources. Weir did not exclude any drill holes from the model.
7.3 HYDROGEOLOGY
Black Thunder is situated in the southern portion of the PRB, within the Cheyenne River watershed and Upper Powder and Antelope sub-basins. The Black Thunder permit area is located on the east limb of the Powder River Structural Basin in northeastern Wyoming. The east limb of the basin dips two to three degrees to the west. The primary drainage in the Black Thunder permit area is Little Thunder Creek, fed by several tributaries within the permit boundary.
Principal aquifers within the Black Thunder area include the Fort Union and overlying Wasatch Formations. These Tertiary Age sand and mudstones occur in the upper portion of the Wasatch-Fox Hills hydrographic sequence (see Figure 6.3-2). The Wasatch-Fox Hills sequence is 1,350 feet in thickness in the northern part of the PRB and thickens to approximately 7,000 feet in Converse County, Wyoming.
Weir Technical Report Summary
Black Thunder Mine
Prepared for Core Resources, Inc.
On a regional basis, flow moves from peripheral recharge areas (along scoria outcrops) toward the center of the basin, primarily controlled by stratigraphy and surface water streamflow. Within the Black Thunder permit area, the gradient dips gently to the west, with head elevations ranging from 4,590 to 4,680 feet.
Core has engaged in extensive modeling to characterize site hydrogeology and to determine groundwater inventories, water quality, and potential impacts to local usage as part of its NPDES permitting process with the Wyoming DEQ. Baseline flow and quality parameters for surface and groundwater inventory have been established and monitored as required by the Wyoming DEQ. Black Thunder maintains an extensive groundwater monitoring network which is approved by Wyoming DEQ-LQD and currently comprised of approximately thirty wells representing well competitions in overburden, underburden, scoria, coal, backfill, and alluvium. These wells are evaluated for both quality and quantity on either a semi-annual or annual basis. Results are reported annually to Wyoming DEQ-LQD. Groundwater impact has been evaluated through seven ground water modeling investigations conducted for the coal aquifer at the Black Thunder Mine.
Water sampling methods for Black Thunder are outlined and maintained by Core in a site-specific work practice document. Reviewed annually, this operating procedure document details sampling locations, frequency, and collection protocols, including storage, transport, delivery and required chain of custody documentation. Approved methods for field data collection and instrument calibration are described, along with methods for creating sample splits, duplicates, and blind standards.
Samples are analyzed by independent laboratories that follow the most recent approved Environmental Protection Agency (EPA) sampling methodology and procedures. The laboratories employ internal quality control and quality assurance protocols before reporting results to Core. Core personnel then review the results again, as a second check for quality control and assurance, before the results are published.
Groundwater inventories, water quality data, water balance, recharge and seepage rates have been reviewed in the approved permit and current permit revisions, including hydrologic impact assessments outlining risks, monitoring program detail, and mitigation obligations. Core’s approach to obtaining and managing its surface and groundwater data for Black Thunder has been demonstrated to be adequate and aligned with regulatory requirements and standard industry practices.
Weir Technical Report Summary
Black Thunder Mine
Prepared for Core Resources, Inc.
Black Thunder monitors surface water at three locations with two of the three sites representing up-stream native conditions and one location capturing downstream effects. All streams in and around Black Thunder are ephemeral and monitored only in response to flow when it occurs. During the months of April to November, in-stream bubbler/pressure transducer data loggers are deployed to collect water quantity data. Quality is typically monitored on a semi-annual basis and intended to capture both spring thaw runoff and thunderstorm/rain events when possible. Sampling is conducted as approved by WY DEQ-LQD. Results are reported annually to WY DEQ-LQD. Should a discharge of water be initiated, samples are collected accordance with WYPDES permits. WEIR finds no material barriers to the continued success of Black Thunder regarding hydrologic impact or compliance.
7.4 GEOTECHNICAL DATA
A geotechnical study of highwall stability for the North, West, and South Pits at Black Thunder was completed by Barr Engineering (Minneapolis, Minnesota) in 2021 as part of a review of the mine’s ground control plan (GCP). Previous geotechnical study and GCP review at Black Thunder were completed in 1973, 2002, 2004, and 2009. Coring, logging, and geophysical logging of 10 boreholes were performed to characterize the lithology of the site and obtain drill core samples of the overlying sand and mudstones. Resulting samples were transported to Soil Engineering Testing (SET), located in Richfield, Minnesota, for geotechnical analysis. Analysis performed include index and soil properties, permeability, and shear strength under the appropriate American Society for Testing and Materials (ASTM) specifications. The current study results indicated that Black Thunder’s current open pit design geometries, as documented in the current ground control plan, are satisfactory to provide safe and stable slopes for the foreseeable 5-year mine plan based on available information. Modeling of the subsurface geological conditions with the final pit wall geometry indicate an expected Factor of Safety (FOS) greater than 1.2. Even for further reduced uniform strength cases, the FOS is greater than 1.0, further suggesting overall pit wall failure is unlikely based on known conditions.
Each cored drillhole included a companion, offset hole that was logged with downhole geophysics (e-logged) by Goodwell, Inc. located in Gillette, Wyoming, and reviewed by Pronghorn Geologic Services located in Gillette, Wyoming. Lithology for each hole was determined using gamma and density downhole data. Slope stability and seepage modeling for both drained and undrained mining conditions were completed to assess the stability of the highwall cuts in each pit.
Weir Technical Report Summary
Black Thunder Mine
Prepared for Core Resources, Inc.
7.5 SITE MAP AND DRILLHOLE LOCATIONS
A map showing the location of all drillholes used to estimate tonnage on the Black Thunder property is shown on Figure 7.5-1.
Weir Technical Report Summary
Black Thunder Mine
Prepared for Core Resources, Inc.
Figure 7.5-1 Drillhole Collar Locations
7.6 DRILLING DATA
Weir Technical Report Summary
Black Thunder Mine
Prepared for Core Resources, Inc.
Core generally uses Matheson Drilling, Inc. located in Gillette Wyoming to drill core holes. Downhole geophysical logging is performed by Goodwell Inc., located in Upton, Wyoming. Coal quality analyses are currently performed by Standard Laboratories, Inc. (Standard) located in Casper, Wyoming.
Weir Technical Report Summary
Black Thunder Mine
Prepared for Core Resources, Inc.
8.0 SAMPLE PREPARATION, ANALYSES, AND SECURITY
8.1 SAMPLE PREPARATION METHODS AND QUALITY CONTROL
Once the target coal seam has been drilled and immediately after logging of the core, all coal samples obtained are placed in labeled plastic core sleeves, sealed, and placed in labeled core boxes. The geologist’s seam thickness measurements are checked against the geophysical logs for thickness accuracy and to confirm core recovery. The samples are coded and labeled with sample identification numbers based on drillhole id (for example, DT2001), sample sequence (A, B, C, etc.), and sample number, (1, 2, 3 etc.), (for example, DT2001A1 = first sample of first seam in drillhole DT2001.) These boxes are kept by the geologic contractor in their storage area until a sufficient load is collected and then delivered directly to the coal analysis lab by the geologic contractor.
Samples are not split or reduced prior to delivery. The full length and diameter of the 3 inch core samples are delivered to the coal analysis laboratory.
8.2 LABORATORY SAMPLE PREPARATION, ASSAYING, AND ANALYTICAL PROCEDURES
8.2.1 Laboratory
Coal analysis for all exploration drilling is conducted by an independent third-party contractor, Standard Laboratories, Inc. (Standard Laboratories) located in Casper, Wyoming. Standard Laboratories conducts all testing under applicable ASTM standards and is accredited by the ANSI National Accreditation Board. Sample preparation by Standard Laboratories includes crushing to suitable size and then creating an appropriate number of splits to accommodate retain samples and composite analyses samples.
All incremental samples receive an as-received short proximate analysis consisting of percent moisture, percent ash, percent sulfur, and Btu/lb. After receiving the results of the short proximate analysis, composite analysis increments are selected based on mining units and sent to Standard Laboratories. For most holes, these composite analyses include Full Proximate, Ash Fusion, Mineral Analysis of Ash, Equilibrium Moisture, Trace Element PPM - Mercury, and Trace Element PPM - Chlorine.
Weir Technical Report Summary
Black Thunder Mine
Prepared for Core Resources, Inc.
For approximately 10 percent of the holes, the composite analyses includes Full Proximate, Ultimate Analysis, Forms of Sulfur, 8-point Ash Fusion, Mineral Analysis of Ash, Water Soluble Alkalis, Hardgrove Grindability Index, Equilibrium Moisture, and Full Trace Element PPM - 27 elements.
Standard Laboratories is certified by ANSI National Accreditation Board and located at 1880 N Loop Ave, Casper, Wyoming 82601
8.3 QUALITY CONTROL PROCEDURES AND QUALITY ASSURANCE
Quality control procedures followed by Core geologists are clearly defined. Core field geologists take defined and specific steps to protect sample integrity and to ensure core samples are always under the control of the Core field geologist. These steps include the following:
•Field geologist to be on site whenever drilling is occurring
•Geologist’s log to be created for each drillhole
•Each drillhole to be logged using geophysical methods
•Geologist to compare field geologist’s logs to the e-log data
•Geologist to compare the core samples against both field geologist’s logs and e-logs to confirm coal thickness
•All core to be boxed and photographed
•Quality sample sheets to be filled out, provided to a supervisor for approval and shipped to the laboratory
•Once core samples have been analyzed, field geologists scrutinize the resulting quality data for accuracy
•Based on the homogeneity of the deposit and the consistent quality of the reserve area as evidenced from the product produced from this active mine, analytical laboratories are instructed to divide the samples and retain the second split for additional analysis should the original test report any anomalies.
8.4 SAMPLE PREPARATION, SECURITY, AND ANALYTICAL PROCEDURES ADEQUACY
Weir Technical Report Summary
Black Thunder Mine
Prepared for Core Resources, Inc.
Core’s procedures for quality analyses provide a full range of coal quality so that engineers and sales staff, reviewing and evaluating the data, have a complete listing of coal seam quality for each drillhole completed by Core.
Drillhole core samples are assigned a sample ID number, and a sample label is created. The label includes drillhole ID, sample ID number, and the to and from depths of the sample. The sample is then placed in a bag with the label. The bags are sealed using zip ties or tape, which begins the chain of custody. The samples do not leave possession of the geologist once removed from the core barrel. The samples remain with the geologist or are stored in a locked facility that only Core geologists can access until delivery of the samples to the contracted laboratory. The delivery of the samples is carried out within one week of drillhole completion. Once in possession of the certified laboratory, the laboratory’s security procedures are followed, all in accordance with standard industry sampling preparation and analyses. After the sample has been tested, reviewed, and accepted, the disposal of the sample is in accordance with local, state, and EPA approved procedures.
Once satisfied that the data laboratory testing reports are accurate, the quality analyses are entered into the Core coal database. Upon data entry completion, the modeling geologists export the data and inspect the data for variance from expected norms. If any data is outside the norm for the property, the data is checked against laboratory results to ensure proper data entry. Once proper data entry is confirmed, quality data is gridded and mapped, with any anomalies in the data mapping investigated. If anomalies are determined to be present, the anomalies are brought to the attention of the geologists, mine engineers and sales staff.
WEIR has determined the sample preparation, security and analysis procedures for the Black Thunder drillhole samples are in accordance with current industry standards for quality testing, with laboratory results suitable to use for mineral resource estimation and related geological modeling.
Weir Technical Report Summary
Black Thunder Mine
Prepared for Core Resources, Inc.
9.0 DATA VERIFICATION
9.1 DATA VERIFICATION PROCEDURES
WEIR reviewed and evaluated copies of all Core drilling records for the Black Thunder LOM Plan area, which included Excel spreadsheets, driller’s log, field geologist’s logs, quality results sheets from the coal quality laboratories, mine measurement tables, as well as drawing files or PDFs of the e-logs. Each drillhole within the LOM Plan was individually checked by WEIR against a copy of the driller’s and/or geologist’s log to confirm data accuracy.
Geological reviews performed by WEIR included:
•Drillhole lithology database comparison to geophysical logs
•Drillhole coal quality database comparison to quality certificates
After WEIR completed the precursory verifications and validations described above, the drillhole data was loaded into Datamine’s MineScape® Stratmodel, a geological modeling package. MineScape provides robust error checking features during the initial data load, which include confirmations of seam continuity, total depth versus hole header file data, interval overlap, and quality sample continuity with coal seams. Once the drillhole data was loaded, a stratigraphic model was created.
Several further verifications were then possible, which include:
•Creating cross sections through the model to visually inspect if anomalies occur due to miscorrelation of seams
•Creating structural and quality contour plots to visually check for other anomalies due to faulty seam elevations or quality data entry mistakes in the drillhole database
Typical errors which may impact reserve and resource estimation relate to discrepancies in original data entry, and might include:
•Incorrect drillhole coordinates (including elevation)
•Mislabeled drillhole lithology
•Unnoticed erroneous quality analyses where duplicate analyses were not requested
Weir Technical Report Summary
Black Thunder Mine
Prepared for Core Resources, Inc.
•Unrecorded drillhole core loss
WEIR conducted a detailed, independent geological evaluation of the data provided by Core, designed to identify and correct errors of the nature listed above. Where errors were identified and could not be successfully resolved, it is WEIR’s policy to exclude that data from the geological model. Based on its geological evaluation of data provided, WEIR did not exclude any holes within the Black Thunder LOM Plan area.
9.2 DATA VERIFICATION LIMITATIONS
WEIR did not conduct an independent verification of property control surveys, nor has it independently surveyed the mining locations. Rather, WEIR relied on information compiled from maps and summaries of the owned and leased property control prepared by Core. WEIR did not conduct a legal title investigation relative to Core’s mineral and surface rights, although there was no reason to believe, based on review of the Black Thunder permit, that Core does not control (by ownership or lease) the coal or surface lands necessary to implement the Black Thunder LOM Plan.
9.3 ADEQUACY OF DATA
It is WEIR’s opinion that the adequacy of sample preparation, security, and analytical procedures for the holes that were drilled by Core, after acquiring the property, are acceptable and meet typical industry standards. Core employs detailed processes and procedures, described in Section 8.4 of this TRS, that are followed each time a core hole is to be sampled. The Core geologist’s logs for these holes contain sampling descriptions and lithologic descriptions that are sufficiently detailed to ascertain that an experienced geologist supervised the drilling and sampling. Core coal quality analyses were performed to ASTM standards by qualified laboratories, as detailed in Section 8.0 of this TRS.
The adequacy of sample preparation, security, and analytical procedures are generally unknown for drillholes that were drilled prior to Core’s predecessor company acquiring the property in 1998. It is unknown if coal quality analyses were performed to ASTM standards by qualified laboratories, as detailed in Section 8.0 of this TRS. This legacy drillhole information was included because these holes, drilled prior to 1998, are within the surface mine workings and have already been mined through and have no influence within the Black Thunder LOM Plan going forward. Model verifications further support WEIR’s high level of confidence that a representative, valid, and accurate drillhole database and geological model have been generated for Black Thunder that can be relied upon to accurately estimate mineral resources and reserves.
Weir Technical Report Summary
Black Thunder Mine
Prepared for Core Resources, Inc.
Weir Technical Report Summary
Black Thunder Mine
Prepared for Core Resources, Inc.
10.0 MINERAL PROCESSING AND METALLURGICAL TESTING
10.1 MINERAL PROCESSING TESTING AND ANALYTICAL PROCEDURES
Mineral processing testing and analytical procedures are not applicable since no mineral processing or metallurgical testing is required at Black Thunder.
After the coal is drilled and blasted, the coal is loaded by large loading shovels or front-end loaders into haul trucks for transport to crushing facilities where the coal is reduced to a final product size of two to three inches. The sized coal product is then conveyed to either the slot coal storage or the silos. As the coal travels along the belt conveyor, a sample cutter drops down intermittently, cuts a sample through the coal, and crushes it into a powder. The onsite laboratory then analyzes the samples to determine the coal quality.
10.2 MINERALIZATION SAMPLE REPRESENTATION
Coal deposits originate in flat, low-lying ground within deltas, alluvial plains, and coastal systems, and as such are a relatively homogeneous, sedimentary mineral occurrence. The deposit within Black Thunder exhibits homogeneous characteristics and does not show any substantial variations in mineralization types or styles that would adversely affect the saleable coal product. Sample data are well representative of the deposit as a whole.
10.3 ANALYTICAL LABORATORIES
The saleable coal product that is sampled from the belt conveyor is tested at Core’s onsite laboratory to determine that the coal is meeting customer quality specifications. Core’s onsite laboratory is not certified. The laboratory performs ASTM and ISO methods for quality analysis to aid in projecting compliance to customers. Customers can request additional testing at an offsite laboratory for further analysis.
10.4 RELEVANT RESULTS AND PROCESSING FACTORS
The coal is sold as a ROM product and is not processed, except for being crushed to a two to three inch top size, depending on customer requirements. As such, processing factors including deleterious elements are not expected to significantly impact the economics of extraction.
Weir Technical Report Summary
Black Thunder Mine
Prepared for Core Resources, Inc.
10.5 DATA ADEQUACY
Core employs testing and analytical procedures in accordance with industry standards, which result in efficient material handling operations that provide requisite quality control to meet product quality projections. The testing performed is sufficient to support the projected saleable product quality for the Black Thunder LOM Plan.
Weir Technical Report Summary
Black Thunder Mine
Prepared for Core Resources, Inc.
11.0 MINERAL RESOURCE ESTIMATES
The mineral resources, as of December 31, 2025, are reported as in-place resources and are exclusive of reported coal reserve tons (see Section 12.0 for reserve tonnage estimates). Resources are reported in categories of Measured, Indicated and Inferred tonnage, in accordance with Regulation S-K Item 1302(d)(1(iii)(A)).
11.1 KEY ASSUMPTIONS, PARAMETERS, AND METHODS
Data Sources
Planimetric data was provided by Core in AutoCAD format and primarily included base map information such as rivers, drainages, roads, mine features, and property boundaries.
The Core drillhole data reviewed by WEIR included lithology, coal quality, and survey data, and was provided in different formats including Excel, ASCII files and PDFs. Geophysical logs, coal quality certificates, driller’s logs, geologist’s logs, downhole deviation data, and drillhole survey records were provided as scanned PDF files and AutoCAD drawing files. Data was provided for 2,042 drillholes, all of which are included in the structural model.
Coal quality data for 1,340 drillholes was provided for Black Thunder, with all 1,340 holes used in the quality model. Data was provided in Excel format along with quality certificates in PDF. Reasons for excluding drillhole quality samples in the modeling process included:
•Poor core recovery noted in the driller’s logs.
•Quality logs that could not be matched to a drillhole.
•The quality listed for the drillhole was not relevant to the model (for example raw Btu/lb. or sulfur were supplied, but not final product Btu/lb. or sulfur). The only relevant raw values used were specific gravity and raw ash. Both are derivable from one another and have bearing on estimated in-place tons.
Geological Model
The Black Thunder geological model was constructed by using seam surface grids that were created in Datamine’s MineScape® Stratmodel (MineScape) geological modeling package.
Topography data was gridded using MineScape software and a grid cell size of 50 feet by 50 feet. Topographic contours from the USGS were provided by Core in CAD format in 25-foot intervals.
Weir Technical Report Summary
Black Thunder Mine
Prepared for Core Resources, Inc.
The contours were provided in the NAD83, Wyoming East State Plane coordinate system (FIPS 4901). The gridded USGS topography contours were compared to drillhole collars and showed that there are differences between the two sets of elevation data. On average, the drillhole collars are less than five feet above or below the USGS topography grid, with the maximum difference of 47 feet. The holes, with the greatest difference, are all outside of the Black Thunder LOM Plan. The hole with the greatest difference within the LOM is approximately 17 feet. These differences are not uncommon when comparing a national data set to localized collar elevations. For this reason, WEIR has not excluded any of the drillholes that have a large elevation difference.
The seam surfaces and thicknesses were created by loading the drilling and mine measurement data into MineScape and gridding the seam intercepts using a grid cell size of 50 feet by 50 feet. The parameters used to create the model are defined in the MineScape modeling schema, which is a specification of modeling rules created for the site. The MineScape interpolators that were used in this study are common in most mine planning software packages. The Planar interpolator is a triangulation method with extrapolation enabled. Finite Element Analysis (FEM) is a widely used method for numerically solving differential equations arising in engineering and mathematical modeling. A trend surface is used in MineScape to promote conformability for the modeled seams to regional structures such as synclines, anticlines, or simply seam dip. MineScape caters to using different interpolators for thickness, roofs and floors (surfaces), and the selected trend surface as they are all modeled separately. The interpolator used for each of these items is selected on the basis of appropriateness to the data sets involved, as well as modeling experience. Stratigraphic Model Interpolators are shown in Table 11.1-1 as follows:
Table 11.1-1 Stratigraphic Model Interpolators
|
|
|
|
|
|
|
|
|
|
|
|
|
|
|
| Interpolator |
|
Parameter |
|
Power/Order |
| Planar |
|
Thickness |
|
0 |
| FEM |
|
Surface |
|
1 |
| Planar |
|
Trend |
|
0 |
The coal seams that were modeled for this TRS are the Upper and Main splits of the Wyodak Seam. A summary of statistics for these drillholes are shown in Table 11.1-2.
Weir Technical Report Summary
Black Thunder Mine
Prepared for Core Resources, Inc.
Table 11.1-2 Drillhole Statistics
|
|
|
|
|
|
|
|
|
|
|
|
|
|
|
|
|
|
|
|
|
|
|
|
|
|
|
|
|
|
|
|
|
|
|
|
|
|
|
|
|
|
|
Average |
|
Minimum |
|
Maximum |
|
|
Number of |
|
Thickness |
|
Hole |
|
Thickness |
|
Hole |
|
Thickness |
| Seam |
|
Intercepts |
|
(Feet) |
|
Name |
|
(Feet) |
|
Name |
|
(Feet) |
| WYODAK - Upper |
|
1880 |
|
12.79 |
|
ARCHFED43-34 |
|
3.5 |
|
BT3794 |
|
20.8 |
| WYODAK - Main |
|
1880 |
|
73.77 |
|
070C2840 |
|
37.5 |
|
BT3744 |
|
73.2 |
The gridded structure surfaces and coal seam thicknesses were validated against drillhole information to ensure that the data was properly modeled. Inconsistencies between modeled seam surfaces and surrounding drillholes were investigated and any confirmed errors in the drillhole data or model parameters were corrected. This process was repeated until a final version of the model was developed.
Coal Quality Model
The drillhole quality data described previously in this report were used to create a raw coal quality model that included raw ash, raw Btu/lb, raw total sulfur, equilibrium moisture, volatile matter, fixed carbon and raw relative coal density.
The drillholes were verified to ensure that the seam depths used in the lithology file matched the sample depths in the quality file, with 1,340 drillholes found to have a fully sampled interval that included the Wyodak Upper split and/or the Wyodak Main split. In each of these 1,340 drillholes, the samples were composited and added to the quality model.
Coal quality samples were loaded into MineScape and composited against the drillhole thicknesses. The composited values were then gridded using a grid cell size of 200 feet by 200 feet and the inverse distance weighted (squared) interpolator. The following quality data was modeled for the Upper and Main splits of the Wyodak Seam:
•Raw
Ash, Dry, weight percent
Calorific Value, Dry, Btu/lb
Total Sulfur, Dry, weight percent
Equilibrium Moisture, weight percent
Volatile Matter, Dry, weight percent
Fixed Carbon, Dry, weight percent Quality contours were generated from the grids to check outlier values.
Hargrove Grindability Index, Dry
Relative Density
Weir Technical Report Summary
Black Thunder Mine
Prepared for Core Resources, Inc.
Additional Resource Criteria and Parameters
Based on WEIR’s review and evaluation of the data and plans relative to the Black Thunder LOM Plan, resource estimation criteria were applied to ensure reported mineral resource tonnage has a reasonable prospect for economic extraction. Resource criteria and parameters for Black Thunder are as follows:
•Resources were estimated as of December 31, 2025.
•Coal density was based on a default apparent relative density (ARD) of 1.28 grams/cubic centimeter.
•Areas where coal thickness did not meet a minimum thickness of 5.0 feet were excluded from the resource estimate.
•Tons with less than 30 feet of cover were considered to be weathered and were excluded from resource estimates.
•A maximum cut-off parting thickness of 0.75 foot for mining the lower seam splits.
•Areas not considered feasibly accessible because of geometry and location in relation to previous mine workings were excluded from resource estimates.
•Tonnage outside of current Black Thunder LOM Plan, but within existing property control, and meeting the criteria listed here, was classified as Resource tonnage and is reported exclusive of Reserve tonnage.
•Core does not use a maximum Stripping Ratio cut-off.
Quality contours were generated from the grids to check outlier values. Maps showing average Raw quality on an as received basis are shown below on Figures 11-1.1 through 11.1-6.
Weir Technical Report Summary
Black Thunder Mine
Prepared for Core Resources, Inc.
Figure 11.1-1 Wyodak - Upper Seam Raw Ash, as Received
Weir Technical Report Summary
Black Thunder Mine
Prepared for Core Resources, Inc.
Figure 11.1-2 Wyodak - Upper Seam Raw BTU, as Received
Weir Technical Report Summary
Black Thunder Mine
Prepared for Core Resources, Inc.
Figure 11.1-3 Wyodak - Upper Seam Raw Sulfur, as Received
Weir Technical Report Summary
Black Thunder Mine
Prepared for Core Resources, Inc.
Figure 11.1-4 Wyodak - Main Seam Raw Ash, as Received
Weir Technical Report Summary
Black Thunder Mine
Prepared for Core Resources, Inc.
Figure 11.1-5 Wyodak - Main Seam Raw BTU, as Received
Weir Technical Report Summary
Black Thunder Mine
Prepared for Core Resources, Inc.
Figure 11.1-6 Wyodak - Main Seam Raw Sulfur, as Received
Weir Technical Report Summary
Black Thunder Mine
Prepared for Core Resources, Inc.
11.2 ESTIMATES OF MINERAL RESOURCES
The mineral resources, as of December 31, 2025, are reported as in-place resources and are exclusive of reported coal reserve tons (see Section 12.0). Resources are reported based on the coal resource estimate methodology described and are summarized in Table 11.2-1 as follows:
Table 11.2-1 In-Place Coal Resource Tonnage and Quality Estimate,
as of December 31, 2025
|
|
|
|
|
|
|
|
|
|
|
|
|
|
|
|
|
|
|
|
|
|
|
|
|
|
|
|
|
|
|
|
|
|
|
|
|
|
|
|
|
|
|
|
|
|
|
|
|
|
|
|
|
|
|
|
|
|
|
|
|
|
|
|
|
|
|
|
|
|
|
|
|
|
|
|
|
Raw Coal Quality (As Received) |
|
|
|
|
Average Coal |
|
|
|
|
|
|
|
Average |
|
|
|
|
|
|
|
Calorific |
|
|
Area |
|
Thickness |
|
In-Place Resources (000 Tons) |
|
Stripping Ratio |
|
Ash |
|
Sulfur |
|
Volatile |
|
Value |
| Seam |
|
(Acres) |
|
(Feet) |
|
Measured |
|
Indicated |
|
Total |
|
(BCY/T) |
|
(%) |
|
(%) |
|
Matter |
|
(Btu/lb) |
| WYODAK - Upper |
|
1,200 |
|
13.49 |
|
25,000 |
|
— |
|
25,000 |
|
— |
|
5.1 |
|
0.55 |
|
33.1 |
|
8,950 |
| WYODAK - Main |
|
1,375 |
|
73.12 |
|
175,000 |
|
5,000 |
|
180,000 |
|
— |
|
4.0 |
|
0.23 |
|
31.9 |
|
8,990 |
|
|
|
|
|
|
200,000 |
|
5,000 |
|
205,000 |
|
4:1 |
|
4.1 |
|
0.27 |
|
32.0 |
|
8,980 |
Notes:
•Mineral Resources reported above are not Mineral Reserves and do not meet the threshold for reserve modifying factors, such as estimated economic viability, that would allow for conversion to mineral reserves. There is no certainty that any part of the Mineral Resources estimated will be converted into Mineral Reserves. Mineral Resources reported here are exclusive of Mineral Reserves.
•Resources stated as contained within a potentially economically mineable surface mine assuming a thermal coal product realizing a sales price of $15.77 per ton FOB Mine and operating cost of $14.57 per ton
•Numbers in the table have been rounded to reflect the accuracy of the estimate and may not sum due to rounding.
11.3 TECHNICAL AND ECONOMIC FACTORS FOR DETERMINING PROSPECTS OF ECONOMIC EXTRACTION
A PFS was conducted to assess the prospects for economic extraction of coal within Black Thunder.
The FOB Mine coal sales price used in assessing the economic mineability of the Black Thunder is primarily based on sales of a thermal coal product, which had an average coal sales price of $14.83 per ton in 2024 through September 2025 and is projected to average $15.77 per ton over the Black Thunder LOM Plan. The sales price is further supported in Section 16.0 of this TRS.
Capital expenditures (including contingency) are discussed in further detail in Section 18.1 of this TRS and are projected to average $0.37 per ton over the Black Thunder LOM Plan, which are higher than actual capital expenditures for Black Thunder of $0.23 per ton in 2024 through September 2025.
Weir Technical Report Summary
Black Thunder Mine
Prepared for Core Resources, Inc.
Operating costs are discussed in further detail in Section 18.2 of this TRS and are projected to average $14.57 per ton over the Black Thunder LOM Plan, compared to actual Black Thunder operating cost of $14.04 per ton in 2024 through September 2025.
Total projected capital expenditures and operating cost of $14.94 per ton, and the coal sales price of $15.77 per ton, provide a reasonable basis for WEIR to determine that all remaining coal has prospects of economic extraction within the Black Thunder mine property.
11.4 MINERAL RESOURCE CLASSIFICATION
Mineral Resource estimates prepared for Black Thunder are based on the SEC Regulation S-K Item 1302(d)(1(iii)(A)), which established definitions and guidance for mineral resources, mineral reserves, and mining studies used in the United States. The definition standards relative to resources are as follows:
Mineral Resource:
Mineral resource is a concentration or occurrence of material of economic interest in or on the Earth's crust in such form, grade or quality, and quantity that there are reasonable prospects for economic extraction. A mineral resource is a reasonable estimate of mineralization, taking into account relevant factors such as cut-off grade, likely mining dimensions, location or continuity, that, with the assumed and justifiable technical and economic conditions, is likely to, in whole or in part, become economically extractable. It is not merely an inventory of all mineralization drilled or sampled.
•Inferred mineral resource is that part of a mineral resource for which quantity and grade or quality are estimated on the basis of limited geological evidence and sampling. The level of geological uncertainty associated with an inferred mineral resource is too high to apply relevant technical and economic factors likely to influence the prospects of economic extraction in a manner useful for evaluation of economic viability. Because an inferred mineral resource has the lowest level of geological confidence of all mineral resources, which prevents the application of the modifying factors in a manner useful for evaluation of economic viability, an inferred mineral resource may not be considered when assessing the economic viability of a mining project, and may not be converted to a mineral reserve.
•Indicated mineral resource is that part of a mineral resource for which quantity and grade or quality are estimated on the basis of adequate geological evidence and sampling. The level of geological certainty associated with an indicated mineral resource is sufficient to allow a qualified person to apply modifying factors in sufficient detail to support mine planning and evaluation of the economic viability of the deposit. Because an indicated mineral resource has a lower level of confidence than the level of confidence of a measured mineral resource, an indicated mineral resource may only be converted to a probable mineral reserve.
Weir Technical Report Summary
Black Thunder Mine
Prepared for Core Resources, Inc.
•Measured mineral resource is that part of a mineral resource for which quantity and grade or quality are estimated on the basis of conclusive geological evidence and sampling. The level of geological certainty associated with a measured mineral resource is sufficient to allow a Qualified Person to apply modifying factors, as defined in this section, in sufficient detail to support detailed mine planning and final evaluation of the economic viability of the deposit. Because a measured mineral resource has a higher level of confidence than the level of confidence of either an indicated mineral resource or an inferred mineral resource, a measured mineral resource may be converted to a proven mineral reserve or to a probable mineral reserve.
Geostatistical methods were applied to drillhole and mine measurement coal thickness data for the Wyodak Seam at Black Thunder to develop variogram ranges (radii) used for resource classification. Figure 11.4-1 illustrates the variogram using 1,902 seam thickness measurements, both within and outside of the Black Thunder LOM Plan. Table 11.4-1 shows the sample count, Measured and Indicated resource ranges determined by the variogram model, and average sample spacing in feet. The theoretical ranges estimated for Measured (to 4,800 feet) and Indicated (to 14,500 feet) resources in WEIR’s variographic analysis demonstrates the spatial continuity of mineable coal seam thickness in the Wyodak Seam at Black Thunder.
Table 11.4-1 Theoretical Variogram Ranges
|
|
|
|
|
|
|
|
|
|
|
|
|
|
|
|
|
|
|
|
|
|
|
|
|
|
|
|
|
|
|
|
|
|
|
|
|
|
|
|
|
|
|
|
|
|
|
|
|
|
|
|
|
|
|
Average |
|
Minimum |
|
Maximum |
|
|
|
|
Measured |
|
Indicated |
|
Inferred |
|
Sample |
|
Sample |
|
Sample |
|
|
Sample |
|
Range |
|
Range |
|
Range |
|
Spacing |
|
Spacing |
|
Spacing |
| Variogram |
|
Count |
|
(Feet) |
|
(Feet) |
|
(Feet) |
|
(Feet) |
|
(Feet) |
|
(Feet) |
| Black Thunder Wyodak Seam |
|
1,902 |
|
4,800 |
|
14,500 |
|
>14,500 |
|
485 |
|
28 |
|
2,327 |
As depicted above, variability in drillhole thickness measurements is highly correlated with the distance between individual drillholes, in particular within the theoretical ranges for Measured and Indicated tonnage. Additionally, WEIR’s generation and review of the applicable quality contours further supports the continuity of coal quality throughout the deposit.
Weir Technical Report Summary
Black Thunder Mine
Prepared for Core Resources, Inc.
The theoretical ranges estimated for Measured (to 4,800 feet) and Indicated (to 14,500 feet) resources in WEIR’s variographic and quality analysis demonstrates the spatial continuity of mineable coal seam thickness and quality in the Wyodak Seam at Black Thunder. WEIR has a high level of geological confidence in this data and considers it sufficient to allow for the application of modifying factors to support detailed mine planning and evaluation of the economic viability of the deposit within the Measured and Indicated ranges.
WEIR has chosen to apply classification radii more conservative than the theoretical radii demonstrated above to be consistent with previous reporting for the Black Thunder deposit. Greater than 99 percent of the estimated tons are classified as measured using the more conservative radii distances. Selection of more conservative classification radii only further increases confidence within the various tonnage classification categories.
Classification radii utilized by WEIR in this study are as follows:
•Measured: 0 - 1,320 feet (based on 1,902 observations informing estimate of coal thickness within this range)
•Indicated: 1,320 - 3,960 feet (based on 1,902 observations informing estimate of coal thickness within this range)
•Inferred: greater than 3,960 feet (based on 1,902 observations informing estimate of coal thickness within this range)
11.5 UNCERTAINTY IN ESTIMATES OF MINERAL RESOURCES
Mining is a high risk, capital-intensive venture and each mineral deposit is unique in its geographic, social, economic, political, environmental, and geologic aspects. At the base of any mining project is the mineral resource itself. Potential risk factors and uncertainties in the geologic data serving as the basis for deposit volume and quality estimations are significant considerations when assessing the potential success of a mining project.
Geological confidence may be considered in the framework of both the natural variability of the mineral occurrence and the uncertainty in the estimation process and data behind it. The mode of mineralization, mineral assemblage, geologic structure, and homogeneity naturally vary for each deposit. Structured variability like cyclic depositional patterns in sedimentary rock can be delineated mathematically with solutions like trend surface analysis or variography.
Weir Technical Report Summary
Black Thunder Mine
Prepared for Core Resources, Inc.
Unstructured variability, in the distribution of igneous rock composition, for example, is more random and less predictable.
The reliability of mineral resource estimation is related to uncertainties introduced at different phases of exploration. Resources meeting criteria for Measured, Indicated, and Inferred categories are determined by the quality of modeled input data, both raw and interpreted. An exploration program comprises several stages of progressive data collection, analysis, and estimation, including:
⦁ Geological data collection
⦁ Geotechnical data collection
⦁ Sampling and assaying procedures
⦁ Bulk density determination
⦁ Geological interpretation and modeling
⦁ Volume and quality estimation
⦁ Validation
⦁ Resource classification and estimation
Error may be introduced at any phase. Data acquisition and methodologies should be properly documented and subject to regular quality control and assurance protocols at all stages, from field acquisition through resource estimation. Managing uncertainty requires frequent review of process standards, conformance, correctional action, and continuous improvement planning. Risk can be minimized with consistent exploration practices that provide transparent, backwards traceable results that ultimately deliver admissible resource estimates for tonnage and quality.
Less dense drillhole coverage in the southwestern portion of Black Thunder is a source of uncertainty, however, that uncertainty is reflected in the classification of Indicated resources versus Measured resources.
As discussed in Sections 8.0, 9.0, and 10.0 of this TRS, it is WEIR’s opinion that Core’s methodologies of data acquisition, record-keeping, and QA/QC protocols are in accordance with Core procedures, and are adequate and reasonable for resource estimation at Black Thunder.
In summary, WEIR has reviewed all geologic and geotechnical data inputs, collection protocols, sampling, assaying, and laboratory procedures serving as the basis for the deposit model, its interpretation, and the estimation and validation of the quantity and quality of mineral resources at Black Thunder. The spatial continuity of the Upper and Main splits of the Wyodak Seam coal deposit at Black Thunder is well demonstrated by professionally developed, well maintained, quantitative and qualitative data.
Weir Technical Report Summary
Black Thunder Mine
Prepared for Core Resources, Inc.
WEIR finds no material reason regarding geologic uncertainty that prohibits acceptably accurate estimation of mineral resources.
11.6 ADDITIONAL COMMODITIES OR MINERAL EQUIVALENT
There are no other commodities or minerals of interest within the Black Thunder resource area other than the coal deposit discussed in this TRS.
11.7 RISK AND MODIFYING FACTORS
The concentration of drilling within the exclusive resource area is less dense than the rest of the Black Thunder property. The resource area is a long thin area, approximately 37,000 feet by 1,000 feet, that bounds the Black Thunder LOM Plan to the west. Drilling within the adjacent LOM Plan reserve area make up the bulk of the data points used for resource estimation. Many of these drillholes are within 200 to 800 feet of the boundary between the reserve and resource areas. However, the spacing increases to the west. The average drillhole spacing ranges from 800 to 1,300 feet (one instance of approximately 3,000 feet). This wider spacing can decrease the confidence of structural features, including seam thickness, and top and bottom elevations. The resource area at Black Thunder is bounded by the LOM Plan in the east and by Core’s lease control boundary in the west. Additional drilling in the Black Thunder resource area will increase confidence in the structural features.
Risk is also associated with the volatility of coal sales prices, and significant variations in operating cost, capital expenditures, and productivity can preclude the economic mineability of the Black Thunder mining operation, at projected thermal coal sales prices.
Unforeseen changes in legislation and new industry developments could alter the performance of Core by impacting thermal coal demand, regulation and taxes, including those aimed at reducing emissions of elements such as mercury, sulfur dioxides, nitrogen oxides, particulate matter or greenhouse gases. The emphasis on reducing emissions, is more of a concern for mines producing a thermal coal product like that produced from Black Thunder.
Weir Technical Report Summary
Black Thunder Mine
Prepared for Core Resources, Inc.
12.0 MINERAL RESERVE ESTIMATES
12.1 KEY ASSUMPTIONS, PARAMETERS, AND METHODS
The conversion of resources to reserves at Black Thunder considers the projected mineral prices and operating costs, regulatory compliance requirements, and mineral control to determine if the saleable coal product will be economically mineable. The design of an executable mine plan that accommodates the planned mining equipment and provides a safe work environment is also considered.
Based on Black Thunder’s historical performance and projected mineral continuity, the mine design is the primary consideration, apart from mineral resource classification, whereupon resources are converted to reserves at Black Thunder.
Based on WEIR’s review and evaluation of the Black Thunder LOM Plan, the justification for conversion of resources to reserves was based on specific criteria. The following criteria were used to estimate reserves for the Black Thunder property:
•Reserves were estimated as of December 31, 2025.
•Coal density was based on a default ARD of 1.28 grams/cubic centimeter.
•Areas where coal thickness did not meet a minimum thickness of 5.0 feet were excluded from the resource estimate.
•A maximum cut-off parting thickness of 0.75 foot for mining the lower seam splits.
•A weathering surface, of topography minus 30 feet was used to exclude potentially oxidized coal.
•Core does not use a maximum Stripping Ratio cut-off.
•The Upper Seam splits use an average mining recovery of 85 percent, while the Main Seam splits use an average mining recovery of 92 percent.
•For mine design purposes, it is assumed that acquisition of mineral control for currently adverse areas will be successful, as it has been historically at Black Thunder. The current Black Thunder LOM Plan does not have any adverse areas, however, if Core decides to extend the LOM Plan to the north, south or west, acquisition of adverse property will be necessary.
Weir Technical Report Summary
Black Thunder Mine
Prepared for Core Resources, Inc.
•Core’s mineral rights for the Black Thunder coal deposits supersedes the mineral rights for oil and gas wells on the property. Core maintains the right to have the wells plugged and mine through them. There are 10 remaining oil and gas wells within the Black Thunder LOM Plan, and Core is required to compensate the well owner when the revenue stream from a well ceases. Plugging a gas well in accordance with the MSHA standards, in order to mine through a well, has an average cost of $175,000. Therefore, coal tonnage surrounding the oil and gas wells has been included in the reserve estimates.
•Reserves are based on a raw coal saleable product.
12.2 ESTIMATES OF MINERAL RESERVES
The mineral reserves that represent the economically viable tonnage controlled by Core, based on the coal reserve estimate methodology described and independent evaluation of the geology, are shown in Table 12.2-1 as follows:
Table 12.2-1 Recoverable Coal Reserve Tonnage and Quality Estimate as of
December 31, 2021
|
|
|
|
|
|
|
|
|
|
|
|
|
|
|
|
|
|
|
|
|
|
|
|
|
|
|
|
|
|
|
|
|
|
|
|
|
|
|
|
|
|
|
|
|
|
|
|
|
|
|
|
|
|
|
|
|
|
|
|
|
|
|
|
|
|
|
|
|
|
|
|
|
|
|
|
|
|
|
|
|
Average |
|
|
|
|
|
|
|
|
|
Raw Coal Quality (As Received) |
|
|
|
|
|
|
Coal |
|
Saleable Tons (000) |
|
Average |
|
|
|
|
|
|
|
|
|
Calorific |
|
|
|
|
Area |
|
Thickness |
|
(As Received) Reserves |
|
Stripping Ratio |
|
Moisture |
|
Ash |
|
Sulfur |
|
Volatile |
|
Value |
| Seam |
|
Product Quality |
|
(Acres) |
|
(Feet) |
|
Proven |
|
Probable |
|
Total |
|
(BCY/T) |
|
(%) |
|
(%) |
|
(%) |
|
Matter |
|
(Btu/lb) |
| WYODAK - Upper |
|
Subbituminous |
|
3,700 |
|
12.7 |
|
32,000 |
|
— |
|
32,000 |
|
— |
|
25.8 |
|
6.1 |
|
0.65 |
|
33.1 |
|
8,890 |
| WYODAK - Main |
|
Subbituminous |
|
4,590 |
|
71.8 |
|
297,500 |
|
2,000 |
|
299,500 |
|
— |
|
25.8 |
|
4.6 |
|
0.26 |
|
32.0 |
|
8,910 |
|
|
|
|
|
|
|
|
329,500 |
|
2,000 |
|
331,500 |
|
3.5:1 |
|
25.8 |
|
4.8 |
|
0.30 |
|
31.9 |
|
8,910 |
Notes:
•Raw recoverable Reserve tonnage based on mining recovery of 85 percent for surface mining the Upper split of the Wyodak Seam, and 92 per cent for surface mining the Main split of the Wyodak Seam.
•Mineral Reserves estimated at a sales price of $15.77 per ton FOB Mine and operating cost of $14.57 per ton
•Numbers in the table have been rounded to reflect the accuracy of the estimate and may not sum due to rounding
•Mineral Reserves are reported exclusive of Mineral Resources
WEIR completed a validation check of its model by using the model to calculate the theoretical tonnage of areas mined from October 1, 2024 through September 30, 2025 and comparing the results to the actual production tonnage from the same timeframe. The results were within a variance of 1.4 percent. The variance can be explained in part by the differing methods of calculating tonnage. The WEIR model used a constant 85 percent mining recovery for the Upper split of the Wyodak Seam and 92 percent mining recovery for the Main split of the Wyodak Seam. The results of the validation are shown in Table 12.2-2.
Weir Technical Report Summary
Black Thunder Mine
Prepared for Core Resources, Inc.
Table 12.2-2 Reserve Validation
|
|
|
|
|
|
|
|
|
|
|
|
|
|
|
|
|
|
|
|
|
|
|
|
|
|
|
|
|
|
|
Actual Production |
|
Estimated Model Tonnage |
|
Variance |
| Mine Area |
|
Seam |
|
(Oct 1 2024 - Sept 30 2025) |
|
(Oct 1 2024 - Sept 30 2025) |
|
(%) |
| Black Thunder |
|
WYODAK - Main |
|
48,041,071 |
|
48,723,844 |
|
1.42 |
12.3 ESTIMATES OF RESERVE CUT-OFF GRADE
Generally, the reserves mined at Black Thunder are not limited by highwalls, but rather by coal quality and stripping ratio. One area that is potentially limited by future highwall advance is the western most boundary of leases WYW150318 and WYW174596, since it includes the areas adjacent to the main-line corridor of the BNSF Class 1 railway. At this time, this coal is considered recoverable, although future engineering studies and mine development plans may refine the mineability of this coal.
Based on historical saleable coal quality, current coal sales contracts, and projected coal quality and stripping ratios modeled by WEIR, WEIR does not foresee future coal quality deviations from the present that would adversely affect the saleable coal product.
12.4 MINERAL RESERVE CLASSIFICATION
WEIR prepared the Black Thunder reserve and resource estimates in accordance with SEC Item 1302(d)(1(iii)(A)) of Regulation S-K, which establishes guidance and definitions for mineral resources, mineral reserves, and mining studies used in the United States. The SEC Regulation S-K Definition Standards relative to reserves are as follows:
Modifying factors are the factors that a qualified person must apply to indicated and measured mineral resources and then evaluate to establish the economic viability of mineral reserves. A qualified person must apply and evaluate modifying factors to convert measured and indicated mineral resources to proven and probable mineral reserves. These factors include but are not restricted to: Mining; processing; metallurgical; infrastructure; economic; marketing; legal; environmental compliance; plans, negotiations, or agreements with local individuals or groups; and governmental factors. The number, type and specific characteristics of the modifying factors applied will necessarily be a function of and depend upon the mineral, mine, property, or project.
Weir Technical Report Summary
Black Thunder Mine
Prepared for Core Resources, Inc.
A mineral reserve is an estimate of tonnage and grade or quality of indicated and measured mineral resources that, in the opinion of the qualified person, can be the basis of an economically viable project. More specifically, it is the economically mineable part of a measured or indicated mineral resource, which includes diluting materials and allowances for losses that may occur when the material is mined or extracted.
•Probable mineral reserve is the economically mineable part of an indicated and, in some cases, a measured mineral resource.
•Proven mineral reserve is the economically mineable part of a measured mineral resource and can only result from conversion of a measured mineral resource.
Within the extent of the LOM Plan for Black Thunder, Measured Resources were converted to Proven Reserves and Indicated Resources were converted to Probable Reserves. Within the extent of the LOM Plan for Black Thunder, Measured and Indicated Resources were converted to Probable Reserves.
12.5 COAL RESERVE QUALITY AND SALES PRICE
Coal quality for Black Thunder was determined by modeling the drillhole coal quality analyses for the LOM Plan. The average coal quality, on an As Received basis, for raw coal for the Black Thunder LOM Plan reserves is shown in Table 12.5-1 as follows:
Table 12.5-1 Average Reserve Quality
|
|
|
|
|
|
|
|
|
|
|
|
|
|
|
|
|
|
|
|
|
|
|
|
|
|
|
|
|
|
|
|
|
|
|
Raw Coal Quality (As Received) |
|
|
|
|
|
|
|
|
|
|
Calorific |
|
|
Ash |
|
Moisture |
|
Sulfur |
|
Volatile |
|
Value |
| Seam |
|
(%) |
|
(%) |
|
(%) |
|
Matter |
|
(Btu/lb) |
| WYODAK - Upper |
|
6.1 |
|
25.8 |
|
0.7 |
|
33.1 |
|
8,890 |
| WYODAK - Main |
|
4.6 |
|
25.8 |
|
0.3 |
|
32.0 |
|
8,910 |
|
|
4.8 |
|
25.8 |
|
0.3 |
|
31.9 |
|
8,910 |
Based on historical saleable coal quality, current coal sales contracts, and projected coal quality modeled by WEIR, WEIR does not foresee future coal quality deviations from the present that would adversely affect the saleable coal product.
Based on the expected modeled coal quality, the estimated FOB Mine coal sales price throughout the Black Thunder LOM Plan and in the PFS used to determine reserves, averages $15.77 per ton. As detailed previously, average sales price of a sub-bituminous thermal coal from 2024 through September 2025 was $14.83 per ton. Additional information and discussion for selecting this price and associated assumptions are discussed in Section 16 of this TRS.
Weir Technical Report Summary
Black Thunder Mine
Prepared for Core Resources, Inc.
12.6 RISK AND MODIFYING FACTORS
The estimate of reserve tonnage includes areas that are exclusively within the Black Thunder LOM Plan. The concentration of valid drilling data points within Black Thunder are generally less than 500 feet from the next nearest data point, resulting in a high confidence of reserve continuity and extent. All reserves within the Black Thunder LOM Plan are within the Proven and Probable classifications determined using the geostatistics variographic study discussed in Section 12.4-1 of this TRS.
Due to the relatively simple geology in the area, and the relatively high continuity (both structure and quality) of the coal within the Black Thunder LOM Plan, geologic uncertainties do not appear to pose a significant risk to mine development.
Black Thunder has an excellent safety record and maintains diligent regulatory compliance. Workforce census has been and is expected to remain stable. The primary mining equipment is well-maintained and has sufficient capability to attain projected levels of productivity and production. This further contributes to Black Thunder Mine being a relatively low risk operation.
Coal recovery is an important aspect in assessing the economic viability of a mine. Based on Core’s historical extraction rates for the surface mine plan, WEIR does not anticipate significant deviation of coal recovery throughout the Black Thunder LOM Plan. WEIR utilized a weighted average mining recovery of 85 percent for Black Thunder in its estimation of recoverable reserves for the Upper split of the Wyodak Seam, and a mining recovery of 92 percent for Black Thunder in its estimation of recoverable reserves for the Main split of the Wyodak Seam.
Risk is also associated with volatility of coal market prices. Even significant variations in operating cost, capital expenditures, and productivity would not likely preclude the economic mineability of Black Thunder, at the projected thermal coal sales price.
Weir Technical Report Summary
Black Thunder Mine
Prepared for Core Resources, Inc.
13.0 MINING METHODS
The mining method at Black Thunder is surface mining utilizing draglines and truck/shovel mining equipment. The surface mining method has been successfully utilized in the PRB since the 1970s, and in other coal producing regions of the United States.
Black Thunder is mining the Upper and Main splits of the Wyodak Seam and parting interval within the seam utilizing draglines, shovels, front-end loaders, trucks, dozers, or scrapers in three long pits and a pit being developed west of the mine office (see Figure 13.5-1).
13.1 GEOTECHNICAL AND HYDROLOGICAL MODELS
13.1.1 Geotechnical Model
Relative to highwall stability, the Black Thunder pit geometry is based on the Simplified Bishop Method of analysis. This method implements rock quality strength parameters that are measured from continuous core samples as input and resulting in a factor of safety for the designed pit geometry. Continuous cores are drilled at locations intended to maintain the integrity of the geological model specifically regarding burden versus coal. As an integral part of this design, and as per Mine Safety and Health Administration (MSHA) requirements, Black Thunder maintains highwall safety benches that are a minimum of 40 feet in width, generally 55 feet per 100 vertical feet of highwall. All prestrip benches are also included in this pit geometry design. Black Thunder maintains, through adherence to the Simplified Bishop Method, a slope stability safety factor of 1.3 or greater. The stability models indicated that the factor of safety for the North Pit, West Pit and South Pit was greater than 1.35.
Black Thunder has an MSHA approved Ground Control Plan that is based on the above-mentioned parameters. This Ground Control Plan is detailed in the Black Thunder Wyoming DEQ permit. Compliance with the plan is monitored by the Wyoming DEQ and the MSHA on a continuing basis to help ensure miner safety. Any corrections to the Ground Control Plan are required to be promptly submitted to the Wyoming DEQ and MSHA for approval. However, this is rare, due mostly to the basic conservative nature of current pit design. To date, there have been no significant slope failures at Black Thunder, although there was a slab failure, or movement of a slab of rock, in 2002 that was associated with sub-vertical jointing and likely related to water seepage from a thick sand channel.
Weir Technical Report Summary
Black Thunder Mine
Prepared for Core Resources, Inc.
13.1.2 Hydrogeological Model
Based on the geotechnical study conducted by Barr Engineering (Barr), groundwater problems are typically associated with loose sands observed in weaker, less cemented zones of sandstone. Groundwater flow rates are estimated by drillers during exploration drilling campaigns using measuring buckets or estimated based on experience at the site. Greater water flows were observed at higher elevations, within the sandstone, of the West Pit. As noted in the Barr study, Black Thunder has developed a series of dewatering wells, which have proven to be successful to mitigate risk related to highwall stability.
Potential concerns related to groundwater were noted in a feasibility study conducted in 1973, where groundwater levels were recorded at 26 to 36 feet below ground surface, though the location of these measurements is not known. Perched groundwater conditions have been described at the mine in prior studies, with an upper coal seam noted as a confined aquifer. These perched conditions were observed to occur in saturated “paleochannel sands” (also known as “water sands”), which have caused local slabbing failures. Dewatering was discussed as the most effective mitigation measure in a study by Calder & Workman in 1994. In general, the sand is very hard when dry, but becomes uncemented and may flow when wet or when blasted.
Black Thunder performs dewatering of the overburden, as needed, prior to development of dragline highwalls, through installation of dewatering wells. In general, this is done when holes with greater than 20 gpm of water flow are encountered while performing exploration drilling in advance of the highwall development. The exploration holes are spaced at 500-feet intervals, with dewatering holes spaced at 250-feet intervals along a section line parallel to the pit, with section lines spaced 500 feet apart (perpendicular to the pit). Black Thunder reported that there are over 100 dewatering wells at the mine site with most of these wells located to support mining the West Pit.
When less than 20 gpm of water inflow is encountered while drilling, the water is generally controlled in the pit. Diversion ditches and water impoundments are created to manage surface water in the mine pits.
The Barr study reported that dewatering efforts have been observed to be effective, especially in the northern part of the West Pit. Black Thunder has observed lower water levels and less groundwater inflow from the West Pit highwall.
Weir Technical Report Summary
Black Thunder Mine
Prepared for Core Resources, Inc.
Some entire sand units were previously saturated, but excavation as deep as 70 feet has been attained before water is observed.
13.1.3 Other Mine Design and Planning Parameters
Black Thunder currently operates a fleet of five draglines and 10 shovels for overburden removal and four shovels for coal removal from four pits. The shovels develop a series of benches that range from 50 to 100 feet to prepare a bench for the draglines. A fleet of seven diesel-powered drills create 12-1/4-inch boreholes at a 60 degree angle for cast-blasting the overburden 150 feet above the coal. The draglines remove the overburden above the coal from a bench created by the dozers, after the cast-blast. After the overburden is removed by the draglines, coal shovels load the coal into trucks for delivery to overland belt conveyors that transport the coal to one of the three rail loadouts.
Mining progresses in an orderly and sequential fashion to meet required sales production and coal quality. The current mining sequence south of State Highway 450, progresses in an east to west direction. North of State Highway 450, mining advances from south to north. Recovery of the coal beneath the existing rail spurs, mine facilities, and State Highway 450 is deferred to the later years of the Black Thunder LOM Plan in order to utilize the existing surface facilities as long as possible.
13.2 PRODUCTION, MINE LIFE, DIMENSIONS, DILUTION, AND RECOVERY
13.2.1 Production Rates
Actual saleable tons produced by Black Thunder for 2024 through September 2025 are shown in Table 13.2-1 as follows:
Table 13.2-1 Black Thunder Mine Historical Saleable Tons Produced
|
|
|
|
|
|
|
|
|
|
|
|
|
|
|
|
|
|
|
|
|
|
|
2024 |
|
2025 (1) |
|
Total |
| Saleable Tons Produced (000s) |
|
44,437 |
|
35,119 |
|
79,556 |
|
|
|
|
|
|
|
(1) Actual through September |
|
|
|
|
|
|
Core’s projected saleable coal production for the Black Thunder LOM Plan is shown in Table 13.2-2 as follows:
Table 13.2-2 Black Thunder Mine LOM Plan Projected Saleable Tons Produced
Weir Technical Report Summary
Black Thunder Mine
Prepared for Core Resources, Inc.
|
|
|
|
|
|
|
|
|
|
|
|
|
|
|
|
|
|
|
|
|
|
|
|
|
|
|
|
|
|
|
|
|
|
|
|
|
|
|
|
|
|
|
|
|
|
|
|
|
|
|
|
|
|
|
|
|
|
|
|
|
|
|
|
|
|
|
|
|
|
|
|
|
|
|
|
|
|
|
|
|
|
|
|
|
|
|
|
|
2026 |
|
2027 |
|
2028 |
|
2029 |
|
2030 |
|
2031 |
|
2032 |
|
2033 |
|
2034 |
|
2035 |
|
2036 |
|
2037 |
|
2038 |
|
Total |
| Saleable Tons Produced (million) |
|
45.0 |
|
42.0 |
|
40.0 |
|
32.0 |
|
32.0 |
|
23.3 |
|
23.6 |
|
21.9 |
|
21.9 |
|
14.6 |
|
14.6 |
|
14.6 |
|
6.0 |
|
331.5 |
13.2.2 Expected Mine Life
The Black Thunder LOM Plan projects mining through December 2038, with an expected mine life of 13 years (see Figure 13.5-1).
13.2.3 Mine Design Dimensions
The Black Thunder LOM Plan projects mining from four pits, North, Northeast, West, and South, through 2038.
The pits are typically 200 to 230 feet wide, with pit lengths ranging from 2,800 feet to 9,800 feet in the LOM Plan. The typical pit configuration is an initial truck/shovel pass for prestrip, since the draglines cannot handle the total depth of overburden. In some areas, coal (Wyodak Rider seams) is encountered in the prestrip and where quality is acceptable, it is mined. Most of the overburden is blasted, although there are some unconsolidated areas where blasting is not required.
Cast blasting is normally implemented in the next pass; prior to the dragline pass, and this pass sequence can require significant dozer material handling, utilizing Black Thunder’s remote control dozer fleet. Subsequently, the dragline takes the quantity of material for which it was designed in the next pass. The dragline performs multiple passes typically using a modified extended bench, which results in a spoil-side pass before the Main split of coal is mined.
There are some areas where leader seams are encountered below the Wyodak Main split with minimal parting thicknesses. Partings above 0.75 foot in thickness are removed with truck/shovel equipment, and the next seam below is mined. Partings are generally ripped versus blasted since the partings are relatively thin.
All coal is recovered using truck/shovel mining equipment. Since seam thickness can be more than 100 feet, multiple coal benches may be required. Coal is excavated without blasting at the mine.
Based on shovel size (mostly BE495s), all shovel benches are generally designed to ensure the safety of the shovel and truck operators. The mine uses typical spoil-side ramps (6 to 8 percent), spaced strategically to help coordinate stripping operations with coal recovery.
Weir Technical Report Summary
Black Thunder Mine
Prepared for Core Resources, Inc.
Draglines do not use these ramps to switch from spoil-side to highwall side stripping. Pit bridges are commonly implemented to shorten hauls from prestrip to spoil-side stripping, with these bridges being part of the dragline pass design. Typically, no highwall ramps are used as the existing pits are too deep. However, highwall ramps may be used in some of the shallower prestrip areas for stockpiling suitable topsoil material.
All haulage, both coal and burden, is performed by large off-highway end dump trucks, typically 240 to 400 ton capacity. Some smaller haul trucks are used in a utility capacity for activities such as reclamation, site construction, or drainage control work.
The projected mining for the Black Thunder LOM Plan is shown on Figure 13.5-1.
13.2.4 Mining Dilution
Due to the thickness of the coal seam, there is no measurable dilution to the saleable coal product.
13.2.5 Mining Recovery
Mining recovery is estimated to range from 85 to 92 percent. The typical coal loss factors for Black Thunder are described below.
Uneconomic Coal Loss
Weathered, lignitic, smoldering, or poor quality coal that will not meet current contract specifications is considered uneconomic. This coal cannot be effectively blended, therefore, it is typically dumped into a waste pile and buried. The truck loads dumped into waste piles are recorded and the associated coal loss is estimated. Coal that becomes diluted to the point of becoming uneconomical from mining conditions, such as highwall or spoil failures, is accounted for as a loss in the recovery factor. Uneconomic coal near the burn line is usually left in place and is not considered recoverable coal.
Cast Blast and Scalping Loss
When a cast blast occurs, a portion of the coal seam may be fragmented and become mixed with the overburden material. As the mining operation progresses across the pit, the top of coal and a portion of the coal edge is exposed and cleaned by scalping a minimal layer off of the top. This process disposes of the coal/overburden mixture created from the cast. Since the coal that is mixed with overburden is not recoverable it is considered lost coal related to mining recovery.
Weir Technical Report Summary
Black Thunder Mine
Prepared for Core Resources, Inc.
Coal Fenders
The primary purposes for leaving coal fenders is for spoil stability, safety, and dilution control. Coal fenders are more likely at pit entrances and where spoil or highwall failure is anticipated to occur. In most cases, efforts are made to recover coal fenders to the greatest extent possible, as the loading equipment retreats from a pit. Any portions of unrecovered coal fenders remaining in the pit will be reflected in the mining recovery factor.
Boxcuts
Occasionally, boxcuts will be developed along previously mined areas. To limit coal loss at these boundaries, Black Thunder plans to widen such boxcuts to enhance mining recovery, to accommodate equipment operations, and to assist dewatering activities. In the event over-stripping and dewatering does not mitigate a backfill slough or ground water inundation, Black Thunder will document low wall material problems, coal loss, and the corrective action taken.
Floor Loss
Generally, the coal separates at the contact with underlying floor materials. Every effort is made to follow this interface closely. This process can be complicated, causing coal losses due to adverse seam geometry, seam characteristics, runoff and groundwater on the pit floor, and timing of coal extraction. On occasion, the floor material is so poor that some coal must be left to provide safe underfoot conditions for loading and hauling equipment. Coal left in the pit floor cannot be recovered and is reflected as a loss in the mining recovery factor.
Other Mining Losses
During the normal mining process other coal losses can occur that are difficult to quantify. Such coal losses related to discrepancies between the actual conditions and the geological model, blasting, transportation, and spontaneous combustion. Although nearly impossible to quantify individually, all of these losses are accounted for in the mining recovery factor.
13.3 DEVELOPMENT AND RECLAMATION REQUIREMENTS
13.3.1 Surface Development Requirements
Weir Technical Report Summary
Black Thunder Mine
Prepared for Core Resources, Inc.
Black Thunder is an active mine and most development work has already been completed. As the mine expands, future development will be required for extension of haulroads, relocation of gas pipelines and a 69kV powerline, and relocation of the road and railroad track in the central area of the property to allow coal removal beneath.
13.3.2 Reclamation (Backfilling) Requirements
Reclamation of the mined surface areas will follow coal extraction in accordance with plans included in the current Wyoming DEQ Land Quality Permit. The land will be graded to blend with existing topographic features. Drainage systems will be reestablished. Some internally drained areas (playas) will be created to replace those existing in the pre-mine landscape. Contoured surfaces will be dressed with topsoil and planted to a variety of grasses, forbs, and shrubs.
13.4 MINING EQUIPMENT AND PERSONNEL
13.4.1 Mining Equipment
The overburden and coal removal are conducted at the four pits utilizing surface mining equipment. Black Thunder utilizes the following industry standard surface mining equipment as shown in Table 13.4-1.
Weir Technical Report Summary
Black Thunder Mine
Prepared for Core Resources, Inc.
Table 13.4-1 Mining Equipment
|
|
|
|
|
|
|
|
|
|
|
|
|
|
|
|
|
|
|
|
|
|
|
|
|
|
|
|
|
|
|
|
|
|
|
|
|
|
|
|
|
|
|
|
|
|
|
|
|
|
|
| Draglines |
|
|
|
|
|
|
|
|
| No. |
|
Manufacturer |
|
Model |
|
(CY) |
|
Material |
|
|
|
|
|
|
|
|
| 1 |
|
Bucyrus |
|
2570WS |
|
164 |
|
Overburden |
|
|
|
|
|
|
|
|
| 1 |
|
Bucyrus |
|
2570W |
|
120 |
|
Overburden |
|
|
|
|
|
|
|
|
| 1 |
|
Bucyrus |
|
2570W |
|
106 |
|
Overburden |
|
|
|
|
|
|
|
|
| 1 |
|
Bucyrus |
|
1570W |
|
82 |
|
Overburden |
|
|
|
|
|
|
|
|
| 1 |
|
Marion |
|
8750 |
|
130 |
|
Overburden |
|
|
|
|
|
|
|
|
| 5 |
|
|
|
|
|
|
|
|
|
|
|
|
|
|
|
|
|
|
|
|
|
|
|
|
|
|
|
|
|
|
|
|
|
| Shovels |
|
Haulage Fleet |
|
|
|
|
|
|
Bucket |
|
|
|
|
|
|
|
|
|
Payload |
| No. |
|
Manufacturer |
|
Model |
|
(CY) |
|
Material |
|
No. |
|
Manufacturer |
|
Model |
|
(Tons) |
| 3 |
|
Bucyrus |
|
495HR |
|
84 |
|
Overburden |
|
37 |
|
Komatsu |
|
830E |
|
240 |
| 3 |
|
P&H |
|
4100XPB |
|
68 |
|
Overburden |
|
55 |
|
Caterpillar |
|
793 |
|
255 |
| 3 |
|
P&H |
|
4100 |
|
53 |
|
Overburden |
|
17 |
|
Komatsu |
|
930E |
|
320 |
| 1 |
|
P&H |
|
2800 |
|
36 |
|
Overburden |
|
16 |
|
Caterpillar |
|
795F |
|
360 |
| 1 |
|
Bucyrus |
|
495B |
|
84 |
|
Coal |
|
2 |
|
Caterpillar |
|
798 |
|
400 |
| 1 |
|
Marion |
|
351M |
|
84 |
|
Coal |
|
127 |
|
|
|
|
|
|
| 1 |
|
P&H |
|
2800XP |
|
65 |
|
Coal |
|
|
|
|
|
|
|
|
| 1 |
|
P&H |
|
2300 |
|
50 |
|
Coal |
|
|
|
|
|
|
|
|
| 14 |
|
|
|
|
|
|
|
|
|
|
|
|
|
|
|
|
|
|
|
|
|
|
|
|
|
|
|
|
|
|
|
|
|
The mining equipment used at Black Thunder is capable of operating at the pit widths and lengths projected to be mined. No changes are planned for the type of mining equipment to be used throughout the Black Thunder LOM Plan.
13.4.2 Staffing
Black Thunder is scheduled to produce coal two production shifts each day. Four rotating crews work 12 hours shifts per day, seven days a week, 365 days a year. Facility maintenance is usually scheduled for 12 to 18 hours per month per facility. There is no idle time for loading trains since trains are diverted to the loadout facility that is operating. Hourly personnel are not affiliated with any union, with no changes in that structure anticipated in the near term.
Core currently employs approximately 650 to 750 personnel at Black Thunder. The projected staffing for the Black Thunder LOM Plan will remain near current employment levels for the first five years of the LOM Plan and then staffing levels will decrease as production declines through the LOM Plan.
Weir Technical Report Summary
Black Thunder Mine
Prepared for Core Resources, Inc.
Most of the mine employees live nearby in Wright or Gillette, Wyoming. Core has had no major issues hiring and retaining qualified candidates for open positions and relies considerably on employee referrals.
Mine Safety
An industry standard for safety performance is the Non-Fatal Days Lost (NFDL) Incidence Rate, which is determined by the number of lost time injuries multiplied by 200,000 divided by the manhours worked.
Black Thunder manhours worked, NFDL injuries, and NFDL Incidence Rate for 2022 through Third Quarter 2025, compared to the national average NFDL Incidence Rate for United States surface coal mines are shown in Table 13.4-2 as follows:
Table 13.4-2 Black Thunder Mine Safety Statistics
|
|
|
|
|
|
|
|
|
|
|
|
|
|
|
|
|
|
|
|
|
|
|
|
|
|
|
|
|
|
|
|
|
|
|
|
|
|
|
|
|
NFDL |
|
|
|
|
|
|
|
|
Incidence Rate |
|
|
Manhours |
|
NFDL Injuries |
|
Black |
|
National |
|
|
Worked |
|
Black Thunder |
|
Contractor |
|
Thunder |
|
Average |
| 2022 |
|
2,181,923 |
|
4 |
|
— |
|
0.37 |
|
0.79 |
| 2023 |
|
2,178,631 |
|
6 |
|
— |
|
0.55 |
|
0.86 |
| 2024 |
|
1,836,481 |
|
3 |
|
— |
|
0.33 |
|
0.90 |
2025 (1) |
|
1,252,245 |
|
— |
|
2 |
|
0.00 |
|
0.92 |
|
|
|
|
|
|
|
|
|
|
|
(1) As of Third Quarter YTD, except national average NFDL rate through Second Quarter YTD |
The Black Thunder NFDL Incidence Rate was significantly lower than the national average from 2022 through Third Quarter 2025 with no lost time injuries incurred in 2025 through the Third Quarter.
13.5 LIFE OF MINE PLAN MAP
The projected mining for the Black Thunder LOM Plan is shown on Figure 13.5-1.
Weir Technical Report Summary
Black Thunder Mine
Prepared for Core Resources, Inc.
Figure 13.5-1 Life of Mine Plan
Weir Technical Report Summary
Black Thunder Mine
Prepared for Core Resources, Inc.
14.0 PROCESSING AND RECOVERY METHODS
14.1 MATERIAL HANDLING PROCESS AND FLOWSHEET
The Black Thunder material handling facilities receives coal from the Primary and 5 West crushing and conveying systems. The coal transported from the pit to the Primary crushing and conveying system is dumped into one of two dump hopper/crushing stations. Each system employs a McLanahan single roll crusher that reduces the coal to a nominal minus three-inch size. Once sized, a 72-inch-wide belt conveyor transports the coal to the train loadout facility. The coal transported from the pit to the 5 West crushing and conveying system is dumped into a single dump hopper/crushing station. This system employs a two stage McLanahan triple roll crusher that reduces the coal to a nominal minus three-inch size. Once sized, a 72-inch-wide belt conveyor transports the coal to a transfer tower/chute where it is allocated to either the silos or the slot storage.
At the Black Thunder Central facility, there are two 12,500-ton capacity storage silos and slot coal storage with a design capacity of 100,000 tons. Coal that is stored in slot storage can be directed for shipment as needed. Two trains can be loaded simultaneously with the use of dual rail loops and loadout facilities. The loadout on the outer loop is capable of flood-loading trains at a rate of 5,000 tons per hour, while the silos on the inner loop are capable of flood-loading trains at a rate of 11,000 tons per hour. Batch scales have been installed at both the train loadouts and the silos. Black Thunder has a total of two track scales and five batch weigh scales.
The Black Thunder West facility receives coal from the 6-North crushing and conveying system. The coal transported from the pit is dumped into a single dump hopper/crusher station. This system employs a two stage McLanahan triple roll crusher that reduces the coal to a nominal minus three-inch size. Once sized, a 72-inch-wide belt conveyor transports the coal to the Black Thunder West loadout.
At the West loadout facility, coal is directed into one of two 17,500-ton capacity storage silos. Coal in the storage silos is then flood-loaded directly into railcars. There is a track scale located before the loadout as well as four batch weigh scales, which are used to measure coal loaded into railcars.
The Black Thunder East facility, which is currently idle, receives coal from the Circuit 3 and Circuit 4 crushing and conveying systems. The coal transported from the pit to Circuit 3 is dumped into a single dump hopper/crushing station.
Weir Technical Report Summary
Black Thunder Mine
Prepared for Core Resources, Inc.
This system employs a two stage McLanahan Triple roll crusher that reduces the coal to a nominal minus three-inch size. Once sized, a 60-inch-wide belt conveyor transports the coal to any of the silos, except for silos 1 and 2. The coal transported from the pit to Circuit 4 is dumped into a dual dump hopper/crushing station. This system employs a Stamler feeder breaker and a single stage Gunlock crusher that reduces the coal to a nominal minus three-inch size. Once sized, a 72-inch-wide belt conveyor transports the coal to an 84-inch-wide belt conveyor, which transports the coal to a 170 ton surge bin. There the coal is separated onto two different 54-inch-wide belt conveyors, which direct the coal to any one of the seven silos.
At the Black Thunder East facility, there are seven 14,000-ton capacity coal storage silos. The loadout facility contains two concentric rail loops, with the silos capable of flood-loading over each rail loop. Four of the silos are located over the outer loop, while the other three silos are located over the inner loop. For each loop, there is a track scale located before the loadout and there is a track scale exiting the loadout. Each loop also contains a batch weigh scale. The Black Thunder East facility has a total of four track scales and two batch weigh scales.
Shipped coal is weighed using batch scales, to an accuracy of 0.25 percent, that are certified semi-annually by contractors approved by the state of Wyoming. If the batch scales should fail, a certified track scale, used to tare weigh the rail cars, can be used to measure the gross weight of the coal. The track scale is certified by contractors approved by the state of Wyoming annually and has an accuracy of 0.50 percent. Certifications for the batch scales and track scales are available for inspection at the plant administrative offices.
A simplified flowsheet for the Black Thunder material handling systems is shown on Figure 14.1-1.
Weir Technical Report Summary
Black Thunder Mine
Prepared for Core Resources, Inc.
Figure 14.1-1 Simplified Material Handling Flowsheets
Weir Technical Report Summary
Black Thunder Mine
Prepared for Core Resources, Inc.
14.2 MATERIAL HANDLING SYSTEM DESIGN, EQUIPMENT CHARACTERISTICS, AND SPECIFICATIONS
Since coal from Black Thunder coal is exclusively sold as a direct shipped ROM thermal product, there is no coal processing that is performed, aside from primary crushing. The maximum annual throughput achieved by Black Thunder was approximately 116 million tons in 2011. ROM coal from the pit is crushed to minus two to three inches, depending on customer requirements, before transferring to rail loading facilities.
Total storage capacity of saleable coal at Black Thunder is 158,000 tons in 11 silos and 100,000 tons in a slot coal storage facility. The stored coal is loaded into railcars from four loadouts: the Central Loadout with 1.25-hour train loading time, the Central Batch Loadout with a 3.5-hour train loading time, the East Loadout with a 1.25-hour train loading time, and the West Loadout with a 1.25-hour train loading time.
14.3 ENERGY, WATER, PROCESS MATERIALS, AND PERSONNEL REQUIREMENTS
The material handling systems require approximately 4.6 million kilowatt-hours of electricity per month. Water requirements are approximately 49 million gallons of water per month for haul road dust suppression and plant washdown.
The is no coal processing performed at Black Thunder and process materials are irrelevant.
Personnel requirements to operate the material handling and loadout facilities total 14 salary and 65 hourly employees in four rotating crews to provide operation of the facilities 24 hours per day, seven days per week.
Weir Technical Report Summary
Black Thunder Mine
Prepared for Core Resources, Inc.
15.0 INFRASTRUCTURE
15.1 ROADS
Access to the Black Thunder property is from State Highway 450 (Clareton Highway), east of the town of Wright in Campbell County, Wyoming. The nearest cities are Wright, Wyoming to the east and Gillette, Wyoming to the north. Wright is located approximately 12 miles east of the Black Thunder Mine and Gillette is located approximately 50 miles north of the Black Thunder Mine.
15.2 RAIL
Black Thunder transports saleable ROM coal via the BNSF or UP railroads.
15.3 POWER
Electrical power for the Black Thunder Mine is provided by Powder River Energy Corporation (PREC), through a 69 kV transmission line. PREC’s average industrial price is 6.41 cents per KWH.
15.4 WATER
The water used for dust suppression is obtained from the mine’s own highwall dewatering program, capable of 500 to 800 million gallons per year. Water for the facilities is obtained from two onsite deep-water wells and is water is treated to produce potable water at a flat rate of $3,520 per month. In 2025, Black Thunder’s average water usage was approximately 49 million gallons per month for haul road dust suppression and facilities washdown.
15.5 PIPELINES
There are several oil and gas pipelines within the Black Thunder property boundary. These will need to be purchased and either relocated or abandoned.
There is no natural gas service to any of the mine facilities.
Weir Technical Report Summary
Black Thunder Mine
Prepared for Core Resources, Inc.
15.6 PORT FACILITIES, DAMS, AND REFUSE DISPOSAL
Port Facilities
Core primarily ships Black Thunder thermal coal directly to power plants by railroad. For its coal export shipments, Core transports coal either by the BNSF for coal shipped through Westshore Terminals in Vancouver, Canada, or by the UP for coal shipments through Houston Bulk Terminal.
Westshore Terminals has onsite storage capacity of 2.2 million tons and an annual throughput capacity of 36.4 million tons. Ships can be loaded at a peak loading rate of 7,700 tons per hour.
The Houston Bulk Terminal is owned by the Port of Houston and operated by Kinder Morgan Energy Partners in Houston, Texas. The terminal has onsite storage capacity of 600,000 tons and an annual capacity of 5.25 million tons and handles both coal and petcoke. It is served by both the UP and BNSF railroads.
Dams and Refuse Disposal
Black Thunder does not have a slurry impoundment or refuse disposal area, since there is no coal processing required to create a saleable coal product.
15.7 MAP OF INFRASTRUCTURE
Black Thunder infrastructure is shown on Figure 15.7-1.
Weir Technical Report Summary
Black Thunder Mine
Prepared for Core Resources, Inc.
Figure 15.7-1 Mine Infrastructure
Weir Technical Report Summary
Black Thunder Mine
Prepared for Core Resources, Inc.
16.0 MARKET STUDIES
16.1 MARKETS
Black Thunder produces and sells a thermal coal product. Historically, the market for thermal coal from Black Thunder has primarily been to domestic coal-fired power plants, with minimal tonnage exported to Asia Pacific and South American customers.
The PRB can be segregated into three distinct tiers that affect the market reach and pricing for PRB coal. Mines operating in the southern area of the PRB (including Black Thunder) produce a higher quality coal (+ 8,800 Btu/lb) and are serviced by both the BNSF and the UP railroads. Coal from this area of the PRB has the farthest market reach, commands higher prices, and is generally in the highest demand.
Mines operating in the central area of the PRB produce a lesser quality coal (8,400 Btu/lb) and are also serviced by the BNSF and the UP railroads. Coal from this area of the PRB moves mainly to Midwest utilities and generally has a price disadvantage relative to the higher quality coal from the southern PRB mines. With less market reach, the demand for coal from the mid-tier mines is the most volatile. In times of reduced thermal coal demand and depressed pricing, these mines are typically the first to realize tonnage reductions.
Mines in the northern area of the PRB typically have the lowest quality (8,200 Btu/lb) and are transportation disadvantaged due to service only by the BNSF railroad. Most of the current customers for the Northern PRB mines are located in the upper Midwest region of the United States, mainly along the Great Lakes, due to limited rail transportation options out of the northern area of the PRB.
Thermal coal sales prices are influenced by many factors, including domestic supply and demand, global supply and demand dynamics, productivity, cost of competing fuels, transportation, and inflation, both mining cost inflation and general inflation.
The average historical spot pricing of PRB coal (8,800 Btu/lb, 0.8 lbs SO2/MMBtu) is shown on Figure 16.1-1 as follows:
Weir Technical Report Summary
Black Thunder Mine
Prepared for Core Resources, Inc.
Figure 16.1-1 Historical PRB Spot Price
Source: McCloskey
PRB coal spot pricing realized significant increases in 2021 due largely to high natural gas prices increasing power plant demand for coal as a more economic fuel source. The increase in demand and finite coal supply resulted in average annual coal prices increasing from $14.84 per ton in 2020 to $20.51 per ton in 2021, representing a 38 percent increase year-over-year. While only a small portion of PRB coal is actually sold on the spot market, anticipated spot market pricing is a key input in most contract price negotiations.
Black Thunder annual average coal sales price realizations (which reflect quality adjustments) from 2024 through September 2025 ranged from $14.31 to $15.14 per ton. Core provided projected FOB Mine coal sales prices for Black Thunder from 2026 through 2030, which WEIR utilized in the Black Thunder LOM Plan financial model. Black Thunder historical (2024 through September 2025) and projected (2026-2038) FOB Mine coal sales price are shown on Figure 16.1-2 as follows:
Weir Technical Report Summary
Black Thunder Mine
Prepared for Core Resources, Inc.
Figure 16.1-2 Historical and Projected Coal Sales Price
The Black Thunder LOM Plan projected FOB Mine coal sales price averages $15.77 per ton between 2026 and 2038.
16.2 MATERIAL CONTRACTS
The Black Thunder saleable thermal coal product is marketed by the Thunder Basin Coal Company, with the exception of coal exported through Westshore Terminals in Vancouver, Canada, which is marketed by Core Sales, Inc., both subsidiaries of Core.
Core holds rail contracts for its export shipments with the BNSF for coal movement through Westshore Terminals in Vancouver, Canada, and with the UP for coal movement through Houston Bulk Terminal. These contracts are renewed as needed to support export sales tonnage.
Weir Technical Report Summary
Black Thunder Mine
Prepared for Core Resources, Inc.
17.0 ENVIRONMENTAL STUDIES, PERMITTING, AND LOCAL INDIVIDUALS OR GROUPS AGREEMENTS
17.1 ENVIRONMENTAL STUDIES
As part of the permitting process required by the Wyoming DEQ, numerous baseline studies and impact assessments were undertaken by Core. These baseline studies and impact assessments included in the permit are summarized as follows, with pertinent text from the permit replicated below:
•Groundwater
•Surface Water Quality and Quantity
•Probable Hydrologic Consequences
Groundwater
The Black Thunder permit area is located on the east limb of the Powder River Structural Basin in northeastern Wyoming. The east limb of the basin dips two to three degrees to the west. The primary formations which crop out in the vicinity of Black Thunder are the Wasatch Formation and the Fort Union Formation. Both formations are characterized by interbedded sandstone, siltstone, claystone, shale, carbonaceous shale and coal. The Wyodak-Anderson coal marks the top of the Fort Union Formation and is the primary seam to be mined. Clinker or scoria adjacent to either the coal or the Wasatch Formation are common throughout the area.
Locally, the Wyodak-Anderson coal seam, the Wasatch Formation, the Quaternary sediments, and the scoria deposits all contain water, however, much of the Wasatch Formation is incapable of yielding water at a sufficient rate to serve as a practical water supply. The Wasatch Formation is too impermeable to yield the quantities of water necessary to justify the cost of well construction. Even the more permeable sandstones within the Wasatch are often not extensive enough to supply a continuous, reliable yield of more than a few gallons per minute (gpm).
The structure of the basin and local topography are the main factors controlling ground-water movement within the PRB. On a regional basis, flow moves from peripheral recharge areas (Scoria outcrops) toward the center of the basin. Locally, shallow ground-water movement is affected by topography. Infiltrating water falling on topographically high areas generally moves downward and laterally in the overburden. Depending on the local geology, this results in water in the overburden system recharging the coal or discharging to nearby valleys.
Weir Technical Report Summary
Black Thunder Mine
Prepared for Core Resources, Inc.
The water reaching the coal through the overburden system also generally moves downward and laterally to discharge areas in nearby valleys.
There are four significant native hydrogeologic units at Black Thunder: the overburden, which includes the Wasatch Formation and Quaternary sediments; the Wyodak-Anderson coal, the top of which marks the top of the Fort Union Formation; the underburden, which is comprised of that part of the Fort Union Formation that is below the coal; and the clinker which occurs at the same stratigraphic level as both the coal and the overburden. The saturated scoria deposits and the Wyodak-Anderson coal are considered the only aquifers within the permit area. There are few sandstone units in the Wasatch overburden within the permit area, and the Quaternary sediments are too thin and fine-grained to be significant aquifers.
Surface Water Quality and Quantity
Black Thunder is located in the Cheyenne River drainage basin. The main streams on and near the permit area are Little Thunder Creek, North Prong of Little Thunder Creek, or simply North Prong and HA Creek. Little Thunder Creek and North Prong join just east of the permit area. Little Thunder Creek then flows into Black Thunder Creek several miles downstream of the permit area as does HA Creek, which joins Black Thunder Creek about five miles east of the permit area. Black Thunder Creek is tributary to the South Fork of the Cheyenne River.
Black Thunder is located in the middle of the Little Thunder Creek drainage basin. Little Thunder Creek and North Prong flow from west to east, and the majority of the runoff from areas within the Black Thunder permit boundary will flow into one of these two streams, with the remaining runoff flowing into Black Thunder Creek via HA Creek and an additional minor tributary.
The geomorphology of the general area is typical of the eastern PRB with its gently rolling terrain. The topography within the Little Thunder Creek drainage basin is gently rolling in the western areas but becomes more rugged in the eastern portion near the Rochelle Hills. The eastern and southern portions of the permit area display some of the characteristics of this rugged terrain in steep-sided, irregular gullies and washes which drain into Little Thunder Creek. These features form breaks in a plateau and contrast with more gently rolling terrain to the north and east. North of the Little Thunder Creek valley, the topography is dominated by a broad, gently rolling plain which extends westward and northwestward beyond the permit area.
Weir Technical Report Summary
Black Thunder Mine
Prepared for Core Resources, Inc.
Within this plain, in Section 17 of T43N, R70W, is an internally drained area which contains an intermittent lake, or playa, at its low point. Further northeast, this plain drops off into the valley of the North Prong of Little Thunder Creek. The valley of the North Prong is generally broad and gentle with a steep southeastern rim. In the western part of the permit area, the valley of Little Thunder Creek is incised into a large, level plain which contains other undrained depressions, each containing one or more playas.
The Little Thunder Creek drainage system cuts into the Tertiary Wasatch and Fort Union formations, but stream valleys are primarily underlain by the Wasatch Formation. Structural and bedrock controls on stream channel orientation are reflected in the sub-dendritic drainage pattern. Streams are often oriented parallel to the northwest-to-southeast structural trends, and abrupt changes in channel direction may follow major joint or fault trends.
Elevations in the Little Thunder Creek drainage basin range from approximately 5,160 feet above MSL in the headwaters area to approximately 4,100 feet above MSL at the confluence with Black Thunder Creek. Drainage basin characteristics for major streams intersecting the permit area (Little Thunder Creek, North Prong, Mills Draw, Shipley Draw, Holmes Creek, West School Creek, Burning Coal Draw Trussler Creek, and HA Creek) are found in Permit No. 233. All streams in the permit area are ephemeral, flowing only in response to precipitation or snowmelt events.
A small area in the northeastern portion of the permit area is within the drainage of HA Creek, which joins Black Thunder Creek approximately five miles east of the permit area. Another small portion of the permit area drains northward into a tributary to Black Thunder Creek.
The general area surrounding Black Thunder is characterized by ephemeral streams. The drainage basins convert little precipitation to runoff because of generally dry soil conditions, high evapotranspiration rates, high initial abstractions, non-contributing areas, stock ponds, and reservoirs. These factors, in addition to low-frequency, low-magnitude precipitation events result in low average annual volume of runoff.
Streamflow data for the general area have been obtained from the USGS publications. Hydrographs generated for the Little Thunder Creek gaging station near Hampshire, Wyoming and the Black Thunder Creek gaging station near Hampshire, Wyoming.
Weir Technical Report Summary
Black Thunder Mine
Prepared for Core Resources, Inc.
The hydrographs show a definite seasonal trend with regard to streamflow. Little Thunder Creek and Black Thunder Creek are more likely to exhibit streamflow events between March 1 and September 30 than at other times of the year. Flows occurring outside of this period tend to be of very low magnitude, less than 5 cubic feet per second (cfs). Black Thunder Creek flow records show two exceptions to the general seasonal trend in 1974 when relatively large flow events occurred in January (63 cfs) and November (55 cfs) of 1974. These events probably also occurred on Little Thunder Creek at a lower magnitude, however, no record exists for comparison.
The hydrographs also show long periods of no flow between each streamflow event. Almost without exception, the hydrographs return to zero shortly after each flow event. This is indicative of the lack of baseflow. Therefore, although there is a seasonal trend to the occurrence of streamflow, the flow is by no means continuous during this period.
The duration of individual streamflow events is also illustrated on the hydrographs and provides further support that the streams in the general area flow only in response to precipitation events. Streamflow on Little Thunder Creek generally occurs for a period of less than 7 days with the exception of the March and May 1978 events. The duration of these flow events was less than 14 days each. Sixty percent of the time, Little Thunder Creek has had an average streamflow of less than 0.1 cfs and 86 percent of the time an average daily streamflow of less than 0.8 cfs.
The streamflow characteristics discussed in this section provide support for classifying the streams in the general area as ephemeral. The information provided shows that the streams exhibit no base flow, flow only in response to precipitation events, and each streamflow event is separated by extended periods of no flow.
Probable Hydrologic Consequences
Field investigations of the reach of North Prong from the east permit boundary to the confluence with Little Thunder Creek were performed to supplement an assessment of the probable hydrologic consequences of the Little Thunder Creek Diversion. Black Thunder prepared channel descriptions and cross sections for 63 locations along North Prong. Culverts and dams in the study area were identified on maps and inspected to determine how they would affect flood flows and channel erosional conditions.
Weir Technical Report Summary
Black Thunder Mine
Prepared for Core Resources, Inc.
Samples of channel bed and bank material were taken at eleven of the cross section locations. Laboratory analyses of selected samples were performed for density, particle size and Atterberg limits.
Inspection of the small dams in Section 22 and 23, T.43N., R.70W. showed evidence of rill erosion, sparse vegetation and compaction by livestock. Well defined spillways were not evident. Instead, overflows occurred at low points adjacent to the dams. At all points where overflows reenter the channel, head cutting was occurring at the point of reentry. Several inactive or washed out structures were identified where the stream had either cut a new channel around the dam or the dam had failed and a new channel had been cut through the structure.
Detailed channel cross sections of North Prong were constructed from field surveys. Valley cross sections are presented in the same figures along with the detailed channel cross sections to show the spatial relationship between colluvium and alluvium in the North Prong channel.
A channel profile for North Prong was prepared using existing maps and aerial photography. A longitudinal profile for Burning Coal Draw reflects upward concavity typical of most natural channels. Slopes are nearly flat near the drainage divide and change to a maximum slope of 1.7 percent before flattening out again.
17.2 REFUSE DISPOSAL AND WATER MANAGEMENT
Refuse Disposal
Black Thunder produces a saleable ROM coal product that only needs crushing to meet customer size and quality requirements, and therefore there is no need for coal processing and associated refuse disposal.
Water Management
Water used for dust suppression at Black Thunder is obtained from the highwall dewatering program to maintain highwall stability. In 2025, the Black Thunder Mine used on average approximately 49 million gallons of water per month for haul road dust suppression and plant washdown
Surface and groundwater outlets are sampled in accordance with the approved Wyoming NPDES permit. Surface water sampling is limited because the occurrence of streamflow in Little Thunder Creek, North Prong and their tributaries is erratic.
Weir Technical Report Summary
Black Thunder Mine
Prepared for Core Resources, Inc.
Core has a work practice that outlines the procedures for properly obtaining field measurements (e.g., pH, flow, etc.) and collecting representative water samples at the Black Thunder permitted property. The procedures described in the work practice pertain to water sampling at the outfalls/outlets and stream monitoring locations. The sampling frequency, outlets/outfalls, stream monitoring locations, and associated parameters are summarized in the Black Thunder permits, as well as Core’s Water Discharge Permit Compliance Environmental Operating Procedure (EOP). This work practice improves overall compliance by providing a comprehensive summary of applicable water quality monitoring requirements in the permit, the Wyoming NPDES rules for coal mining facilities at Title 47, Series 30 (47CSR30), and the EPA regulations under 40 CFR Part 136.
The laboratories have internal quality control and quality assurance protocols that are followed before delivering sample results to the Core Permitting Department. The permitting department reviews the sample results once again, as a second check for quality control and quality assurance before the results are published.
17.3 PERMITS AND BONDING
Coal mines in Wyoming are required to file applications for and receive approval of mining permits issued by the State of Wyoming, Department of Environmental Quality, Land Quality Division to conduct surface disturbance and mining activities. Black Thunder has been issued mining permits and associated NPDES permits by the Wyoming DEQ as shown in Table 17.3-1 as follows:
Table 17.3-1 Black Thunder Mining and NPDES Permits
|
|
|
|
|
|
|
|
|
|
|
|
|
|
|
|
|
|
|
|
|
|
|
Permitted |
|
|
|
|
|
|
Surface |
|
|
|
|
| Permit |
|
Area |
|
Issue |
|
NPDES |
| Number |
|
(Acres) |
|
Date |
|
Permit No. |
| 233 |
|
62,066.12 |
|
12/3/1974 |
|
WY0024091 |
Permit No. 233 includes the areas for the surface mine, material handling facilities and associated support facilities and infrastructure. The associated NPDES permit is required to allow discharges of water from the permit areas and requires submittal of bi-monthly water samples to ensure the discharges are within allowable water quality standards.
Weir Technical Report Summary
Black Thunder Mine
Prepared for Core Resources, Inc.
The entirety of the Black Thunder LOM Plan area is permitted. Of the 62,100 permitted acres, Black Thunder has reclaimed 16,596 acres in various phases of bond release, with 775 acres soiled and seeded, 1,932 acres with Phase I release, 10,557 acres with Phase II release, and 3,332 acres with Phase III release, as of June 2025.
The permitted area, bond amounts and reclamation liability for Black Thunder Permit No. 233 is shown in Table 17.3-2 as follows:
Table 17.3-2 Black Thunder Mine Permitted Area, Reclamation Liability, and Bonds
|
|
|
|
|
|
|
|
|
|
|
|
|
|
|
|
|
|
|
|
|
|
|
Permitted |
|
|
|
|
|
|
Surface |
|
Reclamation |
|
Bond |
| Permit |
|
Area |
|
Liability (1) |
|
Amount |
| Number |
|
(Acres) |
|
($000) |
|
($000) |
| 233 |
|
62,066 |
|
269,050 |
|
414,700 |
|
|
|
|
|
|
|
|
(1) Represents the undiscounted cash flows to satisfy
reclamation as of December 2025
|
17.4 LOCAL STAKEHOLDERS
As indicated in Section 13.5 of this TRS, Core currently employs approximately 650 to 750 personnel at Black Thunder. The mine also creates substantial economic value with its third-party service and supply providers, utilities and through payment of taxes and fees to governmental agencies.
Black Thunder is located in a rural and fairly isolated area of Wyoming. Reportedly, there have been no social or community impact issues relative to Black Thunder for several years.
17.5 MINE CLOSURE PLANS
Reclamation of the mined surface areas will follow coal extraction, in accordance with plans included in the current Wyoming DEQ Permit No. 233. The land will be graded to blend with existing topographic features. Drainage systems will be reestablished. Some internally drained areas (playas) will be created to replace those existing in the pre-mine landscape. Contoured surfaces will be dressed with topsoil and planted to a variety of grasses, forbs, and shrubs.
Weir Technical Report Summary
Black Thunder Mine
Prepared for Core Resources, Inc.
Black Thunder’s permit number, permitted surface area, end of mine reclamation liability estimated by Core, and bond amount, is shown in Table 17.3-2. The bond amount of $414.7 million is the mine closure and reclamation cost estimate for the projected December 31, 2025 mine disturbance, per the Wyoming DEQ bonding guidelines.
17.6 ENVIRONMENTAL COMPLIANCE, PERMITTING, AND LOCAL INDIVIDUALS OR GROUPS ISSUES
Permit No. 233 has not been cited for any permit violations since 2014, which is exceptional in the coal mining industry.
Black Thunder takes pride in its environmental stewardship and has had numerous environmental achievements over the years. The list of environmental achievements is shown in Table 17.6-1.
Table 17.6-1 Environmental Achievements
|
|
|
|
|
|
|
|
|
| Achievement |
|
Year (s) |
| WY Reclamation Award |
|
2018, 2016, 2014 |
| Arch Coal President’s Environmental Award |
|
2018, 2017, 2016, 2014, 2012, 2011, 2010 |
| Conservation Legacy Award |
|
2012 |
| Interstate Mining Compact Commission - Public Outreach |
|
2010 |
| Excellence in Surface Mining - Good Neighbor Award |
|
2008, 2006 |
| Peck Community Service Award |
|
2006 |
| Wyoming Game and Fish Department’s Industry Reclamation and Wildlife Stewardship Award |
|
2005 |
| United States Forest Service Prairie Partner Award |
|
2002 |
| Excellence in Mining Awards |
|
2008, 2006, 1998-1997, 1993-1991, and 1989-1987 |
Based on WEIR’s review of Core’s plans for environmental compliance, permit compliance and conditions, and dealings with local individuals and groups, Core’s efforts are adequate and reasonable in order to obtain approvals necessary relative to the execution of the Black Thunder LOM Plan.
17.7 LOCAL PROCUREMENT AND HIRING COMMITTMENTS
While not a commitment, Black Thunder trains and hires applicants from the local communities.
Weir Technical Report Summary
Black Thunder Mine
Prepared for Core Resources, Inc.
18.0 CAPITAL AND OPERATING COSTS
Core provided historical operating costs and capital expenditures for Black Thunder, which were an adequate check and basis for the Black Thunder LOM Plan cost projections. The operating costs and capital expenditures are included in the financial statements that are audited annually by Ernst & Young LLP for Core’s SEC 10-K reporting. The auditing performed by Ernst & Young, LLP is conducted in accordance with the standards of the Public Company Accounting Oversight Board.
18.1 CAPITAL EXPENDITURES
Black Thunder will require capital to be expended each year for infrastructure additions/extensions, as well as for mining equipment rebuilds/replacements to continue to produce coal at currently projected annual levels of production.
Core investments in Black Thunder, since inception, are considered “Sunk Costs” and as economic returns in this economic analysis are presented only on a forward-looking basis, Sunk Costs are not included in the economic return of the project, as estimated in this study.
Actual capital expenditures for 2024 through September 2025 and projected capital expenditures for 2026 through 2038, in 2025 dollars, are shown in Table 18.1-1.
Weir Technical Report Summary
Black Thunder Mine
Prepared for Core Resources, Inc.
Table 18.1-1 Historical and Projected LOM Plan Capital Expenditures
|
|
|
|
|
|
|
|
|
|
|
|
|
|
|
|
|
|
|
|
|
Capital Expenditures |
|
|
|
($000) |
|
($/Ton) |
| Actual |
2018 |
|
11,898 |
|
0.17 |
|
2019 |
|
28,694 |
|
0.40 |
|
2020 |
|
4,633 |
|
0.09 |
|
2021 |
|
3,527 |
|
0.07 |
|
|
|
48,752 |
|
0.20 |
|
|
|
|
|
|
LOM Plan (1) |
2022 |
|
15,905 |
|
0.26 |
|
2023 |
|
11,242 |
|
0.17 |
|
2024 |
|
5,632 |
|
0.11 |
|
2025 |
|
6,434 |
|
0.14 |
|
2026 |
|
4,640 |
|
0.10 |
|
2027 |
|
5,500 |
|
0.14 |
|
2028 |
|
5,500 |
|
0.14 |
|
2029 |
|
4,400 |
|
0.12 |
|
2030 |
|
48,400 |
|
1.31 |
|
2031 |
|
4,400 |
|
0.13 |
|
2032 |
|
3,300 |
|
0.10 |
|
2033 |
|
3,300 |
|
0.11 |
|
2034 |
|
2,200 |
|
0.09 |
|
2035 |
|
2,200 |
|
0.09 |
|
|
|
123,053 |
|
0.22 |
|
|
|
|
|
|
(1) Includes 10 percent contingency |
The majority of the capital expenditures shown on Table 18.1-2 are for maintenance of mining equipment. The large increase in capital expenditures in 2030 is related to the one-time relocation of a road and railroad to allow mining the coal beneath these surface features.
Black Thunder management has had several years of experience estimating capital expenditures for surface mining and the risk of inaccurate estimates is low. The Black Thunder LOM Plan’s projected average capital expenditures of $0.37 per ton (including contingency) is higher than the 2024 through September 2025 historical average of $0.23 per ton. Capital expenditure projections per annual ton are estimated to have an accuracy of ±15.0 percent with a contingency of 10 percent.
Contingency costs account for undeveloped scope and insufficient data. Contingency for required major projects and mining equipment is estimated at 10 percent and is intended to cover unallocated costs from lack of detailing in scope items. It is a compilation of aggregate risk from estimated cost areas.
18.2 OPERATING COSTS AND RISKS
Weir Technical Report Summary
Black Thunder Mine
Prepared for Core Resources, Inc.
Operating costs are projected based on historical operating costs and adjusted based on projected changes in staffing, hours worked, production, and productivity for mining areas in the LOM Plan. Black Thunder’s actual and LOM Plan projected operating costs in dollars per ton are shown in Table 18.2-1.
Table 18.2-1 Black Thunder Mine Historical and LOM Plan Operating Costs
|
|
|
|
|
|
|
|
|
|
|
|
|
|
|
|
|
|
|
|
|
|
|
Operating Cost ($/T) |
|
|
Cash |
|
Non-Cash |
|
Total |
2024 (1) |
|
14.75 |
|
0.88 |
|
15.63 |
2025 (2) |
|
13.15 |
|
0.68 |
|
13.83 |
| 2026 |
|
13.73 |
|
0.84 |
|
14.57 |
| 2027 |
|
14.07 |
|
0.94 |
|
15.01 |
| 2028 |
|
13.74 |
|
0.65 |
|
14.39 |
| 2029 |
|
15.65 |
|
0.83 |
|
16.48 |
| 2030 |
|
15.77 |
|
0.87 |
|
16.64 |
| 2031 |
|
14.48 |
|
0.67 |
|
15.15 |
| 2032 |
|
14.45 |
|
0.67 |
|
15.12 |
| 2033 |
|
14.70 |
|
0.67 |
|
15.37 |
| 2034 |
|
14.71 |
|
0.67 |
|
15.38 |
| 2035 |
|
13.90 |
|
0.68 |
|
14.58 |
| 2036 |
|
13.91 |
|
0.68 |
|
14.59 |
| 2037 |
|
13.92 |
|
0.68 |
|
14.60 |
| 2038 |
|
14.43 |
|
0.68 |
|
15.11 |
|
|
|
|
|
|
|
(1) Actual |
|
|
(2) Actual through September |
|
|
Descriptions or explanations of the operating costs considered in the Black Thunder LOM Plan are as follows:
•Labor cost includes wages and benefits for hourly and salary personnel at the mine and material handling systems
•Contract mining cost includes payments for third party companies providing services for mining activities
•Maintenance and supplies costs are expenses related to upkeep of mining equipment and associated infrastructure
•Tires and tubes costs are expenses primarily related to rubber tired mobile equipment
•Operating supplies costs are various items used for mine operations and the material handling infrastructure
•Explosives costs are expenses related to blasting overburden rock material
•Utilities costs are expenses related primarily to the purchase of power to operate electrical equipment in the mine and material handling systems, telephone and data lines, water, and garbage services
Weir Technical Report Summary
Black Thunder Mine
Prepared for Core Resources, Inc.
•Fuels and lubes costs are expenses related to diesel fuel, gasoline, motor oil and grease
•Equipment leases and rent costs are expenses related to equipment leased or rented for office and mining activities
•Taxes and insurance costs are expenses related to sales taxes on purchased goods and services and to property and liability insurance for risk management purposes
•Miscellaneous/contract services costs include items such as security services and fines and penalties
The Black Thunder LOM Plan projected cost of sales of $14.57 per ton is $0.53 per ton higher than the 2024 through September 2025 historical average of $14.04 per ton for Black Thunder. With the long history of cost of sales, no contingency is included, although the accuracy of the LOM Plan projected cost of sales should be considered to be within ±15 percent of the historical average.
Capital and Operating Cost Risk
Black Thunder has been in operation since 1977 and has had a relatively long period relative to experience with capital and operating costs. Since the mining operation will continue in the same coal seam and planned mining conducted in the same manner as historical mining, there is little risk associated with the specific engineering estimation methods used to arrive at projected capital and operating costs. An assessment of accuracy of estimation methods is reflected in the sensitivity analysis in Section 19.3 of this TRS.
For purposes of the PFS completed relative to the Black Thunder LOM Plan, capital costs are estimated to an accuracy of ±15 percent, with a contingency of 10 percent and operating costs are estimated to an accuracy of ±15 percent, with no contingency.
Weir Technical Report Summary
Black Thunder Mine
Prepared for Core Resources, Inc.
19.0 ECONOMIC ANALYSIS
19.1 ASSUMPTIONS, PARAMETERS, AND METHODS
A PFS financial model has been prepared in order to assess the economic viability of the Black Thunder LOM Plan. Specifically, plans were evaluated using discounted cash flow analysis, which consists of annual revenue projections for the Black Thunder LOM Plan. Cash outflows such as capital, including sustaining capital costs, operating costs, transportation costs, and taxes are subtracted from the inflows to produce the annual cash flow projections. Cash flows are recognized to occur at the end of each period. There is no adjustment for inflation in the financial model and all cash flows are in 2025 dollars. WEIR’s study is conducted on an un-levered basis, excluding costs associated with any debt servicing requirements.
To reflect the time value of money, annual net cash flow projections are discounted back to the project valuation date, using a discount rate of 12.5 percent. The discount rate appropriate to a specific project depends on many factors, including the type of commodity and the level of project risks, such as market risk, technical risk, and political risk. The discounted present value of the cash flows are summed to arrive at the project’s NPV.
Projected cash flows do not include allowance of any potential salvage value. Additionally, capital previously expended (sunk cost) is not included in the assessment of economic returns.
Royalties are forecasted based on mineral lease rates and anticipated mine plan progression through various lease boundaries within the Black Thunder Mine resource area.
In addition to NPV, the IRR is also calculated. The IRR is defined as the discount rate that results in an NPV equal to zero. Payback Period is calculated as the time required to achieve positive cumulative cash flow for the project at a 12.5 percent discount rate. As the Black Thunder mining operation is ongoing with no initial investment required (i.e. already sunk cost), payback period is less than one year.
The PFS financial model developed for use in this TRS is meant to evaluate the prospects of economic extraction of coal within the Black Thunder resource area. This economic evaluation is not meant to represent a project valuation.
Weir Technical Report Summary
Black Thunder Mine
Prepared for Core Resources, Inc.
Furthermore, optimization of the LOM Plan was outside of the scope of this engagement.
Actual and projected Black Thunder LOM Plan coal sales price forecasts used to estimate revenue are shown on Figure 19.1-1.
Figure 19.1-1 Black Thunder Mine Historical and Projected Coal Sales Price
19.2 ECONOMIC ANALYSIS AND ANNUAL CASH FLOW FORECAST
Annual cash flow for the Black Thunder LOM Plan is shown on Figure 19.2-1 as follows:
Weir Technical Report Summary
Black Thunder Mine
Prepared for Core Resources, Inc.
Figure 19.2-1 Annual Cash Flow Forecast
The Black Thunder LOM Plan has an after-tax NPV of $96.1 million, at the base case discount rate of 12.5 percent (Table 19.2-2). As Black Thunder is an ongoing mine with no initial investment required (i.e. already sunk cost), the IRR indicates that the project NPV is infinite. Cumulative (undiscounted) cash flow over the LOM Plan is positive, at $273.8 million. The calculated Return on Investment (ROI) is 16 percent.
The after-tax NPV, IRR, cumulative cash flow and ROI are summarized in Table 19.2-1 as follows:
Table 19.2-1 After-Tax NPV, IRR, Cumulative Cash Flow, and ROI
|
|
|
|
|
|
|
|
|
|
|
LOM Plan |
| NPV ($000) |
|
96,148 |
| IRR (%) |
|
Infinite |
| Cumulative Cash Flow ($000) |
|
273,836 |
| Return on Investment (%) |
|
16 |
Table 19.2-2 presents key operational statistics for the LOM Plan on an after-tax basis. Over the LOM Plan, the average cost of sales is $15.77 per saleable ton. Operating costs include cash costs and non-cash costs.
Weir Technical Report Summary
Black Thunder Mine
Prepared for Core Resources, Inc.
Table 19.2-2 Key Operating Statistics
|
|
|
|
|
|
|
|
|
|
|
LOM Plan |
| Clean Tons Produced (000s) |
|
331,500 |
| Marketable Tons Sold (000s) |
|
331,548 |
|
|
|
|
|
($ Per Ton) |
| Coal Sales Realization |
|
15.77 |
|
|
|
| Cash Costs |
|
14.57 |
| Non-cash Costs |
|
0.76 |
| Total Cost of Sales |
|
15.33 |
|
|
|
| Profit / (Loss) |
|
0.44 |
|
|
|
| EBITDA |
|
1.20 |
|
|
|
| CAPEX |
|
0.37 |
19.3 SENSITIVITY ANALYSIS
A sensitivity analysis was undertaken to examine the influence of changes to assumptions for coal sales price, operating cost, capital expenditures, and discount rate on the base case after-tax NPV. The sensitivity analysis range (±25 percent) was designed to capture the bounds of reasonable variability for each element analyzed. The basis for reasonable variability for each element analyzed is summarized as follows:
•Coal Sales Price - Historical coal sales price variability of two percent between 2024 and September 2025
•Operating Cost - Estimated accuracy of ±15 percent
•Capital Costs - Assumed accuracy of ±15 percent
•Discount Rate - based on range of variability from 7.5 to 15 percent
Figure 19.3-1 depicts the results of the NPV sensitivity analysis.
Weir Technical Report Summary
Black Thunder Mine
Prepared for Core Resources, Inc.
Figure 19.3-1 Net Present Value Sensitivity Analysis
The chart above shows that the NPV is most sensitive to changes in operating cost and is least sensitive to changes in the discount rate and capital expenditures.
Weir Technical Report Summary
Black Thunder Mine
Prepared for Core Resources, Inc.
20.0 ADJACENT PROPERTIES
This TRS does not include any estimates of mineral resources or mineral reserves associated with adjacent (adverse) properties.
Geological data outside of the Black Thunder property was provided to WEIR, by Core, for inclusion in the report analysis. This data has been used in the geological structure and quality model but is not shown in the data trends related to figures in this report. Utilizing the data outside of the Black Thunder property ensures that the model is able to trend with known data though the boundary where reserves and resources are estimated. This in turn provides a more realistic estimation on tonnages and quality along the borders of the Black Thunder property.
Weir Technical Report Summary
Black Thunder Mine
Prepared for Core Resources, Inc.
21.0 OTHER RELEVANT DATA AND INFORMATION
Conducting a due diligence investigation relative to the mineral and surface rights of Core’s mining operations was not part of WEIR’s scope of work. This TRS is based on Core controlling, by lease or ownership, or having the ability to acquire the mineral reserves and surface lands necessary to support its mine plans.
The ability of Core, or any coal company, to achieve production and financial projections is dependent on numerous factors. These factors primarily include site-specific geological conditions, the capabilities of management and mine personnel, level of success in acquiring reserves and surface properties, coal sales prices and market conditions, environmental issues, securing permits and bonds, and developing and operating mines in a safe and efficient manner. Unforeseen changes in legislation and new industry developments could substantially alter the performance of any mining company.
Coal mining is carried out in an environment where not all events are predictable. While an effective management team can identify known risks and take measures to manage and/or mitigate these risks, there is still the possibility of unexpected and unpredictable events occurring. It is not possible therefore to totally remove all risks or state with certainty that an event that may have a material impact on the operation of a coal mine will not occur.
Weir Technical Report Summary
Black Thunder Mine
Prepared for Core Resources, Inc.
22.0 INTERPRETATIONS AND CONCLUSIONS
22.1 SUMMARY OF INTERPRETATIONS AND CONCLUSIONS
Interpretation
Core has a long operating history of resource exploration, mine development, and mining operations at Black Thunder, with extensive exploration data including drillholes, and seam elevation measurements supporting the determination of mineral resource and reserve estimates, and projected economic viability. The data has been reviewed and analyzed by WEIR and determined to be adequate in quantity and reliability to support the coal resource and coal reserve estimates in this TRS.
Conclusion
The coal resource and coal reserve estimates and supporting PFS were prepared in accordance with SEC S-K 1300 requirements. There are 205 million in-place tons of Measured and Indicated mineral resources, exclusive of reserves, and 331.5 million clean recoverable tons of surface mineable reserves within the Black Thunder LOM Plan, as of December 31, 2025. Reasonable prospects for economic extraction were established through the development of a PFS relative to the Black Thunder LOM Plan, considering historical mining performance, historical and projected metallurgical coal sales prices, historical and projected mine operating costs, and recognizing reasonable and sufficient capital expenditures.
22.2 SIGNIFICANT RISKS AND UNCERTAINTIES
Risk, as defined for this study, is a hazard, condition, or event related to geology and reserves, mine operations and planning, environmental issues, health and safety, and general business issues that when taken individually, or in combination, have an adverse impact on Core’s development of Black Thunder. Risks can disrupt operations, adversely affect production and productivity, and result in increased operating cost and/or increased capital expenditures.
In the context of this TRS, the likelihood of a risk is a subjective measure of the probability of the risk occurring, recognizing the magnitude of the risk defined as follows:
Weir Technical Report Summary
Black Thunder Mine
Prepared for Core Resources, Inc.
Low Risk indicates that the combined probabilities (low/medium/high) together with the economic impact (minimal/significant/adverse), if conditions exist, should not have any material adverse effect on the economic viability of the project.
Moderate Risk indicates that the combined probabilities (low/medium/high) together with the economic impact (minimal/significant/adverse), if conditions exist, could have a detrimental effect on the economic viability of the project.
High Risk indicates that the combined probabilities (low/medium/high) together with the economic impact (minimal/significant/adverse), if conditions exist, could have a seriously adverse effect the economic viability of the project.
Based on a review of available information and discussions with Core personnel, WEIR identified potential risks associated with the Black Thunder LOM Plan. The risks, WEIR’s assessment of risk magnitude, and comments based on WEIR’s experience with surface mining operations are summarized in Table 22.2-1 as follows:
Table 22.2-1 Black Thunder Mine Risk Assessment Summary
|
|
|
|
|
|
|
|
|
|
|
|
|
|
|
|
|
WEIR Risk |
|
|
| Area of Risk |
|
Assessment |
|
Comments |
|
|
|
|
|
| Coal Quality |
|
Low |
|
Black Thunder has a long history of meeting customer requirements. |
|
|
|
|
|
| Geology and Coal Reserves |
|
Low |
|
The Wyodak Seam has been extensively mined by the Black Thunder Mine. This mining has not indicated any anomalies in the seam other than normal thinning and thickening, and encountering expected minimal water originating from overlying sandstone strata. |
|
|
|
|
|
| Land Acquisition |
|
Low |
|
No additional land or mineral is necessary to acquired to achieve the LOM Plan. |
|
|
|
|
|
| Gas Wells |
|
Low |
|
There are 10 gas wells that will have to be acquired and plugged prior to mining. Black Thunder has successfully acquired, plugged, and mined through gas wells historically. |
|
|
|
|
|
| Highwall Stability |
|
Low to Moderate |
|
The potential for a highwall failure when mining is monitored as a part of the normal mining operation. The highwall angle has been designed based on geotechnical studies to achieve a factor of safety greater than 1.30. |
|
|
|
|
|
| Qualified Employees |
|
Low |
|
Black Thunder employment level is at the maximum level for the LOM Plan. Employment levels will drop throughout the LOM Plan and skilled workers will be retained. |
|
|
|
|
|
| Rail Lines |
|
Low |
|
Historically, the volume of coal transported out of the PRB was much greater than current volumes. The rail line capacity is more than adequate to transport the tonnage in Black Thunder's LOM Plan. |
|
|
|
|
|
| Spontaneous Combustion |
|
Low |
|
Black Thunder does not store coal in open stockpiles and the potential for heating of the coal from spontaneous combustion is low. On shift inspections by management personnel would likely identify any heating events. |
|
|
|
|
|
| Water Inflow |
|
Low to Moderate |
|
There have been areas where the Black Thunder Mine has encountered water inflow from the water-bearing sandstone overburden. Dewatering wells continually address any water encountered to mitigate issues leading to highwall failures. |
Weir Technical Report Summary
Black Thunder Mine
Prepared for Core Resources, Inc.
It is WEIR’s opinion that the majority of the risks are low and can be kept low and/or mitigated with proper engineering, planning and monitoring of the mining operations.
Weir Technical Report Summary
Black Thunder Mine
Prepared for Core Resources, Inc.
23.0 RECOMMENDATIONS
Black Thunder has sufficient geologic exploration data to determine mineral reserves. Future exploration work will be undertaken by Core to continuously provide geological data primarily for use by mine operations personnel related to effective implementation of the LOM Plan. Future exploration work should include what has been historically implemented related to the following:
Geology
•Have an experienced geologist log core holes, measure core recovery, complete sampling. Geophysically log core holes to verify seam and coal thickness and core recovery.
•Geophysically log rotary holes to verify strata and coal thickness.
•Continue to prepare laboratory analysis of any core hole samples.
Mine Plan
•Continue to monitor the dewatering wells results relative to minimizing groundwater and the impact on highwall stability.
Weir Technical Report Summary
Black Thunder Mine
Prepared for Core Resources, Inc.
24.0 REFERENCES
References used in preparation of this TRS are as follows:
•BARR Engineering Co. 2021. Geotechnical Highwall Stability Assessment for the Black Thunder Mine Operation
•Thunder Basin Coal Company, LLC. 2009 (updated 2018). Ground Control Plan
•WYDEP Permit No. 233
Websites Referenced:
•Securities and Exchange Commission - Modernization of Property Disclosures for Mining Registrants - Final Rule Adoption
https://www.sec.gov/rules/final/2018/33-10570.pdf
•MSHA Data Retrieval Site
https://www.msha.gov/mine-data-retrieval-system
Weir Technical Report Summary
Black Thunder Mine
Prepared for Core Resources, Inc.
25.0 RELIANCE ON INFORMATION PROVIDED BY THE REGISTRANT
In preparing this report, WEIR relied upon data, written reports and statements provided by the registrant. It is WEIR’s belief that the underlying assumptions and facts supporting information provided by the registrant are factual and accurate, and WEIR has no reason to believe that any material facts have been withheld or misstated. WEIR has taken all appropriate steps, in its professional opinion, to ensure information provided by the registrant is reasonable and reliable for use in this report.
The registrant’s technical and financial personnel provided information as summarized in Table 25.1 as follows:
Table 25.1 Information Relied Upon from Registrant
|
|
|
|
|
|
|
|
|
|
|
|
|
|
|
| Category |
|
Information |
|
Report Section |
| Legal |
|
Mineral control and surface rights |
|
3 |
|
|
|
|
|
| Geotechnical |
|
Highwall Stability, and rock quality analyses |
|
13.1.1 |
|
|
|
|
|
| Hydrogeological |
|
Hydrogeological Analysis including inflow rates, permeability and tranmisivity calculations, and watershed analysis |
|
13.1.2 |
|
|
|
|
|
| Environmental |
|
Permits, bond, and reclamation liability |
|
17 |
|
|
|
|
|
| Macroeconomic |
|
Real price growth (labor and other cash costs) |
|
18 |